Attached files
| file | filename |
|---|---|
| EX-32.1 - EX-32.1 - UNIVERSAL LOGISTICS HOLDINGS, INC. | ulh-ex321_9.htm |
| EX-31.2 - EX-31.2 - UNIVERSAL LOGISTICS HOLDINGS, INC. | ulh-ex312_10.htm |
| EX-31.1 - EX-31.1 - UNIVERSAL LOGISTICS HOLDINGS, INC. | ulh-ex311_8.htm |
| EX-23.1 - EX-23.1 - UNIVERSAL LOGISTICS HOLDINGS, INC. | ulh-ex231_7.htm |
| EX-21.1 - EX-21.1 - UNIVERSAL LOGISTICS HOLDINGS, INC. | ulh-ex211_6.htm |
UNITED STATES
SECURITIES AND EXCHANGE COMMISSION
WASHINGTON, D.C. 20549
FORM 10-K
(Mark One)
|
☒ |
ANNUAL REPORT PURSUANT TO SECTION 13 OR 15(d) OF THE SECURITIES EXCHANGE ACT OF 1934 |
For the fiscal year ended December 31, 2017
|
☐ |
TRANSITION REPORT PURSUANT TO SECTION 13 OR 15(d) OF THE SECURITIES EXCHANGE ACT OF 1934 |
Commission File Number: 0-51142
UNIVERSAL LOGISTICS HOLDINGS, INC.
(Exact Name of Registrant as Specified in Its Charter)
|
Michigan |
|
38-3640097 |
|
(State or Other Jurisdiction of |
|
(I.R.S. Employer |
|
Incorporation or Organization) |
|
Identification No.) |
12755 E. Nine Mile Road
Warren, Michigan 48089
(Address, including Zip Code of Principal Executive Offices)
(586) 920-0100
(Registrant’s telephone number, including area code)
Securities registered pursuant to Section 12(b) of the Act:
|
Common Stock, no par value |
The NASDAQ Stock Market LLC |
|
(Title of class) |
(Name of exchange on which registered) |
Securities registered pursuant to Section 12(g) of the Act: None
Indicate by check mark if the registrant is a well-known seasoned issuer, as defined in Rule 405 of the Securities Act. Yes ☐ No ☒
Indicate by check mark if the registrant is not required to file reports pursuant to Section 13 or Section 15(d) of the Act. Yes ☐ No ☒
Indicate by check mark whether the registrant (1) has filed all reports required to be filed by Section 13 or 15(d) of the Securities Exchange Act of 1934 during the preceding 12 months (or for such shorter period that the registrant was required to file such reports), and (2) has been subject to such filing requirements for the past 90 days. Yes ☒ No ☐
Indicate by checkmark whether the registrant has submitted electronically and posted on its corporate Website, if any, every Interactive Data File required to be submitted and posted pursuant to Rule 405 of Regulation S-T during the preceding 12 months (or for a shorter period that the registrant was required to submit and post such files). Yes ☒ No ☐
Indicate by check mark if disclosure of delinquent filers pursuant to item 405 of Regulation S-K is not contained herein, and will not be contained, to the best of registrant’s knowledge, in definitive proxy or information statements incorporated by reference in Part III of this Form 10-K or any amendment to this Form 10-K. ☒
Indicate by check mark whether the registrant is a large accelerated filer, an accelerated filer, or a non-accelerated filer, or a smaller reporting company. See the definitions of “large accelerated filer”, “accelerated filer”, “smaller reporting company”, and “emerging growth company” in Rule 12b-2 of the Exchange Act.
|
Large Accelerated filer |
|
☐ |
Accelerated filer |
|
☒ |
|
|
|
|
|
|
|
|
Non-accelerated filer |
|
☐ (Do not check if a smaller reporting company) |
Smaller reporting company |
|
☐ |
|
|
|
|
Emerging growth company |
|
☐ |
If an emerging growth company, indicate by check mark if the registrant has elected not to use the extended transition period for complying with any new or revised financial accounting standards provided pursuant to Section 13(a) of the Exchange Act.☐
Indicate by check mark whether the registrant is a shell company (as defined in Exchange Act Rule 12b-2). Yes ☐ No ☒
As of July 1, 2017, the last business day of the registrant’s most recently completed second quarter, the aggregate market value of the registrant’s common stock held by non-affiliates of the registrant, based upon the closing sale price of the common stock on June 30, 2017, as reported by The Nasdaq Stock Market, was approximately $124.0 million (assuming, but not admitting for any purpose, that all (a) directors and executive officers of the registrant are affiliates, and (b) the number of shares held by such directors and executive officers does not include shares that such persons could have acquired within 60 days of July 1, 2017).
The number of shares of common stock, no par value, outstanding as of March 5, 2018, was 28,382,392.
DOCUMENTS INCORPORATED BY REFERENCE
Portions of the Proxy Statement for the Registrant’s 2018 Annual Meeting of Shareholders are incorporated by reference in Part III of this Form 10-K.
UNIVERSAL LOGISTICS HOLDINGS, INC.
2017 ANNUAL REPORT ON FORM 10-K
TABLE OF CONTENTS
|
|
|
|
|
|
|
Item 1. |
|
|
3 |
|
|
Item 1A. |
|
|
8 |
|
|
Item 1B. |
|
|
16 |
|
|
Item 2. |
|
|
16 |
|
|
Item 3. |
|
|
17 |
|
|
Item 4. |
|
|
17 |
|
|
|
|
|
|
|
|
Item 5. |
|
|
18 |
|
|
Item 6. |
|
|
20 |
|
|
Item 7. |
|
Management’s Discussion and Analysis of Financial Condition and Results of Operations |
|
23 |
|
Item 7A. |
|
|
35 |
|
|
Item 8. |
|
|
37 |
|
|
Item 9. |
|
Changes in and Disagreements with Accountants on Accounting and Financial Disclosure |
|
67 |
|
Item 9A. |
|
|
67 |
|
|
Item 9B. |
|
|
69 |
|
|
|
|
|
|
|
|
Item 10. |
|
|
70 |
|
|
Item 11. |
|
|
70 |
|
|
Item 12. |
|
Security Ownership of Certain Beneficial Owners and Management and Related Stockholder Matters |
|
70 |
|
Item 13. |
|
Certain Relationships and Related Transactions, and Director Independence |
|
70 |
|
Item 14. |
|
|
70 |
|
|
|
|
|
|
|
|
Item 15. |
|
|
71 |
|
|
|
|
|
73 |
|
|
EX-21.1 List of Subsidiaries |
|
|
||
|
EX-23.1 Consent of BDO |
|
|
||
|
EX-31.1 Section 302 CEO Certification |
|
|
||
|
EX-31.2 Section 302 CFO Certification |
|
|
||
|
EX-32.1 Section 906 CEO and CFO Certification |
|
|
||
|
EX-101.INS XBRL Instance Document |
|
|
||
|
EX-101.SCH XBRL Schema Document |
|
|
||
|
EX-101.CAL XBRL Calculation Linkbase Document |
|
|
||
|
EX-101.DEF XBRL Definition Linkbase Document |
|
|
||
|
EX-101.LAB XBRL Labels Linkbase Document |
|
|
||
|
EX-101.PRE XBRLPresentation Linkbase Document |
|
|
||
DISCLOSURE REGARDING FORWARD-LOOKING STATEMENTS
This Annual Report on Form 10-K (“Form 10-K”) contains forward-looking statements, within the meaning of the Private Securities Litigation Reform Act of 1995, that involve risks and uncertainties. Many of the forward-looking statements are located in Part II, Item 7 of this Form 10-K under the heading “Management’s Discussion and Analysis of Financial Condition and Results of Operations.” Forward-looking statements provide current expectations of future events based on certain assumptions and include any statement that does not directly relate to any historical or current fact. Forward-looking statements can also be identified by words such as “future,” “anticipates,” “believes,” “estimates,” “expects,” “intends,” “will,” “would,” “could,” “can,” “may,” and similar terms. Forward-looking statements are not guarantees of future performance and the Company’s actual results may differ significantly from the results discussed in the forward-looking statements. Factors that might cause such differences include, but are not limited to, those discussed in Part I, Item 1A of this Form 10-K under the heading “Risk Factors,” which are incorporated herein by reference. All information presented herein is based on the Company’s fiscal calendar. Unless otherwise stated, references to particular years, quarters, months or periods refer to the Company’s fiscal years ended December 31 and the associated quarters, months and periods of those fiscal years. Each of the terms “Universal,” the “Company,” “we,” “us” and “our” as used herein refers collectively to Universal Logistics Holdings, Inc. and its subsidiaries, unless otherwise stated. The Company assumes no obligation to revise or update any forward-looking statements for any reason, except as required by law.
Company Background
We are a leading asset-light provider of customized transportation and logistics solutions throughout the United States, and in Mexico, Canada and Colombia. We offer our customers a broad array of services across their entire supply chain, including truckload, brokerage, intermodal, dedicated, and value-added services.
We provide a comprehensive suite of transportation and logistics solutions that allow our customers to reduce costs and manage their global supply chains more efficiently. We market and deliver our services in several ways:
|
|
• |
Through a direct sales and marketing network focused on selling our portfolio of services to large customers in specific industry sectors; |
|
|
• |
Through a network of agents who solicit freight business directly from shippers; and |
|
|
• |
Through company-managed facilities and full service freight forwarding and customs house brokerage offices. |
At December 31, 2017, we had an agent network totaling approximately 323 agents, and we operated 44 company-managed terminal locations and serviced 50 value-added programs locations throughout the United States and in Mexico, Canada and Colombia.
We were incorporated in Michigan on December 11, 2001. We have been a publicly held company since February 11, 2005, the date of our initial public offering.
Our principal executive offices are located at 12755 E. Nine Mile Road, Warren, Michigan 48089.
Segment Financial Information
We report our financial results in two reportable segments, transportation and logistics, based on the nature of the underlying customer commitment and the types of investment required to support these undertakings. This presentation reflects the manner in which management evaluates our operating segments, including an evaluation of economic characteristics and applicable aggregation criteria.
Operations aggregated in our transportation segment are associated with individual freight shipments coordinated by our agents, company-managed terminals and specialized services operations. In contrast, operations aggregated in our logistics segment deliver value-added or transportation services to specific customers on a dedicated basis, generally pursuant to contract terms of one year or longer. Other non-reportable operating segments consist of the Company’s subsidiaries that provide support services to other subsidiaries and to owner-operators, including shop maintenance and equipment leasing.
For more information on our segment reporting, see Part II, Item 8: Note 16 to the Consolidated Financial Statements.
3
We broadly group our revenues into the following service categories: truckload, brokerage, intermodal, dedicated and value-added services.
Truckload. Our truckload services include dry van, flatbed, heavy-haul and refrigerated operations. Truckload services represented approximately $302.9 million, or 24.9%, of our operating revenues in 2017. We transport a wide variety of general commodities, including automotive parts, machinery, building materials, paper, food, consumer goods, furniture, steel and other metals on behalf of customers in various industries. Our transportation services are provided through a network of owner-operators and employee drivers.
Brokerage. To complement our available capacity, we provide customers freight brokerage services by utilizing third-party transportation providers to move freight. Brokerage services also include full service domestic and international freight forwarding, and customs brokerage. In 2017, brokerage services represented approximately $278.2 million, or 22.9%, of our operating revenues. At December 31, 2017, we had a network of 42,358 active carriers.
Intermodal. Intermodal operations include rail-truck, steamship-truck and support services. Intermodal support services represented $153.7 million, or 12.6%, of our operating revenues in 2017. Our intermodal support services are primarily short-to-medium distance delivery of rail and steamship containers between the railhead or port and the customer and drayage services.
Dedicated. Our dedicated services are primarily provided in support of automotive and retail customers using specialized van equipment. Dedicated services also include our final mile and ground expedited services. In 2017, dedicated services represented approximately $93.5 million, or 7.7%, of our operating revenues. Our dedicated services are primarily short run or round-trip moves within a defined geographic area provided through a network of union and non-union employee drivers, owner-operators, and contract drivers.
Value-Added. Our value-added services, which are typically dedicated to individual customer requirements, include material handling, consolidation, sequencing, sub-assembly, cross-dock services, kitting, repacking, warehousing and returnable container management. Value-added services represented approximately $388.3 million, or 31.9%, of our operating revenues in 2017. Our facilities and services are often directly integrated into the production processes of our customers and represent a critical piece of their supply chains.
Business and Growth Strategy
The key elements of our strategy are as follows:
Expand our network of agents and owner-operators. Increasing the number of agents and owner-operators has been a driver of our historical growth in transactional transportation services. We intend to continue to recruit qualified agents and owner-operators in order to penetrate new markets, and expand our operations in existing markets. Our agents typically focus on a small number of shippers in a particular market and are attuned to the specific transportation needs of that core group of shippers, while remaining alert to growth opportunities.
Continue to capitalize on strong industry fundamentals and outsourcing trends. We believe long-term industry growth will be supported by manufacturers seeking to outsource non-core logistics functions to cost-effective third-party providers that can efficiently manage increasingly complex global supply chains. We intend to leverage our integrated suite of transportation and logistics services, our network of facilities, our long-term customer relationships, and our reputation for operational excellence to capitalize on favorable industry fundamentals and growth expectations.
Target further penetration of key customers in the North American automotive industry. The automotive industry is one of the largest users of global outsourced logistics services, providing us growth opportunities with both existing and new customers. Of our customers generating revenues greater than $100,000 per year, this sector comprised approximately 40% of operating revenues in 2017. We intend to capitalize on anticipated continued growth in outsourcing of higher value logistics services in the automotive sector such as sub-assembly and sequencing, which link directly into production lines and require specialized capabilities, technological expertise and strict quality controls.
4
Continue to expand penetration in other vertical markets. We have a history of providing highly complex value-added logistics services to automotive and other industrial customers. We have developed standardized, modular systems for material handling processes and have extensive experience in rapid implementation and workforce training. These capabilities and our broad portfolio of logistics services are transferable across vertical markets. We believe we can leverage the expertise we initially developed in the automotive sector. In addition to automotive, our targeted industries include aerospace, energy, government services, healthcare, industrial retail, consumer goods, and steel and metals.
Competition and Industry
The transportation and logistics service industry is highly competitive and extremely fragmented. We compete based on quality and reliability of service, price, breadth of logistics solutions, and IT capabilities. We compete with asset and non-asset based truckload and less-than-truckload carriers, intermodal transportation, logistics providers and, in some aspects of our business, railroads. We also compete with other motor carriers for owner-operators and agents.
Our customers may choose not to outsource their logistics operations and, rather, to retain or restore such activities as their own internal operations. In our largest vertical market, the automotive industry, we compete more frequently with a relatively small number of privately-owned firms or with subsidiaries of large public companies. These vendors have the scope and capabilities to provide the breadth of services required by the large and complex supply chains of automotive original equipment manufacturers (OEMs).
We also encounter competition from regional and local third-party logistics providers, integrated transportation companies that operate their own aircraft, cargo sales agents and brokers, surface freight forwarders and carriers, airlines, associations of shippers organized to consolidate their members’ shipments to obtain lower freight rates, and internet-based freight exchanges.
Significant bid activity continued from shippers in 2017, which resulted in pricing pressure throughout the year. We believe that our industry continues to be hindered by an insufficient quantity of qualified drivers which creates significant competition for this declining pool of qualified and safe drivers.
Pricing is expected to be more favorable during periods of rapid economic expansion or insufficient industry-wide trucking capacity. In December 2017, federal regulations mandated the use of electronic logging devices (ELDs) across our industry. These devices have arguably reduced effective industry capacity to date by more strictly enforcing a driver’s hours of service and, as a result, miles that can be driven each day. We are using ELDs in our entire fleet and have adapted our network and customer base to the utilization constraints. A substantial portion of industry capacity, however, has not implemented ELDs; as a result, we expect industry capacity to continue to tighten for the foreseeable future and favorably impact pricing.
Customers
Revenue is generated from customers throughout the United States, and in Mexico, Canada and Colombia. Our customers are largely concentrated in the automotive, steel, oil and gas, alternative energy and manufacturing industries.
A significant percentage of our revenues is derived from the domestic auto industry. Of our customers generating revenues greater than $100,000 per year, aggregate sales in the automotive industry totaled 40%, 43% and 37% of revenues during the fiscal years ended December 31, 2017, 2016 and 2015, respectively. During 2017, 2016 and 2015, General Motors accounted for approximately 16%, 18% and 11% of our total operating revenues, respectively. Sales to our top 10 customers, including General Motors, totaled 40% in 2017. A significant percentage of our revenue also results from our providing capacity to other transportation companies that aggregate loads from a variety of shippers in these and other industries.
Independent Contractor Network
We utilize a network of agents and owner-operators located throughout the United States and in Ontario, Canada. These agents and owner-operators are independent contractors.
A significant percentage of the interaction with our shippers in our transportation segment is provided by our agents. Our agents solicited and controlled over 40% of the freight we hauled in 2017, with the balance of the freight being generated by company-managed terminals, full service freight forwarding and customs house brokerage offices. Our top 100 agents in 2017 generated approximately 23% of our annual operating revenues. Our agents typically focus on three or four shippers within a particular market and solicit most of their freight business from this core group. By focusing on a relatively small number of shippers, each agent is acutely aware of the specific transportation needs of that core group of shippers, while remaining alert to growth opportunities.
5
We also contract with owner-operators to provide greater flexibility in responding to fluctuations in customer demand. Owner-operators provide their own trucks and are contractually responsible for all associated expenses, included financing costs, fuel, maintenance, insurance, and taxes, among other things. They are also responsible for maintaining compliance with Federal Motor Carrier Safety Administration regulations.
Revenue Equipment
The following table represents our equipment used to provide transportation services as of December 31, 2017:
|
Type of Equipment |
|
Company- owned or Leased |
|
|
Owner- Operator Provided |
|
|
Total |
|
|||
|
Tractors |
|
|
935 |
|
|
|
2,849 |
|
|
|
3,784 |
|
|
Yard Tractors |
|
|
198 |
|
|
|
- |
|
|
|
198 |
|
|
Trailers |
|
|
4,024 |
|
|
|
1,741 |
|
|
|
5,765 |
|
|
Chassis |
|
|
1,027 |
|
|
|
- |
|
|
|
1,027 |
|
|
Containers |
|
|
806 |
|
|
|
- |
|
|
|
806 |
|
Employees and Contractors
As of December 31, 2017, we had 8,231 employees. During the year ended December 31, 2017, we also engaged, on average, the full-time equivalency of 1,731 individuals on a contract basis. As of December 31, 2017, approximately 19% of our employees in the United States, Canada and Colombia and 95% of our employees in Mexico were members of unions and subject to collective bargaining agreements. We believe our relationship with our employees is good.
Risk Management and Insurance
Our customers and federal regulations generally require that we provide insurance for auto liability and general liability claims up to $1.0 million per occurrence. Accordingly, in the United States, we purchase such insurance from a licensed casualty insurance carrier, which is a related party, providing a minimum $1.0 million of coverage for individual auto liability and general liability claims. We are self-insured for auto and general liability claims above $1.0 million unless riders are sought to satisfy individual customer or vendor contract requirements. In Mexico, our operations and investment in equipment are insured through an internationally recognized, third-party insurance underwriter.
We typically self-insure for the risk of motor cargo liability claims and material handling claims. Accordingly, we establish financial reserves for anticipated losses and expenses related to motor cargo liability and material handling claims, and we periodically evaluate and adjust those reserves to reflect our experience. Any such adjustments could have a materially adverse effect on our operations and financial results.
To reduce our exposure to claims incurred while a vehicle is being operated without a trailer attached or is being operated with an attached trailer which does not contain or carry any cargo, we require our owner-operators to maintain non-trucking use liability coverage (which the industry refers to as deadhead bobtail coverage) of $2.0 million per occurrence.
In brokerage arrangements, our exposure to liability associated with accidents incurred by other third-party carriers who haul freight on our behalf is reduced by various factors, including the extent to which the third party providers maintain their own insurance coverage.
Technology
We use multifaceted software tools and hardware platforms that support seamless integration with the IT networks of our customers and vendors through electronic data exchange systems. These tools enhance our relationships and ability to effectively communicate with customers and vendors. Our tools and platforms provide real-time, web-based visibility into the supply chain of our customers.
In our logistics segment, we customize our proprietary Warehouse Management System (WMS) to meet the needs of individual customers. Our WMS allows us to send our customers an advance shipping notice through a simple, web-based interface that can be used by a variety of vendors. It also enables us to clearly identify and communicate to the customer any vendor-related problems that may cause delays in production. We also use cross-dock and container-return-management applications that automate the cycle of material receipt and empty container return.
6
Our proprietary and third-party transportation management system allows full operational control and visibility from dispatch to delivery, and from invoicing to receivables collections. For our employee drivers, the system provides automated dispatch to hand-held devices, satellite tracking for quality control and electronic status broadcasts to customers when requested. Our international and domestic air freight and ocean forwarding services use similar systems with added functionalities for managing air and ocean freight transportation requirements. All of these systems have customer-oriented web interfaces that allow for full shipment tracking and visibility, as well as for customer shipment input. We also provide systems that allow agents to list pending freight shipments and owner-operators with available capacity, and track particular shipments at various points in the shipping route.
We believe that these tools improve our services and quality controls, strengthen our relationships with our customers, and enhance our value proposition. Any significant disruption or failure of these systems could have a materially adverse effect on our operations and financial results.
Government Regulation
Our operations are regulated and licensed by various U.S. federal and state agencies, as well as comparable agencies in Mexico, Canada, and Colombia. Interstate motor carrier operations are subject to the broad regulatory powers, to include safety and insurance requirements, prescribed by the Federal Motor Carrier Safety Administration (FMCSA), which is an agency of the U.S. Department of Transportation (DOT). Matters such as weight and equipment dimensions also are subject to United States federal and state regulation. We operate in the United States under operating authority granted by the DOT. We are also subject to regulations relating to testing and specifications of transportation equipment and product handling requirements. In addition, our drivers and owner-operators must have a commercial driver’s license and comply with safety and fitness regulations promulgated by the FMCSA, including those relating to drug and alcohol testing.
Our international operations, which include not only facilities in Mexico, Canada and Colombia but also transportation shipments managed by our specialized service operations, are impacted by a wide variety of U.S. government regulations and applicable international treaties. These include regulations of the U.S. Department of State, U.S. Department of Commerce, and the U.S. Department of Treasury. Regulations also cover specific commodities, destinations and end-users. Part of our specialized services operations is engaged in the arrangement of imported and exported freight. As such, we are subject to the regulations of the U.S. Customs and Border Protection, which include significant notice and registration requirements. In various Canadian provinces, we operate transportation services under authority granted by the Ministries of Transportation and Communications.
Transportation-related regulations are greatly affected by U.S. national security legislation and related regulations. We believe we are in substantial compliance with applicable material regulations and that the costs of regulatory compliance are an ordinary operating cost of our business that we may not be able to recoup from rates charged to customers.
Environmental Regulation
We are subject to various federal, state and local environmental laws and regulations that focus on, among other things: the emission and discharge of hazardous materials into the environment or their presence at our properties or in our vehicles; fuel storage tanks; transportation of certain materials; and the discharge or retention of storm water. Under specific environmental laws, we could also be held responsible for any costs relating to contamination at our past or present facilities and at third-party waste disposal sites, as well as costs associated with cleanup of accidents involving our vehicles. We do not believe that the cost of future compliance with current environmental laws or regulations will have a material adverse effect on our operations, financial condition, competitive position or capital expenditures for fiscal year 2018. However, future changes to laws or regulations may adversely affect our operations and could result in unforeseen costs to our business.
Seasonality
Generally, demand for our value-added services delivered to existing customers increases during the second calendar quarter of each year as a result of the automotive industry’s spring selling season. Conversely, such demand generally decreases during the third quarter of each year due to the impact of scheduled OEM customer plant shutdowns in July for vacations and changeovers in production lines for new model years.
Our value-added services business is also impacted in the fourth quarter by plant shutdowns during the December holiday period. Prolonged adverse weather conditions, particularly in winter months, can also adversely impact margins due to productivity declines and related challenges meeting customer service requirements.
7
Our transportation services business is generally impacted by decreased activity during the post-holiday winter season and, in certain states, during hurricane season. At these times, some shippers reduce their shipments, and inclement weather impedes trucking operations or underlying customer demand.
Additional Information
We make available free of charge on or through our website, www.universallogistics.com, our annual reports on Form 10-K, quarterly reports on Form 10-Q, current reports on Form 8-K and all amendments to those reports as soon as reasonably practicable after such material is electronically filed with or furnished to the Securities and Exchange Commission (SEC). The public may read and copy any materials filed by the Company with the SEC at the SEC’s Public Reference Room at 100 F Street NE, Room 1580, Washington, DC 20549. The public may obtain information on the operation of the Public Reference Room by calling the SEC at 1-800-SEC-0330. The SEC maintains an internet site that contains reports, proxy and information statements and other information regarding issuers that file electronically with the SEC at www.sec.gov. The contents of these websites are not incorporated into this filing.
Set forth below, and elsewhere in this Report and in other documents we file with the SEC, are risks and uncertainties that could cause our actual results to differ materially from the results contemplated by the forward-looking statements contained in this Report.
Risks Related to Our Business
Our business is subject to general economic and business factors that are largely beyond our control, any of which could have a material adverse effect on our operating results.
Our business is dependent upon a number of general economic and business factors that may adversely affect our results of operations. These factors include significant increases or rapid fluctuations in fuel prices, excess capacity in the transportation and logistics industry, surpluses in the market for used equipment, interest rates, fuel taxes, license and registration fees, insurance premiums, self-insurance levels, and difficulty in attracting and retaining qualified drivers and independent contractors.
We operate in a highly competitive and fragmented industry, and our business may suffer if we are unable to adequately address any downward pricing pressures or other factors that may adversely affect our ability to compete with other carriers.
Further, we are affected by recessionary economic cycles and downturns in customers’ business cycles, particularly in market segments and industries, such as the automotive industry, where we have a significant concentration of customers. Economic conditions may also adversely affect our customers and their ability to pay for our services.
Deterioration in the United States and world economies could exacerbate any difficulties experienced by our customers and suppliers in obtaining financing, which, in turn, could materially and adversely impact our business, financial condition, results of operations and cash flows.
We operate in the highly competitive and fragmented transportation and logistics industry, and our business may suffer if we are unable to adequately address factors that may adversely affect our revenue and costs relative to our competitors.
Numerous competitive factors could impair our ability to maintain our current profitability. These factors include the following:
|
|
• |
we compete with many other truckload carriers and logistics companies of varying sizes, some of which have more equipment, a broader coverage network, a wider range of services and greater capital resources than we do; |
|
|
• |
some of our competitors periodically reduce their rates to gain business, especially during times of reduced growth rates in the economy, which may limit our ability to maintain or increase rates, maintain our operating margins or maintain significant growth in our business; |
|
|
• |
many customers reduce the number of carriers they use by selecting so-called “core carriers” as approved service providers, and in some instances we may not be selected; |
|
|
• |
some companies hire lead logistics providers to manage their logistics operations, and these lead logistics providers may hire logistics providers on a non-neutral basis which may reduce the number of business opportunities available to us; |
8
|
|
• |
the trend toward consolidation in the trucking and third-party logistics industries may create other large providers with greater financial resources and other competitive advantages relating to their size and with whom we may have difficulty competing; |
|
|
• |
advances in technology require increased investments to remain competitive, and our customers may not be willing to accept higher rates to cover the cost of these investments; |
|
|
• |
competition from Internet-based and other brokerage companies may adversely affect our relationships with our customers and freight rates; |
|
|
• |
economies of scale that may be passed on to smaller providers by procurement aggregation providers may improve the ability of smaller providers to compete with us; |
|
|
• |
some areas of our service coverage requires trucks with engines no older than 2011 in order to comply with environmental rules; and |
|
|
• |
an inability to continue to access capital markets to finance equipment acquisition could put us at a competitive disadvantage. |
Our revenue is somewhat dependent on North American automotive industry production volume, and may be negatively affected by future downturns in North American automobile production.
A significant portion of our larger customers are concentrated in the North American automotive industry. For customers generating annual revenues over $100,000, 40% of our revenues were derived from customers in the North American automotive industry during 2017. Our business and growth largely depend on continued demand for its services from customers in this industry. Any future downturns in North American automobile production, which also impacts our steel and metals customers, could similarly affect our revenues in future periods.
Our business derives a large portion of revenue from a few major customers, and the loss of any one or more of them as customers, or a reduction in their operations, could have a material adverse effect on our business.
A large portion of our revenue is generated from a limited number of major customers concentrated in the automotive, steel and metals, and energy industries. Our top 10 customers accounted for approximately 40% of our operating revenues during 2017. Our contracts with customers generally contain cancellation clauses, and there can be no assurance that these customers will continue to utilize our services or that they will continue at the same levels. Further, there can be no assurance that these customers will not be affected by a future downturn in demand, which would result in a reduction in their operations and corresponding need for our services. Moreover, our customers may individually lose market share, apart from general economic trends. If our major customers lose U.S. market share, they may have less need for services. A reduction in or termination of services by one or more of our major customers could have a material adverse effect on our business and results of operations.
We may be adversely impacted by fluctuations in the price and availability of diesel fuel.
Diesel fuel represents a significant operating expense for the Company, and we do not currently hedge against the risk of diesel fuel price increases. An increase in diesel fuel prices or diesel fuel taxes, or any change in federal or state regulations that results in such an increase, could have a material adverse effect on our operating results to the extent we are unable to recoup such increases from customers in the form of increased freight rates or through fuel surcharges. Historically, we have been able to offset, to a certain extent, diesel fuel price increases through fuel surcharges to our customers, but we cannot be certain that we will be able to do so in the future. We continuously monitor the components of our pricing, including base freight rates and fuel surcharges, and address individual account profitability issues with our customers when necessary. While we have historically been able to adjust our pricing to help offset changes to the cost of diesel fuel through changes to base rates and/or fuel surcharges, we cannot be certain that we will be able to do so in the future.
9
Difficulty in attracting drivers could affect our profitability and ability to grow.
The transportation industry routinely experiences difficulty in attracting and retaining qualified drivers, including independent contractors, resulting in intense competition for drivers. We have from time to time experienced under-utilization and increased expenses due to a shortage of qualified drivers. If we are unable to attract drivers when needed or contract with independent contractors when needed, we could be required to further adjust our driver compensation packages, increase driver recruiting efforts, or let trucks sit idle, any of which could adversely affect our growth and profitability.
If we are unable to retain our key employees, our business, financial condition and results of operations could be harmed.
We are highly dependent upon the services of our key employees and executive officers. The loss of any of their services could have a material adverse effect on our operations and future profitability. We must continue to develop and retain a core group of managers if we are to realize our goal of expanding our operations and continuing our growth. We cannot assure that we will be able to do so.
A significant labor dispute involving us or one or more of our customers, or that could otherwise affect our operations, could reduce our revenues and harm our profitability.
A substantial number of our employees and of the employees of our largest customers are members of industrial trade unions and are employed under the terms of collective bargaining agreements. Each of our unionized facilities has a separate agreement with the union that represents the workers at only that facility. Labor disputes involving either us or our customers could affect our operations. If the UAW and our automotive customers and their suppliers are unable to negotiate new contracts and our customers’ plants experience slowdowns or closures as a result, our revenue and profitability could be negatively impacted. A labor dispute involving another supplier to our customers that results in a slowdown or closure of our customers’ plants to which we provide services could also have a material adverse effect on our business. Significant increases in labor costs as a result of the renegotiation of collective bargaining agreements could also be harmful to our business and our profitability. As of December 31, 2017, approximately 19% of our employees in the United States, Canada and Colombia, and 95% of our employees in Mexico were members of unions and subject to collective bargaining agreements.
In addition, strikes, work stoppages and slowdowns by our employees may affect our ability to meet our customers’ needs, and customers may do more business with competitors if they believe that such actions may adversely affect our ability to provide service. We may face permanent loss of customers if we are unable to provide uninterrupted service. The terms of our future collective bargaining agreements also may affect our competitive position and results of operations.
Ongoing insurance and claims expenses could significantly reduce our earnings.
Our future insurance and claims expenses might exceed historical levels, which could reduce our earnings. The Company is self-insured for health and workers’ compensation insurance coverage up to certain limits. If medical costs continue to increase, or if the severity or number of claims increase, and if we are unable to offset the resulting increases in expenses with higher freight rates, our earnings could be materially and adversely affected.
We face litigation risks that could have a material adverse effect on the operation of our business.
We face litigation risks regarding a variety of issues, including without limitation, accidents involving our trucks and employees, alleged violations of federal and state labor and employment laws, securities laws, environmental liability and other matters. These proceedings may be time-consuming, expensive and disruptive to normal business operations. The defense of such lawsuits could result in significant expense and the diversion of our management’s time and attention from the operation of our business. In recent years, several insurance companies have stopped offering coverage to trucking companies as a result of increases in the severity of automobile liability claims and higher costs of settlements and verdicts. This trend could adversely affect our ability to obtain suitable insurance coverage or could significantly increase our cost for obtaining such coverage, which would adversely affect our financial condition, results of operations, liquidity and cash flows. Costs we incur to defend or to satisfy a judgment or settlement of these claims may not be covered by insurance or could exceed the amount of that coverage or increase our insurance costs and could have a material adverse effect on our financial condition, results of operations, liquidity and cash flows.
10
Purchase price increases for new revenue equipment and/or decreases in the value of used revenue equipment could have an adverse effect on our results of operations, cash flows and financial condition.
During the last decade, the purchase price of new revenue equipment has increased significantly as equipment manufacturers recover increased materials costs and engine design costs resulting from compliance with increasingly stringent EPA engine emission standards. Additional EPA emission mandates in the future could result in higher purchase prices of revenue equipment which could result in higher than anticipated depreciation expenses. If we were unable to offset any such increase in expenses with freight rate increases, our cash flows and results of operations could be adversely affected. If the market price for used equipment continues to decline, then we could incur substantial losses upon disposition of our revenue equipment which could adversely affect our results of operations and financial condition.
We have significant ongoing capital requirements that could affect our liquidity and profitability if we are unable to generate sufficient cash from operations or obtain sufficient financing on favorable terms.
The transportation and logistics industry is capital intensive. If we are unable to generate sufficient cash from operations in the future, we may have to limit our growth, enter into unfavorable financing arrangements, or operate our revenue equipment for longer periods, any of which could have a material adverse effect on our profitability.
We have a significant amount of debt, which could restrict our growth, place us at a competitive disadvantage or otherwise materially adversely affect our financial health.
Our significant debt levels could have important consequences such as the following:
|
|
• |
impair our ability to obtain additional future financing for working capital, capital expenditures, acquisitions or general corporate expenses; |
|
|
• |
limit our ability to use operating cash flow in other areas of our business due to the necessity of dedicating a substantial portion of these funds for payments on our indebtedness; |
|
|
• |
limit our flexibility in planning for, or reacting to, changes in our business and the industry in which we operate; |
|
|
• |
make it more difficult for us to satisfy our obligations; |
|
|
• |
increase our vulnerability to general adverse economic and industry conditions; and |
|
|
• |
place us at a competitive disadvantage compared to our competitors. |
Our ability to make scheduled payments on, or to refinance, our debt and other obligations will depend on our financial and operating performance, which, in turn, is subject to our ability to implement our strategic initiatives, prevailing economic conditions and certain financial, business and other factors beyond our control. If our cash flow and capital resources are insufficient to fund our debt service and other obligations, we may be forced to reduce or delay expansion plans and capital expenditures, sell material assets or operations, obtain additional capital or restructure our debt. We cannot provide any assurance that our operating performance, cash flow and capital resources will be sufficient to pay our debt obligations when they become due. We also cannot provide assurance that we would be able to dispose of material assets or operations or restructure our debt or other obligations if necessary or, even if we were able to take such actions, that we could do so on terms that are acceptable to us.
Disruptions in the credit markets may adversely affect our business, including the availability and cost of short-term funds for liquidity requirements and our ability to meet long-term commitments, which could adversely affect our results of operations, cash flows and financial condition.
If cash from operations is not sufficient, we may be required to rely on the capital and credit markets to meet our financial commitments and short-term liquidity needs. Disruptions in the capital and credit markets, as have been experienced during recent years, could adversely affect our ability to draw on our revolving credit facilities. Our access to funds under the credit facilities is dependent on the ability of banks to meet their funding commitments. A bank may not be able to meet their funding commitments if they experience shortages of capital and liquidity or if they experience excessive volumes of borrowing requests from other borrowers within a short period of time.
11
Longer term disruptions in the capital and credit markets as a result of uncertainty, changing or increased regulation, reduced alternatives, or failures of significant financial institutions could adversely affect our access to liquidity needed for our business. Any disruption could require us to take measures to conserve cash until the markets stabilize or until alternative credit arrangements or other funding for our business needs can be arranged, which could adversely affect our growth and profitability.
We have substantial fixed costs and, as a result, our operating income fluctuates disproportionately with changes in our net sales.
A significant portion of our expenses are fixed costs that that neither increase nor decrease proportionately with sales. There can be no assurance that we would be able to reduce our fixed costs proportionately in response to a decline in our sales and therefore our competitiveness could be significantly impacted. As a result, a decline in our sales would result in a higher percentage decline in our income from operations and net income.
We operate in a highly regulated industry and increased costs of compliance with, or liability for violation of, existing or future regulations could have a material adverse effect on our business.
The U.S. Federal Motor Carrier Safety Administration, or FMCSA, and various state and local agencies exercise broad powers over our business, generally governing such activities as authorization to engage in motor carrier operations, safety and insurance requirements. Our owner-operators must comply with the safety and fitness regulations promulgated by the FMCSA, including those relating to drug and alcohol testing and hours-of-service. There also are regulations specifically relating to the trucking industry, including testing and specifications of equipment and product handling requirements. These measures could disrupt or impede the timing of our deliveries and we may fail to meet the needs of our customers. The cost of complying with these regulatory measures, or any future measures, could have a materially adverse effect on our business or results of operations.
A determination by regulators that owner-operators are employees, rather than independent contractors, could expose us to various liabilities and additional costs.
Tax and other regulatory authorities often seek to assert that independent contractors in the transportation service industry, such as our owner-operators, are employees rather than independent contractors. There can be no assurance that these interpretations and tax laws that consider these persons independent contractors will not change or that these authorities will not successfully assert this position. If our owner-operators are determined to be our employees, that determination could materially increase our exposure under a variety of federal and state tax, workers’ compensation, unemployment benefits, labor, employment and tort laws, as well as our potential liability for employee benefits. In addition, such changes may be applied retroactively, and if so, we may be required to pay additional amounts to compensate for prior periods. Any of the above increased costs would adversely affect our business and operating results.
Uncertainties in the interpretation and application of the Tax Cuts and Jobs Act of 2017 could materially affect our tax obligations and effective tax rate.
On December 22, 2017, the U.S. enacted comprehensive tax legislation, commonly referred to as the Tax Cuts and Jobs Act of 2017 (“Tax Act”). The new law requires complex computations not previously required by U.S. tax law. As such, the application of accounting guidance for such items is currently uncertain. Further, compliance with the new law and the accounting for such provisions require preparation and analysis of information not previously required or regularly produced. In addition, the U.S. Department of Treasury has broad authority to issue regulations and interpretative guidance that may significantly impact how we will apply the law and impact our results of operations in future periods. Accordingly, while we have provided a provisional estimate on the effect of the new law in our accompanying audited financial statements, further regulatory or GAAP accounting guidance for the law, our further analysis on the application of the law, and refinement of our initial estimates and calculations could materially change our current provisional estimates, which could in turn materially affect our tax obligations and effective tax rate. There are also likely to be significant future impacts that these tax reforms will have on our future financial results and our business strategies. In addition, there is a risk that states or foreign jurisdictions may amend their tax laws in response to these tax reforms, which could have a material impact on our future results.
12
Our results of operations may be affected by seasonal factors.
Our productivity may decrease during the winter season when severe winter weather impedes operations. Also, some shippers may reduce their shipments after the winter holiday season. At the same time, operating expenses may increase and fuel efficiency may decline due to engine idling during periods of inclement weather. Harsh weather conditions generally also result in higher accident frequency, increased freight claims, and higher equipment repair expenditures. Generally, demand for our value-added services delivered to existing customers increases during the second calendar quarter of each year as a result of the automotive industry’s spring selling season and decreases during the third quarter of each year due to the impact of scheduled OEM customer plant shutdowns in July for vacations and changeovers in production lines for new model years. Our value-added services business is also impacted in the fourth quarter by plant shutdowns during the December holiday period.
Our operations are subject to various environmental laws and regulations, the violation of which could result in substantial fines or penalties.
We are subject to various environmental laws and regulations dealing with the handling of hazardous materials, underground fuel storage tanks, and discharge and retention of storm-water. We operate in industrial areas, where truck terminals and other industrial activities are located, and where groundwater or other forms of environmental contamination could occur. In prior years, we also maintained bulk fuel storage and fuel islands at two of our facilities. Our operations may involve the risks of fuel spillage or seepage, environmental damage, and hazardous waste disposal, among others. If we are involved in a spill or other accident involving hazardous substances, or if we are found to be in violation of applicable laws or regulations, it could have a materially adverse effect on our business and operating results. If we should fail to comply with applicable environmental regulations, we could be subject to substantial fines or penalties and to civil and criminal liability.
We may incur additional operating expenses or liabilities as a result of potential future requirements to address climate change issues.
Federal, state and local governments, as well as some of our customers, are beginning to respond to global warming issues. This increased focus on sustainability may result in new legislation or regulations and customer requirements that could negatively affect us as we may incur additional costs or be required to make changes to our operations in order to comply with any new regulations or customer requirements. Legislation or regulations that potentially impose restrictions, caps, taxes, or other controls on emissions of greenhouse gases such as carbon dioxide, a by-product of burning fossil fuels such as those used in the Company’s trucks, could adversely affect our operations and financial results. More specifically, legislative or regulatory actions related to climate change could adversely impact the Company by increasing our fuel costs and reducing fuel efficiency and could result in the creation of substantial additional capital expenditures and operating costs in the form of taxes, emissions allowances, or required equipment upgrades. Any of these factors could impair our operating efficiency and productivity and result in higher operating costs. In addition, revenues could decrease if we are unable to meet regulatory or customer sustainability requirements. These additional costs, changes in operations, or loss of revenues could have a material adverse effect on our business, financial condition and results of operations.
Our business may be disrupted by natural disasters and severe weather conditions causing supply chain disruptions.
Natural disasters such as earthquakes, tsunamis, hurricanes, tornadoes, floods or other adverse weather and climate conditions, whether occurring in the United States or abroad, could disrupt our operations or the operations of our customers or could damage or destroy infrastructure necessary to transport products as part of the supply chain. Specifically, these events may damage or destroy or assets, disrupt fuel supplies, increase fuel costs, disrupt freight shipments or routes, and affect regional economies. As a result, these events could make it difficult or impossible for us to provide logistics and transportation services; disrupt or prevent our ability to perform functions at the corporate level; and/or otherwise impede our ability to continue business operations in a continuous manner consistent with the level and extent of business activities prior to the occurrence of the unexpected event, which could adversely affect our business and results of operations or make our results more volatile.
13
Our information technology systems are subject to certain cyber risks and disasters that are beyond our control.
We depend heavily on the proper functioning and availability of our information, communications, and data processing systems, including operating and financial reporting systems, in operating our business. Our systems and those of our technology and communications providers are vulnerable to interruptions caused by natural disasters, power loss, telecommunication and internet failures, cyber-attack, and other events beyond our control. Accordingly, information security and the continued development and enhancement of the controls and processes designed to protect our systems, computers, software, data and networks from attack, damage or unauthorized access remain a priority for us.
Although our information systems are protected through physical and software security as well as redundant backup systems, they remain susceptible to cyber security risks. Some of our software systems are utilized by third parties who provide outsourced processing services which may increase the risk of a cyber-security incident.
A successful cyber-attack or catastrophic natural disaster could significantly affect our operating and financial systems and could temporarily disrupt our ability to provide required services to our customers, impact our ability to manage our operations and perform vital financial processes, any of which could have a materially adverse effect on our business.
We are subject to certain risks arising from doing business in Mexico.
As we continue to grow our business in Mexico, we are subject to greater risks of doing business internationally, including fluctuations in foreign currencies, changes in the economic strength of Mexico, difficulties in enforcing contractual obligations and intellectual property rights, burdens of complying with a wide variety of international and U.S. export and import laws, and social, political, and economic instability. We also face additional risks associated with our Mexico business, including potential restrictive trade policies and imposition of any import or export tariffs, taxes, duties or fees. If we are unable to address business concerns related to our international operations in a timely and cost efficient manner, our financial position, results of operations or cash flows could be adversely affected. The agreement permitting cross border movements for both United States and Mexican based carriers in the United States and Mexico presents additional risks in the form of potential increased competition and the potential for increased congestion in our lanes that cross the border between countries.
Our business may be harmed by terrorist attacks, future war or anti-terrorism measures.
In order to prevent terrorist attacks, federal, state and municipal authorities have implemented and continue to follow various security measures, including checkpoints and travel restrictions on large trucks. Our international operations in Canada and Mexico may be affected significantly if there are any disruptions or closures of border traffic due to security measures. Such measures may have costs associated with them, which, in connection with the transportation services we provide, we or our owner-operators could be forced to bear. In addition, war or risk of war also may have an adverse effect on the economy. A decline in economic activity could adversely affect our revenue or restrict our future growth. Instability in the financial markets as a result of terrorism or war also could affect our ability to raise capital. In addition, the insurance premiums charged for some or all of the coverage currently maintained by us could increase dramatically or such coverage could be unavailable in the future.
We may be unable to successfully integrate businesses we acquire into our operations.
Integrating businesses we acquire may involve unanticipated delays, costs or other operational or financial problems. Successful integration of the businesses we acquire depends on a number of factors, including our ability to transition acquired companies to our management information systems. In integrating businesses we acquire, we may not achieve expected economies of scale or profitability or realize sufficient revenues to justify our investment. We also face the risk that an unexpected problem at one of the companies we acquire will require substantial time and attention from senior management, diverting management’s attention from other aspects of our business. We cannot be certain that our management and operational controls will be able to support us as we grow.
14
Risks Related to Our Common Stock
Because Matthew T. Moroun and Manuel J. Moroun hold a controlling interest in us, the influence of our public shareholders over significant corporate actions is limited, and we are not subject to certain corporate governance standards that apply to other publicly traded companies.
As of December 31, 2017, Matthew T. Moroun, the Chairman of our Board of Directors, and Manuel J. Moroun, a member of our Board of Directors, together own approximately 71% of our outstanding common stock. As a result, the Moroun family has the power to:
|
|
• |
control all matters submitted to our shareholders; |
|
|
• |
elect our directors; |
|
|
• |
adopt, extend or remove any anti-takeover provisions that are available to us; and |
|
|
• |
exercise control over our business, policies and affairs. |
This concentration of ownership could limit the price that some investors might be willing to pay for shares of our common stock. Our ability to engage in significant transactions, such as a merger, acquisition or liquidation, will require the consent of the Moroun family. Conflicts of interest could arise between us and the Moroun family, and any conflict of interest may be resolved in a manner that does not favor us. Accordingly, the Moroun family could cause us to enter into transactions or agreements of which our other shareholders would not approve or make decisions with which they may disagree. Because of the level of ownership held by the Moroun family, we have elected to be treated as a controlled company in accordance with the rules of the NASDAQ Stock Market. Accordingly, we are not required to comply with NASDAQ Stock Market rules which would otherwise require a majority of our board to be comprised of independent directors and require our board to have a compensation committee and a nominating and corporate governance committee comprised of independent directors.
The Moroun family may continue to retain control of us for the foreseeable future and may decide not to enter into a transaction in which shareholders would receive consideration for our common stock that is much higher than the then-current market price of our common stock. In addition, the Moroun family could elect to sell a controlling interest in us to a third-party and our other shareholders may not be able to participate in such transaction or, if they are able to participate in such a transaction, such shareholders may receive less than the then current fair market value of their shares. Any decision regarding their ownership of us that the Moroun family may make at some future time will be in their absolute discretion, subject to applicable laws and fiduciary duties.
Our stock trading volume may not provide adequate liquidity for investors.
Although shares of our common stock are traded on the NASDAQ Global Market, the average daily trading volume in our common stock is less than that of other larger transportation and logistics companies. A public trading market having the desired characteristics of depth, liquidity and orderliness depends on the presence in the marketplace of a sufficient number of willing buyers and sellers of the common stock at any given time. This presence depends on the individual decisions of investors and general economic and market conditions over which we have no control. Given the daily average trading volume of our common stock, significant sales of the common stock in a brief period of time, or the expectation of these sales, could cause a decline in the price of our common stock. Additionally, low trading volumes may limit a shareholder’s ability to sell shares of our common stock.
Our ability to pay regular dividends on our common stock is subject to the discretion of our Board of Directors and will depend on, among other things, our financial condition, results of operations, capital requirements, any covenants included in our credit facilities any legal or contractual restrictions on the payment of dividends and other factors the Board of Directors deems relevant.
We have adopted a cash dividend policy which anticipates a total annual dividend of $0.42 per share of common stock. However, the payment of future dividends will be at the discretion of our Board of Directors and will depend, among other things, on our financial condition, results of operations, capital requirements, any covenants included in our credit facilities, any legal or contractual restrictions on the payment of dividends and other factors the Board of Directors deem relevant. As a consequence of these limitations and restrictions, we may not be able to make, or may have to reduce or eliminate, the payment of dividends on our common stock. Additionally, any change in the level of our dividends or the suspension of the payment thereof could adversely affect the market price of our common stock.
15
Our articles of incorporation and bylaws have, and under Michigan law are subject to, provisions that could deter or prevent a change of control.
Our articles of incorporation and bylaws contain provisions that might enable our management to resist a proposed takeover of our Company. These provisions could discourage, delay or prevent a change of control of our Company or an acquisition of our Company at a price that our shareholders may find attractive. These provisions also may discourage proxy contests and make it more difficult for our shareholders to elect directors and take other corporate actions. The existence of these provisions could limit the price that investors might be willing to pay in the future for shares of our common stock. These provisions include:
|
|
• |
a requirement that special meetings of our shareholders may be called only by our Board of Directors, the Chairman of our Board of Directors, our Chief Executive Officer or the holders of a majority of our outstanding common stock; |
|
|
• |
advance notice requirements for shareholder proposals and nominations; |
|
|
• |
the authority of our Board of Directors to issue, without shareholder approval, preferred stock with such terms as the Board of Directors may determine, including in connection with our implementation of any shareholders rights plan; and |
|
|
• |
an exclusive forum bylaw provision requiring that any derivative action brought on behalf of the corporation, any action asserting a claim of breach of a legal or fiduciary duty and any similar claim under the Michigan Business Corporation Act or our articles of incorporation must be brought exclusively in the Circuit Court of the County of Macomb in the State of Michigan or the United States District Court for the Eastern District of Michigan, Southern Division. |
In addition, certain provisions of Michigan law that apply to us could discourage or prevent a change of control or acquisition of our Company.
None.
We are headquartered and maintain our corporate administrative offices in Warren, Michigan. We own our corporate administrative offices, as well as 19 terminal yards and other properties in the following locations: Dearborn, Michigan; Romulus, Michigan; Louisville, Kentucky; Albany, Missouri; Columbus, Ohio; Reading, Ohio; Latty, Ohio; Cleveland, Ohio; Gary, Indiana; South Kearny, New Jersey; Rural Hall, North Carolina; Garden City, Georgia; Millwood, West Virginia; Memphis, Tennessee; Jacksonville, Florida; Tampa, Florida; Dallas, Texas; Houston, Texas; York County, Pennsylvania and Wall, Pennsylvania.
As of December 31, 2017, we also leased 81 operating, terminal and yard, and administrative facilities in various U.S. cities located in 25 states, in Milton, Ontario; London, Ontario; Windsor, Ontario; and in San Luis Potosí, Mexico. Generally, our facilities are utilized by both of our operating segments for various administrative, transportation-related or value-added services. We also deliver value-added services under our logistics segment inside or linked to 14 facilities provided by customers. Certain of our leased facilities are leased from entities controlled by our majority shareholders. These facilities are leased on either a month-to-month basis or extended terms. We believe that the properties we lease from these affiliates are, in the aggregate, leased at market rates and are suitable for their purposes and adequate to meet our needs. For more information on our lease arrangements, see Part II, Item 8: Notes 7 and 9 to the Consolidated Financial Statements.
16
On October 16, 2017, a jury in state court in Cook County, Illinois rendered a verdict of $54.2 million against Universal Am-Can, Ltd. (“UACL”) in the matter of Denton v. UACL, et al. The litigation relates to a vehicular accident that occurred on February 8, 2011 on I-65 in Rensselaer, Indiana. The accident involved a tractor-trailer being driven by an independent owner-operator of UACL. The driver was braking on the expressway in order to avoid another vehicle being driven the wrong way on the interstate. The truck attempted to avoid the oncoming vehicle and the plaintiff’s vehicle and, in so doing, struck the plaintiff’s vehicle. As a result of the accident, the plaintiff sustained non-life threatening injuries. In connection with the verdict, the jury determined that UACL was responsible for the liability associated with the accident. The verdict included $19.2 million in compensatory damages and $35.0 million in punitive damages against UACL. The insurance coverage available for reimbursement of UACL’s damages underlying the verdict is limited to $1.0 million. We believe the facts and the law do not support the jury’s findings of liability against UACL. Post-trial motions have been filed seeking a reduction of the verdict or reversal of the judgment. The Company may further seek to appeal the verdict to the extent the circuit court does not set aside the judgment as a result of these motions. The Company currently estimates the possible range of financial exposure in the matter, net of insurance coverage, to be between $18.2 and $53.2 million. Based on the Company’s best estimate of the liability at this time, the Company has recorded an accrued liability for this matter of $18.2 million. While we cannot predict with any certainty the outcome of this litigation, its ultimate resolution could be material to our cash flows and results of operations.
The Company is a plaintiff in a lawsuit that was filed on June 11, 2015 against, among others, Dalton Logistics, Inc. in the United States District Court for the Southern District of Texas. We are seeking approximately $1.9 million in damages from a debtor relating to its unpaid freight charges. In response to our filing of the complaint, the shareholders of Dalton filed a counterclaim against the Company alleging that the Company, in connection with certain unrelated negotiations with the defendant, breached an alleged agreement to acquire Dalton. The respective claims proceeded to trial and, on July 21, 2017, a jury returned two separate verdicts: One in favor of Universal for $1.9 million, and a second in favor of the defendant for approximately $5.7 million. On October 30, 2017, the court entered a judgment against Universal for the $5.7 million, but ignored the $1.9 million jury award in favor of Universal. The Company believes this ruling was in error and further believes the jury erred in their findings of any damages against Universal, and therefore, the Company plans to appeal both the ruling and the verdict. The Company currently estimates the possible range of financial exposure in the matter to be between $0 and $5.7 million. Based on the Company’s best estimate of the liability at this time, the Company has recorded an accrued liability for this matter of $1.8 million. While we cannot predict with any certainty the outcome of this litigation, management does not believe the outcome of this matter will have a material adverse effect on our business, financial position, results of operations or cash flows.
On February 21, 2018, Ford Motor Company (“Ford”) filed suit against two of the Company’s subsidiaries and two related parties in state court in Oakland County, Michigan (the “Indemnity Action”). The complaint seeks a declaratory judgment that Universal and its co-defendants are required to indemnify Ford for damages sustained by Ford in a wrongful death lawsuit in Clay County, Missouri (the “Underlying Action”). In February 2018, a jury returned a verdict against Ford in the Underlying Action and awarded the decedent’s estate $76 million in damages. Universal believes that, under Michigan law and its agreement with Ford, Universal is not required to indemnify Ford for Ford’s own negligence that led to the jury verdict in the Underlying Action. Additionally, at the time of the incident that is the subject of the Underlying Action, Universal had in place insurance required by Ford providing for up to $3.0 million of coverage from a co-defendant. The Company currently estimates the possible range of financial exposure in the matter, net of insurance coverage, to be between $0 and $73 million. Based on not only its knowledge of the facts associated with the Underlying Action and the Indemnity Action but also the opinions of its outside counsel, Universal has determined that a loss in the Indemnity Action is not probable and no accrual is necessary at this time. While the outcome of the Indemnity Action cannot be predicted with any certainty and management believes the Company will be successful in defending its position, the outcome could have material adverse effect on our business, financial position, results of operations and cash flows of the Company.
The Company is involved in certain other claims and pending litigation arising from the ordinary conduct of business. We also provide accruals for claims within our self-insured retention amounts. Based on the knowledge of the facts, and in certain cases, opinions of outside counsel, in the Company’s opinion the resolution of these claims and pending litigation will not have a material effect on our financial position, results of operations or cash flows. However, if we experience claims that are not covered by our insurance or that exceed our estimated claim reserve, it could increase the volatility of our earnings and have a materially adverse effect on our financial condition, results of operations or cash flows.
Not applicable.
17
|
ITEM 5: |
MARKET FOR THE REGISTRANT’S COMMON EQUITY, RELATED STOCKHOLDER MATTERS AND ISSUER PURCHASES OF EQUITY SECURITIES |
Market Information
Our common stock is traded on The NASDAQ Global Market under the symbol ULH. The following table shows the reported high and low sales prices of our common stock for the periods indicated.
|
|
|
2017 |
|
|
2016 |
|
||||||||||
|
Fiscal Period |
|
High |
|
|
Low |
|
|
High |
|
|
Low |
|
||||
|
First Quarter |
|
$ |
16.50 |
|
|
$ |
12.51 |
|
|
$ |
18.31 |
|
|
$ |
11.12 |
|
|
Second Quarter |
|
$ |
15.95 |
|
|
$ |
11.65 |
|
|
$ |
16.93 |
|
|
$ |
11.78 |
|
|
Third Quarter |
|
$ |
20.70 |
|
|
$ |
14.05 |
|
|
$ |
15.45 |
|
|
$ |
11.90 |
|
|
Fourth Quarter |
|
$ |
24.65 |
|
|
$ |
20.10 |
|
|
$ |
17.70 |
|
|
$ |
11.09 |
|
The reported last sale price per share of our common stock as quoted through the NASDAQ Global Market on March 5, 2018 was $21.40 per share. As of such date, we had 28,382,392 shares outstanding. As of March 5, 2018, there were approximately 11 record holders of our common stock, based upon data available to us from our transfer agent. We believe, however, that we have a significantly greater number of shareholders because a substantial number of our common shares are held at The Depository Trust & Clearing Corporation on behalf of our shareholders.
Dividends
On February 21, 2018, our Board of Directors approved an increase in the Company’s annual cash dividend policy from $0.28 per share to $0.42 per share beginning in 2018. The first quarterly installment of $0.105 per share is expected to be declared after the conclusion of the first quarter of 2018. After taking into account the regular quarterly dividends made during the year, the Board of Directors also intends to evaluate the potential declaration of an annual special dividend payable in the first quarter of each year in an effort to return up to 40% of Universal’s net income from the previous fiscal year, beginning in the first quarter of 2019.
Pursuant to the cash dividend policy adopted in 2013 and effective until February 21, 2018, the Board of Directors declared quarterly cash dividends of $0.07 per common share totaling $0.28 per common share for each of the fiscal years ended December 31, 2017, 2016 and 2015. Future dividend policy and the payment of dividends, if any, will be determined by the Board of Directors in light of circumstances then existing, including our earnings, financial condition and other factors deemed relevant by the Board of Directors.
Limitations on our ability to pay dividends are described under the section captioned “Liquidity and Capital Resources – Revolving Credit, Promissory Notes and Term Loan Agreements” in Item 7 of this Form 10-K.
Securities Authorized for Issuance under Equity Compensation Plans
See Part III, Item 12, “Security Ownership of Certain Beneficial Owners and Management and Related Shareholder Matters” of this Annual Report for a presentation of compensation plans under which equity securities of the Company are authorized for issuance.
Purchases of Equity Securities by the Issuer
The following table provides information regarding the Company’s purchases of its common stock during the period from October 1, 2017 to December 31, 2017, the Company’s fourth fiscal quarter:
|
Fiscal Period |
|
Total Number of Shares Purchased |
|
|
Average Price Paid per Share |
|
|
Total Number of Shares Purchased as Part of Publicly Announced Program |
|
|
Maximum Number of Shares that May Yet be Purchased Under the Plans or Program |
|
||||
|
Oct. 1, 2017 - Oct. 28, 2017 |
|
|
25,580 |
|
|
$ |
20.62 |
|
|
|
25,580 |
|
|
|
751,153 |
|
|
Oct. 29, 2017 - Nov. 25, 2017 |
|
|
20,000 |
|
(1) |
|
22.13 |
|
|
|
- |
|
|
|
751,153 |
|
|
Nov. 26, 2017 - Dec. 31, 2017 |
|
|
55 |
|
(2) |
|
23.90 |
|
|
|
- |
|
|
|
751,153 |
|
|
Total |
|
|
45,635 |
|
|
$ |
21.28 |
|
|
|
25,580 |
|
|
|
751,153 |
|
|
|
|
|
|
|
|
|
|
|
|
|
|
|
|
|
|
|
18
|
|
(2) |
Consists of 55 shares of common stock withheld on December 20, 2017 to satisfy employee tax withholding in the amount of $1,315 upon vesting of restricted stock. |
On June 30, 2014, the Company announced that it had been authorized to purchase up to 800,000 shares of its common stock from time to time in the open market. As of December 31, 2017, the Company may purchase 751,153 shares of its common stock under this authorization. No specific expiration date has been assigned to the authorization.
Performance Graph
The graph below matches Universal Logistics Holdings, Inc.'s cumulative 5-year total shareholder return on common stock with the cumulative total returns of the NASDAQ Composite index and the NASDAQ Transportation index. The graph tracks the performance of a $100 investment in our common stock and in each index (with the reinvestment of all dividends) from December 31, 2012 to December 31, 2017.
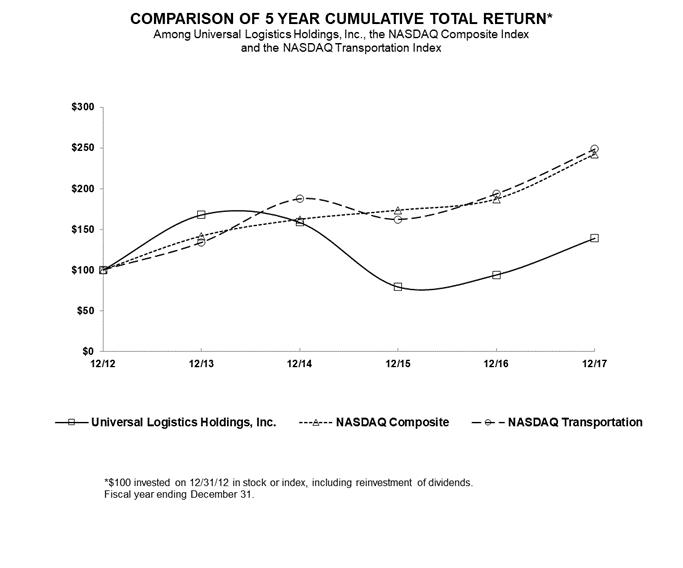
|
|
|
12/12 |
|
|
12/13 |
|
|
12/14 |
|
|
12/15 |
|
|
12/16 |
|
|
12/17 |
|
||||||
|
Universal Logistics Holdings, Inc. |
|
|
100.00 |
|
|
|
168.03 |
|
|
|
158.76 |
|
|
|
79.28 |
|
|
|
94.15 |
|
|
|
139.25 |
|
|
NASDAQ Composite |
|
|
100.00 |
|
|
|
141.63 |
|
|
|
162.09 |
|
|
|
173.33 |
|
|
|
187.19 |
|
|
|
242.29 |
|
|
NASDAQ Transportation |
|
|
100.00 |
|
|
|
133.76 |
|
|
|
187.65 |
|
|
|
162.30 |
|
|
|
193.79 |
|
|
|
248.92 |
|
The stock price performance included in this graph is not necessarily indicative of future stock price performance.
19
The following table sets forth the selected historical financial and operating data as of and for the periods presented. The selected historical balance sheet data at December 31, 2017, 2016, 2015, 2014 and 2013 and the selected historical statement of income data for the years ended December 31, 2017, 2016, 2015, 2014 and 2013 have been derived from our audited consolidated financial statements. The selected historical financial and operating data presented below should be read in conjunction with the information included under the heading “Management’s Discussion and Analysis of Financial Condition and Results of Operations” and our consolidated financial statements and related notes included elsewhere in this Form 10-K. The following financial and operating data may not be indicative of our future performance.
|
|
|
Years ended December 31, |
|
|||||||||||||||||
|
|
|
2017 |
|
|
2016 |
|
|
2015 |
|
|
2014 |
|
|
2013 |
|
|||||
|
|
|
(In thousands, except per share information, operating data and percentages) |
|
|||||||||||||||||
|
Statements of Income Data: |
|
|
|
|
|
|
|
|
|
|
|
|
|
|
|
|
|
|
|
|
|
Operating revenues |
|
$ |
1,216,665 |
|
|
$ |
1,072,751 |
|
|
$ |
1,128,773 |
|
|
$ |
1,191,521 |
|
|
$ |
1,033,492 |
|
|
Operating expenses: |
|
|
|
|
|
|
|
|
|
|
|
|
|
|
|
|
|
|
|
|
|
Purchased transportation and equipment rent |
|
|
577,485 |
|
|
|
509,775 |
|
|
|
567,558 |
|
|
|
615,327 |
|
|
|
560,024 |
|
|
Direct personnel and related benefits |
|
|
314,364 |
|
|
|
265,316 |
|
|
|
222,454 |
|
|
|
214,640 |
|
|
|
187,241 |
|
|
Operating supplies and expenses |
|
|
115,420 |
|
|
|
103,013 |
|
|
|
113,545 |
|
|
|
124,456 |
|
|
|
83,769 |
|
|
Commission expense |
|
|
33,213 |
|
|
|
32,350 |
|
|
|
37,844 |
|
|
|
43,922 |
|
|
|
39,248 |
|
|
Occupancy expense |
|
|
30,575 |
|
|
|
31,923 |
|
|
|
27,004 |
|
|
|
25,063 |
|
|
|
20,049 |
|
|
General and administrative |
|
|
31,518 |
|
|
|
29,368 |
|
|
|
30,687 |
|
|
|
28,234 |
|
|
|
19,740 |
|
|
Insurance and claims (8) |
|
|
41,881 |
|
|
|
17,724 |
|
|
|
21,413 |
|
|
|
25,991 |
|
|
|
19,242 |
|
|
Depreciation and amortization |
|
|
46,995 |
|
|
|
36,702 |
|
|
|
34,873 |
|
|
|
33,053 |
|
|
|
19,686 |
|
|
Total operating expenses |
|
|
1,191,451 |
|
|
|
1,026,171 |
|
|
|
1,055,378 |
|
|
|
1,110,686 |
|
|
|
948,999 |
|
|
Income from operations |
|
|
25,214 |
|
|
|
46,580 |
|
|
|
73,395 |
|
|
|
80,835 |
|
|
|
84,493 |
|
|
Interest income |
|
|
92 |
|
|
|
157 |
|
|
|
55 |
|
|
|
46 |
|
|
|
130 |
|
|
Interest expense |
|
|
(9,538 |
) |
|
|
(8,266 |
) |
|
|
(9,235 |
) |
|
|
(8,229 |
) |
|
|
(4,166 |
) |
|
Other non-operating income |
|
|
1,373 |
|
|
|
934 |
|
|
|
790 |
|
|
|
447 |
|
|
|
459 |
|
|
Income before for income taxes |
|
|
17,141 |
|
|
|
39,405 |
|
|
|
65,005 |
|
|
|
73,099 |
|
|
|
80,916 |
|
|
Income tax (benefit) expense |
|
|
(11,012 |
) |
|
|
15,161 |
|
|
|
25,004 |
|
|
|
27,729 |
|
|
|
30,344 |
|
|
Net income |
|
$ |
28,153 |
|
|
$ |
24,244 |
|
|
$ |
40,001 |
|
|
$ |
45,370 |
|
|
$ |
50,572 |
|
|
Earnings per common share: |
|
|
|
|
|
|
|
|
|
|
|
|
|
|
|
|
|
|
|
|
|
Basic |
|
$ |
0.99 |
|
|
$ |
0.85 |
|
|
$ |
1.37 |
|
|
$ |
1.51 |
|
|
$ |
1.68 |
|
|
Diluted |
|
$ |
0.99 |
|
|
$ |
0.85 |
|
|
$ |
1.37 |
|
|
$ |
1.51 |
|
|
$ |
1.68 |
|
|
Weighted average number of common shares outstanding: |
|
|
|
|
|
|
|
|
|
|
|
|
|
|
|
|
|
|
|
|
|
Basic |
|
|
28,425 |
|
|
|
28,411 |
|
|
|
29,233 |
|
|
|
30,013 |
|
|
|
30,064 |
|
|
Diluted |
|
|
28,428 |
|
|
|
28,411 |
|
|
|
29,235 |
|
|
|
30,044 |
|
|
|
30,160 |
|
|
Dividends paid per common share |
|
$ |
0.28 |
|
|
$ |
0.28 |
|
|
$ |
0.28 |
|
|
$ |
0.28 |
|
|
$ |
0.14 |
|
|
Balance Sheet Data (at end of period): |
|
|
|
|
|
|
|
|
|
|
|
|
|
|
|
|
|
|
|
|
|
Cash and cash equivalents |
|
$ |
1,672 |
|
|
$ |
1,755 |
|
|
$ |
12,930 |
|
|
$ |
8,001 |
|
|
$ |
10,223 |
|
|
Total assets |
|
$ |
610,592 |
|
|
$ |
570,457 |
|
|
$ |
503,155 |
|
|
$ |
529,014 |
|
|
$ |
490,136 |
|
|
Total debt |
|
$ |
249,239 |
|
|
$ |
262,850 |
|
|
$ |
234,913 |
|
|
$ |
235,298 |
|
|
$ |
237,500 |
|
20
|
|
|
Years ended December 31, |
|
|||||||||||||||||
|
|
|
2017 |
|
|
2016 |
|
|
2015 |
|
|
2014 |
|
|
2013 |
|
|||||
|
|
|
(In thousands, except per share information, operating data and percentages) |
|
|||||||||||||||||
|
Other Data: |
|
|
|
|
|
|
|
|
|
|
|
|
|
|
|
|
|
|
|
|
|
EBITDA (1) |
|
$ |
73,582 |
|
|
$ |
84,216 |
|
|
$ |
109,058 |
|
|
$ |
114,335 |
|
|
$ |
104,638 |
|
|
EBITDA margin (4) |
|
|
6.0 |
% |
|
|
7.9 |
% |
|
|
9.7 |
% |
|
|
9.6 |
% |
|
|
10.1 |
% |
|
Adjusted EBITDA (1) |
|
$ |
90,937 |
|
|
$ |
84,216 |
|
|
$ |
109,058 |
|
|
$ |
114,335 |
|
|
$ |
105,361 |
|
|
Adjusted EBITDA margin (4) |
|
|
7.5 |
% |
|
|
7.9 |
% |
|
|
9.7 |
% |
|
|
9.6 |
% |
|
|
10.2 |
% |
|
Operating margin (4) |
|
|
2.1 |
% |
|
|
4.3 |
% |
|
|
6.5 |
% |
|
|
6.8 |
% |
|
|
8.2 |
% |
|
Adjusted operating margin (4) |
|
|
3.5 |
% |
|
|
4.3 |
% |
|
|
6.5 |
% |
|
|
6.8 |
% |
|
|
8.2 |
% |
|
Return on average assets (5) |
|
|
4.8 |
% |
|
|
4.5 |
% |
|
|
7.8 |
% |
|
|
8.9 |
% |
|
|
12.4 |
% |
|
Average number of employees |
|
|
7,253 |
|
|
|
5,573 |
|
|
|
4,397 |
|
|
|
4,219 |
|
|
|
3,449 |
|
|
Average number of full time equivalents |
|
|
1,731 |
|
|
|
2,172 |
|
|
|
1,606 |
|
|
|
1,528 |
|
|
|
1,786 |
|
|
Average number of tractors |
|
|
3,996 |
|
|
|
4,335 |
|
|
|
4,142 |
|
|
|
4,180 |
|
|
|
4,123 |
|
|
Number of value-added programs |
|
|
50 |
|
|
|
47 |
|
|
|
49 |
|
|
|
45 |
|
|
|
43 |
|
|
Number of agents (6) |
|
|
232 |
|
|
|
253 |
|
|
|
264 |
|
|
|
288 |
|
|
|
307 |
|
|
Operating revenues per loaded mile (7) |
|
$ |
2.89 |
|
|
$ |
2.72 |
|
|
$ |
2.96 |
|
|
$ |
3.21 |
|
|
$ |
2.96 |
|
|
Operating revenues per load (7) |
|
$ |
822 |
|
|
$ |
730 |
|
|
$ |
809 |
|
|
$ |
850 |
|
|
$ |
794 |
|
|
Average length of haul (in miles) (7) |
|
|
284 |
|
|
|
269 |
|
|
|
274 |
|
|
|
265 |
|
|
|
269 |
|
|
Number of loads (7) |
|
|
967,378 |
|
|
|
941,170 |
|
|
|
932,165 |
|
|
|
951,884 |
|
|
|
926,171 |
|
|
Fuel surcharge revenues (where separately identified) |
|
$ |
59,511 |
|
|
$ |
50,869 |
|
|
$ |
75,743 |
|
|
$ |
119,749 |
|
|
$ |
118,594 |
|
(1)In addition to providing consolidated financial statements based on generally accepted accounting principles in the United States of America (GAAP), we are providing additional financial measures that are not required by or prepared in accordance with GAAP (non-GAAP). We present adjusted income from operations, EBITDA and adjusted EBITDA as supplemental measures of our performance. We define adjusted income from operations as income from operations adjusted to eliminate the impact of certain items that we do not consider indicative of our ongoing operating performance, including charges related to certain on-going litigation taken in 2017, and transaction and other costs related to our acquisition of Westport in 2013. We define EBITDA as net income plus (i) interest expense, net, (ii) provision for income taxes and (iii) depreciation and amortization. Adjusted EBITDA is further adjusted to eliminate the impact of certain items that we do not consider indicative of our ongoing operating performance, including charges taken related to certain on-going litigation in 2017. These further adjustments are itemized below. You are encouraged to evaluate these adjustments and the reasons we consider them appropriate for supplemental analysis. In evaluating adjusted income from operations, EBITDA and adjusted EBITDA, you should be aware that in the future we may incur expenses that are the same as or similar to some of the adjustments in this presentation. Our presentation of adjusted income from operations, EBITDA and adjusted EBITDA should not be construed as an inference that our future results will be unaffected by unusual or non-recurring items.
21
In accordance with the requirements of Regulation G issued by the Securities and Exchange Commission, we are presenting the most directly comparable GAAP financial measure and reconciling the non-GAAP financial measure to the comparable GAAP measure. Set forth below is a reconciliation of income from operations, the most comparable GAAP measure, to adjusted income from operations; and of net income, the most comparable GAAP measure, to EBITDA and adjusted EBITDA for each of the periods indicated:
|
|
|
Years ended December 31, |
|
|||||||||||||||||
|
|
|
2017 |
|
|
2016 |
|
|
2015 |
|
|
2014 |
|
|
2013 |
|
|||||
|
|
|
(In thousands, except per share information, operating data and percentages) |
|
|||||||||||||||||
|
Adjusted income from operations |
|
|
|
|
|
|
|
|
|
|
|
|
|
|
|
|
|
|
|
|
|
Income from operations |
|
$ |
25,214 |
|
|
$ |
46,580 |
|
|
$ |
73,395 |
|
|
$ |
80,835 |
|
|
$ |
84,493 |
|
|
Transaction and other costs (2) |
|
|
— |
|
|
|
— |
|
|
|
— |
|
|
|
— |
|
|
|
723 |
|
|
Litigation charges (3) |
|
|
17,355 |
|
|
|
— |
|
|
|
— |
|
|
|
— |
|
|
|
— |
|
|
Adjusted income from operations |
|
$ |
42,569 |
|
|
$ |
46,580 |
|
|
$ |
73,395 |
|
|
$ |
80,835 |
|
|
$ |
85,216 |
|
|
Adjusted EBITDA |
|
|
|
|
|
|
|
|
|
|
|
|
|
|
|
|
|
|
|
|
|
Net income |
|
$ |
28,153 |
|
|
$ |
24,244 |
|
|
$ |
40,001 |
|
|
$ |
45,370 |
|
|
$ |
50,572 |
|
|
Income tax (benefit) expense |
|
|
(11,012 |
) |
|
|
15,161 |
|
|
|
25,004 |
|
|
|
27,729 |
|
|
|
30,344 |
|
|
Interest expense, net |
|
|
9,446 |
|
|
|
8,109 |
|
|
|
9,180 |
|
|
|
8,183 |
|
|
|
4,036 |
|
|
Depreciation and amortization |
|
|
46,995 |
|
|
|
36,702 |
|
|
|
34,873 |
|
|
|
33,053 |
|
|
|
19,686 |
|
|
EBITDA |
|
|
73,582 |
|
|
|
84,216 |
|
|
|
109,058 |
|
|
|
114,335 |
|
|
|
104,638 |
|
|
Merger transaction costs (2) |
|
|
— |
|
|
|
— |
|
|
|
— |
|
|
|
— |
|
|
|
723 |
|
|
Litigation charges (3) |
|
|
17,355 |
|
|
|
— |
|
|
|
— |
|
|
|
— |
|
|
|
— |
|
|
Adjusted EBITDA |
|
$ |
90,937 |
|
|
$ |
84,216 |
|
|
$ |
109,058 |
|
|
$ |
114,335 |
|
|
$ |
105,361 |
|
We present adjusted income from operations and adjusted EBITDA in this Form 10-K because we believe they assist investors and analysts in comparing our performance across reporting periods on a consistent basis by excluding items that we do not believe are indicative of our core operating performance.
These performance metrics have limited utility as analytical tools. Some of these limitations are:
|
|
• |
Adjusted income from operations and adjusted EBITDA do not reflect our cash expenditures, or future requirements, for capital expenditures or contractual commitments; |
|
|
• |
Adjusted income from operations and adjusted EBITDA do not reflect changes in, or cash requirements for, our working capital needs; |
|
|
• |
Adjusted income from operations and adjusted EBITDA do not reflect the significant interest expense, or the cash requirements necessary to service interest or principal payments, on our debt; |
|
|
• |
Although depreciation and amortization are non-cash charges, the assets being depreciated and amortized will often have to be replaced in the future, and adjusted EBITDA does not reflect any cash requirements for such replacements; |
|
|
• |
Adjusted income from operations and adjusted EBITDA do not reflect the impact of certain cash charges resulting from matters we consider not to be indicative of our ongoing operations; and |
|
|
• |
Other companies in our industry may calculate adjusted income from operations and adjusted EBITDA differently than we do, limiting its usefulness as a comparative measure. |
Because of these limitations, adjusted income from operations and adjusted EBITDA should not be considered in isolation or as a substitute for performance measures calculated in accordance with GAAP. We compensate for these limitations by relying primarily on our GAAP results and using adjusted income from operations and adjusted EBITDA as secondary, supplemental measures.
|
(2) |
Represents transaction and other costs incurred that were directly related to the acquisitions of Westport in December 2013. |
|
(3) |
Represents charges recorded in the third quarter of 2017 related to certain on-going litigation. |
|
(4) |
Operating margin, adjusted operating margin, EBITDA margin, and adjusted EBITDA margin are computed by dividing income from operations, adjusted income from operations, EBITDA, and adjusted EBITDA, respectively, by total operating revenues for each of the periods indicated. |
|
(5) |
Net income divided by total average assets during the period. Average assets are the sum of our total assets at the end of the fiscal year and our total assets at the end of the prior fiscal year divided by two. |
|
(6) |
Includes only those agents who generated at least $100,000 in operating revenues during the period indicated. |
|
(7) |
Includes fuel surcharges, where separately identifiable, and excludes Universal Logistics Solutions International, Inc., in order to improve the relevance of the statistical data related to our brokerage services and improve the comparability to our peer companies. Also excludes final mile delivery and shuttle service loads. |
|
(8) |
See Item 8, Note 13 to the Consolidated Financial Statements for further information. |
22
Overview
We are a leading asset-light provider of customized transportation and logistics solutions throughout the United States, and in Mexico, Canada and Colombia. We provide a comprehensive suite of transportation and logistics solutions that allow our customers to reduce costs and manage their global supply chains more efficiently. We market our services through a direct sales and marketing network focused on selling our portfolio of services to large customers in specific industry sectors, through a contract network of agents who solicit freight business directly from shippers, and through company-managed facilities and full-service freight forwarding and customs house brokerage offices.
Our network of agents and owner-operators is located throughout the United States and in Ontario, Canada, and we operate, manage or provide services at 94 logistics locations in the United States, Mexico, Canada and Colombia. Fourteen of our value-added service operations are located inside customer plants or distribution operations; the other facilities are generally located close to our customers’ plants to optimize the efficiency of their component supply chains and production processes. Our facilities and services are often directly integrated into the production processes of our customers and represent a critical piece of their supply chains. To support our asset-light business model, we generally coordinate the duration of real estate leases associated with our value-added services with the end date of the related customer contract associated with such facility, or use month-to-month leases, in order to mitigate exposure to unrecovered lease costs.
We offer our customers a wide range of transportation services by utilizing a diverse fleet of tractors and trailing equipment provided by us, our owner-operators and third-party transportation companies. Our owner-operators provided us with approximately 2,850 tractors and 1,740 trailers. We own approximately 935 tractors, 4,000 trailers, 1,025 chassis and 800 containers. Our agents and owner-operators are independent contractors who earn a fixed commission calculated as a percentage of the revenue or gross profit they generate for us and who bring an entrepreneurial spirit to our business. Our transportation services are provided through a network of both union and non-union employee drivers, owner-operators, contract drivers, and third-party transportation companies.
As of December 31, 2017, we employed 8,231 people in the United States, Mexico, Canada, and Colombia, including 2,518 employees subject to collective bargaining agreements. We also engaged contract staffing vendors to supply an average of 1,731 additional personnel on a full-time-equivalent basis.
Our use of agents, owner-operators, third-party providers and contract staffing vendors allows us to maintain both a highly flexible cost structure and a scalable business operation, while reducing investment requirements. These benefits are passed on to our customers in the form of cost savings and increased operating efficiency, while enhancing our cash generation and the returns on our invested capital and assets.
We believe that our flexible business model also offers us substantial opportunities to grow through a mixture of organic growth and acquisitions. We intend to continue our organic growth by recruiting new agents and owner-operators, expanding into new industry verticals and targeting further penetration of our key customers. We believe our integrated suite of transportation and logistics services, our network of facilities in the United States, Mexico, Canada, and Colombia, our long-term customer relationships and our reputation for operational excellence will allow us to capitalize on these growth opportunities. We also expect to continue to make strategic acquisitions of companies that complement our asset light business model, as well as companies that derive a portion of their revenues from asset based operations.
Factors Affecting Our Revenues
Operating Revenues. We generate substantially all of our revenues through fees charged to customers for the transportation of freight and for the customized logistics services we provide. We also derive revenue from fuel surcharges, where separately identifiable, loading and unloading activities, equipment detention, container management and storage and other related services. Operations aggregated in our transportation segment are associated with individual freight shipments coordinated by our agents, company-managed terminals and specialized services operations. In contrast, operations aggregated in our logistics segment deliver value-added services and transportation services to specific customers on a dedicated basis, generally pursuant to contract terms of one year or longer. Our segments are distinguished by the amount of forward visibility we have in regards to pricing and volumes, and also by the extent to which we dedicate resources and company-owned equipment. Fees charged to customers by our full service international freight forwarding and customs house brokerage are based on the specific means of forwarding or delivering freight on a shipment-by-shipment basis.
23
Our transportation revenues are primarily influenced by fluctuations in freight volumes and shipping rates. The main factors that affect these are competition, available truck capacity, and economic market conditions. Our value-added contract business is substantially driven by the level of demand for outsourced logistics services. Major factors that affect our revenues include changes in manufacturing supply chain requirements, production levels in specific industries, pricing trends due to levels of competition and resource costs in logistics and transportation, and economic market conditions.
We recognize revenue on a gross basis at the time that persuasive evidence of an arrangement with our customer exists, sales price is fixed and determinable, and collectability is reasonably assured. Our revenue is recognized at the time of delivery to the receiver’s location, or for service arrangements, after the related services have been rendered.
Factors Affecting Our Expenses
Purchased transportation and equipment rent. Purchased transportation and equipment rent represents the amounts we pay to our owner-operators or other third party equipment providers to haul freight and, to the extent required to deliver certain logistics services, the cost of equipment leased under short-term contracts from third parties. The amount of the purchased transportation we pay to our owner-operators is primarily based on a contractually agreed-upon percentage of our revenue for each load hauled, net of any rental income we receive by leasing our trailers to owner-operators. The expense also includes the amount of fuel surcharges, where separately identifiable, that we receive from our customers and pass through to our owner-operators. Our strategy is to maintain a highly flexible business model that employs a cost structure that is mostly variable in nature. As a result, purchased transportation and equipment rent is the largest component of our costs and increases or decreases proportionately with changes in the amount of revenue generated by our owner-operators and other third party providers and with the production volumes of our customers. We recognize purchased transportation and equipment rent as the services are provided.
Direct personnel and related benefits. Direct personnel and related benefits include the salaries, wages and fringe benefits of our employees, as well as costs related to contract labor utilized in selling and operating activities. These costs are a significant component of our cost structure and increase or decrease proportionately with the expansion, addition or closing of operating facilities. As of December 31, 2017, approximately 19% of our employees in the United States, Canada and Colombia, and 95% of our employees in Mexico were subject to collective bargaining agreements. Any changes in union agreements will affect our personnel and related benefits cost. The operations in the United States, Mexico and Canada that are subject to collective bargaining agreements have separate, individualized agreements with several different unions that represent employees in these operations. While there are some facilities with multiple unions, each collective bargaining agreement with each union covers a single facility for that union. Such agreements have expiration dates that are generally independent of other collective bargaining agreements and include economics and operating terms tailored to the specific operational requirements of a customer. Our operation in Mexico provides competitive compensation within the Mexican statutory framework for managerial and supervisory personnel.
Operating supplies and expenses. These expenses include items such as fuel, tires and parts repair items primarily related to the maintenance of company owned/leased tractors, trailers and lift equipment, as well as licenses, dock supplies, communication, utilities, operating taxes and other general operating expenses. Because we maintain a flexible business model, our operating expenses generally relate to equipment utilization, fluctuations in customer demand and the related impact on our operating capacity. Our transportation services provided by company owned equipment depend on the availability and pricing of diesel fuel. Although we often include fuel surcharges in our billing to customers to offset increases in fuel costs, other operating costs have been, and may continue to be, impacted by fluctuating fuel prices. We recognize these expenses as they are incurred and the related income as it is earned.
Commission expense. Commission expense represents the amount we pay our agents for generating shipments on our behalf. The commissions we pay to our agents are generally established through informal oral agreements and are based on a percentage of revenue or gross profit generated by each load hauled. Traditionally, commission expense increases or decreases in proportion to the revenues generated through our agents. We recognize commission expense at the time we recognize the associated revenue.
Occupancy expense. Occupancy expense includes all costs related to the lease and tenancy of terminals and operating facilities, except utilities, unless such costs are otherwise covered by our customers. Although occupancy expense is generally related to fluctuations in overall customer demand, our contracting and pricing strategies help mitigate the cost impact of changing production volumes. To minimize potential exposure to inactive or underutilized facilities that are dedicated to a single customer, we strive where possible to enter into lease agreements that are coterminous with individual customer contracts, and we seek contract pricing terms that recover fixed occupancy costs, regardless of production volume. Occupancy expense may also include certain lease termination and related occupancy costs that are accelerated for accounting purposes into the fiscal year in which such a decision was implemented.
24
General and administrative expense. General and administrative expense includes the salaries, wages and benefits of administrative personnel, related support costs, taxes (other than income and property taxes), adjustments due to foreign currency transactions, bad debt expense, and other general expenses, including gains or losses on the sale or disposal of assets. These expenses are generally not directly related to levels of operating activity and may contain non-recurring or one-time expenses related to general business operations. We recognize general and administrative expense when it is incurred.
Insurance and claims. Insurance and claims expense represents our insurance premiums and the accruals we make for claims within our self-insured retention amounts. Our insurance premiums are generally calculated based on a mixture of a percentage of line-haul revenue and the size of our fleet. Our accruals have primarily related to cargo and property damage claims. We may also make accruals for personal injuries and property damage to third parties, physical damage to our equipment, general liability and workers' compensation claims if we experience a claim in excess of our insurance coverage. To reduce our exposure to non-trucking use liability claims (claims incurred while the vehicle is being operated without a trailer attached or is being operated with an attached trailer which does not contain or carry any cargo), we require our owner-operators to maintain non-trucking use liability coverage, which the industry refers to as deadhead bobtail coverage, of $2.0 million per occurrence. Our exposure to liability associated with accidents incurred by other third party providers who haul freight on our behalf is reduced by various factors including the extent to which they maintain their own insurance coverage. Our insurance expense varies primarily based upon the frequency and severity of our accident experience, insurance rates, our coverage limits and our self-insured retention amounts.
Depreciation and amortization. Depreciation and amortization expense relates primarily to the depreciation of owned tractors, trailers, computer and operating equipment, and buildings as well as the amortization of the intangible assets recorded for our acquired customer contracts and customer and agent relationships. We estimate the salvage value and useful lives of depreciable assets based on current market conditions and experience with past dispositions.
Operating Revenues
We broadly group our services into the following categories: truckload services, brokerage services, intermodal services, dedicated services and value-added services. Our truckload, brokerage and intermodal services associated with individual freight shipments coordinated by our agents and company-managed terminals are generally aggregated into our reportable transportation segment, while our dedicated and value-added services to specific customers on a contractual basis make up our logistics segment. The following table sets forth operating revenues resulting from each of these service categories for the years ended December 31, 2017, 2016 and 2015, presented as a percentage of total operating revenues:
|
|
|
Years ended December 31, |
|
|||||||||
|
|
|
2017 |
|
|
2016 |
|
|
2015 |
|
|||
|
Operating revenues: |
|
|
|
|
|
|
|
|
|
|
|
|
|
Truckload services |
|
|
24.9 |
% |
|
|
26.2 |
% |
|
|
31.7 |
% |
|
Brokerage services |
|
|
22.9 |
% |
|
|
20.5 |
% |
|
|
18.0 |
% |
|
Intermodal services |
|
|
12.6 |
% |
|
|
13.3 |
% |
|
|
13.2 |
% |
|
Dedicated services |
|
|
7.7 |
% |
|
|
8.9 |
% |
|
|
8.4 |
% |
|
Value-added services |
|
|
31.9 |
% |
|
|
31.1 |
% |
|
|
28.7 |
% |
|
Total operating revenues |
|
|
100.0 |
% |
|
|
100.0 |
% |
|
|
100.0 |
% |
25
The following table sets forth items derived from our Consolidated Statements of Income for the years ended December 31, 2017, 2016 and 2015, presented as a percentage of operating revenues:
|
|
|
Years ended December 31, |
|
|||||||||
|
|
|
2017 |
|
|
2016 |
|
|
2015 |
|
|||
|
Operating revenues |
|
|
100.0 |
% |
|
|
100.0 |
% |
|
|
100.0 |
% |
|
Operating expenses: |
|
|
|
|
|
|
|
|
|
|
|
|
|
Purchased transportation and equipment rent |
|
|
47.5 |
|
|
|
47.5 |
|
|
|
50.3 |
|
|
Direct personnel and related benefits |
|
|
25.8 |
|
|
|
24.7 |
|
|
|
19.7 |
|
|
Operating supplies and expenses |
|
|
9.5 |
|
|
|
9.6 |
|
|
|
10.1 |
|
|
Commission expense |
|
|
2.7 |
|
|
|
3.0 |
|
|
|
3.4 |
|
|
Occupancy expense |
|
|
2.5 |
|
|
|
3.0 |
|
|
|
2.4 |
|
|
General and administrative |
|
|
2.6 |
|
|
|
2.7 |
|
|
|
2.7 |
|
|
Insurance and claims |
|
|
3.4 |
|
|
|
1.7 |
|
|
|
1.9 |
|
|
Depreciation and amortization |
|
|
3.9 |
|
|
|
3.4 |
|
|
|
3.1 |
|
|
Total operating expenses |
|
|
97.9 |
|
|
|
95.7 |
|
|
|
93.5 |
|
|
Income from operations |
|
|
2.1 |
|
|
|
4.3 |
|
|
|
6.5 |
|
|
Interest and other non-operating income (expense), net |
|
|
(0.7 |
) |
|
|
(0.6 |
) |
|
|
(0.7 |
) |
|
Income before for income taxes |
|
|
1.4 |
|
|
|
3.7 |
|
|
|
5.8 |
|
|
Income tax (benefit) expense |
|
|
(0.9 |
) |
|
|
1.4 |
|
|
|
2.3 |
|
|
Net income |
|
|
2.3 |
% |
|
|
2.3 |
% |
|
|
3.5 |
% |
2017 Compared to 2016
Operating revenues. Operating revenues for 2017 increased $143.9 million, or 13.4%, to $1.216 billion from $1.073 billion during the same period last year. Included in operating revenues are separately-identified fuel surcharges of $59.5 million for 2017 compared to $50.9 million for 2016. Revenues from our transportation segment increased $93.8 million, or 14.3%, while income from operations decreased $7.9 million. The decrease in income was primarily attributable to $17.4 million of accruals made for on-going legal matters. In our logistics segment, revenues increased $50.1 million, or 12.1% over the same period last year, while income from operations decreased $17.1 million. Operating income in our logistics segment was negatively impacted by certain large underperforming value-added operations, including a program we ultimately exited in Mexico. Overall, consolidated operating revenues increased due to several factors including significant operations in support of passenger vehicle and heavy-truck programs, a strong pricing environment across our transportation services and an increase in fuel surcharges. However, consolidated income from operations decreased by $21.4 million to $25.2 million for 2017 compared to $46.6 million during the same period last year. The decrease is primarily attributable to lower operating margins, extended launch costs at key value-added operations, operating losses in our Mexican value-added operations, and $17.4 million of charges associated with on-going litigation in our transportation business.
Operating revenues from truckload services increased $21.7 million to $302.9 million during 2017, compared to $281.2 million for the same period last year. Included in truckload revenues during 2017 were $28.4 million in separately-identified fuel surcharges compared to $23.0 million during the same period last year. During the year, Universal’s average operating revenue per load, excluding fuel surcharges, increased 9.4% to $874, primarily due to an increase in revenue per mile. These increases were partially offset by a 1.1% decrease in the number of loads hauled. During 2017, Universal hauled 314,530 loads compared to 318,185 during the same period last year.
Revenues during 2017 from brokerage services increased $58.3 million, or 26.5%, to $278.2 million compared to $219.9 million during the same period last year. The growth is due to increases in the average operating revenue per load and in the number of loads hauled, driven in part by our support of hurricane relief efforts. During 2017, Universal brokered $8.3 million in loads for the Federal Emergency Management Agency. Overall, Universal’s average operating revenue per load from brokerage services during 2017 increased 13.8% to $1,420, up from $1,248 in 2016. The number of brokerage loads hauled during 2017 increased 15.2% to 185,892 compared to 161,297 during the same period last year.
Intermodal services revenues increased $10.7 million to $153.7 million during 2017, up from $143.0 million during the same period last year. The increase reflects a $2.2 million increase in fuel surcharges and an increase in the number of loads hauled. Compared to the same period last year, the number of intermodal loads hauled during 2017 increased by 3.7%.
26
Operating revenues from dedicated services in 2017 declined $1.8 million to $93.5 million compared to $95.3 million in the prior year. The decrease is primarily due to a 7.9% decrease in the number of loads hauled and a decrease in fuel surcharges. Included in dedicated revenues in 2017 were $12.9 million in separately-identified fuel surcharges compared to $11.9 million during the same period last year. The overall decrease in dedicated services revenue was partially offset by a 2.6% increase in average operating revenue per load, excluding fuel surcharges.
Value-added services revenues increased $55.0 million to $388.3 million during 2017 compared to $333.3 million in the same period last year. Our continued support of major customer vehicle programs, as well as improvements in our heavy-truck operations positively impacted top-line revenues in Universal’s value-added service category. Overall, valued-added services grew by 16.5% compared to the same period last year.
Purchased transportation and equipment rent. Purchased transportation and equipment rental costs for 2017 increased by $67.7 million, or 13.3%, to $577.5 million from $509.8 million during the same period last year. Purchased transportation and equipment rent generally increases or decreases in proportion to the revenues generated through owner-operators and other third party providers, and is generally correlated with changes in demand for transportation-related services, which includes truckload, brokerage, intermodal and dedicated services. The absolute increase in purchased transportation and equipment rental costs was primarily the result of an increase in transportation-related service revenues. As a percentage of operating revenues, purchased transportation and equipment rent expense remained consistent at 47.5% for both years.
Direct personnel and related benefits. Direct personnel and related benefits for 2017 increased by $49.1 million, or 18.5%, to $314.4 million compared to $265.3 million during the same period last year. Trends in these expenses are generally correlated with changes in operating facilities and headcount requirements and, therefore, increase and decrease with the level of demand for our value-added services and staffing needs of our operations. As a percentage of operating revenues, personnel and related benefits increased to 25.8% for 2017, compared to 24.7% for 2016. The percentage is derived on an aggregate basis from both existing and new programs, and from customer operations at various stages in their lifecycles. Individual operations may be impacted by additional production shifts or by overtime at selected operations. While generalizations about the impact of personnel and related benefits costs as a percentage of total revenue are difficult, we manage compensation and staffing levels, including the use of contract labor, to maintain target economics based on near-term projections of demand for our services.
Operating supplies and expenses. Operating supplies and expenses increased by $12.4 million, or 12.0%, to $115.4 million for 2017 compared to $103.0 million for 2016. These expenses include items such as fuel, maintenance, cost of materials, communications, utilities and other operating expenses, and generally relate to fluctuations in customer demand. The increase in operating supplies and expenses was primarily the result of increases in travel and meals cost of $4.6 million, largely associated with our Mexican value-added operations, as well as extended launch costs. Included in the overall increase is also a $2.9 million increase in material costs in operations supporting heavy-truck. Additional elements of the increase are increases in vehicle maintenance of $2.2 million, fuel expense on company equipment of $1.0 million and utilities of $0.4 million.
Commission expense. Commission expense for 2017 increased by $0.8 million, or 2.5%, to $33.2 million from $32.4 million for 2016. Commission expense generally increases or decreases in proportion to our transportation-related services, except in cases where we generate a higher proportion of our revenues at company-managed terminals where no commissions are paid. As a percentage of operating revenues, commission expense decreased to 2.7% for 2017, compared to 3.0% one year earlier. During 2017, a higher proportion of transportation revenues were generated at company-managed terminals.
Occupancy expense. Occupancy expenses decreased by $1.3 million, or 4.1%, to $30.6 million for 2017. This compares to $31.9 million for 2016. Occupancy expense remained relatively stable, while we experienced a modest decrease in building rents and property taxes.
General and administrative. General and administrative expense for 2017 increased by $2.1 million, or 7.1%, to $31.5 million from $29.4 million during the same period last year. As a percentage of operating revenues, general and administrative expense was 2.6% for 2017 compared to 2.7% for 2016. Included in the overall increase was a $1.8 million charge for on-going legal matters.
Insurance and claims. Insurance and claims expense for 2017 increased by $24.2 million to $41.9 million from $17.7 million in 2016. Included in the increase was a $15.6 million charge for an on-going legal matter. In addition, we experienced a $7.7 million increase in cargo, scrap and service claims expense primarily related to our value-added operations, of which $5.0 million was in our Mexico operations. As a percentage of operating revenues, insurance and claims increased to 3.4% for 2017 compared to 1.7% for 2016.
Depreciation and amortization. Depreciation and amortization expense for 2017 increased by $10.3 million, or 28.1%, to $47.0 million from $36.7 million for 2016. The increase was primarily due to elevated levels of capital expenditures in recent years. The increase in depreciation expense was partially offset by reductions in amortization expense as certain intangible assets became fully amortized.
27
Interest expense, net. Net interest expense was $9.4 million for 2017 compared to $8.1 million for 2016. The increase of net interest expense reflects an increase in interest rates on our variable rate debt. As of December 31, 2017, our outstanding borrowings totaled $249.2 million compared to $262.8 million at the same time last year.
Other non-operating income. Other non-operating income was $1.4 million for 2017 compared to $0.9 million for 2016. Included in other non-operating income during 2017 were $0.9 million of gains on the sale of marketable securities compared to $0.4 million during the same period last year.
Income tax (benefit) expense. The provision for income taxes resulted in a $11.0 million tax benefit in 2017, compared to income tax expense of $15.2 million for 2016, based on an effective tax rate of (64.2%) and 38.5%, respectively. The decrease in income taxes in 2017 is the result of a $18.2 million income tax benefit representing management’s estimate of the net impact of the Tax Cuts and Jobs Act enacted during the fourth quarter of 2017.
2016 Compared to 2015
Operating revenues. Operating revenues for 2016 decreased by $56.0 million, or 5.0%, to $1.073 billion from $1.129 billion for 2015. Included in operating revenues are fuel surcharges, where separately identifiable, of $50.9 million for 2016, which compares to $75.7 million for 2015. Revenues from our transportation segment decreased $64.9 million, or 9.0%, and income from operations decreased $6.3 million, or 21.9%, compared to 2015. The transportation segment experienced a decrease primarily due to decreases in fuel surcharges and weakness in our energy and domestic steel markets, both of which adversely impacted our flatbed operations. Revenues from our logistics segment increased $8.1 million, or 2.0%, over 2015, while income from operations decreased $16.2 million, or 36.9%, to $27.7 million. This decrease was largely attributable to a $13.8 million year-over-year decline in operating income attributable to value-added operations supporting the heavy-truck market, which are included in our logistics segment. Overall, consolidated operating revenues decreased due to several factors including weakness in our energy and domestic steel markets, a weak pricing environment across our transportation services, and a decrease in fuel surcharges. Consolidated income from operations decreased by $26.8 million to $46.6 million for 2016 compared to $73.4 million for the year prior. The decrease is primarily attributable to lower operating margins resulting from of a weak pricing environment in transportation services, higher than expected launch costs at new value-added operations, and a slow-down in our operations supporting the heavy-truck market.
Operating revenues from truckload services decreased $76.6 million to $281.2 million during 2016, compared to $357.8 million for the prior year. Included in truckload revenues during 2016 were $23.0 million in separately-identified fuel surcharges compared to $37.9 million during the same period last year. During 2016, Universal’s average operating revenue per load, excluding fuel surcharges, decreased 16.7% to $799, primarily due to a weak pricing environment. The number of loads hauled decreased 4.6% in 2016. Universal hauled 318,185 loads during 2016 compared to 333,647 during the prior year.
Revenues during 2016 from brokerage services increased $17.3 million, or 8.5%, to $219.9 million compared to $202.6 million during the prior year. The growth is due to an increase in the number of loads hauled. The number of brokerage loads hauled during 2016 increased 24.4% to 161,297 compared to 129,664 during the prior year. Partially offsetting the increase is a decrease in the average operating revenue per load. Universal’s average operating revenue per load from brokerage services decreased 9.7% to $1,248 during 2016, down from $1,382 during 2015.
Intermodal services revenues decreased $6.4 million to $143.0 million during 2016, down from $149.4 million during the prior year. The decrease reflects a $7.0 million decrease in fuel surcharges. Partially offsetting the decrease in fuel surcharges is an increase in the number of loads hauled to 334,622 in 2016 compared to 330,334 during the prior year.
Operating revenues from dedicated services in 2016 increased $0.3 million to $95.3 million compared to $95.0 million one year earlier. The increase is primarily due to a 15.0% increase the number of loads hauled; however, a decrease in fuel surcharges partially offset this increase. Included in dedicated revenues in 2016 were $11.9 million in separately-identified fuel surcharges compared to $14.6 million during the prior year.
Value-added services revenues increased $9.3 million to $333.3 million during 2016 compared to $324.0 million in the prior year. Our continued support of major customer vehicle programs contributed to the increase in valued-added service revenues, despite a $30.9 million decrease in revenues supporting the heavy-truck market. Overall, valued-added services grew by 2.9% compared to the prior year.
28
Purchased transportation and equipment rent. Purchased transportation and equipment rental costs for 2016 decreased by $57.8 million, or 10.2%, to $509.8 million from $567.6 million for 2015. Purchased transportation and equipment rent generally increases or decreases in proportion to the revenues generated through owner-operators and other third party providers, and is generally correlated with changes in demand for transportation and intermodal services. The overall decrease of purchased transportation and equipment rental costs is due to the decline of transportation and intermodal revenue volumes and in fuel surcharge revenues, which are typically passed on to our owner-operators. Combined, transportation and intermodal service revenues decreased 8.7% to $770.5 million for 2016 compared to $843.5 million for 2015. As a percentage of operating revenues, purchased transportation and equipment rent decreased to 47.5% for 2016 from 50.3% for 2015. As a percentage of operating revenue, the decrease is due to a change in the business mix. For 2016, transportation and intermodal services revenues accounted for 71.8% of total operating revenues compared to 74.7% for prior year.
Direct personnel and related benefits. Direct personnel and related benefit costs for 2016 increased by $42.8 million, or 19.2%, to $265.3 million compared to $222.5 million for 2015. Trends in these expenses are generally correlated with changes in operating facilities and headcount requirements and, therefore, increase and decrease with the level of demand for our value-added services and staffing needs of our operations. The absolute increase is primarily attributable to additional labor costs as we launch new value-added business awards. As a percentage of operating revenues, personnel and related benefits expenses increased to 24.7% for 2016, compared to 19.7% for 2015. The percentage is derived on an aggregate basis from both existing and new programs and from customer operations at various stages in their lifecycles. Individual operations may be impacted by additional production shifts or by overtime at selected operations. While generalizations about the impact of personnel and related benefits costs as a percentage of total operating revenues are difficult, we manage compensation and staffing levels, including the use of contract labor, to maintain target economics based on near-term projections of demand for our services. We employed an average of 5,573 people in the United States, Mexico, Canada and Colombia in 2016 compared to 4,397 during 2015. We also engaged, on average, the full-time equivalency of 2,172 people on a contract basis compared to 1,606 in 2015.
Operating supplies and expenses. Operating supplies and expenses decreased $10.5 million, or 9.3%, to $103.0 million for 2016, compared to $113.5 million for 2015. As a percentage of operating revenues, operating expenses decreased to 9.6% for 2016 from 10.1% for 2015. These expenses include items such as fuel, maintenance, cost of materials, communications, utilities and other general expenses, and generally relate to fluctuations in customer demand. The decrease in operating expenses was primarily due to decreases in fuel expense on company-owned equipment of $4.8 million, repair and maintenance costs of $4.5 million, other operating expenses of $2.9 million, and highway use and fuel taxes of $1.0 million.
Commission expense. Commission expense for 2016 decreased by $5.4 million, or 14.3%, to $32.4 million from $37.8 million for 2015. The absolute decrease was primarily due to the decrease in our operating revenues from transportation services. Commission expense generally increases or decreases in proportion to our transportation and intermodal revenues, excluding where we generate a higher proportion of our revenues at company-managed terminals. As a percentage of operating revenues, commission expense decreased to 3.0% for 2016 compared to 3.4% for 2015. As a percentage of operating revenues, the decrease in commission expense is due to a shift in the mix of revenues generated by company-managed locations and in value-added services where no commissions are paid.
Occupancy expenses. Occupancy expenses for 2016 increased by $4.9 million, or 18.1%, to $31.9 million from $27.0 million for 2015. As a percentage of operating revenues, occupancy expense increased to 3.0% for 2016 compared to 2.4% for 2015. At December 31, 2016, we leased 29 value-added service locations compared to 32 at December 31, 2015. While the number of leased facilities declined, the absolute increase in occupancy expense is due to the increased scale of several operations in order to support the expanded scope of customer programs.
General and administrative. General and administrative expense for 2016 decreased by $1.3 million, or 4.2%, to $29.4 million from $30.7 million for 2015. As a percentage of operating revenues, general and administrative expense remained consistent at 2.7% for each 2016 and 2015. The absolute decrease is primarily the result of a decreases in our professional fees expense of $1.7 million. Minor fluctuations in other expense categories reflect our efforts to maintain stable overhead expenditures while expanding the business.
Insurance and claims. Insurance and claims expense for 2016 decreased by $3.7 million, or 17.3%, to $17.7 million from $21.4 million for 2015. As a percentage of operating revenues, insurance and claims decreased to 1.7% for 2016 compared to 1.9% for 2015. The absolute decrease was primarily the result of decreases in our auto liability insurance premiums and claims expense of $2.9 million and in our cargo and service claims expense of $0.8 million.
Depreciation and amortization. Depreciation and amortization expense for 2016 increased by $1.8 million, or 5.2%, to $36.7 million from $34.9 million for 2015. The absolute increase is primarily the result of increases in capital investments throughout 2016 compared to historical trends. These increases were partially offset by decreases in certain other intangible assets becoming fully amortized during the year.
29
Interest expense, net. Net interest expense was $8.1 million for 2016 compared to $9.2 million for 2015. Included in the prior year were $1.3 million of capitalized finance costs that were written-off resulting from our December 2015 debt refinancing. At December 31, 2016, we had outstanding borrowings totaling $262.8 million compared to $234.9 million outstanding at December 31, 2015.
Other non-operating income. Other non-operating income was $0.9 million for 2016 compared to $0.8 million for 2015. Included in other non-operating income were $0.4 million of gains on the sale of marketable securities for 2016 compared to $0.3 million for 2015.
Income tax (benefit) expense. Income tax expense for 2016 was $15.2 million compared to $25.0 million for 2015, based on an effective tax rate of 38.5% in each of the periods.
Liquidity and Capital Resources
Our primary sources of liquidity are funds generated by operations, loans and extensions of credit under our credit facilities, on margin against our marketable securities and from installment notes, and proceeds from the sales of marketable securities. We use secured, asset lending to fund a substantial portion of purchases of tractors, trailers and material handling equipment.
We employ an asset-light operating strategy which we believe lowers our capital expenditure requirements. In general, our facilities used in our value-added services are leased on terms that are either substantially matched to our customer’s contracts, are month-to-month or are provided to us by our customers. We also utilize owner-operators and third-party carriers to provide a significant portion of our transportation and specialized services. A significant portion of the tractors and trailers used in our business are provided by our owner-operators. In addition, our use of agents reduces our overall need for large terminals. As a result, our capital expenditure requirements are limited in comparison to most large transportation and logistics service providers, which maintain significant properties and sizable fleets of owned tractors and trailers.
In 2017, our capital expenditures totaled $63.3 million. These expenditures primarily consisted of transportation equipment and investments in support of our value-added service operations. Our asset-light business model depends somewhat on the customized solutions we implement for specific customers. As a result, our capital expenditures will depend on specific new contracts and the overall age and condition of our owned transportation equipment. In 2018, exclusive of acquisitions of businesses, we expect our capital expenditures to be in the range of 4% to 5% of operating revenues. We expect to make these capital expenditures for the acquisition of transportation equipment, to support our new and existing value-added service operations, and for the acquisition of real property and improvements to our existing terminal yard and container facilities.
Pursuant to its existing cash dividend policy, our Board of Directors declared a quarterly cash dividend of $0.07 per share of common stock, payable to shareholders of record at the close of business on March 5, 2018 and paid on March 15, 2018. During the year ended December 31, 2017, we paid a total of $0.28 per common share, or $8.0 million.
On February 21, 2018, our Board of Directors approved an increase in the Company’s annual cash dividend policy from $0.28 per share to $0.42 per share beginning in 2018. The first quarterly installment of $0.105 per share is expected to be declared after the conclusion of the first quarter of 2018. After taking into account the regular quarterly dividends made during the year, the Board of Directors also intends to evaluate the potential declaration of an annual special dividend payable in the first quarter of each year in an effort to return up to 40% of Universal’s net income from the previous fiscal year, beginning in the first quarter of 2019. Future dividend policy and the payment of dividends, if any, will be determined by the Board of Directors in light of circumstances then existing, including our earnings, financial condition and other factors deemed relevant by the Board of Directors.
We expect that our cash flow from operations, working capital and available borrowings will be sufficient to meet our capital commitments, to fund our operational needs for at least the next twelve months, and to fund mandatory debt repayments. Based on the availability of borrowings under our credit facilities, against our marketable security portfolio and other financing sources, and assuming the continuation of our current level of profitability, we do not expect that we will experience any liquidity constraints in the foreseeable future.
We continue to evaluate business development opportunities, including potential acquisitions that fit our strategic plans. There can be no assurance that we will identify any opportunities that fit our strategic plans or will be able to execute any such opportunities on terms acceptable to us. Depending on prospective consideration to be paid for an acquisition, any such opportunities would be financed first from available cash and cash equivalents and availability of borrowings under our credit facilities.
30
Revolving Credit, Promissory Notes and Term Loan Agreements
Our asset-based loan facility (“ABL Facility”) provides for maximum borrowings of $120 million at a variable rate of interest based on LIBOR or a base rate and matures on December 23, 2020. The ABL Facility, which is secured by cash, deposits and accounts receivable of our borrowing subsidiaries, includes customary affirmative and negative covenants and events of default, as well as financial covenants requiring a minimum fixed charge coverage ratio to be maintained after a triggering event. Interest on base rate advances is payable quarterly, and interest on each LIBOR-based advance is payable on the last day of the applicable interest period. Our ABL Facility includes an accordion feature which allows us to increase availability by up to $30 million upon our request. At December 31, 2017, we were in compliance with all covenants under the ABL Facility, and $32.0 million was available for borrowing.
One of our wholly-owned subsidiaries, Westport Axle Corporation, has a secured credit facility (the “Westport Facility”) that allows maximum borrowings of $60 million in the form of a $40 million term loan and a $20 million revolver. Borrowings under the Westport Facility, which matures on December 23, 2020, accrue interest at a variable interest rate based on LIBOR or a base rate and are secured by all of Westport’s assets. Universal becomes a guarantor upon the occurrence of certain events specified in the Westport Facility. Borrowings are repaid in part quarterly with the balance due at maturity. Interest on base rate advances is payable quarterly, and interest on each LIBOR-based advance is payable on the last day of the applicable interest period. The Westport Facility includes customary affirmative and negative covenants and events of default. At December 31, 2017, we were in compliance with all covenants, and $10.5 million was available for borrowing.
A wholly-owned subsidiary issued a series of promissory notes in order to finance transportation equipment (the “Equipment Financing”). The notes issued in connection with the Equipment Financing, which are secured by liens on selected titled vehicles, include certain affirmative and negative covenants, are generally payable in 60 monthly installments and bear interest at fixed rates ranging from 3.18% to 4.22%. At December 31, 2017, we were in compliance with all covenants.
A wholly-owned subsidiary issued a series of promissory notes in order to finance certain purchases of real property (the “Real Estate Financing”). The promissory notes, which are secured by first mortgages and assignment of leases on specific parcels of real estate and improvements, include certain affirmative and negative covenants and are generally payable in 120 monthly installments. Each of the notes bears interest at LIBOR plus 2.25%. At December 31, 2017, we were in compliance with all covenants.
We also maintain a short-term line of credit secured by our portfolio of marketable securities (the “Margin Facility”). It bears interest at LIBOR plus 1.10%. The amount available under the Margin Facility is based on a percentage of the market value of the underlying securities. We did not have any amounts outstanding under the Margin Facility at December 31, 2017 or 2016, and the maximum available borrowings were $8.9 million and $7.0 million, respectively.
Discussion of Cash Flows
At December 31, 2017, we had cash and cash equivalents of $1.7 million compared to $1.8 million at December 31, 2016. Net cash provided by operating activities was $83.8 million, while we used $61.3 million in investing activities and $23.2 million in financing activities.
The $83.8 million in net cash provided by operations was primarily attributed to $28.2 million of net income which reflects non-cash depreciation and amortization, gains on the sales of marketable securities, amortization of debt issuance costs, stock-based compensation, provisions for doubtful accounts and a change in deferred income taxes totaling $29.3 million, net. Net cash provided by operating activities also reflects an aggregate decrease in net working capital totaling $26.4 million. The decrease in the working capital position is primarily the result of an increase in accounts payable, accrued expenses, insurance and claims accruals and other current liabilities and a decrease in prepaid income taxes and prepaid expenses and other assets. These decreases were partially offset by an increase in accounts receivable. Also included in the change in working capital were affiliate transactions consisting of an increase in receivable from affiliates of $0.2 million and an increase in accounts payable to affiliates of $7.4 million.
The $61.3 million in net cash used in investing activities consisted primarily of $63.4 million of capital expenditures for transportation and material handling equipment, real estate and leasehold improvements, and investments in support of our value-added service operations. We also made purchases of marketable securities totaling $0.4 million. These expenditures were partially offset by $1.2 million in proceeds from the sale of property and equipment and $1.3 million in proceeds from the sale of marketable securities.
We used $23.2 million in net cash in financing activities. We had outstanding borrowings totaling $249.2 million at December 31, 2017, compared to $262.8 million at December 31, 2016. During 2017, cash borrowings totaled $355.5 million and we made $369.1 million in principal repayments, including $31.5 million on new equipment notes. We also paid cash dividends of $8.0 million and made $1.5 million of common stock repurchases.
31
The following summarizes our contractual obligations at December 31, 2017, and the effect such obligations are expected to have on our liquidity and cash flow in future periods (in thousands):
|
|
|
|
|
|
|
Payments due by period |
|
|||||||||||||
|
|
|
Total |
|
|
Less Than 1 Year |
|
|
1 – 3 Years |
|
|
3 – 5 Years |
|
|
More Than 5 Years |
|
|||||
|
Long-term debt |
|
|
249,239 |
|
|
|
41,205 |
|
|
|
160,683 |
|
|
|
28,762 |
|
|
|
18,589 |
|
|
Interest on debt (1) |
|
|
29,463 |
|
|
|
8,302 |
|
|
|
12,413 |
|
|
|
3,547 |
|
|
|
5,201 |
|
|
Capital lease obligations |
|
|
92 |
|
|
|
92 |
|
|
|
— |
|
|
|
— |
|
|
|
— |
|
|
Operating lease obligations (2) |
|
|
71,847 |
|
|
|
22,908 |
|
|
|
28,214 |
|
|
|
9,910 |
|
|
|
10,815 |
|
|
Purchase obligations |
|
|
5,127 |
|
|
|
5,127 |
|
|
|
— |
|
|
|
— |
|
|
|
— |
|
|
Total |
|
$ |
355,768 |
|
|
$ |
77,634 |
|
|
$ |
201,310 |
|
|
$ |
42,219 |
|
|
$ |
34,605 |
|
|
(1) |
Interest payments on debt include fixed rate interest and variable rate interest based on the debt balance and applicable rate at December 31, 2017. Total interest reported includes $8.1 million of fixed rate interest and $21.4 million of variable rate interest. |
|
(2) |
Certain operating lease obligations in a currency other than the U.S. dollar will be affected by the exchange rate in effect at the time each cash payment is made. |
At December 31, 2017, the total amount of gross unrecognized tax benefits was $0.4 million. This amount is not included in the above table as the Company cannot reasonably estimate the timing of cash settlements, if any, with taxing authorities. At December 31, 2017, the Company has insurance and claims liabilities of $37.7 million, of which $10.1 million are covered by insurance. This amount is not included in the above table as the Company cannot reasonably estimate the timing of cash settlements on these liabilities.
Off-Balance Sheet Arrangements
None.
Legal Matters
We are subject to various legal proceedings and other contingencies, the outcomes of which are subject to significant uncertainty. We accrue for estimated losses if it is probable that an asset has been impaired or a liability has been incurred and the amount of the loss can be reasonably estimated. We use judgment and evaluate, with the assistance of legal counsel, whether a loss contingency arising from litigation should be disclosed or recorded. The outcome of legal proceedings is inherently uncertain and so typically a loss cannot be precisely estimated. Accordingly, if the outcome of legal proceedings is different than is anticipated by us, we would have to record the matter at the actual amount at which it was resolved, in the period resolved, impacting our results of operations and financial position for the period. See Item 8, Note 13 to the Consolidated Financial Statements.
Critical Accounting Policies
Our financial statements have been prepared in accordance with U.S. generally accepted accounting principles. The preparation of these financial statements requires us to make estimates and judgments that affect the reported amounts of assets, liabilities, operating revenues and operating expenses.
Critical accounting policies are those that are both (1) important to the portrayal of our financial condition and results of operations and (2) require management's most difficult, subjective or complex judgments, often as a result of the need to make estimates about the effect of matters that are inherently uncertain. As the number of variables and assumptions affecting the possible future resolution of the uncertainties increase, those judgments become even more subjective and complex. In order to provide an understanding about how our management forms its judgments about future events, including the variables and assumptions underlying the estimates, and the sensitivity of those judgments to different circumstances, we have identified our critical accounting policies below.
32
We recognize revenue at the time (1) persuasive evidence of an arrangement with our customer exists, (2) services have been rendered, (3) sales price is fixed and determinable, and (4) collectability is reasonably assured. For transportation services, we recognize revenue at the time of delivery to the receiver’s location. For service arrangements in general, we recognize revenue after the related services have been rendered. Our customer contracts could involve multiple revenue-generating activities performed for the same customer. When several contracts are entered into with the same customer in a short period of time, we evaluate whether these contracts should be considered as a single, multiple element contract for revenue recognition purposes. Criteria we consider that may result in the aggregation of contracts include whether such contracts are actually entered into within a short period of time, whether services in multiple contracts are interrelated, or if the negotiation and terms of one contract show or include consideration for another contract or contracts. Our current contracts have not been required to be aggregated, as they are negotiated independently on a standalone basis. Our customers typically choose their vendor and award business at the conclusion of a competitive bidding process for each service. As a result, although we evaluate customer purchase orders and agreements for multiple elements and aggregation of individual contracts into a multiple element arrangement, our current contracts do not meet the criteria required for multiple element contract accounting.
We are the primary obligor when rendering transportation, value-added and intermodal services and assume the corresponding credit risk with customers. We have discretion in setting sales prices and, as a result, our earnings may vary. In addition, we have discretion to choose and negotiate terms with our multiple suppliers for the services ordered by our customers. This includes owner-operators with whom we contract to deliver our transportation services.
Allowance for Uncollectible Receivables
The allowance for potentially uncollectible receivables is based on a combination of historical data, cash payment trends, specific customer issues, write-off trends, general economic conditions and other factors. Management continuously monitors these factors to arrive at the estimate of accounts receivable that may be ultimately uncollectible. The receivables analyzed include trade receivables, as well as loans and advances made to owner-operators. All other balances are reviewed on a pooled basis. This analysis requires us to make significant estimates. Changes in the facts and circumstances that these estimates are based upon and changes in the general economic environment could result in a material change to the allowance for uncollectible receivables. These changes include, but are not limited to, deterioration of customers' financial position, changes in our relationships with our customers, agents and owner-operators and unforeseen issues relating to individual receivables.
Insurance and Claim Costs
We maintain auto liability, workers compensation and general liability insurance with licensed insurance carriers. We are self-insured for all cargo and equipment damage claims. Insurance and claims expense represents premiums paid by us and the accruals made for claims within our self-insured retention amounts. A liability is recognized for the estimated cost of all self-insured claims including an estimate of incurred but not reported claims based on historical experience and for claims expected to exceed our policy limits. In addition, legal expenses related to auto liability claims are covered under our policy. We are responsible for all other legal expenses related to claims.
We establish reserves for anticipated losses and expenses related to cargo and equipment damage claims and auto liability claims. The reserves consist of specific reserves for all known claims and an estimate for claims incurred but not reported, and losses arising from known claims ultimately settling in excess of insurance coverage using loss development factors based upon industry data and past experience. In determining the reserves, we specifically review all known claims and record a liability based upon our best estimate of the amount to be paid. In making our estimate, we consider the amount and validity of the claim, as well as our past experience with similar claims. In establishing the reserve for claims incurred but not reported, we consider our past claims history, including the length of time it takes for claims to be reported to us. Based on our past experience, the time between when a claim occurs and when it is reported to us is short. As a result, we believe that the number of incurred but not reported claims at any given point in time is small. These reserves are periodically reviewed and adjusted to reflect our experience and updated information relating to specific claims. As of December 31, 2017, we did not have any reserves for workers' compensation or general liability claims. If we experience claims that are not covered by our insurance or that exceed our estimated claim reserve, it could increase the volatility of our earnings and have a materially adverse effect on our financial condition, results of operations or cash flows.
33
Valuation of Long-Lived Asset, including Goodwill and Intangible Assets
We are required to test goodwill for impairment annually or more frequently, whenever events occur or circumstances change that would more likely than not reduce the fair value of a reporting unit with goodwill below its carrying amount. We annually test goodwill impairment during the third quarter. Goodwill represents the excess purchase price over the fair value of assets acquired in connection with our acquisitions. We continually assess whether any indicators of impairment exist, which requires a significant amount of judgment. Such indicators may include a sustained significant decline in our share price and market capitalization; a decline in our expected future cash flows; a significant adverse change in legal factors or in the business climate; unanticipated competition; overall weaknesses in our industry; and slower growth rates. Adverse changes in these factors could have a significant impact on the recoverability of goodwill and could have a material impact on our consolidated financial statements. The Company has the option to first assess qualitative factors such as current performance and overall economic conditions to determine whether or not it is necessary to perform a quantitative goodwill impairment test. If we choose that option, then we would not be required to perform a quantitative goodwill impairment test unless we determine that, based on a qualitative assessment, it is more likely than not that the fair value of a reporting unit is less than its carrying value. If we determine that it is more likely than not, or if we choose not to perform a qualitative assessment, we then proceed with the quantitative assessment. Under the quantitative test, if the fair value of a reporting unit exceeds its carrying amount, then goodwill of the reporting unit is considered to not be impaired. If the carrying amount of the reporting unit exceeds its fair value, then an impairment loss is recognized in an amount equal to the excess, up to the value of the goodwill. During the third quarter of 2017, we completed our goodwill impairment testing by performing a quantitative assessment. Based on the results of this test, no impairment loss was recognized.
We evaluate the carrying value of long-lived assets, other than goodwill, for impairment by analyzing the operating performance and anticipated future cash flows for those assets, whenever events or changes in circumstances indicate that the carrying amounts of such assets may not be recoverable. We evaluate the need to adjust the carrying value of the underlying assets if the sum of the expected cash flows is less than the carrying value. Our projection of future cash flows, the level of actual cash flows, the methods of estimation used for determining fair values and salvage values can impact impairment. Any changes in management's judgments could result in greater or lesser annual depreciation and amortization expense or impairment charges in the future. Depreciation and amortization of long-lived assets is calculated using the straight-line method over the estimated useful lives of the assets.
Other-than-temporary Impairments
Periodically, we review all available-for-sale securities for other-than-temporary impairment. An impairment that is an other-than-temporary impairment is a decline in the fair value of a security below its cost basis attributable to factors that indicate the cost basis in the security may not be recoverable in the near term. The determination of an other-than-temporary impairment is a subjective process, and requires judgment and assumptions that could affect the timing of loss realization. We consider several factors including the severity and duration of the decline, the financial condition and near-term prospects of the specific issuers and the industries in which they operate, and our intent and ability to hold these securities for a sufficient period of time to allow for a recovery. If, in our judgment, the impairment is determined to be other-than-temporary, then the cost basis of the security is written down to the then-current market value, and the unrealized loss is transferred from accumulated other comprehensive loss as an immediate reduction of current earnings. Gross unrealized holding losses of $0.5 million as of December 31, 2017 have not been recognized in earnings as these impairments in value were judged to be temporary. We may incur future impairment charges if declines in market values continue or worsen and impairments are no longer considered temporary.
Recently Issued Accounting Pronouncements Not Currently Effective
See Item 8: Note 17 to the Consolidated Financial Statements for discussion of new accounting pronouncements.
34
Interest Rate Risk
Our principal exposure to interest rate risk relates to outstanding borrowing under our ABL Facility, Westport Facility, Real Estate Financing and Margin Facility, all of which charge interest at floating rates. Borrowings under the credit agreements with each of the banks bear interest at LIBOR or a base rate, plus an applicable margin. Our Margin Facility bears interest at a floating rate equal to LIBOR plus 1.10%. As of December 31, 2017, we had total variable interest rate borrowings of $137.0 million. Assuming variable rate debt levels remain at $137.0 million for a full year, a 100 basis point increase in interest rates on our variable rate debt would increase interest expense approximately $1.4 million annually.
In connection with the Westport Facility and the Real Estate Financing, we entered into interest rate swap agreements to fix a portion of the interest rates on our variable rate debt that has a combined notional amount of $27.7 million at December 31, 2017. Under two of the swap agreements, the Company receives interest at the one-month LIBOR rate plus 2.25%, and pays a fixed rate. The March 2016 swap (swap A) became effective October 2016, has a rate of 4.16% (amortizing notional amount of $10.0 million) and expires July 2026, and an additional March 2016 swap (swap B) became effective October 2016, has a rate of 3.83% (amortizing notional amount of $5.7 million) and expires May 2022. The third interest rate swap agreement (swap C) has a notional amount of $12.0 million and expires February 2018. Under swap C, the Company receives interest at the one-month LIBOR rate and pays a fixed rate of 0.78%. At December 31, 2017, the fair value of the three swap agreements was an asset of $0.3 million. Since these swap agreements qualify for hedge accounting, the changes in fair value are recorded in other comprehensive income (loss), net of tax.
Included in cash and cash equivalents is approximately $75,000 in short-term investment grade instruments. The interest rates on these instruments are adjusted to market rates at least monthly. In addition, we have the ability to put these instruments back to the issuer at any time. Accordingly, any future interest rate risk on these short-term investments would not be material.
Commodity Price Risk
Fluctuations in fuel prices can affect our profitability by affecting our ability to retain or recruit owner-operators. Our owner-operators bear the costs of operating their tractors, including the cost of fuel. The tractors operated by our owner-operators consume large amounts of diesel fuel. Diesel fuel prices fluctuate greatly due to economic, political and other factors beyond our control. To address fluctuations in fuel prices, we seek to impose fuel surcharges on our customers and pass these surcharges on to our owner-operators. Historically, these arrangements have not fully protected our owner-operators from fuel price increases. If costs for fuel escalate significantly it could make it more difficult to attract additional qualified owner-operators and retain our current owner-operators. If we lose the services of a significant number of owner-operators or are unable to attract additional owner-operators, it could have a materially adverse effect on our financial condition, results of operations and cash flows.
Exposure to market risk for fluctuations in fuel prices also relates to a small portion of our transportation service contracts for which the cost of fuel is integral to service delivery and the service contract does not have a mechanism to adjust for increases in fuel prices. Increases and decreases in the price of fuel are generally passed on to our customers for which we realize minimal changes in profitability during periods of steady market fuel prices. However, profitability may be positively or negatively impacted by sudden increases or decreases in market fuel prices during a short period of time as customer pricing for fuel services is established based on market fuel costs. We believe the exposure to fuel price fluctuations would not materially impact our results of operations, cash flows or financial position.
Included in operating revenues are fuel surcharges, where separately identifiable, of $59.5 million in 2017 compared to $50.9 million in 2016.
Equity Securities Risk
The Company from time to time invests cash in excess of its current needs in marketable securities, much of which is held in equity securities, which are actively traded on public exchanges. It is the philosophy of the Company to minimize the risk of capital loss without foregoing the potential for capital appreciation through investing in value-and-income oriented investments. However, holding equity securities subjects the Company to fluctuations in the market value of its investment portfolio based on current market prices. A drop in market prices or other unstable market conditions could cause a loss in the value of the Company’s marketable securities classified as available-for-sale.
Marketable securities were carried at fair value and are marked to market at the end of each quarter, with the unrealized gains and losses, net of tax, included as a component of accumulated other comprehensive income, unless the declines in value are judged to be other-than-temporary, in which case an impairment charge would be included in the determination of net income. Gross unrealized holding losses of $0.5 million and $0.6 million as of December 31, 2017 and 2016, respectively, were not recognized in earnings as these impairments in value were judged to be temporary. See Item 8, Note 1(e) to the Consolidated Financial Statements.
35
In January 2016, the FASB issued ASU 2016-01, Financial Instruments – Overall: Recognition and Measurement of Financial Assets and Financial Liabilities. Among other things, the ASU requires equity investments to be measured at fair value with changes in fair value recognized in net income. The Company adopted this new standard effective January 1, 2018 using the modified retrospective method with a cumulative adjustment to retained earnings of approximately $3.8 million. See Item 8, Note 17 to the Consolidated Financial Statements.
As of December 31, 2017, the fair value of equity securities was $15.1 million compared to $14.4 million at December 31, 2016. The increase during 2017 represents net realized and unrealized holding gains of $1.6 million and proceeds from sales of securities totaling $1.3 million. Realized gains during 2017 were $0.9 million. A 10% decrease in the market price of our marketable equity securities would cause a corresponding 10% decrease in the carrying amounts of these securities, or approximately $1.5 million.
Foreign Exchange Risk
In each of the years ended December 31, 2017 and 2016, 3.1% of our revenues were derived from services provided outside the United States, principally in Mexico, Canada and Colombia. Exposure to market risk for changes in foreign currency exchange rates relates primarily to selling services and incurring costs in currencies other than the local currency and to the carrying value of net investments in foreign subsidiaries. As a result, we are exposed to foreign currency exchange rate risk due primarily due to translation of the accounts of our Mexican, Canadian and Colombian operations from their local currencies into U.S. dollars and also to the extent we engage in cross-border transactions. The majority of our exposure to fluctuations in the Mexican peso, Canadian dollar, and Colombian peso is naturally hedged, since a substantial portion of our revenues and operating costs are denominated in each country’s local currency. Historically, we have not entered into financial instruments for trading or speculative purposes. Short-term exposures to fluctuating foreign currency exchange rates are related primarily to intercompany transactions. The duration of these exposures is minimized by ongoing settlement of intercompany trading obligations.
The net investments in our Mexican, Canadian and Colombian operations are exposed to foreign currency translation gains and losses, which are included as a component of accumulated other comprehensive income in our statement of shareholders’ equity. Adjustments from the translation of the net investment in these operations increased equity by approximately $0.7 million for the year ended December 31, 2017.
36
Report of Independent Registered Public Accounting Firm
Shareholders and Board of Directors
Universal Logistics Holdings, Inc.
Warren, Michigan
Opinion on the Consolidated Financial Statements
We have audited the accompanying consolidated balance sheets of Universal Logistics Holdings, Inc. (the “Company”) as of December 31, 2017 and 2016, the related consolidated statements of income, comprehensive income, cash flows and shareholders’ equity for each of the three years in the period ended December 31, 2017 and the related notes (collectively referred to as the “consolidated financial statements”). In our opinion, the consolidated financial statements present fairly, in all material respects, the financial position of the Company at December 31, 2017 and 2016, and the results of their operations and their cash flows for each of the three years in the period ended December 31, 2017, in conformity with accounting principles generally accepted in the United States of America.
We also have audited, in accordance with the standards of the Public Company Accounting Oversight Board (United States) (“PCAOB”), the Company's internal control over financial reporting as of December 31, 2017, based on criteria established in Internal Control - Integrated Framework (2013) issued by the Committee of Sponsoring Organizations of the Treadway Commission (“COSO”) and our report dated March 16, 2018 expressed an unqualified opinion thereon.
Basis for Opinion
These consolidated financial statements are the responsibility of the Company’s management. Our responsibility is to express an opinion on the Company’s consolidated financial statements based on our audits. We are a public accounting firm registered with the PCAOB and are required to be independent with respect to the Company in accordance with the U.S. federal securities laws and the applicable rules and regulations of the Securities and Exchange Commission and the PCAOB.
We conducted our audits in accordance with the standards of the PCAOB. Those standards require that we plan and perform the audit to obtain reasonable assurance about whether the consolidated financial statements are free of material misstatement, whether due to error or fraud. Our audits included performing procedures to assess the risks of material misstatement of the consolidated financial statements, whether due to error or fraud, and performing procedures that respond to those risks. Such procedures included examining, on a test basis, evidence regarding the amounts and disclosures in the consolidated financial statements. Our audits also included evaluating the accounting principles used and significant estimates made by management, as well as evaluating the overall presentation of the consolidated financial statements. We believe that our audits provide a reasonable basis for our opinion.
/s/ BDO USA, LLP
We have served as the Company's auditor since 2013.
Troy, Michigan
March 16, 2018
37
UNIVERSAL LOGISTICS HOLDINGS, INC.
December 31, 2017 and 2016
(In thousands, except share data)
|
Assets |
|
2017 |
|
|
2016 |
|
||
|
Current assets: |
|
|
|
|
|
|
|
|
|
Cash and cash equivalents |
|
$ |
1,672 |
|
|
$ |
1,755 |
|
|
Marketable securities |
|
|
15,144 |
|
|
|
14,359 |
|
|
Accounts receivable – net of allowance for doubtful accounts of $1,330 and $1,613, respectively |
|
|
171,036 |
|
|
|
144,712 |
|
|
Other receivables |
|
|
17,511 |
|
|
|
15,438 |
|
|
Due from affiliates |
|
|
2,685 |
|
|
|
2,513 |
|
|
Prepaid income taxes |
|
|
4,515 |
|
|
|
11,300 |
|
|
Prepaid expenses and other |
|
|
16,103 |
|
|
|
17,374 |
|
|
Total current assets |
|
|
228,666 |
|
|
|
207,451 |
|
|
Property and equipment, net |
|
|
267,195 |
|
|
|
246,277 |
|
|
Goodwill |
|
|
74,484 |
|
|
|
74,484 |
|
|
Intangible assets – net of accumulated amortization of $56,901 and $50,971, respectively |
|
|
31,259 |
|
|
|
37,189 |
|
|
Deferred income taxes |
|
|
4,154 |
|
|
|
164 |
|
|
Other assets |
|
|
4,834 |
|
|
|
4,892 |
|
|
Total assets |
|
$ |
610,592 |
|
|
$ |
570,457 |
|
|
Liabilities and Shareholders’ Equity |
|
|
|
|
|
|
|
|
|
Current liabilities: |
|
|
|
|
|
|
|
|
|
Accounts payable |
|
$ |
84,380 |
|
|
$ |
65,945 |
|
|
Due to affiliates |
|
|
11,964 |
|
|
|
4,597 |
|
|
Accrued expenses and other current liabilities |
|
|
24,129 |
|
|
|
19,765 |
|
|
Insurance and claims |
|
|
37,727 |
|
|
|
19,754 |
|
|
Current portion of long-term debt |
|
|
40,870 |
|
|
|
34,455 |
|
|
Total current liabilities |
|
|
199,070 |
|
|
|
144,516 |
|
|
Long-term liabilities: |
|
|
|
|
|
|
|
|
|
Long-term debt, net of current portion |
|
|
207,108 |
|
|
|
226,812 |
|
|
Deferred income taxes |
|
|
32,361 |
|
|
|
47,819 |
|
|
Other long-term liabilities |
|
|
3,288 |
|
|
|
3,578 |
|
|
Total long-term liabilities |
|
|
242,757 |
|
|
|
278,209 |
|
|
Shareholders' equity: |
|
|
|
|
|
|
|
|
|
Common stock, no par value. Authorized 100,000,000 shares; 30,941,702 and 30,917,952 shares issued; 28,382,392 and 28,430,394 shares outstanding, respectively |
|
|
30,943 |
|
|
|
30,919 |
|
|
Paid-in capital |
|
|
3,841 |
|
|
|
3,451 |
|
|
Treasury stock, at cost; 2,559,310 and 2,487,558 shares, respectively |
|
|
(51,532 |
) |
|
|
(50,044 |
) |
|
Retained earnings |
|
|
186,226 |
|
|
|
166,033 |
|
|
Accumulated other comprehensive income (loss): |
|
|
|
|
|
|
|
|
|
Unrealized holding gain on available-for-sale securities, net of income taxes of $1,090 and $1,512, respectively |
|
|
3,823 |
|
|
|
2,679 |
|
|
Interest rate swaps, net of income taxes of $63 and $62, respectively |
|
|
197 |
|
|
|
99 |
|
|
Foreign currency translation adjustments |
|
|
(4,733 |
) |
|
|
(5,405 |
) |
|
Total shareholders’ equity |
|
|
168,765 |
|
|
|
147,732 |
|
|
Total liabilities and shareholders’ equity |
|
$ |
610,592 |
|
|
$ |
570,457 |
|
See accompanying notes to consolidated financial statements.
38
UNIVERSAL LOGISTICS HOLDINGS, INC.
Consolidated Statements of Income
Years ended December 31, 2017, 2016 and 2015
(In thousands, except per share data)
|
|
|
2017 |
|
|
2016 |
|
|
2015 |
|
|||
|
Operating revenues: |
|
|
|
|
|
|
|
|
|
|
|
|
|
Truckload services, including related party amounts of $1,100, $1,090 and $400, respectively |
|
$ |
302,914 |
|
|
$ |
281,213 |
|
|
$ |
357,786 |
|
|
Brokerage services |
|
|
278,187 |
|
|
|
219,898 |
|
|
|
202,621 |
|
|
Intermodal services |
|
|
153,726 |
|
|
|
143,004 |
|
|
|
149,404 |
|
|
Dedicated services |
|
|
93,505 |
|
|
|
95,332 |
|
|
|
94,988 |
|
|
Value-added services |
|
|
388,333 |
|
|
|
333,304 |
|
|
|
323,974 |
|
|
Total operating revenues |
|
|
1,216,665 |
|
|
|
1,072,751 |
|
|
|
1,128,773 |
|
|
Operating expenses: |
|
|
|
|
|
|
|
|
|
|
|
|
|
Purchased transportation and equipment rent, including related party amounts of $35, $233 and $3,347, respectively |
|
|
577,485 |
|
|
|
509,775 |
|
|
|
567,558 |
|
|
Direct personnel and related benefits, including related party amounts of $35,743, $26,267 and $23,792, respectively |
|
|
314,364 |
|
|
|
265,316 |
|
|
|
222,454 |
|
|
Operating supplies and expenses, including related party amounts of $2,652, $2,656 and $1,983, respectively |
|
|
115,420 |
|
|
|
103,013 |
|
|
|
113,545 |
|
|
Commission expense |
|
|
33,213 |
|
|
|
32,350 |
|
|
|
37,844 |
|
|
Occupancy expense, including related party amounts of $17,046, $17,174 and $13,174, respectively |
|
|
30,575 |
|
|
|
31,923 |
|
|
|
27,004 |
|
|
General and administrative, including related party amounts of $6,742, $5,557 and $6,418, respectively |
|
|
31,518 |
|
|
|
29,368 |
|
|
|
30,687 |
|
|
Insurance and claims, including related party amounts of $16,281, $15,362 and $17,360, respectively |
|
|
41,881 |
|
|
|
17,724 |
|
|
|
21,413 |
|
|
Depreciation and amortization |
|
|
46,995 |
|
|
|
36,702 |
|
|
|
34,873 |
|
|
Total operating expenses |
|
|
1,191,451 |
|
|
|
1,026,171 |
|
|
|
1,055,378 |
|
|
Income from operations |
|
|
25,214 |
|
|
|
46,580 |
|
|
|
73,395 |
|
|
Interest income |
|
|
92 |
|
|
|
157 |
|
|
|
55 |
|
|
Interest expense |
|
|
(9,538 |
) |
|
|
(8,266 |
) |
|
|
(9,235 |
) |
|
Other non-operating income |
|
|
1,373 |
|
|
|
934 |
|
|
|
790 |
|
|
Income before income taxes |
|
|
17,141 |
|
|
|
39,405 |
|
|
|
65,005 |
|
|
Income tax (benefit) expense |
|
|
(11,012 |
) |
|
|
15,161 |
|
|
|
25,004 |
|
|
Net income |
|
$ |
28,153 |
|
|
$ |
24,244 |
|
|
$ |
40,001 |
|
|
Earnings per common share: |
|
|
|
|
|
|
|
|
|
|
|
|
|
Basic |
|
$ |
0.99 |
|
|
$ |
0.85 |
|
|
$ |
1.37 |
|
|
Diluted |
|
$ |
0.99 |
|
|
$ |
0.85 |
|
|
$ |
1.37 |
|
|
Weighted average number of common shares outstanding: |
|
|
|
|
|
|
|
|
|
|
|
|
|
Basic |
|
|
28,425 |
|
|
|
28,411 |
|
|
|
29,233 |
|
|
Diluted |
|
|
28,428 |
|
|
|
28,411 |
|
|
|
29,235 |
|
|
Dividends declared per common share |
|
$ |
0.28 |
|
|
$ |
0.28 |
|
|
$ |
0.28 |
|
See accompanying notes to consolidated financial statements.
39
UNIVERSAL LOGISTICS HOLDINGS, INC.
Consolidated Statements of Comprehensive Income
Years ended December 31, 2017, 2016 and 2015
(In thousands, except per share data)
|
|
|
2017 |
|
|
2016 |
|
|
2015 |
|
|||
|
Net Income |
|
$ |
28,153 |
|
|
$ |
24,244 |
|
|
$ |
40,001 |
|
|
Other comprehensive income (loss): |
|
|
|
|
|
|
|
|
|
|
|
|
|
Unrealized holding gains (losses) on available-for-sale securities arising during the period, net of income taxes |
|
|
1,683 |
|
|
|
1,142 |
|
|
|
(1,015 |
) |
|
Realized gains on available-for-sale securities reclassified into income, net of income taxes |
|
|
(539 |
) |
|
|
(264 |
) |
|
|
(72 |
) |
|
Unrealized changes in fair value of interest rate swaps, net of income taxes |
|
|
98 |
|
|
|
99 |
|
|
|
— |
|
|
Foreign currency translation adjustments |
|
|
672 |
|
|
|
(1,161 |
) |
|
|
(2,252 |
) |
|
Total other comprehensive income (loss) |
|
|
1,914 |
|
|
|
(184 |
) |
|
|
(3,339 |
) |
|
Total comprehensive income |
|
$ |
30,067 |
|
|
$ |
24,060 |
|
|
$ |
36,662 |
|
See accompanying notes to consolidated financial statements.
40
UNIVERSAL LOGISTICS HOLDINGS, INC.
Consolidated Statements of Cash Flows
Years ended December 31, 2017, 2016 and 2015
(In thousands)
|
|
|
2017 |
|
|
2016 |
|
|
2015 |
|
|||
|
Cash flows from operating activities: |
|
|
|
|
|
|
|
|
|
|
|
|
|
Net income |
|
$ |
28,153 |
|
|
$ |
24,244 |
|
|
$ |
40,001 |
|
|
Adjustments to reconcile net income to net cash provided by operating activities: |
|
|
|
|
|
|
|
|
|
|
|
|
|
Depreciation and amortization |
|
|
46,995 |
|
|
|
36,702 |
|
|
|
34,873 |
|
|
Gain on sale of marketable equity securities |
|
|
(923 |
) |
|
|
(412 |
) |
|
|
(347 |
) |
|
Other-than-temporary impairment of marketable securities |
|
|
— |
|
|
|
— |
|
|
|
230 |
|
|
(Gain) loss on disposal of property and equipment |
|
|
(10 |
) |
|
|
161 |
|
|
|
239 |
|
|
Amortization of debt issuance costs |
|
|
321 |
|
|
|
312 |
|
|
|
648 |
|
|
Write-off of debt issuance costs |
|
|
— |
|
|
|
— |
|
|
|
1,272 |
|
|
Stock-based compensation |
|
|
414 |
|
|
|
571 |
|
|
|
494 |
|
|
Provision for doubtful accounts |
|
|
1,533 |
|
|
|
3,099 |
|
|
|
3,004 |
|
|
Deferred income taxes |
|
|
(19,014 |
) |
|
|
6,610 |
|
|
|
478 |
|
|
Change in assets and liabilities: |
|
|
|
|
|
|
|
|
|
|
|
|
|
Trade and other accounts receivable |
|
|
(29,398 |
) |
|
|
(7,510 |
) |
|
|
4,424 |
|
|
Prepaid income taxes, prepaid expenses and other assets |
|
|
8,051 |
|
|
|
(12,748 |
) |
|
|
4,347 |
|
|
Accounts payable, accrued expenses, insurance and claims and other current liabilities |
|
|
40,633 |
|
|
|
18,003 |
|
|
|
(11,695 |
) |
|
Due to/from affiliates, net |
|
|
7,192 |
|
|
|
595 |
|
|
|
83 |
|
|
Other long-term liabilities |
|
|
(98 |
) |
|
|
(998 |
) |
|
|
253 |
|
|
Net cash provided by operating activities |
|
|
83,849 |
|
|
|
68,629 |
|
|
|
78,304 |
|
|
Cash flows from investing activities: |
|
|
|
|
|
|
|
|
|
|
|
|
|
Capital expenditures |
|
|
(63,360 |
) |
|
|
(97,351 |
) |
|
|
(26,257 |
) |
|
Proceeds from the sale of property and equipment |
|
|
1,211 |
|
|
|
2,426 |
|
|
|
816 |
|
|
Purchases of marketable securities |
|
|
(401 |
) |
|
|
(17 |
) |
|
|
(1,159 |
) |
|
Proceeds from sale of marketable securities |
|
|
1,261 |
|
|
|
866 |
|
|
|
441 |
|
|
Net cash used in investing activities |
|
|
(61,289 |
) |
|
|
(94,076 |
) |
|
|
(26,159 |
) |
|
Cash flows from financing activities: |
|
|
|
|
|
|
|
|
|
|
|
|
|
Proceeds from borrowing - revolving debt |
|
|
316,458 |
|
|
|
220,633 |
|
|
|
172,758 |
|
|
Repayments of debt - revolving debt |
|
|
(320,833 |
) |
|
|
(217,368 |
) |
|
|
(161,293 |
) |
|
Proceeds from borrowing - term debt |
|
|
39,069 |
|
|
|
99,534 |
|
|
|
163,578 |
|
|
Repayments of debt - term debt |
|
|
(48,305 |
) |
|
|
(78,520 |
) |
|
|
(175,428 |
) |
|
Dividends paid |
|
|
(7,960 |
) |
|
|
(7,954 |
) |
|
|
(8,171 |
) |
|
Payment of capital lease obligations |
|
|
(100 |
) |
|
|
(1,789 |
) |
|
|
(1,050 |
) |
|
Purchases of treasury stock |
|
|
(1,488 |
) |
|
|
(26 |
) |
|
|
(35,065 |
) |
|
Capitalized financing costs |
|
|
— |
|
|
|
(396 |
) |
|
|
(1,499 |
) |
|
Net cash (used in) provided by financing activities |
|
|
(23,159 |
) |
|
|
14,114 |
|
|
|
(46,170 |
) |
|
Effect of exchange rate changes on cash and cash equivalents |
|
|
516 |
|
|
|
158 |
|
|
|
(1,046 |
) |
|
Net (decrease) increase in cash |
|
|
(83 |
) |
|
|
(11,175 |
) |
|
|
4,929 |
|
|
Cash and cash equivalents – January 1 |
|
|
1,755 |
|
|
|
12,930 |
|
|
|
8,001 |
|
|
Cash and cash equivalents – December 31 |
|
$ |
1,672 |
|
|
$ |
1,755 |
|
|
$ |
12,930 |
|
See accompanying notes to consolidated financial statements.
41
UNIVERSAL LOGISTICS HOLDINGS, INC.
Consolidated Statements of Cash Flows - Continued
Years ended December 31, 2017, 2016 and 2015
(In thousands)
|
|
|
2017 |
|
|
2016 |
|
|
2015 |
|
|||
|
Supplemental cash flow information: |
|
|
|
|
|
|
|
|
|
|
|
|
|
Cash paid for interest |
|
$ |
9,104 |
|
|
$ |
7,802 |
|
|
$ |
7,649 |
|
|
Cash paid for income taxes |
|
$ |
2,207 |
|
|
$ |
20,896 |
|
|
$ |
21,541 |
|
|
|
|
|||||||||||
|
Non-cash investing and financing activities: During the year ended December 31, 2016, the Company made $3.7 million of non-cash capital expenditures pursuant to a promissory note. |
|
|||||||||||
See accompanying notes to consolidated financial statements.
42
UNIVERSAL LOGISTICS HOLDINGS, INC.
Consolidated Statements of Shareholders’ Equity
Years ended December 31, 2017, 2016 and 2015
(In thousands)
|
|
|
Common stock |
|
|
Paid-in capital |
|
|
Treasury stock |
|
|
Retained earnings |
|
|
Accumulated other comprehensive income (loss) |
|
|
Total |
|
||||||
|
Balances – December 31, 2014 |
|
$ |
30,857 |
|
|
$ |
2,448 |
|
|
$ |
(14,953 |
) |
|
$ |
117,913 |
|
|
$ |
896 |
|
|
$ |
137,161 |
|
|
Net income |
|
|
— |
|
|
|
— |
|
|
|
— |
|
|
|
40,001 |
|
|
|
— |
|
|
|
40,001 |
|
|
Comprehensive loss |
|
|
— |
|
|
|
— |
|
|
|
— |
|
|
|
— |
|
|
|
(3,339 |
) |
|
|
(3,339 |
) |
|
Dividends paid ($0.28 per share) |
|
|
— |
|
|
|
— |
|
|
|
— |
|
|
|
(8,171 |
) |
|
|
— |
|
|
|
(8,171 |
) |
|
Stock based compensation |
|
|
28 |
|
|
|
466 |
|
|
|
— |
|
|
|
— |
|
|
|
— |
|
|
|
494 |
|
|
Purchases of treasury stock |
|
|
— |
|
|
|
— |
|
|
|
(35,065 |
) |
|
|
— |
|
|
|
— |
|
|
|
(35,065 |
) |
|
Balances – December 31, 2015 |
|
$ |
30,885 |
|
|
$ |
2,914 |
|
|
$ |
(50,018 |
) |
|
$ |
149,743 |
|
|
$ |
(2,443 |
) |
|
$ |
131,081 |
|
|
Net income |
|
|
— |
|
|
|
— |
|
|
|
— |
|
|
|
24,244 |
|
|
|
— |
|
|
|
24,244 |
|
|
Comprehensive loss |
|
|
— |
|
|
|
— |
|
|
|
— |
|
|
|
— |
|
|
|
(184 |
) |
|
|
(184 |
) |
|
Dividends paid ($0.28 per share) |
|
|
— |
|
|
|
— |
|
|
|
— |
|
|
|
(7,954 |
) |
|
|
— |
|
|
|
(7,954 |
) |
|
Stock based compensation |
|
|
34 |
|
|
|
537 |
|
|
|
— |
|
|
|
— |
|
|
|
— |
|
|
|
571 |
|
|
Purchases of treasury stock |
|
|
— |
|
|
|
— |
|
|
|
(26 |
) |
|
|
— |
|
|
|
— |
|
|
|
(26 |
) |
|
Balances – December 31, 2016 |
|
$ |
30,919 |
|
|
$ |
3,451 |
|
|
$ |
(50,044 |
) |
|
$ |
166,033 |
|
|
$ |
(2,627 |
) |
|
$ |
147,732 |
|
|
Net income |
|
|
— |
|
|
|
— |
|
|
|
— |
|
|
|
28,153 |
|
|
|
— |
|
|
|
28,153 |
|
|
Comprehensive income |
|
|
— |
|
|
|
— |
|
|
|
— |
|
|
|
— |
|
|
|
1,914 |
|
|
|
1,914 |
|
|
Dividends paid ($0.28 per share) |
|
|
— |
|
|
|
— |
|
|
|
— |
|
|
|
(7,960 |
) |
|
|
— |
|
|
|
(7,960 |
) |
|
Stock based compensation |
|
|
24 |
|
|
|
390 |
|
|
|
— |
|
|
|
— |
|
|
|
— |
|
|
|
414 |
|
|
Purchases of treasury stock |
|
|
— |
|
|
|
— |
|
|
|
(1,488 |
) |
|
|
— |
|
|
|
— |
|
|
|
(1,488 |
) |
|
Balances – December 31, 2017 |
|
$ |
30,943 |
|
|
$ |
3,841 |
|
|
$ |
(51,532 |
) |
|
$ |
186,226 |
|
|
$ |
(713 |
) |
|
$ |
168,765 |
|
See accompanying notes to consolidated financial statements.
43
UNIVERSAL LOGISTICS HOLDINGS, INC.
Notes to Consolidated Financial Statements
December 31, 2017, 2016 and 2015
|
(1) |
Summary of Significant Accounting Policies |
|
|
(a) |
Business |
Universal Logistics Holdings, Inc. (“Universal” or the “Company”), through its subsidiaries, is a leading asset-light provider of customized transportation and logistics solutions throughout the United States, and in Mexico, Canada and Colombia. We provide our customers with supply chain solutions that can be scaled to meet their changing demands. We offer our customers a broad array of services across their entire supply chain, including truckload, brokerage, intermodal, dedicated and value-added services. Our customized solutions and flexible business model are designed to provide us with a highly variable cost model.
|
|
(b) |
Basis of Presentation |
The consolidated financial statements include the accounts of the Company and its wholly owned subsidiaries. All significant intercompany accounts and transactions relating to these entities have been eliminated.
Our fiscal year consists of four quarters, each with thirteen weeks.
Certain immaterial reclassifications have been made to the prior consolidated financial statements in order for them to conform to the December 31, 2017 presentation, including the reclassification of revenue categories to reflect Universal’s service offering. These reclassifications had no effect on reported consolidated net income, comprehensive income, earnings per common share, cash flows, total assets, or stockholders' equity as previously reported.
|
|
(c) |
Use of Estimates |
The preparation of the consolidated financial statements requires management of the Company to make a number of estimates and assumptions related to the reported amounts of assets and liabilities and the disclosure of contingent assets and liabilities at the date of the consolidated financial statements and the reported amounts of revenues and expenses during the period. Significant items subject to such estimates and assumptions include the fair value of assets and liabilities acquired in business combinations; carrying amounts of property and equipment and intangible assets; marketable securities; valuation allowances for receivables; and liabilities related to insurance and claim costs. Actual results could differ from those estimates.
|
|
(d) |
Cash and Cash Equivalents |
We consider all highly liquid investments, purchased with a maturity of three months or less, to be cash equivalents. Accounts at banks with an aggregate excess of the amount of checks issued over cash balances are included as accounts payable in current liabilities in the consolidated balance sheets, and changes in such accounts are reported as cash flows from operating activities in the consolidated statements of cash flows.
|
|
(e) |
Marketable Securities |
At December 31, 2017 and 2016, marketable securities, all of which are available-for-sale, consist of common and preferred stocks. Marketable securities are carried at fair value, with unrealized gains and losses, net of related income taxes, reported as accumulated other comprehensive income (loss), except for losses from impairments which are determined to be other-than-temporary. Realized gains and losses, and declines in value judged to be other-than-temporary on available-for-sale securities are included in the determination of net income and are included in other non-operating income (expense), at which time the average cost basis of these securities are adjusted to fair value. Fair values are based on quoted market prices at the reporting date. Interest and dividends on available-for-sale securities are included in other non-operating income (expense). During the years ended December 31, 2017, 2016 and 2015, we received proceeds of $1.3 million, $0.9 million and $0.4 million from the sale of marketable securities with a combined cost of $0.3 million, $0.5 million and $0.1 million resulting in a realized gain of $0.9 million, $0.4 million and $0.3 million, respectively.
We plan to adopt Accounting Standards Update (“ASU”) 2016-01 effective as of January 1, 2018. See Note 17 “Recent Accounting Pronouncements” for further information regarding the adoption.
44
UNIVERSAL LOGISTICS HOLDINGS, INC.
Notes to Consolidated Financial Statements – (Continued)
December 31, 2017, 2016 and 2015
|
|
(e) |
Marketable Securities—continued |
The cost, gross unrealized holding gains, gross unrealized holding losses, and fair value of available-for-sale securities by type were as follows (in thousands):
|
|
|
Cost |
|
|
Gross unrealized holding gains |
|
|
Gross unrealized holding (losses) |
|
|
Fair Value |
|
||||
|
At December 31, 2017 |
|
|
|
|
|
|
|
|
|
|
|
|
|
|
|
|
|
Equity Securities |
|
$ |
10,231 |
|
|
$ |
5,390 |
|
|
$ |
(477 |
) |
|
$ |
15,144 |
|
|
At December 31, 2016 |
|
|
|
|
|
|
|
|
|
|
|
|
|
|
|
|
|
Equity Securities |
|
$ |
10,168 |
|
|
$ |
4,780 |
|
|
$ |
(589 |
) |
|
$ |
14,359 |
|
Included in equity securities at December 31, 2017 were securities with a book basis of $3.0 million and a cumulative loss position of $0.5 million, the impairment of which we consider to be temporary. Equity securities at December 31, 2016 included securities with a book basis of $3.5 million and temporary impairments of $0.6 million. We consider several factors in determining as to whether declines in value are judged to be temporary or other-than-temporary, including the severity and duration of the decline, the financial condition and near-term prospects of the specific issuers and the industries in which they operate, and our intent and ability to hold these securities. We may incur future impairment charges if declines in market values continue and/or worsen and impairments are no longer considered temporary.
The fair value and gross unrealized holding losses of our marketable securities that are not deemed to be other-than-temporarily impaired aggregated by type and length of time they have been in a continuous unrealized loss position were as follows (in thousands):
|
|
|
Less than 12 Months |
|
|
12 Months or Greater |
|
|
Total |
|
|||||||||||||||
|
|
|
Fair Value |
|
|
Unrealized Losses |
|
|
Fair Value |
|
|
Unrealized Losses |
|
|
Fair Value |
|
|
Unrealized Losses |
|
||||||
|
At December 31, 2017 |
|
|
|
|
|
|
|
|
|
|
|
|
|
|
|
|
|
|
|
|
|
|
|
|
|
Equity securities |
|
$ |
959 |
|
|
$ |
84 |
|
|
$ |
1,534 |
|
|
$ |
393 |
|
|
$ |
2,493 |
|
|
$ |
477 |
|
|
At December 31, 2016 |
|
|
|
|
|
|
|
|
|
|
|
|
|
|
|
|
|
|
|
|
|
|
|
|
|
Equity securities |
|
$ |
426 |
|
|
$ |
41 |
|
|
$ |
2,438 |
|
|
$ |
548 |
|
|
$ |
2,864 |
|
|
$ |
589 |
|
At December 31, 2017, our portfolio of equity securities in a continuous loss position, the impairment of which we consider to be temporary, consists primarily of common stocks in the oil and gas, banking, transportation, communication, and pharmaceutical industries. The fair value and unrealized losses are distributed in 20 publicly traded companies, with no single industry or company representing a material or concentrated unrealized loss. We have evaluated the near-term prospects of the various industries, as well as the specific issuers within our portfolio, in relation to the severity and duration of the impairments, and based on that evaluation, and our ability and intent to hold these investments for a reasonable period of time to allow for a recovery of fair value, we do not consider these investments to be other-than-temporarily impaired at December 31, 2017.
45
UNIVERSAL LOGISTICS HOLDINGS, INC.
Notes to Consolidated Financial Statements – (Continued)
December 31, 2017, 2016 and 2015
|
|
(f) |
Accounts Receivable |
Accounts receivable are recorded at the net invoiced amount, net of an allowance for doubtful accounts, and do not bear interest. They include unbilled amounts for services rendered in the respective period but not yet billed to the customer until a future date, which typically occurs within one month. In order to reflect customer receivables at their estimated net realizable value, we record charges against revenue based upon current information. These charges generally arise from rate changes, errors, and revenue adjustments that may arise from contract disputes or differences in calculation methods employed by the customer. The allowance for doubtful accounts is our best estimate of the amount of probable credit losses in our existing accounts receivable. We determine the allowance based on historical write-off experience and the aging of our outstanding accounts receivable. Balances are considered past due based on invoiced terms. Account balances are charged off against the allowance after all means of collection have been exhausted and the potential for recovery is considered remote. We do not have any off‑balance‑sheet credit exposure related to our customers. Accounts receivable from affiliates are shown separately and include trade receivables from the sale of services to affiliates.
|
|
(g) |
Inventories |
Included in prepaid expenses and other is inventory used in a portion of our value-added service operations. Inventories are stated net realizable value. Cost is determined using the first-in, first-out method. Provisions for excess and obsolete inventories are based on our assessment of excess and obsolete inventory on a product-by-product basis.
At December 31, inventory consists of the following (in thousands):
|
|
|
2017 |
|
|
2016 |
|
||
|
Raw materials and supplies |
|
$ |
4,596 |
|
|
$ |
7,077 |
|
|
Finished goods |
|
|
746 |
|
|
|
1,540 |
|
|
|
|
$ |
5,342 |
|
|
$ |
8,617 |
|
|
|
(h) |
Property and Equipment |
Property and equipment, including leasehold improvements, are carried at cost less accumulated depreciation. Depreciation is computed using the straight-line method over the estimated useful lives of the assets as follows:
|
Description |
|
Life in Years |
|
Transportation equipment |
|
3 - 15 |
|
Other operating assets |
|
3 - 15 |
|
Information technology equipment |
|
3 - 5 |
|
Buildings and related assets |
|
10 - 39 |
The amounts recorded for depreciation expense were $41.0 million, $29.2 million, and $25.8 million for the years ended December 31, 2017, 2016 and 2015, respectively.
Tire repairs, replacement tires, replacement batteries, consumable tools used in our logistics services, and routine repairs and maintenance on vehicles are expensed as incurred. Parts and fuel inventories are included in prepaid expenses and other. We capitalize certain costs associated with vehicle repairs and maintenance that materially extend the life or increase the value of the vehicle or pool of vehicles.
46
UNIVERSAL LOGISTICS HOLDINGS, INC.
Notes to Consolidated Financial Statements – (Continued)
December 31, 2017, 2016 and 2015
|
|
(i) |
Intangible Assets |
Intangible assets subject to amortization consist of customer contracts and agent and customer relationships that have been acquired in business combinations. These assets are amortized either over the period of economic benefit or on a straight-line basis over the estimated useful lives of the related intangible asset. The estimated useful lives of these intangible assets range from three to nineteen years. The useful lives of acquired trademarks are indefinite and, therefore, not subject to amortization.
Our identifiable intangible assets as of December 31, 2017 and 2016 are as follows (in thousands):
|
|
|
2017 |
|
|
2016 |
|
||
|
Indefinite Lived Intangibles: |
|
|
|
|
|
|
|
|
|
Trademarks |
|
$ |
2,500 |
|
|
$ |
2,500 |
|
|
Definite Lived Intangibles: |
|
|
|
|
|
|
|
|
|
Agent and customer relationships |
|
|
65,060 |
|
|
|
65,060 |
|
|
Customer contracts |
|
|
20,600 |
|
|
|
20,600 |
|
|
Less: accumulated amortization |
|
|
(56,901 |
) |
|
|
(50,971 |
) |
|
Intangible assets, net |
|
$ |
28,759 |
|
|
$ |
34,689 |
|
|
Total Identifiable Intangible Assets |
|
$ |
31,259 |
|
|
$ |
37,189 |
|
Estimated amortization expense by year is as follows (in thousands):
|
2018 |
|
$ |
2,474 |
|
|
2019 |
|
|
2,265 |
|
|
2020 |
|
|
1,970 |
|
|
2021 |
|
|
1,959 |
|
|
2022 |
|
|
1,826 |
|
|
Thereafter |
|
|
18,263 |
|
|
Total |
|
$ |
28,759 |
|
The amounts recorded for amortization expense were $6.0 million, $7.5 million, and $9.2 million for the years ended December 31, 2017, 2016 and 2015, respectively.
|
|
(j) |
Goodwill |
Goodwill represents the excess purchase price over the fair value of assets acquired in connection with the Company’s acquisitions. Under Financial Accounting Standards Board (“FASB”) Accounting Standards Codification, or ASC, Topic 350 “Intangibles – Goodwill and Other”, we are required to test goodwill for impairment annually (in our third fiscal quarter) or more frequently, whenever events occur or circumstances change that would more likely than not reduce the fair value of a reporting unit with goodwill below its carrying amount. We have the option to first assess qualitative factors such as current performance and overall economic conditions to determine whether or not it is necessary to perform a quantitative goodwill impairment test. If we choose that option, then we would not be required to perform a quantitative goodwill impairment test unless we determine that, based on a qualitative assessment, it is more likely than not that the fair value of a reporting unit is less than its carrying value. If we determine that it is more likely than not, or if we choose not to perform a qualitative assessment, we then proceed with the quantitative assessment. Under the quantitative test, if the fair value of a reporting unit exceeds its carrying amount, then goodwill of the reporting unit is considered to not be impaired. If the carrying amount of the reporting unit exceeds its fair value, then an impairment loss is recognized in an amount equal to the excess, up to the value of the goodwill. During the third quarter of 2017, we completed our goodwill impairment testing by performing a quantitative assessment. Based on the results of this test, no impairment loss was recognized.
At both December 31, 2017 and 2016, the carrying amount of goodwill was $74.5 million, of which $18.2 million was recorded in our transportation segment and $56.3 million in our logistics segment.
47
UNIVERSAL LOGISTICS HOLDINGS, INC.
Notes to Consolidated Financial Statements – (Continued)
December 31, 2017, 2016 and 2015
|
|
(k) |
Long-Lived Assets |
Long-lived assets, other than goodwill and indefinite lived intangibles such as property and equipment and purchased intangible assets subject to amortization are reviewed for impairment whenever events or changes in circumstances indicate that the carrying amount of an asset or group may not be recoverable. If circumstances require a long-lived asset to be tested for possible impairment, we first compare the undiscounted cash flows expected to be generated by a long-lived asset or group to its carrying value. If the carrying value of the long-lived asset or group is deemed to not be recoverable on an undiscounted cash flow basis, an impairment charge is recognized to the extent that the carrying value exceeds its fair value. Fair value is determined through various valuation techniques including discounted cash flow models, quoted market prices and independent third-party appraisals. Changes in management’s judgment relating to salvage values and/ or estimated useful lives could result in greater or lesser annual depreciation expense or impairment charges in the future. Indefinite lived intangibles are tested for impairment annually by comparing the carrying value of the assets to their fair value.
|
|
(l) |
Contingent Consideration |
Contingent consideration arrangements granted in connection with a business combination are evaluated to determine whether contingent consideration is, in substance, additional purchase price of an acquired enterprise or compensation for services, use of property or profit sharing. Additional purchase price is added to the fair value of consideration transferred in the business combination and compensation is included in operating expenses in the period it is incurred. Contingent consideration related to additional purchase price is measured to fair value at each reporting date until the contingency is resolved.
|
|
(m) |
Fair Value of Financial Instruments |
For cash equivalents, accounts receivables, accounts payable, and accrued expenses, the carrying amounts are reasonable estimates of fair value as the assets are readily redeemable or short‑term in nature and the liabilities are short-term in nature. Marketable securities, consisting of equity securities, are carried at fair market value as determined by quoted market prices. Our revolving credit and term loan agreements consist of variable rate borrowings. The carrying value of these borrowings approximates fair value because the applicable interest rates are adjusted frequently based on short-term market rates. For our equipment promissory notes, the fair values are estimated using discounted cash flow analyses, based on our current incremental borrowing rates for similar types of borrowing arrangements. See Note 6 “Fair Value Measurement and Disclosures” for further information.
|
|
(n) |
Deferred Compensation |
Deferred compensation relates to our bonus plans. Annual bonuses may be awarded to certain operating, sales and management personnel based on overall Company performance and achievement of specific employee or departmental objectives. Such bonuses are typically paid in annual installments over a five-year period. All bonus amounts earned by and due to employees in the current year are included in accrued expenses and other current liabilities. Those that are payable in subsequent years are included in other long-term liabilities.
48
UNIVERSAL LOGISTICS HOLDINGS, INC.
Notes to Consolidated Financial Statements – (Continued)
December 31, 2017, 2016 and 2015
|
|
(o) |
Closing Costs |
Our customers may discontinue or alter their business activity in a location earlier than anticipated, prompting us to exit a customer-dedicated facility. We recognize exit costs associated with operations that close or are identified for closure as an accrued liability in the Consolidated Balance Sheets. Such charges include lease termination costs, employee termination charges, asset impairment charges, and other exit-related costs associated with a plan approved by management. If we close an operating facility before its lease expires, costs to terminate a lease are recognized when an early termination provision is exercised, or we record a liability for non-cancellable lease obligations based on the fair value of remaining lease payments, reduced by any existing or prospective sublease rentals. Employee termination costs are recognized in the period that the closure is communicated to affected employees. The recognition of exit and disposal charges requires us to make certain assumptions and estimates as to the amount and timing of such charges. Subsequently, adjustments are made for changes in estimates in the period in which the change becomes known.
|
|
(p) |
Revenue and Related Expenses |
We are the primary obligor when rendering truckload, brokerage, intermodal, dedicated and value-added services, and assume the corresponding credit risk with customers. We have discretion in setting sales prices and, as a result, our earnings may vary. In addition, we have discretion to choose and negotiate terms with our multiple suppliers for the services ordered by our customers. This includes owner-operators with whom we contract to deliver our transportation services. As such, revenue and the related purchased transportation and commissions are recognized on a gross basis when persuasive evidence of an arrangement exists, delivery has occurred at the receiver’s location or for service arrangements after the related services have been rendered, the revenue and related expenses are fixed or determinable and collectability is reasonably assured. Fuel surcharges, where separately identifiable, of $59.5 million, $50.9 million and $75.7 million for the years ended December 31, 2017, 2016 and 2015, respectively, are included in operating revenues.
Revenues and associated costs for the sales of axles and machined components are recognized when title has passed and the risks and rewards of ownership are transferred, which is at the time of shipment.
Our customer contracts could involve multiple revenue-generating activities performed for the same customer. When several contracts are entered into with the same customer in a short period of time, we evaluate whether these contracts should be considered as a single, multiple element contract for revenue recognition purposes. Criteria we consider that may result in the aggregation of contracts include whether such contracts are actually entered into within a short period of time, whether services in multiple contracts are interrelated, or if the negotiation and terms of one contract show or include consideration for another contract or contracts. Our current contracts have not been required to be aggregated, as they are negotiated independently on a standalone basis. Our customers typically choose their vendor and award business at the conclusion of a competitive bidding process for each service. As a result, although we evaluate customer purchase orders and agreements for multiple elements and aggregation of individual contracts into a multiple element arrangement, our current contracts do not meet the criteria required for multiple element contract accounting.
We adopted Accounting Standards Update (“ASU”) 2014-09 effective as of January 1, 2018, as further described in Note 17 “Recent Accounting Pronouncements”. The adoption of this standard will change the timing of revenue recognition for our transportation services businesses, which include truckload, brokerage, intermodal and dedicated services, from at delivery to over-time as the performance obligations on the in-transit services are completed. For our value-added service businesses, the adoption of the standard will not change the timing of revenue recognition.
49
UNIVERSAL LOGISTICS HOLDINGS, INC.
Notes to Consolidated Financial Statements – (Continued)
December 31, 2017, 2016 and 2015
(1)Summary of Significant Accounting Policies—continued
|
|
(q) |
Insurance & Claims |
Insurance and claims expense represents charges for premiums and the accruals made for claims within our self-insured retention amounts. The accruals are primarily related to auto liability, general liability, cargo and equipment damage, and service failure claims. A liability is recognized for the estimated cost of all self-insured claims including an estimate of incurred but not reported claims based on historical experience and for claims expected to exceed our policy limits. We may also make accruals for personal injury and property damage to third parties, and workers’ compensation claims if a claim exceeds our insurance coverage. Such accruals are based upon individual cases and estimates of ultimate losses, incurred but not reported losses, and losses arising from known claims ultimately settling in excess of insurance coverage using loss development factors based upon industry data and past experience. Since the reported accrual is an estimate, the ultimate liability may be materially different from the amount recorded.
If adjustments to previously established accruals are required, such amounts are included in operating expenses in the current period. We maintain insurance with licensed insurance carriers. Legal expenses related to auto liability claims are covered under our insurance policy. We are responsible for all other legal expenses related to claims.
In brokerage arrangements, our exposure to liability associated with accidents incurred by other third-party carriers, who haul freight on our behalf, is reduced by various factors including the extent to which the third party providers maintain their own insurance coverage.
Our insurance expense varies primarily based upon the frequency and severity of our accident experience, insurance rates, coverage limits, and self-insured retention amounts.
|
|
(r) |
Stock Based Compensation |
We record compensation expense for the grant of stock based awards. Compensation expense is measured at the grant date, based on the calculated fair value of the award, and recognized as an expense over the requisite service period (generally the vesting period of the grant). See Note 12 “Stock Based Compensation” for further information.
|
|
(s) |
Income Taxes |
Deferred income taxes are provided for temporary differences between the carrying amounts of assets and liabilities for financial reporting purposes and the amounts used for income tax purposes. Deferred tax assets and liabilities are measured using enacted tax rates expected to apply to taxable income in the years in which those temporary differences are expected to be recovered or settled. The effect on deferred tax assets and liabilities of a change in tax rates is recognized in income in the period that includes the enactment date. See Note 8 “Income Taxes” for further information on the impact of the Tax Cuts and Jobs Act (the “Tax Cuts and Jobs Act”) signed into law on December 22, 2017.
We are no longer subject to U.S. federal income tax examinations by tax authorities for years before 2013. In addition, we file income tax returns in various state, local and foreign jurisdictions. Historically, we have been responsible for filing separate state, local and foreign income tax returns for our self and our subsidiaries. We are no longer subject to state or foreign jurisdiction income tax examinations for years before 2012 and 2011, respectively.
We recognize the effect of income tax positions only if those positions are more likely than not of being sustained. Recognized income tax positions are measured at the largest amount that is greater than 50% likely of being realized. Changes in recognition or measurement are reflected in the period in which the change in judgment occurs. We recognize interest related to unrecognized tax benefits in income tax expense and penalties in other operating expenses.
|
|
(t) |
Foreign Currency Translation |
The financial statements of the Company’s subsidiaries operating in Mexico, Canada and Colombia are prepared to conform to U.S. GAAP and translated into U.S. Dollars by applying a current exchange rate. The local currency has been determined to be the functional currency. Items appearing in the Consolidated Statements of Income are translated using average exchange rates during each period. Assets and liabilities of international operations are translated at period-end exchange rates. Translation gains and losses are reported in accumulated other comprehensive income (loss) as a component of shareholders’ equity.
50
UNIVERSAL LOGISTICS HOLDINGS, INC.
Notes to Consolidated Financial Statements – (Continued)
December 31, 2017, 2016 and 2015
|
|
(u) |
Segment Information |
We report our financial results in two reportable segments, the transportation segment and the logistics segment, based on the nature of the underlying customer commitment and the types of investments required to support these commitments. This presentation reflects the manner in which management evaluates our operating segments, including an evaluation of economic characteristics and applicable aggregation criteria.
Operations aggregated in our transportation segment are associated with individual freight shipments coordinated by our agents, company-managed terminals and specialized services operations. In contrast, operations aggregated in our logistics segment deliver value-added services or transportation services to specific customers on a dedicated basis, generally pursuant to contract terms of one year or longer. Other non-reportable operating segments are comprised of the Company’s subsidiaries that provide support services to other subsidiaries and to owner-operators, including shop maintenance and equipment leasing.
|
|
(v) |
Concentrations of Credit Risk |
Financial instruments, which potentially subject us to concentrations of credit risk, consist principally of cash and cash equivalents, marketable securities and accounts receivable. We maintain our cash and cash equivalents and marketable securities with high quality financial institutions. We perform ongoing credit evaluations of our customers and generally do not require collateral. Our customers are generally concentrated in the automotive, wind energy, building materials, machinery and metals industries. During the fiscal years ended December 31, 2017, 2016 and 2015, aggregate sales in the automotive industry totaled 40%, 43% and 37% of revenue, respectively. In 2017, 2016 and 2015, General Motors accounted for approximately 16%, 18% and 11% of our total operating revenues, respectively. In 2017, sales to our top 10 customers, including General Motors, totaled 40%.
51
UNIVERSAL LOGISTICS HOLDINGS, INC.
Notes to Consolidated Financial Statements – (Continued)
December 31, 2017, 2016 and 2015
Accounts receivable amounts appearing in the consolidated financial statements include both billed and unbilled receivables. We bill customers in accordance with contract terms, which may result in a brief timing difference between when revenue is recognized and when invoices are rendered. Unbilled receivables, which usually are billed within one month, totaled $26.2 million and $16.4 million at December 31, 2017 and 2016, respectively.
Accounts receivable are presented net of an allowance for doubtful accounts. Following is a summary of the activity in the allowance for doubtful accounts for the years ended December 31 (in thousands):
|
|
|
2017 |
|
|
2016 |
|
|
2015 |
|
|||
|
Balance at beginning of year |
|
$ |
1,613 |
|
|
$ |
5,173 |
|
|
$ |
5,207 |
|
|
Provision for doubtful accounts |
|
|
1,533 |
|
|
|
3,099 |
|
|
|
3,004 |
|
|
Uncollectible accounts written off |
|
|
(1,816 |
) |
|
|
(6,659 |
) |
|
|
(3,038 |
) |
|
Balance at end of year |
|
$ |
1,330 |
|
|
$ |
1,613 |
|
|
$ |
5,173 |
|
|
(3) |
Property and Equipment |
Property and equipment at December 31 consists of the following (in thousands):
|
|
|
2017 |
|
|
2016 |
|
||
|
Transportation equipment |
|
$ |
236,667 |
|
|
$ |
214,046 |
|
|
Land, buildings and related assets |
|
|
102,977 |
|
|
|
96,549 |
|
|
Other operating assets |
|
|
105,434 |
|
|
|
77,252 |
|
|
Information technology equipment |
|
|
23,985 |
|
|
|
19,520 |
|
|
Construction in process |
|
|
3,903 |
|
|
|
20,204 |
|
|
|
|
|
472,966 |
|
|
|
427,571 |
|
|
Less accumulated depreciation |
|
|
(205,771 |
) |
|
|
(181,294 |
) |
|
Total |
|
$ |
267,195 |
|
|
$ |
246,277 |
|
|
(4) |
Accrued Expenses and Other Current Liabilities |
Accrued expenses consist of the following items at December 31 (in thousands):
|
|
|
2017 |
|
|
2016 |
|
||
|
Payroll related items |
|
$ |
9,854 |
|
|
$ |
8,379 |
|
|
Driver escrow liabilities |
|
|
8,071 |
|
|
|
7,601 |
|
|
Commissions, taxes and other |
|
|
6,204 |
|
|
|
3,785 |
|
|
Total |
|
$ |
24,129 |
|
|
$ |
19,765 |
|
52
UNIVERSAL LOGISTICS HOLDINGS, INC.
Notes to Consolidated Financial Statements – (Continued)
December 31, 2017, 2016 and 2015
Debt is comprised of the following (in thousands):
|
|
|
Interest Rates at |
|
|
December 31, |
|
||||||
|
|
|
December 31, 2017 |
|
|
2017 |
|
|
2016 |
|
|||
|
Outstanding Debt: |
|
|
|
|
|
|
|
|
|
|
|
|
|
ABL Facility (1) |
|
2.86% to 5.00% |
|
|
$ |
70,225 |
|
|
$ |
71,600 |
|
|
|
Westport Facility (2) |
|
|
|
|
|
|
|
|
|
|
|
|
|
Term Loan |
|
4.36% |
|
|
|
22,500 |
|
|
|
34,000 |
|
|
|
Revolver |
|
NA |
|
|
|
— |
|
|
|
3,000 |
|
|
|
Equipment Financing (3) |
|
3.18% to 4.22% |
|
|
|
112,205 |
|
|
|
104,607 |
|
|
|
Real Estate Financing (4) |
|
3.82% |
|
|
|
44,309 |
|
|
|
49,643 |
|
|
|
Margin Facility (5) |
|
NA |
|
|
|
— |
|
|
|
— |
|
|
|
Unamortized debt issuance costs |
|
|
|
|
|
|
(1,261 |
) |
|
|
(1,583 |
) |
|
|
|
|
|
|
|
|
247,978 |
|
|
|
261,267 |
|
|
Less current portion of long-term debt |
|
|
|
|
|
|
40,870 |
|
|
|
34,455 |
|
|
Total long-term debt, net of current portion |
|
|
|
|
|
$ |
207,108 |
|
|
$ |
226,812 |
|
(1) The ABL Facility provides for maximum borrowings of $120 million at a variable rate of interest based on LIBOR or a base rate, and matures on December 23, 2020. The facility, which is secured by cash, deposits and accounts receivable of the borrowing subsidiaries, includes customary affirmative and negative covenants and events of default, as well as financial covenants requiring a minimum fixed charge coverage ratio to be maintained after a triggering event. Interest on base rate advances is payable quarterly, and interest on each LIBOR-based advance is payable on the last day of the applicable interest period. At December 31, 2017, we were in compliance with all covenants under the Facility, and $32.0 million was available for borrowing.
(2) The Westport Facility provides our subsidiary, Westport Axle Corporation, with maximum borrowings of $60 million in the form of a $40 million term loan and a $20 million revolver. Borrowings under the Westport Facility, which matures on December 23, 2020, accrue interest at a variable interest rate based on LIBOR or a base rate, and are secured by all of Westport’s assets. The Company becomes a guarantor upon the occurrence of certain events specified in the Westport Facility. Borrowings are repaid in part quarterly with the balance due at maturity. Interest on base rate advances is payable quarterly, and interest on each LIBOR-based advance is payable on the last day of the applicable interest period. The Westport Facility includes customary affirmative and negative covenants and events of default. At December 31, 2017, we were in compliance with all covenants, and $10.5 million was available for borrowing.
(3) The Equipment Financing consists of a series of promissory notes issued by a wholly-owned subsidiary in order to finance transportation equipment. The equipment notes, which are secured by liens on selected titled vehicles, include certain affirmative and negative covenants and are generally payable in 60 monthly installments and bear interest at fixed rates ranging from 3.18% to 4.22%. At December 31, 2017, we were in compliance with all covenants.
53
UNIVERSAL LOGISTICS HOLDINGS, INC.
Notes to Consolidated Financial Statements – (Continued)
December 31, 2017, 2016 and 2015
(4) The Real Estate Financing consists of a series of promissory notes issued by a wholly-owned subsidiary in order to finance certain real property. The promissory notes, which are secured by first mortgages and assignment of leases on specific parcels of real estate and improvements, include certain affirmative and negative covenants and are generally payable in 120 monthly installments. Each of the notes bears interest at LIBOR plus 2.25%. At December 31, 2017, we were in compliance with all covenants.
(5) The Margin Facility is a short-term line of credit secured by our portfolio of marketable securities. It bears interest at LIBOR plus 1.10%. The amount available under the line of credit is based on a percentage of the market value of the underlying securities. We did not have any amounts outstanding under our line of credit at December 31, 2017 or 2016, and the maximum available borrowings under the line of credit were $8.9 million and $7.0 million, respectively.
The following table reflects the maturities of our principal repayment obligations as of December 31, 2017 (in thousands):
|
Years Ending December 31 |
|
ABL Facility |
|
|
Westport Facility - Term Loan |
|
|
Westport Facility - Revolver |
|
|
Equipment Financing |
|
|
Real Estate Financing |
|
|
Total |
|
||||||
|
2018 |
|
$ |
— |
|
|
$ |
6,000 |
|
|
$ |
— |
|
|
$ |
30,188 |
|
|
$ |
5,017 |
|
|
$ |
41,205 |
|
|
2019 |
|
|
— |
|
|
|
6,000 |
|
|
|
— |
|
|
|
31,293 |
|
|
|
5,176 |
|
|
|
42,469 |
|
|
2020 |
|
|
70,225 |
|
|
|
10,500 |
|
|
|
— |
|
|
|
32,313 |
|
|
|
5,176 |
|
|
|
118,214 |
|
|
2021 |
|
|
— |
|
|
|
— |
|
|
|
— |
|
|
|
12,909 |
|
|
|
5,176 |
|
|
|
18,085 |
|
|
2022 |
|
|
— |
|
|
|
— |
|
|
|
— |
|
|
|
5,502 |
|
|
|
5,175 |
|
|
|
10,677 |
|
|
Thereafter |
|
|
— |
|
|
|
— |
|
|
|
— |
|
|
|
— |
|
|
|
18,589 |
|
|
|
18,589 |
|
|
Total |
|
$ |
70,225 |
|
|
$ |
22,500 |
|
|
$ |
— |
|
|
$ |
112,205 |
|
|
$ |
44,309 |
|
|
$ |
249,239 |
|
The Company is also party to three interest rate swap agreements that qualify for hedge accounting. The swap agreements were executed to fix a portion of the interest rates on its variable rate debt that have a combined notional amount of $27.7 million at December 31, 2017. Under two of the swap agreements, the Company receives interest at the one-month LIBOR rate plus 2.25%, and pays a fixed rate. The March 2016 swap (swap A) became effective October 2016, has a rate of 4.16% (amortizing notional amount of $10.0 million) and expires July 2026, and an additional March 2016 swap (swap B) became effective October 2016, has a rate of 3.83% (amortizing notional amount of $5.7 million) and expires May 2022. The third interest rate swap agreement (swap C) has a notional amount of $12.0 million and expired February 2018. Under swap C, the Company receives interest at the one-month LIBOR rate, and pays a fixed rate of 0.78%. At December 31, 2017, the fair value of the three swap agreements was an asset of $0.3 million. Since these swap agreements qualify for hedge accounting, the changes in fair value are recorded in other comprehensive income (loss), net of tax. See Note 6, “Fair Value Measurement and Disclosures” for additional information pertaining to interest rate swaps.
|
(6) |
Fair Value Measurement and Disclosures |
ASC Topic 820, “Fair Value Measurements and Disclosures”, defines fair value as the exchange price that would be received for an asset or paid to transfer a liability in the principal or most advantageous market for the asset or liability in an orderly transaction between market participants at the measurement date and expanded disclosures with respect to fair value measurements.
ASC Topic 820 also establishes a three-level fair value hierarchy that prioritizes the inputs used to measure fair value. This hierarchy requires entities to maximize the use of observable inputs and minimize the use of unobservable inputs. The three levels of inputs used to measure fair value are as follows:
|
|
• |
Level 1 — Quoted prices in active markets for identical assets or liabilities. |
|
|
• |
Level 2 — Observable inputs other than quoted prices included in Level 1, such as quoted prices for similar assets and liabilities in active markets; quoted prices for identical or similar assets and liabilities in markets that are not active; or other inputs that are observable or can be corroborated by observable market data. |
|
|
• |
Level 3 — Unobservable inputs that are supported by little or no market activity and that are significant to the fair value of the assets or liabilities. This includes certain pricing models, discounted cash flow methodologies and similar techniques that use significant unobservable inputs. |
54
UNIVERSAL LOGISTICS HOLDINGS, INC.
Notes to Consolidated Financial Statements – (Continued)
December 31, 2017, 2016 and 2015
We have segregated all financial assets that are measured at fair value on a recurring basis into the most appropriate level within the fair value hierarchy based on the inputs used to determine the fair value at the measurement date in the tables below (in thousands):
|
|
|
December 31, 2017 |
|
|||||||||||||
|
|
|
Level 1 |
|
|
Level 2 |
|
|
Level 3 |
|
|
Fair Value Measurement |
|
||||
|
Assets |
|
|
|
|
|
|
|
|
|
|
|
|
|
|
|
|
|
Cash equivalents |
|
$ |
75 |
|
|
$ |
— |
|
|
$ |
— |
|
|
$ |
75 |
|
|
Marketable securities |
|
|
15,144 |
|
|
|
— |
|
|
|
— |
|
|
|
15,144 |
|
|
Interest rate swaps |
|
|
— |
|
|
|
260 |
|
|
|
— |
|
|
|
260 |
|
|
Total Assets |
|
$ |
15,219 |
|
|
$ |
260 |
|
|
$ |
— |
|
|
$ |
15,479 |
|
|
|
|
December 31, 2016 |
|
|||||||||||||
|
|
|
Level 1 |
|
|
Level 2 |
|
|
Level 3 |
|
|
Fair Value Measurement |
|
||||
|
Assets |
|
|
|
|
|
|
|
|
|
|
|
|
|
|
|
|
|
Cash equivalents |
|
$ |
4 |
|
|
$ |
— |
|
|
$ |
— |
|
|
$ |
4 |
|
|
Marketable securities |
|
|
14,359 |
|
|
|
— |
|
|
|
— |
|
|
$ |
14,359 |
|
|
Interest rate swaps |
|
|
— |
|
|
|
161 |
|
|
|
— |
|
|
|
161 |
|
|
Total Assets |
|
$ |
14,363 |
|
|
$ |
161 |
|
|
$ |
— |
|
|
$ |
14,524 |
|
The valuation techniques used to measure fair value for the items in the tables above are as follows:
|
|
• |
Cash equivalents – This category consists of money market funds which are listed as Level 1 assets and measured at fair value based on quoted prices for identical instruments in active markets. |
|
|
• |
Marketable securities – Marketable securities represent equity securities, which consist of common and preferred stocks, are actively traded on public exchanges and are listed as Level 1 assets. Fair value was measured based on quoted prices for these securities in active markets. |
|
|
• |
Interest rate swaps - The fair value of our interest rate swaps, as provided by a third party service provider, is determined using a methodology of netting the discounted future fixed cash payments (or receipts) and the discounted expected variable cash receipts (or payments). The variable cash receipts (or payments) are based on the expectation of future interest rates (forward curves) derived from observed market interest rate curves. The fair value measurement also incorporates credit valuation adjustments reflecting both the Company’s nonperformance risk and the respective counterparty’s nonperformance risk. |
Our revolving credit and term loan agreements and our real estate promissory notes all consists of variable rate borrowings. We categorize borrowings under these credit agreements as Level 2 in the fair value hierarchy. The carrying value of these borrowings approximate fair value because the applicable interest rates are adjusted frequently based on short-term market rates.
For our equipment promissory notes with fixed rates, the fair values are estimated using discounted cash flow analyses, based on our current incremental borrowing rates for similar types of borrowing arrangements. We categorize borrowings under this credit agreement as Level 2 in the fair value hierarchy. The carrying values and estimated fair values of these promissory notes at December 31, 2017 is summarized as follows:
|
|
|
2017 |
|
|||||
|
|
|
Carrying Value |
|
|
Estimated Fair Value |
|
||
|
Equipment promissory notes |
|
$ |
112,205 |
|
|
$ |
112,115 |
|
We have not elected the fair value option for any of our financial instruments.
55
UNIVERSAL LOGISTICS HOLDINGS, INC.
Notes to Consolidated Financial Statements – (Continued)
December 31, 2017, 2016 and 2015
CenTra, Inc., an affiliate of the Company, provides administrative support services to Universal in the ordinary course of business, including legal, human resources, tax, and IT infrastructure and related services. The cost of these services is based on the actual or estimated utilization of the specific service.
Universal also purchases other services from affiliates. Following is a schedule of cost incurred and included in operating expenses for services provided by affiliates for the years ended December 31 (in thousands):
|
|
|
2017 |
|
|
2016 |
|
|
2015 |
|
|||
|
Administrative support services |
|
$ |
2,771 |
|
|
$ |
2,638 |
|
|
$ |
3,234 |
|
|
Truck fuel, tolls and maintenance |
|
|
2,652 |
|
|
|
2,656 |
|
|
|
2,523 |
|
|
Real estate rent and related costs |
|
|
17,046 |
|
|
|
17,174 |
|
|
|
13,174 |
|
|
Insurance and employee benefit plans |
|
|
55,995 |
|
|
|
44,548 |
|
|
|
46,173 |
|
|
Contracted transportation services |
|
|
35 |
|
|
|
233 |
|
|
|
969 |
|
|
Total |
|
$ |
78,499 |
|
|
$ |
67,249 |
|
|
$ |
66,073 |
|
We pay CenTra the direct variable cost of maintenance, fueling and other operational support costs for services delivered at our affiliate’s trucking terminals that are geographically remote from our own facilities. Such costs are billed when incurred, paid on a routine basis, and reflect actual labor utilization, repair parts costs or quantities of fuel purchased. In connection with our transportation services, we also pay tolls and other fees for international bridge crossings to certain related entities which are under common control with CenTra.
A significant number of our operating locations are located in facilities leased from affiliates. At 36 facilities, occupancy is based on either month-to-month or contractual, multi-year lease arrangements which are billed and paid monthly. Leasing properties provided by an affiliate that owns a substantial commercial property portfolio affords us significant operating flexibility. However, we are not limited to such arrangements. See Note 9, “Leases” for further information regarding the cost of leased properties.
We purchase workers’ compensation, property and casualty, cargo, warehousing and other general liability insurance from an insurance company controlled by our majority shareholders. Our employee health care benefits and 401(k) programs are also provided by this affiliate.
Other services from affiliates, including contracted transportation services, are delivered to us on a per-transaction-basis or pursuant to separate contractual arrangements provided in the ordinary course of business. At December 31, 2017 and 2016, amounts due to affiliates were $12.0 million and $4.6 million, respectively. In our Consolidated Balance Sheets, we record our insured claims liability and the related recovery from an affiliate insurance provider in insurance and claims, and other receivables. At December 31, 2017 and 2016, there were $10.1 million and $8.7 million, respectively, included in each of these accounts for insured claims.
During 2016 and 2017, we made purchases totaling $2.3 million and $2.1 million, respectively, for wheels and tires for new trailering equipment. We also purchased 64 used tractors from an affiliate in 2017 for $1.8 million. In 2016, we contracted with an affiliate to provide real property improvements to us totaling $1.0 million, and purchased an additional $0.2 million in revenue equipment components during the same period.
We periodically use the law firm of Sullivan Hincks & Conway to provide legal services. Daniel C. Sullivan, a member of our Board, is a partner at Sullivan Hincks & Conway. Not included in the table above are amounts paid for legal services during 2017 and 2015 of $1,400 and $1,500, respectively. No amounts were paid for legal services during 2016.
During 2017, we exercised our right of first refusal to acquire 17,500 shares of restricted stock from a director, H. E. “Scott” Wolfe, for $385,000 based on the closing market price on the effective date of the transaction.
In 2016, we purchased a multi-building, cross-dock logistics terminal located in Romulus, Michigan from a subsidiary of CenTra, Crown Enterprises, Inc. The purchase price, which was established by an independent third party appraisal, was $22.5 million payable pursuant to a promissory note issued to Crown. At December 31, 2016, the promissory note was fully repaid.
56
UNIVERSAL LOGISTICS HOLDINGS, INC.
Notes to Consolidated Financial Statements – (Continued)
December 31, 2017, 2016 and 2015
Services provided by Universal to Affiliates
We periodically assist our affiliates by providing selected transportation and logistics services in connection with their specific customer contracts or purchase orders. Truck fueling and administrative expenses are presented net in operating expense. Following is a schedule of services provided to CenTra and affiliates for the years ended December 31 (in thousands):
|
|
|
2017 |
|
|
2016 |
|
|
2015 |
|
|||
|
Purchased transportation and equipment rent |
|
$ |
1,100 |
|
|
$ |
1,090 |
|
|
$ |
400 |
|
|
Fueling, maintenance and other support services |
|
|
— |
|
|
|
— |
|
|
|
158 |
|
|
Total |
|
$ |
1,100 |
|
|
$ |
1,090 |
|
|
$ |
558 |
|
At December 31, 2017 and 2016, amounts due from affiliates were $2.7 million and $2.5 million, respectively.
|
(8) |
Income Taxes |
A summary of income (loss) related to U.S. and non-U.S. operations are as follows (in thousands):
|
|
|
Year Ended December 31, |
|
|||||||||
|
|
|
2017 |
|
|
2016 |
|
|
2015 |
|
|||
|
Operations |
|
|
|
|
|
|
|
|
|
|
|
|
|
U.S. Domestic |
|
$ |
28,360 |
|
|
$ |
40,172 |
|
|
$ |
62,781 |
|
|
Foreign |
|
|
(11,219 |
) |
|
|
(767 |
) |
|
|
2,224 |
|
|
Total pre-tax income |
|
$ |
17,141 |
|
|
$ |
39,405 |
|
|
$ |
65,005 |
|
The provision (benefit) for income taxes attributable to income from continuing operations for the years ended December 31 consists of the following (in thousands):
|
|
|
2017 |
|
|
2016 |
|
|
2015 |
|
|||
|
Current: |
|
|
|
|
|
|
|
|
|
|
|
|
|
U.S. Federal |
|
$ |
5,394 |
|
|
$ |
7,432 |
|
|
$ |
19,544 |
|
|
State |
|
|
2,227 |
|
|
|
748 |
|
|
|
4,469 |
|
|
Foreign |
|
|
688 |
|
|
|
284 |
|
|
|
449 |
|
|
|
|
|
8,309 |
|
|
|
8,464 |
|
|
|
24,462 |
|
|
Deferred: |
|
|
|
|
|
|
|
|
|
|
|
|
|
U.S. Federal |
|
|
(14,264 |
) |
|
|
6,521 |
|
|
|
1,183 |
|
|
State |
|
|
(1,113 |
) |
|
|
140 |
|
|
|
(730 |
) |
|
Foreign |
|
|
(3,944 |
) |
|
|
36 |
|
|
|
89 |
|
|
|
|
|
(19,321 |
) |
|
|
6,697 |
|
|
|
542 |
|
|
Total |
|
$ |
(11,012 |
) |
|
$ |
15,161 |
|
|
$ |
25,004 |
|
On December 22, 2017, the Tax Cuts and Jobs Act was signed into law, significantly changing the U.S. tax code by providing for, among other things, lower corporate income tax rates and requiring companies to pay a one-time transition tax on deemed repatriated earnings of foreign subsidiaries. Effective January 1, 2018, the Tax Cuts and Jobs Act permanently reduced the U.S. corporate income tax rate from 35% to 21%. In accordance with U.S. GAAP, the reduction in the enacted rate caused the Company to revalue its ending net deferred tax assets and liabilities and caused the Company to record a provisional tax benefit of $18.2 million in its consolidated financial statements for the year ended December 31, 2017. With respect to the transition tax on deemed repatriated foreign earnings, the Company determined that, based upon information currently available, the transition tax did not have a material impact on its results of operations, financial position or cash flows.
57
UNIVERSAL LOGISTICS HOLDINGS, INC.
Notes to Consolidated Financial Statements – (Continued)
December 31, 2017, 2016 and 2015
On December 22, 2017, the SEC issued Staff Accounting Bulletin No. 118 (“SAB 118”). SAB 118 provides guidance on the accounting for the tax effect of the Tax Cuts and Jobs Act in situations when a company does not have all necessary information available, prepared, or analyzed in reasonable detail to complete the accounting for certain income tax effects of the Tax Cuts and Jobs Act. SAB 118 allows for a measurement period not to exceed one year from the enactment of the Tax Cuts and Jobs Act for companies to complete their analysis. The Company recognized the provisional impact related to the revaluation of deferred tax assets and liabilities in its December 31, 2017 consolidated financial statements and determined that there was no material impact from the transition tax; however, the ultimate impact may differ materially due to additional analysis, changes in interpretations and assumptions, or additional regulatory guidance that may be issued.
Deferred income tax assets and liabilities at December 31 consist of the following (in thousands):
|
|
|
2017 |
|
|
2016 |
|
||
|
Domestic deferred tax assets: |
|
|
|
|
|
|
|
|
|
Allowance for doubtful accounts |
|
$ |
323 |
|
|
$ |
633 |
|
|
Other assets |
|
|
2,694 |
|
|
|
2,792 |
|
|
Accrued expenses |
|
|
6,622 |
|
|
|
5,384 |
|
|
Total domestic deferred tax assets |
|
$ |
9,639 |
|
|
$ |
8,809 |
|
|
Domestic deferred tax liabilities: |
|
|
|
|
|
|
|
|
|
Prepaid expenses |
|
$ |
1,002 |
|
|
$ |
144 |
|
|
Marketable securities |
|
|
1,153 |
|
|
|
1,613 |
|
|
Intangible assets |
|
|
7,894 |
|
|
|
13,341 |
|
|
Property and equipment |
|
|
31,951 |
|
|
|
41,530 |
|
|
Total domestic deferred tax liabilities |
|
$ |
42,000 |
|
|
$ |
56,628 |
|
|
Net domestic deferred tax liabilities |
|
$ |
32,361 |
|
|
$ |
47,819 |
|
|
Foreign deferred tax assets |
|
|
|
|
|
|
|
|
|
Net operating losses |
|
$ |
3,636 |
|
|
$ |
407 |
|
|
Other assets |
|
|
928 |
|
|
|
164 |
|
|
Valuation allowance - foreign |
|
|
(410 |
) |
|
|
(407 |
) |
|
Total foreign deferred tax asset |
|
$ |
4,154 |
|
|
$ |
164 |
|
|
Net deferred tax liability |
|
$ |
28,207 |
|
|
$ |
47,655 |
|
|
|
|
|
|
|
|
|
|
|
In assessing whether deferred tax assets may be realized in the future, management considers whether it is more likely than not that some portion of such tax assets will not be realized. The deferred tax assets and liabilities were reviewed separately by jurisdictions when measuring the need for valuation allowances. The ultimate realization of deferred tax assets is dependent upon the generation of future taxable income (both ordinary income and taxable capital gains) during the periods in which those temporary differences reverse. Management considers the scheduled reversal of deferred tax liabilities, projected future taxable income, and tax planning strategies in making this assessment. Valuation allowances are established when necessary to reduce deferred tax assets when it is more likely than not that a portion or all of the deferred tax assets will not be realized. Based upon the level of historical taxable income, reversal of existing taxable temporary differences, projections for future taxable income over the periods in which the domestic deferred tax assets are expected to reverse, and our ability to generate future capital gains, management believes it is more likely than not that we will realize the benefits of these deductible differences. Thus, no valuation allowance has been established for the domestic deferred tax assets. We had foreign net operating loss carryforward associated with our Mexican subsidiary with a tax effect of $3.2 million as of December 31, 2017. The net operating loss carryforward will expire in 2027. Although realization is not assured, the Company has concluded that it is more likely than not that the deferred tax asset will be fully realized and as such no valuation allowance has been provided. At December 31, 2017, we had foreign net operating loss carryforward associated with our German subsidiary with a tax effect of $0.4 million. Based on the anticipated earnings projections, management has recorded a full valuation allowance for the deferred tax assets associated with this entity.
58
UNIVERSAL LOGISTICS HOLDINGS, INC.
Notes to Consolidated Financial Statements – (Continued)
December 31, 2017, 2016 and 2015
Income tax expense attributable to income from continuing operations differs from the statutory rates as follows:
|
|
|
2017 |
|
|
2016 |
|
|
2015 |
|
|||
|
Federal statutory rate |
|
|
35 |
% |
|
|
35 |
% |
|
|
35 |
% |
|
Change in tax law |
|
|
-106 |
% |
|
|
0 |
% |
|
|
0 |
% |
|
Non-deductible expense |
|
|
2 |
% |
|
|
0 |
% |
|
|
0 |
% |
|
State, net of federal benefit |
|
|
4 |
% |
|
|
2 |
% |
|
|
4 |
% |
|
Foreign |
|
|
1 |
% |
|
|
1 |
% |
|
|
-1 |
% |
|
Effective tax rate |
|
|
-64 |
% |
|
|
38 |
% |
|
|
38 |
% |
As of December 31, 2017, the total amount of unrecognized tax benefit representing uncertainty in certain tax positions was $0.4 million. These uncertain tax positions are based on recognition thresholds and measurement attributes for the financial statement recognition and measurements of a tax position taken or expected to be taken in a tax return. Any prospective adjustments to our accrual for uncertain tax positions will be recorded as an increase or decrease to the provision for income taxes and would impact our effective tax rate. At December 31, 2017, there are no positions for which it is reasonably possible that the total amounts of unrecognized tax benefits would significantly increase or decrease within 12 months. As of December 31, 2017, the amount of accrued interest and penalties was $0.1 million and $0.1 million, respectively.
The changes in our gross unrecognized tax benefits during the years ended December 31 are as follows (in thousands):
|
|
|
2017 |
|
|
2016 |
|
|
2015 |
|
|||
|
Unrecognized tax benefit – beginning of year |
|
$ |
416 |
|
|
$ |
333 |
|
|
$ |
414 |
|
|
Increases related to prior year tax positions |
|
|
22 |
|
|
|
24 |
|
|
|
42 |
|
|
Increases related to current year tax positions |
|
|
9 |
|
|
|
95 |
|
|
|
6 |
|
|
Decreases related to prior year tax positions |
|
|
(80 |
) |
|
|
(36 |
) |
|
|
(129 |
) |
|
Unrecognized tax benefit – end of year |
|
$ |
367 |
|
|
$ |
416 |
|
|
$ |
333 |
|
|
(9) |
Leases |
We lease office space, warehouses, freight distribution centers, terminal yards and equipment under non-cancelable operating lease arrangements. Except where we deliver services within facilities provided by our customers, we lease warehouse and freight distribution centers used in our logistics operations, often in connection with a specific customer program. Where facilities are substantially dedicated to a single customer and our lease is with an independent property owner, we attempt to align lease terms with the expected duration of the underlying customer program.
In most cases, we expect our facility leases will be renewed or replaced by other leases in the ordinary course of business. Where possible, we contractually secure the recovery of certain occupancy costs, including rent, during the term of a customer program. Future minimum rental payments pursuant to leases that have an initial or remaining non-cancelable lease term in excess of one year as of December 31, 2017 are as follows (in thousands):
|
Years Ending December 31 |
|
With Affiliates |
|
|
With Third Parties |
|
|
Total |
|
|||
|
2018 |
|
$ |
12,800 |
|
|
$ |
10,108 |
|
|
$ |
22,908 |
|
|
2019 |
|
|
9,578 |
|
|
|
8,534 |
|
|
|
18,112 |
|
|
2020 |
|
|
6,826 |
|
|
|
3,276 |
|
|
|
10,102 |
|
|
2021 |
|
|
5,480 |
|
|
|
511 |
|
|
|
5,991 |
|
|
2022 |
|
|
3,919 |
|
|
|
— |
|
|
|
3,919 |
|
|
Thereafter |
|
|
10,815 |
|
|
|
— |
|
|
|
10,815 |
|
|
Total required payments |
|
$ |
49,418 |
|
|
$ |
22,429 |
|
|
$ |
71,847 |
|
Rental expense for facilities, vehicles and other equipment leased from third parties under operating leases approximated $17.9 million, $20.2 million and $19.2 million for the years ended December 31, 2017, 2016 and 2015.
59
UNIVERSAL LOGISTICS HOLDINGS, INC.
Notes to Consolidated Financial Statements – (Continued)
December 31, 2017, 2016 and 2015
Comprehensive income includes the following for the years ended December 31 (in thousands):
|
|
|
2017 |
|
|
2016 |
|
|
2015 |
|
|||
|
Unrealized holding (losses) gains on available-for-sale securities arising during the period: |
|
|
|
|
|
|
|
|
|
|
|
|
|
Gross amount |
|
$ |
1,645 |
|
|
$ |
1,787 |
|
|
$ |
(1,597 |
) |
|
Income tax (expense) benefit |
|
|
38 |
|
|
|
(645 |
) |
|
|
582 |
|
|
Net of tax amount |
|
$ |
1,683 |
|
|
$ |
1,142 |
|
|
$ |
(1,015 |
) |
|
Realized (gains) on available-for-sale securities reclassified into income: |
|
|
|
|
|
|
|
|
|
|
|
|
|
Realized gains on sales of available-for-sale securities |
|
$ |
(923 |
) |
|
$ |
(412 |
) |
|
$ |
(347 |
) |
|
Other-than-temporary impairment losses |
|
|
— |
|
|
|
— |
|
|
|
230 |
|
|
Total before tax |
|
|
(923 |
) |
|
|
(412 |
) |
|
|
(117 |
) |
|
Income tax expense |
|
|
384 |
|
|
|
148 |
|
|
|
45 |
|
|
Net of tax amount |
|
$ |
(539 |
) |
|
$ |
(264 |
) |
|
$ |
(72 |
) |
|
Unrealized holding gains on interest rate swaps arising during the period: |
|
|
|
|
|
|
|
|
|
|
|
|
|
Gross amount |
|
$ |
99 |
|
|
$ |
161 |
|
|
$ |
— |
|
|
Income tax expense |
|
|
(1 |
) |
|
|
(62 |
) |
|
|
— |
|
|
Net of tax amount |
|
$ |
98 |
|
|
$ |
99 |
|
|
$ |
— |
|
|
Foreign currency translation adjustments |
|
$ |
672 |
|
|
$ |
(1,161 |
) |
|
$ |
(2,252 |
) |
The unrealized holding gains and losses on available-for-sale investments represent mark-to-market adjustments net of related income taxes.
|
(11) |
Retirement Plans |
We offer 401(k) defined contribution plans to our employees. The plans are administered by a company controlled by our principal shareholders and include different matching provisions depending on which subsidiary or affiliate is involved. In the plans available to certain employees not subject to collective bargaining agreements, we matched contributions up to $600 annually for each employee who is not considered highly compensated through December 31, 2008, after which some matching contributions were suspended as a response to market conditions at certain subsidiaries. Three other 401(k) plans are provided to employees of specific operations and offer matching contributions that range from zero to $2,080 per participant annually. The total expense for contributions for 401(k) plans, including plans related to collective bargaining agreements, was $0.5 million, $0.5 million and $0.2 million for the years ended December 31, 2017, 2016 and 2015, respectively.
In connection with a collective bargaining agreement that covered 12 Canadian employees at December 31, 2017, we are required to make defined contributions into the Canada Wide Industrial Pension Plan. At December 31, 2017 and 2016, the required contributions totaled approximately $41,000 and $31,000, respectively.
60
UNIVERSAL LOGISTICS HOLDINGS, INC.
Notes to Consolidated Financial Statements – (Continued)
December 31, 2017, 2016 and 2015
On April 23, 2014, our Board of Directors adopted the 2014 Amended and Restated Stock Incentive Plan, or the Plan. The Plan was approved by our shareholders at the 2014 Annual Meeting and became effective as of the date it was adopted by the Board of Directors. The Plan replaced our 2004 Stock Incentive Plan and carried forward the shares of common stock that remained available for issuance under the 2004 Stock Incentive Plan. The grants may be made in the form of stock options, restricted stock bonuses, restricted stock purchase rights, stock appreciation rights, phantom stock units, restricted stock units or unrestricted common stock. Restricted stock awards currently outstanding under the 2004 Stock Incentive Plan will remain outstanding in accordance with the terms of that plan.
|
On February 22, 2017, February 24, 2016, April 29, 2015 and March 5, 2015, the Company granted 10,000, 10,000, 20,000 and 10,000 shares, respectively, of restricted stock to its Chief Executive Officer. The restricted stock grants have fair values of $13.45, $15.55 per share, $22.03 per share, and $25.18 per share, respectively, based on the closing price of the Company’s stock on each grant date. For each award, 25% of the shares vested immediately on the grant dates, and the remaining shares vest in three equal installments on March 5 of each of the next three years following the grant date, with the final vesting of the 2017 award to occur on March 5, 2020, in each case subject to continued employment with the company. |
On December 23, 2015, the Company granted 50,000 shares of restricted stock to certain of its employees, including 10,000 shares to its Chief Financial Officer. The restricted stock grants have a grant date fair value of $14.93 per share, based on the closing price of the Company’s stock, of which 25% vested immediately, and an additional 25% will vest in three equal increments on each December 20 in 2016, 2017 and 2018.
A grantee’s vesting of restricted stock awards may be accelerated under certain conditions, including retirement.
A summary of the status of our non-vested shares as of December 31, 2017, and changes during the year ended December 31, 2017, is presented below:
|
|
|
Shares |
|
|
Weighted Average Grant Date Fair Value |
|
||
|
Non-vested at January 1, 2017 |
|
|
45,000 |
|
|
$ |
17.75 |
|
|
Granted |
|
|
10,000 |
|
|
$ |
13.45 |
|
|
Vested |
|
|
(23,750 |
) |
|
$ |
17.41 |
|
|
Forfeited |
|
|
— |
|
|
$ |
— |
|
|
Balance at December 31, 2017 |
|
|
31,250 |
|
|
$ |
16.63 |
|
During the years ended December 31, 2017, 2016 and 2015, the total grant date fair value of vested shares recognized as compensation cost was $414,000, $571,000, and $494,000 respectively. As of December 31, 2017, there was $520,000 of total unrecognized compensation cost related to non-vested share-based compensation arrangements granted under the Plan. That cost is expected to be recognized on a straight-line basis over the remaining vesting period. As a result, the Company expects to recognize stock-based compensation costs of $413,000, $73,000, and $34,000 during 2018, 2019 and 2020, respectively.
61
UNIVERSAL LOGISTICS HOLDINGS, INC.
Notes to Consolidated Financial Statements – (Continued)
December 31, 2017, 2016 and 2015
Our principal commitments relate to long-term real estate leases and payment obligations to equipment vendors.
On October 16, 2017, a jury in state court in Cook County, Illinois rendered a verdict of $54.2 million against Universal Am-Can, Ltd. (“UACL”) in the matter of Denton v. UACL, et al. The litigation relates to a vehicular accident that occurred on February 8, 2011 on I-65 in Rensselaer, Indiana. The accident involved a tractor-trailer being driven by an independent owner-operator of UACL. The driver was braking on the expressway in order to avoid another vehicle being driven the wrong way on the interstate. The truck attempted to avoid the oncoming vehicle and the plaintiff’s vehicle and, in so doing, struck the plaintiff’s vehicle. As a result of the accident, the plaintiff sustained non-life threatening injuries. In connection with the verdict, the jury determined that UACL was responsible for the liability associated with the accident. The verdict included $19.2 million in compensatory damages and $35.0 million in punitive damages against UACL. The insurance coverage available for reimbursement of UACL’s damages underlying the verdict is limited to $1.0 million. We believe the facts and the law do not support the jury’s findings of liability against UACL. Post-trial motions have been filed seeking a reduction of the verdict or reversal of the judgment. The Company may further seek to appeal the verdict to the extent the circuit court does not set it aside the judgment as a result of these motions. The Company currently estimates the possible range of financial exposure in the matter, net of insurance coverage, to be between $18.2 and $53.2 million. Based on the Company’s best estimate of the liability at this time, the Company has recorded an accrued liability for this matter of $18.2 million. While we cannot predict with any certainty the outcome of this litigation, its ultimate resolution could be significantly different from our estimate and materially affect our financial condition, results of operations and cash flows.
The Company was plaintiff in a lawsuit that was filed on June 11, 2015 against, among others, Dalton Logistics, Inc. (“Dalton”) in the United States District Court for the Southern District of Texas. The Company was seeking approximately $1.9 million in damages from a debtor relating to unpaid freight charges. In response to the filing of the complaint, the shareholders of Dalton filed a counterclaim against the Company alleging that the Company, in connection with certain unrelated negotiations with the defendant, breached an alleged agreement to acquire Dalton. The respective claims proceeded to trial and, on July 21, 2017, a jury returned two separate verdicts: One in favor of Universal for $1.9 million, and a second in favor of the defendant for approximately $5.7 million. On October 30, 2017, the court entered a judgment against Universal for the $5.7 million, but ignored the $1.9 million jury award in favor of Universal. The Company believes this ruling was in error and further believes the jury erred in their findings of any damages against Universal, and therefore, the Company plans to appeal both the ruling and the verdict. The Company currently estimates the possible range of financial exposure in the matter to be between $0 and $5.7 million. Based on the Company’s best estimate of the liability at this time, the Company has recorded an accrued liability for this matter of $1.8 million. While we cannot predict with any certainty the outcome of this litigation, management does not believe the outcome will have a material adverse effect on our business, financial condition, results of operations or cash flows.
On February 21, 2018, Ford Motor Company (“Ford”) filed suit against two of the Company’s subsidiaries and two related parties in state court in Oakland County, Michigan (the “Indemnity Action”). The complaint seeks a declaratory judgment that Universal and its co-defendants are required to indemnify Ford for damages sustained by Ford in a wrongful death lawsuit in Clay County, Missouri (the “Underlying Action”). In February 2018, a jury returned a verdict against Ford in the Underlying Action and awarded the decedent’s estate $76 million in damages. Universal believes that, under Michigan law and its agreement with Ford, Universal is not required to indemnify Ford for Ford’s own negligence that led to the jury verdict in the Underlying Action. Additionally, at the time of the incident that is the subject of the Underlying Action, Universal had in place insurance required by Ford providing for up to $3.0 million of coverage from a co-defendant. The Company currently estimates the possible range of financial exposure in the matter, net of insurance coverage, to be between $0 and $73 million. Based on not only its knowledge of the facts associated with the Underlying Action and the Indemnity Action but also the opinions of its outside counsel, Universal has determined that a loss in the Indemnity Action is not probable and no accrual is necessary at this time. While the outcome of the Indemnity Action cannot be predicted with any certainty and management believes the Company will be successful in defending its position, the outcome could have material adverse effect on our business, financial position, results of operations and cash flows.
The Company is involved in certain other claims and pending litigation arising from the ordinary conduct of business. We also provide accruals for claims within our self-insured retention amounts. Based on the knowledge of the facts, and in certain cases, opinions of outside counsel, in the Company’s opinion the resolution of these claims and pending litigation will not have a material effect on our financial position, results of operations or cash flows. However, if we experience claims that are not covered by our insurance or that exceed our estimated claim reserve, it could increase the volatility of our earnings and have a materially adverse effect on our financial condition, results of operations or cash flows.
62
UNIVERSAL LOGISTICS HOLDINGS, INC.
Notes to Consolidated Financial Statements – (Continued)
December 31, 2017, 2016 and 2015
At December 31, 2017, approximately 19% of our employees in the United States, Canada and Colombia, and 95% of our employees in Mexico are subject to collective bargaining agreements that are renegotiated periodically. None of the employees in the United States, Canada and Colombia are subject to contracts that expire in 2018. The contract for our Mexican employees expiring in 2018 is currently being negotiated.
|
(14) |
Earnings Per Share |
Basic earnings per common share amounts are based on the weighted average number of common shares outstanding, excluding outstanding non-vested restricted stock. Diluted earnings per common share include dilutive common stock equivalents determined by the treasury stock method. For the years ended December 31, 2017, 2016 and 2015, there were 2,922, zero and 2,273 weighted average non-vested shares of restricted stock, respectively, included in the denominator for the calculation of diluted earnings per share.
For the years ended December 31, 2017, 2016 and 2015, 2,500, 45,000 and 30,725 shares of non-vested restricted stock, respectively, were excluded from the calculation of diluted earnings per share because such shares were anti-dilutive.
|
(15) |
Quarterly Financial Data (unaudited) |
|
|
|
2017 |
|
|||||||||||||
|
|
|
1st quarter |
|
|
2nd quarter |
|
|
3rd quarter |
|
|
4th quarter |
|
||||
|
|
|
(in thousands, except per share information) |
|
|||||||||||||
|
Operating revenue |
|
$ |
284,442 |
|
|
$ |
305,199 |
|
|
$ |
313,001 |
|
|
$ |
314,023 |
|
|
Operating income (loss) |
|
|
9,169 |
|
|
|
6,417 |
|
|
|
(3,484 |
) |
|
|
13,112 |
|
|
Income (loss) before income taxes |
|
|
7,001 |
|
|
|
4,400 |
|
|
|
(5,271 |
) |
|
|
11,011 |
|
|
Income tax (benefit) expense |
|
|
2,683 |
|
|
|
1,661 |
|
|
|
(1,966 |
) |
|
|
(13,390 |
) |
|
Net income (loss) |
|
$ |
4,318 |
|
|
$ |
2,739 |
|
|
$ |
(3,305 |
) |
|
$ |
24,401 |
|
|
Earnings per common share: |
|
|
|
|
|
|
|
|
|
|
|
|
|
|
|
|
|
Basic |
|
$ |
0.15 |
|
|
$ |
0.10 |
|
|
$ |
(0.12 |
) |
|
$ |
0.86 |
|
|
Diluted |
|
$ |
0.15 |
|
|
$ |
0.10 |
|
|
$ |
(0.12 |
) |
|
$ |
0.86 |
|
|
Weighted average number of common shares outstanding: |
|
|
|
|
|
|
|
|
|
|
|
|
|
|
|
|
|
Basic |
|
|
28,435 |
|
|
|
28,443 |
|
|
|
28,441 |
|
|
|
28,382 |
|
|
Diluted |
|
|
28,435 |
|
|
|
28,443 |
|
|
|
28,444 |
|
|
|
28,390 |
|
|
|
|
2016 |
|
|||||||||||||
|
|
|
1st quarter |
|
|
2nd quarter |
|
|
3rd quarter |
|
|
4th quarter |
|
||||
|
|
|
(in thousands, except per share information) |
|
|||||||||||||
|
Operating revenue |
|
$ |
260,394 |
|
|
$ |
276,813 |
|
|
$ |
271,493 |
|
|
$ |
264,051 |
|
|
Operating income |
|
|
13,930 |
|
|
|
16,774 |
|
|
|
10,027 |
|
|
|
5,849 |
|
|
Income before income taxes |
|
|
12,105 |
|
|
|
14,771 |
|
|
|
8,119 |
|
|
|
4,410 |
|
|
Income tax expense |
|
|
4,628 |
|
|
|
5,724 |
|
|
|
3,122 |
|
|
|
1,687 |
|
|
Net income |
|
$ |
7,477 |
|
|
$ |
9,047 |
|
|
$ |
4,997 |
|
|
$ |
2,723 |
|
|
Earnings per common share: |
|
|
|
|
|
|
|
|
|
|
|
|
|
|
|
|
|
Basic |
|
$ |
0.26 |
|
|
$ |
0.32 |
|
|
$ |
0.18 |
|
|
$ |
0.10 |
|
|
Diluted |
|
$ |
0.26 |
|
|
$ |
0.32 |
|
|
$ |
0.18 |
|
|
$ |
0.10 |
|
|
Weighted average number of common shares outstanding: |
|
|
|
|
|
|
|
|
|
|
|
|
|
|
|
|
|
Basic |
|
|
28,402 |
|
|
|
28,414 |
|
|
|
28,413 |
|
|
|
28,415 |
|
|
Diluted |
|
|
28,402 |
|
|
|
28,414 |
|
|
|
28,413 |
|
|
|
28,415 |
|
During the fourth quarter of 2017, the Company recognized an $18.2 million income tax benefit due to the Tax Cuts and Jobs Act.
63
UNIVERSAL LOGISTICS HOLDINGS, INC.
Notes to Consolidated Financial Statements – (Continued)
December 31, 2017, 2016 and 2015
We report our financial results in two reportable segments, the transportation segment and the logistics segment, based on the nature of the underlying customer commitment and the types of investments required to support these commitments. This presentation reflects the manner in which management evaluates our operating segments, including an evaluation of economic characteristics and applicable aggregation criteria.
Operations aggregated in our transportation segment are associated with individual freight shipments coordinated by our agents, company-managed terminals and specialized services operations. In contrast, operations aggregated in our logistics segment deliver value-added services or transportation services to specific customers on a dedicated basis, generally pursuant to contract terms of one year or longer. Other non-reportable operating segments are comprised of the Company’s subsidiaries that provide support services to other subsidiaries and to owner-operators, including shop maintenance and equipment leasing.
The following tables summarize information about our reportable segments as of and for the fiscal years ended December 31, 2017, 2016 and 2015 (in thousands):
|
2017 |
|
Transportation |
|
|
Logistics |
|
|
Other |
|
|
Total |
|
||||
|
Operating revenues |
|
$ |
750,302 |
|
|
$ |
465,070 |
|
|
$ |
1,293 |
|
|
$ |
1,216,665 |
|
|
Eliminated inter-segment revenues |
|
|
(1,064 |
) |
|
|
(8,095 |
) |
|
|
— |
|
|
|
(9,159 |
) |
|
Depreciation and amortization |
|
|
17,661 |
|
|
|
29,136 |
|
|
|
198 |
|
|
|
46,995 |
|
|
Income from operations |
|
|
14,512 |
|
|
|
10,597 |
|
|
|
105 |
|
|
|
25,214 |
|
|
Capital expenditures |
|
|
12,330 |
|
|
|
50,597 |
|
|
|
433 |
|
|
|
63,360 |
|
|
Total assets |
|
|
291,736 |
|
|
|
293,773 |
|
|
|
25,083 |
|
|
|
610,592 |
|
|
|
|
|
|
|
|
|
|
|
|
|
|
|
|
|
|
|
|
2016 |
|
Transportation |
|
|
Logistics |
|
|
Other |
|
|
Total |
|
||||
|
Operating revenues |
|
$ |
656,496 |
|
|
$ |
414,948 |
|
|
$ |
1,307 |
|
|
$ |
1,072,751 |
|
|
Eliminated inter-segment revenues |
|
|
(1,896 |
) |
|
|
(7,482 |
) |
|
|
— |
|
|
|
(9,378 |
) |
|
Depreciation and amortization |
|
|
13,459 |
|
|
|
23,064 |
|
|
|
179 |
|
|
|
36,702 |
|
|
Income from operations |
|
|
22,399 |
|
|
|
27,653 |
|
|
|
(3,472 |
) |
|
|
46,580 |
|
|
Capital expenditures |
|
|
9,464 |
|
|
|
91,045 |
|
|
|
500 |
|
|
|
101,009 |
|
|
Total assets |
|
|
252,164 |
|
|
|
292,227 |
|
|
|
26,066 |
|
|
|
570,457 |
|
|
|
|
|
|
|
|
|
|
|
|
|
|
|
|
|
|
|
|
2015 |
|
Transportation |
|
|
Logistics |
|
|
Other |
|
|
Total |
|
||||
|
Operating revenues |
|
$ |
721,437 |
|
|
$ |
406,822 |
|
|
$ |
514 |
|
|
$ |
1,128,773 |
|
|
Eliminated inter-segment revenues |
|
|
(3,659 |
) |
|
|
(6,170 |
) |
|
|
— |
|
|
|
(9,829 |
) |
|
Depreciation and amortization |
|
|
11,153 |
|
|
|
23,565 |
|
|
|
155 |
|
|
|
34,873 |
|
|
Income from operations |
|
|
28,683 |
|
|
|
43,848 |
|
|
|
864 |
|
|
|
73,395 |
|
|
Capital expenditures |
|
|
2,034 |
|
|
|
23,797 |
|
|
|
426 |
|
|
|
26,257 |
|
|
Total assets |
|
|
219,759 |
|
|
|
253,429 |
|
|
|
29,967 |
|
|
|
503,155 |
|
We provide a portfolio of transportation and logistics services to a wide range of customers throughout the United States and in Mexico, Canada and Colombia. Revenues attributed to geographic areas are as follows (in thousands):
|
|
|
Year Ended December 31, |
|
|||||||||
|
|
|
2017 |
|
|
2016 |
|
|
2015 |
|
|||
|
United States |
|
$ |
1,179,115 |
|
|
$ |
1,038,963 |
|
|
$ |
1,090,683 |
|
|
Mexico |
|
|
24,346 |
|
|
|
20,046 |
|
|
|
27,676 |
|
|
Canada |
|
|
11,538 |
|
|
|
12,157 |
|
|
|
8,577 |
|
|
Colombia |
|
|
1,666 |
|
|
|
1,585 |
|
|
|
1,837 |
|
|
Total |
|
$ |
1,216,665 |
|
|
$ |
1,072,751 |
|
|
$ |
1,128,773 |
|
64
UNIVERSAL LOGISTICS HOLDINGS, INC.
Notes to Consolidated Financial Statements – (Continued)
December 31, 2017, 2016 and 2015
Net long-lived property and equipment assets by geographic area are presented in the table below (in thousands):
|
|
|
Year Ended December 31, |
|
|||||
|
|
|
2017 |
|
|
2016 |
|
||
|
United States |
|
$ |
245,070 |
|
|
$ |
233,644 |
|
|
Mexico |
|
|
21,725 |
|
|
|
12,188 |
|
|
Canada |
|
|
389 |
|
|
|
431 |
|
|
Colombia |
|
|
11 |
|
|
|
14 |
|
|
Total |
|
$ |
267,195 |
|
|
$ |
246,277 |
|
|
(17) |
Recent Accounting Pronouncements |
In May 2014, the FASB issued ASU 2014-09, Revenue from Contracts with Customers. ASU 2014-09 is a comprehensive revenue recognition model requiring a company to recognize revenue to depict the transfer of goods or services to a customer at an amount reflecting the consideration it expects to receive in exchange for those goods or services. In applying the new guidance, an entity will (1) identify the contract(s) with a customer; (2) identify the performance obligations in the contract; (3) determine the transaction price; (4) allocate the transaction price to the contract’s performance obligations; and (5) recognize revenue when (or as) the entity satisfies a performance obligation. For our transportation services businesses, which include truckload, brokerage, intermodal and dedicated services, the adoption of the standard will change the timing of revenue recognition from at delivery to over-time as the performance obligations on the in-transit services are completed. For our value-added service businesses, the adoption of the standard will not change the timing of revenue recognition. On January 1, 2018, the Company adopted ASU 2014-09 using the modified retrospective transition method with a cumulative adjustment to retained earnings. Due to the Company’s short in-transit period for transportation services, the impact did not have a significant impact on its results of operations, financial position or cash flows. The standard also requires additional disclosures to enable users of financial statements to understand the nature, amount, timing, and uncertainty of revenue and cash flows arising from contracts with customers. The Company is finalizing its evaluation of the impact of the required disclosures that will be effective in the first quarter 2018 and expects the disclosures to be enhanced.
In January 2016, the FASB issued ASU 2016-01, Financial Instruments – Overall: Recognition and Measurement of Financial Assets and Financial Liabilities. Among other things, the ASU requires equity investments, with certain exceptions, to be measured at fair value with changes in fair value recognized in net income; simplifies the impairment assessment of equity investments without readily determinable fair values by requiring a qualitative assessment to identify impairment; requires public business entities to use the exit price notion when measuring the fair value of financial instruments for disclosure purposes; requires separate presentation of financial assets and financial liabilities by measurement category and form of financial asset on the balance sheet or the accompanying notes to the financial statements; and clarifies that an entity should evaluate the need for a valuation allowance on a deferred tax asset related to available-for-sale securities. The amendments are to be applied by means of a cumulative-effect adjustment to the balance sheet and are effective for interim and annual periods beginning after December 15, 2017. The Company adopted this new standard effective January 1, 2018 using the modified retrospective method with a cumulative adjustment to retained earnings of approximately $3.8 million.
In February 2016, the FASB issued ASU 2016-02, Leases. The objective of the new standard is to establish principles for lessees and lessors to report information about the amount, timing, and uncertainty of cash flows arising from a lease. The ASU will require a lessee to recognize the assets and liabilities that arise from leases, including operating leases. Under the new requirements, a lessee will recognize in the statement of financial position a liability to make lease payments (the lease liability) and the right-of-use asset representing the right to the underlying asset for the lease term. For leases with a term of 12 months or less, the lessee is permitted to make an accounting policy election by class of underlying asset not to recognize lease assets and lease liabilities. This update is effective for annual and interim periods beginning after December 15, 2018, which will require us to adopt these provisions in the first quarter of 2019 using a modified retrospective approach. Early adoption is permitted, although we do not plan to adopt early. We are currently evaluating the effects ASU 2016-02 will have on our consolidated financial statements and related disclosures. We currently disclose approximately $71.8 million in operating lease obligations in Note 9, “Leases”. We will evaluate those contracts as well as other existing arrangements to determine if they qualify for lease accounting under the new standard. Upon adoption, we would expect the amount recognized for the right-of-use assets and lease liabilities to be material to the consolidated financial statements.
65
UNIVERSAL LOGISTICS HOLDINGS, INC.
Notes to Consolidated Financial Statements – (Continued)
December 31, 2017, 2016 and 2015
In January 2017, the FASB issued ASU 2017-04, Intangibles - Goodwill and Other (Topic 350): Simplifying the Test for Goodwill Impairment. This update simplifies the accounting for goodwill impairments by eliminating step 2 from the goodwill impairment test. Instead, if the carrying amount of a reporting unit exceeds its fair value and impairment loss shall be recognized in an amount equal to that excess, limited to the total amount of goodwill allocated to that reporting unit. The ASU is effective for annual and any interim impairment tests for periods beginning after December 15, 2019. Early adoption is permitted for interim and annual goodwill impairment tests performed after January 1, 2017. We early adopted this ASU for our annual impairment test performed in the third quarter 2017. There was no impact resulting from this adoption on our consolidated financial statements.
In February 2018, the FASB issued ASU 2018-02, Reclassification of Certain Tax Effects From Accumulated Other Comprehensive Income, which amends existing guidance for reporting comprehensive income to reflect changes resulting from the 2017 Tax Act. The amendment provides the option to reclassify stranded tax effects resulting from the 2017 Tax Act and within accumulated other comprehensive income (AOCI) to retained earnings. New disclosures will be required upon adoption, including the accounting policy for releasing income tax effects from AOCI, whether reclassification of stranded income tax effects is elected, and information about other income tax effect reclassifications. The amendment will become effective for us on January 1, 2019, though early adoption is permitted. We are currently evaluating the impact of adopting this standard on our consolidated financial statements and disclosures
|
(18) |
Subsequent Events |
On February 1, 2018, the Company acquired Fore Transportation, Inc., Fore Transport, Inc. and 4 Cargo, LLC (collectively, “Fore”), and APA Holdings, LLC (“Apa Holdings”). Fore provides comprehensive intermodal solutions, including local and regional drayage services. Apa Holdings owns and leases real property and improvements, including a 28-acre terminal that serves as Fore’s corporate headquarters and its secured trailer and container storage facility for 1,100 units. The total cash purchase price was $34.9 million, subject to customary post-closing adjustments. To fund the acquisition, the Company used available cash and borrowed approximately $31.3 million using its margin credit facility, revolving credit facility and secured real estate financing. The Company is in the process of finalizing the purchase accounting for this transaction.
On February 22, 2018, our Board of Directors declared a quarterly cash dividend of $0.07 per share of common stock, which is payable to shareholders of record at the close of business on March 5, 2018 and is expected to be paid on March 15, 2018. Declaration of future cash dividends is subject to final determination by the Board of Directors each quarter after its review of our financial condition, results of operations, capital requirements, any legal or contractual restrictions on the payment of dividends and other factors the Board of Directors deems relevant.
66
None.
Evaluation of Disclosure Controls and Procedures
Based on an evaluation under the supervision and with the participation of the Company’s management, the Company’s principal executive officer and principal financial officer have concluded that the Company’s disclosure controls and procedures as defined in Rules 13a-15(e) and 15d-15(e) under the Securities Exchange Act of 1934, as amended (the “Exchange Act”) were effective as of December 31, 2017 to provide reasonable assurance that information required to be disclosed by the Company in reports that it files or submits under the Exchange Act is (i) recorded, processed, summarized and reported within the time periods specified in the Securities and Exchange Commission rules and forms and (ii) accumulated and communicated to the Company’s management, including its principal executive officer and principal financial officer, as appropriate to allow timely decisions regarding required disclosure.
Inherent Limitations over Internal Controls
The Company’s internal control over financial reporting is designed to provide reasonable assurance regarding the reliability of financial reporting and the preparation of financial statements for external purposes in accordance with U.S. generally accepted accounting principles (“GAAP”). The Company’s internal control over financial reporting includes those policies and procedures that:
|
|
(i) |
pertain to the maintenance of records that, in reasonable detail, accurately and fairly reflect the transactions and dispositions of the Company’s assets; |
|
|
(ii) |
provide reasonable assurance that transactions are recorded as necessary to permit preparation of financial statements in accordance with GAAP, and that the Company’s receipts and expenditures are being made only in accordance with authorizations of the Company’s management and directors; and |
|
|
(iii) |
provide reasonable assurance regarding prevention or timely detection of unauthorized acquisition, use, or disposition of the Company’s assets that could have a material effect on the financial statements. |
Management, including the Company’s Chief Executive Officer and Chief Financial Officer, does not expect that the Company’s internal controls will prevent or detect all errors and all fraud. A control system, no matter how well designed and operated, can provide only reasonable, not absolute, assurance that the objectives of the control system are met. Further, the design of a control system must reflect the fact that there are resource constraints, and the benefits of controls must be considered relative to their costs. Because of the inherent limitations in all control systems, no evaluation of internal controls can provide absolute assurance that all control issues and instances of fraud, if any, have been detected. Also, any evaluation of the effectiveness of controls in future periods are subject to the risk that those internal controls may become inadequate because of changes in business conditions, or that the degree of compliance with the policies or procedures may deteriorate.
Changes in Internal Control over Financial Reporting
There were no changes in the Company’s internal control over financial reporting during the fourth quarter of 2017, which were identified in connection with management’s evaluation required by paragraph (d) of rules 13a-15 and 15d-15 under the Exchange Act, that have materially affected, or are reasonably likely to materially affect, the Company’s internal control over financial reporting.
Management’s Annual Report on Internal Control over Financial Reporting
The Company’s management is responsible for establishing and maintaining adequate internal control over financial reporting (as defined in Rule 13a-15(f) under the Exchange Act). Management conducted an assessment of the effectiveness of the Company’s internal control over financial reporting based on the criteria set forth in Internal Control – Integrated Framework issued by the Committee of Sponsoring Organizations of the Treadway Commission (2013 framework). Based on the Company’s assessment, management has concluded that its internal control over financial reporting was effective as of December 31, 2017. The Company’s independent registered public accounting firm, BDO USA LLP, has issued an audit report on the Company’s internal control over financial reporting, which appears below.
67
Report of Independent Registered Public Accounting Firm
Shareholders and Board of Directors
Universal Logistics Holdings, Inc.
Warren, Michigan
Opinion on Internal Control over Financial Reporting
We have audited Universal Logistics Holdings Inc.’s (the “Company’s”) internal control over financial reporting as of December 31, 2017, based on criteria established in Internal Control - Integrated Framework (2013) issued by the Committee of Sponsoring Organizations of the Treadway Commission (the “COSO criteria”). In our opinion, the Company maintained, in all material respects, effective internal control over financial reporting as of December 31, 2017, based on the COSO criteria.
We also have audited, in accordance with the standards of the Public Company Accounting Oversight Board (United States) (“PCAOB”), the consolidated balance sheets of the Company as of December 31, 2017 and 2016, the related consolidated statements of income, comprehensive income, cash flows and shareholders’ equity for each of the three years in the period ended December 31, 2017, and the related notes and our report dated March 16, 2018 expressed an unqualified opinion thereon.
Basis for Opinion
The Company’s management is responsible for maintaining effective internal control over financial reporting and for its assessment of the effectiveness of internal control over financial reporting, included in the accompanying “Item 9A, Management’s Report on Internal Control over Financial Reporting”. Our responsibility is to express an opinion on the Company’s internal control over financial reporting based on our audit. We are a public accounting firm registered with the PCAOB and are required to be independent with respect to the Company in accordance with U.S. federal securities laws and the applicable rules and regulations of the Securities and Exchange Commission and the PCAOB.
We conducted our audit of internal control over financial reporting in accordance with the standards of the PCAOB. Those standards require that we plan and perform the audit to obtain reasonable assurance about whether effective internal control over financial reporting was maintained in all material respects. Our audit included obtaining an understanding of internal control over financial reporting, assessing the risk that a material weakness exists, and testing and evaluating the design and operating effectiveness of internal control based on the assessed risk. Our audit also included performing such other procedures as we considered necessary in the circumstances. We believe that our audit provides a reasonable basis for our opinion.
Definition and Limitations of Internal Control over Financial Reporting
A company’s internal control over financial reporting is a process designed to provide reasonable assurance regarding the reliability of financial reporting and the preparation of financial statements for external purposes in accordance with generally accepted accounting principles. A company’s internal control over financial reporting includes those policies and procedures that (1) pertain to the maintenance of records that, in reasonable detail, accurately and fairly reflect the transactions and dispositions of the assets of the company; (2) provide reasonable assurance that transactions are recorded as necessary to permit preparation of financial statements in accordance with generally accepted accounting principles, and that receipts and expenditures of the company are being made only in accordance with authorizations of management and directors of the company; and (3) provide reasonable assurance regarding prevention or timely detection of unauthorized acquisition, use, or disposition of the company’s assets that could have a material effect on the financial statements.
Because of its inherent limitations, internal control over financial reporting may not prevent or detect misstatements. Also, projections of any evaluation of effectiveness to future periods are subject to the risk that controls may become inadequate because of changes in conditions, or that the degree of compliance with the policies or procedures may deteriorate.
/s/ BDO USA, LLP
Troy, Michigan
March 16, 2018
68
None.
69
Portions of the information required by Part III of Form 10-K are, pursuant to General Instruction G (3) of Form 10-K, incorporated by reference from our definitive Proxy Statement to be filed pursuant to Regulation 14A for our Annual Meeting of Shareholders to be held on April 26, 2018. We will, within 120 days of the end of our fiscal year, file with the Securities and Exchange Commission a definitive proxy statement pursuant to Regulation 14A.
The information required by this Item is incorporated herein by reference to the definitive Proxy Statement to be filed pursuant to Regulation 14A for our Annual Meeting of Shareholders to be held on April 26, 2018.
The information required by this Item is incorporated herein by reference to the definitive Proxy Statement to be filed pursuant to Regulation 14A for our Annual Meeting of Shareholders to be held on April 26, 2018.
|
ITEM 12: |
SECURITY OWNERSHIP OF CERTAIN BENEFICIAL OWNERS AND MANAGEMENT AND RELATED STOCKHOLDER MATTERS |
The information required by this Item is incorporated herein by reference to the definitive Proxy Statement to be filed pursuant to Regulation 14A for our Annual Meeting of Shareholders to be held on April 26, 2018.
The following table presents information about equity plans under which equity securities of the Company are authorized for issuance at December 31, 2017:
|
Plan Category |
|
Number of securities to be issued upon exercise of outstanding options, warrants and rights |
|
|
Weighted average exercise price of outstanding options, warrants and rights |
|
|
Number of securities remaining available for future issuance |
|
|||
|
Equity compensation plans approved by security holders |
|
|
31,250 |
|
|
$ |
— |
|
(1) |
|
206,880 |
|
|
Equity compensation plans not approved by security holders |
|
|
— |
|
|
$ |
— |
|
|
|
— |
|
|
Total |
|
|
31,250 |
|
|
$ |
— |
|
(1) |
|
206,880 |
|
|
|
(1) |
Reflects shares to be issued under restricted stock bonus awards, which do not have an exercise price. As of December 31, 2017, the Company has no outstanding options, warrants or rights that require payment of an exercise price. |
The information required by this Item is incorporated herein by reference to the definitive Proxy Statement to be filed pursuant to Regulation 14A for our Annual Meeting of Shareholders to be held on April 26, 2018.
The information required by this Item is incorporated herein by reference to the definitive Proxy Statement to be filed pursuant to Regulation 14A for our Annual Meeting of Shareholders to be held on April 26, 2018.
70
|
(1) |
Financial Statements |
|
|
|
Page |
|
|
37 |
|
|
|
38 |
|
|
|
39 |
|
|
|
40 |
|
|
|
41 |
|
|
|
43 |
|
|
|
44 |
|
(2) |
Financial Statement Schedules |
Financial statement schedules have been omitted since they are either not required, not applicable, or the information is otherwise included elsewhere in this Form 10-K.
|
(3) |
Exhibits |
|
Exhibit No. |
|
Description |
|
|
|
|
|
3.1 |
|
|
|
|
|
|
|
3.2 |
|
Amendment to Articles of Incorporation (incorporated by reference to Exhibit 3(i)-1 and 3(i)-2 to the Registrant’s Current Report on Form 8-K filed on November 1, 2012) |
|
|
|
|
|
3.3 |
|
|
|
|
|
|
|
3.4 |
|
|
|
|
|
|
|
4.1 |
|
|
|
|
|
|
|
4.2 |
|
|
|
|
|
|
|
10.1 |
|
|
|
|
|
|
|
10.2+ |
|
|
|
|
|
|
|
10.3 |
|
|
|
|
|
|
|
10.4+ |
|
|
|
|
|
|
|
10.5+ |
|
|
|
|
|
|
|
|
|
|
71
|
Exhibit No. |
|
Description |
|
|
||
|
|
|
|
|
10.7 |
|
|
|
|
|
|
|
10.8 |
|
|
|
|
|
|
|
10.9 |
|
|
|
|
|
|
|
10.10 |
|
|
|
|
|
|
|
10.11 |
|
|
|
|
|
|
|
10.12 |
|
|
|
|
|
|
|
21.1* |
|
|
|
|
|
|
|
23.1* |
|
Consent of BDO USA LLP, independent registered public accounting firm |
|
|
|
|
|
24* |
|
|
|
|
|
|
|
31.1* |
|
|
|
|
|
|
|
31.2* |
|
|
|
|
|
|
|
32.1** |
|
|
|
|
|
|
|
101.INS* |
|
XBRL Instance Document |
|
|
|
|
|
101.SCH* |
|
XBRL Schema Document |
|
|
|
|
|
101.CAL* |
|
XBRL Calculation Linkbase Document |
|
|
|
|
|
101.DEF* |
|
XBRL Definition Linkbase Document |
|
|
|
|
|
101.LAB* |
|
XBRL Labels Linkbase Document |
|
|
|
|
|
101.PRE* |
|
XBRL Presentation Linkbase Document |
|
+ |
Indicates a management contract, compensatory plan or arrangement. |
|
* |
Filed herewith. |
|
** |
Furnished herewith. |
72
Pursuant to the requirements of Section 13 or 15(d) of the Securities Exchange Act of 1934, the registrant has duly caused this report on Form 10-K to be signed on its behalf by the undersigned, thereunto duly authorized.
|
|
Universal Logistics Holdings, Inc. |
||
|
|
|
(Registrant) |
|
|
|
By: |
|
/s/ Jude Beres |
|
|
|
|
Jude Beres, Chief Financial Officer |
|
|
|
|
|
|
|
|
|
Date: March 16, 2018 |
POWER OF ATTORNEY
Know all persons by these presents, that each person whose signature appears below constitutes and appoints Jeff Rogers and Jude Beres, jointly and severally, his attorneys-in-fact, each with the power of substitution, for him in any and all capacities, to sign any amendments to this Form 10-K, and to file the same, with exhibits thereto and other documents in connection therewith, with the Securities and Exchange Commission, hereby ratifying and confirming all that each of said attorneys-in-fact, or his substitutes, may do or cause to be done by virtue hereof.
Pursuant to the requirements of the Securities Exchange Act of 1934, this report has been signed below by the following persons on behalf of the registrant and in the capacities and on the dates indicated.
|
Signatures |
|
Title |
|
Date |
|
|
|
|
|
|
|
/s/ Jeff Rogers |
|
Chief Executive Officer |
|
March 16, 2018 |
|
Jeff Rogers |
|
(Principal Executive Officer) |
|
|
|
/s/ Jude Beres |
|
Chief Financial Officer and Treasurer |
|
March 16, 2018 |
|
Jude Beres |
|
(Principal Financial and Accounting Officer) |
|
|
|
/s/ Matthew T. Moroun |
|
Chairman of the Board |
|
March 16, 2018 |
|
Matthew T. Moroun |
|
|
|
|
|
/s/ Manuel J. Moroun |
|
Director |
|
March 16, 2018 |
|
Manuel J. Moroun |
|
|
|
|
|
/s/ Grant Belanger |
|
Director |
|
March 16, 2018 |
|
Grant Belanger |
|
|
|
|
|
/s/ Frederick P. Calderone |
|
Director |
|
March 16, 2018 |
|
Frederick P. Calderone |
|
|
|
|
|
/s/ Joseph J. Casaroll |
|
Director |
|
March 16, 2018 |
|
Joseph J. Casaroll |
|
|
|
|
|
/s/ Daniel J. Deane |
|
Director |
|
March 16, 2018 |
|
Daniel J. Deane |
|
|
|
|
|
/s/ Michael A. Regan |
|
Director |
|
March 16, 2018 |
|
Michael A. Regan |
|
|
|
|
|
/s/ Daniel C. Sullivan |
|
Director |
|
March 16, 2018 |
|
Daniel C. Sullivan |
|
|
|
|
|
/s/ Richard P. Urban |
|
Director |
|
March 16, 2018 |
|
Richard P. Urban |
|
|
|
|
|
/s/ H.E. “Scott” Wolfe |
|
Director |
|
March 16, 2018 |
|
H. E. “Scott” Wolfe |
|
|
|
|
73