Attached files
| file | filename |
|---|---|
| EX-32.2 - EXHIBIT 32.2 - JAKKS PACIFIC INC | a51771406ex32_2.htm |
| EX-32.1 - EXHIBIT 32.1 - JAKKS PACIFIC INC | a51771406ex32_1.htm |
| EX-31.2 - EXHIBIT 31.2 - JAKKS PACIFIC INC | a51771406ex31_2.htm |
| EX-31.1 - EXHIBIT 31.1 - JAKKS PACIFIC INC | a51771406ex31_1.htm |
| EX-23.1 - EXHIBIT 23.1 - JAKKS PACIFIC INC | a51771406ex23_1.htm |
| EX-21 - EXHIBIT 21 - JAKKS PACIFIC INC | a51771406ex21.htm |
| EX-10.8.5 - EXHIBIT 10.8.5 - JAKKS PACIFIC INC | a51771406ex10_85.htm |
UNITED STATES
SECURITIES AND EXCHANGE COMMISSION
Washington, D.C. 20549
FORM 10-K
(Mark One)
|
☒
|
ANNUAL REPORT UNDER SECTION 13 OR 15(d) OF THE SECURITIES EXCHANGE ACT OF 1934
|
|
|
For the Fiscal Year Ended December 31, 2017
|
|
|
|
|
☐
|
TRANSITION REPORT UNDER SECTION 13 OR 15(d) OF THE SECURITIES EXCHANGE ACT OF 1934
|
For the transition period from ____________ to ____________
Commission File Number 0-28104
JAKKS PACIFIC, INC.
(Exact name of registrant as specified in its charter)
|
Delaware
|
95-4527222
|
|
(State or other jurisdiction of
|
(I.R.S. Employer
|
|
incorporation or organization)
|
Identification No.)
|
|
2951 28th St.
|
|
|
Santa Monica, California
|
90405
|
|
(Address of principal executive offices)
|
(Zip Code)
|
Registrant’s telephone number, including area code: (424) 268-9444
Securities registered pursuant to Section 12(b) of the Exchange Act:
|
Title of each class
|
Name of each exchange
on which registered
|
|
Common Stock, $.001 par value per share
|
Nasdaq Global Select
|
Securities registered pursuant to Section 12(g) of the Exchange Act:
Title of Class
Common Stock, $.001 par value per share
Indicate by check mark if the registrant is a well-known seasoned issuer, as defined in Rule 405 of the Securities Act. Yes ☐ No ☒
Indicate by check mark if the registrant is not required to file reports pursuant to Section 13 or Section 15 of the Act. Yes ☐ No ☒
Indicate by check mark whether the registrant (1) has filed all reports required to be filed by Section 13 or 15(d) of the Securities Exchange Act of 1934 during the preceding 12 months (or for such shorter period that the registrant was required to file such reports) and (2) has been subject to such filing requirements for the past 90 days. Yes x No o
Indicate by check mark whether the registrant has submitted electronically and posted on its corporate web site, if any, every Interactive Data File required to be submitted and posted pursuant to Rule 405 of Regulation S-T during the preceding 12 months (or for such shorter period that the registrant was required to submit and post such files). Yes x No o
Indicate by check mark if disclosure of delinquent filers pursuant to Item 405 of Regulation S-K is not contained herein, and will not be contained, to the best of registrant’s knowledge, in definitive proxy or information statements incorporated by reference in Part III of this Form 10-K or any amendment to this Form 10-K. o
Indicate by check mark whether the registrant is a large accelerated filer, an accelerated filer, a non-accelerated filer, smaller reporting company, or an emerging growth company. See the definitions of “large accelerated filer,” “accelerated filer,” “smaller reporting company,” and “emerging growth company” in Rule 12b-2 of the Exchange Act. (check one):
|
☐ Large Accelerated Filer
|
☒ Accelerated Filer
|
☐ Non-Accelerated Filer
|
☐ Smaller Reporting Company
|
☐ Emerging growth company |
|
|
|
(Do not check if a Smaller Reporting Company)
|
|
If an emerging growth company, indicate by check mark if the registrant has elected not to use the extended transition period for complying with any new or revised financial accounting standards provided pursuant to Section 13(a) of the Exchange Act. ☐
Indicate by check mark whether the registrant is a shell company (as defined in Rule 12b-2 of the Exchange Act). Yes o No x
The aggregate market value of the voting and non-voting common equity (the only such common equity being Common Stock, $.001 par value per share) held by non-affiliates of the registrant (computed by reference to the closing sale price of the Common Stock on June 30, 2017 of $4.00) is $107,392,952.
The number of shares outstanding of the registrant’s Common Stock, $.001 par value (being the only class of its common stock), is 29,159,324 as of March 15, 2018.
Documents Incorporated by Reference
None.
1
JAKKS PACIFIC, INC.
INDEX TO ANNUAL REPORT ON FORM 10-K
For the Fiscal Year ended December 31, 2017
Items in Form 10-K
|
|
|
Page
|
|
|
PART I
|
|
|
3
|
||
|
12
|
||
|
Item 1B.
|
Unresolved Staff Comments
|
None
|
|
18
|
||
|
19
|
||
|
20
|
||
|
|
PART II
|
|
|
21
|
||
|
24
|
||
|
26
|
||
|
36
|
||
|
37
|
||
|
Item 9.
|
Changes in and Disagreements With Accountants on Accounting and Financial Disclosure
|
None
|
|
72
|
||
|
Item 9B.
|
Other Information
|
None
|
|
|
PART III
|
|
|
74
|
||
|
79
|
||
|
99
|
||
|
101
|
||
|
101
|
||
|
|
PART IV
|
|
|
103
|
||
|
105
|
||
|
|
106
|
|
|
Certifications
|
|
|
DISCLOSURE REGARDING FORWARD-LOOKING STATEMENTS
This report includes “forward-looking statements” within the meaning of Section 27A of the Securities Act of 1933 and Section 21E of the Securities Exchange Act of 1934. For example, statements included in this report regarding our financial position, business strategy and other plans and objectives for future operations, and assumptions and predictions about future product demand, supply, manufacturing, costs, marketing and pricing factors are all forward-looking statements. When we use words like “intend,” “anticipate,” “believe,” “estimate,” “plan” or “expect,” we are making forward-looking statements. We believe that the assumptions and expectations reflected in such forward-looking statements are reasonable, based upon information available to us on the date hereof, but we cannot assure you that these assumptions and expectations will prove to have been correct or that we will take any action that we may presently be planning. We have disclosed certain important factors that could cause our actual results to differ materially from our current expectations elsewhere in this report. You should understand that forward-looking statements made in this report are necessarily qualified by these factors. We are not undertaking to publicly update or revise any forward-looking statement if we obtain new information or upon the occurrence of future events or otherwise.
2
PART I
In this report, “JAKKS,” the “Company,” “we,” “us” and “our” refer to JAKKS Pacific, Inc., its subsidiaries and our majority owned joint venture.
Company Overview
We are a leading multi-line, multi-brand toy company that designs, produces, markets and distributes toys and related products, consumables and related products, electronics and related products, kids indoor and outdoor furniture, and other consumer products. We focus our business on acquiring or licensing well-recognized trademarks and brand names, most with long product histories (“evergreen brands”). We seek to acquire these evergreen brands because we believe they are less subject to market fads or trends. We also develop proprietary products marketed under our own trademarks and brand names, and have historically acquired complementary businesses to further grow our portfolio. For accounting purposes, our products have been divided into three segments: (i) U.S. and Canada, (ii) International and (iii) Halloween. Segment information with respect to revenues, assets and profits or losses attributable to each segment is contained in Note 3 to the audited consolidated financial statements contained below in Item 8. Our products include:
Traditional Toys and Electronics
|
●
|
Action figures and accessories, including licensed characters, principally based on Batman®, Star Wars® and Nintendo® franchises;
|
|
|
|
|
●
|
Toy vehicles, including Max Tow®, Road Champs®, Fly Wheels® and MXS® toy vehicles and accessories;
|
|
●
|
Dolls and accessories, including small dolls, large dolls, fashion dolls and baby dolls based on licenses, including Disney’s Frozen, Disney Princess, Disney Fairies, infant and pre-school toys based on PBS’s Daniel Tiger’s Neighborhood®;
|
|
|
|
|
●
|
Private label products as “exclusives” for a myriad of retail customers in many product categories; and
|
|
|
|
|
●
|
Foot-to-floor ride-on toys based on Fisher Price®, Kawasaki®, and DC Comics®, inflatable environments, tents and wagons.
|
|
|
Role Play, Novelty and Seasonal Toys
|
●
|
Role play, dress-up, pretend play and novelty products for boys and girls based on well-known brands and entertainment properties such as Disney’s Frozen, Black & Decker®, McDonald’s®, Disney Princess and Disney Fairies, as well as those based on our own proprietary brands;
|
|
|
|
|
●
|
Indoor and outdoor kids’ furniture, activity trays and tables and room décor; kiddie pools, seasonal and outdoor products, including those based on Crayola®, Disney characters and more, and Funnoodle® pool floats;
|
|
|
|
|
●
|
Halloween and everyday costumes for all ages based on licensed and proprietary non-licensed brands, including Spiderman®, Toy Story, Sesame Street®, Power Rangers®¸Hasbro® brands and Disney’s Frozen, Disney Princess and related Halloween accessories; and
|
|
|
|
|
●
|
Junior sports and outdoor activity toys including Skyball® hyper-charged balls and sport sets and Wave Hoops® toy hoops marketed under our Maui ® brand.
|
3
We continually review the marketplace to identify and evaluate popular and evergreen brands and product categories that we believe have the potential for growth. We endeavor to generate growth within these lines by:
|
|
●
|
creating innovative products under our established licenses and brand names;
|
|
|
●
|
adding new items to the branded product lines that we expect will enjoy greater popularity;
|
|
|
●
|
infusing innovation and technology when appropriate to make them more appealing to today’s kids; and
|
|
|
●
|
focusing our marketing efforts to enhance consumer recognition and retailer interest.
|
Our Business Strategy
In addition to developing our own proprietary brands and marks, licensing popular trademarks enables us to use these high-profile marks at a lower cost than we would incur if we purchased these marks or developed comparable marks on our own. By licensing trademarks, we have access to a far greater range of marks than would be available for purchase. We also license technology developed by unaffiliated inventors and product developers to enhance the design and functionality of our products.
We sell our products through our in-house sales staff and independent sales representatives to toy and mass-market retail chain stores, department stores, office supply stores, drug and grocery store chains, club stores, toy specialty stores and wholesalers. Our three largest customers are Wal-Mart, Target and Toys ‘R’ Us, which accounted for approximately 25.5%, 17.8% and 11.3%, respectively, of our net sales in 2017. No other customer accounted for more than 10.0% of our net sales in 2017.
Our Growth Strategy
In 2016 and 2017, we generated net sales of $706.6 million and $613.1 million, respectively, and net income of $1.2 million in 2016 and a net loss of $83.1 million in 2017. Key elements of our growth strategy include:
● Expand Core Products. We manage our existing and new brands through strategic product development initiatives, including introducing new products, modifying existing products and extending existing product lines to maximize their longevity. Our marketing teams and product designers strive to develop new products or product lines to offer added technological, aesthetic and functional improvements to our extensive portfolio.
● Enter New Product Categories. We use our extensive experience in the toy and other consumer product industries to evaluate products and licenses in new product categories and to develop additional product lines. We began marketing licensed classic video games for simple plug-in use with television sets and expanded into several related categories by infusing additional technologies such as motion gaming and through the licensing of this category from our current licensors, such as Disney and Viacom which owns Nickelodeon®.
● Pursue Strategic Acquisitions. We supplement our internal growth with selected strategic acquisitions. In October 2016, we acquired the operating assets of the C’est Moi™ performance makeup and youth skincare product lines whose distribution is limited primarily to Asia. We expect to launch a full line of makeup and skincare products branded under the C’est Moi name in the U.S. and Canada in the first quarter of 2018. We will continue focusing our acquisition strategy on businesses or brands that we believe have compatible product lines and/or offer valuable trademarks or brands.
4
● Acquire Additional Character and Product Licenses. We have acquired the rights to use many familiar brand and character names and logos from third parties that we use with our primary trademarks and brands. Currently, among others, we have license agreements with Nickelodeon®, Disney and Warner Bros.®, as well as with the licensors of the many popular licensed children’s characters previously mentioned, among others. We intend to continue to pursue new licenses from these entertainment and media companies and other licensors. We also intend to continue to purchase additional inventions and product concepts through our existing network of inventors and product developers.
● Expand International Sales. We believe that foreign markets, especially Europe, Australia, Canada, Latin America and Asia, offer us significant growth opportunities. In 2017, our sales generated outside the United States were approximately $134.0 million, or 21.9% of total net sales. We intend to continue to expand our international sales and further expand distribution agreements in Europe to capitalize on our experience and our relationships with foreign distributors and retailers. We expect these initiatives to contribute to our international growth in 2018.
● Capitalize On Our Operating Efficiencies. We believe that our current infrastructure and operating model can accommodate growth without a proportionate increase in our operating and administrative expenses, thereby increasing our operating margins.
The execution of our growth strategy, however, is subject to several risks and uncertainties and we cannot assure you that we will continue to experience growth in, or maintain our present level of net sales (see “Risk Factors,” in Item 1A). For example, our growth strategy will place additional demands upon our management, operational capacity and financial resources and systems. The increased demand upon management may necessitate our recruitment and retention of additional qualified management personnel. We cannot assure you that we will be able to recruit and retain qualified personnel or expand and manage our operations effectively and profitably. To effectively manage future growth, we must continue to expand our operational, financial and management information systems and to train, motivate and manage our work force. While we believe that our operational, financial and management information systems will be adequate to support our future growth, no assurance can be given they will be adequate without significant investment in our infrastructure. Failure to expand our operational, financial and management information systems or to train, motivate or manage employees could have a material adverse effect on our business, financial condition and results of operations.
Moreover, implementation of our growth strategy is subject to risks beyond our control, including competition, market acceptance of new products, changes in economic conditions, our ability to obtain or renew licenses on commercially reasonable terms and our ability to finance increased levels of accounts receivable and inventory necessary to support our sales growth, if any.
Furthermore, we cannot assure you that we can identify attractive acquisition candidates or negotiate acceptable acquisition terms, and our failure to do so may adversely affect our results of operations and our ability to sustain growth.
Finally, our acquisition strategy involves a number of risks, each of which could adversely affect our operating results, including difficulties in integrating acquired businesses or product lines, assimilating new facilities and personnel and harmonizing diverse business strategies and methods of operation; diversion of management attention from operation of our existing business; loss of key personnel from acquired companies; and failure of an acquired business to achieve targeted financial results.
5
Industry Overview
According to Toy Industry Association, Inc., the leading toy industry trade group, the United States is the world’s largest toy market, followed by Japan and Western Europe. Total retail sales of toys, excluding video games, in the United States, were approximately $20.7 billion in 2017. We believe the two largest United States toy companies, Mattel and Hasbro, collectively hold a dominant share of the domestic non-video toy market. In addition, hundreds of smaller companies compete in the design and development of new toys, the procurement of character and product licenses, and the improvement and expansion of previously introduced products and product lines.
Over the past few years, the toy industry has experienced substantial consolidation among both toy companies and toy retailers. We believe that the ongoing consolidation of toy companies provides us with increased growth opportunities due to retailers’ desire to not be entirely dependent upon a few dominant toy companies. Retailer concentration also enables us to ship products, manage account relationships and track point of sale information more effectively and efficiently.
Products
We focus our business on acquiring or licensing well-recognized trademarks or brand names, and we seek to acquire evergreen brands which are less subject to market fads or trends. Generally, our license agreements for products and concepts call for royalties ranging from 1% to 21% of net sales, and some may require minimum guarantees and advances. Our principal products include:
Traditional Toys
Wheels Products
Motorized and plastic toy vehicles and accessories.
Our extreme sports offerings include our MXS® line of motorcycles with generic and well-known riders and other vehicles include off-road vehicles and skateboards, which are sold individually and with playsets and accessories. In 2014, we launched our proprietary line of motorized vehicles under the brand Max Tow®, and in 2015, we expanded the product line to include higher performance versions as well as mini size vehicles and play sets under the Max Tow®Mini line. In 2017, we launched Real Workin’ Buddies™ with Mr. Dusty, the talking cleaning dump truck.
Action Figures and Accessories
We currently develop, manufacture and distribute other action figures and action figure accessories including those based on Star Wars® and Batman®, capitalizing on the expertise we built in the action figure category.
Our line of Big-Figs™ large scale action figures features an assortment of 20” figures, 31” figures, and 48” figures of characters including Superman®, Power Rangers®, Star Wars® and Teenage Mutant Ninja Turtles®.
6
Dolls
Dolls and accessories include small dolls, large dolls, fashion dolls and baby dolls based on licenses, including Disney’s Frozen, Disney Princess, Disney Fairies, including an extensive line of baby doll accessories that emulate real baby products that mothers today use; plush, infant and pre-school toys, and private label fashion dolls for other retailers and sold to Disney Stores and Disney Parks and Resorts. In 2016, we launched lines of dolls based on Disney’s animated feature Moana and animated television series Elena of Avalor.
Role Play, Novelty & Seasonal
Role Play and Dress-up Products
Our line of role play and dress-up products for boys and girls features entertainment and consumer products properties such as Disney’s Frozen, Disney Princess, Disney Fairies, Moana, Elena of Avalor and Black & Decker®. These products generated a significant amount of sales in 2015, 2016 and 2017.
Seasonal/ Outdoor Products
We have a wide range of seasonal toys and outdoor and leisure products including our Maui® line of proprietary products including Sky Ball®, Sky Bouncer® and Wave Hoop® among other outdoor toys. Our Funnoodle® pool toys include basic Funnoodle® pool floats and a variety of other pool toys.
Indoor and Outdoor Kids’ Furniture
We produce an extensive array of licensed indoor and outdoor kids' furniture and activity tables, and room decor. Our licensed portfolio includes character licenses, including Crayola®, Disney Princess, Toy Story, Mickey Mouse, Paw Patrol®, and others. Products include children’s puzzle furniture, tables and chairs to activity sets, trays, stools and a line of licensed molded kiddie pools, among others.
Halloween and Everyday Costume Play
We produce an expansive and innovative line of Halloween costumes and accessories which includes a wide range of non-licensed Halloween costumes such as horror, pirates, historical figures and aliens to animals, vampires, angels and more, as well as popular licensed characters from top intellectual property owners including Disney, Hasbro®, Sesame Workshop®, Mattel®, and many others. In 2016, we launched new licenses including Lego® brands.
7
Sales, Marketing and Distribution
We sell all of our products through our own in-house sales staff and independent sales representatives to toy and mass-market retail chain stores, department stores, office supply stores, drug and grocery store chains, club stores, toy specialty stores and wholesalers. Our three largest customers are Wal-Mart, Target and Toys ‘R’ Us, which accounted for approximately 54.9% of our net sales in 2016 and 54.6% of our net sales in 2017. We generally sell products to our customers pursuant to letters of credit or, in some cases, on open account with payment terms typically varying from 30 to 90 days. From time to time, we allow our customers credits against future purchases from us in order to facilitate their retail markdown and sales of slow-moving inventory. We also sell our products through e-commerce sites, including Walmart.com, Target.com, Toysrus.com and Amazon.com.
We contract the manufacture of most of our products to unaffiliated manufacturers located in The People’s Republic of China (“China”). We sell the finished products on a letter of credit basis or on open account to our customers, many of whom take title to the goods in Hong Kong or China. These methods allow us to reduce certain operating costs and working capital requirements. A portion of our sales originate in the United States, so we hold certain inventory in our warehouses and fulfillment facilities. To date, a majority of all of our sales has been to domestic customers. We intend to continue expanding distribution of our products into foreign territories and, accordingly, we have:
|
|
●
|
entered into a joint venture in China,
|
|
|
●
|
engaged representatives to oversee sales in certain foreign territories,
|
|
|
●
|
engaged distributors in certain foreign territories,
|
|
|
●
|
established direct relationships with retailers in certain foreign territories,
|
|
|
●
|
opened sales offices in Europe and Mexico,
|
|
|
●
|
opened sales offices and a distribution center in Canada, and
|
|
|
●
|
expanded in-house resources dedicated to product development and marketing of our lines.
|
8
Outside of the United States, we currently sell our products primarily in Europe, Australia, Canada, Latin America and Asia. Sales of our products abroad accounted for approximately $134.0 million, or 21.9% of our net sales in 2017 and approximately $162.5 million, or 23.0% of our net sales in 2016. We believe that foreign markets present an attractive opportunity, and we plan to intensify our marketing efforts and further expand our distribution channels abroad.
We establish reserves for sales allowances, including promotional allowances and allowances for anticipated defective product returns, at the time of shipment. The reserves are determined as a percentage of net sales based upon either historical experience or upon estimates or programs agreed upon by our customers and us.
We obtain, directly, or through our sales representatives, orders for our products from our customers and arrange for the manufacture of these products as discussed below. Cancellations generally are made in writing, and we take appropriate steps to notify our manufacturers of these cancellations. We may incur costs or other losses as a result of cancellations.
We maintain a full-time sales and marketing staff, many of whom make on-site visits to customers for the purpose of showing product and soliciting orders for products. We also retain a number of independent sales representatives to sell and promote our products, both domestically and internationally. Together with retailers, we occasionally test the consumer acceptance of new products in selected markets before committing resources to large-scale production.
We publicize and advertise our products in trade and consumer magazines and other publications, market our products at international, national and regional toy and other specialty trade shows, conventions and exhibitions and carry on cooperative advertising programs with toy and mass market retailers and other customers which include the use of print and television ads and in-store displays. We also produce and broadcast television commercials for several of our product lines, if we expect that the resulting increase in our net sales will justify the relatively high cost of television advertising.
Product Development
Each of our product lines has an in-house manager responsible for product development. The in-house manager identifies and evaluates inventor products and concepts and other opportunities to enhance or expand existing product lines or to enter new product categories. In addition, we create proprietary products to fully exploit our concept and character licenses. Although we have the capability to create and develop products from inception to production, we also use third-parties to provide a portion of the sculpting, sample making, illustration and package design required for our products in order to accommodate our increasing product innovations and introductions. Typically, the development process takes from three to nine months from concept to production and shipment to our customers.
We employ a staff of designers for all of our product lines. We occasionally acquire our other product concepts from unaffiliated third parties. If we accept and develop a third party’s concept for new toys, we generally pay a royalty on the sale of the toys developed from this concept, and may, on an individual basis, guarantee a minimum royalty. Royalties payable to inventors and developers generally range from 1% to 5% of the wholesale sales price for each unit of a product sold by us. We believe that utilizing experienced third-party inventors gives us access to a wide range of development talent. We currently work with numerous toy inventors and designers for the development of new products and the enhancement of existing products.
Safety testing of our products is done at the manufacturers’ facilities by quality control personnel employed by us or by independent third-party contractors engaged by us. Safety testing is designed to meet or exceed regulations imposed by federal and state, as well as applicable international governmental authorities, our retail partners, licensors and the Toy Industry Association. We also closely monitor quality assurance procedures for our products for safety purposes. In addition, independent laboratories engaged by some of our larger customers and licensors test certain of our products.
9
Manufacturing and Supplies
Most of our products are currently produced by overseas third-party manufacturers, which we choose on the basis of quality, reliability and price. Consistent with industry practice, the use of third-party manufacturers enables us to avoid incurring fixed manufacturing costs, while maximizing flexibility, capacity and production technology. Substantially all of the manufacturing services performed overseas for us are paid for on open account with the manufacturers. To date, we have not experienced any material delays in the delivery of our products; however, delivery schedules are subject to various factors beyond our control, and any delays in the future could adversely affect our sales. Currently, we have ongoing relationships with over eighty different manufacturers. We believe that alternative sources of supply are available to us although we cannot be assured that we can obtain adequate supplies of manufactured products.
Although we do not conduct the day-to-day manufacturing of our products, we are extensively involved in the design of the product prototype and production tools, dyes and molds for our products and we seek to ensure quality control by actively reviewing the production process and testing the products produced by our manufacturers. We employ quality control inspectors who rotate among our manufacturers’ factories to monitor the production of substantially all of our products.
The principal raw materials used in the production and sale of our toy products are plastics, zinc alloy, plush, printed fabrics, paper products and electronic components, all of which are currently available at reasonable prices from a variety of sources. Although we do not manufacture our products, we own the majority of the tools, dyes and molds used in the manufacturing process, and these are transferable among manufacturers if we choose to employ alternative manufacturers. Tools, dyes and molds represent a substantial portion of our property and equipment with a net book value of $15.7 million in 2016 and $17.0 million in 2017; substantially all of these assets are located in China.
Trademarks and Copyrights
Most of our products are produced and sold under trademarks owned by or licensed to us. We typically register our properties, and seek protection under the trademark, copyright and patent laws of the United States and other countries where our products are produced or sold. These intellectual property rights can be significant assets. Accordingly, while we believe we are sufficiently protected, the loss of some of these rights could have an adverse effect on our business, financial condition and results of operations.
Competition
Competition in the toy industry is intense. Globally, certain of our competitors have greater financial resources, larger sales and marketing and product development departments, stronger name recognition, longer operating histories and benefit from greater economies of scale. These factors, among others, may enable our competitors to market their products at lower prices or on terms more advantageous to customers than those we could offer for our competitive products. Competition often extends to the procurement of entertainment and product licenses, as well as the marketing and distribution of products and the obtaining of adequate shelf space. Competition may result in price reductions, reduced gross margins and loss of market share, any of which could have a material adverse effect on our business, financial condition and results of operations. In each of our product lines we compete against one or both of the toy industry’s two dominant companies, Mattel and Hasbro. In addition, we compete in our Halloween costume lines with Rubies. We also compete with numerous smaller domestic and foreign toy manufacturers, importers and marketers in each of our product categories.
Seasonality and Backlog
In 2017, approximately 65.1% of our net sales were made in the third and fourth quarters. Generally, the first quarter is the period of lowest shipments and sales in our business and in the toy industry and therefore it is also the least profitable quarter due to various fixed costs. Seasonality factors may cause our operating results to fluctuate significantly from quarter to quarter. However, our seasonal products are primarily sold in the spring and summer seasons. Our results of operations may also fluctuate as a result of factors such as the timing of new products (and related expenses) introduced by us or our competitors, the advertising activities of our competitors, delivery schedules set by our customers and the emergence of new market entrants. We believe, however, that the low retail price of most of our products may be less subject to seasonal fluctuations than higher priced toy products.
We ship products in accordance with delivery schedules specified by our customers, who generally request delivery of products within three to six months of the date of their orders for orders shipped FOB China or Hong Kong and within three days for orders shipped domestically. Because customer orders may be canceled at any time, often without penalty, our backlog may not accurately indicate sales for any future period.
10
Government and Industry Regulation
Our products are subject to the provisions of the Consumer Product Safety Act (“CPSA”), the Federal Hazardous Substances Act (“FHSA”), the Flammable Fabrics Act (“FFA”) and the regulations promulgated there under. The CPSA and the FHSA enable the Consumer Products Safety Commission (“CPSC”) to exclude from the market consumer products that fail to comply with applicable product safety regulations or otherwise create a substantial risk of injury, and articles that contain excessive amounts of a banned hazardous substance. The FFA enables the CPSC to regulate and enforce flammability standards for fabrics used in consumer products. The CPSC may also require the repurchase by the manufacturer of articles. Similar laws exist in some states and cities and in various international markets. We maintain a quality control program designed to ensure compliance with all applicable laws.
Employees
As of February 28, 2018, we employed 751 people, all of whom are full-time employees, including three executive officers. We employed 409 people in the United States, 9 people in Canada, 4 people in Mexico, 203 people in Hong Kong, 100 people in China, 20 people in the United Kingdom, 3 people in France and 3 people in Germany. We believe that we have good relationships with our employees. None of our employees are represented by a union.
Environmental Issues
We are subject to legal and financial obligations under environmental, health and safety laws in the United States and in other jurisdictions where we operate. We are not currently aware of any material environmental liabilities associated with any of our operations.
Available Information
We make available free of charge on or through our Internet website, www.jakks.com, our annual report on Form 10-K, quarterly reports on Form 10-Q, current reports on Form 8-K, and amendments to these reports filed or furnished pursuant to Section 13(a) or 15(d) of the Securities Exchange Act of 1934 as soon as reasonably practicable after we electronically file such material with, or furnish it to, the SEC. The contents of our website are not incorporated in or deemed to be a part of any such report.
Our Corporate Information
We were formed as a Delaware corporation in 1995. Our principal executive offices are located at 2951 28th Street, Santa Monica, California 90405. Our telephone number is (424) 268-9444 and our Internet Website address is www.jakks.com. The contents of our website are not incorporated in or deemed to be a part of this Annual Report on Form 10-K.
11
From time to time, including in this Annual Report on Form 10-K, we publish forward-looking statements, as disclosed in our Disclosure Regarding Forward-Looking Statements, beginning immediately following the Table of Contents of this Annual Report. We note that a variety of factors could cause our actual results and experience to differ materially from the anticipated results or other expectations expressed or anticipated in our forward-looking statements. The factors listed below are risks and uncertainties that may arise and that may be detailed from time to time in our public announcements and our filings with the Securities and Exchange Commission, such as on Forms 8-K, 10-Q and 10-K. We undertake no obligation to make any revisions to the forward-looking statements contained in this Annual Report on Form 10-K to reflect events or circumstances occurring after the date of the filing of this report.
Our inability to redesign, restyle and extend our existing core products and product lines as consumer preferences evolve, and to develop, introduce and gain customer acceptance of new products and product lines, may materially and adversely impact our business, financial condition and results of operations.
Our business and operating results depend largely upon the appeal of our products. Our continued success in the toy industry will depend upon our ability to redesign, restyle and extend our existing core products and product lines as consumer preferences evolve, and to develop, introduce and gain customer acceptance of new products and product lines. Several trends in recent years have presented challenges for the toy industry, including:
|
|
●
|
the phenomenon of children outgrowing toys at younger ages, particularly in favor of interactive and high technology products;
|
|
|
●
|
increasing use of technology;
|
|
|
●
|
shorter life cycles for individual products; and
|
|
|
●
|
higher consumer expectations for product quality, functionality and value.
|
We cannot assure you that:
|
|
●
|
our current products will continue to be popular with consumers;
|
|
|
●
|
the products that we introduce will achieve any significant degree of market acceptance;
|
|
|
●
|
the life cycles of our products will be sufficient to permit us to recover licensing, design, manufacturing, marketing and other costs associated with those products.
|
|
|
●
|
our inclusion of new technology will result in higher sales or increased profits.
|
Our failure to achieve any or all of the foregoing benchmarks may adversely affect our business, financial condition and results of operations.
The failure of our character-related and theme-related products to become and/or remain popular with children may materially and adversely impact our business, financial condition and results of operations.
The success of many of our character-related and theme-related products depends upon the popularity of characters in movies, television programs, live sporting exhibitions, and other media and events. We cannot assure you that:
|
|
●
|
media associated with our character-related and theme-related product lines will be released at the times we expect or will be successful;
|
|
|
●
|
the success of media associated with our existing character-related and theme-related product lines will result in substantial promotional value to our products;
|
|
|
●
|
we will be successful in renewing licenses upon expiration on terms that are favorable to us; or
|
|
|
●
|
we will be successful in obtaining licenses to produce new character-related and theme-related products in the future.
|
Our failure to achieve any or all of the foregoing benchmarks may cause the infrastructure of our operations to fail, thereby adversely affecting our business, financial condition and results of operations.
12
There are risks associated with our license agreements.
|
|
●
|
Our current licenses require us to pay minimum royalties
|
Sales of products under trademarks or trade or brand names licensed from others account for substantially all of our net sales. Product licenses allow us to capitalize on characters, designs, concepts and inventions owned by others or developed by toy inventors and designers. Our license agreements generally require us to make specified minimum royalty payments, even if we fail to sell a sufficient number of units to cover these amounts. In addition, under certain of our license agreements, if we fail to achieve certain prescribed sales targets, we may be unable to retain or renew these licenses.
|
|
●
|
Some of our licenses are restricted as to use
|
Under the majority of our license agreements, the licensors have the right to review and approve our use of their licensed products, designs or materials before we may make any sales. If a licensor refuses to permit our use of any licensed property in the way we propose, or if their review process is delayed, our development or sale of new products could be impeded.
|
|
●
|
New licenses are difficult and expensive to obtain
|
Our continued success will substantially depend upon our ability to obtain additional licenses. Intense competition exists for desirable licenses in our industry. We cannot assure you that we will be able to secure or renew significant licenses on terms acceptable to us. In addition, as we add licenses, the need to fund additional royalty advances and guaranteed minimum royalty payments may strain our cash resources.
|
|
●
|
A limited number of licensors account for a large portion of our net sales
|
We derive a significant portion of our net sales from a limited number of licensors. If one or more of these licensors were to terminate or fail to renew our license or not grant us new licenses, our business, financial condition and results of operations could be adversely affected.
The toy industry is highly competitive and our inability to compete effectively may materially and adversely impact our business, financial condition and results of operations.
The toy industry is highly competitive. Globally, certain of our competitors have financial and strategic advantages over us, including:
|
|
●
|
greater financial resources;
|
|
|
●
|
larger sales, marketing and product development departments;
|
|
|
●
|
stronger name recognition;
|
|
|
●
|
longer operating histories; and
|
|
|
●
|
greater economies of scale.
|
In addition, the toy industry has no significant barriers to entry. Competition is based primarily upon the ability to design and develop new toys, procure licenses for popular characters and trademarks and successfully market products. Many of our competitors offer similar products or alternatives to our products. Our competitors have obtained and are likely to continue to obtain licenses that overlap our licenses with respect to products, geographic areas and markets. We cannot assure you that we will be able to obtain adequate shelf space in retail stores to support our existing products, expand our products and product lines or continue to compete effectively against current and future competitors.
13
We may not be able to sustain or manage our product line growth, which may prevent us from increasing our net revenues.
Historically, we have experienced growth in our product lines through acquisitions of businesses, products and licenses. This growth in product lines has contributed significantly to our total revenues over the last few years. Even though we had no significant acquisitions since 2012, comparing our future period-to-period operating results may not be meaningful and results of operations from prior periods may not be indicative of future results. We cannot assure you that we will continue to experience growth in, or maintain our present level of, net sales.
Our growth strategy calls for us to continuously develop and diversify our toy business by acquiring other companies, entering into additional license agreements, refining our product lines and expanding into international markets, which will place additional demands upon our management, operational capacity and financial resources and systems. The increased demand upon management may necessitate our recruitment and retention of qualified management personnel. We cannot assure you that we will be able to recruit and retain qualified personnel or expand and manage our operations effectively and profitably. To effectively manage future growth, we must continue to expand our operational, financial and management information systems and to train, motivate and manage our work force. There can be no assurance that our operational, financial and management information systems will be adequate to support our future operations. Failure to expand our operational, financial and management information systems or to train, motivate or manage employees could have a material adverse effect on our business, financial condition and results of operations.
In addition, implementation of our growth strategy is subject to risks beyond our control, including competition, market acceptance of new products, changes in economic conditions, our ability to obtain or renew licenses on commercially reasonable terms, our ability to identify acquisition candidates and conclude acquisitions on acceptable terms, and our ability to finance increased levels of accounts receivable and inventory necessary to support our sales growth, if any. Accordingly, we cannot assure you that our growth strategy will be successful.
If we are unable to acquire and integrate companies and new product lines successfully, we will be unable to implement a significant component of our growth strategy.
Our growth strategy depends, in part, upon our ability to acquire companies and new product lines. Future acquisitions, if any, may succeed only if we can effectively assess characteristics of potential target companies and product lines, such as:
|
|
●
|
attractiveness of products;
|
|
|
●
|
suitability of distribution channels;
|
|
|
●
|
management ability;
|
|
|
●
|
financial condition and results of operations; and
|
|
|
●
|
the degree to which acquired operations can be integrated with our operations.
|
We cannot assure you that we can identify attractive acquisition candidates or negotiate acceptable acquisition terms, and our failure to do so may adversely affect our results of operations and our ability to sustain growth. Our acquisition strategy involves a number of risks, each of which could adversely affect our operating results, including:
|
|
●
|
difficulties in integrating acquired businesses or product lines, assimilating new facilities and personnel and harmonizing diverse business strategies and methods of operation;
|
|
|
●
|
diversion of management attention from operation of our existing business;
|
|
|
●
|
loss of key personnel from acquired companies;
|
|
|
●
|
failure of an acquired business to achieve targeted financial results; and
|
|
|
●
|
Limited capital to finance acquisitions.
|
14
A limited number of customers account for a large portion of our net sales, so that if one or more of our major customers were to experience difficulties in fulfilling their obligations to us, cease doing business with us, significantly reduce the amount of their purchases from us or return substantial amounts of our products, it could have a material adverse effect on our business, financial condition and results of operations.
Our three largest customers accounted for 54.6% of our net sales in 2017. Except for outstanding purchase orders for specific products, we do not have written contracts with or commitments from any of our customers and pursuant to the terms of certain of our vendor agreements, even some purchase orders may be cancelled without penalty up until delivery. A substantial reduction in or termination of orders from any of our largest customers could adversely affect our business, financial condition and results of operations. In addition, pressure by large customers seeking price reductions, financial incentives, and changes in other terms of sale or for us to bear the risks and the cost of carrying inventory could also adversely affect our business, financial condition and results of operations. If one or more of our major customers were to experience difficulties in fulfilling their obligations to us, cease doing business with us, significantly reduce the amount of their purchases from us or return substantial amounts of our products, it could have a material adverse effect on our business, financial condition and results of operations. In addition, the bankruptcy or other lack of success of one or more of our significant retailers could negatively impact our revenues and bad debt expense.
Liquidity problems or bankruptcy of our key customers, including the recent bankruptcy filing by Toys “R” Us, could have a significant adverse effect on our business, financial condition and results of operations.
Our sales to customers are typically made on credit without collateral. There is a risk that key customers will not pay, or that payment may be delayed, because of bankruptcy, concentration of credit availability to such customers, weak retail sales or other factors beyond our control, which could increase our exposure to losses from bad debts. In addition, if key customers were to cease doing business as a result of bankruptcy or significantly reduce the number of stores operated, it could have a significant adverse effect on our business, financial condition, and results of operations.
On September 18, 2017, Toys “R” Us, Inc. (“Toys R Us”), accounting for 11.3% and 12.8% of our net sales for the fiscal years ended December 31, 2017 and 2016, announced that certain of its U.S. subsidiaries and its Canadian subsidiary voluntarily filed for relief under Chapter 11 of the Bankruptcy Code in the U.S. and that its Canadian subsidiary also began parallel proceedings under the Companies’ Creditors Arrangement Act (“CCAA”) in Canada.
On March 15, 2018, Toys R Us filed a motion to conduct an orderly wind down of its operations in the U.S. and commence store closing sales at all 735 US stores. Our worldwide Toys R Us accounts receivable balance as of March 15, 2018 is $35.9 million (unaudited). Due to the evolving nature of this matter, it is too early to assess the impact on the collectibility of this receivable and on future revenues we generate from this customer relationship (See Notes 3 and 22).
We depend upon our Chief Executive Officer and any loss or interruption of his services could adversely affect our business, financial condition and results of operations.
Our success has been largely dependent upon the experience and continued services of Stephen G. Berman, our President and Chief Executive Officer. We cannot assure you that we would be able to find an appropriate replacement for Mr. Berman should the need arise, and any loss or interruption of the services of Mr. Berman could adversely affect our business, financial condition and results of operations.
We depend upon third-party manufacturers, and if our relationship with any of them is harmed or if they independently encounter difficulties in their manufacturing processes, we could experience product defects, production delays, cost overruns or the inability to fulfill orders on a timely basis, any of which could adversely affect our business, financial condition and results of operations.
We depend upon many third-party manufacturers who develop, provide and use the tools, dyes and molds that we generally own to manufacture our products. However, we have limited control over the manufacturing processes themselves. As a result, any difficulties encountered by the third-party manufacturers that result in product defects, production delays, cost overruns or the inability to fulfill orders on a timely basis could adversely affect our business, financial condition and results of operations.
We do not have long-term contracts with our third-party manufacturers. Although we believe we could secure other third-party manufacturers to produce our products, our operations would be adversely affected if we lost our relationship with any of our current suppliers or if our current suppliers’ operations or sea or air transportation with our overseas manufacturers were disrupted or terminated even for a relatively short period of time. Our tools, dyes and molds are located at the facilities of our third-party manufacturers.
Although we do not purchase the raw materials used to manufacture our products, we are potentially subject to variations in the prices we pay our third-party manufacturers for products, depending upon what they pay for their raw materials.
We have substantial sales and manufacturing operations outside of the United States, subjecting us to risks common to international operations.
We sell products and operate facilities in numerous countries outside the United States. Sales to our international customers comprised approximately 21.9% of our net sales for the year ended December 31, 2017 and approximately 23.0% of our net sales for the year ended December 31, 2016. We expect our sales to international customers to account for a greater portion of our revenues in future fiscal periods. Additionally, we utilize third-party manufacturers, located principally in China, and are subject to the risks normally associated with international operations, including:
|
|
●
|
currency conversion risks and currency fluctuations;
|
|
|
●
|
limitations, including taxes, on the repatriation of earnings;
|
|
|
●
|
political instability, civil unrest and economic instability;
|
15
|
|
●
|
greater difficulty enforcing intellectual property rights and weaker laws protecting such rights;
|
|
|
●
|
complications in complying with laws in varying jurisdictions and changes in governmental policies;
|
|
|
●
|
greater difficulty and expenses associated with recovering from natural disasters, such as earthquakes, hurricanes and floods;
|
|
|
●
|
transportation delays and interruption;
|
|
|
●
|
work stoppages;
|
|
|
●
|
the potential imposition of tariffs; and
|
|
|
●
|
the pricing of intercompany transactions may be challenged by taxing authorities in both foreign jurisdictions and the United States, with potential increases in income taxes.
|
Our reliance upon external sources of manufacturing can be shifted, over a period of time, to alternative sources of supply, should such changes be necessary. However, if we were prevented from obtaining products or components for a material portion of our product line due to medical, political, labor or other factors beyond our control, our operations would be disrupted while alternative sources of products were secured. Also, the imposition of trade sanctions by the United States against a class of products imported by us from, or the loss of “normal trade relations” status by, China could significantly increase our cost of products imported from that nation. Because of the importance of international sales and international sourcing of manufacturing to our business, our financial condition and results of operations could be significantly and adversely affected if any of the risks described above were to occur.
Our business is subject to extensive government regulation and any violation by us of such regulations could result in product liability claims, loss of sales, diversion of resources, damage to our reputation, increased warranty costs or removal of our products from the market, and we cannot assure you that our product liability insurance for the foregoing will be sufficient.
Our business is subject to various laws, including the Federal Hazardous Substances Act, the Consumer Product Safety Act, the Flammable Fabrics Act and the rules and regulations promulgated under these acts. These statutes are administered by the CPSC, which has the authority to remove from the market products that are found to be defective and present a substantial hazard or risk of serious injury or death. The CPSC can require a manufacturer to recall, repair or replace these products under certain circumstances. We cannot assure you that defects in our products will not be alleged or found. Any such allegations or findings could result in:
|
|
●
|
product liability claims;
|
|
|
●
|
loss of sales;
|
|
|
●
|
diversion of resources;
|
|
|
●
|
damage to our reputation;
|
|
|
●
|
increased warranty and insurance costs; and
|
|
|
●
|
removal of our products from the market.
|
Any of these results may adversely affect our business, financial condition and results of operations. There can be no assurance that our product liability insurance will be sufficient to avoid or limit our loss in the event of an adverse outcome of any product liability claim.
We depend upon our proprietary rights and our inability to safeguard and maintain the same, or claims of third parties that we have violated their intellectual property rights, could have a material adverse effect on our business, financial condition and results of operations.
We rely upon trademark, copyright and trade secret protection, nondisclosure agreements and licensing arrangements to establish, protect and enforce our proprietary rights in our products. The laws of certain foreign countries may not protect intellectual property rights to the same extent or in the same manner as the laws of the United States. We cannot assure you that we or our licensors will be able to successfully safeguard and maintain our proprietary rights. Further, certain parties have commenced legal proceedings or made claims against us based upon our alleged patent infringement, misappropriation of trade secrets or other violations of their intellectual property rights. We cannot assure you that other parties will not assert intellectual property claims against us in the future. These claims could divert our attention from operating our business or result in unanticipated legal and other costs, which could adversely affect our business, financial condition and results of operations.
16
Market conditions and other third-party conduct could negatively impact our margins and implementation of other business initiatives.
Economic conditions, such as decreased consumer confidence, may adversely impact our margins. In addition, general economic conditions were significantly and negatively affected by the September 11th terrorist attacks and could be similarly affected by any future attacks. Such a weakened economic and business climate, as well as consumer uncertainty created by such a climate, could adversely affect our sales and profitability. Other conditions, such as the unavailability of electronics components, may impede our ability to manufacture, source and ship new and continuing products on a timely basis. Significant and sustained increases in the price of oil could adversely impact the cost of the raw materials used in the manufacture of our products, such as plastic.
We may not have the funds necessary to purchase our outstanding convertible senior notes upon a fundamental change or other purchase date, as required by the indenture governing the notes.
In June 2014 we sold an aggregate of $115.0 million principal amount of 4.875% convertible senior notes due on June 1, 2020, of which $113.0 million are currently outstanding (the “2020 Notes”). In July 2013, we sold an aggregate of $100.0 million principal amount of 4.25% convertible senior notes due on August 1, 2018, of which $21.2 million are currently outstanding (the “2018 Notes”) and $21.5 million were extended to November 1, 2020 (the “3.25% 2020 Notes” and collectively with the 2018 Notes and 2020 Notes, the “Notes”). Holders of the Notes may require us to repurchase for cash all or some of their notes upon the occurrence of a fundamental change (as defined in the Notes). Holders of the Notes may convert their notes upon the occurrence of specified events. Upon conversion, the Notes will be settled in shares of our common stock and/or in cash. Restrictions on borrowings under or loss of our credit facility could have a material adverse effect on our financial condition including an adverse impact on our ability to pay the Notes when due.
Restrictions under or the loss of availability under our credit facility could adversely impact our financial condition and our ability to pay our convertible senior notes when due.
In March 2014, we obtained a $75.0 million revolving line of credit. Any amounts borrowed under the revolving credit line are our senior secured obligations. All outstanding borrowings under the revolving credit line are accelerated and become immediately due and payable (and the revolving credit line terminates) in the event of a default which includes, among other things, failure to comply with financial ratio covenants or breach of representations contained in the credit line documents, defaults under other loans or obligations, involvement in bankruptcy proceedings, an occurrence of a change of control or an event constituting a material adverse effect on us (as such terms are defined in the credit line documents). We are also subject to negative covenants which, during the life of the credit line, prohibit and/or limit us from, among other things, incurring certain types of other debt, acquiring other companies, making certain expenditures or investments, changing the character of our business, and certain changes to our executive officers.
We have a valuation allowance on the deferred taxes on our books since their future realization is uncertain.
Deferred tax assets are realized by prior and future taxable income of appropriate character. Current accounting standards require that a valuation allowance be recorded if it is not likely that sufficient taxable income of appropriate character will be generated to realize the deferred tax assets. We currently believe that based on the available information, it is more likely than not that our deferred tax assets will not be realized, and accordingly we have recorded a valuation allowance against our US federal and state deferred tax assets. Our net operating losses and tax credit carry-forwards can expire if unused, and their utilization could be substantially limited in the event of an "ownership change," as defined in Section 382 of the Internal Revenue Code of 1986, as amended, or the Internal Revenue Code.
An adverse decision in litigation in which we have been named as a defendant could have a material adverse effect on our financial condition and results of operations.
We are defendants in a class action described herein and under “Legal Proceedings” in our periodic reports filed pursuant to the Securities Exchange Act of 1934 (see “Legal Proceedings”). No assurances can be given that the results of these litigation matters will be favorable to us or that an adverse decision in such litigation would not have a material adverse impact on our financial condition and results of operations.
We rely extensively on information technology in our operations, and any material failure, inadequacy, interruption, or security breach of that technology could have a material adverse impact on our business.
We rely extensively on information technology systems across our operations, including for management of our supply chain, sale and delivery of our products and services, reporting our results of operations, collection and storage of consumer data, personal data of customers, employees and other stakeholders, and various other processes and transactions. Many of these systems are managed by third-party service providers. We use third-party technology and systems for a variety of reasons, including, without limitation, encryption and authentication technology, employee email, content delivery to customers, back-office support, and other functions. A small and growing volume of our consumer products and services are web-based, and some are offered in conjunction with business partners or such third-party service providers. We, our business partners and third-party service providers collect, process, store and transmit consumer data, including personal information, in connection with those products and services. Failure to follow applicable regulations related to those activities, or to prevent or mitigate data loss or other security breaches, including breaches of our business partners’ technology and systems could expose us or our customers to a risk of loss or misuse of such information, which could adversely affect our operating results, result in regulatory enforcement, other litigation and could be a potential liability for us, and otherwise harm our business. Our ability to effectively manage our business and coordinate the production, distribution, and sale of our products and services depends significantly on the reliability and capacity of these systems and third-party service providers. Although we have developed systems and processes that are designed to protect customer information and prevent data loss and other security breaches, including systems and processes designed to reduce the impact of a security breach at a third party provider, such measures cannot provide absolute security. We have exposure to similar security risks faced by other large companies that have data stored on their information technology systems. To our knowledge, we have not experienced any material breach of our cybersecurity systems. If we or our third-party service providers systems fail to operate effectively or are damaged, destroyed, or shut down, or there are problems with transitioning to upgraded or replacement systems, or there are security breaches in these systems, any of the aforementioned could occur as a result of natural disasters, software or equipment failures, telecommunications failures, loss or theft of equipment, acts of terrorism, circumvention of security systems, or other cyber-attacks, including denial-of-service attacks, we could experience delays or decreases in product sales, and reduced efficiency of our operations. Additionally, any of these events could lead to violations of privacy laws, loss of customers, or loss, misappropriation or corruption of confidential information, trade secrets or data, which could expose us to potential litigation, regulatory actions, sanctions or other statutory penalties, any or all of which could adversely affect our business, and cause it to incur significant losses and remediation costs.
17
The following is a listing of the principal leased offices maintained by us as of February 28, 2018:
|
Property
|
Location
|
Approximate
Square Feet
|
Lease Expiration
Date
|
|||
|
US and Canada *
|
|
|
||||
|
Distribution Center
|
City of Industry, California
|
800,000
|
April 30, 2023
|
|||
|
Distribution Center
|
Hickory, North Carolina
|
139,300
|
August 31, 2018
|
|||
|
Sales Office/Showroom
|
Bentonville, Arkansas
|
9,000
|
September 30, 2019
|
|||
|
Disguise Office
|
Poway, California
|
24,200
|
March 31, 2021
|
|||
|
Sales Office
|
Hoffman Estates, Illinois
|
2,102
|
December 31, 2018
|
|||
|
Corporate Office/Showroom
|
Santa Monica, California
|
65,858
|
January 31, 2024
|
|||
|
Showroom
|
Glendale, California
|
5,830
|
January 31, 2020
|
|||
|
Distribution Center
|
Brampton, Ontario, Canada
|
105,700
|
December 31, 2019
|
|||
|
International *
|
|
|
||||
|
Europe Office
|
Berkshire, United Kingdom
|
4,746
|
January 19, 2027
|
|||
|
Hong Kong Headquarters
|
Kowloon, Hong Kong
|
41,130
|
June 30, 2019
|
|||
|
Production Inspection and Testing Office
|
Shenzhen, China
|
5,417
|
May 14, 2019
|
|||
|
Production Inspection and
Testing Lab
|
Kowloon, Hong Kong
|
34,400
|
October 31, 2018
|
|||
*The Halloween segment is included in the properties listed above.
18
We are a party to, and certain of our property is the subject of, various pending claims and legal proceedings that routinely arise in the ordinary course of our business, but we do not believe that any of these claims or proceedings will have a material effect on our business, financial condition or results of operations.
19
Not applicable.
20
PART II
Item 5. Market for Registrant’s Common Equity, Related Stockholder Matters and Issuer Purchases of Equity Securities
Market Information
Our common stock is traded on the Nasdaq Global Select exchange under the symbol “JAKK.” The following table sets forth, for the periods indicated, the range of high and low sales prices for our common stock on this exchange.
|
|
Price Range of
Common Stock
|
|||||||
|
|
High
|
Low
|
||||||
|
2016:
|
||||||||
|
First quarter
|
$
|
7.97
|
$
|
6.17
|
||||
|
Second quarter
|
8.02
|
6.94
|
||||||
|
Third quarter
|
9.75
|
7.57
|
||||||
|
Fourth quarter
|
9.15
|
4.63
|
||||||
|
2017:
|
||||||||
|
First quarter
|
5.85
|
4.78
|
||||||
|
Second quarter
|
5.55
|
3.80
|
||||||
|
Third quarter
|
4.20
|
2.68
|
||||||
|
Fourth quarter
|
3.55
|
2.20
|
||||||
Performance Graph
The graph and tables below display the relative performance of our common stock, the Russell 2000 Price Index (the “Russell 2000”) and a peer group index, by comparing the cumulative total stockholder return (which assumes reinvestment of dividends, if any) on an assumed $100 investment on December 31, 2012 in our common stock, the Russell 2000 and the peer group index over the period from January 1, 2013 to December 31, 2017.
In accordance with recently enacted regulations implemented by the Securities and Exchange Commission, we retained the services of an expert compensation consultant. In the performance of its services, such consultant used a peer group index for its analysis of our compensation policies. We believe that these companies represent a cross-section of publicly-traded companies with product lines and businesses similar to our own throughout the comparison period and, accordingly, we are using the same peer group for purposes of the performance graph. EMak Worldwide Inc. and THQ Inc. were excluded from the performance peer group in 2014, Kid Brands, Inc. was excluded in 2015 and Leapfrog Enterprises, Inc. was excluded in 2016. Deckers Outdoor Corporation was added in 2016 and our peer group index now is comprised of the following companies: Activision Blizzard, Inc., Deckers Outdoor Corporation, Electronic Arts, Inc., Hasbro, Inc., Mattel, Inc. and Take-Two Interactive, Inc.
21
The historical performance data presented below may not be indicative of the future performance of our common stock, any reference index or any component company in a reference index.
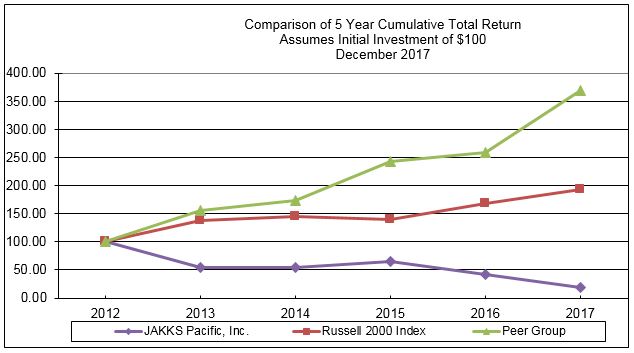
Annual Return Percentage
|
|
December 31,
2013
|
December 31,
2014
|
December 31,
2015
|
December 31,
2016
|
December 31,
2017
|
|||||||||||||||
|
JAKKS Pacific
|
(45.6
|
)%
|
1.2
|
%
|
17.1
|
%
|
(35.3
|
)%
|
(54.4
|
)%
|
||||||||||
|
Peer Group
|
55.6
|
11.7
|
39.4
|
7.0
|
42.8
|
|||||||||||||||
|
Russell 2000
|
38.8
|
4.9
|
(4.4
|
)
|
21.3
|
14.7
|
||||||||||||||
Indexed Returns
|
|
January 1,
2013
|
December 31,
2013
|
December 31,
2014
|
December 31,
2015
|
December 31,
2016
|
December 31,
2017
|
||||||||||||||||||
|
JAKKS Pacific
|
$
|
100.0
|
$
|
54.4
|
$
|
55.1
|
$
|
64.4
|
$
|
41.7
|
$
|
19.0
|
||||||||||||
|
Peer Group
|
100.0
|
155.6
|
173.8
|
242.2
|
259.2
|
370.6
|
||||||||||||||||||
|
Russell 2000
|
100.0
|
138.8
|
145.6
|
139.2
|
168.9
|
193.6
|
||||||||||||||||||
Security Holders
To the best of our knowledge, as of March 6, 2018, there were 109 holders of record of our common stock. We believe there are numerous beneficial owners of our common stock whose shares are held in “street name.”
Dividends
The payment of dividends on common stock is at the discretion of the Board of Directors and is subject to customary limitations. We currently intend to retain our future earnings, if any, to finance the growth and development of our business and/or buy back in the market some of our common stock and/or retire some of our outstanding convertible senior notes.
22
Equity Compensation Plan Information
The table below sets forth the following information as of the year ended December 31, 2017 for (i) all compensation plans previously approved by our stockholders and (ii) all compensation plans not previously approved by our stockholders, if any:
(a) the number of securities to be issued upon the exercise of outstanding options, warrants and rights;
(b) the weighted-average exercise price of such outstanding options, warrants and rights; and
(c) other than securities to be issued upon the exercise of such outstanding options, warrants and rights, the number of securities remaining available for future issuance under the plans.
|
Plan Category
|
Number of
Securities to
be Issued
Upon
Exercise of
Outstanding
Options,
Warrants
and Rights
(a)
|
Weighted-
Average Exercise
Price of
Outstanding
Options,
Warrants and
Rights
(b)
|
Number of
Securities
Remaining
Available for
Future Issuance
Under
Equity
Compensation
Plans, Excluding
Securities Reflected
in
Column (a)
(c)
|
|||||||||
|
Equity compensation plans approved by security holders
|
―
|
$
|
―
|
3,539,848
|
||||||||
|
Equity compensation plans not approved by security holders
|
―
|
―
|
—
|
|||||||||
|
Total
|
―
|
$
|
―
|
3,539,848
|
||||||||
Equity compensation plans approved by our stockholders consists of the 2002 Stock Award and Incentive Plan. An additional 1.4 million and 2.5 million shares were added to the number of total issuable shares under the Plan and approved by the Board in 2013 and 2017, respectively. Additionally, 981,208 shares of restricted stock awards remained unvested as of December 31, 2017. Disclosures with respect to equity issuable to certain of our executive officers pursuant to the terms of their employment agreements is disclosed below under Item 11.
Issuer Purchases of Equity Securities
There were no issuer purchases of equity securities in the fourth quarter of 2017.
Issuer Unregistered Sale of Equity Securities
There were no issuer sales of unregistered equity securities in the fourth quarter of 2017.
23
You should read the financial data set forth below in conjunction with “Management’s Discussion and Analysis of Financial Condition and Results of Operations” (included in Item 7) and our consolidated financial statements and the related notes (included in Item 8).
|
|
Years Ended December 31,
|
|||||||||||||||||||
|
|
2013
|
2014
|
2015
|
2016
|
2017
|
|||||||||||||||
|
|
(In thousands, except per share data)
|
|||||||||||||||||||
|
Consolidated Statement of Operations Data:
|
||||||||||||||||||||
|
Net sales
|
$
|
632,925
|
$
|
810,060
|
$
|
745,741
|
$
|
706,603
|
$
|
613,111
|
||||||||||
|
Cost of sales
|
477,146
|
574,253
|
517,172
|
483,582
|
457,430
|
|||||||||||||||
|
Gross profit
|
155,779
|
235,807
|
228,569
|
223,021
|
155,681
|
|||||||||||||||
|
Selling, general and administrative expenses
|
195,296
|
203,326
|
198,039
|
205,915
|
206,303
|
|||||||||||||||
|
Goodwill and other intangibles impairment
|
―
|
―
|
―
|
―
|
13,536
|
|||||||||||||||
|
Reorganization charges
|
5,015
|
1,154
|
―
|
―
|
―
|
|||||||||||||||
|
Income (loss) from operations
|
(44,532
|
)
|
31,327
|
30,530
|
17,106
|
(64,158
|
)
|
|||||||||||||
|
Change in fair value of business combination liability
|
6,000
|
5,932
|
5,642
|
―
|
―
|
|||||||||||||||
|
Income (loss) from joint ventures
|
(3,148
|
)
|
314
|
2,761
|
889
|
105
|
||||||||||||||
|
Other income
|
―
|
―
|
―
|
305
|
342
|
|||||||||||||||
|
Loss on extinguishment of convertible senior notes
|
―
|
―
|
―
|
―
|
(919
|
)
|
||||||||||||||
|
Write-off of investment in DreamPlay, LLC
|
―
|
―
|
―
|
―
|
(7,000
|
)
|
||||||||||||||
|
Interest income
|
327
|
112
|
62
|
51
|
37
|
|||||||||||||||
|
Interest expense
|
(9,942
|
)
|
(12,461
|
)
|
(12,402
|
)
|
(12,975
|
)
|
(9,829
|
)
|
||||||||||
|
Income (loss) before provision for income taxes
|
(51,295
|
)
|
25,224
|
26,593
|
5,376
|
(81,422
|
)
|
|||||||||||||
|
Provision for income taxes
|
2,611
|
3,715
|
3,423
|
4,127
|
1,606
|
|||||||||||||||
|
Net income (loss)
|
(53,906
|
)
|
21,509
|
23,170
|
1,249
|
(83,028
|
)
|
|||||||||||||
|
Net income (loss) attributable to non-controlling interests
|
―
|
―
|
(84
|
)
|
6
|
57
|
||||||||||||||
|
Net income (loss) attributable to JAKKS Pacific, Inc.
|
$
|
(53,906
|
)
|
$
|
21,509
|
$
|
23,254
|
$
|
1,243
|
$
|
(83,085
|
)
|
||||||||
|
Basic earnings (loss) per share
|
$
|
(2.43
|
)
|
$
|
1.03
|
$
|
1.20
|
$
|
0.08
|
$
|
(3.89
|
)
|
||||||||
|
Diluted earnings (loss) per share
|
$
|
(2.43
|
)
|
$
|
0.70
|
$
|
0.71
|
$
|
0.07
|
$
|
(3.89
|
)
|
||||||||
|
Dividends declared per common share
|
$
|
0.14
|
$
|
—
|
$
|
—
|
$
|
—
|
$
|
—
|
||||||||||
During the third quarter of 2017, we recorded impairment charges of $8.3 million to write off goodwill, $2.9 million to write off the remaining unamortized technology rights related to DreamPlay, LLC, and $2.3 million to write down several underutilized trademarks and trade names that were determined to have no value. Additionally, we wrote off our investment in DreamPlay, LLC in the amount of $7.0 million. During the third and fourth quarters of 2017, we recorded a charge of $9.6 million related to the write-down of certain excess and impaired inventory, recognized a bad debt write-off of $8.9 million related to the Toys “R” Us bankruptcy filing on September 18, 2017, and recorded a charge of $20.5 million related to the write-down of license advances and minimum guarantees that are not expected to be earned through sales of that licensed product. During the fourth quarter of 2017, we recognized a $0.6 million loss related to the extinguishment of $21.5 million face amount of our 4.25% convertible senior notes due in 2018 and we recognized a $0.3 million loss related to the fair market value adjustment for the 3.25% convertible senior notes due in 2020.
During the second quarter of 2016, we recorded income of $0.7 million related to Pacific Animation Partners and $0.2 million for funds received related to our former video game joint venture, which is included in income (loss) from joint ventures.
During the third quarter of 2015, we recorded income of $5.6 million related to the reversal of a portion of the Maui earn-out and during the second and fourth quarters of 2015 we recorded an aggregate of $2.7 million related to our former video game joint venture with THQ.
During the second quarter of 2014, we incurred restructuring charges of $1.2 million related to office space consolidations as part of the reorganization plan which commenced in the third quarter of 2013. During the third quarter of 2014, we recorded income of $5.9 million related to the reversal of a portion of the Maui earn-out. The Maui earn-out reversal was due to Maui not achieving the prescribed earn-out targets in 2014.
24
In 2013, we recorded a charge of $14.9 million related to the write-down of certain excess and impaired inventory. We also recorded a charge of $14.4 million related to the write-down of license advances and minimum guarantees that are not expected to be earned through sales of that licensed product. During the fourth quarter of 2013, we incurred restructuring charges of $5.0 million related to the office space consolidations given the decrease in sales in 2013, and recorded income of $6.0 million related to the reversal of a portion of the Maui earn-out. The Maui earn-out reversal was due to Maui not achieving the prescribed earn-out targets in 2013.
|
|
|
At December 31,
|
||||||||||||||||||
|
|
|
2013
|
|
2014
|
|
2015
|
|
2016
|
|
2017
|
||||||||||
|
|
|
(In thousands)
|
||||||||||||||||||
|
Consolidated Balance Sheet Data:
|
|
|
|
|
|
|
|
|
|
|
|
|
|
|
|
|||||
|
Cash and cash equivalents
|
|
$
|
117,071
|
|
|
$
|
71,525
|
|
|
$
|
102,528
|
|
|
$
|
86,064
|
|
|
$
|
64,977
|
|
|
Working capital
|
|
|
136,337
|
|
|
|
246,245
|
|
|
|
254,967
|
|
|
|
236,569
|
|
|
|
146,911
|
|
|
Total assets
|
|
|
449,844
|
|
|
|
561,782
|
|
|
|
499,620
|
|
|
|
464,303
|
|
|
|
370,349
|
|
|
Short-term debt
|
|
|
38,098
|
|
|
|
―
|
|
|
|
―
|
|
|
|
10,000
|
|
|
|
26,178
|
|
|
Long-term debt
|
|
|
100,000
|
|
|
|
215,000
|
|
|
|
215,000
|
|
|
|
206,865
|
|
|
|
135,469
|
|
|
Total stockholders' equity
|
|
|
148,685
|
|
|
|
145,084
|
|
|
|
153,406
|
|
|
|
135,200
|
|
|
|
94,513
|
|
25
The following Management’s Discussion and Analysis of Financial Condition and Results of Operations contains forward-looking statements that involve risks and uncertainties. Our actual results could differ materially from those anticipated in these forward-looking statements as a result of various factors. You should read this section in conjunction with our consolidated financial statements and the related notes (included in Item 8).
Critical Accounting Policies
The accompanying consolidated financial statements and supplementary information were prepared in accordance with accounting principles generally accepted in the United States of America. Significant accounting policies are discussed in Note 2 to the Consolidated Financial Statements, Item 8. Inherent in the application of many of these accounting policies is the need for management to make estimates and judgments in the determination of certain revenues, expenses, assets and liabilities. As such, materially different financial results can occur as circumstances change and additional information becomes known. The policies with the greatest potential effect on our results of operations and financial position include:
Allowance for Doubtful Accounts. Our allowance for doubtful accounts is based upon management’s assessment of the business environment, customers’ financial condition, historical collection experience, accounts receivable aging, customer disputes and the collectability of specific customer accounts. If there were a deterioration of a major customer’s creditworthiness, or actual defaults were higher than our historical experience, our estimates of the recoverability of amounts due to us could be overstated, which could have an adverse impact on our operating results. Our allowance for doubtful accounts is also affected by the time at which uncollectible accounts receivable balances are actually written off.
Major customers’ accounts are monitored on an ongoing basis; more in-depth reviews are performed based upon changes in a customer’s financial condition and/or the level of credit being extended. When a significant event occurs, such as a bankruptcy filing by a specific customer, and on a quarterly basis, the allowance is reviewed for adequacy and the balance or accrual rate is adjusted to reflect current risk prospects.
Revenue Recognition. Our revenue recognition policy is to recognize revenue when persuasive evidence of an arrangement exists, title transfer has occurred (product shipment), the price is fixed or determinable and collectability is reasonably assured. Sales are recorded net of sales returns and discounts, which are estimated at the time of shipment based upon historical data. JAKKS routinely enters into arrangements with its customers to provide sales incentives and support customer promotions and we provide allowances for returns and defective merchandise. Such programs are primarily based upon customer purchases, customer performance of specified promotional activities and other specified factors such as sales to consumers. Accruals for these programs are recorded as sales adjustments that reduce gross revenue in the period the related revenue is recognized.
Goodwill and other indefinite-lived intangible assets. Goodwill and indefinite-lived intangible assets are not amortized, but are tested for impairment at least annually at the reporting unit level.
Factors we consider important that could trigger an impairment review include the following:
|
|
●
|
significant underperformance relative to expected historical or projected future operating results;
|
|
|
●
|
significant changes in the manner of our use of the acquired assets or the strategy for our overall business; and
|
|
|
●
|
significant negative industry or economic trends.
|
Due to the subjective nature of the impairment analysis, significant changes in the assumptions used to develop the estimate could materially affect the conclusion regarding the future cash flows necessary to support the valuation of long-lived assets, including goodwill. The valuation of goodwill involves a high degree of judgment and uncertainty related to our key assumptions. Any changes in our key projections or estimates could result in a reporting unit either passing or failing the first step of the impairment model, which could significantly change the amount of any impairment ultimately recorded.
Based upon the assumptions underlying the valuation, impairment is determined by estimating the fair value of a reporting unit and comparing that value to the reporting unit’s book value. Goodwill is tested for impairment annually, and on an interim basis if certain events or circumstances indicate that an impairment loss may have been incurred. If the fair value is more than the carrying value of the reporting unit, an impairment loss is not indicated. If a reporting unit's carrying value exceeds its fair value, an impairment charge would be recognized for the excess amount, not to exceed the carrying amount of goodwill.
26
We performed our annual assessment of goodwill for impairment as of our annual testing date being April 1, 2017 for each of our reporting units by evaluating qualitative factors, including, but not limited to, the performance of each reporting unit, general economic conditions, access to capital, the industry and competitive environment, and the interest rate environment. We prepared step-one of our impairment model. Based on our assessment, we determined that the fair values of our reporting units were not less than the carrying amounts. In addition, as a result of operating performance below expectations for the full year of 2017 that became apparent in September 2017, we performed a subsequent impairment assessment on goodwill as of September 30, 2017. Based on our assessment, we determined that the fair values of two of our reporting units were less than the carrying amounts, resulting in an aggregate impairment charge of $8.3 million. The amount of goodwill assigned to each of the three reporting units, U.S. and Canada, International, and Halloween, amounted to $23.8 million, $11.6 million, and nil, respectively, after the impairment charge.
Goodwill and intangible assets amounted to $57.6 million as of December 31, 2017.
Reserve for Inventory Obsolescence. We value our inventory at the lower of cost or market. Based upon a consideration of quantities on hand, actual and projected sales volume, anticipated product selling prices and product lines planned to be discontinued, slow-moving and obsolete inventory is written down to its net realizable value.
Failure to accurately predict and respond to consumer demand could result in us under-producing popular items or overproducing less popular items. Furthermore, significant changes in demand for our products would impact management’s estimates in establishing our inventory provision.
Management estimates are monitored on a quarterly basis and a further adjustment to reduce inventory to its net realizable value is recorded, as an increase to cost of sales, when deemed necessary under the lower of cost or market standard.
Income Allocation for Income Taxes. Our annual income tax provision and related income tax assets and liabilities are based upon actual income as allocated to the various tax jurisdictions based upon our transfer pricing study, US and foreign statutory income tax rates and tax regulations and planning opportunities in the various jurisdictions in which we operate. Significant judgment is required in interpreting tax regulations in the U.S. and foreign jurisdictions, and in evaluating worldwide uncertain tax positions. Actual results could differ materially from those judgments, and changes from such judgments could materially affect our consolidated financial statements.
Income taxes and interest and penalties related to income tax payable. We do not file a consolidated return for our foreign subsidiaries. We file federal and state returns and our foreign subsidiaries each file returns in their respective jurisdictions, as applicable. Deferred taxes are provided on a liability method, whereby deferred tax assets are recognized as deductible temporary differences and operating loss and tax credit carry-forwards and deferred tax liabilities are recognized for taxable temporary differences. Temporary differences are the differences between the reported amounts of assets and liabilities and their tax bases. Deferred tax assets are reduced by a valuation allowance when, in the opinion of management, it is more likely than not that some or all of the deferred tax assets will not be realized. Deferred tax assets and liabilities are adjusted for the effects of changes in tax laws and rates on the date of enactment.
We must assess the likelihood that we will be able to recover our deferred tax assets. Deferred tax assets are reduced by a valuation allowance, if, based upon the weight of available evidence, it is more likely than not that we will not realize some portion or all of the deferred tax assets. We consider all available positive and negative evidence when assessing whether it is more likely than not that deferred tax assets are recoverable. We consider evidence such as our past operating results, the existence of cumulative losses in previous periods and our forecast of future taxable income. We believe this to be a critical accounting policy because should there be a change in our ability to recover our deferred tax assets, our tax provision would increase in the period in which we determine that the recovery is not likely, as well as decrease in the period in which the assessment of the recoverability of the deferred tax assets reverses, which could have a material impact on our results of operations.
We accrue a tax reserve for additional income taxes and interest, which may become payable in future years as a result of audit adjustments by tax authorities. The reserve is based upon management’s assessment of all relevant information and is periodically reviewed and adjusted as circumstances warrant. As of December 31, 2017, our income tax reserves were approximately $1.3 million and relates to the potential tax settlement in Hong Kong, adjustments in the area of withholding taxes, and state taxes.
We recognize current period interest expense and the reversal of previously recognized interest expense that has been determined to not be assessable due to the expiration of the related audit period or other compelling factors on the income tax liability for unrecognized tax benefits as interest expense, and penalties and penalty reversals related to the income taxes payable as other expense in our consolidated statements of operations.
The U.S. Tax Cuts and Jobs Act (the Act) was signed into law on December 22, 2017 and introduces significant changes to the Internal Revenue Code. Effective for tax years beginning after December 31, 2017, the Act reduces the U.S. statutory tax rate from 35% to 21% and creates new taxes on certain foreign-sourced earnings and related-party payments, which are referred to as the global intangible low-taxed income and the base erosion and anti-abuse tax, respectively. In addition, the Act includes a one-time transition tax as of December 31, 2017 on accumulated foreign subsidiary earnings that were previously tax deferred. Due to the timing of the enactment and the complexity involved in applying the provisions of the Act, the SEC issued guidance on December 22, 2017 to address the application of US GAAP in situations when a registrant does not have the necessary information available, prepared, or analyzed in reasonable detail to complete the accounting for certain income tax effects of the Act. In accordance with this guidance, we have made reasonable estimates of the effects of the Act and recorded provisional amounts in our financial statements as of December 31, 2017. For the items for which we determined a reasonable estimate, we recognized a provisional amount of $34.3 million, which is included as a component of income tax expense from continuing operations and partially reduced by fully-valued tax attribute carryforwards. As we collect and prepare necessary data, and interpret the Act and any additional guidance issued by the U.S. Treasury Department, the IRS, and other standard-setting bodies, we may make adjustments to the provisional amounts. Those adjustments may materially impact our provision for income taxes and effective tax rate in the period in which the adjustments are made. The accounting for the tax effects of the Act will be completed in 2018.
27
Share-Based Compensation. We grant restricted stock and options to purchase our common stock to our employees (including officers) and non-employee directors under our 2002 Stock Award and Incentive Plan (the “Plan”), which incorporated the shares remaining under our Third Amended and Restated 1995 Stock Option Plan. The benefits provided under the Plan are share-based payments. Related to the stock option grants, we estimate the value of share-based awards on the date of grant using the Black-Scholes option-pricing model. The determination of the fair value of share-based payment awards on the date of grant using an option-pricing model is affected by our stock price, as well as assumptions regarding a number of complex and subjective variables. These variables include our expected stock price volatility over the term of the awards, actual and projected employee stock option exercise behaviors, cancellations, terminations, risk-free interest rates and expected dividends. Related to the restricted stock award grants, we determine the value of each award based on the market value of the underlying common stock at the date of each grant and expense each award over the stipulated service period.
Recent Accounting Pronouncements.
In May 2014, the FASB issued Accounting Standards Update (“ASU”) 2014-09, “Revenue from Contracts with Customers (Topic 606)”, which supersedes the revenue recognition requirements in Accounting Standard Codification (“ASC”) 605, (Topic 605), and most industry-specific guidance. Under the new model, recognition of revenue occurs when a customer obtains control of promised goods or services in an amount that reflects the consideration to which the entity expects to be entitled in exchange for those goods or services. In addition, the new standard requires that reporting companies disclose the nature, amount, timing, and uncertainty of revenue and cash flows arising from contracts with customers. In August 2015, the FASB issued ASU 2015-14, “Revenue from Contracts with Customers – Deferral of the Effective Date”, which defers the effective date of ASU 2014-09 to annual reporting periods beginning after December 15, 2017, and interim periods therein. In 2016, the FASB issued ASU 2016-08, “Principal versus Agent Considerations (Reporting Revenue Gross versus Net)”, ASU 2016-10, “Identifying Performance Obligations and Licensing”, and ASU 2016-12, “Revenue from Contracts with Customers - Narrow-Scope Improvements and Practical Expedients”. Entities have the choice to adopt these updates using either of the following transition methods: (i) a full retrospective approach reflecting the application of the standard in each prior reporting period with the option to elect certain practical expedients, or (ii) a modified retrospective approach with the cumulative effect of these standards recognized at the date of the adoption.
Our approach to analyze the impact of the standard on our revenue contracts included a review of existing contracts with customers, an evaluation of the specific terms of those contracts and the appropriate treatment under the new standards, and a comparison of that new treatment to our existing accounting policies to identify differences. We will adopt the requirements of the new standard on January 1, 2018 using the modified retrospective approach.
We identified the same performance obligation (sale of our products) under Topic 606 as compared with deliverables and separate units of account previously identified under Topic 605.
We do offer certain types of variable consideration to customers such as discounts, pricing allowances and collaborative marketing arrangements. The standard requires us to estimate these amounts. We anticipate that the timing and measurement of revenue will be consistent with our current revenue recognition although our approach to revenue recognition will now be based on the transfer of control. As a result, there will be no impact on our consolidated financial statements on our adoption of the new standard as of January 1, 2018.
We established new key controls within our financial reporting infrastructure specific to our adoption of ASC 606. Furthermore, additional disclosures will be required to enable users to understand the nature, amount, timing, and uncertainty of revenue and cash flows arising from contracts with customers. Beginning in the first quarter of 2018, additional disclosures will include, but are not limited to, significant judgments and practical expedients elected in the adoption of Topic 606.
In January 2016, the FASB issued ASU 2016-01, “Financial Instruments - Overall: Recognition and Measurement of Financial Assets and Financial Liabilities” (“ASU 2016-01”). The new guidance is intended to improve the recognition and measurement of financial instruments. The ASU is effective for fiscal years and interim periods within those years beginning after December 15, 2017. The adoption of this standard is not expected to have a material impact on our consolidated financial statements.
In February 2016, the FASB issued ASU 2016-02, “Leases” (“ASU 2016-02”). ASU 2016-02 establishes a right-of-use (“ROU”) model that requires a lessee to record a ROU asset and a lease liability on the balance sheet for all leases with terms longer than 12 months. Leases will be classified as either finance or operating, with classification affecting the pattern of expense recognition in the income statement. ASU 2016-02 is effective for fiscal years beginning after December 15, 2018, including interim periods within those fiscal years. A modified retrospective transition approach is required for lessees for capital and operating leases existing at, or entered into after, the beginning of the earliest comparative period presented in the financial statements, with certain practical expedients available. We are currently evaluating the impact of the pending adoption of this new standard on our consolidated financial statements.
In August 2016, the FASB issued ASU 2016-15, “Statement of Cash Flows (Topic 230): Classification of Certain Cash Receipts and Cash Payments.” The new guidance is intended to reduce diversity in practice in how transactions are classified in the statement of cash flows. This ASU is effective for fiscal years, and for interim periods within those fiscal years, beginning after December 15, 2017. The adoption of this standard is not expected to have a material impact on our consolidated financial statements.
In October 2016, the FASB issued ASU 2016-16, “Income Taxes (Topic 740): Intra-Entity Transfers of Assets Other than Inventory.” The amendments in this ASU reduces the complexity in the accounting standards by allowing the recognition of current and deferred income taxes for an intra-entity asset transfer, other than inventory, when the transfer occurs. Historically, recognition of the income tax consequence was not recognized until the asset was sold to an outside party. This ASU is effective for fiscal years, and interim periods within those fiscal years, beginning after December 15, 2017. Early adoption is permitted. The adoption of this standard is not expected to have a material impact on our consolidated financial statements.
In May 2017, the FASB issued ASU 2017-09, “Compensation—Stock Compensation (Topic 718): Scope of Modification Accounting”, which clarifies when to account for a change to the terms or conditions of a share-based payment award as a modification. Under the new guidance, modification accounting is required only if the fair value, vesting conditions, or the classification of the award (as equity or liability) changes as a result of the change in terms or conditions. ASU 2017-09 is effective for fiscal years beginning after December 15, 2017, including interim periods within those fiscal years. The adoption of this standard is not expected to have a material impact on our consolidated financial statements.
28
Results of Operations
The following table sets forth, for the periods indicated, certain statement of operations data as a percentage of net sales.
|
|
Years Ended December 31,
|
|||||||||||
|
|
2015
|
2016
|
2017
|
|||||||||
|
Net Sales
|
100.0
|
%
|
100.0
|
%
|
100.0
|
%
|
||||||
|
Cost of Sales
|
69.4
|
68.4
|
74.6
|
|||||||||
|
Gross profit
|
30.6
|
31.6
|
25.4
|
|||||||||
|
Selling, general and administrative expenses
|
26.5
|
29.1
|
33.7
|
|||||||||
|
Goodwill and other intangibles impairment
|
―
|
―
|
2.2
|
|||||||||
|
Income (loss) from operations
|
4.1
|
2.5
|
(10.5
|
)
|
||||||||
|
Change in fair value of business combination liability
|
0.8
|
―
|
―
|
|||||||||
|
Income from joint ventures
|
0.4
|
0.1
|
―
|
|||||||||
|
Other income
|
―
|
―
|
0.1
|
|||||||||
|
Loss on extinguishment of convertible senior notes
|
―
|
―
|
(0.2
|
)
|
||||||||
|
Write-off of investment in DreamPlay, LLC
|
―
|
―
|
(1.1
|
)
|
||||||||
|
Interest income
|
―
|
―
|
―
|
|||||||||
|
Interest expense
|
(1.7
|
)
|
(1.8
|
)
|
(1.6
|
)
|
||||||
|
Income (loss) before provision for income taxes
|
3.6
|
0.8
|
(13.3
|
)
|
||||||||
|
Provision for income taxes
|
0.5
|
0.6
|
0.2
|
|||||||||
|
Net income (loss)
|
3.1
|
0.2
|
(13.5
|
)
|
||||||||
|
Net income attributable to non-controlling interests
|
―
|
―
|
0.1
|
|||||||||
|
Net income (loss) attributable to JAKKS Pacific, Inc.
|
3.1
|
%
|
0.2
|
%
|
(13.6
|
)%
|
||||||
The following table summarizes, for the periods indicated, certain income statement data by segment (in thousands).
|
|
Years Ended December 31,
|
|||||||||||
|
|
2015
|
2016
|
2017
|
|||||||||
|
|
||||||||||||
|
Net Sales
|
||||||||||||
|
U.S. and Canada
|
$
|
478,728
|
$
|
478,595
|
$
|
406,411
|
||||||
|
International
|
169,826
|
131,229
|
107,231
|
|||||||||
|
Halloween
|
97,187
|
96,779
|
99,469
|
|||||||||
|
|
745,741
|
706,603
|
613,111
|
|||||||||
|
Cost of Sales
|
||||||||||||
|
U.S. and Canada
|
334,989
|
322,721
|
297,115
|
|||||||||
|
International
|
110,174
|
89,187
|
81,381
|
|||||||||
|
Halloween
|
72,009
|
71,674
|
78,934
|
|||||||||
|
|
517,172
|
483,582
|
457,430
|
|||||||||
|
Gross Profit
|
||||||||||||
|
U.S. and Canada
|
143,739
|
155,874
|
109,296
|
|||||||||
|
International
|
59,652
|
42,042
|
25,850
|
|||||||||
|
Halloween
|
25,178
|
25,105
|
20,535
|
|||||||||
|
|
$
|
228,569
|
$
|
223,021
|
$
|
155,681
|
||||||
29
Comparison of the Years Ended December 31, 2017 and 2016
Net Sales
U.S. and Canada. Net sales of our U.S. and Canada segment were $406.4 million in 2017, compared to $478.6 million in 2016, representing a decrease of $72.2 million, or 15.1%. The decrease in net sales was primarily due to decreases in unit sales in our Disney Tsum Tsum, Disney Frozen, XPV radio controlled vehicles, Graco, and Star Wars product lines partially offset by higher unit sales in our Moana, Squish-Dee-Lish, Beauty and the Beast Live Action, Tangled – the Series, and Real Workin’ Buddies – Mr. Dusty product lines.
International. Net sales of our International segment were $107.2 million in 2017, compared to $131.2 million in 2016, representing a decrease of $24.0 million, or 18.3%. The decrease in net sales was primarily driven by declines in unit sales in our Disney Frozen, Star Wars, and Sofia the First product lines, partially offset by higher unit sales in our Moana, Elena of Avalor, Beauty & the Beast Live Action product lines.
Halloween. Net sales of our Halloween segment were $99.5 million in 2017, compared to $96.8 million in 2016, representing an increase of $2.7 million, or 2.8%. The increase in net sales was due to an increase in unit sales of a variety of products in 2017.
Cost of Sales
U.S. and Canada. Cost of sales of our U.S. and Canada segment was $297.1 million, or 73.1% of related net sales in 2017 compared to $322.7 million, or 67.4% of related net sales in 2016, representing a decrease of $25.6 million, or 7.9%. The decrease in cost of sales is due to lower overall unit sales in 2017, partially offset by minimum guarantee shortfalls. The increase as a percentage of net sales, year over year, is primarily due to increased charges recorded for minimum guarantee shortfalls and inventory impairment.
International. Cost of sales of our International segment was $81.4 million, or 75.9% of related net sales in 2017 compared to $89.2 million, or 68.0% of related net sales in 2016, representing a decrease of $7.8 million, or 8.7%. The decrease in cost of sales is due to lower overall unit sales in 2017, partially offset by minimum guarantee shortfalls. The increase as a percentage of net sales, year-over-year, is primarily due to increased charges recorded for minimum guarantee shortfalls and inventory impairment.
Halloween. Cost of sales of our Halloween segment was $78.9 million, or 79.3% of related net sales for 2017 compared to $71.7 million, or 74.1% of related net sales in 2016, representing an increase of $7.2 million, or 10.0%. The increase in cost of sales is due to higher overall unit sales in 2017 and minimum guarantee shortfalls. The increase as a percentage of net sales, year-over-year, is primarily due to increased charges for minimum guarantee shortfalls, changes in product mix and inventory impairment.
Selling, General and Administrative Expenses
Selling, general and administrative expenses were $206.3 million in 2017 and $205.9 million in 2016, constituting 33.7% and 29.1% of net sales, respectively. Selling, general and administrative expenses increased by $0.4 million, primarily due to bad debt write-offs of $11.2 million, offset by lower marketing expense and other general and administrative costs. The increases as a percentage of net sales, year over year is due to the lower net sales in 2017 coupled with comparable costs.
Goodwill and Other Intangibles Impairment
Goodwill and other intangibles impairment was $13.5 million for 2017, as compared to nil in the prior year period. In 2017, we recorded impairment charges of $8.3 million for goodwill, $2.9 million to write-off the remaining unamortized technology rights related to DreamPlay, LLC and $2.3 million to write down several underutilized trademarks and trade names that were determined to have no value.
Income from Joint Ventures
We recognized $0.1 million of income for funds received in 2017 related to our former video game joint venture in partial settlement of amounts owed to the Company when our joint venture partner was liquidated pursuant to their 2012 bankruptcy filing. It is not known if any additional funds will be received by us. In 2016, we recognized $0.2 million of income for funds received related to our former video game joint venture and $0.7 million of income for funds received related to Pacific Animation Partners.
Other Income
We recognized income of $0.1 million for funds received in 2017 related to the disgorgement of short swing trading profits from a shareholder, net of legal fees and a $0.1 million gain on extinguishment of convertible senior notes. We recognized income of $0.2 million for funds received in 2016 related to the disgorgement of short swing trading profits from a shareholder, net of legal fees and a $0.1 million gain on extinguishment of convertible senior notes.
Loss on Extinguishment of Convertible Senior Notes
In 2017, we recognized a $0.6 million loss related to the extinguishment of $21.5 million face amount of our 4.25% convertible senior notes due in 2018. In 2017, we also recognized a $0.3 million loss related to the fair market value adjustment for the 3.25% convertible senior notes due in 2020.
30
Interest Income
Interest income in 2017 was $37,000, comparable to $51,000 in 2016.
Interest Expense
Interest expense was $9.8 million in 2017, as compared to $13.0 million in the prior year period. In 2017, we recorded interest expense of $9.4 million related to our convertible senior notes payable due in 2018 and 2020 and $0.4 million related to our revolving credit facility. In 2016, we recorded interest expense of $11.7 million related to our convertible senior notes payable, $0.9 million related to our revolving credit facility and $0.4 million related to the interest component of our Maui acquisition earn-out. The overall decrease in 2017 is due to a lower average debt.
Provision for Income Taxes
Our income tax expense, which includes federal, state and foreign income taxes and discrete items, was $1.6 million, or an effective tax rate of (2.0%) for 2017. During 2016, the income tax expense was $4.1 million, or an effective tax rate of 76.8%.
The 2017 tax expense of $1.6 million included a discrete tax benefit of $0.6 million primarily comprised of return to provision and uncertain tax position adjustments. Absent these discrete tax benefits, our effective tax rate for 2017 was (2.8%), primarily due to the US federal transition tax, various state taxes and taxes on foreign income.
The 2016 tax expense of $4.1 million included a discrete tax benefit of $0.1 million primarily comprised of return to provision adjustments. Absent these discrete tax expenses, our effective tax rate for 2016 was 79.2%, primarily due to US federal alternative minimum tax, various state taxes and taxes on foreign income.
We assess the available positive and negative evidence to estimate if sufficient future taxable income will be generated to use the existing deferred tax assets by jurisdiction. Based on our evaluation of all positive and negative evidence, as of December 31, 2017, a valuation allowance of $89.7 million has been recorded against the deferred tax assets that more likely than not will not be realized. The net deferred tax liabilities of $0.8 million consists of the net deferred tax liabilities in the foreign jurisdiction, where we are in a cumulative income position, partially offset by the deferred tax assets in the US related to the AMT carryforward, which are fully realizable.
Comparison of the Years Ended December 31, 2016 and 2015
Net Sales
U.S. and Canada. Net sales of our U.S. and Canada segment were $478.6 million in 2016, compared to $478.7 million in 2015, representing a decrease of $0.1 million. Net sales were flat year-over year primarily due to a decrease in unit sales of various products due to the suspension of shipments to a major U.S. customer and lower than expected unit sales of some movie licensed products, offset by higher unit sales of our Disney Tsum Tsum line of collectibles, Disney Princess and Alice Through the Looking Glass dolls, kids furniture and accessories, and our Big Figs line.
International. Net sales of our International segment were $131.2 million in 2016, compared to $169.8 million in 2015, representing a decrease of $38.6 million, or 22.7%. The decrease in net sales was primarily driven by declines in unit sales of various products in the United Kingdom and Western Europe due to the reduced buying power of our customers stemming from the devaluation of the British Pound, and lower than expected unit sales of movie licensed product.
Halloween. Net sales of our Halloween segment were $96.8 million in 2016, compared to $97.2 million in 2015, representing a decrease of $0.4 million, or 0.4%. The decrease in net sales was primarily due to a decrease in unit sales of a variety of products in 2016.
Cost of Sales
U.S. and Canada. Cost of sales of our U.S. and Canada segment was $322.7 million, or 67.4% of related net sales in 2016 compared to $335.0 million, or 70.0% of related net sales in 2015, representing a decrease of $12.3 million, or 3.7%. The decrease in cost of sales as a percentage of net sales, year over year, is due to reduced costing of legacy products and product mix, partially offset by increased product tooling driven by new product introductions in 2016. Depreciation of molds and tools for the segment increased slightly in 2016 due to an increase in new product tooling driven by product introductions in 2016.
31
International. Cost of sales of our International segment was $89.2 million, or 68.0% of related net sales in 2016 compared to $110.2 million, or 64.9% of related net sales in 2015, representing a decrease of $21.0 million, or 19.1%. The decrease in cost of sales is a direct function of lower overall unit sales. The increase as a percentage of net sales, year-over-year, is due to the change in product mix to relatively higher cost product and an increase in the average royalty rate. The increase in royalties is driven by a shift in the product mix to products with relatively higher royalty rates and an increase in royalty rates on shipments made FOB China. Our depreciation of molds and tools for the segment showed a modest increase from 2015 due to increased product tooling driven by new product introductions in 2016.
Halloween. Cost of sales of our Halloween segment was $71.7 million, or 74.1% of related net sales for 2016 compared to $72.0 million, or 74.1% of related net sales in 2015, representing a decrease of $0.3 million, or 0.4%. The percentage of net sales in 2016 is comparable to 2015.
Selling, General and Administrative Expenses
Selling, general and administrative expenses were $205.9 million in 2016 and $198.0 million in 2015, constituting 29.1% and 26.5% of net sales, respectively. Selling, general and administrative expenses increased by $7.9 million driven by higher marketing expenses ($6.7 million), higher product development costs in support of increased product launches ($2.5 million), and increased depreciation and amortization ($1.6 million), partially offset by a decrease in general and administrative expenses ($2.9 million).
Income from Joint Ventures
We recognized $0.2 million of income for funds received in 2016 related to our former video game joint venture in partial settlement of amounts owed to the Company when our joint venture partner was liquidated pursuant to their 2012 bankruptcy filing and $0.7 million of income for funds received in 2016 related to Pacific Animation Partners. In 2015, we recognized $2.7 million in income related to our former video game joint venture and $0.1 million of income for funds received related to Pacific Animation Partners.
Other Income
We recognized income of $0.2 million for funds received in 2016 related to the disgorgement of short swing trading profits from a shareholder, net of legal fees and a $0.1 million gain on extinguishment of convertible senior notes.
Interest Income
Interest income in 2016 was $51,000, comparable to $62,000 in 2015.
Interest Expense
Interest expense was $13.0 million in 2016, as compared to $12.4 million in 2015. In 2016, we recorded interest expense of $11.7 million related to our convertible senior notes payable, $0.9 million related to our revolving credit facility and $0.4 million related to the interest component of our Maui acquisition earn-out. In 2015, we recorded interest expense of $11.5 million related to our convertible senior notes payable and $0.9 million related to our revolving credit facility.
Provision for Income Taxes
Our income tax expense, which includes federal, state and foreign income taxes and discrete items, was $4.1 million, or an effective tax rate of 76.8% for 2016. During 2015, the income tax expense was $3.4 million, or an effective tax rate of 12.9%.
The 2016 tax expense of $4.1 million included a discrete tax benefit of $0.1 million primarily comprised of return to provision adjustments. Absent these discrete tax benefits, our effective tax rate for 2016 was 79.2%, primarily due to US federal alternative minimum tax, various state taxes and taxes on foreign income.
The 2015 tax expense of $3.4 million included a discrete tax expense of $0.9 million primarily comprised of return to provision adjustments. Absent these discrete tax expenses, our effective tax rate for 2015 was 9.5%, primarily due to a full valuation allowance on the Company's United States deferred tax assets and the foreign rate differential, and is impacted by the proportion of Hong Kong earnings to overall earnings and is expected to vary depending on the level of consolidated earnings.
We assess the available positive and negative evidence to estimate if sufficient future taxable income will be generated to use the existing deferred tax assets by jurisdiction. Based on our evaluation of all positive and negative evidence, as of December 31, 2016, a valuation allowance of $49.3 million has been recorded against the deferred tax assets that more likely than not will not be realized. The net deferred tax liabilities of $2.0 million represent the net deferred tax liabilities in the foreign jurisdiction, where we are in a cumulative income position.
As of December 31, 2016, we had net deferred tax liabilities of approximately $2.0 million related to foreign jurisdictions.
32
Quarterly Fluctuations and Seasonality
We have experienced significant quarterly fluctuations in operating results and anticipate these fluctuations in the future. The operating results for any quarter are not necessarily indicative of results for any future period. Our first quarter is typically expected to be the least profitable as a result of lower net sales but substantially similar fixed operating expenses. This is consistent with the performance of many companies in the toy industry.
The following table presents our unaudited quarterly results for the years indicated. The seasonality of our business is reflected in this quarterly presentation.
|
2016
|
2017
|
|||||||||||||||||||||||||||||||
|
First
|
Second
|
Third
|
Fourth
|
First
|
Second
|
Third
|
Fourth
|
|||||||||||||||||||||||||
|
(unaudited)
|
Quarter
|
Quarter
|
Quarter
|
Quarter
|
Quarter
|
Quarter
|
Quarter
|
Quarter
|
||||||||||||||||||||||||
|
|
||||||||||||||||||||||||||||||||
|
Net sales
|
$
|
95,809
|
$
|
140,977
|
$
|
302,791
|
$
|
167,026
|
$
|
94,505
|
$
|
119,565
|
$
|
262,413
|
$
|
136,628
|
||||||||||||||||
|
As a % of full year
|
13.6
|
%
|
20.0
|
%
|
42.8
|
%
|
23.6
|
%
|
15.4
|
%
|
19.5
|
%
|
42.8
|
%
|
22.3
|
%
|
||||||||||||||||
|
Gross Profit
|
$
|
31,183
|
$
|
44,800
|
$
|
94,933
|
$
|
52,105
|
$
|
30,021
|
$
|
33,719
|
$
|
61,781
|
$
|
30,160
|
||||||||||||||||
|
As a % of full year
|
14.0
|
%
|
20.1
|
%
|
42.5
|
%
|
23.4
|
%
|
19.3
|
%
|
21.7
|
%
|
39.7
|
%
|
19.3
|
%
|
||||||||||||||||
|
As a % of net sales
|
32.5
|
%
|
31.8
|
%
|
31.4
|
%
|
31.2
|
%
|
31.8
|
%
|
28.2
|
%
|
23.5
|
%
|
22.1
|
%
|
||||||||||||||||
|
Income (loss) from operations
|
$
|
(13,816
|
)
|
$
|
(1,100
|
)
|
$
|
34,413
|
$
|
(2,391
|
)
|
$
|
(15,724
|
)
|
$
|
(14,108
|
)
|
$
|
(7,746
|
)
|
$
|
(26,580
|
)
|
|||||||||
|
As a % of full year
|
(80.8
|
)%
|
(6.4
|
)%
|
201.2
|
%
|
(14.0
|
)%
|
24.5
|
%
|
22.0
|
%
|
12.1
|
%
|
41.4
|
%
|
||||||||||||||||
|
As a % of net sales
|
(14.4
|
)%
|
(0.8
|
)%
|
11.4
|
%
|
(1.4
|
)%
|
(16.6
|
)%
|
(11.8
|
)%
|
(3.0
|
)%
|
(19.5
|
)%
|
||||||||||||||||
|
Income (loss) before provision
(benefit) for income taxes
|
$
|
(16,951
|
)
|
$
|
(3,441
|
)
|
$
|
31,612
|
$
|
(5,844
|
)
|
$
|
(18,629
|
)
|
$
|
(16,371
|
)
|
$
|
(16,651
|
)
|
$
|
(29,771
|
)
|
|||||||||
|
As a % of net sales
|
(17.7
|
)%
|
(2.4
|
)%
|
10.4
|
%
|
(3.5
|
)%
|
(19.7
|
)%
|
(13.7
|
)%
|
(6.3
|
)%
|
(21.8
|
)%
|
||||||||||||||||
|
Net income (loss)
|
$
|
(17,383
|
)
|
$
|
(4,145
|
)
|
$
|
30,529
|
$
|
(7,752
|
)
|
$
|
(18,285
|
)
|
$
|
(16,687
|
)
|
$
|
(17,569
|
)
|
$
|
(30,487
|
)
|
|||||||||
|
As a % of net sales
|
(18.1
|
)%
|
(2.9
|
)%
|
10.1
|
%
|
(4.6
|
)%
|
(19.3
|
)%
|
(14.0
|
)%
|
(6.7
|
)%
|
(22.3
|
)%
|
||||||||||||||||
|
Net income (loss) attributable to non-controlling interests
|
$
|
32
|
$
|
224
|
$
|
(83
|
)
|
$
|
(167
|
)
|
$
|
31
|
$
|
55
|
$
|
45
|
$
|
(74
|
)
|
|||||||||||||
|
As a % of net sales
|
—
|
%
|
0.2
|
%
|
—
|
%
|
(0.1
|
)%
|
—
|
%
|
—
|
%
|
—
|
%
|
(0.1
|
)%
|
||||||||||||||||
|
Net income (loss) attributable to JAKKS Pacific, Inc.
|
$
|
(17,415
|
)
|
$
|
(4,369
|
)
|
$
|
30,612
|
$
|
(7,585
|
)
|
$
|
(18,316
|
)
|
$
|
(16,742
|
)
|
$
|
(17,614
|
)
|
$
|
(30,413
|
)
|
|||||||||
|
As a % of net sales
|
(18.2
|
)%
|
(3.1
|
)%
|
10.1
|
%
|
(4.5
|
)%
|
(19.4
|
)%
|
(14.0
|
)%
|
(6.7
|
)%
|
(22.3
|
)%
|
||||||||||||||||
|
Diluted earnings (loss) per share
|
$
|
(1.01
|
)
|
$
|
(0.27
|
)
|
$
|
0.82
|
$
|
(0.47
|
)
|
$
|
(1.01
|
)
|
$
|
(0.77
|
)
|
$
|
(0.77
|
)
|
$
|
(1.33
|
)
|
|||||||||
|
Weighted average shares and
equivalents outstanding
|
17,218
|
16,402
|
39,504
|
16,098
|
18,104
|
21,616
|
22,772
|
22,799
|
||||||||||||||||||||||||
Consistent with the seasonality of our business, first and second quarters of 2016 and 2017 and fourth quarter of 2017, experienced seasonally low sales which coupled with fixed overhead resulted in significant net losses.
Quarterly and year-to-date computations of income (loss) per share amounts are made independently. Therefore, the sum of the per share amounts for the quarters may not agree with the per share amounts for the year.
33
Debt with Conversion and Other Options
In July 2013, we sold an aggregate of $100.0 million principal amount of 4.25% convertible senior notes due 2018 (the “2018 Notes”). The 2018 Notes, which are senior unsecured obligations, pay interest semi-annually in arrears on August 1 and February 1 of each year at a rate of 4.25% per annum and will mature on August 1, 2018. The initial and still conversion rate for the 2018 Notes is 114.3674 shares of our common stock per $1,000 principal amount of notes, equivalent to an initial conversion price of approximately $8.74 per share of common stock, subject to adjustment in certain events. Upon conversion, the 2018 Notes will be settled in shares of our common stock. Holders of the 2018 Notes may require us to repurchase for cash all or some of their notes upon the occurrence of a fundamental change (as defined in the 2018 Notes). In 2016, we repurchased and retired $6.1 million principal amount of the 2018 Notes. In 2017, we exchanged and retired an aggregate of $51.1 million principal amount of the 2018 Notes at par for $35.6 million in cash and approximately 3.0 million shares of our common stock, and the maturity of $21.5 million principal amount of the 2018 Notes was extended to November 1, 2020 along with a reduction in the interest rate to 3.25% per annum if paid in cash and a reduction in the conversion price to $3.05 per share.
In June 2014, we sold an aggregate of $115.0 million principal amount of 4.875% convertible senior notes due 2020 (the “2020 Notes”). The 2020 Notes are senior unsecured obligations of the Company paying interest semi-annually in arrears on June 1 and December 1 of each year at a rate of 4.875% per annum and will mature on June 1, 2020. The initial and still conversion rate for the 2020 Notes is 103.7613 shares of our common stock per $1,000 principal amount of notes, equivalent to an initial conversion price of approximately $9.64 per share of common stock, subject to adjustment in certain events. Upon conversion, the 2020 Notes will be settled in shares of our common stock. Holders of the 2020 Notes may require us to repurchase for cash all or some of their notes upon the occurrence of a fundamental change (as defined in the 2020 Notes). In 2016, we repurchased and retired $2.0 million principal amount of the 2020 Notes.
Liquidity and Capital Resources
As of December 31, 2017, we had working capital of $146.9 million compared to $236.6 million as of December 31, 2016. The decrease was primarily attributable to the reclassification of $21.1 million of the 2018 convertible senior notes to current liabilities, the exchange and retirement of convertible senior notes, and the net loss, partially offset by proceeds from the issuance of common stock to a Hong Kong affiliate of our China joint venture partner during the second quarter of 2017.
Operating activities provided net cash of $65.8 million, $16.7 million and $11.4 million for the years ended December 31, 2015, 2016 and 2017, respectively. Net cash was favorably impacted primarily by decreases in accounts receivable and inventory. Our accounts receivable turnover as measured by days sales for the quarter outstanding in accounts receivable was 90 days, 96 days, and 96 days as of December 31, 2015, 2016 and 2017, respectively. Other than open purchase orders issued in the normal course of business, we have no obligations to purchase finished goods from our manufacturers. As of December 31, 2017, we had cash and cash equivalents of $65.0 million.
Investing activities used net cash of $21.7 million, $15.1 million and $14.8 million for the years ended December 31, 2015, 2016 and 2017, respectively. Cash used in 2017 consisted primarily of $14.9 million cash paid for the purchase of molds and tooling used in the manufacture of our products. Cash used in 2016 consisted primarily of $14.8 million cash paid for the purchase of office furniture, equipment, and molds and tooling used in the manufacturing of our products. Cash used in 2015 consisted primarily of $17.8 million cash paid for leasehold improvements, the purchase of office furniture, equipment and molds and tooling used in the manufacturing of our products. As part of our strategy to develop and market new products, we have entered into various character and product licenses with royalties generally ranging from 1% to 21% payable on net sales of such products. As of December 31, 2017, these agreements required future aggregate minimum guarantees of $57.1 million, exclusive of $23.4 million in advances already paid. Of this $57.1 million future minimum guarantee, $40.7 million is due over the next twelve months.
Financing activities used net cash of $13.4 million, $12.0 million and $21.4 million for the years ended December 31, 2015, 2016 and 2017, respectively. The cash used in 2017 consists primarily of the cash portion of $35.6 million in the exchange of $51.1 million principal amount of our 2018 convertible senior notes, partially offset by the issuance of approximately 3.7 million shares of common stock for cash in the amount of $19.3 million. The cash used in 2016 consists primarily of the repurchase of our common stock and convertible senior notes. The cash used in 2015 consists primarily of the repurchase of our common stock.
The following is a summary of our significant contractual cash obligations for the periods indicated that existed as of December 31, 2017 and is based upon information appearing in the notes to the consolidated financial statements (in thousands):
|
|
Less than
1 year
|
1 – 3
years
|
3 – 5
years
|
More Than
5 years
|
Total
|
|||||||||||||||
|
Short-term debt
|
$
|
26,178
|
$
|
―
|
$
|
―
|
$
|
―
|
$
|
26,178
|
||||||||||
|
Long-term debt
|
―
|
135,469
|
―
|
―
|
135,469
|
|||||||||||||||
|
Interest on debt
|
6,734
|
9,088
|
―
|
―
|
15,822
|
|||||||||||||||
|
Operating leases
|
13,403
|
21,396
|
18,884
|
7,121
|
60,804
|
|||||||||||||||
|
Minimum guaranteed license/royalty payments
|
40,725
|
16,408
|
―
|
―
|
57,133
|
|||||||||||||||
|
Employment contracts
|
8,936
|
10,312
|
―
|
―
|
19,248
|
|||||||||||||||
|
Total contractual cash obligations
|
$
|
95,976
|
$
|
192,673
|
$
|
18,884
|
$
|
7,121
|
$
|
314,654
|
||||||||||
`
The above table excludes any potential uncertain income tax liabilities that may become payable upon examination of our income tax returns by taxing authorities. Such amounts and periods of payment cannot be reliably estimated. See Note 13 to the consolidated financial statements for further explanation of our uncertain tax positions.
34
In October 2016, we acquired the operating assets of the C’est Moi brand of performance makeup and youth skincare products whose distribution is currently limited primarily to Asia. We expect to launch a full line of makeup and skincare products branded under the C’est Moi name in the U.S. and Canada in the first quarter of 2018 prior to which sales are anticipated to be nominal.
We believe that our cash flows from operations and cash and cash equivalents will be sufficient to meet our working capital and capital expenditure requirements and provide us with adequate liquidity to meet our anticipated operating needs for at least the next 12 months from the issuance of this annual report. We expect our capital expenditures to be approximately $14.0 million in 2018. Although operating activities are expected to provide cash, to the extent we make any acquisitions or grow significantly in the future, our operating and investing activities may use cash and, consequently, any acquisitions or growth may require us to obtain additional sources of financing. There can be no assurance that any necessary additional financing will be available to us on commercially reasonable terms, if at all. We intend to finance our long-term liquidity requirements out of net cash provided by operations and net cash and cash equivalents. As of December 31, 2017, we do not have any off-balance sheet arrangements.
During the last three fiscal years ending December 31, 2017, we do not believe that inflation has had a material impact on our net sales and revenues and on income from continuing operations.
Exchange Rates
Sales from our United States and Hong Kong operations are denominated in U.S. dollars and our manufacturing costs are denominated in either U.S. or Hong Kong dollars. Local sales (other than in Hong Kong) and operating expenses of our operations in Hong Kong, the United Kingdom, Germany, France, Spain, Canada, Mexico and China are denominated in local currency, thereby creating exposure to changes in exchange rates. Changes in the various exchange rates against the U.S. dollar may positively or negatively affect our operating results. The exchange rate of the Hong Kong dollar to the U.S. dollar has been fixed by the Hong Kong government since 1983 at HK$7.80 to US$1.00 and, accordingly, has not represented a currency exchange risk to the U.S. dollar. We cannot assure you that the exchange rate between the United States and Hong Kong currencies will continue to be fixed or that exchange rate fluctuations between the United States and Hong Kong or all other currencies will not have a material adverse effect on our business, financial condition or results of operations.
35
Market risk represents the risk of loss that may impact our financial position, results of operations or cash flows due to adverse changes in financial and commodity market prices and rates. We are exposed to market risk in the areas of changes in United States and international borrowing rates and changes in foreign currency exchange rates. In addition, we are exposed to market risk in certain geographic areas that have experienced or remain vulnerable to an economic downturn, such as China. We purchase substantially all of our inventory from companies in China, and, therefore, we are subject to the risk that such suppliers will be unable to provide inventory at competitive prices. While we believe that, should such events occur we would be able to find alternative sources of inventory at competitive prices, we cannot assure you that we would be able to do so. These exposures are directly related to our normal operating and funding activities. To date, we have not used derivative instruments or engaged in hedging activities to minimize our market risk.
Interest Rate Risk
As of December 31, 2017, we have outstanding convertible senior notes payable of $21.2 million principal amount due August 2018 with a fixed interest rate of 4.25% per annum, $113.0 million principal amount due June 2020 with a fixed interest rate of 4.875% per annum, and $21.5 million principal amount due November 2020 with a fixed interest rate of 3.25% per annum if paid in cash. As the interest rates on the notes are at fixed rates, we are not generally subject to any direct risk of loss related to these notes arising from changes in interest rates.
Our exposure to market risk includes interest rate fluctuations in connection with our revolving credit facility (see Note 11 - Credit Facility in the accompanying notes to the consolidated financial statements for additional information). Borrowings under the revolving credit facility bear interest at a variable rate based on Prime Lending Rate or LIBOR Rate at the option of the Company. For Prime Lending Rate loans, the interest rate is equal to the highest of (i) the Federal Funds Rate plus a margin of 0.50%, (ii) the rate last quoted by The Wall Street Journal as the “Prime Rate,” or (iii) the sum of a LIBOR rate plus 1.00%, plus a margin of 2.25%. For LIBOR rate loans, the interest rate is equal to a LIBOR rate plus a margin of 2.25%. Borrowings under the revolving credit facility are therefore subject to risk based upon prevailing market interest rates. Interest rate risk may result from many factors, including governmental monetary and tax policies, domestic and international economic and political considerations and other factors that are beyond our control. During the year ended December 31, 2017, the maximum amount borrowed under the revolving credit facility was $20.0 million and the average amount of borrowings outstanding was $5.7 million. As of December 31, 2017, the amount of total borrowings outstanding under the revolving credit facility was $5.0 million. If the prevailing market interest rates relative to these borrowings increased by 10%, our interest expense during the period ended December 31, 2017 would have increased by less than $0.1 million.
Foreign Currency Risk
We have wholly-owned subsidiaries in Hong Kong, China, the United Kingdom, Germany, France, Spain, Canada and Mexico. Sales are generally made by these operations on FOB China or Hong Kong terms and are denominated in U.S. dollars. However, purchases of inventory and Hong Kong operating expenses are typically denominated in Hong Kong dollars and local operating expenses in the United Kingdom, Germany, France, Spain, Canada, Mexico and China are denominated in local currency, thereby creating exposure to changes in exchange rates. Changes in the U.S. dollar exchange rates may positively or negatively affect our gross margins, operating income and retained earnings. The exchange rate of the Hong Kong dollar to the U.S. dollar has been fixed by the Hong Kong government since 1983 at HK$7.80 to US$1.00 and, accordingly, has not represented a currency exchange risk to the U.S. dollar. We do not believe that near-term changes in these exchange rates, if any, will result in a material effect on our future earnings, fair values or cash flows. Therefore, we have chosen not to enter into foreign currency hedging transactions. We cannot assure you that this approach will be successful, especially in the event of a significant and sudden change in the value of these foreign currencies.
36
Report of Independent Registered Public Accounting Firm
Shareholders and Board of Directors
JAKKS Pacific, Inc.
Santa Monica, California
Opinion on the Consolidated Financial Statements
We have audited the accompanying consolidated balance sheets of JAKKS Pacific, Inc. (the “Company") and subsidiaries as of December 31, 2017 and 2016 and the related consolidated statements of operations, comprehensive income (loss), stockholders’ equity, and cash flows for each of the three years in the period ended December 31, 2017, and the related notes and financial statement schedule listed in the accompanying index (collectively referred to as the “consolidated financial statements”). In our opinion, the consolidated financial statements present fairly, in all material respects, the financial position of the Company and subsidiaries at December 31, 2017 and 2016, and the results of their operations and their cash flows for each of the three years in the period ended December 31, 2017, in conformity with accounting principles generally accepted in the United States of America.
We also have audited, in accordance with the standards of the Public Company Accounting Oversight Board (United States) (“PCAOB”), the Company’s internal control over financial reporting as of December 31, 2017, based on criteria established in Internal Control – Integrated Framework (2013) issued by the Committee of Sponsoring Organizations of the Treadway Commission (“COSO”) and our report dated March 16, 2018 expressed an unqualified opinion thereon.
Basis for Opinion
These consolidated financial statements are the responsibility of the Company’s management. Our responsibility is to express an opinion on the Company’s consolidated financial statements based on our audits. We are a public accounting firm registered with the PCAOB and are required to be independent with respect to the Company in accordance with the U.S. federal securities laws and the applicable rules and regulations of the Securities and Exchange Commission and the PCAOB.
We conducted our audits in accordance with the standards of the PCAOB. Those standards require that we plan and perform the audit to obtain reasonable assurance about whether the consolidated financial statements are free of material misstatement, whether due to error or fraud.
Our audits included performing procedures to assess the risks of material misstatement of the consolidated financial statements, whether due to error or fraud, and performing procedures that respond to those risks. Such procedures included examining, on a test basis, evidence regarding the amounts and disclosures in the consolidated financial statements. Our audits also included evaluating the accounting principles used and significant estimates made by management, as well as evaluating the overall presentation of the consolidated financial statements. We believe that our audits provide a reasonable basis for our opinion.
|
/S/ BDO USA, LLP
|
|
We have served as the Company’s auditor since 2006.
Los Angeles, California
March 16, 2018
37
JAKKS PACIFIC, INC. AND SUBSIDIARIES
CONSOLIDATED BALANCE SHEETS
|
|
December 31,
|
|||||||
|
|
2016
|
2017
|
||||||
|
|
(In thousands, except
|
|||||||
|
|
share data)
|
|||||||
|
Assets
|
||||||||
|
Current assets
|
||||||||
|
Cash and cash equivalents
|
$
|
86,064
|
$
|
64,977
|
||||
|
Accounts receivable, net of allowance for uncollectible accounts of $2,864 and $10,940 in 2016 and 2017, respectively
|
173,599
|
142,457
|
||||||
|
Inventory, net
|
75,435
|
58,432
|
||||||
|
Income taxes receivable
|
1,204
|
1,880
|
||||||
|
Prepaid expenses and other assets
|
17,077
|
14,923
|
||||||
|
Total current assets
|
353,379
|
282,669
|
||||||
|
Property and equipment
|
||||||||
|
Office furniture and equipment
|
14,345
|
15,043
|
||||||
|
Molds and tooling
|
103,128
|
115,378
|
||||||
|
Leasehold improvements
|
10,927
|
10,936
|
||||||
|
Total
|
128,400
|
141,357
|
||||||
|
Less accumulated depreciation and amortization
|
105,559
|
118,130
|
||||||
|
Property and equipment, net
|
22,841
|
23,227
|
||||||
|
Intangible assets, net
|
33,111
|
22,190
|
||||||
|
Other long term assets
|
2,156
|
6,579
|
||||||
|
Investment in DreamPlay, LLC
|
7,000
|
—
|
||||||
|
Goodwill
|
43,208
|
35,384
|
||||||
|
Trademarks
|
2,608
|
300
|
||||||
|
Total assets
|
$
|
464,303
|
$
|
370,349
|
||||
|
Liabilities and Stockholders’ Equity
|
||||||||
|
Current liabilities
|
||||||||
|
Accounts payable
|
$
|
51,741
|
$
|
49,916
|
||||
|
Accrued expenses
|
38,645
|
42,145
|
||||||
|
Reserve for sales returns and allowances
|
16,424
|
17,622
|
||||||
|
Short term debt
|
10,000
|
5,000
|
||||||
|
Convertible senior notes, net
|
—
|
21,075
|
||||||
|
Total current liabilities
|
116,810
|
135,758
|
||||||
|
Convertible senior notes, net
|
203,007
|
133,497
|
||||||
|
Other liabilities
|
5,004
|
4,537
|
||||||
|
Income taxes payable
|
2,248
|
1,261
|
||||||
|
Deferred income taxes, net
|
2,034
|
783
|
||||||
|
Total liabilities
|
329,103
|
275,836
|
||||||
|
Commitments and Contingencies
|
||||||||
|
Stockholders’ equity
|
||||||||
|
Preferred stock, $.001 par value; 5,000,000 shares authorized; nil outstanding
|
—
|
—
|
||||||
|
Common stock, $.001 par value; 100,000,000 shares authorized; 19,376,773 and 26,957,354 shares issued and outstanding in 2016 and 2017, respectively
|
19
|
27
|
||||||
|
Treasury stock, at cost; 3,112,840 shares
|
(24,000
|
)
|
(24,000
|
)
|
||||
|
Additional paid-in capital
|
177,624
|
215,809
|
||||||
|
Accumulated deficit
|
(2,148
|
)
|
(85,233
|
)
|
||||
|
Accumulated other comprehensive loss
|
(17,207
|
)
|
(13,059
|
)
|
||||
|
Total JAKKS Pacific, Inc. stockholders’ equity
|
134,288
|
93,544
|
||||||
|
Non-controlling interests
|
912
|
969
|
||||||
|
Total stockholders’ equity
|
135,200
|
94,513
|
||||||
|
Total liabilities and stockholders’ equity
|
$
|
464,303
|
$
|
370,349
|
||||
See accompanying notes to consolidated financial statements.
38
JAKKS PACIFIC, INC. AND SUBSIDIARIES
CONSOLIDATED STATEMENTS OF OPERATIONS
|
|
Years Ended December 31,
|
|||||||||||
|
|
2015
|
2016
|
2017
|
|||||||||
|
|
(In thousands, except per share amounts)
|
|||||||||||
|
Net sales
|
$
|
745,741
|
$
|
706,603
|
$
|
613,111
|
||||||
|
Cost of sales
|
517,172
|
483,582
|
457,430
|
|||||||||
|
Gross profit
|
228,569
|
223,021
|
155,681
|
|||||||||
|
Selling, general and administrative expenses
|
198,039
|
205,915
|
206,303
|
|||||||||
|
Goodwill and other intangibles impairment
|
—
|
—
|
13,536
|
|||||||||
|
Income (loss) from operations
|
30,530
|
17,106
|
(64,158
|
)
|
||||||||
|
Change in fair value of business combination liability
|
5,642
|
—
|
—
|
|||||||||
|
Income from joint ventures
|
2,761
|
889
|
105
|
|||||||||
|
Other income
|
—
|
305
|
342
|
|||||||||
|
Loss on extinguishment of convertible senior notes
|
—
|
—
|
(919
|
)
|
||||||||
|
Write-off of investment in DreamPlay, LLC
|
—
|
—
|
(7,000
|
)
|
||||||||
|
Interest income
|
62
|
51
|
37
|
|||||||||
|
Interest expense
|
(12,402
|
)
|
(12,975
|
)
|
(9,829
|
)
|
||||||
|
Income (loss) before provision for income taxes
|
26,593
|
5,376
|
(81,422
|
)
|
||||||||
|
Provision for income taxes
|
3,423
|
4,127
|
1,606
|
|||||||||
|
Net income (loss)
|
23,170
|
1,249
|
(83,028
|
)
|
||||||||
|
Net income (loss) attributable to non-controlling interests
|
(84
|
)
|
6
|
57
|
||||||||
|
Net income (loss) attributable to JAKKS Pacific, Inc.
|
$
|
23,254
|
$
|
1,243
|
$
|
(83,085
|
)
|
|||||
|
Basic earnings (loss) per share
|
$
|
1.20
|
$
|
0.08
|
$
|
(3.89
|
)
|
|||||
|
Basic weighted number of shares
|
19,435
|
16,542
|
21,341
|
|||||||||
|
Diluted earnings (loss) per share
|
$
|
0.71
|
$
|
0.07
|
$
|
(3.89
|
)
|
|||||
|
Diluted weighted number of shares
|
43,321
|
16,665
|
21,341
|
|||||||||
See accompanying notes to consolidated financial statements.
39
JAKKS PACIFIC, INC. AND SUBSIDIARIES
CONSOLIDATED STATEMENTS OF COMPREHENSIVE INCOME (LOSS)
|
Years Ended December 31,
|
||||||||||||
|
2015
|
2016
|
2017
|
||||||||||
| (In thousands) | ||||||||||||
|
Net income (loss)
|
|
$
|
23,170
|
|
$
|
1,249
|
|
$
|
(83,028
|
)
|
||
|
Other comprehensive income (loss):
|
||||||||||||
|
Foreign currency translation adjustment
|
(3,216
|
)
|
(7,156
|
)
|
|
4,148
|
||||||
|
Comprehensive income (loss)
|
|
|
19,954
|
|
|
(5,907
|
)
|
|
|
(78,880
|
)
|
|
|
Less: Comprehensive income (loss) attributable to non-controlling interests
|
|
|
(84
|
)
|
|
6
|
|
|
57
|
|||
|
Comprehensive income (loss) attributable to JAKKS Pacific, Inc.
|
|
$
|
20,038
|
|
$
|
(5,913
|
)
|
|
$
|
(78,937
|
)
|
|
See accompanying notes to consolidated financial statements.
40
JAKKS PACIFIC, INC. AND SUBSIDIARIES
CONSOLIDATED STATEMENTS OF STOCKHOLDERS’ EQUITY
YEARS ENDED DECEMBER 31, 2015, 2016 AND 2017
(In thousands)
|
|
Common Stock
|
Accumulated
|
JAKKS
|
|||||||||||||||||||||||||||||||||
|
|
Additional
|
Other
|
Pacific, Inc.
|
Non-
|
Total
|
|||||||||||||||||||||||||||||||
|
|
Number
|
Treasury
|
Paid-in
|
Accumulated
|
Comprehensive
|
Stockholders’
|
Controlling
|
Stockholders’
|
||||||||||||||||||||||||||||
|
|
of Shares
|
Amount
|
Stock
|
Capital
|
Deficit
|
Loss
|
Equity
|
Interests
|
Equity
|
|||||||||||||||||||||||||||
|
Balance, January 1, 2015
|
22,682
|
$
|
22
|
$
|
(24,000
|
)
|
$
|
202,052
|
$
|
(26,645
|
)
|
$
|
(6,835
|
)
|
$
|
144,594
|
$
|
490
|
$
|
145,084
|
||||||||||||||||
|
Restricted stock grants
|
71
|
1
|
—
|
1,561
|
—
|
—
|
1,562
|
—
|
1,562
|
|||||||||||||||||||||||||||
|
Retirement of restricted stock
|
(52
|
)
|
(1
|
)
|
—
|
—
|
—
|
—
|
(1
|
)
|
—
|
(1
|
)
|
|||||||||||||||||||||||
|
Repurchase of common stock
|
(1,547
|
)
|
(1
|
)
|
(13,192
|
)
|
—
|
—
|
—
|
(13,193
|
)
|
—
|
(13,193
|
)
|
||||||||||||||||||||||
|
Retirement of treasury stock
|
—
|
(1
|
)
|
8,870
|
(8,869
|
)
|
—
|
—
|
―
|
—
|
―
|
|||||||||||||||||||||||||
|
Net income
|
—
|
—
|
—
|
—
|
23,254
|
—
|
23,254
|
(84
|
)
|
23,170
|
||||||||||||||||||||||||||
|
Foreign currency translation adjustment
|
—
|
—
|
—
|
—
|
—
|
(3,216
|
)
|
(3,216
|
)
|
—
|
(3,216
|
)
|
||||||||||||||||||||||||
|
Balance, December 31, 2015
|
21,154
|
20
|
(28,322
|
)
|
194,744
|
(3,391
|
)
|
(10,051
|
)
|
153,000
|
406
|
153,406
|
||||||||||||||||||||||||
|
Contributions from non-controlling interests
|
—
|
—
|
—
|
—
|
—
|
—
|
—
|
500
|
500
|
|||||||||||||||||||||||||||
|
Restricted stock grants
|
65
|
1
|
—
|
1,620
|
—
|
—
|
1,621
|
—
|
1,621
|
|||||||||||||||||||||||||||
|
Retirement of restricted stock
|
(25
|
)
|
—
|
—
|
—
|
—
|
—
|
—
|
—
|
—
|
||||||||||||||||||||||||||
|
Repurchase of common stock
|
(1,766
|
)
|
—
|
(13,506
|
)
|
—
|
—
|
—
|
(13,506
|
)
|
—
|
(13,506
|
)
|
|||||||||||||||||||||||
|
Repurchase of common stock for employee tax withholding
|
(51
|
)
|
—
|
—
|
(1,462
|
)
|
—
|
—
|
(1,462
|
)
|
—
|
(1,462
|
)
|
|||||||||||||||||||||||
|
Retirement of treasury stock
|
—
|
(2
|
)
|
17,828
|
(17,826
|
)
|
—
|
—
|
―
|
—
|
―
|
|||||||||||||||||||||||||
|
Excess tax benefit on vesting of restricted stock
|
—
|
—
|
—
|
548
|
—
|
—
|
548
|
—
|
548
|
|||||||||||||||||||||||||||
|
Net income
|
—
|
—
|
—
|
—
|
1,243
|
—
|
1,243
|
6
|
1,249
|
|||||||||||||||||||||||||||
|
Foreign currency translation adjustment
|
—
|
—
|
—
|
—
|
—
|
(7,156
|
)
|
(7,156
|
)
|
—
|
(7,156
|
)
|
||||||||||||||||||||||||
|
Balance, December 31, 2016
|
19,377
|
19
|
(24,000
|
)
|
177,624
|
(2,148
|
)
|
(17,207
|
)
|
134,288
|
912
|
135,200
|
||||||||||||||||||||||||
|
Restricted stock grants
|
981
|
1
|
—
|
3,111
|
―
|
―
|
3,112
|
—
|
3,112
|
|||||||||||||||||||||||||||
|
Retirement of restricted stock
|
(9
|
)
|
—
|
—
|
—
|
―
|
―
|
—
|
—
|
―
|
||||||||||||||||||||||||||
|
Shares issued in exchange for convertible notes
|
2,977
|
3
|
—
|
15,521
|
―
|
―
|
15,524
|
—
|
15,524
|
|||||||||||||||||||||||||||
|
Repurchase of common stock for employee tax withholding
|
(30
|
)
|
—
|
—
|
(79
|
)
|
—
|
—
|
(79
|
)
|
—
|
(79
|
)
|
|||||||||||||||||||||||
|
Issuance of common stock to Hongkong Meisheng
|
3,661
|
4
|
—
|
19,307
|
—
|
—
|
19,311
|
—
|
19,311
|
|||||||||||||||||||||||||||
|
Adjustment to additional paid in capital
|
325
|
325
|
—
|
325
|
||||||||||||||||||||||||||||||||
|
Net income (loss)
|
—
|
—
|
—
|
—
|
(83,085
|
)
|
―
|
(83,085
|
)
|
57
|
(83,028
|
)
|
||||||||||||||||||||||||
|
Foreign currency translation adjustment
|
—
|
—
|
—
|
—
|
—
|
4,148
|
4,148
|
—
|
4,148
|
|||||||||||||||||||||||||||
|
Balance, December 31, 2017
|
26,957
|
$
|
27
|
$
|
(24,000
|
)
|
$
|
215,809
|
$
|
(85,233
|
)
|
$
|
(13,059
|
)
|
$
|
93,544
|
$
|
969
|
$
|
94,513
|
||||||||||||||||
See accompanying notes to consolidated financial statements.
41
JAKKS PACIFIC, INC. AND SUBSIDIARIES
CONSOLIDATED STATEMENTS OF CASH FLOWS
|
|
Years Ended December 31,
|
|||||||||||
|
|
2015
|
2016
|
2017
|
|||||||||
|
|
(In thousands)
|
|||||||||||
|
Cash flows from operating activities
|
||||||||||||
|
Net income (loss)
|
$
|
23,170
|
$
|
1,249
|
$
|
(83,028
|
)
|
|||||
|
Adjustments to reconcile net income (loss) to net cash provided by operating activities:
|
||||||||||||
|
Provision for doubtful accounts
|
—
|
—
|
11,803
|
|||||||||
|
Depreciation and amortization
|
18,860
|
22,944
|
21,003
|
|||||||||
|
Write-off and amortization of debt issuance costs
|
2,042
|
2,542
|
2,104
|
|||||||||
|
Share-based compensation expense
|
1,562
|
1,621
|
3,112
|
|||||||||
|
(Gain) loss on disposal of property and equipment
|
47
|
17
|
(71
|
)
|
||||||||
|
Intangibles impairment
|
—
|
—
|
5,248
|
|||||||||
|
Write-off of investment in DreamPlay, LLC
|
—
|
—
|
7,000
|
|||||||||
|
Goodwill impairment
|
—
|
—
|
8,288
|
|||||||||
|
Change in fair value of business combination liability
|
(5,642
|
)
|
—
|
—
|
||||||||
|
(Gain) loss on extinguishment of convertible senior notes
|
—
|
(98
|
)
|
497
|
||||||||
|
Income from joint ventures
|
(1,017
|
)
|
—
|
—
|
||||||||
|
Deferred income taxes
|
(329
|
)
|
(259
|
)
|
(1,251
|
)
|
||||||
|
Change in fair value of convertible senior notes
|
—
|
—
|
308
|
|||||||||
|
Changes in operating assets and liabilities, net of acquisitions:
|
||||||||||||
|
Accounts receivable
|
71,129
|
(10,212
|
)
|
19,339
|
||||||||
|
Inventory
|
18,283
|
(14,891
|
)
|
17,003
|
||||||||
|
Income taxes receivable
|
—
|
22,804
|
(676
|
)
|
||||||||
|
Prepaid expenses and other assets
|
(7,513
|
)
|
15,227
|
(2,149
|
)
|
|||||||
|
Accounts payable
|
(21,037
|
)
|
10,558
|
(380
|
)
|
|||||||
|
Accrued expenses
|
(26,811
|
)
|
(12,767
|
)
|
3,500
|
|||||||
|
Reserve for sales returns and allowances
|
(7,210
|
)
|
(843
|
)
|
1,198
|
|||||||
|
Income taxes payable
|
(3,014
|
)
|
(21,018
|
)
|
(987
|
)
|
||||||
|
Other liabilities
|
3,281
|
(151
|
)
|
(467
|
)
|
|||||||
|
Total adjustments
|
42,631
|
15,474
|
94,422
|
|||||||||
|
Net cash provided by operating activities
|
65,801
|
16,723
|
11,394
|
|||||||||
|
Cash flows from investing activities
|
||||||||||||
|
Purchases of property and equipment
|
(17,840
|
)
|
(14,765
|
)
|
(14,928
|
)
|
||||||
|
Proceeds from sale of property and equipment
|
—
|
—
|
145
|
|||||||||
|
Distributions from joint venture
|
60
|
—
|
—
|
|||||||||
|
Cash paid for intangible assets
|
—
|
(300
|
)
|
—
|
||||||||
|
Sale of marketable securities
|
220
|
—
|
—
|
|||||||||
|
Change in other assets
|
(4,149
|
)
|
—
|
—
|
||||||||
|
Net cash used in investing activities
|
(21,709
|
)
|
(15,065
|
)
|
(14,783
|
)
|
||||||
|
Cash flows from financing activities
|
||||||||||||
|
Surrender of common stock
|
(1
|
)
|
—
|
—
|
||||||||
|
Repurchase of common stock
|
(13,193
|
)
|
(13,506
|
)
|
—
|
|||||||
|
Repurchase of common stock for employee tax withholding
|
—
|
(1,462
|
)
|
(79
|
)
|
|||||||
|
Net proceeds from credit facility borrowings
|
—
|
10,000
|
—
|
|||||||||
|
Repayment of credit facility borrowings
|
—
|
—
|
(5,000
|
)
|
||||||||
|
Credit facility costs
|
(188
|
)
|
—
|
—
|
||||||||
|
Repurchase of convertible senior notes
|
—
|
(8,035
|
)
|
(35,614
|
)
|
|||||||
|
Proceeds from issuance of common shares of non-controlling interests
|
—
|
500
|
—
|
|||||||||
|
Proceeds from issuance of common stock
|
—
|
—
|
19,311
|
|||||||||
|
Excess tax benefit from share-based compensation
|
—
|
548
|
—
|
|||||||||
|
Net cash used in financing activities
|
(13,382
|
)
|
(11,955
|
)
|
(21,382
|
)
|
||||||
|
Net increase (decrease) in cash and cash equivalents
|
30,710
|
(10,297
|
)
|
(24,771
|
)
|
|||||||
|
Effect of foreign currency translation
|
293
|
(6,167
|
)
|
3,684
|
||||||||
|
Cash and cash equivalents, beginning of year
|
71,525
|
102,528
|
86,064
|
|||||||||
|
Cash and cash equivalents, end of year
|
$
|
102,528
|
$
|
86,064
|
$
|
64,977
|
||||||
|
Cash paid during the period for:
|
||||||||||||
|
Interest
|
$
|
10,198
|
$
|
9,855
|
$
|
8,778
|
||||||
|
Income taxes
|
$
|
7,832
|
$
|
2,165
|
$
|
4,076
|
||||||
As of December 31, 2015 there was $0.4 million and $2.7 million of property and equipment included in accounts payable and accrued expenses, respectively. As of December 31, 2016 there was $6.6 million and nil of property and equipment included in accounts payable and accrued expenses, respectively. As of December 31, 2017 there was $5.2 million and nil of property and equipment included in accounts payable and accrued expenses, respectively.
See Notes 4, 5 and 19 for additional supplemental information to consolidated statements of cash flows.
See accompanying notes to consolidated financial statements.
42
JAKKS PACIFIC, INC. AND SUBSIDIARIES
NOTES TO CONSOLIDATED FINANCIAL STATEMENTS
DECEMBER 31, 2017
Note 1—Principal Industry
JAKKS Pacific, Inc. (the “Company”) is engaged in the development, production and marketing of consumer products, including toys and related products, electronic products, and other consumer products, many of which are based on highly-recognized character and entertainment licenses. The Company commenced its primary business operations in July 1995 through the purchase of substantially all of the assets of a Hong Kong toy company. The Company markets its product lines domestically and internationally.
The Company was incorporated under the laws of the State of Delaware in January 1995.
Note 2—Summary of Significant Accounting Policies
Principles of consolidation
These consolidated financial statements include the accounts of the Company, its wholly-owned subsidiaries, and its majority owned joint venture. All intercompany transactions have been eliminated.
The Company entered into a joint venture with Meisheng Culture & Creative Corp., for the purpose of providing certain JAKKS licensed and non-licensed toys and consumer products to agreed-upon territories of the People’s Republic of China. The joint venture includes a subsidiary in the Shanghai Free Trade Zone that sells, distributes and markets these products, which include dolls, plush, role play products, action figures, costumes, seasonal items, technology and app-enhanced toys, based on top entertainment licenses and JAKKS’ own proprietary brands. The Company owns fifty-one percent of the joint venture and consolidates the joint venture since control rests with the Company.
Cash and cash equivalents
The Company considers all highly liquid investments with an original maturity of three months or less, when acquired, to be cash equivalents. The Company maintains its cash in bank deposits which, at times, may exceed federally insured limits. The Company has not experienced any losses in such accounts. The Company believes it is not exposed to any significant credit risk of cash and cash equivalents.
Accounts Receivable and Allowance for Doubtful Accounts
Credit is granted to customers on an unsecured basis. Credit limits and payment terms are established based on extensive evaluations made on an ongoing basis throughout the fiscal year of the financial performance, cash generation, financing availability, and liquidity status of each customer. Customers are reviewed at least annually, with more frequent reviews performed as necessary, depending upon the customer’s financial condition and the level of credit being extended. For customers who are experiencing financial difficulties, management performs additional financial analyses before shipping to those customers on credit. The Company uses a variety of financial arrangements to ensure collectability of accounts receivable of customers deemed to be a credit risk, including requiring letters of credit, purchasing various forms of credit insurance with unrelated third parties, or requiring cash in advance of shipment.
The Company records an allowance for doubtful accounts based upon management’s assessment of the business environment, customers’ financial condition, historical collection experience, accounts receivable aging, customer disputes and the collectability of specific customer accounts.
Use of estimates
The preparation of consolidated financial statements in conformity with accounting principles generally accepted in the United States of America requires management to make estimates and assumptions that affect the reported amounts of assets and liabilities, disclosure of contingent assets and liabilities at the dates of the consolidated financial statements, and the reported amounts of revenue and expenses during the reporting periods. Actual future results could differ from those estimates.
Revenue recognition
Revenue is recognized upon the shipment of goods to customers or their agents, depending upon terms, provided there are no uncertainties regarding customer acceptance, the sales price is fixed or determinable and collectability is reasonably assured.
Generally the Company does not allow product returns. It provides its customers a negotiated allowance for breakage or defects, which is recorded when the related revenue is recognized. However, the Company does make occasional exceptions to this policy and consequently accrues a return allowance based upon historic return amounts and management estimates. The Company occasionally grants credits to facilitate markdowns and sales of slow-moving merchandise. These credits are recorded as a reduction of gross sales at the time of the sale.
43
Fair value measurements
Fair value is the price that would be received to sell an asset or paid to transfer a liability in an orderly transaction between market participants at the measurement date. In determining fair value, the Company uses various methods including market, income and cost approaches. Based upon these approaches, the Company often utilizes certain assumptions that market participants would use in pricing the asset or liability, including assumptions about risk and/or the risks inherent in the inputs to the valuation technique. These inputs can be readily observable, market-corroborated, or unobservable inputs. The Company utilizes valuation techniques that maximize the use of observable inputs and minimize the use of unobservable inputs. Based upon observable inputs used in the valuation techniques, the Company is required to provide information according to the fair value hierarchy. The fair value hierarchy ranks the quality and reliability of the information used to determine fair values into three broad levels as follows:
|
Level 1:
|
Valuations for assets and liabilities traded in active markets from readily available pricing sources for market transactions involving identical assets or liabilities.
|
|
Level 2:
|
Valuations for assets and liabilities traded in less active dealer or broker markets. Valuations are obtained from third-party pricing services for identical or similar assets or liabilities.
|
|
Level 3:
|
Valuations incorporate certain assumptions and projections in determining the fair value assigned to such assets or liabilities.
|
In instances where the determination of the fair value measurement is based upon inputs from different levels of the fair value hierarchy, the level in the fair value hierarchy within which the entire fair value measurement falls is based upon the lowest level input that is significant to the fair value measurement in its entirety. The Company’s assessment of the significance of a particular input to the fair value measurement in its entirety requires judgment, and considers factors specific to the asset or liability.
The following table summarizes the Company’s financial assets measured at fair value on a recurring basis as of December 31 (in thousands):
|
|
Fair Value Measurements
|
|||||||||||||||
|
|
Carrying Amount as of
|
As of December 31, 2016
|
||||||||||||||
|
|
December 31, 2016
|
Level 1
|
Level 2
|
Level 3
|
||||||||||||
|
|
||||||||||||||||
|
Cash equivalents
|
$
|
15,312
|
$
|
15,312
|
$
|
—
|
$
|
—
|
||||||||
|
|
Fair Value Measurements
|
|||||||||||||||
|
|
Carrying Amount as of
|
As of December 31, 2017
|
||||||||||||||
|
|
December 31, 2017
|
Level 1
|
Level 2
|
Level 3
|
||||||||||||
|
|
||||||||||||||||
|
Cash equivalents
|
$
|
13,718
|
$
|
13,718
|
$
|
—
|
$
|
—
|
||||||||
|
3.25% Convertible senior notes due in 2020
|
$
|
22,469
|
$
|
—
|
$
|
—
|
$
|
22,469
|
||||||||
The following table provides a reconciliation of the beginning and ending balances of assets measured at fair value on a recurring basis using significant unobservable inputs (Level 3) (in thousands):
|
|
2017
|
|||
|
Balance at January 1, 2017
|
$
|
—
|
||
|
Issuance of 3.25% Convertible Senior Notes due in 2020
|
22,161
|
|||
|
Change in fair value
|
308
|
|||
|
Balance at December 31, 2017
|
$
|
22,469
|
||
The Company’s accounts receivable, accounts payable and accrued expenses represent financial instruments. The carrying value of these financial instruments is a reasonable approximation of fair value.
In August 2017, the Company agreed with Oasis Management and Oasis Investments II Master Fund Ltd., the holder of approximately $21.5 million face amount of its 4.25% convertible senior notes due in 2018 (“2018 Notes”), to exchange and extend the maturity date of these notes to November 1, 2020. In addition, the interest rate was reduced to 3.25% per annum and the conversion rate was increased to 328.0302 shares of the Company’s common stock per $1,000 principal amount of notes, among other things. These notes are hereafter referred to as the “3.25% Convertible Senior Notes due in 2020” or “3.25% 2020 Notes.” After execution of a definitive agreement and final approval by the other members of the Company’s Board of Directors and Oasis’ Investment Committee, the transaction closed on November 7, 2017. The principal balance of the remaining 2018 Notes amounted to approximately $21.2 million. In connection with the transaction, the Company elected the fair value option of measurement for the 3.25% 2020 Notes under ASC 815 Derivatives and Hedging. As a result, these notes are re-measured each reporting period using Level 3 inputs (Monte Carlo simulation model and inputs for stock price, risk-free rate and volatility), with changes in fair value reflected in current period earnings in our consolidated statements of operations. At December 31, 2017 the 3.25% 2020 Notes had a fair value of $22.5 million.
44
The fair value of the remaining 4.25% convertible senior notes payable due 2018 as of December 31, 2016 and 2017 was $18.9 million and $20.5 million respectively, based upon the most recent quoted market prices, and the fair value of the 4.875% convertible senior notes payable due 2020 as of December 31, 2016 and 2017 was $89.3 million and $89.7 million, respectively, based upon the most recent quoted market prices. The fair values of the convertible senior notes are considered to be Level 3 measurements on the fair value hierarchy.
For the years ended December 31, 2016 and 2017, there was no impairment to the value of the Company’s non-financial assets.
Inventory
Inventory, which includes the ex-factory cost of goods, capitalized warehouse costs and in-bound freight and duty, is valued at the lower of cost (first-in, first-out) or market, net of inventory obsolescence reserve, and consists of the following (in thousands):
|
|
|
December 31,
|
||||||
|
|
|
2016
|
|
2017
|
||||
|
Raw materials
|
|
$
|
5,204
|
|
|
$
|
3,265
|
|
|
Finished goods
|
|
|
70,231
|
|
|
|
55,167
|
|
|
|
|
$
|
75,435
|
|
|
$
|
58,432
|
|
During the first quarter of 2017, the Company adopted Accounting Standards Update (“ASU”) 2015-11, “Simplifying the Measurement of Inventory (Topic 330)”. The amendments, which apply to inventory that is measured using any method other than the last-in, first-out (LIFO) or retail inventory method, require that entities measure inventory at the lower of cost or net realizable value. ASU 2015-11 is effective for fiscal years, and interim periods within those years, beginning after December 15, 2016 and should be applied on a prospective basis. The adoption of ASU 2015-11 did not have a material impact on the Company’s consolidated financial statements.
45
Property and equipment
Property and equipment are stated at cost and are being depreciated using the straight-line method over their estimated useful lives as follows:
|
Office equipment
|
5 years
|
|
Automobiles
|
5 years
|
|
Furniture and fixtures
|
5 - 7 years
|
|
Leasehold improvements
|
Shorter of length of lease or 10 years
|
During interim reporting periods, the Company uses the usage method as its depreciation methodology for molds and tools used in the manufacturing of its products, which is more closely correlated to the production of goods as it follows the seasonality of sales. The Company believes that the usage method more accurately matches costs with revenues. From a full-year perspective, the depreciation methodology follows the straight-line method, based on the estimated useful life of molds and tools of three years. Estimated useful lives are periodically reviewed and, where appropriate, changes are made prospectively. The carrying value of property and equipment is reviewed when events or changes in circumstances indicate that the carrying value of an asset may not be recoverable. No impairment charges were recorded for the years ended December 31, 2015, 2016 and 2017.
For the years ended December 31, 2015, 2016 and 2017, the Company’s aggregate depreciation expense related to property and equipment was $10.9 million, $13.9 million and $13.0 million, respectively.
Other Comprehensive Income (Loss)
Other comprehensive income (loss) includes all changes in equity from non-owner sources. The Company accounts for other comprehensive income in accordance with Accounting Standards Codification (“ASC”) ASC 220, “Comprehensive Income.” All the activity in other comprehensive income (loss) and all amounts in accumulated other comprehensive income (loss) relate to foreign currency translation adjustments.
Advertising
Production costs of commercials and programming are charged to operations in the period during which the production is first aired. The costs of other advertising, promotion and marketing programs are charged to operations in the period incurred. Advertising expense for the years ended December 31, 2015, 2016 and 2017, was approximately $15.8 million, $20.1 million and $10.8 million, respectively.
The Company also participates in cooperative advertising arrangements with certain customers, whereby it allows a discount from invoiced product amounts in exchange for customer purchased advertising that features the Company’s products. Typically, these discounts range from 2% to 10% of gross sales, and are generally based upon product purchases or specific advertising campaigns. Such amounts are accrued when the related revenue is recognized or when the advertising campaign is initiated. These cooperative advertising arrangements are accounted for as direct selling expenses.
Income taxes
The Company does not file a consolidated return with its foreign subsidiaries. The Company files federal and state returns and its foreign subsidiaries file returns in their respective jurisdictions. Deferred taxes are provided on an asset and liability method whereby deferred tax assets are recognized as deductible temporary differences and operating loss and tax credit carry-forwards and deferred tax liabilities are recognized for taxable temporary differences. Temporary differences are the differences between the reported amounts of assets and liabilities and their tax basis. Deferred tax assets are reduced by a valuation allowance when, in the opinion of management, it is more likely than not that some portion or all of the deferred tax assets will not be realized. Deferred tax assets and liabilities are adjusted for the effects of changes in tax laws and rates on the date of enactment.
In October 2016, the FASB issued ASU 2016-16, “Income Taxes (Topic 740): Intra-Entity Transfers of Assets Other than Inventory.” The amendments in this ASU reduces the complexity in the accounting standards by allowing the recognition of current and deferred income taxes for an intra-entity asset transfer, other than inventory, when the transfer occurs. Historically, recognition of the income tax consequence was not recognized until the asset was sold to an outside party. This ASU is effective for fiscal years, and interim periods within those fiscal years, beginning after December 15, 2017. Early adoption is permitted. The Company expects the impact of this ASU to be immaterial to its consolidated financial statements.
Foreign Currency Translation Exposure
The Company’s reporting currency is the U.S. dollar. The translation of its net investment in subsidiaries with non-U.S. dollar functional currencies subjects the Company to currency exchange rate fluctuations in its results of operations and financial position. Assets and liabilities of subsidiaries with non-U.S. dollar functional currencies are translated into U.S. dollars at year-end exchange rates. Income, expense and cash flow items are translated at average exchange rates prevailing during the year. The resulting currency translation adjustments are recorded as a component of accumulated other comprehensive loss/gain within stockholders’ equity. The Company’s primary currency translation exposures in 2015, 2016 and 2017 were related to its net investment in entities having functional currencies denominated in the Hong Kong dollar, British pound, Canadian dollar, Chinese yuan, Mexican peso and the Euro.
46
Foreign Currency Transaction Exposure
Currency exchange rate fluctuations may impact the Company’s results of operations and cash flows. The Company’s currency transaction exposures include gains and losses realized on unhedged inventory purchases and unhedged receivables and payables balances that are denominated in a currency other than the applicable functional currency. Gains and losses on unhedged inventory purchases and other transactions associated with operating activities are recorded in the components of operating income in the consolidated statement of operations.
Accounting for the impairment of finite-lived tangible and intangible assets
Long-lived assets with finite lives, which include property and equipment and intangible assets other than goodwill, are evaluated for impairment when events or changes in circumstances indicate that the carrying amount of the assets may not be recoverable through the estimated undiscounted future cash flows from the use of these assets. When any such impairment exists, the related assets will be written down to fair value. Finite-lived intangible assets consist primarily of product technology rights, acquired backlog, customer relationships, product lines and license agreements. These intangible assets are amortized over the estimated economic lives of the related assets. There were no impairments for years ended December 31, 2015 and 2016. In 2017, the Company recorded impairment charges of $2.9 million to write off the remaining unamortized technology rights related to DreamPlay, LLC which were included in product lines, and $2.3 million to write down several underutilized trademarks and trade names that were determined to have no value.
47
Goodwill and other indefinite-lived intangible assets
Goodwill and indefinite-lived intangible assets are not amortized, but are tested for impairment at least annually at the reporting unit level and asset level, respectively. Losses in value are recorded when material impairment has occurred in the underlying assets or when the benefits of the identified intangible assets are realized. Indefinite-lived intangible assets other than goodwill consist of trademarks.
The carrying value of goodwill and trademarks are based upon cost, which is subject to management’s current assessment of fair value. Management evaluates fair value recoverability using both objective and subjective factors. Objective factors include cash flows and analysis of recent sales and earnings trends. Subjective factors include management’s best estimates of projected future earnings and competitive analysis and the Company’s strategic focus.
For the years ended December 31, 2015 and 2016, there was no impairment to the value of the Company's goodwill or trademarks. In the third quarter of 2017, the Company determined that the fair values of its reporting units should be retested for potential impairment. Based on the retesting performed with the assistance of a third-party valuation consultant as of September 30, 2017, it was determined that the fair values of two of its three reporting units were less than their respective carrying amounts. Accordingly, a charge of $8.3 million for goodwill impairment was recorded.
Share-based Compensation
The Company measures all employee stock-based compensation awards using a fair value method and records such expense in its consolidated financial statements. The Company recorded $1.6 million, $1.6 million and $3.1 million of restricted stock expense in 2015, 2016 and 2017, respectively. See Note 17 for further details relating to share based compensation.
Earnings per share
The following table is a reconciliation of the weighted-average shares used in the computation of basic and diluted earnings per share (“EPS”) for the periods presented (in thousands, except per share data):
|
|
|
2015
|
||||||||||
|
|
|
|
|
|
Weighted
|
|
|
|
||||
|
|
|
|
|
|
Average
|
|
|
|
||||
|
|
|
Income
|
|
Shares
|
|
Per Share
|
||||||
|
Basic EPS
|
|
|
|
|
|
|
|
|
|
|||
|
Income available to common stockholders
|
|
$
|
23,254
|
|
|
|
19,435
|
|
$
|
1.20
|
|
|
|
Effect of dilutive securities:
|
|
|
|
|
|
|
|
|
|
|||
|
Assumed conversion of convertible senior notes
|
|
|
7,385
|
|
|
|
23,369
|
|
|
|
|
|
|
Options and warrants
|
|
|
—
|
|
|
|
—
|
|
|
|
|
|
|
Unvested performance stock grants
|
|
|
—
|
|
|
|
347
|
|
|
|
|
|
|
Unvested restricted stock grants
|
|
|
—
|
|
|
|
170
|
|
|
|
|
|
|
Diluted EPS
|
||||||||||||
|
Income available to common stockholders plus assumed exercises and conversion
|
|
$
|
30,639
|
|
|
|
43,321
|
|
|
$
|
0.71
|
|
|
|
|
2016
|
||||||||||
|
|
|
|
|
|
Weighted
|
|
|
|
||||
|
|
|
|
|
|
Average
|
|
|
|
||||
|
|
|
Income
|
|
Shares
|
|
Per Share
|
||||||
|
Basic EPS
|
|
|
|
|
|
|
|
|
|
|||
|
Income available to common stockholders
|
|
$
|
1,243
|
16,542
|
$
|
0.08
|
||||||
|
Effect of dilutive securities:
|
|
|
||||||||||
|
Assumed conversion of convertible senior notes
|
|
|
—
|
—
|
||||||||
|
Options and warrants
|
—
|
—
|
||||||||||
|
Unvested performance stock grants
|
|
|
—
|
—
|
||||||||
|
Unvested restricted stock grants
|
|
|
—
|
123
|
||||||||
|
Diluted EPS
|
|
|
||||||||||
|
Income available to common stockholders plus assumed exercises and conversion
|
|
$
|
1,243
|
16,665
|
$
|
0.07
|
||||||
48
|
|
|
2017
|
||||||||||
|
|
|
|
|
|
Weighted
|
|
|
|
||||
|
|
|
|
|
|
Average
|
|
|
|
||||
|
|
|
Loss
|
|
Shares
|
|
Per Share
|
||||||
|
Basic EPS
|
|
|
|
|
|
|
|
|
|
|||
|
Loss attributable to common stockholders
|
|
$
|
(83,085
|
) |
21,341
|
$
|
(3.89
|
) | ||||
|
Effect of dilutive securities:
|
|
|
||||||||||
|
Assumed conversion of convertible senior notes
|
|
|
—
|
—
|
||||||||
|
Options and warrants
|
—
|
—
|
||||||||||
|
Unvested performance stock grants
|
|
|
—
|
—
|
||||||||
|
Unvested restricted stock grants
|
|
|
—
|
—
|
||||||||
|
Diluted EPS
|
|
|
||||||||||
|
Loss attributable to common stockholders plus assumed exercises and conversion
|
|
$
|
(83,085
|
) |
21,341
|
$
|
(3.89
|
) | ||||
Basic earnings per share is calculated using the weighted average number of common shares outstanding during the period. Diluted earnings per share is calculated using the weighted average number of common shares and common share equivalents outstanding during the period (which consist of warrants, options and convertible debt to the extent they are dilutive). For the years ended December 31, 2015, 2016 and 2017, the convertible senior notes interest and related common share equivalent of nil, 23,004,916 and 18,272,906, respectively, were excluded from the diluted earnings per share calculation because they were anti-dilutive. Potentially dilutive stock options and warrants of 1,518,596, 1,500,000 and 1,062,500 for the years ended December 31, 2015, 2016 and 2017, respectively, were excluded from the computation of diluted earnings per share since they would have been anti-dilutive. Potentially dilutive restricted stock of nil for each of the years ended December 31, 2015, 2016 and 2017 were excluded from the computation of diluted earnings per share since they would have been anti-dilutive.
The Company is also party to a prepaid forward contract to purchase 3,112,840 shares of its common stock that are to be delivered over a settlement period in 2020. The number of shares to be delivered under the prepaid forward contract has been removed from the weighted-average basic and diluted shares outstanding. Any dividends declared and paid on the shares underlying the forward contract are to be reverted back to the Company based on the contractual terms of the forward contract.
49
Debt with Conversion and Other Options
In July 2013, the Company sold an aggregate of $100.0 million principal amount of 4.25% convertible senior notes due 2018 (the “2018 Notes”). The 2018 Notes are senior unsecured obligations of the Company paying interest semi-annually in arrears on August 1 and February 1 of each year at a rate of 4.25% per annum and will mature on August 1, 2018. The initial and still current conversion rate for the 2018 Notes is 114.3674 shares of the Company’s common stock per $1,000 principal amount of notes, equivalent to an initial conversion price of approximately $8.74 per share of common stock, subject to adjustment in certain events. Upon conversion, the 2018 Notes will be settled in shares of the Company’s common stock. Holders of the 2018 Notes may require that the Company repurchase for cash all or some of their notes upon the occurrence of a fundamental change (as defined in the 2018 Notes). In 2016, the Company repurchased and retired an aggregate of approximately $6.1 million principal amount of the 2018 Notes. In 2017, the Company exchanged and retired an aggregate of $51.1 million principal amount of the 2018 Notes at par for $35.6 million in cash and approximately 3.0 million shares of its common stock, reducing the principal balance of the remaining 2018 Notes to approximately $21.2 million. In addition, $21.5 million principal amount of the 2018 Notes were exchanged and their maturity extended to November 1, 2020 along with a reduction in the interest rate to 3.25% per annum if paid in cash and a reduction in the conversion price to $3.05 per share (the “3.25% 2020 Notes”).
In June 2014, the Company sold an aggregate of $115.0 million principal amount of 4.875% convertible senior notes due 2020 (the “2020 Notes”). The 2020 Notes are senior unsecured obligations of the Company paying interest semi-annually in arrears on June 1 and December 1 of each year at a rate of 4.875% per annum and will mature on June 1, 2020. The initial and still current conversion rate for the 2020 Notes is 103.7613 shares of the Company’s common stock per $1,000 principal amount of notes, equivalent to an initial conversion price of approximately $9.64 per share of common stock, subject to adjustment in certain events. Upon conversion, the 2020 Notes will be settled in shares of the Company’s common stock. Holders of the 2020 Notes may require that the Company repurchase for cash all or some of their notes upon the occurrence of a fundamental change (as defined in the 2020 Notes). The Company received net proceeds of approximately $110.4 million from the offering of which $24.0 million was used to repurchase 3.1 million shares of the Company’s common stock under a prepaid forward purchase contract. In January 2016, the Company repurchased and retired an aggregate of $2.0 million principal amount of the 2020 Notes.
In June 2014, the Company effectively repurchased 3,112,840 shares of its common stock at an average cost of $7.71 per share for an aggregate amount of $24.0 million pursuant to a prepaid forward share repurchase agreement entered into with Merrill Lynch International (“ML”). These repurchased shares are treated as retired for basic and diluted EPS purposes although they remain legally outstanding. The Company reflects the aggregate purchase price of its common shares repurchased as a reduction to stockholders’ equity allocated to treasury stock. Any dividends declared and paid on the shares underlying the forward contract are to be reverted back to the Company based on the contractual terms of the forward contract.
Reclassifications
Certain reclassifications were made to the prior year consolidated financial statements to conform to current year presentation.
Recent Accounting Pronouncements
In May 2014, the FASB issued ASU 2014-09, “Revenue from Contracts with Customers (Topic 606)”, which supersedes the revenue recognition requirements in ASC 605, (Topic 605), and most industry-specific guidance. Under the new model, recognition of revenue occurs when a customer obtains control of promised goods or services in an amount that reflects the consideration to which the entity expects to be entitled in exchange for those goods or services. In addition, the new standard requires that reporting companies disclose the nature, amount, timing, and uncertainty of revenue and cash flows arising from contracts with customers. In August 2015, the FASB issued ASU 2015-14, “Revenue from Contracts with Customers – Deferral of the Effective Date”, which defers the effective date of ASU 2014-09 to annual reporting periods beginning after December 15, 2017, and interim periods therein. In 2016, the FASB issued ASU 2016-08, “Principal versus Agent Considerations (Reporting Revenue Gross versus Net)”, ASU 2016-10, “Identifying Performance Obligations and Licensing”, and ASU 2016-12, “Revenue from Contracts with Customers - Narrow-Scope Improvements and Practical Expedients”. Entities have the choice to adopt these updates using either of the following transition methods: (i) a full retrospective approach reflecting the application of the standard in each prior reporting period with the option to elect certain practical expedients, or (ii) a modified retrospective approach with the cumulative effect of these standards recognized at the date of the adoption.
The Company’s approach to analyze the impact of the standard on its revenue contracts included a review of existing contracts with customers, an evaluation of the specific terms of those contracts and the appropriate treatment under the new standards, and a comparison of that new treatment to its existing accounting policies to identify differences. The Company will adopt the requirements of the new standard on January 1, 2018 using the modified retrospective approach.
The Company identified the same performance obligation (sale of our products) under Topic 606 as compared with deliverables and separate units of account previously identified under Topic 605.
50
The Company does offer certain types of variable consideration to customers such as discounts, pricing allowances and collaborative marketing arrangements. The standard requires us to estimate these amounts. The Company anticipates that the timing and measurement of revenue will be consistent with its current revenue recognition although the approach to revenue recognition will now be based on the transfer of control. As a result, there will be no impact to the Company’s consolidated financial statements on the adoption of the new standard as of January 1, 2018.
The Company established new key controls within its financial reporting infrastructure specific to its adoption of ASC 606. Furthermore, additional disclosures will be required to enable users to understand the nature, amount, timing, and uncertainty of revenue and cash flows arising from contracts with customers. Beginning in the first quarter of 2018, additional disclosures will include, but are not limited to, significant judgments and practical expedients elected in the adoption of Topic 606.
In January 2016, the FASB issued ASU 2016-01, “Financial Instruments - Overall: Recognition and Measurement of Financial Assets and Financial Liabilities” (“ASU 2016-01”). The new guidance is intended to improve the recognition and measurement of financial instruments. The ASU is effective for fiscal years and interim periods within those years beginning after December 15, 2017. The adoption of this standard is not expected to have a material impact on the Company’s consolidated financial statements.
In February 2016, the FASB issued Accounting Standards Update 2016-02, “Leases” (“ASU 2016-02”). ASU 2016-02 establishes a right-of-use (“ROU”) model that requires a lessee to record a ROU asset and a lease liability on the balance sheet for all leases with terms longer than 12 months. Leases will be classified as either finance or operating, with classification affecting the pattern of expense recognition in the income statement. ASU 2016-02 is effective for fiscal years beginning after December 15, 2018, including interim periods within those fiscal years. Early adoption is permitted. A modified retrospective transition approach is required for lessees for capital and operating leases existing at, or entered into after, the beginning of the earliest comparative period presented in the financial statements, with certain practical expedients available. The Company is currently evaluating the impact of the pending adoption of this new standard on its consolidated financial statements.
In August 2016, the FASB issued ASU 2016-15, “Statement of Cash Flows (Topic 230): Classification of Certain Cash Receipts and Cash Payments.” The new guidance is intended to reduce diversity in practice in how transactions are classified in the statement of cash flows. This ASU is effective for fiscal years, and for interim periods within those fiscal years, beginning after December 15, 2017. The adoption of this standard is not expected to have a material impact on the Company’s consolidated financial statements.
In October 2016, the FASB issued ASU 2016-16, “Income Taxes (Topic 740): Intra-Entity Transfers of Assets Other than Inventory.” The amendments in this ASU reduces the complexity in the accounting standards by allowing the recognition of current and deferred income taxes for an intra-entity asset transfer, other than inventory, when the transfer occurs. Historically, recognition of the income tax consequence was not recognized until the asset was sold to an outside party. This ASU is effective for fiscal years, and interim periods within those fiscal years, beginning after December 15, 2017. Early adoption is permitted. The adoption of this standard is not expected to have a material impact on the Company’s consolidated financial statements.
In November 2016, the FASB issued ASU 2016-18, “Statement of Cash Flows (Topic 230): Restricted Cash”. The update requires that amounts generally described as restricted cash or restricted cash equivalents be included with cash and cash equivalents when reconciling the beginning-of-period and end-of-period total amounts shown on the statement of cash flows. The new standard will be effective for fiscal years beginning after December 15, 2017, including interim periods within those fiscal years, and early adoption is permitted. The Company early adopted this standard during the second quarter of 2017. The adoption of this standard does not have an impact on the Company’s consolidated financial statements.
In May 2017, the FASB issued ASU 2017-09, “Compensation—Stock Compensation (Topic 718): Scope of Modification Accounting”, which clarifies when to account for a change to the terms or conditions of a share-based payment award as a modification. Under the new guidance, modification accounting is required only if the fair value, vesting conditions, or the classification of the award (as equity or liability) changes as a result of the change in terms or conditions. ASU 2017-09 is effective for fiscal years beginning after December 15, 2017, including interim periods within those fiscal years. The adoption of this standard is not expected to have a material impact on the Company’s consolidated financial statements.
51
Note 3—Business Segments, Geographic Data, Sales by Product Group and Major Customers
The Company is a worldwide producer and marketer of children’s toys and other consumer products, principally engaged in the design, development, production, marketing and distribution of its diverse portfolio of products. The Company has aligned its operating segments into three segments that reflect the management and operation of the business. The Company’s segments are (i) U.S. and Canada, (ii) International and (iii) Halloween.
The U.S. and Canada segment includes action figures, vehicles, play sets, plush products, dolls, electronic products, construction toys, infant and pre-school toys, role play and everyday costume play, foot to floor ride-on vehicles, wagons, novelty toys, seasonal and outdoor products, and kids’ indoor and outdoor furniture, primarily within the United States and Canada.
Within the International segment, the Company markets and sells its toy products in markets outside of the U.S. and Canada, primarily in the European, Asia Pacific, and Latin and South American regions.
Within the Halloween segment, the Company markets and sells Halloween costumes and accessories and everyday costume play products, primarily in the U.S. and Canada.
Segment performance is measured at the operating income level. All sales are made to external customers and general corporate expenses have been attributed to the various segments based upon relative sales volumes. Segment assets are primarily comprised of accounts receivable and inventories, net of applicable reserves and allowances, goodwill and other assets. Certain assets which are not tracked by operating segment and/or that benefit multiple operating segments have been allocated on the same basis.
Results are not necessarily those which would be achieved if each segment was an unaffiliated business enterprise. Information by segment and a reconciliation to reported amounts as of December 31, 2016 and 2017 and for the three years in the period ended December 31, 2017 are as follows (in thousands):
|
|
|
Years Ended December 31,
|
||||||||||
|
|
|
2015
|
|
2016
|
|
2017
|
||||||
|
Net Sales
|
|
|
|
|
|
|
|
|
|
|||
|
U.S. and Canada
|
|
$
|
478,728
|
|
|
$
|
478,595
|
|
|
$
|
406,411
|
|
|
International
|
169,826
|
131,229
|
107,231
|
|||||||||
|
Halloween
|
|
|
97,187
|
|
|
|
96,779
|
|
|
|
99,469
|
|
|
|
|
$
|
745,741
|
|
|
$
|
706,603
|
|
|
$
|
613,111
|
|
|
|
|
Years Ended December 31,
|
||||||||||
|
|
|
2015
|
|
2016
|
|
2017
|
||||||
|
Income (Loss) from Operations
|
|
|
|
|
|
|
|
|
|
|||
|
U.S. and Canada
|
|
$
|
17,562
|
|
$
|
17,434
|
|
$
|
(35,720
|
)
|
||
|
International
|
16,249
|
4,360
|
(13,184
|
)
|
||||||||
|
Halloween
|
|
|
(3,281
|
)
|
|
|
(4,688
|
)
|
|
|
(15,254
|
)
|
|
|
|
$
|
30,530
|
|
|
$
|
17,106
|
|
$
|
(64,158
|
)
|
|
|
|
|
Years Ended December 31,
|
||||||||||
|
|
|
2015
|
|
2016
|
|
2017
|
||||||
|
Depreciation and Amortization Expense
|
|
|
|
|
|
|
|
|
|
|||
|
U.S. and Canada
|
|
$
|
13,023
|
|
|
$
|
16,817
|
|
|
$
|
15,286
|
|
|
International
|
4,439
|
4,549
|
4,079
|
|||||||||
|
Halloween
|
|
|
1,398
|
|
|
|
1,578
|
|
|
|
1,638
|
|
|
|
|
$
|
18,860
|
|
|
$
|
22,944
|
|
|
$
|
21,003
|
|
|
|
December 31,
|
|||||||
|
|
2016
|
|
2017
|
|||||
|
Assets
|
|
|
|
|
|
|||
|
U.S. and Canada
|
$
|
306,895
|
|
|
$
|
229,505
|
|
|
|
International
|
119,560
|
106,255
|
||||||
|
Halloween
|
|
37,848
|
|
|
|
34,589
|
|
|
|
|
$
|
464,303
|
|
|
$
|
370,349
|
|
|
52
Information regarding the Company’s operations in different geographical areas is presented below on the basis the Company uses to manage its business. Net revenues are categorized based upon location of the customer, while long-lived assets are categorized based upon the location of the Company’s assets. Tools, dies and molds represent a substantial portion of the long-lived assets included in the United States with a net book value of $15.7 million in 2016 and $17.0 million in 2017 and substantially all of these assets are located in China. The following tables present information about the Company by geographic area as of December 31, 2016 and 2017 and for each of the three years in the period ended December 31, 2017 (in thousands):
|
|
December 31,
|
|||||||
|
|
2016
|
|
2017
|
|||||
|
Long-lived Assets
|
|
|
|
|
|
|||
|
China
|
$
|
15,710
|
|
|
$
|
17,194
|
|
|
|
United States
|
|
6,587
|
|
|
|
5,755
|
|
|
|
Hong Kong
|
|
544
|
|
|
|
278
|
|
|
|
|
$
|
22,841
|
|
|
$
|
23,227
|
|
|
|
|
Years Ended December 31,
|
|||||||||||
|
|
2015
|
2016
|
2017
|
|||||||||
|
Net Sales by Customer Area
|
||||||||||||
|
United States
|
$
|
542,101
|
$
|
544,096
|
$
|
479,133
|
||||||
|
Europe
|
117,313
|
92,811
|
71,094
|
|||||||||
|
Canada
|
32,587
|
26,947
|
21,882
|
|||||||||
|
Hong Kong
|
1,675
|
2,012
|
1,064
|
|||||||||
|
Other
|
52,065
|
40,737
|
39,938
|
|||||||||
|
|
$
|
745,741
|
$
|
706,603
|
$
|
613,111
|
||||||
Major Customers
Net sales to major customers were as follows (in thousands, except for percentages):
|
|
|
2015
|
|
2016
|
|
2017
|
||||||||||||||||||
|
|
|
|
|
|
Percentage of
|
|
|
|
|
Percentage of
|
|
|
|
|
Percentage of
|
|||||||||
|
|
|
Amount
|
|
Net Sales
|
|
Amount
|
|
Net Sales
|
|
Amount
|
|
Net Sales
|
||||||||||||
|
Wal-Mart
|
|
$
|
180,758
|
|
|
|
24.3
|
%
|
|
$
|
186,894
|
26.5
|
%
|
|
$
|
156,436
|
25.5
|
%
|
||||||
|
Target
|
|
|
96,850
|
|
|
|
13.0
|
|
|
110,233
|
15.6
|
|
|
108,799
|
17.8
|
|||||||||
|
Toys 'R' Us
|
|
|
96,446
|
|
|
|
12.9
|
|
|
90,568
|
12.8
|
|
|
69,508
|
11.3
|
|||||||||
|
|
|
$
|
374,054
|
|
|
|
50.2
|
%
|
|
$
|
387,695
|
54.9
|
%
|
|
$
|
334,743
|
54.6
|
%
|
||||||
No other customer accounted for more than 10% of the Company’s total net sales.
As of December 31, 2016 and 2017, the Toys “R” Us, Inc. (“TRU”) consolidated accounts receivable balance represented 23.5% and 26.4%, respectively, of the Company’s gross accounts receivable. When combined with Wal-Mart and Target, the Company’s other two most significant customers, these customers represent 59.6% and 60.6%, respectively, of gross accounts receivable at December 31, 2016 and 2017.
On September 18, 2017, TRU and certain of its U.S. subsidiaries and its Canadian subsidiary voluntarily filed for relief under Chapter 11 of the Bankruptcy Code in the U.S. The Canadian subsidiary also began parallel proceedings under the Companies’ Creditors Arrangement Act (“CCAA”) in Canada. As a result, the Company has reserved $8.9 million of the TRU pre-petition consolidated accounts receivable balance of $22.8 million resulting in a net pre-petition consolidated accounts receivable balance of $13.9 million as of December 31, 2017. The unreserved amount includes $2.9 million and the Company can assert a priority claim under section 503(b)(9) of the Bankruptcy Code for this amount. The balance of the unreserved amount has been submitted to the Company’s insurance carrier and is expected to be recovered.
On September 20, 2017, TRU received interim approval to access up to $2.2 billion in debtor-in-possession financing and on September 22, 2017 TRU closed on $3.1 billion of debtor-in-possession financing to support its ongoing liquidity needs. Accordingly, the Company resumed shipping to TRU for the 2017 holiday season resulting in post-petition consolidated accounts receivable balance with TRU at December 31, 2017 of $18.6 million, with no related amount reserved. Subsequent to the year ended December 31, 2017, the Company has collected $14.1 million (unaudited) of the TRU post-petition consolidated accounts receivable balance outstanding as of December 31, 2017 resulting in a remaining balance of $4.5 million (unaudited) as of March 15, 2018.
The concentration of the Company’s business with a relatively small number of customers may expose the Company to material adverse effects if one or more of its large customers were to experience financial difficulty. The Company performs ongoing credit evaluations of its top customers and maintains an allowance for potential credit losses (see Note 22).
53
Note 4—Joint Ventures
The Company owns a fifty percent interest in a joint venture (“Pacific Animation Partners”) with the U.S. entertainment subsidiary of a leading Japanese advertising and animation production company. The joint venture was created to develop and produce a boys’ animated television show, which it licensed worldwide for television broadcast as well as consumer products. The Company produced toys based upon the television program under a license from the joint venture which also licensed certain other merchandising rights to third parties. The joint venture completed and delivered 65 episodes of the show, which began airing in February 2012, and has since ceased production of the television show. For the years ended December 31, 2015, 2016 and 2017, the Company recognized income from the joint venture of $0.1 million, $0.7 million and nil, respectively.
As of December 31, 2016 and 2017, the balance of the investment in the Pacific Animation Partners joint venture is nil.
In September 2012, the Company entered into a joint venture (“DreamPlay Toys”) with NantWorks LLC (“NantWorks”) in which it owns a fifty percent interest. Pursuant to the operating agreement of DreamPlay Toys, the Company paid to NantWorks cash in the amount of $8.0 million and issued NantWorks a warrant to purchase 1.5 million shares of the Company’s common stock at a value of $7.0 million in exchange for the exclusive right to arrange for the provision of the NantWorks recognition technology platform for toy products. The Company had classified these rights as an intangible asset, which was being amortized over the anticipated revenue stream from the exploitation of these rights. However, the Company has abandoned the use of the technology in connection with its toy products and no future sales are anticipated, and the Company recorded an impairment charge to income of $2.9 million to write off the remaining unamortized technology rights during the third quarter of 2017. The Company retains the financial risk of the joint venture and is responsible for the day-to-day operations, which are expected to be nominal in future periods. The results of operations of the joint venture are consolidated with the Company’s results.
In addition, in 2012, the Company invested $7.0 million in cash in exchange for a five percent economic interest in a related entity, DreamPlay, LLC, that was expected to monetize the exploitation of the recognition technologies in non-toy consumer product categories. Adoption of the technology has been inadequate to establish a commercially viable market for the technology. NantWorks has the right to repurchase the Company’s interest for $7.0 million, but the Company does not anticipate that NantWorks will do so. As of September 30, 2017, the Company determined the value of this investment will not be realized and that full impairment of the value had occurred. Accordingly, the Company recorded an impairment charge of $7.0 million during the quarter ended September 30, 2017.
In November 2014, the Company entered into a joint venture with Meisheng Culture & Creative Corp., for the purpose of providing certain JAKKS licensed and non-licensed toys and consumer products to agreed-upon territories of the People’s Republic of China. The joint venture includes a subsidiary in the Shanghai Free Trade Zone that sells, distributes and markets these products, which include dolls, plush, role play products, action figures, costumes, seasonal items, technology and app-enhanced toys, based on top entertainment licenses and JAKKS’ own proprietary brands. The Company owns fifty-one percent of the joint venture and consolidates the joint venture since control rests with the Company. The non-controlling interest’s share of the income from the joint venture for the year ended December 31, 2016 and 2017 was income of $6,000 and $57,000, respectively.
In October 2016, the Company entered into a joint venture with Hong Kong Meisheng Cultural Company Limited, a Hong Kong-based subsidiary of Meisheng (“HK Meisheng”), for the purpose of creating and developing original, multiplatform content for children including new short-form series and original shows. JAKKS and HK Meisheng each own fifty percent of the joint venture and will jointly own the content. JAKKS will retain merchandising rights for kids’ consumer products in all markets except China, which Meisheng will oversee through the Company’s existing distribution joint venture. The non-controlling interest’s share of the loss from the joint venture for year ended December 31, 2017 was nil. As of April 27, 2017, Hong Kong Meisheng Cultural Company Limited beneficially owns more than 10% of the Company’s outstanding common stock.
Note 5—Business Combinations
In October 2016, the Company acquired the operating assets of C’est Moi with its performance makeup and youth skincare product lines for $0.3 million to further enhance its existing product lines and to continue diversification into other consumer products categories. We expect to launch a full line of makeup and skincare products branded under the C’est Moi name in the U.S. and Canada in the first quarter of 2018. The Company’s investment in C’est Moi is included in trademarks in our consolidated financial statements (See Note 7).
54
Note 6—Goodwill
The changes in the carrying amount of goodwill by reporting unit for the years ended December 31, 2016 and 2017 are as follows (in thousands):
|
|
U.S. and Canada
|
International
|
Halloween
|
Total
|
||||||||||||
|
Balance, January 1, 2016:
|
||||||||||||||||
|
Goodwill
|
$
|
30,218
|
$
|
11,717
|
$
|
2,264
|
$
|
44,199
|
||||||||
|
Adjustments to goodwill for foreign currency translation
|
(678
|
)
|
(262
|
)
|
(51
|
)
|
(991
|
)
|
||||||||
|
Balance December 31, 2016:
|
29,540
|
11,455
|
2,213
|
43,208
|
||||||||||||
|
Adjustments to goodwill for foreign currency translation
|
317
|
125
|
22
|
464
|
||||||||||||
|
Impairment
|
(6,053
|
)
|
—
|
(2,235
|
)
|
(8,288
|
)
|
|||||||||
|
Balance December 31, 2017:
|
$
|
23,804
|
$
|
11,580
|
$
|
—
|
$
|
35,384
|
||||||||
The Company assesses goodwill and indefinite-lived intangible assets for impairment on an annual basis by reviewing relevant qualitative and quantitative factors. More frequent evaluations may be required if the Company experiences changes in its business climate or as a result of other triggering events that take place. If carrying value exceeds fair value, a possible impairment exists and further evaluation is performed.
The Company performed its annual assessment for impairment on goodwill as of our annual testing date being April 1, 2017. In performing its assessment for goodwill impairment, the Company prepared a Step 1 quantitative test and determined there was no impairment to goodwill as of April 1, 2017. The valuation of goodwill involves a high degree of judgment and uncertainty related to key assumptions. Due to the subjective nature of the impairment analysis, significant changes in the assumptions used to develop the estimate could materially affect the conclusion regarding the future cash flows necessary to support the valuation of goodwill.
In January 2017, the FASB issued ASU 2017-04, “Simplifying the Test for Goodwill Impairment”, which removes Step 2 from the goodwill impairment test. ASU 2017-04 requires that if a reporting unit’s carrying value exceeds its fair value, an impairment charge would be recognized for the excess amount, not to exceed the carrying amount of goodwill. ASU 2017-04 will be effective for interim and annual reporting periods beginning after December 15, 2019. Early application is permitted after January 1, 2017. The Company early adopted ASU 2017-04 in the third quarter of 2017.
The Company applies a fair value-based impairment test to the carrying value of goodwill and indefinite-lived intangible assets on an annual basis, and on an interim basis, if certain events or circumstances indicate that an impairment loss may have been incurred. Goodwill impairment exists when the estimated fair value of goodwill is less than its carrying value. Based on several factors that have occurred since the Company’s April 1, 2017 assessment, the Company determined that the fair values of its reporting units should be retested for potential impairment. Based on the retesting performed with the assistance of a third-party valuation consultant as of September 30, 2017, it was determined that the fair values of two of its three reporting units were less than their respective carrying amounts. Accordingly, a charge of $8.3 million for goodwill impairment was recorded during the third quarter of the year ending December 31, 2017. No impairment was recorded during the year ended December 31, 2016.
Note 7—Intangible Assets
Intangible assets consist primarily of licenses, product lines, customer relationships and trademarks. Amortized intangible assets are included in intangibles in the accompanying balance sheets. Trademarks are disclosed separately in the accompanying balance sheets. Intangible assets are as follows (in thousands, except for weighted useful lives):
|
|
|
|
|
|
December 31, 2016
|
|
|
December 31, 2017
|
|
||||||||||||||||||
|
|
|
Weighted
Useful
Lives
|
|
|
Gross
Carrying
Amount
|
|
|
Accumulated
Amortization
|
|
|
Net
Amount
|
|
|
Gross
Carrying
Amount
|
|
|
Accumulated
Amortization
|
|
|
Net
Amount
|
|
||||||
|
|
|
(Years)
|
|
|
|
|
|
|
|
|
|
|
|
|
|
|
|
|
|
|
|
||||||
|
|
|
|
|
|
|
|
|
|
|
|
|
|
|
|
|
|
|
|
|
|
|
||||||
|
Amortized Intangible Assets:
|
|
|
|
|
|
|
|
|
|
|
|
|
|
|
|
|
|
|
|
|
|
||||||
|
Licenses
|
|
5.81
|
$
|
20,130
|
|
$
|
(17,248
|
)
|
|
$
|
2,882
|
|
$
|
20,130
|
|
$
|
(18,620
|
)
|
|
$
|
1,510
|
||||||
|
Product lines
|
|
5.07
|
50,093
|
|
|
(20,634
|
)
|
|
|
29,459
|
|
33,858
|
|
|
(13,178
|
)
|
|
|
20,680
|
||||||||
|
Customer relationships
|
|
4.90
|
3,152
|
|
|
(2,755
|
)
|
|
|
397
|
|
3,152
|
|
|
(3,152
|
)
|
|
|
―
|
||||||||
|
Trade names
|
|
5.00
|
3,000
|
|
|
(2,650
|
)
|
|
|
350
|
|
3,000
|
|
|
(3,000
|
)
|
|
|
―
|
||||||||
|
Non-compete/ Employment contracts
|
|
5.00
|
200
|
|
|
(177
|
)
|
|
|
23
|
|
200
|
|
|
(200
|
)
|
|
|
―
|
||||||||
|
Total amortized intangible assets
|
|
$
|
76,575
|
|
$
|
(43,464
|
)
|
|
$
|
33,111
|
|
$
|
60,340
|
|
$
|
(38,150
|
)
|
|
$
|
22,190
|
|||||||
|
Unamortized Intangible Assets:
|
|
|
|
|
|
|
|
|
|
|
|
||||||||||||||||
|
Trademarks
|
|
|
$
|
2,608
|
|
$
|
―
|
|
$
|
2,608
|
|
$
|
300
|
|
$
|
―
|
|
$
|
300
|
||||||||
55
In 2017, the Company recorded impairment charges of $2.9 million to write off the remaining unamortized technology rights related to DreamPlay, LLC which were included in product lines, and $2.3 million to write down several underutilized trademarks and trade names that were determined to have no value.
For the years ended December 31, 2015, 2016 and 2017, the Company’s aggregate amortization expense related to intangible assets was $8.0 million, $8.8 million and $8.0 million, respectively. The Company currently estimates continuing future amortization expense to be approximately (in thousands):
|
2018
|
$
|
4,261
|
||
|
2019
|
3,327
|
|||
|
2020
|
3,053
|
|||
|
2021
|
3,053
|
|||
|
2022
|
3,053
|
|||
|
Thereafter
|
5,443
|
|||
|
|
$
|
22,190
|
56
Note 8—Concentration of Credit Risk
Financial instruments that subject the Company to concentration of credit risk are cash and cash equivalents and accounts receivable. Cash equivalents consist principally of short-term money market funds. These instruments are short-term in nature and bear minimal risk. On September 18, 2017, Toys "R" Us, Inc. filed for relief under Chapter 11 of the Bankruptcy Code. Accordingly, as of December 31, 2017, the Company has reserved $8.9 million of the Toys "R" Us pre-petition bankruptcy receivables (see Note 3).
The Company performs ongoing credit evaluations of its customers’ financial conditions, but does not require collateral to support domestic customer accounts receivable. Most goods shipped FOB Hong Kong or China are secured with irrevocable letters of credit.
Note 9—Accrued Expenses
Accrued expenses consist of the following (in thousands):
|
|
2016
|
2017
|
||||||
|
Royalties
|
$
|
13,805
|
$
|
17,854
|
||||
|
Inventory liabilities
|
5,425
|
5,943
|
||||||
|
Salaries and employee benefits
|
3,243
|
4,064
|
||||||
|
Unearned revenue
|
779
|
3,924
|
||||||
|
Bonuses
|
1,500
|
1,914
|
||||||
|
Goods in transit
|
3,441
|
1,669
|
||||||
|
Interest expense
|
2,520
|
1,398
|
||||||
|
Professional fees
|
3,696
|
1,376
|
||||||
|
Sales commissions
|
816
|
663
|
||||||
|
Other
|
3,420
|
3,340
|
||||||
|
|
$
|
38,645
|
$
|
42,145
|
||||
In addition to royalties currently payable on the sale of licensed products during the quarter, the Company records a liability as accrued royalties for the estimated shortfall in achieving minimum royalty guarantees pursuant to certain license agreements (Note 16).
Note 10—Related Party Transactions
A director of the Company is a partner in a law firm that acts as counsel to the Company. The Company incurred legal fees and expenses to the law firm in the amount of approximately $3.1 million in 2015, $3.2 million in 2016 and $2.2 million in 2017. As of December 31, 2016 and 2017, legal fees and reimbursable expenses of $1.6 million and $0.5 million, respectively, were payable to this law firm.
The owner of NantWorks, the Company’s DreamPlay Toys joint venture partner, beneficially owns 8.9% of the Company’s outstanding common stock. Pursuant to the joint venture agreements, the Company is obligated to pay NantWorks a preferred return on joint venture sales.
For the years ended December 31, 2015, 2016 and 2017, preferred returns of $0.7 million, nil and nil, respectively, were earned and payable to NantWorks. Pursuant to the amended Toy Services Agreement, NantWorks is entitled to receive a renewal fee in the amount $1.2 million payable in installments of $0.8 million paid on the effective date of the renewal in 2015 and $0.2 million on or before each of August 1, 2016 and 2017. As of December 31, 2016 and 2017, the Company has a receivable from NantWorks in the amount of $0.6 million and nil, respectively. In addition, the Company previously leased office space from NantWorks. Rent expense, including common area maintenance and parking, for the years ended December 31, 2015, 2016 and 2017 was $0.1 million, nil and nil, respectively.
In November 2014, the Company entered into a joint venture with Meisheng Cultural & Creative Corp., Ltd., for the purpose of providing certain JAKKS licensed and non-licensed toys and consumer products to agreed-upon territories of the People’s Republic of China. The joint venture includes a subsidiary in the Shanghai Free Trade Zone that sells, distributes and markets these products, which include dolls, plush, role play products, action figures, costumes, seasonal items, technology and app-enhanced toys, based on top entertainment licenses and JAKKS’ own proprietary brands. The Company owns fifty-one percent of the joint venture and consolidates the joint venture since control rests with the Company. The non-controlling interest’s share of the income (loss) from the joint venture for the year 2016 and 2017 was $6,000 and 57,000, respectively.
In October 2016, the Company entered into a joint venture with Hong Kong Meisheng Cultural Company Limited, a Hong Kong-based subsidiary of Meisheng (“HK Meisheng”), for the purpose of creating and developing original, multiplatform content for children including new short-form series and original shows. JAKKS and HK Meisheng each own fifty percent of the joint venture and will jointly own the content. JAKKS will retain merchandising rights for kids’ consumer products in all markets except China, which Meisheng will oversee through the Company’s existing distribution joint venture. The non-controlling interest’s share of the loss from the joint venture for year ended December 31, 2017 was nil. As of April 27, 2017, Hong Kong Meisheng Cultural Company Limited beneficially owns more than 10% of the Company’s outstanding common stock.
57
In March 2017, the Company entered into an agreement to issue 3,660,891 shares of its common stock at an aggregate price of $19.3 million to a Hong Kong affiliate of its China joint venture partner. After their shareholder and China regulatory approval, the transaction closed on April 27, 2017. Upon the closing, the Company added a representative of Meisheng as a non-employee director and issued 13,319 shares of restricted stock at a value of $0.1 million, which vest in January 2018.
A director of the Company is a portfolio manager at Oasis Management. In August 2017, the Company agreed with Oasis Management and Oasis Investments II Master Fund Ltd., the holder of approximately $21.5 million face amount of its 4.25% convertible senior notes due in 2018, to exchange and extend the maturity date of these notes to November 1, 2020. The transaction closed on November 7, 2017 (see Note 12).
Note 11—Credit Facility
In March 2014, the Company and its domestic subsidiaries entered into a secured credit facility with General Electric Capital Corporation (“GECC”). The loan agreement, as amended and subsequently assigned to Wells Fargo Bank, N.A. pursuant to its acquisition of GECC, provides for a $75.0 million revolving credit facility subject to availability based on prescribed advance rates on certain accounts receivable and inventory (the “WF Loan Agreement”). The amounts outstanding under the credit facility are payable in full upon maturity of the facility on March 27, 2019, and the credit facility is secured by a security interest in favor of the lender covering a substantial amount of the assets of the Company. As of December 31, 2016, the amount of outstanding borrowings was $10.0 million and outstanding stand-by letters of credit totaled $28.2 million; the total excess borrowing capacity was $12.1 million. As of December 31, 2017, the amount of outstanding borrowings was $5.0 million and outstanding stand-by letters of credit totaled $20.0 million; the total excess borrowing capacity was $14.1 million.
The Company’s ability to borrow under the WF Loan Agreement is also subject to its ongoing compliance with certain financial covenants, including the maintenance by the Company of a fixed charge coverage ratio of at least 1.25:1.0 based on the trailing four fiscal quarters in the event minimum excess availability under the facility is not achieved. As of December 31, 2016 and 2017, the Company was in compliance with the financial covenants under the WF Loan Agreement.
The Company may borrow funds at LIBOR or at a base rate, plus applicable margins of 225 basis point spread over LIBOR and 125 basis point spread on base rate loans. In addition to standard fees, the facility has an unused credit line fee, which ranges from 25 to 50 basis points. As of December 31, 2016 and 2017, the weighted average interest rate on the credit facility was approximately 2.45% and 3.79%, respectively.
The WF Loan Agreement also contains customary events of default, including a cross default provision and a change of control provision. In the event of a default, all of the obligations of the Company and its subsidiaries under the WF Loan Agreement may be declared immediately due and payable. For certain events of default relating to insolvency and receivership, all outstanding obligations become due and payable.
58
Note 12—Convertible Senior Notes
Convertible senior notes consist of the following (in thousands):
|
|
|
December 31, 2016
|
|
December 31, 2017
|
||||||||||||||||||||
|
|
|
Principal/
|
|
Debt
|
|
|
Principal/
|
|
Debt
|
|
||||||||||||||
|
Fair Value
|
Issuance
|
Net
|
Fair Value
|
Issuance
|
Net
|
|||||||||||||||||||
|
|
|
Amount
|
|
Costs
|
|
Amount
|
|
Amount
|
|
Costs
|
|
Amount
|
||||||||||||
|
3.25% convertible senior notes (due 2020) *
|
|
$
|
―
|
|
$
|
―
|
|
$
|
―
|
|
$
|
22,469
|
|
$
|
―
|
|
$
|
22,469
|
||||||
|
4.25% convertible senior notes (due 2018)
|
|
93,865
|
|
1,098
|
|
92,767
|
|
21,178
|
|
103
|
|
21,075
|
||||||||||||
|
4.875% convertible senior notes (due 2020)
|
|
|
113,000
|
|
|
2,760
|
|
|
110,240
|
|
|
113,000
|
|
|
1,972
|
|
|
111,028
|
||||||
|
Total convertible senior notes, net of debt issuance costs
|
|
$
|
206,865
|
|
$
|
3,858
|
|
$
|
203,007
|
|
$
|
156,647
|
|
$
|
2,075
|
|
$
|
154,572
|
||||||
* The amount presented for the 3.25% 2020 convertible senior notes within the table represents the fair value as of December 31, 2017. The principal amount of these notes is $21.5 million.
In July 2013, the Company sold an aggregate of $100.0 million principal amount of 4.25% Convertible Senior Notes due 2018 (the “2018 Notes”). The 2018 Notes are senior unsecured obligations of the Company paying interest semi-annually in arrears on August 1 and February 1 of each year at a rate of 4.25% per annum and will mature on August 1, 2018. The initial and still current conversion rate for the 2018 Notes is 114.3674 shares of the Company’s common stock per $1,000 principal amount of notes, equivalent to an initial conversion price of approximately $8.74 per share of common stock, subject to adjustment in certain events. Upon conversion, the 2018 Notes will be settled in shares of the Company’s common stock. Holders of the 2018 Notes may require that the Company repurchase for cash all or some of their notes upon the occurrence of a fundamental change (as defined in the 2018 Notes). In 2016, the Company repurchased and retired an aggregate of approximately $6.1 million principal amount of the 2018 Notes. In addition, approximately $0.1 million of the unamortized debt issuance costs were written off and a nominal gain was recognized in conjunction with the retirement of the 2018 Notes. During the first quarter of 2017, the Company exchanged and retired $39.1 million principal amount of the 2018 Notes at par for $24.1 million in cash and approximately 2.9 million shares of its common stock. During the second quarter of 2017, the Company exchanged and retired $12.0 million principal amount of the 2018 Notes at par for $11.6 million in cash and 112,400 shares of its common stock, and approximately $0.1 million of the unamortized debt issuance costs were written off and a $0.1 million gain was recognized in conjunction with the exchange and retirement of the 2018 Notes.
In August 2017, the Company agreed with Oasis Management and Oasis Investments II Master Fund Ltd., the holder of approximately $21.5 million face amount of its 4.25% Convertible Senior Notes due in 2018, to extend the maturity date of these notes to November 1, 2020. In addition, the interest rate was reduced to 3.25% per annum and the conversion rate was increased to 328.0302 shares of the Company’s common stock per $1,000 principal amount of notes, among other things. After execution of a definitive agreement for the modification and final approval by the other members of the Company’s Board of Directors and Oasis’ Investment Committee the transaction closed on November 7, 2017. In connection with this transaction, the Company recognized a loss on extinguishment of the debt of approximately $0.6 million. Further, the Company elected to measure and present the new debt held by Oasis at fair value using Level 3 inputs (see Note 2) and as a result, recognized a loss of $0.3 million related to changes in the fair value of the 3.25% 2020 Notes. At December 31, 2017, the 3.25% 2020 Notes had a fair value of $22.5 million.
In June 2014, the Company sold an aggregate of $115.0 million principal amount of 4.875% Convertible Senior Notes due 2020 (the “2020 Notes”). The 2020 Notes are senior unsecured obligations of the Company paying interest semi-annually in arrears on June 1 and December 1 of each year at a rate of 4.875% per annum and will mature on June 1, 2020. The initial and still current conversion rate for the 2020 Notes is 103.7613 shares of the Company’s common stock per $1,000 principal amount of notes, equivalent to an initial conversion price of approximately $9.64 per share of common stock, subject to adjustment in certain events. Upon conversion, the 2020 Notes will be settled in shares of the Company’s common stock. Holders of the 2020 Notes may require that the Company repurchase for cash all or some of their notes upon the occurrence of a fundamental change (as defined in the 2020 Notes). In January 2016, the Company repurchased and retired an aggregate of $2.0 million principal amount of the 2020 Notes. In addition, approximately $0.1 million of the unamortized debt issuance costs were written off and a $0.1 million gain was recognized in conjunction with the retirement of the 2020 Notes.
Key components of the 4.25% convertible senior notes due 2018 consist of the following (in thousands):
|
|
|
Years Ended December 31,
|
||||||||||
|
|
|
2015
|
|
2016
|
|
2017
|
||||||
|
Contractual interest expense on the coupon
|
|
$
|
4,250
|
|
|
$
|
4,191
|
|
|
$
|
2,184
|
|
|
Amortization of debt discount and debt issuance costs recognized as interest expense
|
|
|
836
|
|
|
|
1,172
|
|
|
|
844
|
|
|
|
|
$
|
5,086
|
|
|
$
|
5,363
|
|
|
$
|
3,028
|
|
59
Key components of the 3.25% convertible senior notes due 2020 consist of the following (in thousands):
|
|
|
Years Ended December 31,
|
||||||||||
|
|
|
2015
|
|
2016
|
|
2017
|
||||||
|
Contractual interest expense
|
|
$
|
―
|
|
|
$
|
―
|
|
|
$
|
103
|
|
|
Amortization of debt issuance costs recognized as interest expense
|
|
|
―
|
|
|
|
―
|
|
|
|
―
|
|
|
|
|
$
|
―
|
|
|
$
|
―
|
|
|
$
|
103
|
|
Key components of the 4.875% convertible senior notes due 2020 consist of the following (in thousands):
|
|
|
Years Ended December 31,
|
||||||||||
|
|
|
2015
|
|
2016
|
|
2017
|
||||||
|
Contractual interest expense
|
|
$
|
5,606
|
|
$
|
5,508
|
|
|
$
|
5,509
|
|
|
|
Amortization of debt issuance costs recognized as interest expense
|
|
|
811
|
|
|
804
|
|
|
|
789
|
|
|
|
|
|
$
|
6,417
|
|
$
|
6,312
|
|
|
$
|
6,298
|
|
|
60
Note 13—Income Taxes
The Company does not file a consolidated return with its foreign subsidiaries. The Company files federal and state returns and its foreign subsidiaries file returns in their respective jurisdiction.
For the years ended 2015, 2016 and 2017, the provision for income taxes, which included federal, state and foreign income taxes, was an expense of $3.4 million, $4.1 million, and $1.6 million reflecting effective tax provision rates of 12.9%, 76.8%, and (2.0%) respectively.
For the years ended 2015 and 2016, provision for income taxes includes federal, state and foreign income taxes at effective tax rates of 12.9% and 76.8%. Exclusive of discrete items, the effective tax provision rate would be 9.5% in 2015 and 79.2% in 2016. The increase in the effective rate absent discrete items was primarily due to the foreign deemed dividend. The rate exclusive of discrete items can be materially impacted by the proportion of Hong Kong earnings to consolidated earnings.
The 2017 tax expense of $1.6 million included a discrete tax benefit of $0.1 million primarily comprised of the US federal transition tax, return to provision and uncertain tax position adjustments. Absent these discrete tax expenses, the Company’s effective tax rate for 2017 was (2.8%), primarily due to various state taxes and taxes on foreign income.
For years ended 2016 and 2017, the Company had net deferred tax liabilities of approximately $2.0 million and $0.8 million, respectively, primarily related to foreign jurisdictions.
Provision for income taxes reflected in the accompanying consolidated statements of operations are comprised of the following (in thousands):
|
|
2015
|
2016
|
2017
|
|||||||||
|
Federal
|
$
|
—
|
$
|
1,549
|
$
|
550
|
||||||
|
State and local
|
708
|
652
|
51
|
|||||||||
|
Foreign
|
3,044
|
1,637
|
2,256
|
|||||||||
|
Total Current
|
3,752
|
3,838
|
2,857
|
|||||||||
|
APIC
|
—
|
548
|
—
|
|||||||||
|
Deferred
|
(329
|
)
|
(259
|
)
|
(1,251
|
)
|
||||||
|
Total
|
$
|
3,423
|
$
|
4,127
|
$
|
1,606
|
||||||
The components of deferred tax assets/(liabilities) are as follows (in thousands):
|
|
2016
|
2017
|
||||||
|
Net deferred tax assets/(liabilities):
|
||||||||
|
Reserve for sales allowances and possible losses
|
$
|
801
|
$
|
611
|
||||
|
Accrued expenses
|
1,739
|
1,375
|
||||||
|
Prepaid royalties
|
16,806
|
13,631
|
||||||
|
Accrued royalties
|
2,638
|
1,864
|
||||||
|
Inventory
|
3,506
|
6,146
|
||||||
|
State income taxes
|
98
|
26
|
||||||
|
Property and equipment
|
4,997
|
4,257
|
||||||
|
Original issue discount interest
|
(6,945
|
)
|
(2,131
|
)
|
||||
|
Goodwill and intangibles
|
29,378
|
15,782
|
||||||
|
Share based compensation
|
1,607
|
578
|
||||||
|
Undistributed foreign earnings
|
(48,731
|
)
|
(2,524
|
)
|
||||
|
Federal and state net operating loss carryforwards
|
22,755
|
14,091
|
||||||
|
Credit carryforwards
|
21,097
|
35,195
|
||||||
|
Other
|
(2,495
|
)
|
22
|
|||||
|
Gross
|
47,251
|
88,923
|
||||||
|
Valuation allowance
|
(49,285
|
)
|
(89,706
|
)
|
||||
|
Total net deferred tax liabilities
|
$
|
(2,034
|
)
|
$
|
(783
|
)
|
||
61
The U.S. Tax Cuts and Jobs Act (the Act) was signed into law on December 22, 2017 and introduces significant changes to the Internal Revenue Code. Effective for tax years beginning after December 31, 2017, the Act reduces the U.S. statutory tax rate from 35% to 21% and creates new taxes on certain foreign-sourced earnings and related-party payments, which are referred to as the global intangible low-taxed income and the base erosion and anti-abuse tax, respectively. In addition, the Act includes a one-time transition tax as of December 31, 2017 on accumulated foreign subsidiary earnings that were previously tax deferred.
Due to the timing of the enactment and the complexity involved in applying the provisions of the Act, the SEC issued guidance on December 22, 2017 to address the application of US GAAP in situations when a registrant does not have the necessary information available, prepared, or analyzed in reasonable detail to complete the accounting for certain income tax effects of the Act. In accordance with this guidance, we have made reasonable estimates below of the effects of the Act and recorded provisional amounts in our financial statements as of December 31, 2017. For the items for which we determined a reasonable estimate, we recognized a provisional amount of $34.3 million, which is included as a component of income tax expense from continuing operations and partially reduced by fully-valued tax attribute carryforwards. As we collect and prepare necessary data, and interpret the Act and any additional guidance issued by the U.S. Treasury Department, the IRS, and other standard-setting bodies, we may make adjustments to the provisional amounts. Those adjustments may materially impact our provision for income taxes and effective tax rate in the period in which the adjustments are made. The accounting for the tax effects of the Act will be completed in 2018.
Provisional amounts for the following income tax effects of the Tax Act have been recorded as of December 31, 2017 and are subject to change during 2018.
The Act requires the Company to pay U.S. income taxes on accumulated foreign subsidiary earnings not previously subject to U.S. income tax at a rate of 15.5% to the extent of foreign cash and certain other net current assets and 8% on the remaining earnings. Given that the transition tax analysis requires significant data from our foreign subsidiaries that is not regularly collected or analyzed, we recorded a provisional amount for the one-time transitional tax liability for our foreign subsidiaries of approximately $35.1 million, which does not entirely impact income tax expense for 2017 since the Company has reflected the transition tax liability as a partial reduction to existing fully-valued tax attribute carryforwards. Additional work is necessary for a more detailed analysis of the Company’s deferred tax assets and liabilities and its historical foreign earnings as well as potential correlative adjustments. Any subsequent adjustment to the amount will be recorded in the quarter of 2018 when the analysis is complete, but is not anticipated to significantly impact tax expense due to the existence of the aforementioned fully-valued tax attribute carryforwards.
The Act reduces the U.S. statutory tax rate from 35% to 21% for tax years after December 31, 2017. Accordingly, we have re-measured our deferred taxes as of December 31, 2017 to reflect the reduced rate that will apply in future periods when these deferred taxes are settled or realized. The provisional amount related to the re-measurement was which was fully offset by a concurrent change in the valuation allowance, resulting in no tax expense impact. Although the tax rate reduction is known, we have not collected the necessary data to complete our analysis of the effect of the Act on the underlying deferred taxes and as such, the amounts recorded as of December 31, 2017 are provisional. The Act repeals the Alternative Minimum Tax (AMT) for tax years beginning after 2017. However, AMT credits are fully refundable by tax years beginning after 2021. We have $0.8 million of deferred tax assets related to the AMT credit carryforwards. Given that these credits are now fully realizable, we have released the corresponding valuation allowance against these deferred tax assets and recognized the income tax benefit. We will continue to classify AMT credits along with our other deferred tax assets.
The Act includes new anti-deferral, anti-base erosion, and base broadening provisions. Given the complexity of these provisions, we are still evaluating the effects and impact of these provisions.
Provision for income taxes varies from the U.S. federal statutory rate. The following reconciliation shows the significant differences in the tax at statutory and effective rates:
|
|
|
2015
|
|
2016
|
|
2017
|
||||||
|
Federal income tax expense
|
|
|
35.0
|
%
|
|
|
35.0
|
%
|
|
|
35.0
|
%
|
|
State income tax expense, net of federal tax effect
|
|
|
1.0
|
|
|
|
(3.6
|
)
|
|
|
5.0
|
|
|
Effect of differences in U.S. and foreign statutory rates
|
|
|
(9.4
|
)
|
|
|
(53.7
|
)
|
|
|
1.9
|
|
|
Uncertain tax positions
|
|
|
0.3
|
|
|
|
3.4
|
|
|
|
―
|
|
|
Earn-out adjustments
|
(7.4
|
)
|
―
|
―
|
||||||||
|
Provision to return
|
12.2
|
4.5
|
(0.7)
|
|||||||||
|
Non-deductible expenses
|
1.1
|
8.9
|
(48.0)
|
|||||||||
|
Other
|
|
|
0.5
|
|
|
|
0.6
|
|
|
|
(0.2)
|
|
|
Foreign deemed dividend
|
|
|
1.7
|
|
|
|
262.2
|
|
|
|
―
|
|
|
Foreign tax credit
|
|
|
(0.5
|
)
|
|
|
(126.1
|
)
|
|
|
20.3
|
|
|
Undistributed foreign earnings
|
―
|
906.5
|
57.3
|
|||||||||
|
Effect of change in federal statutory rate
|
―
|
―
|
(23.0)
|
|||||||||
|
Valuation allowance
|
|
|
(21.6
|
)
|
|
|
(960.9
|
)
|
|
|
(49.6
|
)
|
|
|
|
|
12.9
|
%
|
|
|
76.8
|
%
|
|
|
(2.0)
|
%
|
62
Deferred taxes result from temporary differences between tax bases of assets and liabilities and their reported amounts in the consolidated financial statements. The temporary differences result from costs required to be capitalized for tax purposes by the U.S. Internal Revenue Code (“IRC”), and certain items accrued for financial reporting purposes in the year incurred but not deductible for tax purposes until paid. The Company has established a valuation allowance on net deferred tax assets in the United States since, in the opinion of management, it is not more likely than not that the U.S. net deferred tax assets will be realized.
The components of income (loss) before provision for income taxes are as follows (in thousands):
|
|
2015
|
2016
|
2017
|
|||||||||
|
Domestic
|
$
|
11,692
|
$
|
(7,760
|
)
|
$
|
(85,288
|
)
|
||||
|
Foreign
|
14,901
|
13,136
|
3,866
|
|||||||||
|
|
$
|
26,593
|
$
|
5,376
|
$
|
(81,422
|
)
|
|||||
The Company uses a recognition threshold and measurement process for recording in the consolidated financial statements uncertain tax positions (“UTP”) taken or expected to be taken in a tax return.
$1.1 million of the liability for UTP related to state taxes and audit examination in Hong Kong was de-recognized in 2017. Additionally, approximately $66,300 of UTP related to state taxes was recognized in 2017. During 2016, approximately $49,700 of additional UTP was recognized.
Current interest on uncertain income tax liabilities is recognized as interest expense and penalties are recognized in selling, general and administrative expenses in the consolidated statement of operations. During 2015, the Company did not recognize any current year interest expense relating to UTPs. During 2016, the Company recognized $67,900 of current interest expense relating to UTPs. During 2017, the Company did not recognize any current year interest expense relating to UTPs.
The following table provides further information of UTPs that would affect the effective tax rate, if recognized, as of December 31, 2017 (in millions):
|
Balance, January 1, 2015
|
$
|
2.5
|
||
|
Current year additions
|
1.8
|
|||
|
Current year reduction due to lapse of applicable statute of limitations
|
(2.1
|
)
|
||
|
Balance, December 31, 2015
|
2.2
|
|||
|
Current year additions
|
0.1
|
|||
|
Current year reduction due to lapse of applicable statute of limitations
|
—
|
|||
|
Balance, December 31, 2016
|
2.3
|
|||
|
Current year additions
|
0.1
|
|||
|
Current year reduction due to audit settlement
|
(1.1
|
)
|
||
|
Balance, December 31, 2017
|
$
|
1.3
|
We do not expect our gross unrecognized tax benefits to significantly change within the next 12 months.
Tax years 2014 through 2016 remain subject to examination in the United States. The tax years 2013 through 2016 are generally still subject to examination in the various states. The tax years 2011 through 2016 are still subject to examination in Hong Kong. In the normal course of business, the Company is audited by federal, state and foreign tax authorities. The U.S. Internal Revenue Service is currently examining the 2015 tax year.
Management assesses the available positive and negative evidence to estimate if sufficient future taxable income will be generated to use the existing deferred tax assets by jurisdiction. The Company is required to establish a valuation allowance for the U.S. deferred tax assets and record a charge to income if Management determines, based upon available evidence at the time the determination is made, that it is more likely than not that some portion or all of the deferred tax assets may not be realized.
Based on our evaluation of all positive and negative evidence, as of December 31, 2017, a valuation allowance of $89.7 million has been recorded against the deferred tax assets that more likely than not will not be realized. For the year ended December 31, 2017, the valuation allowance increased by $40.4 million from $49.3 million at December 31, 2016 to $89.7 million at December 31, 2017. The net deferred tax liabilities of $2.0 million in 2016 represent the net deferred tax liabilities in the foreign jurisdiction, where the Company is in a cumulative income position. The net deferred tax liabilities of $0.8 million in 2017 represent the net deferred tax liabilities in the foreign jurisdiction, where the Company is in a cumulative income position, partially offset by the U.S. deferred tax assets related to the AMT credit carryforwards.
63
At December 31, 2017, the Company had no remaining U.S. federal net operating loss carryforwards, or "NOLs", as they were fully utilized in 2017. At December 31, 2017, the Company's state NOLs were mainly from California. The majority of the approximately $164.4 million of California NOLs will begin to expire in 2031. At December 31, 2017, the Company had foreign tax credit carryforwards of approximately $34.1 million, which will begin to expire in 2022. At December 31, 2017, the Company had federal research and development tax credit carryforwards ("credit carryforwards") of approximately $0.2 million, which will begin to expire in 2029. At December 31, 2017, the Company had state research and development tax credits of approximately $0.1 million, which carry forward indefinitely. At December 31, 2017, the Company had AMT credit carryforwards of approximately $0.8 million, which carry forward indefinitely. Utilization of certain NOLs and research credit carryforwards may be subject to an annual limitation due to ownership change limitations set forth in Sections 382 and 383 of the Internal Revenue Code of 1986, as amended, and comparable state income tax laws. Any future annual limitation may result in the expiration of NOLs and credit carryforwards before utilization.
During the first quarter of 2017, the Company adopted ASU 2016-09, “Improvement to Employee Share-Based Payment Accounting,” which simplifies several aspects of the accounting for share-based payments, including treatment of excess tax benefits and forfeitures, as well as consideration of minimum statutory tax withholding requirements. This accounting standard did not have a material effect on the Company’s income tax provision in 2017.
64
Note 14—Leases
The Company leases office, warehouse and showroom facilities and certain equipment under operating leases. Rent expense for the years ended December 31, 2015, 2016 and 2017 totaled $11.5 million, $12.3 million and $12.2 million, respectively. Following is a schedule of minimum annual lease payments (in thousands).
|
2018
|
$
|
13,403
|
||
|
2019
|
11,782
|
|||
|
2020
|
9,614
|
|||
|
2021
|
9,405
|
|||
|
2022
|
9,479
|
|||
|
Thereafter
|
7,121
|
|||
|
|
$
|
60,804
|
Note 15—Common Stock, Preferred Stock and Warrants
The Company has 105,000,000 authorized shares of stock consisting of 100,000,000 shares of $.001 par value common stock and 5,000,000 shares of $.001 par value preferred stock. On December 31, 2016 shares issued and outstanding were 19,376,773, and on December 31, 2017, shares issued and outstanding were 26,957,354.
All issuances of common stock, including those issued pursuant to stock option and warrant exercises, restricted stock grants and acquisitions, are issued from the Company’s authorized but not issued and outstanding shares.
In June 2014, the Company effectively repurchased 3,112,840 shares of its common stock at an average cost of $7.71 per share for an aggregate amount of $24.0 million pursuant to a prepaid forward share repurchase agreement entered into with Merrill Lynch International (“ML”). These repurchased shares are treated as retired for basic and diluted EPS purposes although they remain legally outstanding. The Company reflects the aggregate purchase price as a reduction to stockholders’ equity classified as Treasury Stock. No shares have been delivered to the Company by ML as of December 31, 2017.
In June 2015, and as subsequently increased, the Board of Directors authorized the repurchase of up to an aggregate of $35.0 million of the Company’s outstanding common stock and/or convertible senior notes (collectively, “securities”). During 2015, the Company repurchased 1,547,361 shares of its common stock at an aggregate value of $13.2 million. During 2016, the Company repurchased 1,766,284 shares of its common stock at an aggregate value of $13.5 million and also repurchased $2.0 million principal amount of its 2020 Notes at a cost of $1.9 million and $6.1 million principal amount of its 2018 Notes at a cost of $6.1 million. As of December 31, 2016, the Company completed the authorized repurchases of securities and retired all of the repurchased securities.
In January 2016, the Company issued an aggregate of 449,120 shares of restricted stock at a value of approximately $3.6 million to two executive officers, which vest, subject to certain company financial performance criteria and market conditions, over a three year period. In addition, an aggregate of 62,710 shares of restricted stock at an aggregate value of approximately $0.5 million were issued to its five non-employee directors, which vested in January 2017.
In March 2016, the Company issued an aggregate of 134,058 shares of restricted stock at a value of approximately $0.9 million to an executive officer, which vest, subject to certain company financial performance criteria and market conditions, over a three year period.
In October 2016, the Company issued an aggregate of 2,463 shares of restricted stock at a nominal value to a non-employee director, which vested in January 2017.
In January and February 2017, the Company issued an aggregate of 873,787 shares of restricted stock at a value of approximately $4.5 million to two executive officers, which vest, subject to certain company financial performance criteria and market conditions, over a three year period. In addition, an aggregate of 94,102 shares of restricted stock at an aggregate value of approximately $0.5 million were issued to its five non-employee directors, which vest in January 2018.
In January and February 2017, the Company issued an aggregate of 2,865,000 shares of its common stock at a value of $15.1 million to holders of its 2018 convertible senior notes as partial consideration for the exchange at par of $39.1 million principal amount of such notes.
In March 2017, the Company entered into an agreement to issue 3,660,891 shares of its common stock at an aggregate price of $19.3 million to a Hong Kong affiliate of its China joint venture partner. After their shareholder and China regulatory approval, the transaction closed on April 27, 2017. Upon the closing, the Company added a representative of Meisheng as a non-employee director and issued 13,319 shares of restricted stock at a value of $0.1 million, which vest in January 2018.
In June 2017, the Company issued an aggregate of 112,400 shares of its common stock at a value of approximately $0.4 million to holders of its 2018 convertible senior notes as partial consideration for the exchange at par of $11.6 million principal amount of such notes.
All issuances of common stock, including those issued pursuant to stock option and warrant exercises, restricted stock grants and acquisitions, are issued from the Company’s authorized but not issued and outstanding shares.
No dividend was declared or paid in 2016 and 2017.
65
Note 16—Commitments
The Company has entered into various license agreements whereby the Company may use certain characters and intellectual properties in conjunction with its products. Generally, such license agreements provide for royalties to be paid at 1% to 20% of net sales with minimum guarantees and advance payments.
In the event the Company determines that a shortfall in achieving the minimum guarantee is likely, a liability is recorded for the estimated short fall and charged to royalty expense.
Future annual minimum royalty guarantees as of December 31, 2017 are as follows (in thousands):
|
2018
|
$
|
40,725
|
||
|
2019
|
14,494
|
|||
|
2020
|
1,914
|
|||
|
|
$
|
57,133
|
The Company has entered into employment and consulting agreements with certain executives expiring through December 31, 2020. The aggregate future annual minimum guaranteed amounts due under those agreements as of December 31, 2017 are as follows (in thousands):
|
2018
|
$
|
8,936
|
||
|
2019
|
8,027
|
|||
|
2020
|
2,285
|
|||
|
|
$
|
19,248
|
Note 17—Share-Based Payments
Under its 2002 Stock Award and Incentive Plan (“the Plan”), which incorporated its Third Amended and Restated 1995 Stock Option Plan, the Company has reserved shares of its common stock for issuance upon the exercise of options granted under the Plan, as well as for the awarding of other securities. Under the Plan, employees (including officers), non-employee directors and independent consultants may be granted options to purchase shares of common stock and other securities (Note 15). The vesting of these options and other securities may vary, but typically vest on a step-up basis over a maximum period of 4 years. Restricted shares typically vest in the same manner, with the exception of certain awards vesting over one to two years. Share-based compensation expense is recognized on a straight-line basis over the requisite service period. As of December 31, 2017, 3,539,848 shares were available for future grant. Additional shares may become available to the extent that options or shares of restricted stock presently outstanding under the Plan terminate or expire.
Restricted Stock
Under the Plan, share-based compensation payments may include the issuance of shares of restricted stock. Restricted stock award grants are based upon employment contracts, which vary by individual and year, and are subject to vesting conditions. Non-employee directors each receive grants of restricted stock at a value of $100,000 annually which vest after one year – this amount is prorated if a director is appointed within the year. In addition, at the discretion of Management and approval of the Board, non-executive employees also may receive restricted stock awards, which occurs approximately once per year.
During 2015, the Company issued a total of 734,823 shares of restricted stock; of which 660,968 shares of restricted stock (with performance based vesting measures) were issued to two executive officers. Of the 660,968 shares, a total of 612,221 were subsequently forfeited based upon the Company not meeting certain financial targets for the year. A total of 73,855 shares were granted to its non-employee directors. The Company cancelled 51,633 shares of restricted stock due to various non-executive employees departing from the Company prior to shares vesting completely. Also during 2015, certain employees, including an executive officer, surrendered an aggregate of 52,024 shares of restricted stock for $0.4 million to cover income taxes due on the vesting of restricted shares. As of December 31, 2015, 411,409 shares of the restricted stock remained unvested, representing a weighted average grant date fair value of $2.7 million.
During 2016, the Company issued a total of 648,351 shares of restricted stock; of which 583,178 shares of restricted stock (with performance based vesting measures) were issued to two executive officers. Of the 583,178 shares, all were subsequently forfeited based upon the Company not meeting certain financial targets for the year. A total of 65,173 shares were granted to its non-employee directors. The Company cancelled 24,822 shares of restricted stock due to various non-executive employees departing from the Company prior to shares vesting completely. Also during 2016, certain employees, including an executive officer, surrendered an aggregate of 50,719 shares of restricted stock for $1.5 million to cover income taxes due on the vesting of restricted shares. As of December 31, 2016, 196,453 shares of the restricted stock remained unvested, representing a weighted average grant date fair value of $1.4 million.
66
During 2017, the Company issued a total of 981,208 shares of restricted stock. A total of 107,421 shares were granted to its non-employee directors. The Company cancelled 9,229 shares of restricted stock due to various non-executive employees departing from the Company prior to shares vesting completely. Also during 2017, certain employees, including an executive officer, surrendered an aggregate of 29,689 shares of restricted stock for $79,000 to cover income taxes due on the vesting of restricted shares. As of December 31, 2017, 981,208 shares of the restricted stock remained unvested, representing a weighted average grant date fair value of $5.1 million.
The following table summarizes the restricted stock award activity, annually, for the years ended December 31, 2015, 2016 and 2017:
|
|
Restricted and Performance Based
Stock Awards (RSA)
|
|||||||
|
|
Number of
Shares
|
Weighted
Average
Fair
Value
|
||||||
|
|
||||||||
|
Outstanding, January 1, 2015
|
568,057
|
$ |
6.54
|
|||||
|
Awarded
|
734,823
|
6.81
|
||||||
|
Released
|
(227,616
|
)
|
6.60
|
|||||
|
Forfeited
|
(663,855
|
)
|
6.77
|
|||||
|
Outstanding, December 31, 2015
|
411,409
|
6.61
|
||||||
|
Awarded
|
648,351
|
7.00
|
||||||
|
Released
|
(255,307
|
)
|
6.68
|
|||||
|
Forfeited
|
(608,000
|
)
|
6.88
|
|||||
|
Outstanding, December 31, 2016
|
196,453
|
7.01
|
||||||
|
Awarded
|
981,208
|
5.15
|
||||||
|
Released
|
(187,224
|
)
|
7.05
|
|||||
|
Forfeited
|
(9,229
|
)
|
6.32
|
|||||
|
Outstanding, December 31, 2017
|
981,208
|
5.15
|
||||||
Restricted Stock Units
Under the Plan, share-based compensation payments may include the issuance of Restricted Stock Units (RSUs) to non-executive employees, which occurs approximately once per year and are subject to vesting conditions. RSUs are valued at the market price of the shares underlying the award on the date of grant. The compensation expense for RSUs is recognized ratably over the service period of the award, which is generally 4 years from the date of grant.
During 2017, the Company issued a total of 1,001,206 RSUs; of which 458,637 RSUs had performance based vesting measures. The Company cancelled 42,014 RSUs due to various non-executive employees departing from the Company prior to shares vesting completely. As of December 31, 2017, 959,192 RSUs remained unvested, representing a weighted average grant date fair value of $4.9 million.
The following table summarizes the RSU award activity, annually for the year ended December 31, 2017:
|
|
|
Restricted and Performance Based
Stock Units (RSUs)
|
||||||
|
|
|
Number of
Shares
|
|
Weighted
Average
Fair
Value
|
||||
|
|
|
|
|
|
|
|
||
|
Outstanding, December 31, 2016
|
|
|
-
|
|
$ |
-
|
|
|
|
Awarded
|
|
|
1,001,206
|
5.15
|
||||
|
Released
|
|
|
-
|
-
|
||||
|
Forfeited
|
|
|
(42,014
|
)
|
5.15
|
|||
|
Outstanding, December 31, 2017
|
|
|
959,192
|
5.15
|
||||
As of December 31, 2017, there was $4.3 million of total unrecognized compensation cost related to non-vested restricted stock, which is expected to be recognized over a weighted-average period of 2.55 years.
Compensation expense for performance-awards is measured based on the amount of shares ultimately expected to vest, estimated at each reporting date based on management expectations regarding the releavant performance crieria.
67
The following table summarizes the total share-based compensation expense and related tax benefits recognized (in thousands):
|
|
|
Year Ended December 31,
|
||||||||||
|
|
|
2015
|
|
2016
|
|
2017
|
||||||
|
|
|
|
|
|
|
|
|
|
|
|||
|
Restricted stock compensation expense
|
|
$
|
1,562
|
|
|
$
|
1,621
|
|
$
|
3,112
|
||
Stock Options
There has been no stock option activity since December 31, 2015.
68
Non-Employee Stock Warrants
In 2012, the Company granted 1,500,000 stock warrants with an exercise price of $16.28 per share and a five year term to a third party as partial consideration for the exclusive right to use certain recognition technology in connection with the Company’s toy products. All warrants vested upon grant and expired unexercised on September 12, 2017.
The Company measured the fair value of the warrants granted on the measurement date. The fair value of the 2012 stock warrant was capitalized as an intangible asset and had been amortized to expense in the consolidated statements of operations as the related product net sales were recognized.
Note 18—Employee Benefits Plan
The Company sponsors for its U.S. employees, a defined contribution plan under Section 401(k) of the Internal Revenue Code. The Plan provides that employees may defer up to 50% of their annual compensation subject to annual dollar limitations, and that the Company will make a matching contribution equal to 100% of each employee’s deferral, up to 5% of the employee’s annual compensation. Company matching contributions, which vest immediately, totaled $2.2 million, $2.5 million and $2.3 million for the years ended December 31, 2015, 2016 and 2017, respectively.
Note 19—Supplemental Information to Consolidated Statements of Cash Flows
In 2015, certain employees – including an executive officer, surrendered an aggregate of 52,024 shares of restricted stock at a value of $0.4 million to cover their income taxes due on the 2015 vesting of the restricted shares granted them in 2014 and prior. Additionally, the Company recognized a nominal excess tax benefit from the vesting of restricted stock.
In 2016, certain employees – including an executive officer, surrendered an aggregate of 50,719 shares of restricted stock at a value of $1.5 million to cover their income taxes due on the 2016 vesting of the restricted shares granted them in 2015 and prior. Additionally, the Company recognized a $0.5 million excess tax benefit from the vesting of restricted stock.
In 2017, certain employees – including an executive officer, surrendered an aggregate of 29,689 shares of restricted stock at a value of less than $0.1 million to cover their income taxes due on the 2017 vesting of the restricted shares granted to them in 2011 and 2013. Additionally, the Company recognized nil excess tax deficiency from the vesting of restricted stock.
In 2017, the Company issued approximately 3.0 million shares of its common stock with a value of $15.5 million to extinguish a portion of the 2018 convertible senior notes (see Note 12).
69
Note 20—Selected Quarterly Financial Data (Unaudited)
Selected unaudited quarterly financial data for the years 2016 and 2017 are summarized below. The Company has derived this data from the unaudited consolidated interim financial statements that, in the Company's opinion, have been prepared on substantially the same basis as the audited financial statements contained elsewhere in this report and include all normal recurring adjustments necessary for a fair presentation of the financial information for the periods presented. These unaudited quarterly results should be read in conjunction with the financial statements and notes thereto included elsewhere in this report. The operating results in any quarter are not necessarily indicative of the results that may be expected for any future period.
|
|
2016
|
2017
|
||||||||||||||||||||||||||||||
|
|
First
|
Second
|
Third
|
Fourth
|
First
|
Second
|
Third
|
Fourth
|
||||||||||||||||||||||||
|
|
Quarter
|
Quarter
|
Quarter
|
Quarter
|
Quarter
|
Quarter
|
Quarter
|
Quarter
|
||||||||||||||||||||||||
|
|
(in thousands, except per share data)
|
|||||||||||||||||||||||||||||||
|
Net sales
|
$
|
95,809
|
$
|
140,977
|
$
|
302,791
|
$
|
167,026
|
$
|
94,505
|
$
|
119,565
|
$
|
262,413
|
$
|
136,628
|
||||||||||||||||
|
Gross profit
|
$
|
31,183
|
$
|
44,800
|
$
|
94,933
|
$
|
52,105
|
$
|
30,021
|
$
|
33,719
|
$
|
61,781
|
$
|
30,160
|
||||||||||||||||
|
Income (loss) from operations
|
$
|
(13,816
|
)
|
$
|
(1,100
|
)
|
$
|
34,413
|
$
|
(2,391
|
)
|
$
|
(15,724
|
)
|
$
|
(14,108
|
)
|
$
|
(7,746
|
)
|
$
|
(26,580
|
)
|
|||||||||
|
Income (loss) before provision
(benefit) for income taxes
|
$
|
(16,951
|
)
|
$
|
(3,441
|
)
|
$
|
31,612
|
$
|
(5,844
|
)
|
$
|
(18,629
|
)
|
$
|
(16,371
|
)
|
$
|
(16,651
|
)
|
$
|
(29,771
|
)
|
|||||||||
|
Net income (loss)
|
$
|
(17,383
|
)
|
$
|
(4,145
|
)
|
$
|
30,529
|
$
|
(7,752
|
)
|
$
|
(18,825
|
)
|
$
|
(16,687
|
)
|
$
|
(17,569
|
)
|
$
|
(30,487
|
)
|
|||||||||
|
Basic earnings (loss) per share
|
$
|
(1.01
|
)
|
$
|
(0.27
|
)
|
$
|
1.91
|
$
|
(0.47
|
)
|
$
|
(1.01
|
)
|
$
|
(.77
|
)
|
$
|
(.77
|
)
|
$
|
(1.33
|
)
|
|||||||||
|
Weighted average shares
outstanding
|
17,218
|
16,402
|
16,044
|
16,098
|
18,104
|
21,616
|
22,772
|
22,799
|
||||||||||||||||||||||||
|
Diluted earnings (loss) per share
|
$
|
(1.01
|
)
|
$
|
(0.27
|
)
|
$
|
0.82
|
$
|
(0.47
|
)
|
$
|
(1.01
|
)
|
$
|
(.77
|
)
|
$
|
(.77
|
)
|
$
|
(1.33
|
)
|
|||||||||
|
Weighted average shares and
equivalents outstanding
|
17,218
|
16,402
|
39,504
|
16,098
|
18,104
|
21,616
|
22,772
|
22,799
|
||||||||||||||||||||||||
Quarterly and year-to-date computations of income (loss) per share amounts are made independently. Therefore, the sum of the per-share amounts for the quarters may not agree with the per share amounts for the year.
70
Note 21 – Litigation
The Company is a party to, and certain of its property is the subject of, various pending claims and legal proceedings that routinely arise in the ordinary course of its business, but the Company does not believe that any of these claims or proceedings will have a material effect on its business, financial condition or results of operations.
|
Note 22 – Subsequent Events
|
On March 15, 2018, Toys “R” Us filed a motion to conduct an orderly wind down of its operations in the U.S. and commence store closing sales at all 735 US stores. The total worldwide pre and post-petition gross accounts receivable balance as of March 15, 2018 is $22.8 million (unaudited) and $13.1 million (unaudited), respectively. The Company has filed a claim with its insurance carrier of $13.9 million, net of the deductible, resulting in a net receivable from Toys “R” Us of $22.0 million (unaudited). The reserve with respect to such receivable balance at March 15, 2018 is $8.9 million (unaudited), resulting in a net exposure of $13.1 million (unaudited). Due to the evolving nature of this matter, it is too early to assess the impact on the collectability of this receivable and on the Company’s future operations.
71
JAKKS PACIFIC, INC. AND SUBSIDIARIES
SCHEDULE II—VALUATION AND QUALIFYING ACCOUNTS
YEARS ENDED DECEMBER 31, 2015, 2016 and 2017
Allowances are deducted from the assets to which they apply, except for sales returns and allowances.
|
|
Balance at
|
Charged to
|
Balance
|
|||||||||||||
|
|
Beginning
|
Costs and
|
at End
|
|||||||||||||
|
|
of Period
|
Expenses
|
Deductions
|
of Period
|
||||||||||||
|
|
(In thousands)
|
|||||||||||||||
|
Year ended December 31, 2015:
|
||||||||||||||||
|
Allowance for:
|
||||||||||||||||
|
Uncollectible accounts
|
$
|
3,264
|
$
|
(143
|
)
|
$
|
(407
|
)
|
$
|
2,714
|
||||||
|
Reserve for potential product obsolescence
|
7,877
|
1,511
|
(1,337
|
)
|
8,051
|
|||||||||||
|
Reserve for sales returns and allowances
|
24,477
|
42,507
|
(49,717
|
)
|
17,267
|
|||||||||||
|
|
$
|
35,618
|
$
|
43,875
|
$
|
(51,461
|
)
|
$
|
28,032
|
|||||||
|
Year ended December 31, 2016:
|
||||||||||||||||
|
Allowance for:
|
||||||||||||||||
|
Uncollectible accounts
|
$
|
2,714
|
$
|
303
|
$
|
(153
|
)
|
$
|
2,864
|
|||||||
|
Reserve for potential product obsolescence
|
8,051
|
(161
|
)
|
(273
|
)
|
7,617
|
||||||||||
|
Reserve for sales returns and allowances
|
17,267
|
50,582
|
(51,425
|
)
|
16,424
|
|||||||||||
|
|
$
|
28,032
|
$
|
50,724
|
$
|
(51,851
|
)
|
$
|
26,905
|
|||||||
|
Year ended December 31, 2017:
|
||||||||||||||||
|
Allowance for:
|
||||||||||||||||
|
Uncollectible accounts
|
$
|
2,864
|
$
|
11,803
|
$
|
(3,727
|
)
|
$
|
10,940
|
|||||||
|
Reserve for potential product obsolescence
|
7,617
|
7,593
|
(764
|
)
|
14,446
|
|||||||||||
|
Reserve for sales returns and allowances
|
16,424
|
42,654
|
(41,456
|
)
|
17,622
|
|||||||||||
|
|
$
|
26,905
|
$
|
62,050
|
$
|
(45,947
|
)
|
$
|
43,008
|
|||||||
Evaluation of Disclosure Controls and Procedures.
Our Chief Executive Officer and Chief Financial Officer, after evaluating the effectiveness of our disclosure controls and procedures (as defined in Exchange Act Rules 13a-15(e) and 15d-15(e)) as of the end of the period covered by this Annual Report, have concluded that as of December 31, 2017, our disclosure controls and procedures were adequate and effective to ensure that information required to be disclosed by us in the reports we file or submit with the Securities and Exchange Commission is recorded, processed, summarized and reported within the time periods specified in the Securities and Exchange Commission’s rules and forms.
Changes in Internal Control over Financial Reporting.
There has been no change in our internal control over financial reporting identified in connection with the evaluation required by Exchange Act Rules 13a-15(d) and 15d-15 that occurred during the fourth quarter period covered by this Annual Report that has materially affected, or is reasonably likely to materially affect, our internal control over financial reporting.
Management’s Annual Report on Internal Control over Financial Reporting.
We, as management, are responsible for establishing and maintaining adequate “internal control over financial reporting” (as defined in Exchange Act Rule 13a-15(f)). Our internal control system was designed by or is under the supervision of management and our board of directors to provide reasonable assurance regarding the reliability of financial reporting and the preparation of published financial statements.
All internal control systems, no matter how well designed, have inherent limitations. Therefore, even those systems determined to be effective can provide only reasonable assurance with respect to financial statement preparation and presentation.
Our management, including our Chief Executive Officer and Chief Financial Officer, evaluated the effectiveness of our internal control over financial reporting as of December 31, 2017. In making this assessment, management used the criteria set forth by the Committee of Sponsoring Organizations of the Treadway Commission (COSO) in Internal Control — Integrated Framework (2013) . We believe that, as of December 31, 2017, our internal control over financial reporting was effective based upon those criteria.
Our independent registered public accounting firm has issued a report on our internal control over financial reporting. This report appears below.
72
Report of the Independent Registered Public Accounting Firm.
Report of Independent Registered Public Accounting Firm
Shareholders and Board of Directors
JAKKS Pacific, Inc.
Santa Monica, California
Opinion on Internal Control over Financial Reporting
We have audited JAKKS Pacific, Inc.’s (the “Company’s”) internal control over financial reporting as of December 31, 2017, based on criteria established in Internal Control – Integrated Framework (2013) issued by the Committee of Sponsoring Organizations of the Treadway Commission (the “COSO criteria”). In our opinion, the Company maintained, in all material respects, effective internal control over financial reporting as of December 31, 2017, based on the COSO criteria.
We also have audited, in accordance with the standards of the Public Company Accounting Oversight Board (United States) (“PCAOB”), the consolidated balance sheets of the Company and subsidiaries as of December 31, 2017 and 2016, the related consolidated statements of operations, comprehensive income (loss), stockholders’ equity, and cash flows for each of the three years in the period ended December 31, 2017, and the related notes and schedule and our report dated March 16, 2018 expressed an unqualified opinion thereon.
Basis of Opinion
The Company’s management is responsible for maintaining effective internal control over financial reporting and for its assessment of the effectiveness of internal control over financial reporting, included in the accompanying Item 9A, Management’s Annual Report on Internal Control Over Financial Reporting. Our responsibility is to express an opinion on the Company’s internal control over financial reporting based on our audit. We are a public accounting firm registered with the PCAOB and are required to be independent with respect to the Company in accordance with the U.S. federal securities laws and the applicable rules and regulations of the Securities and Exchange Commission and the PCAOB.
We conducted our audit of internal control over financial reporting in accordance with the standards of the PCAOB. Those standards require that we plan and perform the audit to obtain reasonable assurance about whether effective internal control over financial reporting was maintained in all material respects. Our audit included obtaining an understanding of internal control over financial reporting, assessing the risk that a material weakness exists, and testing and evaluating the design and operating effectiveness of internal control based on the assessed risk. Our audit also included performing such other procedures as we considered necessary in the circumstances. We believe that our audit provides a reasonable basis for our opinion.
Definition and Limitations of Internal Control over Financial Reporting
A company’s internal control over financial reporting is a process designed to provide reasonable assurance regarding the reliability of financial reporting and the preparation of financial statements for external purposes in accordance with generally accepted accounting principles. A company’s internal control over financial reporting includes those policies and procedures that (1) pertain to the maintenance of records that, in reasonable detail, accurately and fairly reflect the transactions and dispositions of the assets of the company; (2) provide reasonable assurance that transactions are recorded as necessary to permit preparation of financial statements in accordance with generally accepted accounting principles, and that receipts and expenditures of the company are being made only in accordance with authorizations of management and directors of the company; and (3) provide reasonable assurance regarding prevention or timely detection of unauthorized acquisition, use, or disposition of the company’s assets that could have a material effect on the financial statements.
Because of its inherent limitations, internal control over financial reporting may not prevent or detect misstatements. Also, projections of any evaluation of effectiveness to future periods are subject to the risk that controls may become inadequate because of changes in conditions, or that the degree of compliance with the policies or procedures may deteriorate.
|
/S/ BDO USA, LLP
|
|
Los Angeles, California
March 16, 2018
73
PART III
Directors and Executive Officers
Our directors and executive officers are as follows:
|
Name
|
Age
|
Positions with the Company
|
|||
|
|
|
||||
|
Stephen G. Berman
|
53
|
Chief Executive Officer, President, Secretary and Director
|
|||
|
Joel M. Bennett
|
56
|
Executive Vice President and Chief Financial Officer
|
|||
|
John J. McGrath
|
52
|
Chief Operating Officer
|
|||
|
Michael S. Sitrick
|
70
|
Director
|
|||
|
Murray L. Skala
|
71
|
Director
|
|||
|
Alexander Shoghi
|
36
|
Director
|
|||
|
Rex H. Poulsen
|
66
|
Director
|
|||
|
Michael J. Gross
|
42
|
Director
|
|||
|
Zhao Xiaoqiang
|
50
|
Director
|
|||
Stephen G. Berman has been our Chief Operating Officer (until August 23, 2011) and Secretary and one of our directors since co-founding JAKKS in January 1995. From February 17, 2009 through March 31, 2010 he was also our Co-Chief Executive Officer and has been our Chief Executive Officer since April 1, 2010. Since January 1, 1999, he has also served as our President and since October 23, 2015 he has also served as our Chairman. From our inception until December 31, 1998, Mr. Berman was also our Executive Vice President. From October 1991 to August 1995, Mr. Berman was a Vice President and Managing Director of THQ International, Inc., a subsidiary of THQ. From 1988 to 1991, he was President and an owner of Balanced Approach, Inc., a distributor of personal fitness products and services.
Joel M. Bennett joined us in September 1995 as Chief Financial Officer and was given the additional title of Executive Vice President in May 2000. From August 1993 to September 1995, he served in several financial management capacities at Time Warner Entertainment Company, L.P., including as Controller of Warner Brothers Consumer Products Worldwide Merchandising and Interactive Entertainment. From June 1991 to August 1993, Mr. Bennett was Vice President and Chief Financial Officer of TTI Technologies, Inc., a direct-mail computer hardware and software distribution company. From 1986 to June 1991, Mr. Bennett held various financial management positions at The Walt Disney Company, including Senior Manager of Finance for its international television syndication and production division. Mr. Bennett began his career at Ernst & Young LLP as an auditor from August 1983 to August 1986. Mr. Bennett holds a Bachelor of Science degree in Accounting and a Master of Business Administration degree in Finance and is a Certified Public Accountant (inactive).
John J. (Jack) McGrath is our Chief Operating Officer. He was our Executive Vice President of Operations from December 2007 until August 2011 when he became our Chief Operating Officer. Mr. McGrath was our Vice President of Marketing from 1999 to August 2003 and became a Senior Vice President of Operations in August 2003 and Executive Vice President of Operations in December 2007. From January 1992 to December 1998, Mr. McGrath was Director of Marketing at Mattel Inc. and prior thereto he was a PFC in the U.S. Army. Mr. McGrath holds a Bachelor of Science degree in Marketing.
Michael S. Sitrick has been a director since December 19, 2014. Since November 2009, Mr. Sitrick is the chairman and chief executive officer of Sitrick Brinko LLC, a subsidiary of Resources Connection, Inc. (NASDAQ: RECN)., and the successor to Sitrick And Company, which he founded in 1989 and was its founder, chairman and chief executive officer until he sold it to Resources Connection, Inc. in 2009, which is a public relations, strategic communications and crisis management company providing advice and counseling to some of the country’s largest corporations, non-profits and governmental agencies, in many areas including mergers and acquisitions, litigation support, corporate positioning and repositioning, developing and implementing strategies to deal with short sellers, executive transitions and government investigations. Prior thereto he was an executive and Senior Vice President – Communications for Wickes Companies, Inc. (from 1981to1989), head of Communications and Government Affairs for National Can Corporation (from 1974 to 1981) and Group Supervisor at Selz, Seabolt and Associates before that. Prior thereto Mr. Sitrick was Assistant Director of Public Information in the Richard J. Daley administration in Chicago and worked as a reporter. Mr. Sitrick is a published author, frequent lecturer, a former board member at two public companies (both of which were sold) and a current and former board member of several charitable organizations. He holds a B.S. degree in Business Administration and a major in Journalism from the University of Maryland, College Park.
74
Murray L. Skala has been one of our directors since October 1995. Since 1976, Mr. Skala has been a partner of the law firm Feder Kaszovitz LLP, our general counsel.
Alexander Shoghi has been a director since December 18, 2015. Mr. Shoghi is a Portfolio Manager at Oasis Management, a private investment management firm headquartered in Hong Kong. Mr. Shoghi joined Oasis in 2005, first based in Hong Kong, and subsequently relocating to the US as the founder and manager of Oasis Capital in Austin, Texas in early 2012. From 2004 to 2005, Mr. Shoghi worked at Lehman Brothers in New York City. Mr. Shoghi received a Bachelor of Science of Business Administration in Finance and International Business from Georgetown University in 2004.
Rex H. Poulsen has been a director since December 26, 2012. Mr. Poulsen is currently a partner in the Glendale, California office of Hutchinson and Bloodgood LLP, a regional certified public accounting and consulting firm registered with the PCAOB. Mr. Poulsen has been continuously licensed as a Certified Public Accountant since 1974, and has spent most of his career with public accounting firms as an independent auditor of both private and publicly-held companies. Mr. Poulsen also has extensive experience in assisting companies in the areas of due diligence, valuation and other services related to the purchase and sale of businesses, as well as providing services in connection with litigation matters including forensic accounting assignments and expert witness testimony. Mr. Poulsen received a Bachelor of Science degree in Accounting from Weber State University in 1973, and is a member of the American Institute of Certified Public Accountants.
Michael J. Gross has been a director since October 19, 2016. Michael Gross has been the Vice Chairman of WeWork LLC since July 2015 and was its CFO from October 2013 to July 2015. Prior to joining WeWork LLC, Michael was appointed to the Board of Directors of Morgans Hotel Group from October 2009 to June 2013 and was its CEO from March 2011 to September 2013. From January 2008 until March 2011 Michael partnered with The Yucaipa Companies focusing on retail and consumer investment opportunities. From 1998 to 2007, Michael focused on consumer, retail and real estate companies with various investment and research roles at Prentice Capital Management, S.A.C. Capital Advisors, Lehman Brothers Inc., Salomon Smith Barney and Granite Partners. Michael graduated with a Bachelor of Science from Cornell University’s School of Hotel Administration.
Zhao Xiaoqiang has been a director since April 27, 2017. Since 2002 Mr. Zhao Xiaoqiang has been the Chairman of Meisheng Holding Co., a private holding company, selling cultural products and since 2007 he has been the Chairman of Meisheng Culture & Creative Corp. Ltd. a public company listed on the Shenzen Stock Exchange in 2012, with 23 subsidiaries which business includes manufacturing, animation, games, movies, online video, stage performance art, e-commerce and overseas investments. Mr. Zhao Xiaoqiang is also a director of two of the Company’s subsidiaries, JAKKS Meisheng Animation (H.K.) Limited and JAKKS Meisheng Trading (Shanghai) Limited. Mr. Zhao Xiaoqiang received an EMBA from Zhejiang University in 2010.
A majority of our directors are “independent,” as defined under the rules of the Nasdaq Stock Market. Such independent directors are currently Messrs. Sitrick, Poulsen, Shoghi, Gross and Xiaoqiang. Our directors hold office until the next annual meeting of stockholders and until their successors are elected and qualified. Our officers are elected annually by our Board of Directors and serve at its discretion. None of our current independent directors have served as such for more than the past five years. Our current independent directors were selected for their experience as businessmen (Sitrick, Gross and Xiaoqiang) or financial expertise (Poulsen and Gross) or financial management expertise (Shoghi). We believe that our board is best served by benefiting from this blend of business and financial expertise and experience. Our remaining directors consist of our chief executive officer (Berman) who brings management’s perspective to the board’s deliberations and, our longest serving director (Skala), who, as an attorney with many years of experience advising businesses, is able to provide guidance to the board from a legal perspective.
Committees of the Board of Directors
We have an Audit Committee, a Compensation Committee and a Nominating and Corporate Governance Committee. The Capital Allocation Committee was established as a standing committee in February 2016.
Audit Committee. In addition to risk management functions, the primary functions of the Audit Committee are to select or to recommend to our Board the selection of outside auditors; to monitor our relationships with our outside auditors and their interaction with our management in order to ensure their independence and objectivity; to review, and to assess the scope and quality of, our outside auditor’s services, including the audit of our annual financial statements; to review our financial management and accounting procedures; to review our financial statements with our management and outside auditors; and to review the adequacy of our system of internal accounting controls. Messrs. Poulsen (chairman), Gross and Shoghi are the current members of the Audit Committee and are each “independent” (as that term is defined in NASD Rule 4200(a)(14)), and are each able to read and understand fundamental financial statements. Mr. Poulsen, our audit committee financial expert, is the Chairman of the Audit Committee and possesses the financial expertise required under Rule 401(h) of Regulation S-K of the Act and NASD Rule 4350(d)(2). He is further “independent”, as that term is defined under Item 7(d)(3)(iv) of Schedule 14A under the Exchange Act. We will, in the future, continue to have (i) an Audit Committee of at least three members comprised solely of independent directors, each of whom will be able to read and understand fundamental financial statements (or will become able to do so within a reasonable period of time after his or her appointment); and (ii) at least one member of the Audit Committee that will possess the financial expertise required under NASD Rule 4350(d)(2). Our Board has adopted a written charter for the Audit Committee and the Audit Committee reviews and reassesses the adequacy of that charter on an annual basis. The full text of the charter is available on our website at www.jakks.com.
75
Compensation Committee. In addition to risk oversight functions, the functions of the Compensation Committee are to make recommendations to the Board regarding compensation of management employees and to administer plans and programs relating to employee benefits, incentives, compensation and awards under our 2002 Stock Award and Incentive Plan (the “2002 Plan”). Messrs. Sitrick (Chairman), Gross and Poulsen are the current members of the Compensation Committee. The Board has determined that each of them is “independent,” as defined under the applicable rules of the Nasdaq Stock Market. A copy of the Compensation Committee’s Charter is available on our website at www.jakks.com. Executive officers that are members of our Board make recommendations to the Compensation Committee with respect to the compensation of other executive officers that are not on the Board. Except as otherwise prohibited, the Committee may delegate its responsibilities to subcommittees or individuals. The Compensation Committee has the authority, in its sole discretion, to retain or obtain advice from a compensation consultant, legal counsel or other advisor and is directly responsible for the appointment, compensation and oversight of such persons. The Company provides the appropriate funding to such persons as determined by the Compensation Committee. The Compensation Committee conducts an independence assessment of its outside advisors using the six factors contained in Exchange Act Rule 10C-1. The Compensation Committee receives legal advice from our outside general counsel and for 2015 retained Lipis Consulting, Inc. (“LCI”), a compensation consulting firm, which provides advice directly to the Compensation Committee. The Compensation Committee retained Willis Towers Watson (“WTW”), a compensation consulting firm, to advise it in 2016 and 2017. WTW provides advice directly to the Compensation Committee.
The Compensation Committee also annually reviews the overall compensation of our executive officers for the purpose of determining whether discretionary bonuses should be granted. In 2015, LCI presented a report to the Compensation Committee comparing our performance, size and executive compensation levels to those of peer group companies. LCI also reviewed with the Compensation Committee the base salaries, annual bonuses, total cash compensation, long-term compensation and total compensation of our senior executive officers relative to those companies. The performance comparison presented to the Compensation Committee each year includes a comparison of our total shareholder return, earnings per share growth, sales, net income (and one-year growth of both measures) to the peer group companies. The Compensation Committee reviews this information along with details about the components of each executive officer’s compensation. LCI also provided guidance to the Compensation Committee with respect to the extension of Messrs. McGrath’s and Bennett’s employment agreements (see “- Employment Agreements and Termination of Employment Arrangements”). The Compensation Committee consulted with Frederick W. Cook & Co., Inc. (“FWC"), a compensation consulting firm, in 2012 with respect to determination of a portion of Mr. Berman’s bonus criteria for 2012, and in 2013 with respect to determination of a portion of his bonus criteria for 2013, and in 2014 with respect to the determination of a portion of his bonus criteria for 2014. The Compensation Committee also consulted with FWC in 2013 with respect to a portion of Mr. McGrath’s bonus criteria for 2013 and in 2014 with respect to a portion of his bonus criteria for 2014. The Compensation Committee consulted with LCI with respect to establishing the bonus criteria for Messrs. Berman and McGrath for 2015. The Compensation Committee consulted with WTW with respect to the amendments to the employment agreements for Messrs. Berman and McGrath in 2016.
Nominating and Corporate Governance Committee. In addition to risk oversight functions, the functions of the Nominating and Corporate Governance Committee are to develop our corporate governance system and to review proposed new members of our Board of Directors, including those recommended by our stockholders. Messrs. Poulsen (Chairman) and Sitrick are the current members of our Nominating and Corporate Governance Committee. The Nominating and Corporate Governance Committee operates pursuant to a written charter adopted by the Board. The full text of the charter is available on our website at www.jakks.com. The Board has determined that each member of this Committee is “independent,” as defined under the applicable rules of the Nasdaq Stock Market.
The Nominating and Corporate Governance Committee will review, on an annual basis, the composition of our Board of Directors and the ability of its current members to continue effectively as directors for the upcoming fiscal year. The Nominating and Corporate Governance Committee established the position of Chairman of the Board in 2015. In the ordinary course, absent special circumstances or a change in the criteria for Board membership, the Nominating and Corporate Governance Committee will renominate incumbent directors who continue to be qualified for Board service and are willing to continue as directors. If that Committee thinks it is in our best interests to nominate a new individual for director in connection with an annual meeting of stockholders, or if a vacancy on the Board occurs between annual stockholder meetings or an incumbent director chooses not to run, the nominating committee will seek out potential candidates for Board appointment who meet the criteria for selection as a nominee and have the specific qualities or skills being sought. Director candidates will be selected based on input from members of the Board, our senior management and, if the Committee deems appropriate, a third-party search firm. The Nominating and Corporate Governance Committee will evaluate each candidate’s qualifications and check relevant references and each candidate will be interviewed by at least one member of that Committee. Candidates meriting serious consideration will meet with all members of the Board. Based on this input, the Nominating and Corporate Governance Committee will evaluate whether a prospective candidate is qualified to serve as a director and whether the Committee should recommend to the Board that this candidate be appointed to fill a current vacancy on the Board, or presented for the approval of the stockholders, as appropriate.
Stockholder recommendations for director nominees are welcome and should be sent to our Chief Financial Officer, who will forward such recommendations to our Nominating and Corporate Governance Committee, and should include the following information: (a) all information relating to each nominee that is required to be disclosed pursuant to Regulation 14A under the Securities Exchange Act of 1934 (including such person’s written consent to being named in the proxy statement as a nominee and to serving as a director if elected); (b) the names and addresses of the stockholders making the nomination and the number of shares of our common stock which are owned beneficially and of record by such stockholders; and (c) appropriate biographical information and a statement as to the qualification of each nominee, and must be submitted in the time frame described under the appropriate caption in our proxy statement. The Nominating and Corporate Governance Committee will evaluate candidates recommended by stockholders in the same manner as candidates recommended by other sources, using additional criteria, if any, approved by the Board from time to time. Our stockholder communication policy may be amended at any time with the consent of our Nominating and Corporate Governance Committee.
76
Pursuant to the Director Resignation Policy adopted by our Board following our 2014 Annual Meeting, in the event a nominee for director in an uncontested election receives less than a majority of the votes cast, the director must submit his resignation to the Board. The Nominating and Corporate Governance Committee then considers such resignation and makes a recommendation to our Board concerning the acceptance or rejection of such resignation. This procedure was implemented following our 2016 Annual Meeting when Mr. Shoghi did not receive a majority of the votes and the Nominating and Corporate Governance Committee recommended that his resignation not be accepted, which recommendation was accepted by the Board.
Capital Allocation Committee. In addition to assisting the Board and management in reviewing the Company’s capital structure and material capital allocation decisions, the Board established the Capital Allocation Committee to assist the Board and management in reviewing strategic investments, and acquisitions and dispositions and other opportunities for maximizing shareholder value. In furtherance of such purposes, the Committee’s responsibilities include review of the Company’s financial strategies, including debt and equity issuances, repurchases of debt and bank credit facilities. The Capital Allocation Committee is also responsible to consider and, if implemented, review the Corporation's dividend and share repurchase policies and programs and other strategies to return capital to stockholders. The Board is in the process of appointing members of this committee. The Board will ensure that each of them will be “independent “ as defined under the applicable rules of the NASDAQ stock market. A copy of the Capital Allocation Committee's charter is available on our website at www.jakks.com. The Committee does not have any authority or responsibility with respect to matters delegated by the Board to the Corporation's Audit, Compensation or Nominating and Governance Committees. The Committee has the authority, in its discretion, to retain independent consultants, counsel and other advisors, and the Company pays for the expenses of retaining such persons as determined by the Capital Allocation Committee. The Capital Allocation Committee reviewed with management and the Board and financial advisors to the Board regarding the Company’s share and convertible debt repurchases.
Executive Officers
Our executive officers are elected by our Board of Directors and serve pursuant to the terms of their respective employment agreements. One of our executive officers, Stephen G. Berman, is also a director of the Company. See above for biographical information about this officer. The other current executive officers are Joel M. Bennett, our Executive Vice President and Chief Financial Officer and John (Jack) McGrath, our Executive Vice President and Chief Operating Officer.
John J. (Jack) McGrath is our Chief Operating Officer. He was our Executive Vice President of Operations from December 2007 until August 2011 when he became our Chief Operating Officer. Mr. McGrath was our Vice President of Marketing from 1999 to August 2003 and became a Senior Vice President of Operations in August 2003 and Executive Vice President of Operations in December 2007. From January 1992 to December 1998, Mr. McGrath was Director of Marketing at Mattel Inc. and prior thereto he was a PFC in the U.S. Army. Mr. McGrath holds a Bachelor of Science degree in Marketing.
Joel M. Bennett joined us in September 1995 as Chief Financial Officer and was given the additional title of Executive Vice President in May 2000. From August 1993 to September 1995, he served in several financial management capacities at Time Warner Entertainment Company, L.P., including as Controller of Warner Brothers Consumer Products Worldwide Merchandising and Interactive Entertainment. From June 1991 to August 1993, Mr. Bennett was Vice President and Chief Financial Officer of TTI Technologies, Inc., a direct-mail computer hardware and software distribution company. From 1986 to June 1991, Mr. Bennett held various financial management positions at The Walt Disney Company, including Senior Manager of Finance for its international television syndication and production division. Mr. Bennett began his career at Ernst & Young LLP as an auditor from August 1983 to August 1986. Mr. Bennett holds a Bachelor of Science degree in Accounting and a Master of Business Administration degree in Finance and is a Certified Public Accountant (inactive).
On December 27, 2017, we entered into a letter agreement with our Chief Financial Officer, Joel M. Bennett, which provides for Mr. Bennett’s stepping down from his position. In order to arrange for a smooth transition, Mr. Bennett will continue as our Chief Financial Officer through March 2018.
Section 16(a) Beneficial Ownership Reporting Compliance
Based solely upon a review of Forms 3 and 4 and amendments thereto furnished to us during 2017 and Forms 5 and amendments thereto furnished to us with respect to 2017, one of our directors filed a Form 3 and a Form 4 late but all other Forms 3, 4 and 5 required to be filed during 2017 by our directors and executive officers were done so on a timely basis.
Code of Ethics
We have a Code of Ethics (which we call a code of conduct) that applies to all our employees, officers and directors. This code was filed as an exhibit to our Annual Report on Form 10-K for the fiscal year ended December 31, 2003. We have posted on our website, www.jakks.com, the full text of such Code. We will disclose when there have been waivers of, or amendments to, such Code, as required by the rules and regulations promulgated by the Securities and Exchange Commission and/or Nasdaq.
77
Pursuant to our Code of Conduct (a copy of which may be found on our website, www.jakks.com), all of our employees are required to disclose to our General Counsel, the Board of Directors or any committee established by the Board of Directors to receive such information, any material transaction or relationship that reasonably could be expected to give rise to actual or apparent conflicts of interest between any of them, personally, and us. In addition, our Code of Conduct also directs all employees to avoid any self-interested transactions without full disclosure. This policy, which applies to all of our employees, is reiterated in our Employee Handbook which states that a violation of this policy could be grounds for termination. In approving or rejecting a proposed transaction, our General Counsel, Board of Directors or designated committee will consider the facts and circumstances available and deemed relevant, including but not limited to, the risks, costs and benefits to us, the terms of the transactions, the availability of other sources for comparable services or products, and, if applicable, the impact on director independence. Upon concluding their review, they will only approve those agreements that, in light of known circumstances, are in or are not inconsistent with, our best interests, as they determine in good faith.
78
Compensation Discussion and Analysis
Compensation Philosophy and Objectives
We believe that a strong management team comprised of highly talented individuals in key positions is critical to our ability to deliver sustained growth and profitability, and our executive compensation program is an important tool for attracting and retaining such individuals. We also believe that our most important resource is our people. While some companies may enjoy an exclusive or limited franchise or are able to exploit unique assets or proprietary technology, we depend fundamentally on the skills, energy and dedication of our employees to drive our business. It is only through their constant efforts that we are able to innovate through the creation of new products and the continual rejuvenation of our product lines, to maintain superior operating efficiencies, and to develop and exploit marketing channels. With this in mind, we have consistently sought to employ the most talented, accomplished and energetic people available in the industry. Therefore, we believe it is vital that our named executive officers receive an aggregate compensation package that is both highly competitive with the compensation received by similarly-situated executive officers at peer group companies, and also reflective of each individual named executive officer’s contributions to our success on both a long-term and short-term basis. As discussed in greater depth below, the objectives of our compensation program are designed to execute this philosophy by compensating our executives at the top quartile of their peers.
Our executive compensation program is designed with three main objectives:
● to offer a competitive total compensation opportunity that will allow us to continue to retain and motivate highly talented individuals to fill key positions;
● to align a significant portion of each executive’s total compensation with our annual performance and the interests of our stockholders; and
● reflect the qualifications, skills, experience and responsibilities of our executives
Administration and Process
Our executive compensation program is administered by the Compensation Committee. The Compensation Committee receives legal advice from our outside general counsel and has retained Willis Towers Watson (“WTW”), a compensation consulting firm, which provides advice directly to the Compensation Committee. Historically, the base salary, bonus structure and the long-term equity compensation of our executive officers are governed by the terms of their individual employment agreements (see “-Employment Agreements and Termination of Employment Arrangements”) and we expect that to continue in the future. With respect to our chief executive officer and president and our chief operating officer the Compensation Committee, with input from WTW, establishes target performance levels for incentive bonuses based on a number of factors that are designed to further our executive compensation objectives, including our performance, the compensation received by similarly-situated executive officers at peer group companies, the conditions of the markets in which we operate and the relative earnings performance of peer group companies.
Historically, a factor given considerable weight in establishing bonus performance criteria is Adjusted EPS which is the net income per share of our common stock calculated on a fully-diluted basis in accordance with GAAP, applied on a basis consistent with past periods, as adjusted in the sole discretion of the Compensation Committee to take account of extraordinary or special items.
As explained in greater detail below (see “Employment Agreements and Termination of Employment Arrangements”), pursuant to a September 2012 amendment to Mr. Berman’s employment agreement, commencing in 2013, his annual bonus was restructured so that part of it was capped at 300% of his base salary and the performance criteria and vesting are solely within the discretion of the Compensation Committee, which establishes all of the criteria during the first quarter of each fiscal year for that year’s bonus, based upon financial and non-financial factors selected by the Compensation Committee, and another part of his annual performance bonus is based upon the success of a joint venture entity we initiated in September 2012. The portion of the bonus equal to the first 200% of base salary is payable in cash and the balance in restricted stock vesting over three years. In addition, the annual grant of $500,000 of restricted stock was changed to $3,500,000 of restricted stock and the vesting criteria was also changed from being solely based upon established EPS targets to being based upon performance standards established by the Compensation Committee during the first quarter of each year. On June 7, 2016 we further amended the employment agreement to provide, among other things, for (i) extension of the term to December 31, 2020; (ii) modification of the performance and vesting standards for each $3.5 million Annual Restricted Stock Grant (“Berman Annual Stock Grant”) provided for under Section 3(b) of his Employment Agreement, effective as of January 1, 2017, so that 40% ($1.4 million) of each Berman Annual Stock Grant will be subject to time vesting in four equal annual installments over four years and 60% ($2.1 million) of each Berman Annual Stock Grant will be subject to three year “cliff vesting” (i.e. payment is based upon performance at the close of the three year performance period), with vesting of each Berman Annual Stock Grant determined by the following performance measures: (a) total shareholder return as compared to the Russell 2000 Index (weighted 50%), (b) net revenue growth as compared to our peer group (weighted 25%) and (c) EBITDA growth as compared to our peer group (weighted 25%); and (iii) modification of the performance measures for award of his Annual Performance Bonus equal to up to 300% of Base Salary (“Berman Annual Bonus”) provided for under Section 3(d) of his Employment Agreement, effective as of January 1, 2017, so that the performance measures will be based only upon net revenues and EBITDA, each performance measure weighted 50%, and with the specific performance criteria applicable to each Berman Annual Bonus determined by the Compensation Committee during the first quarter of each fiscal year; and (iv) increase Mr. Berman’s base salary to $1,450,000 effective June 1, 2016 subject to annual increases of at least $25,000 per year thereafter.
79
On August 23, 2011 we entered into an amended employment agreement with John J. (Jack) McGrath whereby he became Chief Operating Officer. As disclosed in greater detail below, Mr. McGrath’s employment agreement also provides for fixed and adjustable bonuses payable based upon adjusted EPS, which targets are set in the agreement, based upon input from our outside consulting firm, with the adjustable bonus capped at a maximum of 125% of base salary. On March 31, 2015, the Compensation Committee increased for 2015 the performance bonus that can be earned by Mr. McGrath from a maximum of up to 125% of his base salary to a maximum of up to 150% of his base salary, subject to achievement of certain performance based conditions established by the Committee, and also awarded Mr. McGrath the opportunity to earn an additional $925,000 of restricted stock subject to achievement of certain performance based vesting conditions. On September 29, 2016 we entered into a Fourth Amendment to the employment agreement with Mr. McGrath which provides, among other things, for (i) extension of the term December 31, 2020; (i) modification of the performance and vesting standards for each Annual Restricted Stock Grant (“McGrath Annual Stock Grant”) provided for under Section 3(d) of his Employment Agreement, effective as of January 1, 2017, as follows: each McGrath Annual Stock Grant will be equal to $1 million, and 40% ($0.4 million) of each McGrath Annual Stock Grant will be subject to time vesting in four equal annual installments over four years, and 60% ($0.6 million) of each McGrath Annual Stock Grant will be subject to three year “cliff vesting” (i.e. vesting is based upon satisfaction of the performance measures at the close of the three year performance period), determined by the following performance measures: (A) total shareholder return as compared to the Russell 2000 Index (weighted 50%), (B) net revenue growth as compared to our peer group (weighted 25%) and (C) growth in Earnings Before Interest, Taxes, Depreciation and Amortization (“EBITDA”) as compared to our peer group (weighted 25%); and (iii) modification of the Annual Performance Bonus (“McGrath Annual Bonus”) provided for under Section 3(e) of his Employment Agreement, effective as of January 1, 2017, as follows: the McGrath Annual Bonus will be equal to up to 125% of base salary, and the actual amount will be determined by performance measures based upon net revenues and EBITDA, each performance measure weighted 50%, and with the specific performance criteria applicable to each McGrath Annual Bonus determined by the Compensation Committee during the first quarter of each fiscal year, and payable in cash (up to 100% of base salary) and shares of our common stock (any excess over 100% of base salary) with the shares of stock vesting over three years in equal quarterly installments.
While the Compensation Committee does not establish target performance levels for our chief financial officer, it does consider similar factors when determining such officer’s bonus. The employment agreement for Mr. Bennett expired on December 31, 2009 and from January 1, 2010 through October 20, 2011 Mr. Bennett was an employee at will until his entry into a new employment agreement dated October 21, 2011. Prior to its expiration, the agreement authorized our Compensation Committee and Board of Directors to award an annual bonus to Mr. Bennett in an amount up to 50% of his salary as the Committee or Board determined in its discretion and also gave the Compensation Committee and the Board the discretionary authority to pay Mr. Bennett additional incentive compensation as it determined. Mr. Bennett’s new employment agreement does not contain a limitation on the percentage of salary that can be granted as a bonus. On February 18, 2014, we entered into a Continuation and Extension of Term of Employment Agreement with respect to Mr. Joel M. Bennett’s Employment Agreement dated October 21, 2011 such that it is deemed to have been renewed and continued from January 1, 2014 without interruption and it was extended through December 31, 2015. On June 11, 2015 Mr. Bennett’s employment agreement was extended through December 31, 2017.
The current employment agreements with our named executive officers also gives the Compensation Committee the authority to award additional compensation to each of them as it determines in its sole discretion based upon criteria it establishes.
The Compensation Committee also annually reviews the overall compensation of our named executive officers for the purpose of determining whether discretionary bonuses should be granted. In 2017, WTW presented a report to the Compensation Committee comparing our performance, size and executive compensation levels to those of peer group companies. WTW also reviewed with the Compensation Committee the base salaries, annual bonuses, total cash compensation, long-term compensation and total compensation of our senior executive officers relative to those companies. The performance comparison presented to the Compensation Committee each year includes a comparison of our total shareholder return, earnings per share growth, sales, net income (and one-year growth of both measures) to the peer group companies. The Compensation Committee reviews this information along with details about the components of each named executive officer’s compensation.
Peer Group
One of the factors considered by the Compensation Committee is the relative performance and the compensation of executives of peer group companies. The peer group is comprised of a group of the companies selected in conjunction with WTW that we believe provides relevant comparative information, as these companies represent a cross-section of publicly-traded companies with product lines and businesses similar to our own throughout the comparison period. The composition of the peer group is reviewed annually and companies are added or removed from the group as circumstances warrant. For the last fiscal year, the peer group companies utilized for executive compensation analysis, which remained the same as in the previous year were:
|
●
|
Activision Blizzard, Inc
|
|
|
●
|
Deckers Outdoor Corporation
|
|
|
●
|
Electronic Arts, Inc.
|
|
|
●
|
Hasbro, Inc.
|
|
|
●
|
Mattel, Inc.
|
|
| ● | Take-Two Interactive, Inc. |
80
Elements of Executive Compensation
The compensation packages for the Company’s senior executives have both performance-based and non-performance based elements. Based on its review of each named executive officer’s total compensation opportunities and performance, and our performance, the Compensation Committee determines each year’s compensation in the manner that it considers to be most likely to achieve the objectives of our executive compensation program. The specific elements, which include base salary, annual cash incentive compensation and long-term equity compensation, are described below.
The Compensation Committee has negative discretion to adjust performance results used to determine annual incentive and the vesting schedule of long-term incentive payouts to the named executive officers. The Compensation Committee also has discretion to grant bonuses even if the performance targets were not met.
81
Base Salary
Mr. Berman received compensation in 2016 pursuant to the terms of his employment agreement; Mr. McGrath became an executive officer on August 23, 2011 pursuant to the terms of an amendment to his employment agreement and Mr. Bennett entered into a new employment agreement on October 21, 2011 which was extended in 2015. As discussed in greater detail below, the employment agreement for Mr. Berman was to expire on December 31, 2010 and Mr. Bennett’s employment agreement expired on December 31, 2013. Effective November 11, 2010, Mr. Berman entered into an amended and restated employment agreement, which was further amended in 2012 and 2016. Pursuant to the terms of their employment agreements as in effect on December 31, 2013, Messrs. Berman, McGrath, and Bennett each receive a base salary which is increased automatically each year by at least $25,000 for Mr. Berman and $15,000 for each of Messrs. McGrath and Bennett pursuant to the terms of their respective employment agreements. Mr. Bennett’s extended employment agreement, which was set to expire in December 2017, does not provide for automatic annual increases in base salary. Any further increase in base salary, as the case may be, is determined by the Compensation Committee based on a combination of two factors. The first factor is the Compensation Committee’s evaluation of the salaries paid in peer group companies to executives with similar responsibilities. The second factor is the Compensation Committee’s evaluation of the executive’s unique role, job performance and other circumstances. Evaluating both of these factors allows us to offer a competitive total compensation value to each individual named executive officer taking into account the unique attributes of, and circumstances relating to, each individual, as well as marketplace factors. This approach has allowed us to continue to meet our objective of offering a competitive total compensation value and attracting and retaining key personnel. Based on its review of these factors, the Compensation Committee determined not to increase the base salary of each of Messrs. Berman, McGrath and Bennett above the contractually required minimum increase in 2016 as unnecessary to maintain our competitive total compensation position in the marketplace. Pursuant to the 2016 amendment to his employment agreement, Mr. Berman’s base salary as of June 1, 2016 was increased to $1,450,000.
Annual Cash Incentive Compensation
The function of the annual cash bonus is to establish a direct correlation between the annual incentives awarded to the participants and our financial performance. This purpose is in keeping with our compensation program’s objective of aligning a significant portion of each executive’s total compensation with our annual performance and the interests of our shareholders.
The employment agreements as in effect on January 1, 2017 for Messrs. Berman and McGrath provided for an incentive cash bonus award based on a percentage of each participant’s base salary if the performance goals set by the Compensation Committee are met for that year. The employment agreements mandated that the specific criteria to be used is growth in earnings per share and the Compensation Committee sets the various target thresholds to be met to earn increasing amounts of the bonus up to a maximum of 200% of base salary for Mr. Berman and 125% for Mr. McGrath, although the Compensation Committee has the ability to increase the maximum in its discretion. Commencing in 2012, the Compensation Committee is required to meet to establish criteria for earning the annual performance bonus (and with respect to Mr. Berman, any additional annual performance bonus) during the first quarter of the year. As described elsewhere herein, Mr. Berman’s employment agreement was further amended in 2016.
The employment agreements as in effect on January 1, 2017 for Messrs. Berman, McGrath and Bennett contemplate that the Compensation Committee may grant discretionary bonuses in situations where, in its sole judgment, it believes they are warranted. The Compensation Committee approaches this aspect of the particular executive’s compensation package by looking at the other components of the executive’s aggregate compensation and then evaluating if any additional compensation is appropriate to meet our compensation goals. As part of this review, the Compensation Committee, with significant input from WTW, collects information about the total compensation packages in our peer group and various indicia of performance by the peer group such as sales, one-year sales growth, net income, one-year net income growth, market capitalization, size of companies, one- and three-year stockholder returns, etc. and then compares such data to our corresponding performance data. Based upon our philosophy of executive compensation described above, after not approving any discretionary bonuses in 2012 and 2013, in light of the Company’s turn-around in 2014 the Compensation Committee approved discretionary bonuses for 2014 to Messrs. Berman, McGrath and Bennett in the amounts of $417,250, $31,550 and $207,000, respectively, and in light of its continuing turn-around in 2015 approved discretionary bonuses for 2015 to Messrs. Berman, McGrath and Bennett in the amounts of $150,000, $50,000 and $142,500, respectively, and for 2016 approved a discretionary bonus of $652,500 for Mr. Berman and for 2017 approved discretionary bonuses to Messrs. Berman and McGrath of $750,000 and $138,000, respectively.
.
Long-Term Compensation
Long-term compensation is an area of particular emphasis in our executive compensation program, because we believe that these incentives foster the long-term perspective necessary for our continued success. Again, this emphasis is in keeping with our compensation program objective of aligning a significant portion of each executive’s total compensation with our long-term performance and the interests of our shareholders.
Historically, our long-term compensation program has focused on the granting of stock options that vested over time. However, commencing in 2006 we began shifting the emphasis of this element of compensation and we currently favor the issuance of restricted stock awards. The Compensation Committee believes that the award of full-value shares that vest over time is consistent with our overall compensation philosophy and objectives as the value of the restricted stock varies based upon the performance of our common stock, thereby aligning the interests of our executives with our shareholders. The Compensation Committee has also determined that awards of restricted stock are anti-dilutive as compared to stock options inasmuch as it feels that less restricted shares have to be granted to match the compensation value of stock options.
82
Mr. Berman’s 2010 amended and restated employment provided for annual grants of $500,000 of restricted stock which vest in equal annual installments through January 1, 2017, which was one year following the life of the agreement, subject to meeting the 3% vesting condition, as defined in the agreement. As described in greater detail below, pursuant to the 2012 amendment, commencing in 2013, this bonus changed to $3,500,000 of restricted stock to be earned based upon performance targets established by the Compensation Committee during the first quarter of each year. Mr. McGrath’s amended employment agreement provides for annual grants of $75,000 of restricted stock which vests in equal installments over three years subject to meeting certain EPS milestones. As explained in greater detail below (see “Employment Agreements and Termination of Employment Arrangement”), it was changed to $1,000,000 effective January 1, 2017 subject in part to time vesting over four years and in part subject to performance milestones with cliff vesting spread over three years. The Company did not meet the vesting requirements contained in either employment agreement for 2014 so both of Messrs. Berman and McGrath forfeited their stock awards for 2014. For 2015, due to missed milestones, Mr. Berman forfeited all but 7.5% of his annual grant and Mr. McGrath forfeited all of his annual grant. For 2016, due to missed milestones, both of Messrs. Berman and McGrath forfeited their stock awards. As explained in greater detail below (see “ Employment Agreements and Termination of Employment Arrangements ”), Mr. Berman’s employment agreement also provides for an annual performance bonus. Commencing in 2012, the criteria for earning such bonus are to be established by the Compensation Committee. This bonus, if earned, is payable partially in cash and partially in shares of restricted common stock. Mr. Berman’s agreement also provides for an additional annual performance bonus, payable solely in shares of restricted stock, which can be earned by Mr. Berman if the Company’s performance meets certain criteria to be established by the Compensation Committee during the first quarter of each year.
After a review of all of the factors discussed above, the Compensation Committee determined that, in keeping with our compensation objectives, and in light of the discretionary bonus already approved, Mr. Berman was not awarded a long term bonus for 2017.
83
Other Benefits and Perquisites
Our executive officers participate in the health and dental coverage, life insurance, paid vacation and holidays, 401(k) retirement savings plans and other programs that are generally available to all of the Company’s employees.
The provision of any additional perquisites to each of the named executive officers is subject to review by the Compensation Committee. Historically, these perquisites include payment of an automobile allowance and matching contributions to a 401(k) defined contribution plan. In 2017, the named executive officers were granted the following perquisites: automobile allowance and 401(k) plan matching contribution. We value perquisites at their incremental cost to us in accordance with SEC regulations.
We believe that the benefits and perquisites we provide to our named executive officers are within competitive practice and customary for executives in key positions at comparable companies. Such benefits and perquisites serve our objective of offering competitive compensation that allows us to continue to attract, retain and motivate highly talented people to these critical positions, ultimately providing a substantial benefit to our shareholders.
Change of Control/Termination Agreements
We recognize that, as with any public company, it is possible that a change of control may take place in the future. We also recognize that the threat or occurrence of a change of control can result in significant distractions of key management personnel because of the uncertainties inherent in such a situation. We further believe that it is essential and in our best interest and the interests of our shareholders to retain the services of our key management personnel in the event of the threat or occurrence of a change of control and to ensure their continued dedication and efforts in such event without undue concern for their personal financial and employment security. In keeping with this belief and its objective of retaining and motivating highly talented individuals to fill key positions, which is consistent with our general compensation philosophy, the employment agreement for named chief executive officers contain provisions which guarantee specific payments and benefits upon a termination of employment without good reason following a change of control of the Company. In addition, the employment agreements also contain provisions providing for certain lump-sum payments in the event the executive is terminated without “cause” or if we materially breach the agreement leading the affected executive to terminate the agreement for good reason.
Additional details of the terms of the change of control agreements and termination provisions outlined above are provided below.
Impact of Accounting and Tax Treatments
Section 162(m) of the Internal Revenue Code (the “Code”) prohibits publicly held companies like us from deducting certain compensation to any one named executive officer in excess of $1,000,000 during the tax year. However, Section 162(m) provides that, to the extent that compensation is based on the attainment of performance goals set by the Compensation Committee pursuant to plans approved by the Company’s shareholders, the compensation is not included for purposes of arriving at the $1,000,000.
The Company, through the Compensation Committee, intends to attempt to qualify executive compensation as tax deductible to the extent feasible and where it believes it is in our best interests and in the best interests of our shareholders. However, the Compensation Committee does not intend to permit this arbitrary tax provision to distort the effective development and execution of our compensation program. Thus, the Compensation Committee is permitted to and will continue to exercise discretion in those instances in which mechanistic approaches necessary to satisfy tax law considerations could compromise the interests of our shareholders. In addition, because of the uncertainties associated with the application and interpretation of Section 162(m) and the regulations issued thereunder, there can be no assurance that compensation intended to satisfy the requirements for deductibility under Section 162(m) will in fact be deductible.
84
Compensation Risk Management
As part of its annual review of our executive compensation program, the Compensation Committee reviews with management the design and operation of our incentive compensation arrangements for senior management, including executive officers, to determine if such programs might encourage inappropriate risk-taking that could have a material adverse effect on the Company. The Compensation Committee considered, among other things, the features of the Company’s compensation program that are designed to mitigate compensation-related risk, such as the performance objectives and target levels for incentive awards (which are based on overall Company performance), and its compensation recoupment policy. The Compensation Committee also considered our internal control structure which, among other things, limits the number of persons authorized to execute material agreements, requires approval of our board of directors for matters outside of the ordinary course and its whistle blower program. Based upon the above, the Compensation Committee concluded that any risks arising from the Company’s compensation plans, policies and practices are not reasonably likely to have a material adverse effect on the Company.
Impact of Shareholder Advisory Vote
At our 2017 annual meeting, our shareholders approved our current executive compensation with over 85% of all shares actually voting on the issue (over 51% of all outstanding shares whether or not voting) affirmatively giving their approval. Accordingly, we believe that this vote ratifies our executive compensation philosophy and policies, as currently adopted and implemented, and we intend to continue such philosophy and policies.
Pay Ratio Disclosure Rule
Pursuant to a mandate of the Dodd-Frank Wall Street Reform and Consumer Protection Act (the “Dodd – Frank Act”), the SEC adopted a rule requiring annual disclosure of the ratio of the median employee’s annual total compensation to the total annual compensation of the principal executive officer (‟PEO”). Our PEO is Mr. Berman.
|
Median Employee total annual compensation (excluding Mr. Berman)
|
$
|
67,807
|
||
|
Mr. Berman’s total annual compensation
|
$
|
2,139,711
|
||
|
Ratio of PEO to Median Employee Compensation
|
3.2
|
%
|
In determining the median employee, a listing was prepared of all employees as of December 31, 2017. The median amount was selected from the annualized list. As of December 31, 2017 the Company employed 749 persons of which 340 are based outside of the United States.
Compensation Committee Report
The Compensation Committee has reviewed and discussed with management the Compensation Discussion and Analysis (the “CD&A”) for the year ended December 31, 2017. In reliance on the reviews and discussions referred to above, the compensation committee recommended to the board, and the board has approved, that the CD&A be furnished in the annual report on Form 10-K for the year ended December 31, 2017.
|
|
By the Compensation Committee of the Board of Directors:
|
|
|
|
|
|
Michael S. Sitrick, Chairman
|
|
|
Rex H. Poulsen, Member
|
|
Michael J. Gross, Member
|
85
Summary Compensation Table– 2015-2017
|
Name and
Principal
Position
|
Year
|
Salary
($)
|
Bonus
($)
|
Stock
Awards
($)
|
Option
Awards
($)
|
Non-Equity
Incentive Plan
Compensation
($)
|
Change in
Pension
Value and
Nonqualified
Deferred
Compensation
Earnings ($)
|
All Other
Compensation
($) (1)
|
Total
($)
|
|||||||||||||||||||||||||
|
Stephen G. Berman
|
2017
|
1,475,000
|
750,000
|
3,500,000
|
―
|
―
|
―
|
30,000
|
5,755,000
|
|||||||||||||||||||||||||
|
Chief Executive Officer,
|
2016
|
1,372,916
|
652,500
|
―
|
―
|
―
|
―
|
30,000
|
2,055,416
|
|||||||||||||||||||||||||
|
President and Secretary
|
2015
|
1,240,000
|
1,241,200
|
262,500
|
—
|
—
|
—
|
30,000
|
2,773,700
|
|||||||||||||||||||||||||
|
|
|
|||||||||||||||||||||||||||||||||
|
John J. McGrath
|
2017
|
690,000
|
138,000
|
1,000,000
|
―
|
―
|
―
|
26,400
|
1,854,400
|
|||||||||||||||||||||||||
|
Chief Operating Officer
|
2016
|
675,000
|
―
|
―
|
―
|
―
|
―
|
26,400
|
701,400
|
|||||||||||||||||||||||||
|
2015
|
660,000
|
566,600
|
69,378
|
—
|
—
|
—
|
26,400
|
1,322,378
|
||||||||||||||||||||||||||
|
|
|
|||||||||||||||||||||||||||||||||
|
Joel M. Bennett
|
2017
|
505,000
|
―
|
294,000
|
―
|
―
|
―
|
24,000
|
823,000
|
|||||||||||||||||||||||||
|
Executive Vice President
|
2016
|
490,000
|
―
|
―
|
―
|
―
|
―
|
24,000
|
514,000
|
|||||||||||||||||||||||||
|
and Chief Financial Officer
|
2015
|
475,000
|
142,500
|
―
|
―
|
―
|
―
|
24,000
|
641,500
|
|||||||||||||||||||||||||
|
(1)
|
Represents automobile allowances paid in the amount of $18,000, $14,400 and $12,000 to each of Messrs. Berman, McGrath and Bennett, respectively, for 2015, 2016 and 2017; amount also includes matching contributions made by us to the Named Officer’s 401(k) defined contribution plan in the amount of $12,000, $12,000 and $12,000, respectively, for 2015, 2016 and 2017, for each of Messrs. Berman, McGrath and Bennett. See “Employee Pension Plan.”
|
86
The following table sets forth certain information regarding all equity-based compensation awards outstanding as of December 31, 2017 by the Named Officers:
Outstanding Equity Awards At Fiscal Year-end
|
|
Option Awards
|
Stock Awards
|
||||||||||||||||||||||||||||||||||
|
Name
|
Number of
Securities
Underlying
Unexercised
Options
Exercisable
(#)
|
Number of
Securities
Underlying
Unexercised
Options
Unexercisable
(#)
|
Equity
Incentive
Plan
Awards:
Number of
Securities
Underlying
Unexercised
Unearned
Options (#)
|
Option
Exercise
Price
($)
|
Option
Expiration
Date
|
Number
of
Shares or
Units of
Stock
that
Have
Not
Vested
(#)
|
Market
Value of
Shares or
Units of
Stock
that
Have
Not Vested
($) (1)
|
Equity
Incentive
Plan
Awards:
Number
of
Unearned
Shares,
Units or
Other
Rights
that
Have Not
Vested
(#)
|
Equity
Incentive
Plan
Awards:
Market
or Payout
Value of
Unearned
Shares,
Units or
Other
Rights
That
Have Not
Vested
($)
|
|||||||||||||||||||||||||||
|
Stephen G. Berman
|
—
|
—
|
—
|
—
|
—
|
679,612
|
1,597,088
|
—
|
—
|
|||||||||||||||||||||||||||
|
|
||||||||||||||||||||||||||||||||||||
|
John J. McGrath
|
—
|
—
|
—
|
—
|
—
|
194,175
|
456,311
|
—
|
—
|
|||||||||||||||||||||||||||
|
|
||||||||||||||||||||||||||||||||||||
|
Joel M. Bennett
|
—
|
—
|
—
|
—
|
—
|
57,087
|
134,154
|
—
|
—
|
|||||||||||||||||||||||||||
|
(1)
|
The product of (x) $2.35 (the closing sale price of the common stock on December 29, 2017) multiplied by (y) the number of unvested restricted shares outstanding.
|
The following table sets forth certain information regarding amount realized upon the vesting and exercise of any equity-based compensation awards during 2017 by the Named Officers:
Options Exercises And Stock Vested-2017
|
|
Option Awards
|
Stock Awards
|
||||||||||||||
|
Name
|
Number of
Shares
Acquired on
Exercise (#)
|
Value
Realized on
Exercise
($)
|
Number of
Shares
Acquired on
Vesting (#)
|
Value
Realized on
Vesting ($)
|
||||||||||||
|
Stephen G. Berman
|
—
|
—
|
—
|
—
|
||||||||||||
|
|
||||||||||||||||
|
John J. McGrath
|
—
|
—
|
—
|
—
|
||||||||||||
|
|
||||||||||||||||
|
Joel M. Bennett
|
—
|
—
|
—
|
—
|
||||||||||||
87
Potential Payments upon Termination or Change in Control
The following tables describe potential payments and other benefits that would have been received by each Named Officer at, following or in connection with any termination, including, without limitation, resignation, severance, retirement or a constructive termination of such Named Officer, or a change in control of our Company or a change in such Named Officer’s responsibilities on December 31, 2017. The potential payments listed below assume that there is no earned but unpaid base salary at December 31, 2017.
Stephen G. Berman
|
|
Upon
Retirement
|
Quits For
“Good
Reason”
(2)
|
Upon
Death
|
Upon
“Disability”
(3)
|
Termination
Without
“Cause”
|
Termination
For “Cause”
(4)
|
Involuntary
Termination
In
Connection
with Change
of
Control(5)
|
|||||||||||||||||||||
|
Base Salary
|
$
|
―
|
$
|
4,425,000
|
$
|
―
|
$
|
―
|
$
|
4,425,000
|
$
|
―
|
$
|
5,373,918
|
(6)
|
|||||||||||||
|
Restricted Stock -
Performance-Based
|
―
|
―
|
―
|
―
|
―
|
―
|
―
|
|||||||||||||||||||||
|
Annual Cash Incentive
Award (1)
|
―
|
―
|
―
|
―
|
―
|
―
|
―
|
|||||||||||||||||||||
88
|
|
(1) Assumes that if the Named Officer is terminated on December 31, 2017, they were employed through the end of the incentive period.
|
|
|
|
|
|
(2) Defined as (i) our violation or failure to perform or satisfy any material covenant, condition or obligation required to be performed or satisfied by us, or (ii) the material change in the nature, titles or scope of the duties, obligations, rights or powers of the Named Officer’s employment resulting from any action or failure to act by us.
|
|
|
|
|
|
(3) Defined as a Named Officer’s inability to perform his duties by reason of any disability or incapacity (due to any physical or mental injury, illness or defect) for an aggregate of 180 days in any consecutive 12-month period.
|
|
|
|
|
|
(4) Defined as (i) the Named Officer’s conviction of, or entering a plea of guilty or nolo contendere (which plea is not withdrawn prior to its approval by the court) to, a felony offense and either the Named Officer’s failure to perfect an appeal of such conviction prior to the expiration of the maximum period of time within which, under applicable law or rules of court, such appeal may be perfected or, if he does perfect such an appeal, the sustaining of his conviction of a felony offense on appeal; or (ii) the determination by our Board of Directors, after due inquiry, based upon convincing evidence, that the Named Officer has:
|
|
|
(A) committed fraud against, or embezzled or misappropriated funds or other assets of, our Company (or any subsidiary);
|
|
|
|
|
|
(B) violated, or caused our Company (or any subsidiary) or any of our officers, employees or other agents, or any other individual or entity to violate, any material law, rule, regulation or ordinance, or any material written policy, rule or directive of our Company or our Board of Directors;
|
|
|
|
|
|
(C) willfully, or because of gross or persistent inaction, failed properly to perform his duties or acted in a manner detrimental to, or adverse to our interests; or
|
|
|
|
|
|
(D) violated, or failed to perform or satisfy any material covenant, condition or obligation required to be performed or satisfied by him under his employment agreement with us;
|
and that, in the case of any violation or failure referred to in clause (B), (C) or (D), above, such violation or failure has caused, or is reasonably likely to cause, us to suffer or incur a substantial casualty, loss, penalty, expense or other liability or cost.
|
|
(5) Section 280G of the Code disallows a company’s tax deduction for what are defined as “excess parachute payments” and Section 4999 of the Code imposes a 20% excise tax on any person who receives excess parachute payments. As discussed above, Mr. Berman is entitled to certain payments upon termination of his employment, including termination following a change in control of our Company. Under the terms of his employment agreement (see “ - Employment Agreements”), Mr. Berman is not entitled to any payments that would be an excess parachute payment, and such payments are to be reduced by the least amount necessary to avoid the excise tax. Accordingly, our tax deduction would not be disallowed under Section 280G of the Code, and no excise tax would be imposed under Section 4999 of the Code.
|
|
|
|
|
|
(6) Under the terms of Mr. Berman’s employment agreement (see “ - Employment Agreements”), if a change of control occurs and within two years thereafter Mr. Berman is terminated without “Cause” or quits for “Good Reason”, then he has the right to receive a payment equal to 2.99 times his then current base amount as defined in the Code (which was $1,797,297 in 2017).
|
John J. McGrath
|
|
Upon
Retirement
|
Quits For
“Good
Reason”
(2)
|
Upon
Death
|
Upon
“Disability”
(3)
|
Termination
Without
“Cause”
|
Termination
For “Cause”
(4)
|
Involuntary
Termination
In
Connection
with Change
of
Control(5)
|
|||||||||||||||||||||
|
Base Salary
|
$
|
―
|
$
|
2,070,000
|
$
|
―
|
$
|
―
|
$
|
2,070,000
|
$
|
―
|
$
|
2,070,000
|
(6)
|
|||||||||||||
|
Restricted Stock -
Performance-Based
|
―
|
―
|
―
|
―
|
―
|
―
|
―
|
|||||||||||||||||||||
|
Annual Cash Incentive
Award (1)
|
―
|
―
|
―
|
―
|
―
|
―
|
―
|
|||||||||||||||||||||
|
|
(1) Assumes that if the Named Officer is terminated on December 31, 2017, they were employed through the end of the incentive period.
|
89
|
|
|
|
|
(2) Defined as (i) our violation or failure to perform or satisfy any material covenant, condition or obligation required to be performed or satisfied by us, or (ii) the material change in the nature, titles or scope of the duties, obligations, rights or powers of the Named Officer’s employment resulting from any action or failure to act by us.
|
|
|
|
|
|
(3) Defined as a Named Officer’s inability to perform his duties by reason of any disability or incapacity (due to any physical or mental injury, illness or defect) for an aggregate of 180 days in any consecutive 12-month period.
|
|
|
|
|
|
(4) Defined as (i) the Named Officer’s conviction of, or entering a plea of guilty or nolo contendere (which plea is not withdrawn prior to its approval by the court) to, a felony offense and either the Named Officer’s failure to perfect an appeal of such conviction prior to the expiration of the maximum period of time within which, under applicable law or rules of court, such appeal may be perfected or, if he does perfect such an appeal, the sustaining of his conviction of a felony offense on appeal; or (ii) the determination by our Board of Directors, after due inquiry, based on convincing evidence, that the Named Officer has:
|
|
|
(A) committed fraud against, or embezzled or misappropriated funds or other assets of, our Company (or any subsidiary);
|
|
|
|
|
|
(B) violated, or caused our Company (or any subsidiary) or any of our officers, employees or other agents, or any other individual or entity to violate, any material law, rule, regulation or ordinance, or any material written policy, rule or directive of our Company or our Board of Directors;
|
|
|
|
|
|
(C) willfully, or because of gross or persistent inaction, failed properly to perform his duties or acted in a manner detrimental to, or adverse to our interests; or
|
|
|
|
|
|
(D) violated, or failed to perform or satisfy any material covenant, condition or obligation required to be performed or satisfied by him under his employment agreement with us;
|
and that, in the case of any violation or failure referred to in clause (B), (C) or (D), above, such violation or failure has caused, or is reasonably likely to cause, us to suffer or incur a substantial casualty, loss, penalty, expense or other liability or cost.
90
|
|
(5) Section 280G of the Code disallows a company’s tax deduction for what are defined as “excess parachute payments” and Section 4999 of the Code imposes a 20% excise tax on any person who receives excess parachute payments. As discussed above, Mr. McGrath is entitled to certain payments upon termination of his employment, including termination following a change in control of our Company. Under the terms of his employment agreement (see “ - Employment Agreements”), Mr. McGrath is not entitled to any payments that would be an excess parachute payment, and such payments are to be reduced by the least amount necessary to avoid the excise tax. Accordingly, our tax deduction would not be disallowed under Section 280G of the Code, and no excise tax would be imposed under Section 4999 of the Code.
|
|
|
|
|
|
(6) Under the terms of Mr. McGrath’s employment agreement (see “ - Employment Agreements”), if a change of control occurs and within two years thereafter Mr. McGrath is terminated without “Cause” or quits for “Good Reason”, then he has the right to receive a payment equal to the greater of two times his then current base salary or the payments due for the remainder of the term of his employment agreement.
|
Joel M. Bennett
|
|
Upon
Retirement
|
Quits For
“Good
Reason”
(2)
|
Upon
Death
|
Upon
“Disability”
(3)
|
Termination
Without
“Cause”
|
Termination
For “Cause”
(4)
|
Involuntary
Termination
In
Connection
with Change
of
Control(5)
|
|||||||||||||||||||||
|
Base Salary
|
$
|
―
|
$
|
―
|
$
|
―
|
$
|
―
|
$
|
―
|
$
|
―
|
$
|
―
|
(6)
|
|||||||||||||
|
Restricted Stock -
Performance-Based
|
―
|
―
|
―
|
―
|
―
|
―
|
―
|
|||||||||||||||||||||
|
Annual Cash Incentive
Award (1)
|
―
|
―
|
―
|
―
|
―
|
―
|
―
|
|||||||||||||||||||||
|
|
(1) Assumes that if the Named Officer is terminated on December 31, 2017, they were employed through the end of the incentive period.
|
|
|
|
|
|
(2) Defined as (i) our violation or failure to perform or satisfy any material covenant, condition or obligation required to be performed or satisfied by us, or (ii) the material change in the nature, titles or scope of the duties, obligations, rights or powers of the Named Officer’s employment resulting from any action or failure to act by us.
|
|
|
|
|
|
(3) Defined as a Named Officer’s inability to perform his duties by reason of any disability or incapacity (due to any physical or mental injury, illness or defect) for an aggregate of 180 days in any consecutive 12-month period.
|
|
|
|
|
|
(4) Defined as (i) the Named Officer’s conviction of, or entering a plea of guilty or nolo contendere (which plea is not withdrawn prior to its approval by the court) to, a felony offense and either the Named Officer’s failure to perfect an appeal of such conviction prior to the expiration of the maximum period of time within which, under applicable law or rules of court, such appeal may be perfected or, if he does perfect such an appeal, the sustaining of his conviction of a felony offense on appeal; or (ii) the determination by our Board of Directors, after due inquiry, based on convincing evidence, that the Named Officer has:
|
|
|
(A) committed fraud against, or embezzled or misappropriated funds or other assets of, our Company (or any subsidiary);
|
|
|
|
|
|
(B) violated, or caused our Company (or any subsidiary) or any of our officers, employees or other agents, or any other individual or entity to violate, any material law, rule, regulation or ordinance, or any material written policy, rule or directive of our Company or our Board of Directors;
|
|
|
|
|
|
(C) willfully, or because of gross or persistent inaction, failed properly to perform his duties or acted in a manner detrimental to, or adverse to our interests; or
|
|
|
|
|
|
(D) violated, or failed to perform or satisfy any material covenant, condition or obligation required to be performed or satisfied by him under his employment agreement with us;
|
and that, in the case of any violation or failure referred to in clause (B), (C) or (D), above, such violation or failure has caused, or is reasonably likely to cause, us to suffer or incur a substantial casualty, loss, penalty, expense or other liability or cost.
91
|
|
(5) Section 280G of the Code disallows a company’s tax deduction for what are defined as “excess parachute payments” and Section 4999 of the Code imposes a 20% excise tax on any person who receives excess parachute payments. As discussed above, Mr. Bennett is entitled to certain payments upon termination of his employment, including termination following a change in control of our Company. Under the terms of his employment agreement (see “Employment Agreements”), Mr. Bennett is not entitled to any payments that would be an excess parachute payment, and such payments are to be reduced by the least amount necessary to avoid the excise tax. Accordingly, our tax deduction would not be disallowed under Section 280G of the Code, and no excise tax would be imposed under Section 4999 of the Code.
|
|
|
|
|
|
(6) Under the terms of Mr. Bennett’s employment agreement (see “Employment Agreements”), if a change of control occurs and within two years thereafter Mr. Bennett is terminated without “Cause” or quits for “Good Reason”, then he has the right to receive a payment equal to the greater of two times his then current base salary or the payments due for the remainder of the term of his employment agreement.
|
92
Compensation of Directors
Analogous to our executive compensation philosophy, it is our desire to similarly compensate our non-employee directors for their services in a way that will serve to attract and retain highly qualified members. As changes in the securities laws require greater involvement by, and places additional burdens on, a company’s directors it becomes even more necessary to locate and retain highly qualified directors. As such, after consulting with Lipis Consulting Inc., the Compensation Committee developed and the Board approved a structure for the compensation package of our non-employee directors so that the total compensation package of our non-employee directors would be at approximately the median total compensation package for non-employee directors in our peer group.
In December 2009, our board of directors, after consulting with our prior consultant, changed the compensation package for non-employee directors as of January 1, 2010 by (i) increasing the annual cash stipend to $75,000, (ii) eliminating meeting fees for attendance at both board and committee meetings, (iii) increasing the annual fees paid to committee chairs and the members of the audit committee, (iv) decreasing by $25,000 the value of the annual grant of restricted shares of our common stock to $100,000 and (v) imposing minimum shareholding requirements. Specifically, the chair of the audit committee receives an annual fee of $30,000, each member of the audit committee receives a $15,000 annual fee (including the chair), the chair of the compensation committee and the nominating and governance committee each receives an annual fee of $15,000 and each member of such committees (including the chair) receives an annual fee of $10,000. Newly-elected non-employee directors will receive a portion of the foregoing annual consideration, prorated according to the portion of the year in which they serve in such capacity.
In February 2010 our board determined the terms for the minimum shareholding requirements. Pursuant to the new minimum shareholding requirements, each director will be required to hold shares with a value equal to at least two times the average annual cash stipend paid to the director during the prior two calendar years. In determining the value of a director’s shareholdings, each option, whether or not in the money, will count as ½ share. To illustrate: if an average director wishes to sell shares in 2018, he will have to hold shares with a market value of at least $215,000 prior to and following any sale of shares calculated as of the date of the sale, such $215,000 minimum calculated by taking the average cash stipend of $107,500 paid during the prior two years multiplied by two.
The following table sets forth the compensation we paid to our non-employee directors for our fiscal year ended December 31, 2017:
Director Compensation
|
Name
|
Year
|
Fees
Earned
or Paid in
Cash
($)
|
Stock
Awards
($)
|
Option
Awards
($)
|
Non-Equity
Incentive
Plan
Compensation
($)
|
Change in
Pension Value
and
Nonqualified
Deferred
Compensation
Earnings
($)
|
All Other
Compensation
($)
|
Total
($)
|
||||||||||||||||||||||||
|
Murray L. Skala
|
2017
|
75,000
|
99,519
|
(1
|
) |
—
|
—
|
—
|
—
|
174,519
|
||||||||||||||||||||||
|
Rex H. Poulsen
|
2017
|
165,000
|
99,519
|
(1
|
) |
—
|
—
|
—
|
—
|
264,519
|
||||||||||||||||||||||
|
Michael S. Sitrick
|
2017
|
125,000
|
99,519
|
(1
|
) |
—
|
—
|
—
|
—
|
224,519
|
||||||||||||||||||||||
|
Alexander Shoghi
|
(2
|
) |
2017
|
86,301
|
86,551
|
(4
|
) |
—
|
—
|
—
|
—
|
172,852
|
||||||||||||||||||||
|
Michael J. Gross
|
2017
|
125,000
|
99,519
|
(1
|
) |
—
|
—
|
—
|
—
|
224,519
|
||||||||||||||||||||||
|
Zhao Xiaoquiang
|
(3
|
) |
2017
|
51,164
|
66,195
|
(5
|
) |
117,359
|
||||||||||||||||||||||||
|
|
(1) The value of the shares was determined by taking the product of (a) 19,324 shares of restricted stock multiplied by (b) $5.15, the last sales price of our common stock on January 1, 2016, as reported by Nasdaq, the date prior to the date the shares were granted, all of which shares vested on January 1, 2018.
|
|
|
|
|
(2) Mr. Shoghi was reappointed to the Board on February 20, 2017.
|
|
|
|
|
|
(3) Mr. Xiaoquiang was appointed to the Board on April 27, 2017.
|
|
|
|
(4) The value of the shares was determined by taking the product of (a) 16,806 shares of restricted stock multiplied by (b) $5.15, the last sales price of our common stock on February 17, 2017, as reported by Nasdaq, the date prior to the date the shares were granted, all of which shares vested on January 1, 2018.
|
|
(5) The value of the shares was determined by taking the product of (a) 13,319 shares of restricted stock multiplied by (b) $4.97, the last sales price of our common stock on April 26, 2017, as reported by Nasdaq, the date prior to the date the shares were granted, all of which shares vested on January 1, 2018.
|
93
Employment Agreements and Termination of Employment Arrangements
In March 2003 we amended and restated our employment agreement with Mr. Berman and we entered into a new amended and restated agreement with Mr. Berman on November 11, 2010. We entered into a new employment agreement with Mr. Bennett on October 31, 2011. We entered into an emended employment agreement with Mr. McGrath on August 23, 2011 when he became our Chief Operating Officer.
94
On November 11, 2010 we entered into a second amended and restated employment agreement with Stephen Berman, our President, Chief Executive Officer and Chief Operating Officer. This agreement extended the term of the 2003 agreement to December 31, 2015 from its current termination date of December 31, 2010. The new amended and restated agreement also provides, among other things, new provisions for (i) an annual salary of $1,140,000 in 2011 and annual increases thereafter at the discretion of the Board but no less than $25,000; (ii) an annual restricted stock award of $500,000 of our common stock commencing January 1, 2011, subject to vesting in equal installments through January 1, 2017, except that the vesting of each annual $500,000 award is conditioned on EPS (defined as our net income per share of our common stock, calculated on a fully diluted basis) for the fiscal year in which the shares are issued being equal to minimum EPS as follows: $1.41 for 2011, $1.45 for 2012, $1.49 for 2013, $1.54 for 2014, and $1.59 for 2015. If the minimum EPS vesting condition for the first tranche is not met, then the $500,000 grant lapses, but if the vesting condition is satisfied for the first tranche of the $500,000 grant, then each subsequent tranche of the $500,000 grant will vest; (iii) an annual performance bonus as follows: (x) 2010 bonus (previously established in March 2010) remains unchanged except that 20% of the bonus will be paid in restricted stock which will vest in six equal annual installments of 14.5% of the number of shares, the first on the date in 2011 that the bonus is determined to have been earned, and a seventh and final installment of 13% of the shares on January 1, 2017, and (y) for years commencing January 1, 2011, an amount equal to up to 200% of base salary, to be paid in stock and cash (20-40% in stock, in the percentages set forth on Exhibit E to the agreement), bonus criteria using “Adjusted” EPS growth (as defined in the agreement) to be determined by our Compensation Committee in the first quarter of each fiscal year, except that Adjusted EPS criteria (but not vesting) for 2011 shall range from $1.37 - $1.78 as stated in Exhibit D to the agreement, and shares will vest in equal annual installments commencing with the date the Bonus for a fiscal year is determined to have been earned and thereafter on January 1 in each subsequent year until the final installment on January 1, 2017, and (z) an additional bonus equal to 100% of base salary to be paid entirely in restricted stock; the criteria and vesting schedules to be determined by our Compensation Committee in the first fiscal quarter of each year, using criteria to be selected by such Committee which are in its discretion such as grown in net sales, return on invested capital, growth in free cash flow, total shareholder return (or any combination); (iv) restrictions on sale of our securities such that he cannot sell any shares of our common stock if his shares remaining after a sale are not equal to at least three times his then base salary; (v) life insurance in the amount of $1.5 million; (vi) severance if we terminate the agreement without cause (as defined in the agreement) or Mr. Berman terminates it for Good Reason (as defined in the agreement), in an amount equal to the base salary at termination date multiplied by the number of years and partial years remaining in the term; and (vii) restrictive covenants, change of control provisions and our ownership of certain intellectual property.
On October 19, 2011, we clarified our employment agreement with Mr. Berman and entered into a letter amendment dated October 20, 2011. The clarification corrects and clarifies certain cross references relating to Mr. Berman’s entitlement to severance upon a qualifying termination following a change of control (as defined in his employment agreement). It also clarifies that a material change in the nature and/or scope of the duties, obligations, rights or powers of his employment under the agreement would be deemed to include his ceasing to be the Chief Executive Officer and President of a publicly traded company (one of the standards for determining whether Mr. Berman has “good reason” to terminate his employment under his employment agreement), and further provides that Mr. Berman's post-change of control severance benefits shall be payable upon a qualifying termination of employment within a two year period following a change of control (the agreement originally provided for a one year period).
On September 21, 2012, in connection with our entry into agreements dated September 10, 2012 with NantWorks LLC to form DreamPlay Toys LLC and DreamPlay LLC, all Delaware limited liability companies, we entered into Amendment Number One to Mr. Berman’s Second Amended and Restated Employment Agreement dated November 11, 2012 (as previously modified by the October 20, 2011 letter amendment); DreamPlay Toys LLC will develop, market and sell toys and consumer products incorporating NantWorks’ proprietary iD (iDream) image recognition technology and DreamPlay LLC’s business is the extension of such image recognition technology to non-toy consumer products and applications.
The following description modifies and supersedes, to the extent inconsistent with, the disclosure in the preceding paragraphs. The term of Mr. Berman’s employment agreement has been extended to December 31, 2018 and provides (i) that commencing on January 1, 2013 the amount of the annual restricted stock award shall increase to up to $3.5M, with the vesting of each annual grant to be determined by the Compensation Committee based upon performance criteria it establishes during the first quarter of the year of grant; (ii) commencing with 2013 Mr. Berman can earn an annual performance bonus described below. Part of the annual performance bonus in an amount not exceeding 300% of that year’s base salary can be earned based upon financial and non-financial factors determined annually by the Compensation Committee during the first quarter of each year. The other part of the additional annual performance bonus can be earned in an amount equal to one-half of the cash distributions we receive from DreamPlay LLC, subject to satisfaction of the following three conditions: (1) we have positive net income after deducting the aggregate annual performance bonus, (2) the aggregate annual performance bonus cannot exceed 2.9% of our net income for such year except that if our net income exceeds $385,000 for the year the percentage limitation shall be reduced to 1% and if our net income for the year exceeds $770,000 the percentage limitation is reduced to 0.5% and (3) we have received an aggregate of at least $15 million of net income from DreamPlay Toys LLC and DreamPlay LLC. The amendment also provides (i) that the portion of the annual performance bonus up to an amount equal to 200% of that year’s base salary shall be paid in cash, and any excess over 200% of such base salary shall be paid in shares of restricted stock vesting in equal quarterly installments with the initial installment vesting upon grant and the balance over three years following the award date; (ii) for a life insurance policy of $5 million or such lesser amount we can obtain for an annual premium of up to $10,000; (iii) for the reimbursement of legal fees in negotiating this amendment of up to $25,000, (iv) that the full amount of the payments and benefits payable in the event of a Change in Control (as defined in the employment agreement) shall be paid, even if it triggers an excise tax imposed by the tax code if the net after-tax amount would still be greater than reducing the total payments and benefits to avoid such excise tax, and (vi) the term “Good Reason Event” has been expanded to include a change in the composition of our board of directors where the majority of the directors were not in office on September 15, 2012. This provision would have been triggered if management’s slate of nominee directors at our 2014 Annual Meeting were elected so prior to such Meeting, Mr. Berman waived such provision of his employment agreement with respect to the slate of nominees at such Meeting. Mr. Berman waived the provision again following our 2015 Annual Meeting.
95
On June 7, 2016 we amended the employment agreement between us and Mr. Stephen G. Berman, our Chairman, CEO and President, and entered into Amendment Number Two to Mr. Berman’s Second Amended and Restated Employment Agreement dated November 11, 2010 (the “Employment Agreement”). The terms of Mr. Berman’s Employment Agreement have been amended as follows: (i) extension of the term until December 31, 2020; (ii) increase of Mr. Berman’s Base Salary to $1,450,000.00 effective June 1, 2016, subject to annual increases thereafter as determined by the Compensation Committee, with annual minimum increases of $25,000.00 commencing January 1, 2017; (iii) modification of the performance and vesting standards for each $3.5 million Annual Restricted Stock Grant (“Annual Stock Grant”) provided for under Section 3(b) of the Employment Agreement, effective as of January 1, 2017, so that 40% ($1.4 million) of each Annual Stock Grant will be subject to time vesting in four equal annual installments over four years and 60% ($2.1 million) of each Annual Stock Grant will be subject to three year “cliff vesting” (i.e. payment is based upon performance at the close of the three year performance period), with vesting of each Annual Stock Grant determined by the following performance measures: (a) total shareholder return as compared to the Russell 2000 Index (weighted 50%), (b) net revenue growth as compared to our peer group (weighted 25%) and (c) EBITDA growth as compared to our peer group (weighted 25%); (iv) modification of the performance measures for award of the Annual Performance Bonus equal to up to 300% of Base Salary (“Annual Bonus”) provided for under Section 3(d) of the Employment Agreement, effective as of January 1, 2017, so that the performance measures will be based only upon net revenues and EBITDA, each performance measure weighted 50%, and with the specific performance criteria applicable to each Annual Bonus determined by the Compensation Committee during the first quarter of each fiscal year; and (v) provision of health and dental insurance coverage for Mr. Berman’s children in the event of his death during the term of the Employment Agreement.
On August 23, 2011 we entered into an amended employment agreement with John J. (Jack) McGrath whereby he became our Chief Operating Officer. The amended employment agreement, which ran through December 31, 2013, provided for an annual salary of $600,000; an annual increase over the prior year’s base salary of at least $15,000; an annual award of $75,000 of restricted stock, subject to vesting in equal installments over three years, provided, however, that the initial vesting of the first installment of each year’s award is conditioned on “Adjusted” EPS (as defined in the amended agreement) for the fiscal year in which the shares are issued being equal to minimum “Adjusted” EPS as follows: 2011 vesting condition: greater of $1.41 or 3% higher than 2010 “Adjusted” EPS; 2012 vesting: greater of $1.45 or 3% higher than 2011“Adjusted” EPS; and 2013 vesting condition: greater of $1.49 or 3% higher than “Adjusted” 2012 EPS. The amended agreement also provides for an annual bonus opportunity of up to 125% of salary payable 50% in cash and 50% in restricted stock (with a four year vesting) based upon “Adjusted” EPS growth. Bonus targets for 2011 ranged from $1.37 -$1.78. Commencing in 2012 the bonus targets are to be set by the Compensation Committee.
96
On May 15, 2013, we entered a Second Amendment to Mr. John a/k/a Jack McGrath’s Employment Agreement dated March 4, 2010 (effective January 1, 2010), as previously amended on August 23, 2011. Mr. McGrath’s employment agreement was amended as follows: (i) the term was extended by two years to December 31, 2015; (ii) it provides for two annual grants of $75,000 worth of restricted shares of common stock of the Company (A) the first such grant to be made on January 1, 2014, which grant shall vest in three annual equal installments as set forth on Exhibit B to the amendment, provided that Adjusted EPS (as defined in the employment agreement) for the 2014 fiscal year is equal to the greater of $1.05 or an amount that is 3% higher than the actual Adjusted EPS for the 2014 fiscal year; (B) the second grant to be made on January 1, 2015, which grant shall vest in two annual equal installments as set forth on Exhibit B to the amendment, provided that Adjusted EPS for the 2015 fiscal year is equal to the greater of $2.10 or an amount that is 3% higher than the actual Adjusted EPS for the 2015 fiscal year; and (iii) in each of 2014 and 2015 Mr. McGrath can earn an annual performance bonus of up to 125% of his then base salary based upon such financial (e.g., growth in EPS, return on equity, growth in the Common Stock price) and non-financial (e.g., organic growth, personnel development) factors determined annually by the Compensation Committee of the Board of Directors during the first quarter of the relevant calendar year for which the annual performance bonus criteria are being established; one-half of such bonus shall be paid in cash, and one-half in shares of restricted common stock, which shall vest in two equal annual installments, the first installment of which shall vest on the Annual Performance Bonus Award Date (as defined in the employment agreement) and thereafter on January 1 in each subsequent year until the final vesting date on January 1, 2017. On June 11, 2016, we extended Mr. McGrath’s employment agreement through December 31, 2017.
On September 29, 2016 we entered into a Fourth Amendment to the employment agreement between us and Mr. John a/k/a Jack McGrath, our Chief Operating Officer, dated March 4, 2010 (which was effective January 1, 2010) (the “Employment Agreement”). The terms of Mr. McGrath’s Employment Agreement were amended as follows: (i) extension of the term until December 31, 2020; (ii) modification of the performance and vesting standards for each Annual Restricted Stock Grant (“Annual Stock Grant”) provided for under Section 3(d) of the Employment Agreement, effective as of January 1, 2017, as follows: each Annual Stock Grant will be equal to $1 million, and 40% ($0.4 million) of each Annual Stock Grant will be subject to time vesting in four equal annual installments over four years, and 60% ($0.6 million) of each Annual Stock Grant will be subject to three year “cliff vesting” (i.e. vesting is based upon satisfaction of the performance measures at the close of the three year performance period), determined by the following performance measures: (A) total shareholder return as compared to the Russell 2000 Index (weighted 50%), (B) net revenue growth as compared to our peer group (weighted 25%) and (C) growth in Earnings Before Interest, Taxes, Depreciation and Amortization (“EBITDA”) as compared to our peer group (weighted 25%); and (iii) modification of the Annual Performance Bonus (“Annual Bonus”) provided for under Section 3(e) of the Employment Agreement, effective as of January 1, 2017, as follows: the Annual Bonus will be equal to up to 125% of Base Salary, and the actual amount will be determined by performance measures based upon net revenues and EBITDA, each performance measure weighted 50%, and with the specific performance criteria applicable to each Annual Bonus determined by the Compensation Committee during the first quarter of each fiscal year, and payable in cash (up to 100% of Base Salary) and shares of our common stock (any excess over 100% of Base Salary) with the shares of stock vesting over three years in equal quarterly installments.
On October 21, 2011, we entered into an employment agreement with Joel M. Bennett, the Company’s Executive Vice President and Chief Financial Officer, with a term ending on December 31, 2013. Pursuant to the new agreement, Mr. Bennett is entitled to an annual base salary of $420,000, to be increased annually by at least $15,000 over the prior year’s base salary, and will be eligible at the discretion of the Compensation Committee to receive bonuses or other compensation in the form of cash or equity-based awards upon the achievement of performance goals determined by the Board or the Compensation Committee. In the event of Mr. Bennett’s termination of employment by the Company without “cause” or by Mr. Bennett for “good reason,” in each case other than within two years following a “change in control” (each as defined in the agreement), Mr. Bennett would be entitled to receive, in addition to accrued benefits, cash severance equal to the amount of base salary payable for the remainder of his term and continuation of his medical, hospitalization and dental insurance through the remainder of his term. In the event of Mr. Bennett’s termination of employment by the Company without “cause” or by Mr. Bennett for “good reason” within two years following a “change of control,” Mr. Bennett would be entitled to receive, in addition to accrued benefits, severance equal to the higher of two times his annual base salary and his base salary payable for the remainder of his term.
On February 18, 2014, we entered into a Continuation and Extension of Term of Employment Agreement with respect to Mr. Joel M. Bennett’s Employment Agreement dated October 21, 2011 such that it is deemed to have been renewed and continued from January 1, 2014 without interruption and it was extended through December 31, 2015. On June 11, 2016, we extended Mr. Bennett’s employment agreement through December 31, 2017.
On December 27, 2017, we entered into a letter agreement with our Chief Financial Officer, Joel M. Bennett (the “Letter Agreement”), which provides for Mr. Bennett’s stepping down from his position. In order to arrange for a smooth transition, Mr. Bennett will continue as our Chief Financial Officer until completion of our annual report for the 2017 fiscal year or such earlier date that a successor has been named and transitioned to the office of Chief Financial Officer. The Letter Agreement provides, among other things, that Mr. Bennett will receive a severance payment in a maximum amount of up to 15 month’s salary, accelerated vesting of a portion of his restricted stock units and continued health care coverage for up to 12 months. The Letter Agreement also requires Mr. Bennett to comply with confidentiality, non-disparagement and cooperation obligations.
The foregoing is only a summary of the material terms of our employment agreements with the Named Officers. For a complete description, copies of such agreements are annexed herein in their entirety as exhibits or are otherwise incorporated herein by reference.
97
On October 19, 2011, our Board of Directors approved the material terms of and adoption of our Company’s Change in Control Severance Plan (the “Severance Plan”), which applies to certain of our key employees. None of our named executive officers participate in the Severance Plan. The Severance Plan provides that if, within the two year period immediately following the “change in control” date (as defined in the Severance Plan), a participant has a qualifying termination of employment, the participant will be entitled to severance equal to a multiple of monthly base salary, which multiple is the greater of (i) the number of months remaining in the participant’s term of employment under his or her employment agreement and (ii) a number ranging between 12 and 18; accelerated vesting of all unvested equity awards; and continued health care coverage for the number of months equal to the multiple used to determine the severance payment.
Employee Benefits Plan
We sponsor for our U.S. employees (including the Named Officers), a defined contribution plan under Section 401(k) of the Internal Revenue Code. The Plan provided that employees may defer up to 50% of their annual compensation subject to annual dollar limitations, and that we will make a matching contribution equal to 100% of each employee’s deferral, up to 5% of the employee’s annual compensation. Company matching contributions, which vest immediately, totaled $2.2 million, $2.5 million and $2.3 million for 2015, 2016 and 2017, respectively.
Compensation Committee Interlocks and Insider Participation
None of our executive officers has served as a director or member of a compensation committee (or other board committee performing equivalent functions) of any other entity, one of whose executive officers served as a director or a member of our Compensation Committee.
98
Item 12. Security Ownership of Certain Beneficial Owners and Management and Related Stockholder Matters
The following table sets forth certain information as of March 4, 2018 with respect to the beneficial ownership of our common stock by (1) each person known by us to own beneficially more than 5% of the outstanding shares of our common stock, (2) each of our directors, (3) each of our executive officers named in the Summary Compensation Table set forth under the caption “Executive Compensation”, below, and (4) all our directors and executive officers as a group.
|
Name and Address of
Beneficial Owner (1)(2) |
Amount
and Nature of Beneficial Ownership (3) |
Percent of
Outstanding Shares (4) |
||||||
|
Dr. Patrick Soon-Shiong
|
2,500,676 (5
|
)
|
8.6
|
%
|
||||
|
Oasis Management Company Ltd.
|
2,506,930(6
|
)
|
8.3
|
|||||
|
Wolverine Asset Management, LLC
|
1,712,746(7
|
)
|
5.5
|
|||||
|
Renaissance Technologies LLC
|
2,069,500(8
|
)
|
7.1
|
|||||
|
Hongkong Meisheng Cultural Company Limited
|
5,239,538(9
|
)
|
18.0
|
|||||
|
Stephen G. Berman
|
2,311,086(10
|
)
|
7.9
|
|||||
|
Rex H. Poulsen
|
120,590(11
|
)
|
*
|
|||||
|
Michael S. Sitrick
|
133,217(12
|
)
|
*
|
|||||
|
Murray L. Skala
|
156,545(13
|
)
|
*
|
|||||
|
Joel M. Bennett
|
42,682
|
*
|
||||||
|
John J. McGrath
|
643,085(14
|
)
|
2.2
|
|||||
|
Alexander Shoghi
|
70,928(15
|
)
|
*
|
|||||
|
Michael J. Gross
|
63,367(16
|
)
|
*
|
|||||
|
Zhao Xiaoqiang
|
54,899(17
|
)
|
*
|
|||||
|
All directors and executive officers as a group (9 persons)
|
3,596,399(18
|
)
|
12.3
|
|||||
|
*
|
Less than 1% of our outstanding shares.
|
|
(1)
|
Unless otherwise indicated, such person’s address is c/o JAKKS Pacific, Inc., 2951 28th Street, Santa Monica, California 90405.
|
|
|
|
|
(2)
|
The number of shares of common stock beneficially owned by each person or entity is determined under the rules promulgated by the Securities and Exchange Commission. Under such rules, beneficial ownership includes any shares as to which the person or entity has sole or shared voting power or investment power. The percentage of our outstanding shares is calculated by including among the shares owned by such person any shares which such person or entity has the right to acquire within 60 days after March 4, 2018. The inclusion herein of any shares deemed beneficially owned does not constitute an admission of beneficial ownership of such shares.
|
|
|
|
|
(3)
|
Except as otherwise indicated, exercises sole voting power and sole investment power with respect to such shares.
|
|
|
|
|
(4)
|
Does not include any shares of common stock issuable upon the conversion of $42.7 million of our 4.25% convertible senior notes due 2018, initially convertible at the rate of 114.3674 shares of common stock per $1,000 principal amount at issuance of the notes (but subject to adjustment under certain circumstances as described in the notes) nor any shares of common stock issuable upon the conversion of $113.0 million of our 4.875% convertible senior notes due 2020, initially convertible at the rate of 103.7613 shares of common stock per $1,000 principal amount at issuance of the notes (but subject to adjustment under certain circumstances as described in the notes). Does include 3,112,840 shares of common stock repurchased by the Company under a prepaid forward purchase contract under which no shares have been returned to the Company.
|
|
|
|
|
(5)
|
The address of Dr. Patrick Soon-Shiong is 10182 Culver Blvd., Culver City, CA 90232. Except for 239,622 shares, all of the shares are owned jointly with California Capital Z, LLC. All the information presented in this Item with respect to this beneficial owner was extracted solely from the Schedule 13D/A filed on July 26, 2016.
|
|
(6)
|
The address of Oasis Management Company Ltd. is c/o Oasis Management (Hong Kong) LLC, 21/F Man Yee Building, 68Des Voeux Road, Central, Hong Kong. Possesses shared voting and dispositive power of such shares. 1,063,553 of such shares underlie convertible notes. All the information presented in this Item with respect to this beneficial owner was extracted solely from the Schedule 13D/A filed on November 8, 2017.
|
|
|
|
|
(7)
|
The address of Wolverine Asset Management, LLC is175 West Jackson Blvd., Suite 340, Chicago Illinois 60604. Possesses joint voting and dispositive power with respect to 1,704,622 of such shares (the balance is held jointly by other related parties) and all which shares (except for 8,124 shares) underlie presently convertible notes. All the information presented in this Item with respect to this beneficial owner was extracted solely from the Schedule 13G/A filed on February 14, 2018.
|
99
|
(8)
|
The address of Renaissance Technologies LLC is 800 Third Avenue, New York, NY 10022. All the information presented in this Item with respect to this beneficial owner was extracted solely from the Schedule 13G/A filed on February 14, 2018.
|
|
|
|
|
(9)
|
The address of Hongkong Meisheng Culture Company Ltd is Room 1901, 19/F, Lee Garden One, 33 Hysan Avenue, Causeway Bay, Hong Kong. Zhao Xiaoqiang, executive director of this entity, is a director of the Company. Possesses shared voting and dispositive power with respect to all of such shares. All the information presented in this Item with respect to this beneficial owner was extracted solely from the Schedule 13D/A filed on January 26, 2018.
|
|
|
|
|
(10)
|
Includes 1,489,362 shares of common stock issued on January 1, 2018 pursuant to the terms of Mr. Berman’s January 1, 2003 Employment Agreement (as amended to date), which shares are further subject to the terms of our January 1, 2018 Restricted Stock Award Agreement with Mr. Berman (the “Berman Agreement”). The Berman Agreement provides that Mr. Berman will forfeit his rights to some or all 1,489,362 shares unless certain conditions precedent are met prior to January 1, 2019, as described in the Berman Agreement, whereupon the forfeited shares will become authorized but unissued shares of our common stock. Certain of these shares may be restricted from transfer pursuant to the minimum stock ownership provisions adopted by the Company's Board of Directors.
|
|
|
|
|
(11)
|
Includes 120,590 shares of Common Stock issued pursuant to our 2002 Stock Award and Incentive Plan pursuant to which 41,580 of such shares may not be sold, mortgaged, transferred or otherwise encumbered prior to January 1, 2019. Certain of these shares may be restricted from transfer pursuant to the minimum stock ownership provisions adopted by the Company's Board of Directors.
|
|
|
|
|
(12)
|
Consists of 133,217 shares of Common Stock issued pursuant to our 2002 Stock Award and Incentive Plan, pursuant to which 41,580 of such shares may not be sold, mortgaged, transferred or otherwise encumbered prior to January 1, 2019. Certain of these shares may be restricted from transfer pursuant to the minimum stock ownership provisions adopted by the Company's Board of Directors.
|
|
(13)
|
Consists of 156,545 shares of Common Stock issued pursuant to our 2002 Stock Award and Incentive Plan, pursuant to which 41,580 of such shares may not be sold, mortgaged, transferred or otherwise encumbered prior to January 1, 2019. Certain of these shares may be restricted from transfer pursuant to the minimum stock ownership provisions adopted by the Company's Board of Directors.
|
|
|
|
|
(14)
|
Includes 425,532 shares of common stock issued on January 1, 2018 pursuant to the terms of Mr. McGrath’s March 4, 2010 Employment Agreement (as amended to date), which shares are further subject to the terms of our January 1, 2018 Restricted Stock Award Agreement with Mr. McGrath (the “McGrath Agreement”). The McGrath Agreement provides that Mr. McGrath will forfeit his rights to some or all 425,532 shares unless certain conditions precedent are met prior to January 1, 2019, as described in the McGrath Agreement, whereupon the forfeited shares will become authorized but unissued shares of our common stock. Certain of these shares may be restricted from transfer pursuant to the minimum stock ownership provisions adopted by the Company's Board of Directors.
|
|
|
|
|
(15)
|
Consists of 70,928 shares of common stock issued pursuant to our 2002 Stock Award and Incentive Plan, pursuant to which 41,580 of such shares may not be sold, mortgaged, transferred or otherwise encumbered prior to January 1, 2019. Certain of these shares may be restricted from transfer pursuant to the minimum stock ownership provisions adopted by the Company's Board of Directors.
|
|
|
|
|
(16)
|
Consists of 63,367 shares of common stock issued pursuant to our 2002 Stock Award and Incentive Plan, pursuant to which 41,580 of such shares may not be sold, mortgaged, transferred or otherwise encumbered prior to January 1, 2019. Certain of these shares may be restricted from transfer pursuant to the minimum stock ownership provisions adopted by the Company's Board of Directors.
|
|
|
|
|
(17)
|
Consists of 54,899 shares of common stock issued pursuant to our 2002 Stock Award and Incentive Plan, pursuant to which 41,580 of such shares may not be sold, mortgaged, transferred or otherwise encumbered prior to January 1, 2019. Certain of these shares may be restricted from transfer pursuant to the minimum stock ownership provisions adopted by the Company's Board of Directors. Does not include the 5,239,538 shares owned by Hongkong Meisheng Cultural Company Limited reported above, of which entity Zhao Xiaoqiang is executive director.
|
|
(18)
|
Does not include the 5,239,538 shares owned by Hongkong Meisheng Cultural Company Limited reported above, of which entity Zhao Xiaoqiang is executive director.
|
100
(a) Transactions with Related Persons
One of our directors, Murray L. Skala, is a partner in the law firm of Feder Kaszovitz LLP, which has performed, and is expected to continue to perform, legal services for us. In 2016 and 2017, we incurred approximately $3.2 million and $2.2 million, respectively, for legal fees and reimbursable expenses payable to that firm. As of December 31, 2016 and 2017, legal fees and reimbursable expenses of $1.6 million and $0.5 million, respectively, were payable to this law firm.
The owner of NantWorks, our DreamPlay Toys joint venture partner, beneficially owns 8.9% of the Company’s outstanding common stock. Pursuant to the joint venture agreements, the Company is obligated to pay NantWorks a preferred return on joint venture sales.
For the years ended and as of December 31, 2016 and 2017 preferred returns of nil and nil, respectively, were earned and payable to NantWorks. As of December 31, 2016 and 2017, the Company has a receivable from NantWorks in the amount of $0.6 million and nil, respectively.
Hongkong Meisheng Cultural Company Limited (“Meisheng”) owns 18% of our outstanding common stock. On January 25, 2018, Meisheng submitted to our Board of Directors a letter containing a non-binding proposal (“Expression of Interest”) expressing Meisheng’s interest in acquiring additional shares of our common stock for $2.95 per share. Upon completion of the transaction, Meisheng’s shareholdings and voting rights would increase to 51%. The Expression of Interest states that it is subject to due diligence, and to approval by Meisheng’s Board of Directors, shareholders and Chinese regulatory authorities. Our Board of Directors has authorized a Special Committee comprised solely of independent directors to evaluate the Expression of Interest.
We are one of the largest customers of Meisheng and we have entered into two joint ventures in Hong Kong, China, with Meisheng which generated a loss for us of $87,000 in 2015 and income of $6,000 and $59,000 in 2016 and 2017, respectively. Zhao Xiaoqiang, the control person of Meisheng, is one of our directors.
A director of the Company is a portfolio manager at Oasis Management. In August 2017, the Company agreed with Oasis Management and Oasis Investments II Master Fund Ltd., the holder of approximately $21.5 million face amount of its 4.25% convertible senior notes due in 2018, to exchange and extend the maturity date of these notes to November 1, 2020. The transaction closed on November 7, 2017.
(b) Review, Approval or Ratification of Transactions with Related Persons
Pursuant to our Ethical Code of Conduct (a copy of which may be found on our website, www.jakks.com), all of our employees are required to disclose to our General Counsel, the Board of directors or any committee established by the Board of Directors to receive such information, any material transaction or relationship that reasonably could be expected to give rise to actual or apparent conflicts of interest between any of them, personally, and us. In addition, our Ethical Code of Conduct also directs all employees to avoid any self-interested transactions without full disclosure. This policy, which applies to all of our employees, is reiterated in our Employee Handbook which states that a violation of this policy could be grounds for termination. In approving or rejecting a proposed transaction, our General Counsel, Board of Directors or designated committee will consider the facts and circumstances available and deemed relevant, including but not limited to, the risks, costs and benefits to us, the terms of the transactions, the availability of other sources for comparable services or products, and, if applicable, the impact on director independence. Upon concluding their review, they will only approve those agreements that, in light of known circumstances, are in or are not inconsistent with, our best interests, as they determine in good faith.
(c) Director Independence
For a description of our Board of Directors and its compliance with the independence requirements therefore as promulgated by the Securities and Exchange Commission and Nasdaq, see “Item 10- Directors, Executive Officers and Corporate Governance”.
Before our principal accountant is engaged by us to render audit or non-audit services, as required by the rules and regulations promulgated by the Securities and Exchange Commission and/or Nasdaq, such engagement is approved by the Audit Committee.
The following are the fees of BDO USA, LLP, our principal accountant, for the two years ended December 31, 2017, for services rendered in connection with the audit for those respective years (all of which have been pre-approved by the Audit Committee):
|
|
2016
|
2017
|
||||||
|
Audit Fees
|
$
|
1,215,000
|
$
|
1,468,199
|
||||
|
Audit Related Fees
|
49,306
|
32,292
|
||||||
|
Tax Fees
|
7,555
|
2,103
|
||||||
|
|
$
|
1,271,861
|
$
|
1,502,594
|
||||
101
Audit Fees consist of the aggregate fees for professional services rendered for the audit of our annual financial statements and the reviews of the financial statements included in our Forms 10-Q and for any other services that were normally provided by our auditors in connection with our statutory and regulatory filings or engagements.
Audit Related Fees consist of the aggregate fees billed for professional services rendered for assurance and related services that were reasonably related to the performance of the audit or review of our financial statements and were not otherwise included in Audit Fees. These fees primarily relate to statutory audit requirements and audits of employee benefit plans.
Tax Fees consist of the aggregate fees billed for professional services rendered for tax consulting. Included in such Tax Fees were fees for consultancy and review of foreign tax filings.
All Other Fees consist of the aggregate fees billed for products and services provided by our auditors and not otherwise included in Audit Fees, Audit Related Fees or Tax Fees.
Our Audit Committee has considered whether the provision of the non-audit services described above is compatible with maintaining our auditors’ independence and determined that such services are appropriate.
102
PART IV
The following documents are filed as part of this Annual Report on Form 10-K:
|
(1)
|
●
|
Financial Statements (included in Item 8):
|
|
|
|
|
|
|
●
|
Reports of Independent Registered Public Accounting Firm
|
|
|
|
|
|
|
●
|
Consolidated Balance Sheets as of December 31, 2016 and 2017
|
|
|
|
|
|
|
●
|
Consolidated Statements of Operations for the years ended December 31, 2015, 2016 and 2017
|
|
|
|
|
|
|
●
|
Consolidated Statements of Other Comprehensive Income (Loss) for the years ended December 31, 2015, 2016 and 2017
|
|
|
|
|
|
|
●
|
Consolidated Statements of Stockholders’ Equity for the years ended December 31, 2015, 2016 and 2017
|
|
|
|
|
|
|
●
|
Consolidated Statements of Cash Flows for the years ended December 31, 2015, 2016 and 2017
|
|
|
|
|
|
|
●
|
Notes to Consolidated Financial Statements
|
|
|
|
|
|
(2)
|
|
Financial Statement Schedules (included in Item 8):
|
|
|
|
|
|
|
●
|
Schedule II — Valuation and Qualifying Accounts
|
|
|
|
|
|
(3)
|
|
Exhibits:
|
|
Exhibit
Number
|
Description
|
|
|
3.1
|
Amended and Restated Certificate of Incorporation of the Company (1)
|
|
|
3.2
|
Amended and Restated By-Laws of the Company (2)
|
|
|
4.1
|
Indenture dated July 24, 2013 by and between the Registrant and Wells Fargo Bank, N.A (3)
|
|
|
4.2
|
Form of 4.25% Senior Convertible Note (3)
|
|
|
4.2.1
|
Convertible Senior Note due November 7, 2020 (24)
|
|
|
4.3
|
Credit Agreement dated as of March 27, 2014 by and among Registrant and its US wholly-owned subsidiaries and General Electric Capital Corporation (10)
|
|
|
4.3.1
|
Fourth Amendment to Credit Agreement dated as of June 5, 2015 by and among Registrant and its US wholly-owned subsidiaries and General Electric Capital Corporation (20)
|
|
|
4.4
|
Revolving Loan Note dated March 27, 2014 by Registrant and its US wholly-owned subsidiaries in favor of General Electric Capital Corporation (10)
|
|
|
4.5
|
Indenture dated June 9, 2014 by and between the Registrant and Wells Fargo Bank, N.A (19)
|
|
|
4.6
|
Form of 4.875% Senior Convertible Note (19)
|
|
|
10.1.1
|
Third Amended and Restated 1995 Stock Option Plan (4)
|
|
|
10.1.2
|
1999 Amendment to Third Amended and Restated 1995 Stock Option Plan (5)
|
|
|
10.1.3
|
2000 Amendment to Third Amended and Restated 1995 Stock Option Plan (6)
|
|
|
10.1.4
|
2001 Amendment to Third Amended and Restated 1995 Stock Option Plan (7)
|
|
|
10.2
|
2002 Stock Award and Incentive Plan (8)
|
|
|
10.2.1
|
2008 Amendment to 2002 Stock Award and Incentive Plan (9)
|
|
|
10.4.1
|
Second Amended and Restated Employment Agreement between the Company and Stephen G. Berman dated as of November 11, 2010 (11)
|
|
|
10.4.2
|
Clarification Letter dated October 20, 2011 with respect to Mr. Berman’s Second Amended and Restated employment agreement (12)
|
|
|
10.4.3
|
Amendment Number One dated September 21, 2012 to Mr. Berman’s Second Amended and Restated Employment Agreement (13)
|
|
|
10.4.4
|
Amendment Number Two dated June 7, 2016 to Mr. Berman’s Second Amended and Restated Employment Agreement (21)
|
103
|
10.5
|
Office Lease dated November 18, 1999 between the Company and Winco Maliview Partners (14)
|
|
|
10.6
|
Form of Restricted Stock Agreement (10)
|
|
|
10.7
|
Employment Agreement between the Company and Joel M. Bennett, dated October 21, 2011 (12)
|
|
|
10.7.1
|
Continuation and Extension of Term of Employment Agreement Between JAKKS Pacific, Inc. and Joel M. Bennett dated February 18, 2014 (15)
|
|
|
10.7.2
|
Amendment Extending Term of Employment Agreement Between JAKKS Pacific, Inc. and Joel M. Bennett dated June 11, 2015 (20)
|
|
|
10.7.3
|
Letter Agreement dated December 27, 2017 between the Company and Joel M. Bennett (23)
|
|
|
10.8
|
Employment Agreement between the Company and John a/k/a Jack McGrath, dated March 4, 2010 (16)
|
|
|
10.8.1
|
First Amendment to Employment Agreement between the Company and John a/k/a Jack McGrath, dated August 23, 2011 (16)
|
|
|
10.8.2
|
Second Amendment to Employment Agreement between the Company and John a/k/a Jack McGrath, dated May 15, 2013 (17)
|
|
|
10.8.3
|
Third Amendment to Employment Agreement between the Company and John a/k/a Jack McGrath, dated June 11, 2015 (20)
|
|
|
10.8.4
|
Fourth Amendment to Employment Agreement between the Company and John a/k/a Jack McGrath, dated September 29, 2016 (22)
|
|
| 10.8.5 | Fifth Amendment to Employment Agreement between the Company and John a/k/a Jack McGrath, dated February 28, 2018 (*) | |
|
10.9
|
Exchange Agreement dated November 7, 2017 between the Company and Oasis Investments II Master Fund Ltd. (24)
|
|
|
14
|
Code of Ethics (18)
|
|
|
21
|
Subsidiaries of the Company (*)
|
|
| 23.1 | Consent of BDO USA, LLP (*) | |
|
31.1
|
Rule 13a-14(a)/15d-14(a) Certification of Stephen G. Berman (*)
|
|
|
31.2
|
Rule 13a-14(a)/15d-14(a) Certification of Joel M. Bennett (*)
|
|
|
32.1
|
Section 1350 Certification of Stephen G. Berman (*)
|
|
|
32.2
|
Section 1350 Certification of Joel M. Bennett (*)
|
|
|
101.INS
|
XBRL Instance Document
|
|
|
101.SCH
|
XBRL Taxonomy Extension Schema Document
|
|
|
101.CAL
|
XBRL Taxonomy Extension Calculation Linkbase Document
|
|
|
101.DEF
|
XBRL Taxonomy Extension Definition Linkbase Document
|
|
|
101.LAB
|
XBRL Taxonomy Extension Label Linkbase Document
|
|
|
101.PRE
|
XBRL Taxonomy Extension Presentation Linkbase Document
|
104
|
(1)
|
Filed previously as Appendix 2 to the Company’s Schedule 14A Proxy Statement, filed August 23, 2002, and incorporated herein by reference.
|
|
(2)
|
Filed previously as an exhibit to the Company’s Current Report on Form 8-K filed October 21, 2011, and incorporated herein by reference.
|
|
(3)
|
Filed previously as an exhibit to the Company's Current Report on Form 8-K filed July 24, 2013 and incorporated herein by reference.
|
|
(4)
|
Filed previously as Appendix A to the Company’s Schedule 14A Proxy Statement, filed June 23, 1998, and incorporated herein by reference
|
|
(5)
|
Filed previously as an exhibit to the Company’s Registration Statement on Form S-8 (Reg. No. 333-90055), filed November 1, 1999, and incorporated herein by reference.
|
|
(6)
|
Filed previously as an exhibit to the Company’s Registration Statement on Form S-8 (Reg. No. 333-40392), filed June 29, 2000, and incorporated herein by reference.
|
|
(7)
|
Filed previously as Appendix B to the Company’s Schedule 14A Proxy Statement, filed June 11, 2001, and incorporated herein by reference.
|
|
(8)
|
Filed previously as an exhibit to the Company’s Registration Statement on Form S-8 (Reg. No. 333-101665), filed December 5, 2002, and incorporated herein by reference.
|
|
(9)
|
Filed previously as an exhibit to the Company’s Schedule 14A Proxy Statement, filed August 20, 2008, and incorporated herein by reference.
|
|
(10)
|
Filed previously as an exhibit to the Company’s Current Report on Form 8-K filed April 2, 2014 and incorporated herein by reference.
|
|
(11)
|
Filed previously as an exhibit to the Company’s Current Report on Form 8-K filed November 17, 2010, and incorporated herein by reference.
|
|
(12)
|
Filed previously as an exhibit to the Company’s Current Report on Form 8-K filed October 21, 2011, and incorporated herein by reference.
|
|
(13)
|
Filed previously as an exhibit to the Company’s Current Report on Form 8-K filed September 25, 2012, and incorporated herein by reference.
|
|
(14)
|
Filed previously as an exhibit to the Company’s Annual Report on Form 10-K for its fiscal year ended December 31, 1999, filed March 30, 2000, and incorporated herein by reference.
|
|
(15)
|
Filed previously as an exhibit to the Company’s Current Report on Form 8-K filed February 20, 2014, and incorporated herein by reference.
|
|
(16)
|
Filed previously as an exhibit to the Company’s Current Report on Form 8-K filed August 24, 2011, and incorporated herein by reference.
|
|
(17)
|
Filed previously as an exhibit to the Company’s Current Report on Form 8-K filed May 21, 2013, and incorporated herein by reference.
|
|
(18)
|
Filed previously as an exhibit to the Company’s Annual Report on Form 10-K for its fiscal year ended December 31, 2003, filed March 15, 2004, and incorporated herein by reference.
|
|
(19)
|
Filed previously as an exhibit to the Company’s Current Report on Form 8-K filed June 9, 2014 and incorporated herein by reference.
|
|
(20)
|
Filed previously as an exhibit to the Company’s Current Report on Form 8-K filed June 16, 2015 and incorporated herein by reference.
|
|
(21)
|
Filed previously as an exhibit to the Company’s Current Report on Form 8-K filed June 9, 2016 and incorporated herein by reference.
|
|
(22)
|
Filed previously as an exhibit to the Company’s Current Report on Form 8-K filed September 30, 2016 and incorporated herein by reference.
|
|
(23)
|
Filed previously as an exhibit to the Company’s Current Report on Form 8-K filed December 29, 2017 and incorporated herein by reference.
|
|
(24)
|
Filed previously as an exhibit to the Company’s Current Report on Form 8-K filed November 11, 2017 and incorporated herein by reference.
|
|
(*)
|
Filed herewith.
|
Item 16. Form 10-K Summary
None.
105
Pursuant to the requirements of Section 13 or 15(d) of the Securities Exchange Act of 1934, the registrant has duly caused this report to be signed on its behalf by the undersigned, thereunto duly authorized.
|
Dated: March 16, 2018
|
JAKKS PACIFIC, INC.
|
|
|
|
|
|
|
|
By:
|
/s/ STEPHEN G. BERMAN
|
|
|
|
Stephen G. Berman
|
|
|
|
Chief Executive Officer
|
Pursuant to the requirements of the Securities Exchange Act of 1934, this report has been signed below by the following persons on behalf of the registrant and in the capacities and on the dates indicated.
|
Signature
|
|
Title
|
|
Date
|
|
/s/ STEPHEN G. BERMAN
|
|
Director and
|
|
March 16, 2018
|
|
Stephen G. Berman
|
|
Chief Executive Officer
|
|
|
|
|
|
|
|
|
|
|
|
Chief Financial Officer
|
|
|
|
/s/ JOEL M. BENNETT
|
|
(Principal Financial Officer and
|
|
March 16, 2018
|
|
Joel M. Bennett
|
|
Principal Accounting Officer)
|
|
|
|
|
|
|
|
|
|
/s/ REX H. POULSEN
|
|
Director
|
|
March 16, 2018
|
|
Rex H. Poulsen
|
|
|
|
|
|
|
|
|
|
|
|
/s/ MICHAEL S. SITRICK
|
|
Director
|
|
March 16, 2018
|
|
Michael S. Sitrick
|
|
|
|
|
|
|
|
|
|
|
|
/s/ MURRAY L. SKALA
|
|
Director
|
|
March 16, 2018
|
|
Murray L. Skala
|
|
|
|
|
|
/s/ ALEXANDER SHOGHI
|
Director
|
March 16, 2018
|
||
|
Alexander Shoghi
|
||||
|
|
|
|
|
|
|
/s/ MICHAEL J. GROSS
|
|
Director
|
|
March 16, 2018
|
|
Michael J. Gross
|
|
|
|
|
| /s/ ZHAO XIAOQUIANG | Director |
March 16, 2018
|
||
| Zhao Xiaoquiang | ||||
106
EXHIBIT INDEX
|
Exhibit
Number
|
Description
|
| 10.8.5 | Fifth Amendment to Employment Agreement between the Company and John a/k/a Jack McGrath, dated February 28, 2018 (*) |
| 23.1 | Consent of BDO USA, LLP (*) |
|
101.INS
|
XBRL Instance Document
|
|
101.SCH
|
XBRL Taxonomy Extension Schema Document
|
|
101.CAL
|
XBRL Taxonomy Extension Calculation Linkbase Document
|
|
101.DEF
|
XBRL Taxonomy Extension Definition Linkbase Document
|
|
101.LAB
|
XBRL Taxonomy Extension Label Linkbase Document
|
|
101.PRE
|
XBRL Taxonomy Extension Presentation Linkbase Document
|
107
|
(1)
|
Filed previously as Appendix 2 to the Company’s Schedule 14A Proxy Statement, filed August 23, 2002, and incorporated herein by reference.
|
|
(2)
|
Filed previously as an exhibit to the Company’s Current Report on Form 8-K filed October 21, 2011, and incorporated herein by reference.
|
|
(3)
|
Filed previously as an exhibit to the Company's Current Report on Form 8-K filed July 24, 2013 and incorporated herein by reference.
|
|
(4)
|
Filed previously as Appendix A to the Company’s Schedule 14A Proxy Statement, filed June 23, 1998, and incorporated herein by reference
|
|
(5)
|
Filed previously as an exhibit to the Company’s Registration Statement on Form S-8 (Reg. No. 333-90055), filed November 1, 1999, and incorporated herein by reference.
|
|
(6)
|
Filed previously as an exhibit to the Company’s Registration Statement on Form S-8 (Reg. No. 333-40392), filed June 29, 2000, and incorporated herein by reference.
|
|
(7)
|
Filed previously as Appendix B to the Company’s Schedule 14A Proxy Statement, filed June 11, 2001, and incorporated herein by reference.
|
|
(8)
|
Filed previously as an exhibit to the Company’s Registration Statement on Form S-8 (Reg. No. 333-101665), filed December 5, 2002, and incorporated herein by reference.
|
|
(9)
|
Filed previously as an exhibit to the Company’s Schedule 14A Proxy Statement, filed August 20, 2008, and incorporated herein by reference.
|
|
(10)
|
Filed previously as an exhibit to the Company’s Current Report on Form 8-K filed April 2, 2014 and incorporated herein by reference.
|
|
(11)
|
Filed previously as an exhibit to the Company’s Current Report on Form 8-K filed November 17, 2010, and incorporated herein by reference.
|
|
(12)
|
Filed previously as an exhibit to the Company’s Current Report on Form 8-K filed October 21, 2011, and incorporated herein by reference.
|
|
(13)
|
Filed previously as an exhibit to the Company’s Current Report on Form 8-K filed September 25, 2012, and incorporated herein by reference.
|
|
(14)
|
Filed previously as an exhibit to the Company’s Annual Report on Form 10-K for its fiscal year ended December 31, 1999, filed March 30, 2000, and incorporated herein by reference.
|
|
(15)
|
Filed previously as an exhibit to the Company’s Current Report on Form 8-K filed February 20, 2014, and incorporated herein by reference.
|
|
(16)
|
Filed previously as an exhibit to the Company’s Current Report on Form 8-K filed August 24, 2011, and incorporated herein by reference.
|
|
(17)
|
Filed previously as an exhibit to the Company’s Current Report on Form 8-K filed May 21, 2013, and incorporated herein by reference.
|
|
(18)
|
Filed previously as an exhibit to the Company’s Annual Report on Form 10-K for its fiscal year ended December 31, 2003, filed March 15, 2004, and incorporated herein by reference.
|
|
(19)
|
Filed previously as an exhibit to the Company’s Current Report on Form 8-K filed June 9, 2014 and incorporated herein by reference.
|
|
(20)
|
Filed previously as an exhibit to the Company’s Current Report on Form 8-K filed June 16, 2015 and incorporated herein by reference.
|
|
(21)
|
Filed previously as an exhibit to the Company’s Current Report on Form 8-K filed June 9, 2016 and incorporated herein by reference.
|
|
(22)
|
Filed previously as an exhibit to the Company’s Current Report on Form 8-K filed September 30, 2016 and incorporated herein by reference.
|
|
(23)
|
Filed previously as an exhibit to the Company’s Current Report on Form 8-K filed December 29, 2017 and incorporated herein by reference.
|
|
(24)
|
Filed previously as an exhibit to the Company’s Current Report on Form 8-K filed November 11, 2017 and incorporated herein by reference.
|
|
(*)
|
Filed herewith.
|
108