Attached files
| file | filename |
|---|---|
| EX-32.1 - EXHIBIT 32.1 - Houston Wire & Cable CO | s109314_ex32-1.htm |
| EX-31.2 - EXHIBIT 31.2 - Houston Wire & Cable CO | s109314_ex31-2.htm |
| EX-31.1 - EXHIBIT 31.1 - Houston Wire & Cable CO | s109314_ex31-1.htm |
UNITED STATES
SECURITIES AND EXCHANGE COMMISSION
Washington, D.C. 20549
FORM 10-K
| x | ANNUAL REPORT PURSUANT TO SECTION 13 OR 15(d) OF THE SECURITIES EXCHANGE ACT OF 1934 |
For the Fiscal Year ended December 31, 2017
or
| ¨ | TRANSITION REPORT PURSUANT TO SECTION 13 OR 15(d) OF THE SECURITIES EXCHANGE ACT OF 1934 |
For the transition period from to
Commission File Number: 000-52046

| Delaware | 36-4151663 |
| (State or other jurisdiction of incorporation or organization) | (I.R.S. Employer Identification No.) |
|
10201 North Loop East Houston, Texas |
77029 |
| (Address of principal executive offices) | (Zip Code) |
(713) 609-2100
(Registrant’s telephone number, including area code)
Securities registered pursuant to Section 12(b) of the Act:
| Title of Each Class | Name of Each Exchange on Which Registered | |
| Common stock, par value $0.001 per share | The NASDAQ Stock Market |
Securities registered pursuant to Section 12(g) of the Act: None
Indicate by check mark if the registrant is a well-known seasoned issuer, as defined in Rule 405 of the Securities Act. YES ¨ NO x
Indicate by check mark if the registrant is not required to file reports pursuant to Section 13 or Section 15(d) of the Act. YES ¨ NO x
Indicate by check mark whether the registrant (1) has filed all reports required to be filed by Section 13 or 15(d) of the Securities Exchange Act of 1934 during the preceding 12 months (or for such shorter period that the Registrant was required to file such reports), and (2) has been subject to such filing requirements for the past 90 days. YES x NO ¨
Indicate by check mark whether the registrant has submitted electronically and posted on its corporate Web site, if any, every Interactive Data File required to be submitted and posted pursuant to Rule 405 of Regulation S-T (§ 232.405 of this chapter) during the preceding 12 months (or for such shorter period that the registrant was required to submit and post such files). YES ☒ NO ☐
Indicate by check mark if disclosure of delinquent filers pursuant to Item 405 of Regulation S-K (§ 229.405 of this chapter) is not contained herein, and will not be contained, to the best of Registrant’s knowledge, in definitive proxy or information statements incorporated by reference in Part III of this Form 10-K or any amendment to this Form 10-K. ☐
Indicate by check mark whether the registrant is a large accelerated filer, an accelerated filer, a non-accelerated filer, a smaller reporting company, or emerging growth company. See definitions of “large accelerated filer,” “accelerated filer,” “smaller reporting company,” and “emerging growth company” in Rule 12b-2 of the Exchange Act.
| Large Accelerated Filer ¨ | Accelerated Filer x | Non-Accelerated Filer ¨ | Smaller reporting company ¨ |
| Emerging growth company ¨ |
If an emerging growth company, indicate by check mark if the registrant has elected not to use the extended transition period for complying with any new or revised financial accounting standards provided pursuant to Section 13(a) of the Exchange Act. ¨
Indicate by check mark whether the registrant is a shell company (as defined in Rule 12b-2 of the Exchange Act). YES ¨ NO x
The aggregate market value of the voting stock (common stock) held by non-affiliates of the registrant as of June 30, 2017 was $84,392,594.
At March 1, 2018, there were 16,482,383 shares of the registrant’s common stock, $.001 par value per share, outstanding.
DOCUMENTS INCORPORATED BY REFERENCE
Part III of this report incorporates by reference specific portions of the registrant’s definitive Proxy Statement relating to the Annual Meeting of Stockholders to be held on May 8, 2018.
HOUSTON WIRE & CABLE COMPANY
Form 10-K
For the Fiscal Year Ended December 31, 2017
INDEX
| 2 |
Overview
We are a provider of industrial products including electrical and mechanical wire and cable, industrial fasteners, hardware and related services to the U.S. market. We sell electrical products through wholesale electrical distributors, steel wire rope and synthetic products through rigging wholesalers, fastener products through industrial distributors, and fabricated steel wire rope and synthetic lifting and hardware products to distributors and end users. We provide our customers with a single-source solution by offering a large selection of in-stock items, exceptional customer service and high levels of product expertise.
Our wide product selection and specialized services support our position in the supply chain between manufacturers and the customer. The breadth and depth of wire and cable, fasteners, lifting products and related hardware that we offer requires significant warehousing resources and a large number of SKU’s (stock-keeping units). While manufacturers may have the space and capabilities to maintain a large supply of inventory, we do not believe that any single manufacturer has the breadth and depth of product that we offer. More importantly, manufacturers historically have not offered the services that our customers need, such as complimentary custom cutting, cable coiling, custom manufactured slings and harnesses, paralleling, bundling, striping, cable management for large capital projects, and same day shipment, and do not have multiple distribution centers across the nation.
Our Cable Management Program addresses our customers’ requirement for sophisticated and efficient just-in-time product management for large capital projects. This program entails purchasing and storing dedicated inventory so our customers have immediate product availability for the duration of their projects. Advantages of this program include extra pre-allocated safety stock, firm pricing, zero cable surplus and just-in-time delivery. Used on large construction and capital expansion projects, our Cable Management Program combines the expertise of our cable specialists with dedicated project inventory and superior logistics to allow complex projects to be completed on time, within budget and with minimal residual waste.
History
We were founded in 1975 and have a long history of exceptional customer service, broad product selection and high levels of product expertise. In 1987, we completed our first initial public offering and were subsequently purchased in 1989 by ALLTEL Corporation and in 1997 by investment funds affiliated with Code, Hennessy & Simmons LLC. In 2006, we completed our second initial public offering. In 2010, we purchased Southwest Wire Rope LP (“Southwest”), its general partner Southwest Wire Rope GP LLC and its wholly owned subsidiary, Southern Wire (“Southern”), and subsequently merged the acquired businesses into our operating subsidiary. On October 3, 2016 we completed the acquisition of Vertex Corporate Holdings, Inc., and its subsidiaries (“Vertex”) from DXP Enterprises. Vertex is a master distributor of industrial fasteners and this acquisition expanded our product offerings to the industrial marketplace that purchases our wire and cable products.
Products
We offer products in most categories of wire and cable, including: continuous and interlocked armor cable; control and power cable; electronic wire and cable; flexible and portable cord; instrumentation and thermocouple cable; lead and high temperature cable; medium voltage cable; premise and category wire and cable, primary and secondary aluminum distribution cable, steel wire rope and wire rope slings, as well as synthetic fiber rope slings, chain, shackles, related hardware and corrosion resistant products including inch and metric bolts, screws, nuts, washers, rivets and hose clamps. We also offer private branded products, including our proprietary brand LifeGuard™, a low-smoke, zero-halogen cable. Our products are used in repair and replacement work, also referred to as Maintenance, Repair and Operations ("MRO"), and related projects, larger-scale projects in the utility, industrial and infrastructure markets and a diverse range of industrial applications including communications, energy, engineering and construction, general manufacturing, marine construction and marine transportation, mining, infrastructure, oilfield services, petrochemical, transportation, utility, wastewater treatment and food and beverage.
Targeted Markets
Our business is driven, in part, by the strength, growth prospects and activity in the end-markets in which our products are used, which are primarily in the continental United States, where we target the utility, industrial and infrastructure markets.
Utility Market. The utility market includes large investor-owned utilities, rural cooperatives and municipal power authorities. While we are not a significant distributor of power lines used for the transmission of electricity today, we have added products to our portfolio that are used in this sector. We continue to sell our core products for the construction of power plants and the related pollution control equipment used to comply with environmental standards as well as plant modernizations implemented to extend the life of power generation facilities. Our customers utilize our cable management services to supply the wire and cable required in the construction of new power plants and upgrading of existing power plants.
| 3 |
Industrial Market. The industrial market is one of the largest segments of the U.S. economy and is comprised of a diverse base of manufacturing and production companies. The largest driver of our success in this market results from the level of U.S. investment in upstream, midstream and downstream oil and gas exploration, transportation and production. We provide a wide variety of products specifically designed for use in manufacturing, metal/mineral, and oil and gas upstream, midstream and downstream markets.
Infrastructure Market. Investments in the development, construction and maintenance of infrastructure markets including education and health care; air, ground and rail transportation; telecommunications, and wastewater are opportunities for our product and service offerings.
Distribution Logistics
We believe that our national distribution presence and value-added services make us an essential partner in the supply chain for our suppliers. We have successfully expanded our business from the original location in Houston, Texas to twenty-one locations nationwide, which includes three third-party logistics providers. Our standard practice is to process customers' orders the same day they are received. Our strategically located distribution centers generally allow for ground delivery nationwide within 24 hours of shipment. Orders are delivered through a variety of distribution methods, including less-than-truck-load, truck-load, air or parcel service providers, direct from supplier and cross-dock shipments. Freight costs are typically borne by our customers. Due to our shipment volume, we have preferred pricing relationships with our contract carriers.
Customers
During 2017, we served approximately 9,000 customers, shipping approximately 46,000 SKU’s to approximately 13,000 customer locations nationwide. No customer represented 10% or more of our 2017 sales.
Suppliers
We obtain products from leading suppliers and believe we have strong relationships with our top suppliers. We source a portion of our products from offshore. While alternative sources are available for the majority of our products, we have strategically concentrated our purchases with our top suppliers in order to maximize product quality, delivery dependability, purchasing efficiencies, and vendor rebates. As a result, in 2017, approximately 50% of our purchases came from five suppliers. We do not believe we are dependent on any one supplier for any of the industrial products that we sell.
Our top five suppliers in 2017 were AmerCable Incorporated, Belden Inc., General Cable Corporation, ICC Cable Corp and Nexans Energy USA, Inc.
Sales
We market our products and related services through an inside sales force situated in our regional offices, a field sales force focused on key geographic markets and regional sales agencies. By operating under a decentralized process, region managers are able to adapt quickly to market-specific occurrences, allowing us to compete effectively with local competitors. We believe the knowledge, experience and tenure of our sales force are critical to serving our fragmented and diverse customer and end-user base.
Competition
The industrial products market remains very competitive and fragmented, with several hundred electrical wire and cable, steel wire rope, and fastener competitors serving this market. The product offerings and levels of service from the other providers of product with whom we compete vary widely at the national, regional or local levels. In addition to the direct competition with other product providers, we also face, on a varying basis, competitors that sell products directly or through multiple distribution channels to end-users or other resellers.
In the markets that we sell our industrial products, competition is primarily based on product line breadth, quality, product availability, service capabilities and price.
| 4 |
Employees
At December 31, 2017, we had 422 employees. Our sales and marketing staff accounted for 189 employees, including 33 field sales personnel, 12 representative sales agencies, and 117 inside sales and technical support personnel.
Fifteen warehouse employees at our Attleboro, Massachusetts location are represented by a labor union. We believe that our employee relations are good.
Website Access
We maintain an internet website at www.houwire.com. We make available, under the “Investor Relations” tab on our website, our annual report on Form 10-K, quarterly reports on Form 10-Q, current reports on Form 8-K, and if applicable, amendments to those reports, as well as proxy and information statements, as soon as reasonably practicable after such documents are electronically filed with or furnished to the Securities and Exchange Commission (the “SEC”). Information contained on our website is not part of, and should not be construed as being incorporated by reference into, this Annual Report on Form 10-K.
Government Regulation
We are subject to regulation by various federal, state and local agencies. We believe we are in compliance in all material respects with existing applicable statutes and regulations affecting environmental issues and our employment, workplace health and workplace safety practices.
| 5 |
In addition to other information in this Annual Report on Form 10-K, the following risk factors should be carefully considered in evaluating our business, because such factors may have a significant impact on our business, operating results, cash flows and financial condition. As a result of the risks set forth below and elsewhere in this Annual Report, actual results could differ materially from those projected in any forward-looking statements.
Downturns in capital spending and cyclicality in the markets we serve have had and could continue to have a material adverse effect on our financial condition and results of operations.
The majority of our products are used in the construction, maintenance, repair and operation of facilities, plants and projects in the communications, energy, engineering and construction, general manufacturing, infrastructure, oil and gas, marine construction, marine transportation, mining, oilfield services, transportation, utility, wastewater treatment and food and beverage industries. The demand for our products and services depends to a large degree on the capital spending levels of end-users in these markets. Many of these end-users defer capital expenditures or cancel projects during economic downturns or periods of uncertainty. In addition, certain of the markets we serve are cyclical, which affects capital spending by end-users in these industries.
We have risks associated with our customers’ access to credit.
Poor credit market conditions may adversely impact the availability of construction and other project financing, upon which many of our customers depend, resulting in project cancellations or delays. Our utility and industrial customers may also face limitations when trying to access the credit markets to fund ongoing operations or capital projects. Credit constraints experienced by our customers may result in lost revenues, reduced gross margins for us and, in some cases, higher than expected bad debt losses.
We have risks associated with inventory.
Our business requires us to maintain substantial levels of inventory. We must identify the right mix and quantity of products to keep in our inventory to fulfill customer orders. Failure to do so could adversely affect our sales and earnings. However, if our inventory levels are too high, we are at risk that unexpected changes in circumstances, such as a shift in market demand, drop in prices or loss of a customer, could have a material adverse impact on the net realizable value of our inventory.
Our operating results are affected by fluctuations in commodity prices.
Copper, steel, aluminum, nickel and petrochemical products are components of the products we sell. Fluctuations in the costs of these and other commodities have historically affected our operating results. If commodity prices decline, the net realizable value of our existing inventory could be reduced, and our gross profit could be adversely affected. To the extent higher commodity prices result in increases in the costs we pay for our products, we attempt to reflect the increase in the prices we charge our customers. While we historically have been able to pass most of these cost increases on to our customers, to the extent we are unable to do so in the future, it could have a material adverse effect on our operating results. In addition, if commodity costs increase, our customers may delay or decrease their purchases of our products.
Our sales are impacted by the level of oil and gas drilling activity.
We estimate that approximately one-third of our sales directly depend upon the level of capital and operating expenditures in the oil and gas industry, including capital and other expenditures in connection with exploration, drilling, production, gathering, transportation, refining and processing operations. Demand for the products we distribute is sensitive to the level of exploration, development and production activity of, and the corresponding capital and other expenditures by, oil and gas companies. A material decline in oil or gas prices, inability to access capital, and consolidation within the industry could all depress levels of exploration, development and production activity and, therefore, could lead to a decrease in our sales due to curtailed capital and MRO expenditures.
If we are unable to maintain our relationships with our customers, it could have a material adverse effect on our financial results.
We rely on customers to purchase our industrial products. The number, size, business strategy and operations of these customers vary widely from market to market. Our success depends heavily on our ability to identify and respond to our customers’ needs.
| 6 |
In 2017, our ten largest customers accounted for approximately 38% of our sales. If we were to lose one or more of our large customers, or if one or more of our large customers were to significantly reduce their purchases from us, and we were unable to replace the lost sales on similar terms, we could experience a significant loss of revenue and profits. In addition, if one or more of our key customers failed or were unable to pay, we could experience a write-off or write-down of the related receivables, which could adversely affect our earnings. We participate with national marketing groups and engage in joint promotional sales activities with the members of those groups. Any permanent exclusion of us from, or refusal to allow us to participate in, such national marketing groups could have a material adverse effect on our sales and our results of operations.
An inability to obtain the products that we distribute could result in lost revenues and reduced profits and damage our relationships with customers.
In 2017, we sourced products from approximately 290 suppliers. However, we have adopted a strategy to concentrate our purchases with a small number of suppliers in order to maximize product quality, delivery dependability, purchasing efficiencies and vendor rebates. As a result, in 2017 approximately 50% of our purchases came from five suppliers. If any of these suppliers changes its sales strategy or decides to terminate its business relationship with us, our sales and earnings could be adversely affected unless and until we were able to establish relationships with suppliers of comparable products. In addition, if we are not able to obtain the products we distribute from either our current suppliers or other competitive sources, we could experience a loss of revenue, reduction in profits and damage to our relationships with our customers. Supply shortages may occur as a result of unanticipated demand or production cutbacks, shortages of raw materials, labor disputes or weather conditions affecting products or shipments, transportation disruptions or other reasons beyond our control. When shortages occur, suppliers often allocate products among their customers, and our allocations might not be adequate to meet our customers' needs.
Loss of key personnel or our inability to attract and retain new qualified personnel could hurt our ability to operate and grow successfully.
Our success is highly dependent upon the services of James L. Pokluda III, our President and Chief Executive Officer, and Nicol G. Graham, our Chief Financial Officer. Our success will continue to depend to a significant extent on our executive officers, key management and sales personnel. We do not have key man life insurance covering any of our executive officers. We may not be able to retain our executive officers, key personnel or attract additional qualified management and sales personnel. The loss of any of our executive officers or our other key management and sales personnel or our inability to recruit and retain qualified personnel could hurt our ability to operate and make it difficult to maintain our market share and to execute our growth strategies.
A change in vendor rebate programs could adversely affect our gross margins and results of operations.
The terms on which we purchase products from many of our suppliers entitle us to receive a rebate based on the volume of our purchases. These rebates effectively reduce our costs for products. If suppliers adversely change the terms of some or all of these programs, the changes may lower our gross margins on products we sell and may have an adverse effect on our operating results.
If we encounter difficulties with our management information systems, including cyber-attacks, we would experience problems managing our business.
We believe our management information systems are a competitive advantage in maintaining a leadership position in the industrial supply industry. We rely upon our management information systems to manage and replenish inventory, determine pricing, fill and ship orders on a timely basis and coordinate our sales and marketing activities. If we experience problems with our management information systems, we could experience product shortages, diminished inventory control or an increase in accounts receivable. Any failure by us to maintain our management information systems could adversely impact our ability to attract and serve customers and would cause us to incur higher operating costs and experience reduced profitability.
An increase in competition could decrease sales or earnings.
We operate in a highly competitive industry. We compete directly with national, regional and local providers of industrial products. Competition is primarily focused in the local service area and is generally based on product line breadth, quality, product availability, service capabilities and price. Some of our existing competitors have, and new market entrants may have, greater financial and marketing resources than we do. To the extent existing or future competitors seek to gain or retain market share by reducing prices, we may be required to lower our prices, thereby adversely affecting our financial results. Existing or future competitors also may seek to compete with us for acquisitions, which could have the effect of increasing the price and reducing the number of suitable acquisitions. Other companies, including our current customers, could seek to compete directly with our private branded products, which could adversely affect our sales of those products and ultimately our financial results. Our existing customers, as well as suppliers, could seek to compete with us by offering services similar to ours, which could adversely affect our market share and our financial results. In addition, competitive pressures resulting from economic conditions and the industry trend toward consolidation could adversely affect our growth and profit margins.
| 7 |
We may not be able to successfully identify acquisition candidates, effectively integrate newly acquired businesses into our operations or achieve expected profitability from our acquisitions.
To supplement our growth, we intend to selectively pursue acquisition opportunities. If we are not successful in finding attractive acquisition candidates that we can acquire on satisfactory terms, or if we cannot complete those acquisitions that we identify, we will not be able to realize the benefit of this growth strategy.
Acquisitions involve numerous possible risks, including unforeseen difficulties in integrating operations, technologies, services, accounting and personnel; the diversion of financial and management resources from existing operations; unforeseen difficulties related to entering geographic regions or target markets where we do not have prior experience; the potential loss of key employees; and the inability to generate sufficient profits to offset acquisition or investment-related expenses. If we finance acquisitions by issuing equity securities or securities convertible into equity securities, our existing stockholders could be diluted, which, in turn, could adversely affect the market price of our stock. If we finance an acquisition with debt, it could result in higher leverage and interest costs. As a result, if we fail to evaluate and execute acquisitions properly, we might not achieve the anticipated benefits of these acquisitions, and we may incur costs in excess of what we anticipate, and goodwill impairments may result.
We are anticipating growth in the businesses we acquired in 2010 and in 2016. However, the Southern reporting unit had impairments of intangibles in 2013 and 2016 and the Southwest reporting unit had a goodwill impairment charge and impairment of intangibles in 2015 as they did not meet their financial objectives. Future goodwill and tradename impairments may result, should the acquired businesses not achieve their currently forecasted growth or profitability targets.
We may be subject to product liability claims that could be costly and time consuming.
We sell industrial products. As a result, from time to time we have been named as defendants in lawsuits alleging that these products caused physical injury or injury to property. We rely on product warranties and indemnities from the product manufacturers, as well as insurance that we maintain, to protect us from these claims. However, if manufacturers' warranties and indemnities and our insurance coverage are not available or inadequate to cover every claim, it could have an adverse effect on our operating results.
Changes to the U.S. tax, tariff and import/export regulations may have a negative effect on our results of operations.
We import a relatively small but growing percentage of our wire and cable products, as well as a significant portion of our hardware products, from foreign manufacturers. Some recent U.S. tax reform proposals could, if enacted, increase the amount of tax paid on imported goods. In addition, the 2016 presidential and congressional elections have created uncertainty about future trade policies, treaties, government regulations and tariffs. Changes in import tariffs or other trade regulations, could have a negative impact on our cash flow, and require us to change our sourcing and supply chain strategies, and adversely affect our profitability.
| 8 |
ITEM 1B. UNRESOLVED STAFF COMMENTS
None.
Facilities
We operate out of twenty-one distribution centers strategically located throughout the United States with approximately 1,011,000 square feet of distribution space. We own three facilities in Houston, Texas, including our corporate headquarters, and two facilities in Louisiana. All of the other facilities are leased, including three from third-party logistics providers. Eighteen of the facilities, in addition to containing inventory for re-sale, house knowledgeable sales staff. We believe that our properties are in good operating condition and adequately serve our current business operations.
From time to time, we are involved in lawsuits that are brought against us in the normal course of business. We are not currently a party to any legal proceedings that we expect, either individually or in the aggregate, to have a material adverse effect on our business or financial condition. We, along with many other defendants, have been named in a number of lawsuits in the state courts of Minnesota, North Dakota, and South Dakota alleging that certain wire and cable which may have contained asbestos caused injury to the plaintiffs who were exposed to this wire and cable. These lawsuits are individual personal injury suits that seek unspecified amounts of money damages as the sole remedy. It is not clear whether the alleged injuries occurred as a result of the wire and cable in question or whether we, in fact, distributed the wire and cable alleged to have caused any injuries. We maintain general liability insurance that, to date, has covered the defense of and all costs associated with these claims. In addition, we did not manufacture any of the wire and cable at issue, and we would rely on any warranties from the manufacturers of such cable if it were determined that any of the wire or cable that we distributed contained asbestos which caused injury to any of these plaintiffs. In connection with ALLTEL's sale of our company in 1997, ALLTEL provided indemnities with respect to costs and damages associated with these claims that we believe we could enforce if our insurance coverage proves inadequate.
ITEM 4. MINE SAFETY DISCLOSURES
Not applicable.
SUPPLEMENTAL ITEM. EXECUTIVE OFFICERS OF THE REGISTRANT
| Name/Office | Age | Business Experience During Last 5 Years | ||
|
James L. Pokluda III President and Chief Executive Officer |
53 | Chief Executive Officer since January 2012 and President since May 2011. Prior thereto, Vice President Sales & Marketing from April 2007 until May 2011. | ||
|
Nicol G. Graham Chief Financial Officer, Treasurer and Secretary |
65 | Chief Financial Officer, Treasurer and Secretary since 1997. |
| 9 |
ITEM 5. MARKET FOR REGISTRANT’S COMMON EQUITY, RELATED STOCKHOLDER MATTERS AND ISSUER PURCHASES OF EQUITY SECURITIES
Our common stock is listed on The NASDAQ Global Market under the symbol “HWCC”. As of January 5, 2018, there were 1,940 holders of record, including participants in security position listings. This figure does not include those beneficial holders whose shares may be held of record by brokerage firms and clearing agencies. The following table lists quarterly information on the price range of our common stock based on the high and low reported sale prices for our common stock as reported by The NASDAQ Global Market for the periods indicated below.
| High | Low | |||||||
| Year ended December 31, 2017: | ||||||||
| First quarter | $ | 8.05 | $ | 6.25 | ||||
| Second quarter | $ | 7.05 | $ | 5.05 | ||||
| Third quarter | $ | 6.25 | $ | 4.70 | ||||
| Fourth quarter | $ | 7.30 | $ | 4.80 | ||||
| Year ended December 31, 2016: | ||||||||
| First quarter | $ | 7.33 | $ | 4.79 | ||||
| Second quarter | $ | 7.71 | $ | 5.11 | ||||
| Third quarter | $ | 6.28 | $ | 5.15 | ||||
| Fourth quarter | $ | 7.30 | $ | 5.10 | ||||
Purchases of Equity Securities by the Issuer and Affiliated Purchasers
The board authorized a stock repurchase program of $25 million in March 2014. The program has no expiration date. Purchases under the stock repurchase program were suspended in November 2016. At December 31, 2017, there was $9.2 million available under the program to repurchase stock.
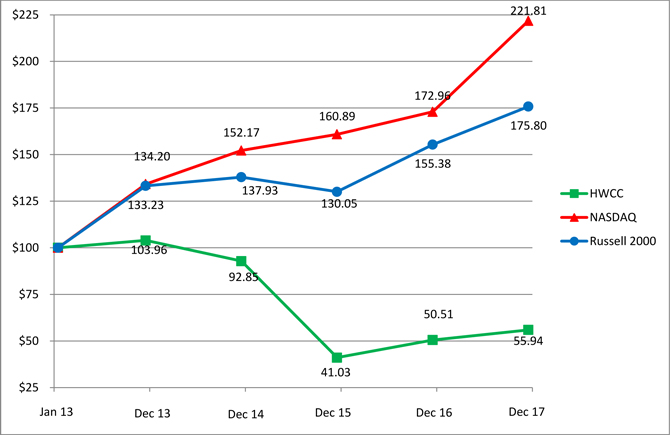
Stock Performance Graph
The following graph compares the total stockholder return on our common stock with the total return on the NASDAQ US Index and the Russell 2000 Index. We believe the Russell 2000 Index includes companies with market capitalization comparable to ours. Houston Wire & Cable Company has a unique niche in the marketplace, due to the size and scope of our business platform, and we are unable to identify peer issuers, as the public companies within our industry are substantially more diversified than we are.
| 10 |
Total return is based on an initial investment of $100 on January 1, 2013, and reinvestment of dividends.
Dividend Policy
Holders of our common stock are entitled to receive dividends when, as and if declared by our Board of Directors. We paid a quarterly cash dividend from August 2007 until August 2016. Our quarterly cash dividend from November 2015 through May 2016 was $0.06 per share. We paid a cash dividend of $0.03 per share in August 2016. The Board of Directors determined to suspend the regular dividend in November 2016, to redeploy funds for other purposes, including the Vertex acquisition. For the year ended December 31, 2016, cash dividends were $0.15 per share, resulting in total dividends paid of $2.5 million.
As a holding company, our only source of funds to pay dividends is distributions from our operating subsidiary. Our loan agreement does not limit the amount of dividends we may pay or stock we may repurchase, as long as we are not in default under the loan agreement and we maintain defined levels of fixed charge coverage and/or availability.
Securities Authorized for Issuance under Equity Compensation Plans
The information called for by this Item regarding securities available for issuance is provided in response to Item 12.
| 11 |
ITEM 6. SELECTED FINANCIAL DATA
You should read the following selected financial information together with our consolidated financial statements and the related notes and the "Management's Discussion and Analysis of Financial Condition and Results of Operations" appearing elsewhere in this Form 10-K. We have derived the consolidated statement of operations data for each of the years ended December 31, 2017, 2016 and 2015, and the consolidated balance sheet data at December 31, 2017 and 2016, from our audited financial statements, which are included in this Form 10-K. We have derived the consolidated statement of operations data for each of the years ended December 31, 2014 and 2013, and the consolidated balance sheet data at December 31, 2015, 2014 and 2013 from our audited financial statements, which are not included in this Form 10-K.
| Year Ended December 31, | ||||||||||||||||||||
| 2017 | 2016 | 2015 | 2014 | 2013 | ||||||||||||||||
| (Dollars in thousands, except share data) | ||||||||||||||||||||
| CONSOLIDATED STATEMENT OF OPERATIONS DATA: | ||||||||||||||||||||
| Sales | $ | 317,697 | $ | 261,644 | $ | 308,133 | $ | 390,011 | $ | 383,292 | ||||||||||
| Cost of sales | 245,035 | 208,694 | 242,223 | 304,073 | 298,633 | |||||||||||||||
| Gross profit | 72,662 | 52,950 | 65,910 | 85,938 | 84,659 | |||||||||||||||
| Operating expenses: | ||||||||||||||||||||
| Salaries and commissions | 36,570 | 29,369 | 28,537 | 31,196 | 30,946 | |||||||||||||||
| Other operating expenses | 28,716 | 24,714 | 25,023 | 26,400 | 26,068 | |||||||||||||||
| Depreciation and amortization | 2,772 | 3,018 | 2,915 | 2,919 | 2,978 | |||||||||||||||
| Impairment charge | — | 2,384 | 3,417 | — | 7,562 | |||||||||||||||
| Total operating expenses | 68,058 | 59,485 | 59,892 | 60,515 | 67,554 | |||||||||||||||
| Operating income (loss) | 4,604 | (6,535 | ) | 6,018 | 25,423 | 17,105 | ||||||||||||||
| Interest expense | 2,073 | 845 | 901 | 1,168 | 992 | |||||||||||||||
| Income (loss) before income taxes | 2,531 | (7,380 | ) | 5,117 | 24,255 | 16,113 | ||||||||||||||
| Income tax expense (benefit) | 2,753 | (1,374 | ) | 3,073 | 9,283 | 8,211 | ||||||||||||||
| Net income (loss) | $ | (222 | ) | $ | (6,006 | ) | $ | 2,044 | $ | 14,972 | $ | 7,902 | ||||||||
| Earnings (loss) per share: | ||||||||||||||||||||
| Basic | $ | (0.01 | ) | $ | (0.37 | ) | $ | 0.12 | $ | 0.85 | $ | 0.44 | ||||||||
| Diluted | $ | (0.01 | ) | $ | (0.37 | ) | $ | 0.12 | $ | 0.85 | $ | 0.44 | ||||||||
| Weighted average common shares outstanding : | ||||||||||||||||||||
| Basic | 16,269,611 | 16,345,679 | 17,012,560 | 17,605,290 | 17,805,464 | |||||||||||||||
| Diluted | 16,269,611 | 16,345,679 | 17,067,593 | 17,683,931 | 17,900,372 | |||||||||||||||
| 12 |
| As of December 31, | ||||||||||||||||||||
| 2017 | 2016 | 2015 | 2014 | 2013 | ||||||||||||||||
| (Dollars in thousands) | ||||||||||||||||||||
| CONSOLIDATED BALANCE SHEET DATA: | ||||||||||||||||||||
| Cash and cash equivalents | $ | — | $ | — | $ | — | $ | — | $ | — | ||||||||||
| Accounts receivable, net | $ | 57,396 | $ | 44,677 | $ | 46,250 | $ | 61,599 | $ | 60,408 | ||||||||||
| Inventories, net | $ | 88,115 | $ | 79,783 | $ | 75,777 | $ | 88,958 | $ | 96,107 | ||||||||||
| Total assets | $ | 194,039 | $ | 175,870 | $ | 159,113 | $ | 189,813 | $ | 196,175 | ||||||||||
| Book overdraft (1) | $ | 3,028 | $ | 3,181 | $ | 3,701 | $ | 3,113 | $ | 4,594 | ||||||||||
| Total debt | $ | 73,555 | $ | 60,388 | $ | 39,188 | $ | 53,847 | $ | 47,952 | ||||||||||
| Stockholders’ equity | $ | 90,744 | $ | 90,131 | $ | 100,001 | $ | 111,307 | $ | 110,694 | ||||||||||
| (1) | Our book overdraft is funded by our revolving credit facility as soon as the related checks clear our disbursement accounts. |
| 13 |
ITEM 7. MANAGEMENT’S DISCUSSION AND ANALYSIS OF FINANCIAL CONDITION AND RESULTS OF OPERATIONS
You should read the following discussion in conjunction with our consolidated financial statements and related notes appearing elsewhere in this Form 10-K. In addition to historical information, this discussion contains forward-looking statements that involve risks, uncertainties and assumptions that could cause actual results to differ materially from our expectations. Factors that could cause such differences include those described in “Risk Factors” and elsewhere in this Form 10-K. Certain tabular information may not foot due to rounding.
Overview
Since our founding 42 years ago, we have grown to be a large provider of industrial products to the U.S. market. Today, we serve approximately 9,000 customers. Our products are used in MRO activities and related projects, as well as for larger-scale projects in the utility, industrial and infrastructure markets and a diverse range of industrial applications including communications, energy, engineering and construction, general manufacturing, mining, marine construction and marine transportation, infrastructure, oilfield services, petrochemical, transportation, utility, wastewater treatment and food and beverage. Activity in the MRO market has been inconsistent, while the level of competition has increased.
Our revenue is driven in part by the level of capital spending within the end-markets we serve. Because many of these end-markets defer capital expenditures during periods of economic downturns, our business has experienced cyclicality. Our revenue has been and will continue to be impacted by fluctuations in capital spending and by our ability to drive demand through our sales and marketing initiatives and the continued development and marketing of our private branded products, such as LifeGuard™. The recent increased levels of economic activity and commodity prices have impacted sales and the level of demand.
Our direct costs will continue to be influenced significantly by the prices we pay our suppliers to procure the products we distribute to our customers. Changes in these costs may result, for example, from increases or decreases in raw material costs, changes in our relationships with suppliers or changes in vendor rebates. Our operating expenses will continue to be affected by our investment in sales, marketing and customer support personnel and commissions paid to our sales force for revenue and profit generated. Some of our operating expenses are related to our fixed infrastructure, including rent, utilities, administrative salaries, maintenance, insurance and supplies. To meet our customers’ needs for an extensive product offering and short delivery times, we will need to continue to maintain adequate inventory levels. Our ability to obtain this inventory will depend, in part, on our relationships with suppliers.
Critical Accounting Policies and Estimates
Critical accounting policies are those that both are important to the accurate portrayal of a company’s financial condition and results of operations, and require subjective or complex judgments, often as a result of the need to make estimates about the effect of matters that are inherently uncertain.
In order to prepare financial statements that conform to accounting principles generally accepted in the United States, commonly referred to as GAAP, we make estimates and assumptions that affect the amounts reported in our financial statements and accompanying notes. Certain estimates are particularly sensitive due to their significance to the financial statements and the possibility that future events may be significantly different from our expectations.
We have identified the following accounting policies as those that require us to make the most subjective or complex judgments in order to fairly present our consolidated financial position and results of operations. Actual results in these areas could differ materially from management’s estimates under different assumptions and conditions.
Inventories
Inventories are valued at the lower of cost, using the average cost method, and net realizable value. We continually monitor our inventory levels at each of our distribution centers. Our reserve for inventory is based on the age of the inventory, movements of our inventory over the prior twelve months and the experience of our purchasing and sales departments in estimating demand for the product in the succeeding year. Our inventories are generally not susceptible to technological obsolescence. A 20% change in our estimate at December 31, 2017 would have resulted in a change in income before income taxes of $0.8 million.
| 14 |
Intangible Assets
The Company’s intangible assets, excluding goodwill, represent tradenames and customer relationships. Tradenames are not being amortized and are treated as indefinite-lived assets. Tradenames are tested for recoverability on an annual basis in October of each year, or when there is a triggering event. Before testing its indefinite-lived assets, the Company considers whether or not to first assess qualitative factors to determine whether the existence of events or circumstances leads to a determination that it is more-likely-than-not that the fair value is less than its carrying amount and whether an impairment test is required. The annual qualitative test for 2017 showed no indications of impairment. The Company assigns useful lives to its intangible assets based on the periods over which it expects the assets to contribute directly or indirectly to the future cash flows of the Company. Customer relationships are amortized over 6 to 9 year useful lives. If events or circumstances were to indicate that any of the Company’s definite-lived intangible assets might be impaired, the Company would assess recoverability based on the estimated undiscounted future cash flows to be generated from the applicable intangible asset.
When performing quantitative assessments for impairment, we use various assumptions in determining the current fair value of these indefinite-lived intangible assets, including future expected cash flows and discount rates, as well as other fair value measures. If actual results are not consistent with our assumptions and judgments used in estimating future cash flows and asset fair values, we may be exposed to future impairment charges that could be material to our results of operations.
Vendor Rebates
Many of our arrangements with our vendors entitle us to receive a rebate of a specified amount when we achieve any of a number of measures, generally related to the volume of purchases from the vendor. We account for such rebates as a reduction of the prices of the vendor’s products and therefore as a reduction of inventory until we sell the product, at which time such rebates reduce cost of sales. Throughout the year, we estimate the amount of the rebates earned based on purchases to date relative to the total purchase levels expected to be achieved during the rebate period. We continually revise these estimates to reflect rebates expected to be earned based on actual purchase levels and forecasted purchase volumes for the remainder of the rebate period. A 20% change in our estimate of total rebates earned during 2017 would have resulted in a change in income before income taxes of $1.0 million for the year ended December 31, 2017.
Goodwill
Goodwill represents the excess of the amount we paid to acquire businesses over the estimated fair value of tangible assets and identifiable intangible assets acquired, less liabilities assumed. Determining the fair value of assets acquired and liabilities assumed requires management’s judgment and often involves the use of significant estimates and assumptions, including assumptions with respect to future cash flows, discount rates and asset lives among other items. At December 31, 2017, our goodwill balance was $22.4 million, representing 11.5% of our total assets.
The Company conducts impairment testing for goodwill annually in the fourth quarter of its fiscal year and more frequently, on an interim basis, when an event occurs or circumstances change that indicate that the fair value of a reporting unit may have declined below its carrying value. Events or circumstances which could indicate a probable impairment include, but are not limited to, financial performance, industry and market conditions, macroeconomic conditions, reporting unit-specific events, historical results of goodwill impairment testing and the timing of the last performance of a quantitative assessment.
The Company tests goodwill at the reporting unit level, which is defined as an operating segment or one level below an operating segment that constitutes a business for which financial information is available and is regularly reviewed by management. The Company determined that it has four reporting units for this purpose. Before testing goodwill, the Company considers whether or not to first assess qualitative factors to determine whether the existence of events or circumstances lead to a determination that it is more-likely-than-not that the fair value of a reporting unit is less than its carrying amount and whether an impairment test is required.
The goodwill impairment test is a two-step process. The first step is to identify if a potential impairment exists by comparing the fair value of the reporting unit with its carrying amount, including goodwill. If the fair value of a reporting unit exceeds its carrying amount, goodwill of the reporting unit is not considered to have a potential impairment and the second step of the impairment test is not necessary. However if the carrying amount of a reporting unit exceeds its fair value, the second step is performed to determine if goodwill is impaired and to measure the amount of impairment loss to recognize, if any. The second step compares the implied fair value of goodwill with the carrying amount of goodwill. If the implied fair value of goodwill exceeds the carrying amount, then goodwill is not considered impaired. However, if the carrying amount of goodwill exceeds the implied fair value, an impairment loss is recognized in an amount equal to that excess.
| 15 |
When performing goodwill impairment testing, the fair values of reporting units are determined based on valuation techniques using the best available information, including discounted cash flow projections.
Inherent in such fair value determinations are certain judgments and estimates relating to future cash flows, including our interpretation of current economic indicators and market valuations, and assumptions about our strategic plans. In developing fair values for our reporting units, we may employ a market multiple or a discounted cash flow methodology, or a combination thereof. The market multiple methodology compares us to similar companies on the basis of risk characteristics to determine our risk profile relative to the comparable companies as a group. This analysis generally focuses on quantitative considerations, which include financial performance and other quantifiable data, and qualitative considerations, which include any factors which are expected to impact future financial performance. The most significant assumptions affecting the market multiple methodology are the market multiples and control premium. A control premium represents the value an investor would pay above non-controlling interest transaction prices in order to obtain a controlling interest in the respective unit.
The discounted cash flow methodology establishes fair value by estimating the present value of the projected future cash flows to be generated from the reporting unit. The discount rate applied to the projected future cash flows to arrive at the present value is intended to reflect all risks of ownership and the associated risks of realizing the stream of projected future cash flows. The discounted cash flow methodology uses our projections of financial performance. The most significant assumptions used in the discounted cash flow methodology are the discount rate, the customer attrition rate and expected future revenue and operating margins, which vary among reporting units. If actual results are not consistent with our assumptions and judgments used in estimating future cash flows and asset fair values, we may be exposed to future impairment losses that could be material to our results of operations.
The annual goodwill impairment qualitative test was performed as of October 1, 2017, related to the Southern and Vertex reporting units. Based on the Company’s assessment of these tests, which compared current year to date performance to plan, the Company does not believe it is more-likely-than- not that the fair values of these reporting units are less than their respective carrying values. If there are future reductions in our market capitalization and market multiples, or the projected performance is not achieved, these reporting units could be at risk of failing the second step in the future.
Income Taxes
The Company determines deferred tax assets and liabilities based on differences between the carrying amounts of assets and liabilities for financial reporting purposes and the amounts used for income tax purposes and are measured using the enacted tax rates and laws that will be in effect when the differences are expected to reverse. On December 22, 2017, the Tax Cuts and Jobs Act (“the Act”) was signed into law, making significant changes to the US Internal Revenue Code. The Company has made a reasonable estimate of the effects, including re-measurement on its existing deferred tax balances and re-evaluating the valuation allowance on the deferred tax assets not expected to be realized, as of December 31, 2017. The Company is still analyzing the Act and refining its calculations, which could potentially impact the measurement of the deferred tax balances. The Company is also assessing the impact of the provisions of the Act which do not apply until 2018.
Estimates, judgments and assumptions are required in determining whether deferred tax assets will be fully or partially realized. The Company establishes a valuation allowance to reduce the deferred tax assets when it is more likely than not that some portion or all of the deferred tax assets will not be realized. In evaluating the ability to realize deferred tax assets, the Company considers all available positive and negative evidence, in determining whether, based on the weight of that evidence, a valuation allowance is needed for part or all of the deferred tax assets. In determining the need for a valuation allowance on the Company’s deferred tax assets the Company places greater weight on recent and objectively verifiable current information, as compared to more forward-looking information that is used in valuing other assets on the balance sheet. The Company has considered taxable income in prior carryback years, future reversals of existing taxable temporary differences, future taxable income, and tax planning strategies in assessing the need for the valuation allowance.
The Company establishes liabilities for estimated tax issues, and the provisions and benefits resulting from changes to those liabilities are included in our annual tax provision along with related interest. The Company recognizes interest on any tax issue as a component of interest expense and any related penalties in other operating expenses.
Sales
We generate most of our sales by providing industrial products to our customers, as well as billing for freight charges. We recognize revenue upon shipment of our products to customers from our distribution centers or directly from our suppliers. Sales incentives earned by customers are accrued in the same month as the shipment is invoiced and are accounted for as a reduction in sales.
| 16 |
Cost of Sales
Cost of sales consists primarily of the average cost of the industrial products that we sell. We also incur shipping and handling costs in the normal course of business. Cost of sales also reflects cash discounts for prompt payment to vendors and vendor rebates generally related to annual purchase targets, as well as inventory obsolescence charges.
Operating Expenses
Operating expenses include all expenses, excluding freight, incurred to receive, sell and ship product and administer the operations of the Company.
Salaries and Commissions. Salary expense includes the base compensation, and any overtime earned by hourly personnel, for all sales, administrative and warehouse employees and stock compensation expense for options and restricted stock granted to employees. Commission expense is earned by inside sales personnel based on gross profit dollars generated, by field sales personnel from generating sales and meeting various objectives, by sales, national and marketing managers for driving the sales process, by region managers based on the profitability of their branches and by corporate managers based primarily on our profitability and also on other operating metrics.
Other Operating Expenses. Other operating expenses include all payroll taxes, health insurance, travel expenses, public company expenses, advertising, management information system expenses, facility rent and all distribution expenses such as packaging, reels, and repair and maintenance of equipment and facilities.
Depreciation and Amortization. We incur depreciation expense on costs related to capitalized property and equipment on a straight-line basis over the estimated useful lives of the assets, which range from three to thirty years. We incur amortization expense on leasehold improvements and capital leases over the shorter of the lease term or the life of the related asset and on intangible assets over the estimated life of the asset.
Interest Expense
Interest expense consists primarily of interest we incur on our debt.
| 17 |
Results of Operations
The following discussion compares our results of operations for the years ended December 31, 2017, 2016 and 2015.
The following table shows, for the periods indicated, information derived from our consolidated statements of operations, expressed as a percentage of sales for the period presented.
| Year Ended December 31, | ||||||||||||
| 2017 | 2016 | 2015 | ||||||||||
| Sales | 100.0 | % | 100.0 | % | 100.0 | % | ||||||
| Cost of sales | 77.1 | % | 79.8 | % | 78.6 | % | ||||||
| Gross profit | 22.9 | % | 20.2 | % | 21.4 | % | ||||||
| Operating expenses: | ||||||||||||
| Salaries and commissions | 11.5 | % | 11.2 | % | 9.3 | % | ||||||
| Other operating expenses | 9.0 | % | 9.4 | % | 8.1 | % | ||||||
| Depreciation and amortization | 0.9 | % | 1.2 | % | 0.9 | % | ||||||
| Impairment charge | 0.0 | % | 0.9 | % | 1.1 | % | ||||||
| Total operating expenses | 21.4 | % | 22.7 | % | 19.4 | % | ||||||
| Operating income (loss) | 1.4 | % | (2.5 | )% | 2.0 | % | ||||||
| Interest expense | 0.7 | % | 0.3 | % | 0.3 | % | ||||||
| Income (loss) before income taxes | 0.8 | % | (2.8 | )% | 1.7 | % | ||||||
| Income tax expense (benefit) | 0.9 | % | (0.5 | )% | 1.0 | % | ||||||
| Net income (loss) | (0.1 | )% | (2.3 | )% | 0.7 | % | ||||||
Note: Due to rounding, percentages may not add up to total operating expenses, operating income (loss), income (loss) before income taxes or net income (loss).
Comparison of Years Ended December 31, 2017 and 2016
Sales
| Year Ended | ||||||||||||||||
| December 31, | ||||||||||||||||
| (Dollars in millions) | 2017 | 2016 | Change | |||||||||||||
| Sales | $ | 317.7 | $ | 261.6 | $ | 56.1 | 21.4 | % | ||||||||
Our sales in 2017 increased $56.1 million or 21.4% from 2016. The increase in sales was primarily attributable to an increase in sales of $31.3 million, or 12.5%, together with the inclusion of a full year of Vertex’s sales, which was $24.7 million more than sales of Vertex included in the 2016 financial statements, following its acquisition on October 3, 2016. We estimate that higher metals prices in 2017 represented approximately 3% of the increase in sales. We estimate sales for our project business, which targets end markets for Environmental Compliance, Engineering & Construction, Industrials, Utility Power Generation, and Mechanical Wire Rope, increased 3%, while Maintenance, Repair, and Operations (MRO) sales increased 15%, as compared to 2016, including the impact of higher metals prices.
Gross Profit
| Year Ended | ||||||||||||||||
| December 31, | ||||||||||||||||
| (Dollars in millions) | 2017 | 2016 | Change | |||||||||||||
| Gross profit | $ | 72.7 | $ | 53.0 | $ | 19.7 | 37.2 | % | ||||||||
| Gross profit as a percent of sales | 22.9 | % | 20.2 | % | ||||||||||||
Gross profit increased $19.7 million or 37.2% from 2016. The increase was primarily attributable to the increase in sales, including a full year of Vertex’s sales, higher product margins and the higher margins generated by Vertex.
| 18 |
Operating Expenses
| Year Ended | ||||||||||||||||
| December 31, | ||||||||||||||||
| (Dollars in millions) | 2017 | 2016 | Change | |||||||||||||
| Operating expenses: | ||||||||||||||||
| Salaries and commissions | $ | 36.6 | $ | 29.4 | $ | 7.2 | 24.5 | % | ||||||||
| Other operating expenses | 28.7 | 24.7 | 4.0 | 16.2 | % | |||||||||||
| Depreciation and amortization | 2.8 | 3.0 | (0.2 | ) | (8.2 | )% | ||||||||||
| Impairment charge | — | 2.4 | (2.4 | ) | (100.0 | )% | ||||||||||
| Total operating expenses | $ | 68.1 | $ | 59.5 | $ | 8.6 | 14.4 | % | ||||||||
| Operating expenses as a percent of sales | 21.4 | % | 22.7 | % | ||||||||||||
Note: Due to rounding, numbers may not add up to total operating expenses.
Salaries and Commissions. Salaries and commissions increased $7.2 million or 24.5%, which included Vertex’s salaries and commissions for a full year, an increase in commissions due to higher sales and profitability and higher distribution labor costs due to higher activity levels.
Other Operating Expenses. Other operating expenses increased $4.0 million or 16.2%, which included operating expenses of Vertex for a full year and additional warehouse distribution expenses as sales increased.
Depreciation and Amortization. Depreciation and amortization decreased slightly to $2.8 million in 2017 from $3.0 million in 2016.
Impairment Charge. The Company recorded a non-cash impairment charge in 2016 with respect to goodwill at its HWC reporting unit and tradenames at its Southern Wire reporting unit. (See Note 4 to our Consolidated Financial Statements)
Operating expenses as a percentage of sales decreased to 21.4% in 2017 from 22.7% in 2016. This decrease primarily relates to the leverage obtained from increased sales, which rose at a higher rate, and the absence of an impairment charge in 2017.
Interest Expense
Interest expense increased 145.3% to $2.1 million in 2017 from $0.8 million in 2016 due to higher average debt primarily as a result of borrowing to finance the Vertex acquisition. Average debt was $71.8 million in 2017 compared to $40.0 million in 2016. The average effective interest rate increased to 2.8% in 2017 from 2.0% in 2016.
Income Tax
We recorded an income tax charge of $2.8 million in 2017, compared to an income tax benefit of $1.4 million in 2016. The effective income tax rate was 108.8% in 2017 compared to an income tax benefit of 18.6% in 2016. The 2017 tax rate included 41.0% in respect of a valuation allowance on our net deferred tax assets, 15.2% for stock compensation expense and a 12.9% charge for deferred tax assets in respect of the tax reform rate change.
Net Loss
We sustained a net loss of $0.2 million in 2017 compared to a net loss of $6.0 million in 2016.
| 19 |
Comparison of Years Ended December 31, 2016 and 2015
Sales
| Year Ended | ||||||||||||||||
| December 31, | ||||||||||||||||
| (Dollars in millions) | 2016 | 2015 | Change | |||||||||||||
| Sales | $ | 261.6 | $ | 308.1 | $ | (46.5 | ) | (15.1 | )% | |||||||
Our sales in 2016 decreased 15.1% to $261.6 million from $308.1 million in 2015. We estimate that lower metals prices in 2016 resulted in approximately 8% of the decrease in sales from 2015. In addition, we estimate that our project business, which targets end markets and encompassing Environmental Compliance, Engineering & Construction, Industrials, LifeGuard™, Utility Power Generation, and Mechanical Wire Rope, was down approximately 34% from 2015, while MRO sales fell approximately 1% from 2015 including, in each case, the impact of lower metals prices.
Gross Profit
| Year Ended | ||||||||||||||||
| December 31, | ||||||||||||||||
| (Dollars in millions) | 2016 | 2015 | Change | |||||||||||||
| Gross profit | $ | 53.0 | $ | 65.9 | $ | (13.0 | ) | (19.7 | )% | |||||||
| Gross profit as a percent of sales | 20.2 | % | 21.4 | % | ||||||||||||
Gross profit decreased 19.7% to $53.0 million in 2016 from $65.9 million in 2015. The decrease in gross profit was primarily attributable to the decrease in sales. Gross margin decreased to 20.2% in 2016 from 21.4% in 2015 primarily due to continued competitive market conditions.
Operating Expenses
| Year Ended | ||||||||||||||||
| December 31, | ||||||||||||||||
| (Dollars in millions) | 2016 | 2015 | Change | |||||||||||||
| Operating expenses: | ||||||||||||||||
| Salaries and commissions | $ | 29.4 | $ | 28.5 | $ | 0.8 | 2.9 | % | ||||||||
| Other operating expenses | 24.7 | 25.0 | (0.3 | ) | (1.2 | )% | ||||||||||
| Depreciation and amortization | 3.0 | 2.9 | 0.1 | 3.5 | % | |||||||||||
| Impairment charge | 2.4 | 3.4 | (1.0 | ) | (30.2 | )% | ||||||||||
| Total operating expenses | $ | 59.5 | $ | 59.9 | $ | (0.4 | ) | (0.7 | )% | |||||||
| Operating expenses as a percent of sales | 22.7 | % | 19.4 | % | ||||||||||||
Note: Due to rounding, numbers may not add up to total operating expenses.
Salaries and Commissions. Salaries and commissions increased 2.9% to $29.4 million in 2016 from $28.5 million in 2015. The increase was primarily due to Vertex’s salaries.
Other Operating Expenses. Other operating expenses decreased 1.2% to $24.7 million in 2016 from $25.0 million in 2015 primarily due to the decrease in sales volume and the related decrease in warehouse expenses and lower health insurance claims. These decreases were partially offset by the operating expenses of Vertex. In addition operating expenses include approximately $0.9 million related to the Vertex acquisition.
Depreciation and Amortization. Depreciation and amortization increased slightly to $3.0 million in 2016 from $2.9 million in 2015.
Impairment Charge. The Company recorded a non-cash impairment charge in 2016 with respect to goodwill at its HWC reporting unit and tradenames at its Southern Wire reporting unit. The Company recorded a non-cash impairment charge in 2015 with respect to goodwill at its Southwest reporting unit and in respect of tradenames at its Southern and Southwest reporting units. (See Note 4 to our Consolidated Financial Statements)
| 20 |
Operating expenses as a percentage of sales increased to 22.7% in 2016 from 19.4% in 2015. This increase primarily relates to the decrease in sales which fell at a higher rate than total operating expenses.
Interest Expense
Interest expense decreased 6.2% to $0.8 million in 2016 from $0.9 million in 2015 due to lower average debt in the first nine months of the year, offset by higher debt in the last quarter due to the Vertex acquisition. Average debt was $40.0 million in 2016 compared to $43.9 million in 2015. The average effective interest rate increased slightly to 2.0% in 2016 from 1.9% in 2015.
Income Tax
We recorded an income tax benefit of $1.4 million in 2016, due to the pre-tax loss, compared to income tax expense of $3.1 million in 2015. The effective income tax rate decreased to 18.6% in 2016 from 60.1% in 2015. In 2015, the non-deductible portion of the impairment charge increased the rate by 20.0% and the impact of the share-based compensation deficit increased the rate by 3.7%.
Net Income (Loss)
We sustained a net loss of $6.0 million in 2016 compared to net income of $2.0 million in 2015, primarily due to the lower level of sales activity.
Impact of Inflation and Commodity Prices
Our results of operations are affected by changes in the inflation rate and commodity prices. Moreover, because copper, steel, aluminum, nickel and petrochemical products are components of the industrial products we sell, fluctuations in the costs of these and other commodities have historically affected our operating results. We estimate increasing metal prices positively impacted sales by approximately 3% in 2017. To the extent commodity prices decline, the net realizable value of our existing inventory could also decline, and our gross profit can be adversely affected because of either reduced selling prices or lower of cost or market adjustments in the carrying value of our inventory. If we turn our inventory approximately three times a year, the impact of changes in commodity prices in any particular quarter would primarily affect the results of the succeeding two calendar quarters. If we are unable to pass on to our customers future cost increases due to inflation or rising commodity prices, our operating results could be adversely affected.
Liquidity and Capital Resources
Our primary capital needs are for working capital obligations, capital expenditures, and other general corporate purposes, including acquisitions. We have currently suspended purchases under our stock repurchase program and the payment of a dividend. Our primary sources of working capital are cash from operations supplemented by bank borrowings.
Liquidity is defined as the ability to generate adequate amounts of cash to meet the current need for cash. We assess our liquidity in terms of our ability to generate cash to fund our operating activities. Significant factors which could affect liquidity include the following:
| • | the adequacy of available bank lines of credit; | |
| • | cash flows generated from operating activities; | |
| • | capital expenditures; | |
| • | acquisitions; and | |
| • | the ability to attract long-term capital with satisfactory terms |
Comparison of Years Ended December 31, 2017 and 2016
Our net cash used in operating activities was $11.3 million compared to net cash provided by operating activities of $17.2 million in 2016. We had a net loss of $0.2 million in 2017 compared to net loss of $6.0 million in 2016.
Changes in our operating assets and liabilities resulted in cash used in operating activities of $16.7 million in 2017. Accounts receivable increased $12.7 million, primarily due to increased sales in 2017. Inventories increased $7.9 million in alignment with the increase in sales volume. Partially offsetting these uses of cash was the increase in accrued and other current liabilities of $3.6 million primarily due to increased customer volume discounts.
Net cash used in investing activities was $1.6 million in 2017 compared to $33.7 million in 2016. The decrease from the prior year was primarily due to the Vertex acquisition in October 2016.
| 21 |
Net cash provided by financing activities was $12.9 million in 2017 compared to $16.4 million in 2016. Net borrowings under our revolver of $13.2 million to fund higher working capital requirements and the purchase of treasury stock of $0.2 million were the main components of financing activities in 2017.
Comparison of Years Ended December 31, 2016 and 2015
Our net cash provided by operating activities was $17.2 million in 2016 compared to $31.8 million in 2015. We had a net loss of $6.0 million in 2016 compared to net income of $2.0 million in 2015.
Changes in our operating assets and liabilities resulted in cash provided by operating activities of $16.7 million in 2016. Excluding the operating assets and liabilities acquired as part of the Vertex acquisition, inventories decreased $10.5 million as we continued to improve inventory profiles. Accounts receivable decreased $4.0 million, primarily due to decreased sales in 2016. Accrued and other current liabilities increased $2.6 million primarily due to increased inventory purchases in the latter part of the year.
Net cash used in investing activities was $33.7 million in 2016 compared to $3.1 million in 2015. The increase was primarily attributable to the Vertex acquisition in October 2016.
Net cash provided by financing activities was $16.4 million in 2016 compared to net cash used in financing activities of $28.7 million in 2015. Net borrowings under our revolver of $21.2 million due to the impact of funding the Vertex acquisition, the payment of dividends of $2.5 million and the purchase of treasury stock of $2.3 million were the main components of financing activities in 2016.
Indebtedness
Our principal source of liquidity at December 31, 2017 was working capital of $119.6 million compared to $102.1 million at December 31, 2016. We also had available borrowing capacity under our loan agreement in the amount of $23.0 million at December 31, 2017 and $25.6 million at December 31, 2016. The decrease in availability is primarily due to additional working capital requirements.
We believe that we will have adequate availability of capital to fund our present operations, meet our commitments on our existing debt, and fund anticipated growth over the next twelve months, including expansion in existing and targeted market areas. We continually seek potential acquisitions and from time to time hold discussions with acquisition candidates. If suitable acquisition opportunities or working capital needs arise that would require additional financing, we believe that our financial position and earnings history provide a solid base for obtaining additional financing resources at competitive rates and terms. Additionally, based on market conditions, we may decide to issue additional shares of common or preferred stock to raise funds.
Loan and Security Agreement
On October 3, 2016, in connection with the Vertex acquisition, we entered into a First Amendment (the “Loan Agreement Amendment”) amending the Fourth Amended and Restated Loan and Security Agreement with Bank of America, N.A. as agent and lender (the “2015 Loan Agreement”). The Loan Agreement Amendment adds Vertex as borrower (and lien grantor) and provides the terms for inclusion of Vertex’s eligible accounts receivable and eligible inventory in the borrowing base for the 2015 Loan Agreement. The 2015 Loan Agreement was expanded to include incremental availability on eligible accounts receivable and inventory up to $5 million, which, starting April 1, 2017, is being amortized quarterly over two and a half years. The 2015 Loan Agreement provides a $100 million revolving credit facility and expires on September 30, 2020. Under certain circumstances we may request an increase in the commitment by an additional $50 million. Borrowings under the 2015 Loan Agreement bear interest at the British Bankers Association LIBOR Rate plus 100 to 150 basis points based on availability, if a LIBOR loan, or at a fluctuating rate equal to the greatest of the agent’s prime rate, the federal funds rate plus 50 basis points, or LIBOR for a 30-day interest period plus 150 basis points, if a base rate loan. The unused commitment fee is 25 basis points. Availability under the 2015 Loan Agreement is limited to a borrowing base equal to 85% of the value of eligible accounts receivable, plus the lesser of 70% of the value of eligible inventory or 90% of the net orderly liquidation value percentage of the value of eligible inventory, in each case less certain reserves. The 2015 Loan Agreement is secured by substantially all of our property, other than real estate.
Covenants in the 2015 Loan Agreement require us to maintain certain minimum financial ratios and/or availability levels. Repaid amounts can be re-borrowed subject to the borrowing base. As of December 31, 2017, we met the availability-based covenant.
| 22 |
Contractual Obligations
The following table describes our cash commitments to settle contractual obligations as of December 31, 2017.
| Total | Less than 1 year | 1-3 years | 3-5 years | More than 5 years | ||||||||||||||||
| (In thousands) | ||||||||||||||||||||
| Loans payable | $ | 73,555 | $ | — | $ | 73,555 | $ | — | $ | — | ||||||||||
| Operating lease obligations | 14,484 | 3,631 | 5,460 | 4,924 | 469 | |||||||||||||||
| Non-cancellable purchase obligations (1) | 61,827 | 61,827 | — | — | — | |||||||||||||||
| Total | $ | 149,866 | $ | 65,458 | $ | 79,015 | $ | 4,924 | $ | 469 | ||||||||||
| (1) | These obligations reflect purchase orders outstanding with manufacturers as of December 31, 2017. We believe that some of these obligations may be cancellable upon negotiation with our vendors, but we are treating these as non-cancellable for this disclosure due to the absence of an express cancellation right. |
Capital Expenditures
We made capital expenditures of $1.8 million, $1.3 million and $3.1 million in the years ended December 31, 2017, 2016 and 2015, respectively. The 2015 expenditures included amounts of $1.9 million to complete the renovation and build out of the facility purchased in 2013 which was used to consolidate the Southwest operations in Houston, Texas in 2015.
Off-Balance Sheet Arrangements
We have no off-balance sheet arrangements, other than operating leases.
Financial Derivatives
We have no financial derivatives.
Market Risk Management
We are exposed to market risks arising from changes in market prices, including movements in interest rates and commodity prices.
Interest Rate Risk
Borrowings under our 2015 Loan Agreement bear interest at variable interest rates and therefore are sensitive to changes in the general level of interest rates. At December 31, 2017, the weighted average interest rate on our $73.6 million of variable interest debt was approximately 3.2%.
While our variable rate debt obligations expose us to the risk of rising interest rates, management does not believe that the potential exposure is material to our overall financial performance or results of operations. Based on December 31, 2017 borrowing levels, a 1.0% change in the applicable interest rates would have a $0.7 million effect on our annual interest expense.
Commodity Risk
We are subject to periodic fluctuations in metals prices, as our products have varying levels of metals content including copper, steel, aluminum and nickel, in their construction. In addition, petrochemical prices also impact certain products we purchase. Profitability is influenced by these fluctuations as prices change between the time we buy and sell our products.
Foreign Currency Exchange Rate Risk
Our products are purchased and invoiced in U.S. dollars and in Euros. We believe we have minimal exposure to foreign exchange rate risk.
| 23 |
Climate Risk
Our operations are subject to inclement weather conditions including hurricanes, earthquakes and abnormal weather events. Our previous experience from these events has had a minimal effect on our operations.
Factors Affecting Future Results
This Annual Report on Form 10-K contains statements that may be considered forward-looking. These statements can be identified by the fact that they do not relate strictly to historical or current facts. They use words such as "aim," "anticipate," "believe," "could," "estimate," "expect," "intend," "may," "plan," "project," "should," "will be," "will continue," "will likely result," "would" and other words and terms of similar meaning in conjunction with a discussion of future operating or financial performance. You should read statements that contain these words carefully, because they discuss our future expectations, contain projections of our future results of operations or of our financial position or state other "forward-looking" information. Actual results could differ materially from the results indicated by these statements, because the realization of those results is subject to many risks and uncertainties. Some of these risks and uncertainties are discussed in greater detail under Item 1A, "Risk Factors."
All forward-looking statements are based on current management expectations and speak only as of the date of this filing. Except as required under federal securities laws and the rules and regulations of the SEC, we do not have any intention, and do not undertake, to update any forward-looking statements to reflect events or circumstances arising after the date of this Form 10-K.
| 24 |
ITEM 7A. QUANTITATIVE AND QUALITATIVE DISCLOSURES ABOUT MARKET RISK
Quantitative and Qualitative Disclosures about Market Risk are reported in Item 7, “Management’s Discussion and Analysis of Financial Condition and Results of Operations”, under the captions “Market Risk Management”, “Interest Rate Risk”, “Commodity Risk”, and “Foreign Currency Exchange Rate Risk”.
| 25 |
ITEM 8. CONSOLIDATED FINANCIAL STATEMENTS AND SUPPLEMENTARY DATA
Houston Wire & Cable Company
Index to consolidated financial statements
| 26 |
Report of Independent Registered Public Accounting Firm
To the Stockholders and Board of Directors of Houston Wire & Cable Company
Opinion on the Financial Statements
We have audited the accompanying consolidated balance sheets of Houston Wire & Cable Company (the Company) as of December 31, 2017 and 2016, and the related consolidated statements of operations, stockholders’ equity, and cash flows for each of the three years in the period ended December 31, 2017, and the related notes (collectively referred to as the “consolidated financial statements”). In our opinion, the consolidated financial statements present fairly, in all material respects, the financial position of the Company at December 31, 2017 and 2016, and the results of its operations and its cash flows for each of the three years in the period ended December 31, 2017, in conformity with U.S. generally accepted accounting principles.
We also have audited, in accordance with the standards of the Public Company Accounting Oversight Board (United States) (PCAOB), the Company’s internal control over financial reporting as of December 31, 2017, based on criteria established in Internal Control-Integrated Framework issued by the Committee of Sponsoring Organizations of the Treadway Commission (2013 framework) and our report dated March 16, 2018 expressed an unqualified opinion thereon.
Basis for Opinion
These financial statements are the responsibility of the Company’s management. Our responsibility is to express an opinion on the Company’s financial statements based on our audits. We are a public accounting firm registered with the PCAOB and are required to be independent with respect to the Company in accordance with the U.S. federal securities laws and the applicable rules and regulations of the Securities and Exchange Commission and the PCAOB.
We conducted our audits in accordance with the standards of the PCAOB. Those standards require that we plan and perform the audit to obtain reasonable assurance about whether the financial statements are free of material misstatement, whether due to error or fraud. Our audits included performing procedures to assess the risks of material misstatement of the financial statements, whether due to error or fraud, and performing procedures that respond to those risks. Such procedures include examining, on a test basis, evidence regarding the amounts and disclosures in the financial statements. Our audits also included evaluating the accounting principles used and significant estimates made by management, as well as evaluating the overall presentation of the financial statements. We believe that our audits provide a reasonable basis for our opinion.
| /s/ Ernst & Young LLP | |
| We have served as the Company’s auditor since 1997. | |
| Houston, Texas | |
| March 16, 2018 |
| F-1 |
Consolidated Balance Sheets
| December 31, | ||||||||
| 2017 | 2016 | |||||||
| (In thousands, except share data) | ||||||||
| Assets | ||||||||
| Current assets: | ||||||||
| Accounts receivable, net | $ | 57,396 | $ | 44,677 | ||||
| Inventories, net | 88,115 | 79,783 | ||||||
| Income taxes | 449 | 1,948 | ||||||
| Prepaids | 1,938 | 570 | ||||||
| Total current assets | 147,898 | 126,978 | ||||||
| Property and equipment, net | 11,355 | 11,261 | ||||||
| Intangible assets, net | 12,015 | 13,378 | ||||||
| Goodwill | 22,353 | 22,770 | ||||||
| Deferred income taxes | — | 892 | ||||||
| Other assets | 418 | 591 | ||||||
| Total assets | $ | 194,039 | $ | 175,870 | ||||
| Liabilities and stockholders’ equity | ||||||||
| Current liabilities: | ||||||||
| Book overdraft | $ | 3,028 | $ | 3,181 | ||||
| Trade accounts payable | 8,449 | 8,406 | ||||||
| Accrued and other current liabilities | 16,823 | 13,248 | ||||||
| Total current liabilities | 28,300 | 24,835 | ||||||
| Debt | 73,555 | 60,388 | ||||||
| Deferred income taxes | 414 | — | ||||||
| Other long-term obligations | 1,026 | 516 | ||||||
| Total liabilities | 103,295 | 85,739 | ||||||
| Stockholders’ equity: | ||||||||
| Preferred stock, $0.001 par value; 5,000,000 shares authorized, none issued and outstanding | — | — | ||||||
| Common stock, $0.001 par value; 100,000,000 shares authorized: 20,988,952 shares issued: 16,491,181 and 16,457,525 shares outstanding at December 31, 2017 and 2016, respectively | 21 | 21 | ||||||
| Additional paid-in capital | 54,006 | 53,824 | ||||||
| Retained earnings | 97,336 | 97,550 | ||||||
| Treasury stock | (60,619 | ) | (61,264 | ) | ||||
| Total stockholders’ equity | 90,744 | 90,131 | ||||||
| Total liabilities and stockholders’ equity | $ | 194,039 | $ | 175,870 | ||||
The accompanying notes are an integral part of these consolidated financial statements.
| F-2 |
Consolidated Statements of Operations
| Year Ended December 31, | ||||||||||||
| 2017 | 2016 | 2015 | ||||||||||
| (In thousands, except share and per share data) | ||||||||||||
| Sales | $ | 317,697 | $ | 261,644 | $ | 308,133 | ||||||
| Cost of sales | 245,035 | 208,694 | 242,223 | |||||||||
| Gross profit | 72,662 | 52,950 | 65,910 | |||||||||
| Operating expenses: | ||||||||||||
| Salaries and commissions | 36,570 | 29,369 | 28,537 | |||||||||
| Other operating expenses | 28,716 | 24,714 | 25,023 | |||||||||
| Depreciation and amortization | 2,772 | 3,018 | 2,915 | |||||||||
| Impairment charge | — | 2,384 | 3,417 | |||||||||
| Total operating expenses | 68,058 | 59,485 | 59,892 | |||||||||
| Operating income (loss) | 4,604 | (6,535 | ) | 6,018 | ||||||||
| Interest expense | 2,073 | 845 | 901 | |||||||||
| Income (loss) before income taxes | 2,531 | (7,380 | ) | 5,117 | ||||||||
| Income tax expense (benefit) | 2,753 | (1,374 | ) | 3,073 | ||||||||
| Net income (loss) | $ | (222 | ) | $ | (6,006 | ) | $ | 2,044 | ||||
| Earnings (loss) per share: | ||||||||||||
| Basic | $ | (0.01 | ) | $ | (0.37 | ) | $ | 0.12 | ||||
| Diluted | $ | (0.01 | ) | $ | (0.37 | ) | $ | 0.12 | ||||
| Weighted average common shares outstanding: | ||||||||||||
| Basic | 16,269,611 | 16,345,679 | 17,012,560 | |||||||||
| Diluted | 16,269,611 | 16,345,679 | 17,067,593 | |||||||||
| Dividends declared per share | $ | — | $ | 0.15 | $ | 0.42 | ||||||
The accompanying notes are an integral part of these consolidated financial statements.
| F-3 |
Consolidated Statements of Stockholders' Equity
| Additional | Total | |||||||||||||||||||||||||||
| Common Stock | Paid-In | Retained | Treasury Stock | Stockholders' | ||||||||||||||||||||||||
| Shares | Amount | Capital | Earnings | Shares | Amount | Equity | ||||||||||||||||||||||
| (In thousands, except share data) | ||||||||||||||||||||||||||||
| Balance at December 31, 2014 | 20,988,952 | $ | 21 | $ | 54,871 | $ | 111,233 | (3,480,937 | ) | $ | (54,818 | ) | $ | 111,307 | ||||||||||||||
| Net income | — | — | — | 2,044 | — | — | 2,044 | |||||||||||||||||||||
| Exercise of stock options, net | — | — | (48 | ) | — | 4,125 | 59 | 11 | ||||||||||||||||||||
| Repurchase of treasury shares | — | — | — | — | (865,922 | ) | (6,858 | ) | (6,858 | ) | ||||||||||||||||||
| Excess tax deficiency | — | — | (40 | ) | — | — | — | (40 | ) | |||||||||||||||||||
| Amortization of unearned stock compensation | — | — | 886 | — | — | — | 886 | |||||||||||||||||||||
| Impact of forfeited awards | — | — | 664 | — | (52,128 | ) | (784 | ) | (120 | ) | ||||||||||||||||||
| Impact of released vested restricted stock units | — | — | (224 | ) | — | 14,946 | 224 | — | ||||||||||||||||||||
| Issuance of restricted stock awards | — | — | (1,488 | ) | — | 103,590 | 1,488 | — | ||||||||||||||||||||
| Dividends on common stock | — | — | — | (7,229 | ) | — | — | (7,229 | ) | |||||||||||||||||||
| Balance at December 31, 2015 | 20,988,952 | 21 | 54,621 | 106,048 | (4,276,326 | ) | (60,689 | ) | 100,001 | |||||||||||||||||||
| Net loss | — | — | — | (6,006 | ) | — | — | (6,006 | ) | |||||||||||||||||||
| Repurchase of treasury shares | — | — | — | — | (376,860 | ) | (2,228 | ) | (2,228 | ) | ||||||||||||||||||
| Amortization of unearned stock compensation | — | — | 856 | — | — | — | 856 | |||||||||||||||||||||
| Impact of forfeited awards | — | — | 387 | — | (28,295 | ) | (387 | ) | — | |||||||||||||||||||
| Impact of released vested restricted stock units | — | — | (284 | ) | — | 20,416 | 284 | — | ||||||||||||||||||||
| Issuance of restricted stock awards | — | — | (1,756 | ) | — | 129,638 | 1,756 | — | ||||||||||||||||||||
| Dividends on common stock | — | — | — | (2,492 | ) | — | — | (2,492 | ) | |||||||||||||||||||
| Balance at December 31, 2016 | 20,988,952 | 21 | 53,824 | 97,550 | (4,531,427 | ) | (61,264 | ) | 90,131 | |||||||||||||||||||
| Net loss | — | — | — | (222 | ) | — | — | (222 | ) | |||||||||||||||||||
| Repurchase of treasury shares | — | — | — | — | (27,156 | ) | (177 | ) | (177 | ) | ||||||||||||||||||
| Amortization of unearned stock compensation | — | — | 1,004 | — | — | — | 1,004 | |||||||||||||||||||||
| Impact of forfeited awards | — | — | 361 | — | (26,707 | ) | (361 | ) | — | |||||||||||||||||||
| Impact of released vested restricted stock units | — | — | (372 | ) | — | 27,519 | 372 | — | ||||||||||||||||||||
| Issuance of restricted stock awards | — | — | (811 | ) | — | 60,000 | 811 | — | ||||||||||||||||||||
| Dividend accrual reversal | — | — | — | 8 | — | — | 8 | |||||||||||||||||||||
| Balance at December 31, 2017 | 20,988,952 | $ | 21 | $ | 54,006 | $ | 97,336 | (4,497,771 | ) | $ | (60,619 | ) | $ | 90,744 | ||||||||||||||
The accompanying notes are an integral part of these consolidated financial statements.
| F-4 |
Consolidated Statements of Cash Flows
| Year Ended December 31, | ||||||||||||
| 2017 | 2016 | 2015 | ||||||||||
| (In thousands) | ||||||||||||
| Operating activities | ||||||||||||
| Net income (loss) | $ | (222 | ) | $ | (6,006 | ) | $ | 2,044 | ||||
| Adjustments to reconcile net income to net cash provided by operating activities: | ||||||||||||
| Impairment charge | — | 2,384 | 3,417 | |||||||||
| Depreciation and amortization | 2,772 | 3,018 | 2,915 | |||||||||
| Amortization of unearned stock compensation | 1,176 | 856 | 886 | |||||||||
| Provision for doubtful accounts | 68 | 285 | 97 | |||||||||
| Provision (reversal) for inventory obsolescence | 34 | 93 | 397 | |||||||||
| Deferred income taxes | 1,314 | 6 | (485 | ) | ||||||||
| Other non-cash items | 222 | (116 | ) | (59 | ) | |||||||
| Changes in operating assets and liabilities: | ||||||||||||
| Accounts receivable | (12,719 | ) | 4,019 | 15,352 | ||||||||
| Inventories | (7,942 | ) | 10,483 | 12,784 | ||||||||
| Book overdraft | (153 | ) | (517 | ) | 588 | |||||||
| Trade accounts payable | 38 | 896 | (1,613 | ) | ||||||||
| Accrued and other current liabilities | 3,571 | 2,587 | (3,557 | ) | ||||||||
| Income taxes | 1,499 | (1,016 | ) | (713 | ) | |||||||
| Prepaid expenses | (1,368 | ) | 124 | (83 | ) | |||||||
| Other operating activities | 368 | 147 | (141 | ) | ||||||||
| Net cash (used in) provided by operating activities | (11,342 | ) | 17,243 | 31,829 | ||||||||
| Investing activities | ||||||||||||
| Expenditures for property and equipment | (1,769 | ) | (1,319 | ) | (3,123 | ) | ||||||
| Proceeds from disposals of property and equipment | 8 | 5 | 8 | |||||||||
| Cash refunded (paid) for acquisition | 193 | (32,370 | ) | — | ||||||||
| Net cash used in investing activities | (1,568 | ) | (33,684 | ) | (3,115 | ) | ||||||
| Financing activities | ||||||||||||
| Borrowings on revolver | 333,301 | 302,898 | 310,366 | |||||||||
| Payments on revolver | (320,133 | ) | (281,698 | ) | (325,025 | ) | ||||||
| Proceeds from exercise of stock options | — | — | 11 | |||||||||
| Payment of dividends | (81 | ) | (2,495 | ) | (7,172 | ) | ||||||
| Purchase of treasury stock | (177 | ) | (2,264 | ) | (6,894 | ) | ||||||
| Net cash provided by (used in) financing activities | 12,910 | 16,441 | (28,714 | ) | ||||||||
| Net change in cash | — | — | — | |||||||||
| Cash at beginning of year | — | — | — | |||||||||
| Cash at end of year | $ | — | $ | — | $ | — | ||||||
| Supplemental disclosures | ||||||||||||
| Cash paid during the year for interest | $ | 1,961 | $ | 728 | $ | 900 | ||||||
| Cash paid during the year for income taxes | $ | 64 | $ | 233 | $ | 4,278 | ||||||
The accompanying notes are an integral part of these consolidated financial statements.
| F-5 |
Notes to Consolidated Financial Statements
| 1. | Organization and Summary of Significant Accounting Policies |
Description of Business
Houston Wire & Cable Company (the “Company”), through its wholly owned subsidiaries, HWC Wire & Cable Company, Advantage Wire & Cable and Cable Management Services Inc., provides industrial products to the U.S. market through twenty-one locations in fourteen states throughout the United States. In 2010, the Company purchased Southwest Wire Rope LP (“Southwest”), its general partner Southwest Wire Rope GP LLC and its wholly owned subsidiary, Southern Wire (“Southern”) and subsequently merged them into the Company’s operating subsidiary. On October 3, 2016, the Company purchased Vertex Corporate Holdings, Inc. and its subsidiaries (“Vertex”). The Company has no other business activity.
Basis of Presentation and Principles of Consolidation
The consolidated financial statements include the accounts of the Company and its subsidiaries and have been prepared following accounting principles generally accepted in the United States (“GAAP”) and the requirements of the Securities and Exchange Commission (“SEC”). The financial statements include all normal and recurring adjustments that are necessary for a fair presentation of the Company’s financial position and operating results. All significant inter-company balances and transactions have been eliminated.
Use of Estimates
The preparation of the financial statements in conformity with GAAP requires management to make estimates and assumptions that affect the amounts reported in the financial statements and accompanying notes. The most significant estimates are those relating to the allowance for doubtful accounts, the reserve for returns and allowances, the inventory obsolescence reserve, vendor rebates, the realization of deferred tax assets and the valuation of goodwill and indefinite-lived assets. Actual results could differ materially from the estimates and assumptions used for the preparation of the financial statements.
Earnings (loss) per Share
Basic earnings (loss) per share are calculated by dividing net income (loss) by the weighted average number of common shares outstanding. Diluted earnings (loss) per share include the dilutive effects of option and unvested restricted stock awards and units.
The following reconciles the denominator used in the calculation of diluted earnings (loss) per share:
| Year Ended December 31, | ||||||||||||
| 2017 | 2016 | 2015 | ||||||||||
| Denominator: | ||||||||||||
| Weighted average common shares for basic earnings per share | 16,269,611 | 16,345,679 | 17,012,560 | |||||||||
| Effect of dilutive securities | — | — | 55,033 | |||||||||
| Denominator for diluted earnings per share | 16,269,611 | 16,345,679 | 17,067,593 | |||||||||
The Company calculates earnings per share using the “two-class” method, whereby unvested share-based payment awards that contain non-forfeitable rights to dividends or dividend equivalents are “participating securities”, as discussed in Note 9, and therefore, these participating securities are treated as a separate class in computing earnings per share. Stock awards to purchase 808,391, 685,054 and 643,738 shares of common stock were not included in the diluted net income (loss) per share calculation for 2017, 2016 and 2015, respectively, as their inclusion would have been anti-dilutive.
Accounts Receivable
Accounts receivable consists primarily of receivables from customers, less an allowance for doubtful accounts of $0.2 million at December 31, 2017 and 2016, and a reserve for returns and allowances of $0.4 million and $0.2 million at December 31, 2017 and 2016, respectively. The Company has no contractual repurchase arrangements with its customers. Credit losses have been within management’s expectations.
| F-6 |
The following table summarizes the changes in the allowance for doubtful accounts for the past three years:
| 2017 | 2016 | 2015 | ||||||||||
| (In thousands) | ||||||||||||
| Balance at beginning of year | $ | 151 | $ | 132 | $ | 139 | ||||||
| Bad debt expense | 68 | 285 | 97 | |||||||||
| Write-offs, net of recoveries | (47 | ) | (266 | ) | (104 | ) | ||||||
| Balance at end of year | $ | 172 | $ | 151 | $ | 132 | ||||||
Inventories
Inventories are carried at the lower of cost, using the average cost method, and net realizable value and consist primarily of goods purchased for resale, less a reserve for obsolescence and unusable items and unamortized vendor rebates. The reserve for inventory is based upon a number of factors, including the experience of the purchasing and sales departments, age of the inventory, new product offerings, and other factors. The reserve for inventory may periodically require adjustment as the factors identified above change. The inventory reserve was $3.9 million and $4.4 million at December 31, 2017 and 2016, respectively.
The following table summarizes the changes in the inventory reserves for the past three years:
| 2017 | 2016 | 2015 | ||||||||||
| (In thousands) | ||||||||||||
| Balance at beginning of year | $ | 4,366 | $ | 4,829 | $ | 4,478 | ||||||
| Provision for inventory write-downs | 34 | 93 | 397 | |||||||||
| Deduction for inventory write-offs | (475 | ) | (556 | ) | (46 | ) | ||||||
| Balance at end of year | $ | 3,925 | $ | 4,366 | $ | 4,829 | ||||||
Vendor Rebates
Under many of the Company’s arrangements with its vendors, the Company receives a rebate of a specified amount of consideration, payable when the Company achieves any of a number of measures, generally related to the volume level of purchases from the vendors. The Company accounts for such rebates as a reduction of the prices of the vendors’ products and therefore as a reduction of inventory until it sells the products, at which time such rebates reduce cost of sales in the accompanying consolidated statements of operations. Throughout the year, the Company estimates the amount of the rebates earned based on purchases to date relative to the total purchase levels expected to be achieved during the rebate period. The Company continually revises these estimates to reflect rebates expected to be earned based on actual purchase levels and forecasted purchase volumes for the remainder of the rebate period.
Property and Equipment
The Company provides for depreciation on a straight-line method over the following estimated useful lives:
| Buildings | 25 to 30 years | |
| Machinery and equipment | 3 to 10 years |
Leasehold improvements are depreciated over their estimated life or the term of the lease, whichever is shorter.
Total depreciation expense was approximately $1.4 million, $1.3 million and $1.2 million for the years ended December 31, 2017, 2016 and 2015, respectively.
Goodwill
Goodwill represents the excess of the amount paid to acquire businesses over the estimated fair value of tangible assets and identifiable intangible assets acquired, less liabilities assumed. Determining the fair value of assets acquired and liabilities assumed requires management’s judgment and often involves the use of significant estimates and assumptions, including assumptions with respect to future cash flows, discount rates and asset lives among other items. At December 31, 2017, the goodwill balance was $22.4 million, representing 11.5% of the Company’s total assets.
| F-7 |
The Company conducts impairment testing for goodwill annually in the fourth quarter of its fiscal year and more frequently, on an interim basis, when an event occurs or circumstances change that indicate that the fair value of a reporting unit may have declined below its carrying value. Events or circumstances which could indicate a probable impairment include, but are not limited to, financial performance, industry and market conditions, macroeconomic conditions, reporting unit-specific events, historical results of goodwill impairment testing and the timing of the last performance of a quantitative assessment.
The Company tests goodwill at the reporting unit level, which is defined as an operating segment or one level below an operating segment that constitutes a business for which financial information is available and is regularly reviewed by management. The Company determined that it has four reporting units for this purpose. Before testing goodwill, the Company considers whether or not to first assess qualitative factors to determine whether the existence of events or circumstances leads to a determination that it is more-likely-than-not that the fair value of a reporting unit is less than its carrying amount and whether an impairment test is required.
Intangibles
Intangible assets, from the acquisition of Southwest and Southern in 2010 and the acquisition of Vertex in October 2016, consist of customer relationships and tradenames. The customer relationships are amortized over 6 to 9 year useful lives. If events or circumstances were to indicate that any of the Company’s definite-lived intangible assets might be impaired, the Company would assess recoverability based on the estimated undiscounted future cash flows to be generated from the applicable intangible asset. If the undiscounted cash flows were less than the carrying value, then the intangible assets would be written down to their fair value. Tradenames have an indefinite life and are not being amortized and are tested for impairment on an annual basis.
Self Insurance
The Company retains certain self-insurance risks for both health benefits and property and casualty insurance programs. The Company limits its exposure to these self-insurance risks by maintaining excess and aggregate liability coverage. Self-insurance reserves are established based on claims filed and estimates of claims incurred but not reported. The estimates are based on information provided to the Company by its claims administrators.
Segment Reporting
The Company operates in a single operating and reportable segment, sales of industrial products, including electrical and mechanical wire and cable, industrial fasteners, hardware and related services to the U.S. market. The Company’s chief operating decision maker (“CODM”) is its Chief Executive Officer. The CODM makes operational and resource decisions based on company-wide sales and margin performance compared to the established strategic goals of the Company.
Revenue Recognition, Returns & Allowances
The Company recognizes revenue when the following four basic criteria have been met:
1. Persuasive evidence of an arrangement exists;
2. Delivery has occurred or services have been rendered;
3. The seller’s price to the buyer is fixed or determinable; and
4. Collectability is reasonably assured.
The Company records revenue when customers take delivery of products. Customers may pick up products at any distribution center location, or products may be delivered via third party carriers. Products shipped via third party carriers are considered delivered based on the shipping terms, which are generally FOB shipping point. Customers are permitted to return product only on a case-by-case basis. Product exchanges are handled as a credit, with any replacement item being re-invoiced to the customer. Customer returns are recorded as an adjustment to sales. In the past, customer returns have not been material. The Company has no installation obligations.
The Company may offer sales incentives, which are accrued monthly as an adjustment to sales.
Shipping and Handling
The Company incurs shipping and handling costs in the normal course of business. Freight amounts invoiced to customers are included as sales, and freight charges are included as a component of cost of sales.
| F-8 |
Credit Risk
No single customer accounted for 10% or more of the Company’s sales in 2017, 2016 or 2015. The Company performs periodic credit evaluations of its customers and generally does not require collateral.
Advertising Costs
Advertising costs are expensed when incurred. Advertising expenses were $0.5 million for the year ended December 31, 2017 and $0.4 million for each of the years ended December 31, 2016 and 2015.
Financial Instruments
The carrying values of accounts receivable, trade accounts payable and accrued and other current liabilities approximate fair value, due to the short maturity of these instruments. The carrying amount of long term debt approximates fair value as it bears interest at variable rates.
Recent Accounting Pronouncements
The Financial Accounting Standards Board (the “FASB”) Accounting Standards Codification (“ASC”) is the sole source of authoritative GAAP other than SEC issued rules and regulations that apply only to SEC registrants. The FASB issues an Accounting Standard Update ("ASU") to communicate changes to the codification. The Company considers the applicability and impact of all ASUs. The following are those ASUs that are relevant to the Company.
In May 2014, the FASB issued ASU No. 2014-09, “Revenue from Contracts with Customers” (Topic 606), which supersedes the revenue recognition requirements in ASC Topic 605, “Revenue Recognition,” and most industry-specific guidance. This ASU is based on the principle that revenue is recognized to depict the transfer of goods or services to customers in an amount that reflects the consideration to which the entity expects to be entitled in exchange for those goods or services. The ASU also requires additional disclosure about the nature, amount, timing and uncertainty of revenue and cash flows arising from customer contracts, including significant judgments and changes in judgments, and assets recognized from costs incurred to obtain or fulfill a contract. The amendments in the ASU must be applied using one of two retrospective methods and are effective for annual and interim periods beginning after December 15, 2017. The Company will adopt this ASU effective January 1, 2018 using the modified retrospective method. The Company has substantially completed its evaluation and has concluded that the adoption of this ASU does not materially change the timing of our revenue recognition and does not have a material impact on the consolidated financial statements.
In May 2017, the FASB issued ASU No. 2017-09, “Compensation-Stock Compensation (Topic 718): Scope of Modification Accounting.” The amendments in this update provide guidance about which changes to the terms and conditions of a share-based payment award, require the application of modification accounting. This update is effective for public companies for annual periods beginning after December 15, 2017. The Company is still reviewing the implications of this ASU, but based on current information, does not believe that the adoption will have a material impact on its results of operations.
In March 2017, the FASB issued ASU No. 2017-07, “Compensation – Retirement Benefits (Topic 715): Improving the Presentation of Net Periodic Pension Cost and Net Periodic Postretirement Benefit Cost.” The new guidance requires that an employer disaggregate the service cost component from the other components of net benefit cost. This update is effective for public companies for annual periods beginning after December 15, 2017. The Company has concluded that the adoption of this ASU will not have a material impact on the consolidated financial statements.
In January 2017, the FASB issued ASU No. 2017-04, “Intangibles – Goodwill and Other (Topic 350): Simplifying the Test for Goodwill Impairment.” The amendment in this ASU provides final guidance that simplifies the accounting for goodwill impairment for all entities by requiring impairment charges to be based on the first step in today’s two-step impairment test under ASC 350. ASU No. 2017-04 is effective for annual and interim impairment tests performed in periods beginning after December 15, 2019. Early adoption is permitted for annual and interim goodwill impairment testing dates after January 1, 2017. The Company is currently evaluating the impact of adopting, as well as the timing of when it will adopt, this ASU.
In August 2016, the FASB issued ASU No. 2016-15, “Statement of Cash Flows (Topic 230): Classification of Certain Cash Receipts and Cash Payments.” The amendments in this ASU address eight cash flow issues with the intention of reducing current diversity in practice among business entities. ASU No. 2016-15 is effective for annual and interim periods beginning after December 15, 2017; early adoption is permitted and should be applied retrospectively where practical. The Company adopted this guidance in the third quarter of 2016 and has applied it retrospectively. It did not have a material impact on the consolidated financial statements.
| F-9 |
In February 2016, the FASB issued ASU No. 2016-02, “Leases (Topic 842).” Under the new guidance, a lessee will be required to recognize a lease liability and a right-to-use asset for leases greater than one year, both financing and operating leases. This update is effective for public companies for fiscal years beginning after December 15, 2018 with early adoption permitted. This guidance will apply beginning January 2019, which is when the Company plans to adopt this ASU. The Company expects the adoption of this ASU will lead to a material increase in the assets and liabilities recorded on its Consolidated Balance Sheet.
Stock-Based Compensation
Stock options issued under the Company’s 2006 stock plan have an exercise price equal to the fair value of the Company’s stock on the grant date. Restricted stock awards, units and cash awards are valued at the closing price of the Company’s stock on the grant date. The Company recognizes compensation expense ratably over the vesting period. The Company’s stock-based compensation expense is included in salaries and commissions expense in the accompanying consolidated statements of operations.
The Company receives a tax deduction for certain stock option exercises in the period in which the options are exercised, generally for the excess of the market price on the date of exercise over the exercise price of the options. The Company reports excess tax benefits from the award of equity instruments as financing cash flows. Excess tax benefits result when a deduction reported for tax return purposes for an award of equity instruments exceeds the cumulative compensation cost for the instruments recognized for financial reporting purposes.
Income Taxes
Deferred tax assets and liabilities are determined based on differences between the carrying amounts of assets and liabilities for financial reporting purposes and the amounts used for income tax purposes and are measured using the enacted tax rates and laws that will be in effect when the differences are expected to reverse. The Company establishes a valuation allowance to reduce the deferred tax assets when it is more likely than not that some or all of the deferred tax assets will not be realized. In evaluating the ability to realize deferred tax assets, the Company considers all available positive and negative evidence, in determining whether, based on the weight of that evidence, a valuation allowance is needed for some or all of the deferred tax assets. In determining the need for a valuation allowance on the Company’s deferred tax assets the Company places greater weight on recent and objectively verifiable current information, as compared to more forward-looking information that is used in valuing other assets on the balance sheet. The Company has considered taxable income in prior carryback years future reversals of existing taxable temporary differences, future taxable income, and tax planning strategies in assessing the need for the valuation allowance.
| 2. | Business Combination |
On October 3, 2016, the Company completed the acquisition of Vertex from DXP Enterprises. The acquisition has been accounted for in accordance with ASC Topic 805, Business Combinations. Accordingly, the total purchase price has been allocated to the assets acquired and liabilities assumed based on their fair values as of the acquisition date. Vertex is a master distributor of industrial fasteners, specializing in corrosion resistant and specialty alloy inch and metric threaded fasteners, rivets, and hose clamps, to the industrial market. Under the terms of the acquisition agreement, the purchase price was $32.3 million, subject to an adjustment based on the net working capital of Vertex as of the date of closing. On May 2, 2017, the Company and DXP Enterprises finalized the working capital adjustment resulting in a final purchase price of $32.2 million. The Company treated the acquisition as a stock purchase for tax purposes. The amount of goodwill deductible for tax purposes is $1.0 million. The acquisition was funded by borrowing under the Company’s loan agreement. This acquisition expanded the Company’s product offerings to the industrial marketplace that purchases its wire and cable products.
During the third quarter 2017, the Company finalized its analysis of assets acquired and liabilities assumed, including accounts receivable, inventories and leases. The following table summarizes the final fair value of the acquired assets and assumed liabilities recorded as of the date of acquisition:
| At October 3, 2016 | ||||
| (In thousands) | ||||
| Cash | $ | 3 | ||
| Accounts receivable | 2,874 | |||
| Inventories | 15,006 | |||
| Prepaids | 46 | |||
| Property and equipment | 59 | |||
| Intangibles | 9,161 | |||
| Goodwill | 9,849 | |||
| Other assets | 116 | |||
| Total assets acquired | 37,114 | |||
| Trade accounts payable | 1,134 | |||
| Accrued and other current liabilities | 1,051 | |||
| Long-term obligation | 320 | |||
| Deferred income taxes | 2,432 | |||
| Total liabilities assumed | 4,937 | |||
| Net assets purchased | $ | 32,177 | ||
| F-10 |
The fair values of the assets acquired and liabilities assumed were determined using the market, income and cost approaches. The market approach used by the Company included prices at which comparable assets were purchased under similar circumstances. The income approach indicated value for the subject net assets based on the present value of cash flows projected to be generated by the net assets over their useful life. Projected cash flows were discounted at a market rate of return that reflected the relative risk associated with the asset and the time value of money. The cost approach estimated value by determining the current cost of replacing the asset with another of equivalent economic utility. The cost to replace a given asset reflected the estimated reproduction or replacement cost for the asset, less an allowance for loss in value due to depreciation.
Intangible assets acquired consist of customer relationships - $7.0 million and trade names - $2.1 million. Trade names are not being amortized, while customer relationships are being amortized over a 9 year useful life. As of December 31, 2017, accumulated amortization on the acquired intangible assets was $1.0 million, and amortization expense for the year ended December 31, 2017 was $0.8 million. Amortization expense to be recognized on the acquired intangible assets is expected to be $0.8 million per year in 2018 through 2024 and $0.6 million in 2025.
Goodwill represents the future economic benefits arising from other assets acquired that could not be individually identified and separately recognized. The goodwill arising from the acquisition consists primarily of sales and operational synergies that will be achieved by consolidating certain of Vertex’s locations into existing Company locations and expanding Vertex’s product offerings throughout the balance of the Company’s national platform.
The long-term obligation represents the unfavorable lease terms relative to market, and is being amortized over the remaining term of the lease, which was 66 months at December 31, 2017.
Under ASC Topic 805-10, acquisition-related costs (e.g. legal, valuation and advisory) are not included as a component of consideration paid, but are accounted for as operating expenses in the periods in which the costs are incurred. For the year ended December 31, 2016, the Company incurred $0.9 million of acquisition-related costs, which were recorded in other operating expenses on the statement of operations. In the year ended December 31, 2017 no acquisition-related costs were incurred.
| 3. | Detail of Selected Balance Sheet Accounts |
Property and Equipment
Property and equipment are stated at cost and consist of:
| At December 31, | ||||||||
| 2017 | 2016 | |||||||
| (In thousands) | ||||||||
| Land | $ | 2,476 | $ | 2,476 | ||||
| Buildings | 8,207 | 8,105 | ||||||
| Machinery and equipment | 14,165 | 12,934 | ||||||
| 24,848 | 23,515 | |||||||
| Less accumulated depreciation | 13,493 | 12,254 | ||||||
| Total | $ | 11,355 | $ | 11,261 | ||||
| F-11 |
Intangible assets
Intangible assets consist of:
| At December 31, | ||||||||
| 2017 | 2016 | |||||||
| (In thousands) | ||||||||
| Tradenames | $ | 5,996 | $ | 5,996 | ||||
| Customer relationships | 18,620 | 18,620 | ||||||
| 24,616 | 24,616 | |||||||
| Less accumulated amortization: | ||||||||
| Tradenames | — | — | ||||||
| Customer relationships | 12,601 | 11,238 | ||||||
| 12,601 | 11,238 | |||||||
| Total | $ | 12,015 | $ | 13,378 | ||||
Intangible assets include customer relationships which are being amortized over 7 to 9 year useful lives. The weighted average amortization period for intangible assets is 8.0 years. Tradenames have an indefinite life and are not amortized; however, they are tested annually for impairment. As of December 31, 2017, accumulated amortization on the acquired intangible assets was $12.6 million, and amortization expense was $1.4 million in the year ended December 31, 2017, $1.7 million in the year ended December 31, 2016 and $1.8 million in the year ended December 31, 2015. Future amortization expense to be recognized on the acquired intangible assets is expected to be as follows:
| Annual Amortization Expense | ||||
| (In thousands) | ||||
| 2018 | $ | 777 | ||
| 2019 | 777 | |||
| 2020 | 777 | |||
| 2021 | 777 | |||
| 2022 | 777 | |||
| 2023 | 777 | |||
| 2024 | 777 | |||
| 2025 | 583 | |||
Goodwill
| At December 31, | ||||||||
| 2017 | 2016 | |||||||
| (In thousands) | ||||||||
| Balance at beginning of year | $ | 22,770 | $ | 25,082 | ||||
| Current year acquisitions | — | 10,266 | ||||||
| 22,770 | 35,348 | |||||||
| Less accumulated impairment losses | — | 12,578 | ||||||
| Less purchase price adjustment | 417 | — | ||||||
| Balance at end of year | $ | 22,353 | $ | 22,770 | ||||
| F-12 |
Accrued and Other Current Liabilities
| Accrued and other current liabilities consist of: | At December 31, | |||||||
| 2017 | 2016 | |||||||
| (In thousands) | ||||||||
| Customer rebates | $ | 5,648 | $ | 3,343 | ||||
| Payroll, commissions, and bonuses | 3,056 | 1,783 | ||||||
| Accrued inventory purchases | 4,796 | 4,268 | ||||||
| Property taxes | 943 | 1,243 | ||||||
| Freight | 318 | 514 | ||||||
| Other | 2,062 | 2,097 | ||||||
| Total | $ | 16,823 | $ | 13,248 | ||||
| 4. | Impairment of Goodwill and Intangibles |
The annual goodwill and intangibles impairment qualitative test was performed as of October 1, 2017 for the Southern, Southwest and Vertex reporting units. This qualitative test, which compared current year-to-date performance to plan, indicated that it was more likely than not that goodwill and the intangibles were not impaired. If there are future reductions in our market capitalization and market multiples, or a unit’s projected performance is not achieved, a reporting unit could be at risk of failing the second step in the future.
During the second quarter of 2016 and prior to the annual impairment test of goodwill in October, the Company concluded that impairment indicators existed at the Houston Wire & Cable (“HWC”) reporting unit, due to a decline in its overall financial performance, decrease in the market capitalization and overall market demand. In the second quarter, the Company also concluded that there were impairment indicators for certain of the Company’s tradenames related to the Southern reporting unit.
The Company performed step one of the impairment test and concluded that the fair value of the HWC reporting unit was less than its carrying value. Therefore, the Company performed step two of the impairment analysis. The step one test also indicated that one of the tradenames at Southern was impaired, and the Company recorded a non-cash charge of less than $0.1 million against the tradenames during the quarter ended June 30, 2016.
Step two of the impairment analysis measured the impairment charge by allocating the HWC reporting unit’s fair value to all of the assets and liabilities of the reporting unit in a hypothetical analysis that calculated implied fair value of goodwill in the same manner as if the reporting unit was being acquired in a business combination and recording the deferred tax impact. Any excess of the carrying value of the reporting unit’s goodwill over the implied fair value of the reporting unit’s goodwill was recorded as an impairment loss.
The fair value of the HWC reporting unit was estimated using a discounted cash flow model (income approach) and a guideline public company method, giving 50% weight to each. The material assumptions used included a weighted average cost of capital of 11.0% and a long-term growth rate of 3-7% for the income approach and an adjusted invested capital multiple of 0.2 times revenue and a control premium of 10.0% for the guideline public company method. The carrying value of the HWC reporting unit’s goodwill was $2.4 million and its implied fair value resulting from step two of the impairment test was zero. As a result, the Company recorded a non-cash goodwill impairment charge of $2.4 million during the quarter ended June 30, 2016.
The fair values for goodwill and tradenames (indefinite-lived intangible assets) were both determined using a Level 3 measurement approach. The Level 3 value of all of the Company’s tradenames at June 30, 2016 was $4.5 million.
The Company is still anticipating significant growth in the businesses acquired in 2010 and in 2016, but if this growth is not achieved, further goodwill impairments may result.
| 5. | Debt |
On October 3, 2016, in connection with the Vertex acquisition, HWC Wire & Cable Company , the Company, Vertex, and Bank of America, N.A., as agent and lender, entered into a First Amendment (the “Loan Agreement Amendment”) amending the Fourth Amended and Restated Loan and Security Agreement (the “2015 Loan Agreement”). The Loan Agreement Amendment adds Vertex as borrower (and lien grantor) and provides the terms for inclusion of Vertex’s eligible accounts receivable and eligible inventory in the borrowing base for the 2015 Loan Agreement. The 2015 Loan Agreement was expanded to include incremental availability on eligible accounts receivable and inventory up to $5 million, which, starting April 1, 2017, is being amortized quarterly over two and a half years. The 2015 Loan Agreement provides a $100 million revolving credit facility and expires on September 30, 2020. Under certain circumstances the Company may request an increase in the commitment by an additional $50 million.
| F-13 |
Portions of the loan may be converted to LIBOR loans in minimum amounts of $1.0 million and integral multiples of $0.1 million. LIBOR loans bear interest at the British Bankers Association LIBOR Rate plus 100 to 150 basis points based on availability, and loans not converted to LIBOR loans bear interest at a fluctuating rate equal to the greatest of the agent’s prime rate, the federal funds rate plus 50 basis points, or 30-day LIBOR plus 150 basis points. The unused commitment fee is 25 basis points.
Availability under the 2015 Loan Agreement is limited to a borrowing base equal to 85% of the value of eligible accounts receivable, plus the lesser of 70% of the value of eligible inventory or 90% of the net orderly liquidation value percentage of the value of eligible inventory, in each case less certain reserves. The 2015 Loan Agreement is secured by substantially all of the property of the Company, other than real estate.
The 2015 Loan Agreement includes, among other things, covenants that require the Company to maintain a specified minimum fixed charge coverage ratio, unless certain availability levels exist. Additionally, the 2015 Loan Agreement allows for the unlimited payment of dividends and repurchases of stock, subject to the absence of events of default and maintenance of a fixed charge coverage ratio and/or minimum level of availability. The 2015 Loan Agreement contains certain provisions that may cause the debt to be classified as a current liability, in accordance with GAAP, if availability falls below certain thresholds, even though the ultimate maturity date under the loan agreement remains as September 30, 2020. At December 31, 2017, the Company was in compliance with the availability-based covenants governing its indebtedness.
The Company’s borrowings at December 31, 2017 and 2016 were $73.6 million and $60.4 million, respectively. The weighted average interest rates on outstanding borrowings were 3.2% and 2.4% at December 31, 2017 and 2016, respectively.
During 2017, the Company had an average available borrowing capacity of approximately $24.0 million. This average was computed from the monthly borrowing base certificates prepared for the lender. At December 31, 2017, the Company had available borrowing capacity of $23.0 million under the terms of the 2015 Loan Agreement. During each of the three years ended December 31, 2017, the Company paid, $0.1 million, $0.2 million and $0.2 million, respectively, for the unused facility.
Principal repayment obligations for succeeding fiscal years are as follows:
| (In thousands) | ||||
| 2017 | $ | — | ||
| 2018 | — | |||
| 2019 | — | |||
| 2020 | 73,555 | |||
| Total | $ | 73,555 | ||
| 6. | Income Taxes |
On December 22, 2017 the Tax Cuts and Jobs Act (“the Act”) was signed into law, making significant changes to the U.S. Internal Revenue Code. The major provisions include a corporate tax rate decrease from 35% to 21%, effective for years beginning after December 31, 2017, and changes in business-related exclusions and deductions.
As a result of the reduction in the U.S. corporate tax rate, the Company re-measured its deferred income tax balances at December 31, 2017. The Company has recorded a best estimate of the impact of the Act in the year-end income tax provision and as a result has recorded provisional income tax expense of $0.3 million in the fourth quarter of 2017, the period in which the legislation was enacted.
At December 31, 2017, the Company has not completed its accounting for the tax effects of the Act; however, for certain items, the Company has made a reasonable estimate of the effects on its existing deferred tax balances. The Company is still analyzing the Act and refining its calculations, which could potentially impact the measurement of the tax balances. The Company is also assessing the impact of the provisions of the Act which do not apply until 2018. Any subsequent adjustment to these estimates will be included in the current tax expense of future periods.
| F-14 |
The provision (benefit) for income taxes consists of:
| Year Ended December 31, | ||||||||||||
| 2017 | 2016 | 2015 | ||||||||||
| (In thousands) | ||||||||||||
| Current: | ||||||||||||
| Federal | $ | 1,280 | $ | (1,285 | ) | $ | 3,166 | |||||
| State | 159 | (95 | ) | 392 | ||||||||
| Total current | 1,439 | (1,380 | ) | 3,558 | ||||||||
| Deferred: | ||||||||||||
| Federal | 1,259 | 13 | (436 | ) | ||||||||
| State | 55 | (7 | ) | (49 | ) | |||||||
| Total deferred | 1,314 | 6 | (485 | ) | ||||||||
| Total | $ | 2,753 | $ | (1,374 | ) | $ | 3,073 | |||||
A reconciliation of the U.S. Federal statutory tax rate to the effective tax rate on income (loss) before taxes is as follows:
| Year Ended December 31, | ||||||||||||
| 2017 | 2016 | 2015 | ||||||||||
| Federal statutory rate | 35.0 | % | 35.0 | % | 35.0 | % | ||||||
| State taxes, net of federal benefit | 4.2 | 1.7 | 4.1 | |||||||||
| Impairment, non-deductible portion | — | (6.6 | ) | 20.0 | ||||||||
| Share-based compensation | 15.2 | (9.0 | ) | 3.7 | ||||||||
| Non-deductible items | 4.6 | (3.9 | ) | 3.0 | ||||||||
| Valuation allowance | 41.0 | — | — | |||||||||
| Tax reform rate change | 12.9 | — | — | |||||||||
| Other | (4.1 | ) | 1.4 | (5.7 | ) | |||||||
| Total effective tax rate | 108.8 | % | 18.6 | % | 60.1 | % | ||||||
The share-based compensation resulted in incremental income tax expense, because the grant date fair value of share-based payments exceeded the actual tax deductions realized, either upon exercise or vesting or due to forfeitures. Any future net deficits arising from stock-based compensation transactions will result in incremental income tax expense, and will likely negatively impact the effective tax rate. In 2015, the other credit includes the impact of over accruals of both federal and state taxes in earlier years. The current year tax charge included $1.0 million for the impact of the valuation allowance.
| F-15 |
Significant components of the Company’s deferred taxes were as follows:
| Year Ended December 31, | ||||||||
| 2017 | 2016 | |||||||
| (In thousands) | ||||||||
| Deferred tax assets: | ||||||||
| Uniform capitalization adjustment | $ | 1,272 | $ | 1,420 | ||||
| Inventory valuation | 1,334 | 2,496 | ||||||
| Accounts receivable valuation | 51 | 159 | ||||||
| Stock compensation expense | 725 | 1,368 | ||||||
| Property and equipment | 62 | 145 | ||||||
| Other | 134 | 96 | ||||||
| Total deferred tax assets | 3,578 | 5,684 | ||||||
| Deferred tax liabilities | ||||||||
| Goodwill | 460 | 393 | ||||||
| Intangibles | 2,385 | 4,211 | ||||||
| Other | 109 | 188 | ||||||
| Total deferred tax liabilities | 2,954 | 4,792 | ||||||
| Less: Valuation allowance | 1,038 | — | ||||||
| Net deferred tax (liabilities)/assets | $ | (414 | ) | $ | 892 | |||
The Company establishes a valuation allowance to reduce the deferred tax assets when it is more likely than not that some portion or all of the deferred tax assets will not be realized. In evaluating the ability to realize deferred tax assets, the Company considers all available positive and negative evidence, in determining whether, based on the weight of that evidence, a valuation allowance is needed for some or all of their deferred tax assets. In determining the need for a valuation allowance on the Company’s deferred tax assets the Company places greater weight on recent and objectively verifiable current information, as compared to more forward-looking information that is used in valuing other assets on the balance sheet. The Company has considered taxable income in prior carryback years, future reversals of existing taxable temporary differences, future taxable income, and tax planning strategies in assessing the need for the valuation allowance. If the Company was to determine that it would be able to realize the deferred tax assets in the future in excess of their net recorded amount, the Company would make an adjustment to the valuation allowance, which would reduce the provision for income taxes. Due to the level of losses incurred in 2016, management believes that it is more-likely-than-not that the Company would not be able to realize all of the benefits of its deferred tax assets and accordingly recognized a valuation allowance of $1.0 million for the year ended December 31, 2017.
The Company does not have any unrecognized tax benefits recorded at December 2017, 2016 and 2015. The Company recognizes interest on any tax issue as a component of interest expense and any related penalties in other operating expenses. As of December 31, 2017, 2016 and 2015, the Company recorded no provision for interest or penalties related to uncertain tax positions. The tax years 2013 through 2017 remain open to examination by the major taxing jurisdictions to which the Company is subject.
| 7. | Stockholders’ Equity |
On March 7, 2014, the Board of Directors adopted a stock repurchase program under which the Company is authorized to purchase up to $25 million of its outstanding shares of common stock from time to time, depending on market conditions, trading activity, business conditions and other factors. Shares of stock purchased under the program are held as treasury shares and may be used to satisfy the exercise of options, issuance of restricted stock, to fund acquisitions or for other uses as authorized by the Board of Directors. In November 2016, the Board of Directors suspended purchases under the stock repurchase program. During 2016, the Company made repurchases under the stock repurchase program of 366,820 shares for a total cost of $2.2 million.
Under the terms of the 2006 Stock Plan, the Company acquired 27,156 shares and 10,040 shares that were surrendered by the holders to pay withholding taxes in 2017 and 2016, respectively.
The Company paid a quarterly cash dividend from August 2007 until August 2016, resulting in aggregate dividends in 2016 and 2015 of $2.5 million and $7.2 million, respectively.
The Company is authorized to issue 5,000,000 shares of preferred stock, par value $.001 per share. The Board of Directors is authorized to fix the particular preferences, rights, qualifications and restrictions of each series of preferred stock. In connection with the adoption of a now terminated stockholder rights plan, the Board of Directors designated 100,000 shares as Series A Junior Participating Preferred Stock. No shares of preferred stock have been issued.
| F-16 |
| 8. | Retirement-related Benefits |
Defined Contribution Plan
The Company maintains a combination profit-sharing plan and salary deferral plan for the benefit of its employees who are not covered by a collective bargaining agreement. Employees who are eligible to participate in the plan can contribute a percentage of their base compensation, up to the maximum percentage allowable not to exceed the limits U.S. of Internal Revenue Code Sections 401(k), 404, and 415, subject to the IRS-imposed dollar limit. Employee contributions are invested in certain equity and fixed-income securities, based on employee elections. The Company matches 100% of the first 1% of the employee’s contribution. The Company’s match for the years ended December 31, 2017, 2016 and 2015 was $0.2 million for each year.
Defined Benefit Plan
The Company has a non-contributory defined benefit pension plan for those current and former employees at its Vertex location in Attleboro, Massachusetts who are subject to a collective bargaining agreement under the PFI Union. Currently, there are fifteen active employees, fourteen retired and eight terminated employees, covered by the plan.
The benefit provisions to participants of the defined benefit plan are calculated based on the number of years of service and an annual negotiated plan benefit per year of service. Annual compensation (or future compensation increases) is not used in calculating the benefit or future plan contributions.
It is the Company’s policy to fund amounts for pensions sufficient to meet the minimum funding requirements set forth in applicable employee benefit laws, which currently approximate the benefit payments made each year. A total contribution of less than $0.1 million was made during the year.
The current projected benefit obligation as of December 31, 2017 is $1.0 million. The discount rate used to determine the projected benefit obligation was 3.77%.
The Company’s investment policy is to maximize the expected return for an acceptable level of risk. The expected long-term rate of return on plan assets, which was 5%, is based on a target allocation of assets, which is based on the goal of earning the highest rate of return while maintaining risk at acceptable levels. As of December 31, 2017, the target asset allocations for the defined benefit plan were 69% equity securities and 31% debt securities.
The fair value of the assets of the defined benefit plan as of December 31, 2017 was $1.1 million, which consisted of $0.8 million of equity mutual funds and $0.3 million of fixed income – corporate bonds. The plan assets are all classified as Level 1 and as such have readily observable prices and therefore a reliable fair market value.
The Company expects to contribute approximately $0.1 million to the defined benefit plan in 2018 and expects the annual benefit payments to be approximately $0.1 million per year.
| 9. | Incentive Plans |
On August 4, 2017, the Board of Directors approved the Houston Wire & Cable Company 2017 Stock Plan (the “2017 Plan”). The 2017 Plan provides for discretionary grants of stock options, stock awards, stock units and stock appreciation rights (SARs) to employees and directors up to a total of 1,000,000 shares. Shares issuable under the 2017 Plan may be authorized but unissued shares or treasury shares. If any award granted under the 2017 Plan expires, terminates or is forfeited or cancelled for any reason, the shares subject to the award will again be available for issuance. Any shares subject to an award that are delivered to the Company or withheld by the Company on behalf of a participant as payment for the award (including the exercise price of a stock option or SAR) or as payment for any withholding taxes due in connection with the award, or that are purchased by the Company with proceeds received from a stock option exercise, will not again be available for issuance. The 2017 Plan’s purpose is to attract and retain outstanding individuals as employees and directors of the Company and its subsidiaries and to provide them with additional incentive to expand and improve the Company's profits by giving them the opportunity to acquire or increase their proprietary interest in the Company. The Company will submit the 2017 Plan for approval by stockholders at the 2018 Annual Meeting.
The 2017 Plan succeeded the Company’s 2006 Stock Plan (the “2006 Plan”), which expired on May 1, 2017. The types of equity awards previously authorized under the 2006 Plan did not significantly differ from those permitted under the 2017 Plan.
| F-17 |
Stock Option Awards
The Company has granted options to purchase its common stock to employees and directors of the Company under the 2006 Plan at no less than the fair market value of the underlying stock on the date of grant. These options are granted for a term not exceeding ten years and may be forfeited in the event the employee or director terminates his or her employment or relationship with the Company. Options granted to employees generally vest over three to five years, and options granted to directors generally vest one year after the date of grant. Shares issued to satisfy the exercise of options may be newly issued shares or treasury shares. The plan contains anti-dilutive provisions that permit an adjustment of the number of shares of the Company’s common stock represented by each option for any change in capitalization. Compensation cost for options granted is charged to expense on a straight line basis over the term of the option.
The fair value of each option awarded is estimated on the date of grant using a Black-Scholes option-pricing model. Expected volatilities are based on historical volatility of the Company’s stock and other factors. The expected life of options granted represents the period of time that options granted are expected to be outstanding. The risk-free rate for periods within the life of the option is based on the U.S. Treasury yield curve in effect at the time of grant. There were no options granted in 2017 or 2016.
All granted stock options have vested, with the last grant having an expiration date of December 20, 2021. The following summarizes stock option activity and related information:
| 2017 | ||||||||||||||||
| Options (in 000’s) | Weighted Average Exercise Price | Aggregate Intrinsic Value | Weighted Average Remaining Contractual Life (in years) | |||||||||||||
| Outstanding—Beginning of year | 314 | $ | 13.85 | $ | — | 3.28 | ||||||||||
| Granted | — | — | ||||||||||||||
| Exercised | — | — | ||||||||||||||
| Forfeited | (48 | ) | 12.89 | |||||||||||||
| Expired | (43 | ) | 18.89 | |||||||||||||
| Outstanding—End of year | 223 | 13.10 | $ | — | 2.84 | |||||||||||
| Exercisable—End of year | 223 | 13.10 | $ | — | 2.84 | |||||||||||
| Weighted average fair value of options granted during 2017 | $ | — | ||||||||||||||
| Weighted average fair value of options granted during 2016 | $ | — | ||||||||||||||
| Weighted average fair value of options granted during 2015 | $ | — | ||||||||||||||
There was no excess tax benefit for the years ended December 31, 2017, 2016 and 2015.
There were no options exercised in the years ended December 31, 2017 and 2016. The total intrinsic value of options exercised during the year ended December 31, 2015 was less than $0.1 million. There is no intrinsic value of options outstanding and exercisable as of December 31, 2017 as the closing stock price at the end of 2017 creates a negative intrinsic value.
The total grant-date fair value of options vested during the years ended December 31, 2017, 2016 and 2015 was $0.2 million, $0.3 million and $0.1 million, respectively.
Restricted Stock Awards, Restricted Stock Units and Cash Awards
Liability (cash) awards
Following the Annual Meeting of Stockholders on May 5, 2017, the Company approved the award of restricted stock units with a value of $60,000 to each non-employee director who was elected or re-elected, for an aggregate of 37,500 restricted stock units. Issuance of the restricted stock unit awards was subject to adoption of the 2017 Plan, as the Company’s 2006 Stock Plan expired on May 1, 2017. Each award of restricted stock units will vest at the date of the 2018 Annual Meeting of Stockholders. In addition, on August 4, 2017, the Company approved the award of 7,653 restricted stock units with a value of $45,000 to a newly elected non-employee director. Until the 2017 Plan has been approved by the Company’s stockholders, each restricted stock unit entitles the non-employee director to receive, at such time as the director’s service on the board terminates for any reason, a cash payment equal to the market value of one share of the Company’s common stock, together with dividend equivalents from the date of grant, at the time of payment. Following stockholder approval of the 2017 Plan, instead of such cash payment each non-employee director will be entitled to receive a number of shares of the Company’s common stock equal to the number of vested restricted stock units, together with dividend equivalents from the date of grant, at such time as the director’s service on the board terminates for any reason. At the time the awards vest, they will represent the right to receive shares of common stock.
| F-18 |
On August 4, 2017, the Company approved an award of restricted stock units with a value of $50,000 to a new member of senior management, based on the closing price on the date of grant. These units vest in one third increments, on the third, fourth and fifth anniversaries of the date of grant, as long as the recipient is still employed by the Company. Assuming the stockholders approve the Plan at the 2018 Annual Meeting, upon vesting each restricted stock unit will entitle the recipient to receive one share of the Company’s common stock, together with dividend equivalents from the date of grant.
On December 11, 2017, the Board of Directors granted to the Company’s President and CEO 46,154 restricted stock units and an additional 46,154 performance stock units. The restricted stock units vest in equal thirds on December 11, 2018, 2019 and 2020. The performance stock units will vest on December 31, 2020 based on the Company’s achievement of cumulative EBITDA and stock price performance goals over a three-year period, as long as the recipient is then employed by the Company. Any dividends declared will be accrued and paid if and when the related units vest and are settled.
In addition, on December 11, 2017, the Board of Directors also granted $330,000 of restricted stock units to members of management. These units vest in one third increments, on the third, fourth and fifth anniversaries of the date of grant, as long as the recipient is then employed by the Company. Any dividends declared will be accrued and paid if and when the related units vest and are settled.
Until the 2017 Plan has been approved by the Company’s stockholders, each restricted stock unit may be settled only in cash. Following stockholder approval of the 2017 Plan, instead of a cash payment, upon vesting of a restricted stock unit, the recipient will be entitled to receive shares of the Company’s common stock.
As long as they can be settled only in cash, the awards discussed above are liability awards and are required to be fair valued every quarter and any difference accounted for in the statement of operation. The fair value of these awards is $0.2 million as of December 31, 2017.
Equity awards
On January 30, 2017, the Board of Directors granted to the Company’s President and CEO 60,000 voting shares of restricted stock and performance stock units with respect to an additional 40,000 shares of common stock under the 2006 Plan. The 60,000 shares of restricted stock vest in one-third increments on January 30, 2018, December 19, 2018 and December 19, 2019, in each case as long as the recipient is then employed by the Company. The performance stock units vest on December 31, 2019 based on and subject to the Company’s achievement of cumulative EBITDA and stock price performance goals over a three-year period, as long as the recipient is then employed by the Company, and upon vesting will be settled in shares of the Company’s common stock. Any dividends declared will be accrued and paid if and when the related shares or units vest.
Restricted common shares and restricted stock units are measured at fair value on the date of grant based on the quoted price of the common stock. Such value is recognized as compensation expense over the corresponding vesting period which ranges from one to five years, based on the number of awards that vest.
| F-19 |
The following summarizes restricted stock activity for the year ended December 31, 2017:
| 2017 | ||||||||||||||||
| Shares | Units | |||||||||||||||
| Shares (in 000’s) | Weighted Average Market Value at Grant Date | Shares (in 000’s) | Weighted Average Market Value at Grant Date | |||||||||||||
| Non-vested —Beginning of year | 299 | $ | 7.88 | 36 | $ | 7.04 | ||||||||||
| Granted | 60 | 7.50 | 40 | 7.50 | ||||||||||||
| Vested | (94 | ) | 9.02 | (36 | ) | 7.04 | ||||||||||
| Cancelled/Forfeited | (27 | ) | 7.94 | — | — | |||||||||||
| Expired | — | — | — | — | ||||||||||||
| Non-vested —End of year | 238 | $ | 7.33 | 40 | $ | 7.50 | ||||||||||
Total stock-based compensation cost was $1.2 million for the year ended December 31, 2017, of which $1.0 million was for equity awards and $0.2 million was for liability awards, and $0.9 million for each of the years ended December 31, 2016 and 2015. Total income tax benefit recognized for equity awards stock-based compensation arrangements was $0.2 million for the year ended December 31, 2017 and $0.3 million for each of the years ended December 31, 2016 and 2015.
As of December 31, 2017, there was $2.2 million of total unrecognized compensation cost related to non-vested, share-based compensation arrangements, of which $1.3 million was for equity awards and $0.9 million was for liability awards. The cost for equity and liability awards is expected to be recognized over a weighted average period of approximately 28 months and 38 months, respectively.
| 10. | Commitments and Contingencies |
The Company has entered into operating leases, primarily for distribution centers and office facilities. These operating leases frequently include renewal options at the fair rental value at the time of renewal. For leases with step rent provisions, whereby the rental payments increase incrementally over the life of the lease, the Company recognizes the total minimum lease payments on a straight line basis over the minimum lease term. Facility rent expense was approximately $3.5 million in 2017, $2.6 million in 2016 and $2.5 million in 2015.
Future minimum lease payments under non-cancelable operating leases with initial terms of one year or more consisted of the following at December 31, 2017:
| (In thousands) | ||||
| 2018 | $ | 3,631 | ||
| 2019 | 3,058 | |||
| 2020 | 2,401 | |||
| 2021 | 2,133 | |||
| 2022 | 1,955 | |||
| Thereafter | 1,306 | |||
| Total minimum lease payments | $ | 14,484 | ||
The Company had aggregate purchase commitments for fixed inventory quantities of approximately $61.8 million at December 31, 2017.
As part of the acquisition of Southwest and Southern in 2010, the Company assumed the liability for the post-remediation monitoring of the water quality at one of the acquired facilities in Louisiana. The expected liability of $0.1 million at December 31, 2017 relates to the cost of the monitoring, which the Company estimates will be incurred in the next year and also the cost to plug the wells. Remediation work was completed prior to the acquisition in accordance with the requirements of the Louisiana Department of Environmental Quality.
| F-20 |
The Company, along with many other defendants, has been named in a number of lawsuits in the state courts of Minnesota, North Dakota, and South Dakota alleging that certain wire and cable which may have contained asbestos caused injury to the plaintiffs who were exposed to this wire and cable. These lawsuits are individual personal injury suits that seek unspecified amounts of money damages as the sole remedy. It is not clear whether the alleged injuries occurred as a result of the wire and cable in question or whether the Company, in fact, distributed the wire and cable alleged to have caused any injuries. The Company maintains general liability insurance that, to date, has covered the defense of and all costs associated with these claims. In addition, the Company did not manufacture any of the wire and cable at issue, and the Company would rely on any warranties from the manufacturers of such cable if it were determined that any of the wire or cable that the Company distributed contained asbestos which caused injury to any of these plaintiffs. In connection with ALLTEL's sale of the Company in 1997, ALLTEL provided indemnities with respect to costs and damages associated with these claims that the Company believes it could enforce if its insurance coverage proves inadequate.
There are no legal proceedings pending against or involving the Company that, in management’s opinion, based on the current known facts and circumstances, are expected to have a material adverse effect on the Company’s consolidated financial position, cash flows, or results from operations.
| 11. | Subsequent Events |
None.
| 12. | Select Quarterly Financial Data (unaudited) |
The following table presents the Company’s unaudited quarterly results of operations for each of the last eight quarters in the period ended December 31, 2017. The unaudited information has been prepared on the same basis as the audited consolidated financial statements.
| Year Ended December 31, 2017 | ||||||||||||||||
| Fourth Quarter | Third Quarter | Second Quarter | First Quarter | |||||||||||||
| (in thousands, except per share data) | ||||||||||||||||
| Sales | $ | 82,146 | $ | 81,196 | $ | 75,646 | $ | 78,709 | ||||||||
| Gross profit | $ | 20,843 | $ | 18,570 | $ | 16,318 | $ | 16,931 | ||||||||
| Operating income (loss) | $ | 2,969 | $ | 2,047 | $ | (162 | ) | $ | (250 | ) | ||||||
| Net income (loss) | $ | 1,996 | $ | (1,711 | ) | $ | (54 | ) | $ | (453 | ) | |||||
| Earnings (loss) per share: | ||||||||||||||||
| Basic | $ | 0.12 | (1) | $ | (0.11 | ) | $ | (0.00 | ) | $ | (0.03 | ) | ||||
| Diluted | $ | 0.12 | (1) | $ | (0.11 | ) | $ | (0.00 | ) | $ | (0.03 | ) | ||||
| Year Ended December 31, 2016 | ||||||||||||||||
| Fourth Quarter | Third Quarter | Second Quarter | First Quarter | |||||||||||||
| (in thousands, except per share data) | ||||||||||||||||
| Sales | $ | 69,257 | $ | 65,222 | $ | 62,454 | $ | 64,711 | ||||||||
| Gross profit | $ | 15,076 | $ | 12,045 | $ | 12,430 | $ | 13,399 | ||||||||
| Operating income (loss) | $ | (1,630 | )(2) | $ | (1,804 | ) | $ | (3,062 | )(3) | $ | (39 | ) | ||||
| Net income (loss) | $ | (1,826 | )(2) | $ | (1,439 | ) | $ | (2,557 | )(3) | $ | (184 | ) | ||||
| Earnings (loss) per share: | ||||||||||||||||
| Basic | $ | (0.11 | )(2) | $ | (0.09 | ) | $ | (0.16 | )(3) | $ | (0.01 | ) | ||||
| Diluted | $ | (0.11 | )(2) | $ | (0.09 | ) | $ | (0.16 | )(3) | $ | (0.01 | ) | ||||
| (1) | The “two-class” method was used to calculate earnings per share which resulted in the same value. |
| (2) | During the fourth quarter of 2016, the Company recorded a charge of $483 of additional cost of sales expense that related to the first three quarters of 2016 and was immaterial to each quarter. |
| (3) | During the second quarter of 2016, the Company recorded a non-cash impairment charge of $2,384. See Note 4 for additional information. |
| F-21 |
ITEM 9. CHANGES IN AND DISAGREEMENTS WITH ACCOUNTANTS ON ACCOUNTING AND FINANCIAL DISCLOSURE
None.
ITEM 9A. CONTROLS AND PROCEDURES
Evaluation of Disclosure Controls and Procedures
In accordance with Exchange Act Rules 13a-15 and 15a-15, we carried out an evaluation, under the supervision and with the participation of management, including our Chief Executive Officer and Chief Financial Officer, of the effectiveness of our disclosure controls and procedures as of the end of the period covered by this report. Based on that evaluation, our Chief Executive Officer and Chief Financial Officer concluded that our disclosure controls and procedures were effective as of December 31, 2017.
Design and Evaluation of Internal Control over Financial Reporting
Pursuant to Section 404 of the Sarbanes-Oxley Act of 2002, we included a report of management’s assessment of the design and effectiveness of our internal controls as part of this Annual Report on Form 10-K for the fiscal year ended December 31, 2017. Ernst & Young, LLP, our independent registered public accounting firm, also attested to our internal control over financial reporting. Management’s report and the independent registered accounting firm’s attestation report are included on pages 28 and 29 under the captions entitled “Management’s Report on Internal Control Over Financial Reporting” and “Report of Independent Registered Public Accounting Firm on Internal Control Over Financial Reporting.”
There has been no change in our internal controls over financial reporting that occurred during the quarter ended December 31, 2017 that has materially affected, or is reasonably likely to materially affect, our internal controls over financial reporting.
| 27 |
MANAGEMENT’S REPORT ON INTERNAL CONTROL OVER FINANCIAL REPORTING
The Company has assessed the effectiveness of its internal control over financial reporting as of December 31, 2017 based on criteria established by Internal Control — Integrated Framework issued by the Committee of Sponsoring Organizations of the Treadway Commission (2013 framework) (“COSO Framework”). The Company’s management is responsible for establishing and maintaining adequate internal controls over financial reporting. The Company’s independent registered public accountants that audited the Company’s financial statements as of December 31, 2017 have issued an attestation report on management’s assessment of the effectiveness of the Company’s internal control over financial reporting, which appears on page 29.
Internal control over financial reporting is a process designed to provide reasonable assurance regarding the reliability of financial reporting and the preparation of financial statements for external purposes in accordance with generally accepted accounting principles. Internal control over financial reporting includes those policies and procedures that: (1) pertain to the maintenance of records that, in reasonable detail, accurately and fairly reflect the transactions and dispositions of the assets of the company; (2) provide reasonable assurance that transactions are recorded as necessary to permit preparation of financial statements in accordance with generally accepted accounting principles, and that receipts and expenditures of the company are being made only in accordance with authorizations of management and directors of the company; and (3) provide reasonable assurance regarding prevention or timely detection of unauthorized acquisition, use, or disposition of the company’s assets that could have a material effect on the financial statements. Because of the inherent limitations, internal control over financial reporting may not prevent or detect misstatements. Also, projections of any evaluation of effectiveness to future periods are subject to the risk that controls may become inadequate because of changes in conditions, or that the degree of compliance with the policies and procedures may deteriorate.
The Company’s assessment of the effectiveness of its internal control over financial reporting included testing and evaluating the design and operating effectiveness of its internal controls. In management’s opinion, the Company has maintained effective internal control over financial reporting as of December 31, 2017, based on criteria established in the COSO Framework.
| /s/ James L. Pokluda III | /s/ Nicol G. Graham | |
| James L. Pokluda III | Nicol G. Graham | |
| President and Chief Executive Officer | Chief Financial Officer, Treasurer | |
| and Secretary (Chief Accounting Officer) |
| 28 |
Report of Independent Registered Public Accounting Firm
To the Stockholders and Board of Directors of Houston Wire & Cable Company
Opinion on Internal Control over Financial Reporting
We have audited Houston Wire & Cable Company’s internal control over financial reporting as of December 31, 2017, based on criteria established in Internal Control—Integrated Framework issued by the Committee of Sponsoring Organizations of the Treadway Commission (2013 framework) (the COSO criteria). In our opinion, Houston Wire & Cable Company (the Company) maintained, in all material respects, effective internal control over financial reporting as of December 31, 2017, based on the COSO criteria.
We also have audited, in accordance with the standards of the Public Company Accounting Oversight Board (United States) (PCAOB), the consolidated balance sheets of the Company as of December 31, 2017 and 2016, the related consolidated statements of operations, stockholders' equity and cash flows for each of the three years in the period ended December 31, 2017, and the related notes and our report dated March 16, 2018 expressed an unqualified opinion thereon.
Basis for Opinion
The Company’s management is responsible for maintaining effective internal control over financial reporting and for its assessment of the effectiveness of internal control over financial reporting included in the accompanying Management’s Report on Internal Control Over Financial Reporting. Our responsibility is to express an opinion on the Company’s internal control over financial reporting based on our audit. We are a public accounting firm registered with the PCAOB and are required to be independent with respect to the Company in accordance with the U.S. federal securities laws and the applicable rules and regulations of the Securities and Exchange Commission and the PCAOB.
We conducted our audit in accordance with the standards of the PCAOB. Those standards require that we plan and perform the audit to obtain reasonable assurance about whether effective internal control over financial reporting was maintained in all material respects.
Our audit included obtaining an understanding of internal control over financial reporting, assessing the risk that a material weakness exists, testing and evaluating the design and operating effectiveness of internal control based on the assessed risk, and performing such other procedures as we considered necessary in the circumstances. We believe that our audit provides a reasonable basis for our opinion.
Definition and Limitations of Internal Control Over Financial Reporting
A company’s internal control over financial reporting is a process designed to provide reasonable assurance regarding the reliability of financial reporting and the preparation of financial statements for external purposes in accordance with generally accepted accounting principles. A company’s internal control over financial reporting includes those policies and procedures that (1) pertain to the maintenance of records that, in reasonable detail, accurately and fairly reflect the transactions and dispositions of the assets of the company; (2) provide reasonable assurance that transactions are recorded as necessary to permit preparation of financial statements in accordance with generally accepted accounting principles, and that receipts and expenditures of the company are being made only in accordance with authorizations of management and directors of the company; and (3) provide reasonable assurance regarding prevention or timely detection of unauthorized acquisition, use, or disposition of the company’s assets that could have a material effect on the financial statements.
Because of its inherent limitations, internal control over financial reporting may not prevent or detect misstatements. Also, projections of any evaluation of effectiveness to future periods are subject to the risk that controls may become inadequate because of changes in conditions, or that the degree of compliance with the policies or procedures may deteriorate.
| /s/ Ernst & Young LLP | |
| Houston, Texas | |
| March 16, 2018 |
| 29 |
None.
ITEM 10. DIRECTORS, EXECUTIVE OFFICERS AND CORPORATE GOVERNANCE
The information called for by Item 10 relating to directors and nominees for election to the Board of Directors is incorporated herein by reference to the “Election of Directors” section of the registrant’s definitive Proxy Statement relating to the Annual Meeting of Stockholders to be held on May 8, 2018. The information called for by Item 10 relating to executive officers and certain significant employees is set forth in Part I of this Annual Report on Form 10-K.
The information called for by Item 10 relating to disclosure of delinquent Form 3, 4 or 5 filers is incorporated herein by reference to the “General – Section 16 (a) Beneficial Ownership Reporting Compliance” section of the registrant’s definitive Proxy Statement relating to the Annual Meeting of Stockholders to be held on May 8, 2018.
The information called for by Item 10 relating to the code of ethics is incorporated herein by reference to the “Corporate Governance and Board Committees – Code of Business Conduct” section of the registrant’s definitive Proxy Statement relating to the Annual Meeting of Stockholders to be held on May 8, 2018.
The information called for by Item 10 relating to the procedures by which security holders may recommend nominees to the Board of Directors is incorporated herein by reference to the “Corporate Governance and Board Committees – Stockholder Recommendations for Director Nominations” section of the registrant’s definitive Proxy Statement relating to the Annual Meeting of Stockholders to be held on May 8, 2018.
The information called for by Item 10 relating to the audit committee and the audit committee financial expert is incorporated herein by reference to the “Corporate Governance and Board Committees – Committees Established by the Board of Directors – Audit Committee” section of the registrant’s definitive Proxy Statement relating to the Annual Meeting of Stockholders to be held on May 8, 2018.
ITEM 11. EXECUTIVE COMPENSATION
The information called for by Item 11 is incorporated herein by reference to the “Compensation Committee Report,” “Compensation Committee Interlocks and Insider Participation,” “Executive Compensation” and “Director Compensation” sections of the registrant’s definitive Proxy Statement relating to the Annual Meeting of Stockholders to be held on May 8, 2018.
ITEM 12. SECURITY OWNERSHIP OF CERTAIN BENEFICIAL OWNERS AND MANAGEMENT AND RELATED STOCKHOLDER MATTERS
The information called for by Item 12 is incorporated herein by reference to the “Stock Ownership of Certain Beneficial Owners and Management” and “Equity Compensation Plan Information” sections of the registrant’s definitive Proxy Statement relating to the Annual Meeting of Stockholders to be held on May 8, 2018.
ITEM 13. CERTAIN RELATIONSHIPS AND RELATED TRANSACTIONS, AND DIRECTOR INDEPENDENCE
The information called for by Item 13 is incorporated herein by reference to the “Corporate Governance and Board Committees – Director Independence” and “Related Person Transaction Policy” sections of the registrant’s definitive Proxy Statement relating to the Annual Meeting of Stockholders to be held on May 8, 2018.
ITEM 14. PRINCIPAL ACCOUNTING FEES AND SERVICES
The information called for by Item 14 is incorporated herein by reference to the “Principal Independent Accounting Fees and Services” section of the registrant’s definitive Proxy Statement relating to the Annual Meeting of Stockholders to be held on May 8, 2018.
| 30 |
ITEM 15. EXHIBITS AND FINANCIAL STATEMENT SCHEDULES
| (a) | The following financial statements of our Company and Report of the Independent Registered Public Accounting Firm are included in Part II: |
| • | Report of Independent Registered Public Accounting Firm | |
| • | Consolidated Balance Sheets as of December 31, 2017 and 2016 | |
| • | Consolidated Statements of Operations for the years ended December 31, 2017, 2016 and 2015 | |
| • | Consolidated Statements of Stockholders’ Equity for the years ended December 31, 2017, 2016 and 2015 | |
| • | Consolidated Statements of Cash Flows for the years ended December 31, 2017, 2016 and 2015 | |
| • | Notes to Consolidated Financial Statements |
| (b) | Financial Statement Schedules: |
Financial statement schedules have been omitted because they are either not applicable or the required information has been disclosed in the financial statements or notes thereto.
| (c) | Exhibits |
Exhibits are set forth on the attached exhibit index
Not applicable
| 31 |
INDEX TO EXHIBITS
| 32 |
| * | Management contract or compensatory plan or arrangement |
| ** | Filed herewith |
| 33 |
Pursuant to the requirements of Section 13 or 15(d) of the Securities Exchange Act of 1934, the registrant has duly caused this report to be signed on its behalf by the undersigned, thereunto duly authorized.
|
HOUSTON WIRE & CABLE COMPANY (Registrant) | ||
| Date: March 16, 2018 | By: | /s/ NICOL G. GRAHAM |
|
Nicol G. Graham Chief Financial Officer, Treasurer and Secretary | ||
Pursuant to the requirements of the Securities Exchange Act of 1934, this report has been signed below by the following persons on behalf of the registrant and in the capacities and on the dates indicated.
| SIGNATURE | TITLE | DATE | ||
| /s/ JAMES L. POKLUDA III | President, Chief Executive Officer and Director | March 16, 2018 | ||
| James L. Pokluda III | ||||
| /s/ NICOL G. GRAHAM |
Chief Financial Officer, Treasurer and Secretary (Principal Accounting Officer) |
March 16, 2018 | ||
| Nicol G. Graham | ||||
| /s/ WILLIAM H. SHEFFIELD | Chairman of the Board | March 16, 2018 | ||
| William H. Sheffield | ||||
| /s/ MICHAEL T. CAMPBELL | Director | March 16, 2018 | ||
| Michael T. Campbell | ||||
| /s/ ROY W. HALEY | Director | March 16, 2018 | ||
| Roy W. Haley | ||||
| /s/ MARK A. RUELLE | Director | March 16, 2018 | ||
| Mark A. Ruelle | ||||
| /s/ G. GARY YETMAN | Director | March 16, 2018 | ||
| G. Gary Yetman |
| 34 |