Attached files
| file | filename |
|---|---|
| EX-32.2 - EXHIBIT 32.2 - DAVEY TREE EXPERT CO | dt2017q410kex322.htm |
| EX-32.1 - EXHIBIT 32.1 - DAVEY TREE EXPERT CO | dt2017q410kex321.htm |
| EX-31.2 - EXHIBIT 31.2 - DAVEY TREE EXPERT CO | dt2017q410kex312.htm |
| EX-31.1 - EXHIBIT 31.1 - DAVEY TREE EXPERT CO | dt2017q410kex311.htm |
| EX-23 - EXHIBIT 23 - DAVEY TREE EXPERT CO | dt2017q410kex23.htm |
| EX-21 - EXHIBIT 21 - DAVEY TREE EXPERT CO | dt2017q410kex21.htm |
UNITED STATES
SECURITIES AND EXCHANGE COMMISSION
Washington, D.C. 20549
FORM 10-K
x ANNUAL REPORT PURSUANT TO SECTION 13 OR 15(d) OF THE SECURITIES EXCHANGE ACT OF 1934
For the fiscal year ended December 31, 2017
OR
¨ TRANSITION REPORT PURSUANT TO SECTION 13 OR 15(d) OF THE SECURITIES EXCHANGE ACT OF 1934
For the transition period from ______________ to ______________
Commission file number 000-11917

THE DAVEY TREE EXPERT COMPANY
(Exact name of registrant as specified in its charter)
Ohio | 34-0176110 |
(State or other jurisdiction of incorporation or organization) | (I.R.S. Employer Identification Number) |
1500 North Mantua Street
P.O. Box 5193
Kent, Ohio 44240
(Address of principal executive offices) (Zip code)
(330) 673-9511
(Registrant's telephone number, including area code)
Securities registered pursuant to Section 12(b) of the Act:
None
Securities registered pursuant to Section 12(g) of the Act:
Common Shares, $1.00 par value
Indicate by check mark if the registrant is a well-known seasoned issuer (as defined in Rule 405 of the Securities Act). Yes ¨ No x | ||||||||
Indicate by check mark if the registrant is not required to file reports pursuant to Section 13 or 15(d) of the Act. Yes ¨ No x | ||||||||
Indicate by check mark whether the registrant (1) has filed all reports required to be filed by Section 13 or 15(d) of the Securities Exchange Act of 1934 during the preceding 12 months (or for such shorter period that the registrant was required to file such reports), and (2) has been subject to such filing requirements for the past 90 days. Yes x No ¨ | ||||||||
Indicate by check mark whether the registrant has submitted electronically and posted on its corporate Web site, if any, every Interactive Data File required to be submitted and posted pursuant to Rule 405 of Regulation S-T(§ 232.405 of this chapter) during the preceding 12 months (or for such shorter period that the registrant was required to submit and post such files). Yes x No ¨ | ||||||||
Indicate by check mark if disclosure of delinquent filers pursuant to Item 405 of Regulation S-K is not contained herein, and will not be contained, to the best of registrant's knowledge, in definitive proxy or information statements incorporated by reference in Part III of this Form 10-K or any amendment to this Form 10-K. ¨ | ||||||||
Indicate by check mark whether the registrant is a large accelerated filer, an accelerated filer, a non-accelerated filer, a smaller reporting company or an emerging growth company. See the definitions of “large accelerated filer,” “accelerated filer”, “smaller reporting company” and "emerging growth company" in Rule 12b-2 of the Exchange Act. | ||||||||
(Check one): | ¨ | Large Accelerated Filer | x | Accelerated Filer | ¨ | Emerging Growth Company | ||
¨ | Non-Accelerated Filer (Do not check if a smaller reporting company) | ¨ | Smaller Reporting Company | |||||
If an emerging growth company, indicate by check mark if the registrant has elected not to use the extended transition period for complying with any new or revised financial accounting standards provided pursuant to Section 13(a) of the Exchange Act ¨ | ||||||||
Indicate by check mark whether the registrant is a shell company (as defined in Rule 12b-2 of the Act). Yes ¨ No x | ||||||||
There were 24,227,668 Common Shares outstanding as of March 9, 2018. The aggregate market value of the Common Shares held by nonaffiliates of the registrant as of July 1, 2017 was $390,025,072. For purposes of this calculation, it is assumed that the registrant's affiliates include the registrant's Board of Directors and its executive officers.
DOCUMENTS INCORPORATED BY REFERENCE
Portions of the registrant's definitive Proxy Statement for the 2018 Annual Meeting of Shareholders, to be held on May 15, 2018, are incorporated by reference into Part III (to be filed within 120 calendar days of the registrant’s fiscal year end).
NOTE REGARDING FORWARD-LOOKING STATEMENTS
This annual report on Form 10-K contains forward-looking statements (within the meaning of the Private Securities Litigation Reform Act of 1995) in "Item 7 - Management's Discussion and Analysis of Financial Condition and Results of Operations," "Item 7A - Quantitative and Qualitative Disclosures About Market Risk," and elsewhere. These statements relate to future events or our future financial performance. In some cases, forward-looking statements may be identified by terminology such as "may," "will," "should," "expects," "plans," "anticipates," "believes," "estimates," "predicts," "potential," "continue" or the negative of these terms or other comparable terminology. These statements are only predictions and involve known and unknown risks, uncertainties and other factors that may cause our or our industry's actual results, levels of activity, performance or achievements to differ materially from what is expressed or implied in these forward-looking statements. Some important factors that could cause actual results to differ materially from those in the forward-looking statements include:
▪ | Our business, other than tree services to utility customers, is highly seasonal and weather dependent. |
▪ | Various economic factors may adversely impact our customers’ spending and pricing for our services, and impede our collection of accounts receivable. |
▪ | Significant customers, particularly utilities, may experience financial difficulties, resulting in payment delays or delinquencies. |
▪ | The seasonal nature of our business and changes in general and local economic conditions, among other factors, may cause our quarterly results to fluctuate, and our prior performance is not necessarily indicative of future results. |
▪ | The uncertainties in the credit and financial markets may limit our access to capital. |
▪ | Significant increases in fuel prices for extended periods of time will increase our operating expenses. |
▪ | Fluctuations in foreign currency exchange rates may have a material adverse impact on our operating results. |
▪ | We have significant contracts with our utility, commercial and government customers that include liability risk exposure as part of those contracts. Consequently, we have substantial excess-umbrella liability insurance, and increases in the cost of obtaining adequate insurance, or the inadequacy of our self-insurance accruals or insurance coverages, could negatively impact our liquidity and financial condition. |
▪ | Because no public market exists for our common shares, the ability of shareholders to sell their common shares is limited. |
▪ | Significant increases in health care costs could negatively impact our results of operations or financial position. |
▪ | We are subject to intense competition. |
▪ | Our failure to comply with environmental laws could result in significant liabilities, fines and/or penalties. |
▪ | The impact of regulations initiated as a response to possible changing climate conditions could have a negative effect on our results of operations or our financial condition. |
▪ | We may encounter difficulties obtaining surety bonds or letters of credit necessary to support our operations. |
▪ | We are dependent, in part, on our reputation of quality, integrity and performance. If our reputation is damaged, we may be adversely affected. |
▪ | We may be unable to attract and retain a sufficient number of qualified employees for our field operations, and we may be unable to attract and retain qualified management personnel. |
▪ | Our facilities could be damaged or our operations could be disrupted, or our customers or vendors may be adversely affected, by events such as natural disasters, pandemics, terrorist attacks or other external events. |
▪ | A disruption in our information technology systems, including a disruption related to cybersecurity, could adversely affect our financial performance. |
▪ | We may be subject to third-party and governmental regulatory claims and litigation that may have an adverse effect on us. |
▪ | We may misjudge a competitive bid and be contractually bound to an unprofitable contract. |
Although we believe that the expectations reflected in the forward-looking statements are reasonable, we cannot guarantee future results, levels of activity, performance or achievements. We are under no duty to update any of the forward-looking statements after the date of this annual report on Form 10-K to conform these statements to actual future results.
Page 1
THE DAVEY TREE EXPERT COMPANY FORM 10-K For the Year Ended December 31, 2017 TABLE OF CONTENTS | |
Page | |
PART I | |
PART II | |
PART III | |
PART IV | |
“We,” “Us,” “Our,” “Davey” and “Davey Tree,” unless the context otherwise requires, means The Davey Tree Expert Company and its subsidiaries.
Page 2
PART I
Item 1. Business.
General
The Davey Tree Expert Company, which was founded in 1880 and incorporated in Ohio in 1909, and its subsidiaries ("we" or "us") provides a wide range of arboricultural, horticultural, environmental and consulting services to our customers throughout the United States and Canada. We have two reportable operating segments organized by type or class of customer: Residential and Commercial, and Utility.
Our Residential and Commercial segment provides services to our residential and commercial customers including: the treatment, preservation, maintenance, removal and planting of trees, shrubs and other plant life; the practice of landscaping, grounds maintenance, tree surgery, tree feeding and tree spraying; the application of fertilizer, herbicides and insecticides; and, natural resource management and consulting, forestry research and development, and environmental planning.
Our Utility segment is principally engaged in providing services to our utility customers--investor-owned, municipal utilities, and rural electric cooperatives--including: the practice of line-clearing and vegetation management around power lines, rights-of-way and chemical brush control; and, natural resource management and consulting, forestry research and development and environmental planning.
We also maintain research, technical support and laboratory diagnostic facilities.
Competition and Customers
Our Residential and Commercial segment is one of the largest national tree care organizations in the United States, and competes with other national and local firms with respect to its services. On a national level, our competition is primarily landscape construction and maintenance companies as well as residential and commercial lawn care companies. At a local and regional level, our competition comes mainly from small, local companies which are engaged primarily in tree care and lawn services. Our Utility segment is the second largest organization in the industry in the United States, and competes principally with one major national competitor, The Asplundh Tree Expert Co., as well as several smaller regional firms.
Principal methods of competition in both operating segments are customer service, marketing, image, performance and reputation. Our program to meet our competition stresses the necessity for our employees to have and project to customers a thorough knowledge of all horticultural services provided, and utilization of modern, well-maintained equipment. Pricing is not always a critical factor in a customer's decision with respect to our Residential and Commercial segment; however, pricing is generally the principal method of competition for our Utility segment, although in most instances consideration is given to reputation and past production performance.
We provide a wide range of horticultural services to private companies, public utilities, local, state and federal agencies, and a variety of industrial, commercial and residential customers. During 2017, we had revenues of approximately $104 million, or approximately 11% of total revenues, from Pacific Gas & Electric Company ("PG&E"), our largest customers.
Regulation and Environment
Our facilities and operations, in common with those of the industry generally, are subject to governmental regulations designed to protect the environment. This is particularly important with respect to our services regarding insect and disease control, because these services involve, to a considerable degree, the blending and application of spray materials, which require formal licensing in most areas. Constant changes in environmental conditions, environmental awareness, technology and social attitudes make it necessary for us to maintain a high degree of awareness of the impact such changes have on the market for our services. We believe that we comply in all material respects with existing federal, state and local laws regulating the use of materials in our spraying operations as well as the other aspects of our business that are subject to any such regulation.
Marketing
We solicit business from residential customers principally through referrals, direct mail programs and to a lesser extent through the placement of advertisements in national magazines and trade journals, local newspapers and "yellow pages" telephone directories. We also employ online marketing and lead generation strategies, including email marketing campaigns,
Page 3
search engine optimization, search engine marketing, and social media communication. Business from utility and commercial customers is obtained principally through negotiated contracts and competitive bidding. We carry out all of our sales and services through our employees. We generally do not use agents, and do not franchise our name or business.
Seasonality
Our business is seasonal, primarily due to fluctuations in horticultural services provided to Residential and Commercial customers and to a lesser extent by budget constraints imposed on our Utility customers. Because of this seasonality, we have historically incurred losses in the first quarter, while sales and earnings are generally highest in the second and third quarters of the calendar year. Consequently, this has created heavy demands for additional working capital at various times throughout the year. We borrow primarily against bank commitments in the form of a revolving credit facility to provide the necessary funds for our operations. You can find more information about our bank commitments in “Liquidity and Capital Resources” on pages 23-26 of this report under “Management’s Discussion and Analysis of Financial Condition and Results of Operations.”
Other Factors
Due to rapid changes in equipment technology and intensity of use, we must constantly update our equipment and processes to ensure that we provide competitive services to our customers and continue our compliance with the Occupational Safety and Health Act.
We own several trademarks including "Davey," "Davey and Design," "Arbor Green Pro," "Arbor Green," and "Davey Resource Group." Through substantial advertising and use, we believe that these trademarks have become of value in the identification and acceptance of our products and services.
Employees
We employed approximately 8,200 employees at December 31, 2017. However, employment levels fluctuate due to seasonal factors affecting our business. We consider our employee relations to be good.
Domestic and Foreign Operations
We sell our services to customers in the United States and Canada.
We do not consider the risks attendant to our business with foreign customers, other than currency exchange risks, to be materially different from those attendant to our business with domestic customers.
Financial Information About Segments and Geographic Areas
Certain financial information regarding our operations by segment and geographic area is contained in Note S to our consolidated financial statements, which are included in Part II, Item 8 of this report.
Access to Company Information
Davey Tree’s internet address is http://www.davey.com. Through our internet website, by hyperlink to the Securities and Exchange Commission (“SEC”) website (http://www.sec.gov), we make available, free of charge, our Annual Report on Form 10-K, quarterly reports on Form 10-Q, current reports on Form 8-K, and all amendments to those reports. Availability of the reports occurs contemporaneously with the electronic posting to the SEC’s website as the reports are electronically filed with or furnished to the SEC. The information on our website is not a part of this Annual Report on Form 10-K.
The following documents are also made available on our website and a copy will be mailed, without charge, upon request to our Corporate Secretary:
▪ | Code of Ethics |
▪ | Code of Ethics for Financial Matters |
Page 4
Item 1A. Risk Factors.
The factors described below represent the principal risks we face. Except as otherwise indicated, these factors may or may not occur and we are not in a position to express a view on the likelihood of any such factor occurring. Other factors may exist that we do not consider to be significant based on information that is currently available or that we are not currently able to anticipate.
Our business is highly seasonal and weather dependent.
Our business, other than tree services to utility customers, is highly seasonal and weather dependent, primarily due to fluctuations in horticultural services provided to Residential and Commercial customers. We have historically incurred losses in the first quarter, while revenue and operating income are generally highest in the second and third quarters of the calendar year. Inclement weather, such as uncharacteristically low or high (drought) temperatures, in the second and third quarters could dampen the demand for our horticultural services, resulting in reduced revenues that would have an adverse effect on our results of operations.
Economic conditions may adversely impact our customers’ future spending as well as pricing and payment for our services, thus negatively impacting our operations and growth.
Various economic factors may adversely impact the demand for our services and potentially result in depressed prices for our services and the delay or cancellation of projects. That may make it difficult to estimate our customers' requirements for our services and, therefore, add uncertainty to customer demand. Various economic factors and customers' confidence in future economic conditions may cause a reduction in our customers' spending for our services and may also impact the ability of our customers to pay amounts owed, which could reduce our cash flow and adversely impact our debt or equity financing. These events could have a material adverse effect on our operations and our ability to grow at historical levels.
Financial difficulties or the bankruptcy of one or more of our major customers could adversely affect our results.
Our ability to collect our accounts receivable and future sales depends, in part, on the financial strength of our customers. We grant credit, generally without collateral, to our customers. Consequently, we are subject to credit risk related to changes in business and economic factors throughout the United States and Canada. In the event customers experience financial difficulty, and particularly if bankruptcy results, our profitability may be adversely impacted by our failure to collect our accounts receivable in excess of our estimated allowance for uncollectible accounts. Additionally, our future revenues could be reduced by the loss of a customer due to bankruptcy. Our failure to collect accounts receivable and/or the loss of one or more major customers could have an adverse effect on our net income and financial condition.
Our business is dependent upon service to our utility customers and we may be affected by developments in the utility industry.
We derive approximately 51% of our total revenues from our Utility segment. Significant adverse developments in the utility industry generally, or specifically for our major utility customers, could result in pressure to reduce costs by utility industry service providers (such as us), delays in payments of our accounts receivable, or increases in uncollectible accounts receivable, among other things. As a result, such developments could have an adverse effect on our results of operations.
Our quarterly results may fluctuate.
We have experienced and expect to continue to experience quarterly variations in revenues and operating income as a result of many factors, including:
▪ | the seasonality of our business; |
▪ | the timing and volume of customers' projects; |
▪ | budgetary spending patterns of customers; |
▪ | the commencement or termination of service agreements; |
▪ | costs incurred to support growth internally or through acquisitions; |
▪ | changes in our mix of customers, contracts and business activities; |
▪ | fluctuations in insurance expense due to changes in claims experience and actuarial assumptions; and |
▪ | general and local economic conditions. |
Page 5
Accordingly, our operating results in any particular quarter may not be indicative of the results that you can expect for any other quarter or for the entire year.
We may not have access to capital in the future due to uncertainties in the financial and credit markets.
We may need new or additional financing in the future to conduct our operations, expand our business or refinance existing indebtedness. Future changes in the general economic conditions and/or financial markets in the United States or globally could affect adversely our ability to raise capital on favorable terms or at all. From time-to-time we have relied, and may also rely in the future, on access to financial markets as a source of liquidity for working capital requirements, acquisitions and general corporate purposes. Our access to funds under our revolving credit facility is dependent on the ability of the financial institutions that are parties to the facility to meet their funding commitments. Those financial institutions may not be able to meet their funding commitments if they experience shortages of capital and liquidity or if they experience excessive volumes of borrowing requests within a short period of time. Economic disruptions and any resulting limitations on future funding, including any restrictions on access to funds under our revolving credit facility, could have a material adverse effect on us.
We are subject to the risk of changes in fuel costs.
The cost of fuel is a major operating expense of our business. Significant increases in fuel prices for extended periods of time will cause our operating expenses to fluctuate. An increase in cost with partial or no corresponding compensation from customers would lead to lower margins that would have an adverse effect on our results of operations.
We are subject to the effect of foreign currency exchange rate fluctuations, which may have a material adverse impact on us.
We are exposed to foreign currency exchange rate risk resulting from our operations in Canada, where we provide a comprehensive range of horticultural services. Fluctuations in foreign currency exchange rates may make our services more expensive for others to purchase or increase our operating costs, affecting our competitiveness and our profitability. Our financial results could be affected by factors such as changes in the foreign currency exchange rate or differing economic conditions in the Canadian markets as compared with the markets for our services in the United States. Our earnings are affected by translation exposures from currency fluctuations in the value of the U.S. dollar as compared to the Canadian dollar.
Revenues from customers in Canada are subject to foreign currency exchange. Thus, certain revenues and expenses have been, and are expected to be, subject to the effect of foreign currency fluctuations, and these fluctuations may have a material adverse impact on our operating results, asset values and could reduce shareholders’ equity. In addition, if we expand our Canadian operations, exposures to gains and losses on foreign currency transactions may increase.
We could be negatively impacted if our self-insurance accruals or our insurance coverages prove to be inadequate.
We are generally self-insured for losses and liabilities related to workers' compensation, vehicle liability and general liability claims (including any wildfire-related claims, up to certain retained coverage limits). A liability for unpaid claims and associated expenses, including incurred but not reported losses, is actuarially determined and reflected in our consolidated balance sheet as an accrued liability. The determination of such claims and expenses, and the extent of the need for accrued liabilities, are continually reviewed and updated. If we were to experience insurance claims or costs above our estimates and were unable to offset such increases with earnings, our business could be adversely affected. Also, where we self-insure, a deterioration in claims management, whether by our management or by a third-party claims administrator, could lead to delays in settling claims, thereby increasing claim costs, particularly as it relates to workers’ compensation. In addition, catastrophic uninsured claims filed against us or the inability of our insurance carriers to pay otherwise-insured claims would have an adverse effect on our financial condition.
Furthermore, many customers, particularly utilities, prefer to do business with contractors with significant financial resources, who can provide substantial insurance coverage. Should we be unable to renew our excess liability insurance and other commercial insurance policies at competitive rates, this loss would have an adverse effect on our financial condition and results of operations.
Increases in our health insurance costs and uncertainty about federal health care policies could adversely affect our results of operations and cash flows.
The costs of employee health care insurance have been increasing in recent years due to rising health care costs, legislative changes, and general economic conditions. We cannot predict what other health care programs and regulations will ultimately
Page 6
be implemented at the federal or state level or the effect of any future legislation or regulations on our business, results of operations and cash flows. In addition, we cannot predict when and if Congress will repeal and/or replace certain health care programs and regulations at the federal level and the impact that such changes would have on our business. A continued increase in health care costs or additional costs incurred as a result of the Patient Protection and Affordable Care Act and the Health Care and Education Reconciliation Act of 2010 or other future health care reform laws imposed by Congress or state legislatures could have a negative impact on our financial position, results of operations and cash flows.
The unavailability or cancellation of third-party insurance coverage may have a material adverse effect on our financial condition and results of operations as well as disrupt our operations.
Any of our existing excess insurance coverage may not be renewed upon the expiration of the coverage period or future coverage may not be available at competitive rates for the required limits. In addition, our third-party insurers could fail, suddenly cancel our coverage or otherwise be unable to provide us with adequate insurance coverage. If any of these events occur, they may have a material adverse effect on our financial condition and results of operations as well as disrupt our operations. For example, we have operations in California, which has an environment prone to wildfires. Should our third-party insurers determine to exclude coverage for wildfires in the future, we could be exposed to significant liabilities, having a material adverse effect on our financial condition and results of operations and potentially disrupting our California operations.
Because no public market exists for our common shares, your ability to sell your common shares may be limited.
Our common shares are not traded on any national exchange, market system or over-the-counter bulletin board. Because no public market exists for our common shares, your ability to sell these shares is limited.
We are subject to intense competition.
We believe that each aspect of our business is highly competitive. Principal methods of competition in our operating segments are customer service, marketing, image, performance and reputation. Pricing is not always a critical factor in a customer’s decision with respect to our Residential and Commercial segment; however, pricing is generally the principal method of competition for our Utility segment, although in most instances consideration is given to reputation and past production performance. On a national level, our competition is primarily landscape construction and maintenance companies as well as residential and commercial lawn care companies. At a local and regional level, our competition comes mainly from small, local companies which are engaged primarily in tree care and lawn services. Our Utility segment competes principally with one major national competitor, as well as several smaller regional firms. Furthermore, competitors may have lower costs because privately-owned companies operating in a limited geographic area may have significantly lower labor and overhead costs. Our competitors may develop the expertise, experience and resources to provide services that are superior in both price and quality to our services. These strong competitive pressures could inhibit our success in bidding for profitable business and may have a material adverse effect on our business, financial condition and results of operations.
Our failure to comply with environmental laws could result in significant liabilities.
Our facilities and operations are subject to governmental regulations designed to protect the environment, particularly with respect to our services regarding insect and tree, shrub and lawn disease management, because these services involve to a considerable degree the blending and application of spray materials, which require formal licensing in most areas. Continual changes in environmental laws, regulations and licensing requirements, environmental conditions, environmental awareness, technology and social attitudes make it necessary for us to maintain a high degree of awareness of the impact such changes have on our compliance programs and the market for our services. We are subject to existing federal, state and local laws, regulations and licensing requirements regulating the use of materials in our spraying operations as well as certain other aspects of our business. If we fail to comply with such laws, regulations or licensing requirements, we may become subject to significant liabilities, fines and/or penalties, which could adversely affect our financial condition and results of operations.
We cannot predict the impact that policies regarding changing climate conditions, including legal, regulatory and social responses thereto, may have on our business.
Many scientists, environmentalists, international organizations, political activists, regulators and other commentators believe that global climate change has added, and will continue to add, to the unpredictability, frequency and severity of natural disasters in certain parts of the world. In response, a number of legal and regulatory measures and social initiatives have been introduced in an effort to reduce greenhouse gas and other carbon emissions that these parties believe may be contributors to global climate change. These proposals, if enacted, could result in a variety of regulatory programs, including potential new
Page 7
regulations, additional charges and taxes to fund energy efficiency activities, or other regulatory actions. Any of these actions could result in increased costs associated with our operations and impact the prices we charge our customers.
We cannot predict the impact, if any, that changing climate conditions will have on us or our customers. However, it is possible that the legal, regulatory and social responses to real or imagined climate change could have a negative effect on our results of operations or our financial condition.
We may be adversely affected if we are unable to obtain necessary surety bonds or letters of credit.
Surety market conditions are currently difficult as a result of significant losses incurred by many sureties in recent years, both in the construction industry as well as in certain larger corporate bankruptcies. As a result, less bonding capacity is available in the market and terms have become more expensive and restrictive. Further, under standard terms in the surety market, sureties issue or continue bonds on a project-by-project basis and can decline to issue bonds at any time or require the posting of collateral as a condition to issuing or renewing any bonds. If surety providers were to limit or eliminate our access to bonding, we would need to post other forms of collateral for project performance, such as letters of credit or cash. We may be unable to secure sufficient letters of credit on acceptable terms, or at all. Accordingly, if we were to experience an interruption or reduction in the availability of bonding capacity, our liquidity may be adversely affected.
We may be adversely affected if our reputation is damaged.
We are dependent, in part, upon our reputation of quality, integrity and performance. If our reputation were damaged in some way, it may impact our ability to grow or maintain our business.
We may be unable to employ a sufficient workforce for our field operations.
Our industry operates in an environment that requires heavy manual labor. We may experience slower growth in the labor force for this type of work than in the past. As a result, we may experience labor shortages or the need to pay more to attract and retain qualified employees.
We may be unable to attract and retain skilled management.
Our success depends, in part, on our ability to attract and retain key managers. Competition for the best people can be intense and we may not be able to promote, hire or retain skilled managers. The loss of services of one or more of our key managers could have a material adverse impact on our business because of the loss of the manager's skills, knowledge of our industry and years of industry experience, and the difficulty of promptly finding qualified replacement personnel.
Natural disasters, pandemics, terrorist attacks and other external events could adversely affect our business.
Natural disasters, pandemics, terrorist attacks and other adverse external events could materially damage our facilities or disrupt our operations, or damage the facilities or disrupt the operations of our customers or vendors. The occurrence of any such event could adversely affect our business, financial condition and results of operations.
A disruption in our information technology systems, including a disruption related to cybersecurity, could adversely affect our financial performance.
We rely on the accuracy, capacity and security of our information technology systems. Despite the security measures that we have implemented, including those measures related to cybersecurity, our systems could be breached or damaged by computer viruses, natural or man-made incidents or disasters or unauthorized physical or electronic access. A breach could result in business disruption, theft of our intellectual property, trade secrets or customer information and unauthorized access to personnel information. To the extent that our business is interrupted or data is lost, destroyed or inappropriately used or disclosed, such disruptions could adversely affect our competitive position, reputation, relationships with our customers, financial condition, operating results and cash flows. In addition, we may be required to incur significant costs to protect against the damage caused by these disruptions or security breaches in the future.
We are subject to third-party and governmental regulatory claims and litigation.
From time-to-time, customers, vendors, employees, governmental regulatory authorities and others may make claims and take legal action against us. Whether these claims and legal actions are founded or unfounded, if such claims and legal actions are not resolved in our favor, they may result in significant financial liability. Any such financial liability could have a
Page 8
material adverse effect on our financial condition and results of operations. Any such claims and legal actions may also require significant management attention and may detract from management's focus on our operations.
We may be adversely affected if we enter into a major unprofitable contract.
Our Residential and Commercial segment and our Utility segment frequently operate in a competitive bid contract environment. As a result, we may misjudge a bid and be contractually bound to an unprofitable contract, which could adversely affect our results of operations.
Item 1B. Unresolved SEC Staff Comments.
There are no unresolved comments from the Staff of the Securities and Exchange Commission.
Item 2. Properties.
Our corporate headquarters campus is located in Kent, Ohio, which, along with several other properties in the surrounding area, includes The Davey Institute's research, technical support and laboratory diagnostic facilities.
We conduct administrative functions through our headquarters and our offices in Livermore, California (Utility Services). Our Canadian operations’ administrative functions are conducted through properties located in the provinces of Ontario and British Columbia. We believe our properties are well maintained, in good condition and suitable for our present operations. A summary of our properties follows:
Segment | Number of Properties | How Held | Square Footage | Number of States or Provinces | |||||
Residential and Commercial | 29 | Owned | 274,271 | 15 | |||||
Utility | 3 | Owned | 36,037 | 3 | |||||
Residential and Commercial, and Utility | 3 | Owned | 30,080 | 3 | |||||
We also rent approximately 151 properties in 31 states and four provinces.
None of our owned or rented properties used by our business segments is individually material to our operations.
Item 3. Legal Proceedings.
In November 2017, a suit was filed against Davey Tree, its subsidiary, Wolf Tree, Inc., a former Davey employee, two Wolf employees, and a former Wolf employee alleging various acts of negligence and seeking compensatory and punitive damages for wrongful death and assault and battery of the plaintiff’s husband, a Wolf Tree employee in Savannah, Georgia, who was killed in August 2017. The Company has denied all liability and is vigorously defending the action. It also has retained separate counsel for three of the individual defendants, each of whom has denied all liability and also is vigorously defending the action.
On a quarterly basis, we assess our liabilities and contingencies in connection with outstanding legal proceedings utilizing the latest information available. Where it is probable that we will incur a loss and the amount of the loss can be reasonably estimated, we record a liability in our consolidated financial statements. These legal reserves may be increased or decreased to reflect any relevant developments on a quarterly basis. Where a loss is not probable or the amount of the loss is not estimable, we do not accrue legal reserves, consistent with applicable accounting guidance. Based on information currently available to us, advice of counsel, and available insurance coverage, we believe that our established reserves are adequate and the liabilities arising from the legal proceedings will not have a material adverse effect on our consolidated financial condition. We note, however, that in light of the inherent uncertainty in legal proceedings there can be no assurance that the ultimate resolution of a matter will not exceed established reserves. As a result, the outcome of a particular matter or a combination of matters may be material to our results of operations for a particular period, depending upon the size of the loss or our income for that particular period.
Item 4. Mine Safety Disclosures.
Not applicable.
Page 9
Executive Officers of the Company.
Our executive officers and their present positions and ages as of March 1, 2018 follow:
Name | Age | Position | Years with Company | Served as an Executive Officer Since |
Patrick M. Covey | 54 | President and Chief Executive Officer | 26 | 2007 |
Joseph R. Paul, CPA | 56 | Executive Vice President, Chief Financial Officer and Secretary | 12 | 2005 |
Lawrence S. Abernathy | 67 | Vice President, Davey Tree Surgery Company | 48 | 2015 |
Christopher J. Bast, CPA, CTP | 50 | Vice President and Treasurer | 4 | 2013 |
James E. Doyle | 49 | Executive Vice President and General Manager, Davey Tree Expert Co. of Canada, Limited | 28 | 2014 |
Gregory M. Ina | 46 | Executive Vice President, The Davey Institute and Employee Development | 22 | 2016 |
Dan A. Joy | 60 | Executive Vice President and General Manager, Commercial Landscape Services and Operations Support Services | 41 | 2013 |
Brent R. Repenning | 46 | Executive Vice President, U.S. Utility and Davey Resource Group | 23 | 2014 |
Thea R. Sears, CPA | 49 | Vice President and Controller | 24 | 2010 |
James F. Stief | 63 | Executive Vice President, U.S. Residential Operations | 39 | 2010 |
Mark J. Vaughn | 63 | Vice President and General Manager, Eastern Utility Services | 45 | 2013 |
Mr. Covey was appointed Chief Executive Officer effective July 21, 2017 and served as President and Chief Operating Officer since March 4, 2016 and as a Director since May 20, 2014. He previously served as President and Chief Operating Officer, U.S. Operations, having been appointed in April 2014, and as Chief Operating Officer, U.S. Operations, having been appointed in February 2012. Prior to that time, Mr. Covey served as Executive Vice President, having been appointed in January 2007, Vice President and General Manager of the Davey Resource Group, having been appointed in March 2005, and Vice President, Southern Operations, Utility Services, having been appointed in January 2003. Previously, having joined Davey Tree in August 1991, Mr. Covey held various managerial positions, including Manager of Systems and Process Management and Administrative Manager, Utility Services.
Mr. Paul was elected Executive Vice President, Chief Financial Officer and Secretary effective March 4, 2016 and served as Chief Financial Officer and Secretary, having been appointed in March 2013. Prior to that time, he served as Vice President and Treasurer, having been appointed in May 2011. Mr. Paul joined Davey Tree as Treasurer in December 2005.
Page 10
Mr. Abernathy was elected Vice President, Davey Tree Surgery Company, effective November 1, 2107 having previously served as Vice President and General Manager, Davey Tree Surgery Company, since April 2012, and as Senior Vice President, Davey Tree Surgery Company, having been appointed in July 2010. Prior to that time, he served as Vice President, Utility Operations, having been appointed in April 1995. Previously, having joined Davey Tree in 1969, Mr. Abernathy held various managerial positions, including Operations Manager, Area Manager and Account Manager.
Mr. Bast was elected Vice President effective September 18, 2017 having previously served as Treasurer since April 2013. Mr. Bast joined Davey Tree in March 2013 and prior to joining us, served in various management positions from 1994 to 2013 at Diebold, Incorporated, a provider of self-service delivery and security systems.
Mr. Doyle was elected Executive Vice President and General Manager, Davey Tree Expert Co. of Canada, Limited (“Davey Tree Limited”), effective May 21, 2014 and served as Vice President and General Manager, Davey Tree Limited, having been appointed in February 2012. Prior to that time, he served as Vice President and General Manager, Operations, Davey Tree Limited, having been appointed in May 2011 and Vice President, Operations, Davey Tree Limited, having been appointed in January 2006. Previously, having joined Davey Tree in 1989, Mr. Doyle held various managerial positions, including District Manager and Operations Manager.
Mr. Ina was elected Executive Vice President, The Davey Institute and Employee Development in July 2017, having previously served as Vice President and General Manager of Research, Recruiting and Human Resource Development effective April 4, 2016, and having previously been elected an officer effective March 4, 2016. Prior to this time, he served as Vice President and General Manager of the Davey Institute, having been appointed in May 2009 and General Manager of the Davey Institute, having been appointed in May 2006. Previously, having joined Davey Tree in 1996, Mr. Ina held various managerial and operational positions in the Davey Institute and Davey Resource Group.
Mr. Joy was elected Executive Vice President and General Manager, Commercial Landscape Services and Operations Support Services, effective August 15, 2014 and served as Executive Vice President and General Manager, Commercial Landscape Services, having been appointed in May 2014. Prior to that time, he served as Vice President and General Manager, Commercial Landscape Services, having been appointed in May 2013, and Vice President, Commercial Landscape Services, having been appointed in December 2004. Previously, having joined Davey Tree in 1976, Mr. Joy held various managerial positions, including Operations Manager, District Manager and Assistant District Manager.
Mr. Repenning was elected Executive Vice President, U.S. Utility and Davey Resource Group in July 2017, having previously served as Senior Vice President, Davey Resource Group and Eastern Utility, effective October 2, 2016 and served as Vice President and General Manager, Davey Resource Group, having been appointed in June 2010. Prior to that time, he served as Vice President, Davey Resource Group, having been appointed in October 2009. Previously, having joined Davey Tree in 1994, Mr. Repenning held various managerial and operational positions, including Regional Manager, Production Manager and Supervisor.
Ms. Sears was elected Vice President effective September 18, 2017 having served as Controller since September 16, 2016 and prior to that, served as Assistant Controller, having been appointed in May 2010. Prior to that time, she served as Manager of Financial Accounting, having been appointed in April 1998, and as Supervisor of Financial Accounting, having been appointed in September 1995. Having joined Davey Tree in 1993, Ms. Sears has held a variety of roles in financial reporting, managerial reporting and operations accounting.
Mr. Stief was elected Executive Vice President, U.S. Residential Operations, effective February 12, 2012 and previously served as Vice President and General Manager, Residential/Commercial Services, since January 2010. Prior to that time, Mr. Stief served as Vice President and General Manager, South, West and Central Residential/Commercial Operations, having been appointed in January 2007, and Vice President South, West and Central Residential/Commercial Operations, having been appointed in January 1997. Previously, having joined Davey Tree in 1978, Mr. Stief held various managerial positions, including Operations Manager and District Manager.
Mr. Vaughn was elected Vice President and General Manager, Eastern Utility Services, effective June 6, 2010, and served as Vice President, Eastern Utility Services, having been appointed in December 2007. Prior to that time, he served as Vice President, Northern Operating Group, Utility Services, having been appointed in July 2002. Previously, having joined Davey Tree in 1972, Mr. Vaughn held various managerial positions, including Operations Manager and Regional Manager.
Our officers serve from the date of their election to the next organizational meeting of the Board of Directors and until their respective successors are elected.
Page 11
PART II
Item 5. Market for Company’s Common Equity, Related Stockholder Matters and Issuer Purchases of Equity Securities.
Our common shares are not listed or traded on an established public trading market and market prices are, therefore, not available. Semiannually, for purposes of the Davey 401KSOP and ESOP, the fair market value of our common shares is determined by an independent stock valuation firm, based upon our performance and financial condition, using a peer group of comparable companies selected by that firm. The peer group currently consists of: ABM Industries Incorporated; Comfort Systems USA, Inc.; Dycom Industries, Inc.; MYR Group, Inc.; Quanta Services, Inc.; Rollins, Inc.; and Scotts Miracle-Gro Company. The semiannual valuations are effective for a period of six months and the per-share price established by those valuations is the price at which our Board of Directors has determined our common shares will be bought and sold during that six-month period in transactions involving Davey Tree or one of its employee benefit or stock purchase plans. Since 1979, we have provided a ready market for all shareholders through our direct purchase of their common shares, although we are under no obligation to do so (other than for repurchases pursuant to the put option under The Davey 401KSOP and ESOP Plan, as described in Note N). These purchases are added to our treasury stock.
Record Holders and Common Shares
On March 9, 2018 we had 3,800 record holders of our common shares.
On March 9, 2018 we had 24,227,668 common shares outstanding and options exercisable to purchase 800,615 common shares, partially-paid subscriptions for 764,382 common shares and purchase rights outstanding for 309,389 common shares.
Dividends
The following table sets forth, for the periods indicated, the cash dividends declared per common share (in cents). The numbers in the following table have been adjusted for a two-for-one stock split, effected in the form of a 100% stock dividend paid on June 15, 2017 to shareholders of record at the close of business on June 1, 2017.
Year Ended December 31, | ||||||
Quarter | 2017 | 2016 | ||||
1 | 2.50 | 2.50 | ||||
2 | 2.50 | 2.50 | ||||
3 | 2.50 | 2.50 | ||||
4 | 2.50 | 2.50 | ||||
Total | 10.00 | 10.00 | ||||
We presently expect to pay comparable cash dividends in 2018.
Recent Sales of Unregistered Securities
None.
Page 12
Purchases of Equity Securities
The following table provides information on purchases made by the Company of our common shares during the fiscal year ended December 31, 2017. The numbers in the following table have been adjusted for a two-for-one stock split, effected in the form of a 100% stock dividend paid on June 15, 2017 to shareholders of record at the close of business on June 1, 2017.
Period | Total Number of Shares Purchased | Average Price Paid per Share | Total Number of Shares Purchased as Part of Publicly Announced Plans or Programs | Maximum Number (or Approximate Dollar Value) of Shares that May Yet Be Purchased Under the Plans or Programs | |||||||||
Fiscal 2017 | |||||||||||||
January 1 to January 28 | 610 | $ | 16.95 | n/a | n/a | ||||||||
January 29 to February 25 | 548 | 16.95 | n/a | n/a | |||||||||
February 26 to April 1 | 117,878 | 17.60 | n/a | n/a | |||||||||
Total First Quarter | 119,036 | 17.59 | |||||||||||
April 2 to April 29 | 270,158 | 17.60 | n/a | n/a | |||||||||
April 30 to May 27 | 434,290 | 17.60 | — | 200,000 | |||||||||
May 28 to July 1 | 118,551 | 17.60 | — | 200,000 | |||||||||
Total Second Quarter | 822,999 | 17.60 | |||||||||||
July 2 to July 29 | 550 | 17.60 | — | 200,000 | |||||||||
July 30 to August 26 | 72,969 | 18.30 | — | 200,000 | |||||||||
August 27 to September 30 | 64,237 | 18.30 | — | 200,000 | |||||||||
Total Third Quarter | 137,756 | 18.30 | |||||||||||
October 1 to October 28 | 385,955 | 18.30 | 59,705 | 140,295 | |||||||||
October 29 to December 2 | 181,822 | 18.30 | 10,534 | 129,761 | |||||||||
December 3 to December 31 | 50,156 | 18.30 | — | 129,761 | |||||||||
Total Fourth Quarter | 617,933 | 18.30 | 70,239 | ||||||||||
Total Year to Date | 1,697,724 | $ | 17.91 | 70,239 | — | ||||||||
n/a--Not applicable. There were no publicly announced plans or programs to purchase common shares. | |||||||||||||
At the Annual Meeting of Shareholders of the Company held on May 16, 2017, the shareholders of the Company approved proposals to amend the Company's Articles of Incorporation to (i) expand the Company's current right of first refusal with respect to proposed transfers of shares of the Company's common shares, (ii) clarify provisions regarding when the Company may provide notice of its decision to exercise its right of first refusal with respect to proposed transfers of common shares by the estate or personal representative of a deceased shareholder, and (iii) grant the Company a right to repurchase common shares held by certain shareholders of the Company.
On May 10, 2017, the Board of Directors of the Company adopted a policy regarding the Company's exercise of the repurchase right granted to the Company through amendments to the Company's Articles of Incorporation, as approved by shareholders on May 16, 2017.
Until further action by the Board, it will be the policy of the Company not to exercise its repurchase rights under the amended Articles with respect to shares of the Company's common shares held by current and retired employees and current and
Page 13
former directors of the Company (subject to exceptions set forth in the policy) (collectively, "Active Shareholders"), their spouses, their first-generation descendants and trusts established exclusively for their benefit.
Until further action by the Board, it will also be the policy of the Company not to exercise its rights under the amended Articles to repurchase shares of the Company's common shares proposed to be transferred by an Active Shareholder to his or her spouse, a first-generation descendant, or a trust established exclusively for the benefit of one or more of an Active Shareholder, his or her spouse and first-generation descendants of an Active Shareholder, or upon the death of an Active Shareholder, such transfers from the estate or personal representative of a deceased Active Shareholder. The Board may suspend, change or discontinue the policy at any time without prior notice.
On May 17, 2017, in accordance with the amendments to the Articles approved by the Company's shareholders at the Annual Meeting, the Company's Board of Directors authorized the Company to repurchase up to 100,000 common shares (200,000 common shares on a post-split basis). Share repurchases may be made from time to time and the timing of any repurchases and the actual number of shares repurchased will depend on a variety of factors. The Company is not obligated to purchase any shares, and repurchases may be commenced, suspended or discontinued from time to time without prior notice. The repurchase program does not have an expiration date.
Page 14
Stock Performance Graph
Comparison of five-year cumulative return among The Davey Tree Expert Company, S&P 500 Stock Index and Selected Peer Group Companies Index
The following Performance Graph compares cumulative total shareholder returns for The Davey Tree Expert Company common shares during the last five years to the Standard & Poor’s 500 Stock Index and to an index of selected peer group companies. The peer group, which is the same group used by Davey’s independent stock valuation firm, consists of: ABM Industries Incorporated; Comfort Systems USA, Inc.; Dycom Industries, Inc.; MYR Group, Inc.; Quanta Services, Inc.; Rollins, Inc.; and Scotts Miracle-Gro Company. Each of the three measures of cumulative total return assumes reinvestment of dividends.
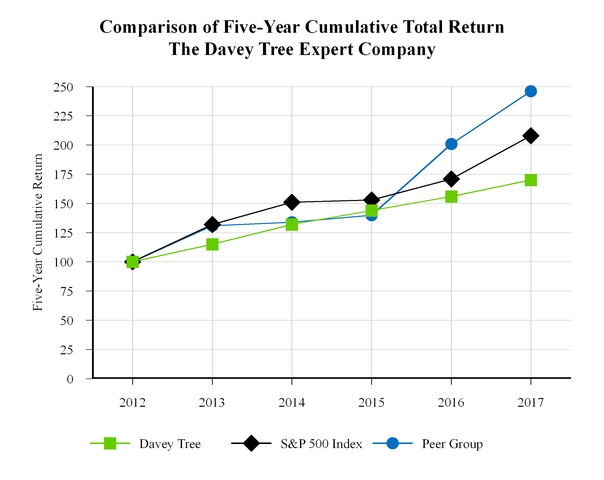
2012 | 2013 | 2014 | 2015 | 2016 | 2017 | |||||||
Davey Tree | 100 | 115 | 132 | 144 | 156 | 170 | ||||||
S&P 500 Index | 100 | 132 | 151 | 153 | 171 | 208 | ||||||
Peer Group | 100 | 131 | 134 | 140 | 201 | 246 | ||||||
The Performance Graph and related information above shall not be deemed “soliciting material” or be “filed” with the Securities and Exchange Commission, nor shall such information be incorporated by reference into any future filing under the Securities Act of 1933 or Securities Exchange Act of 1934, each as amended, except to the extent that we specifically incorporate it by reference into such filing.
Page 15
Item 6. Selected Financial Data.
Fiscal Year Ended December 31, | |||||||||||||||||||
2017 | 2016 | 2015 | 2014 | 2013 | |||||||||||||||
(In thousands, except ratio and per share data) | |||||||||||||||||||
Operating Statement Data: | |||||||||||||||||||
Revenues | $ | 915,958 | $ | 845,678 | $ | 821,904 | $ | 789,911 | $ | 713,848 | |||||||||
Costs and expenses: | |||||||||||||||||||
Operating | 587,333 | 541,486 | 528,899 | 508,677 | 462,646 | ||||||||||||||
Selling | 167,934 | 152,106 | 144,234 | 140,027 | 120,842 | ||||||||||||||
General and administrative | 64,589 | 61,789 | 59,798 | 54,970 | 50,654 | ||||||||||||||
Depreciation | 50,702 | 47,284 | 44,677 | 40,970 | 38,231 | ||||||||||||||
Amortization of intangible assets | 2,384 | 2,306 | 2,214 | 2,070 | 1,980 | ||||||||||||||
Gain on sale of assets, net | (3,989 | ) | (4,664 | ) | (2,026 | ) | (806 | ) | (1,294 | ) | |||||||||
Income from operations | 47,005 | 45,371 | 44,108 | 44,003 | 40,789 | ||||||||||||||
Interest expense | (4,886 | ) | (4,393 | ) | (3,355 | ) | (2,948 | ) | (2,708 | ) | |||||||||
Interest income | 292 | 255 | 249 | 295 | 311 | ||||||||||||||
Other expense | (4,417 | ) | (3,989 | ) | (5,744 | ) | (3,050 | ) | (2,827 | ) | |||||||||
Income before income taxes | 37,994 | 37,244 | 35,258 | 38,300 | 35,565 | ||||||||||||||
Income taxes | 15,874 | 14,960 | 13,460 | 15,131 | 12,712 | ||||||||||||||
Net income | $ | 22,120 | $ | 22,284 | $ | 21,798 | $ | 23,169 | $ | 22,853 | |||||||||
Earnings per share--diluted * | $ | .83 | $ | .82 | $ | .78 | $ | .81 | $ | .79 | |||||||||
Shares used for computing per share amounts--diluted * | 26,697 | 27,247 | 27,955 | 28,477 | 29,205 | ||||||||||||||
Other Financial Data: | |||||||||||||||||||
Depreciation and amortization | $ | 53,086 | $ | 49,590 | $ | 46,891 | $ | 43,040 | $ | 40,211 | |||||||||
Capital expenditures | 57,100 | 56,646 | 56,047 | 55,731 | 45,205 | ||||||||||||||
Cash flow provided by (used in): | |||||||||||||||||||
Operating activities | 56,776 | 55,370 | 62,689 | 49,279 | 56,310 | ||||||||||||||
Investing activities | (59,518 | ) | (54,808 | ) | (56,046 | ) | (64,060 | ) | (43,205 | ) | |||||||||
Financing activities | 6,410 | (7,721 | ) | (7,140 | ) | 17,335 | (16,891 | ) | |||||||||||
Cash dividends declared per share * | $ | .1000 | $ | .1000 | $ | .1000 | $ | .0925 | $ | .0900 | |||||||||
Page 16
As of December 31, | |||||||||||||||||||
2017 | 2016 | 2015 | 2014 | 2013 | |||||||||||||||
(In thousands, except ratio and per share data) | |||||||||||||||||||
Balance Sheet Data: | |||||||||||||||||||
Working capital | $ | 80,468 | $ | 59,868 | $ | 48,984 | $ | 49,916 | $ | 39,030 | |||||||||
Current ratio | 1.63 | 1.50 | 1.44 | 1.46 | 1.37 | ||||||||||||||
Property and equipment, net | 193,183 | 179,436 | 166,422 | 160,883 | 136,884 | ||||||||||||||
Total assets | 473,135 | 423,939 | 393,586 | 381,004 | 330,814 | ||||||||||||||
Long-term debt | 119,210 | 92,623 | 85,104 | 81,306 | 50,034 | ||||||||||||||
Other long-term liabilities | 63,878 | 60,565 | 55,464 | 54,854 | 44,371 | ||||||||||||||
Redeemable common shares related to 401KSOP and Employee Stock Ownership Plan (ESOP) | 123,520 | 124,201 | 127,089 | 123,668 | 113,694 | ||||||||||||||
Total common shareholders' equity | 37,870 | 27,978 | 14,450 | 12,826 | 19,347 | ||||||||||||||
Redeemable common shares * | 6,467 | 7,057 | 7,773 | 8,217 | 8,613 | ||||||||||||||
Common shares: * | |||||||||||||||||||
Issued | 36,447 | 35,857 | 35,141 | 34,697 | 34,301 | ||||||||||||||
Less: In treasury | 18,693 | 17,991 | 17,427 | 16,584 | 16,036 | ||||||||||||||
Net outstanding | 24,221 | 24,923 | 25,487 | 26,330 | 26,878 | ||||||||||||||
Stock options: * | |||||||||||||||||||
Outstanding | 1,529 | 1,599 | 1,634 | 1,540 | 1,324 | ||||||||||||||
Exercisable | 801 | 751 | 834 | 778 | 684 | ||||||||||||||
ESOT valuation per share * | $ | 19.10 | $ | 17.60 | $ | 16.35 | $ | 15.05 | $ | 13.20 | |||||||||
* Prior periods have been adjusted for the two-for-one stock split, effective June 1, 2017, as discussed in Note B to the audited financial statements included in Item 8.
Item 7. Management's Discussion and Analysis of Financial Condition and Results of Operations.
(Amounts in thousands, except share data)
Management’s Discussion and Analysis of Results of Operations and Financial Condition (“MD&A”) is provided as a supplement to the accompanying consolidated financial statements and notes to help provide an understanding of our financial condition, cash flows and results of operations. MD&A is organized as follows:
▪ | Overview of 2017 Results; |
▪ | Results of Operations, including fiscal 2017 compared to fiscal 2016, fiscal 2016 compared to fiscal 2015, liabilities for uncertain income tax positions, and other matters; |
▪ | Liquidity and Capital Resources, including cash flow summary, off-balance sheet arrangements, and capital resources; |
▪ | Recent Accounting Guidance; |
▪ | Critical Accounting Policies and Estimates; and |
▪ | Market Risk Information, including interest rate risk and foreign currency exchange rate risk. |
OVERVIEW OF 2017 RESULTS
General
We provide a wide range of horticultural, arboricultural, environmental and consulting services to residential, commercial, utility and institutional customers throughout the United States and Canada.
Our Business--We have two reportable operating segments organized by type or class of customer: Residential and Commercial, and Utility.
Page 17
Residential and Commercial--Residential and Commercial provides services to our residential and commercial customers including: the treatment, preservation, maintenance, removal and planting of trees, shrubs and other plant life; the practice of landscaping, grounds maintenance, tree surgery, tree feeding and tree spraying; the application of fertilizer, herbicides and insecticides; and natural resource management and consulting, forestry research and development, and environmental planning.
Utility--Utility is principally engaged in providing services to our utility customers--investor-owned, municipal utilities, and rural electric cooperatives--including: the practice of line-clearing and vegetation management around power lines, rights-of-way and chemical brush control; and natural resource management and consulting, forestry research and development and environmental planning.
All other operating activities, including research, technical support and laboratory diagnostic facilities, are included in “All Other.”
Results of Operations
The following table sets forth our consolidated results of operations as a percentage of revenues and the percentage change in dollar amounts of the results of operations for the periods presented:
Year Ended December 31, | Percentage Change | |||||||||||||
2017 | 2016 | 2015 | 2017/2016 | 2016/2015 | ||||||||||
Revenues | 100.0 | % | 100.0 | % | 100.0 | % | 8.3 | % | 2.9 | % | ||||
Costs and expenses: | ||||||||||||||
Operating | 64.1 | 64.0 | 64.3 | 8.5 | 2.4 | |||||||||
Selling | 18.3 | 18.0 | 17.5 | 10.4 | 5.5 | |||||||||
General and administrative | 7.1 | 7.3 | 7.3 | 4.5 | 3.3 | |||||||||
Depreciation | 5.5 | 5.6 | 5.4 | 7.2 | 5.8 | |||||||||
Amortization of intangible assets | .3 | .3 | .3 | 3.4 | 4.2 | |||||||||
Gain on sale of assets, net | (.4 | ) | (.6 | ) | (.2 | ) | (14.5 | ) | 130.2 | |||||
94.9 | 94.6 | 94.6 | 8.6 | 2.9 | ||||||||||
Income from operations | 5.1 | 5.4 | 5.4 | 3.6 | 2.9 | |||||||||
Other income (expense): | ||||||||||||||
Interest expense | (.5 | ) | (.5 | ) | (.4 | ) | 11.2 | 30.9 | ||||||
Interest income | — | — | — | nm | nm | |||||||||
Other | (.5 | ) | (.5 | ) | (.7 | ) | 10.7 | (30.6 | ) | |||||
Income before income taxes | 4.1 | 4.4 | 4.3 | 2.0 | 5.6 | |||||||||
Income taxes | 1.7 | 1.8 | 1.6 | 6.1 | 11.1 | |||||||||
Net income | 2.4 | % | 2.6 | % | 2.7 | % | (.7 | )% | 2.2 | % | ||||
nm--not meaningful | ||||||||||||||
Revenues of $915,958 were 8.3% higher than last year’s revenues of $845,678. Utility revenues increased 7.7%, and Residential and Commercial revenues increased 8.6% from the prior year.
Overall, income from operations of $47,005 increased 3.6% from the $45,371 experienced in the prior year. Income from operations was $18,223 in Utility (a 5.4% decrease as compared with 2016) and $41,158 for Residential and Commercial (a 12.3% increase as compared with 2016).
Net income of $22,120 was $164 less than the $22,284 earned in 2016. The increase in income from operations was offset by increases in other nonoperating expenses of $428, income taxes of $914 and interest expense of $493.
Operating activities in 2017 provided cash of $56,776 as compared to $55,370 provided in 2016. The $1,406 net increase was primarily attributable to (i) $5,349 less cash used by accounts receivable, (ii) an increase of $3,496 in depreciation and
Page 18
amortization expense, (iii) an increase of $3,693 in deferred income taxes offset by (iv) $12,938 less cash provided from changes in operating assets and liabilities excluding accounts receivable.
Investing activities used $59,518 in cash, or $4,710 more than that used in 2016. Increases in expenditures for equipment, land and buildings and purchases of businesses were partially offset by fewer proceeds from the sales of assets.
Financing activities provided $6,410 in cash in 2017, $14,131 more than the $7,721 of cash used in 2016. The increase in cash provided of $14,131 was primarily attributable to (i) $20,500 more cash provided by our revolving credit facility, (ii) $2,247 more cash used for purchases of common shares, sale of common shares and cash received on common share subscription, net and (iii) $4,206 more cash used for payments of notes payable, long-term debt and capital leases. .
Fiscal 2017 Compared to Fiscal 2016
A comparison of our fiscal year 2017 results to 2016 follows:
Year Ended December 31, | ||||||||||||||
2017 | 2016 | Change | % Change | |||||||||||
Revenues | $ | 915,958 | $ | 845,678 | $ | 70,280 | 8.3 | % | ||||||
Costs and expenses: | ||||||||||||||
Operating | 587,333 | 541,486 | 45,847 | 8.5 | ||||||||||
Selling | 167,934 | 152,106 | 15,828 | 10.4 | ||||||||||
General and administrative | 64,589 | 61,789 | 2,800 | 4.5 | ||||||||||
Depreciation | 50,702 | 47,284 | 3,418 | 7.2 | ||||||||||
Amortization of intangible assets | 2,384 | 2,306 | 78 | 3.4 | ||||||||||
Gain on sale of assets, net | (3,989 | ) | (4,664 | ) | 675 | (14.5 | ) | |||||||
868,953 | 800,307 | 68,646 | 8.6 | |||||||||||
Income from operations | 47,005 | 45,371 | 1,634 | 3.6 | ||||||||||
Other income (expense): | ||||||||||||||
Interest expense | (4,886 | ) | (4,393 | ) | (493 | ) | 11.2 | |||||||
Interest income | 292 | 255 | 37 | 14.5 | ||||||||||
Other | (4,417 | ) | (3,989 | ) | (428 | ) | 10.7 | |||||||
Income before income taxes | 37,994 | 37,244 | 750 | 2.0 | ||||||||||
Income taxes | 15,874 | 14,960 | 914 | 6.1 | ||||||||||
Net income | $ | 22,120 | $ | 22,284 | $ | (164 | ) | (.7 | )% | |||||
Revenues--Revenues of $915,958 increased $70,280 compared with the $845,678 reported in 2016. Utility increased $33,348, or 7.7%, from the prior year. The increase is attributable to additional revenues from storm-related services provided as a result of Hurricane Irma in the Southeast United States and increased work year-over-year on existing accounts as well as new accounts. Residential and Commercial increased $35,150, or 8.6%, from 2016. Increases in tree surgery, spraying, landscaping, pest management as well as storm-related work as a result of Hurricane Irma were partially offset by decreases in snow removal and mowing revenues. Higher contract rates on our tree pruning, tree removal and liquid services, increased storm revenue, increased productivity and additional revenue from the purchase of businesses accounted for the increase. Total consolidated revenue of $915,958 includes production incentive revenue, recognized under the completed-performance method, of $2,336 during 2017 as compared with $2,827 during 2016.
Operating Expenses--Operating expenses of $587,333 increased $45,847 from the prior year, and as a percentage of revenues increased .1% to 64.1%. Utility experienced an increase of $28,043, or 8.7%, from 2016, and as a percentage of revenues increased .6% to 75.0%. Increases in employee labor and benefits expense, fuel expense, subcontractor expense, disposal expense and crew expenses associated with the increased revenues were partially offset by decreases in repair and maintenance expense and material expense. Residential and Commercial increased $16,234, or 7.5%, compared with 2016 but as a percentage of revenue decreased .4% to 52.2%. Increases primarily in employee labor and benefits expense, repair and maintenance expense, fuel expense, materials expense, subcontractor expense and crew expense account for the increase.
Page 19
Fuel costs increased in 2017 as compared with fuel costs for 2016 and impacted operating expenses within both segments. During 2017, fuel expense of $27,427 increased $4,750, or 20.9%, from the $22,677 incurred in 2016. The $4,750 increase included price increases approximating $3,861 and usage increases approximating $889.
Selling Expenses--Selling expenses of $167,934 increased $15,828 from 2016 and as a percentage of revenues increased .3% to 18.3%. Utility increased $4,916, or 10.8%, from 2016 and as a percentage of revenue increased .3% to 10.8%. Increases in field management wages and incentive expense, office support wage expense, field management auto expense, rent expense and communication expense were partially offset by reductions in field management travel expense, local office expense, computer expense and employee development expense. Residential and Commercial increased $11,062, or 10.1%, from 2016 and as a percentage of revenue increased .3% to 27.1%. Increases primarily in field management wages and incentive expense, office support wage expense, sales and marketing expense, employee development expense, communication expense and field management travel expense were partially offset by a reduction in computer expense.
General and Administrative Expenses--General and administrative expenses increased $2,800 to $64,589, an increase of 4.5% from the $61,789 experienced in 2016 but as a percentage of revenues decreased .2% to 7.1%. Increases in pension expense, salary and incentive expense, stock compensation expense, computer expense and office rent expense were partially offset by a decrease in office expenses, communication expense and management travel expense.
Depreciation and Amortization Expense--Depreciation and amortization expense of $53,086 increased $3,496 from the prior year and as a percentage of revenues decreased .1% to 5.8%. The increase is attributable to higher capital expenditures for equipment, land and buildings and an increase in amortization expense related to our purchases of businesses.
Gain on Sale of Assets--Gain on the sale of assets of $3,989 decreased $675 from the $4,664 experienced in 2016. The decrease is the result of lower average sales prices on units disposed of in 2017 as compared with 2016. In addition, the gain of $4,664 in 2016 also included the sale of a building.
Interest Expense--Interest expense of $4,886 increased $493 from the $4,393 incurred in 2016. The increase is attributable to higher average debt levels and borrowing rates necessary to fund operations and capital expenditures.
Other, Net--Other, net of $4,417 increased $428 from the $3,989 experienced in 2016. Other, net, consisted of nonoperating income and expense, including foreign currency gains on the intercompany account balances of our Canadian operations.
Income Taxes--Income taxes for 2017 were $15,874, an effective tax rate of 41.8%, compared with income taxes for 2016 of $14,960, or an effective tax rate of 40.2%. The increase of 1.6% in the effective tax rate as compared to 2016 relates primarily to changes in our deferred taxes as a result of the Tax Cuts and Jobs Act (the "Tax Reform Act"), as described in Note Q, enacted in the fourth quarter of 2017.
Net Income--Net income of $22,120 was $164 less than the $22,284 earned in 2016. The increase in income from operations of $1,634 was offset by increases in other nonoperating expenses of $428, interest expense of $493 and income taxes of $914.
Page 20
Fiscal 2016 Compared to Fiscal 2015
A comparison of our fiscal year 2016 results to 2015 follows:
Year Ended December 31, | ||||||||||||||
2016 | 2015 | Change | % Change | |||||||||||
Revenues | $ | 845,678 | $ | 821,904 | $ | 23,774 | 2.9 | % | ||||||
Costs and expenses: | ||||||||||||||
Operating | 541,486 | 528,899 | 12,587 | 2.4 | ||||||||||
Selling | 152,106 | 144,234 | 7,872 | 5.5 | ||||||||||
General and administrative | 61,789 | 59,798 | 1,991 | 3.3 | ||||||||||
Depreciation | 47,284 | 44,677 | 2,607 | 5.8 | ||||||||||
Amortization of intangible assets | 2,306 | 2,214 | 92 | 4.2 | ||||||||||
Gain on sale of assets, net | (4,664 | ) | (2,026 | ) | (2,638 | ) | 130.2 | |||||||
800,307 | 777,796 | 22,511 | 2.9 | |||||||||||
Income from operations | 45,371 | 44,108 | 1,263 | 2.9 | ||||||||||
Other income (expense): | ||||||||||||||
Interest expense | (4,393 | ) | (3,355 | ) | (1,038 | ) | 30.9 | |||||||
Interest income | 255 | 249 | 6 | 2.4 | ||||||||||
Other | (3,989 | ) | (5,744 | ) | 1,755 | (30.6 | ) | |||||||
Income before income taxes | 37,244 | 35,258 | 1,986 | 5.6 | ||||||||||
Income taxes | 14,960 | 13,460 | 1,500 | 11.1 | ||||||||||
Net income | $ | 22,284 | $ | 21,798 | $ | 486 | 2.2 | % | ||||||
Revenues--Revenues of $845,678 increased $23,774 compared with the $821,904 reported in 2015. Utility increased $262, or .1%, from the prior year. New contracts obtained and increases in rates and productivity on contracts within both our U.S. and Canadian operations were partially offset by contracts lost and significant reductions in contract scope with two utility providers within our U.S. Utility operations. Residential and Commercial increased $24,551, or 6.4%, from 2015. Higher contract rates on our tree pruning, tree removal and liquid services, increased storm revenue, increased productivity and additional revenue from the purchase of businesses accounted for the increase. Total consolidated revenue of $845,678 includes production incentive revenue, recognized under the completed-performance method, of $2,827 during 2016 as compared with $4,686 during 2015.
Operating Expenses--Operating expenses of $541,486 increased $12,587 from the prior year, and as a percentage of revenues decreased .3% to 64.0%. Utility experienced an increase of $1,971, or .6%, from 2015, and as a percentage of revenues increased .6% to 74.4%. Increases in employee labor and benefits expense, equipment repair and maintenance expense, disposal expense and subcontractor expense were partially offset by decreases in fuel expense, crew expense and material expense. Residential and Commercial increased $12,767, or 6.3%, compared with 2015 and as a percentage of revenue decreased .1% to 52.6%. Increases in employee labor and benefits expense, subcontractor expense, disposal expense, tool and saw expense and material expense were partially offset by decreases in fuel expense and crew expense.
Fuel costs decreased in 2016 as compared with fuel costs for 2015 and impacted operating expenses within both segments. During 2016, fuel expense of $22,677 decreased $3,204, or 12.4%, from the $25,881 incurred in 2015. Substantially all of the $3,204 decrease relates to a decrease in price of fuel.
Selling Expenses--Selling expenses of $152,106 increased $7,872 from 2015 and as a percentage of revenues increased .5% to 18.0%. Utility increased $1,016, or 2.3%, from 2015. Increases in office support wages, field management travel expense, rent expense and computer expense were partially offset by reductions in field management wages and incentive expense and employee development expense. Residential and Commercial increased $7,191, or 7.0%, from 2015 and as a percentage of revenue increased .2% to 26.8%. Increases in field management wages and incentive expense, rent expense, computer expense, communication expense, professional services expense and sales and marketing expense were partially offset by reductions in field management auto expense.
Page 21
General and Administrative Expenses--General and administrative expenses increased $1,991 to $61,789, an increase of 3.3% from the $59,798 experienced in 2015 and as a percentage of revenues remained at 7.3%. Increases in salary and incentive expense, office expense, and computer expense were partially offset by a decrease in professional services expense.
Depreciation and Amortization Expense--Depreciation and amortization expense of $49,590 increased $2,699 from the prior year and as a percentage of revenues increased .2% to 5.9%. The increase is attributable to higher capital expenditures for equipment and an increase in amortization expense related to our purchases of businesses.
Gain on Sale of Assets--Gain on the sale of assets of $4,664 increased $2,638 from the $2,026 experienced in 2015. The increase is the result of more units sold at a higher average price in 2016 as compared with 2015 and the sale of a building in 2016.
Interest Expense--Interest expense of $4,393 increased $1,038 from the $3,355 incurred in 2015. The increase is attributable to higher-average debt levels necessary to fund operations and capital expenditures.
Other, Net--Other, net of $3,989 decreased $1,755 from the $5,744 experienced in 2015. Other, net, consisted of nonoperating income and expense, including foreign currency gains on the intercompany account balances of our Canadian operations.
Income Taxes--Income taxes for 2016 were $14,960, an effective tax rate of 40.2%, compared with income taxes for 2015 of $13,460, or an effective tax rate of 38.2%. The increase of 2.0% in the effective tax rate as compared to 2015 relates primarily to changes in foreign tax credits, which had reduced the 2015 rate.
Net Income--Net income of $22,284 was $486 more than the $21,798 earned in 2015. The increase in income from operations of $1,263 and the decrease of other nonoperating expenses of $1,755, offset by the increases in interest expense of $1,038 and income taxes of $1,500, contributed to the increase in net income.
Income Tax—Liabilities for Uncertain Tax Positions
The amount of income taxes we pay is subject to audit by U.S. federal, state and Canadian tax authorities, which may result in proposed assessments. Our estimate for the potential outcome for any uncertain tax issue is highly judgmental. Uncertain tax positions are recognized only if they are more-likely-than-not to be upheld during examination based on their technical merits. The measurement of the uncertain tax position is based on the largest benefit amount that is more-likely-than-not (determined on a cumulative probability basis) to be realized upon settlement of the matter. If payment of these amounts ultimately proves to be unnecessary, the reversal of the liabilities would result in tax benefits being recognized in the period when we determine the liabilities are no longer necessary. If the estimate of tax liabilities proves to be less than the ultimate settlement, a further charge to expense may result.
The Company is routinely under audit by U.S. federal, state, local and Canadian authorities in the area of income tax. These audits include questioning the timing and the amount of income and deductions and the allocation of income and deductions among various tax jurisdictions. During the fourth quarter 2017, the U.S. Internal Revenue Service initiated an audit of the Company's U.S. income tax returns for 2015. With the exception of U.S. state jurisdictions, the Company is no longer subject to examination by tax authorities for the years through 2013. As of December 31, 2017, we believe it is reasonably possible that the total amount of unrecognized tax benefits will not significantly increase or decrease.
Goodwill—Impairment Tests
Annually, we perform the impairment tests for goodwill during the fourth quarter. Impairment of goodwill is tested at the reporting-unit level, which for us are also our business segments. Impairment of goodwill is tested by comparing the reporting unit’s carrying value, including goodwill, to the fair value of the reporting unit. The fair values of the reporting units are estimated using discounted projected cash flows. If the carrying value of the reporting unit exceeds its fair value, goodwill is considered impaired and an impairment charge is recognized for the amount by which the carrying amount exceeds the reporting unit's fair value. We conducted our annual impairment tests and determined that no impairment loss was required to be recognized in 2017 or for any prior periods. There were no events or circumstances from the date of our assessment through December 31, 2017 that would impact this conclusion.
The fair values of the reporting units were estimated using discounted projected cash flows for the goodwill impairment tests and analysis that required judgmental assumptions about revenues, operating margins, growth rates, discount rates, and working capital requirements. In determining those judgmental assumptions, we consider data, including--for each reporting unit--its annual budget for the upcoming year, its longer-term performance expectations, anticipated future cash flows and market data. Assumptions were also made for perpetual growth rates for periods beyond the forecast period.
Page 22
If the fair values of the reporting units were less than the carrying values of the reporting units (including recorded goodwill), determined through the discounted projected cash flow methodology, goodwill impairment may be present. In such an instance, an impairment charge would be recognized for the amount by which the reporting unit’s carrying amount of goodwill exceeded the reporting unit's fair value of goodwill.
The carrying value of the recorded goodwill for all reporting units totaled $35,477 at December 31, 2017. Based upon the goodwill impairment analysis conducted in the fourth quarter 2017, a hypothetical reduction in the fair value of the individual reporting units of approximately 35% to 69% would not have resulted in the carrying value of the individual reporting units exceeding the reduced fair value.
LIQUIDITY AND CAPITAL RESOURCES
Our principal financial requirements are for capital spending, working capital and business acquisitions. Cash generated from operations and our revolving credit facility are our primary sources of capital.
Cash Flow Summary
Our cash flows from operating, investing and financing activities, as reflected in the Consolidated Statements of Cash Flow for the years ended December 31, 2017 and December 31, 2016, are summarized as follows:
2017 | 2016 | ||||||
Cash provided by (used in): | |||||||
Operating activities | $ | 56,776 | $ | 55,370 | |||
Investing activities | (59,518 | ) | (54,808 | ) | |||
Financing activities | 6,410 | (7,721 | ) | ||||
Effect of exchange rate changes on cash | 447 | 135 | |||||
Increase/(decrease) in cash | $ | 4,115 | $ | (7,024 | ) | ||
Net Cash Provided by Operating Activities--Operating activities in 2017 provided cash of $56,776 as compared to $55,370 provided in 2016. The $1,406 net increase was primarily attributable to (i) $5,349 less cash used by accounts receivable, (ii) an increase of $3,496 in depreciation and amortization expense, (iii) an increase of $3,693 in deferred income taxes offset by (iv) $12,938 less cash provided from changes in operating assets and liabilities.
Overall, accounts receivable increased $20,784 in 2017 as compared to the increase of $26,133 experienced in 2016. The increase in 2017 was attributable to the timing of payments from utility customers for work performed as a result of Hurricane Irma. With respect to the change in accounts receivable arising from business levels, the “days-sales-outstanding” in accounts receivable (“DSO”) at the end of 2017 increased by five days to 67 days, as compared to 2016. The DSO at December 31, 2016 was 62 days.
Accounts payable and accrued expenses increased $6,164 in 2017, $3,710 more than the increase of $2,454 experienced in 2016. Increases in employee compensation accruals, compensated absence accruals, health insurance accruals, income taxes payable, 401KSOP liabilities and professional service accruals were partially offset by decreases in advance payments from customers and employee savings withholdings.
Self-insurance accruals increased $4,856 in 2017, a change of $2,357 compared to the increase of $2,499 experienced in 2016. The increase occurred within all classifications (workers compensation, vehicle liability and general liability) and resulted primarily from an overall increase in deductible amounts under commercial insurance or the self-insured risk retention.
Other assets, net, increased $11,011 in 2017, as compared to the $7,994 decrease in 2016. Decreases in pension liabilities and increases in operating supplies and prepaid expenses were partially offset by a reduction in refundable income taxes and deposits.
Net Cash Used in Investing Activities--Investing activities used $59,518 in cash, $4,710 more than the $54,808 used in 2016. Increases in the purchases of businesses along with capital expenditures for equipment and land and buildings necessary to support the business were partially offset by less proceeds from the sales of assets.
Net Cash Used in Financing Activities--Financing activities provided $6,410 in cash in 2017, $14,131 more than the $7,721 of cash used in 2016. Our revolving credit facility provided $33,000 as compared with the $12,500 provided during 2016. We
Page 23
use the revolving credit facility primarily for capital expenditures and payments of notes payable, primarily related to acquisitions. Payments of notes payable totaled $2,144 and payments of long-term debt and capital leases totaled $6,548 during 2017. Purchases of common shares for treasury of $30,404 were partially offset by net cash received of $15,019 from the sale of common shares and cash received on our common share subscriptions. Dividends paid during 2017 totaled $2,513.
The Company currently repurchases common shares at the shareholders’ request in accordance with the terms of the Davey 401KSOP and ESOP Plan and also repurchases common shares from time to time at the Company’s discretion. The amount of common shares offered to the Company for repurchase by the holders of shares distributed from the Davey 401KSOP and ESOP Plan is not within the control of the Company, but is at the discretion of the shareholders. The Company expects to continue to repurchase its common shares, as offered by its shareholders from time to time, at their then current fair value. However, (other than repurchases pursuant to the put option under the Davey 401KSOP and ESOP Plan, as described in Note N) such purchases are not required, and the Company retains the right to discontinue them at any time. Repurchases of redeemable common shares from the Davey 401KSOP and ESOP at the shareholders’ request approximated $14,587 and $8,019 in 2017 and 2016, respectively. Purchases of common shares, other than redeemable common shares, approximated $15,979 and $17,271 in 2017 and 2016, respectively.
Revolving Credit Facility and 5.09% Senior Unsecured Notes--In October 2017, we amended our revolving credit facility. The Amended and Restated Credit Agreement provides for a revolving credit facility with a group of banks under which up to an aggregate of $250,000 is available, with a letter of credit sublimit of $100,000 and a swing line commitment of $25,000. Under certain circumstances, the amount available under the revolving credit facility may be increased to $325,000.
The Amended and Restated Credit Agreement extended the term of the revolving credit facility to October 6, 2022 from November 7, 2018. The revolving credit facility contains certain affirmative and negative covenants customary for this type of facility and includes financial covenant ratios with respect to a maximum leverage ratio (not to exceed 3.00 to 1.00 with exceptions in case of material acquisitions) and a minimum interest coverage ratio (not less than 3.00 to 1.00), in each case subject to certain further restrictions as described in the Credit Agreement. As of December 31, 2017, we were in compliance with all financial covenants contained in our revolving credit facility.
As of December 31, 2017, we had unused commitments under the facility approximating $146,912, and $103,088 committed, which consisted of borrowings of $100,000 and issued letters of credit of $3,088. Borrowings outstanding bear interest, at our option, of either (a) the base rate or (b) LIBOR plus a margin adjustment ranging from .875% to 1.50%--with the margin adjustments in both instances based on the Company's leverage ratio at the time of borrowing. The base rate is the greater of (i) the agent bank’s prime rate, (ii) LIBOR plus 1.5%, or (iii) the federal funds rate plus .5%. A commitment fee ranging from .10% to .225% is also required based on the average daily unborrowed commitment.
On July 22, 2010, we issued $30,000 of 5.09% Senior Unsecured Notes, Series A, due July 22, 2020 (the "5.09% Senior Notes"). The 5.09% Senior Notes were issued pursuant to a Master Note Purchase Agreement (the “Purchase Agreement”), between Davey Tree and the purchasers of the 5.09% Senior Notes. The net proceeds of the 5.09% Senior Notes were used in 2010 to pay down borrowings under our revolving credit facility.
The 5.09% Senior Notes are equal in right of payment with our revolving credit facility and all other senior unsecured obligations of the Company. Interest is payable semiannually and five equal, annual principal payments commenced on July 22, 2016 (the sixth anniversary of issuance). The Purchase Agreement contains customary events of default and covenants related to limitations on indebtedness and transactions with affiliates and the maintenance of certain financial ratios. As of December 31, 2017, we were in compliance with all financial covenants.
Accounts Receivable Securitization Facility--In May 2017, we amended our accounts receivable securitization facility (the “AR securitization facility”), to extend the scheduled termination date for an additional one-year period, to May 8, 2018 and increase the limit of the facility from $60,000 to $100,000. Davey Tree has pledged a first priority security interest in certain trade receivables in exchange for the bank issuing letters of credit (“LCs”) with a committed facility limit of $100,000.
As of December 31, 2017, we had issued LCs of $58,150 under the terms of the AR securitization facility.
Under the AR securitization facility, Davey Tree transfers by selling or contributing current and future trade receivables to a wholly-owned, bankruptcy-remote financing subsidiary which pledges a perfected first priority security interest in the trade receivables--equal to the issued LCs as of December 31, 2017--to the bank in exchange for the bank issuing LCs.
Fees payable to the bank include: (a) an LC issuance fee, payable on each settlement date, in the amount of .90% per annum on the aggregate amount of all LCs outstanding plus outstanding reimbursement obligations (e.g., arising from drawn LCs), if any, and (b) an unused LC fee, payable monthly, equal to (i) .35% per annum for each day on which the sum of the total LCs outstanding plus any outstanding reimbursement obligations is greater than or equal to 50% of the facility limit and (ii) .45%
Page 24
per annum for each day on which the sum of the total LCs outstanding plus any outstanding reimbursement obligations is less than 50% of the facility limit. If an LC is drawn and the bank is not immediately reimbursed in full for the drawn amount, any outstanding reimbursement obligation will accrue interest at a per annum rate equal to a reserve-adjusted LIBOR or, in certain circumstances, a base rate equal to the higher of (i) the bank’s prime rate and (ii) the federal funds rate plus .50% and, following any default, 2.00% plus the greater of (a) adjusted LIBOR and (b) a base rate equal to the higher of (i) the bank’s prime rate and (ii) the federal funds rate plus .50%.
The agreements underlying the AR securitization facility contain various customary representations and warranties, covenants, and default provisions which provide for the termination and acceleration of the commitments under the AR securitization facility in circumstances including, but not limited to, failure to make payments when due, breach of a representation, warranty or covenant, certain insolvency events or failure to maintain the security interest in the trade receivables, and defaults under other material indebtedness.
Contractual Obligations Summary
The following is a summary of our long-term contractual obligations, as at December 31, 2017, to make future payments for the periods indicated:
Contractual Obligations Due -- Year Ending December 31, | ||||||||||||||||||||||||||||
Description | Total | 2018 | 2019 | 2020 | 2021 | 2022 | Thereafter | |||||||||||||||||||||
Revolving credit facility | $ | 100,000 | $ | — | $ | — | $ | — | $ | — | $ | 100,000 | $ | — | ||||||||||||||
Senior unsecured notes | 18,000 | 6,000 | 6,000 | 6,000 | — | — | — | |||||||||||||||||||||
Term loans | 16,242 | 10,166 | 890 | 894 | 4,292 | — | — | |||||||||||||||||||||
Capital lease obligations | 2,510 | 651 | 660 | 657 | 542 | — | — | |||||||||||||||||||||
Operating lease obligations | 27,635 | 7,243 | 5,326 | 3,945 | 2,354 | 1,794 | 6,973 | |||||||||||||||||||||
Self-insurance accruals | 67,882 | 24,315 | 15,217 | 10,034 | 6,224 | 3,755 | 8,337 | |||||||||||||||||||||
Purchase obligations | 12,702 | 12,702 | — | — | — | — | — | |||||||||||||||||||||
Other liabilities | 19,966 | 5,436 | 6,403 | 1,989 | 2,376 | 1,790 | 1,972 | |||||||||||||||||||||
$ | 264,937 | $ | 66,513 | $ | 34,496 | $ | 23,519 | $ | 15,788 | $ | 107,339 | $ | 17,282 | |||||||||||||||
The self-insurance accruals in the summary above reflect the total of the undiscounted amount accrued, for which amounts estimated to be due each year may differ from actual payments required to fund claims. Purchase obligations in the summary above represent open purchase-order amounts that we anticipate will become payable within the next year for goods and services we have negotiated for delivery as of December 31, 2017. Other liabilities include estimates of future expected funding requirements related to retirement plans and other sundry items. Because their future cash outflows are uncertain, accrued income tax liabilities for uncertain tax positions, as of December 31, 2017, have not been included in the summary above. Noncurrent deferred taxes and payments related to defined benefit pension plans are also not included in the summary.
As of December 31, 2017, total commitments related to issued letters of credit were $63,242, of which $3,088 were issued under the revolving credit facility, $58,150 were issued under the AR securitization facility, and $2,004 were issued under short-term lines of credit. As of December 31, 2016, total commitments related to issued letters of credit were $64,225, of which $4,071 were issued under the revolving credit facility, $58,150 were issued under the AR securitization facility, and $2,004 were issued under short-term lines of credit.
Also, as is common with our industry, we have performance obligations that are supported by surety bonds, which expire during 2018 through 2023. We intend to renew the performance bonds where appropriate and as necessary.
Off-Balance Sheet Arrangements
There are no “off-balance sheet arrangements” as that term is defined in Regulation S-K, Item 303(a)(4)(ii) under the Securities Exchange Act of 1934, as amended.
Capital Resources
Cash generated from operations and our revolving credit facility are our primary sources of capital.
Page 25
Cash of $13,121 as of December 31, 2017 included $7,885 in the U.S. and $5,236 in Canada, all of which is subject to U.S. federal income taxes and Canadian taxes if repatriated to the U.S. Currently, we do not expect to repatriate a portion of our 2017 Canadian earnings to satisfy our 2017 U.S. based cash flow needs.
Business seasonality results in higher revenues during the second and third quarters as compared with the first and fourth quarters of the year, while our methods of accounting for fixed costs, such as depreciation and interest expense, are not significantly impacted by business seasonality. Capital resources during these periods are equally affected. We satisfy seasonal working capital needs and other financing requirements with the revolving credit facility and several other short-term lines of credit. We are continually reviewing our existing sources of financing and evaluating alternatives. At December 31, 2017, we had working capital of $80,468, unused short-term lines of credit approximating $7,042, and $146,912 available under our revolving credit facility.
Our sources of capital presently allow us the financial flexibility to meet our capital spending plan and to complete business acquisitions for at least the next twelve months and for the foreseeable future.
RECENT ACCOUNTING GUIDANCE
Recent Accounting Guidance
Accounting Standards Adopted in 2017
Accounting Standards Update 2016-09, Compensation-Stock Compensation (Topic 718): Improvements to Employee Share-Based Payment Accounting--In March 2016, the FASB issued ASU 2016-09, “Stock Compensation (Topic 718): Improvements to Employee Share-Based Payment Accounting,” with the objective to simplify several aspects of the accounting for share-based payment transactions, including: the income tax consequences; classification of awards as either equity or liabilities; classification of certain items on the statement of cash flows; and accounting for forfeitures. ASU 2016-09 became effective for Davey Tree on January 1, 2017 and we elected to make an accounting policy change to recognize forfeitures as they occur. The adoption impact on the consolidated condensed balance sheet was a cumulative-effect adjustment of $$162, increasing opening retained earnings and decreasing additional paid-in capital.
Accounting Standards Update 2017-04, Intangibles-Goodwill and Other (Topic 350): Simplifying the Test for Goodwill Impairment--In January 2017, the FASB issued ASU 2017-04, “Intangibles-Goodwill and Other (Topic 350),” which simplifies the subsequent measurement of goodwill by eliminating Step 2 of the goodwill impairment test, which required entities to fair value their assets and liabilities using procedures that would be followed in an assumed business combination to arrive at the impairment charge. Under ASU 2017-04, the goodwill impairment test is performed by comparing the fair value of the reporting unit with its carrying amount and an impairment charge should be recognized for the amount by which the carrying amount exceeds the reporting unit’s fair value. The update is effective for annual or interim periods beginning after December 15, 2019, which for Davey Tree is January 1, 2020. The Company early adopted ASU 2017-04 during the fourth quarter 2017 and the adoption had no effect on the Company’s consolidated financial statements or related disclosures.
Accounting Standards Update 2017-09, Compensation - Stock Compensation (Topic 718): Scope of Modification Accounting--In May 2017, the FASB issued ASU 2017-09, “Compensation - Stock Compensation (Topic 718): Scope of Modification Accounting,” which provides guidance on which changes in the terms or conditions of a share-based payment award require modification accounting under Topic 718. Modification accounting is required for changes in terms or conditions unless the fair value, vesting condition and classification of the modified award is the same as the original award. The update is effective for annual and interim periods beginning after December 15, 2017, which for Davey Tree would be January 1, 2018. The Company early adopted ASU 2017-09 during the fourth quarter 2017 and the adoption had no effect on the Company's consolidated financial statements or related disclosures.
Accounting Standards Not Yet Adopted
Accounting Standards Update 2016-15, Statement of Cash Flows (Topic 230): Classification of Certain Cash Receipts and Cash Payments (a consensus of the FASB Emerging Issues Task Force)--In August 2016, the FASB issued ASU 2016-15, “Statement of Cash Flows (Topic 230): Classification of Certain Cash Receipts and Cash Payments,” which provides guidance on how cash receipts and cash payments related to eight specific cash flow issues are presented and classified in the statement of cash flows, with the objective of reducing the existing diversity in practice. The update is effective for annual periods beginning after December 15, 2017, which for Davey Tree is January 1, 2018. Early adoption is permitted. We do not expect the adoption of ASU 2016-15 to have a material impact on our consolidated financial statements.
Accounting Standards Update 2017-07, Compensation - Retirement Benefits (Topic 715): Improving the Presentation of Net Periodic Pension Cost and Net Periodic Postretirement Benefit Cost--In March 2017, the FASB issued ASU 2017-07,
Page 26
“Compensation-Retirement Benefits (Topic 715): Improving the Presentation of Net Periodic Pension Cost and Net Periodic Postretirement Benefit Cost,” which changes the presentation of net periodic benefit cost related to employer sponsored defined benefit plans and other postretirement benefits. Under ASU 2017-07, service costs will be included within the same income statement line item as other compensation costs arising from services rendered by pertinent employees during the period. The other components of net periodic benefit pension cost will be presented separately outside of income from operations. Additionally, only service costs may be capitalized in assets. ASU 2017-07 is effective for fiscal years beginning after December 15, 2017, which for Davey Tree is January 1, 2018. Management is currently assessing the impact of the new standard on the Company’s consolidated financial statements and does not expect the adoption to have a material effect on the Company's consolidated financial statements.
Accounting Standards Update 2014-09, Revenue from Contracts with Customers (Topic 606)--In May 2014, the FASB issued ASU 2014-09, “Revenue from Contracts with Customers (Topic 606),” which will replace all current U.S. GAAP guidance on revenue recognition and eliminate all industry-specific guidance.
The new revenue recognition guidance provides a unified model to determine when and how revenue is recognized. The underlying principle is that an entity should recognize revenue to depict the transfer of promised goods and services to customers in an amount that reflects the consideration which the entity expects to receive in exchange for those goods and services. The guidance provides a five-step analysis of transactions to determine when and how revenue is recognized. Other major provisions include capitalization of certain contract costs, consideration of the time value of money in the transaction price, and allowing estimates of variable consideration to be recognized before contingencies are resolved in certain circumstances. The guidance also requires enhanced information to be presented in the financial statements regarding the nature, amount, timing and uncertainty of revenue and cash flows arising from an entity’s contracts with customers.
This guidance is effective for annual reporting periods beginning after December 15, 2017 and interim periods therein. An entity can elect to apply the guidance under one of the following two methods: (i) retrospectively to each prior reporting period presented, referred to as the full retrospective method, or (ii) retrospectively with the cumulative effect of initially applying the standard recognized at the date of initial application in retained earnings, referred to as the modified retrospective method. The Company adopted the new standard on January 1, 2018, using the modified retrospective method.
Management has substantially completed the process of evaluating the effect of the adoption, which included reviewing representative samples of customer contracts for each revenue stream, analyzing those contracts under the new revenue standard, and comparing the conclusions to the current accounting policies and practices to identify potential changes, and determined that the adoption of ASU No. 2014-09 will not have a material impact on the Company’s financial statements. Based on management’s evaluation process, the majority of the Company’s revenue arrangements generally consist of a single performance obligation to transfer promised services over time. The Company is entitled to consideration for the services as they are performed, and the timing and amount of revenue recognized based on ASU No. 2014-09 is consistent with the Company’s revenue recognition policy under previous guidance. However, the Company will be required to expand its revenue disclosures as a result of adopting the new standard, which will primarily include disaggregation of revenue, changes in contract assets and liabilities, information about our performance obligations and significant judgments made in the application of the new standard. The Company has documented this evaluation and has implemented processes and controls for its revenue streams as warranted by the guidance.
Accounting Standards Update 2016-02, Leases (Topic 842)--In February 2016, the FASB issued ASU 2016-02, “Leases (Topic 842).” ASU 2016-02 establishes a comprehensive new lease accounting model. The new standard: (a) clarifies the definition of a lease; (b) requires a dual approach to lease classification similar to current lease classifications; and, (c) causes lessees to recognize leases on the balance sheet as a lease liability with a corresponding right-of-use asset for leases with a lease-term of more than twelve months. The new standard is effective for interim and annual periods beginning after December 15, 2018, which for Davey Tree would be January 1, 2019. Early adoption is permitted. The new standard requires a modified retrospective transition for capital or operating leases existing at or entered into after the beginning of the earliest comparative period presented in the financial statements, but it does not require transition accounting for leases that expire prior to the date of initial application. The Company plans to adopt during the first quarter 2019. We are are in the process of identifying the population of leases affected and determining the information required to calculate the lease liability and right-of-use asset in addition to evaluating software to assist with future reporting.
CRITICAL ACCOUNTING POLICIES AND ESTIMATES
Our consolidated financial statements are prepared in accordance with accounting principles generally accepted in the United States. The preparation of these financial statements requires the use of estimates, judgments and assumptions that affect the reported amounts of assets and liabilities at the date of the financial statements and the reported amounts of revenues and expenses during the periods presented.
Page 27
On an ongoing basis, we evaluate our estimates and assumptions, including those related to accounts receivable, specifically those receivables under contractual arrangements primarily arising from Utility customers; allowance for doubtful accounts; and self-insurance accruals. We base our estimates on historical experience and on various other factors that we believe to be reasonable under the circumstances, the results of which form the basis for making judgments about the carrying values of assets and liabilities that are not readily apparent from other sources. Actual results could differ from these estimates.
We believe the following are our “critical accounting policies and estimates”--those most important to the financial presentations and those that require the most difficult, subjective or complex judgments.
Revenue Recognition--Revenues from Residential and Commercial customers are recognized as the services are provided and amounts are determined to be collectible. Revenues from contractual arrangements, primarily with Utility customers, are recognized based on costs incurred to total estimated contract costs. Changes in estimates and assumptions related to total estimated contract costs may have a material effect on the amounts reported as receivables arising from contractual arrangements and the corresponding amounts of revenues and profit.
Utility Customers--We generate a significant portion of revenues and corresponding accounts receivable from our Utility customers in the utility industry. One Utility customer, PG&E, approximated 11% of revenues during 2017, 12% during 2016 and 11% during 2015. Adverse conditions in the utility industry or individual utility customer operations may affect the collectibility of our receivables or our ability to generate ongoing revenues.
Allowance for Doubtful Accounts--In determining the allowance for doubtful accounts, we evaluate the collectibility of our accounts receivable based on a combination of factors. In circumstances where we are aware of a specific customer’s inability to meet its financial obligations to us (e.g., bankruptcy filings), we record a specific allowance for doubtful accounts against amounts due to reduce the net recognized receivable to the amount we reasonably believe will be collected. For all other customers, we recognize allowances for doubtful accounts based on the length of time the receivables are past due. If circumstances change (e.g., unexpected material adverse changes in a major customer’s ability to meet its financial obligation to us or higher than expected customer defaults), our estimates of the recoverability of amounts could differ from the actual amounts recovered.
Self-Insurance Accruals--We are generally self-insured for losses and liabilities related primarily to workers’ compensation, vehicle liability and general liability claims. We use commercial insurance as a risk-reduction strategy to minimize catastrophic losses. Ultimate losses are accrued based upon estimates of the aggregate liability for claims incurred using certain actuarial assumptions followed in the insurance industry and based on Company-specific experience.
Our self-insurance accruals include claims for which the ultimate losses will develop over a period of years. Accordingly, our estimates of ultimate losses can change as claims mature. Our accruals also are affected by changes in the number of new claims incurred and claim severity. The methods for estimating the ultimate losses and the total cost of claims were determined by third-party consulting actuaries; the resulting accruals are reviewed by management, and any adjustments arising from changes in estimates are reflected in income.
The workers' compensation accruals are discounted as the amount and timing of cash payments related to those accruals are reliably determinable given the nature of workers' compensation benefits and the level of historical claim volume to support the actuarial assumptions and judgments used to derive the expected loss payment pattern. The workers' compensation accruals are discounted using an interest rate that approximates the long-term investment yields over the expected payment pattern of unpaid losses.
Our self-insurance accruals are based on estimates and, while we believe that the amounts accrued are adequate and not excessive, the ultimate claims may be in excess of or less than the amounts provided.
MARKET RISK INFORMATION
In the normal course of business, we are exposed to market risk related to changes in interest rates, changes in foreign currency exchange rates and changes in the price of fuel. We do not hold or issue derivative financial instruments for trading or speculative purposes. We use derivative financial instruments to manage risk, in part, associated with changes in interest rates and changes in fuel prices.
Page 28
Interest Rate Risk
We are exposed to market risk related to changes in interest rates on long-term debt obligations. We regularly monitor and measure our interest rate risk and, to the extent that we believe we are exposed, from time-to-time we have entered into interest rate swap contracts--derivative financial instruments--with the objective of altering interest rate exposures related to a portion of our variable debt.
The following table provides information, as of December 31, 2017, about our debt obligations, including principal cash flows, weighted-average interest rates by expected maturity dates and fair values. Weighted-average interest rates used for variable-rate obligations are based on rates as derived from published spot rates, in effect as of December 31, 2017.
Expected Maturity Date | Fair Value December 31, 2017 | ||||||||||||||||||||||||||||||
2018 | 2019 | 2020 | 2021 | 2022 | Thereafter | Total | |||||||||||||||||||||||||
Liabilities | |||||||||||||||||||||||||||||||
Long-term debt: | |||||||||||||||||||||||||||||||
Fixed rate | $ | 16,387 | $ | 7,419 | $ | 7,426 | $ | 4,834 | $ | — | $ | — | $ | 36,066 | $ | 38,559 | |||||||||||||||
Average interest rate | 3.9 | % | 4.6 | % | 4.6 | % | 5.3 | % | — | — | |||||||||||||||||||||
Variable rate | $ | 431 | $ | 131 | $ | 125 | $ | — | $ | 100,000 | $ | — | $ | 100,687 | $ | 100,686 | |||||||||||||||
Average interest rate | 4.0 | % | 3.8 | % | 4.0 | % | — | 2.6 | % | — | |||||||||||||||||||||
Interest rates on the variable-rate debt, as of December 31, 2017, ranged from 2.5% to 13.0%.
Foreign Currency Exchange Rate Risk
We are exposed to market risk related to foreign currency exchange rate risk resulting from our operations in Canada, where we provide a comprehensive range of horticultural services. Our financial results could be affected by factors such as changes in the foreign currency exchange rate or differing economic conditions in the Canadian markets as compared with the markets for our services in the United States. Our earnings are affected by translation exposures from currency fluctuations in the value of the U.S. dollar as compared to the Canadian dollar. Similarly, the Canadian dollar-denominated assets and liabilities may result in financial exposure as to the timing of transactions and the net asset / liability position of our Canadian operations.
For the year ended December 31, 2017, the result of a hypothetical 10% uniform change in the value of the U.S. dollar as compared with the Canadian dollar would not have a material effect on our results of operations or our financial position. Our sensitivity analysis of the effect of changes in foreign currency exchange rates does not factor in a potential change in sales levels or local currency prices. Presently, we do not engage in hedging activities related to our foreign currency exchange rate risk.
Commodity Price Risk
We are subject to market risk from fluctuating prices of fuel--both diesel and gasoline. In prior years we have used fuel derivatives as "economic hedges" related to fuel consumed by Davey Tree service vehicles. The objectives of the economic hedges are to fix the price of a portion of our fuel needs and mitigate the earnings and cash flow volatility attributable to the risk of changing prices. Presently, we are not engaged in any hedging or derivative activities.
Impact of Inflation
The impact of inflation on the results of operations has not been significant in recent years.
Page 29
Item 7A. Quantitative and Qualitative Disclosures About Market Risk.
The information set forth in “Market Risk Information” under Item 7. “Management’s Discussion and Analysis of Financial Condition and Results of Operations” is incorporated herein by reference.
Item 8. Financial Statements and Supplementary Data.
Our consolidated financial statements are attached hereto and listed on page F-1 of this annual report.
Item 9. Changes in and Disagreements with Accountants on Accounting and Financial Disclosure.
None.
Item 9A. Controls and Procedures.
(a) Management’s Evaluation of Disclosure Controls and Procedures
As of the end of the period covered by this Form 10-K, we carried out an evaluation, under the supervision and with the participation of our management, including our Chief Executive Officer and Chief Financial Officer, of the effectiveness of the design and operation of our disclosure controls and procedures (as defined in Rule 13a-15(e) under the Securities Exchange Act of 1934 as amended (the “Exchange Act”)). Based on that evaluation, our Chief Executive Officer and Chief Financial Officer concluded that the design and operation of our disclosure controls and procedures were effective at the reasonable assurance level as of the end of the period covered by this Form 10-K in ensuring that information required to be disclosed in the reports that we file or submit under the Exchange Act is recorded, processed, summarized and reported within the time periods specified in the SEC’s rules and forms and is accumulated and communicated to our management, including our Chief Executive Officer and our Chief Financial Officer, as appropriate to allow timely decisions regarding required disclosure.
(b) Management’s Discussion of Internal Controls over Financial Reporting
Our management is responsible for establishing and maintaining adequate internal control over financial reporting. Our internal control framework and processes were designed to provide reasonable assurance to management and the Board of Directors that our financial reporting is reliable and that our consolidated financial statements for external purposes have been prepared in accordance with accounting principles generally accepted in the United States (“U.S. GAAP”).
Our management recognizes its responsibility for fostering a strong ethical climate so that our affairs are conducted according to the highest standards of personal and corporate conduct.
Our internal controls over financial reporting include policies and procedures that: (i) provide for the maintenance of records that, in reasonable detail, accurately and fairly reflect our business transactions; (ii) provide reasonable assurance that transactions are recorded properly to allow for the preparation of financial statements in accordance with U.S. GAAP; and (iii) provide reasonable assurance that the unauthorized acquisition, use, or disposition of our assets will be prevented or detected in a timely manner. We maintain a dynamic system of internal controls and processes--including internal controls over financial reporting--designed to ensure reliable financial recordkeeping, transparent financial reporting and protection of physical and intellectual property.
All internal control systems, no matter how well designed, have inherent limitations. Therefore, even those systems determined to be effective can provide only reasonable assurance with respect to financial statement preparation and presentation.
(c) Management’s Annual Report on Internal Control over Financial Reporting
The Company implemented additional internal controls during the fourth quarter 2017 to remediate the material weakness pursuant to the restatement included in the 2016 Form 10-K and Form 10-Q’s for the quarters ended April 1, 2017 and July 1, 2017 relating to the classification of shares of the Company’s common stock held by the Davey 401KSOP and ESOP Plan which were historically classified as permanent equity rather than temporary equity in the mezzanine section of the balance sheet.
Page 30
The Company has reviewed its internal control processes and procedures and has implemented the following changes to improve the precision of our review controls relating to redemption provisions and associated fair value and classification of our common shares related to the Plan.
• | Quarterly review of Plan statements from our third-party service provider. |
• | New procedures to identify disposition of Davey common stock from the 401KSOP and ESOP. |
• | Implemented additional reviews and reconciliations for transactions from the 401KSOP and ESOP. |
• | Enhanced review controls regarding changes to plan documents. |
• | Developed processes and controls around the fair value of the common shares in the 401KSOP and ESOP. |
Based on our evaluation, and as a result of the additional processes and internal controls implemented above, our management concluded that the controls are functioning properly and that our internal control over financial reporting is effective as of December 31, 2017.
Our independent registered public accounting firm has issued an audit report on our internal control over financial reporting, which is included in this report.
/s/ Patrick M. Covey | /s/ Joseph R. Paul | /s/ Thea R. Sears | ||
Patrick M. Covey President and Chief Executive Officer | Joseph R. Paul Executive Vice President, Chief Financial Officer and Secretary | Thea R. Sears Vice President and Controller | ||
Kent, Ohio
March 16, 2018
(d) Changes in Internal Control over Financial Reporting
Other than as described above, there were no changes in our internal control over financial reporting during the fourth quarter 2017 that have materially affected, or are reasonably likely to materially affect, our internal control over financial reporting.
Page 31
(e) Report of Independent Registered Public Accounting Firm
Report of Independent Registered Public Accounting Firm
To the Shareholders and the Board of Directors of The Davey Tree Expert Company
Opinion on Internal Control over Financial Reporting
We have audited The Davey Tree Expert Company’s internal control over financial reporting as of December 31, 2017, based on criteria established in Internal Control-Integrated Framework issued by the Committee of Sponsoring Organizations of the Treadway Commission (2013 Framework) (the COSO criteria). In our opinion, The Davey Tree Expert Company (the Company) maintained, in all material respects, effective internal control over financial reporting as of December 31, 2017, based on the COSO criteria.
We also have audited, in accordance with the standards of the Public Company Accounting Oversight Board (United States) (PCAOB), the consolidated balance sheets of the Company as of December 31, 2017 and 2016, and the related consolidated statements of operations, comprehensive income, shareholders’ equity, and cash flows for each of the three years in the period ended December 31, 2017, and the related notes and our report dated March 16, 2018 expressed an unqualified opinion thereon.
Basis for Opinion
The Company’s management is responsible for maintaining effective internal control over financial reporting, and for its assessment of the effectiveness of internal control over financial reporting included in the accompanying Management’s Annual Report on Internal Control over Financial Reporting. Our responsibility is to express an opinion on the Company’s internal control over financial reporting based on our audit. We are a public accounting firm registered with the PCAOB and are required to be independent with respect to the Company in accordance with the U.S. federal securities laws and the applicable rules and regulations of the Securities and Exchange Commission and the PCAOB.
We conducted our audit in accordance with the standards of the PCAOB. Those standards require that we plan and perform the audit to obtain reasonable assurance about whether effective internal control over financial reporting was maintained in all material respects.
Our audit included obtaining an understanding of internal control over financial reporting, assessing the risk that a material weakness exists, testing and evaluating the design and operating effectiveness of internal control based on the assessed risk, and performing such other procedures as we considered necessary in the circumstances. We believe that our audit provides a reasonable basis for our opinion.
Definition and Limitations of Internal Control Over Financial Reporting
A company’s internal control over financial reporting is a process designed to provide reasonable assurance regarding the reliability of financial reporting and the preparation of financial statements for external purposes in accordance with generally accepted accounting principles. A company’s internal control over financial reporting includes those policies and procedures that (1) pertain to the maintenance of records that, in reasonable detail, accurately and fairly reflect the transactions and dispositions of the assets of the company; (2) provide reasonable assurance that transactions are recorded as necessary to permit preparation of financial statements in accordance with generally accepted accounting principles, and that receipts and expenditures of the company are being made only in accordance with authorizations of management and directors of the company; and (3) provide reasonable assurance regarding prevention or timely detection of unauthorized acquisition, use, or disposition of the company’s assets that could have a material effect on the financial statements.
Because of its inherent limitations, internal control over financial reporting may not prevent or detect misstatements. Also, projections of any evaluation of effectiveness to future periods are subject to the risk that controls may become inadequate because of changes in conditions, or that the degree of compliance with the policies or procedures may deteriorate.
/s/ Ernst & Young LLP
Akron, Ohio
March 16, 2018
Item 9B. Other Information.
None.
Page 32
PART III
Item 10. Directors, Executive Officers and Corporate Governance.
Information about our executive officers is included in the section "Executive Officers of the Company,” pursuant to Instruction G of Form 10-K as an unnumbered item to Part I of this report.
Information about our directors is in the section "Proposal One-Election of Directors" and "Corporate Governance-Transactions with Related-Persons, Promoters and Certain Control Persons" of our 2018 Proxy Statement, which is incorporated into this report by reference.
Information about our audit committee and our audit committee financial experts is in the section "Corporate Governance- Committees of the Board of Directors; Attendance-Audit Committee” of our 2018 Proxy Statement, which is incorporated into this report by reference.
Information required by Item 405 of Regulation S-K is in the section "Ownership of Common Shares-Section 16(a) Beneficial Ownership Reporting Compliance” of our 2018 Proxy Statement, which is incorporated into this report by reference. See also the section titled "Corporate Governance-Shareholder Nominations for Director," which is incorporated into this report by reference.
We have adopted a Code of Ethics for Financial Matters that applies to our principal executive officer, principal financial officer and principal accounting officer, or persons performing similar functions. That Code is available on our website or upon request, as described in this report in Item 1. “Business - Access to Company Information.” We intend to disclose, on our website, any amendments to, or waiver of, any provision of that Code that would otherwise be required to be disclosed under the rules of the Securities and Exchange Commission.
Item 11. Executive Compensation.
Information about executive and director compensation is in the sections “Compensation Discussion and Analysis,” "Report of the Compensation Committee," "Compensation Risk Analysis," "Compensation of Executive Officers," "Corporate Governance-Committees of the Board of Directors; Attendance," "Corporate Governance-Compensation of Directors," "Corporate Governance-Role of the Board in Risk Oversight" for item and "Pay Ratio" 402(s) of Reg S-K of our 2018 Proxy Statement, which are incorporated into this report by reference.
Item 12. Security Ownership of Certain Beneficial Owners and Management and Related Stockholder Matters.
Information about ownership of our common shares by certain persons is in the section "Ownership of Common Shares" of our 2018 Proxy Statement, which is incorporated into this report by reference. Information about our securities authorized for issuance under equity compensation plans is in the section “Compensation of Executive Officers-Equity Compensation Plan Information” of our 2018 Proxy Statement, which is incorporated into this report by reference.
Item 13. Certain Relationships and Related Transactions, and Director Independence.
Information about certain transactions between us and our affiliates and certain other persons and the independence of directors is in the section “Corporate Governance-Board Independence” and "Corporate Governance-Transactions with Related-Persons, Promoters and Certain Control Persons" of our 2018 Proxy Statement, which is incorporated into this report by reference.
Item 14. Principal Accountant Fees and Services.
Information about our principal accountant’s fees and services is in the section “Independent Auditors” of our 2018 Proxy Statement, which is incorporated into this report by reference.
Page 33
PART IV
Item 15. Exhibits and Financial Statement Schedules.
(a) (1) and (a) (2) Financial Statements and Schedules.
The response to this portion of Item 15 is set forth on page F-1 of this report.
(b) Exhibits.
The exhibits to this Form 10-K are submitted as a separate section of this report. See Exhibit Index.
EXHIBIT INDEX | ||||
Exhibit No. | Description | |||
Page 34
EXHIBIT INDEX | ||||
Exhibit No. | Description | |||
Filed Herewith | ||||
Filed Herewith | ||||
Filed Herewith | ||||
Filed Herewith | ||||
Furnished Herewith | ||||
Furnished Herewith | ||||
Page 35
EXHIBIT INDEX | ||||
Exhibit No. | Description | |||
101 | The following materials from the Company's Annual Report on Form 10-K for the year ended December 31, 2017, formatted in XBRL (Extensible Business Reporting Language): (i) the Consolidated Balance Sheets, (ii) the Consolidated Statements of Operations, (iii) the Consolidated Statements of Comprehensive Income, (iv) the Statements of Consolidated Shareholders' Equity, (v) the Consolidated Statements of Cash Flows, and (vi) Notes to Consolidated Financial Statements. | Filed Herewith | ||
* Management contracts or compensatory plans or arrangements.
The Registrant is a party to certain instruments, copies of which will be furnished to the Securities and Exchange Commission upon request, defining the rights of holders of long-term debt.
Item 16. Form 10-K Summary.
None.
Page 36
SIGNATURES |
Pursuant to the requirements of Section 13 or 15(d) of the Securities Exchange Act of 1934, the registrant has duly caused this report to be signed on its behalf by the undersigned, thereunto duly authorized on March 16, 2018. |
THE DAVEY TREE EXPERT COMPANY | ||
/s/ Patrick M. Covey | ||
Patrick M. Covey President and Chief Executive Officer | ||
Pursuant to the requirements of the Securities Exchange Act of 1934, this report has been signed below by the following persons on behalf of the registrant and in the capacities indicated on March 14, 2017. | ||
/s/ Donald C. Brown | /s/ John E. Warfel | |
Donald C. Brown Director | John E. Warfel Director | |
/s/ Patrick M. Covey | /s/ Karl J. Warnke | |
Patrick M. Covey Director, President and Chief Executive Officer (Principal Executive Officer) | Karl J. Warnke Director, Chairman of the Board of Directors | |
/s/ J. Dawson Cunningham | /s/ Joseph R. Paul | |
J. Dawson Cunningham Director | Joseph R. Paul Executive Vice President, Chief Financial Officer and Secretary (Principal Financial Officer) | |
/s/ William J. Ginn | /s/ Thea R. Sears | |
William J. Ginn Director | Thea R. Sears Vice President and Controller (Principal Accounting Officer) | |
/s/ Douglas K. Hall | ||
Douglas K. Hall Director | ||
/s/ Sandra W. Harbrecht | ||
Sandra W. Harbrecht Director | ||
Page 37
ANNUAL REPORT ON FORM 10-K
ITEM 8, ITEM 15(a)(1) and (2)
LIST OF FINANCIAL STATEMENTS AND FINANCIAL STATEMENT SCHEDULES
FINANCIAL STATEMENTS AND SUPPLEMENTARY DATA
CERTAIN EXHIBITS
FINANCIAL STATEMENTS SCHEDULES
YEAR ENDED DECEMBER 31, 2017
THE DAVEY TREE EXPERT COMPANY
KENT, OHIO
Page 38
LIST OF FINANCIAL STATEMENTS AND FINANCIAL STATEMENT SCHEDULES | |
FORM 10-K - ITEM 15(a)(1) AND (2) | |
THE DAVEY TREE EXPERT COMPANY | |
The following consolidated financial statements of The Davey Tree Expert Company are included in Item 8: | |
Audited Consolidated Financial Statements: | Page |
Notes to Consolidated Financial Statements -- December 31, 2017 | |
Financial Statement Schedules: | |
None. | |
All schedules for which provision is made in the applicable accounting regulations of the Securities and Exchange Commission are not required under the related instructions or are inapplicable and therefore have been omitted. | |
F-1
Report of Independent Registered Public Accounting Firm
To the Shareholders and the Board of Directors of The Davey Tree Expert Company
Opinion on the Financial Statements
We have audited the accompanying consolidated balance sheets of The Davey Tree Expert Company (the Company) as of December 31, 2017 and 2016, and the related consolidated statements of operations, comprehensive income, shareholders' equity, and cash flows for each of the three years in the period ended December 31, 2017, and the related notes (collectively referred to as the “consolidated financial statements”). In our opinion, the consolidated financial statements present fairly, in all material respects, the financial position of the Company at December 31, 2017 and 2016, and the results of its operations and its cash flows for each of the three years in the period ended December 31, 2017, in conformity with U.S. generally accepted accounting principles.
We also have audited, in accordance with the standards of the Public Company Accounting Oversight Board (United States) (PCAOB), the Company's internal control over financial reporting as of December 31, 2017, based on criteria established in Internal Control-Integrated Framework issued by the Committee of Sponsoring Organizations of the Treadway Commission (2013 Framework) and our report dated March 16, 2018 expressed an unqualified opinion thereon.
Basis for Opinion
These financial statements are the responsibility of the Company's management. Our responsibility is to express an opinion on the Company’s financial statements based on our audits. We are a public accounting firm registered with the PCAOB and are required to be independent with respect to the Company in accordance with the U.S. federal securities laws and the applicable rules and regulations of the Securities and Exchange Commission and the PCAOB.
We conducted our audits in accordance with the standards of the PCAOB. Those standards require that we plan and perform the audit to obtain reasonable assurance about whether the financial statements are free of material misstatement, whether due to error or fraud. Our audits included performing procedures to assess the risks of material misstatement of the financial statements, whether due to error or fraud, and performing procedures that respond to those risks. Such procedures included examining, on a test basis, evidence regarding the amounts and disclosures in the financial statements. Our audits also included evaluating the accounting principles used and significant estimates made by management, as well as evaluating the overall presentation of the financial statements. We believe that our audits provide a reasonable basis for our opinion.
/s/ Ernst & Young LLP
We have served as the Company’s auditor since 2001.
Akron, Ohio
March 16, 2018
F-2
THE DAVEY TREE EXPERT COMPANY
CONSOLIDATED BALANCE SHEETS
(In thousands, except per share dollar amounts)
December 31, | |||||||
2017 | 2016 | ||||||
Assets | |||||||
Current assets: | |||||||
Cash | $ | 13,121 | $ | 9,006 | |||
Accounts receivable, net | 168,671 | 146,134 | |||||
Operating supplies | 10,069 | 7,277 | |||||
Prepaid expenses | 15,893 | 14,493 | |||||
Other current assets | 1,371 | 1,863 | |||||
Total current assets | 209,125 | 178,773 | |||||
Property and equipment: | |||||||
Land and land improvements | 18,215 | 16,263 | |||||
Buildings and leasehold improvements | 40,285 | 37,676 | |||||
Equipment | 557,536 | 534,711 | |||||
616,036 | 588,650 | ||||||
Less accumulated depreciation | 422,853 | 409,214 | |||||
193,183 | 179,436 | ||||||
Other assets | 29,156 | 31,354 | |||||
Identified intangible assets and goodwill, net | 41,671 | 34,376 | |||||
$ | 473,135 | $ | 423,939 | ||||
Liabilities and shareholders' equity | |||||||
Current liabilities: | |||||||
Short-term debt | $ | 16,315 | $ | 16,701 | |||
Current portion of capital leases | 651 | 170 | |||||
Accounts payable | 45,093 | 41,283 | |||||
Accrued expenses | 42,816 | 37,659 | |||||
Self-insurance accruals | 23,782 | 23,092 | |||||
Total current liabilities | 128,657 | 118,905 | |||||
Long-term debt | 105,469 | 72,194 | |||||
Senior unsecured notes | 11,882 | 17,923 | |||||
Capital leases | 1,859 | 2,173 | |||||
Self-insurance accruals | 43,912 | 39,746 | |||||
Other liabilities | 19,966 | 20,819 | |||||
311,745 | 271,760 | ||||||
Redeemable common shares related to 401KSOP and Employee Stock Ownership Plan (ESOP): 6,467 and 7,057 shares at redemption value as of December 31, 2017 and 2016 | 123,520 | 124,201 | |||||
Common shareholders' equity:* | |||||||
Common shares, $1.00 par value, per share; 48,000 shares authorized; 36,447 and 35,857 shares issued and outstanding before treasury shares and which excludes 6,467 and 7,057 shares subject to redemption as of December 31, 2017 and 2016 | 36,447 | 35,857 | |||||
Additional paid-in capital | 58,554 | 41,626 | |||||
Common shares subscribed | 7,529 | 8,209 | |||||
Retained earnings | 143,835 | 133,951 | |||||
Accumulated other comprehensive loss | (8,393 | ) | (12,162 | ) | |||
237,972 | 207,481 | ||||||
Less: Cost of Common shares held in treasury; 18,693 shares in 2017 and 17,991 in 2016 | 198,327 | 176,530 | |||||
Common shares subscription receivable | 1,775 | 2,973 | |||||
37,870 | 27,978 | ||||||
$ | 473,135 | $ | 423,939 | ||||
* Prior period has been adjusted for the two-for-one stock split | |||||||
See notes to consolidated financial statements. | |||||||
F-3
THE DAVEY TREE EXPERT COMPANY
CONSOLIDATED STATEMENTS OF OPERATIONS
(In thousands, except per share dollar amounts)
Year Ended December 31, | |||||||||||
2017 | 2016 | 2015 | |||||||||
Revenues | $ | 915,958 | $ | 845,678 | $ | 821,904 | |||||
Costs and expenses: | |||||||||||
Operating | 587,333 | 541,486 | 528,899 | ||||||||
Selling | 167,934 | 152,106 | 144,234 | ||||||||
General and administrative | 64,589 | 61,789 | 59,798 | ||||||||
Depreciation | 50,702 | 47,284 | 44,677 | ||||||||
Amortization of intangible assets | 2,384 | 2,306 | 2,214 | ||||||||
Gain on sale of assets, net | (3,989 | ) | (4,664 | ) | (2,026 | ) | |||||
868,953 | 800,307 | 777,796 | |||||||||
Income from operations | 47,005 | 45,371 | 44,108 | ||||||||
Other income (expense): | |||||||||||
Interest expense | (4,886 | ) | (4,393 | ) | (3,355 | ) | |||||
Interest income | 292 | 255 | 249 | ||||||||
Other | (4,417 | ) | (3,989 | ) | (5,744 | ) | |||||
Income before income taxes | 37,994 | 37,244 | 35,258 | ||||||||
Income taxes | 15,874 | 14,960 | 13,460 | ||||||||
Net income | $ | 22,120 | $ | 22,284 | $ | 21,798 | |||||
Share data:* | |||||||||||
Earnings per share--basic | $ | .87 | $ | .85 | $ | .81 | |||||
Earnings per share--diluted | $ | .83 | $ | .82 | $ | .78 | |||||
Weighted-average shares outstanding:* | |||||||||||
Basic | 25,557 | 26,212 | 26,931 | ||||||||
Diluted | 26,697 | 27,247 | 27,955 | ||||||||
Dividends declared per share* | $ | .100 | $ | .100 | $ | .100 | |||||
* Prior periods adjusted for the two-for-one stock split | |||||||||||
See notes to consolidated financial statements. | |||||||||||
F-4
THE DAVEY TREE EXPERT COMPANY
CONSOLIDATED STATEMENTS OF COMPREHENSIVE INCOME
(In thousands)
Year Ended December 31, | |||||||||||
2017 | 2016 | 2015 | |||||||||
Net income | $ | 22,120 | $ | 22,284 | $ | 21,798 | |||||
Other comprehensive income (loss), net of tax: | |||||||||||
Foreign currency translation adjustments gains/(losses) | 2,195 | 744 | (5,093 | ) | |||||||
Defined benefit pension plans: | |||||||||||
Net (loss)/gain arising during the year | (1,286 | ) | (1,219 | ) | 326 | ||||||
Reclassification to results of operations: | |||||||||||
Amortization of defined benefit pension items: | |||||||||||
Net actuarial loss | 2,822 | 1,912 | 2,863 | ||||||||
Prior service cost | 38 | (205 | ) | 33 | |||||||
2,860 | 1,707 | 2,896 | |||||||||
Defined benefit pension plan adjustments | 1,574 | 488 | 3,222 | ||||||||
Total other comprehensive income (loss), net of tax | 3,769 | 1,232 | (1,871 | ) | |||||||
Comprehensive income | $ | 25,889 | $ | 23,516 | $ | 19,927 | |||||
See notes to consolidated financial statements. | |||||||||||
F-5
THE DAVEY TREE EXPERT COMPANY
STATEMENTS OF CONSOLIDATED SHAREHOLDERS' EQUITY
(In thousands, except per share data)
2017 | 2016 | 2015 | ||||||||||||||||||
Shares* | Amount | Shares* | Amount | Shares* | Amount | |||||||||||||||
Common shares | ||||||||||||||||||||
At beginning of year | 35,857 | $ | 35,857 | 35,141 | $ | 35,141 | 34,697 | $ | 34,697 | |||||||||||
Change in 401KSOP and ESOP related shares | 590 | 590 | 716 | 716 | 444 | 444 | ||||||||||||||
At end of year | 36,447 | 36,447 | 35,857 | 35,857 | 35,141 | 35,141 | ||||||||||||||
Additional paid-in capital | ||||||||||||||||||||
At beginning of year | 41,626 | 24,340 | 9,520 | |||||||||||||||||
Shares sold to employees | 5,690 | 4,182 | 6,066 | |||||||||||||||||
Options exercised | 76 | (992 | ) | (152 | ) | |||||||||||||||
Subscription shares, issued | (35 | ) | 21 | 83 | ||||||||||||||||
Stock-based compensation | 1,220 | 2,860 | 2,357 | |||||||||||||||||
Change in 401KSOP and ESOP related shares | 9,977 | 11,215 | 6,466 | |||||||||||||||||
At end of year | 58,554 | 41,626 | 24,340 | |||||||||||||||||
Common shares subscribed, unissued | ||||||||||||||||||||
At beginning of year | 834 | 8,209 | 872 | 8,591 | 952 | 9,381 | ||||||||||||||
Common shares, issued | (59 | ) | (567 | ) | (32 | ) | (325 | ) | (68 | ) | (676 | ) | ||||||||
Cancellations | (11 | ) | (113 | ) | (6 | ) | (57 | ) | (12 | ) | (114 | ) | ||||||||
At end of year | 764 | 7,529 | 834 | 8,209 | 872 | 8,591 | ||||||||||||||
Retained earnings | ||||||||||||||||||||
At beginning of year | 133,951 | 123,307 | 114,504 | |||||||||||||||||
Net income | 22,120 | 22,284 | 21,798 | |||||||||||||||||
Dividends, $ .10 per share | (2,513 | ) | (2,597 | ) | (2,663 | ) | ||||||||||||||
Stock-based compensation | 162 | — | — | |||||||||||||||||
Change in the fair value of 401KSOP and ESOP related shares | (9,885 | ) | (9,043 | ) | (10,332 | ) | ||||||||||||||
At end of year | 143,835 | 133,951 | 123,307 | |||||||||||||||||
Accumulated other comprehensive income (loss), net of tax | ||||||||||||||||||||
At beginning of year | (12,162 | ) | (13,394 | ) | (11,523 | ) | ||||||||||||||
Currency translation adjustments | 2,196 | 744 | (5,093 | ) | ||||||||||||||||
Defined benefit pension plans | 1,573 | 488 | 3,222 | |||||||||||||||||
At end of year | (8,393 | ) | (12,162 | ) | (13,394 | ) | ||||||||||||||
Common shares held in treasury | ||||||||||||||||||||
At beginning of year | 17,991 | (176,530 | ) | 17,427 | (159,429 | ) | 16,584 | (138,155 | ) | |||||||||||
Shares purchased | 1,698 | (30,566 | ) | 1,492 | (25,290 | ) | 1,648 | (25,395 | ) | |||||||||||
Shares sold to employees | (663 | ) | 5,206 | (617 | ) | 5,298 | (576 | ) | 2,198 | |||||||||||
Options exercised | (242 | ) | 2,634 | (262 | ) | 2,442 | (143 | ) | 1,225 | |||||||||||
Subscription shares, issued | (91 | ) | 929 | (49 | ) | 449 | (86 | ) | 698 | |||||||||||
At end of year | 18,693 | (198,327 | ) | 17,991 | (176,530 | ) | 17,427 | (159,429 | ) | |||||||||||
Common shares subscription receivable | ||||||||||||||||||||
At beginning of year | (834 | ) | (2,973 | ) | (872 | ) | (4,106 | ) | (952 | ) | (5,600 | ) | ||||||||
Payments | 59 | 1,123 | 32 | 1,104 | 68 | 1,434 | ||||||||||||||
Cancellations | 11 | 75 | 6 | 29 | 12 | 60 | ||||||||||||||
At end of year | (764 | ) | (1,775 | ) | (834 | ) | (2,973 | ) | (872 | ) | (4,106 | ) | ||||||||
Common shareholders' equity at December 31 | 17,754 | $ | 37,870 | 17,866 | $ | 27,978 | 17,714 | $ | 14,450 | |||||||||||
* Prior periods adjusted for the two-for-one stock split | ||||||||||||||||||||
See notes to consolidated financial statements. | ||||||||||||||||||||
F-6
THE DAVEY TREE EXPERT COMPANY
CONSOLIDATED STATEMENTS OF CASH FLOWS
(In thousands)
Year Ended December 31, | ||||||||||||
2017 | 2016 | 2015 | ||||||||||
Operating activities | ||||||||||||
Net income | $ | 22,120 | $ | 22,284 | $ | 21,798 | ||||||
Adjustments to reconcile net income to net cash provided by operating activities: | ||||||||||||
Depreciation | 50,702 | 47,284 | 44,677 | |||||||||
Amortization | 2,384 | 2,306 | 2,214 | |||||||||
Gain on sale of assets | (3,989 | ) | (4,664 | ) | (2,026 | ) | ||||||
Deferred income taxes | 3,753 | 60 | (2,975 | ) | ||||||||
Other | 2,581 | 1,286 | 2,399 | |||||||||
Changes in operating assets and liabilities: | ||||||||||||
Accounts receivable | (20,784 | ) | (26,133 | ) | (8,403 | ) | ||||||
Accounts payable and accrued expenses | 6,164 | 2,454 | 1,722 | |||||||||
Self-insurance accruals | 4,856 | 2,499 | 1,446 | |||||||||
Other assets, net | (11,011 | ) | 7,994 | 1,837 | ||||||||
34,656 | 33,086 | 40,891 | ||||||||||
Net cash provided by operating activities | 56,776 | 55,370 | 62,689 | |||||||||
Investing activities | ||||||||||||
Capital expenditures: | ||||||||||||
Equipment | (53,128 | ) | (54,147 | ) | (52,466 | ) | ||||||
Land and buildings | (3,972 | ) | (2,499 | ) | (3,581 | ) | ||||||
Proceeds from sales of property and equipment | 5,034 | 5,635 | 2,650 | |||||||||
Purchases of businesses | (7,452 | ) | (3,797 | ) | (2,649 | ) | ||||||
Net cash used in investing activities | (59,518 | ) | (54,808 | ) | (56,046 | ) | ||||||
Financing activities | ||||||||||||
Revolving credit facility borrowings/(payments), net | 33,000 | 12,500 | 10,000 | |||||||||
(Payments)/borrowings of notes payable | (2,144 | ) | 656 | 6,720 | ||||||||
Payments of long-term debt and capital leases | (6,548 | ) | (5,142 | ) | (6,624 | ) | ||||||
Purchase of common shares for treasury | (30,404 | ) | (25,290 | ) | (25,395 | ) | ||||||
Sale of common shares from treasury | 13,820 | 11,019 | 9,328 | |||||||||
Cash received on common-share subscriptions | 1,199 | 1,133 | 1,494 | |||||||||
Dividends | (2,513 | ) | (2,597 | ) | (2,663 | ) | ||||||
Net cash provided by (used in) financing activities | 6,410 | (7,721 | ) | (7,140 | ) | |||||||
Effect of exchange rate changes on cash | 447 | 135 | (1,888 | ) | ||||||||
Increase (Decrease) in cash | 4,115 | (7,024 | ) | (2,385 | ) | |||||||
Cash, beginning of year | 9,006 | 16,030 | 18,415 | |||||||||
Cash, end of year | $ | 13,121 | $ | 9,006 | $ | 16,030 | ||||||
See notes to consolidated financial statements. | ||||||||||||
F-7
The Davey Tree Expert Company
Notes to Consolidated Financial Statements
December 31, 2017
(In thousands, except share data)
A. | Our Business |
We provide a wide range of arboricultural, horticultural, environmental and consulting services to residential, utility, commercial and government entities throughout the United States and Canada. We have two reportable operating segments organized by type or class of customer: Residential and Commercial, and Utility.
Residential and Commercial--Residential and Commercial provides services to our residential and commercial customers including: the treatment, preservation, maintenance, removal and planting of trees, shrubs and other plant life; the practice of landscaping, grounds maintenance, tree surgery, tree feeding and tree spraying; the application of fertilizer, herbicides and insecticides; and, natural resource management and consulting, forestry research and development, and environmental planning.
Utility--Utility is principally engaged in providing services to our utility customers--investor-owned, municipal utilities, and rural electric cooperatives--including: the practice of line-clearing and vegetation management around power lines, rights-of-way and chemical brush control; and, natural resource management and consulting, forestry research and development and environmental planning.
We also maintain research, technical support and laboratory diagnostic facilities.
When we refer to “we,” “us,” “our,” “Davey Tree,” and the “Company,” we mean The Davey Tree Expert Company, unless the context indicates otherwise.
B. | Summary of Significant Accounting Policies |
Principles of Consolidation and Basis of Presentation--The consolidated financial statements include the accounts of Davey Tree and our wholly-owned subsidiaries and were prepared in accordance with accounting principles generally accepted in the United States of America (“U.S. GAAP”) as codified in the Financial Accounting Standards Board ("FASB") Accounting Standards Codification ("ASC"). Intercompany accounts and transactions have been eliminated in consolidation.
Per Common Share Information--We have given retroactive consideration to the two-for-one stock split of our common shares effective June 1, 2017 including all common share and per share data.
Use of Estimates in Financial Statement Preparation--The preparation of financial statements in accordance with U.S. GAAP requires management to make estimates and assumptions that affect reported amounts. Estimates are used for, but not limited to, accounts receivable valuation, depreciable lives of fixed assets, self-insurance accruals, and revenue recognition. Actual results could differ from those estimates.
Property and Equipment--Property and equipment are stated at cost. Repair and maintenance costs are expensed as incurred. Depreciation is computed for financial reporting purposes by the straight-line method for land improvements, building and leasehold improvements and by the declining-balance method for equipment, based on the estimated useful lives of the assets, as follows:
Land improvements | 5 to 20 years |
Buildings | 5 to 30 years |
Equipment | 3 to 10 years |
Leasehold improvements | Shorter of lease term or estimated useful life; ranging from 5-to-20 years |
Intangible Assets--Intangible assets with finite lives, primarily customer lists, noncompete agreements and tradenames, are amortized by the straight-line method based on their estimated useful lives, ranging from one-to-ten years.
Long-Lived Assets--We assess potential impairment to our long-lived assets, other than goodwill, when there is evidence that events or changes in circumstances have made recovery of the asset’s carrying value unlikely and the carrying amount of the asset exceeds the estimated future undiscounted cash flow. In the event the assessment indicates that the carrying amounts
F-8
The Davey Tree Expert Company
Notes to Consolidated Financial Statements--(Continued)
December 31, 2017
(In thousands, except share data)
B. | Summary of Significant Accounting Policies (continued) |
may not be recoverable, an impairment loss would be recognized to reduce the asset’s carrying amount to its estimated fair value based on the present value of the estimated future cash flows.
Goodwill--Goodwill is recorded when the cost of acquired businesses exceeds the fair value of the identified net assets acquired. Goodwill is not amortized, but tested for impairment annually or when events or circumstances indicate that impairment may have occurred. Annually, we perform the impairment tests for goodwill during the fourth quarter. Impairment of goodwill is tested at the reporting-unit level, which for us are also our business segments. Impairment of goodwill is tested by comparing the reporting unit’s carrying value, including goodwill, to the fair value of the reporting unit. The fair values of the reporting units are estimated using discounted projected cash flows. If the carrying value of the reporting unit exceeds its fair value, goodwill is considered impaired and an impairment loss should be recognized for the amount by which the carrying amount exceeds the reporting unit’s fair value. We conducted our annual impairment tests and determined that no impairment loss was required to be recognized in 2017 or for any prior periods. There were no events or circumstances from the date of our assessment through December 31, 2017 that would impact this conclusion.
Self-Insurance Accruals--We are generally self-insured for losses and liabilities related primarily to workers’ compensation, vehicle liability and general liability claims. We use commercial insurance as a risk-reduction strategy to minimize catastrophic losses. Ultimate losses are accrued based upon estimates of the aggregate liability for claims incurred using certain actuarial assumptions followed in the insurance industry and based on Company-specific experience.
Our self-insurance accruals include claims for which the ultimate losses will develop over a period of years. Accordingly, our estimates of ultimate losses can change as claims mature. Our accruals also are affected by changes in the number of new claims incurred and claim severity. The methods for estimating the ultimate losses and the total cost of claims were determined by third-party consulting actuaries; the resulting accruals are reviewed by management, and any adjustments arising from changes in estimates are reflected in income.
The workers' compensation accruals are discounted as the amount and timing of cash payments related to those accruals are reliably determinable given the nature of workers' compensation benefits and the level of historical claim volume to support the actuarial assumptions and judgments used to derive the expected loss payment pattern. The workers' compensation accruals are discounted using an interest rate that approximates the long-term investment yields over the expected payment pattern of unpaid losses.
Our self-insurance accruals are based on estimates and, while we believe that the amounts accrued are adequate and not excessive, the ultimate claims may be in excess of or less than the amounts provided.
Stock-Based Compensation--Stock-based compensation cost for all share-based payment plans is measured at fair value on the date of grant and recognized over the employee service period on the straight-line recognition method for awards expected to vest. The fair value of all stock-based payment plans—stock option plans, stock-settled stock appreciation rights, and performance-based restricted stock units as well as our Employee Stock Purchase Plan—is determined by the number of awards granted and the price of our common stock. The fair value of each award is estimated on the date of grant using a binomial option-pricing model. The binomial model considers a range of assumptions related to volatility, risk-free interest rate and employee exercise behavior. Expected volatilities utilized in the binomial model are based on historical volatility of our share prices and other factors. Similarly, the dividend yield is based on historical experience and expected future changes. The binomial model also incorporates exercise assumptions based on an analysis of historical data. The expected life of the stock-based awards is derived from the output of the binomial model and represents the period of time that awards granted are expected to be outstanding.
Defined Benefit Pension Plans--We record annual expenses relating to our defined benefit pension plans based on calculations that include various actuarial assumptions, including discount rates and expected long-term rates of return on plan assets. Actuarial assumptions are reviewed annually with modifications made to the assumptions, if necessary, based on current rates and trends. The effects of the actuarial gains or losses are amortized over future service periods. The funded status (that is, the projected benefit obligation less the fair value of plan assets) for each plan is reported in our balance sheet
F-9
The Davey Tree Expert Company
Notes to Consolidated Financial Statements--(Continued)
December 31, 2017
(In thousands, except share data)
B. | Summary of Significant Accounting Policies (continued) |
using a December 31 measurement date. Changes in the funded status of the plans are recognized in the year in which the changes occur and reported in comprehensive income (loss).
Income Taxes--We compute taxes on income in accordance with the tax rules and regulations where the income is earned. The income tax rates imposed by these taxing authorities vary. Taxable income may differ from pretax income for financial reporting purposes. We compute and recognize deferred tax assets and liabilities for the expected future tax consequences of temporary differences between the financial statement carrying amounts and the tax bases of our assets and liabilities. Changes in tax rates and laws are reflected in income in the period when such changes are enacted. We account for uncertain tax positions by recognizing the financial statement effects of a tax position only when, based upon the technical merits, it is more-likely-than-not that the position will be sustained upon examination.
Earnings Per Share--Basic earnings per share is determined by dividing the income available to common shareholders by the weighted-average number of common shares outstanding. Diluted earnings per share is computed similarly to basic earnings per share except that the weighted-average number of shares is increased to include the effect of stock awards that were granted and outstanding during the period.
Revenue Recognition--Revenues from residential and commercial services are recognized as the services are provided and amounts are determined to be collectible. Revenues from contractual arrangements, primarily with utility services customers, are recognized based on costs incurred to total estimated contract costs. During the performance of such contracts, estimated final contract prices and costs are periodically reviewed and revisions are made, as required, to the revenue recognized. On cost-plus-fee contracts, revenue is recognized to the extent of costs incurred plus a proportionate amount of fees earned, and on time-and-material contracts, revenue is recognized to the extent of billable rates times hours worked, plus material and other reimbursable costs incurred. Revisions arise in the normal course of providing services to utility services customers and generally relate to changes in contract specifications and cost allowability. Such revisions are recorded when realization is probable and can be reliably estimated.
Concentration of Credit Risk--Credit risk represents the accounting loss that would be recognized if the counterparties failed to perform as contracted. The principal financial instruments subject to credit risk follow:
Cash--To limit our exposure, we transact our business and maintain banking relationships with high credit-quality financial institutions.
Accounts Receivable--Our residential and commercial customers are located geographically throughout the United States and Canada and, as to commercial customers, within differing industries; thus, minimizing credit risk. The credit exposure of utility services customers is directly affected by conditions within the utility industries as well as the financial condition of individual customers. One utility customer approximated 11% of revenues during 2017, 12% in 2016 and 11% in 2015. To reduce credit risk, we evaluate the credit of customers, but generally do not require advance payments or collateral. Exposure to losses on receivables is principally dependent on each customer’s financial condition.
Foreign Currency Translation and Transactions--Assets and liabilities of our Canadian operations are translated into U.S. dollars using year-end exchange rates, and revenues and expenses are translated using exchange rates as determined throughout the year. Gains or losses resulting from translation are included in the consolidated balance sheet, classified in shareholders’ equity as a separate component of accumulated other comprehensive income (loss). Gains or losses resulting from Canadian-dollar transactions with the Canadian operations are translated to U.S. dollars at the rates of exchange prevailing at the dates of the transactions. The effect of the transactions gain or loss is classified in the statement of operations as a component of other nonoperating income (expense), net.
Interest Rate Risk Management--We have entered into interest rate contracts, from time-to-time, with the objective of altering interest rate exposures related to variable rate debt. In the interest rate contracts, we have agreed with a financial
F-10
The Davey Tree Expert Company
Notes to Consolidated Financial Statements--(Continued)
December 31, 2017
(In thousands, except share data)
B. | Summary of Significant Accounting Policies (continued) |
institution to exchange, at specified intervals, the difference between fixed and floating interest amounts calculated on an agreed-upon notional principal amount. During the year ended December 31, 2017, we did not enter into any interest rate contracts.
Comprehensive Income (Loss)--Comprehensive income (loss) includes net income and other comprehensive income or loss. Other comprehensive income (loss) refers to revenues, expenses, gains and losses that under U.S. GAAP are included in comprehensive income but are excluded from net income as these amounts are recorded directly as an adjustment to shareholders’ equity, net of tax.
C. | Recent Accounting Guidance |
Accounting Standards Adopted in 2017
Accounting Standards Update 2016-09, Compensation-Stock Compensation (Topic 718): Improvements to Employee Share-Based Payment Accounting--In March 2016, the FASB issued ASU 2016-09, “Stock Compensation (Topic 718): Improvements to Employee Share-Based Payment Accounting,” with the objective to simplify several aspects of the accounting for share-based payment transactions, including: the income tax consequences; classification of awards as either equity or liabilities; classification of certain items on the statement of cash flows; and, accounting for forfeitures. ASU 2016-09 became effective for Davey Tree on January 1, 2017 and we elected to make an accounting policy change to recognize forfeitures as they occur. The adoption impact on the consolidated condensed balance sheet was a cumulative-effect adjustment of $162, increasing opening retained earnings and decreasing additional paid-in capital.
Accounting Standards Update 2017-04, Intangibles-Goodwill and Other (Topic 350): Simplifying the Test for Goodwill Impairment--In January 2017, the FASB issued ASU 2017-04, “Intangibles-Goodwill and Other (Topic 350),” which simplifies the subsequent measurement of goodwill by eliminating Step 2 of the goodwill impairment test, which required entities to fair value their assets and liabilities using procedures that would be followed in an assumed business combination to arrive at the impairment charge. Under ASU 2017-04, the goodwill impairment test is performed by comparing the fair value of the reporting unit with its carrying amount and an impairment charge should be recognized for the amount by which the carrying amount exceeds the reporting unit’s fair value. The update is effective for annual or interim periods beginning after December 15, 2019, which for Davey Tree is January 1, 2020. The Company early adopted ASU 2017-04 during the fourth quarter 2017 and the adoption had no effect on the Company’s consolidated financial statements or related disclosures.
Accounting Standards Update 2017-09, Compensation - Stock Compensation (Topic 718): Scope of Modification Accounting--In May 2017, the FASB issued ASU 2017-09, “Compensation - Stock Compensation (Topic 718): Scope of Modification Accounting,” which provides guidance on which changes in the terms or conditions of a share-based payment award require modification accounting under Topic 718. Modification accounting is required for changes in terms or conditions unless the fair value, vesting condition and classification of the modified award is the same as the original award. The update is effective for annual and interim periods beginning after December 15, 2017, which for Davey Tree would be January 1, 2018. The Company early adopted ASU 2017-09 during the fourth quarter 2017 and the adoption had no effect on the Company's consolidated financial statements or related disclosures.
Accounting Standards Not Yet Adopted
Accounting Standards Update 2016-15, Statement of Cash Flows (Topic 230): Classification of Certain Cash Receipts and Cash Payments (a consensus of the FASB Emerging Issues Task Force)--In August 2016, the FASB issued ASU 2016-15, “Statement of Cash Flows (Topic 230): Classification of Certain Cash Receipts and Cash Payments,” which provides guidance on how cash receipts and cash payments related to eight specific cash flow issues are presented and classified in the statement of cash flows, with the objective of reducing the existing diversity in practice. The update is effective for annual periods beginning after December 15, 2017, which for Davey Tree would be January 1, 2018. Early adoption is permitted. We do not expect the adoption of ASU 2016-15 to have a material impact on our consolidated financial statements.
F-11
The Davey Tree Expert Company
Notes to Consolidated Financial Statements--(Continued)
December 31, 2017
(In thousands, except share data)
C. | Recent Accounting Guidance (continued) |
Accounting Standards Update 2017-07, Compensation - Retirement Benefits (Topic 715): Improving the Presentation of Net Periodic Pension Cost and Net Periodic Postretirement Benefit Cost--In March 2017, the FASB issued ASU 2017-07, “Compensation-Retirement Benefits (Topic 715): Improving the Presentation of Net Periodic Pension Cost and Net Periodic Postretirement Benefit Cost,” which changes the presentation of net periodic benefit cost related to employer sponsored defined benefit plans and other postretirement benefits. Under ASU 2017-07, service costs will be included within the same income statement line item as other compensation costs arising from services rendered by pertinent employees during the period. The other components of net periodic benefit pension cost will be presented separately outside of income from operations. Additionally, only service costs may be capitalized in assets. ASU 2017-07 is effective for fiscal years beginning after December 15, 2017, which for Davey Tree is January 1, 2018. Management is currently assessing the impact of the new standard on the Company’s consolidated financial statements and does not expect the adoption to have a material effect on the Company's consolidated financial statements.
Accounting Standards Update 2014-09, Revenue from Contracts with Customers (Topic 606)--In May 2014, the FASB issued ASU 2014-09, “Revenue from Contracts with Customers (Topic 606),” which will replace all current U.S. GAAP guidance on revenue recognition and eliminate all industry-specific guidance.
The new revenue recognition guidance provides a unified model to determine when and how revenue is recognized. The underlying principle is that an entity should recognize revenue to depict the transfer of promised goods and services to customers in an amount that reflects the consideration which the entity expects to receive in exchange for those goods and services. The guidance provides a five-step analysis of transactions to determine when and how revenue is recognized. Other major provisions include capitalization of certain contract costs, consideration of the time value of money in the transaction price, and allowing estimates of variable consideration to be recognized before contingencies are resolved in certain circumstances. The guidance also requires enhanced information to be presented in the financial statements regarding the nature, amount, timing and uncertainty of revenue and cash flows arising from an entity’s contracts with customers.
This guidance is effective for annual reporting periods beginning after December 15, 2017 and interim periods therein. An entity can elect to apply the guidance under one of the following two methods: (i) retrospectively to each prior reporting period presented, referred to as the full retrospective method, or (ii) retrospectively with the cumulative effect of initially applying the standard recognized at the date of initial application in retained earnings, referred to as the modified retrospective method. The Company adopted the new standard on January 1, 2018, using the modified retrospective method.
Management has substantially completed the process of evaluating the effect of the adoption, which included reviewing representative samples of customer contracts for each revenue stream, analyzing those contracts under the new revenue standard, and comparing the conclusions to the current accounting policies and practices to identify potential changes, and determined that the adoption of ASU No. 2014-09 will not have a material impact on the Company’s financial statements. Based on management’s evaluation process, the majority of the Company’s revenue arrangements generally consist of a single performance obligation to transfer promised services over time. The Company is entitled to consideration for the services as they are performed, and the timing and amount of revenue recognized based on ASU No. 2014-09 is consistent with the Company’s revenue recognition policy under previous guidance. However, the Company will be required to expand its revenue disclosures as a result of adopting the new standard, which will primarily include disaggregation of revenue, changes in contract assets and liabilities, information about our performance obligations and significant judgments made in the application of the new standard. The Company has documented this evaluation and has implemented processes and controls for its revenue streams as warranted by the guidance.
Accounting Standards Update 2016-02, Leases (Topic 842)--In February 2016, the FASB issued ASU 2016-02, “Leases (Topic 842).” ASU 2016-02 establishes a comprehensive new lease accounting model. The new standard: (a) clarifies the definition of a lease; (b) requires a dual approach to lease classification similar to current lease classifications; and, (c) causes lessees to recognize leases on the balance sheet as a lease liability with a corresponding right-of-use asset for leases with a lease-term of more than twelve months. The new standard is effective for interim and annual periods beginning after December 15, 2018, which for Davey Tree would be January 1, 2019. Early adoption is permitted. The new standard requires a modified retrospective transition for capital or operating leases existing at or entered into after the beginning of the earliest comparative period presented in the financial statements, but it does not require transition accounting for leases that expire
F-12
The Davey Tree Expert Company
Notes to Consolidated Financial Statements--(Continued)
December 31, 2017
(In thousands, except share data)
C. | Recent Accounting Guidance (continued) |
prior to the date of initial application. The Company plans to adopt during the first quarter 2019. We are are in the process of identifying the population of leases affected and determining the information required to calculate the lease liability and right-of-use asset in addition to evaluating software to assist with future reporting.
D. | Business Combinations |
Our investments in businesses were: (a) $13,264 in 2017, including liabilities assumed of $2,713 and debt issued of $3,099; (b) $4,888 in 2016, including liabilities assumed of $216 and debt issued of $875; and (c) $4,149 in 2015, including no liabilities assumed and debt issued of $1,500.
The net assets of the businesses acquired are accounted for under the acquisition method and were recorded at their fair values at the dates of acquisition. The excess of the purchase price over the estimated fair values of the net assets acquired was recorded as an increase in goodwill of approximately $5,131 in 2017 (all of which is deductible for tax purposes), $817 in 2016 (all of which is deductible for tax purposes) and $1,410 goodwill in 2015 (all of which is deductible for tax purposes).
The results of operations of acquired businesses have been included in the consolidated statements of operations beginning as of the effective dates of acquisition. The effect of these acquisitions on our consolidated revenues and results of operations, either individually or in the aggregate, for the years ended December 31, 2017, 2016 or 2015 was not significant.
E. | Accounts Receivable, Net and Supplemental Balance Sheet Information |
Accounts receivable, net, consisted of the following:
December 31, | |||||||
2017 | 2016 | ||||||
Accounts receivable | $ | 143,244 | $ | 128,202 | |||
Receivables under contractual arrangements | 29,895 | 21,541 | |||||
173,139 | 149,743 | ||||||
Less allowances for doubtful accounts | 4,468 | 3,609 | |||||
$ | 168,671 | $ | 146,134 | ||||
Receivables under contractual arrangements consist of work-in-process in accordance with the terms of contracts, primarily, with utility services customers.
F-13
The Davey Tree Expert Company
Notes to Consolidated Financial Statements--(Continued)
December 31, 2017
(In thousands, except share data)
E. | Accounts Receivable, Net and Supplemental Balance Sheet Information (continued) |
The following items comprise the amounts included in the balance sheets:
December 31, | |||||||
Other current assets | 2017 | 2016 | |||||
Refundable income taxes | $ | 587 | $ | 548 | |||
Other | 784 | 1,315 | |||||
Total | $ | 1,371 | $ | 1,863 | |||
December 31, | |||||||
Other assets, noncurrent | 2017 | 2016 | |||||
Assets invested for self-insurance | $ | 19,422 | $ | 15,492 | |||
Investment--cost-method affiliate | 1,218 | 1,168 | |||||
Deferred income taxes | 4,815 | 11,129 | |||||
Other | 3,701 | 3,565 | |||||
Total | $ | 29,156 | $ | 31,354 | |||
December 31, | |||||||
Accrued expenses | 2017 | 2016 | |||||
Employee compensation | $ | 20,794 | $ | 18,438 | |||
Accrued compensated absences | 9,267 | 9,215 | |||||
Self-insured medical claims | 3,193 | 2,961 | |||||
Customer advances, deposits | 1,672 | 2,997 | |||||
Income taxes payable | 3,443 | 953 | |||||
Taxes, other than income | 2,279 | 2,166 | |||||
Other | 2,168 | 929 | |||||
Total | $ | 42,816 | $ | 37,659 | |||
December 31, | |||||||
Other liabilities, noncurrent | 2017 | 2016 | |||||
Pension and retirement plans | $ | 14,759 | $ | 15,982 | |||
Other | 5,207 | 4,837 | |||||
Total | $ | 19,966 | $ | 20,819 | |||
F-14
The Davey Tree Expert Company
Notes to Consolidated Financial Statements--(Continued)
December 31, 2017
(In thousands, except share data)
F. | Supplemental Operating Information |
Other Nonoperating (Expense) Income, Net
Other nonoperating (expense) income, net, included in the statements of operations follows:
Year Ended December 31, | |||||||||||
2017 | 2016 | 2015 | |||||||||
Other nonoperating expense, net | $ | (4,417 | ) | $ | (3,989 | ) | $ | (5,744 | ) | ||
Other nonoperating (expense) income, net, includes foreign currency (i) gains of $55 for 2017, (ii) gains of $113 for 2016, and (iii) losses of $854 for 2015 on the intercompany balances of our Canadian operations.
G. | Supplemental Cash Flow Information |
Supplemental cash flow information follows:
Year Ended December 31, | |||||||||||
Supplemental cash flow information | 2017 | 2016 | 2015 | ||||||||
Interest paid | $ | 5,096 | $ | 4,329 | $ | 3,386 | |||||
Income taxes paid, net | 10,005 | 10,578 | 16,679 | ||||||||
Noncash transactions: | |||||||||||
Debt issued for purchases of businesses | $ | 3,099 | $ | 875 | $ | 1,500 | |||||
Detail of acquisitions: | |||||||||||
Assets acquired: | |||||||||||
Receivables | $ | 1,753 | $ | — | $ | — | |||||
Operating supplies | — | 157 | — | ||||||||
Prepaid expense | 128 | 55 | — | ||||||||
Equipment | 1,904 | 2,485 | 1,264 | ||||||||
Deposits and other | 52 | — | 11 | ||||||||
Intangibles | 4,296 | 1,374 | 1,464 | ||||||||
Goodwill | 5,131 | 817 | 1,410 | ||||||||
Liabilities assumed | (2,713 | ) | (216 | ) | — | ||||||
Debt issued for purchases of businesses | (3,099 | ) | (875 | ) | (1,500 | ) | |||||
Cash paid | $ | 7,452 | $ | 3,797 | $ | 2,649 | |||||
F-15
The Davey Tree Expert Company
Notes to Consolidated Financial Statements--(Continued)
December 31, 2017
(In thousands, except share data)
H. | Identified Intangible Assets and Goodwill, Net |
The carrying amount of the identified intangibles and goodwill acquired in connection with our investments in businesses were as follows:
Weighted-Average Amortization Period (Years) | December 31, 2017 | December 31, 2016 | ||||||||||||||||
Carrying Amount | Accumulated Amortization | Carrying Amount | Accumulated Amortization | |||||||||||||||
Amortized intangible assets: | ||||||||||||||||||
Customer lists/relationships | 2.8 | years | $ | 21,487 | $ | 16,846 | $ | 17,822 | $ | 15,171 | ||||||||
Employment-related | 2.2 | years | 7,333 | 6,624 | 7,032 | 6,386 | ||||||||||||
Tradenames | 2.9 | years | 5,978 | 5,134 | 5,634 | 4,860 | ||||||||||||
Total | 34,798 | $ | 28,604 | 30,488 | $ | 26,417 | ||||||||||||
Less accumulated amortization | 28,604 | 26,417 | ||||||||||||||||
Identified intangibles, net | 6,194 | 4,071 | ||||||||||||||||
Unamortized intangible assets: | ||||||||||||||||||
Goodwill | Not amortized | 35,477 | 30,305 | |||||||||||||||
$ | 41,671 | $ | 34,376 | |||||||||||||||
The changes in the carrying amounts of goodwill, by segment, for the year ended December 31, 2017 follow:
Balance at January 1, 2017 | Acquisitions | Translation and Other Adjustments | Balance at December 31, 2017 | ||||||||||||
Utility | $ | 3,424 | $ | — | $ | — | $ | 3,424 | |||||||
Residential and Commercial | 26,881 | 5,131 | 41 | 32,053 | |||||||||||
Total | $ | 30,305 | $ | 5,131 | $ | 41 | $ | 35,477 | |||||||
Estimated future aggregate amortization expense of intangible assets--The estimated aggregate amortization expense of intangible assets, as of December 31, 2017, in each of the next five years follows:
Estimated Future Amortization Expense | ||||
Year ending December 31, 2018 | $ | 1,581 | ||
2019 | 1,451 | |||
2020 | 1,265 | |||
2021 | 826 | |||
2022 | 596 | |||
F-16
The Davey Tree Expert Company
Notes to Consolidated Financial Statements--(Continued)
December 31, 2017
(In thousands, except share data)
I. | Short and Long-Term Debt and Commitments Related to Letters of Credit |
Short-term debt consisted of the following:
December 31, | |||||||
2017 | 2016 | ||||||
Notes payable | $ | 149 | $ | — | |||
Current portion of long-term debt | 16,166 | 16,701 | |||||
$ | 16,315 | $ | 16,701 | ||||
At December 31, 2017, we also had unused short-term lines of credit with several banks totaling $7,042, generally at the banks' prime rate or LIBOR plus a margin adjustment of .75% to 1.50%. Long-term debt consisted of the following:
December 31, | |||||||
2017 | 2016 | ||||||
Revolving credit facility | |||||||
Swing-line borrowings | $ | — | $ | 10,000 | |||
LIBOR borrowings | 100,000 | 57,000 | |||||
100,000 | 67,000 | ||||||
Senior unsecured notes | 18,000 | 24,000 | |||||
Term loans | 16,242 | 16,151 | |||||
134,242 | 107,151 | ||||||
Less debt issuance costs | 725 | 333 | |||||
Less current portion | 16,166 | 16,701 | |||||
$ | 117,351 | $ | 90,117 | ||||
Revolving Credit Facility and 5.09% Senior Unsecured Notes--In October 2017, the Company amended its revolving credit facility. The amended and restated credit agreement, which expires in October 2022, permits borrowings as defined up to $250,000 including a letter of credit sublimit of $100,000 and a swing-line commitment of $25,000. Under certain circumstances, the amount available under the revolving credit facility may be increased to $325,000. The revolving credit facility contains certain affirmative and negative covenants customary for this type of facility and includes financial covenant ratios with respect to a maximum leverage ratio (not to exceed 3.00 to 1.00 with exceptions in case of material acquisitions) and a minimum interest coverage ratio (not less than 3.00 to 1.00), in each case subject to certain further restrictions as described in the Credit Agreement.
On July 22, 2010, we issued $30,000 of 5.09% Senior Unsecured Notes, Series A, due July 22, 2020 (the "5.09% Senior Notes"). The 5.09% Senior Notes were issued pursuant to a Master Note Purchase Agreement (the “Purchase Agreement”), between the Company and the purchasers of the 5.09% Senior Notes. The net proceeds of the 5.09% Senior Notes were used to pay down borrowings under our revolving credit facility.
The 5.09% Senior Notes are equal in right of payment with our revolving credit facility and all other senior unsecured obligations of the Company. Interest is payable semiannually and five equal, annual principal payments commenced on July 22, 2016 (the sixth anniversary of issuance). The Purchase Agreement contains customary events of default and covenants related to limitations on indebtedness and transactions with affiliates and the maintenance of certain financial ratios.
As of December 31, 2017, we had unused commitments under the revolving credit facility approximating $146,912, and $103,088 committed, which consisted of borrowings of $100,000 and issued letters of credit of $3,088. Borrowings outstanding bear interest, at the Company's option, of either (a) the base rate or (b) LIBOR plus a margin adjustment ranging from .875% to 1.50%--with the margin adjustments in both instances based on the Company's leverage ratio at the time of borrowing. The base rate is the greater of (i) the agent bank’s prime rate, (ii) LIBOR plus 1.5%, or (iii) the federal funds rate
F-17
The Davey Tree Expert Company
Notes to Consolidated Financial Statements--(Continued)
December 31, 2017
(In thousands, except share data)
I. Short and Long-Term Debt and Commitments Related to Letters of Credit (continued)
plus .5%. A commitment fee ranging from .10% to .225% is also required based on the average daily unborrowed commitment.
Term Loans, Weighted-Average Interest Rate--The weighted-average interest on the term loans approximated 3.75% at December 31, 2017 and 3.56% at December 31, 2016.
Aggregate Maturities of Long-Term Debt--Aggregate maturities of long-term debt for the five years subsequent to December 31, 2017 were as follows: 2018--$16,166; 2019--$6,890; 2020--$6,894; 2021--$4,292; and, 2022--$100,000.
Accounts Receivable Securitization Facility--In May 2017, Davey Tree amended its Accounts Receivable Securitization Facility (the “AR securitization facility”), to extend the scheduled termination date for an additional one-year period, to May 8, 2018 and increase the limit of the facility from $60,000 to $100,000. Under the AR securitization facility, Davey Tree transfers by selling or contributing current and future trade receivables to a wholly-owned, bankruptcy-remote financing subsidiary which pledges a perfected first priority security interest in the trade receivables--equal to the issued letters of credit ("LCs") as of December 31, 2017--to the bank in exchange for the bank issuing LCs.
Fees payable to the bank include: (a) an LC issuance fee, payable on each settlement date, in the amount of .90% per annum on the aggregate amount of all LCs outstanding plus outstanding reimbursement obligations (e.g., arising from drawn LCs), if any, and (b) an unused LC fee, payable monthly, equal to (i) .35% per annum for each day on which the sum of the total LCs outstanding plus any outstanding reimbursement obligations is greater than or equal to 50% of the facility limit and (ii) .45% per annum for each day on which the sum of the total LCs outstanding plus any outstanding reimbursement obligations is less than 50% of the facility limit. If an LC is drawn and the bank is not immediately reimbursed in full for the drawn amount, any outstanding reimbursement obligation will accrue interest at a per annum rate equal to a reserve-adjusted LIBOR or, in certain circumstances, a base rate equal to the higher of (i) the bank’s prime rate and (ii) the federal funds rate plus .50% and, following any default, 2.00% plus the greater of (a) adjusted LIBOR and (b) a base rate equal to the higher of (i) the bank’s prime rate and (ii) the federal funds rate plus .50%.
The agreements underlying the AR securitization facility contains various customary representations and warranties, covenants, and default provisions which provide for the termination and acceleration of the commitments under the AR securitization facility in circumstances including, but not limited to, failure to make payments when due, breach of a representation, warranty or covenant, certain insolvency events or failure to maintain the security interest in the trade receivables, and defaults under other material indebtedness.
As of December 31, 2017, we had issued LCs of $58,150 under the terms of the AR securitization facility.
Total Commitments Related to Issued Letters of Credit--As of December 31, 2017, total commitments related to issued letters of credit were $63,242, of which $3,088 were issued under the revolving credit facility, $58,150 were issued under the AR securitization facility, and $2,004 were issued under short-term lines of credit. As of December 31, 2016, total commitments related to issued letters of credit were $64,225, of which $4,071 were issued under the revolving credit facility, $58,150 were issued under the AR securitization facility and $2,004 were issued under short-term lines of credit.
F-18
The Davey Tree Expert Company
Notes to Consolidated Financial Statements--(Continued)
December 31, 2017
(In thousands, except share data)
J. | Self-Insurance Accruals |
Components of our self-insurance accruals for workers’ compensation, vehicle liability and general liability follow:
December 31, | |||||||
2017 | 2016 | ||||||
Workers' compensation | $ | 40,764 | $ | 38,811 | |||
Present value discount | 2,346 | 2,236 | |||||
38,418 | 36,575 | ||||||
Vehicle liability | 5,536 | 4,763 | |||||
General liability | 23,740 | 21,500 | |||||
Total | 67,694 | 62,838 | |||||
Less current portion | 23,782 | 23,092 | |||||
Noncurrent portion | $ | 43,912 | $ | 39,746 | |||
The changes in our self-insurance accruals and the discount rate used for the workers’ compensation accrual are summarized in the table below.
December 31, | |||||||
2017 | 2016 | ||||||
Balance, beginning of year | $ | 62,838 | $ | 60,339 | |||
Provision for claims | 34,884 | 33,404 | |||||
Payment of claims | 30,028 | 30,905 | |||||
Balance, end of year | $ | 67,694 | $ | 62,838 | |||
Workers' compensation discount rate | 2.00 | % | 2.20 | % | |||
F-19
The Davey Tree Expert Company
Notes to Consolidated Financial Statements--(Continued)
December 31, 2017
(In thousands, except share data)
K. | Lease Obligations |
Assets acquired under capital leases and included in property and equipment consisted of the following:
December 31, | |||||||
2017 | 2016 | ||||||
Equipment | $ | 3,481 | $ | 2,528 | |||
Less accumulated amortization | 805 | 160 | |||||
$ | 2,676 | $ | 2,368 | ||||
We also lease facilities under noncancelable operating leases, which are used for district office and warehouse operations. These leases extend for varying periods of time up to five years and, in some cases, contain renewal options. Minimum rental commitments under all capital and noncancelable operating leases, as of December 31, 2017, were as follows:
Lease Obligations | ||||||||
Minimum lease obligations | Capital | Operating | ||||||
Year ending December 31, 2018 | $ | 694 | $ | 7,243 | ||||
2019 | 694 | 5,326 | ||||||
2020 | 682 | 3,945 | ||||||
2021 | 558 | 2,354 | ||||||
2022 | — | 1,794 | ||||||
2023 and after | — | 6,973 | ||||||
Total minimum lease payments | 2,628 | $ | 27,635 | |||||
Amounts representing interest | 118 | |||||||
Present value of net minimum lease payments | 2,510 | |||||||
Less current portion | 651 | |||||||
Long-term capital lease obligations, December 31, 2017 | $ | 1,859 | ||||||
Total rent expense under all operating leases was $7,998 in 2017, $7,536 in 2016 and $7,398 in 2015.
L. | Common Shares, Redeemable Common Shares and Preferred Shares |
We have given retroactive consideration to the two-for-one stock split of our common shares effective June 1, 2017 including all common share and per share data.
Preferred Shares--We have authorized a class of 4,000,000 preferred shares, no par value, of which none were issued.
Redeemable Common Shares-Our Davey 401KSOP and ESOP Plan includes a put option for shares of the Company’s common stock distributed from the plan. Due to the Company’s obligation under the put option, shares held in the Davey 401KSOP and ESOP Plan as well as distributed shares subject to the put option are reclassified from permanent equity to temporary equity. The number of redeemable common shares for each of the three years in the period ended December 31, 2017 was as follows: 2017--6,467,027; 2016--7,056,904; and 2015--7,773,052.
Common Shares--The number of common shares authorized is 48,000,000, par value $1.00. The number of common shares issued during each of the three years in the period ended December 31, 2017 was as follows: 2017--36,446,890; 2016--35,856,856 and 2015--35,140,708. The number of shares in the treasury for each of the three years in the period ended December 31, 2017 was as follows: 2017--18,692,901; 2016--17,990,620; and 2015--17,427,132.
F-20
The Davey Tree Expert Company
Notes to Consolidated Financial Statements--(Continued)
December 31, 2017
(In thousands, except share data)
L. | Common Shares, Redeemable Common Shares and Preferred Shares (continued) |
Our common and redeemable common shares are not listed or traded on an established public trading market, and market prices are, therefore, not available. Semiannually, an independent stock valuation firm determines the fair market value of our common and redeemable common shares based upon our performance and financial condition. Since 1979, we have provided a ready market for all shareholders through our direct purchase of their common shares, although we are under no obligation to do so (other than repurchases pursuant to the put option under the Davey 401KSOP and ESOP Plan, as described in Note N). During 2017, purchases of common shares, both redeemable and common, totaled 1,697,727 shares for $30,566 in cash; we also had direct sales to directors and employees of 39,564 shares for $700, excluding those shares issued through either the exercise of options or the Employee Stock Purchase Plan. We also sold 80,178 shares to our 401(k) plan for $1,420 and issued 208,024 shares to participant accounts to satisfy our liability for the 2016 employer match in the amount of $3,661. The liability accrued at December 31, 2017 for the 2017 employer match was $3,991. There were also 335,040 shares purchased during 2017 under the Employee Stock Purchase Plan.
Common and Redeemable Shares Outstanding--The table below reconciles the activity of the common and redeemable shares outstanding:
Common Shares Net of Treasury Shares | Redeemable Shares | Total | ||||||
Shares outstanding, December 31, 2015 | 17,713,576 | 7,773,052 | 25,486,628 | |||||
Shares purchased | (479,807 | ) | (1,012,275 | ) | (1,492,082 | ) | ||
Shares sold | 321,657 | 296,127 | 617,784 | |||||
Stock subscription offering, employee cash purchases | 48,730 | — | 48,730 | |||||
Options exercised | 262,080 | — | 262,080 | |||||
Shares outstanding, December 31, 2016 | 17,866,236 | 7,056,904 | 24,923,140 | |||||
Shares purchased | (807,718 | ) | (890,009 | ) | (1,697,727 | ) | ||
Shares sold | 362,674 | 300,132 | 662,806 | |||||
Stock subscription offering, employee cash purchases | 90,645 | — | 90,645 | |||||
Options exercised | 241,995 | — | 241,995 | |||||
Shares outstanding, December 31, 2017 | 17,753,832 | 6,467,027 | 24,220,859 | |||||
On December 31, 2017, we had 24,220,859 common shares outstanding, employee options exercisable to purchase 800,615 common shares, partially-paid subscription for 764,382 common shares and purchase rights outstanding for 309,389 common shares.
Stock Subscription Offering--Beginning May 2012, the Company offered to eligible employees and nonemployee directors the right to subscribe to common shares of the Company at $9.85 per share in accordance with the provisions of The Davey Tree Expert Company 2004 Omnibus Stock Plan and the rules of the Compensation Committee of the Company's Board of Directors (collectively, the "plan"). The offering period ended on August 1, 2012 and resulted in the subscription of 1,275,428 common shares for $12,563 at $9.85 per share.
Under the plan, a participant in the offering purchasing common shares for an aggregate purchase price of less than $5 had to pay with cash. All participants (excluding Company directors and officers) purchasing $5 or more of the common shares had an option to finance their purchase through a down-payment of at least 10% of the total purchase price and a seven-year promissory note for the balance due with interest at 2%. Payments on the promissory note can be made either by payroll deductions or annual lump-sum payments of both principal and interest.
Common shares purchased under the plan have been pledged as security for the payment of the promissory note and the common shares will not be issued until the promissory note is paid-in-full. Dividends will be paid on all subscribed shares, subject to forfeiture to the extent that payment is not ultimately made for the shares.
F-21
The Davey Tree Expert Company
Notes to Consolidated Financial Statements--(Continued)
December 31, 2017
(In thousands, except share data)
L. | Common Shares, Redeemable Common Shares and Preferred Shares (continued) |
All participants in the offering purchasing in excess of $5 of common shares were granted a "right" to purchase one additional common share at a price of $9.85 per share for every three common shares purchased under the plan. As a result of the stock subscription, employees were granted rights to purchase 423,600 common shares. Each right may be exercised at the rate of one-seventh per year and will expire seven years after the date that the right was granted. Employees may not exercise a right should they cease to be employed by the Company.
M. | Accumulated Other Comprehensive Income (Loss) |
Comprehensive income (loss) is comprised of net income and other adjustments that relate to foreign currency translation adjustments and defined benefit pension plan adjustments. We do not provide income taxes on currency translation adjustments, as the earnings of our Canadian operations are considered to be indefinitely reinvested.
The following summarizes the components of other comprehensive income (loss) accumulated in shareholders’ equity:
Foreign Currency Translation Adjustments | Defined Benefit Pension Plans | Accumulated Other Comprehensive Income (Loss) | ||||||||||
Balance at January 1, 2015 | $ | (1,151 | ) | $ | (10,372 | ) | $ | (11,523 | ) | |||
Unrealized gains (losses) | (5,093 | ) | — | (5,093 | ) | |||||||
Amounts reclassified from accumulated other comprehensive income (loss) | — | 4,774 | 4,774 | |||||||||
Tax effect | — | (1,878 | ) | (1,878 | ) | |||||||
Unrecognized amounts from defined benefit pension plans | — | 538 | 538 | |||||||||
Tax effect | — | (212 | ) | (212 | ) | |||||||
Net of tax amount | (5,093 | ) | 3,222 | (1,871 | ) | |||||||
Balance at December 31, 2015 | $ | (6,244 | ) | $ | (7,150 | ) | $ | (13,394 | ) | |||
Unrealized gains (losses) | 744 | — | 744 | |||||||||
Amounts reclassified from accumulated other comprehensive income (loss) | — | 2,844 | 2,844 | |||||||||
Tax effect | — | (1,137 | ) | (1,137 | ) | |||||||
Unrecognized amounts from defined benefit pension plans | — | (2,032 | ) | (2,032 | ) | |||||||
Tax effect | — | 813 | 813 | |||||||||
Net of tax amount | 744 | 488 | 1,232 | |||||||||
Balance at December 31, 2016 | $ | (5,500 | ) | $ | (6,662 | ) | $ | (12,162 | ) | |||
Unrealized gains (losses) | 2,195 | — | 2,195 | |||||||||
Amounts reclassified from accumulated other comprehensive income (loss) | — | 4,822 | 4,822 | |||||||||
Tax effect | — | (1,962 | ) | (1,962 | ) | |||||||
Unrecognized amounts from defined benefit pension plans | — | (2,169 | ) | (2,169 | ) | |||||||
Tax effect | — | 883 | 883 | |||||||||
Net of tax amount | 2,195 | 1,574 | 3,769 | |||||||||
Balance at December 31, 2017 | $ | (3,305 | ) | $ | (5,088 | ) | $ | (8,393 | ) | |||
The amounts reclassified from accumulated other comprehensive income (loss) related to defined benefit pension plans for 2017, 2016 and 2015 are included in net periodic pension expense and classified in the statement of operations as costs and expenses, general and administrative.
F-22
The Davey Tree Expert Company
Notes to Consolidated Financial Statements--(Continued)
December 31, 2017
(In thousands, except share data)
N. | The Davey 401KSOP and Employee Stock Ownership Plan |
On March 15, 1979, we consummated a plan, which transferred control of the Company to our employees. As a part of this plan, we initially sold 120,000 common shares (presently, 11,520,000 common shares adjusted for stock splits) to our Employee Stock Ownership Trust (“ESOT”) for $2,700. The Employee Stock Ownership Plan (“ESOP”), in conjunction with the related ESOT, provided for the grant to certain employees of certain ownership rights in, but not possession of, the common shares held by the trustee of the ESOT. Annual allocations of shares have been made to individual accounts established for the benefit of the participants.
Defined Contribution and Savings Plans--Most employees are eligible to participate in The Davey 401KSOP and ESOP. Effective January 1, 1997, the plan commenced operations and retained the existing ESOP participant accounts and incorporated a deferred savings plan (a "401(k) plan") feature. Participants in the 401(k) plan are allowed to make before-tax contributions, within Internal Revenue Service established limits, through payroll deductions. Effective January 1, 2009, we match, in either cash or our common shares, 100% of the first one percent and 50% of the next three percent of each participant's before-tax contribution, limited to the first four percent of the employee's compensation deferred each year. All nonbargaining domestic employees who attained age 21 and completed one year of service are eligible to participate. In May 2004, we adopted the 401K Match Restoration Plan, a defined contribution plan that supplements the retirement benefits of certain employees that participate in the savings plan feature of The Davey 401KSOP and ESOP Plan, but are limited in contributions because of tax rules and regulations.
The Davey 401KSOP and ESOP Plan includes a put option for shares of the Company’s common stock distributed from the plan. Shares are distributed from the Davey 401KSOP and ESOP Plan to former participants of the plan, their beneficiaries, donees or heirs (each, a “participant”). Since our common stock is not currently traded on an established securities market, if the owners of distributed shares desire to sell their shares, the Company is required to purchase the shares at fair value for two 60-day periods after distribution of the shares from the Davey 401KSOP and ESOP. The fair value of distributed shares subject to the put option totaled $3,843 and $1,148 as of December 31, 2017 and December 31, 2016, respectively. The fair value of the shares held in the Davey 401KSOP and ESOP totaled $119,677 and $123,053 as of December 31, 2017 and December 31, 2016, respectively. Due to the Company’s obligation under the put option, the distributed shares subject to the put option and the shares held in the Davey 401KSOP and ESOP (collectively referred to as 401KSOP and ESOP related shares) are classified as temporary equity in the mezzanine section of the consolidated balance sheets and totaled $123,520 and $124,201 as of December 31, 2017 and December 31, 2016, respectively. Changes in the fair value of the Davey 401KSOP and ESOP Plan related shares are reflected in retained earnings while net share activity associated with the Davey 401KSOP and ESOP Plan related shares are first reflected in additional paid-in capital and then retained earnings if additional paid in-capital is insufficient.
Total compensation for these plans, consisting primarily of the employer match, was $3,794 in 2017, $3,661 in 2016, and $3,373 in 2015.
O. | Stock-Based Compensation |
Our shareholders approved the 2014 Omnibus Stock Plan (the “2014 Stock Plan”) at our annual meeting of shareholders on May 20, 2014. The 2014 Stock Plan replaced the expired 2004 Omnibus Stock Plan (the “2004 plan”) previously approved by the shareholders in 2004. The 2014 Stock Plan is administered by the Compensation Committee of the Board of Directors and will remain in effect for ten years. All directors of the Company and employees of the Company and its subsidiaries are eligible to participate in the 2014 Stock Plan. The 2014 Stock Plan (similar to the 2004 plan) continues the maintenance of the Employee Stock Purchase Plan, as well as provisions for the grant of stock options and other stock-based incentives. The 2014 Stock Plan provides for the grant of five percent of the number of the Company’s common shares outstanding as of the first day of each fiscal year plus the number of common shares that were available for grant of awards, but not granted, in prior years. In no event, however, may the number of common shares available for the grant of awards in any fiscal year exceed ten percent of the common shares outstanding as of the first day of that fiscal year. Common shares subject to an award that is forfeited, terminated, or canceled without having been exercised are generally added back to the number of shares available for grant under the 2014 Stock Plan.
F-23
The Davey Tree Expert Company
Notes to Consolidated Financial Statements--(Continued)
December 31, 2017
(In thousands, except share data)
O. | Stock-Based Compensation (continued) |
Stock-based compensation expense under all share-based payment plans—our Employee Stock Purchase Plan, stock option plans, stock-settled stock appreciation rights, and performance-based restricted stock units—included in the results of operations follows:
Year Ended December 31, | |||||||||||
2017 | 2016 | 2015 | |||||||||
Compensation expense, all share-based payment plans | $ | 4,049 | $ | 2,811 | $ | 2,327 | |||||
Income tax benefit | 1,315 | 823 | 694 | ||||||||
Stock-based compensation consisted of the following:
Employee Stock Purchase Plan--Under the Employee Stock Purchase Plan, all full-time employees with one year of service are eligible to purchase, through payroll deduction, common shares. Employee purchases under the Employee Stock Purchase Plan are at 85% of the fair market value of the common shares--a 15% discount. Purchases under the plan, at 85% of the fair market value of the common shares, have been as follows:
Year Ended December 31, | |||||||||||
2017 | 2016 | 2015 | |||||||||
Number of employees participating | 2,297 | 1,952 | 1,750 | ||||||||
Shares purchased during the year | 335,040 | 297,262 | 251,558 | ||||||||
Weighted-average per share purchase price paid | $ | 15.27 | $ | 14.17 | $ | 13.11 | |||||
Cumulative shares purchased since 1982 | 18,386,370 | 18,051,330 | 17,754,068 | ||||||||
Compensation costs are recognized as payroll deductions are made. The 15% discount of total shares purchased under the plan resulted in compensation cost recognized of $888 in 2017, $727 in 2016 and $569 in 2015.
Stock Options Plan--The stock options outstanding were awarded under a graded vesting schedule, measured at fair value, and have a term of ten years. Compensation costs for stock options are recognized over the requisite service period on the straight-line recognition method. Compensation cost recognized for stock options was $705 in 2017, $596 in 2016 and $494 in 2015.
Stock-Settled Stock Appreciation Rights--During the year ended December 31, 2017, the Compensation Committee of the Board of Directors awarded 152,000 Stock-Settled Stock Appreciation Rights (“SSARs”) to certain management employees which vest ratably over five years. A stock-settled stock appreciation right is an award that allows the recipient to receive common stock equal to the appreciation in the fair market value of our common stock between the date the award was granted and the conversion date of the shares vested.
F-24
The Davey Tree Expert Company
Notes to Consolidated Financial Statements--(Continued)
December 31, 2017
(In thousands, except share data)
O. | Stock-Based Compensation (continued) |
The following table summarizes the SSARs as of December 31, 2017:
Stock-Settled Stock Appreciation Rights | Number of Rights | Weighted- Average Award Date Value | Weighted- Average Remaining Contractual Life | Unrecognized Compensation Cost | Aggregate Intrinsic Value | ||||||||||||
Unvested, January 1, 2017 | 743,662 | $ | 2.75 | ||||||||||||||
Granted | 152,000 | 3.57 | |||||||||||||||
Forfeited | (8,060 | ) | 3.09 | ||||||||||||||
Vested | (439,422 | ) | 2.67 | ||||||||||||||
Unvested, December 31, 2017 | 448,180 | $ | 3.10 | 2.5 years | $ | 998 | $ | 8,202 | |||||||||
Compensation costs for SSARs are determined using a fair-value method and amortized over the requisite service period. Compensation expense for SSARs totaled $1,035 in 2017, $591 in 2016 and $489 in 2015.
Restricted Stock Units--During the year ended December 31, 2017, the Compensation Committee of the Board of Directors awarded 68,086 performance-based restricted stock units ("PRSUs") to certain management employees and 12,264 restricted stock units ("RSUs") to nonemployee directors. The Compensation Committee made similar awards in prior periods. The awards vest over specified periods. The following table summarizes restricted stock units as of December 31, 2017:
Restricted Stock Units | Number of Stock Units | Weighted- Average Grant Date Value | Weighted- Average Remaining Contractual Life | Unrecognized Compensation Cost | Aggregate Intrinsic Value | ||||||||||||
Unvested, January 1, 2017 | 304,958 | $ | 13.22 | ||||||||||||||
Granted | 80,350 | 17.01 | |||||||||||||||
Forfeited | — | — | |||||||||||||||
Vested | (94,642 | ) | 12.76 | ||||||||||||||
Unvested, December 31, 2017 | 290,666 | $ | 14.41 | 2.2 years | $ | 2,063 | $ | 5,319 | |||||||||
Employee PRSUs | 253,242 | $ | 14.20 | 2.5 years | $ | 1,773 | $ | 4,634 | |||||||||
Nonemployee Director RSUs | 37,424 | $ | 15.85 | 1.4 years | $ | 290 | $ | 685 | |||||||||
Compensation cost for awards is determined using a fair-value method, amortized over the requisite service period. “Intrinsic value” is defined as the amount by which the fair market value of a common share of stock exceeds the exercise price of a performance-based restricted stock unit. Compensation expense on restricted stock awards totaled $1,421 in 2017, $897 in 2016 and $775 in 2015.
The fair value of each award was estimated on the date of grant using a binomial option-pricing model. The binomial model considers a range of assumptions related to volatility, risk-free interest rate and employee exercise behavior. Expected volatilities utilized in the binomial model are based on historical volatility of our share prices and other factors. Similarly, the dividend yield is based on historical experience and expected future changes. The binomial model also incorporates exercise and forfeiture assumptions based on an analysis of historical data. The expected life of the stock-based awards is derived from the output of the binomial model and represents the period of time that awards granted are expected to be outstanding.
F-25
The Davey Tree Expert Company
Notes to Consolidated Financial Statements--(Continued)
December 31, 2017
(In thousands, except share data)
O. | Stock-Based Compensation (continued) |
The fair values of stock-based awards granted were estimated at the dates of grant with the following weighted-average assumptions:
Year Ended December 31, | ||||||||
2017 | 2016 | 2015 | ||||||
Volatility rate | 10.3 | % | 10.6 | % | 10.9 | % | ||
Risk-free interest rate | 2.2 | % | 1.8 | % | 2.1 | % | ||
Expected dividend yield | .7 | % | .7 | % | .7 | % | ||
Expected life of awards (years) | 8.9 | 9.5 | 9.3 | |||||
General Stock Option Information--The following table summarizes activity under the stock option plans for the year ended December 31, 2017:
Stock Options | Number of Options Outstanding | Weighted- Average Exercise Price | Weighted- Average Remaining Contractual Life | Unrecognized Compensation Cost | Aggregate Intrinsic Value | ||||||||||||
Outstanding, January 1, 2017 | 1,599,296 | $ | 12.49 | ||||||||||||||
Granted | 148,500 | 17.60 | |||||||||||||||
Exercised | (138,107 | ) | 11.30 | ||||||||||||||
Forfeited | (81,074 | ) | 13.34 | ||||||||||||||
Outstanding, December 31, 2017 | 1,528,615 | $ | 13.05 | 6.2 years | $ | 1,534 | $ | 8,025 | |||||||||
Exercisable, December 31, 2017 | 800,615 | $ | 11.14 | 4.8 years | $ | 5,660 | |||||||||||
“Intrinsic value” is defined as the amount by which the market price of a common share of stock exceeds the exercise price of an option. Information regarding the stock options outstanding at December 31, 2017 is summarized below:
Stock Options Exercise Price | Number Outstanding | Weighted-Average Remaining Contractual Life | Weighted- Average Exercise Price | Number Exercisable | Weighted- Average Exercise Price | |||||||||||||
Employee options: | ||||||||||||||||||
$ | 8.00 | 144,948 | 1.8 years | $ | 8.00 | 144,948 | $ | 8.00 | ||||||||||
8.30 | 167,098 | 2.8 years | 8.30 | 167,098 | 8.30 | |||||||||||||
11.60 | 296,047 | 5.5 years | 11.60 | 216,647 | 11.60 | |||||||||||||
13.20 | 303,122 | 6.5 years | 13.20 | 156,322 | 13.20 | |||||||||||||
15.05 | 235,000 | 7.5 years | 15.05 | 74,200 | 15.05 | |||||||||||||
16.35 | 245,400 | 8.5 years | 16.35 | 41,400 | 16.35 | |||||||||||||
17.60 | 137,000 | 9.5 years | 17.60 | — | 17.60 | |||||||||||||
1,528,615 | 6.2 years | $ | 13.05 | 800,615 | $ | 11.14 | ||||||||||||
F-26
The Davey Tree Expert Company
Notes to Consolidated Financial Statements--(Continued)
December 31, 2017
(In thousands, except share data)
O. | Stock-Based Compensation (continued) |
We issue common shares from treasury upon the exercise of stock options, stock-settled stock appreciation rights, performance-based restricted stock units or purchases under the Employee Stock Purchase Plan.
Tax Benefits of Stock-Based Compensation--Our total income tax benefit from share-based awards--as recognized in our consolidated statement of operations--for the last three years was: $1,315 in 2017, $823 in 2016, and $694 in 2015. Tax benefits for share-based awards are accrued as stock compensation expense and recognized in our consolidated statement of operations. Tax benefits on share-based awards are realized when: (a) stock-settled stock appreciation rights are exercised; (b) performance-based restricted stock units vest; and (c) stock options are exercised.
When actual tax benefits realized exceed the tax benefits accrued for share-based awards, we realize an excess tax benefit. We had excess tax benefits of: $691 in 2017, $1,113 in 2016, and $352 in 2015.
P. | Defined Benefit Pension Plans |
We have defined benefit pension plans covering certain current and retired U.S. employees. Plans include: (i) the Employee Retirement Plan (“ERP”) for employees hired prior to January 1, 2009; (ii) a Supplemental Executive Retirement Plan (“SERP”) for which future benefit accruals were frozen effective at the end of the second quarter 2015; and (iii) a Benefit Restoration Pension Plan (“Restoration Plan”) for certain key employees hired prior to January 1, 2009.
Both the SERP and the Restoration Plan are defined benefit plans under which nonqualifed supplemental pension benefits will be paid in addition to amounts paid under our qualified retirement defined benefit pension plans, which are subject to Internal Revenue Service limitations on covered compensation.
Effective December 31, 2008, enhanced benefits were implemented to our defined contribution savings plan--The Davey 401KSOP and ESOP--at which time, the Board of Directors approved an amendment to freeze the ERP and the Restoration Plan. The ERP was closed to new participants after December 2008. In connection with the freeze of the ERP, the Restoration Plan and the SERP, (a) benefits currently being paid to retirees continue and (b) benefits accrued through December 31, 2008 for employees covered by the ERP were not affected. All ERP, Restoration Plan and SERP balances remain intact and participant account balances, as well as service credits for vesting and retirement eligibility, remain intact and continue in accordance with the terms of the plans. Only future accruals were eliminated with: (i) the 2008 freeze of the ERP and Restoration Plan and (ii) the 2015 freeze of the SERP.
During the first quarter of 2016, the Company terminated the plan for bargaining employees not covered by union pension plans ("SPP") for which future benefit accruals were frozen effective December 31, 2013. We purchased a guaranteed group annuity contract from a third-party insurance company, which unconditionally and irrevocably guarantees the full payment of all annuity payments to the 94 participants. In connection with the plan termination, we made cash contributions of $522 to fully fund the SPP obligation and recorded a settlement charge of $453.
F-27
The Davey Tree Expert Company
Notes to Consolidated Financial Statements--(Continued)
December 31, 2017
(In thousands, except share data)
P. | Defined Benefit Pension Plans (continued) |
The change in benefit obligations and the fair value of plans assets follows:
December 31, | |||||||
2017 | 2016 | ||||||
Change in benefit obligation | |||||||
Projected benefit obligation at beginning of year | $ | 24,833 | $ | 27,228 | |||
Service cost | 530 | 370 | |||||
Interest cost | 1,002 | 1,243 | |||||
Actuarial (gains)/losses | 1,865 | 703 | |||||
Amendments | — | 341 | |||||
Settlements | (8,400 | ) | (4,873 | ) | |||
Benefits paid | (427 | ) | (179 | ) | |||
Projected benefit obligation at end of year | $ | 19,403 | $ | 24,833 | |||
Accumulated benefit obligation at end of year | $ | 19,403 | $ | 24,833 | |||
December 31, | |||||||
2017 | 2016 | ||||||
Change in fair value of plan assets | |||||||
Fair value of plan assets at beginning of year | $ | 11,509 | $ | 15,216 | |||
Actual return on plan assets | 845 | 400 | |||||
Plan expenses, including PBGC premiums | (513 | ) | (727 | ) | |||
Employer contributions | 4,091 | 1,672 | |||||
Settlements | (8,400 | ) | (4,873 | ) | |||
Benefits paid | (427 | ) | (179 | ) | |||
Fair value of plan assets at end of year | $ | 7,105 | $ | 11,509 | |||
The settlements in the change in benefit obligation and in the change in fair value of plan assets arise from: (i) purchase during the fourth quarter 2017 of a guaranteed group annuity contract from a third-party insurance company which unconditionally and irrevocably guarantees the full payment of all annuity payments to a combination of participants currently receiving benefits or entitled to future benefits from the ERP plan; (ii) termination of the SPP plan during the first quarter of 2016; and (iii) lump sum offering to 224 participants in our ERP plan during the fourth quarter of 2016.
December 31, | |||||||
2017 | 2016 | ||||||
Funded status of the plans | |||||||
Fair value of plan assets | $ | 7,105 | $ | 11,509 | |||
Projected benefit obligation | 19,403 | 24,833 | |||||
Funded status of the plans | $ | (12,298 | ) | $ | (13,324 | ) | |
F-28
The Davey Tree Expert Company
Notes to Consolidated Financial Statements--(Continued)
December 31, 2017
(In thousands, except share data)
P. | Defined Benefit Pension Plans (continued) |
December 31, | |||||||
2017 | 2016 | ||||||
Amounts reported in the consolidated balance sheets | |||||||
Current liability | $ | (175 | ) | $ | (83 | ) | |
Noncurrent liability | (12,123 | ) | (13,241 | ) | |||
Funded status of the plans | $ | (12,298 | ) | $ | (13,324 | ) | |
Amounts included in accumulated other comprehensive income (loss), related to our defined benefit pension plans follow:
At December 31, 2017 | At December 31, 2016 | ||||||||||||||
Pretax | Net of Tax | Pretax | Net of Tax | ||||||||||||
Amounts reported in accumulated other comprehensive income | |||||||||||||||
Unrecognized net actuarial loss | $ | 8,086 | $ | 4,919 | $ | 10,675 | $ | 6,456 | |||||||
Unrecognized prior service cost | 278 | 169 | 341 | 206 | |||||||||||
$ | 8,364 | $ | 5,088 | $ | 11,016 | $ | 6,662 | ||||||||
To the extent actuarial losses exceed the greater of 10% of the projected benefit obligation or market-related value of plan assets, the unrecognized actuarial losses will be amortized straight-line on a plan-by-plan basis, over the remaining expected future working lifetime of active participants, except for the SERP, which, after the plan freeze, is being amortized based on the remaining life expectancy of plan participants. The total amount of unrecognized prior service cost was amortized straight-line on a plan-by-plan basis. The total amortization associated with these amounts that is expected to be recognized in net periodic benefit expense for 2018 follows:
Year ending December 31, 2018 | |||||||
Pretax | Net of Tax | ||||||
Amortization of Costs Expected to be Recognized Next Year | |||||||
Unrecognized net actuarial loss | $ | 727 | $ | 436 | |||
Unrecognized prior service cost | 64 | 38 | |||||
$ | 791 | $ | 474 | ||||
The aggregate projected benefit obligation, accumulated benefit obligation and fair value of plan assets for plans in which the fair value of plan assets is less than either the projected benefit obligation or accumulated benefit obligation follow:
December 31, | |||||||
2017 | 2016 | ||||||
For pension plans with accumulated benefit obligations in excess of plan assets | |||||||
Projected benefit obligation | $ | 19,403 | $ | 24,833 | |||
Accumulated benefit obligation | 19,403 | 24,833 | |||||
Fair value of plan assets | 7,105 | 11,509 | |||||
F-29
The Davey Tree Expert Company
Notes to Consolidated Financial Statements--(Continued)
December 31, 2017
(In thousands, except share data)
P. | Defined Benefit Pension Plans (continued) |
The actuarial assumptions follow. The discount rates were used to measure the year-end benefit obligation and compute pension expense for the subsequent year.
December 31, | ||||||||
2017 | 2016 | 2015 | ||||||
Actuarial assumptions | ||||||||
Discount rate | 3.70 | % | 4.20 | % | 4.70 | % | ||
Expected long-term rate of return on plan assets | 2.50 | 5.00 | 7.25 | |||||
Net periodic benefit expense (income) associated with the defined benefit pension plans included the following components:
Year Ended December 31, | |||||||||||
2017 | 2016 | 2015 | |||||||||
Components of pension expense (income) | |||||||||||
Service costs--increase in benefit obligation earned | $ | 530 | $ | 370 | $ | 35 | |||||
Interest cost on projected benefit obligation | 1,002 | 1,243 | 1,486 | ||||||||
Expected return on plan assets | (638 | ) | (1,044 | ) | (1,576 | ) | |||||
Curtailment loss | — | — | 49 | ||||||||
Settlement loss | 3,849 | 2,346 | 2,915 | ||||||||
Amortization of net actuarial loss | 909 | 951 | 1,400 | ||||||||
Amortization of prior service cost | 64 | — | 6 | ||||||||
Net pension expense of defined benefit pension plans | $ | 5,716 | $ | 3,866 | $ | 4,315 | |||||
Investment Strategy and Risk Management for Plan Assets--Our investment strategy is to manage the plan assets in order to pay retirement benefits to plan participants while minimizing our cash contributions over the life of the plans. This is accomplished by maintaining liquidity and preserving principal through diversification in high-quality investments through the use of investment managers and mutual funds. Performance of all investment managers and mutual funds is monitored quarterly and evaluated over rolling three-to-five year periods.
In December 2017, we revised our investment policy to reallocate 100% of our plan assets into the fixed income and cash asset class from the prior target allocations of: (a) equities of a minimum 20% to a maximum of 40%; (b) fixed income and cash of a minimum 50% to a maximum of 70%; and, (c) alternative investments of a minimum of zero to a maximum of 15%. The purpose of the fixed income asset class is to provide a deflation hedge, to reduce the overall volatility of plan assets and to produce current income in support of the needs of the plan.
Fixed income assets can be invested in U.S. government and prime money market funds, U.S. Treasuries, insured certificates of deposit and U.S. investment grade corporates of at least "A" or better quality and other high quality debt securities. Other than investments in U.S. government or government agencies, no single debt issue will be allowed to exceed 5% market value of the debt portfolio. Short-selling, securities lending, financial futures, margins, options, and derivatives are not used. Investments in nonmarketable securities, commodities, or direct ownership of real estate are prohibited.
Rate-of-return-on-assets assumptions are made based on the mix of assets according to our investment policy. Given the reallocation of plan assets into the fixed income and cash asset class, the overall expected long-term rate-of-return-on-plan assets net of investment manager fees as at December 31, 2017, was 2.50%.
F-30
The Davey Tree Expert Company
Notes to Consolidated Financial Statements--(Continued)
December 31, 2017
(In thousands, except share data)
P. | Defined Benefit Pension Plans (continued) |
Plan Assets--The fair values of our pension plan assets at December 31, 2017 by asset category, using the three-level hierarchy of fair value inputs, were as follows:
Fair Value Measurements at December 31, 2017 Using: | ||||||||||||||||
Description | Total Carrying Value at December 31, 2017 | Quoted prices in active markets (Level 1) | Significant other observable inputs (Level 2) | Significant unobservable inputs (Level 3) | ||||||||||||
Asset Category | ||||||||||||||||
Money market funds (a) | $ | 897 | $ | — | $ | 897 | $ | — | ||||||||
U.S. large-cap equities | ||||||||||||||||
Growth | 576 | 576 | — | — | ||||||||||||
Value | 542 | 542 | — | — | ||||||||||||
U.S. small/mid-cap equities | ||||||||||||||||
Growth | 246 | 246 | — | — | ||||||||||||
Value | 247 | 247 | — | — | ||||||||||||
International equities | ||||||||||||||||
Growth | 376 | 376 | — | — | ||||||||||||
Value | 366 | 366 | — | — | ||||||||||||
Fixed income | 3,070 | 3,070 | — | — | ||||||||||||
Multiclass world-allocation mutual funds | 785 | 785 | — | — | ||||||||||||
$ | 7,105 | $ | 6,208 | $ | 897 | $ | — | |||||||||
The fair values of our pension plan assets at December 31, 2016 by asset category, using the three-level hierarchy of fair value inputs, were as follows:
Fair Value Measurements at December 31, 2016 Using: | ||||||||||||||||
Description | Total Carrying Value at December 31, 2016 | Quoted prices in active markets (Level 1) | Significant other observable inputs (Level 2) | Significant unobservable inputs (Level 3) | ||||||||||||
Asset Category | ||||||||||||||||
Money market funds (a) | $ | 2,882 | $ | — | $ | 2,882 | $ | — | ||||||||
U.S. large-cap equities | ||||||||||||||||
Growth | 687 | 687 | — | — | ||||||||||||
Value | 729 | 729 | — | — | ||||||||||||
U.S. small/mid-cap equities | ||||||||||||||||
Growth | 339 | 339 | — | — | ||||||||||||
Value | 339 | 339 | — | — | ||||||||||||
International equities | ||||||||||||||||
Growth | 443 | 443 | — | — | ||||||||||||
Value | 514 | 514 | — | — | ||||||||||||
Fixed income | 4,669 | 4,669 | — | — | ||||||||||||
Multiclass world-allocation mutual funds | 907 | 907 | — | — | ||||||||||||
$ | 11,509 | $ | 8,627 | $ | 2,882 | $ | — | |||||||||
F-31
The Davey Tree Expert Company
Notes to Consolidated Financial Statements--(Continued)
December 31, 2017
(In thousands, except share data)
P. | Defined Benefit Pension Plans (continued) |
Within the pension plan asset categories, the Level 1 investments are publicly traded in active markets and are valued using the net asset value or closing price of the investment at the measurement date. Securities held by a money market fund are generally high quality and liquid; however, they are reflected as Level 2 because the inputs used to determine fair value are not quoted prices in an active market.
Expected Benefit Plan Contributions--It is our practice to make contributions to comply with the minimum funding requirements of ERISA. In accordance with such practice, contributions totaling $638 are required for 2018; however, we may make additional discretionary contributions.
Expected Benefit Plan Payments--The benefits, as of December 31, 2017, expected to be paid to defined-benefit plan participants in each of the next five years, and in the aggregate for the five years thereafter, follow:
Participants Benefits | ||||
Estimated future payments | ||||
Year ending December 31, 2018 | $ | 565 | ||
2019 | 675 | |||
2020 | 757 | |||
2021 | 809 | |||
2022 | 856 | |||
Years 2023 to 2027 | 4,835 | |||
Multiemployer Defined Benefit Pension Plans--In providing services to our Utility Services customers, we contribute to multiemployer defined benefit pension plans under the terms of collective-bargaining agreements that cover certain of our union-represented employees.
These plans generally provide retirement benefits to participants based on their service to contributing employers. We do not administer these multiemployer plans. In general, these plans are managed by a board of trustees with the unions appointing certain trustees and other contributing employers of the plan appointing certain members. We generally are not represented on the board of trustees.
The risks of participating in these multiemployer plans are different from single-employer plans in that: (a) assets contributed to the multiemployer plan by one employer may be used to provide benefits to employees of other participating employers; (b) if a participating employer stops contributing to the plan, the unfunded obligations of the plan may be assumed by the remaining participating employers; and, (c) if we choose to stop participating in a multiemployer plan, we may be required to pay the plan an amount based on the underfunded status of the plan, referred to as a withdrawal liability.
Our participation in the multiemployer defined benefit pension plans is summarized in the table below. The “EIN/Pension Plan Number” column provides the Employer Identification Number (“EIN”) and the three-digit plan number. The most recent Pension Protection Act of 2006 (the “PPA”) zone status is from the Form 5500, “Annual Return/Report of Employee Benefit Plan,” filed by the plan and certified by the plan's actuary. The PPA zone status describes plans that are underfunded. Among other factors, plans in the “critical” red zone are generally less than 65% funded; plans in the “endangered” yellow zone are less than 80% funded; and, plans in the “safe” green zone are at least 80% funded.
F-32
The Davey Tree Expert Company
Notes to Consolidated Financial Statements--(Continued)
December 31, 2017
(In thousands, except share data)
P. | Defined Benefit Pension Plans (continued) |
Pension Fund | EIN/Pension Plan Number | Pension Protection Act Zone Status | FIP/RP Status Pending Implemented | Davey Tree Contributions | Surcharge Imposed | Expiration Dates of Bargaining Agreement | ||||||||||||||||||
2017 | 2016 | 2017 | 2016 | 2015 | ||||||||||||||||||||
National Electric Benefit Fund | 53-0181657/001 | Green | Green | No | $ | 785 | $ | 712 | $ | 774 | No | Ranging from June 30, 2017 to December 31, 2018 | ||||||||||||
Eighth District Electrical Pension Fund | 84-6100393/001 | Green | Green | No | 102 | 90 | 119 | No | December 31, 2017 | |||||||||||||||
$ | 887 | $ | 802 | $ | 893 | |||||||||||||||||||
We were not listed in the Form 5500 for either plan as having provided more than 5% of the total contributions.
Both the National Electric Benefit Fund and the Eighth District Electrical Pension Fund are green zone status--safe--which represents at least 80% funded and does not require a “financial improvement plan” (“FIP”) or a “rehabilitation plan” (“RP”).
We are party to nine collective-bargaining agreements with the National Electric Benefit Fund, with expiration dates ranging from June 30, 2017 to December 31, 2018, and one collective-bargaining agreement with Eighth District Electrical Pension Fund which expired on December 31, 2017. Expired agreements are currently being renegotiated.
Q. | Income Taxes |
On December 22, 2017, the President of the United States (“U.S.”) signed into law the Tax Cuts and Jobs Act (the “Tax Reform Act”), which enacts significant changes to U.S. tax laws. Some of the provisions of the new tax law affecting corporations include, but are not limited to lowering the U.S. corporate income tax rate from 35% to 21% effective January 1, 2018, immediate expensing of certain qualified capital expenditures, implementing a territorial tax system and imposing a one-time transitional toll tax on deferred foreign earnings. As a result of the Tax Reform Act, the Company recorded the provisional tax effects, including a tax charge of $1.0 million due to the remeasurement of deferred tax assets and liabilities in the fourth quarter of 2017. The Company has also estimated a tax liability of $6.1 million due to the transition toll tax on the deemed repatriation of deferred foreign earnings of non-U.S. operations, which the Company believes will be fully offset by foreign tax credits. The final amounts recorded in subsequent financial statements may differ from these provisional amounts due to, among other things, additional analysis related to foreign deferred earnings, changes in interpretations of the Tax Reform Act and related assumptions of the Company and additional regulatory guidance that may be issued.
On December 22, 2017, the Securities and Exchange Commission (“SEC”) issued Staff Accounting Bulletin 118 (“SAB 118”). This guidance allows registrants a “measurement period”, not to exceed one year from the date of enactment, to complete their accounting for the tax effects of the Tax Reform Act. SAB 118 further directs that during the measurement period, registrants who are able to make reasonable estimates for the tax effects of the Tax Reform Act should include those amounts in their financial statements as “provisional” amounts. Registrants should reflect adjustments over subsequent periods as they are able to refine their estimates and complete their accounting for the tax effects of the Tax Reform Act. The provisional amounts computed by the Company are expected to be finalized when the U.S. corporate income tax return for 2017 is filed in 2018, but in no event later than one year from the enactment date.
Other provisions of the Tax Reform Act include a new minimum tax on certain foreign earnings (the Global Intangibles Low-taxed Income, or “GILTI”), a new tax on certain payments to foreign related parties (the Base Erosion Anti-Avoidance tax, or “BEAT”), a new incentive for Foreign-derived Intangibles Income (“FDII”), repealing the deduction for domestic production activities, changes to the limitation on the deductibility of certain executive compensation, and new limitations on the deductibility of interest expense. Generally, the tax effect of these other provisions will begin for the Company in the year ending December 31, 2018.
F-33
The Davey Tree Expert Company
Notes to Consolidated Financial Statements--(Continued)
December 31, 2017
(In thousands, except share data)
Q. | Income Taxes (continued) |
Income before income taxes was attributable to the following sources:
Year Ended December 31, | |||||||||||
2017 | 2016 | 2015 | |||||||||
United States | $ | 38,800 | $ | 35,867 | $ | 32,807 | |||||
Canada | (806 | ) | 1,377 | 2,451 | |||||||
Total | $ | 37,994 | $ | 37,244 | $ | 35,258 | |||||
The provision for income taxes follows:
Year Ended December 31, | |||||||||||
2017 | 2016 | 2015 | |||||||||
Currently payable: | |||||||||||
Federal | $ | 9,914 | $ | 12,216 | $ | 13,337 | |||||
State | 2,469 | 2,286 | 2,487 | ||||||||
Canadian | (262 | ) | 398 | 611 | |||||||
Total current | 12,121 | 14,900 | 16,435 | ||||||||
Deferred taxes | 3,753 | 60 | (2,975 | ) | |||||||
Total taxes on income | $ | 15,874 | $ | 14,960 | $ | 13,460 | |||||
A reconciliation of the expected statutory U.S. federal rate to our actual effective income tax rate follows:
Year Ended December 31, | ||||||||
2017 | 2016 | 2015 | ||||||
Statutory U.S. federal tax rate | 35.0 | % | 35.0 | % | 35.0 | % | ||
State income taxes, net of federal benefit | 4.9 | 4.0 | 3.7 | |||||
Effect of Canadian income taxes | .3 | (.2 | ) | (.5 | ) | |||
Nondeductible expenses | 2.2 | 2.2 | 2.3 | |||||
ESOP dividend deduction | (.6 | ) | (.7 | ) | (.8 | ) | ||
Uncertain tax adjustments and audit settlement | (.2 | ) | .2 | 1.5 | ||||
Valuation allowance | — | — | (2.2 | ) | ||||
Income tax reform | 2.5 | — | — | |||||
All other, net | (2.3 | ) | (.3 | ) | (.8 | ) | ||
Effective income tax rate | 41.8 | % | 40.2 | % | 38.2 | % | ||
Deferred income taxes reflect the tax effects of temporary differences between the carrying amount of assets and liabilities for financial reporting purposes and the amounts used for income tax purposes. A valuation allowance is recorded when it is more-likely-than-not that an income tax benefit will not be realized.
F-34
The Davey Tree Expert Company
Notes to Consolidated Financial Statements--(Continued)
December 31, 2017
(In thousands, except share data)
Q. | Income Taxes (continued) |
Significant components of our noncurrent net deferred tax assets and liabilities at December 31, were as follows:
December 31, | |||||||
2017 | 2016 | ||||||
Deferred tax assets: | |||||||
Self-insurance accruals | $ | 14,186 | $ | 21,967 | |||
Accrued compensated absences | 1,747 | 3,540 | |||||
Accrued expenses and other liabilities | 798 | 1,394 | |||||
Accrued stock compensation | 1,571 | 2,502 | |||||
Defined benefit pension plans | 2,289 | 4,019 | |||||
Foreign tax credit carryforward | 605 | 575 | |||||
Other future deductible amounts, net | 3,661 | 4,213 | |||||
24,857 | 38,210 | ||||||
Deferred tax liabilities: | |||||||
Intangibles | 969 | 297 | |||||
Prepaid expenses | 2,300 | 3,510 | |||||
Property and equipment | 16,773 | 23,274 | |||||
20,042 | 27,081 | ||||||
Net deferred tax assets--noncurrent | $ | 4,815 | $ | 11,129 | |||
We treat all of our Canadian subsidiary earnings through December 31, 2017 as permanently reinvested and have not provided any U.S. federal or state tax thereon. As of December 31, 2017, approximately $30,329 of undistributed earnings attributable to our Canadian operations was considered to be indefinitely invested. Presently, our intention is to reinvest the earnings permanently.
If, in the future, these earnings are distributed to the U.S. in the form of dividends or otherwise, or if the Company determines such earnings will be remitted in the foreseeable future, the Company would be subject to Canadian withholding taxes. It is not practicable to estimate the amount of taxes that would be payable upon remittance of these earnings given the various tax planning alternatives that we could employ should we decide to repatriate those earnings.
As of December 31, 2015, we released a valuation allowance that had been recorded in prior years related to the foreign tax credit carryforward that arose in 2010--wherein we repatriated earnings in 2010 of our Canadian operations due to capital in Canada in excess of current and future projected needs. Management presently believes that it is more-likely-than-not that the deferred tax asset, related to the foreign tax credits that expires in 2020 and 2027, will be realized. The criteria considered in making the determination included the ability to utilize tax-planning strategies, historical and projected operating results, and the period of time over which the foreign tax credit can be utilized.
The amount of income taxes that we pay is subject to audit by U.S. federal, state, local and Canadian tax authorities, which may result in proposed assessments. Our estimate for the potential outcome for any uncertain tax issue is highly judgmental. Uncertain tax positions are recognized only if they are more-likely-than-not to be upheld during examination based on their technical merits. The measurement of the uncertain tax position is based on the largest benefit amount that is more-likely-than-not (determined on a cumulative probability basis) to be realized upon settlement of the matter. If payment of these amounts ultimately proves to be unnecessary, the reversal of the liabilities would result in tax benefits being recognized in the period when we determine the liabilities are no longer necessary. If the estimate of tax liabilities proves to be less than the ultimate settlement, a further charge to expense may result.
F-35
The Davey Tree Expert Company
Notes to Consolidated Financial Statements--(Continued)
December 31, 2017
(In thousands, except share data)
Q. | Income Taxes (continued) |
The balance of unrecognized benefits and the amount of related interest and penalties at December 31, were as follows:
December 31, | |||||||
2017 | 2016 | ||||||
Unrecognized tax benefits | $ | 2,581 | $ | 2,532 | |||
Portion, if recognized, would reduce tax expense and effective tax rate | 1,948 | 2,053 | |||||
Accrued interest on unrecognized tax benefits | 128 | 107 | |||||
We recognize interest accrued related to unrecognized tax benefits in income tax expense. Penalties, if incurred, would be recognized as a component of income tax expense.
The Company is routinely under audit by U.S. federal, state, local and Canadian authorities in the area of income tax. These audits include questioning the timing and the amount of income and deductions and the allocation of income and deductions among various tax jurisdictions. During the fourth quarter 2017, the U.S. Internal Revenue Service initiated an audit of the Company's U.S. income tax returns for 2015. With the exception of U.S. state jurisdictions, the Company is no longer subject to examination by tax authorities for the years through 2013. As of December 31, 2017, we believe it is reasonably possible that the total amount of unrecognized tax benefits will not significantly increase or decrease.
The changes in our unrecognized tax benefits are summarized in the table below:
Year Ended December 31, | |||||||||||
2017 | 2016 | 2015 | |||||||||
Balance, beginning of year | $ | 2,532 | $ | 2,557 | $ | 1,949 | |||||
Additions based on tax positions related to the current year | 650 | 402 | 642 | ||||||||
Additions for tax positions of prior years | (21 | ) | 51 | 52 | |||||||
Reductions for tax positions of prior years | — | (39 | ) | (63 | ) | ||||||
Lapses in statutes of limitations | (580 | ) | (439 | ) | (23 | ) | |||||
Balance, end of year | $ | 2,581 | $ | 2,532 | $ | 2,557 | |||||
F-36
The Davey Tree Expert Company
Notes to Consolidated Financial Statements--(Continued)
December 31, 2017
(In thousands, except share data)
R. | Earnings Per Share Information |
Earnings per share is computed as follows (prior periods have been adjusted for the two-for-one stock split of our common shares effective June 1, 2017):
Year Ended December 31, | |||||||||||
2017 | 2016 | 2015 | |||||||||
Income available to common shareholders: | |||||||||||
Net income | $ | 22,120 | $ | 22,284 | $ | 21,798 | |||||
Weighted-average shares: | |||||||||||
Basic: | |||||||||||
Outstanding | 24,793,086 | 25,378,600 | 26,058,736 | ||||||||
Partially-paid share subscriptions | 764,382 | 833,440 | 872,162 | ||||||||
Basic weighted-average shares | 25,557,468 | 26,212,040 | 26,930,898 | ||||||||
Diluted: | |||||||||||
Basic from above | 25,557,468 | 26,212,040 | 26,930,898 | ||||||||
Incremental shares from assumed: | |||||||||||
Exercise of stock subscription purchase rights | 146,453 | 142,746 | 135,428 | ||||||||
Exercise of stock options and awards | 993,141 | 892,568 | 888,254 | ||||||||
Diluted weighted-average shares | 26,697,062 | 27,247,354 | 27,954,580 | ||||||||
Share data: | |||||||||||
Earnings per share--basic | $ | .87 | $ | .85 | $ | .81 | |||||
Earnings per share--diluted | $ | .83 | $ | .82 | $ | .78 | |||||
S. | Operations by Business Segment and Geographic Information |
We provide a wide range of arboricultural, horticultural, environmental and consulting services to residential, utility, commercial and government entities throughout the United States and Canada. We have two reportable operating segments organized by type or class of customer: Residential and Commercial, and Utility.
Residential and Commercial--Residential and Commercial provides services to our residential and commercial customers including: the treatment, preservation, maintenance, removal and planting of trees, shrubs and other plant life; the practice of landscaping, grounds maintenance, tree surgery, tree feeding and tree spraying; the application of fertilizer, herbicides and insecticides; and, natural resource management and consulting, forestry research and development, and environmental planning.
Utility--Utility is principally engaged in providing services to our utility customers--investor-owned, municipal utilities, and rural electric cooperatives--including: the practice of line-clearing and vegetation management around power lines, rights-of-way and chemical brush control; and, natural resource management and consulting, forestry research and development and environmental planning.
All other operating activities, including research, technical support and laboratory diagnostic facilities, are included in “All Other.”
Measurement of Segment Profit and Loss and Segment Assets--We evaluate performance and allocate resources based primarily on operating income and also actively manage business unit operating assets. The accounting policies of the reportable segments are the same as those described in the summary of significant accounting policies except that (a) we compute and recognize depreciation expense for our segments only by the straight-line method and (b) state income taxes are allocated to the segments. Corporate expenses are substantially allocated among the operating segments, but the nature of expenses allocated may differ from year-to-year. There are no intersegment revenues.
F-37
The Davey Tree Expert Company
Notes to Consolidated Financial Statements--(Continued)
December 31, 2017
(In thousands, except share data)
S. | Operations by Business Segment and Geographic Information (continued) |
Segment assets are those generated or directly used by each segment, and include accounts receivable, operating supplies, and property and equipment.
Information on reportable segments and reconciliation to the consolidated financial statements follows:
Utility Services | Residential Commercial Services | All Other | Reconciling Adjustments | Consolidated | |||||||||||||||
Fiscal Year 2017 | |||||||||||||||||||
Revenues | $ | 466,727 | $ | 446,028 | $ | 3,203 | $ | — | $ | 915,958 | |||||||||
Income (loss) from operations | 18,223 | 41,158 | (2,634 | ) | (9,742 | ) | (a) | 47,005 | |||||||||||
Interest expense | (4,886 | ) | (4,886 | ) | |||||||||||||||
Interest income | 292 | 292 | |||||||||||||||||
Other income (expense), net | (4,417 | ) | (4,417 | ) | |||||||||||||||
Income before income taxes | $ | 37,994 | |||||||||||||||||
Depreciation | $ | 27,928 | $ | 19,384 | $ | — | $ | 3,390 | (b) | $ | 50,702 | ||||||||
Amortization | 122 | 2,240 | — | 22 | 2,384 | ||||||||||||||
Capital expenditures | 26,910 | 23,199 | — | 6,991 | 57,100 | ||||||||||||||
Segment assets, total | 189,662 | 197,698 | — | 85,775 | (c) | 473,135 | |||||||||||||
Fiscal Year 2016 | |||||||||||||||||||
Revenues | $ | 433,379 | $ | 410,878 | $ | 1,421 | $ | — | $ | 845,678 | |||||||||
Income (loss) from operations | 19,256 | 36,640 | (4,318 | ) | (6,207 | ) | (a) | 45,371 | |||||||||||
Interest expense | (4,393 | ) | (4,393 | ) | |||||||||||||||
Interest income | 255 | 255 | |||||||||||||||||
Other income (expense), net | (3,989 | ) | (3,989 | ) | |||||||||||||||
Income before income taxes | $ | 37,244 | |||||||||||||||||
Depreciation | $ | 26,855 | $ | 17,198 | $ | — | $ | 3,231 | (b) | $ | 47,284 | ||||||||
Amortization | 135 | 2,136 | — | 35 | 2,306 | ||||||||||||||
Capital expenditures | 28,660 | 21,819 | — | 6,167 | 56,646 | ||||||||||||||
Segment assets, total | 171,220 | 166,858 | — | 85,861 | (c) | 423,939 | |||||||||||||
Fiscal Year 2015 | |||||||||||||||||||
Revenues | $ | 433,117 | $ | 386,327 | $ | 2,460 | $ | — | $ | 821,904 | |||||||||
Income (loss) from operations | 24,273 | 35,271 | (5,368 | ) | (10,068 | ) | (a) | 44,108 | |||||||||||
Interest expense | (3,355 | ) | (3,355 | ) | |||||||||||||||
Interest income | 249 | 249 | |||||||||||||||||
Other income (expense), net | (5,744 | ) | (5,744 | ) | |||||||||||||||
Income before income taxes | $ | 35,258 | |||||||||||||||||
Depreciation | $ | 25,466 | $ | 15,592 | $ | — | $ | 3,619 | (b) | $ | 44,677 | ||||||||
Amortization | 144 | 2,062 | — | 8 | 2,214 | ||||||||||||||
Capital expenditures | 26,853 | 22,853 | — | 6,341 | 56,047 | ||||||||||||||
Segment assets, total | 145,306 | 162,679 | — | 85,601 | (c) | 393,586 | |||||||||||||
F-38
The Davey Tree Expert Company
Notes to Consolidated Financial Statements--(Continued)
December 31, 2017
(In thousands, except share data)
S. | Operations by Business Segment and Geographic Information (continued) |
Reconciling adjustments from segment reporting to consolidated external financial reporting include unallocated corporate items:
(a) | Reconciling adjustments from segment reporting to consolidated external financial reporting include reclassification of depreciation expense and allocation of corporate expenses. |
(b) | Adjustments to declining-balance method depreciation expense from straight-line method and depreciation and amortization of corporate assets. |
(c) | Corporate assets include cash, prepaid expenses, corporate facilities, enterprise-wide information systems and other nonoperating assets. |
Geographic Information--The following presents revenues and long-lived assets by geographic territory:
Year Ended December 31, | |||||||||||
2017 | 2016 | 2015 | |||||||||
Revenues | |||||||||||
United States | $ | 847,540 | $ | 775,870 | $ | 749,896 | |||||
Canada | 68,418 | 69,808 | 72,008 | ||||||||
$ | 915,958 | $ | 845,678 | $ | 821,904 | ||||||
December 31, | |||||||||||
2017 | 2016 | 2015 | |||||||||
Long-lived assets, net | |||||||||||
United States | $ | 242,118 | $ | 224,727 | $ | 213,323 | |||||
Canada | 21,893 | 20,439 | 19,329 | ||||||||
$ | 264,011 | $ | 245,166 | $ | 232,652 | ||||||
T. | Fair Value Measurements and Financial Instruments |
Financial Accounting Standards Board Accounting Standard Codification 820, “Fair Value of Measurements and Disclosures (“Topic 820”)” defines fair value based on the price that would be received to sell an asset or the exit price that would be paid to transfer a liability in an orderly transaction between market participants at the measurement date. Market participants are defined as buyers or sellers in the principal or most advantageous market for the asset or liability that are independent of the reporting entity, knowledgeable and able and willing to transact for the asset or liability.
Valuation Hierarchy--Topic 820 establishes a fair value hierarchy that prioritizes observable and unobservable inputs used to measure fair value. The hierarchy prioritizes the inputs into three broad levels:
Level 1 inputs are quoted prices in active markets for identical assets or liabilities that the entity has the ability to access.
Level 2 inputs are observable inputs other than prices included in Level 1, such as quoted prices for similar assets and liabilities in active markets; quoted prices for identical or similar assets and liabilities in markets that are not active; or other inputs that are observable or can be corroborated with observable market data.
Level 3 inputs are unobservable inputs that are supported by little or no market activity and that are significant to the fair value of the assets and liabilities. This includes certain pricing models, discounted cash flow methodologies and similar techniques that use significant unobservable inputs.
F-39
The Davey Tree Expert Company
Notes to Consolidated Financial Statements--(Continued)
December 31, 2017
(In thousands, except share data)
T. | Fair Value Measurements and Financial Instruments (continued) |
Our assets and liabilities measured at fair value on a recurring basis at December 31, 2017 and December 31, 2016, were as follows:
Fair Value Measurements at December 31, 2017 Using: | ||||||||||||||||
Total Carrying Value at | Quoted prices in active markets | Significant other observable inputs | Significant unobservable inputs | |||||||||||||
Description | December 31, 2017 | (Level 1) | (Level 2) | (Level 3) | ||||||||||||
Assets: | ||||||||||||||||
Assets invested for self-insurance, classified as other assets, noncurrent | $ | 19,422 | $ | 19,422 | $ | — | $ | — | ||||||||
Defined benefit pension plan assets | 7,105 | 6,208 | 897 | — | ||||||||||||
Liabilities: | ||||||||||||||||
Deferred compensation | $ | 2,146 | $ | — | $ | 2,146 | $ | — | ||||||||
Fair Value Measurements at December 31, 2016 Using: | ||||||||||||||||
Total Carrying Value at | Quoted prices in active markets | Significant other observable inputs | Significant unobservable inputs | |||||||||||||
Description | December 31, 2016 | (Level 1) | (Level 2) | (Level 3) | ||||||||||||
Assets: | ||||||||||||||||
Assets invested for self-insurance, classified as other assets, noncurrent | $ | 15,492 | $ | 15,492 | $ | — | $ | — | ||||||||
Defined benefit pension plan assets | 11,509 | 8,627 | 2.882 | — | ||||||||||||
Liabilities: | ||||||||||||||||
Deferred compensation | $ | 1,837 | $ | — | $ | 1,837 | $ | — | ||||||||
The estimated fair value of the deferred compensation--classified as Level 2--is based on the value of the Company's common shares, determined by independent valuation.
F-40
The Davey Tree Expert Company
Notes to Consolidated Financial Statements--(Continued)
December 31, 2017
(In thousands, except share data)
T. | Fair Value Measurements and Financial Instruments (continued) |
Fair Value of Financial Instruments--The fair values of our current financial assets and current liabilities, including cash, accounts receivable, accounts payable, and accrued expenses among others, approximate their reported carrying values because of their short-term nature. The assets invested for self-insurance are money market funds--classified as Level 1--based on quoted market prices of the identical underlying securities in active markets. Financial instruments classified as noncurrent liabilities and their carrying values and fair values were as follows:
December 31, 2017 | December 31, 2016 | ||||||||||||||
Carrying Value | Fair Value | Carrying Value | Fair Value | ||||||||||||
Revolving credit facility, noncurrent | $ | 100,000 | $ | 100,000 | $ | 67,000 | $ | 67,000 | |||||||
Senior unsecured notes | 12,000 | 12,389 | 18,000 | 18,509 | |||||||||||
Term loans, noncurrent | 7,935 | 10,038 | 7,623 | 9,854 | |||||||||||
Total | $ | 119,935 | $ | 122,427 | $ | 92,623 | $ | 95,363 | |||||||
The carrying value of our revolving credit facility approximates fair value--classified as Level 2--as the interest rates on the amounts outstanding are variable. The fair value of our senior unsecured notes and term loans--classified as Level 2--is determined based on expected future weighted-average interest rates with the same remaining maturities.
Market Risk--In the normal course of business, we are exposed to market risk related to changes in foreign currency exchange rates, changes in interest rates and changes in fuel prices. We do not hold or issue derivative financial instruments for trading or speculative purposes. In prior years, we have used derivative financial instruments to manage risk, in part, associated with changes in interest rates and changes in fuel prices. Presently, we are not engaged in any hedging or derivative activities.
U. | Commitments and Contingencies |
Letters of Credit
At December 31, 2017, we were contingently liable to our principal banks in the amount of $63,242 for letters of credit outstanding primarily related to insurance coverage.
Surety Bonds
In certain circumstances, we have performance obligations that are supported by surety bonds in connection with our contractual commitments.
Litigation
We are party to a number of lawsuits, threatened lawsuits and other claims arising out of the normal course of business. On a quarterly basis, we assess our liabilities and contingencies in connection with outstanding legal proceedings utilizing the latest information available. Where it is probable that we will incur a loss and the amount of the loss can be reasonably estimated, we record a liability in our consolidated financial statements. These legal reserves may be increased or decreased to reflect any relevant developments on a quarterly basis. Where a loss is not probable or the amount of the loss is not estimable, we do not accrue legal reserves, consistent with applicable accounting guidance. Based on information currently available to us, advice of counsel, and available insurance coverage, we believe that our established reserves are adequate and the liabilities arising from the legal proceedings will not have a material adverse effect on our consolidated financial condition. We note, however, that in light of the inherent uncertainty in legal proceedings there can be no assurance that the ultimate resolution of a matter will not exceed established reserves. As a result, the outcome of a particular matter or a combination of matters may be material to our results of operations for a particular period, depending upon the size of the loss or our income for that particular period.
F-41
The Davey Tree Expert Company
Notes to Consolidated Financial Statements--(Continued)
December 31, 2017
(In thousands, except share data)
U. | Commitments and Contingencies (continued) |
In November 2017, a suit was filed against Davey Tree, its subsidiary, Wolf Tree, Inc., a former Davey employee, two Wolf employees, and a former Wolf employee alleging various acts of negligence and seeking compensatory and punitive damages for wrongful death and assault and battery of the plaintiff’s husband, a Wolf Tree employee in Savannah, Georgia, who was killed in August 2017. The Company has denied all liability and is vigorously defending the action. It also has retained separate counsel for three of the individual defendants, each of whom has denied all liability and also is vigorously defending the action.
V. | Quarterly Results of Operations (Unaudited) |
The following is a summary of the results of operations for each quarter of 2017 and 2016. We have given retroactive consideration to the two-for-one stock split of our common shares effective June 1, 2017.
Fiscal 2017, Three Months Ended | |||||||||||||||
Apr 1 | Jul 1 | Sep 30 | Dec 31 | ||||||||||||
Revenues | $ | 192,813 | $ | 245,037 | $ | 249,588 | $ | 228,520 | |||||||
Gross profit (revenues less costs and expenses, operating) | 59,154 | 93,512 | 91,973 | 83,986 | |||||||||||
Income (loss) from operations | (4,342 | ) | 25,312 | 18,701 | 7,334 | ||||||||||
Net income (loss) | (3,887 | ) | 14,223 | 10,237 | 1,547 | ||||||||||
Net income (loss) per share -- Basic | $ | (.15 | ) | $ | .57 | $ | .41 | $ | .04 | ||||||
Net income (loss) per share -- Diluted | $ | (.15 | ) | $ | .55 | $ | .39 | $ | .04 | ||||||
ESOT valuation per share | $ | 17.60 | $ | 17.60 | $ | 18.30 | $ | 19.10 | |||||||
Fiscal 2016, Three Months Ended | |||||||||||||||
Apr 2 | Jul 2 | Oct 1 | Dec 31 | ||||||||||||
Revenues | $ | 180,833 | $ | 224,763 | $ | 223,719 | $ | 216,363 | |||||||
Gross profit (revenues less costs and expenses, operating) | 57,660 | 87,631 | 81,386 | 77,515 | |||||||||||
Income (loss) from operations | (5,120 | ) | 24,286 | 15,042 | 11,163 | ||||||||||
Net income (loss) | (4,188 | ) | 13,309 | 8,141 | 5,022 | ||||||||||
Net income (loss) per share -- Basic | $ | (.16 | ) | $ | .52 | $ | .32 | $ | .17 | ||||||
Net income (loss) per share -- Diluted | $ | (.16 | ) | $ | .50 | $ | .31 | $ | .17 | ||||||
ESOT valuation per share | $ | 16.35 | $ | 16.35 | $ | 16.95 | $ | 17.60 | |||||||
Fourth quarters 2017 and 2016 include a decrease in casualty insurance expense that had the effect of increasing the fourth quarter gross profit for 2017 and 2016 by approximately $2,735 and $2,810, respectively. | |||||||||||||||
F-42