Attached files
| file | filename |
|---|---|
| EX-32.2 - PCM, INC. | ex32-2.htm |
| EX-32.1 - PCM, INC. | ex32-1.htm |
| EX-31.2 - PCM, INC. | ex31-2.htm |
| EX-31.1 - PCM, INC. | ex31-1.htm |
| EX-23.1 - PCM, INC. | ex23-1.htm |
| EX-21.1 - PCM, INC. | ex21-1.htm |
| EX-10.30 - PCM, INC. | ex10-30.htm |
UNITED STATES
SECURITIES AND EXCHANGE COMMISSION
Washington, D.C. 20549
FORM 10-K
| [X] | ANNUAL REPORT PURSUANT TO SECTION 13 OR 15(d) OF THE SECURITIES EXCHANGE ACT OF 1934 |
For the fiscal year ended December 31, 2017
| [ ] | TRANSITION REPORT PURSUANT TO SECTION 13 OR 15(d) OF THE SECURITIES EXCHANGE ACT OF 1934 |
For the transition period from to
Commission File Number: 0-25790
PCM, INC.
(Exact name of Registrant as specified in its charter)
| Delaware | 95-4518700 | |
| (State or other jurisdiction of | (IRS Employer | |
| incorporation or organization) | Identification Number) |
1940 East Mariposa Avenue, El Segundo, CA 90245
(Address of principal executive offices, including zip code)
(310) 354-5600
(Registrant’s telephone number, including area code)
(Former address of principal executive offices, including zip code)
Securities registered pursuant to Section 12(b) of the Act:
| Title of Each Class | Name of Exchange on Which Registered | |
| Common Stock, $0.001 par value per share | The NASDAQ Global Market |
Securities registered pursuant to Section 12(g) of the Act: None
Indicate by check mark if the registrant is a well-known seasoned issuer, as defined in Rule 405 of the Securities Act. Yes [ ] No [X]
Indicate by check mark if the registrant is not required to file reports pursuant to Section 13 or Section 15(d) of the Act. Yes [ ] No [X]
Indicate by check mark whether the registrant: (1) has filed all reports required to be filed by Section 13 or 15(d) of the Securities Exchange Act of 1934 during the preceding 12 months (or for such shorter period that the registrant was required to file such reports), and (2) has been subject to such filing requirements for the past 90 days. Yes [X] No [ ]
Indicate by check mark whether the registrant has submitted electronically and posted on its corporate Web site, if any, every Interactive Data File required to be submitted and posted pursuant to Rule 405 of Regulation S-T during the preceding 12 months (or for such shorter period that the registrant was required to submit and post such files). Yes [X] No [ ]
Indicate by check mark if disclosure of delinquent filers pursuant to Item 405 of Regulation S-K is not contained herein, and will not be contained, to the best of registrant’s knowledge, in definitive proxy or information statements incorporated by reference in Part III of this Form 10-K or any amendment to this Form 10-K. [ ]
Indicate by check mark whether the registrant is a large accelerated filer, an accelerated filer, a non-accelerated filer, a smaller reporting company, or an emerging growth company. See the definitions of “large accelerated filer,” “accelerated filer,” “smaller reporting company,” and “emerging growth company” in Rule 12b-2 of the Exchange Act.
| Large accelerated filer [ ] | Accelerated filer [X] | |
| Non-accelerated filer [ ] (Do not check if a smaller reporting company) | Smaller reporting company [ ] | |
| Emerging growth company [ ] |
If an emerging growth company, indicate by check mark if the registrant has elected not to use the extended transition period for complying with any new or revised financial accounting standards provided pursuant to Section 13(a) of the Exchange Act. [ ]
Indicate by check mark whether the registrant is a shell company (as defined in Rule 12b-2 of the Act). Yes [ ] No [X]
As of June 30, 2017, the aggregate market value of the Common Stock held by non-affiliates of the registrant was approximately $186.6 million, based upon the closing sales price of the registrant’s Common Stock on such date, as reported on the Nasdaq Global Market. Shares of Common Stock held by each executive officer, director and each person owning more than 10% of the outstanding Common Stock of the registrant have been excluded in that such persons may be deemed to be affiliates of the registrant. This determination of affiliate status is not necessarily a conclusive determination for other purposes.
As of March 12, 2018, the registrant had 11,792,105 shares of common stock outstanding.
Documents Incorporated By Reference Into Part III:
Portions of the definitive Proxy Statement for the Registrant to be filed in connection with its 2018 Annual Meeting of Stockholders are incorporated by reference into Part III of this Report.
PCM, INC.
TABLE OF CONTENTS
| 1 |
FORWARD-LOOKING STATEMENTS
This Annual Report on Form 10-K contains forward-looking statements within the meaning of Section 27A of the Securities Act of 1933, as amended (the “Securities Act”), and Section 21E of the Securities Exchange Act of 1934, as amended (the “Exchange Act”). Such statements include statements regarding our expectations, hopes or intentions regarding the future, including but not limited to, statements regarding our strategy, competition, markets, vendors, expenses, new services and technologies, growth prospects, financing, revenue, margins, operations, litigation and compliance with applicable laws. In particular, the following types of statements are forward-looking:
| ● | our ability to execute and benefit from our business strategies, including but not limited to, business strategies related to and strategic investments in our internal organization and focus on practice groups and sales of end-point solutions, advanced technologies, managed services and software solutions, leveraging our key vendor partner relationships, identifying and driving further operational efficiencies or successfully effecting our acquisition strategies including integrating our most recent acquisitions, and expanding our international capabilities; | |
| ● | our use of management information systems and their need for future support or upgrade; | |
| ● | our expectations regarding the timing, costs and benefits of our ongoing or planned IT systems and communications infrastructure upgrades; | |
| ● | our expectations regarding the business impact and accounting treatment of recent acquisitions, including any additional charges that may be taken in future periods; | |
| ● | our expectations that the transfer of certain customer contracts to potentially non-consolidated partners may have a negative impact on our consolidated net sales in future periods; | |
| ● | our expectations regarding key personnel and our ability to hire new and retain such individuals; | |
| ● | our expectations regarding the impact of our transition of certain outsourced services to our captive support operations; | |
| ● | our expectations regarding the impact of cost reductions on our results in future periods; | |
| ● | our expectations regarding our operations in newly opened geographies, including the United Kingdom; | |
| ● | our competitive advantages and growth opportunities; | |
| ● | our ability to increase revenues and profitability; | |
| ● | our expectation regarding general economic uncertainties and the related potential negative impact on our profit and profit margins, as well as our financial condition, liquidity and future cash flows; | |
| ● | our expectations to continue our efforts to increase the productivity of our sales force and reduce costs; | |
| ● | our plans to invest in and enhance programs and training to align us with our key vendor partners; | |
| ● | our ability to generate vendor supported marketing; | |
| ● | our expectations regarding our future capital needs and the availability of working capital, liquidity, cash flows from operations and borrowings under our credit facility and other long-term debt; | |
| ● | the expected results or profitability of any of our individual business units in future periods; | |
| ● | the expected impact of customer implementations or rollouts on our individual business units in future periods; | |
| ● | the impact on accounts receivable from our efforts to focus on sales in our Commercial and Public Sector segments; | |
| ● | our ability to penetrate the public sector market; | |
| ● | our beliefs relating to the benefits to be received from our international operations, including in Canada, the Philippines, and the UK, including the impact of taxes and labor costs in such operations; | |
| ● | our expectations regarding the impact of our transition from outsourced operations in Pakistan to our captive BPO operations including our captive BPO operations in the Philippines; | |
| ● | our belief regarding our exposure to currency exchange and interest rate risks; | |
| ● | our ability to attract new customers and stimulate additional purchases from existing customers, including our expectations regarding future marketing and advertising levels and the effect on sales; | |
| ● | our ability to leverage our market position and purchasing power and offer a wide selection of products at competitive prices; | |
| ● | our expectations regarding the ability of our marketing programs or campaigns to stimulate additional purchases or to maximize product sales; | |
| ● | our ability to limit risk related to price reductions; | |
| ● | our belief regarding the effect of seasonal trends and general economic conditions on our business and results of operations across all of our segments; | |
| ● | our expectations regarding competition and the industry trend toward consolidation; | |
| ● | the anticipated impact of reductions in sales to certain large enterprise customers; | |
| ● | our expectations regarding the impact of investments we are making in the area of sales headcount, software and advanced technology solutions; | |
| ● | our expectations regarding the payment of dividends and our intention to retain any earnings to finance the growth and development of our business; |
| 2 |
| ● | our expectations with respect to changes in our unrecognized tax benefits; | |
| ● | our compliance with laws and regulations; | |
| ● | our beliefs regarding the applicability of tax statutes, regulations and governmental tax regulatory positions; | |
| ● | our expectations regarding the impact of accounting pronouncements; | |
| ● | our expectations regarding any future repurchases of our common stock, including the financing of any such repurchases; | |
| ● | our belief that backlog is not useful for predicting our future sales; | |
| ● | our expectations regarding the impact and outcome of pending litigation and other dispute resolution proceedings; | |
| ● | our belief that our existing distribution facilities are adequate for our current and foreseeable future needs; and | |
| ● | the likelihood that new laws and regulations will be adopted with respect to the Internet, privacy and data security that may impose additional restrictions or burdens on our business, and our implementation of compliance procedures and the costs associated with compliance with such laws and regulations. |
Forward-looking statements involve certain risks and uncertainties, and actual results may differ materially from those discussed in any such statement. Factors that could cause actual results to differ materially from such forward-looking statements include the risks described under the heading “Risk Factors” in Part I, Item 1A of this report. All forward-looking statements in this document are made as of the date hereof, based on information available to us as of the date hereof, and, except as otherwise required by law, we assume no obligation to update any forward-looking statement or other information contained herein to reflect new information, events or circumstances after the date hereof.
***
| 3 |
PCM, Inc. is a leading multi-vendor provider of technology solutions, including hardware products, software and services, offered through our dedicated sales force, ecommerce channels and technology services teams. Since our founding in 1987, we have served our customers by offering products and services from vendors such as Adobe, Apple, Cisco, Dell, Hewlett Packard Enterprise, HP Inc., Lenovo, Microsoft, Oracle, Symantec and VMware. We provide our customers with comprehensive solutions incorporating leading products and services across a variety of technology practices and platforms such as cloud, security, data center, networking, collaboration and mobility. Our sales and marketing efforts allow our vendor partners to reach multiple customer segments including small, medium and enterprise businesses, state, local and federal governments and educational institutions.
In recent years, we have completed several strategic acquisitions to increase the capabilities, scale and value we provide our customers and partners, as follows:
| ● | En Pointe: In April 2015, we acquired certain assets of En Pointe Technologies, one of the nation’s largest independent IT solutions providers, headquartered in Southern California. This acquisition has significantly enhanced our relationships with several key vendor partners, provided incremental advanced technical certifications and operational expertise in key practice areas, and has provided our consolidated business significantly increased scale, especially in the enterprise and public sector spaces. | |
| ● | Acrodex: In October 2015, we acquired Acrodex, Inc., an Edmonton, Alberta (Canada) based solution provider. Acrodex provides full end-to-end infrastructure solutions primarily to Canadian based commercial and governmental customers from initial plan and design, through procurement and installation, to full support and on-going management. Acrodex’s core business areas include software value-added reseller services, software asset management and hardware sales and services, including client device products, servers, storage, networks, printers and a full complement of accessories and devices. Services are a significant component to Acrodex’s product mix and include managed services, cloud-based services, consulting, IT management and other IT service areas. This acquisition enhances our ability to provide full solutions to customers across the United States and Canada. | |
| ● | TigerDirect: In December 2015, we acquired certain Business to Business (B2B) assets of Systemax’s North American Technology Group (NATG), including the TigerDirect brand, the right to hire approximately 400 B2B sales representatives located across the United States and Canada, all rights to the NATG B2B customer list, certain B2B customer and vendor contracts, trademarks and other intellectual property rights and certain fixed assets and equipment. We believe that this acquisition provided additional scale and opportunity to PCM in the SMB space. | |
| ● | Stratiform: In December 2016, we acquired Stratiform, Inc., a Calgary, Alberta (Canada) based provider of cloud IT solutions that includes consulting, professional, and managed services to clients across Canada. Stratiform, an innovative Gold Certified Microsoft Partner, expands our existing capabilities in Microsoft cloud technology, including Azure Cloud solutions, Office 365 and Enterprise Mobility Suite. | |
| ● | Stack Technology: In September 2017, PCM UK, our UK based subsidiary, completed the acquisition of Stack Technology, headquartered in Liverpool, United Kingdom, which specializes in the selection, implementation and management of leading IT solutions, with offerings encompassing all aspects of cloud-based solutions, security, virtualization, data services, unified communications, and infrastructure. | |
| ● | Provista Technology: In December 2017, PCM UK completed the acquisition of Provista Technology, which is highly regarded in its expertise across a range of technologies and manufacturers including Cisco, Avaya, Cisco Meraki, Huawei, Checkpoint, and other leading vendors, with offerings encompassing all aspects of Cloud Networking, Cloud Video, Hyperconvergence, Security, Collaboration, Secure Wireless and IP LAN, WAN & Data Center Networks. We believe this acquisition will further enhance PCM UK’s expertise and vendor accreditations in the United Kingdom as a Cisco Gold Partner, allowing PCM UK and its subsidiaries to offer further consultancy, integration and supply of services and solutions across the UK marketplace while replicating many existing offerings from our North American organization. | |
| ● | Epoch Universal: In January 2018, we completed the acquisition of certain assets of Epoch Universal, Inc., an end-to-end IT solutions provider that is highly regarded in its expertise across a wide range of solutions including Unified Collaboration, Networking and Security, Wireless, Data Center and Virtualization, Cloud and other advanced technologies. Epoch Universal employees hold advanced Cisco and VMware certifications enabling fully integrated enterprise solutions, including managed and professional services, to customers across the United States. |
| 4 |
In connection with our recent acquisitions and our resulting entrance into selling products, services and solutions in the Canadian and the United Kingdom (“UK”) markets, we formed two new operating segments called Canada and United Kingdom. Our Canada segment includes our operations related to these Canadian market activities, beginning as of the respective dates of the Acrodex and Tiger Direct acquisitions in 2015 and Stratiform in late 2016, as discussed above. Our United Kingdom segment includes the results of our subsidiary PCM UK, which serves as our hub for the UK and the rest of Europe. For more information about our segments, see below under “Segment Reporting Data.”
Investment in Non-Consolidated Affiliate
Based on various supplier diversity policies and requirements of certain customers whose contracts we acquired rights to in connection with the En Pointe transaction, beginning in the first quarter of 2017, our financial results do not consolidate the financial results of sales made under some customer contracts we purchased in the En Pointe acquisition, which are now held by a partner which qualifies for certification as a minority and women owned business in accordance with customer supplier diversity policies. We hold a 49% passive equity interest in this partner and we have accounted for our investment in this partner using the equity method of accounting beginning in the first quarter of 2017. We refer to this entity as the non-controlled entity or NCE. We record our results from our 49% equity interest in the NCE’s operations as “Equity income from unconsolidated affiliate” in our consolidated statement of operations.
Our Strategy
Expand Advanced Solutions Capabilities and Sales
Our Advanced Solutions strategy is focused on the creation and delivery of advanced solutions primarily in the following areas:
| ● | Cloud | |
| ● | Security | |
| ● | Data Center | |
| ● | Networking | |
| ● | Collaboration | |
| ● | Professional & Consulting Services | |
| ● | Managed Services |
Our customers are increasingly consuming technology in different and evolving ways. As a result, they are utilizing more complex solutions, including advanced technology hardware and software products, particularly related to cloud, security, data center, networking and collaboration. It is a key part of our strategy to tailor our offerings to leverage these market dynamics. We believe we have significant opportunities for growth and increased profitability by continuing to invest in, and enhance, our advanced solutions portfolio.
Our Advanced Solutions resources include pre-sales, engineering, and post sales delivery teams. To better support our customers and as a reflection of our focus on customer satisfaction, we have invested heavily in growing the number of certified engineers, technicians and project managers providing on-site and remote support to our clients. These professionals, who collectively hold thousands of technical certifications, support a wide variety of technology solutions and, along with our strong industry relationships with our key vendor partners, are augmented by a nationwide network of service providers, which act as our subcontractors to increase our reach into all of our geographical markets and allow us to deliver the most appropriate solutions for our customers. Our technology services, whether they are delivered by us or through our partners, complement our offerings and allow us to develop complete solutions to meet our customers’ needs. We intend to continue to invest in sales and technical competencies to drive advanced solutions-centric sales to our growing customer base. We have continued to add specializations with our top partners in an effort to better align us with their respective growth strategies.
Our Advanced Solutions strategy also focuses on providing services spanning the entire information technology life cycle, from the initial design to implementation and continuing management. These services include professional and consulting and managed services. Our professional and consulting services are used to design, deploy, implement and manage complex solutions surrounding our customers’ needs across their organizations. We leverage technology and expertise to solve our customers’ complex needs and to help them reduce their operational costs. We also provide managed services and support for the data center, network, and software applications that our customers use. We further provide our customers with multi-lingual 24x7x365 service desk support, and in the field, we perform break-fix maintenance support and staff augmentation services. We are focused on the creation and delivery of private, public and hybrid cloud solutions and remote systems monitoring and management through our own captive and our partners’ data centers.
| 5 |
We have invested heavily in our managed services capabilities in order to help customers with the assessment, migration, integration and managed services necessary to simplify the cloud adoption process. We offer cloud-based solutions by utilizing our three hybrid cloud data centers near Columbus, Ohio and Atlanta, Georgia, as well as a global network of partners. We maintain Network Operating Centers (NOCs) within each of our data centers to provide 24x7x365 monitoring and management of customers’ systems wherever they are located. We believe that the operation of our own data centers provides incremental value to our customers that is unmatched in our space.
We also have made significant investments to help our customers optimize their software environments and to better understand their needs, evaluate their existing assets and assist them with implementation and migration strategies. We offer our customers expertise in the following areas:
| ● | Local Support Staff | |
| ● | Licensing Expertise | |
| ● | Cloud Solutions Specialists | |
| ● | Microsoft Professional Services | |
| ● | Microsoft Contract Support | |
| ● | 24x7x365 Cloud Help Desk | |
| ● | Agreement Onboarding | |
| ● | Agreement Lifecycle Services | |
| ● | Strategic Funding Access | |
| ● | Market Intelligence | |
| ● | Cost Analysis & Licensing Assessments | |
| ● | Cloud Envisioning Sessions | |
| ● | Software Asset Management |
We believe our strategic focus in advanced solutions expands and enhances our capabilities to service our customers’ needs and drives conversations regarding all of our technology solution offerings. We intend to leverage our existing resources, continue to train our sales account executives and provide a high level of support to our customers.
Increase Our Core Sales of End Point Solutions
Our End Point Solutions strategy is focused on the delivery of solutions in the following areas:
| ● | Mobility | |
| ● | Desktop | |
| ● | Digital Signage | |
| ● | POS | |
| ● | ||
| ● | Field & Lifecycle Services |
We maintain pre-sales, engineering and post sales delivery resources focused on driving sales in the core end point technologies that customers demand. By leveraging our inside and field sales teams across the United States and Canada, and our e-Commerce and logistics capabilities, we are able to more effectively and efficiently tailor unique offerings to our diverse customer base. We seek to drive growth through our efforts to expand our relationships with our existing customers as well as by seeking new customers through targeted account acquisition efforts. We are expanding our sales reach across the United States by adding account executives to our inside and field sales teams in an effort to achieve enhanced market penetration.
We place significant strategic emphasis on increasing the productivity and tenure of our sales force by enhancing our training and tools, optimizing our technical pre-sales resources and other support functions, expanding our reach into higher value customer opportunities and realigning our commercial account executives and corporate and enterprise accounts under a more unified brand and go to market strategy. Through these efforts we intend to better equip our account executives to evaluate, understand and deliver profitable technology solutions that address our customers’ technology needs with a superior customer experience in a changing technology environment.
| 6 |
Leverage our Strong Partnerships with Key Vendors
We believe it is important to leverage our strong relationships with key OEM and publisher vendor partners such as Adobe, Apple, Cisco, Dell, Hewlett Packard Enterprise, HP Inc., Lenovo, Microsoft, Oracle, Samsung, Symantec and VMware and other key partners on a company-wide basis. We believe our long-standing relationships with our key vendor partners give us increased visibility and legitimacy in the minds of our customers and provide us key insights related to new and existing technology solutions, roadmaps for such offerings and other critical industry dynamics. These insights help to ensure that our sales and marketing organizations are knowledgeable and well positioned to profitably understand, market, sell and deliver these technologies to our customers, allowing us to meet our customers’ evolving and increasingly complex technology needs.
We also intend to continue to invest in and enhance our training programs, our compensation plans and our marketing activities related to each of our key vendor partners. These investments and enhancements are central to our strategic efforts intended to add additional value to these partners by maintaining and enhancing our ability to efficiently and effectively market, sell, deliver and incorporate their products and services into our comprehensive solutions with a high degree of customization.
Identify and Drive Further Operational Efficiencies
We utilize a centralized infrastructure for our back-office capabilities. In order to free our sales and marketing organizations to increase their focus on our existing and prospective customers, we maintain centralized IT, finance, human resources, and other support functions. We believe that leveraging a centralized model for these critical back-office functions drives a more efficient overall cost structure and allows us to more cost effectively introduce new tools to our sales and marketing organizations. As an additional part of our strategy to drive cost advantages and operational efficiencies, we also have located a significant number of personnel related to these functions internationally and intend to continue with this strategy. As an additional key part of our strategy to identify and drive operational efficiencies, we are currently upgrading many of our disparate IT systems to SAP. We believe the implementation and upgrade should help us to gain further efficiencies across our organization.
Selectively Pursue and Integrate Strategic Acquisitions
One element of our business strategy involves the potential expansion through opportunistic acquisitions of businesses, assets, personnel or technologies that allow us to complement our existing operations and expand our market coverage or add new business capabilities. The technology solutions industry has undergone significant consolidation and change over the past 15-20 years and while we believe that the fragmented nature of the industry, industry consolidation trends, and accelerated rate of change in the industry may continue to present acquisition opportunities for us, these trends may also make acquisitions more competitive.
We continually evaluate and explore strategic opportunities as they arise, including business combination transactions, strategic partnerships and the purchase or sale of assets. We may choose to pursue acquisitions for several reasons. For instance, we may pursue acquisitions that will broaden our technology solutions’ capabilities, enable us to further penetrate or enter new geographies we deem attractive, expand or enhance vendor relationships or provide increased economies of scale. We evaluate acquisition opportunities based on our assessment of several factors, including the perceived value of the opportunity, our available financing sources, potential synergies of the acquisition target with our business and the opportunity costs of any such investment. The implementation of our acquisition strategy depends on the availability of suitable acquisition candidates at reasonable prices and our ability to resolve challenges associated with integrating acquired businesses into our existing business.
Our ability to complete acquisitions in the future will depend on our ability to fund such acquisitions with our internally available cash, cash generated from operations, amounts available under our existing credit facilities, additional borrowings or from the issuance of additional securities.
Expand International Capabilities
Many of our commercial enterprise customers continue to increase their international technology fulfillment needs related to many of the technology solutions we sell. Historically, our business has been focused on the United States and more recently has expanded across Canada and the UK. In order meet our customers’ international needs, we also have recently made investments to establish our ability to provide technology solutions to some countries throughout the world beyond the United States, Canada and the UK. Expanding these capabilities will continue to be a key strategic focus in the near term.
| 7 |
Our Sales and Marketing Approach
Sales Activities. Our account executives handle a variety of customer needs, including, assessment and support for complex technology solutions, operations and procurement processes, ongoing customer service and other value-added services. They are responsible for assisting customers in purchasing decisions, answering product pricing and availability questions and processing product orders, but more importantly, for proactively reaching out to existing and prospective clients to assess opportunities to sell them value-added technology services and solutions. Our account executives profile accounts, identify and build relationships with key decision makers and influencers within their account base and are responsible for growing the depth of hardware products, software and service offerings we sell to our customers. Account executives have the authority to vary prices within specified parameters in order to be competitive. Our account executives also utilize a support team which is focused on non-selling administrative support activities, leaving our account executives incremental time to sell and prospect. We further support our account executives with systems used for order entry, customer tracking and relationship management, product availability and fulfillment schedules and which support their ability to sell across multiple product categories.
We believe that the success of our account executives is substantially dependent on the quality of our recruiting and training programs. Upon hiring, our account executives undergo an initial sales training program focusing on the use of our systems, technology solutions, including hardware products, software and service offerings, sales techniques and customer service. To ensure that they are able to effectively sell all of our offerings, account executives attend regular training sessions to stay up-to-date on new technologies. Account executives are also supported by pre-sales personnel who assist them with technology specific questions and solutions support. We also require the account executives to acquire certain sales technical certifications for key technologies to ensure they are credible and competent in selling complex services and solutions.
We frequently enhance our tools that are used to support our sales activities. Generally, these tools enable our account executives and sales managers to utilize a number of metrics and analytics from which incremental opportunities can be identified within specific customer accounts or an account executive’s entire book of business. These capabilities provide a solid foundation from which our account executives can expand their customer account penetration and drive incremental revenue and profitability.
Marketing Activities. We design our marketing programs to attract new customers and to stimulate additional purchases by existing customers. Our marketing programs are tailored for the specific needs of our various customer segments and within the end point and advanced solutions businesses. We utilize sophisticated analytic tools designed to manage marketing campaigns using different media channels and to optimize campaigns through advanced data mining techniques. The analytic tools combine optimization techniques with multiple models to more effectively match offers to individuals and businesses in an effort to provide the most profitable results.
Vendor Supported Marketing. We provide vendor supported custom marketing campaigns that may include outbound call campaigns, customer webinars and events, lead campaigns, email marketing, promotional offers, the sale of advertising space in our catalogs and on our websites and trade-in and trade-up programs. We also work collaboratively with our vendor partners and use vendor funding to help offset portions of the costs of marketing promotions, direct mail offers, customer trainings and events and e-marketing or sales incentives. These marketing activities are based on market opportunity and vendors’ strategies. We also develop marketing campaigns designed to maximize product sales and we receive additional funds from our vendors in the form of volume incentive rebates and other programs.
Online Marketing. eCommerce marketing programs and capabilities, such as affiliate marketing, search engine optimization, email and search engine marketing, are essential components of our customer acquisition and retention strategy. We operate several websites, including pcm.com, pcmg.com, macmall.com, tigerdirect.com, tigerdirect.ca, pcmcanada.com, stratiform.com and abreon.com. Our websites offer features such as online ordering, access to inventory availability and a large product selection with detailed product information. We also maintain and operate commercial, customized extranets to provide businesses and their employees with an online purchasing channel with custom catalogs, pricing, security, asset management and workflow configurable to our customers’ needs. These extranet sites are designed to enhance sales productivity by allowing customers to perform routine tasks online, freeing our associated account executive’s time for other tasks.
Other Direct Marketing. We selectively mail catalogs to existing and prospective customers, utilize online advertising methodologies and, to a limited extent, advertise in certain major magazines, radio and local television programs. We also send direct marketing mailers to selected target audiences to drive sales to new and existing customers. We create our marketing materials in-house with our own design team and production artists. We believe the in-house preparation of catalogs, advertisements, and promotional materials streamlines the production process, provides greater flexibility and creativity in catalog production and results in significant cost savings over outside production.
Products and Merchandising
We screen and select new products and vendors based on evolving customer technology solution needs, the expected market opportunity and related technology adoption trends within our targeted customer markets. We also consider product attributes like features, quality, sales trends, price, margins, market development funds and vendor warranties.
| 8 |
Through our large sales force and frequent emails, website updates and catalog mailings, we believe we are able to quickly introduce new products and replace slower selling products. We also use various marketing materials, web training and local events to educate our customers on solutions and more complex technologies and to provide other content to describe technology applications and how they will benefit the customer. Through these materials and activities, we showcase the full breadth of the products and solutions we sell in an effort to provide our customers with a single source for all their technology needs.
The following table sets forth our net billed sales by major categories as a percentage of total net billed sales for the periods presented, determined based upon our internal product code classifications.
| Years Ended December 31, | ||||||||||||
| 2017 | 2016 | 2015 | ||||||||||
| Software (1) | 27.5 | % | 27.6 | % | 28.4 | % | ||||||
| Notebooks & Tablets | 19.8 | 18.9 | 18.1 | |||||||||
| Desktops | 7.4 | 7.4 | 7.6 | |||||||||
| Delivered services | 7.3 | 6.4 | 7.4 | |||||||||
| Networking | 6.5 | 7.2 | 7.5 | |||||||||
| Manufacturer service and warranty (1) | 5.7 | 6.5 | 6.6 | |||||||||
| Displays | 4.4 | 4.4 | 4.2 | |||||||||
| Accessories | 3.7 | 3.7 | 3.0 | |||||||||
| Storage | 3.3 | 3.9 | 3.9 | |||||||||
| Servers | 2.7 | 2.3 | 3.3 | |||||||||
| Printers | 2.3 | 2.5 | 1.5 | |||||||||
| Input devices | 1.8 | 2.0 | 2.7 | |||||||||
| Other (2) | 7.6 | 7.2 | 5.8 | |||||||||
| Total | 100.0 | % | 100.0 | % | 100.0 | % | ||||||
| (1) | Software, including software licenses, maintenance and enterprise agreements, and manufacturer service and warranties are shown, for purposes of this table, on a gross sales billed to customers basis, net of returns and do not reflect the net down impact related to revenue recognition for sales of such products. |
| (2) | All other includes power, supplies, consumer electronics, memory, iPod/MP3 and miscellaneous other items. |
Purchasing and Inventory
Effective purchasing is a key element of our strategy to provide technology products and solutions at competitive prices. We believe that our high volume of sales results in increased purchasing power with our primary suppliers, resulting in volume discounts, favorable product return and price protection policies and certain other vendor consideration. A substantial portion of our business is dependent on sales of Cisco, HP Inc., Microsoft and products purchased from other vendors including Apple, Dell, Hewlett Packard Enterprise, Ingram Micro, Lenovo, Synnex and Tech Data. Our top sales of products by manufacturer as a percent of our gross billed sales were as follows for the periods presented:
| Years Ended December 31, | ||||||||||||
| 2017 | 2016 | 2015 | ||||||||||
| Microsoft | 15 | % | 15 | % | 14 | % | ||||||
| HP Inc. | 10 | 10 | 11 | |||||||||
We are also linked electronically with approximately 30 distributors and manufacturers, which allows our account executives to view applicable product availability online and drop-ship those products directly to customers. These arrangements allow us to reduce inventory carrying costs, achieve higher order fill rates and improve inventory turns.
Many of our vendor partners provide us with volume incentive rebates and market development funds to assist in the active marketing and sales of their products. Such funds help offset portions of the costs incurred to market their products. As is customary in our industry, we have no long-term supply contracts with any of our vendors. Substantially all of our contracts with our vendors are terminable upon 30 days’ notice or less.
We attempt to manage our inventory to optimize order fill rate and customer satisfaction, while limiting inventory risk. Inventory levels may vary from period to period, due in part to increases or decreases in sales levels, our practice of making large-volume purchases when we deem the terms of such purchases to be attractive and the addition of new manufacturers and products. We have negotiated agreements with many of our vendors that contain price protection provisions intended to reduce our risk of loss due to manufacturer price reductions; however, rights vary by product line, have conditions and limitations and generally can be terminated or changed at any time.
| 9 |
The market for technology solutions is characterized by rapid technological change and growing diversity. We believe that our success depends in large part on our ability to identify and obtain the right to market hardware products, software and services that meet the changing requirements of the marketplace and to obtain sufficient quantities to meet changing demands. There can be no assurance that we will be able to identify and offer technology solutions necessary to remain competitive or avoid losses related to excess or obsolete inventory.
Backlog
Our backlog generally represents open, cancelable orders and may vary significantly from period to period. We do not believe that backlog is useful for predicting our future sales.
Distribution
We have historically directly operated a full-service 212,000 square feet distribution center in Memphis, Tennessee, an 84,640 square feet warehouse facility in Columbus, Ohio, which includes a 20,000 square feet configuration center, and a 20,254 square feet warehouse facility in Irvine, California. The Memphis warehouse has been our primary distribution center, strategically located near the FedEx main hub in Memphis, while our Columbus and Irvine warehouses have primarily functioned as custom configuration and distribution centers for our commercial customers. With the evolution of our business, in mid-2015 we evaluated our Memphis operation and considered the alternative of more heavily relying on the effective and vast network of our electronically connected distributors and vendor partners. Based on this evaluation, we made the decision to leverage the logistics and configuration services of our distributors and vendor partners and our sophisticated configuration center in Columbus, Ohio in replacement of our historic warehousing and distribution operations of our directly operated Memphis facility. Also, in mid-2016, we added an approximately 63,000 square feet facility, which includes a 5,000 square feet configuration center, in Worthington, Ohio to support reverse logistics activities and provide additional bandwidth to support logistics and fulfillment needs. In 2017, we added an additional approximately 63,000 square feet of space to the Worthington, Ohio facility such that we now have approximately 126,000 total square feet in that facility. We expect this approach to improve our operating efficiency while maintaining appropriate warehousing and distribution service levels to our customers. We believe that our warehousing and distribution facilities and relationships are adequate for our current and foreseeable future needs.
Our warehouse and distributor partners also provide us with electronic purchasing and drop shipping systems for products that we do not maintain in stock in our directly owned inventory. Approximately 30 distributors and manufacturers are linked to us electronically to provide inventory availability and pricing information. We transmit orders electronically for immediate shipment via an electronic interchange to the selected distributor after considering inventory availability, service level, price and location. This capability has historically allowed us to ship a high percentage of orders on the same day that they are received and we expect to continue to leverage these capabilities.
Management Information and Communication Systems
We have committed significant resources to the development of sophisticated computer systems that are used to manage our business. Our computer systems support phone and web-based sales, marketing, purchasing, accounting, customer service, warehousing and distribution, and facilitate the preparation of daily operating control reports which are designed to provide concise and timely information regarding key aspects of our business. The systems allow us to, among other things, monitor sales trends, make informed purchasing decisions, and provide product availability and order status information. In addition to the main computer systems, we have systems of networked computers across all of our locations. We also use our management information systems to manage our inventory. We believe that in order to remain competitive, we will need to upgrade our management information systems on a regular basis, which could require significant capital expenditures.
Our success is dependent on the accuracy and proper utilization of our management information systems and our communications systems. In addition to the costs associated with system upgrades, the transition to and implementation of new or upgraded solutions can result in system delays or failures. We currently operate one of our management information systems using an HP3000 Enterprise System, which was supported by HP until December 2010. We currently contract with a third party service provider specializing in maintenance and support of this system to provide us adequate support until we finalize the upgrade of this system to SAP, which is more fully described in Part II, Item 7 of this report under “ERP Upgrades.” Any interruption, corruption, degradation or failure of our management information systems or communications systems could adversely impact our ability to receive and process customer orders on a timely basis.
Many of our systems are located in our data centers in El Segundo, California, Columbus, Ohio and Atlanta, Georgia. These data centers now provide geographic redundancy for certain critical systems.
| 10 |
Competition
The business of selling information technology hardware products, software and services is highly competitive. We compete with a variety of companies that can be divided into several broad categories:
| ● | other technology solution providers and direct marketers, including CDW, Insight Enterprises, Presidio and Connection; | |
| ● | large value added resellers such as CompuCom Systems, Pomeroy IT Solutions and World Wide Technology; | |
| ● | government resellers such as CDWG and GovConnection; | |
| ● | computer retail stores and resellers, including superstores such as Best Buy, Office Depot and Staples; | |
| ● | hardware and software vendors such as Apple, Hewlett Packard Enterprise, HP Inc. and Dell that sell or are increasing sales directly to end users; | |
| ● | online resellers, such as Amazon.com; | |
| ● | software focused resellers such as Soft Choice and SHI; and | |
| ● | other direct marketers and value added resellers of information technology hardware products, software and services, such as Amazon Business and Web Services, and Google Business Services, among others. |
Barriers to entry are relatively low in the direct marketing industry, and the risk of new competitors entering the market is high.
Competition in our market is based on various factors, including but not limited to, price, product selection, quality and availability, ease of doing business, customer service, and brand recognition.
The manner in which technology solutions are distributed and sold is continually changing, and new methods of sales and distribution have emerged. Information technology resellers are consolidating operations and acquiring or merging with other resellers to achieve economies of scale and increased efficiency. Our largest manufacturers have sold, and continue to sell, their products directly to customers. To the extent additional manufacturers adopt this selling format, it could adversely affect our sales and profitability. In addition, traditional retailers have entered and may increase their penetration into direct marketing and the commercial market. Industry reconfiguration and consolidation could cause the industry to become even more competitive, further increase pricing pressures and make it more difficult for us to maintain our operating margins or to increase or maintain the same level of net sales or gross profit.
Although many of our competitors have greater financial resources than we do, we believe that our ability to offer our customers a wide selection of technology solutions, at competitive prices, with prompt delivery and a high level of customer satisfaction, together with good relationships with our vendors and suppliers, allows us to compete effectively. We compete not only for customers, but also for favorable product allocations and cooperative advertising support from our vendor partners. Some of our competitors could enter into exclusive distribution arrangements with our vendors and deny us access to their products and solutions, devote greater resources to marketing and promotional campaigns and devote substantially more resources to their websites and systems development than we can. New technologies and the continued enhancement of existing technologies also may increase competitive pressures on us. An increase in competition could require us to adopt competitive pricing or advertising strategies that may have an adverse effect on our operating results. There can be no assurance that we can continue to compete effectively against existing or new competitors that may enter the market.
Intellectual Property
We rely on a combination of laws and contractual restrictions with our employees, customers, suppliers, affiliates and others to establish and protect our proprietary rights. Despite these precautions, it is possible that third parties may copy or otherwise obtain and use our intellectual property, including using our trademarks or domain names, without authorization. Although we regularly assert our intellectual property rights when we learn that they are being infringed, these claims can be time-consuming and may require litigation and administrative proceedings to be successful. We have numerous trademarks and service marks that we consider to be material to the successful operation of our business. We have registrations in the United States and in numerous foreign jurisdictions.
Third parties have asserted, and may in the future assert, that our business methods or the technologies we use infringe their intellectual property rights. We may be subject to intellectual property claims and legal proceedings in the ordinary course of our business. If we are forced to defend against any third-party infringement claims, we could face expensive and time-consuming litigation and be required to pay monetary damages, which could include treble damages and attorneys’ fees for any infringement that is found to be willful, and either be enjoined or required to pay ongoing royalties with respect to any business methods or technologies that are found to be infringing. Further, as a result of infringement claims either against us or against those who license technology to us, we may be required, or deem it advisable, to develop non-infringing business methods or technology, which could be costly and time-consuming, or enter into costly royalty or licensing agreements.
Third parties have in the past, and may in the future, hire employees who have had access to our proprietary technologies, processes and operations. This exposes us to the risk that former employees will misappropriate our intellectual property.
| 11 |
Litigation may be necessary in the future to enforce our intellectual property rights, to protect our trade secrets or to determine the validity and scope of the proprietary rights of others. Any litigation, regardless of outcome or merit, could result in substantial costs and diversion of management and technical resources, which could materially harm our business.
Segment Reporting Data
Operating segment and principal geographic area data for 2017, 2016 and 2015 are summarized in Note 14 of the Notes to the Consolidated Financial Statements in Part II, Item 8 of this report, which is incorporated herein by reference.
In connection with our entrance into the UK market in the first quarter of 2017, we formed a new operating segment called United Kingdom. In February 2016, we transitioned out nearly the entire management overhead of our MacMall business, thinned out its cost structure and brought it under the management and supervision of our Commercial segment. Also, in connection with our acquisitions of Acrodex and certain assets of Systemax’s North American Technology Group in the fourth quarter of 2015 and our resulting entrance into selling technology solutions in the Canadian market, we formed a new operating segment called Canada, which includes our operations related to these Canadian market activities, beginning as of the respective dates of these acquisitions. As a result, we currently operate in four reportable segments: Commercial, Public Sector, Canada and United Kingdom. Our reportable operating segments are primarily aligned based upon our reporting of results as used by our chief operating decision maker in evaluating the operating results and performance of our company. We include corporate related expenses such as legal, accounting, information technology, product management and other administrative costs that are not otherwise included in our reportable operating segments in Corporate & Other.
Employees
At December 31, 2017, we had 4,073 full-time and 89 part-time employees, consisting of 2,315 in the United States, 1,005 in the Philippines, 713 in Canada and 129 in the United Kingdom. We emphasize recruiting and training high-quality personnel and, to the extent practical, promote people to positions of increased responsibility from within the company. Many employees initially receive training appropriate for their position, followed by varying levels of training in computer technology, communication and leadership. New account executives participate in an intensive sales training program, during which time they are introduced to our business ethics and philosophy, available resources, products and services, as well as basic and advanced sales skills. Training for specific product lines and continuing education programs are conducted on a regular basis, supplemented by vendor-sponsored training programs for account executives and technical support personnel.
We consider our employee relations to be good. None of our employees is represented by a labor union, and we have experienced no work stoppages.
Regulatory and Legal Matters
Our businesses are subject to various regulatory and legal requirements, such as the Mail or Telephone Order Merchandise Rule and other related regulations promulgated by the Federal Trade Commission and other laws and regulations applicable to commerce on the Internet and laws and regulations of the federal government related to our procurement of products and services and our sales to the government. These laws and regulations may cover taxation of eCommerce, user privacy, marketing and promotional practices (including electronic communications with our customers and potential customers), database protection, pricing, content, copyrights, distribution, electronic contracts and other communications, consumer protection, product safety, the provision of online payment services, copyrights, patents and other intellectual property rights, data security, unauthorized access (including the Computer Fraud and Abuse Act), and the characteristics and quality of products and services.
While we believe we are currently in compliance with such laws and regulations and have sought to implement processes, programs and systems in an effort to achieve compliance with existing laws and regulations applicable to our businesses, many of these laws and regulations are unclear and have yet to be interpreted by courts, or may be subject to conflicting interpretations by courts. No assurances can be given that new laws or regulations will not be enacted or adopted, or that our processes, programs and systems will be sufficient to comply with present or future laws or regulations, which might adversely affect our operations. Moreover, changing technologies and the growth and evolution of Internet commerce has and may continue to prompt calls for more stringent consumer protection, privacy and data protection laws that, if enacted, could impose additional restrictions or burdens on us and other companies.
| 12 |
Based upon current law, some of our affiliated companies currently collect and remit sales and use tax only on sales of products or services to residents of the states in which they have a physical presence or have voluntarily registered. Various state taxing authorities have sought to impose on companies with no physical presence in the taxing state the burden of collecting state sales and use taxes on the sale of products or services shipped or sold to those states’ residents, and it is possible that such a requirement could be imposed in the future. In addition, a number of bills may be introduced or are pending before federal and state legislatures that would potentially expand our tax collection or reporting responsibility. Until these legislative efforts have run their course and the courts have considered and resolved some cases involving these tax collection and reporting issues, there can be no assurance that future laws or interpretations of existing laws imposing taxes or other regulations on direct marketing or Internet commerce would not substantially impair our growth or otherwise have a material adverse effect on our business, results of operations and financial condition.
In addition, we and our subsidiaries may be subject to state or local taxes on income or (in states such as Kentucky, Michigan, Ohio, Texas, Washington or the District of Columbia) on gross receipts or a similar measure earned in a state even though we and our subsidiaries may have no physical presence in the state. State and local governments may seek to impose such taxes in cases where they believe the taxpayer may have a significant economic presence by reason of significant sales to customers located in the states. The responsibility to pay income and gross receipts taxes has also been the subject of court actions and various legislative efforts. There can be no assurance that these taxes will not be imposed upon us and our subsidiaries.
Available Information
Our corporate website address is www.pcm.com. We are subject to the informational requirements of Section 13(a) or 15(d) of the Securities Exchange Act of 1934 and file or furnish reports, proxy statements, and other information with the Securities and Exchange Commission (“SEC”). We make our annual reports on Form 10-K, our quarterly reports on Form 10-Q, our current reports on Form 8-K and all amendments to these reports, if any, available free of charge on our corporate website as soon as reasonably practicable after such reports are electronically filed with, or furnished to, the SEC. We have also adopted a code of conduct and ethics that applies to our directors, officers and employees which is available on our website. The information contained on our website is not part of this report or incorporated by reference herein.
***
| 13 |
This report and other documents we file with the Securities and Exchange Commission contain forward looking statements that are based on current expectations, estimates, forecasts and projections about us, our future performance, our business, our beliefs and our management’s assumptions. These statements are not guarantees of future performance and involve certain risks, uncertainties, and assumptions that are difficult to predict. You should carefully consider the risks and uncertainties facing our business which are set forth below. The risks described below are not the only ones facing us. Our business is also subject to risks that affect many other companies, such as employment relations, general economic conditions, geopolitical events and international operations. Further, additional risks not currently known to us or that we currently believe are immaterial also may impair our business, operations, liquidity and stock price materially and adversely.
Our success is in part dependent on the accuracy and proper utilization of our management information and communications systems.
We have committed significant resources to the development of sophisticated systems that are used to manage our business. Our systems support phone and web-based sales, marketing, purchasing, accounting, customer service, warehousing and distribution, and facilitate the preparation of daily operating control reports which are designed to provide concise and timely information regarding key aspects of our business. The systems allow us to, among other things, monitor sales trends, make informed purchasing decisions, and provide product availability and order status information. In addition to the main computer systems, we have systems of networked computers across all of our locations. We also use our management information systems to manage our inventory. We believe that in order to remain competitive, we will need to upgrade our management information and communications systems on a regular basis, which could require significant capital expenditures.
Our success is dependent on the accuracy and proper utilization of our management information systems and our communications systems. In addition to the costs associated with system upgrades, the transition to and implementation of new or upgraded solutions can result in system delays or failures. We currently operate one of our management information systems using an HP3000 Enterprise System, which was supported by HP until December 2010. We currently contract with a third party service provider specializing in maintenance and support of this system to provide us adequate support until we finalize the upgrade of this system to the SAP platform historically utilized by the En Pointe business. Any interruption, corruption, degradation or failure of our management information systems or communications systems could adversely impact our ability to receive and process customer orders on a timely basis.
In addition to our systems upgrades that are currently being implemented, we also regularly upgrade our systems in an effort to better meet the information requirements of our users, and believe that to remain competitive, it will be necessary for us to upgrade these systems on a regular basis in the future. The implementation of any upgrades is complex, in part, because of the wide range of processes and the multiple systems that may need to be integrated across our business.
In connection with any system upgrades, we generally create a project plan to provide a reasonable allocation of resources to the project; however, execution of any such plan, or a divergence from it, may result in cost overruns, project delays or business interruptions. Furthermore, any divergence from any such project plan could affect the timing or the extent of benefits we may expect to achieve from the system or any process efficiencies. Any such project delays, business interruptions or loss of expected benefits could have a material adverse effect on our business, financial condition or results of operations.
Any disruptions, delays or deficiencies in the design, operation or implementation of our various systems, or in the performance of our systems, particularly any disruptions, delays or deficiencies that impact our operations, could adversely affect our ability to effectively run and manage our business, including our ability to receive, process, ship and bill for orders in a timely manner or our ability to properly manage our inventory or accurately present our inventory availability or pricing. We do not currently have a redundant or back-up telephone system, nor do we have complete redundancy for our management information systems. Any interruption, corruption, deficiency or delay in our management information systems, including those caused by natural disasters, could have a material adverse effect on our business, financial condition or results of operations.
| 14 |
Changes and uncertainties in the economic climate could negatively affect the rate of information technology spending by our customers, which would likely have an impact on our business.
As a result of the ongoing economic uncertainties, the direction and relative strength of the U.S. and Canadian economies remain a considerable risk to our business, operating results and financial condition. This economic uncertainty could also increase the risk of uncollectible accounts receivable from our customers. During previous economic downturns in the U.S., Canada, the UK and elsewhere, customers generally reduced, often substantially, their rate of information technology spending. Additionally, economic conditions and the level of consumer confidence has limited technology spending. Future changes and uncertainties in the economic climate in the U.S., Canada, the UK and elsewhere could have a similar negative impact on the rate of information technology spending of our current and potential customers, which would likely have a negative impact on our business, operating results and financial condition, and could significantly hinder our growth and prevent us from achieving our financial performance goals.
Our earnings and growth rate could be adversely affected by negative changes in economic or geopolitical conditions.
We are subject to risks arising from adverse changes in domestic and global economic conditions and unstable geopolitical conditions. If economic growth in the United States, Canada, the UK or other countries slows or declines, current and prospective customer spending rates could be significantly reduced. This could result in reductions in sales of our products, longer sales and payment cycles, slower adoption of new technologies and increased price competition, any of which could materially and adversely affect our business, results of operations and financial condition. Weak general economic conditions or uncertainties in geopolitical conditions could adversely impact our revenue, expenses and growth rate. In addition, our revenue, margins and earnings could deteriorate in the future as a result of unfavorable economic or geopolitical conditions.
Our revenue is dependent on sales of products from a small number of key manufacturers, and a decline in sales of products from these manufacturers could materially harm our business.
Our revenue is dependent on sales of products from a small number of key manufacturers and software publishers, including Adobe, Apple, Cisco, Dell, Hewlett Packard Enterprise, HP Inc., Lenovo, Microsoft, Oracle, Samsung, Symantec and VMware. For example, products manufactured by Microsoft represented approximately 15% of our net sales in each of the years ended December 31, 2017 and 2016 and products manufactured by HP Inc. represented approximately 10% of our net sales in each of the years ended December 31, 2017 and 2016. A decline in sales of any of our key manufacturers’ products, whether due to decreases in supply of or demand for their products, termination of any of our agreements with them, or otherwise, could have a material adverse impact on our sales and operating results.
Certain of our vendors provide us with incentives and other assistance that reduce our operating costs, and any decline in these incentives and other assistance could materially harm our operating results.
Certain of our vendors, including OEMs, software publishers and distribution partners, provide us with trade credit or substantial incentives in the form of discounts, credits and cooperative advertising. We have agreements with many of our vendors under which they provide us, or they have otherwise consistently provided us, with market development funds to finance portions of our advertising, marketing and distribution costs based upon the amount of coverage we give to their respective products in our catalogs or other advertising and marketing mediums. Any termination or interruption of our relationships with one or more of these vendors, or modification of the terms or discontinuance of our agreements and market development fund programs and arrangements with these vendors, could adversely affect our operating income and cash flow. For example, the amount of vendor consideration we receive from a particular vendor may be impacted by a number of events outside of our control, including acquisitions, divestitures, management changes or economic pressures affecting such vendor, any of which could materially affect the amount of vendor consideration we receive from such vendor.
We do not have long-term supply agreements or guaranteed price or delivery arrangements with our vendors.
In most cases we have no guaranteed price or delivery arrangements with our vendors. As a result, we have experienced and may in the future experience inventory shortages on certain products. Furthermore, our industry occasionally experiences significant product supply shortages and customer order backlogs due to the inability of certain manufacturers to supply certain products as needed. We cannot assure you that suppliers will maintain an adequate supply of products to fulfill our orders on a timely basis, or at all, or that we will be able to obtain particular products on favorable terms or at all. Additionally, we cannot assure you that product lines currently offered by suppliers will continue to be available to us. A decline in the supply or continued availability of the products of our vendors, or a significant increase in the price of those products, could reduce our sales and negatively affect our operating results.
| 15 |
Substantially all of our agreements with vendors are terminable within 30 days.
Substantially all of our vendor agreements are terminable upon 30 days’ notice or less. Vendors that currently sell their products or services through us could decide to sell, or increase their sales of, their products or services directly or through other resellers or channels. Any termination, interruption or adverse modification of our relationship with a key vendor or a significant number of other vendors would likely adversely affect our operating income, cash flow and future prospects.
Our success is dependent in part upon the ability of our vendors to develop and market products that meet changes in market demand, as well as our ability to sell popular products from new vendors.
The products and services we sell are generally subject to rapid technological change and related changes in marketplace demand. Our success is dependent in part upon the ability of our vendors to develop and market products and services that meet these changes in market demand. Our success is also dependent on our ability to develop relationships with and sell products and services from new vendors that address these changes in market demand. To the extent products that address changes in marketplace demand are not available to us, or are not available to us in sufficient quantities or on acceptable terms, we could encounter increased price and other competition, which would likely adversely affect our business, financial condition and results of operations.
We may not be able to maintain existing vendor relationships or preferred provider status with our vendors, which may affect our ability to offer a broad selection of products at competitive prices and negatively impact our results of operations.
We purchase products and services for resale both directly from manufacturers and software publishers and indirectly through distributors and other sources, all of whom we consider our vendors. We also maintain certain qualifications and preferred provider status with several of our vendors, which provides us with preferred pricing, vendor training and support, preferred access to products and services, and other significant benefits. In many cases, vendors require us to meet certain minimum standards in order to retain these qualifications and preferred provider status. If we do not maintain our existing relationships or preferred provider certifications or authorizations, or if we fail to build new relationships with vendors on acceptable terms, including favorable pricing, vendor consideration or reseller qualifications, we may not be able to offer a broad selection of products and services or continue to offer products and services from these vendors at competitive prices or at all. From time to time, vendors may be acquired by other companies, terminate our right to sell some or all of their products, modify or terminate our preferred provider or qualification status, change the applicable terms and conditions of sale or reduce or discontinue the incentives or vendor consideration that they offer us. For example, one of our major vendors adopted heightened sales growth and dedicated sales personnel standards for its preferred provider designation. Our failure to meet these heightened standards could cause us to lose preferred provider status with the vendor. Any termination of our preferred provider status with any of our major vendors, or our failure to build new vendor relationships, could have a negative impact on our operating results. Additionally, some products are subject to manufacturer, publisher or distributor allocation, which limits the number of units of those products that are available to us and may adversely affect our operating results.
Part of our business strategy includes the opportunistic acquisition of other companies, and we may have difficulties integrating acquired companies into our operations in a cost-effective manner, if at all.
One element of our business strategy involves the potential expansion through opportunistic acquisitions of businesses, assets, personnel or technologies that allow us to complement our existing operations, expand our market coverage, enter new geographic markets, or add new business capabilities. We continually evaluate and explore strategic opportunities as they arise, including business combination transactions, strategic partnerships, and the purchase or sale of assets. Our acquisition strategy depends on the availability of suitable acquisition candidates at reasonable prices and our ability to resolve challenges associated with integrating acquired businesses into our existing business. Since 2015, we completed four strategic acquisitions and are focused on integrating these acquisitions into our operations. No assurance can be given that the benefits or synergies we may expect from acquisitions will be realized to the extent or in the time frame we anticipate. We may lose key employees, customers, distributors, vendors and other business partners of the companies we acquire after announcement of acquisition plans. In addition, acquisitions may involve a number of risks and difficulties, including expansion into new geographic markets and business areas in which our management has limited prior experience, the diversion of management’s attention to the operations and personnel of the acquired company, the integration of the acquired company’s personnel, operations and management information (ERP) systems, changing relationships with customers, suppliers and strategic partners, differing regulatory requirements in new geographic markets and new business areas, and potential short-term adverse effects on our operating results. These challenges can be magnified as the size of the acquisition increases. Any delays or unexpected costs incurred in connection with the integration of acquired companies or otherwise related to acquisitions could have a material adverse effect on our business, financial condition and results of operations.
| 16 |
Acquisitions may require large one-time charges and can result in increased debt or other contingent liabilities, adverse tax consequences, deferred compensation charges, the recording and later amortization of amounts related to deferred compensation and certain purchased intangible assets, and the refinement or revision of fair value acquisition estimates following the completion of acquisitions, any of which items could negatively impact our business, financial condition and results of operations. In addition, we may record goodwill in connection with an acquisition and incur goodwill impairment charges in the future. Any of these charges could cause the price of our common stock to decline.
An acquisition could absorb substantial cash resources, require us to incur or assume debt obligations, or involve our issuance of additional equity securities. If we issue equity securities in connection with an acquisition, we may dilute our common stock with securities that have an equal or a senior interest in our company. If we incur additional debt to pay for an acquisition, it may significantly reduce amounts that would otherwise be available under our credit facility, increase our interest expense, leverage and debt service requirements and could negatively impact our ability to comply with applicable financial covenants in our credit facility or limit our ability to obtain credit from our vendors. Acquired entities also may be highly leveraged or dilutive to our earnings per share, or may have unknown liabilities. In addition, the combined entity may have lower revenues or higher expenses and therefore may not achieve the anticipated results. Any of these factors relating to acquisitions could have a material adverse impact on our business, financial condition and results of operations.
We cannot assure you that we will be able to identify suitable acquisition opportunities, consummate any pending or future acquisitions or that we will realize any anticipated benefits from any such acquisitions. Even if we do find suitable acquisition opportunities, we may not be able to consummate the acquisitions on commercially acceptable terms, and any decline in the price of our common stock may make it significantly more difficult and expensive to initiate or consummate additional acquisitions. We cannot assure you that we will be able to implement or sustain our acquisition strategy or that our strategy will ultimately prove profitable.
Narrow margins magnify the impact of variations in operating costs and of adverse or unforeseen events on operating results.
We are subject to intense price competition with respect to the technology offerings we provide. As a result, our gross and operating margins have historically been narrow, and we expect them to continue to be narrow. We have recently experienced increasing price competition, which has a negative impact on our margins. Narrow margins magnify the impact of variations in operating costs and of adverse or unforeseen events on operating results. Future increases in costs such as the cost of merchandise, wage levels, shipping rates, freight costs and fuel costs may negatively impact our margins and profitability. We are not always able to raise the sales price to offset cost increases. If we are unable to maintain our margins in the future, it could have a material adverse effect on our business, financial condition or results of operations. In addition, because price is an important competitive factor in our industry, we cannot assure you that we will not be subject to increased price competition in the future. If we become subject to increased price competition in the future, we cannot assure you that we will not lose market share, that we will not be forced to reduce our prices and further reduce our margins, or that we will be able to compete effectively.
We experience variability in our net sales and net income on a quarterly basis as a result of many factors.
We experience variability in our net sales and net income on a quarterly basis as a result of many factors. These factors include:
| ● | the relative mix of hardware products, software and services sold during the period; | |
| ● | the general economic environment and competitive conditions, such as pricing; | |
| ● | the timing of procurement cycles by our business, government and educational institution customers; | |
| ● | seasonality in customer spending and demand for technology offerings we provide; | |
| ● | variability in vendor programs; | |
| ● | the introduction of new and upgraded products, services or solutions; | |
| ● | changes in prices from our suppliers; | |
| ● | promotions; | |
| ● | the loss or consolidation of significant suppliers or customers; | |
| ● | our ability to control costs; | |
| ● | the timing of our capital expenditures; | |
| ● | the condition of our industry in general; | |
| ● | customer acceptance of new purchasing models; | |
| ● | deferral of customer orders in anticipation of new offerings; | |
| ● | product or solution enhancements or operating system changes; | |
| ● | any inability on our part to obtain adequate quantities of products, services or solutions; |
| 17 |
| ● | delays in the release by suppliers of new products, services or solutions and inventory adjustments; | |
| ● | our expenditures on new business ventures and acquisitions; | |
| ● | performance of acquired businesses; | |
| ● | adverse weather conditions that affect supply or customer response; | |
| ● | distribution or shipping to our customers; and | |
| ● | geopolitical events. |
Our planned operating expenditures each quarter are based on sales forecasts for the quarter. If our sales do not meet expectations in any given quarter, our operating results for the quarter may be materially adversely affected. Our narrow margins may magnify the impact of these factors on our operating results. We believe that period-to-period comparisons of our operating results are not necessarily a good indication of our future performance. In addition, our results in any quarterly period are not necessarily indicative of results to be expected for a full fiscal year. In future quarters, our operating results may be below the expectations of public market analysts or investors and as a result the market price of our common stock could be materially adversely affected.
Our focus on commercial and public sector sales presents numerous risks and challenges, and may not improve our profitability or result in expanded market share.
An important element of our business is focused on commercial and public sector sales and related market share growth. In competing in these markets, we face numerous risks and challenges, including competition from a wider range of sources and the need to continually develop and enhance strategic relationships. We cannot assure you that our focus on commercial and public sector sales will result in expanded market share or increased profitability. Furthermore, revenue from our public sector business is derived from sales to federal, state and local governmental departments and agencies, as well as to educational institutions, through various contracts and open market sales. Government contracting is a highly regulated area, and noncompliance with government procurement regulations or contract provisions could result in civil, criminal, and administrative liability, including substantial monetary fines or damages, termination of government contracts, and suspension, debarment or ineligibility from doing business with the government. The effect of any of these possible actions by any governmental department or agency with which we contract could adversely affect our business or results of operations. Moreover, contracting with governmental departments and agencies involves additional risks, such as longer payment terms, limited recourse against the government agency in the event of a business dispute, requirements that we provide representations, warranties and indemnities related to our offerings, the potential lack of a limitation of our liability for damages from our product sales or our provision of services to the department or agency, and the potential for changes in statutory or regulatory provisions that negatively affect the profitability of such contracts. Similarly, many large commercial businesses also require us to regularly enter into complex contractual relationships involving various risks and uncertainties such as requirements that we provide representations, warranties and indemnities to our customers and potential lack of limitation of our liability for damages under some of such contracts. Additionally, our operating results from our Commercial segment are impacted by certain commercial customer diverse supplier requirements and relationships we maintain with third party diverse supplier partners. Changes in any of these diverse supplier customer requirements or failure of our diverse supplier relationships to satisfy any such requirements at any time could have a material adverse effect on our results of operations or financial condition.
Our strategy and investments in increasing the productivity of our account executives, and our focus on sales and delivery of technology solutions may not improve our profitability or result in expanded market share.
We have made and are currently making efforts to increase our market share by investing in training and retention of our sales force. We have also incurred, and expect to continue to incur, significant expenses resulting from infrastructure investments related to our sales force. Our customers are increasingly consuming IT in different and evolving ways and utilizing more elaborate solutions. In response, we are investing in our capabilities and portfolio and are working with our customers to identify areas where they can gain efficiencies by outsourcing to us traditional technology functions. Specifically, we are focused on and investing in solutions, including around centers (which includes storage and security solutions), cloud computing, collaboration, virtualization, secure mobility, borderless networks and enterprise software solutions. We cannot assure you that any of our investments in our sales force or sales support resources or our focus on our services and solutions capabilities and portfolio will result in expanded market share or increased profitability in the near or long term.
Our financial performance could be adversely affected if we are not able to retain and increase the experience of our sales force or if we are not able to maintain or increase their productivity.
Our sales and operating results may be adversely affected if we are unable to increase the average tenure of our account executives or if the sales volumes and profitability achieved by our account executives do not increase with their increased experience.
| 18 |
Existing or future government and tax laws and regulations and related risks could expose us to liabilities or costly changes in our business operations, and could reduce demand for our products and services.
We may be subject to state or local taxes on income, gross receipts, sales or use or a similar measure. State and local governments may seek to impose such taxes in cases where they believe the taxpayer may have a significant economic presence by reason of significant sales to customers located in the states. The responsibility to pay or collect taxes has also been the subject of court actions and various legislative efforts. There can be no assurance that these taxes will not be imposed upon us and our subsidiaries in a manner that could materially adversely impact our financial condition or results of operations.
We are subject to a number of general business laws and regulations, including laws and regulations specifically governing companies that do business over the Internet. These laws and regulations may cover user privacy, marketing and promotional practices (including electronic communications with our customers and potential customers), data protection and privacy, pricing, content, copyrights, distribution, contracts and other communications, consumer protection, product safety, the provision of online payment services, copyrights, patents and other intellectual property rights, unauthorized access (including the Computer Fraud and Abuse Act), and the characteristics and quality of products and services. Additionally, some of our subsidiaries which are government contractors or subcontractors are subject to laws and regulations related to companies that sell to the government, including but not limited to regulations of the Department of Labor and laws and regulations related to our procurement of products and services and our sales to the government.
In addition, we may be subject to federal, state or local taxes on income, gross receipts, sales or use or a similar measure. State and local governments may seek to impose such taxes in cases where they believe the taxpayer may have a sufficient economic presence by reason of sales or services to customers located in the applicable jurisdiction. The responsibility to pay or collect taxes has been the subject of court actions and various legislative efforts. There can be no assurance that these taxes or tax collection obligations will not be imposed upon us and our subsidiaries in a manner that could materially adversely impact our financial condition or results of operations.
While we have sought to implement processes, programs and systems in an effort to achieve compliance with existing laws and regulations applicable to our business, many of these laws and regulations are unclear and have yet to be interpreted by courts, or may be subject to conflicting interpretations by courts or regulatory agencies. Further, no assurances can be given that new laws or regulations will not be enacted or adopted, or that our processes, programs and systems will be sufficient to comply with present or future laws or regulations, which might adversely affect our business, financial condition or results of operations.
The Tax Cuts and Jobs Act of 2017 was approved by Congress and signed into law in December 2017. This legislation makes significant changes to the U.S. Internal Revenue Code. Such changes include a reduction in the corporate tax rate and limitations on certain corporate deductions and credits, among other changes. Certain of these changes could have a negative impact on our business. Moreover, further legislative and regulatory changes may be more likely in the current political environment, particularly to the extent that Congress and the U.S. presidency are controlled by the same political party and significant reform of the tax code has been described publicly as a legislative priority. Significant further changes to the tax code could have an adverse impact on our business, financial condition and results of operations.
Such existing and future laws and regulations may also impede our business. Additionally, it is not always clear how existing laws and regulations apply to our businesses. Unfavorable resolution of these issues may expose us to liability and costly changes in our business operations, and could reduce customer demand for our offerings.
Additionally, although historically only a small percentage of our total sales in any given quarter or year are made to customers outside of the continental United States, we recently entered the Canadian market with our acquisitions in Canada, which subjected us to laws and regulations applicable to companies doing business in the multiple Canadian provinces. We also commenced operations in the United Kingdom in the first quarter of 2017. Further, there is a possibility that other foreign jurisdictions may take the position that our business is subject to their laws and regulations, which could impose restrictions or burdens on us and expose us to tax and other potential liabilities and could also require costly changes to our business operations with respect to those jurisdictions. In some cases, our sales related to foreign jurisdictions could also be subject to export control laws and foreign corrupt practice laws and there is a risk that we could face allegations from U.S. or foreign governmental authorities alleging our failure to comply with the requirements of such laws subjecting us to costly litigation and potential significant governmental penalties or fines.
| 19 |
If goodwill or intangible assets become impaired, we may be required to record a significant charge to earnings.
The purchase price allocation for our historical acquisitions resulted in a material amount allocated to goodwill and intangible assets. In accordance with GAAP, we review our intangible assets for impairment when events or changes in circumstances indicate the carrying value may not be recoverable. We review the fair values of our goodwill and intangible assets with indefinite useful lives and test them for impairment annually or whenever events or changes in circumstances indicate an impairment may have occurred. Factors that may be considered a change in circumstances indicating that the carrying value of our goodwill or intangible assets may not be recoverable include a decline in stock price and market capitalization, reduced future cash flow estimates, and slower growth rates in our industry. We may be required to record a significant non-cash charge to earnings in our consolidated financial statements during the period in which any impairment of our goodwill or intangible assets is determined, which could have a material adverse effect on our results of operations.
If significant negative industry or economic trends, including decreases in our market capitalization, slower growth rates or lack of growth in our business occurs in the future it may indicate that impairment charges are required. If we are required to record any impairment charges, this could have a material adverse effect on our consolidated financial statements. In addition, the testing of goodwill for impairment requires us to make significant estimates about the future performance and cash flows of our company, as well as other assumptions. These estimates can be affected by numerous factors, including changes in economic, industry or market conditions, changes in underlying business operations, future reporting unit operating performance, existing or new product market acceptance, changes in competition, or changes in technologies. Any changes in key assumptions, or actual performance compared with those assumptions, about our business and future prospects or other assumptions could affect the fair value of one or more reporting units, resulting in an impairment charge.
We may not be able to maintain profitability on a quarterly or annual basis.
Our ability to maintain profitability on a quarterly or annual basis given our planned business strategy depends upon a number of factors discussed in these risk factors, including our ability to effectively compete in the marketplace with our competitors. Our ability to maintain profitability on a quarterly or annual basis will also depend on our ability to manage and control operating expenses and to generate and sustain adequate levels of revenue. Many of our expenses are fixed in the short term, and we may not be able to quickly reduce spending if our revenue is lower than what we project. In addition, we may find that our business plan costs more to execute than what we currently anticipate. Some of the factors that affect our ability to maintain profitability on a quarterly or annual basis are beyond our control, including general economic trends and uncertainties.
Our operating results are difficult to predict and may adversely affect our stock price.
Our operating results have fluctuated in the past and are likely to vary significantly in the future based upon a number of factors, many of which we cannot control. We operate in a highly dynamic industry and future results could be subject to significant fluctuations. These fluctuations could cause us to fail to meet or exceed financial expectations of investors or analysts, which could cause our stock price to decline rapidly and significantly. Revenue and expenses in future periods may be greater or less than revenue and expenses in the immediately preceding period or in the comparable period of the prior year. Therefore, period-to-period comparisons of our operating results are not necessarily a good indication of our future performance. Some of the factors that could cause our operating results to fluctuate include:
| ● | changes in the mix of products, services or solutions that we sell; | |
| ● | the amount and timing of operating costs and capital expenditures relating to any expansion of our business operations and infrastructure; | |
| ● | price competition that results in lower sales volumes, lower profit margins, or net losses; | |
| ● | the availability of vendor programs, authorizations or certifications; | |
| ● | our ability to attract and retain key personnel and the related costs, | |
| ● | fluctuations in the demand for our products, services or solutions or overstocking or under-stocking of our products; | |
| ● | economic conditions; | |
| ● | changes in the amounts of information technology spending by our customers; | |
| ● | the amount and timing of advertising and marketing costs; | |
| ● | fluctuations in levels of inventory theft, damage or obsolescence that we incur; | |
| ● | our ability to successfully integrate operations and technologies from any past or future acquisitions or other business combinations; | |
| ● | revisions or refinements of fair value estimates relating to acquisitions or other business combinations; | |
| ● | changes in the number of visitors to our websites or our inability to convert those visitors into customers; | |
| ● | technical difficulties, including system or Internet failures; | |
| ● | introduction of new or enhanced products, services or solutions; | |
| ● | fluctuations in warehousing and shipping costs; and | |
| ● | foreign currency exchange rates. |
| 20 |
If we fail to accurately predict and manage our inventory risks, our margins may decline as a result of required inventory write downs due to lower prices obtained from older or obsolete products.
We derive a significant amount of our gross sales from products sold out of owned inventory at our directly operated and distributor partner warehouse and distribution facilities. We assume the inventory damage, theft and obsolescence risks, as well as price erosion risks for products that are sold out of such inventory. These risks are especially significant because many of the products we sell are characterized by rapid technological change, obsolescence and price erosion, and because at times we may stock large quantities of particular types of inventory. There can be no assurance that we will be able to identify and offer products necessary to remain competitive, maintain our margins, or avoid or minimize losses related to excess and obsolete inventory. We currently have limited return rights with respect to products we purchase from some of our largest vendor partners, but these rights vary by product line, are subject to specified conditions and limitations and can be terminated or changed at any time. We also recently have decided to move more of our inventory warehousing and distribution functions to third party distributor partners in replacement of our historic directly operated facility in Memphis Tennessee. Moving these operations to third party facilities will result in greater dependence on these third parties for portions of our warehousing and distribution needs. As a result, we will now be subject to third party contractual relationships for these replaced operations, which could result in future cost increases and other contractual risk allocations which we have not historically faced and may not be able control.
We may need additional financing and may not be able to raise additional financing on favorable terms or at all, which could increase our costs, limit our ability to grow and dilute the ownership interests of existing stockholders.
We require substantial working capital to fund our business. We believe that our current working capital, including our existing cash balance, together with our expected future cash flows from operations and available borrowing capacity under our existing credit facility, which functions as a working capital line of credit, will be adequate to support our current operating plans for at least the next twelve months. However, if we need additional financing, such as for acquisitions or expansion of our business or the businesses of our subsidiaries or to finance our operations during a significant downturn in sales or an increase in operating expenses, there are no assurances that adequate financing will be available on acceptable terms, if at all. We may in the future seek additional financing from public or private debt or equity financings to fund additional expansion, or take advantage of strategic opportunities or favorable market conditions. There can be no assurance such financings will be available on terms favorable to us or at all. To the extent any such financings involve the issuance of equity securities, existing stockholders could suffer dilution. If we raise additional financing through the issuance of equity, equity-related or debt securities, those securities may have rights, preferences or privileges senior to those of the rights of our common stock and our stockholders will experience dilution of their ownership interests. If additional financing is required but not available, we would have to implement further measures to conserve cash and reduce costs. However, there is no assurance that such measures would be successful. Our failure to raise required additional financing could adversely affect our ability to maintain, develop or enhance our product offerings, take advantage of future strategic opportunities, respond to competitive pressures or continue operations.
Economic volatility and geopolitical uncertainty could result in disruptions of the capital and credit markets. Problems in these areas could have a negative impact on our ability to obtain future financing if we need additional funds, such as for acquisitions or expansion, to fund changes in our sales or an increase in our operating expenses, or to take advantage of strategic opportunities or favorable market conditions. We may seek additional financing from public or private debt or equity issuances; however, there can be no assurance that such financing will be available at acceptable terms, if at all. Also, there can be no assurance that the cost or availability of future borrowings, if any, under our credit facility or in the debt markets will not be impacted by disruptions in the capital and credit markets.
Rising interest rates could negatively impact our results of operations and financial condition.
A significant portion of our working capital requirements and our real estate acquisitions have historically been funded through borrowings under our working capital credit facility or through long term notes. These facilities bear interest at variable rates tied to the LIBOR or prime rate, and the long term notes generally have initial terms of between five and seven years. If the variable interest rates on our borrowings increase, we could incur greater interest expense than we have in the past. Rising interest rates, and our increased interest expense that would result from them, could negatively impact our results of operations and financial condition.
| 21 |
We may be subject to claims regarding our intellectual property, including our business processes, or the products, services or solutions we sell, any of which could result in expensive litigation, distract our management or force us to enter into costly royalty or licensing agreements.
Third parties have asserted, and may in the future assert, that our business or the technologies we use or sell infringe on their intellectual property rights. As a result, we may be subject to intellectual property legal proceedings and claims in the ordinary course of our business. We cannot predict whether third parties will assert additional claims of infringement against us in the future or whether any future claims will prevent us from offering popular products or operating our business as planned. If we are forced to defend against any third-party infringement claims, whether they are with or without merit or are determined in our favor, we could face expensive and time-consuming litigation, which could result in the imposition of a preliminary injunction preventing us from continuing to operate our business as currently conducted throughout the duration of the litigation or distract our technical and management personnel. If we are found to infringe, we may be required to pay monetary damages, which could include treble damages and attorneys’ fees for any infringement that is found to be willful, and either be enjoined or required to pay ongoing royalties with respect to any technologies found to infringe. Further, as a result of infringement claims either against us or against those who license technology to us, we may be required, or deem it advisable, to develop non-infringing technology, which could be costly and time consuming, or enter into costly royalty or licensing agreements. Such royalty or licensing agreements, if required, may be unavailable on terms that are acceptable to us, or at all. If a third party successfully asserts an infringement claim against us and we are enjoined or required to pay monetary damages or royalties or we are unable to develop suitable non-infringing alternatives or license the infringed or similar technology on reasonable terms on a timely basis, our business, results of operations and financial condition could be materially harmed. Similarly, we may be required incur substantial monetary and diverted resource costs in order to protect our intellectual property rights against infringement by others.
Furthermore, we sell products, services and solutions manufactured, published and distributed by third parties, some of which may be defective. If any product, service or solution that we sell were to cause physical injury or damage to property, the injured party or parties could bring claims against us as the retailer of the product or solution. Our insurance coverage may not be adequate to cover every claim that could be asserted. If a successful claim were brought against us in excess of our insurance coverage, it could expose us to significant liability. Even unsuccessful claims could result in the expenditure of funds and management time and could decrease our profitability.
Costs and other factors associated with pending or future litigation could materially harm our business, results of operations and financial condition.
From time to time we receive claims and become subject to litigation, including consumer protection, employment, intellectual property and other litigation and government or third party audits related to the conduct of our business. Additionally, we may from time to time institute legal proceedings against third parties to protect our interests. For example, we are currently involved in several disputes related to the En Pointe acquisition. These proceedings are described under the heading “Legal Proceedings” in Part I, Item 1, Note 10 to the Notes to the Consolidated Financial Statements of this report. Any litigation, arbitration, audit, investigation or other dispute resolution process that we become a party to could be costly and time consuming and could divert our management and key personnel from our business operations. In connection with any such matters, we may be subject to significant damages or equitable remedies relating to the operation of our business and could incur significant costs in asserting, defending, or settling any such matters. We cannot determine with any certainty the costs or outcome of such pending or future matters, and they may materially harm our business, results of operations or financial condition.
We may fail to expand our hardware product, software or service categories and offerings, our websites or our processing systems in a cost-effective and timely manner as may be required to efficiently operate our business.
We may be required to expand or change our hardware product, software or service categories or offerings, our websites or our processing systems in order to compete in our highly competitive and rapidly changing industry or to efficiently operate our business. Any failure on our part to expand or change the way we do business in a cost-effective and timely manner in response to any such requirements would likely adversely affect our operating results, financial condition or future prospects. Additionally, we cannot assure you that we will be successful in implementing any such changes when and if they are required.
We have generated substantial portions of our revenue in the past from the sale of computer hardware, software and accessories and consumer electronics products. Expansion into new hardware product, software and service categories, including for example our efforts to grow managed and advanced technology services and solutions, may require us to incur significant marketing expenses, develop relationships with new vendors and comply with new regulations. In addition, demand for the solutions we sell to our customers could decrease if we are unable to adapt in areas like cloud technology, IaaS, SaaS, PaaS, SDN or other emerging technologies. We may lack the necessary expertise in a new category or offering to realize the expected benefits of that new category or offering. These requirements could strain our managerial, financial and operational resources. Additional challenges that may affect our ability to expand into new hardware product, software or service categories and offerings include our ability to:
| 22 |
| ● | establish or increase awareness of our new brands and categories and offerings; | |
| ● | acquire, attract and retain customers at a reasonable cost; | |
| ● | achieve and maintain a critical mass of customers and orders across all of our categories and offerings; | |
| ● | attract a sufficient number of new customers to whom any new categories and offerings are targeted; | |
| ● | successfully market our new categories or offerings to existing customers; | |
| ● | maintain or improve our margins and fulfillment costs; | |
| ● | attract and retain vendors to provide expanded lines of business to our customers on terms that are acceptable to us; and | |
| ● | manage our inventory in new categories and offerings. |
We cannot be certain that we will be able to successfully address any or all of these challenges in a manner that will enable us to expand our business in a cost-effective or timely manner. If our new categories or offerings are not received favorably, or if our suppliers fail to meet our customers’ expectations, our results of operations would suffer and our reputation and the value of the applicable new brand and our other brands could be damaged. The lack of market acceptance of our new categories or our inability to generate satisfactory revenue from any such expanded categories or offerings to offset their cost could harm our business, financial condition or results of operations.
The evolution of cloud-based offerings may negatively impact our sales of hardware products, software and related services.
Our customers are increasingly able to access technology solutions necessary to their operations through cloud-based offerings. Increasing demand for cloud-based offerings may reduce demand for certain of our existing technology solution offerings. We are investing in our cloud-based capabilities, including products and services related to our own direct and third-party cloud-based offerings, such as our hybrid cloud data center and NOC services, Azure Cloud solutions, Office 365 and Enterprise Mobility Suite. We expect to continue to increasingly invest in our cloud-based capabilities in support of anticipated customer evolution towards cloud-based solutions. There can be no assurance that our investments in cloud-based offerings will result in improved sales or profitability or allow us to offset any reductions in sales of our more traditional hardware product, software and related service offerings which may result from our customers’ increased adoption of cloud-based solutions. Any such reductions in sales may have a material adverse effect on our business, financial condition or results of operations.
We may not be able to attract and retain key personnel such as senior management, sales and services personnel or information technology specialists.
Our future performance will depend to a significant extent upon the efforts and abilities of certain key management and other personnel, including Frank F. Khulusi, our Chairman of the Board and Chief Executive Officer, as well as other executive officers and senior management. The loss of service of one or more of our key management members could have a material adverse effect on our business. Our success and plans for future growth will also depend in part on our management’s continuing ability to hire, train and retain skilled personnel in all areas of our business such as sales, services and IT personnel. For example, our management information systems and processes require the services of employees with extensive knowledge of these systems and processes and the business environment in which we operate, and in order to successfully implement and operate our systems and processes we must be able to attract and retain a significant number of information technology specialists. We may not be able to attract, train and retain the skilled personnel required to, among other things, implement, maintain, and operate our information systems and processes or to offer and support our managed and advanced technology solutions, and any failure to do so would likely have a material adverse effect on our operations.
If we fail to achieve and maintain adequate internal controls, we may not be able to produce reliable financial reports in a timely manner or prevent financial fraud.
We monitor and periodically test our internal control procedures. We may from time to time identify deficiencies which we may not be able to remediate in a timely or cost-effective manner. In addition, if we fail to achieve and maintain the adequacy of our internal controls, we may not be able to ensure that we can conclude on an ongoing basis that we have effective internal controls over financial reporting. Effective internal controls, particularly those related to revenue recognition, are necessary for us to produce reliable financial reports and are important in helping prevent financial fraud. If we cannot provide reliable financial reports on a timely basis or prevent financial fraud, our business and operating results could be harmed, investors could lose confidence in our reported financial information, and the trading price of our stock could drop significantly.
| 23 |
Any inability to effectively manage our growth and achieve economies of scale may prevent us from successfully expanding our business.
The growth of our business has required us to make significant additions in personnel and has significantly increased our working capital requirements. Although we have experienced significant sales growth in the past, such growth should not be considered indicative of future sales growth. Such growth has resulted in new and increased responsibilities for our management personnel and has placed and continues to place significant strain upon our management, operating and financial systems, and other resources. Any future growth, whether organic or through acquisition, may result in increased strain. There can be no assurance that current or future strain will not have a material adverse effect on our business, financial condition, and results of operations. Also crucial to our success in managing our growth will be our ability to achieve additional economies of scale. We cannot assure you that we will be able to achieve such economies of scale, and the failure to do so could have a material adverse effect upon our business, financial condition or results of operations.
Our advertising and marketing efforts may be costly and may not achieve desired results.
We incur substantial expense in connection with our advertising and marketing efforts. Although we target our advertising and marketing efforts on current and potential customers who we believe are likely to be in the market for the products we sell, we cannot assure you that our advertising and marketing efforts will achieve our desired results. In addition, we periodically adjust our advertising expenditures in an effort to optimize the return on such expenditures. Any decrease in the level of our advertising expenditures which may be made to optimize such return could adversely affect our sales.
We are exposed to the credit risk of some of our customers and to credit exposures in weakened markets, which could negatively impact our business, operating results and financial condition.
Business customers who qualify are provided credit terms and while we monitor individual customer payment capability and maintain reserves we believe are adequate to cover exposure for doubtful accounts, we have exposure to credit risk in the event that customers fail to meet their payment obligations. Additionally, to the degree that there may be tightness in the credit markets that makes it more difficult for some customers to obtain financing, those customers’ ability to meet their payment obligations to us could be adversely impacted, which in turn could have a material adverse impact on our business, operating results, and financial condition.
Increased product returns or a failure to accurately predict product returns could decrease our revenue and impact profitability.
We make allowances for product returns in our consolidated financial statements based on historical return rates. We are responsible for returns of certain products shipped from our distribution center, as well as products that are shipped to our customers directly from our vendors. If our actual product returns significantly exceed our allowances for returns, our revenue and profitability could decrease. In addition, because our allowances are based on historical return rates, the introduction of new merchandise categories, new products, changes in our product mix, or other factors may cause actual returns to exceed return allowances, perhaps significantly. In addition, any policies that we adopt that are intended to reduce the number of product returns may result in customer dissatisfaction and fewer repeat customers.
Our business may be harmed by fraudulent activities.
We have received in the past, and anticipate that we will receive in the future, communications from customers due to purported fraudulent activities, including fraudulent activities on our websites such as fraudulent credit card transactions. Negative publicity generated as a result of fraudulent conduct by third parties could damage our reputation and diminish the value of our brand name. Fraudulent activities could also subject us to losses and could lead to scrutiny from lawmakers and regulators regarding the operation of our businesses, including the operation of our websites. We expect to continue to receive requests from customers for reimbursement due to purportedly fraudulent activities or threats of legal action against us if no reimbursement is made.
| 24 |
Breaches of data security could significantly impact our business and expose us to material costs and liability.
We are subject to data security laws that are becoming more widespread and burdensome, and increasingly require notification of security breaches to affected individuals, regulators and other third parties. At the same time, cyber attacks and other efforts by bad actors to steal personal information or company proprietary information, and to disrupt service, are on the rise. Our systems contain personal, financial and other information that is entrusted to us by our customers and employees, as well as financial, proprietary, and other confidential information relating to our business. Despite the security measures we have in place, security breaches involving our systems or the systems of our third-party vendors may occur, and could result in system and service disruptions or the theft or disclosure of personal or confidential information. In addition to risks we face from cyber attacks or security attacks directly targeted at our systems, we offer our products, services and solutions to companies, such as healthcare or financial institutions, under contracts which may expose us to significant liabilities for data breaches or losses which could arise out of or result from products, services or solutions we may sell to these institutions. The occurrence of any of these security breaches, or the claim that our company has suffered such a security breach, whether accurate or not, could result in adverse publicity, loss of customer confidence, increased costs, reduced sales and profits, criminal penalties, and civil liabilities. In addition, in order to ensure customer confidence in our solutions and services, we may choose to remediate actual or perceived security concerns by implementing further security measures which could require us to expend significant resources. The FTC and state consumer protection authorities have brought a number of enforcement actions against U.S. companies for alleged deficiencies in companies’ data security practices, and they may continue to bring such actions. Enforcement actions, which may or may not be based upon actual cyber attacks, security breaches, or other disclosures of personal information, present an ongoing risk to us, could result in a loss of customers, damage to our reputation and monetary damages. This liability could also include claims for other misuses of personal information, including for unauthorized marketing purposes. Other liability could include claims alleging misrepresentation or violation of our privacy and data security practices. Any such liability could decrease our profitability and materially adversely affect our financial condition.
Laws or regulations relating to privacy and data protection may adversely affect the growth of our business or our marketing efforts and expose us to material costs and liability.
We market to names in our proprietary customer database and to potential customers whose names we obtain from rented or exchanged mailing lists. Worldwide public concern regarding personal privacy has subjected the rental and use of customer mailing lists and other customer information to increased scrutiny and regulation. As a result, we are subject to increasing regulation relating to privacy and the use of personal information. For example, we are subject to various telemarketing and anti-spam laws that regulate the manner in which we may solicit future suppliers and customers. Such regulations, along with increased governmental or private enforcement, may increase the cost of operating and growing our business. In addition, several states have proposed legislation that would limit the uses of personal information gathered online or require online services to establish privacy policies. The Federal Trade Commission has adopted regulations regarding the collection and use of personal identifying information obtained from children under 13 years of age. Bills proposed in Congress would expand online privacy protections already provided to adults. Moreover, in the United States, Canada, the United Kingdom, the European Union and elsewhere, laws and regulations, such as the General Data Protection Regulation (GDPR), are becoming increasingly protective of consumer privacy, with a trend toward requiring companies to establish procedures to notify users of privacy and security policies, to obtain consent from users for collection and use of personal information, and to provide users with the ability to access, correct and delete personal information stored by companies. Such privacy and data protection laws and regulations, and efforts to enforce such laws and regulations, may restrict our ability to collect, use or transfer demographic and personal information from users, which could be costly or harm our marketing efforts. Further, any violation of domestic or foreign privacy or data protection laws and regulations, including the U.S. national do-not-call list and CAN-SPAM Act, the Canadian Anti-Spam Legislation, GDPR and the UK Privacy and Electronic Communications Regulations, may subject us to fines, penalties and damages, which could decrease our revenue and profitability.
The growth and demand for online commerce has and may continue to result in more stringent consumer protection laws that impose additional compliance burdens on online companies. We also could incur additional costs and liability exposures if new laws or regulations regarding the use of personal information are introduced. These privacy protection laws could result in substantial compliance costs and could decrease our profitability. Further, additional regulation of the Internet may lead to a decrease in Internet usage, which could adversely affect our business. Growing public concern about privacy and the collection, distribution and use of information about individuals may subject us to increased regulatory scrutiny or litigation. In the past, the FTC has investigated companies that have used personally identifiable information without permission or in violation of a stated privacy policy. If we are accused of violating the stated terms of our privacy policy, we may face a loss of customers or damage to our reputation and may be forced to expend significant amounts of financial and managerial resources to defend against these accusations, face potential liability and be subject to extended regulatory oversight in the form of a long-term consent order.
The security risks of eCommerce may discourage customers from purchasing products, services or solutions from us.
In order for the eCommerce market to be successful, we and other market participants must be able to transmit confidential information securely over public networks. Third parties may have the technology or know-how to breach the security of customer transaction data. Any breach could cause customers to lose confidence in the security of our websites and choose not to purchase from our websites. If someone is able to circumvent our security measures, he or she could destroy or steal valuable information or disrupt our operations. Concerns about the security and privacy of transactions over the Internet could inhibit the growth of Internet usage and eCommerce.
| 25 |
Credit card fraud could decrease our revenue and profitability.
We do not carry insurance against the risk of credit card fraud, so the failure to adequately control fraudulent credit card transactions could reduce our revenues or increase our operating costs. We may in the future suffer losses as a result of orders placed with fraudulent credit card data even though the associated financial institution approved payment of the orders. Under current credit card practices, we may be liable for fraudulent credit card transactions. If we are unable to detect or control credit card fraud, or if credit card companies require more burdensome terms or refuse to accept credit card charges from us, our revenue and profitability could decrease.
Our facilities and systems are vulnerable to natural disasters or other catastrophic events.
Our headquarters, customer service center and a part of our infrastructure, including computer servers, are located near Los Angeles, California and in other areas that are susceptible to earthquakes, floods, severe weather and other natural disasters. Our owned and third party distribution facilities, which house the product inventory from which a material amount of our orders may be shipped, are located in areas that are susceptible to natural disasters and extreme weather conditions such as earthquakes, fire, floods and major storms. Our operations in the Philippines are also in an area that is periodically subject to extreme weather. A natural disaster or other catastrophic event, such as an earthquake, fire, flood, severe storm, break-in, terrorist attack or other comparable events in the areas in which we operate could cause interruptions or delays in our business and loss of data or render us unable to accept and fulfill customer orders in a timely manner, or at all. Our systems, including our management information systems, websites and communications systems, are not fully redundant, and we do not have redundant geographic locations or earthquake insurance. Further, power outages in any locations where our systems are located could disrupt our operations. Our business interruption insurance may not adequately compensate us for losses that may occur.
We rely on independent shipping companies to deliver the products we sell.
We rely upon third party carriers, especially FedEx and UPS, for timely delivery of our product shipments. As a result, we are subject to carrier disruptions and increased costs due to factors that are beyond our control, including employee strikes, inclement weather and increased fuel costs. Any failure to deliver products to our customers in a timely and accurate manner may damage our reputation and brand and could cause us to lose customers. We do not have a written long-term agreement with any of these third party carriers, and we cannot be sure that these relationships will continue on terms favorable to us, if at all. If our relationship with any of these third party carriers is terminated or impaired, or if any of these third parties are unable to deliver products for us, we would be required to use alternative carriers for the shipment of products to our customers. We may be unable to engage alternative carriers on a timely basis or on terms favorable to us, if at all. Potential adverse consequences include:
| ● | reduced visibility of order status and package tracking; | |
| ● | delays in order processing and product delivery; | |
| ● | increased cost of delivery, resulting in reduced margins; and | |
| ● | reduced shipment quality, which may result in damaged products and customer dissatisfaction. |
Furthermore, shipping costs represent a significant operational expense for us. Any future increases in shipping rates could have a material adverse effect on our business, financial condition and results of operations.
We may not be able to compete successfully against existing or future competitors, which include some of our largest vendors.
The business of direct marketing of the technology offerings we provide is highly competitive and driven in large part by price, products and services availability, speed and accuracy of delivery and performance, effectiveness of sales and marketing programs, credit availability, ability to tailor specific solutions to customer needs, quality and breadth of product lines and services, availability of talented sales and service personnel and the availability of technical information. We compete with other solution providers, including CDW, Insight Enterprises, Presidio and Connection. In addition, we compete with large value added resellers such as CompuCom Systems and World Wide Technology, and computer retail stores and resellers, including superstores such as Best Buy and Staples, certain hardware and software vendors such as Apple and Dell Computer that sell or are increasing sales directly to end users, online resellers such as Amazon.com, government resellers such as CDWG and GovConnection, software focused resellers such as SoftwareOne, Soft Choice and Software House International and other direct marketers and value added resellers of hardware, software, technology services and computer-related and electronic products, including Amazon Business and Web Services, and Google Business Services. In the technology solution provider and resale industries, barriers to entry are relatively low and the risk of new competitors entering the market is high. Certain of our existing competitors have substantially greater financial resources than we have. There can be no assurance that we will be able to continue to compete effectively against existing competitors, consolidations of competitors or new competitors that may enter the market.
| 26 |
Furthermore, the manner in which our technology offerings are distributed and sold is changing, and new methods of sale and distribution have emerged and serve an increasingly large portion of the market. Computer hardware and software OEM vendors have sold, and may intensify their efforts to sell, their products directly to end users. From time to time, certain OEM vendors have instituted programs for the direct sale of large quantities of hardware and software to certain large business accounts. These types of programs may continue to be developed and used by various vendors. Software publishers also may attempt to increase the volume of software products distributed electronically directly to end users’ personal computers. Any of these competitive programs, if successful, could have a material adverse effect on our business, financial condition or results of operations.
We are exposed to the risks of business and other conditions in Asia, Canada and the United Kingdom.
All or portions of certain of the products we sell are produced, or have major components produced, in Asia. We engage in U.S. dollar denominated transactions with U.S. divisions and subsidiaries of companies located in that region as well. We also entered the Canadian market in 2015 with our Acrodex and Systemax acquisitions and the UK market in 2017. As a result, we may be indirectly affected by risks associated with international events, including economic and labor conditions, such as fluctuating oil prices, political instability, tariffs and taxes, availability of products, natural disasters and currency fluctuations in the U.S. dollar versus the regional currencies. In the past, countries in Asia have experienced volatility in their currency, banking and equity markets. In addition, the referendum in the UK electing to withdraw from the European Union has created significant uncertainty about the future relationship between the UK and the European Union, including with respect to the laws and regulations that will apply as the UK determines which European Union laws to replace or replicate in the event of a withdrawal. Future volatility in any of these international markets could adversely affect the supply and price of the products we sell and their components and ultimately, our results of operations.
We also maintain an office in the Philippines and have historically received third party back office support from Pakistan, as a result of our En Pointe acquisition, and we may increase our offshore operations in the future. Establishing and transitioning offshore operations may entail considerable expense before we realize cost savings, if any, from these initiatives. The risks associated with doing business overseas and international events could prevent us from realizing the expected benefits from our international operations or any other offshore operations that we may establish.
The increasing significance of our foreign operations exposes us to risks that are beyond our control and could affect our ability to operate successfully.
In order to enhance the cost-effectiveness of our operations, we have increasingly sought to shift portions of our operations to jurisdictions with lower cost structures than that available in the United States. The transition of even a portion of our business operations to new facilities in a foreign country involves a number of logistical and technical challenges that could result in operational interruptions, which could reduce our revenues and adversely affect our business. We may encounter complications associated with the set-up, migration and operation of business systems and equipment in a new facility. This could result in disruptions that could damage our reputation and otherwise adversely affect our business and results of operations.
To the extent that we shift any operations or labor offshore to jurisdictions with lower cost structures, we may experience challenges in effectively managing those operations as a result of several factors, including time zone differences and regulatory, legal, cultural and logistical issues. Additionally, the relocation of labor resources may have a negative impact on our existing employees, which could negatively impact our operations. If we are unable to effectively manage our offshore personnel and any other offshore operations, our business and results of operations could be adversely affected.
We cannot be certain that any shifts in our operations to offshore jurisdictions will ultimately produce the expected cost savings. We cannot predict the extent of government support, availability of qualified workers, future labor rates, or monetary and economic conditions in any offshore locations where we may operate. Although some of these factors may influence our decision to establish or increase our offshore operations, there are inherent risks beyond our control, including:
| ● | political unrest or uncertainties; | |
| ● | wage inflation; | |
| ● | exposure to foreign currency fluctuations; | |
| ● | tariffs and other trade barriers; and | |
| ● | foreign regulatory restrictions and unexpected changes in regulatory environments. |
We will likely be faced with competition in these offshore markets for qualified personnel, and we expect this competition to increase as other companies expand their operations offshore. If the supply of such qualified personnel becomes limited due to increased competition or otherwise, it could increase our costs and employee turnover rates. One or more of these factors or other factors relating to foreign operations could result in increased operating expenses and make it more difficult for us to manage our costs and operations, which could cause our operating results to decline and result in reduced revenues.
| 27 |
International operations expose us to currency exchange risk and we cannot predict the effect of future exchange rate fluctuations on our business and operating results.
We have operation centers in Canada and the Philippines that have historically provided back-office administrative support and customer service support, and we recently began selling technology solutions in the Canadian market in connection with three business acquisitions and launched a new business in the United Kingdom in 2017. Our international operations are sensitive to currency exchange risks. We have currency exposure arising from both sales and purchases denominated in foreign currencies, as well as intercompany transactions. Significant changes in exchange rates between foreign currencies in which we transact business and the U.S. dollar may adversely affect our results of operations and financial condition. Historically, we have not entered into any hedging activities, and, to the extent that we continue not to do so in the future, we may be vulnerable to the effects of currency exchange-rate fluctuations.
In addition, our international operations also expose us to currency fluctuations as we translate the financial statements of our foreign operations to the U.S. dollar. Although the effect of currency fluctuations on our financial statements has not generally been material in the past, there can be no guarantee that the effect of currency fluctuations will not be material in the future.
We are subject to risks associated with consolidation within our industry.
Many technology solution providers are consolidating operations and acquiring or merging with other providers to achieve economies of scale, expanded product and service offerings, and increased efficiency. The current industry reconfiguration and the trend towards consolidation could cause the industry to become even more competitive, further increase pricing pressures and make it more difficult for us to maintain our operating margins or to increase or maintain the same level of net sales or gross profit. Declining prices, resulting in part from technological changes, may require us to sell a greater number of products, services or solutions to achieve the same level of net sales and gross profit. Such a trend could make it more difficult for us to continue to increase our net sales and earnings growth. In addition, growth in the information technology market has slowed. If the growth rate of the information technology market were to further decrease, our business, financial condition and operating results could be materially adversely affected.
If we are unable to provide satisfactory customer service and support, we could lose customers or fail to attract new customers.
Our ability to provide satisfactory levels of customer service depends, to a large degree, on the efficient and uninterrupted operation of our customer service and support operations. Any material disruption or slowdown in our order processing systems resulting from labor disputes, telephone or Internet failures, upgrading our management information systems, power or service outages, natural disasters or other events could make it difficult or impossible to provide adequate customer service and support. Furthermore, we may be unable to attract and retain adequate numbers of competent customer service representatives and relationship managers for our business customers, each of which is essential in creating a favorable interactive customer experience. If we are unable to continually provide adequate staffing and training for our customer service and support operations, our reputation could be seriously harmed and we could lose customers or fail to attract new customers. In addition, if our e-mail and telephone call volumes exceed our present system capacities, we could experience delays in placing orders, responding to customer inquiries and addressing customer concerns. Because our success depends largely on keeping our customers satisfied, any failure to provide high levels of customer service would likely impair our reputation and decrease our revenues.
Following our acquisition of En Pointe, we received third party back office support in Pakistan to supplement our captive support operations in other geographies. The agreement for these outsourced services in Pakistan expired in the third quarter of 2017. We have transitioned these IT, accounting, customer service and order management and other support services to our wholly-owned service operations in the Philippines and other geographies. Any transition of historical support operations involves risks of business disruption and management distraction. We cannot be certain that any such transition in our support operations will ultimately produce the expected benefits to our business or our customers.
| 28 |
Our stock price may be volatile.
We believe that certain factors, such as sales of our common stock into the market by existing stockholders, fluctuations in our quarterly operating results, changes in market conditions affecting stocks of computer hardware and software manufacturers and resellers generally and companies in the Internet and eCommerce industries in particular, could cause the market price of our common stock to fluctuate substantially. Other factors that could affect our stock price include, but are not limited to, the following:
| ● | failure to meet investors’ expectations regarding our operating performance; | |
| ● | changes in securities analysts’ recommendations or estimates of our financial performance; | |
| ● | publication of research reports by analysts; | |
| ● | changes in market valuations of similar companies; | |
| ● | announcements by us or our competitors of significant contracts, acquisitions, commercial relationships, joint ventures or capital commitments; | |
| ● | actual or anticipated fluctuations in our operating results; | |
| ● | litigation developments; and | |
| ● | general economic and market conditions or other economic factors unrelated to our performance, including disruptions in the capital and credit markets. |
The stock market in general, and the stocks of computer and software resellers, and companies in the Internet and electronic commerce industries in particular, and other technology or related stocks, have in the past experienced extreme price and volume fluctuations which have been unrelated to corporate operating performance. Such market volatility may adversely affect the market price of our common stock. In the past, following periods of volatility in the market price of a public company’s securities, securities class action litigation has often been instituted against that company. Such litigation, if asserted against us, could result in substantial costs to us and cause a likely diversion of our management’s attention from the operations of our company.
ITEM 1B. UNRESOLVED STAFF COMMENTS
None.
At December 31, 2017, we operated in approximately 925,000 square feet of space primarily in the United States, Canada, United Kingdom and the Philippines. We lease a total of approximately 567,000 square feet of space primarily used for office, distribution and data center purposes. We own a total of approximately 358,000 square feet of space, primarily used for our corporate headquarters, data center and warehouse purposes. Each of our facilities is utilized by one or more of our segments.
Our principal facilities at December 31, 2017 are set forth in the table below:
| Description | Sq. Ft. | Location | ||||
| Midwest Regional Headquarters, Sales Office and Distribution Center(1) | 144,000 | Lewis Center, OH | ||||
| Corporate Headquarters and Sales Office(1) | 83,864 | El Segundo, CA | ||||
| Acrodex Headquarters and Sales Office | 63,611 | Edmonton, Alberta | ||||
| Distribution Center | 126,621 | Worthington, OH | ||||
| Irvine Sales Office and Distribution Center(1) | 60,072 | Irvine, CA | ||||
| New Albany Data Center(1) | 30,850 | New Albany, OH | ||||
| Roswell Data Center | 15,700 | Roswell, GA | ||||
| (1) | Owned. |
In January 2017, we completed the purchase of real property in Woodridge, Illinois for approximately $3.1 million in cash. The real property includes approximately 29,344 square feet of office space.
In March 2015, we completed the purchase of real property in Irvine, California (the “Irvine Property”) for approximately $5.8 million and financed $4.9 million with a long-term note. The real property includes approximately 60,072 square feet of office and warehouse space and land. Certain of our subsidiaries were tenants of the building, which are continuing to use the office and warehouse space. In September 2015, we listed the Irvine Property for sale. Under a broker agreement, the Irvine Property is available for immediate sale in its present condition and it is being actively marketed for sale.
| 29 |
In January 2015, we completed the purchase of the real property located at Lewis Center, Ohio (our “Midwest Regional Headquarters, Sales Office and Distribution Center” included in the table above) for a total of $6.6 million. The real property is located in Lewis Center, Ohio and includes approximately 12.4 acres of land together with a building for office and warehouse space of approximately 144,000 square feet.
We are not currently a party to any material legal proceedings, other than ordinary routine litigation incidental to the business and certain other noteworthy proceedings described under the heading “Legal Proceedings” in Part II, Item 8, Note 10 to the Notes to the Consolidated Financial Statements of this report.
From time to time, we receive claims of and become subject to consumer protection, employment, intellectual property and other litigation related to the conduct of our business. Any such litigation could be costly and time consuming and could divert our management and key personnel from our business operations. In connection with any such litigation, we may be subject to significant damages or equitable remedies relating to the operation of our business. Any such litigation may materially harm our business, results of operations and financial condition.
ITEM 4. MINE SAFETY DISCLOSURES
Not applicable.
***
| 30 |
| ITEM 5. | MARKET FOR REGISTRANT’S COMMON EQUITY, RELATED STOCKHOLDER MATTERS AND ISSUER PURCHASES OF EQUITY SECURITIES |
Our common stock has been publicly traded on the Nasdaq Global Market since our initial public offering on April 4, 1995 and currently trades under the symbol PCMI. The following table sets forth the range of high and low sales price per share for our common stock for the periods indicated, as reported on the Nasdaq Global Market:
| Price Range of Common Stock | ||||||||
| High | Low | |||||||
| Year Ended December 31, 2017 | ||||||||
| First Quarter | $ | 29.85 | $ | 21.20 | ||||
| Second Quarter | 31.20 | 17.25 | ||||||
| Third Quarter | 20.50 | 11.80 | ||||||
| Fourth Quarter | 14.50 | 9.40 | ||||||
| Year Ended December 31, 2016 | ||||||||
| First Quarter | $ | 9.92 | $ | 7.48 | ||||
| Second Quarter | 11.39 | 7.99 | ||||||
| Third Quarter | 21.91 | 10.80 | ||||||
| Fourth Quarter | 24.53 | 18.06 | ||||||
As of the close of business on March 12, 2018, there were approximately 20 holders of record of our common stock.
We have never paid cash dividends on our capital stock and our credit facility prohibits us from paying any cash dividends on our capital stock. Therefore, we do not currently anticipate paying dividends; we intend to retain any earnings to finance the growth and development of our business.
Information regarding compensation plans under which our equity securities may be issued is included in Item 12 of Part III of this report through incorporation by reference to our definitive Proxy Statement to be filed in connection with our 2018 Annual Meeting of Stockholders.
| 31 |
Issuer Purchases of Equity Securities
We have a board approved discretionary stock repurchase program under which shares may be repurchased from time to time at prevailing market prices, through open market or unsolicited negotiated transactions, depending on market conditions. Our Board of Directors originally adopted the plan in October 2008 with an initial authorized maximum of $10 million. The plan was amended in September 2012 and increased to $20 million, again amended in April 2015 and increased to a total of $30 million, and again amended in August 2017 and increased to a total of $40 million. Under the program, the shares may be repurchased from time to time at prevailing market prices, through open market or unsolicited negotiated transactions, depending on market conditions. We expect that the repurchase of our common stock under the program will be financed with existing working capital and amounts available under our existing credit facility. The repurchased shares are held as treasury stock. No limit was placed on the duration of the repurchase program. There is no guarantee as to the exact number of shares that we will repurchase. Subject to applicable securities laws, repurchases may be made at such times and in such amounts as our management deems appropriate. The program can also be discontinued at any time management feels additional purchases are not warranted.
A summary of the repurchase activity for the three months ended December 31, 2017 is as follows (dollars in thousands, except per share amounts):
| Total
Number of Shares Purchased | Average
Price Paid Per Share | Total
Number of Shares Purchased as Part of Publicly Announced Plans or Programs | Maximum
Dollar Value that May Yet Be Purchased Under the Plans or Programs | |||||||||||||
| October 1, 2017 to October 31, 2017 | — | $ | — | — | $ | 2,725 | ||||||||||
| November 1, 2017 to November 30, 2017 | 23,000 | 10.81 | 23,000 | 2,476 | ||||||||||||
| December 1, 2017 to December 31, 2017 | — | — | — | 2,476 | ||||||||||||
| Total | 23,000 | 23,000 | ||||||||||||||
We repurchased 23,000 shares of our common stock under this program during the three months ended December 31, 2017 for $0.2 million. From the inception of the program in October 2008 through December 31, 2017, we have repurchased an aggregate of 4,973,974 shares of our common stock for a total cost of $37.5 million. At December 31, 2017, we had $2.5 million available in stock repurchases under the program, subject to any limitations that may apply from time to time under our existing credit facility.
Notwithstanding anything to the contrary set forth in any of the Company’s filings under the Securities Act of 1933, as amended, or the Securities Exchange Act of 1934, as amended, that might incorporate future filings, including this Annual Report on Form 10-K, in whole or in part, the Stock Performance Graph which follows shall not be deemed to be incorporated by reference into any such filings except to the extent that we specifically incorporate any such information into any such future filings.
Stock Performance Graph
The performance graph below compares the cumulative total stockholder return of our company with the cumulative total return of the Nasdaq Stock Market—the Nasdaq Composite Index and the Nasdaq Retail Trade Index. The graph assumes $100 invested at the per-share closing price of our common stock and each of the indices on December 31, 2012. The stock price performance shown in this graph is neither necessarily indicative of nor intended to suggest future stock price performance.
| 32 |
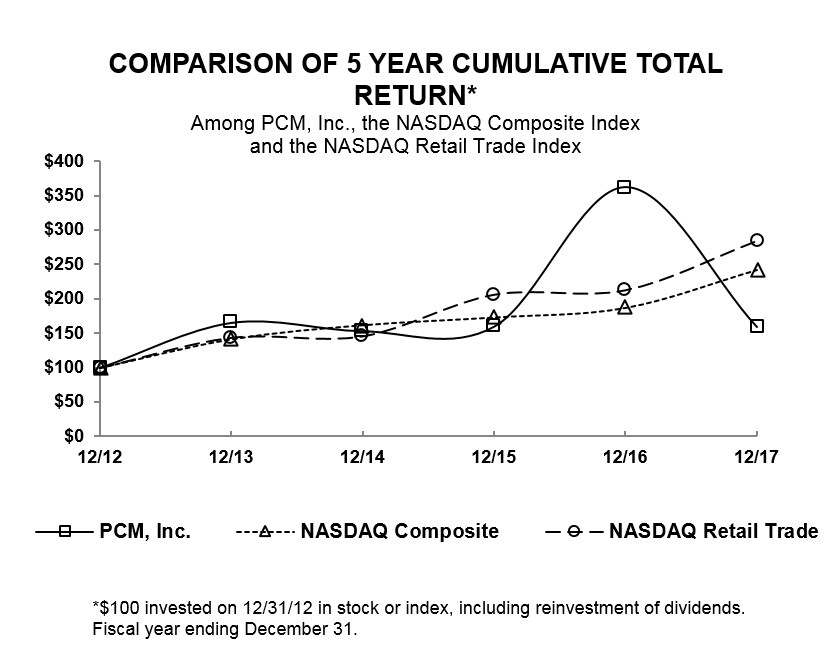
| Measurement Period (fiscal years covered) | ||||||||||||||||||||||||
| 12/2012 | 12/2013 | 12/2014 | 12/2015 | 12/2016 | 12/2017 | |||||||||||||||||||
| PCM, Inc. | $ | 100.00 | $ | 165.38 | $ | 153.30 | $ | 159.90 | $ | 362.32 | $ | 159.42 | ||||||||||||
| NASDAQ Composite | 100.00 | 141.63 | 162.09 | 173.33 | 187.19 | 242.29 | ||||||||||||||||||
| NASDAQ Retail Trade | 100.00 | 143.64 | 145.80 | 205.96 | 212.50 | 283.72 | ||||||||||||||||||
***
| 33 |
ITEM 6. SELECTED FINANCIAL DATA
The following selected consolidated financial data are qualified by reference to, and should be read in conjunction with, our consolidated financial statements and the notes thereto and “Management’s Discussion and Analysis of Financial Condition and Results of Operations” contained elsewhere herein.
The selected consolidated statements of operations data for the years ended December 31, 2017, 2016 and 2015 and the selected consolidated balance sheet data as of December 31, 2017 and 2016 presented below were derived from our audited consolidated financial statements, which are included elsewhere herein. The selected consolidated statements of operations data for the years ended December 31, 2014 and 2013 along with the consolidated balance sheet data as of December 31, 2015, 2014 and 2013 presented below were derived from our consolidated financial statements which are not included elsewhere herein.
| Years Ended December 31, | ||||||||||||||||||||
| 2017 | 2016 | 2015 | 2014 | 2013 | ||||||||||||||||
| (in thousands, except per share data) | ||||||||||||||||||||
| Consolidated Statements of Operations Data | ||||||||||||||||||||
| Net sales | $ | 2,193,436 | $ | 2,250,587 | $ | 1,661,948 | $ | 1,356,362 | $ | 1,359,999 | ||||||||||
| Cost of goods sold | 1,867,714 | 1,931,786 | 1,437,621 | 1,164,295 | 1,170,500 | |||||||||||||||
| Gross profit | 325,722 | 318,801 | 224,327 | 192,067 | 189,499 | |||||||||||||||
| Selling, general and administrative expenses | 314,281 | 284,010 | 249,809 | (1) | 176,362 | 171,279 | ||||||||||||||
| Operating profit (loss) | 11,441 | 34,791 | (25,482 | ) | 15,705 | 18,220 | ||||||||||||||
| Interest expense, net | 7,894 | 6,083 | 3,860 | 3,180 | 3,340 | |||||||||||||||
| Equity income from unconsolidated affiliate | 528 | — | — | — | — | |||||||||||||||
| Income (loss) from continuing operations before income taxes | 4,075 | 28,708 | (29,342 | ) | 12,525 | 14,880 | ||||||||||||||
| Income tax expense (benefit) | 984 | 11,115 | (11,394 | ) | 5,490 | 6,235 | ||||||||||||||
| Income (loss) from continuing operations | 3,091 | 17,593 | (17,948 | ) | 7,035 | 8,645 | ||||||||||||||
| Loss from discontinued operations, net of taxes | — | — | (310 | ) | (1,570 | ) | (516 | ) | ||||||||||||
| Net income (loss) | $ | 3,091 | $ | 17,593 | $ | (18,258 | ) | $ | 5,465 | $ | 8,129 | |||||||||
| Basic and Diluted Earnings (Loss) Per Common Share | ||||||||||||||||||||
| Basic EPS | ||||||||||||||||||||
| Income (loss) from continuing operations | $ | 0.25 | $ | 1.49 | $ | (1.49 | ) | $ | 0.57 | $ | 0.75 | |||||||||
| Loss from discontinued operations, net of taxes | — | — | (0.03 | ) | (0.12 | ) | (0.05 | ) | ||||||||||||
| Net income (loss) | $ | 0.25 | $ | 1.49 | $ | (1.52 | ) | $ | 0.45 | $ | 0.70 | |||||||||
| Diluted EPS | ||||||||||||||||||||
| Income (loss) from continuing operations | $ | 0.24 | $ | 1.40 | $ | (1.49 | ) | $ | 0.55 | $ | 0.73 | |||||||||
| Loss from discontinued operations, net of taxes | — | — | (0.03 | ) | (0.13 | ) | (0.05 | ) | ||||||||||||
| Net income (loss) | $ | 0.24 | $ | 1.40 | $ | (1.52 | ) | $ | 0.42 | $ | 0.68 | |||||||||
| (1) | Includes a $25.4 million write-off of internally developed software work in process related to our upcoming ERP and CRM systems, in favor of an ERP and CRM systems already configured and in production at En Pointe. |
| 34 |
| At December 31, | ||||||||||||||||||||
| 2017 | 2016 | 2015 | 2014 | 2013 | ||||||||||||||||
| (in thousands) | ||||||||||||||||||||
| Consolidated Balance Sheet Data | ||||||||||||||||||||
| Cash and cash equivalents | $ | 9,113 | $ | 7,172 | $ | 11,176 | $ | 8,892 | $ | 9,992 | ||||||||||
| Working capital | (7,719 | ) | (4,997 | ) | (9,165 | ) | 63,425 | 57,595 | ||||||||||||
| Total assets | 740,252 | 629,810 | 600,173 | 389,190 | 434,822 | |||||||||||||||
| Short-term debt | 3,362 | 15,769 | (1) | 17,711 | (1) | 3,741 | 1,167 | |||||||||||||
| Line of credit | 213,778 | 107,396 | 162,439 | 52,795 | 110,499 | |||||||||||||||
| Long-term debt, excluding current portion.. | 32,892 | 18,750 | 21,454 | 22,415 | 13,742 | |||||||||||||||
| Total stockholders’ equity | 127,626 | 128,471 | 109,515 | 133,316 | 125,762 | |||||||||||||||
| (1) | Short-term debt at December 31, 2016 and 2015 includes $4.6 million and $4.8 million, respectively, classified on our Consolidated Balance Sheet as “Note payable related to asset held for sale” relating to the mortgage on our Irvine property that is held for sale. |
During 2014, we discontinued the operation of all four of our retail stores, located in Huntington Beach, Santa Monica and Torrance, California and Chicago, Illinois, and our OnSale and eCost businesses. We reflected the results of these operations, which were historically reported as a part of our MacMall segment at the time, as discontinued operations for all periods presented herein in our Consolidated Balance Sheets and Consolidated Statements of Operations.
***
| 35 |
| ITEM 7. | MANAGEMENT’S DISCUSSION AND ANALYSIS OF FINANCIAL CONDITION AND RESULTS OF OPERATIONS |
You should read the following Management’s Discussion and Analysis of Financial Condition and Results of Operations together with the consolidated financial statements and related notes thereto included elsewhere in this report. This discussion contains forward-looking statements that involve risks and uncertainties. Our actual results could differ materially from those anticipated in these forward-looking statements as a result of various factors, including those described under “Risk Factors” in Part I, Item 1A and elsewhere in this report.
BUSINESS OVERVIEW
PCM, Inc. is a leading multi-vendor provider of technology solutions, including hardware products, software and services, offered through our dedicated sales force, ecommerce channels and technology services teams. Since our founding in 1987, we have served our customers by offering products and services from vendors such as Adobe, Apple, Cisco, Dell, Hewlett Packard Enterprise, HP Inc., Lenovo, Microsoft, Oracle, Symantec and VMware. We provide our customers with comprehensive solutions incorporating leading products and services across a variety of technology practices and platforms such as cloud, security, data center, networking, collaboration and mobility. Our sales and marketing efforts allow our vendor partners to reach multiple customer segments including small, medium and enterprise businesses, state, local and federal governments and educational institutions.
In connection with our entrance into the UK market in the first quarter of 2017 with the formation of PCM Technology Solutions UK, Ltd (“PCM UK”), we formed a new operating segment called United Kingdom. In February 2016, we transitioned out nearly the entire management overhead of our MacMall business, thinned out its cost structure and brought it under the management and supervision of our Commercial segment. Also, in connection with our acquisitions of Acrodex and certain assets of Systemax’s North American Technology Group in the fourth quarter of 2015, which are both described more fully below under “Strategic Developments – Acquisitions,” and our resulting entrance into selling technology solutions in the Canadian market, we formed a new operating segment called Canada, which includes our operations related to these Canadian market activities. As a result, we operate in four reportable segments: Commercial, Public Sector, Canada and United Kingdom. Our reportable operating segments are primarily aligned based upon our reporting of results as used by our chief operating decision maker in evaluating the operating results and performance of our company. We include corporate related expenses such as legal, accounting, information technology, product management and other administrative costs that are not otherwise included in our reportable operating segments in Corporate & Other. All historical segment financial information provided herein has been revised to reflect our revised reportable operating segments.
We sell primarily to customers in the United States, Canada and the UK, and maintain offices in the United States, Canada and the UK, as well as in the Philippines. In 2017, we generated approximately 79% of our revenue in our Commercial segment, 13% of our revenue in our Public Sector segment and 8% of our revenue in our Canada segment. PCM UK commenced its sales operations in May 2017 and our United Kingdom segment net sales were $12.2 million in the year ended December 31, 2017.
Our Commercial segment sells complex technology solutions to commercial businesses in the United States, using multiple sales channels, including a field relationship-based selling model, an outbound phone based sales force, a field services organization and online extranets.
Our Public Sector segment consists of sales made primarily to federal, state and local governments, as well as educational institutions. The Public Sector segment utilizes an outbound phone and field relationship-based selling model, as well as contract and bid business development teams and an online extranet.
Our Canada segment consists of sales made to customers in the Canadian market beginning as of the respective dates of our acquisition of Acrodex and certain assets of Systemax in October and December 2015, respectively, as well as the acquisition of Stratiform in December 2016.
Our United Kingdom segment consists of results of our UK subsidiary, PCM UK, and its wholly-owned subsidiaries, which serve as our hub for the UK and the rest of Europe.
We experience variability in our net sales and operating results on a quarterly basis as a result of many factors. We experience some seasonal trends in our sales of technology solutions to businesses, government and educational institutions. For example, the timing of capital budget authorizations for our commercial customers can affect when these companies can procure IT products and services. The fiscal year-ends of U.S. Public Sector customers vary for those in the federal government space and those in the state and local government and educational institution (“SLED”) space. We generally see an increase in our second quarter sales related to customers in the U.S. SLED sector and in our third quarter sales related to customers in the federal government space as these customers close out their budgets for their fiscal year. Further, our Canadian business may see seasonal increases in the first quarter due to Canadian SLED budgets being closed out in the first quarter. We may also experience variability in our gross profit and gross profit margin as a result of changes in the various vendor programs we participate in and its effect on the amount of vendor consideration we receive from a particular vendor, which may be impacted by a number of events outside of our control. As such, the results of interim periods are not necessarily indicative of the results that may be expected for any other interim period or for the full year.
| 36 |
A substantial portion of our business is dependent on sales of Cisco, HP Inc. and Microsoft products as well as products purchased from other vendors including Apple, Dell, Hewlett Packard Enterprise, Ingram Micro, Lenovo, Synnex and Tech Data. Our top sales of products by manufacturer as a percent of our gross billed sales were as follows for the periods presented:
| Years Ended December 31, | ||||||||||||
| 2017 | 2016 | 2015 | ||||||||||
| Microsoft | 15 | % | 15 | % | 14 | % | ||||||
| HP Inc. | 10 | 10 | 11 | |||||||||
Our planned operating expenditures each quarter are based in large part on sales forecasts for the quarter. If our sales do not meet expectations in any given quarter, our operating results for the quarter may be materially adversely affected. Our narrow margins may magnify the impact of these factors on our operating results. Management regularly reviews our operating performance using a variety of financial and non-financial metrics including sales, shipments, margin, vendor consideration, advertising expense, personnel costs, account executive productivity, accounts receivable aging, inventory turnover, liquidity and cash resources. Our management monitors the various metrics against goals and budgets, and makes necessary adjustments intended to enhance our performance.
General economic conditions have an effect on our business and results of operations across all of our segments. If economic growth in the U.S., Canada, the UK and other countries slows or declines, government, consumer and business spending rates could be significantly reduced. These developments could also increase the risk of uncollectible accounts receivable from our customers. The economic climate in the U.S., Canada, UK and elsewhere could have an impact on the rate of information technology spending of our current and potential customers, which would impact our business and results of operations. These factors affect sales of our products, sales cycles, adoption rates of new technologies and level of price competition. We continue to focus our efforts on cost controls, competitive pricing strategies, and driving higher margin service and solution sales. We also continue to make selective investments in our sales force personnel, service and solutions capabilities and IT infrastructure and tools in an effort to meet vendor program requirements and to position us for enhanced productivity and future growth.
STRATEGIC DEVELOPMENTS
Acquisitions
Provista Technology
On December 22, 2017, PCM UK, our U.K. based subsidiary, completed the acquisition of Provista Technology for £4,100,000 in cash (or $3.1 million, net of cash acquired). Provista is highly regarded in its expertise across a range of technologies and manufacturers including Cisco, Avaya, Cisco Meraki, Huawei, Checkpoint, and other leading vendors, with offerings encompassing all aspects of Cloud Networking, Cloud Video, Hyperconvergence, Security, Collaboration, Secure Wireless and IP LAN, WAN & Data Center Networks. We believe this acquisition will further enhance PCM UK’s expertise and vendor accreditations in the United Kingdom as a Cisco Gold Partner, allowing PCM UK and its subsidiaries to offer further consultancy, integration and supply of services and solutions across the UK marketplace while replicating many existing offerings from our North American organization.
Stack Technology
On September 22, 2017, PCM UK completed the acquisition of Stack Technology for £1,350,000 in cash (or $1.7 million, net of cash acquired). Stack Technology, headquartered in Liverpool, United Kingdom, specializes in the selection, implementation and management of leading IT solutions, with offerings encompassing all aspects of cloud-based solutions, security, virtualization, data services, unified communications, and infrastructure.
Stratiform
On December 29, 2016, we completed the acquisition of Stratiform, Inc. for C$2.1 million in cash (or $1.6 million). Stratiform is an industry-leading provider of cloud IT solutions that include consulting, professional and managed services to clients across Canada.
| 37 |
Systemax
On December 1, 2015, we completed the acquisition of certain Business to Business (B2B) assets of Systemax’s North American Technology Group (NATG) for $14 million in cash. We acquired the right to hire approximately 400 B2B sales representatives located across the United States and Canada, all rights to the NATG B2B customer list, certain B2B customer and vendor contracts, trademarks and other intellectual property rights including the TigerDirect brand, and certain fixed assets and equipment. We did not acquire cash, accounts receivable, inventory or assume trade payables in connection with the transaction. Also at closing, the parties entered into a transition services agreement to facilitate an orderly transition of the purchased assets. We assumed certain leases and entered into certain subleases for office space where the B2B sales representatives currently work. In January 2016, we exercised an option in our purchase agreement and paid $0.4 million related to our purchase of additional customer list information, which was recorded as an increase to goodwill associated with the Systemax assets acquisition. As of December 31, 2016, we have finalized the accounting for the Systemax asset acquisition and the related purchase price allocation with no changes to the initial accounting and purchase price allocation recorded as of December 31, 2015.
Acrodex
On October 26, 2015, PCM Sales Canada, Inc., our Canadian- based subsidiary, completed the acquisition of all the outstanding common stock of Acrodex, Inc. (“Acrodex”) for a total purchase price of approximately C$16.7 million (or $13.6 million, net of cash acquired). Acrodex, headquartered in Edmonton, Alberta (Canada), provides end-to-end infrastructure solutions from initial plan and design, through procurement and installation, to full support and on-going management. Acrodex’s core business areas include software value-added reseller services, software asset management and hardware sales and services, including client device products, servers, storage, networks, printers and a full complement of accessories and devices. Services are a significant component to Acrodex’s product mix and include managed services, cloud-based services, consulting, IT management and other IT service areas.
In March 2016 and June 2016, we paid an additional $0.2 million and $0.1 million, respectively, related to adjustments to the net asset value as defined in the agreement, which was recorded as an increase to goodwill resulting from the Acrodex acquisition. As of September 30, 2016, we have finalized the final fair value determination and purchase price allocation for the Acrodex acquisition, and there has been no other change to the preliminary accounting for the Acrodex acquisition and the related purchase price allocation.
En Pointe
On April 1, 2015, we completed the acquisition of certain assets of En Pointe, one of the nation’s largest independent IT solutions providers, headquartered in Southern California. En Pointe is our largest acquisition to date based on revenues, and is expected to significantly enhance our relationships with several key vendor partners, provide incremental advanced technical certifications and operational expertise in key practice areas, and bring the consolidated business significantly increased scale. We acquired the assets of En Pointe’s IT solutions provider business, excluding cash and other current tangible assets such as accounts receivable. The assets were acquired by an indirect wholly-owned subsidiary of PCM, which subsidiary now operates under the En Pointe brand. Under the terms of the agreement, we paid an initial purchase price of $15 million in cash and an additional $2.3 million for inventory. We agreed to pay certain contingent earn-out consideration, including 22.5% of the future adjusted gross profit of the business and 10% of certain service revenues over the three years following the closing of the acquisition. As of December 31, 2016, we have estimated that the fair value of contingent consideration to be paid throughout the earn-out period ending March 31, 2018 to be approximately $38.6 million, representing no change from December 31, 2015. During 2017, 2016 and 2015, we made $13.4 million, $13.1 million, $8.9 million, respectively, of earn-out payments to the sellers of En Pointe. The fair value of this contingent consideration was historically determined and accrued based on a probability weighted average of possible outcomes that would occur should certain financial metrics be reached. Because there is no market data available to use in valuing the contingent consideration, we developed our own assumptions related to the future financial performance of the businesses to determine the fair value of this liability. As such, the valuation of the contingent consideration is determined using Level 3 inputs. The significant inputs into the calculation of the contingent consideration include projected gross profit values of the Commercial and Public Sector components of En Pointe and the weighted average cost of capital of each component. The payments made to date have been reasonably consistent with the historical fair value analysis and thus have not resulted in a change to the estimated liability. At the end of the earn-out period in 2018, we will make a final adjustment to the earn-out based on actual payments, with any adjustment to be recorded in our consolidated statement of operations.
The accounting for the acquisition of En Pointe was finalized as of December 31, 2015. The purchase price has been allocated to the acquired assets and assumed liabilities, which include, but are not limited to, fixed assets, licenses, intangible assets and professional liabilities, based on estimated fair values as of the date of acquisition.
| 38 |
Investment in Non-Consolidated Affiliate
Based on various supplier diversity policies and requirements of certain customers whose contracts we acquired rights to in connection with the En Pointe transaction, beginning in the first quarter of 2017, our financial results do not consolidate the financial results of sales made under some customer contracts we purchased in the En Pointe acquisition, which are now held by a partner which qualifies for certification as a minority and women owned business in accordance with customer supplier diversity policies. We hold a 49% passive equity interest in this partner and we have accounted for our investment in this partner using the equity method of accounting beginning in the first quarter of 2017. We refer to this entity as the non-controlled entity or NCE. We record our results from our 49% equity interest in the NCE’s operations as “Equity income from unconsolidated affiliate” in our consolidated statement of operations.
ERP Upgrades
We have been in the process of upgrading our ERP systems due to the discontinued third party support of certain of our aged legacy systems, our changing IT needs when considering the transitioning state of our business from our origins towards becoming a leading IT solution provider and the ongoing desire to integrate multiple systems upon which we currently operate as a result of multiple acquisitions. In this regard, we previously purchased licenses for Microsoft Dynamics AX and other related modules to provide a complete, robust and integrated ERP solution and have expended time, effort and resources to implement this AX solution for our legacy businesses. We believe the implementation and upgrade of our systems should help us to gain further efficiencies across our organizations. Our newly acquired En Pointe business has operated for a number of years on an implemented and successfully functioning SAP system. As a result of the En Pointe acquisition, we considered new issues related to the costs, risks and benefits of either continuing the implementation of our AX solution and moving En Pointe to such AX solution or moving the legacy businesses to the SAP solution. In response, we shifted certain of our IT development efforts towards assessing these respective costs, risks and benefits. There are significant risks and uncertainties in adopting and implementing a new ERP system and as part of our assessment of these alternatives, we considered the fact that En Pointe has been successfully functioning on its SAP system for many years while none of our businesses have operated on the AX system. While we believe the AX solution has many valuable features and that it has been essential that we have undertaken our AX development efforts to date, we have weighed these attributes and the transition risk inherent with any such new solution against the fact that En Pointe, with similar business characteristics and system needs to our legacy businesses, has been successfully operating on its SAP system for a number of years. As a result of the assessments performed, our management concluded that the SAP solution is the best, most viable and cost effective option for our consolidated business going forward. To that end, in late October 2015, our management determined, and our Board of Directors approved such determination, to adopt the SAP platform across all of our business units and approved the non-cash write-off of the remaining $22.1 million of work in process software previously capitalized for all major phases of the design, configuration and customization of the AX solution to date. For the year ended December 31, 2015, a total of $25.4 million of non-cash charge related to the ERP and CRM write-offs were included in “Selling, general and administrative expenses” on our Consolidated Statements of Operations.
We have made significant progress in the configuration and implementation of the SAP platform and have begun the migration process. The migration process started in the second quarter of 2017 and it will continue through 2018. We anticipate completion of migration of a significant portion of our legacy systems to the SAP platform in 2018 with a total expected capitalized cost of under $5 million.
Real Estate Transactions
In January 2017, we completed the purchase of real property in Woodridge, Illinois for approximately $3.1 million in cash. The real property includes approximately 29,344 square feet of office space.
In March 2015, we completed the purchase of real property in Irvine, California (the “Irvine Property”) for approximately $5.8 million and financed $4.9 million with a long-term note. The real property includes approximately 60,072 square feet of office and warehouse space and land. In September 2015, we listed our real property located in Irvine, California (the “Irvine Property”) for sale. Under a broker agreement, the Irvine Property is available for immediate sale in its present condition. We classified $5.8 million related to the Irvine Property, stated at lower of cost or fair value, as “Property held for sale” and $4.6 million related to the mortgage on the Irvine Property as “Note payable related to asset held for sale” on our Consolidated Balance Sheet as of December 31, 2016. As of December 31, 2017, the Irvine Property, which continues to be available for sale, was classified as part of “Property and equipment, net” and the related mortgage as part of “Notes payable-current” and “Notes payable” on our Consolidated Balance Sheet as it no longer met the criteria for held for sale classification primarily due to passage of time.
In January 2015, we completed the purchase of the real property located at Lewis Center, Ohio (our “Midwest Regional Headquarters, Sales Office and Distribution Center” included in the table above) for a total of $6.6 million. The real property is located in Lewis Center, Ohio and includes approximately 12.4 acres of land together with a building for office and warehouse space of approximately 144,000 square feet. Certain of our subsidiaries were tenants of the building, which are continuing to use the office and warehouse space.
| 39 |
For more information on the financing arrangements on the transactions discussed above, see Note 8 of the Notes to the Consolidated Financial Statements in Part II, Item 8 of this Annual Report on Form 10-K.
Common Stock Repurchase Program
We have a board approved discretionary stock repurchase program under which shares may be repurchased from time to time at prevailing market prices, through open market or unsolicited negotiated transactions, depending on market conditions. Our Board of Directors originally adopted the plan in October 2008 with an initial authorized maximum of $10 million. The plan was amended in September 2012 and increased to $20 million, again amended in April 2015 and increased to a total of $30 million, and again amended in August 2017 and increased to a total of $40 million. Under the program, the shares may be repurchased from time to time at prevailing market prices, through open market or unsolicited negotiated transactions, depending on market conditions. We expect that the repurchase of our common stock under the program will be financed with existing working capital and amounts available under our existing credit facility. The repurchased shares are held as treasury stock. No limit was placed on the duration of the repurchase program. There is no guarantee as to the exact number of shares that we will repurchase. Subject to applicable securities laws, repurchases may be made at such times and in such amounts as our management deems appropriate. The program can also be discontinued at any time management feels additional purchases are not warranted.
We repurchased 23,000 shares of our common stock under this program during the three months ended December 31, 2017 for $0.2 million. From the inception of the program in October 2008 through December 31, 2017, we have repurchased an aggregate of 4,973,974 shares of our common stock for a total cost of $37.5 million. At December 31, 2017, we had $2.5 million available in stock repurchases under the program, subject to any limitations that may apply from time to time under our existing credit facility.
CRITICAL ACCOUNTING POLICIES AND ESTIMATES
Our consolidated financial statements have been prepared in accordance with accounting principles generally accepted in the United States of America. The preparation of our consolidated financial statements requires management to make estimates, judgments and assumptions that affect the reported amounts of assets, liabilities, net sales and expenses, as well as the disclosure of contingent assets and liabilities. Management bases its estimates, judgments and assumptions on historical experience and on various other factors that we believe to be reasonable under the circumstances, the results of which form the basis for making judgments about carrying values of assets and liabilities that are not readily apparent from other sources. Due to the inherent uncertainty involved in making estimates, actual results reported for future periods may be affected by changes in those estimates, and revisions to estimates are included in our results for the period in which the actual amounts become known.
Management considers an accounting estimate to be critical if:
| ● | it requires assumptions to be made that were uncertain at the time the estimate was made; and | |
| ● | changes in the estimate or different estimates that could have been selected could have a material impact on our consolidated results of operations or financial position. |
Management has discussed the development and selection of these critical accounting policies and estimates with the audit committee of our board of directors. We believe the critical accounting policies described below affect the more significant judgments and estimates used in the preparation of our consolidated financial statements. For a summary of our significant accounting policies, including those discussed below, see Note 2 of the Notes to the Consolidated Financial Statements in Item 8, Part II, of this Annual Report on Form 10-K.
Revenue Recognition. We adhere to the guidelines and principles of sales recognition described in ASC 605 — Revenue Recognition. Under ASC 605, product sales are recognized when the title and risk of loss are passed to the customer, there is persuasive evidence of an arrangement for sale, delivery has occurred and/or services have been rendered, the sales price is fixed or determinable and collectability is reasonably assured. Under these guidelines, the majority of our sales, including revenue from product sales and gross outbound shipping and handling charges, are recognized upon receipt of the product by the customer. In accordance with our revenue recognition policy, we perform an analysis to estimate the number of days products we have shipped are in transit to our customers using data from our third party carriers and other factors. We record an adjustment to reverse the impact of sale transactions based on the estimated value of products that have shipped, but have not yet been received by our customers, and we recognize such amounts in the subsequent period when delivery has occurred. Changes in delivery patterns or unforeseen shipping delays beyond our control could have a material impact on our revenue recognition for the current period.
| 40 |
For all product sales shipped directly from suppliers to customers, we take title to the products sold upon shipment, bear credit risk, and bear inventory risk for returned products that are not successfully returned to suppliers; therefore, these revenues are recognized at gross sales amounts.
We also sell certain products for which we act as an agent in accordance with ASC 605-45. Products in this category include the sale of third-party services, warranties, software assurance (“SA”) and subscriptions. SA is an “insurance” or “maintenance” product that allows customers to upgrade, at no additional cost, to the latest technology if new applications are introduced during the period that the SA is in effect. These sales do not meet the criteria for gross sales recognition, and thus are recognized on a net basis at the time of sale. Under net sales recognition, the cost paid to the vendor or third-party service provider is recorded as a reduction to sales, resulting in net sales being equal to the gross profit on the transaction.
Some of our larger customers are offered the opportunity by certain of our vendors to purchase software licenses and SA under enterprise agreements (“EAs”). Under EAs, customers are considered to be compliant with applicable license requirements for the ensuing year, regardless of changes to their employee base. Customers are charged an annual true-up fee for changes in the number of users over the year. With most EAs, our vendors will transfer the license and invoice the customer directly, paying us an agency fee or commission on these sales. We record these fees as a component of net sales as earned and there is no corresponding cost of sales amount. In certain instances, we invoice the customer directly under an EA and account for the individual items sold based on the nature of the item. Our vendors typically dictate how the EA will be sold to the customer.
When a customer order contains multiple deliverables such as hardware, software and services which are delivered at varying times, we determine whether the delivered items can be considered separate units of accounting as prescribed under ASC 605-25, Revenue Recognition, Multiple-Element Arrangements. For arrangements with multiple units of accounting, arrangement consideration is allocated among the units of accounting, where separable, based on their relative selling price. Relative selling price is determined based on vendor-specific objective evidence, if it exists. Otherwise, third-party evidence of selling price is used, when it is available, and in circumstances when neither vendor-specific objective evidence nor third-party evidence of selling price is available, management’s best estimate of selling price is used.
Revenue from professional services is either recognized as incurred for services billed at an hourly rate or recognized using the proportional performance method for services provided at a fixed fee. Revenue for data center services, including internet connectivity, web hosting, server co-location and managed services, is recognized over the period the service is performed.
Sales are reported net of estimated returns and allowances, discounts, mail-in rebate redemptions and credit card chargebacks. If the actual sales returns, allowances, discounts, mail-in rebate redemptions or credit card chargebacks are greater than estimated by management, additional expense may be incurred.
Vendor Consideration. We receive vendor consideration from our vendors in the form of cooperative marketing allowances, volume incentive rebates and other programs to support our marketing of their products. Most of our vendor consideration is accrued, when performance required for recognition is completed, as an offset to cost of sales in accordance with ASC 605-50, Customer Payments and Incentives since such funds are not a reimbursement of specific, incremental, identifiable costs incurred by us in selling the vendors’ products. At the end of any given period, billed or accrued receivables related to our vendor consideration are included in our “Accounts receivable, net of allowances.” Any change by the vendors of their program requirements or any changes in estimates of performance under such programs could have a material impact to our results of operations.
Goodwill and Intangible Assets. Goodwill and indefinite-lived intangible assets are carried at historical cost, subject to write-down, as needed, based upon an impairment analysis that we perform annually, or sooner if an event occurs or circumstances change that would more likely than not result in an impairment loss. We perform our annual impairment test for goodwill and indefinite-lived intangible assets as of October 1 of each year.
Goodwill impairment is deemed to exist if the net book value of a reporting unit exceeds its estimated fair value. Events that may create an impairment include, but are not limited to, significant and sustained decline in our stock price or market capitalization, significant underperformance of operating units and significant changes in market conditions. Changes in estimates of future cash flows or changes in market values could result in a write-down of our goodwill in a future period. If an impairment loss results from any impairment analysis as described above, such loss will be recorded as a pre-tax charge to our operating income. Goodwill is allocated to various reporting units, which are generally an operating segment or one level below the operating segment. At October 1, 2017, our goodwill resided in our Abreon, Commercial Technology, Public Sector and Canada reporting units.
| 41 |
Goodwill impairment testing is a two-step process. Step one involves comparing the fair value of our reporting units to their carrying amount. If the fair value of the reporting unit is greater than its carrying amount, there is no impairment and no further testing is required. If the reporting unit’s carrying amount is greater than the fair value, the second step must be completed to measure the amount of impairment, if any. Step two calculates the implied fair value of goodwill by deducting the fair value of all tangible and intangible assets, excluding goodwill, of the reporting unit from the fair value of the reporting unit as determined in step one. The implied fair value of goodwill determined in this step is compared to the carrying value of goodwill. If the implied fair value of goodwill is less than the carrying value of goodwill, an impairment loss is recognized equal to the difference.
We performed our annual impairment analysis of goodwill and indefinite-lived intangible assets for possible impairment as of October 1, 2017. Our annual impairment analysis excluded goodwill associated with acquisitions made during the third and fourth quarter of 2017, as their purchase price allocations were completed subsequent to the analysis date, and their operations have not had sufficient operating time to suggest any triggering event would have occurred. Our management, with the assistance of an independent third-party valuation firm, determined the fair values of our reporting units and their underlying assets, and compared them to their respective carrying values. Goodwill represents the excess of the purchase price over the fair value of the net tangible and identifiable intangible assets acquired in each business combination. The carrying value of goodwill was allocated to our reporting units pursuant to ASC 350. As a result of our annual impairment analysis as of October 1, 2017, we have determined that no impairment of goodwill and other indefinite-lived intangible assets existed.
Fair value was determined by using a weighted combination of a market-based approach and an income approach, as this combination was deemed to be the most indicative of fair value in an orderly transaction between market participants. Under the market-based approach, we utilized information regarding our company and publicly available comparable company and industry information to determine cash flow multiples and revenue multiples that are used to value our reporting units. Under the income approach, we determined fair value based on estimated future cash flows of each reporting unit, discounted by an estimated weighted-average cost of capital, which reflects the overall level of inherent risk of a reporting unit and the rate of return an outside investor would expect to earn.
In addition, fair value of our indefinite-lived trademark was determined using the relief from royalty method under the income approach to value. This method applies a market based royalty rate to projected revenues that are associated with the trademarks. Applying the royalty rate to projected revenues resulted in an indication of the pre-tax royalty savings associated with ownership of the trademarks. Projected after-tax royalty savings were discounted to present value at the reporting unit’s weighted average cost of capital, and a tax amortization benefit (calculated based on a 15-year life for tax purposes) was added.
In conjunction with our annual assessment of goodwill, our valuation techniques did not indicate any impairment as of October 1, 2017. All reporting units with goodwill passed the first step of the goodwill evaluation, with the fair values of our Abreon, Commercial Technology, Public Sector and Canada reporting units exceeding their respective carrying values by 56%, 46%, 63% and 103% and, accordingly, we were not required to perform the second step of the goodwill evaluation. We had $7.2 million, $62.5 million, $8.3 million and $6.5 million of goodwill as of October 1, 2017 residing in our Abreon, Commercial Technology, Public Sector and Canada reporting units, respectively. In applying the market and income approaches to determining fair value of our reporting units, we rely on a number of significant assumptions and estimates including revenue growth rates and operating margins, discount rates and future market conditions, among others. Our estimates are based upon assumptions we believe to be reasonable, but which by nature are uncertain and unpredictable. Changes in one or more of these significant estimates or assumptions could affect the results of these impairment reviews.
As part of our annual review for impairment, we assessed the total fair values of the reporting units and compared total fair value to our market capitalization at October 1, 2017, including the implied control premium, to determine if the fair values are reasonable compared to external market indicators. When comparing our market capitalization to the discounted cash flow models for each reporting unit summed together, the implied control premium was approximately 34% as of October 1, 2017.
Given continuing economic uncertainties and related risks to our business, there can be no assurance that our estimates and assumptions made for purposes of our goodwill and indefinite-lived intangible assets impairment testing as of October 1, 2017 will prove to be accurate predictions of the future. We may be required to record additional goodwill impairment charges in future periods, whether in connection with our next annual impairment testing as of October 1, 2018 or prior to that, if any change constitutes a triggering event outside of the quarter from when the annual goodwill and indefinite-lived intangible assets impairment test is performed. It is not possible at this time to determine if any such future impairment charge would result or, if it does, whether such charge would be material.
| 42 |
We amortize other intangible assets with definite lives generally on a straight-line basis over their estimated useful lives, or in the case of customer relationships, based on a relative percentage of annual discounted cash flows expected to be delivered by the asset over its estimated useful life.
RESULTS OF OPERATIONS
Consolidated Statements of Operations Data
The following table sets forth, for the years indicated, our Consolidated Statements of Operations (in thousands) and information derived from our Consolidated Statements of Operations expressed as a percentage of net sales. There can be no assurance that trends in net sales, gross profit or operating results will continue in the future.
| Years Ended December 31, | ||||||||||||
| 2017 | 2016 | 2015 | ||||||||||
| Net sales | $ | 2,193,436 | $ | 2,250,587 | $ | 1,661,948 | ||||||
| Cost of goods sold | 1,867,714 | 1,931,786 | 1,437,621 | |||||||||
| Gross profit | 325,722 | 318,801 | 224,327 | |||||||||
| Selling, general and administrative expenses | 314,281 | 284,010 | 249,809 | |||||||||
| Operating profit (loss) | 11,441 | 34,791 | (25,482 | ) | ||||||||
| Interest expense, net | 7,894 | 6,083 | 3,860 | |||||||||
| Equity income from unconsolidated affiliate | 528 | — | — | |||||||||
| Income (loss) from continuing operations before income taxes | 4,075 | 28,708 | (29,342 | ) | ||||||||
| Income tax expense (benefit) | 984 | 11,115 | (11,394 | ) | ||||||||
| Income (loss) from continuing operations | 3,091 | 17,593 | (17,948 | ) | ||||||||
| Loss from discontinued operations, net of taxes | — | — | (310 | ) | ||||||||
| Net income (loss) | $ | 3,091 | $ | 17,593 | $ | (18,258 | ) | |||||
| As
a Percentage of Net Sales For Years Ended December 31, | ||||||||||||
| 2017 | 2016 | 2015 | ||||||||||
| Net sales | 100.0 | % | 100.0 | % | 100.0 | % | ||||||
| Cost of goods sold | 85.2 | 85.8 | 86.5 | |||||||||
| Gross profit | 14.8 | 14.2 | 13.5 | |||||||||
| Selling, general and administrative expenses | 14.3 | 12.6 | 15.0 | |||||||||
| Operating profit (loss) | 0.5 | 1.6 | (1.5 | ) | ||||||||
| Interest expense, net | 0.3 | 0.3 | 0.3 | |||||||||
| Equity income from unconsolidated affiliate | 0.0 | — | — | |||||||||
| Income (loss)from continuing operations before income taxes | 0.2 | 1.3 | (1.8 | ) | ||||||||
| Income tax expense (benefit) | 0.1 | 0.5 | (0.7 | ) | ||||||||
| Income (loss)from continuing operations | 0.1 | 0.8 | (1.1 | ) | ||||||||
| Loss from discontinued operations, net of taxes | — | — | (0.0 | ) | ||||||||
| Net income (loss) | 0.1 | % | 0.8 | % | (1.1 | )% | ||||||
Year Ended December 31, 2017 Compared to the Year Ended December 31, 2016
Net Sales
The following table presents our net sales by segment for the periods presented (in thousands):
| Year Ended December 31, | ||||||||||||||||||||||||
| 2017 | 2016 | |||||||||||||||||||||||
| Net Sales | Percentage
of Total Net Sales | Net Sales | Percentage
of Total Net Sales | Dollar Change | Percent Change | |||||||||||||||||||
| Commercial | $ | 1,732,439 | 79 | % | $ | 1,746,530 | 77 | % | $ | (14,091 | ) | (1 | )% | |||||||||||
| Public Sector | 277,882 | 13 | 353,497 | 16 | (75,615 | ) | (21 | ) | ||||||||||||||||
| Canada | 171,335 | 8 | 150,643 | 7 | 20,692 | 14 | ||||||||||||||||||
| United Kingdom | 12,235 | — | — | — | 12,235 | NM | (1) | |||||||||||||||||
| Corporate & Other | (455 | ) | — | (83 | ) | — | (372 | ) | NM | (1) | ||||||||||||||
| Consolidated | $ | 2,193,436 | 100 | % | $ | 2,250,587 | 100 | % | $ | (57,151 | ) | (3 | ) | |||||||||||
| (1) | Not meaningful. |
| 43 |
Consolidated net sales were $2,193.4 million in 2017 compared to $2,250.6 million in 2016, a decrease of $57.2 million, or 3%. Our consolidated net sales in 2017 do not include $98.7 million of net sales made under contracts held by the NCE. Consolidated sales of services were $160.8 million in 2017 compared to $143.2 million in 2016, an increase of $17.6 million, or 12%, and represented 7% and 6% of consolidated net sales in 2017 and 2016, respectively.
Commercial net sales were $1,732.4 million in 2017 compared to $1,746.5 million in 2016, a decrease of $14.1 million or 1% despite the impact of $98.7 million of net sales made under contracts now held by the NCE and not consolidated in our Commercial net sales. Sales of services in our Commercial segment were $116.3 million in 2017 compared to $107.6 million in 2016, an increase of $8.7 million, or 8%, and represented 7% and 6% of Commercial net sales in 2017 and 2016, respectively.
Public Sector net sales were $277.9 million in 2017 compared to $353.5 million in 2016, a decrease of $75.6 million, or 21%. Our Federal sales decreased by 24%, while our State, Local and Educational Sales decreased by 20%. Public Sector business was also impacted by the departure of the president of our Public Sector business in the fourth quarter of 2017 for personal reasons unrelated to the business, and we are currently undertaking a search for his replacement. Sales of services in our Public Sector segment were $13.9 million in 2017 compared to $11.5 million in 2016, an increase of $2.4 million, or 21%, and represented 5% and 3% of Public Sector net sales in 2017 and 2016, respectively.
Canada net sales were $171.3 million in 2017 compared to $150.6 million in 2016, an increase of $20.7 million, or 14%. Sales of services in our Canadian segment were $30.1 million in 2017 compared to $24.0 million in 2016, an increase of $6.1 million, or 25%, and represented 18% and 16% of Canada net sales in 2017 and 2016, respectively.
Our United Kingdom segment, which officially launched in the second quarter of 2017, generated net sales of approximately $12.2 million in 2017.
Gross Profit and Gross Profit Margin
Consolidated gross profit was $325.7 million in 2017 compared to $318.8 million in 2016, an increase of $6.9 million, or 2%. Consolidated gross profit margin increased to 14.8% in 2017 from 14.2% in the same period last year. The increase in consolidated gross profit was primarily due to an increased mix of higher margin solutions and services, despite the decrease in consolidated net sales. The increase in consolidated gross profit margin was primarily due to the impact of increased sales of services and advanced solutions as well as the beneficial impact of the non-consolidation in 2017 of contracts now held by the NCE, as discussed above, which have historically had lower margins.
Selling, General & Administrative Expenses
Consolidated SG&A expenses were $314.3 million in 2017 compared to $284.0 million in 2016, an increase of $30.3 million, or 11%. Consolidated SG&A expenses as a percentage of net sales increased to 14.3% in 2017 from 12.6% in the same period last year. The increase in consolidated SG&A expenses was primarily related to a $19.1 million increase in personnel costs, which was primarily related to the investments we made in account executives in the U.K., Canada and in our advanced technology solutions practices. The increase in consolidated SG&A expenses was also impacted by $3.6 million of restructuring related costs, $1.7 million of increased telecommunication costs and a $1.5 million increase in M&A and related litigation costs, partially offset by a $1.7 million reduction in amortization expense and a $1.6 million decrease in outside service costs primarily related to the termination of the third party back office support (BPO) contract in Pakistan.
Operating Profit (Loss)
The following table presents our operating profit (loss) and operating profit margin, by segment, for the periods presented (in thousands):
| Year Ended December 31, | Change in | |||||||||||||||||||||||||||
| 2017 | 2016 | Change in | Operating | |||||||||||||||||||||||||
| Operating | Operating Profit (Loss) | Operating | Operating Profit (Loss) | Operating Profit (Loss) | Profit (Loss) Margin | |||||||||||||||||||||||
| Profit (Loss) | Margin(1) | Profit (Loss) | Margin(1) | $ | % | % | ||||||||||||||||||||||
| Commercial | $ | 76,097 | 4.4 | % | $ | 81,220 | 4.7 | % | $ | (5,123 | ) | (6 | )% | (0.3 | )% | |||||||||||||
| Public Sector | 8,885 | 3.2 | 14,163 | 4.0 | (5,278 | ) | (37 | ) | (0.8 | ) | ||||||||||||||||||
| Canada | 423 | 0.2 | 3,994 | 2.7 | (3,571 | ) | (89 | ) | (2.5 | ) | ||||||||||||||||||
| United Kingdom | (5,205 | ) | NM | (1) | — | — | (5,205 | ) | NM | (1) | NM | (1) | ||||||||||||||||
| Corporate & Other | (68,759 | ) | (3.1 | )(2) | (64,586 | ) | (2.9 | )(2) | (4,173 | ) | 6 | (0.2 | ) | |||||||||||||||
| Consolidated | $ | 11,441 | 0.5 | $ | 34,791 | 1.5 | $ | (23,350 | ) | (67 | ) | (1.0 | ) | |||||||||||||||
| (1) | Not meaningful. |
| (2) | Operating profit margin for Corporate & Other is computed based on consolidated net sales. Operating profit margin for each of the other segments is computed based on the respective segment’s net sales. |
| 44 |
Consolidated operating profit was $11.4 million in 2017 compared to $34.8 million in 2016, a decrease of $23.4 million or 67%.
Commercial operating profit was $76.1 million in 2017 compared to $81.2 million in 2016, a decrease of $5.1 million, or 6%. The decrease in Commercial operating profit was primarily due to an increase in investments we made in our advanced solutions, field sales and inside sales, partially offset by a $5.1 million decrease in personnel costs, a $1.6 million decrease in lease expenditures, a $1.1 million decrease in amortization expenses and a $3.5 million increase in Commercial gross profit.
Public Sector operating profit was $8.9 million in 2017 compared to $14.2 million in 2016, a decrease of $5.3 million, or 37%. The decrease in Public Sector operating profit was primarily due to a $2.8 million increase in personnel costs and a $2.3 million decrease in Public Sector gross profit.
Canada operating profit was $0.4 million in 2017 compared to $4.0 million in 2016, a decrease of $3.6 million, or 89%. This decrease in Canada operating profit was primarily due to a $6.5 million increase in personnel costs related to our investment in advanced solutions and sales account executive headcount, as well as the addition of costs resulting from the acquisition of Stratiform in December 2016, a $0.4 million increase in each of travel and entertainment expenses and consulting fees, partially offset by a $4.3 million increase in Canada gross profit.
United Kingdom operating loss was $5.2 million in 2017, representing the segment’s operating expenses which include overhead support and consulting costs.
Corporate & Other operating expenses include corporate related expenses such as legal, accounting, information technology, product management and certain other administrative costs that are not otherwise included in our reportable operating segments. Corporate & Other operating expenses were $68.8 million in 2017 compared to $64.6 million in 2016, an increase of $4.2 million, or 6%. The increase in our Corporate & Other operating expenses was primarily due to a $9.6 million increase in personnel costs, a $3.6 million increase in restructuring related charges, a $1.5 million increase in M&A related expenses, a $0.8 million increase in telecommunication expenses and a $0.6 million increase in travel and entertainment expenses, partially offset by a $1.5 million decrease in outside service costs primarily related to the termination of the Pakistani BPO service contract.
Net Interest Expense
Total net interest expense for 2017 increased to $7.9 million compared with $6.1 million for 2016. The $1.8 million increase in net interest expense in 2017 was primarily due to higher average interest rate and higher average loan balance in 2017 compared to the same period in the prior year, as well as a $0.3 million interest charge recorded in the second quarter of 2017 related to unclaimed property reports dating back to 2013.
Income Tax Expense
We recorded an income tax expense of $1.0 million in 2017 compared to $11.1 million in 2016. Our effective tax rates were 24.2% for 2017 and 38.7% for 2016. The reduction in tax rate in 2017 reflected the adoption of ASU 2016-09 with a benefit associated with stock compensation as well as certain adjustments related to the Tax Cuts and Jobs Act of 2017 including a $1.9 million one-time benefit of revaluing our deferred tax liabilities at a new lower federal tax rate, partially offset by a $0.7 million one-time expense related to the foreign income transition tax.
Year Ended December 31, 2016 Compared to the Year Ended December 31, 2015
Net Sales
The following table presents our net sales by segment for the periods presented (in thousands):
| Year Ended December 31, | ||||||||||||||||||||||||
| 2016 | 2015 | |||||||||||||||||||||||
| Net Sales | Percentage of Total Net Sales | Net Sales | Percentage of Total Net Sales | Dollar Change | Percent Change | |||||||||||||||||||
| Commercial | $ | 1,746,530 | 77 | % | $ | 1,365,384 | 82 | % | $ | 381,146 | 28 | % | ||||||||||||
| Public Sector | 353,497 | 16 | 279,603 | 17 | 73,894 | 26 | ||||||||||||||||||
| Canada | 150,643 | 7 | 16,987 | 1 | 133,656 | NM | (1) | |||||||||||||||||
| Corporate & Other | (83 | ) | — | (26 | ) | — | (57 | ) | NM | (1) | ||||||||||||||
| Consolidated | $ | 2,250,587 | 100 | % | $ | 1,661,948 | 100 | % | $ | 588,639 | 35 | % | ||||||||||||
| (1) | Not meaningful. |
| 45 |
Consolidated net sales were $2,250.6 million in 2016 compared to $1,661.9 million in 2015, an increase of $588.7 million, which was primarily due to the addition of sales from our 2015 acquisitions and strong organic growth predominantly in our field sales organization, as well as growth in our SLED and federal business within the Public Sector segment. Consolidated sales of services were $143.2 million in 2016 compared to $123.1 million in 2015, an increase of $20.1 million, or 16%, and represented 6% and 7% of net sales in 2016 and 2015, respectively.
Commercial net sales were $1,746.5 million in 2016 compared to $1,365.4 million in 2015, an increase of $381.1 million, or 28%. The increase in Commercial net sales was primarily due to the addition of sales from our 2015 acquisitions, the investments we have made in advanced technologies and software for the benefit of the overall business. Sales of services in the Commercial segment decreased by $0.6 million to $107.6 million in 2016 from $108.2 million in 2015, and represented 6% and 8% of Commercial net sales in 2016 and 2015, respectively.
Public Sector net sales were $353.5 million in 2016 compared to $279.6 million in 2015, an increase of $73.9 million, or 26%. The increase in Public Sector net sales was primarily due to an increase in our SLED business primarily due to the addition of sales from our Tiger Direct acquisition completed in December 2015 and an increase in sales in our federal business which was primarily due to an increase in productivity resulting from investments we made in our federal business.
Canada net sales were $150.6 million in 2016 compared to $17.0 million in 2015, an increase of $133.6 million, representing sales from our Acrodex acquisition in October 2015 and the Canadian unit of our Tiger Direct acquisition in December 2015.
Gross Profit and Gross Profit Margin
Consolidated gross profit was $318.8 million in 2016, an increase of $94.5 million, or 42%, from $224.3 million in 2015. Consolidated gross profit margin increased to 14.2% in 2016 from 13.5% in 2015. The increase in consolidated gross profit was primarily due to the increase in net sales discussed above. The increase in consolidated gross profit margin was primarily due to an improved sales mix of advanced solutions and an increase in vendor consideration as a percent of net sales.
Selling, General & Administrative Expenses
Consolidated SG&A expenses increased by $34.2 million, or 14%, to $284.0 million in 2016 from $249.8 million in 2015. Consolidated SG&A expenses as a percentage of net sales decreased to 13% in 2016 from 15% in 2015. The increase in consolidated SG&A expenses was primarily related to our 2015 acquisitions and the investments we have made in advanced technologies and software for the benefit of the overall business, including a $46.5 million increase in personnel costs, a $4.8 million increase in outside service costs, a $4.5 million increase in amortization expense related to purchased intangibles, a $2.8 million increase in credit card related fees, partially offset by a $25.4 million non-cash charge in 2015 related to our decision to pursue En Pointe’s SAP solution over the AX ERP solution.
Operating Profit (Loss)
The following table presents our operating profit and operating profit margin, by segment, for the periods presented (in thousands):
| Year Ended December 31, | Change in | |||||||||||||||||||||||||||
| 2016 | 2015 | Operating | ||||||||||||||||||||||||||
| Operating | Operating Profit | Operating | Operating Profit | Change
in Operating Profit (Loss) | Profit Margin | |||||||||||||||||||||||
| Profit (Loss) | Margin | Profit (Loss) | Margin | $ | % | % | ||||||||||||||||||||||
| Commercial | $ | 81,220 | 4.7 | % | $ | 59,479 | 4.4 | % | $ | 21,741 | 37 | % | 0.3 | % | ||||||||||||||
| Public Sector | 14,163 | 4.0 | 10,020 | 3.6 | 4,143 | 41 | 0.4 | |||||||||||||||||||||
| Canada | 3,994 | 2.7 | 591 | 3.5 | 3,403 | NM | (2) | (0.8 | ) | |||||||||||||||||||
| Corporate & Other(1) | (64,586 | ) | (2.9 | ) | (95,572 | ) | (5.8 | ) | 30,986 | (32 | ) | 2.9 | ||||||||||||||||
| Consolidated | $ | 34,791 | 1.5 | % | $ | (25,482 | ) | (1.5 | )% | $ | 60,273 | 237 | % | 3.0 | % | |||||||||||||
| (1) | Operating profit margin for Corporate & Other is computed based on consolidated net sales. Operating profit margin for each of the other segments is computed based on the respective segment’s net sales. |
| (2) | Not meaningful. |
| 46 |
Consolidated operating profit was $34.8 million in 2016 compared to an operating loss of $25.5 million in 2015, an increase of $60.3 million, or 237%.
Commercial operating profit was $81.2 million in 2016 compared to $59.5 million in 2015, an increase of $21.7 million, or 37%. The increase in Commercial operating profit was primarily due to a $64.9 million increase in Commercial gross profit, partially offset by a $5.3 million increase in personnel costs which was primarily related to the 2015 acquisitions, investments in advanced technologies and software specialists, a $2.8 million increase in amortization expense relating to purchased intangibles, a $2.5 million increase in credit card related expenses, a $2.4 million increase in outside services and a $1.4 million increase in variable fulfillment costs.
Public Sector operating profit was $14.2 million in 2016 compared to $10.0 million in 2015, an increase of $4.2 million or 41%. The increase in Public Sector operating profit was primarily due to a $9.0 million increase in Public Sector gross profit, partially offset by a $2.5 million increase in personnel costs, including increased variable compensation on increased gross profit, a $0.8 million increase in amortization expense relating to purchased intangibles, a $0.3 million increase in bad debt charge, a $0.2 million increase in travel and entertainment expenses and a $0.2 million legal settlement charge.
Canada operating profit was $4.0 million in 2016 compared to $0.6 million in 2015, an increase of $3.4 million, representing operating profit from our Acrodex acquisition and the Canadian unit of the Tiger Direct acquisition in December 2015.
Corporate & Other operating expenses include corporate related expenses such as legal, accounting, information technology, product management and certain other administrative costs that are not otherwise included in our reportable operating segments. Corporate & Other operating expenses were $64.6 million in 2016 compared to $95.6 million in 2015, a decrease of $31.0 million, or 32%. The decrease in our Corporate & Other operating expenses was primarily due to a $25.4 million non-cash charge in 2015 related to our decision to pursue En Pointe’s SAP solution over the AX ERP solution, a $2.5 decrease in personnel costs, a $1.5 million decrease in depreciation expense, a $1.3 million gain resulting from a class action settlement related to an industry wide DRAM indirect antitrust litigation and a $1.1 million decrease in M&A related expenses.
Net Interest Expense
Total net interest expense for 2016 increased to $6.1 million compared with $3.9 million in 2015. The $2.2 million increase in net interest expense was primarily due to higher average total outstanding borrowings and interest rate during 2016 compared to the same period in the prior year.
Income Tax Expense
We recorded an income tax expense of $11.1 million in 2016 compared to an income tax benefit of $11.4 million in 2015. Our effective tax rate was 38.7% and 38.8% for 2016 and 2015, respectively.
Loss from Discontinued Operations
Loss from discontinued operations, net of taxes, was $0.3 million in 2015 and none in 2016.
| 47 |
LIQUIDITY AND CAPITAL RESOURCES
Working Capital. Our primary capital needs have and we expect will continue to be the funding of our existing working capital requirements, capital expenditures for which we expect to include substantial investments in our new ERP system, eCommerce platform and other upgrades of our current IT infrastructure over the next several years, which are discussed further below in “Other Planned Capital Projects,” possible sales growth, possible acquisitions and new business ventures, and possible repurchases of our common stock under a discretionary repurchase program, which is also further discussed below. Our primary sources of financing have historically come from borrowings from financial institutions, public and private issuances of our common stock and cash flows from operations. Our continuing efforts to drive revenue growth from commercial customers could result in an increase in our accounts receivable as these customers are generally provided longer payment terms than consumers. We historically have increased our inventory levels from time to time to take advantage of strategic manufacturer promotions. We believe that our existing cash balance, together with our expected future cash flows from operations and available borrowing capacity under our line of credit, will be adequate to support our current operating plans for at least the next 12 months. However, the current uncertainty in the macroeconomic environment may limit our cash resources that could otherwise be available to fund capital investments, future strategic opportunities or growth beyond our current operating plans. We may in the future seek additional financing from public or private debt or equity financings to fund additional acquisitions or expansion, or take advantage of opportunities or favorable market conditions. If we raise additional financing through the issuance of equity, equity-related or debt securities, those securities may have rights, preferences or privileges senior to those of the rights of our common stock and our stockholders will experience dilution of their ownership interests.
There has been ongoing uncertainty in the global economic environment, which could cause disruptions in the capital and credit markets. While our revolving credit facility does not mature until March 2021, we believe problems in these areas could have a negative impact on our ability to obtain future financing if we need additional funds, such as for acquisitions or expansion, to fund a significant downturn in our sales or an increase in our operating expenses, or to take advantage of opportunities or favorable market conditions in the future. We may seek additional financing from public or private debt or equity issuances; however, there can be no assurance that such financing will be available at acceptable terms, if at all. Also, there can be no assurance that the cost or availability of future borrowings, if any, under our credit facility or in the debt markets will not be impacted by disruptions in the capital and credit markets.
We had cash and cash equivalents of $9.1 million at December 31, 2017 and $7.2 million at December 31, 2016. Our negative working capital increased by $2.7 million to a negative working capital of $7.7 million at December 31, 2017 from negative working capital of $5.0 million at December 31, 2016.
We have a board approved discretionary stock repurchase program under which shares may be repurchased from time to time at prevailing market prices, through open market or unsolicited negotiated transactions, depending on market conditions. Our Board of Directors originally adopted the plan in October 2008 with an initial authorized maximum of $10 million. The plan was amended in September 2012 and increased to $20 million, again amended in April 2015 and increased to a total of $30 million, and again amended in August 2017 and increased to a total of $40 million. Under the program, the shares may be repurchased from time to time at prevailing market prices, through open market or unsolicited negotiated transactions, depending on market conditions. We expect that the repurchase of our common stock under the program will be financed with existing working capital and amounts available under our existing credit facility. The repurchased shares are held as treasury stock. No limit was placed on the duration of the repurchase program. There is no guarantee as to the exact number of shares that we will repurchase. Subject to applicable securities laws, repurchases may be made at such times and in such amounts as our management deems appropriate. The program can also be discontinued at any time management feels additional purchases are not warranted.
We repurchased 23,000 shares of our common stock under this program during the three months ended December 31, 2017 for $0.2 million. From the inception of the program in October 2008 through December 31, 2017, we have repurchased an aggregate of 4,973,974 shares of our common stock for a total cost of $37.5 million. At December 31, 2017, we had $2.5 million available in stock repurchases under the program, subject to any limitations that may apply from time to time under our existing credit facility.
We maintain a Canadian sales center serving the U.S. market, which historically received the benefit of labor credits under the Investment Quebec Refundable Tax Credit for Major Employment Generating Projects (GPCE) program. In addition to other eligibility requirements under the program, which extended through fiscal year 2016, we were required to maintain a minimum of 317 eligible employees employed by our subsidiary PCM Sales Canada in the province of Quebec at all times to remain eligible to apply annually for these labor credits. As a result of this certification, we are eligible to make annual labor credit claims for eligible employees equal to 25% of eligible salaries, but not to exceed $15,000 (Canadian) per eligible employee per year, continuing through fiscal year 2016. In June 2014, the province of Quebec passed a budget that modified the annual labor credit, prospectively reducing the claim percentage from 25% to 20% of eligible salaries, and reducing the annual amount from $15,000 to $12,000 (Canadian) per eligible employee per year. As of December 31, 2017, we had a total accrued receivable of $1.9 million related to 2016. We filed our 2016 claim during the third quarter of 2017, and we expect to receive full payment under our remaining accrued labor credits receivable.
Cash Flows from Operating Activities. Net cash used in operating activities was $64.8 million in 2017 compared to net cash provided by operating activities of $96.5 million in 2016 and net cash used by operating activities of $52.2 million in 2015.
| 48 |
The $64.8 million of net cash provided by operating activities in 2017 was primarily the result of an increase in accounts receivable by $77.6 million primarily due to timing differences compared to the prior year and an increase in inventory by $22.6 million reflecting certain purchases made in the fourth quarter of 2017 which have largely been sold in the first quarter of 2018 to date, partially offset by an $8.5 increase in accounts payable and a $7.1 million decrease in prepaid expenses and other current assets.
The $96.5 million of net cash provided by operating activities in 2016 was primarily the result of our net income adjusted for depreciation and amortization, an increase in accounts payable of $87.7 million relating to timing of payables, partially offset by a $25.6 million increase in inventory and a $17.4 million increase in accounts receivable.
The $52.2 million of net cash used in operating activities in 2015 was primarily due to a $127.0 million increase in accounts receivable resulting primarily from the build of En Pointe’s receivables since the acquisition in April 2015 as we did not purchase any receivables as part of our acquisition of En Pointe, partially offset by a $54.3 million increase in accounts payable, which was primarily due to the addition of En Pointe, and a $6.3 million increase in our accrued liabilities primarily relating to the addition of En Pointe.
Cash Flows from Investing Activities. Net cash used in investing activities was $22.1 million in 2017, $10.9 million in 2016 and $66.2 million in 2015.
The $22.1 million of net cash used in investing activities in 2017 was primarily related to $17.3 million of capital expenditures, $3.1 million related to the acquisition of Provista Technology and $1.7 million related to the acquisition of Stack Technology.
The $10.9 million of net cash used in investing activities in 2016 was primarily related to $8.7 million of capital expenditures, $1.5 million related to the acquisition of Stratiform in December 2016 and $0.5 million of incremental acquisition-related investments.
The $66.2 million of net cash used in investing activities in 2015 was primarily related to the acquisition of En Pointe for $17.3 million, the acquisition of certain assets of Systemax for $14.0 million, the acquisition of Acrodex for $13.6 million, net of cash acquired, the purchase of real properties in Lewis Center, Ohio for $6.0 million and in Irvine, California for $5.8 million, as well as expenditures relating to investments in our IT infrastructure and new ERP systems.
Cash Flows from Financing Activities. Net cash provided by financing activities was $88.4 million in 2017 compared to net cash used in financing activities of $90.0 million in 2016 and net cash provided by financing activities of $122.0 million in 2015.
The $88.4 million of net cash provided by financing activities in 2017 was primarily related to $106.4 million of net borrowings on our line of credit, partially offset by $13.4 million of earn-out liability payments and $11.6 million of payments related to repurchases of our common stock.
The $90.0 million of net cash used in financing activities in 2016 was primarily related to $55.0 million of net payments on our line of credit, $13.1 million of earn-out liability payments and a $13.1million decrease in book overdraft.
The $122.0 million of net cash provided by financing activities in 2015 was primarily related to a $109.6 million increase in our outstanding borrowings on our line of credit and a $17.7 million increase in borrowings under our notes payable.
Debt. The following table sets forth our outstanding debt as of the periods presented (in thousands):
| At December 31, | ||||||||
| 2017 | 2016 | |||||||
| Revolving credit facility, LIBOR plus 1.50%, maturing in March 2021 | $ | 213,778 | $ | 107,396 | ||||
| Note payable, LIBOR plus 1.50%, maturing in March 2021 | — | 8,293 | ||||||
| Note payable, LIBOR plus 1.50%, maturing in March 2021 | 11,032 | 1,392 | ||||||
| Note payable, LIBOR plus 1.50%, maturing in March 2021 | 1,943 | — | ||||||
| Note payable, greater of 2% or LIBOR plus 2.15%, maturing in April 2022 | 4,404 | 4,601 | (1) | |||||
| Note payable, LIBOR plus 2.25%, maturing in January 2022 | 3,908 | 4,137 | ||||||
| Notes payable, 4.12%, 4.33% and 4.60%, matured in March 2017 | — | 525 | ||||||
| Note payable, LIBOR plus 2.25%, maturing in January 2020 | 6,798 | 7,107 | ||||||
| Note payable, Prime plus 0.375% or LIBOR plus 2.375%, maturing in January 2020 | 7,710 | 8,113 | ||||||
| Note payable, LIBOR plus 3.2%, maturing in May 2025 | 284 | — | ||||||
| Other notes payable, maturing in August and September 2018 | 175 | 351 | ||||||
| Total | 250,032 | 141,915 | ||||||
| Less: Total current debt | 217,140 | 123,165 | ||||||
| Total non-current debt | $ | 32,892 | $ | 18,750 | ||||
| (1) | This note payable, related to the Irvine Property, has been presented on our Consolidated Balance Sheet at December 31, 2016 as “Note payable related to asset held for sale” and was included as current debt. See Note 5 to the Notes to Consolidated Financial Statements in Part II, Item 8 of this report for more information regarding the Irvine Property. |
| 49 |
Line of Credit and Related Notes
We maintain a credit facility, which functions as a working capital line of credit with a borrowing base of inventory and accounts receivable, including certain credit card receivables, and a portion of the value of certain real estate. On January 19, 2016, we entered into a Fourth Amended and Restated Loan and Security Agreement (the “Fourth Amended Loan Agreement”) with certain lenders and Wells Fargo Capital Finance, LLC as administrative and collateral agent (the “Lenders”). On July 7, 2016, we entered into a First Amendment to the Fourth Amended Loan Agreement with the Lenders and on February 24, 2017, we entered into a Second Amendment to the Fourth Amended Loan Agreement with the Lenders. On October 24, 2017, PCM, all of its wholly-owned domestic subsidiaries (collectively with PCM, the “US Borrowers”), all of its Canadian subsidiaries (collectively, the “Canadian Borrowers”) and its PCM UK subsidiary (together with the US Borrowers and the Canadian Borrowers, the “Borrowers”), entered into a Fifth Amended and Restated Loan and Security Agreement (the “Fifth Amended Loan Agreement”) with the Lenders. The Fifth Amended Loan Agreement amends and restates the Fourth Amended Loan Agreement.
As amended through December 31, 2017, the terms of our credit facility provide for (i) a Maximum Credit, as defined in the credit facility, of $345,000,000; (ii) a sub-line of up to C$40,000,000 as the Canadian Maximum Credit and a sub-line of up to £25,000,000 as the UK Maximum Credit ((i) and (ii) collectively the “Revolving Line”); (iii) a Maturity Date of March 19, 2021; (iv) interest on outstanding balance under the Canadian Maximum Credit based on the Canadian Base Rate (calculated as the greater of CDOR plus one percentage point and the “prime rate” for Canadian Dollar commercial loans, as further defined in the Fifth Amended Loan Agreement) or at the election of the Borrowers, based on the CDOR Rate, plus a margin, depending on average excess availability under the Revolving Line, ranging from 1.50% to 1.75%; (v) interest on outstanding UK balances based on LIBOR plus a margin, depending on average excess availability under the Revolving Line, ranging from 1.50% to 1.75%; (vi) interest on outstanding balance under the Maximum Credit based on the Eurodollar Rate plus a margin, depending on average excess availability under the revolving line, ranging from 1.50% to 1.75%; and (vii) a monthly unused line fee of 0.25% per year on the amount, if any, by which the Maximum Credit, then in effect, exceeds the average daily principal balance of outstanding borrowings during the immediately preceding month. The terms of our credit facility are more fully described in the Fifth Amended Loan Agreement.
The credit facility is collateralized by substantially all of our assets. In addition to the security interest required by the credit facility, certain of our vendors have security interests in some of our assets related to their products. The credit facility has as its single financial covenant a minimum fixed charge coverage ratio (FCCR) requirement in the event an FCCR triggering event has occurred. An FCCR triggering event is comprised of maintaining certain specified daily and average excess availability thresholds. In the event the FCCR covenant applies, the fixed charge coverage ratio is 1.0 to 1.0 calculated on a trailing four-quarter basis as of the end of the last quarter immediately preceding such FCCR triggering event date. At December 31, 2017, we were in compliance with our financial covenant under the credit facility.
Loan availability under the line of credit fluctuates daily and is affected by many factors, including eligible assets on-hand, opportunistic purchases of inventory and availability and our utilization of early-pay discounts. At December 31, 2017, we had $99.7 million available to borrow for working capital advances under the line of credit.
In connection with, and as part of, our revolving credit facility, we maintain a sub-line with a limit of $12.5 million secured by our properties located in Santa Monica, California, with a monthly principal amortization of $149,083 and a sub-line with a limit of $2.2 million secured by our property in Woodridge, Illinois, with a monthly principal amortization of $26,250.
Also on July 7, 2016, we entered into a Credit Agreement with Castle Pines Capital LLC (“Castle Pines”), which provides for a credit facility (“Channel Finance Facility”) to finance the purchase of inventory from a list of approved vendors. The aggregate availability under the Channel Finance Facility is variable and discretionary, but has initially been set at $35 million. Each advance under the Channel Finance Facility will be made directly to an approved vendor and must be repaid on the earlier of (i) the payment due date as set by Castle Pines or (ii) the date (if any) when the inventory is lost, stolen or damaged. No interest accrues on advances paid on or prior to payment due date. The Channel Finance Facility is secured by a lien on certain of our assets, subject to an intercreditor arrangement with the Lenders. The Channel Finance Facility has an initial term of one year, but shall be automatically renewed for one year periods from year to year thereafter unless terminated earlier by either party within reasonable notice periods.
| 50 |
Other Notes Payable
In March 2015, we completed the purchase of real property in Irvine, California for approximately $5.8 million and financed $4.9 million with a long-term note. The loan agreement provides for a seven-year term and a 25 year straight-line, monthly principal repayment amortization period that began on May 1, 2015 with a balloon payment at maturity in April 2022. The loan is secured by the real property and contains financial covenants substantially similar to those of our existing asset-based credit facility. In September 2015, we listed the Irvine Property for sale.
In January 2015, we completed the purchase of certain real property in Lewis Center, Ohio for approximately $6.6 million and financed $4.575 million with a long-term note. The $4.575 million term note provides for a seven-year term and a 25 year straight-line, monthly principal repayment amortization period that began in February 2015 with a balloon payment at maturity in January 2022. The loan is secured by the real property and contains financial covenants substantially similar to those of our existing asset-based credit facility.
Throughout 2014, we entered into three financing arrangements with a bank to finance the costs of equipment, software and professional services related to our ERP upgrade. The total amount financed was $5.6 million, with a quarterly repayment schedule which matured in March 2017.
In December 2012, we completed the purchase of 7.9 acres of land for approximately $1.1 million and have incurred additional costs of $12.2 million through December 31, 2014 towards the construction of a new cloud data center that we opened in June 2014. In July 2013, we entered into a loan agreement for with a bank for draws up to $7.725 million to finance the build out of the new data center. The loan agreement provides for a five-year term and a 25 year straight-line, monthly principal repayment amortization period with a balloon payment at maturity in January 2020. The loan is secured by the real property and contains financial covenants substantially similar to those of our existing asset-based credit facility.
In June 2011, we entered into a credit agreement to finance a total of $10.1 million of the acquisition and improvement costs for the real property we purchased in March 2011 in El Segundo, California. The credit agreement, as amended, provides for a five-year term and a 25 year straight-line, monthly principal repayment amortization period with a balloon payment at maturity in September 2016. In September 2017, we entered into an amendment with the lender extending the maturity of the loan to January 31, 2020. The loan is secured by the real property and contains financial covenants substantially similar to those of our existing asset-based credit facility.
At December 31, 2017, the effective weighted average annual interest rate on our outstanding amounts under the credit facility, term note and variable interest rate notes payable was 3.12%.
The carrying amounts of our line of credit borrowings and notes payable approximate their fair value based upon the current rates offered to us for obligations of similar terms and remaining maturities.
As part of our growth strategy, we may, in the future, make acquisitions in the same or complementary lines of business, and pursue other business ventures. Any launch of a new business venture or any acquisition and the ensuing integration of the acquired operations would place additional demands on our management, and our operating and financial resources.
Inflation
Inflation has not had a material impact on our operating results; however, there can be no assurance that inflation will not have a material impact on our business in the future.
Dividend Policy
We have never paid cash dividends on our capital stock and our credit facility prohibits us from paying any cash dividends on our capital stock. Therefore, we do not currently anticipate paying dividends; we intend to retain any earnings to finance the growth and development of our business.
| 51 |
CONTRACTUAL OBLIGATIONS, OFF-BALANCE SHEET ARRANGEMENTS AND CONTINGENCIES
Contractual Obligations
The following tables set forth our future contractual obligations and other commercial commitments as of December 31, 2017 (in thousands), including the future periods in which payments are expected. Additional details regarding these obligations are provided in the Notes to the Consolidated Financial Statements in Part II, Item 8 of this report.
| Payments Due by Period | ||||||||||||||||||||
| Total | Less
than 1 year | 1-3 years | 3-5 years | After 5 years | ||||||||||||||||
| Contractual obligations: | ||||||||||||||||||||
| Long-term debt obligations (a) | $ | 36,254 | $ | 3,362 | $ | 18,930 | $ | 13,874 | $ | 88 | ||||||||||
| Purchase obligations (b) | 15,202 | 13,178 | 2,024 | — | — | |||||||||||||||
| Operating lease obligations | 28,954 | 6,726 | 10,672 | 7,065 | 4,491 | |||||||||||||||
| Capital lease obligations | 1,943 | 641 | 979 | 323 | — | |||||||||||||||
| Total contractual obligations | $ | 82,353 | $ | 23,907 | $ | 32,605 | $ | 21,262 | $ | 4,579 | ||||||||||
| Other commercial commitments (c): | ||||||||||||||||||||
| Line of credit (a) | $ | 213,778 | $ | 213,778 | $ | — | $ | — | $ | — | ||||||||||
| (a) | Long-term debt obligations and line of credit exclude interest, which is based on a variable rate tied to the prime rate or LIBOR plus a variable spread, at our option. |
| (b) | Purchase obligations consist of minimum commitments under non-cancelable contracts for services relating to telecommunications, IT maintenance, financial services and employment contracts with certain employees (which consist of severance arrangements that, if exercised, would become payable in less than one year). |
| (c) | We had $13.1 million of standby letters of credits (LOCs) under which there were no minimum payment requirements at December 31, 2017. LOCs are commitments issued to third party beneficiaries, underwritten by a third party bank, representing funding responsibility in the event of third party demands or contingent events. The outstanding balance of our standby LOCs reduces the amount available to us from our revolving credit facility. There were no claims made against any standby LOCs during the year ended December 31, 2017. |
Other Planned Capital Projects
ERP Upgrades
We have been in the process of upgrading our ERP systems due to the discontinued third party support of certain of our aged legacy systems, our changing IT needs when considering the transitioning state of our business from our origins towards becoming a leading IT solution provider and the ongoing desire to integrate multiple systems upon which we currently operate as a result of multiple acquisitions. In this regard, we previously purchased licenses for Microsoft Dynamics AX and other related modules to provide a complete, robust and integrated ERP solution and have expended time, effort and resources to implement this AX solution for our legacy businesses. We believe the implementation and upgrade of our systems should help us to gain further efficiencies across our organizations. Our newly acquired En Pointe business has operated for a number of years on an implemented and successfully functioning SAP system. As a result of the En Pointe acquisition, we considered new issues related to the costs, risks and benefits of either continuing the implementation of our AX solution and moving En Pointe to such AX solution or moving the legacy businesses to the SAP solution. In response, we shifted certain of our IT development efforts towards assessing these respective costs, risks and benefits. There are significant risks and uncertainties in adopting and implementing a new ERP system and as part of our assessment of these alternatives, we considered the fact that En Pointe has been successfully functioning on its SAP system for many years while none of our businesses have operated on the AX system. While we believe the AX solution has many valuable features and that it has been essential that we have undertaken our AX development efforts to date, we have weighed these attributes and the transition risk inherent with any such new solution against the fact that En Pointe, with similar business characteristics and system needs to our legacy businesses, has been successfully operating on its SAP system for a number of years. As a result of the assessments performed, our management concluded that the SAP solution is the best, most viable and cost effective option for our consolidated business going forward. To that end, in late October 2015, our management determined, and our Board of Directors approved such determination, to adopt the SAP platform across all of our business units and approved the non-cash write-off of the remaining $22.1 million of work in process software previously capitalized for all major phases of the design, configuration and customization of the AX solution to date. For the year ended December 31, 2015, a total of $25.4 million non-cash charge related to the ERP and CRM write-offs was included in “Selling, general and administrative expenses” on our Consolidated Statements of Operations.
We have made significant progress in the configuration and implementation of the SAP platform and have begun the migration process. The migration process started in the second quarter of 2017 and it will continue through 2018. We anticipate completion of migration of a significant portion of our legacy systems to the SAP platform in 2018 with a total expected capitalized cost of under $5 million.
| 52 |
In addition to costs related to the upgrade of our ERP systems, we expect to make periodic upgrades to our IT systems on an ongoing basis.
Off-Balance Sheet Arrangements
As of December 31, 2017, we did not have any off-balance sheet arrangements.
Contingencies
For a discussion of contingencies, see Part II, Item 8, Note 10 of the Notes to the Consolidated Financial Statements of this report.
RELATED-PARTY TRANSACTIONS
There were no material related-party transactions during the year ended December 31, 2017 other than employee compensation arrangements in the ordinary course of business.
IMPACT OF RECENTLY ISSUED ACCOUNTING STANDARDS
For a discussion of impact of recently issued accounting standards, see Part II, Item 8, Note 2 of the Notes to the Consolidated Financial Statements of this report under “Recent Accounting Pronouncements.”
ITEM 7A. QUANTITATIVE AND QUALITATIVE DISCLOSURES ABOUT MARKET RISK
Our financial instruments include cash and cash equivalents, accounts receivable, accounts payable, accrued expenses and other current liabilities, and debt. At December 31, 2017, the carrying values of our financial instruments approximated their fair values based on current market prices and rates.
We have not entered into derivative financial instruments as of December 31, 2017. However, from time-to-time, we contemplate and may enter into derivative financial instruments related to interest rate, foreign currency, and other market risks.
Interest Rate Risk
We have exposure to the risks of fluctuating interest rates on our line of credit and notes payable. The variable interest rates on our line of credit and notes payable are tied to the prime rate or the LIBOR, at our discretion. At December 31, 2017, we had $213.8 million outstanding under our line of credit and $35.8 million outstanding under our notes payable with variable interest rates. As of December 31, 2017, the hypothetical impact of a one percentage point increase in interest rate related to the outstanding borrowings under our line of credit and such notes payable would be to increase our annual interest expense by approximately $2.5 million.
Foreign Currency Exchange Risk
We have operation centers in Canada and the Philippines that provide back-office administrative support and customer service support. In each of these countries, transactions are primarily conducted in the respective local currencies. In addition, our two foreign subsidiaries that operate the operation centers have intercompany accounts with our U.S. subsidiaries that eliminate upon consolidation. However, transactions resulting in such accounts expose us to foreign currency rate fluctuations. We record gains and losses resulting from exchange rate fluctuations on our short-term intercompany accounts in “Selling, general and administrative expenses” in our Consolidated Statements of Operations and translation gains and losses resulting from exchange rate fluctuations on local currency based assets and liabilities in “Accumulated other comprehensive income,” a separate component of stockholders’ equity on our Consolidated Balance Sheets. As such, we have foreign currency translation exposure for changes in exchange rates for these currencies and any significant changes in exchange rates between foreign currencies in which we transact business and the U.S. dollar may adversely affect our Consolidated Statements of Operations and Consolidated Balance Sheets. As of December 31, 2017, we did not have material foreign currency or overall currency exposure.
***
| 53 |
ITEM 8. FINANCIAL STATEMENTS AND SUPPLEMENTARY DATA
INDEX TO CONSOLIDATED FINANCIAL STATEMENTS
All other schedules are omitted since the required information is not present or is not present in amounts sufficient to require submission of the schedule, or because the information required is included in the consolidated financial statements and notes thereto.
| 54 |
REPORT OF INDEPENDENT REGISTERED PUBLIC ACCOUNTING FIRM
To the stockholders and the Board of Directors of PCM, Inc.
Opinions on the Financial Statements and Internal Control over Financial Reporting
We have audited the accompanying consolidated balance sheets of PCM, Inc. and subsidiaries (the “Company”) as of December 31, 2017 and 2016, the related consolidated statements of operations, comprehensive income (loss), stockholders’ equity, and cash flows for each of the three years in the period ended December 31, 2017, and the related notes and the schedule listed in the Index at Item 15 (collectively referred to as the “financial statements”). We also have audited the Company’s internal control over financial reporting as of December 31, 2017, based on criteria established in Internal Control — Integrated Framework (2013) issued by the Committee of Sponsoring Organizations of the Treadway Commission (COSO).
In our opinion, the financial statements referred to above present fairly, in all material respects, the financial position of the Company as of December 31, 2017 and 2016, and the results of its operations and its cash flows for each of the three years in the period ended December 31, 2017, in conformity with accounting principles generally accepted in the United States of America. Also, in our opinion, the Company maintained, in all material respects, effective internal control over financial reporting as of December 31, 2017, based on criteria established in Internal Control — Integrated Framework (2013) issued by COSO.
Basis for Opinions
The Company’s management is responsible for these financial statements, for maintaining effective internal control over financial reporting, and for its assessment of the effectiveness of internal control over financial reporting, included in the accompanying Management’s Report on Internal Control Over Financial Reporting appearing in Item 9A. Our responsibility is to express an opinion on these financial statements and an opinion on the Company’s internal control over financial reporting based on our audits. We are a public accounting firm registered with the Public Company Accounting Oversight Board (United States) (PCAOB) and are required to be independent with respect to the Company in accordance with the U.S. federal securities laws and the applicable rules and regulations of the Securities and Exchange Commission and the PCAOB.
We conducted our audits in accordance with the standards of the PCAOB. Those standards require that we plan and perform the audits to obtain reasonable assurance about whether the financial statements are free of material misstatement, whether due to error or fraud, and whether effective internal control over financial reporting was maintained in all material respects.
Our audits of the financial statements included performing procedures to assess the risks of material misstatement of the financial statements, whether due to error or fraud, and performing procedures to respond to those risks. Such procedures included examining, on a test basis, evidence regarding the amounts and disclosures in the financial statements. Our audits also included evaluating the accounting principles used and significant estimates made by management, as well as evaluating the overall presentation of the financial statements. Our audit of internal control over financial reporting included obtaining an understanding of internal control over financial reporting, assessing the risk that a material weakness exists, and testing and evaluating the design and operating effectiveness of internal control based on the assessed risk. Our audits also included performing such other procedures as we considered necessary in the circumstances. We believe that our audits provide a reasonable basis for our opinions.
Definition and Limitations of Internal Control over Financial Reporting
A company’s internal control over financial reporting is a process designed to provide reasonable assurance regarding the reliability of financial reporting and the preparation of financial statements for external purposes in accordance with generally accepted accounting principles. A company’s internal control over financial reporting includes those policies and procedures that (1) pertain to the maintenance of records that, in reasonable detail, accurately and fairly reflect the transactions and dispositions of the assets of the company; (2) provide reasonable assurance that transactions are recorded as necessary to permit preparation of financial statements in accordance with generally accepted accounting principles, and that receipts and expenditures of the company are being made only in accordance with authorizations of management and directors of the company; and (3) provide reasonable assurance regarding prevention or timely detection of unauthorized acquisition, use, or disposition of the company’s assets that could have a material effect on the financial statements.
Because of its inherent limitations, internal control over financial reporting may not prevent or detect misstatements. Also, projections of any evaluation of effectiveness to future periods are subject to the risk that controls may become inadequate because of changes in conditions, or that the degree of compliance with the policies or procedures may deteriorate.
| /s/ Deloitte & Touche LLP | |
| Los Angeles, California | |
| March 15, 2018 |
We have served as the Company’s auditor since 2013.
| 55 |
PCM, INC.
(in thousands, except per share amounts and share data)
| December 31, 2017 | December 31, 2016 | |||||||
| ASSETS | ||||||||
| Current assets: | ||||||||
| Cash and cash equivalents | $ | 9,113 | $ | 7,172 | ||||
| Accounts receivable, net of allowances of $2,181 and $832 | 439,658 | 358,949 | ||||||
| Inventories | 103,471 | 80,872 | ||||||
| Prepaid expenses and other current assets | 9,333 | 16,250 | ||||||
| Asset held for sale | — | 5,812 | ||||||
| Total current assets | 561,575 | 469,055 | ||||||
| Property and equipment, net | 71,551 | 56,352 | ||||||
| Goodwill | 87,768 | 83,388 | ||||||
| Intangible assets, net | 11,090 | 15,074 | ||||||
| Deferred income taxes | 1,759 | 947 | ||||||
| Investment and other assets | 6,509 | 4,994 | ||||||
| Total assets | $ | 740,252 | $ | 629,810 | ||||
| LIABILITIES AND STOCKHOLDERS’ EQUITY | ||||||||
| Current liabilities: | ||||||||
| Accounts payable | $ | 289,201 | $ | 276,524 | ||||
| Accrued expenses and other current liabilities | 55,040 | 63,403 | ||||||
| Deferred revenue | 7,913 | 10,960 | ||||||
| Line of credit | 213,778 | 107,396 | ||||||
| Notes payable — current | 3,362 | 11,168 | ||||||
| Note payable related to asset held for sale | — | 4,601 | ||||||
| Total current liabilities | 569,294 | 474,052 | ||||||
| Notes payable | 32,892 | 18,750 | ||||||
| Other long-term liabilities | 7,338 | 7,039 | ||||||
| Deferred income taxes | 3,102 | 1,498 | ||||||
| Total liabilities | 612,626 | 501,339 | ||||||
| Commitments and contingencies | ||||||||
| Stockholders’ equity: | ||||||||
| Preferred stock, $0.001 par value; 5,000,000 shares authorized; none issued and outstanding | — | — | ||||||
| Common stock, $0.001 par value; 30,000,000 shares authorized; 17,170,273 and 16,465,567 shares issued; 11,779,621 and 11,967,202 shares outstanding | 17 | 16 | ||||||
| Additional paid-in capital | 134,646 | 127,777 | ||||||
| Treasury stock, at cost: 5,390,652 and 4,498,365 shares | (38,536 | ) | (26,934 | ) | ||||
| Accumulated other comprehensive income (loss) | 251 | (639 | ) | |||||
| Retained earnings | 31,248 | 28,251 | ||||||
| Total stockholders’ equity | 127,626 | 128,471 | ||||||
| Total liabilities and stockholders’ equity | $ | 740,252 | $ | 629,810 | ||||
See Notes to the Consolidated Financial Statements.
| 56 |
PCM, INC.
CONSOLIDATED STATEMENTS OF OPERATIONS
(in thousands, except per share amounts)
| Years Ended December 31, | ||||||||||||
| 2017 | 2016 | 2015 | ||||||||||
| Net sales | $ | 2,193,436 | $ | 2,250,587 | $ | 1,661,948 | ||||||
| Cost of goods sold | 1,867,714 | 1,931,786 | 1,437,621 | |||||||||
| Gross profit | 325,722 | 318,801 | 224,327 | |||||||||
| Selling, general and administrative expenses | 314,281 | 284,010 | 249,809 | |||||||||
| Operating profit (loss) | 11,441 | 34,791 | (25,482 | ) | ||||||||
| Interest expense, net | 7,894 | 6,083 | 3,860 | |||||||||
| Equity income from unconsolidated affiliate | 528 | — | — | |||||||||
| Income (loss) from continuing operations before income taxes | 4,075 | 28,708 | (29,342 | ) | ||||||||
| Income tax expense (benefit) | 984 | 11,115 | (11,394 | ) | ||||||||
| Income (loss) from continuing operations | 3,091 | 17,593 | (17,948 | ) | ||||||||
| Loss from discontinued operations, net of taxes | — | — | (310 | ) | ||||||||
| Net income (loss) | $ | 3,091 | $ | 17,593 | $ | (18,258 | ) | |||||
| Basic and Diluted Earnings (Loss) Per Common Share | ||||||||||||
| Basic EPS: | ||||||||||||
| Income (loss) from continuing operations | $ | 0.25 | $ | 1.49 | $ | (1.49 | ) | |||||
| Loss from discontinued operations, net of taxes | — | — | (0.03 | ) | ||||||||
| Net income (loss) | $ | 0.25 | $ | 1.49 | $ | (1.52 | ) | |||||
| Diluted EPS: | ||||||||||||
| Income (loss) from continuing operations | $ | 0.24 | $ | 1.40 | $ | (1.49 | ) | |||||
| Loss from discontinued operations, net of taxes | — | — | (0.03 | ) | ||||||||
| Net income (loss) | $ | 0.24 | $ | 1.40 | $ | (1.52 | ) | |||||
| Weighted average number of common shares outstanding: | ||||||||||||
| Basic | 12,269 | 11,847 | 12,049 | |||||||||
| Diluted | 13,094 | 12,528 | 12,049 | |||||||||
See Notes to the Consolidated Financial Statements.
| 57 |
PCM, INC.
CONSOLIDATED STATEMENTS OF COMPREHENSIVE INCOME (LOSS)
(in thousands)
| Years Ended December 31, | ||||||||||||
| 2017 | 2016 | 2015 | ||||||||||
| Net income (loss) | $ | 3,091 | $ | 17,593 | $ | (18,258 | ) | |||||
| Other comprehensive income (loss): | ||||||||||||
| Foreign currency translation adjustments | 890 | 126 | (1,706 | ) | ||||||||
| Total other comprehensive income (loss) | 890 | 126 | (1,706 | ) | ||||||||
| Comprehensive income (loss) | $ | 3,981 | $ | 17,719 | $ | (19,964 | ) | |||||
See Notes to the Consolidated Financial Statements.
| 58 |
PCM, INC.
CONSOLIDATED STATEMENTS OF STOCKHOLDERS’ EQUITY
(in thousands)
| Accumulated | ||||||||||||||||||||||||||||
| Additional | Other | Retained | ||||||||||||||||||||||||||
| Common Stock | Paid-in | Treasury | Comprehensive | Earnings | ||||||||||||||||||||||||
| Outstanding | Amount | Capital | Stock | Income (loss) | (Loss) | Total | ||||||||||||||||||||||
| Balance at December 31, 2014 | 12,268 | $ | 16 | $ | 120,915 | $ | (17,472 | ) | $ | 941 | $ | 28,916 | $ | 133,316 | ||||||||||||||
| Stock option exercises, RSUs vested and related income tax benefit | 249 | — | 428 | — | — | 428 | ||||||||||||||||||||||
| Stock-based compensation expense | — | — | 1,589 | — | — | — | 1,589 | |||||||||||||||||||||
| Purchases of common stock under a stock repurchase program | (602 | ) | — | — | (5,854 | ) | — | — | (5,854 | ) | ||||||||||||||||||
| Net income | — | — | — | — | — | (18,258 | ) | (18,258 | ) | |||||||||||||||||||
| Other comprehensive loss | — | — | — | — | (1,706 | ) | — | (1,706 | ) | |||||||||||||||||||
| Balance at December 31, 2015 | 11,915 | 16 | 122,932 | (23,326 | ) | (765 | ) | 10,658 | 109,515 | |||||||||||||||||||
| Stock option exercises, RSUs vested and related income tax benefit | 458 | — | 2,884 | — | — | 2,884 | ||||||||||||||||||||||
| Stock-based compensation expense | — | — | 1,961 | — | — | — | 1,961 | |||||||||||||||||||||
| Purchases of common stock under a stock repurchase program | (406 | ) | — | — | (3,608 | ) | — | — | (3,608 | ) | ||||||||||||||||||
| Net loss | — | — | — | — | — | 17,593 | 17,593 | |||||||||||||||||||||
| Other comprehensive loss | — | — | — | — | 126 | — | 126 | |||||||||||||||||||||
| Balance at December 31, 2016 | 11,967 | 16 | 127,777 | (26,934 | ) | (639 | ) | 28,251 | 128,471 | |||||||||||||||||||
| Stock option exercises, RSUs vested and related income tax benefit | 705 | 1 | 4,170 | — | — | 4,171 | ||||||||||||||||||||||
| Stock-based compensation expense | — | — | 2,605 | — | — | — | 2,605 | |||||||||||||||||||||
| Purchases of common stock under a stock repurchase program | (892 | ) | — | — | (11,602 | ) | — | — | (11,602 | ) | ||||||||||||||||||
| Forfeiture rate election related to stock-based compensation | — | — | 94 | — | — | (94 | ) | — | ||||||||||||||||||||
| Net income | — | — | — | — | — | 3,091 | 3,091 | |||||||||||||||||||||
| Other comprehensive income | — | — | — | — | 890 | — | 890 | |||||||||||||||||||||
| Balance at December 31, 2017 | 11,780 | $ | 17 | $ | 134,646 | $ | (38,536 | ) | $ | 251 | $ | 31,248 | $ | 127,626 | ||||||||||||||
See Notes to the Consolidated Financial Statements.
| 59 |
PCM, INC.
CONSOLIDATED STATEMENTS OF CASH FLOWS
(in thousands)
| Years Ended December 31, | ||||||||||||
| 2017 | 2016 | 2015 | ||||||||||
| Cash Flows From Operating Activities | ||||||||||||
| Net income (loss) | $ | 3,091 | $ | 17,593 | $ | (18,258 | ) | |||||
| Adjustments to reconcile net income (loss) to net cash provided by (used in) operating activities: | ||||||||||||
| Depreciation and amortization | 14,181 | 15,784 | 12,217 | |||||||||
| Equity income from unconsolidated affiliate | (528 | ) | — | — | ||||||||
| Distribution from equity method investee | 237 | — | — | |||||||||
| Write-off of software work in process | — | 37 | 25,427 | |||||||||
| Provision for deferred income taxes | 600 | 1,248 | (9,775 | ) | ||||||||
| Non-cash stock-based compensation | 2,605 | 1,961 | 1,589 | |||||||||
| Change in operating assets and liabilities: | ||||||||||||
| Accounts receivable | (77,644 | ) | (17,421 | ) | (126,981 | ) | ||||||
| Inventories | (22,599 | ) | (25,557 | ) | 1,663 | |||||||
| Prepaid expenses and other current assets | 7,061 | 1,770 | (629 | ) | ||||||||
| Other assets | (333 | ) | 1,020 | 837 | ||||||||
| Accounts payable | 8,535 | 87,702 | 54,314 | |||||||||
| Accrued expenses and other current liabilities | 3,869 | 12,948 | 6,317 | |||||||||
| Deferred revenue | (3,853 | ) | (572 | ) | 1,074 | |||||||
| Total adjustments | (67,896 | ) | 78,920 | (33,947 | ) | |||||||
| Net cash provided by (used in) operating activities | (64,778 | ) | 96,513 | (52,205 | ) | |||||||
| Cash Flows From Investing Activities | ||||||||||||
| Acquisitions, net of cash acquired | (4,806 | ) | (2,077 | ) | (44,861 | ) | ||||||
| Purchases of property and equipment | (17,325 | ) | (8,705 | ) | (21,380 | ) | ||||||
| Net cash used in investing activities | (22,131 | ) | (10,782 | ) | (66,241 | ) | ||||||
| Cash Flows From Financing Activities | ||||||||||||
| Net borrowings (payments) under line of credit | 106,382 | (55,043 | ) | 109,644 | ||||||||
| Borrowings under notes payable | 5,216 | 526 | 17,695 | |||||||||
| Payments under notes payable | (3,771 | ) | (5,173 | ) | (4,686 | ) | ||||||
| Change in book overdraft | 3,195 | (13,131 | ) | 16,387 | ||||||||
| Payments of earn-out liability | (13,427 | ) | (13,058 | ) | (8,938 | ) | ||||||
| Payments of obligations under capital leases | (1,311 | ) | (2,425 | ) | (2,394 | ) | ||||||
| Proceeds from stock issued under stock option plans | 5,080 | 2,541 | 907 | |||||||||
| Capital lease proceeds | 587 | — | — | |||||||||
| Payments for deferred financing costs | (1,009 | ) | (653 | ) | (760 | ) | ||||||
| Common shares repurchased and held in treasury | (11,602 | ) | (3,608 | ) | (5,854 | ) | ||||||
| Payment of taxes related to net-settled stock awards | (894 | ) | — | — | ||||||||
| Net cash provided by (used in) financing activities | 88,446 | (90,024 | ) | 122,001 | ||||||||
| Effect of foreign currency on cash flow | 404 | 289 | (1,271 | ) | ||||||||
| Net change in cash and cash equivalents | 1,941 | (4,004 | ) | 2,284 | ||||||||
| Cash and cash equivalents at beginning of the period | 7,172 | 11,176 | 8,892 | |||||||||
| Cash and cash equivalents at end of the period | $ | 9,113 | $ | 7,172 | $ | 11,176 | ||||||
| Supplemental Cash Flow Information | ||||||||||||
| Interest paid | $ | 7,071 | $ | 5,373 | $ | 3,619 | ||||||
| Income taxes paid (refund), net | 4,340 | 7,332 | (4,960 | ) | ||||||||
| Supplemental Non-Cash Investing and Financing Activities | ||||||||||||
| Accrued earn-out liability related to acquisitions | $ | 707 | $ | 326 | $ | 38,625 | ||||||
| Financed purchases of property and equipment | 900 | 777 | 895 | |||||||||
See Notes to the Consolidated Financial Statements.
| 60 |
PCM, INC.
NOTES TO THE CONSOLIDATED FINANCIAL STATEMENTS
1. Description of Company
PCM, Inc. is a leading multi-vendor provider of technology solutions, including hardware products, software and services, offered through our dedicated sales force, ecommerce channels and technology services teams. Since our founding in 1987, we have served our customers by offering products and services from vendors such as Adobe, Apple, Cisco, Dell, Hewlett Packard Enterprise, HP Inc., Lenovo, Microsoft, Oracle, Symantec and VMware. We provide our customers with comprehensive solutions incorporating leading products and services across a variety of technology practices and platforms such as cloud, security, data center, networking, collaboration and mobility. Our sales and marketing efforts allow our vendor partners to reach multiple customer segments including small, medium and enterprise businesses, state, local and federal governments and educational institutions.
In connection with our entrance into the UK market in the first quarter of 2017 with the formation of PCM Technology Solutions UK, Ltd (“PCM UK”), we formed a new operating segment called United Kingdom. In February 2016, we transitioned out nearly the entire management overhead of our MacMall business, thinned out its cost structure and brought it under the management and supervision of our Commercial segment. Also, in connection with our acquisitions of Acrodex and certain assets of Systemax’s North American Technology Group in the fourth quarter of 2015, which are both described more fully below in Note 3, and our resulting entrance into selling technology solutions in the Canadian market, we formed a new operating segment called Canada, which includes our operations related to these Canadian market activities. As a result, we operate in four reportable segments: Commercial, Public Sector, Canada and United Kingdom. Our reportable operating segments are primarily aligned based upon our reporting of results as used by our chief operating decision maker in evaluating the operating results and performance of our company. We include corporate related expenses such as legal, accounting, information technology, product management and other administrative costs that are not otherwise included in our reportable operating segments in Corporate & Other. All historical segment financial information provided herein has been revised to reflect our revised reportable operating segments.
We sell primarily to customers in the United States, Canada and the UK, and maintain offices in the United States, Canada and the UK, as well as in the Philippines. In 2017, we generated approximately 79% of our revenue in our Commercial segment, 13% of our revenue in our Public Sector segment and 8% of our revenue in our Canada segment. PCM UK commenced its sales operations in May 2017 and our United Kingdom segment net sales were $12.2 million in the year ended December 31, 2017.
Our Commercial segment sells complex technology solutions to commercial businesses in the United States, using multiple sales channels, including a field relationship-based selling model, an outbound phone based sales force, a field services organization and online extranets.
Our Public Sector segment consists of sales made primarily to federal, state and local governments, as well as educational institutions. The Public Sector segment utilizes an outbound phone and field relationship-based selling model, as well as contract and bid business development teams and an online extranet.
Our Canada segment consists of sales made to customers in the Canadian market beginning as of the respective dates of our acquisition of Acrodex and certain assets of Systemax in October and December 2015, respectively, as well as the acquisition of Stratiform in December 2016.
Our United Kingdom segment consists of results of our UK subsidiary, PCM UK, and its wholly-owned subsidiaries, which serve as our hub for the UK and the rest of Europe.
2. Basis of Presentation and Summary of Significant Accounting Policies
Beginning in the first quarter of 2017, our financial results do not consolidate the financial results of sales made under some customer contracts we purchased in the En Pointe acquisition, which are now held by a partner which qualifies for certification as a minority and women owned business in accordance with customer supplier diversity policies. We hold a 49% passive equity interest in this partner and we have accounted for our investment in this partner using the equity method of accounting beginning in the first quarter of 2017. We refer to this entity as the non-controlled entity or NCE. We record our results from our 49% equity interest in the NCE’s operations as “Equity income from unconsolidated affiliate” in our consolidated statement of operations.
| 61 |
Principles of Consolidation
The accompanying financial statements included herein are presented on a consolidated basis and include our accounts and the accounts of all of our wholly-owned subsidiaries after elimination of intercompany accounts and transactions.
Use of Estimates in the Preparation of the Consolidated Financial Statements
We prepare our consolidated financial statements in conformity with accounting principles generally accepted in the United States of America, which requires management to make estimates, judgments and assumptions that affect the amounts reported herein. Management bases its estimates, judgments and assumptions on historical experience and on various other factors that are believed to be reasonable under the circumstances. Due to the inherent uncertainty involved in making estimates, actual results reported in future periods could differ from those estimates.
Revenue Recognition
We adhere to the guidelines and principles of revenue recognition described in ASC 605 — Revenue Recognition. Under ASC 605, product sales are recognized when the title and risk of loss are passed to the customer, there is persuasive evidence of an arrangement for sale, delivery has occurred and/or services have been rendered, the sales price is fixed or determinable and collectability is reasonably assured. Under these guidelines, the majority of our sales, including revenue from product sales and gross outbound shipping and handling charges, are recognized upon receipt of the product by the customer. In accordance with our revenue recognition policy, we perform an analysis to estimate the number of days products we have shipped are in transit to our customers using data from our third party carriers and other factors. We record an adjustment to reverse the impact of sale transactions based on the estimated value of products that have shipped, but have not yet been received by our customers, and we recognize such amounts in the subsequent period when delivery has occurred. Changes in delivery patterns or unforeseen shipping delays beyond our control could have a material impact on our revenue recognition for the current period.
For all product sales shipped directly from suppliers to customers, we take title to the products sold upon shipment, bear credit risk, and bear inventory risk for returned products that are not successfully returned to suppliers; therefore, these revenues are recognized at gross sales amounts.
We also sell certain products for which we act as an agent in accordance with ASC 605-45. Products in this category include the sale of third-party services, warranties, software assurance (“SA”) and subscriptions. SA is an “insurance” or “maintenance” product that allows customers to upgrade, at no additional cost, to the latest technology if new applications are introduced during the period that the SA is in effect. These sales do not meet the criteria for gross sales recognition, and thus are recognized on a net basis at the time of sale. Under net sales recognition, the cost paid to the vendor or third-party service provider is recorded as a reduction to sales, resulting in net sales being equal to the gross profit on the transaction.
Some of our larger customers are offered the opportunity by certain of our vendors to purchase software licenses and SA under enterprise agreements (“EAs”). Under EAs, customers are considered to be compliant with applicable license requirements for the ensuing year, regardless of changes to their employee base. Customers are charged an annual true-up fee for changes in the number of users over the year. With most EAs, our vendors will transfer the license and invoice the customer directly, paying us an agency fee or commission on these sales. We record these fees as a component of net sales as earned and there is no corresponding cost of sales amount. In certain instances, we invoice the customer directly under an EA and accounts for the individual items sold based on the nature of the item. Our vendors typically dictate how the EA will be sold to the customer.
When a customer order contains multiple deliverables such as hardware, software and services which are delivered at varying times, we determine whether the delivered items can be considered separate units of accounting as prescribed under ASC 605-25, Revenue Recognition, Multiple-Element Arrangements. For arrangements with multiple units of accounting, arrangement consideration is allocated among the units of accounting, where separable, based on their relative selling price. Relative selling price is determined based on vendor-specific objective evidence, if it exists. Otherwise, third-party evidence of selling price is used, when it is available, and in circumstances when neither vendor-specific objective evidence nor third-party evidence of selling price is available, management’s best estimate of selling price is used.
Revenue from professional services is either recognized as incurred for services billed at an hourly rate or recognized using the proportional performance method for services provided at a fixed fee. Revenue for data center services, including internet connectivity, web hosting, server co-location and managed services, is recognized over the period the service is performed.
Sales are reported net of estimated returns and allowances, discounts, mail-in rebate redemptions and credit card chargebacks. If the actual sales returns, allowances, discounts, mail-in rebate redemptions or credit card chargebacks are greater than estimated by management, additional expense may be incurred.
| 62 |
Cost of Goods Sold
Cost of goods sold includes product costs, outbound and inbound shipping costs and costs of delivered services, offset by certain market development funds, volume incentive rebates and other consideration from vendors.
We receive consideration from our vendors in the form of cooperative marketing allowances, volume incentive rebates and other programs to support our marketing of their products. Most of our vendor consideration is accrued, when performance required for recognition is completed, as an offset to cost of sales in accordance with ASC 605-50, Revenue Recognition — Customer Payments and Incentives, since such funds are not a reimbursement of specific, incremental, identifiable costs incurred by us in selling the vendors’ products. For costs that are considered to be a reimbursement of specific, incremental, identifiable costs incurred by us in selling the vendors’ products, we accrue the vendor consideration as an offset to such costs in selling, general and administrative expenses. At the end of any given period, unbilled receivables related to our vendor consideration are included in “Accounts receivable, net of allowances” in our Consolidated Balance Sheets.
Cash and Cash Equivalents
All highly liquid investments with initial maturities of three months or less and credit card receivables with settlement terms less than 5 days are considered cash equivalents. Amounts due from credit card processors classified as cash totaled $4.0 million and $4.6 million at December 31, 2017 and 2016. Checks issued but not presented for payment to the bank, net of available cash subject to a right of offset, totaling $8.6 million and $5.4 million as of December 31, 2017 and 2016 were included in “Accounts payable” in our Consolidated Balance Sheets. Our cash management programs result in utilizing available cash to pay down our line of credit.
Accounts Receivable
We generate the majority of our accounts receivable through the sale of products and services to certain customers on account. In addition, we record vendor receivables at such time as all conditions have been met that would entitle us to receive such vendor funding, and is thereby considered fully earned.
The following table presents the gross amounts of our accounts receivable (in thousands):
| At December 31, | ||||||||
| 2017 | 2016 | |||||||
| Trade receivables | $ | 380,990 | $ | 320,321 | ||||
| Vendor receivables | 41,185 | 35,482 | ||||||
| Other receivables | 19,664 | 3,978 | ||||||
| Total gross accounts receivable | 441,839 | 359,781 | ||||||
| Less: Allowance for doubtful accounts receivable | (2,181 | ) | (832 | ) | ||||
| Accounts receivable, net | $ | 439,658 | $ | 358,949 | ||||
As of December 31, 2017 and 2016, “Vendor receivables” presented above included $23.6 million and $22.6 million, respectively, of unbilled receivables relating to vendor consideration, which is described above under “Cost of Goods Sold.”
Accounts receivable potentially subject us to credit risk. We extend credit to our customers based upon an evaluation of each customer’s financial condition and credit history, and generally do not require collateral. No customer accounted for more than 10% of trade accounts receivable at December 31, 2017 and 2016. We maintain an allowance for doubtful accounts receivable based upon estimates of future collection. We regularly evaluate our customers’ financial condition and credit history in determining the adequacy of our allowance for doubtful accounts. We have historically incurred credit losses within management’s expectations. We also maintain an allowance for uncollectible vendor receivables, which arise from vendor rebate programs, price protections and other promotions. We determine the sufficiency of the vendor receivable allowance based upon various factors, including payment history. Amounts received from vendors may vary from amounts recorded because of potential non-compliance with certain elements of vendor programs. If the estimated allowance for uncollectible accounts or vendor receivables subsequently proves to be insufficient, additional allowance may be required.
Inventories
Inventories consist primarily of finished goods, and are stated at the lower of cost (determined under the first-in, first-out method) or market. As discussed under “Revenue Recognition” above, we do not record revenue and related cost of goods sold until there is persuasive evidence of an arrangement for sale, delivery has occurred, the sales price is fixed and determinable and collectability is reasonably assured. As such, inventories include goods-in-transit to customers at December 31, 2017 and 2016.
A substantial portion of our business is dependent on sales of Cisco, HP Inc. and Microsoft products as well as products purchased from other vendors including Apple, Dell, Hewlett Packard Enterprise, Ingram Micro, Lenovo, Synnex and Tech Data. Our top sales of products by manufacturer as a percent of our gross billed sales were as follows for the periods presented:
| Years Ended December 31, | ||||||||||||
| 2017 | 2016 | 2015 | ||||||||||
| Microsoft | 15 | % | 15 | % | 14 | % | ||||||
| HP Inc. | 10 | 10 | 11 | |||||||||
| 63 |
Advertising Costs
Our advertising expenditures are expensed in the period incurred. Total net advertising expenses, which were included in “Selling, general and administrative expenses” in our Consolidated Statements of Operations, were $5.3 million, $4.2 million and $4.4 million in the years ended December 31, 2017, 2016 and 2015, respectively.
Property and Equipment
Property and equipment are stated at cost and are depreciated using the straight-line method over the estimated useful lives of the assets, as noted below. Leasehold improvements are amortized over the shorter of their useful lives or the remaining lease term. We also capitalize computer software costs that meet both the definition of internal-use software and defined criteria for capitalization in accordance with ASC 350-40, Internal-Use Software.
| Autos | 3 – 5 years | |
| Computers, software, machinery and equipment | 1 – 7 years | |
| Leasehold improvements | 1 – 10 years | |
| Furniture and fixtures | 3 – 15 years | |
| Building and improvements | 5 – 31 years |
We had $4.5 million and $4.2 million of remaining unamortized internally developed software at December 31, 2017 and 2016, respectively.
Disclosures About Fair Value of Financial Instruments
The carrying amounts of our cash and cash equivalents, accounts receivable, accounts payable and accrued expenses and other current liabilities approximate their fair values because of the short-term maturity of these instruments. The carrying amounts of our line of credit borrowings and notes payable approximate their fair values based upon the current rates offered to us for obligations of similar terms and remaining maturities.
Goodwill and Intangible Assets
Goodwill and indefinite-lived intangible assets are carried at historical cost, subject to write-down, as needed, based upon an impairment analysis that we perform annually, or sooner if an event occurs or circumstances change that would more likely than not result in an impairment loss. We perform our annual impairment test for goodwill and indefinite-lived intangible assets as of October 1 of each year.
Goodwill impairment is deemed to exist if the net book value of a reporting unit exceeds its estimated fair value. Events that may create an impairment include, but are not limited to, significant and sustained decline in our stock price or market capitalization, significant underperformance of operating units and significant changes in market conditions. Changes in estimates of future cash flows or changes in market values could result in a write-down of our goodwill in a future period. If an impairment loss results from any impairment analysis as described above, such loss will be recorded as a pre-tax charge to our operating income. Goodwill is allocated to various reporting units, which are generally an operating segment or one level below the operating segment. At October 1, 2017, our goodwill resided in our Abreon, Commercial Technology, Public Sector and Canada reporting units.
Goodwill impairment testing is a two-step process. Step one involves comparing the fair value of our reporting units to their carrying amount. If the fair value of the reporting unit is greater than its carrying amount, there is no impairment and no further testing is required. If the reporting unit’s carrying amount is greater than the fair value, the second step must be completed to measure the amount of impairment, if any. Step two calculates the implied fair value of goodwill by deducting the fair value of all tangible and intangible assets, excluding goodwill, net of any assumed liabilities, of the reporting unit from the fair value of the reporting unit as determined in step one. The implied fair value of goodwill determined in this step is compared to the carrying value of goodwill. If the implied fair value of goodwill is less than the carrying value of goodwill, an impairment loss is recognized equal to the difference.
We performed our annual impairment analysis of goodwill and indefinite-lived intangible assets for possible impairment as of October 1, 2017. Our annual impairment analysis excluded goodwill associated with acquisitions made during the third and fourth quarter of 2017, as their purchase price allocations were completed subsequent to the analysis date, and their operations have not had sufficient operating time to suggest any triggering event would have occurred. Our management, with the assistance of an independent third-party valuation firm, determined the fair values of our reporting units and their underlying assets, and compared them to their respective carrying values. Goodwill represents the excess of the purchase price over the fair value of the net tangible and identifiable intangible assets acquired in each business combination. The carrying value of goodwill was allocated to our reporting units pursuant to ASC 350. As a result of our annual impairment analysis as of October 1, 2017, we have determined that no impairment of goodwill and other indefinite-lived intangible assets existed.
| 64 |
Fair value was determined by using a weighted combination of a market-based approach and an income approach, as this combination was deemed to be the most indicative of fair value in an orderly transaction between market participants. Under the market-based approach, we utilized information regarding our company and publicly available comparable company and industry information to determine cash flow multiples and revenue multiples that are used to value our reporting units. Under the income approach, we determined fair value based on estimated future cash flows of each reporting unit, discounted by an estimated weighted-average cost of capital, which reflects the overall level of inherent risk of a reporting unit and the rate of return an outside investor would expect to earn.
In addition, the fair value of our indefinite-lived trademark was determined using the relief from royalty method under the income approach to value. This method applies a market based royalty rate to projected revenues that are associated with the trademarks. Applying the royalty rate to projected revenues resulted in an indication of the pre-tax royalty savings associated with ownership of the trademarks. Projected after-tax royalty savings were discounted to present value at the reporting unit’s weighted average cost of capital, and a tax amortization benefit (calculated based on a 15-year life for tax purposes) was added.
In conjunction with our annual assessment of goodwill, our valuation techniques did not indicate any impairment as of October 1, 2017. All reporting units with goodwill passed the first step of the goodwill evaluation, with the fair values of our Abreon, Commercial Technology, Public Sector and Canada reporting units exceeding their respective carrying values by 56%, 46%, 63% and 103% and, accordingly, we were not required to perform the second step of the goodwill evaluation. We had $7.2 million, $62.5 million, $8.3 million and $6.5 million of goodwill as of October 1, 2017 residing in our Abreon, Commercial Technology, Public Sector and Canada reporting units, respectively. In applying the market and income approaches to determining fair value of our reporting units, we rely on a number of significant assumptions and estimates including revenue growth rates and operating margins, discount rates and future market conditions, among others. Our estimates are based upon assumptions we believe to be reasonable, but which by nature are uncertain and unpredictable. Changes in one or more of these significant estimates or assumptions could affect the results of these impairment reviews.
As part of our annual review for impairment, we assessed the total fair values of the reporting units and compared total fair value to our market capitalization at October 1, 2017, including the implied control premium, to determine if the fair values are reasonable compared to external market indicators. When comparing our market capitalization to the discounted cash flow models for each reporting unit summed together, the implied control premium was approximately 34% as of October 1, 2017. We believe several factors are contributing to our low market capitalization, including the lack of trading volume in our stock and the recent significant investments made in various parts of our business and their effects on analyst earnings models.
Given continuing economic uncertainties and related risks to our business, there can be no assurance that our estimates and assumptions made for purposes of our goodwill and indefinite-lived intangible assets impairment testing as of October 1, 2017 will prove to be accurate predictions of the future. We may be required to record additional goodwill impairment charges in future periods, whether in connection with our next annual impairment testing as of October 1, 2018 or prior to that, if any change constitutes a triggering event outside of the quarter from when the annual goodwill and indefinite-lived intangible assets impairment test is performed. It is not possible at this time to determine if any such future impairment charge would result or, if it does, whether such charge would be material.
We amortize other intangible assets with definite lives generally on a straight-line basis over their estimated useful lives, or in the case of customer relationships, based on a relative percentage of annual discounted cash flows expected to be delivered by the asset over its estimated useful life.
Valuation of Long-Lived Assets
We review long-lived assets and certain intangible assets for impairment when events or changes in circumstances indicate the carrying amount of an asset may not be recoverable. In the event the undiscounted future cash flow attributable to the asset is less than the carrying amount of the asset, an impairment loss is recognized based on the amount by which the carrying value exceeds the fair value of the long-lived asset. Changes in estimates of future cash flows attributable to the long-lived assets could result in a write-down of the asset in a future period.
| 65 |
Debt Issuance Costs
We defer costs incurred to obtain our credit facility as an asset and amortize these deferred costs to interest expense using the straight-line method over the term of the respective obligation.
Income Taxes
We account for income taxes under the assets and liability method as prescribed in accordance with ASC 740 - Income Taxes. Under this method, deferred tax assets and liabilities are recognized by applying enacted statutory tax rates applicable to future years to differences between the tax basis and financial reporting amounts of existing assets and liabilities. The effect of a change in tax rates on deferred tax assets and liabilities is recognized in income in the period that includes the enactment date. We make certain estimates and judgments in determining income tax provisions and benefits, in assessing the likelihood of recovering our deferred tax assets and in evaluating our tax positions. A valuation allowance is provided when it is more likely than not that all or some portion of deferred tax assets will not be realized. In making such a determination, all available positive and negative evidence is considered, including future reversals of existing taxable temporary differences, projected future taxable income, tax-planning strategies, and results of recent operations.
We account for uncertainty in income taxes recognized in financial statements in accordance with ASC 740, which prescribes a recognition threshold and measurement attribute for the financial statement recognition and measurement of a tax position taken or expected to be taken in a tax return. ASC 740 also provides guidance on derecognition, classification, interest and penalties, accounting in interim periods, disclosure, and transition. Only tax positions that meet the more-likely-than-not recognition threshold may be recognized. We have elected to classify interest and penalties related to income tax liabilities, when applicable, as part of “Interest expense, net” in our Consolidated Statements of Operations.
Sales Taxes
We present sales tax we collect from our customers on a net basis (excluded from our revenues), a presentation which is prescribed as one of two methods available under ASC 605-45-50-3 (Taxes Collected from Customers and Remitted to Governmental Authorities).
Stock-Based Compensation
We account for stock-based compensation in accordance with ASC 718 - Compensation - Stock Compensation. ASC 718 addresses the accounting for share-based payment transactions in which an enterprise receives employee services in exchange for either equity instruments of the enterprise or liabilities that are based on the fair value of the enterprise’s equity instruments or that may be settled by the issuance of such equity instruments. We record compensation expense related to stock-based compensation over the award’s requisite service period on a straight-line basis.
We estimate the grant date fair value of each stock option grant awarded using the Black-Scholes option pricing model and management assumptions made regarding various factors, including expected volatility of our common stock, expected life of options granted and estimated forfeiture rates, which require use of accounting judgment and financial estimates. We compute the expected term based upon an analysis of historical exercises of stock options by our employees. We compute our expected volatility using historical prices of our common stock for a period equal to the expected term of the options. The risk-free interest rate is determined using the implied yield on U.S. Treasury issues with a remaining term within the contractual life of the award. We account for forfeitures as they occur. Any material change in the estimates used in calculating the stock-based compensation expense could result in a material impact on our results of operations.
Foreign Currency Translation
The local currency of our foreign operations is their functional currency. The financial statements of our foreign subsidiaries are translated into U.S. dollars in accordance with ASC 830-30. Accordingly, the assets and liabilities of our Canadian and Philippine subsidiaries are translated into U.S. dollars at the exchange rate in effect at the balance sheet dates. Income and expense items are translated at the average exchange rate for each month within the year. The resulting translation adjustments are recorded in “Accumulated other comprehensive income (loss),” a separate component of stockholders’ equity on our Consolidated Balance Sheets. All transaction gains or losses are recorded in “Selling, general and administrative expenses” on our Consolidated Statements of Operations, and we recorded gains of $25,000, $0.2 million and a loss of $0.7 million for the years ended December 31, 2017, 2016 and 2015, respectively.
| 66 |
Recent Accounting Pronouncements
In January 2017, the Financial Accounting Standards Board (“FASB”) issued ASU No. 2017-04, “Intangibles – Goodwill and Other (Topic 350): Simplifying the Test for Goodwill Impairment,” which simplified the testing of goodwill for impairment by eliminating Step 2 from the goodwill impairment test. Step 2 measured a goodwill impairment loss by comparing the implied fair value of a reporting unit’s goodwill with the carrying amount of that goodwill. ASU 2017-04 is effective for public companies for its annual or any interim goodwill impairment tests in fiscal years beginning after December 15, 2019. We are currently evaluating the effects that the adoption of ASU 2017-04 will have on our consolidated financial statements.
In January 2017, the FASB issued ASU No. 2017-01, “Business Combinations (Topic 805): Clarifying the Definition of a Business,” which provides a more robust framework to use in determining when a set of assets and activities is a business. ASU 2017-01 provides a more narrow definition of what is referred to as outputs and align it with how outputs are described in Topic 606 in order to narrow the broad interpretations of the definition of a business. ASU 2017-01 is effective for public companies in their annual periods beginning after December 15, 2017, including interim periods within those periods. We are currently evaluating the effects that the adoption of ASU 2017-01 will have on our consolidated financial statements.
In August 2016, the FASB issued ASU No. 2016-15, “Statement of Cash Flows (Topic 230) – Classification of Certain Cash Receipts and Cash Payments,” which aims to eliminate the diversity in practice related to classification of eight types of cash flows. ASU 2016-15 is effective for public companies for fiscal years beginning after December 15, 2017, including interim periods within those fiscal years. We are currently evaluating the effects that the adoption of ASU 2016-15 will have on our consolidated financial statements.
In March 2016, the FASB issued ASU No. 2016-09, “Compensation – Stock Compensation (Topic 718) - Improvements to Employee Share-Based Accounting,” which simplifies several aspects of accounting for employee share-based payment transactions, including the accounting for income taxes, the calculation of diluted earnings per share, forfeitures, and statutory state tax withholding requirements, as wells as classification in statement of cash flows. We adopted ASU 2016-09 effective January 1, 2017 using the prospective method to recognize excess tax benefits and deficits in our consolidated statements of operations, and using the retrospective method relating to classification of excess tax benefits on our consolidated statements of cash flows. Also, we made an accounting policy election, on a modified prospective basis, to recognize forfeitures as they occur and cease estimating expected forfeitures. As a result of adopting ASU 2016-09, in 2017 we recorded a credit to income tax expense of approximately $2.7 million related to the excess tax benefits associated with the exercise of stock options and vesting of restricted stock units on our consolidated statement of operations, and we reclassified $0.9 million and $0.2 million from cash flows from financing activities to cash flows from operating activities for 2016 and 2015, respectively, to conform to our current period presentation. Also, we recorded a $94,000 cumulative effect adjustment to retained earnings as of January 1, 2017 as a result of our accounting policy election relating to forfeitures. We anticipate ongoing income tax expense volatility as a result of the adoption of this standard.
In February 2016, the FASB issued ASU No. 2016-02, “Leases (Topic 842)” which requires lessees to recognize right-of-use assets and lease liability, initially measured at present value of the lease payments, on its balance sheet for leases with terms longer than 12 months and classified as either financing or operating leases. ASU 2016-02 requires a modified retrospective transition approach for capital and operating leases existing at, or entered into after, the beginning of the earliest comparative period presented in the financial statements, and provides certain practical expedients that companies may elect. ASU 2016-02 is effective for public companies for fiscal years beginning after December 15, 2018, including interim periods within those fiscal years. We are currently evaluating the effects that the adoption of ASU 2016-02 will have on our consolidated financial statements.
In November 2015, the FASB issued ASU No. 2015-17, “Balance Sheet Classification of Deferred Taxes,” which requires all deferred tax assets and liabilities, and any related valuation allowance, to be classified as non-current on the balance sheet. The classification change for all deferred taxes as non-current simplifies entities’ processes as it eliminates the need to separately identify the net current and net non-current deferred tax asset or liability in each jurisdiction and allocate valuation allowances. We adopted ASU 2015-17 effective January 1, 2017 on a retrospective basis. As a result of the adoption, we reclassified current deferred tax assets of $3.6 million and current deferred tax liabilities of $0.6 million included in our balance sheet as of December 31, 2016 to noncurrent. There was no impact on our results of operations or our cash flows as a result of the adoption of ASU 2015-17.
In July 2015, the FASB issued ASU 2015-11, “Inventory (Topic 330) - Simplifying the Measurement of Inventory,” which requires that inventory within the scope of the guidance be measured at the lower of cost and net realizable value. Net realizable value is the estimated selling prices in the ordinary course of business, less reasonably predictable costs of completion, disposal, and transportation. ASU 2015-11 applies to inventory that is measured using first-in, first-out (FIFO) or average cost. We adopted ASU 2015-11 effective January 1, 2017 and it did not have a material effect on our consolidated financial statements.
| 67 |
In May 2014, the FASB issued ASU 2014-09, Revenue from Contracts with Customers (Topic 606), which, along with amendments issued in 2015 and 2016, will replace most existing revenue recognition guidance under GAAP and eliminate industry specific guidance. The core principle of the new guidance is that an entity should recognize revenue for the transfer of goods and services equal to an amount it expects to be entitled to receive for those goods and services. The new guidance permits two methods of adoption: retrospectively to each prior reporting period presented (full retrospective method), or retrospectively by recognizing the cumulative effect of initially applying the guidance to all contracts existing at the date of initial application (the modified retrospective method). The ASU, as amended, was effective beginning in the first quarter of 2018. We have engaged resources and created a cross-functional implementation team to analyze the effect of the new guidance and communicate its findings and progress to management and the audit committee. We have assessed all potential impacts of the standard on our contract portfolio by reviewing the current accounting policies and practices utilized to identify potential differences that would result from applying the requirements of the new standard to our various contracts. We adopted the guidance on January 1, 2018 using the full retrospective method. We have finalized the accounting policies under the new guidance and determined it to impact two revenue streams as follows:
| ● | the timing of revenue recognition of product in transit to customers - different businesses within PCM have had varying terms of sale related to when title and risk of loss transfer to the customer, either upon shipment or delivery. Historically, regardless of the terms of sale, we have recorded revenue upon delivery to the customer. The adoption of ASU 2014-09 changes the way we would recognize revenue for sales with terms where title and risk of loss transfer at shipping point, such that they are now to be recorded at shipment, which is when we transfer control, rather than upon delivery, to our customers. Given that we are migrating to a common ERP, and to ensure consistent application of the new revenue standard across all of our businesses as we adopt and implement ASU 2014-09, we changed the terms of sale in the fourth quarter of 2017 such that all of our businesses have terms where title and risk of loss transfer upon delivery to the customer. As a result, we will continue to record all sales in 2018 and beyond similar to how we have historically recorded them in 2017 and prior by recording them upon delivery to our customers. Since we have elected the retrospective method of adoption, the 2016 and 2017 results will reflect the impact of recording revenue at its historical stated terms and conditions.
| |
| ● | the gross vs. net treatment of certain security software revenues – in certain security software transactions when accompanying third-party delivered software assurance is deemed to be critical or essential to the core functionality of the software license, we have determined that the software license and the accompanying third-party delivered software assurance are a single performance obligation. The value of the product is primarily the accompanying support delivered by a third-party and therefore we act as an agent in these transactions and will recognize them on a net basis. We currently recognize revenue from the software license on a gross basis (i.e., acting as a principal) and accompanying third-party delivered software assurance on a net basis. This change will reduce both net sales and cost of sales with no impact on reported gross profit.
| |
| ● | The accounting for revenue related to hardware, software (excluding the above) and services will remain unchanged. |
We expect the adoption of ASU 2014-09 will impact our financial results as follows (in millions, except per share amounts):
| Year Ended December 31, 2017 | Year Ended December 31, 2016 | |||||||||||||||||||||||
| As Reported | New Revenue Recognition Standard Adjustment | As Adjusted | As Reported | New Revenue Recognition Standard Adjustment | As Adjusted | |||||||||||||||||||
| Net sales | $ | 2,193,436 | $ | (26,549 | ) | $ | 2,166,887 | $ | 2,250,587 | $ | (11,030 | ) | $ | 2,239,557 | ||||||||||
| Gross profit | 325,722 | (994 | ) | 324,728 | 318,801 | 126 | 318,927 | |||||||||||||||||
| Gross profit margin | 14.85 | % | 14bps | 14.99 | % | 14.17 | % | 8bps | 14.24 | % | ||||||||||||||
| Operating profit | $ | 11,441 | $ | (813 | ) | $ | 10,628 | $ | 34,791 | $ | 110 | $ | 34,901 | |||||||||||
| Income tax expense | 984 | (317 | ) | 667 | 11,115 | 43 | 11,158 | |||||||||||||||||
| Net income | 3,091 | (496 | ) | 2,595 | 17,593 | 67 | 17,660 | |||||||||||||||||
| Earnings per common share: | ||||||||||||||||||||||||
| Basic | $ | 0.25 | $ | (0.04 | ) | $ | 0.21 | $ | 1.49 | $ | 0.01 | $ | 1.49 | (1) | ||||||||||
| Diluted | 0.24 | (0.04 | ) | 0.20 | 1.40 | 0.01 | 1.41 | |||||||||||||||||
(1) Amount does not foot across due to rounding.
| 68 |
| At December 31, 2016 | ||||||||||||
| As Reported | New Revenue Recognition Standard Adjustment | As Adjusted | ||||||||||
| Accounts receivable, net | $ | 358,949 | $ | 9,647 | $ | 368,596 | ||||||
| Inventories | 80,872 | (8,653 | ) | 72,219 | ||||||||
| Total current assets | 469,055 | 994 | 470,049 | |||||||||
| Total assets | 629,810 | 994 | 630,804 | |||||||||
| Accounts payable | 276,524 | 180 | 276,704 | |||||||||
| Total current liabilities | 474,052 | 180 | 474,232 | |||||||||
| Deferred income tax liabilities | 1,498 | 317 | 1,815 | |||||||||
| Total liabilities | 501,339 | 498 | 501,837 | |||||||||
| Retained earnings | 28,251 | 496 | 28,747 | |||||||||
| Total stockholders’ equity | 128,471 | 496 | 128,967 | |||||||||
| Total liabilities and stockholders’ equity | 629,810 | 994 | 630,804 | |||||||||
The adoption of ASU 2014-09 did not impact our consolidated balance sheet as of December 31, 2017 and cash flow provided by operating activities for the years ended December 31, 2017 and 2016.
3. Acquisitions
Provista Technology
On December 22, 2017, PCM UK, our UK based subsidiary, completed the acquisition of Provista Technology for an initial purchase price of £3.4 million, net of cash acquired and including £1.1 million of accrued earn-out liability (or $4.5 million, net of cash acquired and including $1.4 million of accrued earn-out liability). Provista Technology has expertise across a range of technologies and manufacturers including Cisco, Avaya, Cisco Meraki, Huawei, Checkpoint, and other leading vendors, with offerings encompassing all aspects of Cloud Networking, Cloud Video, Hyperconvergence, Security, Collaboration, Secure Wireless and IP LAN, WAN & Data Center Networks. We believe this acquisition will further enhance PCM UK’s expertise and vendor accreditations in the United Kingdom as a Cisco Gold Partner, allowing PCM UK and its subsidiaries to offer further consultancy, integration and supply of services and solutions across the UK marketplace while replicating many existing offerings from our North American organization. As part of the Provista acquisition, we agreed to pay certain contingent earn-out consideration related to years ending December 31, 2018, 2019 and 2020 (each year the “measurement period”), and payable 90 days in arrears following each measurement period. As of December 31, 2017, we have estimated that the fair value of contingent consideration to be paid throughout the earn-out periods to be approximately $1.4 million, of which we have included $0.5 million in “Accrued expenses and other current liabilities” and $0.9 million in “Other long-term liabilities” on our Consolidated Balance Sheet as of December 31, 2017. The accounting for the acquisition of Provista Technology is currently preliminary and we continue to obtain information relative to the fair values of certain assets acquired and certain liabilities assumed in the transaction.
Stack Technology
On September 22, 2017, PCM UK completed the acquisition of Stack Technology for an initial purchase price of £1.2 million, net of cash acquired (or $1.7 million, net of cash acquired). Stack Technology, headquartered in Liverpool, United Kingdom, specializes in the selection, implementation and management of leading IT solutions, with offerings encompassing all aspects of cloud-based solutions, security, virtualization, data services, unified communications, and infrastructure. We agreed to pay certain contingent consideration as part of our acquisition of Stack Technology. However, we do not believe any earn-out consideration will be earned by the seller pursuant to the terms of the acquisition agreement. As such, as of December 31, 2017, we have no accrued earn-out liability related to the Stack Technology acquisition. The accounting for the acquisition of Stack Technology is currently preliminary and we continue to obtain information relative to the fair values of certain assets acquired and certain liabilities assumed in the transaction.
| 69 |
Stratiform
On December 29, 2016, we completed the acquisition of Stratiform, Inc. for C$2.1 million in cash (or $1.6 million). Stratiform is an industry-leading provider of cloud IT solutions that include consulting, professional and managed services to clients across Canada. As part of the Stratiform acquisition, we agreed to pay certain contingent earn-out consideration related to years ending December 31, 2017, 2018 and 2019 (each year the “measurement period”), and payable 90 days in arrears following each measurement period. As of December 31, 2016, we have estimated that the fair value of contingent consideration to be paid throughout the earn-out periods to be approximately $0.7 million, of which we have included $0.3 million in each of “Accrued expenses and other current liabilities” and “Other long-term liabilities” on our Consolidated Balance Sheet as of December 31, 2016. In conjunction with the finalization of our earn-out valuation, we recorded a $0.7 million reduction to accrued earn out liability and goodwill on our consolidated balance sheet as of December 31, 2017.
Systemax
On December 1, 2015, we completed the acquisition of certain Business to Business (B2B) assets of Systemax’s North American Technology Group (NATG) for $14 million in cash. We acquired the right to hire approximately 400 B2B sales representatives located across the United States and Canada, all rights to the NATG B2B customer list, certain B2B customer and vendor contracts, trademarks and other intellectual property rights including the TigerDirect brand, and certain fixed assets and equipment. We did not acquire cash, accounts receivable, inventory or assume trade payables in connection with the transaction. Also at closing, the parties entered into a transition services agreement to facilitate an orderly transition of the purchased assets. We assumed certain leases and entered into certain subleases for office space where the approximate 400 B2B sales representatives currently work.
In January 2016, we exercised an option in our purchase agreement and paid $0.4 million related to our purchase of additional customer list information, which was recorded as an increase to goodwill associated with the Systemax assets acquisition. As of December 31, 2016, we have finalized the fair value determination and purchase price allocation for the Systemax acquisition, and there has been no other change to the preliminary accounting for the Systemax acquisition and the related purchase price allocation. Based on the final purchase price allocation, we recorded the following fair values of the certain assets acquired and liabilities assumed at the date of the Systemax asset acquisition (in thousands):
| Purchase price paid | $ | 14,000 | ||
| Property and equipment | 706 | |||
| Intangible assets: | ||||
| Customer relationships(1) | 4,700 | |||
| Trademarks and trade names(2) | 2,020 | |||
| Non-compete agreements(3) | 270 | |||
| Total intangible assets | 6,990 | |||
| Total assets acquired | 7,696 | |||
| Accrued liabilities | 473 | |||
| Capital lease payables | 507 | |||
| Total liabilities assumed | 980 | |||
| Goodwill(4) | $ | 7,284 |
| (1) | Estimated useful life of this asset is 20 years. | |
| (2) | Estimated useful life of this asset is 3 years. | |
| (3) | Estimated useful life of this asset is 5 years. | |
| (4) | This goodwill acquired as part of the Systemax acquisition is recorded as part of our Canada segment, and it is not deductible for tax purposes |
Following the completion of the acquisition on December 1, 2015, the results of our TigerDirect operations, which generated $12.5 million of net sales and $0.7 million of operating profit since the date of acquisition, have been included in the results of our Commercial, Public Sector and Canada operating segments for the year ended December 31, 2015.
| 70 |
Acrodex
On October 26, 2015, PCM Sales Canada, Inc., a wholly-owned subsidiary of PCM, Inc., completed the acquisition of all the outstanding common stock of Acrodex, Inc. (“Acrodex”) for a total purchase price of approximately C$16.7 million (or $13.6 million, net of cash acquired). Acrodex, headquartered in Edmonton, Alberta (Canada), provides full end-to-end infrastructure solutions from initial plan and design, through procurement and installation, to full support and on-going management. Acrodex’s core business areas include software value-added reseller services, software asset management and hardware sales and services, including client device products, servers, storage, networks, printers and a full complement of accessories and devices. Services are a significant component to Acrodex’s product mix and include managed services, cloud-based services, consulting, IT management and other IT service areas.
We have finalized the fair value determination and purchase price allocation for the Acrodex acquisition as of September 30, 2016, and there has been no other change to the preliminary accounting for the Acrodex acquisition and the related purchase price allocation. Based on the final purchase price allocation, we recorded the following estimated fair values of the certain assets acquired and liabilities assumed at the date of the Acrodex acquisition (in thousands):
| Purchase price paid, net of cash acquired | $ | 13,566 | ||
| Accounts receivable | 14,330 | |||
| Inventories | 2,351 | |||
| Prepaid expenses and other current assets | 224 | |||
| Property and equipment | 1,098 | |||
| Intangible assets: | ||||
| Customer relationships(1) | 1,657 | |||
| Trademarks and trade names(2) | 380 | |||
| Non-compete agreements(3) | 236 | |||
| Total intangible assets | 2,273 | |||
| Other long-term assets | 62 | |||
| Total assets acquired | 20,338 | |||
| Accounts payable | 6,190 | |||
| Accrued liabilities | 3,144 | |||
| Deferred revenue | 13 | |||
| Total liabilities assumed | 9,347 | |||
| Goodwill(4) | $ | 2,575 |
| (1) | Estimated useful life of this asset is 20 years. | |
| (2) | Estimated useful life of this asset is 3 years. | |
| (3) | Estimated useful life of this asset is 5 years. | |
| (4) | This goodwill acquired as part of the Acrodex acquisition is recorded as part of our Canada segment, and it is not deductible for tax purposes. |
| 71 |
In March 2016 and June 2016, we paid an additional $0.2 million and $0.1 million, respectively, related to adjustments to the net asset value as defined in the agreement, which was recorded as an increase to goodwill resulting from the Acrodex acquisition.
Following the completion of the Acrodex acquisition on October 26, 2015, the results of our Acrodex operations, which generated $16.7 million of net sales and $0.6 million of operating profit since the date of acquisition, have been included in the results of our Canada operating segment for the year ended December 31, 2015.
En Pointe
On April 1, 2015, we completed the acquisition of certain assets of En Pointe, one of the nation’s largest independent IT solutions providers, headquartered in Southern California. En Pointe is the largest acquisition by PCM to date based on revenues, and is expected to significantly enhance PCM’s relationships with several key vendor partners, provide incremental advanced technical certifications and operational expertise in key practice areas, and bring the consolidated business significantly increased scale. We acquired the assets of En Pointe’s IT solutions provider business, excluding cash and other current tangible assets such as accounts receivable. The assets were acquired by an indirect wholly-owned subsidiary of PCM, which subsidiary now operates under the En Pointe brand. Under the terms of the agreement, we paid an initial purchase price of $15 million in cash and an additional $2.3 million for inventory. We agreed to pay certain contingent earn-out consideration, including 22.5% of the future adjusted gross profit of the business and 10% of certain service revenues over the three years following the closing of the acquisition. As of December 31, 2017, we have estimated that the fair value of contingent consideration to be paid throughout the earn-out period ending March 31, 2018 to be approximately $38.6 million, representing no change from December 31, 2015. During 2017, 2016 and 2015, we made $13.4 million, $13.1 million and $8.9 million, respectively, of earn-out payments to the sellers of En Pointe. The fair value of this contingent consideration is determined and accrued based on a probability weighted average of possible outcomes that would occur should certain financial metrics be reached. Because there is no market data available to use in valuing the contingent consideration, the Company developed its own assumptions related to the future financial performance of the businesses to determine the fair value of this liability. As such, the valuation of the contingent consideration is determined using Level 3 inputs. The payments made to date have been reasonably consistent with the historical fair value analysis and thus have not resulted in a change to the estimated liability as of December 31, 2017.
The accounting for the acquisition of En Pointe was finalized as of December 31, 2015. The purchase price has been allocated to the acquired assets and assumed liabilities, which include, but are not limited to, fixed assets, licenses, intangible assets and professional liabilities, based on estimated fair values as of the date of acquisition. Based on the final purchase price allocation, we recorded the following estimated fair values of the certain assets acquired and liabilities assumed at the date of the En Pointe acquisition (in thousands):
| Purchase price paid | $ | 17,295 | ||
| Inventories | 4,004 | |||
| Prepaid expenses and other current assets | 1,598 | |||
| Property and equipment | 439 | |||
| Intangible assets: | ||||
| Customer relationships(1) | 4,500 | |||
| Trademarks and trade names(2) | 2,000 | |||
| Non-compete agreements(3) | 1,860 | |||
| Total intangible assets | 8,360 | |||
| Other long-term assets | 115 | |||
| Total assets acquired | 14,516 | |||
| Accounts payable | 2,157 | |||
| Accrued liabilities | 1,489 | |||
| Earn-out liabilities | 38,625 | |||
| Deferred revenue | 276 | |||
| Total liabilities assumed | 42,547 | |||
| Goodwill(4) | $ | 45,326 |
| (1) | Estimated useful life of this asset is 20 years. | |
| (2) | Estimated useful life of this asset is 3 years. | |
| (3) | Estimated useful life of this asset is 4 years. | |
| (4) | This goodwill acquired as part of the En Pointe acquisition is recorded as part of our Commercial and Public Sector segments. | |
| The goodwill resulting from the En Pointe acquisition is deductible for tax purposes. |
| 72 |
As of December 31, 2017, we had $3.2 million of accrued earn-out liability included in “Accrued expenses and other current liabilities” on our Consolidated Balance Sheet. As of December 31, 2016, we had $13.3 million and $3.4 million of accrued earn-out liability included in “Accrued expenses and other current liabilities” and “Other long-term liabilities,” respectively, on our Consolidated Balance Sheets. We recorded approximately $1.8 million and $2.3 million of amortization expense during the years ended December 31, 2017 and 2016, respectively, related to the $8.4 million of intangible assets acquired in the En Pointe transaction.
The following table sets forth our results of operations on a pro forma basis as though the En Pointe acquisition had been completed as of the beginning of the periods presented (in thousands, except per share amounts):
| 2015 | ||||
| Net sales | $ | 1,779,975 | ||
| Operating loss | (24,531 | ) | ||
| Loss from continuing operations | (17,415 | ) | ||
| Net loss | (17,725 | ) | ||
| Basic and Diluted Loss Per Common Share | ||||
| Basic | $ | (1.47 | ) | |
| Diluted | (1.47 | ) | ||
| Weighted average number of common shares outstanding: | ||||
| Basic | 12,049 | |||
| Diluted | 12,049 | |||
Real Estate Transactions
In January 2017, we completed the purchase of real property in Woodridge, Illinois for approximately $3.1 million in cash. The real property includes approximately 29,344 square feet of office space.
In March 2015, we completed the purchase of real property in Irvine, California (the “Irvine Property”) for approximately $5.8 million and financed $4.9 million with a long-term note. The real property includes approximately 60,000 square feet of office and warehouse space and land. Certain of our subsidiaries were tenants of the building, which are continuing to use the office and warehouse space. In September 2015, we listed the Irvine Property for sale. See Note 5 below for more information.
In January 2015, we completed the purchase of certain real property in Lewis Center, Ohio for approximately $6.6 million. We paid approximately $2.2 million in cash and financed $4.575 million with a long-term note. The $4.575 million term note provides for a five-year term with a 25 year principal amortization period that began in February 2015, and bears interest at a variable rate of LIBOR plus 2.25%. The real property includes approximately 12.4 acres of land together with a building for office and warehouse space of approximately 144,000 square feet. Certain of our subsidiaries were tenants of the building, which are continuing to use the office and warehouse space.
For more information on the financing arrangements on the real estate transactions discussed above, see Note 8 below.
4. Stock-Based Compensation
Stock-Based Benefit Plan
PCM, Inc. 2012 Equity Incentive Plan
In April 2012, the Compensation Committee of our Board of Directors approved and adopted our 2012 Equity Incentive Plan (the “2012 Plan”). In June 2012, the Plan was approved by our stockholders at our 2012 annual stockholders meeting. Upon the adoption of the 2012 Plan, our 1994 Stock Incentive Plan (the “1994 Plan”) was terminated, canceling the shares that remained available for grant under the 1994 Plan. Outstanding awards granted under the 1994 Plan continue unaffected following the termination of the 1994 Plan.
| 73 |
The 2012 Plan authorizes our Board and the Compensation Committee to grant equity-based compensation awards in the form of stock options, SARs, restricted stock, RSUs, performance shares, performance units, and other awards for the purpose of providing our directors, officers and other employees incentives and rewards for performance. The 2012 Plan does not contain an evergreen provision. The 2012 Plan is administered by the Compensation Committee under delegated authority from the Board. The Board or Compensation Committee may delegate its authority under the 2012 Plan to a subcommittee. The Compensation Committee or the subcommittee may delegate to one or more of its members or to one or more of our officers, or to one or more agents or advisors, administrative duties, and the Compensation Committee may also delegate powers to one or more of our officers to designate employees to receive awards under the 2012 Plan and determine the size of any such awards (subject to certain limitations described in the 2012 Plan).
At December 31, 2017, a total of 936,754 shares of authorized and unissued shares were available for future grants. All options granted through December 31, 2017 have been Nonstatutory Stock Options. We satisfy stock option exercises and vesting of RSUs with newly issued shares.
Stock-Based Compensation
For the years ended December 31, 2017, 2016 and 2015, we recognized stock-based compensation expense of $2.6 million, $2.0 million and $1.6 million, respectively, in “Selling, general and administrative expenses” in our Consolidated Statements of Operations, and related deferred income tax benefits of $0.7 million, $0.8 million and $0.6 million, respectively.
Valuation Assumptions
We estimated the grant date fair value of each stock option grant awarded during the years ended December 31, 2017, 2016 and 2015 using the Black-Scholes option pricing model and management assumptions made regarding various factors which require extensive use of accounting judgment and financial estimates. We compute the expected term based upon an analysis of historical exercises of stock options by our employees. We computed our expected volatility using historical prices of our common stock for a period equal to the expected term of the options. The risk free interest rate was determined using the implied yield on U.S. Treasury issues with a remaining term within the contractual life of the award. Each year, we estimated an annual forfeiture rate based on our historical forfeiture data, which rate is revised, if necessary, in future periods if actual forfeitures differ from those estimates.
The following table presents the weighted average assumptions we used in each of the following years:
| Years Ended December 31, | ||||||||||||
| 2017 | 2016 | 2015 | ||||||||||
| Risk free interest rate | 1.99 | % | 1.45 | % | 1.67 | % | ||||||
| Expected volatility | 47 | % | 44 | % | 46 | % | ||||||
| Expected term (in years) | 6 | 6 | 5 | |||||||||
| Expected dividend yield | None | None | None | |||||||||
Stock-Based Payment Award Activity
Stock Options
The following table summarizes our stock option activity during the year ended December 31, 2017 and stock options outstanding and exercisable at December 31, 2017 for the above plans:
| Weighted | ||||||||||||||||
| Weighted | Average | Aggregate | ||||||||||||||
| Average | Remaining | Intrinsic | ||||||||||||||
| Exercise | Contractual | Value | ||||||||||||||
| Number | Price | Term (in years) | (in thousands) | |||||||||||||
| Outstanding at December 31, 2016 | 1,799,925 | $ | 8.41 | |||||||||||||
| Granted | 252,331 | 19.22 | ||||||||||||||
| Exercised | (664,817 | ) | 8.01 | |||||||||||||
| Forfeited | (85,807 | ) | 15.53 | |||||||||||||
| Expired/cancelled | (3,700 | ) | 10.97 | |||||||||||||
| Outstanding at December 31, 2017 | 1,297,932 | 10.24 | 4.06 | $ | 1,861 | |||||||||||
| Exercisable at December 31, 2017 | 763,884 | 7.92 | 3.04 | 1,829 | ||||||||||||
| 74 |
The aggregate intrinsic value is calculated for in-the-money options based on the difference between the exercise price of the underlying awards and the closing price of our common stock on December 29, 2017, which was $9.90.
| Years Ended December 31, | ||||||||||||
| 2017 | 2016 | 2015 | ||||||||||
| Weighted average grant-date fair value of options granted during the period | $ | 8.94 | $ | 4.74 | $ | 4.20 | ||||||
| Total intrinsic value of options exercised during the period (in thousands) | 9,763 | 3,391 | 1,526 | |||||||||
| Total fair value of shares vested during the period (in thousands) | 990 | 767 | 898 | |||||||||
As of December 31, 2017, there was $2.9 million of unrecognized compensation cost related to unvested outstanding stock options. We expect to recognize these costs over a weighted average period of 3.6 years.
Restricted Stock Units
We estimate the fair value of RSU awards based on the closing stock price of our common shares on the date of grant. The following table summarizes our RSU activity during the year ended December 31, 2017 issued under the above plans:
| Restricted
Stock Units | Weighted Average Grant Date Fair Value | |||||||
| Non-vested at December 31, 2016 | 379,600 | $ | 9.56 | |||||
| Granted | 194,400 | 18.97 | ||||||
| Vested and distributed | (112,400 | ) | 9.45 | |||||
| Forfeited | (16,600 | ) | 9.26 | |||||
| Expired | – | – | ||||||
| Non-vested at December 31, 2017 | 445,000 | 13.71 | ||||||
The weighted average grant-date fair value of RSUs granted during the year ended December 31, 2016 and 2015 was $10.05 and $9.66, respectively.
As of December 31, 2017, there was $5.1 million of unrecognized compensation cost related to unvested outstanding RSUs. We expect to recognize these costs over a weighted average period of 3.53 years.
5. Property and Equipment
Property and equipment consisted of the following (in thousands):
| At December 31, | ||||||||
| 2017 | 2016 | |||||||
| Computers, software, machinery and equipment | $ | 79,671 | $ | 71,769 | ||||
| Leasehold improvements | 11,886 | 7,848 | ||||||
| Furniture and fixtures | 8,498 | 6,898 | ||||||
| Building and improvements | 28,272 | 23,786 | ||||||
| Land | 17,959 | 12,852 | ||||||
| Software development and other equipment in progress | 4,369 | 2,581 | ||||||
| Subtotal | 150,655 | 125,734 | ||||||
| Less: Accumulated depreciation and amortization | (79,104 | ) | (69,382 | ) | ||||
| Property and equipment, net | $ | 71,551 | $ | 56,352 | ||||
We capitalized interest costs of approximately $86,000 and $40,000 in 2017 and 2016, respectively, relating to internally developed software costs during development. Depreciation and amortization expense for property and equipment, including fixed assets under capital leases, for the years ended December 31, 2017, 2016 and 2015 totaled $10.1 million, $9.9 million and $10.9 million.
| 75 |
In January 2017, we completed the purchase of real property in Woodridge, Illinois for approximately $3.1 million in cash. The real property includes approximately 29,344 square feet of office space.
In September 2015, we listed our real property located in Irvine, California (the “Irvine Property”) for sale. Under a broker agreement, the Irvine Property is available for immediate sale in its present condition. We classified $5.8 million related to the Irvine Property, stated at lower of cost or fair value, as “Asset held for sale” and $4.6 million related to the mortgage on the Irvine Property as “Note payable related to asset held for sale” on our Consolidated Balance Sheet as of December 31, 2016. As of December 31, 2017, the Irvine Property, which continues to be available for sale, has been classified as part of “Property and equipment, net” and the related mortgage as part of “Notes payable-current” and “Notes payable” on our Consolidated Balance Sheet as it no longer meets the criteria for held for sale classification primarily due to passage of time.
Throughout 2017 and 2016, we entered into capital lease schedules with a bank totaling approximately $1.3 million and $0.8 million, respectively. The capital leases are primarily related to the buildout of the data center in Roswell, Georgia, the data center we constructed in New Albany, Ohio, and the addition of SAP software licenses. The capital lease schedules entered into in 2017 and 2016 have terms ranging from one to five years. See Note 10 below for information related to capital lease obligations. At December 31, 2017, we had a total of $1.9 million under our capital lease obligations, of which $0.6 million was included as part of “Accrued expenses and other current liabilities” and $1.3 million was included as part of “Other long-term liabilities” on our Consolidated Balance Sheets. At December 31, 2016, we had a total of $2.0 million under our capital lease obligations, of which $1.3 million was included as part of “Accrued expenses and other current liabilities” and $0.7 million was included as part of “Other long-term liabilities” on our Consolidated Balance Sheets.
We have been in the process of upgrading our ERP systems due to the discontinued third party support of certain of our aged legacy systems, our changing IT needs when considering the transitioning state of our business from our origins towards becoming a leading IT solution provider and the ongoing desire to integrate multiple systems upon which we currently operate as a result of multiple acquisitions. In this regard, we previously purchased licenses for Microsoft Dynamics AX and other related modules to provide a complete, robust and integrated ERP solution and have expended time, effort and resources to implement this AX solution for our legacy businesses. We believe the implementation and upgrade of our systems should help us to gain further efficiencies across our organizations. Our newly acquired En Pointe business has operated for a number of years on an implemented and successfully functioning SAP system. As a result of the En Pointe acquisition, we considered new issues related to the costs, risks and benefits of either continuing the implementation of our AX solution and moving En Pointe to such AX solution or moving the legacy businesses to the SAP solution. In response, we shifted certain of our IT development efforts towards assessing these respective costs, risks and benefits. There are significant risks and uncertainties in adopting and implementing a new ERP system and as part of our assessment of these alternatives, we considered the fact that En Pointe has been successfully functioning on its SAP system for many years while none of our businesses have operated on the AX system. While we believe the AX solution has many valuable features and that it has been essential that we have undertaken our AX development efforts to date, we have weighed these attributes and the transition risk inherent with any such new solution against the fact that En Pointe, with similar business characteristics and system needs to our legacy businesses, has been successfully operating on its SAP system for a number of years. As a result of the assessments performed, our management concluded that the SAP solution is the best, most viable and cost effective option for our consolidated business going forward. To that end, in late October 2015, our management determined, and our Board of Directors approved such determination, to adopt the SAP platform across all of our business units and approved the non-cash write-off of the remaining $22.1 million of work in process software previously capitalized for all major phases of the design, configuration and customization of the AX solution to date. For the year ended December 31, 2015, a total of $25.4 million non-cash charge related to the ERP and CRM write-offs was included in “Selling, general and administrative expenses” on our Consolidated Statements of Operations.
| 76 |
6. Goodwill and Intangible Assets
Goodwill
The change in the carrying amounts of goodwill was as follows by segment (in thousands):
| Commercial | Public Sector | Canada | United Kingdom | Total | ||||||||||||||||
| Balance at December 31, 2016 | $ | 69,735 | $ | 8,322 | $ | 5,331 | $ | — | $ | 83,388 | ||||||||||
| Adjustment related to acquisition of Stratiform | — | — | (696 | ) | — | (696 | ) | |||||||||||||
| Acquisition of Stack Technology | — | — | — | 803 | 803 | |||||||||||||||
| Acquisition of Provista | — | — | — | 3,865 | 3,865 | |||||||||||||||
| Foreign currency translation | — | — | 362 | 46 | 408 | |||||||||||||||
| Balance at December 31, 2017 | $ | 69,735 | $ | 8,322 | $ | 4,997 | $ | 4,714 | $ | 87,768 | ||||||||||
Intangible Assets
The following table sets forth the amounts recorded for intangible assets (in thousands):
| Weighted Average Estimated | At December 31, 2017 | At December 31, 2016 | ||||||||||||||||||||||||||
| Useful
Lives (years) | Gross Amount | Accumulated Amortization | Net Amount | Gross Amount | Accumulated Amortization | Net Amount | ||||||||||||||||||||||
| Patent, trademarks, trade names & URLs | 4 | $ | 7,739 | (1) | $ | 3,186 | $ | 4,553 | $ | 7,691 | (1) | $ | 1,901 | $ | 5,790 | |||||||||||||
| Customer relationships | 15 | 13,533 | 7,799 | 5,734 | 13,369 | 5,480 | 7,889 | |||||||||||||||||||||
| Non-compete agreements | 4 | 2,377 | 1,574 | 803 | 2,361 | 966 | 1,395 | |||||||||||||||||||||
| Total intangible assets | $ | 23,649 | $ | 12,559 | $ | 11,090 | $ | 23,421 | $ | 8,347 | $ | 15,074 | ||||||||||||||||
| (1) | Included in the total amount for “Patent, trademarks & URLs” are $2.9 million of trademarks with indefinite useful lives that are not amortized. |
Amortization expense for intangible assets was $4.1 million, $5.8 million and $1.3 million for the years ended December 31, 2017, 2016 and 2015, respectively.
Estimated amortization expense for intangible assets in each of the next five years and thereafter, as applicable, as of December 31, 2017 was as follows: $3.0 million in 2018, $1.9 million in 2019, $1.3 million in 2020, $0.5 million in 2021, $0.4 million in 2022 and $1.1 million thereafter.
7. Discontinued Operations
During 2014, we discontinued the operation of all four of our retail stores, located in Huntington Beach, Santa Monica and Torrance, California and Chicago, Illinois, and our OnSale and eCost businesses. We reflected the results of these operations, which were historically reported as a part of our MacMall segment, as discontinued operations for all periods presented herein. The revenues, operating and non-operating results of the discontinued operations are reflected in a single line item entitled “Loss from discontinued operations, net of taxes” on our Consolidated Statements of Operations, and the related liabilities are presented in our Consolidated Balance Sheets in a line item entitled “Current liabilities of discontinued operations” for all periods presented herein.
The carrying amounts of major classes of assets and liabilities that have been included in such balance sheet line items, as described above, in our Consolidated Balance Sheets were as follows (in thousands):
| At December 31, | ||||||||
| 2016 | 2015 | |||||||
| Accounts payable | $ | 59 | $ | 117 | ||||
| Accrued expenses and other current liabilities | 20 | 36 | ||||||
| Current liabilities of discontinued operations | $ | 79 | $ | 153 | ||||
The operating results of our discontinued operations reported in “Loss from discontinued operations, net of taxes” in our Consolidated Statements of Operations were as follows (in thousands):
| Year Ended December 31, | ||||
| 2015 | ||||
| Net sales | $ | (4 | ) | |
| Loss before income taxes | $ | (507 | ) | |
| Income tax benefit | (197 | ) | ||
| Loss from discontinued operations, net of taxes | $ | (310 | ) | |
| 77 |
8. Debt
The following table sets forth our outstanding debt as of the periods presented (in thousands):
| At December 31, | ||||||||
| 2017 | 2016 | |||||||
| Revolving credit facility, LIBOR plus 1.50%, maturing in March 2021 | $ | 213,778 | $ | 107,396 | ||||
| Note payable, LIBOR plus 1.50%, maturing in March 2021 | — | 8,293 | ||||||
| Note payable, LIBOR plus 1.50%, maturing in March 2021 | 11,032 | 1,392 | ||||||
| Note payable, LIBOR plus 1.50%, maturing in March 2021 | 1,943 | — | ||||||
| Note payable, greater of 2% or LIBOR plus 2.15%, maturing in April 2022 | 4,404 | 4,601 | (1) | |||||
| Note payable, LIBOR plus 2.25%, maturing in January 2022 | 3,908 | 4,137 | ||||||
| Notes payable, 4.12%, 4.33% and 4.60%, matured in March 2017 | — | 525 | ||||||
| Note payable, LIBOR plus 2.25%, maturing in January 2020 | 6,798 | 7,107 | ||||||
| Note payable, Prime plus 0.375% or LIBOR plus 2.375%, maturing in January 2020 | 7,710 | 8,113 | ||||||
| Note payable, LIBOR plus 3.2%, maturing in May 2025 | 284 | — | ||||||
| Other notes payable, maturing in August and September 2018 | 175 | 351 | ||||||
| Total | 250,032 | 141,915 | ||||||
| Less: Total current debt | 217,140 | 123,165 | ||||||
| Total non-current debt | $ | 32,892 | $ | 18,750 | ||||
| (1) | This note payable, related to the Irvine Property, has been presented on our Consolidated Balance Sheet at December 31, 2016 as “Note payable related to asset held for sale” and was included as current debt. See Note 5 above for more information regarding the Irvine Property. |
The following table sets forth the maturities of our outstanding debt balance as of December 31, 2017 (in thousands):
| 2018 | 2019 | 2020 | 2021 | 2022 | Thereafter | Total | ||||||||||||||||||||||
| Total long-term debt obligations | $ | 3,362 | $ | 3,277 | $ | 15,653 | $ | 7,127 | $ | 6,747 | $ | 88 | $ | 36,254 | ||||||||||||||
| Revolving credit facility | 213,778 | — | — | — | — | — | 213,778 | |||||||||||||||||||||
| Total | $ | 217,140 | $ | 3,277 | $ | 15,653 | $ | 7,127 | $ | 6,747 | $ | 88 | $ | 250,032 | ||||||||||||||
Line of Credit and Related Notes
We maintain a credit facility, which functions as a working capital line of credit with a borrowing base of inventory and accounts receivable, including certain credit card receivables, and a portion of the value of certain real estate. On January 19, 2016, we entered into a Fourth Amended and Restated Loan and Security Agreement (the “Fourth Amended Loan Agreement”) with certain lenders and Wells Fargo Capital Finance, LLC as administrative and collateral agent (the “Lenders”). On July 7, 2016, we entered into a First Amendment to the Fourth Amended Loan Agreement with the Lenders and on February 24, 2017, we entered into a Second Amendment to the Fourth Amended Loan Agreement with the Lenders. On October 24, 2017, PCM, all of its wholly-owned domestic subsidiaries (collectively with PCM, the “US Borrowers”), all of its Canadian subsidiaries (collectively, the “Canadian Borrowers”) and its PCM UK subsidiary (together with the US Borrowers and the Canadian Borrowers, the “Borrowers”), entered into a Fifth Amended and Restated Loan and Security Agreement (the “Fifth Amended Loan Agreement”) with the Lenders. The Fifth Amended Loan Agreement amends and restates the Fourth Amended Loan Agreement.
| 78 |
As amended through December 31, 2017, the terms of our credit facility provide for (i) a Maximum Credit, as defined in the credit facility, of $345,000,000; (ii) a sub-line of up to C$40,000,000 as the Canadian Maximum Credit and a sub-line of up to £25,000,000 as the UK Maximum Credit ((i) and (ii) collectively the “Revolving Line”); (iii) a Maturity Date of March 19, 2021; (iv) interest on outstanding balance under the Canadian Maximum Credit based on the Canadian Base Rate (calculated as the greater of CDOR plus one percentage point and the “prime rate” for Canadian Dollar commercial loans, as further defined in the Fifth Amended Loan Agreement) or at the election of the Borrowers, based on the CDOR Rate, plus a margin, depending on average excess availability under the Revolving Line, ranging from 1.50% to 1.75%; (v) interest on outstanding UK balances based on LIBOR plus a margin, depending on average excess availability under the Revolving Line, ranging from 1.50% to 1.75%; (vi) interest on outstanding balance under the Maximum Credit based on the Eurodollar Rate plus a margin, depending on average excess availability under the revolving line, ranging from 1.50% to 1.75%; and (vii) a monthly unused line fee of 0.25% per year on the amount, if any, by which the Maximum Credit, then in effect, exceeds the average daily principal balance of outstanding borrowings during the immediately preceding month. The terms of our credit facility are more fully described in the Fifth Amended Loan Agreement.
The credit facility is collateralized by substantially all of our assets. In addition to the security interest required by the credit facility, certain of our vendors have security interests in some of our assets related to their products. The credit facility has as its single financial covenant a minimum fixed charge coverage ratio (FCCR) requirement in the event an FCCR triggering event has occurred. An FCCR triggering event is comprised of maintaining certain specified daily and average excess availability thresholds. In the event the FCCR covenant applies, the fixed charge coverage ratio is 1.0 to 1.0 calculated on a trailing four-quarter basis as of the end of the last quarter immediately preceding such FCCR triggering event date. At December 31, 2017, we were in compliance with our financial covenant under the credit facility.
Loan availability under the line of credit fluctuates daily and is affected by many factors, including eligible assets on-hand, opportunistic purchases of inventory and availability and our utilization of early-pay discounts. At December 31, 2017, we had $99.7 million available to borrow for working capital advances under the line of credit.
In connection with, and as part of, our revolving credit facility, we maintain a sub-line with a limit of $12.5 million secured by our properties located in Santa Monica, California, with a monthly principal amortization of $149,083 and a sub-line with a limit of $2.2 million secured by our property in Woodridge, Illinois, with a monthly principal amortization of $26,250.
Also on July 7, 2016, we entered into a Credit Agreement with Castle Pines Capital LLC (“Castle Pines”), which provides for a credit facility (“Channel Finance Facility”) to finance the purchase of inventory from a list of approved vendors. The aggregate availability under the Channel Finance Facility is variable and discretionary, but has initially been set at $35 million. Each advance under the Channel Finance Facility will be made directly to an approved vendor and must be repaid on the earlier of (i) the payment due date as set by Castle Pines or (ii) the date (if any) when the inventory is lost, stolen or damaged. No interest accrues on advances paid on or prior to payment due date. The Channel Finance Facility is secured by a lien on certain of our assets, subject to an intercreditor arrangement with the Lenders. The Channel Finance Facility has an initial term of one year, but shall be automatically renewed for one year periods from year to year thereafter unless terminated earlier by either party within reasonable notice periods. As of December 31, 2107, we had no outstanding balance under the Channel Finance Facility.
Other Notes Payable
In March 2015, we completed the purchase of real property in Irvine, California for approximately $5.8 million and financed $4.9 million with a long-term note. The loan agreement provides for a seven-year term and a 25 year straight-line, monthly principal repayment amortization period that began on May 1, 2015 with a balloon payment at maturity in April 2022. The loan is secured by the real property and contains financial covenants substantially similar to those of our existing asset-based credit facility. In September 2015, we listed the Irvine Property for sale.
In January 2015, we completed the purchase of certain real property in Lewis Center, Ohio for approximately $6.6 million and financed $4.575 million with a long-term note. The $4.575 million term note provides for a seven-year term and a 25 year straight-line, monthly principal repayment amortization period that began in February 2015 with a balloon payment at maturity in January 2022. The loan is secured by the real property and contains financial covenants substantially similar to those of our existing asset-based credit facility.
Throughout 2014, we entered into three financing arrangements with a bank to finance the costs of equipment, software and professional services related to our ERP upgrade. The total amount financed was $5.6 million, with a quarterly repayment schedule which matured in March 2017.
| 79 |
In December 2012, we completed the purchase of 7.9 acres of land for approximately $1.1 million and have incurred additional costs of $12.2 million through December 31, 2014 towards the construction of a new cloud data center that we opened in June 2014. In July 2013, we entered into a loan agreement for with a bank for draws up to $7.725 million to finance the build out of the new data center. The loan agreement provides for a five-year term and a 25 year straight-line, monthly principal repayment amortization period with a balloon payment at maturity in January 2020. The loan is secured by the real property and contains financial covenants substantially similar to those of our existing asset-based credit facility.
In June 2011, we entered into a credit agreement to finance a total of $10.1 million of the acquisition and improvement costs for the real property we purchased in March 2011 in El Segundo, California. The credit agreement, as amended, provides for a five-year term and a 25 year straight-line, monthly principal repayment amortization period with a balloon payment at maturity in September 2016. In September 2017, we entered into an amendment with the lender extending the maturity of the loan to January 31, 2020. The loan is secured by the real property and contains financial covenants substantially similar to those of our existing asset-based credit facility.
At December 31, 2017, the effective weighted average annual interest rate on our outstanding amounts under the credit facility, term note and variable interest rate notes payable was 3.12%.
The carrying amounts of our line of credit borrowings and notes payable approximate their fair value based upon the current rates offered to us for obligations of similar terms and remaining maturities.
9. Income Taxes
“Income (loss) from continuing operations before income taxes” in the Consolidated Statements of Operations included the following components for the periods presented (in thousands):
| Years Ended December 31, | ||||||||||||
| 2017 | 2016 | 2015 | ||||||||||
| U.S. | $ | 7,928 | $ | 23,818 | $ | (30,402 | ) | |||||
| Foreign | (3,853 | ) | 4,890 | 1,060 | ||||||||
| Income (loss) from continuing operations before income taxes | $ | 4,075 | $ | 28,708 | $ | (29,342 | ) | |||||
“Income tax expense (benefit)” in the Consolidated Statements of Operations consisted of the following for the periods presented (in thousands):
| Years Ended December 31, | ||||||||||||
| 2017 | 2016 | 2015 | ||||||||||
| Current | ||||||||||||
| Federal | $ | (1,941 | ) | $ | 7,008 | $ | (2,616 | ) | ||||
| State | 323 | 949 | 81 | |||||||||
| Foreign | 2,002 | 1,910 | 719 | |||||||||
| Total — Current | 384 | 9,867 | (1,816 | ) | ||||||||
| Deferred | ||||||||||||
| Federal | 1,745 | 1,346 | (8,303 | ) | ||||||||
| State | 339 | 269 | (1,155 | ) | ||||||||
| Foreign | (1,484 | ) | (367 | ) | (120 | ) | ||||||
| Total — Deferred | 600 | 1,248 | (9,578 | ) | ||||||||
| Income tax expense (benefit) | $ | 984 | $ | 11,115 | $ | (11,394 | ) | |||||
We recorded an income tax benefit of $0.2 million during the year ended December 31, 2015 related to our discontinued operations.
The provision for income taxes differed from the amount computed by applying the U.S. federal statutory rate to “Income (loss) from continuing operations before income taxes” due to the effects of the following (dollars in thousands):
| Years Ended December 31, | ||||||||||||||||||||||||
| 2017 | 2016 | 2015 | ||||||||||||||||||||||
| Expected taxes at federal statutory tax rate | $ | 1,426 | 35.0 | % | $ | 10,048 | 35.0 | % | $ | (10,270 | ) | 35.0 | % | |||||||||||
| State income taxes, net of federal income tax benefit | 198 | 4.9 | 1,086 | 3.8 | (939 | ) | 3.2 | |||||||||||||||||
| Stock-based compensation | (2,476 | ) | (60.7 | ) | — | — | — | — | ||||||||||||||||
| Remeasurement of deferred taxes | (1,870 | ) | (45.9 | ) | — | — | — | — | ||||||||||||||||
| Deemed repatriation of foreign earnings, net of credits | 669 | 16.4 | — | — | — | — | ||||||||||||||||||
| Change in valuation allowance | 1,049 | 25.7 | (201 | ) | (0.7 | ) | 117 | (0.4 | ) | |||||||||||||||
| Non-deductible business expenses | 1,162 | 28.5 | 440 | 1.5 | 352 | (1.2 | ) | |||||||||||||||||
| Foreign rate differential | 725 | 17.8 | (392 | ) | (1.4 | ) | (88 | ) | 0.3 | |||||||||||||||
| Research tax credits | — | — | (57 | ) | (0.2 | ) | (822 | ) | 2.8 | |||||||||||||||
| Other | 101 | 2.5 | 191 | 0.7 | 255 | (0.9 | ) | |||||||||||||||||
| Total | $ | 984 | 24.2 | % | $ | 11,115 | 38.7 | % | $ | (11,394 | ) | 38.8 | % | |||||||||||
| 80 |
The significant components of deferred tax assets and liabilities were as follows (in thousands):
| At December 31, | ||||||||
| 2017 | 2016 | |||||||
| Deferred tax assets : | ||||||||
| Accounts receivable | $ | 535 | $ | 287 | ||||
| Inventories | 194 | 567 | ||||||
| Deferred revenue | 279 | 341 | ||||||
| Accrued expenses and reserves | 2,642 | 4,064 | ||||||
| Stock-based compensation | 1,034 | 2,277 | ||||||
| Tax credits and loss carryforwards | 4,053 | 1,610 | ||||||
| Other | 6 | 9 | ||||||
| Total gross deferred tax assets | 8,743 | 9,155 | ||||||
| Less: Valuation allowance | (2,274 | ) | (711 | ) | ||||
| Total deferred tax assets | 6,469 | 8,444 | ||||||
| Deferred tax liabilities: | ||||||||
| Property and equipment | (4,154 | ) | (4,638 | ) | ||||
| Intangibles | (1,659 | ) | (2,196 | ) | ||||
| Foreign employment tax subsidy | (517 | ) | (1,083 | ) | ||||
| Prepaid expenses | (944 | ) | (881 | ) | ||||
| Other | (538 | ) | (198 | ) | ||||
| Total deferred tax liabilities | (7,812 | ) | (8,996 | ) | ||||
| Net deferred tax liabilities | $ | (1,343 | ) | $ | (552 | ) | ||
Valuation allowances are provided when it is considered more likely than not that deferred tax assets will not be realized. The valuation allowance relates to certain foreign and state net operating loss carryforwards and other foreign and state deferred tax assets generated by subsidiaries in a cumulative loss position. The valuation allowance increased by $1.6 million during the year ended December 31, 2017 primarily due to foreign and state net operating losses and revaluing of state deferred tax assets.
At December 31, 2017, we had state net operating loss carryforwards of $29.4 million, of which $0.4 million expire between 2018 and 2020, and the remainder expire between 2021 and 2038. Included in these amounts are $0.5 million of state net operating loss carryforwards which relate to an acquired subsidiary and are subject to annual limitations as to their use under IRC Section 382. As such, the extent to which these losses may offset future taxable income may be limited. At December 31, 2017, we also had foreign net operating loss carryforwards of $7.2 million, the majority of which have no expiration date.
At December 31, 2017, we had state research tax credits of $0.7 million, which have no expiration date.
On December 22, 2017, U.S. tax legislation was enacted containing a broad range of tax reform provisions, including a corporate tax rate reduction from 35% to 21% and changes in the U.S. taxation of non-U.S. earnings. The provisions included a one-time transition tax, payable over eight years, resulting from the mandatory deemed repatriation of previously-untaxed foreign earnings. Also on December 22, 2017, the SEC issued Staff Accounting Bulletin No. 118, which provides additional guidance on how to account for the financial statement effects of U.S. tax reform and establishes a measurement period for recording such effects. We have not completed our accounting for the income tax effects of U.S. tax reform; however, we have made a reasonable estimate of the impact on our deferred tax balances and the additional tax resulting from the mandatory deemed repatriation of foreign earnings. Accordingly, we have recognized a provisional net tax benefit of $1.2 million related to these items. We expect to finalize provisional estimates before the end of 2018 as additional data is prepared and analyzed, interpretations and assumptions are refined, and any additional guidance is issued.
U.S. tax reform introduced a provision, effective for years beginning on or after January 1, 2018, which taxes global intangible low-taxed income (GILTI) in excess of a deemed return on the tangible assets of foreign corporations. We are continuing to evaluate the GILTI provisions and have not yet made a policy election to account for GILTI as a period expense if or when incurred, or to recognize the impact of GILTI in our deferred taxes.
At December 31, 2017, estimated foreign earnings of $9.7 million were taxed at a reduced rate due to the deemed repatriation of previously-untaxed foreign earnings required by U.S. tax reform. We continue to assert indefinite reinvestment of past and future foreign earnings, and accordingly have not accrued any additional withholding taxes on the potential repatriation of these earnings. At the present time, given the various complexities involved in repatriating earnings, it is not practicable to estimate the amount of tax that may be payable if these earnings were not reinvested indefinitely.
| 81 |
Unrecognized Tax Benefits
ASC 740 clarifies the accounting for uncertainty in tax positions by subscribing the recognition threshold a tax position is required to meet before being measured and then recognized in the financial statements. It also provides guidance on derecognition, classification, interest and penalties, accounting in interim periods, disclosure and transition. We elected to classify interest and penalties related to income tax liabilities, when applicable, as part of our “Interest expense, net” rather than as a component of income tax expense in our Consolidated Statements of Operations.
Activity relating to our unrecognized tax benefits were as follows (in thousands):
| Years Ended December 31, | ||||||||||||
| 2017 | 2016 | 2015 | ||||||||||
| Beginning balance | $ | 474 | $ | 420 | $ | — | ||||||
| Additions to tax positions | — | 54 | 420 | |||||||||
| Ending balance | $ | 474 | $ | 474 | $ | 420 | ||||||
Although it is reasonably possible that certain unrecognized tax benefits may increase or decrease within the next twelve months due to tax examination changes, settlement activities, expirations of statute of limitations, or the impact on recognition and measurement considerations related to the results of published tax cases or other similar activities, we do not anticipate any significant changes to unrecognized tax benefits over the next 12 months. During the years ended December 31, 2017 and 2016, no interest or penalties were required to be recognized relating to unrecognized tax benefits.
We are subject to U.S. and foreign income tax examinations for years subsequent to 2013, and state income tax examinations for years following 2012. However, to the extent allowable by law, the tax authorities may have a right to examine prior periods when net operating losses or tax credits were generated and carried forward for subsequent utilization, and make adjustments up to the amount of the net operating losses or credit carryforwards.
10. Commitments and Contingencies
Commitments
We lease office and warehouse space and equipment under various non-cancelable operating leases which provide for minimum annual rentals and escalations based on increases in real estate taxes and other operating expenses. We also have minimum commitments under non-cancelable contracts for services relating to telecommunications, IT maintenance, financial services and employment contracts with certain employees (which consist of severance arrangements that, if exercised, would become payable in less than one year). In addition, we have obligations under capital leases for computers and related equipment, telecommunications equipment and software.
As of December 31, 2017, minimum payments over the terms of applicable contracts were payable as follows (in thousands):
| 2018 | 2019 | 2020 | 2021 | 2022 | Thereafter | Total | ||||||||||||||||||||||
| Operating lease obligations | $ | 6,726 | $ | 5,739 | $ | 4,933 | $ | 4,244 | $ | 2,821 | $ | 4,491 | $ | 28,954 | ||||||||||||||
| Capital lease obligations | 641 | 605 | 374 | 323 | — | — | 1,943 | |||||||||||||||||||||
| Other commitments (1)(2) | 13,178 | 1,805 | 219 | — | — | — | 15,202 | |||||||||||||||||||||
| Total minimum payments | $ | 20,545 | $ | 8,149 | $ | 5,526 | $ | 4,567 | $ | 2,821 | $ | 4,491 | $ | 46,099 | ||||||||||||||
| (1) | Other commitments consist of minimum commitments under non-cancelable contracts for services relating to telecommunications, IT maintenance, financial services and employment contracts with certain employees (which consist of severance arrangements that, if exercised, would become payable in less than one year). |
| (2) | We had $13.1 million of standby letters of credits (LOCs) under which there were no minimum payment requirements at December 31, 2017. LOCs are commitments issued to third party beneficiaries, underwritten by a third party bank, representing funding responsibility in the event of third party demands or contingent events. The outstanding balance of our standby LOCs reduces the amount available to us from our revolving credit facility. There were no claims made against any standby LOCs during the year ended December 31, 2017. |
For the years ended December 31, 2017, 2016 and 2015, total rent expense, net of sublease income, totaled $6.7 million, $5.8 million and $4.2 million, respectively. Some of the leases contain renewal options and escalation clauses, and require us to pay taxes, insurance and maintenance costs.
| 82 |
Legal Proceedings
From time to time, we receive claims of and become subject to consumer protection, employment, intellectual property and other litigation related to the conduct of our business. Any such litigation could result in a material amount of legal or related expenses and be time consuming and could divert our management and key personnel from our business operations. In connection with any such litigation, we may be subject to significant damages or equitable remedies relating to the operation of our business. Any such litigation may materially harm our business, results of operations and financial condition.
As described above in Note 3 above, we acquired certain assets of En Pointe Technologies in 2015. The assets were acquired by an indirect wholly-owned subsidiary of PCM, which subsidiary now operates under the En Pointe brand (“En Pointe”). We are currently involved in several disputes related to the En Pointe acquisition as described below. Any litigation, arbitration or other dispute resolution process could be costly and time consuming and could divert our management and key personnel from our business operations. In connection with any such matters, we may be subject to significant damages or equitable remedies relating to the operation of our business and could incur significant costs in asserting, defending, or settling any such matters. While we intend to pursue and/or defend these actions vigorously, we cannot determine with any certainty the costs or outcome of such pending or future matters, and they may materially harm our business, results of operations or financial condition.
Delaware Litigation with Collab9. On December 5, 2016, Collab9, Inc. (formerly, En Pointe Technologies Sales, Inc.) filed an action against PCM, Inc. and its subsidiary, En Pointe Technologies Sales, LLC, in the Superior Court of Delaware in New Castle County, Delaware. The action arises out of a March 12, 2015 Asset Purchase Agreement (“APA”) pursuant to which the Company acquired assets of Collab9’s information technology solutions business. Collab9’s complaint alleged that the Company breached the APA by failing to pay Collab9 the full amount of the periodic “earn-out” payments to which Collab9 is entitled under the APA. The complaint also alleged that the Company breached an obligation to cooperate with Collab9’s evaluation of its claim for breach of the APA’s earn-out provisions. The complaint did not specify the amount of damages Collab9 is seeking, but asserted that the amount of underpayment is “millions of dollars.” On February 8, 2017, the Company filed an answer to Collab9’s complaint in which the Company denied that it breached the APA and asserted that there is no merit in Collab9’s claim. On March 5, 2018, Collab9 filed a motion for leave to amend its pleadings to add new allegations in support of its earn-out claim and to advance additional theories of recovery. Collab9 now alleges that the Company (i) failed to include in the earn-out payments a portion of internally delivered services revenue calculated across all consolidated Company businesses rather than the acquired En Pointe business; (ii) transferred accounts and sales persons away from the En Pointe business for the purpose of reducing the earn-out payment calculation; (iii) had an implied duty to maintain a separate financial accounting system for the purpose of tracking earn-out payment calculations; (iv) failed to provide Collab9 with a sublicense to certain SAP software acquired by the Company under the APA; (v) obtained and modified certain data that Collab9 delivered to the Company; and (vi) failed to cooperate with Collab9 to indemnify it in connection with the foregoing claims. Collab9 further asserts breaches of the APA and the implied covenant of good faith and fair dealing, and that the Company’s certification of earn-out payments other than in accordance with these new allegations was fraudulent. The Company believes the claims are speculative and wholly without merit, and intends to vigorously defend the claims. However, the outcome of this matter is uncertain and, as a result, the Company cannot reasonably estimate the loss or range of loss that could result in the event of an unfavorable outcome. Accordingly, no amounts have been accrued for any liability that may result from the resolution of this matter.
On April 11, 2017, the Company amended its answer to include counterclaims against the sellers in the Collab 9 transaction, including Collab9. These counterclaims assert claims for breach of contract, tortious interference, and intentional misrepresentation. The counterclaims include allegations that the sellers intentionally breached their representations and warranties concerning the financial statements of the business whose assets the Company acquired under the APA, and the need for minority business certifications which were required for certain acquired contracts under the APA. The counterclaims also include allegations that the sellers failed to disclose related party interests or retained control over Ovex Technologies (Private) Limited (“Ovex”), a third party operation in Pakistan that provided support functions for the acquired business. At this time, the outcome of this matter is uncertain.
California Litigation with Collab9. On January 13, 2017, Collab9 filed an action against PCM, Inc. and its subsidiary, En Pointe Technologies Sales, LLC, in the Superior Court of California for the County of Los Angeles. The complaint alleged that, in connection with the Company’s processing of transactions with certain customers whose contracts the Company purchased the rights to under the APA following the closing of the APA, the Company, without authorization, accessed and altered electronically stored data of which Collab9 claims to have retained ownership. It further alleged that, although Collab9 authorized the Company to access the data in question during a post-closing transition period, the Company continued to access and alter the data Collab9 claims to own after an alleged termination of such authorization, and, in so doing, violated California’s Computer Data Access and Fraud Act. On February 21, 2017, the Company moved to dismiss the case on the ground that the APA governs this dispute and contains a provision designating New Castle County, Delaware as the exclusive forum in which claims arising out of or relating to the APA may be brought. Following briefing and oral argument on July 12, 2017, the court granted the Company’s motion to dismiss. We do not know whether Collab9 will refile the claim asserted in this action in a Delaware court. The Company believes the claims are wholly without merit, and if pursued by Collab9 in Delaware, the Company intends to vigorously defend the claims.
| 83 |
California Litigation Against Yunus, Ovex, Din and Zones. On February 22, 2017, En Pointe filed an action against former employee Imran Yunus in California Superior Court alleging misappropriation of trade secrets, breach of contract, and other claims relating to Mr. Yunus’s departure from his employment at En Pointe to commence employment at a competitor. After discovering new facts about an alleged conspiracy to cause Ovex employees to resign and join a competitor, En Pointe amended the complaint on June 1, 2017 to add Zones, Inc., Ovex and Bob Din as defendants. In its complaint, En Pointe seeks damages against Zones, Yunus, and Din, and injunctive relief against all defendants. The core allegations relate to an alleged scheme orchestrated by defendant Din to conspire with Ovex management to cause Ovex employees to leave Ovex, taking En Pointe’s confidential information and trade secrets, and join competitor Zones. On June 6, 2017, a temporary restraining order was issued by the court in which defendants were ordered, among other things, to immediately provide En Pointe with access to information in their possession and to not use or disclose En Pointe’s trade secrets and confidential information. Ovex partially complied with the order. On July 13, 2017, the court denied En Pointe’s request for a preliminary injunction, without prejudice, and dissolved the temporary restraining order for periods after July 13, 2017 without relieving defendants of their obligations while the temporary restraining order was in effect. The court based its decision primarily upon its determination that, at this stage of the litigation, there lacked sufficient evidence at this time to support the continued need for injunctive relief. In November 2017, we voluntarily dismissed the action without prejudice in order to seek resolution of disputes regarding data ownership and use rights in the pending Delaware action with Collab9 described above. Depending on the outcome of the Delaware case, we may decide to reinstate this action in California.
Pakistan Litigation. On June 3, 2017, Ovex filed an action in Pakistan against En Pointe and PCM’s subsidiary in Pakistan claiming that En Pointe breached a contract pursuant to which Ovex provided En Pointe with back-office administrative support and customer service support. The complaint sought damages, declaratory relief that En Pointe’s termination of services contract should be suspended, and other injunctive relief. On the same date, the court in Pakistan issued a temporary order suspending the termination of the services contract pending a further hearing on the action and indicating that such order will not affect any other order or proceeding of any other competent judicial authority. En Pointe filed applications before the court in Pakistan seeking orders dismissing the injunction and staying the case filed by Ovex seeking damages. En Pointe’s applications were based on its assertion that any matters to be litigated arising out of or in connection with the services contract is subject to a binding and enforceable exclusive arbitration clause in the services contract. On October 10, 2017 the Civil court in Pakistan dismissed the case on grounds of the exclusive venue provision of the contract which requires the case to be litigated in arbitration in California. Ovex appealed the decision of the Civil Court to the High Court in Islamabad Pakistan. The High Court heard arguments by Ovex on the appeal in early November 2017. The case was temporarily adjourned by request to the High Court by Ovex with the consent of En Pointe and may be refixed for a future hearing on the appeal at the request of a party to the judge. The Company believes the claims by Ovex are speculative and wholly without merit, and intends to vigorously defend the claims on jurisdictional grounds. However, the outcome of this matter is uncertain and, as a result, the Company cannot reasonably estimate the loss or range of loss that could result in the event of an unfavorable outcome. Accordingly, no amounts have been accrued for any liability that may result from the resolution of this matter.
Ovex Arbitration. On June 6, 2017, En Pointe commenced arbitration against Ovex claiming damages arising from various claimed breaches by Ovex of the services contract between the parties. On July 7, 2017, an emergency arbitrator granted En Pointe some interim relief, including (i) a declaration that the arbitration clause in the services contract is valid and not waived, (ii) that any claim relating to termination of the services contract, or for beach of the contract, or for damages arising out of the services contract must be conducted within the arbitration, and (iii) that the services contract terminates no later than August 18, 2017. A permanent arbitrator for the action was appointed on August 3, 2017 and the arbitrator held an in-person, live, evidentiary hearing on November 28, 2017. On March 9, 2018, the arbitrator in the primary arbitration proceeding entered a partial final award in favor of En Pointe. In the award, the arbitrator found, among other things, that: (1) En Pointe had not breached the service contract and owes nothing to Ovex; (2) Ovex materially breached the service agreement and owes En Pointe $990,586 in actual damages plus attorneys’ fees in an amount to be determined later; and (3) the service agreement was properly terminated by En Pointe with no further obligations to En Pointe. Additional claims and damages against Ovex will be decided in a later phase of the arbitration.
Federal Anti-Suit Injunction Action. On June 12, 2017, En Pointe filed a petition in the U.S. District Court for the Central District of California to compel arbitration in California for claims relating to the services contract with Ovex and for an anti-suit injunction against Ovex. In this action, En Pointe sought an order directing that any claims for damages arising out of the services contract must occur in arbitration, and any attempt to pursue damages in a foreign jurisdiction will be blocked by an anti-suit injunction. On September 11, 2017 the U.S. District Court issued an order compelling arbitration in California and granting the anti-suit injunction as requested in En Pointe’s petition. Ovex has continued to litigate in Pakistan in violation of the U.S. District Court’s order.
| 84 |
Securities Class Action. On May 3, 2017, a purported securities class action was filed in the United States District Court for the Central District of California, entitled Miller v. PCM Inc., Case No. 2:17-cv-03364-VAP-KS (C.D. Cal. filed May 3, 2017). In the original complaint in this action, plaintiff, purportedly on behalf of a putative class of purchasers of PCM securities from June 17, 2015 through May 2, 2017, alleged that the Company and certain of its officers violated Sections 10(b) and 20(a) of the Securities Exchange Act of 1934, 15 U.S.C. §§ 78j(b), 78t(a), and Rule 10b-5, 17 C.F.R. § 240.10b-5, promulgated thereunder, by intentionally or recklessly making false and/or misleading statements and/or failing to disclose that the financial statements of En Pointe, a company PCM acquired in 2015, materially overstated the profitability of En Pointe’s business. On July 27, 2017, the court appointed three individuals as lead plaintiffs and approved their selection of lead plaintiffs’ counsel. On September 8, 2017, lead plaintiffs filed an amended complaint, purportedly on behalf of a putative class of purchasers of PCM securities from August 10, 2015 through May 2, 2017, reiterating the claims asserted against the defendants in the original complaint and alleging that defendants also failed to disclose purported harm caused to PCM’s business by the alleged breakdown of a contractual relationship between En Pointe/PCM and Ovex Technologies, Ltd. and failed to conduct proper impairment analyses of goodwill and intangible assets relating thereto. On October 6, 2017, defendants filed a motion to dismiss the amended complaint for failure to state a claim for relief pursuant to Federal Rules of Civil Procedure 12(b)(6) and 9(b) and the Private Securities Litigation Reform Act of 1995, based upon lead plaintiffs’ failure to plead both loss causation and a strong inference of defendants’ scienter. On November 3, 2017, lead plaintiffs filed their opposition to defendants’ motion to dismiss. On January 3, 2018, the court issued an order granting defendants’ motion to dismiss the amended complaint without prejudice and ordered lead plaintiffs to file a second amended complaint by January 24, 2018. On January 24, 2018, by stipulation among the parties, lead plaintiffs agreed not to file a second amended complaint or appeal the court’s January 3, 2018 order (or any eventual judgment dismissing the action) and the parties agreed to bear their own costs and fees. As a result, on February 2, 2018, the court dismissed the action with prejudice and entered judgment for defendants. This lawsuit is now fully and finally concluded.
11. Stockholders’ Equity
We have a board approved discretionary stock repurchase program under which shares may be repurchased from time to time at prevailing market prices, through open market or unsolicited negotiated transactions, depending on market conditions. Our Board of Directors originally adopted the plan in October 2008 with an initial authorized maximum of $10 million. The plan was amended in September 2012 and increased to $20 million, again amended in April 2015 and increased to a total of $30 million, and again amended in August 2017 and increased to a total of $40 million. Under the program, the shares may be repurchased from time to time at prevailing market prices, through open market or unsolicited negotiated transactions, depending on market conditions. We expect that the repurchase of our common stock under the program will be financed with existing working capital and amounts available under our existing credit facility. The repurchased shares are held as treasury stock. No limit was placed on the duration of the repurchase program. There is no guarantee as to the exact number of shares that we will repurchase. Subject to applicable securities laws, repurchases may be made at such times and in such amounts as our management deems appropriate. The program can also be discontinued at any time management feels additional purchases are not warranted.
We repurchased 892,287 shares of our common stock under this program during the year ended December 31, 2017 for $11.6 million. From the inception of the program in October 2008 through December 31, 2017, we have repurchased an aggregate of 4,973,974 shares of our common stock for a total cost of $37.5 million. At December 31, 2017, we had $2.5 million available in stock repurchases under the program, subject to any limitations that may apply from time to time under our existing credit facility.
We have never paid cash dividends on our capital stock and our credit facility prohibits us from paying any cash dividends on our capital stock. Therefore, we do not currently anticipate paying dividends; we intend to retain any earnings to finance the growth and development of our business.
12. Earnings (Loss) Per Common Share
Basic earnings (loss) per share (“EPS”) is computed by dividing net income (loss) by the weighted average number of common shares outstanding during the reported periods. Diluted EPS reflects the potential dilution that could occur under the treasury stock method if stock options and other commitments to issue common stock were exercised, except in periods where the effect would be antidilutive. Potential common shares of approximately 188,000 and 279,000 for the years ended December 31, 2017 and 2016 have been excluded from the calculation of diluted EPS because the effect of their inclusion would be antidilutive. For the year ended December 31, 2015, since we reported a loss from continuing operations, all potential shares totaling 553,000 were excluded from the computation of diluted EPS as their inclusion would have been antidilutive. For the year ended December 31, 2015, had we reported income from continuing operations, approximately 466,000 common shares would have been excluded from the calculation of diluted EPS because the effect of their inclusion would have been antidilutive.
| 85 |
The reconciliation of the amounts used in the basic and diluted EPS computation was as follows for income from continuing operations (in thousands, except per share amounts):
| Years Ended December 31, | ||||||||||||
| 2017 | 2016 | 2015 | ||||||||||
| Numerator: | ||||||||||||
| Income (loss) from continuing operations | $ | 3,091 | $ | 17,593 | $ | (17,948 | ) | |||||
| Net income (loss) | 3,091 | 17,593 | (18,258 | ) | ||||||||
| Denominator: | ||||||||||||
| Basic EPS - Weighted average number of common shares outstanding | 12,269 | 11,847 | 12,049 | |||||||||
| Dilutive effect of stock awards | 825 | 681 | — | |||||||||
| Diluted EPS - Weighted average number of common shares outstanding | 13,094 | 12,528 | 12,049 | |||||||||
| Net earnings (loss) per share: | ||||||||||||
| Income (loss) from continuing operations | ||||||||||||
| Basic | $ | 0.25 | $ | 1.49 | $ | (1.49 | ) | |||||
| Diluted | 0.24 | 1.40 | (1.49 | ) | ||||||||
| Net income (loss) | ||||||||||||
| Basic | $ | 0.25 | $ | 1.49 | $ | (1.52 | ) | |||||
| Diluted | 0.24 | 1.40 | (1.52 | ) | ||||||||
13. Employee & Non-Employee Benefits
401(k) Savings Plan
We maintain a 401(k) Savings Plan which covers substantially all full-time employees who meet the plan’s eligibility requirements. Participants are allowed to make tax-deferred contributions up to limitations specified by the Internal Revenue Code. We make 25% matching contributions for amounts that do not exceed 4% of the participants’ compensation. The matched contributions to the employees are subject to a five-year vesting provision, with credit given towards vesting for employment during prior years. We made matching contributions to the plan totaling approximately $876,000, $803,000 and $661,900 in 2017, 2016 and 2015, respectively.
Stock Options and Restricted Stock Units Issued to Non-Employees
On May 20, 2017, our Compensation Committee approved and granted, under our 2012 Plan, the award of 4,000 shares of restricted stock units to each of our three non-employee members of the board for a total award of 12,000 restricted stock units. The restricted stock units each vest annually in equal amounts over a two-year period from the dates of grant. On May 20, 2016, our Compensation Committee approved and granted, under our 2012 Plan, the award of options to purchase 12,750 shares of our common stock to each of our non-employee members of our board for a total of 38,250 shares. These options were issued at an exercise price of $10.05 with a seven-year term and vest quarterly in equal amounts over a two-year term. On May 20, 2015, our Compensation Committee approved and granted, under our 2012 Plan, the award of 6,000 shares of restricted stock units to each of our three non-employee members of the board for a total award of 18,000 restricted stock units. The restricted stock units each vest annually in equal amounts over a two-year period from the dates of grant. See Note 4 for more information on our accounting for stock-based compensation.
14. Segment Information
Our four reportable operating segments - Commercial, Public Sector, Canada and United Kingdom - are primarily aligned based upon our reporting of results as used by our chief operating decision maker in evaluating the operating results and performance of our company. We include corporate related expenses such as legal, accounting, information technology, product management and certain other administrative costs that are not otherwise included in our reportable operating segments in Corporate & Other. We allocate our resources to and evaluate the performance of our segments based on operating income. For more information on our reportable operating segments, see Note 1 above.
| 86 |
Summarized segment information for our continuing operations is as follows for the periods presented (in thousands):
| Commercial | Public Sector | Canada | United Kingdom | Corporate
& Other | Consolidated | |||||||||||||||||||
| Year Ended December 31, 2017 | ||||||||||||||||||||||||
| Net sales | $ | 1,732,439 | $ | 277,882 | $ | 171,335 | $ | 12,235 | $ | (455 | ) | $ | 2,193,436 | |||||||||||
| Gross profit | 262,370 | 33,676 | 28,060 | 2,064 | (448 | ) | 325,722 | |||||||||||||||||
| Depreciation and amortization expense(1) | 5,683 | 829 | 1,090 | 48 | 6,531 | 14,181 | ||||||||||||||||||
| Operating profit (loss) | 76,097 | 8,885 | 423 | (5,205 | ) | (68,759 | ) | 11,441 | ||||||||||||||||
| Year Ended December 31, 2016 | ||||||||||||||||||||||||
| Net sales | $ | 1,746,530 | $ | 353,497 | $ | 150,643 | $ | — | $ | (83 | ) | $ | 2,250,587 | |||||||||||
| Gross profit | 259,102 | 35,946 | 23,838 | — | (85 | ) | 318,801 | |||||||||||||||||
| Depreciation and amortization expense(1) | 6,491 | 1,162 | 1,320 | — | 6,811 | 15,784 | ||||||||||||||||||
| Operating profit (loss) | 81,220 | 14,163 | 3,994 | — | (64,586 | ) | 34,791 | |||||||||||||||||
| Year Ended December 31, 2015 | ||||||||||||||||||||||||
| Net sales | $ | 1,365,384 | $ | 279,603 | $ | 16,987 | $ | — | $ | (26 | ) | $ | 1,661,948 | |||||||||||
| Gross profit | 194,214 | 26,914 | 3,200 | — | (1 | ) | 224,327 | |||||||||||||||||
| Depreciation and amortization expense(1) | 3,472 | 326 | 67 | — | 8.352 | 12,217 | ||||||||||||||||||
| Operating profit (loss) | 58,479 | 10,020 | 591 | — | (95,572 | ) | (25,482 | ) | ||||||||||||||||
| (1) | Primary fixed assets relating to network and servers are managed by the Corporate headquarters. As such, depreciation expense relating to such assets is included as part of Corporate & Other. |
As of December 31, 2017 and 2016, we had total consolidated assets of $740.3 million and $629.8 million, respectively. Our management does not have available to them and does not use total assets measured at the segment level in allocating resources. Therefore, such information relating to segment assets is not provided herein.
Sales of our products and services are made to customers primarily within the U.S. and Canada and other foreign countries. During the year ended December 31, 2017, approximately 8% of our gross billed sales were made to customers outside of the continental U.S. During the year ended December 31, 2016, approximately 6% of our gross billed sales were made to customers outside of the continental U.S. During the year ended December 31, 2015, less than 1% of our gross billed sales were made to customers outside of the continental U.S. No single customer accounted for more than 10% of our gross billed sales in each of the years ended December 31, 2017, 2016 and 2015.
Our property and equipment, net, were located in the following countries as of the periods presented (in thousands):
| At December 31, | ||||||||
| Location: | 2017 | 2016 | ||||||
| U.S. | $ | 66,736 | $ | 54,784 | ||||
| Canada | 2,776 | 1,405 | ||||||
| United Kingdom | 1,716 | — | ||||||
| Philippines | 323 | 163 | ||||||
| Property and equipment, net | $ | 71,551 | $ | 56,352 | ||||
| 87 |
15. Supplementary Quarterly Financial Information (Unaudited)
The following tables summarize supplementary quarterly financial information (in thousands, except per share data):
| 2017 | ||||||||||||||||
| 1st Quarter | 2nd Quarter | 3rd Quarter | 4th Quarter | |||||||||||||
| Net sales | $ | 524,399 | $ | 560,110 | $ | 545,479 | $ | 563,448 | ||||||||
| Gross profit | 78,205 | 85,371 | 81,294 | 80,852 | ||||||||||||
| Net income (loss) | 4,027 | 2,500 | (841 | ) | (2,595 | ) | ||||||||||
| Basic and diluted earnings (loss) per common share: | ||||||||||||||||
| Basic | $ | 0.33 | $ | 0.20 | $ | (0.07 | ) | $ | (0.22 | ) | ||||||
| Diluted | 0.30 | 0.19 | (0.07 | ) | (0.22 | ) | ||||||||||
| 2016 | ||||||||||||||||
| 1st Quarter | 2nd Quarter | 3rd Quarter | 4th Quarter | |||||||||||||
| Net sales | $ | 498,029 | $ | 580,994 | $ | 584,937 | $ | 586,627 | ||||||||
| Gross profit | 70,307 | 82,999 | 82,655 | 82,840 | ||||||||||||
| Net income | 156 | 7,406 | 5,321 | 4,710 | ||||||||||||
| Basic and diluted earnings per common share: | ||||||||||||||||
| Basic | $ | 0.01 | $ | 0.63 | $ | 0.45 | $ | 0.40 | ||||||||
| Diluted | 0.01 | 0.61 | 0.43 | 0.37 | ||||||||||||
| 88 |
| ITEM 9. | CHANGES IN AND DISAGREEMENTS WITH ACCOUNTANTS ON ACCOUNTING AND FINANCIAL DISCLOSURE |
None.
| ITEM 9A. | CONTROLS AND PROCEDURES |
Disclosure Controls and Procedures
We maintain disclosure controls and procedures that are designed to ensure that information required to be disclosed in the reports that we file or submit under the Exchange Act is recorded, processed, summarized and reported within the time periods specified in the SEC’s rules and forms, and that such information is accumulated and communicated to our management, including our Chief Executive Officer and Chief Financial Officer, as appropriate, to allow timely decisions regarding required disclosure.
We carried out an evaluation, under the supervision and with the participation of our management, including our Chief Executive Officer and Chief Financial Officer, of the effectiveness of the design and operation of our disclosure controls and procedures (as defined in Rules 13a-15(e) and 15d-15(e) under the Exchange Act) as of the end of our most recent fiscal year. Based upon this evaluation, our Chief Executive Officer and Chief Financial Officer concluded that our disclosure controls and procedures were effective as of December 31, 2017.
Changes in Internal Control Over Financial Reporting
No change in our internal control over financial reporting (as defined in Rules 13a-15(f) and 15d-15(f) under the Exchange Act) occurred during the fourth quarter of 2017 that has materially affected, or is reasonably likely to materially affect, our internal control over financial reporting.
Report on Internal Control Over Financial Reporting
Management’s Report on Internal Control Over Financial Reporting
Management is responsible for establishing and maintaining adequate internal control over financial reporting. Internal control over financial reporting is defined in Rules 13a-15(f) and 15d-15(f) promulgated under the Securities Exchange Act of 1934, as amended, as a process designed by, or under the supervision of, our principal executive and principal financial officer, or persons performing similar functions, and effected by our board of directors, management and other personnel, to provide reasonable assurance regarding the reliability of financial reporting and the preparation of financial statements for external purposes in accordance with U.S. generally accepted accounting principles and includes those policies and procedures that:
| ● | pertain to the maintenance of records that in reasonable detail accurately and fairly reflect the transactions and dispositions of our assets; | |
| ● | provide reasonable assurance that transactions are recorded as necessary to permit preparation of financial statements in accordance with generally accepted accounting principles, and that receipts and expenditures of the company are being made only in accordance with authorizations of our management and directors; and | |
| ● | provide reasonable assurance regarding prevention or timely detection of unauthorized acquisition, use or disposition of our assets that could have a material effect on the financial statements. |
Because of its inherent limitations, internal control over financial reporting may not prevent or detect misstatements. Also, projections of any evaluation of effectiveness to future periods are subject to the risk that controls may become inadequate because of changes in conditions, or that the degree of compliance with the policies or procedures may deteriorate.
Our management, with the participation of our principal executive officer and principal financial officer, has assessed the effectiveness of our internal control over financial reporting as of December 31, 2017. In making its assessment of internal control over financial reporting, management used the criteria described in “Internal Control — Integrated Framework (2013)” issued by the Committee of Sponsoring Organizations of the Treadway Commission. Based on this assessment and those criteria, management believes that, as of December 31, 2017, our internal control over financial reporting was effective.
The effectiveness of our internal control over financial reporting has been audited by Deloitte & Touche LLP, an independent registered public accounting firm, as stated in their report which appears in Part II, Item 8 of this Form 10-K.
| ITEM 9B. | OTHER INFORMATION |
None.
| 89 |
| ITEM 10. | DIRECTORS, EXECUTIVE OFFICERS AND CORPORATE GOVERNANCE |
Our executive officers as of March 12, 2018 and their respective ages and positions were as follows:
| Name | Age | Position | ||
| Frank F. Khulusi | 51 | Chairman and Chief Executive Officer | ||
| Robert J. Miley | 47 | President | ||
| Brandon H. LaVerne | 46 | Chief Financial Officer, Treasurer, Chief Accounting Officer and Assistant Secretary | ||
| Robert I. Newton | 52 | Executive Vice President, Chief Legal Officer and Secretary | ||
| Simon M. Abuyounes | 64 | Executive Vice President — IT and Operations |
The following is a biographical summary of the experience of our executive officers:
Frank F. Khulusi is one of our co-founders and has served as our Chairman of the Board and Chief Executive Officer since our inception in 1987, served as President until July 1999, and resumed the office of President in March 2001 through March 2012. Mr. Khulusi attended the University of Southern California.
Robert J. Miley joined us in December 2014 and currently serves as President of PCM, Inc. Prior to joining us, Mr. Miley held various positions at Ingram Micro spanning approximately 20 years, most recently having served as Vice President and General Manager of Advanced Technology Division in North America. Mr. Miley earned an MBA from the University of Southern California Marshall School of Business and graduated from the University of California Santa Barbara with a B.A. in Business Economics and a B.A. in Political Science.
Brandon H. LaVerne has served as our Chief Financial Officer since July 2008. Mr. LaVerne previously served as our Interim Chief Financial Officer, Chief Accounting Officer and Treasurer of the Company since June 2007, and continues to serve as our principal financial and accounting officer. Prior to June 2007, Mr. LaVerne served as Vice President and Controller and has been with us since October 1998. Prior to joining us, Mr. La Verne worked for Computer Sciences Corporation, and started his career with Deloitte & Touche LLP. Mr. LaVerne received his B.S. in Accounting from the University of Southern California and is a Certified Public Accountant.
Robert I. Newton joined us in June 2004 and currently serves as our Executive Vice President, Chief Legal Officer and Secretary. Mr. Newton was Of Counsel in the corporate practice group of Morrison & Foerster LLP from February 2000 until joining our company. Prior to his employment at Morrison & Foerster LLP, Mr. Newton was a partner in the corporate practice group of McDermott, Will & Emery LLP. Mr. Newton received a B.B.A., with highest honors, and a J.D., with honors, from the University of Texas at Austin.
Simon M. Abuyounes was appointed Executive Vice President — IT and Operations of PCM, Inc. in April 2014. Mr. Abuyounes previously served as President of PCM Logistics, LLC since June 2005. Prior to June 2005, Mr. Abuyounes has served as Senior Vice President of Operations and has been with us since June 1995. Prior to joining us, Mr. Abuyounes held various engineering and managerial positions for over 10 years. Mr. Abuyounes received his B.S. and M.S. degrees in Engineering from the Ohio State University. Mr. Abuyounes is the brother-in-law of Mr. Khulusi.
Information regarding our board of directors, audit committee, audit committee financial expert, code of business conduct and ethics, our nominating and corporate governance committee as well as other corporate governance matters is set forth under the caption “Election of Directors” in our definitive Proxy Statement to be filed in connection with our 2016 Annual Meeting of Stockholders and such information is incorporated herein by reference.
Information regarding Section 16(a) beneficial ownership compliance is set forth under the caption “Executive Compensation — Section 16(a) Beneficial Ownership Reporting Compliance” in our definitive Proxy Statement to be filed in connection with our 2018 Annual Meeting of Stockholders and such information is incorporated herein by reference.
We have adopted a code of business conduct and ethics that applies to our directors, officers and employees, including our principal executive officer and principal financial and accounting officer. Our code of business conduct and ethics is posted in the “Investor Relations” section of our website at www.pcm.com. Any amendments to, or waivers from, a provision of our code of business conduct and ethics that applies to our principal executive officer, principal financial officer, principal accounting officer or controller, or persons performing similar functions will be posted in the “Investor Relations” section of our website. We will provide a copy of our code of business conduct and ethics to any person, without charge, upon receipt of a written request directed to our Corporate Secretary at our principal executive offices.
| ITEM 11. | EXECUTIVE COMPENSATION |
The information required by this item is set forth under the caption “Executive Compensation” and “Election of Directors -Director Compensation” in our definitive Proxy Statement to be filed in connection with our 2018 Annual Meeting of Stockholders and such information is incorporated herein by reference.
| ITEM 12. | SECURITY OWNERSHIP OF CERTAIN BENEFICIAL OWNERS AND MANAGEMENT AND RELATED STOCKHOLDER MATTERS |
The information required by this item is set forth under the caption “Security Ownership of Certain Beneficial Owners” and “Executive Compensation — Equity Compensation Plan Information” in our definitive Proxy Statement to be filed in connection with our 2018 Annual Meeting of Stockholders and such information is incorporated herein by reference.
| ITEM 13. | CERTAIN RELATIONSHIPS AND RELATED TRANSACTIONS, AND DIRECTOR INDEPENDENCE |
The information required by this item is set forth under the captions “Certain Relationships and Related Transactions,” “Election of Directors — Director Independence” and “Executive Compensation — Compensation Committee Interlocks and Insider Participation” in our definitive Proxy Statement to be filed in connection with our 2018 Annual Meeting of Stockholders and such information is incorporated herein by reference.
| ITEM 14. | PRINCIPAL ACCOUNTING FEES AND SERVICES |
The information required by this item is set forth under the caption “Ratification of the Appointment of Independent Registered Public Accounting Firm” in our definitive Proxy Statement to be filed in connection with our 2018 Annual Meeting of Stockholders and such information is incorporated herein by reference.
| 90 |
| ITEM 15. | EXHIBITS AND FINANCIAL STATEMENT SCHEDULES |
| (a) | The following documents are filed as part of this report: |
| Page Number | |||
| (1) | Financial Statements | See Part II, Item 8, beginning on page 54 | |
| (2) | Financial
Statement Schedule II — Valuation and Qualifying Accounts for the Years Ended December 31, 2017, 2016 and 2015 |
| 91 |
PCM, INC.
SCHEDULE II — VALUATION AND QUALIFYING ACCOUNTS
For the Years Ended December 31, 2017, 2016 and 2015
(in thousands)
| Balance
at Beginning of Year | Additions Charged to Operations | Deduction from Reserves | Balance
at End of Year | |||||||||||||
| Allowance for doubtful accounts for the years ended: | ||||||||||||||||
| December 31, 2017 | $ | 832 | $ | 2,191 | $ | (842 | )(a) | $ | 2,181 | |||||||
| December 31, 2016 | 558 | 1,696 | (1,422 | )(a) | 832 | |||||||||||
| December 31, 2015 | 426 | 731 | (599 | )(a) | 558 | |||||||||||
| Valuation allowance for deferred tax assets for the years ended: | ||||||||||||||||
| December 31, 2017 | $ | 711 | $ | 1,565 | (b) | $ | (2 | )(b) | $ | 2,274 | ||||||
| December 31, 2016 | 911 | 15 | (b) | (215 | )(b) | 711 | ||||||||||
| December 31, 2015 | 805 | 168 | (b) | (62 | )(b) | 911 | ||||||||||
| (a) | Relates primarily to accounts written-off. |
| (b) | Relates primarily to changes in valuation allowances applied to various state net operating loss carryforwards. |
| 92 |
(3) Exhibits. The following exhibits are filed with this Report or incorporated by reference:
EXHIBIT LIST
| 93 |
| 94 |
| 95 |
| 31.2 | Certification of the Chief Financial Officer of PCM, Inc. pursuant to Exchange Act Rule 13a-14(a) | |
| 32.1 | Certification of the Chief Executive Officer of PCM, Inc. pursuant to 18 U.S.C. 1350, as adopted by Section 906 of the Sarbanes-Oxley Act of 2002 | |
| 32.2 | Certification of the Chief Financial Officer of PCM, Inc. pursuant to 18 U.S.C. 1350, as adopted by Section 906 of the Sarbanes-Oxley Act of 2002 | |
| 101.INS | XBRL Instance Document | |
| 101.SCH | XBRL Taxonomy Extension Schema Document | |
| 101.CAL | XBRL Taxonomy Extension Calculation Linkbase Document | |
| 101.DEF | XBRL Taxonomy Extension Definition Linkbase Document | |
| 101.LAB | XBRL Taxonomy Extension Label Linkbase Document | |
| 101.PRE | XBRL Taxonomy Extension Presentation Linkbase Document |
| * | Exhibits and schedules have been omitted pursuant to Item 601(b)(2) of Regulation S-K. The Registrant hereby undertakes to furnish supplementally copies of any of the omitted schedules upon request by the Securities and Exchange Commission. This agreement has been included to provide investors with information regarding its terms, however it is not intended to provide any other factual information about the parties. The agreement contains representations and warranties of the parties as of specified dates that are qualified by information in confidential disclosure schedules delivered in connection with signing the agreement. The assertions embodied in these representations and warranties were made solely for purposes of the agreement and may be subject to important qualifications and limitations agreed to by the parties in connection with negotiating its terms. Moreover, certain representations and warranties may not be accurate or complete as of any specified date because they are subject to a contractual standard of materiality that is different from certain standards generally applicable to stockholders or were used for the purpose of allocating risk between the parties rather than establishing matters as facts. Accordingly, investors should not rely on the representations and warranties as characterizations of the actual state of facts at the time they were made or otherwise. |
| ** | Management contract, or compensatory plan or arrangement. |
| + | Confidential portions omitted and filed separately with the U.S. Securities and Exchange Commission pursuant to a request for confidential treatment under Rule 24b-2 promulgated under the Securities Exchange Act of 1934, as amended. |
***
Not applicable.
| 96 |
Pursuant to the requirements of Section 13 or 15(d) of the Securities Exchange Act of 1934, the Registrant has duly caused this report to be signed on its behalf by the undersigned, hereunto duly authorized.
| PCM, INC. | ||
| (Registrant) | ||
| Date: March 15, 2018 | By: | /s/ FRANK F. KHULUSI |
| Frank F. Khulusi | ||
| Chief Executive Officer | ||
POWER OF ATTORNEY
KNOW ALL PERSONS BY THESE PRESENTS, that each person whose signature appears below constitutes and appoints Frank F. Khulusi and Brandon H. LaVerne, and each of them, as his true and lawful attorneys-in-fact and agents, with full power of substitution and re-substitution, for him and in his name, place and stead, in any and all capacities, to sign any and all amendments to this Annual Report on Form 10-K, and to file the same, with exhibits thereto, and other documents in connection therewith, with the Securities and Exchange Commission, granting unto said attorneys-in-fact and agents, and each of them, full power and authority to do and perform each and every act and thing requisite and necessary to be done in connection therewith, as fully to all intents and purposes as he might or could do in person, hereby ratifying and confirming all that said attorneys-in-fact and agents, or any of them, or their or his substitute or substitutes, may lawfully do or cause to be done by virtue hereof.
Pursuant to the requirements of the Securities Exchange Act of 1934, as amended, this report has been signed below by the following persons on behalf of the Registrant in the capacities and on the dates indicated.
| Signature | Title | Date | ||
| /s/ FRANK F. KHULUSI | Chairman and Chief Executive Officer | March 15, 2018 | ||
| Frank F. Khulusi | (Principal Executive Officer) | |||
| /s/ BRANDON H. LAVERNE | Chief Financial Officer, Chief Accounting Officer, Treasurer and | March 15, 2018 | ||
| Brandon H. LaVerne | Assistant Secretary (Principal Financial and Accounting Officer) | |||
| /s/ THOMAS A. MALOOF | Director | March 15, 2018 | ||
| Thomas A. Maloof | ||||
| /s/ RONALD B. RECK | Director | March 15, 2018 | ||
| Ronald B. Reck | ||||
| /s/ PAUL C. HEESCHEN | Director | March 15, 2018 | ||
| Paul C. Heeschen |
***
| 97 |