Attached files
| file | filename |
|---|---|
| EX-32.2 - EX-32.2 - Party City Holdco Inc. | d516776dex322.htm |
| EX-32.1 - EX-32.1 - Party City Holdco Inc. | d516776dex321.htm |
| EX-31.2 - EX-31.2 - Party City Holdco Inc. | d516776dex312.htm |
| EX-31.1 - EX-31.1 - Party City Holdco Inc. | d516776dex311.htm |
| EX-23.1 - EX-23.1 - Party City Holdco Inc. | d516776dex231.htm |
| EX-21.1 - EX-21.1 - Party City Holdco Inc. | d516776dex211.htm |
| EX-10.22 - EX-10.22 - Party City Holdco Inc. | d516776dex1022.htm |
| EX-10.21 - EX-10.21 - Party City Holdco Inc. | d516776dex1021.htm |
| EX-10.20 - EX-10.20 - Party City Holdco Inc. | d516776dex1020.htm |
| EX-10.19 - EX-10.19 - Party City Holdco Inc. | d516776dex1019.htm |
| EX-10.18 - EX-10.18 - Party City Holdco Inc. | d516776dex1018.htm |
| EX-10.14 - EX-10.14 - Party City Holdco Inc. | d516776dex1014.htm |
| EX-10.4 - EX-10.4 - Party City Holdco Inc. | d516776dex104.htm |
| EX-10.3 - EX-10.3 - Party City Holdco Inc. | d516776dex103.htm |
| EX-4.5 - EX-4.5 - Party City Holdco Inc. | d516776dex45.htm |
Table of Contents
UNITED STATES
SECURITIES AND EXCHANGE COMMISSION
Washington, D.C. 20549
Form 10-K
| ☑ | ANNUAL REPORT PURSUANT TO SECTION 13 OR 15(d) OF THE SECURITIES EXCHANGE ACT OF 1934 |
For the fiscal year ended December 31, 2017
OR
| ☐ | TRANSITION REPORT PURSUANT TO SECTION 13 OR 15(d) OF THE SECURITIES EXCHANGE ACT OF 1934 |
For the transition period from to
Commission File Number: 001-37344
Party City Holdco Inc.
(Exact Name of Registrant as Specified in Its Charter)
| Delaware | 46-0539758 | |
| (State or Other Jurisdiction of Incorporation or Organization) |
(I.R.S. Employer Identification No.) |
80 Grasslands Road
Elmsford, NY 10523
(Address of Principal Executive Offices)
(914) 345-2020
(Registrant’s telephone number, including area code)
Securities Registered Pursuant to Section 12(b) of the Act:
| Title of each class |
Name of each exchange on which registered | |
| Common Stock $0.01 par value | New York Stock Exchange |
Securities Registered Pursuant to Section 12(g) of the Act: None
Indicate by check mark if the registrant is a well-known seasoned issuer, as defined in Rule 405 of the Securities Act. Yes ☐ No ☑
Indicate by check mark if the registrant is not required to file reports pursuant to Section 13 or 15(d) of the Securities Exchange Act of 1934. Yes ☐ No ☑
Indicate by check mark whether the registrant (1) has filed all reports required to be filed by Section 13 or 15(d) of the Securities Exchange Act of 1934 during the preceding 12 months (or for such shorter period that the registrant was required to file such reports), and (2) has been subject to such filing requirements for the past 90 days. Yes ☑ No ☐
Indicate by a check mark whether the registrant has submitted electronically and posted on its corporate website, if any, every Interactive Data File required to be submitted and posted pursuant to Rule 405 of Regulation S-T (§232.405 of this chapter) during the preceding 12 months (or for such shorter period that the registrant was required to submit and post such files.) Yes ☑ No ☐
Indicate by check mark if disclosure of delinquent filers pursuant to Item 405 of Regulation S-K (§229.405 of this chapter) is not contained herein, and will not be contained, to the best of registrant’s knowledge, in definitive proxy or information statements incorporated by reference in Part III of this Form 10-K or any amendment to this Form 10-K. ☑
Indicate by check mark whether the registrant is a large accelerated filer, an accelerated filer, a non-accelerated filer, a smaller reporting company, or an emerging growth company. See the definitions of “large accelerated filer,” “accelerated filer”, “smaller reporting company” and “emerging growth company” in Rule 12b-2 of the Exchange Act. (Check one):
| Large accelerated filer | ☐ | Accelerated filer | ☑ | |||
| Non-accelerated filer | ☐ (Do not check if a smaller reporting company) | Smaller reporting company | ☐ | |||
| Emerging growth company | ☐ | |||||
If an emerging growth company, indicate by check mark if the registrant has elected not to use the extended transition period for complying with any new or revised financial accounting standards provided pursuant to Section 13(a) of the Exchange Act. ☐
Indicate by check mark whether the registrant is a shell company (as defined in Rule 12b-2 of the Exchange Act). Yes ☐ No ☑
The aggregate market value of common stock held by non-affiliates as of June 30, 2017 was $480,211,611. As of February 15, 2018, there were 96,394,102 shares of the registrant’s common stock outstanding.
DOCUMENTS INCORPORATED BY REFERENCE
Portions of the registrant’s definitive proxy statement relating to its 2018 annual meeting of stockholders, to be held on June 6, 2018, are incorporated by reference in Part III.
Table of Contents
TABLE OF CONTENTS
Table of Contents
Forward-Looking Statements
This Annual Report on Form 10-K, including the section “Management’s Discussion and Analysis of Financial Condition and Results of Operations” in Part II, Item 7, contains information that may constitute forward-looking statements. Forward-looking statements relate to expectations, beliefs, projections, future plans and strategies, anticipated events or trends and similar expressions concerning matters that are not historical facts, such as statements regarding our future financial condition or results of operations, our prospects and strategies for future growth and the development and introduction of new products. In many cases you can identify forward-looking statements by terms such as “believes,” “anticipates,” “expects,” “targets,” “estimates,” “intends,” “will,” “may” or “plans” and similar expressions. These forward-looking statements reflect our current expectations and are based upon data available to us at the time the statements were made.
Such statements are subject to certain risks and uncertainties that could cause actual results to differ materially from expectations. These risks, as well as other risks and uncertainties, are detailed in the section Item 1A. “Risk Factors.” Moreover, we operate in a very competitive and rapidly changing environment. New risks emerge from time to time. It is not possible for our management to predict all risks, nor can we assess the impact of all factors on our business or the extent to which any factor, or combination of factors, may cause actual results to differ materially from those contained in any forward-looking statements we may make. In light of these risks, uncertainties and assumptions, the forward-looking events and circumstances discussed in this Annual Report on Form 10-K may not occur and actual results could differ materially and adversely from those anticipated or implied in the forward-looking statements. All forward-looking statements are qualified by these cautionary statements and are made only as of the date of this Annual Report on Form 10-K. Any such forward-looking statements should be considered in context with the various disclosures made by us about our business. Unless required by law, we undertake no obligation to publicly update or revise any forward-looking statements to reflect new information or future events or otherwise. You should, however, review the factors and risks we describe in the reports we will file from time to time with the Securities and Exchange Commission (the “SEC”) after the date of the filing of this Annual Report on Form 10-K.
In this Annual Report on Form 10-K references to “Party City Holdco,” “Party City,” the “Company “we,” “our,” “ours” and “us” refer to Party City Holdco Inc. and its consolidated subsidiaries unless stated or the context otherwise requires.
Overview
Party City Holdco is a holding company with no operating assets or operations. Party City Holdco owns 100% of PC Nextco Holdings, LLC (“PC Nextco”), which owns 100% of PC Intermediate Holdings, Inc. (“PC Intermediate”). PC Intermediate owns 100% of Party City Holdings Inc. (“PCHI”). PCHI or its direct or indirect subsidiaries conduct most of our operations. The Company’s principal executive offices are located at 80 Grasslands Road, Elmsford, New York 10523.
We are the leading party goods retailer by revenue in North America and, we believe, the largest vertically integrated supplier of decorated party goods globally by revenue. With over 900 locations (inclusive of franchised stores), we have the only coast-to-coast network of party superstores in the U.S. and Canada that make it easy and fun to enhance special occasions with a differentiated shopping experience and an unrivaled assortment of innovative and exciting merchandise offered at a compelling value. We also operate multiple e-commerce sites, principally under the domain name PartyCity.com, and during the Halloween selling season we open a network of approximately 250—300 temporary stores under the Halloween City banner.
In addition to our retail operations, we are also one of the largest global designers, manufacturers and distributors of decorated party supplies, with products found in over 40,000 retail outlets worldwide, including
1
Table of Contents
independent party supply stores, mass merchants, grocery retailers and dollar stores. Our products are available in over 100 countries with the United Kingdom (“U.K.”), Canada, Germany, Mexico and Australia among the largest end markets for our products outside of the United States. During 2017, our third-party wholesale revenues were $629 million.
The 2005 combination of Amscan, which focused on the wholesale market, and Party City, which focused on the retail market, represented an important step in our evolution. Since the acquisition of Party City in 2005, we have steadily increased the selection of Amscan merchandise offered in Party City stores from approximately 25% to approximately 80% in 2017, allowing us to capture the full manufacturing-to-retail margin on a significant portion of our retail sales.
Through a combination of organic growth and strategic acquisitions, we have been able to generate strong topline performance and margin expansion, including:
| • | Growing revenue from $2,045.1 million for the year ended December 31, 2013 to $2,371.6 million for the year ended December 31, 2017, representing a compounded annual growth rate of 3.8%. |
| • | Increasing adjusted EBITDA from $320.8 million for the year ended December 31, 2013 to $409.2 million for the year ended December 31, 2017. |
| • | Increasing adjusted net income from $68.4 million for the year ended December 31, 2013 to $148.6 million for the year ended December 31, 2017. |
For a discussion of our use of adjusted EBITDA and adjusted net income and reconciliations to net income (loss), please refer to Item 6, “Selected Consolidated Financial Data.”
Industry Overview
We operate in the broadly defined $10 billion retail party goods industry (including decorative paper and plastic tableware, costumes, decorations, accessories and balloons), which is supported by a range of suppliers from commodity paper goods producers to party goods manufacturers. Sales of party goods are fueled by everyday events such as birthdays, baby showers, weddings and anniversaries, as well as seasonal events such as holidays and other special occasions. As a result of numerous and diverse occasions, the U.S. party goods market enjoys broad demographic appeal. We also operate in the $7 billion Halloween market, a portion of which overlaps with the $10 billion retail party goods industry. The Halloween market includes products that we sell such as costumes, candy and makeup. However, it also includes products and services which we do not supply, such as pumpkins, hay rides and haunted house tours.
The retail landscape is comprised primarily of party superstores, mass merchants, e-commerce merchandisers, craft stores, grocery retailers, and dollar stores. The party superstore has emerged as a preferred destination for party goods shoppers, similar to the dominance of specialty retailers in other categories such as home improvement, pet products and sporting goods. This is typically due to the superstore chain’s ability to offer a wider variety of merchandise at more compelling prices in a convenient setting as well as the knowledgeable staff often found at superstores. Other retailers that cater to the party goods market typically offer a limited assortment of party supplies and seasonal items. Mass merchants tend to focus primarily on juvenile and seasonal goods, greeting cards and gift wrap; craft stores on decorations and seasonal merchandise; and dollar stores on general and seasonal party goods items.
Segments
We have two reporting segments: Retail and Wholesale. In 2017, we generated 73.5% of our total revenues from our retail segment and 26.5% of our total revenues from our wholesale segment.
Our retail operations generate revenue primarily through the sale of our Amscan, Designware, Anagram and Costumes USA party supplies through our Party City stores, Halloween City stores and PartyCity.com. During
2
Table of Contents
2017, approximately 80% of the product that was sold by our retail operations was supplied by our wholesale operations and approximately 23% was self-manufactured.
Our wholesale revenues are generated from the sale of party goods for all occasions, including paper and plastic tableware, accessories and novelties, costumes, metallic and latex balloons and stationery. Our products are sold at wholesale to party goods superstores, including our franchise stores, other party goods retailers, mass merchants, independent card and gift stores, dollar stores and other retailers and distributors throughout the world.
Financial information about our business segments and geographical areas is provided in Note 15, Segment Information, to our consolidated financial statements in Part II, Item 8, “Financial Statements and Supplementary Data,” in this Annual Report on Form 10-K.
Retail Operations
Overview
Opening its first company-owned store in 1986, Party City has grown to become what we believe is the largest operator of owned and franchised party superstores by revenue in the United States. At the time of the combination of Party City and Amscan in 2005, Party City’s network consisted of 502 stores, including 254 franchised locations. Since the acquisition, we have expanded the Party City network to approximately 880 superstore locations in the United States (inclusive of franchised stores) and approximately 60 locations in Canada. We also operate approximately 250—300 temporary Halloween stores, under the Halloween City banner.
The following table shows the change in our company-owned Party City store network over the past three years:
| 2017 | 2016 | 2015 | ||||||||||
| Stores open at beginning of year |
750 | 712 | 693 | |||||||||
| Stores opened |
16 | 29 | 27 | |||||||||
| Stores acquired from franchisees/others |
44 | 19 | 6 | |||||||||
| Stores closed |
(7 | ) | (10 | ) | (14 | ) | ||||||
|
|
|
|
|
|
|
|||||||
| Stores open at end of year |
803 | 750 | 712 | |||||||||
|
|
|
|
|
|
|
|||||||
E-commerce
Our websites, including PartyCity.com, offer a convenient, user-friendly and secure online shopping option for new and existing customers. In addition to the ability to order products, our websites provide a substantial amount of content about our party products, party planning ideas and promotional offers. The websites are also one of our key marketing vehicles, specifically as they relate to social media marketing initiatives.
Retail Advertising and Marketing
Our advertising focuses on promoting specific seasonal occasions and general party themes, with a strong emphasis on our price-value proposition, with the goal of increasing customer traffic and further building our brand.
Competition at Retail
In our retail segment, our stores compete primarily on the basis of product assortment, store location and layout, customer convenience and value. Although we compete with a variety of smaller and larger retailers,
3
Table of Contents
including, but not limited to, independent party goods supply stores, specialty stores, dollar stores, e-commerce merchandisers, warehouse/merchandise clubs, drug stores, and mass merchants, we believe that, based on our revenues and strong brand awareness with our customers, our retail stores maintain a leading position in the party goods business by offering a wider breadth of merchandise than most competitors and a greater selection within merchandise classes, at a compelling value. We are one of only a few vertically integrated suppliers of decorated party goods. While some of our competitors in our markets may have greater financial resources, we believe that our significant buying power, which results from the size of our retail store network and the breadth of our assortment, is an important competitive advantage. Many of our retail competitors are also customers of our wholesale business.
Retail Seasonality
Our retail operations are subject to significant seasonal variations. Historically, this segment has realized a significant portion of its revenues, cash flow and net income in the fourth quarter of the year, principally due to our Halloween sales in October and, to a lesser extent, year-end holiday sales. Halloween business represents approximately 20% of our total domestic retail sales. To maximize our seasonal opportunity, we operate a chain of temporary Halloween stores, under the Halloween City banner, during the months of September and October of each year. During 2017, our temporary Halloween stores (including Canadian stores) generated revenues of approximately $54 million.
Franchise Operations
We have franchised stores throughout the United States, Mexico and Puerto Rico run by franchisees utilizing our format, design specifications, methods, standards, operating procedures, systems and trademarks. Our wholesale sales to franchised stores generally mirror, with respect to relative size, mix and category, those to our company-owned stores. The following table shows the change in our franchise-owned store network over the past three years:
| 2017 | 2016 | 2015 | ||||||||||
| Stores open at beginning of year |
184 | 200 | 208 | |||||||||
| Stores opened/acquired by existing franchisees |
3 | 5 | — | |||||||||
| Stores sold to the Company |
(36 | ) | (19 | ) | (6 | ) | ||||||
| Stores closed or converted to independent stores |
(3 | ) | (2 | ) | (2 | ) | ||||||
|
|
|
|
|
|
|
|||||||
| Stores open at end of year |
148 | 184 | 200 | |||||||||
|
|
|
|
|
|
|
|||||||
We are not currently marketing, nor do we plan to market, new franchise territories in the United States or Canada. However, in the future, we do plan on marketing new franchise territories internationally. During 2015, the Company entered into an agreement with a subsidiary of Grupo Oprimax to franchise the Party City concept throughout Mexico. Under the terms of the agreement, Grupo Oprimax will have the exclusive right to open up Party City stores in Mexico.
We receive revenue from our franchisees, consisting of an initial one-time fee and ongoing royalty fees generally ranging from 4% to 6% of net sales. In exchange for these franchise fees, franchisees principally receive brand value and company support with respect to planograms. Each franchisee has a mandated advertising budget, which consists of a minimum initial store opening promotion and ongoing local advertising and promotions. Additionally, franchisees must pay 1% to 2.25% of net sales to a group advertising fund to cover common advertising materials. We do not offer financing to our franchisees for one-time fees or ongoing royalty fees. Our franchise agreements provide us with a right of first refusal should any franchisee look to dispose of its operations.
Current franchise agreements provide for an assigned area or territory that typically equals a three or four-mile radius from the franchisee’s store location and the right to use the Party City® logo and trademark. In
4
Table of Contents
addition, certain agreements with our franchisees and other business partners contain geographic limitations on opening new stores. For most stores, the franchisee or the majority owner of a corporate franchisee devotes full time to the management, operation and on-premises supervision of the stores or groups of stores.
Wholesale Operations
Overview
We currently offer over 400 party goods ensembles, which range from approximately five to 50 design-coordinated items spanning tableware, accessories, novelties, balloons and decorations. The breadth of these ensembles enables retailers to promote additional sales of related products for every occasion. To enhance our customers’ celebrations of life’s important events, we market party goods ensembles for a wide variety of occasions, including seasonal and religious holidays, special events and themed celebrations.
Our Amscan, Anagram, Costumes USA and Designware branded products are offered in over 40,000 retail outlets worldwide, ranging from party goods superstores, including our company-owned and franchised retail stores, other party goods retailers, mass merchants, independent card stores, dollar stores and other retailers and distributors throughout the world. We have long-term relationships with many of our wholesale customers. Party goods superstores, the Company’s primary channel of distribution, provide consumers with a one-stop source for all of their party needs. Amscan, Anagram, Costumes USA and Designware branded products represent a significant portion of party goods carried by both company-owned and third-party stores with the overall percentage continuing to increase, reflecting the breadth of our product line and, based on our scale, our ability to manufacture and source quality products at competitive prices.
The table below shows the breakdown of our total wholesale sales by channel for the year ended December 31, 2017:
| Channel |
Sales | |||
| (dollars in millions) | ||||
| Party City and Halloween City—owned stores and e-commerce |
$ | 631 | ||
| Party City franchised stores and other domestic retailers |
269 | |||
| Domestic balloon distributors/retailers |
86 | |||
| International balloon distributors |
22 | |||
| Other international |
252 | |||
|
|
|
|||
| Total wholesale sales |
$ | 1,260 | ||
|
|
|
|||
5
Table of Contents
Product Lines
The following table sets forth the principal products we distribute by product category, and the corresponding percentage of revenue that each category represents:
Wholesale Sales by Product for the Year Ended
December 31, 2017
| Category |
Items |
% of Sales | ||||
| Tableware |
Plastic Plates, Paper Plates, Plastic Cups, Paper Cups, Paper Napkins, Plastic Cutlery, Tablecovers | 25 | % | |||
| Costumes & Accessories |
Costumes, Other Wearables, Wigs | 22 | % | |||
| Decorations |
Latex Balloons, Piñatas, Crepes, Flags & Banners, Decorative Tissues, Stickers and Confetti, Scene Setters, Garland, Centerpieces | 21 | % | |||
| Favors, Stationery & Other |
Party Favors, Gift Bags, Gift Wrap, Invitations, Bows, Stationery | 17 | % | |||
| Metallic Balloons |
Bouquets, Standard 18 Inch Sing-A-Tune, SuperShapes, Weights | 15 | % | |||
Our products span a wide range of lifestyle events from birthdays to theme parties and sporting events, as well as holidays such as Halloween and New Year’s. In 2017, approximately 70% of our wholesale sales consisted of items designed for everyday occasions, with the remaining sales comprised of items used for holidays and seasonal celebrations throughout the year. Our product offerings cover the following broad range of occasions and life celebrations:
Current Product Offering
| Everyday |
Seasonal | |
| Anniversaries |
New Year’s | |
| Bar Mitzvahs |
Valentine’s Day | |
| Birthdays |
St. Patrick’s Day | |
| Bridal/Baby Showers |
Easter | |
| Christenings Confirmations First Communions |
Passover Graduations Cinco de Mayo | |
| Theme-oriented* |
Fourth of July | |
| Weddings |
Halloween | |
| Fall | ||
| Thanksgiving | ||
| Hanukkah | ||
| Christmas |
| * | Our theme-oriented ensembles enhance various celebrations and include Bachelorette, Card Party, Casino, Chinese New Year, Cocktail Party, Disco, Fiesta, Fifties Rock-and-Roll, Hawaiian Luau, Hollywood, Mardi Gras, Masquerade, Patriotic, Retirement, Sports, Summer Barbeque and Western. |
Wholesale Manufactured Products
In 2017, we manufactured items representing approximately 40% of our net sales at wholesale (including sales to our retail operations). Our manufacturing facilities in Minnesota, Kentucky, New York, Rhode Island, Malaysia, New Mexico, Mexico and Madagascar are generally highly automated and produce paper and plastic
6
Table of Contents
plates and cups, paper napkins, metallic and latex balloons, injection molded product, costumes, pinatas and other party and novelty items at globally competitive costs. State-of-the-art printing, forming, folding and packaging equipment support most of these manufacturing operations. Given our size and sales volume, we are generally able to operate our manufacturing equipment on the basis of at least two shifts per day, thus lowering production costs per unit. In select cases, we use available capacity to manufacture products for third parties, which allows us to maintain a satisfactory level of equipment utilization.
The table below summarizes our principal manufacturing facilities:
| Location |
Principal Products |
Approximate Square Feet | ||
| Monterrey, Mexico |
Stickers, gift wrap, bags and invites | 355,500 | ||
| Newburgh, New York |
Paper napkins and paper cups | 248,000 | ||
| East Providence, Rhode Island |
Plastic plates, cups and bowls | 229,230(1) | ||
| Louisville, Kentucky |
Paper plates | 189,175 | ||
| Tijuana, Mexico |
Piñatas and other party products | 135,000 | ||
| Eden Prairie, Minnesota |
Metallic balloons and accessories | 115,600 | ||
| Melaka, Malaysia |
Latex balloons | 100,000 | ||
| Los Lunas, New Mexico |
Injection molded plastics | 85,055 | ||
| Antananarivo, Madagascar |
Costumes | 41,000 |
| (1) | The square footage represents an industrial park, which includes a 48,455 square foot office and warehouse. |
Complementing our manufacturing facilities, we have a diverse global network of third-party suppliers that supports our strategy of consistently offering a broad selection of high quality, innovative and competitively priced product. We have over 20-year relationships with many of our vendors and often represent a significant portion of their overall business. They generally produce items designed by and created for us, are located in Asia, and are managed by our sourcing office in Hong Kong. We actively work with our third-party suppliers to ensure product cost, quality and safety.
The principal raw materials used in manufacturing our products are paper, petroleum-based resin and cotton. While we currently purchase such raw material from a relatively small number of sources, paper, resin and cotton are available from numerous sources. Therefore, we believe our current suppliers could be replaced without adversely affecting our manufacturing operations in any material respect.
Wholesale Product Safety and Quality Assurance
We are subject to regulatory requirements in the United States and internationally, and we believe that all products that we manufacture and source comply with the requirements in the markets in which they are sold. Third-party manufactured products are tested both at the manufacturing site and upon arrival at our distribution centers. We have a full-time staff of professionals in the United States, Asia and Europe dedicated to product safety and quality assurance.
Wholesale Distribution and Systems
We ship our products directly to retailers and distributors throughout the world from our distribution facilities, as well as on a free-on-board (“FOB”) basis directly from our domestic and international factories. Our electronic order entry and information systems allow us to manage our inventory with minimal obsolescence while maintaining strong fill rates and quick order turnaround time.
Our main distribution facility for domestic party customers is located in Chester, New York, with nearly 900,000 square feet under one roof. This state-of-the-art facility serves as the main point of distribution for our Amscan-branded products and utilizes paperless, pick-by-light systems, offering superior inventory management and turnaround times as short as 48 hours.
7
Table of Contents
We utilize a bypass system which allows us to ship products directly from selected third-party suppliers to our company-owned and franchised stores, thus bypassing our distribution facilities. In addition to lowering our distribution costs, this bypass system creates warehouse capacity.
The distribution center for our retail e-commerce platform is located in Naperville, Illinois. We also have other distribution centers in the U.K., Germany and Mexico to support our international customers.
Wholesale Customers
We have a diverse third party customer base at wholesale. During 2017, no individual third party customer accounted for more than 10% of our total third-party sales at wholesale.
Competition at Wholesale
In our wholesale segment, we compete primarily on the basis of diversity and quality of our product designs, breadth of product line, product availability, price, reputation and customer service. Although we have many competitors with respect to one or more of our products, we believe that there are no competitors who design, manufacture, source and distribute products with the complexity of design and breadth of product lines that we do. Furthermore, our design and manufacturing processes create efficiencies in manufacturing that few of our competitors can achieve in the production of numerous coordinated products in multiple design types. Competitors include smaller independent manufacturers and distributors, as well as divisions or subsidiaries of large companies. Certain of these competitors control various party goods product licenses for widely recognized images, such as cartoon or motion picture characters, which could provide them with a competitive advantage. However, we control a strong portfolio of character licenses for use in the design and production of our metallic balloons and we have access to a strong portfolio of character and other licenses for party goods.
Information Systems
We continually evaluate and upgrade our information systems to enhance the quantity, quality and timeliness of information available to management and to improve the efficiency of our manufacturing and distribution facilities, as well as our service at the store level. We have implemented merchandise replenishment software to complement our distribution, planning and allocation processes. The system enhances the store replenishment function by improving in-stock positions, leveraging our distribution infrastructure and allowing us to become more effective in our use of store labor. We have implemented a Point of Sale system and upgraded merchandising systems to standardize technology across all of our domestic retail superstores and we have implemented similar systems at our temporary Halloween City locations.
Employees
As of December 31, 2017, the Company had approximately 9,400 full-time employees and 10,400 part-time employees, none of whom is covered by a collective bargaining agreement. We consider our relationship with our employees to be good.
Intellectual Property
We own the copyrights in the designs we create and use on our products and various trademarks and service marks used on or in connection with our products. It is our practice to register our copyrights with the United States Copyright Office and our trademarks and service marks with the United States Patent and Trademark Office, or with other foreign jurisdictions, to the extent we deem necessary. In addition, we rely on unregistered common law trademark rights and unregistered copyrights under applicable U.S. law to distinguish and/or protect our products, services and branding. We do not believe that the loss of copyrights or trademarks with respect to any particular product or products would have a material adverse effect on our business. We hold numerous
8
Table of Contents
intellectual property licenses from third parties, allowing us to use various third-party cartoon and other characters and designs on our products, and the images on our metallic balloons and costumes are principally covered by these licenses. None of these licenses is individually material to our aggregate business. We also own patents relating to display racks and balloon weights, none of which is individually material to our aggregate business.
We permit our franchisees to use a number of our trademarks and service marks, including Party City, The Discount Party Super Store, Party America and Halloween City.
Government Regulation
As a franchisor, we must comply with regulations adopted by the Federal Trade Commission, such as the Trade Regulation Rule on Franchising, which requires us, among other things, to furnish prospective franchisees with a franchise offering circular. We also must comply with a number of state laws that regulate the offer and sale of our franchises and certain substantive aspects of franchisor-franchisee relationships. These laws vary in their application and in their regulatory requirements. State laws that regulate the offer and sale of franchises typically require us to, among other things, register before the offer and sale of a franchise can be made in that state and to provide a franchise offering circular to prospective franchisees.
State laws that regulate the franchisor-franchisee relationship presently exist in a substantial number of states. Those laws regulate the franchise relationship, for example, by restricting a franchisor’s rights with regard to the termination, transfer and renewal of a franchise agreement (for example, by requiring “good cause” to exist as a basis for the termination and the franchisor’s decision to refuse to permit the franchisee to exercise its transfer or renewal rights), by requiring the franchisor to give advance notice to the franchisee of the termination and give the franchisee an opportunity to cure most defaults. To date, those laws have not precluded us from seeking franchisees in any given area and have not had a material adverse effect on our operations.
Our wholesale and retail segments must also comply with applicable regulations adopted by federal agencies, including product safety regulations, and with licensing and other regulations enforced by state and local health, sanitation, safety, fire and other departments. Difficulties or failures in obtaining the required licenses or approvals can delay and sometimes prevent the opening of a new store or the shutting down of an existing store.
Our manufacturing operations, stores and other facilities must comply with applicable environmental, health and safety regulations, although the cost of complying with these regulations to date has not been material. More stringent and varied requirements of local governmental bodies with respect to zoning, land use, and environmental factors can delay, and sometimes prevent, development of new stores in particular locations. Our stores must comply with the Fair Labor Standards Act and various state laws governing various matters such as minimum wages, overtime and other working conditions. Our stores must also comply with the provisions of the Americans with Disabilities Act, which requires that employers provide reasonable accommodation for employees with disabilities and that stores must be accessible to customers with disabilities.
Available Information
We are subject to the informational requirements of the Securities Exchange Act of 1934, as amended (the “Exchange Act”), and in accordance therewith, we file reports, proxy and information statements and other information with the SEC. Our Annual Report on Form 10-K, Quarterly Reports on Form 10-Q, Current Reports on Form 8-K, and other information to those reports filed or furnished pursuant to Section 13(a) or 15(d) of the Exchange Act are available through the investor relations section of our website at www.partycity.com. Reports are available free of charge as soon as reasonably practicable after we electronically file them with, or furnish them to, the SEC. The information contained on our website is not incorporated by reference into this Annual Report on Form 10-K.
9
Table of Contents
In addition to our website, you may read and copy public reports we file with or furnish to the SEC at the SEC’s Public Reference Room at 100 F Street, NE, Washington, DC 20549. You may obtain information on the operation of the Public Reference Room by calling the SEC at 1-800-SEC-0330. The SEC maintains an Internet site that contains our reports, proxy and information statements, and other information that we file electronically with the SEC at www.sec.gov.
10
Table of Contents
| Item 1A. | Risk Factors |
The following risk factors may be important to understanding any statement in this Annual Report on Form 10-K or elsewhere. Our business, financial condition and operating results can be affected by a number of factors, whether currently known or unknown, including but not limited to those described below. Any one or more of such factors could directly or indirectly cause our actual results of operations and financial condition to vary materially from past or anticipated future results of operations and financial condition. Any of these factors, in whole or in part, could materially and adversely affect our business, financial condition, results of operations and stock price.
We operate in a competitive industry, and our failure to compete effectively could cause us to lose our market share, revenues and growth prospects.
We compete with many other manufacturers and distributors, including smaller, independent manufacturers and distributors and divisions or subsidiaries of larger companies with greater financial and other resources than we have. Some of our competitors control licenses for widely recognized images and have broader access to mass market retailers that could provide them with a competitive advantage.
The party goods retail industry is large and highly fragmented. Our retail stores compete with a variety of smaller and larger retailers, including specialty retailers, warehouse/merchandise clubs, drug stores, supermarkets, dollar stores, mass merchants, and catalogue and online merchants. Our stores compete, among other ways, on the basis of location and store layout, product mix and availability, customer convenience and price. We may not be able to continue to compete successfully against existing or future competitors in the retail space. Expansion into markets served by our competitors and entry of new competitors or expansion of existing competitors into our markets could materially adversely affect our business, results of operations, cash flows and financial performance.
We must remain competitive in the areas of quality, price, breadth of selection, customer service and convenience. Competing effectively may require us to reduce our prices or increase our costs, which could lower our margins and adversely affect our revenues and growth prospects.
A decrease in our Halloween sales could have a material adverse effect on our operating results for the year.
Our retail business realizes a significant portion of its revenues, net income and cash flows in September and October, principally due to Halloween sales. We believe that this general pattern will continue in the future. An economic downturn, or adverse weather, during this period could adversely affect us to a greater extent than at other times of the year. Any unanticipated decrease in demand for our products during the Halloween season could require us to maintain excess inventory or sell excess inventory at substantial markdowns, which could have a material adverse effect on our business, profitability, ability to repay any indebtedness and our brand image. In addition, our sales during the Halloween season could be affected if we are not able to find sufficient and adequate lease space for our temporary Halloween City stores or if we are unable to hire qualified temporary personnel to adequately staff these stores and our distribution facility during the Halloween season, whether due to labor market conditions or a failure in our internal recruiting and staffing processes. Failure to have proper lease space and adequate personnel could hurt our business, financial condition and results of operations.
Our failure to appropriately respond to changing merchandise trends and consumer preferences could significantly harm our customer relationships and financial performance.
As a manufacturer, distributor and retailer of consumer goods, our products must appeal to a broad range of consumers whose preferences are constantly changing. We also sell certain licensed products, with images such as cartoon or motion picture characters, which are in great demand for short time periods, making it difficult to project our inventory needs for these products. In addition, we may not be able to obtain the licenses for certain
11
Table of Contents
popular characters and could lose market share to competitors who are able to obtain those licenses. Additionally, if consumers’ demand for single-use, disposable party goods were to diminish in favor of reusable products for environmental or other reasons, our sales could decline.
The success of our business depends upon many factors, such as our ability to accurately predict the market for our products and our customers’ purchasing habits, to identify product and merchandise trends, to innovate and develop new products, to manufacture and deliver our products in sufficient volumes and in a timely manner and to differentiate our product offerings from those of our competitors. We may not be able to continue to offer assortments of products that appeal to our customers or respond appropriately to consumer demands. We could misinterpret or fail to identify trends on a timely basis. Our failure to anticipate, identify or react appropriately to changes in consumer tastes could, among other things, lead to excess inventories and significant markdowns or a shortage of products and lost sales. Our failure to do so could harm our customer relationships and financial performance.
Our business may be adversely affected by material fluctuations in commodity prices.
The costs of our key raw materials (paper, petroleum-based resin and cotton) fluctuate. In general, we absorb movements in raw material costs that we consider temporary or insignificant. However, cost increases that are considered other than temporary may require us to increase our prices to maintain our margins. Raw material prices may increase in the future and we may not be able to pass on these increases to our customers. A significant increase in the price of raw materials that we cannot pass on to customers could have a material adverse effect on our results of operations and financial performance. In addition, the interruption in supply of certain key raw materials essential to the manufacturing of our products may have an adverse impact on our and our suppliers’ abilities to manufacture the products necessary to maintain our existing customer relationships.
We may not be able to successfully implement our store growth strategy.
If we are unable to increase the number of retail stores we operate and increase the productivity and profitability of existing retail stores, our ability to increase sales, profitability and cash flow could be impaired. To the extent we are unable to open new stores as we planned, our retail store sales growth, if any, would come primarily from increases in comparable store sales. We may not be able to increase our comparable store sales, improve our margins or reduce costs as a percentage of sales. Growth in profitability in that case would depend significantly on our ability to increase margins or reduce costs as a percentage of sales. Further, as we implement new initiatives to reduce the cost of operating our stores, sales and profitability may be negatively impacted.
Our ability to successfully open and operate new stores depends on many factors including, among others, our ability to:
| • | identify suitable store locations, including temporary lease space for our Halloween City locations, the availability of which is largely outside of our control; |
| • | negotiate and secure acceptable lease terms, desired tenant allowances and assurances from operators and developers that they can complete the project, which depend in part on the financial resources of the operators and developers; |
| • | obtain or maintain adequate capital resources on acceptable terms, including the availability of cash for rent outlays under new leases; |
| • | manufacture and source sufficient levels of inventory at acceptable costs; |
| • | hire, train and retain an expanded workforce of store managers and other store-level personnel, many of whom are in entry-level or part-time positions with historically high rates of turnover; |
| • | successfully integrate new stores into our existing control structure and operations, including information system integration; |
12
Table of Contents
| • | maintain adequate manufacturing and distribution facilities, information system and other operational system capabilities; |
| • | identify and satisfy the merchandise and other preferences of our customers in new geographic areas and markets; |
| • | gain brand recognition and acceptance in new markets; and |
| • | address competitive, merchandising, marketing, distribution and other challenges encountered in connection with expansion into new geographic areas and markets, including geographic restrictions on the opening of new stores based on certain agreements with our franchisees and other business partners. |
In addition, as the number of our stores increases along with our online sales, we may face risks associated with market saturation of our product offerings. To the extent our new store openings are in markets where we have existing stores, we may experience reduced net sales in existing stores in those markets. Finally, there can be no assurance that any newly opened stores will be received as well as, or achieve net sales or profitability levels comparable to those of, our existing stores in the time periods estimated by us, or at all. If our stores fail to achieve, or are unable to sustain, acceptable net sales and profitability levels, our business may be materially harmed and we may incur significant costs associated with closing those stores. Our failure to effectively address challenges such as these could adversely affect our ability to successfully open and operate new stores in a timely and cost-effective manner, and could have a material adverse effect on our business, results of operations and financial condition.
Unexpected or unfavorable consumer responses to our promotional or merchandising programs could materially adversely affect our business, results of operations, cash flows and financial performance.
Brand recognition, quality and price have a significant influence on consumers’ choices among competing products and brands. Advertising, promotion, merchandising and the cadence of new product introductions also have a significant impact on consumers’ buying decisions. If we misjudge consumer responses to our existing or future promotional activities, this could have a material adverse impact on our business, results of operations, cash flow and financial performance.
Our marketing programs, e-commerce initiatives and use of consumer information are governed by an evolving set of laws and enforcement trends and unfavorable changes in those laws or trends, or our failure to comply with existing or future laws, could substantially harm our business and results of operations.
We collect, maintain and use data provided to us through our online activities and other customer interactions in our business. Our current and future marketing programs depend on our ability to collect, maintain and use this information, and our ability to do so is subject to certain contractual restrictions in third-party contracts as well as evolving international, federal and state laws and enforcement trends. We strive to comply with all applicable laws and other legal obligations relating to privacy, data protection and consumer protection, including those relating to the use of data for marketing purposes. It is possible, however, that these requirements may be interpreted and applied in a manner that is inconsistent from one jurisdiction to another, may conflict with other rules or may conflict with our practices. If so, we may suffer damage to our reputation and be subject to proceedings or actions against us by governmental entities or others. Any such proceeding or action could hurt our reputation, force us to spend significant amounts to defend our practices, distract our management, increase our costs of doing business and result in monetary liability.
In addition, as data privacy and marketing laws change, we may incur additional costs to ensure we remain in compliance with such laws. If applicable data privacy and marketing laws become more restrictive at the federal or state level, our compliance costs may increase, our ability to effectively engage customers via personalized marketing may decrease, our investment in our e-commerce platform may not be fully realized, our opportunities for growth may be curtailed by our compliance capabilities or reputational harm and our potential liability for security breaches may increase.
13
Table of Contents
Because we rely heavily on our own manufacturing operations and those of our suppliers, disruptions at manufacturing facilities could adversely affect our business, results of operations, cash flows and financial performance.
Any significant disruption in manufacturing facilities, in the United States or abroad, for any reason, including regulatory requirements, unstable labor relations, the loss of certifications, power interruptions, fires, hurricanes, war or other forces of nature, could disrupt our supply of products, adversely affecting our business, results of operations, cash flows and financial performance. The occurrence of one or more natural disasters, or other disruptive geo-political events, could also result in increases in fuel (or other energy) prices or a fuel shortage, the temporary or permanent closure of one or more of manufacturing or distribution centers, the temporary lack of an adequate work force in a market, the temporary or long-term disruption in the supply of products from some local and overseas suppliers, the temporary disruption in the transport of goods from overseas or delays in the delivery of goods to our distribution centers or stores or to third parties who purchase from us. If one or more of these events occurred, our revenues and profitability would be reduced.
Disruption to the transportation system or increases in transportation costs may negatively affect our operating results.
We rely upon various means of transportation, including shipments by air, sea, rail and truck, to deliver products to our distribution centers from vendors and manufacturers and from other distribution centers to our stores, as well as for direct shipments from vendors to stores and sales to third-party customers. Independent third parties with whom we conduct business may employ personnel represented by labor unions. Labor stoppages, shortages or capacity constraints in the transportation industry, disruptions to the national and international transportation infrastructure, fuel shortages or transportation cost increases could adversely affect our business, results of operations, cash flows and financial performance.
Product recalls and/or product liability may adversely impact our business, merchandise offerings, reputation, results of operations, cash flow and financial performance.
We may be subject to product recalls if any of the products that we manufacture or sell are believed to cause injury or illness. In addition, as a retailer of products manufactured by third parties, we may also be liable for various product liability claims for products we do not manufacture. Indemnification provisions that we may enter into are typically limited by their terms and depend on the creditworthiness of the indemnifying party and its insurer and the absence of significant defenses. We may be unable to obtain full recovery from the insurer or any indemnifying third party in respect of any claims against us in connection with products manufactured by such third party. In addition, if our vendors fail to manufacture or import merchandise that adheres to our quality control standards or standards established by applicable law, our reputation and brands could be damaged, potentially leading to an increase in customer litigation against us. Furthermore, to the extent we are unable to replace any recalled products, we may have to reduce our merchandise offerings, resulting in a decrease in sales, especially if a recall occurs near or during a peak seasonal period. If our vendors are unable or unwilling to recall products failing to meet our quality standards, we may be required to recall those products at a substantial cost to us.
Our business is sensitive to consumer spending and general economic conditions, and other factors beyond our control, including adverse weather conditions or the outbreak of disease, and an economic slowdown could adversely affect our financial performance.
In general, our retail sales, and the retail sales of our business partners to whom we sell, represent discretionary spending by our customers and our business partners’ customers. Discretionary spending is affected by many factors, such as general business conditions, interest rates, availability of consumer credit, unemployment levels, taxation, weather, hurricanes, outbreaks of contagious diseases (such as the flu) and consumer confidence in future economic conditions. For example, Hurricanes Harvey and Irma had a negative impact on fiscal year 2017 brand comp sales, same-store sales and e-commerce sales. See “Item 7.
14
Table of Contents
Management’s Discussion and Analysis of Financial Condition and Results of Operations — Business Overview — Results of Operations — Retail” for more information on the impact of Hurricanes Harvey and Irma on operating results. Our customers’ purchases and our business partners’ customers’ purchases of discretionary items, including our products, often decline during periods when disposable income is lower or during periods of actual or perceived unfavorable economic conditions. If this occurs, our revenues and profitability will decline. In addition, economic downturns may make it difficult for us to accurately forecast future demand trends, which could cause us to purchase excess inventories, resulting in increases in our inventory carrying cost, or insufficient inventories, resulting in our inability to satisfy our customer demand and potential loss of market share.
Our business may be adversely affected by the loss or actions of our third-party vendors.
Our ability to find new qualified vendors who meet our standards and supply products in a timely and efficient manner can be a significant challenge, especially for goods sourced from outside the United States. Many of our vendors currently provide us with incentives such as volume purchasing allowances and trade discounts. If our vendors were to reduce or discontinue these incentives, costs would increase. Should we be unable to pass cost increases to consumers, our profitability would be reduced.
Our business and results of operations may be harmed if our suppliers or third-party manufacturers fail to follow acceptable labor practices or to comply with other applicable laws and guidelines.
Many of the products sold in our stores and on our websites are manufactured outside of the United States, which may increase the risk that the labor, manufacturing safety and other practices followed by the manufacturers of these products may differ from those generally accepted in the United States as well as those with which we are required to comply under many of our image or character licenses. Although we require each of our vendors to sign a purchase order and vendor agreement that requires adherence to accepted labor practices and compliance with labor, manufacturing safety and other laws and we test merchandise for product safety standards, we do not supervise, control or audit our vendors or the manufacturers that produce the merchandise we sell to our customers. The violation of labor, manufacturing safety or other laws by any of our vendors or manufacturers, or the divergence of the labor practices followed by any of our vendors or manufacturers from those generally accepted in the United States could interrupt or otherwise disrupt the shipment of finished products to us, damage our brand image, subject us to boycotts by our customers or activist groups or cause some of our licensors of popular images to terminate their licenses to us. Our future operations and performance will be subject to these factors, which are beyond our control and could materially hurt our business, financial condition and results of operations or require us to modify our current business practices or incur increased costs.
Changes in regulations or enforcement, or our failure to comply with existing or future regulations, may adversely impact our business.
We are subject to federal, state and local regulations with respect to our operations in the United States. Additionally, we are subject to regulations in the foreign countries in which we operate and such regulations are increasingly distinct from those in the United States. Further, we may be subject to greater international regulation as our business expands. There are a number of legislative and regulatory initiatives that could adversely impact our business if they are enacted or enforced. Those initiatives include increased/new tariffs on imported products, wage or workforce issues (such as minimum-wage requirements, overtime and other working conditions and citizenship requirements), collective bargaining matters, environmental regulation, price and promotion regulation, trade regulations and others.
Proposed changes in tax regulations may also change our effective tax rate as our business is subject to a combination of applicable tax rates in the various countries, states and other jurisdictions in which we operate. New accounting pronouncements and interpretations of existing accounting rules and practices have occurred and may occur in the future. A change in accounting standards or practices can have a significant effect on our reported results of operations. Failure to comply with legal requirements could result in, among other things,
15
Table of Contents
increased litigation risk that could affect us adversely by subjecting us to significant monetary damages and other remedies or by increasing our litigation expenses, administrative enforcement actions, fines and civil and criminal liability. If such issues become more expensive to address, or if new issues arise, they could increase our expenses, generate negative publicity, or otherwise adversely affect us.
Certain aspects of recent U.S. federal income tax reform could negatively affect us.
On December 22, 2017, the Tax Cuts and Jobs Act of 2017 (“the Act”) was signed into law. The Act should result in an overall benefit to us, because it will reduce our marginal U.S. federal income rate to 21%, effective January 1, 2018, and will generally allow us to immediately deduct 100% of the cost of tangible, depreciable property that we acquire after September 27, 2017 and place into service on or before December 31, 2022.
Certain aspects of the Act, however, could negatively affect us. For example, under the Act, we will generally not be able to deduct our business interest expense to the extent that it exceeds 30% of our EBITDA for our 2018 through 2021 tax years or 30% of our EBIT thereafter.
Additionally, under the Act, we will be required to pay a one-time transition tax on the previously untaxed deferred foreign earnings that our foreign subsidiaries have accrued since 1986 at a rate of 15.5% for cash and cash-equivalent profits and 8% on other reinvested foreign earnings (the “Transition Tax”). We may elect to pay this Transition Tax over eight annual installments without interest.
Further, under the Act, we will lose the domestic production activities deduction and we may be subject to a tax on global intangible low-taxed income.
Our international operations subject us to additional risks, which risks and costs may differ in each country in which we do business and may cause our profitability to decline.
We conduct our business in a number of foreign countries, including contracting with manufacturers and suppliers located outside of the United States, many of which are located in Asia. We have expanded our international operations through numerous acquisitions and we plan on continuing to expand them through additional acquisitions, investments in joint ventures and organic growth. Our operations and financial condition may be adversely affected if the markets in which we compete or source our products are affected by changes in political, economic or other factors. These factors, over which we have no control, may include:
| • | recessionary or expansive trends in international markets; |
| • | changes in foreign currency exchange rates, principally fluctuations in the British Pound Sterling, the Canadian Dollar, the Euro, the Malaysian Ringgit, the Mexican Peso and the Australian Dollar; |
| • | hyperinflation or deflation in the foreign countries in which we operate; |
| • | work stoppages or other employee rights issues; |
| • | the imposition of restrictions on currency conversion or the transfer of funds; |
| • | transportation delays and interruptions; |
| • | increases in the taxes we pay and other changes in applicable tax laws; |
| • | difficulty enforcing our intellectual property and competition against counterfeit goods; |
| • | legal and regulatory changes and the burdens and costs of our compliance with a variety of laws, including trade restrictions and tariffs; and |
| • | political and economic instability. |
16
Table of Contents
Our business may be adversely impacted by helium shortages.
Although not used in the actual manufacture of our products, helium gas is currently used to inflate the majority of our metallic balloons. We rely upon the exploration and refining of natural gas to ensure adequate supplies of helium as helium is a by-product of the natural gas production process. Helium shortages can adversely impact our financial performance.
We may face risks associated with litigation and claims.
From time to time, we may become involved in other legal proceedings relating to the conduct of our business, including but not limited to, employee-related and consumer matters. Additionally, as a retailer and manufacturer of decorated party goods, we have been and may continue to be subject to product liability claims if the use of our products, whether manufactured by us or third party manufacturers, is alleged to have resulted in injury or if our products include inadequate instructions or warnings. Such matters can be time-consuming, divert management’s attention and resources and cause us to incur significant expenses. Due to the uncertainties of litigation, we can give no assurance that we will prevail on all claims made against us in the lawsuits that we currently face or that additional claims will not be made against us in the future. Furthermore, because litigation is inherently uncertain, there can be no assurance that the results of any of these actions will not have a material adverse effect on our business, results of operations or financial condition.
We may require additional capital to fund our business, which may not be available to us on satisfactory terms or at all.
We currently rely on cash generated by operations and borrowings available under the credit facilities to meet our working capital needs. However, if we are unable to generate sufficient cash from operations or if borrowings available under the credit facilities are insufficient, we may be required to adopt one or more alternatives to raise cash, such as incurring additional indebtedness, selling our assets, seeking to raise additional equity capital or restructuring, which alternatives may not be available to us on satisfactory terms or at all. Any of the foregoing could have a material adverse effect on our business.
Our success depends, in large part, on our senior management team.
The success of our business depends, to a large extent, on the continued service of our senior management team. James M. Harrison, our Chief Executive Officer, has been with the Company for over 20 years. We may not be able to adequately mitigate the negative impact on our business and competitive position that the loss of his services and leadership could have, as we may not be able to find management personnel internally or externally with similar experience and industry knowledge to replace him on a timely basis. We may also experience similar risks with respect to other members of our senior management team. We do not maintain key life insurance on any of our senior officers.
Our supply of qualified personnel and our labor costs depend in part on factors outside of our control.
As our business expands, we believe that our future success will depend greatly on our continued ability to attract, motivate and retain qualified personnel who are able to successfully meet the needs of our business. Although we generally have been able to meet our staffing requirements in the past, our ability to meet our labor needs while controlling costs is subject to external factors, such as unemployment levels, labor market conditions, minimum wage legislation and changing demographics. Recently, various legislative movements have sought to increase the federal minimum wage in the United States, as well as the minimum wage in a number of individual states. As federal or state minimum wage rates increase, we may need to increase not only the wage rates of our minimum wage employees, but also the wages paid to our other hourly employees as well. Our inability to meet our staffing requirements in the future at costs that are favorable to us, or at all, could impair our ability to increase revenue, and our customers could experience lower levels of customer service.
17
Table of Contents
We are subject to risks associated with leasing substantial amounts of space.
We lease all of our company-owned stores, our corporate headquarters and most of our distribution facilities. Payments under our leases account for a significant portion of our operating expenses and we expect payment obligations under our leases to account for a significant portion of our future operating expenses. The majority of our store leases contain provisions for base rent and a small number of store leases contain provisions for base rent, plus percentage rent based on sales in excess of an agreed upon minimum annual sales level. Our continued growth and success depends in part on our ability to renew leases for successful stores and negotiate leases for new stores, including temporary leases for our Halloween City stores. There is no assurance that we will be able to negotiate leases at similar or favorable terms, and we may decide not to enter a market or be forced to exit a market if a favorable arrangement cannot be made. If an existing or future store is not profitable and we decide to close it, we may nonetheless be committed to perform our obligations under the applicable lease, including, among other things, paying the base rent for the balance of the lease term. Moreover, even if a lease has an early cancellation clause, we may not satisfy the contractual requirements for early cancellation under the lease.
Our business could be harmed if our existing franchisees do not conduct their business in accordance with agreed upon standards.
Our success depends, in part, upon the ability of our franchisees to operate their stores and promote and develop our store concept. Although our franchise agreements include certain operating standards, all franchisees operate independently and their employees are not our employees. We provide certain training and support to our franchisees, but the quality of franchise store operations may be diminished by any number of factors beyond our control. Consequently, franchisees may not successfully operate stores in a manner consistent with our standards and requirements, or may not hire and train qualified managers and other store personnel. If they do not, our image, brand and reputation could suffer.
Our information systems, order fulfillment and distribution facilities may prove inadequate or may be disrupted.
We depend on our management information systems for many aspects of our business. We will be materially adversely affected if our management information systems are disrupted or we are unable to improve, upgrade, maintain and expand our systems. In particular, we believe our perpetual inventory, automated replenishment and stock ledger systems are necessary to properly forecast, manage and analyze our inventory levels, margins and merchandise ordering quantities. We may fail to properly optimize the effectiveness of these systems, or to adequately support and maintain the systems. Moreover, we may not be successful in developing or acquiring technology that is competitive and responsive to our customers and might lack sufficient resources to make the necessary investments in technology needs and to compete with our competitors, which could have a material adverse impact on our business, results of operations, cash flows and financial performance.
In addition, we may not be able to prevent a significant interruption in the operation of our electronic order entry and information systems, e-commerce platforms or manufacturing and distribution facilities due to natural disasters, accidents, systems failures or other events. Any significant interruption in the operation of these facilities, including an interruption caused by our failure to successfully expand or upgrade our systems or manage our transition to utilizing the expansions or upgrades, could reduce our ability to receive and process orders and provide products and services to our stores, third-party stores, and other customers, which could result in lost sales, cancelled sales and a loss of loyalty to our brand.
We may fail to adequately maintain the security of our electronic and other confidential information.
We have become increasingly centralized and dependent upon automated information technology processes. In addition, a portion of our business operations is now conducted over the Internet. We could experience operational problems with our information systems and e-commerce platforms as a result of system failures,
18
Table of Contents
viruses, computer “hackers” or other causes. Any material disruption or slowdown of our systems could cause information, including data related to customer orders, to be lost or delayed, which could—especially if the disruption or slowdown occurred during a peak sales season—result in delays in the delivery of merchandise to our stores and customers or lost sales, which could reduce demand for our merchandise and cause our sales to decline.
In addition, in the ordinary course of our business, we collect and store certain personal information from individuals, such as our customers and suppliers, and we process customer payment card and check information, including via our e-commerce platforms. Computer hackers may attempt to penetrate our computer system and, if successful, misappropriate personal information, payment card or check information or confidential Company business information. In addition, a Company employee, contractor or other third party with whom we do business may attempt to circumvent our security measures in order to obtain such information and may purposefully or inadvertently cause a breach involving such information. Any failure to maintain the security of our customers’ confidential information, or data belonging to us or our suppliers, could put us at a competitive disadvantage, result in deterioration in our customers’ confidence in us, subject us to potential litigation and liability, and fines and penalties, resulting in a possible material adverse impact on our business, results of operations, cash flows and financial performance.
Historically we have made a number of acquisitions, and we may make more acquisitions in the future as part of our growth strategy. Future acquisitions or investments could disrupt our ongoing business, distract management and employees, increase our expenses and adversely affect our business. In addition, we may not be able to identify suitable acquisitions.
We have made a number of recent acquisitions which have contributed to our growth. Acquisitions require significant capital resources and can divert management’s attention from our existing business. Acquisitions also entail an inherent risk that we could become subject to contingent or other liabilities, including liabilities arising from events or conduct predating the acquisition, that were not known to us at the time of acquisition. We may also incur significantly greater expenditures in integrating an acquired business than we had anticipated at the time of the acquisition, which could impair our ability to achieve anticipated cost savings and synergies. Acquisitions may also have unanticipated tax and accounting ramifications. Furthermore, acquisitions might consume a significant portion of our senior management team’s time and efforts with issues unrelated to advancing our core business strategies and operation issues. Our failure to successfully identify and consummate acquisitions or to manage and integrate the acquisitions we make could have a material adverse effect on our business, financial condition or results of operations.
In addition, we may not be able to:
| • | identify suitable acquisition candidates; |
| • | consummate acquisitions on acceptable terms; |
| • | successfully integrate any acquired business into our operations or successfully manage the operations of any acquired business; or |
| • | retain an acquired company’s significant customer relationships, goodwill and key personnel or otherwise realize the intended benefits of an acquisition. |
In the event that the operations of an acquired business do not meet our performance expectations, we may have to restructure the acquired business or write-off the value of some or all of the assets of the acquired business.
Our intellectual property rights may be inadequate to protect our business.
We hold a variety of United States trademarks, service marks, patents, copyrights, and registrations and applications therefor, as well as a number of foreign counterparts thereto and/or independent foreign intellectual
19
Table of Contents
property asset registrations. In some cases, we rely solely on unregistered common law trademark rights and unregistered copyrights under applicable United States law to distinguish and/or protect our products, services and branding from the products, services and branding of our competitors. We cannot assure you that no one will challenge our intellectual property rights in the future. In the event that our intellectual property rights are successfully challenged by a third party, we could be forced to re-brand, re-design or discontinue the sale of certain of our products or services, which could result in loss of brand recognition and/or sales and could require us to devote resources to advertising and marketing new branding or re-designing our products. Further, we cannot assure you that competitors will not infringe our intellectual property rights, or that we will have adequate resources to enforce these rights. We also permit our franchisees to use a number of our trademarks and service marks, including Party City, The Discount Party Super Store, Nobody Has More Party for Less, Party America and Halloween City. Our failure to properly control our franchisees’ use of such trademarks could adversely affect our ability to enforce them against third parties. A loss of any of our material intellectual property rights could have a material adverse effect on our business, financial condition and results of operations.
We license from many third parties and do not own the intellectual property rights necessary to sell products capturing many popular images, such as cartoon or motion picture characters. While none of these licenses is individually material to our aggregate business, a large portion of our business depends on the continued ability to license the intellectual property rights to these images in the aggregate. Any injury to our reputation or our inability to comply with, in many cases, stringent licensing guidelines in these agreements may adversely affect our ability to maintain these relationships. A termination of any of our significant intellectual property licenses, or any other similarly material limitation on our ability to use certain licensed material may prevent us from manufacturing and distributing certain licensed products and could cause our customers to purchase these products from our competitors. In addition, we may be unable to renew some of our significant intellectual property licenses on terms favorable to us or at all. A large aggregate loss of our right to use intellectual property under our license agreements could have a material adverse effect on our business, financial condition and results of operations.
We also face the risk of claims that we have infringed third parties’ intellectual property rights, which could be expensive and time consuming to defend, cause us to cease using certain intellectual property rights, redesign certain products or packaging or cease selling certain products or services, result in our being required to pay significant damages or require us to enter into costly royalty or licensing agreements in order to obtain the rights to use third parties’ intellectual property rights, which royalty or licensing agreements may not be available at all, any of which could have a negative impact on our operating profits and harm our future prospects.
Our substantial indebtedness and lease obligations could adversely affect our financial flexibility and our competitive position.
As of December 31, 2017, we had total indebtedness of $1,831.4 million, net of deferred financing costs, capitalized call premiums and original issue discounts. Additionally, we had $172.0 million of borrowing capacity available under our asset-based revolving credit facility (“ABL Facility”, collectively with our senior secured term loan facility, the “Senior Credit Facilities”).
As of December 31, 2017, we had outstanding approximately $1,480.5 million in aggregate principal amount of indebtedness under the Senior Credit Facilities, net of deferred financing costs, capitalized call premiums and original issue discounts. Such indebtedness bears interest at a floating rate.
We also have, and will continue to have, significant lease obligations. As of December 31, 2017, our minimum aggregate rental obligation under operating leases for fiscal 2018 through 2022 totaled $742.6 million.
20
Table of Contents
Our substantial level of indebtedness will increase the possibility that we may be unable to generate cash sufficient to pay, when due, the principal of, interest on or other amounts due in respect of our indebtedness. For example, it could:
| • | make it more difficult for us to satisfy our obligations with respect to our indebtedness and any failure to comply with the obligations under any of our debt instruments, including restrictive covenants, could result in an event of default under the agreements governing such other indebtedness; |
| • | require us to dedicate a substantial portion of our cash flow from operations to payments on our indebtedness, thereby reducing funds available for working capital, capital expenditures, acquisitions, selling and marketing efforts, product development and other purposes; |
| • | increase our vulnerability to adverse economic and industry conditions, which could place us at a competitive disadvantage compared to our competitors that have relatively less indebtedness; |
| • | limit our flexibility in planning for, or reacting to, changes in our business and the industries in which we operate; |
| • | expose us to the risk of increasing rates as certain of our borrowings, including under the Senior Credit Facilities, will be at variable interest rates; |
| • | restrict us from making strategic acquisitions or cause us to make non-strategic divestitures; and |
| • | limit our ability to borrow additional funds, or to dispose of assets to raise funds, if needed, for working capital, capital expenditures, acquisitions, product development and other corporate purposes. |
The occurrence of any one of these events could have an adverse effect on our business, financial condition, results of operations, prospects and ability to satisfy our obligations under our indebtedness.
Restrictions under our existing and future indebtedness may prevent us from taking actions that we believe would be in the best interest of our business.
The agreements governing our existing indebtedness contain and the agreements governing our future indebtedness will likely contain customary restrictions on us or our subsidiaries, including covenants that, among other things and subject to certain exceptions, restrict us or our subsidiaries, as the case may be, from:
| • | incurring additional indebtedness or issuing disqualified stock; |
| • | paying dividends or distributions on, redeeming, repurchasing or retiring our capital stock; |
| • | making payments on, or redeeming, repurchasing or retiring indebtedness; |
| • | making investments, loans, advances or acquisitions; |
| • | entering into sale and leaseback transactions; |
| • | engaging in transactions with affiliates; |
| • | creating liens; |
| • | transferring or selling assets; |
| • | guaranteeing indebtedness; |
| • | creating restrictions on the payment of dividends or other amounts to us from our subsidiaries; and |
| • | consolidating, merging or transferring all or substantially all of our assets and the assets of our subsidiaries. |
In addition, the ABL Facility requires us to comply, under specific circumstances, including certain types of acquisitions, with a minimum fixed charge coverage ratio (as defined therein) covenant of 1.00 to 1.00. Our ability to comply with this covenant can be affected by events beyond our control, and we may not be able to
21
Table of Contents
satisfy them. A breach of this covenant would be an event of default. If an event of a default occurs under the ABL Facility, the ABL Facility lenders could elect to declare all amounts outstanding under the ABL Facility to be immediately due and payable or terminate their commitments to lend additional money, which would also lead to a cross-default and cross-acceleration of amounts owed under the senior secured term loan facility (“the Term Loan Credit Agreement”) and would lead to an event of default under our $350.0 million senior notes if any of the Senior Credit Facilities were accelerated. If the indebtedness under the Senior Credit Facilities or our other indebtedness were to be accelerated, our assets may not be sufficient to repay such indebtedness in full. We have pledged a significant portion of our assets as collateral under the Senior Credit Facilities.
We may not be able to generate sufficient cash to service all of our indebtedness and may be forced to take other actions to satisfy our obligations under our indebtedness, which may not be successful.
Our ability to make scheduled payments on or to refinance our debt obligations depends on our financial condition and operating performance, which is subject to prevailing economic and competitive conditions and to certain financial, business and other factors beyond our control. We may not be able to maintain a level of cash flows from operating activities sufficient to permit us to pay the principal, premium, if any, and interest on our indebtedness.
If our cash flows and capital resources are insufficient to fund our debt service obligations, we may be forced to reduce or delay investments and capital expenditures, or to sell assets, seek additional capital or restructure or refinance our indebtedness. Our ability to restructure or refinance our debt will depend on the condition of the capital markets and our financial condition at such time. Any refinancing of our debt could be at higher interest rates and may require us to comply with more onerous covenants, which could further restrict our business operations. The terms of existing or future debt instruments may restrict us from adopting some of these alternatives. In addition, any failure to make payments of interest and principal on our outstanding indebtedness on a timely basis would likely result in a reduction of our credit rating, which could harm our ability to incur additional indebtedness. In the absence of such operating results and resources, we could face substantial liquidity problems and might be required to dispose of material assets or operations to meet our debt service and other obligations. The Senior Credit Facilities and the indentures governing the senior notes restrict our ability to dispose of assets and use the proceeds from the disposition. We may not be able to consummate those dispositions or obtain the proceeds that we could realize from them and the proceeds may not be adequate to meet any debt service obligations then due. These alternative measures may not be successful and may not permit us to meet our scheduled debt service obligations.
Our ability to repay our debt is affected by the cash flow generated by our subsidiaries.
Our subsidiaries own substantially all of our assets and conduct substantially all of our operations. Accordingly, repayment of our indebtedness will be dependent on the generation of cash flow by our subsidiaries and their ability to make such cash available to us, by dividend, debt repayment or otherwise. Our subsidiaries may not be able to, or may not be permitted to, make distributions to enable us to make payments in respect of our indebtedness. Each subsidiary is a distinct legal entity and, under certain circumstances, legal and contractual restrictions may limit our ability to obtain cash from our subsidiaries. While the indentures governing the senior notes limit the ability of our subsidiaries to incur consensual restrictions on their ability to pay dividends or make other intercompany payments to us, these limitations are subject to certain qualifications and exceptions.
In addition, under certain circumstances, legal restrictions may limit our ability to obtain cash from our subsidiaries. Under the Delaware General Corporation Law (the “DGCL”), our subsidiaries organized in the State of Delaware may only make dividends (i) out of their “surplus” as defined in the DGCL or (ii) if there is no such surplus, out of their net profits for the fiscal year in which the dividend is declared and/or the preceding fiscal year. Under fraudulent transfer laws, certain of our subsidiaries may not pay dividends if the relevant entity is insolvent or is rendered insolvent thereby. The measures of insolvency for purposes of these fraudulent transfer laws vary depending upon the law applied in any proceeding to determine whether a fraudulent transfer has occurred. Generally, however, an entity would be considered insolvent if:
22
Table of Contents
| • | the sum of its debts, including contingent liabilities, was greater than the fair saleable value of all of its assets; |
| • | the present fair saleable value of its assets was less than the amount that would be required to pay its probable liability on its existing debts, including contingent liabilities, as they become absolute and mature; or |
| • | it could not pay its debts as they became due. |
While we believe that we and our relevant subsidiaries currently have surplus and are not insolvent, there can otherwise be no assurance that we and these subsidiaries will not become insolvent or will be permitted to make dividends in the future in compliance with these restrictions in amounts needed to service our indebtedness.
Significant interest rate changes could affect our profitability and financial performance.
Our earnings are affected by changes in interest rates as a result of our variable rate indebtedness under the ABL Facility and the Term Loan Credit Agreement. The interest rate swap agreements that we use to manage the risk associated with fluctuations in interest rates may not be able to fully eliminate our exposure to these changes.
Investment funds affiliated with Thomas H. Lee Partners, L.P. (“THL”) will have the ability to control the outcome of matters submitted for stockholder approval and may have interests that differ from those of our other stockholders.
Investment funds affiliated with THL beneficially own approximately 60% of our capital stock in the aggregate. As a result, THL has significant influence over corporate transactions. So long as investment funds associated with or designated by THL continue to own a significant amount of the outstanding shares of our common stock, even if such amount is less than 50%, THL will continue to be able to strongly influence or effectively control our decisions, regardless of whether or not other stockholders believe that the transaction is in their own best interests. Such concentration of voting power could also have the effect of delaying, deterring or preventing a change of control or other business combination that might otherwise be beneficial to our stockholders.
Maintaining and improving our financial controls and the requirements of being a public company may strain our resources, divert management’s attention and affect our ability to attract and retain qualified board members.
As a public company, we are subject to the reporting and other requirements of the Exchange Act, the Sarbanes-Oxley Act of 2002 (the “Sarbanes-Oxley Act”), the Dodd-Frank Wall Street Reform and Consumer Protection Act of 2010 and the New York Stock Exchange (the “NYSE”) rules. The requirements of these rules and regulations have increased and will continue to significantly increase our legal and financial compliance costs, including costs associated with the hiring of additional personnel, making some activities more difficult, time-consuming or costly, and may also place undue strain on our personnel, systems and resources. The Exchange Act requires, among other things, that we file annual, quarterly and current reports with respect to our business and financial condition.
The Sarbanes-Oxley Act requires, among other things, that we maintain disclosure controls and procedures and internal control over financial reporting. Ensuring that we have adequate internal financial and accounting controls and procedures in place is a costly and time-consuming effort that needs to be re-evaluated frequently. We test our internal controls in order to comply with the requirements of Section 404 of the Sarbanes-Oxley Act (“Section 404”). Section 404 requires that we evaluate our internal control over financial reporting to enable management to report on, and our independent auditors to audit, the effectiveness of those controls. Both we and our independent registered public accounting firm test our internal controls in connection with the Section 404 requirements and could, as part of that testing, identify material weaknesses, significant deficiencies or other areas for further attention or improvement.
23
Table of Contents
Implementing any appropriate changes to our internal controls may require specific compliance training for our directors, officers and employees, require the hiring of additional finance, accounting and other personnel, entail substantial costs to modify our existing accounting systems, and take a significant period of time to complete. These changes may not, however, be effective in maintaining the adequacy of our internal controls, and any failure to maintain that adequacy, or consequent inability to produce accurate financial statements on a timely basis, could increase our operating costs and could materially impair our ability to operate our business. Moreover, adequate internal controls are necessary for us to produce reliable financial reports and are important to help prevent fraud. As a result, our failure to satisfy the requirements of Section 404 on a timely basis could result in the loss of investor confidence in the reliability of our financial statements, which in turn could cause the market value of our common stock to decline.
Various rules and regulations applicable to public companies make it more difficult and more expensive for us to maintain directors’ and officers’ liability insurance, and we may be required to accept reduced coverage or incur substantially higher costs to maintain coverage. If we are unable to maintain adequate directors’ and officers’ liability insurance, our ability to recruit and retain qualified officers and directors, especially those directors who may be deemed independent for purposes of the NYSE rules, will be significantly curtailed.
The market price of our common stock could decline due to the large number of outstanding shares of our common stock eligible for future sale.
Sales of substantial amounts of our common stock in the public market in future offerings, or the perception that these sales could occur, could cause the market price of our common stock to decline. These sales could also make it more difficult for us to sell equity or equity-related securities in the future, at a time and price that we deem appropriate. In addition, the additional sale of our common stock by our officers, directors or THL in the public market, or the perception that these sales may occur, could cause the market price of our common stock to decline.
We may issue shares of our common stock or other securities from time to time as consideration for, or to finance, future acquisitions and investments or for other capital needs. We cannot predict the size of future issuances of our shares or the effect, if any, that future sales and issuances of shares would have on the market price of our common stock. If any such acquisition or investment is significant, the number of shares of common stock or the number or aggregate principal amount, as the case may be, of other securities that we may issue may in turn be substantial and may result in additional dilution to our stockholders. We may also grant registration rights covering shares of our common stock or other securities that we may issue in connection with any such acquisitions and investments.
To the extent that any of us, our executive officers, directors or THL sell, or indicate an intent to sell, substantial amounts of our common stock in the public market, the trading price of our common stock could decline significantly.
Anti-takeover provisions in our charter documents and Delaware law might discourage, delay or prevent a change in control of our company.
Our amended and restated certificate of incorporation or bylaws contain provisions that may make the acquisition of our company more difficult without the approval of our board of directors. These provisions include:
| • | the division of our board of directors into three classes and the election of each class for three-year terms; |
| • | certain rights of THL with respect to the designation of directors for nomination and election to our board of directors; |
| • | advance notice requirements for stockholder proposals and director nominations; |
24
Table of Contents
| • | the sole ability of the board of directors to fill a vacancy created by the expansion of the board of directors; |
| • | the required approval of holders of at least 75% of our outstanding shares of capital stock entitled to vote generally at an election of the directors to remove directors only for cause once THL ceases to own at least 50% of our outstanding common stock; |
| • | the required approval of holders of at least 66 2⁄3% of our outstanding shares of capital stock entitled to vote at an election of directors to adopt, amend or repeal our bylaws, or amend or repeal certain provisions of our amended and restated certificate of incorporation once THL ceases to own at least 50% of our outstanding common stock; |
| • | limitations on the ability of stockholders to call special meetings and, when THL ceases to own 50% of our outstanding common stock, to take action by written consent; and |
| • | provisions that reproduce much of the provisions that limit the ability of “interested stockholders” (other than THL and certain of its transferees) from engaging in specified business combinations with us absent prior approval of the board of directors or holders of 66 2⁄3% of our voting stock. |
The existence of the foregoing provisions and anti-takeover measures could limit the price that investors might be willing to pay in the future for shares of our common stock. They could also deter potential acquirers of our company, thereby reducing the likelihood that you could receive a premium for your common stock in the acquisition.
Our amended and restated certificate of incorporation designates courts in the State of Delaware as the sole and exclusive forum for certain types of actions and proceedings that may be initiated by our stockholders, which could limit our stockholders’ ability to obtain a favorable judicial forum for disputes with us or our directors, officers or employees.
Our amended and restated certificate of incorporation provides that, subject to limited exceptions, the Court of Chancery of the State of Delaware will be the sole and exclusive forum for (i) any derivative action or proceeding brought on our behalf, (ii) any action asserting a claim of breach of a fiduciary duty owed by any of our directors, officers or other employees to us or our stockholders, (iii) any action asserting a claim against us arising pursuant to any provision of the DGCL, our amended and restated certificate of incorporation or our amended and restated bylaws or (iv) any other action asserting a claim against us that is governed by the internal affairs doctrine (each, a “Covered Proceeding”). In addition, our amended and restated certificate of incorporation provides that if any action the subject matter of which is a Covered Proceeding is filed in a court other than the specified Delaware courts without the approval of our board of directors (each, a “Foreign Action”), the claiming party will be deemed to have consented to (i) the personal jurisdiction of the specified Delaware courts in connection with any action brought in any such courts to enforce the exclusive forum provision described above and (ii) having service of process made upon such claiming party in any such enforcement action by service upon such claiming party’s counsel in the Foreign Action as agent for such claiming party. Any person or entity purchasing or otherwise acquiring any interest in shares of our capital stock shall be deemed to have notice of and to have consented to these provisions. These provisions may limit a stockholder’s ability to bring a claim in a judicial forum that it finds favorable for disputes with us or our directors, officers or other employees, which may discourage such lawsuits against us and our directors, officers and employees. Alternatively, if a court were to find these provisions of our amended and restated certificate of incorporation inapplicable to, or unenforceable in respect of, one or more of the specified types of actions or proceedings, we may incur additional costs associated with resolving such matters in other jurisdictions, which could adversely affect our business and financial condition.
Because we have no current plans to pay cash dividends on our common stock for the foreseeable future, you may not receive any return on investment unless you sell your common stock for a price greater than you paid.
We plan to retain future earnings, if any, for future operation, expansion and debt repayment and have no current plans to pay any cash dividends for the foreseeable future. Any decision to declare and pay dividends in
25
Table of Contents
the future will be made at the discretion of our board of directors and will depend on, among other things, our results of operations, financial condition, cash requirements, contractual restrictions and other factors that our board of directors may deem relevant. In addition, our ability to pay dividends may be limited by covenants of any existing and future outstanding indebtedness we or our subsidiaries incur. As a result, you may not receive any return on an investment in our common stock unless you sell our common stock for a price greater than you paid.
| Item 1B. | Unresolved Staff Comments |
Not applicable.
| Item 2. | Properties |
The Company maintains the following facilities for its corporate and retail headquarters and to conduct its principal design, manufacturing and distribution operations:
| Location |
Principal Activity |
Square Feet | Owned or Leased (With Expiration Date) | |||
| Elmsford, New York |
Executive and other corporate offices, showrooms, design and art production for party products | 146,346 square feet | Leased (1) | |||
| Rockaway, New Jersey |
Retail corporate offices | 106,000 square feet | Leased (expiration date: July 31, 2022) | |||
| Antananarivo, Madagascar |
Manufacture of costumes | 41,000 square feet | Leased (expiration date: December 31, 2023) | |||
| Dallas, Texas |
Manufacture/personalization of cups and napkins | 54,413 square feet | Leased (expiration date: January 31, 2019) | |||
| East Providence, Rhode Island |
Manufacture and distribution of plastic plates, cups and bowls | 229,231 square feet (2) | Leased (expiration date: April 27, 2026) | |||
| Eden Prairie, Minnesota |
Manufacture of metallic balloons and accessories | 115,600 square feet | Owned | |||
| Eden Prairie, Minnesota |
Manufacture of retail, trade show and showroom fixtures | 57,873 square feet | Leased (expiration date: October 31, 2020) | |||
| Los Lunas, New Mexico |
Manufacture of injection molded plastics | 85,055 square feet | Owned | |||
| Louisville, Kentucky |
Manufacture and distribution of paper plates | 213,958 square feet | Leased (expiration date: March 31, 2025) | |||
| Melaka, Malaysia |
Manufacture and distribution of latex balloons | 100,000 square feet | Leased (expiration date: May 30, 2072) | |||
| Monterrey, Mexico |
Manufacture and distribution of party products | 355,500 square feet | Leased (expiration date: March 3, 2027) | |||
| Newburgh, New York |
Manufacture of paper napkins and cups | 248,000 square feet | Leased (expiration date: July 31, 2027) |
26
Table of Contents
| Location |
Principal Activity |
Square Feet | Owned or Leased (With Expiration Date) | |||
| Tijuana, Mexico |
Manufacture and distribution of party products | 135,000 square feet | Leased (3) | |||
| Brooklyn, New York |
Distribution of balloons | 68,700 square feet | Leased (expiration date: March 31, 2019) | |||
| Chester, New York |
Distribution of party products | 896,000 square feet | Owned | |||
| Edina, Minnesota |
Distribution of metallic balloons and accessories | 122,312 square feet | Leased (expiration date: March 31, 2021) | |||
| Kirchheim unter Teck, Germany |
Distribution of party goods | 215,000 square feet | Owned | |||
| Milton Keynes, Buckinghamshire, England |
Distribution of party products throughout Europe | 130,858 square feet | Leased (expiration date: December 31, 2022) | |||
| Naperville, Illinois |
Distribution of party goods for e-commerce sales | 440,343 square feet | Leased (expiration date: December 31, 2033) |
| (1) | Property is comprised of two buildings with various lease expiration dates through December 31, 2027. |
| (2) | This figure represents an industrial park, which includes a 48,455 square foot office and warehouse. |
| (3) | Property is comprised of two buildings with various lease expiration dates through March 31, 2022. |
In addition to the facilities listed above, we maintain smaller distribution facilities in Mexico, Australia and the United Kingdom, small manufacturing facilities in Madagascar, small administrative offices in California, Australia, Canada and the United Kingdom, and sourcing offices in China, Hong Kong, Indonesia, Vietnam and India. We also maintain warehouses in Michigan and New York, a sales office in Japan and showrooms in New York, Canada and the United Kingdom.
As of December 31, 2017, Company-owned and franchised permanent stores were located in the following states and Puerto Rico:
| State |
Company-owned | Franchise | Chain-wide | |||||||||
| Alabama |
9 | 0 | 9 | |||||||||
| Arizona |
16 | 0 | 16 | |||||||||
| Arkansas |
0 | 3 | 3 | |||||||||
| California |
107 | 15 | 122 | |||||||||
| Colorado |
15 | 0 | 15 | |||||||||
| Connecticut |
16 | 0 | 16 | |||||||||
| Delaware |
1 | 1 | 2 | |||||||||
| Florida |
65 | 8 | 73 | |||||||||
| Georgia |
30 | 1 | 31 | |||||||||
| Hawaii |
0 | 2 | 2 | |||||||||
| Illinois |
49 | 0 | 49 | |||||||||
| Indiana |
21 | 0 | 21 | |||||||||
| Iowa |
9 | 0 | 9 | |||||||||
| Kansas |
6 | 0 | 6 | |||||||||
| Kentucky |
9 | 0 | 9 | |||||||||
| Louisiana |
12 | 0 | 12 | |||||||||
| Maine |
3 | 0 | 3 | |||||||||
| Maryland |
12 | 12 | 24 | |||||||||
| Massachusetts |
25 | 0 | 25 | |||||||||
27
Table of Contents
| State |
Company-owned | Franchise | Chain-wide | |||||||||
| Michigan |
28 | 0 | 28 | |||||||||
| Minnesota |
0 | 16 | 16 | |||||||||
| Mississippi |
1 | 2 | 3 | |||||||||
| Missouri |
18 | 1 | 19 | |||||||||
| Montana |
0 | 1 | 1 | |||||||||
| Nebraska |
4 | 0 | 4 | |||||||||
| Nevada |
6 | 0 | 6 | |||||||||
| New Hampshire |
7 | 0 | 7 | |||||||||
| New Jersey |
27 | 2 | 29 | |||||||||
| New Mexico |
3 | 0 | 3 | |||||||||
| New York |
53 | 12 | 65 | |||||||||
| North Carolina |
13 | 5 | 18 | |||||||||
| North Dakota |
0 | 3 | 3 | |||||||||
| Ohio |
30 | 0 | 30 | |||||||||
| Oklahoma |
9 | 0 | 9 | |||||||||
| Oregon |
1 | 2 | 3 | |||||||||
| Pennsylvania |
14 | 17 | 31 | |||||||||
| Puerto Rico |
0 | 5 | 5 | |||||||||
| Rhode Island |
3 | 0 | 3 | |||||||||
| South Carolina |
9 | 1 | 10 | |||||||||
| Tennessee |
9 | 7 | 16 | |||||||||
| Texas |
57 | 17 | 74 | |||||||||
| Vermont |
1 | 0 | 1 | |||||||||
| Virginia |
15 | 8 | 23 | |||||||||
| Washington |
18 | 1 | 19 | |||||||||
| West Virginia |
4 | 0 | 4 | |||||||||
| Wisconsin |
12 | 0 | 12 | |||||||||
|
|
|
|
|
|
|
|||||||
| Total |
747 | 142 | 889 | |||||||||
|
|
|
|
|
|
|
|||||||
Additionally, at December 31, 2017, there were 56 company-owned stores in Canada (including four opened during fiscal year 2017) and six franchise stores in Mexico.
In 2017, we operated 272 temporary stores, under the Halloween City banner, in the U.S. and Canada. Under this program, we operate stores under short-term leases with terms of approximately four months (to cover the early September through late October Halloween selling season).
We lease the property for all of our company-operated stores, which generally range in size from 10,000 square feet to 15,000 square feet. We do not believe that any individual store property is material to our financial condition or results of operations. Of the leases for the company-owned stores at December 31, 2017, 71 expire in 2018, 100 expire in 2019, 65 expire in 2020, 75 expire in 2021, 72 expire in 2022 and the balance expire in 2023 or thereafter. We have options to extend many of these leases for a minimum of five years.
We believe that our properties have been adequately maintained, are in generally good condition and are suitable for our business as presently conducted. We believe our existing manufacturing facilities provide sufficient production capacity for our present needs and for our anticipated needs in the foreseeable future. To the extent such capacity is not needed for the manufacture of our products, we generally use such capacity for the manufacture of products for others pursuant to terminable agreements. All manufacturing and distribution facilities generally are used on a basis of two shifts per day. We also believe that, upon the expiration of our current leases, we will be able either to secure renewal terms or to enter into leases for alternative locations at market terms.
28
Table of Contents
| Item 3. | Legal Proceedings |
From time to time, we are subject to various legal proceedings and claims that arise in the ordinary course of our business activities. We do not believe we are currently party to any pending legal action, the outcome of which, if determined adversely to us, would individually or in the aggregate be reasonably expected to have a material adverse effect on our business or operating results.
| Item 4. | Mine Safety Disclosures |
Not applicable.
29
Table of Contents
| Item 5. | Market for Registrant’s Common Equity and Related Stockholder Matters and Issuer Purchases of Equity Securities |
The Company’s common stock is listed on the NYSE under the symbol “PRTY”. The following table sets forth, for the quarterly periods indicated, the high and low market prices per share of the Company’s common stock, as reported on the NYSE.
| High | Low | |||||||
| Quarter ended March 31, 2017 |
15.95 | 12.75 | ||||||
| Quarter ended June 30, 2017 |
17.05 | 13.35 | ||||||
| Quarter ended September 30, 2017 |
16.90 | 13.40 | ||||||
| Quarter ended December 31, 2017 |
14.23 | 9.50 | ||||||
| High | Low | |||||||
| Quarter ended March 31, 2016 |
15.11 | 7.53 | ||||||
| Quarter ended June 30, 2016 |
15.34 | 12.05 | ||||||
| Quarter ended September 30, 2016 |
19.10 | 13.57 | ||||||
| Quarter ended December 31, 2016 |
17.85 | 14.15 | ||||||
As of the close of business on February 15, 2018, there were fifty one holders of record of the Company’s common stock, which does not reflect those shares held beneficially or those shares held in “street” name. Accordingly, the number of beneficial owners of our common stock exceeds this number.
Dividend Policy
No dividends were paid to stockholders during fiscal years 2016 or 2017. The Company currently intends to retain all of its future earnings, if any, to finance operations, development and growth of its business and repay indebtedness. Most of the Company’s indebtedness contains restrictions on the Company’s activities, including paying dividends on its capital stock and restricting dividends or other payments to the Company. See Note 8, Long-Term Obligations, of Item 8, “Financial Statements and Supplementary Data,” in this Annual Report on Form 10-K for further discussion. Any future determination relating to our dividend policy will be made at the discretion of the Company’s board of directors and will depend on a number of factors, including future earnings, capital requirements, financial conditions, future prospects, contractual restrictions and covenants and other factors that the board of directors may deem relevant.
Securities Authorized for Issuance Under Equity Compensation Plans
| (a) | (b) | (c) | ||||||||||
| Plan Category |
Number of securities to be issued upon exercise of outstanding options, warrants, and rights |
Weighted-average exercise price of outstanding options, warrants and rights |
Number of securities remaining available for future issuance under equity compensation plans (excluding securities reflected in column (a)) |
|||||||||
| Equity compensation plans approved by security holders |
8,024,761 | $ | 8.89 | 6,581,624 | ||||||||
| Equity compensation plans not approved by security holders |
596,000 | 15.60 | 254,000 | |||||||||
|
|
|
|
|
|
|
|||||||
| Total |
8,620,761 | $ | 9.35 | 6,835,624 | ||||||||
30
Table of Contents
Stock Performance Graph
The line graph below compares the cumulative total stockholder return on the Company’s common stock with the S&P 500 Index and the Dow Jones U.S. Specialty Retailers Index for the period from the completion of our initial public offering on April 16, 2015 through December 31, 2017. The graph assumes an investment of $100 made at the closing of trading on April 16, 2015 in (i) the Company’s common stock, (ii) the stocks comprising the S&P 500 Index and (iii) the stocks comprising the Dow Jones U.S. Specialty Retailers Index. All values assume reinvestment of the full amount of all dividends, if any, into additional shares of the same class of equity securities at the frequency with which dividends were paid on such securities during the applicable time period. The stock price performance included in the line graph below is not necessarily indicative of future stock price performance. The stock performance graph shall not be deemed “soliciting material” or to be “filed” with the SEC, nor shall such information be incorporated by reference into any future filing by us under the Securities Act or the Exchange Act, except to the extent that we specifically incorporate the graph by reference in such filing.
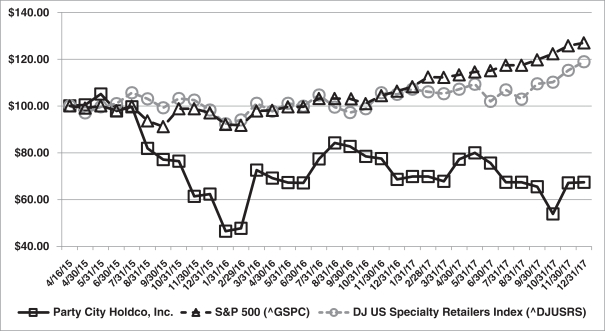
Common Stock Repurchases
The following table contains information for common stock repurchased during the fourth quarter of 2017:
| Period |
Total Number of Shares Purchased(1) |
Average Price Paid Per Share |
Total Number of Shares Purchased as Part of Publicly Announced Plans or Programs(2) |
Approximate Dollar Value of Shares That May Yet Be Purchased Under the Plans or Programs |
||||||||||||
| October 1 to October 31 |
— | — | — | $ | 100,000,000 | |||||||||||
| November 1 to November 30 |
336,633 | $ | 12.53 | 336,633 | 95,781,989 | |||||||||||
| December 1 to December 31 |
23,042,934 | $ | 12.26 | 3,201,240 | 55,336,095 | |||||||||||
|
|
|
|
|
|
|
|
|
|||||||||
| Total |
23,379,567 | 3,537,873 | ||||||||||||||
| (1) | Represents shares repurchased in open market transactions pursuant to the Share Repurchase Program (as defined below) and the repurchase of 19,841,694 shares in a privately negotiated transaction from Advent International Corporation in December 2017 (the “Advent Share Repurchase”). |
31
Table of Contents
| (2) | Other than the Advent Share Repurchase, all other shares repurchases were made pursuant to a share repurchase program (the “Share Repurchase Program”) authorized by our board of directors. This program was announced on November 9, 2017 and allows for the purchase of up to $100 million of outstanding share of our common stock in privately negotiated transactions or in the open market, or otherwise. |
| Item 6. | Selected Consolidated Financial Data |
The following table sets forth selected historical consolidated financial data for the periods and as of the dates indicated below. Our selected historical consolidated financial data as of December 31, 2016 and December 31, 2017 and for the years ended December 31, 2015, December 31, 2016 and December 31, 2017 presented in this table has been derived from our historical audited consolidated financial statements included elsewhere in this Annual Report on Form 10-K. Our selected historical consolidated financial data for the years ended December 31, 2013 and December 31, 2014 were derived from our audited consolidated financial statements that are not included in this Annual Report on Form 10-K.
32
Table of Contents
The historical results presented below are not necessarily indicative of the results to be expected for any future period. The following information should be read in conjunction with Item 7, “Management’s Discussion and Analysis of Financial Condition and Results of Operations,” and our financial statements and the notes thereto contained in Item 8, “Financial Statements and Supplementary Data,” of this Annual Report on Form 10-K.
| Fiscal Year Ended December 31, 2013 (1) |
Fiscal Year Ended December 31, 2014 (2) |
Fiscal Year Ended December 31, 2015 (3) |
Fiscal Year Ended December 31, 2016 (4) |
Fiscal Year Ended December 31, 2017 (5) |
||||||||||||||||
| Income Statement Data: |
||||||||||||||||||||
| Revenues: |
||||||||||||||||||||
| Net sales |
$ | 2,026,272 | $ | 2,251,589 | $ | 2,275,122 | $ | 2,266,386 | $ | 2,357,986 | ||||||||||
| Royalties and franchise fees |
18,841 | 19,668 | 19,411 | 17,005 | 13,583 | |||||||||||||||
|
|
|
|
|
|
|
|
|
|
|
|||||||||||
| Total revenues |
2,045,113 | 2,271,257 | 2,294,533 | 2,283,391 | 2,371,569 | |||||||||||||||
| Expenses: |
||||||||||||||||||||
| Cost of sales (6) |
1,259,188 | 1,375,706 | 1,370,884 | 1,350,387 | 1,395,279 | |||||||||||||||
| Wholesale selling expenses |
68,102 | 73,910 | 64,260 | 59,956 | 65,356 | |||||||||||||||
| Retail operating expenses |
369,996 | 397,110 | 401,039 | 408,583 | 415,167 | |||||||||||||||
| Franchise expenses |
13,320 | 14,281 | 14,394 | 15,213 | 14,957 | |||||||||||||||
| General and administrative expenses |
146,094 | 147,718 | 151,097 | 152,919 | 168,369 | |||||||||||||||
| Art and development costs |
19,311 | 19,390 | 20,640 | 22,249 | 23,331 | |||||||||||||||
| Development stage expenses (7) |
— | — | — | — | 8,974 | |||||||||||||||
| Impairment of Halloween City trade name (8) |
7,500 | — | — | — | — | |||||||||||||||
|
|
|
|
|
|
|
|
|
|
|
|||||||||||
| Income from operations |
161,602 | 243,142 | 272,219 | 274,084 | 280,136 | |||||||||||||||
| Interest expense, net |
143,406 | 155,917 | 123,361 | 89,380 | 87,366 | |||||||||||||||
| Other expense (income), net (9) |
18,478 | 5,891 | 130,990 | (2,010 | ) | 4,626 | ||||||||||||||
|
|
|
|
|
|
|
|
|
|
|
|||||||||||
| (Loss) income before income taxes |
(282 | ) | 81,334 | 17,868 | 186,714 | 188,144 | ||||||||||||||
| Income tax (benefit) expense (10) |
(4,525 | ) | 25,211 | 7,409 | 69,237 | (27,196 | ) | |||||||||||||
|
|
|
|
|
|
|
|
|
|
|
|||||||||||
| Net income |
4,243 | 56,123 | 10,459 | 117,477 | 215,340 | |||||||||||||||
| Less: net income attributable to noncontrolling interests |
224 | — | — | — | — | |||||||||||||||
|
|
|
|
|
|
|
|
|
|
|
|||||||||||
| Net income attributable to Party City Holdco Inc. |
$ | 4,019 | $ | 56,123 | $ | 10,459 | $ | 117,477 | $ | 215,340 | ||||||||||
|
|
|
|
|
|
|
|
|
|
|
|||||||||||
| Statement of Cash Flow Data: |
||||||||||||||||||||
| Net cash provided by (used in) |
||||||||||||||||||||
| Operating activities (11) |
$ | 135,818 | $ | 136,387 | $ | 80,212 | $ | 257,800 | $ | 267,921 | ||||||||||
| Investing activities (11) |
(112,522 | ) | (89,632 | ) | (100,136 | ) | (113,733 | ) | (141,645 | ) | ||||||||||
| Financing activities (11) |
(18,373 | ) | (23,530 | ) | 18,941 | (119,740 | ) | (139,962 | ) | |||||||||||
| Per Share Data: |
||||||||||||||||||||
| Basic |
$ | 0.04 | $ | 0.60 | $ | 0.09 | $ | 0.98 | $ | 1.81 | ||||||||||
| Diluted |
$ | 0.04 | $ | 0.59 | $ | 0.09 | $ | 0.98 | $ | 1.79 | ||||||||||
| Weighted Average |
||||||||||||||||||||
| Outstanding basic |
93,725,721 | 93,996,355 | 111,917,168 | 119,381,842 | 118,589,421 | |||||||||||||||
| Diluted |
93,725,721 | 94,444,137 | 112,943,807 | 120,369,672 | 119,894,021 | |||||||||||||||
| Cash dividend per common share |
$ | 3.60 | — | — | — | — | ||||||||||||||
| Other Financial Data: |
||||||||||||||||||||
| Adjusted EBITDA (12) |
$ | 320,775 | $ | 362,125 | $ | 380,293 | $ | 390,049 | $ | 409,210 | ||||||||||
| Adjusted net income (12) |
$ | 68,393 | $ | 86,838 | $ | 114,206 | $ | 138,277 | $ | 148,643 | ||||||||||
| Adjusted net income per common share – diluted (12) |
$ | 0.73 | $ | 0.92 | $ | 1.01 | $ | 1.15 | $ | 1.24 | ||||||||||
| Number of company-owned Party City stores |
674 | 693 | 712 | 750 | 803 | |||||||||||||||
| Capital expenditures |
$ | 61,241 | $ | 78,241 | $ | 78,825 | $ | 81,948 | $ | 66,970 | ||||||||||
| Party City brand comp sales (13) |
2.9 | % | 5.8 | % | 1.5 | % | (0.4 | )% | (0.7 | )% | ||||||||||
| Share of shelf (14) |
67.5 | % | 70.2 | % | 75.0 | % | 76.6 | % | 79.6 | % | ||||||||||
| Balance Sheet Data (at end of period): |
||||||||||||||||||||
| Cash and cash equivalents |
$ | 25,645 | $ | 47,214 | $ | 42,919 | $ | 64,610 | $ | 54,291 | ||||||||||
| Working capital (15). |
400,748 | 467,115 | 382,788 | 387,565 | 194,632 | |||||||||||||||
| Total assets (15) |
3,272,288 | 3,336,491 | 3,292,403 | 3,393,978 | 3,454,756 | |||||||||||||||
| Total debt (15)(16) |
2,129,240 | 2,120,796 | 1,786,809 | 1,673,090 | 1,831,440 | |||||||||||||||
| Redeemable common securities |
23,555 | 35,062 | — | — | 3,590 | |||||||||||||||
| Total equity (16) |
456,757 | 487,226 | 913,017 | 1,016,789 | 968,790 | |||||||||||||||
| (1) | The acquisitions of Party Delights Ltd. (“Party Delights”) and iParty Corp. (“IParty”) are included in the financial statements from their acquisition dates (first quarter 2013 and second quarter 2013, respectively). |
33
Table of Contents
| (2) | The acquisition of U.S. Balloon Manufacturing Co., Inc. (“U.S. Balloon”) is included in the financial statements from the acquisition date (fourth quarter 2014). |
| (3) | The acquisitions of Travis Designs Limited (“Travis”) and Accurate Custom Injection Molding Inc. (“ACIM”) are included in the financial statements from their acquisition dates (first quarter 2015 and third quarter 2015, respectively). |
| (4) | The acquisitions of nineteen franchise stores and Festival S.A. are included in the financial statements from their acquisition dates during the first quarter of 2016. |
| (5) | The acquisitions of thirty-six franchise stores and Granmark S.A. de C.V. (“Granmark”) are included in the financial statements from their acquisition dates during the first quarter of 2017. The acquisition of Print Appeal, Inc. (“Print Appeal”) is included in the financial statements from its acquisition date during the third quarter of 2017. |
| (6) | On July 27, 2012, PC Merger Sub, Inc. (“Merger Sub”), which was our wholly-owned indirect subsidiary, merged into PCHI, with PCHI being the surviving entity (the “Transaction”). As a result of the Transaction, the Company applied the acquisition method of accounting and increased the value of its inventory by $89.8 million as of July 28, 2012. Such adjustment increased the Company’s cost of sales during 2014 and 2013 by $5.9 million and $25.2 million, respectively, as the related inventory was sold. |
| (7) | During the first quarter of 2017, the Company and Ampology, a subsidiary of Trivergence, reached an agreement to form a new legal entity (Kazzam, LLC) for the purpose of designing, developing and launching an online exchange platform for party-related services. The website will allow consumers to select, schedule and pay for various services (including entertainment, activities and food) all through a single portal. During 2017, Kazzam incurred $9.0 million of start-up expenses, which are recorded in development stage expenses in the Company’s consolidated statement of operations and comprehensive income. |
| (8) | In conjunction with the Transaction, the Company applied the acquisition method of accounting and allocated the $2.7 billion acquisition price to various tangible and intangible assets, including the Company’s Halloween City trade name. The value that was ascribed to the trade name was based on the number of Halloween City stores that the Company expected to open during each subsequent Halloween selling season and the expected performance of such stores. The number of stores that the Company opens during a season is driven by many factors, including the availability of suitable locations. During 2013, the Company made a strategic decision to open fewer temporary Halloween City stores. As a result of a change in store performance and the Company’s decision to open fewer Halloween City stores than previously assumed, during 2013 the Company lowered the value of its Halloween City trade name by recording a $7.5 million impairment charge. |
| (9) | During August 2015, PCHI redeemed all $700 million of its 8.875% senior notes (“Old Senior Notes”) and refinanced its existing $1,125 million senior secured term loan facility (“Old Term Loan Credit Agreement”) and $400 million asset-based revolving credit facility (“Old ABL Facility”) with new indebtedness consisting of: (i) a senior secured term loan facility (“Term Loan Credit Agreement”), (ii) a $540 million asset-based revolving credit facility (with a seasonal increase to $640 million during a certain period of each calendar year) (“ABL Facility”) and (iii) $350 million of 6.125% senior notes (“Senior Notes”). The redemption price for the Old Senior Notes was 6.656% of the principal amount, or $46.6 million. The Company recorded such amount in other expense, net. Additionally, in conjunction with the refinancing, the Company wrote-off $22.7 million of previously capitalized deferred financing costs, original issuance discounts and call premiums and also recorded such amount in other expense, net. Further, in conjunction with the refinancing of the term loans, the Company incurred banker and legal fees, $9.8 million of which was recorded in other expense, net. |
During April 2015, in conjunction with the Company’s initial public offering, the Company paid a 2% prepayment penalty, or $7.0 million, in order to redeem $350.0 million of senior PIK toggle notes (the “Nextco Notes”) issued by the Company’s wholly-owned subsidiaries, PC Nextco and PC Nextco Finance, Inc., and paid a management agreement termination fee of $30.7 million to affiliates of THL and Advent. The Company recorded the prepayment penalty and termination fee in other expense, net. Additionally, in conjunction with the redemption of the Nextco Notes, the Company wrote off $8.6 million of capitalized debt issuance costs and original issuance discounts. The write-off was also recorded in other expense, net.
| (10) | On December 22, 2017, the Tax Cuts and Jobs Act of 2017 (“the Act”) was signed into law. The Act significantly changed U.S. tax law, including lowering the U.S. corporate income tax rate from 35% to 21%, effective January 1, 2018, and implementing a one-time “deemed repatriation” tax on unremitted earnings accumulated in non-U.S. jurisdictions. Due to the complexities of accounting for the Act, the SEC issued Staff Accounting Bulletin No. 118 which allows entities to include a provisional estimate of the impact of the Act in its 2017 financial statements. Therefore, based on currently available information, during 2017 the Company recorded a provisional estimate of the impact of the Act, which included an income tax benefit of $91.0 million related to the remeasurement of its domestic deferred tax liabilities and deferred tax assets due to the lower U.S. corporate tax rate. Additionally, during 2017, the Company recorded an income tax expense of $1.1 million as its provisional estimate of the Transition Tax related to the deemed repatriation of unremitted earnings of foreign subsidiaries. See footnote 13 to the consolidated financial statements in Item 8. for further discussion. |
| (11) | See Item 7, “Management’s Discussion and Analysis of Financial Condition and Results of Operations—Liquidity,” for a discussion of cash flows. |
| (12) | The Company presents adjusted EBITDA, adjusted net income and adjusted net income per common share—diluted as supplemental measures of its operating performance. The Company defines EBITDA as net income (loss) before interest expense, net, income taxes, depreciation and amortization and defines adjusted EBITDA as EBITDA, as further adjusted to eliminate the impact of certain items that the Company does not consider indicative of our core operating performance. These further adjustments are itemized below. Adjusted net income represents the Company’s net income (loss) adjusted for, among other items, intangible asset amortization, non-cash purchase accounting adjustments, amortization of deferred financing costs and original issue discounts, refinancing charges, equity based compensation, and impairment charges. Adjusted net income per common share—diluted represents adjusted net income divided by diluted weighted average common shares outstanding. The Company presents these measures as supplemental measures of its operating performance. You are encouraged to evaluate these adjustments and the reasons the Company considers them appropriate for supplemental analysis. In evaluating the measures, you should be aware that in the future the Company may incur expenses that are the same as, or similar to, some of the adjustments in this presentation. The Company’s presentation of adjusted EBITDA and adjusted net income should not be construed as an inference that the Company’s future results will be unaffected by unusual or non-recurring items. |
34
Table of Contents
| The Company presents the measures because the Company believes they assist investors in comparing the Company’s performance across reporting periods on a consistent basis by eliminating items that the Company does not believe are indicative of its core operating performance. In addition, the Company uses adjusted EBITDA: (i) as a factor in determining incentive compensation, (ii) to evaluate the effectiveness of its business strategies and (iii) because its credit facilities use adjusted EBITDA to measure compliance with certain covenants. The Company also believes that adjusted net income and adjusted net income per common share—diluted are helpful benchmarks to evaluate its operating performance. |
Adjusted EBITDA, adjusted net income, and adjusted net income per common share—diluted have limitations as analytical tools. Some of these limitations are:
| • | they do not reflect the Company’s cash expenditures or future requirements for capital expenditures or contractual commitments; |
| • | they do not reflect changes in, or cash requirements for, the Company’s working capital needs; |
| • | adjusted EBITDA does not reflect the significant interest expense, or the cash requirements necessary to service interest or principal payments, on the Company’s indebtedness; |
| • | although depreciation and amortization are non-cash charges, the assets being depreciated and amortized will often have to be replaced in the future, and adjusted EBITDA does not reflect any cash requirements for such replacements; |
| • | non-cash compensation is and will remain a key element of the Company’s overall long-term incentive compensation package, although the Company excludes it as an expense when evaluating its core operating performance for a particular period; |
| • | they do not reflect the impact of certain cash charges resulting from matters the Company considers not to be indicative of its ongoing operations; and |
| • | other companies in the Company’s industry may calculate adjusted EBITDA, adjusted net income and adjusted net income per common share differently than the Company does, limiting its usefulness as a comparative measure. |
Because of these limitations, adjusted EBITDA, adjusted net income, and adjusted net income per common share—diluted should not be considered in isolation or as substitutes for performance measures calculated in accordance with GAAP. The Company compensates for these limitations by relying primarily on its GAAP results and using the metrics only on a supplemental basis. The reconciliations from net income (loss) to adjusted EBITDA and adjusted net income for the periods presented follow (dollars in thousands, except per share amounts):
| Fiscal Year Ended December 31, 2013 |
Fiscal Year Ended December 31, 2014 |
Fiscal Year Ended December 31, 2015 |
Fiscal Year Ended December 31, 2016 |
Fiscal Year Ended December 31, 2017 |
||||||||||||||||
| Net income |
$ | 4,243 | $ | 56,123 | $ | 10,459 | $ | 117,477 | $ | 215,340 | ||||||||||
| Interest expense, net |
143,406 | 155,917 | 123,361 | 89,380 | 87,366 | |||||||||||||||
| Income taxes |
(4,525 | ) | 25,211 | 7,409 | 69,237 | (27,196 | ) | |||||||||||||
| Depreciation and amortization |
94,624 | 82,890 | 80,515 | 83,630 | 85,168 | |||||||||||||||
|
|
|
|
|
|
|
|
|
|
|
|||||||||||
| EBITDA |
237,748 | 320,141 | 221,744 | 359,724 | 360,678 | |||||||||||||||
| Non-cash purchase accounting adjustments |
25,229 | (a) | 8,868 | (a) | 4,470 | (a) | 4,114 | (a) | 7,378 | (a) | ||||||||||
| Management fee |
3,000 | (b) | 3,356 | (b) | 31,627 | (b) | — | — | ||||||||||||
| Impairment charges |
7,822 | (c) | 1,012 | 852 | — | — | ||||||||||||||
| Restructuring, retention and severance |
4,673 | 3,391 | 2,318 | 911 | 9,718 | (d) | ||||||||||||||
| Refinancing charges |
12,295 | (e) | 4,396 | (e) | 94,607 | (e) | 1,458 | (e) | — | |||||||||||
| Deferred rent |
17,055 | (f) | 14,418 | (f) | 13,407 | (f) | 18,835 | (f) | 7,287 | (f) | ||||||||||
| Business interruption |
500 | (2,435 | ) | — | — | — | ||||||||||||||
| Corporate development expenses |
4,828 | (g) | 700 | (g) | 1,786 | (g) | 4,290 | (g) | 9,401 | (g) | ||||||||||
| Foreign currency losses (gains) |
1,581 | 1,447 | 3,691 | (7,417 | ) | 466 | ||||||||||||||
| Closed store expense |
1,498 | (h) | 1,199 | (h) | 1,901 | (h) | 3,688 | (h) | 4,875 | (h) | ||||||||||
| Employee equity based compensation |
2,137 | 1,583 | 3,042 | 3,853 | 5,309 | |||||||||||||||
| Non-employee equity based compensation |
— | — | — | — | 3,033 | (i) | ||||||||||||||
| Undistributed loss (gain) in unconsolidated joint ventures |
172 | 1,556 | 562 | 314 | (194 | ) | ||||||||||||||
| Gain on sale of assets |
— | — | (2,660 | ) | — | — | ||||||||||||||
| Hurricane-related costs |
— | — | — | — | 455 | |||||||||||||||
| Change-of-control license premium |
— | — | 3,000 | — | — | |||||||||||||||
| Other |
2,237 | 2,493 | (54 | ) | 279 | 804 | ||||||||||||||
|
|
|
|
|
|
|
|
|
|
|
|||||||||||
| Adjusted EBITDA |
$ | 320,775 | $ | 362,125 | $ | 380,293 | $ | 390,049 | $ | 409,210 | ||||||||||
|
|
|
|
|
|
|
|
|
|
|
|||||||||||
35
Table of Contents
| Fiscal Year Ended December 31, 2013 |
Fiscal Year Ended December 31, 2014 |
Fiscal Year Ended December 31, 2015 |
Fiscal Year Ended December 31, 2016 |
Fiscal Year Ended December 31, 2017 |
||||||||||||||||
| (Loss) income before income taxes |
$ | (282 | ) | $ | 81,334 | $ | 17,868 | $ | 186,714 | $ | 188,144 | |||||||||
| Intangible asset amortization |
26,997 | (j) | 22,195 | (j) | 18,885 | (j) | 17,247 | (j) | 16,959 | (j) | ||||||||||
| Non-cash purchase accounting adjustments |
39,414 | (a) | 13,692 | (a) | 6,445 | (a) | 5,300 | (a) | 9,549 | (a) | ||||||||||
| Amortization of deferred financing costs and original issuance discount |
20,211 | (k)(e) | 15,610 | (k)(e) | 40,516 | (k)(e) | 5,818 | (k)(e) | 4,937 | (k) | ||||||||||
| Management fee |
3,000 | (b) | 3,356 | (b) | 31,627 | (b) | — | — | ||||||||||||
| Refinancing charges |
4,068 | (e) | 1,407 | (e) | 65,338 | (e) | 725 | (e) | — | |||||||||||
| Employee equity based compensation |
2,137 | 1,583 | 3,042 | 3,853 | 5,309 | |||||||||||||||
| Non-employee equity based compensation |
— | — | — | — | 3,033 | (i) | ||||||||||||||
| Restructuring, retention and severance |
— | — | — | — | 7,113 | (d) | ||||||||||||||
| Hurricane-related costs |
— | — | — | — | 455 | |||||||||||||||
| Impairment charges |
7 ,822 | (c) | 1,012 | 852 | — | — | ||||||||||||||
| Gain on sale of assets |
— | — | (2,660 | ) | — | — | ||||||||||||||
| Change-of-control license premium |
— | — | 3,000 | — | — | |||||||||||||||
|
|
|
|
|
|
|
|
|
|
|
|||||||||||
| Adjusted income before income taxes |
103,367 | 140,189 | 184,913 | 219,657 | 235,499 | |||||||||||||||
| Adjusted income taxes |
34,974 | (l) | 53,351 | (l) | 70,707 | (l) | 81,380 | (l) | 86,856 | (l)(m) | ||||||||||
|
|
|
|
|
|
|
|
|
|
|
|||||||||||
| Adjusted net income |
$ | 68,393 | $ | 86,838 | $ | 114,206 | $ | 138,277 | $ | 148,643 | ||||||||||
|
|
|
|
|
|
|
|
|
|
|
|||||||||||
| Adjusted net income per common share—diluted |
$ | 0.73 | $ | 0.92 | $ | 1.01 | $ | 1.15 | $ | 1.24 | ||||||||||
|
|
|
|
|
|
|
|
|
|
|
|||||||||||
| (a) | As a result of the Transaction, the Company applied the acquisition method of accounting and increased the value of its inventory by $89.8 million as of July 28, 2012. Such adjustment increased the Company’s cost of sales during 2014 and 2013 by $5.9 million and $25.2 million, respectively, as the related inventory was sold. Further, during the application of the acquisition method of accounting, the Company increased the value of certain property, plant and equipment. The impact of such adjustments on depreciation expense increased the Company’s expenses during 2017, 2016, 2015, 2014 and 2013 by $1.0 million, $1.4 million, $2.8 million, $4.8 million and $14.2 million, respectively. These property, plant and equipment depreciation amounts are included in “Non-cash purchase accounting adjustments” for purposes of calculating “adjusted net income”, but are excluded from “Non-cash purchase accounting adjustments” for purposes of calculating adjusted EBITDA since they are included in depreciation expense. |
| (b) | At the time of the Transaction, the Company entered into a management agreement with THL and Advent under which THL and Advent provided advice to the Company on, among other things, financing, operations, acquisitions and dispositions. Under the agreement, THL and Advent were paid an annual management fee for such services. In connection with the initial public offering in April 2015, the management agreement was terminated and the Company paid THL and Advent a termination fee. Such amount, $30.7 million, was recorded in other expense, net. |
| (c) | In conjunction with the Transaction, the Company applied the acquisition method of accounting and allocated the $2.7 billion acquisition price to various tangible and intangible assets, including the Company’s Halloween City trade name. The value that was ascribed to the trade name was based on the number of Halloween City stores that the Company expected to open during each subsequent Halloween selling season and the expected performance of such stores. The number of stores that the Company opens during a season is driven by many factors, including the availability of suitable locations. During 2013, the Company made a strategic decision to open fewer temporary Halloween City stores. As a result of a change in store performance and the Company’s decision to open fewer Halloween City stores than previously assumed, during 2013 the Company lowered the value of its Halloween City trade name by recording a $7.5 million impairment charge. |
| (d) | The “restructuring, retention and severance” amounts in the adjusted net income table relate entirely to an organizational restructuring which took place during the first quarter of 2017 and which consisted of: a) the Company entering into a Transition and Consulting Agreement with Gerry Rittenberg and b) a restructuring of the Company’s retail segment. See Note 20 to the consolidated financial statements in Item 8. for further discussion. The “restructuring, retention and severance” amounts in the adjusted EBITDA table also include additional restructuring, retention and severance charges incurred by the Company and excluded from the definition of adjusted EBITDA in the Company’s credit facilities (see above for a discussion of the Company’s use of adjusted EBITDA). |
| (e) | During October 2016, the Company amended the Term Loan Credit Agreement. In conjunction with that amendment, the Company wrote-off $0.4 million of costs that had been capitalized during the initial issuance of the debt. Additionally, the Company wrote-off $0.3 million of the net original issuance discount that existed as of the time of the amendment. The amounts are included in “Refinancing charges” in the adjusted EBITDA table above and in “Amortization of deferred financing costs and original issue discount” in the adjusted net income table above (consistent with the presentation in the Company’s consolidated statement of cash flows included elsewhere in this Annual Report on Form 10-K). Further, in conjunction with the amendment, the Company expensed $0.7 million of investment banking and legal fees. These amounts are included in “Refinancing charges” in the tables above. |
During August 2015, the Company refinanced its debt. In conjunction with the refinancing, the Company paid a call premium and other third-party costs. The Company recorded such payments, $56.4 million in aggregate, in the Company’s 2015 consolidated statement of operations and comprehensive loss. The amount is included in “Refinancing charges” in the tables above. Additionally, in conjunction with the refinancing, the Company wrote off $22.7 million of capitalized debt issuance costs, original issuance discounts and call premiums. Such charge was recorded in the Company’s 2015 consolidated statement of operations and
36
Table of Contents
comprehensive loss and included in “Refinancing charges” in the adjusted EBITDA table above and in “Amortization of deferred financing costs and original issue discounts” in the adjusted net income table above (consistent with the presentation in the Company’s consolidated statement of cash flows included elsewhere in this annual Report on Form 10-K). Further, as PCHI was required to provide 30 days of notice when calling its Old Senior Notes, during a portion of 2015 both the Old Senior Notes and Senior Notes were outstanding. The overlapping interest expense, $2.0 million, is included in “Refinancing charges” in the adjusted net income table above.
During April 2015, the Company used proceeds from the initial public offering to redeem the Nextco Notes. The redemption resulted in a prepayment penalty of $7.0 million. The Company recorded the prepayment penalty in the Company’s 2015 consolidated statement of operations and comprehensive loss. The amount is included in “Refinancing charges” in the tables above. Additionally, in conjunction with the redemption, the Company wrote off $8.6 million of capitalized debt issuance costs and original issuance discounts related to the Nextco Notes. Such charge was recorded in the Company’s consolidated statement of operations and comprehensive loss during 2015 and included in “Refinancing charges” in the adjusted EBITDA table above and in “Amortization of deferred financing costs and original issue discounts” in the adjusted net income table above (consistent with the presentation in the Company’s consolidated statement of cash flows included elsewhere in this Annual Report on Form 10-K).
During February 2014, the Company amended the Old Term Loan Credit Agreement again. In conjunction with that amendment, the Company wrote-off $1.6 million of costs that had been capitalized during the issuance of the debt. Additionally, the Company wrote-off $1.3 million of the net original issuance discount that existed as of the time of that amendment. The amounts are included in “Refinancing charges” in the adjusted EBITDA table above and in “Amortization of deferred financing costs and original issue discount” in the adjusted net income table above (consistent with the presentation in the Company’s consolidated statement of cash flows included elsewhere in this Annual Report on Form 10-K). Further, in conjunction with the amendment, the Company expensed $1.4 million of investment banking and legal fees. These amounts are included in “Refinancing charges” in the tables above.
During February 2013, the Company amended the Old Term Loan Credit Agreement. In conjunction with that amendment, the Company wrote-off $5.9 million of costs that had been capitalized during the initial issuance of the debt. Additionally, the Company wrote-off $2.3 million of the net original issuance discount that existed as of the time of that amendment. The amounts are included in “Refinancing charges” in the adjusted EBITDA table above and in “Amortization of deferred financing costs and original issue discount” in the adjusted net income table above (consistent with the presentation in the Company’s consolidated statement of cash flows included elsewhere in this Annual Report on Form 10-K). Further, in conjunction with that amendment, the Company expensed $2.5 million of a call premium and $1.6 million of investment banking and legal fees. These amounts are included in “Refinancing charges” in the tables above.
| (f) | The deferred rent adjustment reflects the difference between accounting for rent and landlord incentives in accordance with GAAP and the Company’s actual cash outlay for such items. |
| (g) | Principally represents third-party costs related to acquisitions (primarily legal expenses and diligence fees). Such costs are excluded from the definition of “Consolidated Adjusted EBITDA” that is utilized for certain covenants in the Company’s credit agreements. Additionally, 2017 includes start-up costs for Kazzam (see footnote 21 to the consolidated financial statements in Item 8. for further discussion of Kazzam). |
| (h) | Charges incurred related to closing unprofitable stores. |
| (i) | Principally represents shares of Kazzam awarded to Ampology as compensation for Ampology’s services. See Note 21 to the consolidated financial statements in Item 8. for further discussion. |
| (j) | Represents the amortization of intangible assets, including those assets recorded in conjunction with the application of the acquisition method of accounting due to the Transaction. |
| (k) | Represents the amortization of deferred financing costs, original issuance discounts and capitalized call premiums related to debt offerings. Additionally, 2016, 2015, 2014 and 2013 include the write-off of deferred financing costs, net original issuance discounts and capitalized call premiums in conjunction with refinancings. See note (e) for further discussion. |
| (l) | Represents income tax expense/benefit after excluding the specific tax impacts for each of the pre-tax adjustments. The tax impacts for each of the adjustments were determined by applying to the pre-tax adjustments the effective income tax rates for the specific legal entities in which the adjustments were recorded. |
| (m) | On December 22, 2017, the Tax Cuts and Jobs Act of 2017 (“the Act”) was signed into law. The Act significantly changed U.S. tax law, including lowering the U.S. corporate income tax rate from 35% to 21%, effective January 1, 2018, and implementing a one-time “deemed repatriation” tax on unremitted earnings accumulated in non-U.S. jurisdictions since 1986. Due to the complexities of accounting for the Act, the SEC issued Staff Accounting Bulletin No. 118 which allows entities to include a provisional estimate of the impact of the Act in its 2017 financial statements. Therefore, based on currently available information, during 2017 the Company recorded a provisional estimate of the impact of the Act, which included an income tax benefit of $91.0 million related to the remeasurement of its domestic deferred tax liabilities and deferred tax assets due to the lower U.S. corporate tax rate. As the Act is a significant and non-recurring event which is impacting the comparability of the Company’s financial statements, the Company has excluded the impact of the law, including the $91.0 million benefit, from its adjusted net income and adjusted earnings per share for the year ended December 31, 2017. |
| (13) | Party City brand comp sales include North American e-commerce sales. |
| (14) | Represents the percentage of product costs included in cost of goods sold by our Party City stores and North American retail e-commerce operations which relate to products supplied by our wholesale operations. |
| (15) | Amounts for 2013 and 2014 adjusted to reflect the Company’s retrospective adoption during the fourth quarter of 2015 of Financial Accounting Standards Board Accounting Standards Update 2015-03, “Simplifying the Presentation of Debt Issuance Costs”. Deferred financing costs in the amounts of $44.4 million and $55.2 million were reclassified from “other assets” to debt as of December 31, 2014, and 2013, respectively. |
| (16) | Excludes redeemable common securities. |
37
Table of Contents
| Item 7. | Management’s Discussion and Analysis of Financial Condition and Results of Operations |
Business Overview
Our Company
We are the leading party goods retailer by revenue in North America and, we believe, the largest vertically integrated supplier of decorated party goods globally by revenue. With over 900 locations (inclusive of franchised stores), we have the only coast-to-coast network of party superstores in the U.S. and Canada that make it easy and fun to enhance special occasions with a differentiated shopping experience and an unrivaled assortment of innovative and exciting merchandise offered at a compelling value. We also operate multiple e-commerce sites, principally under the domain name PartyCity.com, and during the Halloween selling season we open a network of approximately 250—300 temporary stores under the Halloween City banner.
In addition to our retail operations, we are also one of the largest global designers, manufacturers and distributors of decorated party supplies, with products found in over 40,000 retail outlets worldwide, including independent party supply stores, mass merchants, grocery retailers and dollar stores. Our products are available in over 100 countries with the United Kingdom (“U.K.”), Canada, Germany, Mexico and Australia among the largest end markets for our products outside of the United States.
How We Assess the Performance of Our Company
In assessing the performance of our company, we consider a variety of performance and financial measures for our two operating segments, Retail and Wholesale. These key measures include revenues and gross profit, comparable retail same-store sales and operating expenses. We also review other metrics such as adjusted net income (loss), adjusted net income (loss) per common share – diluted and adjusted EBITDA. For a discussion of our use of these measures and a reconciliation of adjusted net income (loss) and adjusted EBITDA to net income (loss), please refer to Item 6, “Selected Consolidated Financial Data.”
Segments
Our retail segment generates revenue primarily through the sale of Amscan, Designware, Anagram, Costumes USA and other party supplies through Party City, Halloween City and PartyCity.com. During 2017, approximately 80% of the product that was sold by our retail segment was supplied by our wholesale segment.
Our wholesale revenues are generated from the sale of party goods for all occasions, including paper and plastic tableware, accessories and novelties, costumes, metallic and latex balloons and stationery. Our products are sold at wholesale to party goods superstores, including our franchise stores, other party goods retailers, mass merchants, independent card stores, dollar stores and other retailers and distributors throughout the world.
Intercompany sales between the Wholesale and the Retail segment are eliminated, and the wholesale profits on intercompany sales are deferred and realized at the time the merchandise is sold to the retail consumer. For segment reporting purposes, certain general and administrative expenses and art and development costs are allocated based on total revenues.
Financial Measures
Revenues. Revenues from retail store operations are recognized at point of sale. We estimate future retail sales returns and record a provision in the period in which the related sales are recorded based on historical information. E-commerce sales are recorded on a FOB destination basis and include shipping revenues. Retail sales are reported net of taxes collected.
Under the terms of our agreements with our franchisees, we provide both: 1) brand value (via significant advertising spend) and 2) support with respect to planograms, in exchange for a royalty fee that ranges from 4% to 6% of the franchisees’ sales. The Company records the royalty fees at the time that the franchisees’ sales are recorded.
38
Table of Contents
Revenues from our wholesale segment represent the sale of our products to third parties, less rebates, discounts and other allowances. The terms of our wholesale sales are generally FOB shipping point, and revenue is recognized when goods are shipped. We estimate reductions to revenues for volume-based rebate programs and subsequent credits at the time sales are recognized. Intercompany sales from our wholesale segment to our retail segment are eliminated in our consolidated total revenues.
Comparable Retail Same-Store Sales. The growth in same-store sales represents the percentage change in same-store sales in the period presented compared to the prior year. Same-store sales exclude the net sales of a store for any period if the store was not open during the same period of the prior year. Acquired stores are excluded from same-store sales until they are converted to the Party City format and included in our sales for the comparable period of the prior year. Comparable sales are calculated based upon stores that were open at least thirteen full months as of the end of the applicable reporting period. When a store is reconfigured or relocated within the same general territory, the store continues to be treated as the same store. If, during the period presented, a store was closed, sales from that store up to and including the closing day are included as same-store sales as long as the store was open during the same period of the prior year. Same-store sales for the Party City brand include North American retail e-commerce sales.
Cost of Sales. Cost of sales at wholesale reflects the production costs (i.e., raw materials, labor and overhead) of manufactured goods and the direct cost of purchased goods, inventory shrinkage at both retail and wholesale, inventory adjustments, inbound freight to our manufacturing and distribution facilities, distribution costs and outbound freight to get goods to our wholesale customers. At retail, cost of sales reflects the direct cost of goods purchased from third parties and the production or purchase costs of goods acquired from our wholesale segment. Retail cost of sales also includes inventory shrinkage, inventory adjustments, inbound freight, occupancy costs related to store operations (such as rent and common area maintenance, utilities and depreciation on assets) and all logistics costs associated with our retail e-commerce business.
Our cost of sales increases in higher volume periods as the direct costs of manufactured and purchased goods, inventory shrinkage and freight are generally tied to net sales. However, other costs are largely fixed or vary based on other factors and do not necessarily increase as sales volume increases. Changes in the mix of our products may also impact our overall cost of sales. The direct costs of manufactured and purchased goods are influenced by raw material costs (principally paper, petroleum-based resins and cotton), domestic and international labor costs in the countries where our goods are purchased or manufactured and logistics costs associated with transporting our goods. We monitor our inventory levels on an on-going basis in order to identify slow-moving goods.
Cost of sales related to sales from our wholesale segment to our retail segment are eliminated in our consolidated financial statements.
Wholesale Selling Expenses. Wholesale selling expenses include the costs associated with our wholesale sales and marketing efforts, including merchandising and customer service. Costs include the salaries and benefits of the related work force, including sales-based bonuses and commissions. Other costs include catalogues, showroom rent, travel and other operating costs. Certain selling expenses, such as sales-based bonuses and commissions, vary in proportion to sales, while other costs vary based on other factors, such as our marketing efforts, or are largely fixed and do not necessarily increase as sales volumes increase.
Retail Operating Expenses. Retail operating expenses include all of the costs associated with retail store operations, excluding occupancy-related costs included in cost of sales. Costs include store payroll and benefits, advertising, supplies and credit card costs. Retail expenses are largely variable but do not necessarily vary in proportion to net sales.
Franchise Expenses. Franchise expenses include the costs associated with operating our franchise network, including salaries and benefits of the administrative work force and other administrative costs. These expenses generally do not vary proportionally with royalties and franchise fees.
39
Table of Contents
General and Administrative Expenses. General and administrative expenses include all operating costs not included elsewhere in the statement of operations and comprehensive income (loss). These expenses include payroll and other expenses related to operations at our corporate offices, including occupancy costs, related depreciation and amortization, legal and professional fees and data-processing costs. These expenses generally do not vary proportionally with net sales.
Art and Development Costs. Art and development costs include the costs associated with art production, creative development and product management. Costs include the salaries and benefits of the related work force. These expenses generally do not vary proportionally with net sales.
Development Stage Expenses. Development stage expenses represent start-up activities related to Kazzam, LLC.
Adjusted EBITDA. We define EBITDA as net income (loss) before interest expense, net, income taxes, depreciation and amortization. We define Adjusted EBITDA as EBITDA, as further adjusted to eliminate the impact of certain items that we do not consider indicative of our core operating performance. We caution investors that amounts presented in accordance with our definition of Adjusted EBITDA may not be comparable to similar measures disclosed by other issuers, because not all issuers calculate Adjusted EBITDA in the same manner. We believe that Adjusted EBITDA is an appropriate measure of operating performance in addition to EBITDA because we believe it assists investors in comparing our performance across reporting periods on a consistent basis by eliminating the impact of items that we do not believe are indicative of our core operating performance. In addition, we use Adjusted EBITDA: (i) as a factor in determining incentive compensation, (ii) to evaluate the effectiveness of our business strategies, and (iii) because the credit facilities use Adjusted EBITDA to measure compliance with certain covenants.
Adjusted Net Income (Loss). Adjusted net income (loss) represents our net income (loss), adjusted for, among other items, intangible asset amortization, non-cash purchase accounting adjustments, amortization of deferred financing costs and original issue discounts, refinancing charges, equity based compensation and impairment charges. We present adjusted net income because we believe it assists investors in comparing our performance across reporting periods on a consistent basis by eliminating the impact of items that we do not believe are indicative of our core operating performance.
Adjusted Net Income (Loss) Per Common Share—Diluted. Adjusted net income (loss) per common share— diluted represents adjusted net income (loss) divided by the Company’s diluted weighted average common shares outstanding. We present the metric because we believe it assists investors in comparing our per share performance across reporting periods on a consistent basis by eliminating the impact of items that we do not believe are indicative of our core operating performance.
Executive Overview
Net income increased from $117.5 million in 2016 to $215.3 million in 2017. Adjusted EBITDA increased from $390.0 million in 2016 to $409.2 million in 2017 and adjusted net income increased from $138.3 million to $148.6 million. See Item 6, “Selected Consolidated Financial Data”, of this Annual Report on Form 10-K for reconciliations of such metrics.
Net income per common share—diluted increased from $0.98 in 2016 to $1.79 in 2017. Additionally, adjusted net income per common share—diluted increased from $1.15 in 2016 to $1.24 in 2017.
40
Table of Contents
Factors Affecting Our Results
Important events that have impacted or will impact the results presented in “Management’s Discussion and Analysis of Financial Condition and Results of Operations” include:
Tax Reform. On December 22, 2017, the Tax Cuts and Jobs Act of 2017 (“the Act”) was signed into law. The Act significantly changed U.S. tax law, including lowering the U.S. corporate income tax rate from 35% to 21%, effective January 1, 2018, and implementing a one-time “deemed repatriation” tax on unremitted earnings accumulated in non-U.S. jurisdictions since 1986 (the “Transition Tax”). Due to the complexities of accounting for the Act, the SEC issued Staff Accounting Bulletin No. 118 which allows entities to include a provisional estimate of the impact of the Act in its 2017 financial statements. Therefore, based on currently available information, during 2017 the Company recorded a provisional estimate of the impact of the Act, which included an income tax benefit of $91.0 million related to the remeasurement of its domestic deferred tax liabilities and deferred tax assets due to the lower U.S. corporate tax rate. Additionally, during 2017, the Company recorded income tax expense of $1.1 million as its provisional estimate of the Transition Tax related to the deemed repatriation of unremitted earnings of foreign subsidiaries.
New Year’s Eve Sales. The Company’s retail operations define a fiscal year as the 52-week period or 53-week period ended on the Saturday nearest December 31st of each year. Fiscal 2017 ended on December 30, 2017 and Fiscal 2016 ended on December 31, 2016. As a result, the Company’s sales of New Year’s Eve-related product in Fiscal 2017 were approximately $7 million lower than during Fiscal 2016. See “Results of Operations” below for further discussion.
Hurricanes. During the third quarter of 2017, the results of the Company’s retail segment were impacted by two hurricanes. See “Results of Operations” below for further discussion.
Recent Acquisitions. During the first quarter of 2017, we acquired 36 franchise stores. Additionally, during the fourth quarter of 2017, we acquired 7 independent stores. The acquisitions increased sales for our retail segment by approximately $66 million versus 2016. Additionally, these acquisitions decreased our third-party wholesale sales by $25 million as post-acquisition wholesale sales to such stores are now eliminated as intercompany sales.
Additionally, during March 2017, the Company acquired 85% of the common stock of Granmark, S.A. de C.V., a Mexican manufacturer and wholesaler of party goods. The acquisition increased sales for our wholesale segment by approximately $27 million versus 2016.
Kazzam. During the first quarter of 2017, the Company and Ampology, a subsidiary of Trivergence, reached an agreement to form a new legal entity (Kazzam, LLC) for the purpose of designing, developing and launching an online exchange platform for party-related services. The website will allow consumers to select, schedule and pay for various services (including entertainment, activities and food) all through a single portal. During 2017, Kazzam incurred $9.0 million of start-up expenses, which are recorded in development stage expenses in the Company’s consolidated statement of operations and comprehensive income.
Foreign Exchange. Our international operations conduct business in various currencies. As many of the operations utilize U.S. Dollars to purchase product and then sell to customers in other currencies, the strengthening of the U.S. Dollar negatively impacts the margins of such operations. Additionally, when the sales and other income statement amounts of the foreign entities are translated into U.S. Dollars during the financial statement consolidation process, the strengthening of the U.S. Dollar decreases such amounts in our consolidated statement of operations and comprehensive income (loss). Further, during our financial statement close process, we adjust open receivables and payables that are not denominated in the functional currency of a subsidiary to the subsidiary’s functional currency using the foreign currency exchange rate at the balance sheet date. The gains and losses created by such adjustments are primarily recorded in our statement of operations and comprehensive income.
41
Table of Contents
Therefore, during 2017, fluctuations in the U.S. Dollar versus the Pound and other foreign currencies impacted our results when compared to 2016. Please see “Results of Operations” below for further discussion. Additionally, please see Item 7A., “Quantitative and Qualitative Disclosures about Market Risk”, for further discussion of how foreign exchange impacts us.
Restructuring Charges. During 2017, the Company recorded a $3.2 million severance charge related to a restructuring of its Retail segment. Of such amount, $2.3 million was recorded in retail operating expenses and $0.9 million was recorded in general and administrative expenses.
Additionally, on March 15, 2017, the Company and its Chairman of the Board of Directors, Gerald Rittenberg, entered into a Transition and Consulting Agreement under which Mr. Rittenberg’s employment as Executive Chairman of the Company terminated effective March 31, 2017. See “Results of Operations” below for further discussion.
Results of Operations
The following tables set forth our operating results and operating results as a percentage of total revenues for the years ended December 31, 2017 and 2016.
| Years Ended December 31, | ||||||||||||||||
| 2017 | 2016 | |||||||||||||||
| (Dollars in thousands, except per share data) | ||||||||||||||||
| Revenues: |
||||||||||||||||
| Net sales |
$ | 2,357,986 | 99.4 | % | $ | 2,266,386 | 99.3 | % | ||||||||
| Royalties and franchise fees |
13,583 | 0.6 | 17,005 | 0.7 | ||||||||||||
|
|
|
|
|
|
|
|
|
|||||||||
| Total revenues |
2,371,569 | 100.0 | 2,283,391 | 100.0 | ||||||||||||
| Expenses: |
||||||||||||||||
| Cost of sales |
1,395,279 | 58.8 | 1,350,387 | 59.1 | ||||||||||||
| Wholesale selling expenses |
65,356 | 2.8 | 59,956 | 2.6 | ||||||||||||
| Retail operating expenses |
415,167 | 17.5 | 408,583 | 17.9 | ||||||||||||
| Franchise expenses |
14,957 | 0.6 | 15,213 | 0.7 | ||||||||||||
| General and administrative expenses |
168,369 | 7.1 | 152,919 | 6.7 | ||||||||||||
| Art and development costs |
23,331 | 1.0 | 22,249 | 1.0 | ||||||||||||
| Development stage expenses |
8,974 | 0.4 | — | — | ||||||||||||
|
|
|
|
|
|
|
|
|
|||||||||
| Total expenses |
2,091,433 | 88.2 | 2,009,307 | 88.0 | ||||||||||||
|
|
|
|
|
|
|
|
|
|||||||||
| Income from operations |
280,136 | 11.8 | 274,084 | 12.0 | ||||||||||||
| Interest expense, net |
87,366 | 3.7 | 89,380 | 3.9 | ||||||||||||
| Other expense (income), net |
4,626 | 0.2 | (2,010 | ) | (0.1 | ) | ||||||||||
|
|
|
|
|
|
|
|
|
|||||||||
| Income before income taxes |
188,144 | 7.9 | 186,714 | 8.2 | ||||||||||||
| Income tax (benefit) expense |
(27,196 | ) | (1.2 | ) | 69,237 | 3.1 | ||||||||||
|
|
|
|
|
|
|
|
|
|||||||||
| Net income. |
$ | 215,340 | 9.1 | % | $ | 117,477 | 5.1 | % | ||||||||
|
|
|
|
|
|
|
|
|
|||||||||
| Net income per common share—basic. |
$ | 1.81 | $ | 0.98 | ||||||||||||
| Net income per common share—diluted. |
$ | 1.79 | $ | 0.98 | ||||||||||||
42
Table of Contents
Revenues
Total revenues for the year ended December 31, 2017 were $2,371.6 million and were $88.2 million or 3.9% higher than 2016. The following table sets forth our total revenues for the years ended December 31, 2017 and 2016.
| Years Ended December 31, | ||||||||||||||||
| 2017 | 2016 | |||||||||||||||
| Dollars in Thousands |
Percentage of Total Revenues |
Dollars in Thousands |
Percentage of Total Revenues |
|||||||||||||
| Net Sales: |
||||||||||||||||
| Wholesale |
$ | 1,260,089 | 53.1 | % | $ | 1,252,218 | 54.8 | % | ||||||||
| Eliminations |
(630,692 | ) | (26.6 | )% | (626,900 | ) | (27.4 | )% | ||||||||
|
|
|
|
|
|
|
|
|
|||||||||
| Net wholesale |
629,397 | 26.5 | % | 625,318 | 27.4 | % | ||||||||||
| Retail |
1,728,589 | 72.9 | % | 1,641,068 | 71.9 | % | ||||||||||
|
|
|
|
|
|
|
|
|
|||||||||
| Total net sales |
2,357,986 | 99.4 | % | 2,266,386 | 99.3 | % | ||||||||||
| Royalties and franchise fees |
13,583 | 0.6 | % | 17,005 | 0.7 | % | ||||||||||
|
|
|
|
|
|
|
|
|
|||||||||
| Total revenues |
$ | 2,371,569 | 100.0 | % | $ | 2,283,391 | 100.0 | % | ||||||||
|
|
|
|
|
|
|
|
|
|||||||||
Retail
Retail net sales during 2017 were $1,728.6 million and increased $87.5 million, or 5.3%, compared to 2016. Retail net sales at our Party City stores totaled $1,521.7 million and were $92.2 million, or 6.4%, higher than 2016 due to franchise store acquisitions and new store growth. Same-store sales were principally consistent with 2016 excluding the impact of hurricanes and a shift in the Company’s fiscal calendar which caused certain New Year’s Eve sales to shift into the first quarter of fiscal 2018 (see below for further detail). During 2017, we acquired 36 franchise stores and 8 independent stores, opened 16 new stores and closed 7 stores. Global retail e-commerce sales totaled $152.5 million during 2017 and were $0.4 million, or 0.3%, lower than during 2016 as foreign exchange negatively impacted e-commerce sales by $1.2 million. Sales at our temporary Halloween City stores were $54.4 million during 2017 and were $4.3 million, or 7.3%, lower than full-year 2016.
Same-store sales for the Party City brand (including North American retail e-commerce sales) decreased by 0.7%. Approximately 50 basis points of the decrease was due to a shift in the Company’s fiscal calendar which caused certain New Year’s Eve sales to shift into the first quarter of fiscal 2018. Additionally, Hurricanes Harvey and Irma adversely impacted brand comp sales by approximately 30 basis points. Adjusting for the negative impact of both the calendar shift and the hurricanes, results in same store sales were essentially flat with 2016 levels. Excluding the calendar shift and the hurricanes, both transaction count and average transaction dollar size were also principally consistent with full-year 2016.
Excluding the impact of e-commerce, same-store sales decreased by 0.5%. The shift in the Company’s fiscal calendar and the hurricanes negatively impacted same-store sales by 40 basis points and 30 basis points, respectively.
The North American retail e-commerce sales included in our Party City brand comp decreased by 2.2% as a 0.4% increase in transaction count was more than offset by a decrease in average transaction dollar size. Hurricane Harvey and Hurricane Irma adversely impacted the percentage by approximately 40 basis points. The decrease in average transaction dollar size principally related to increased promotional activity, largely related to free delivery of product.
Same-store sales percentages were not affected by foreign currency as such percentages are calculated in local currency.
43
Table of Contents
Wholesale
Wholesale net sales during 2017 totaled $629.4 million and were $4.1 million, or 0.7%, higher than during 2016. Net sales to domestic party goods retailers and distributors (including our franchisee network) totaled $268.6 million and were $33.3 million, or 11.0%, lower than during full-year 2016. The decrease was principally due to our acquisition of 36 franchise stores during the first quarter of 2017; as post-acquisition sales to such stores (approximately $25 million during 2016) are now eliminated as intercompany sales. Additionally, sales to existing franchisees decreased versus the corresponding period of 2016, principally due to carryover inventory from the 2016 Halloween selling season. Further, gift product sales decreased by approximately $4 million due to the continued de-emphasis and product-line refinement of our Grasslands Road gift business. Net sales of metallic balloons to domestic distributors and retailers (including our franchisee network) totaled $86.2 million during 2017 and were $4.2 million, or 5.1%, higher than during 2016 primarily due to organic growth in the category largely associated with product expansion as well as the timing of certain Valentine’s Day shipments. Our international sales (which include U.S. export sales and exclude U.S. import sales from foreign subsidiaries) totaled $274.6 million and were $33.2 million, or 13.8%, higher than during full-year 2016, despite a $2 million negative impact from foreign currency translation. The growth was principally attributable to two acquisitions (which contributed approximately $30 million of sales) and category expansion, in part driven by our store-in-store concept with key European and U.K. retailers.
Intercompany sales to our retail affiliates totaled $630.7 million during 2017 and were $3.8 million, or 0.6%, higher than during the corresponding period of 2016. Intercompany sales represented 50.1% of total wholesale sales during both 2017 and 2016. The intercompany sales of our wholesale segment are eliminated against the intercompany purchases of our retail segment in the consolidated financial statements.
Royalties and franchise fees
Royalties and franchise fees for 2017 totaled $13.6 million and were $3.4 million, or 20.1%, lower than during 2016 principally due to the acquisition of 36 franchise stores during the first quarter of 2017.
Gross Profit
The following table sets forth the Company’s gross profit for the years ended December 31, 2017 and December 31, 2016.
| Year Ended December 31, | ||||||||||||||||
| 2017 | 2016 | |||||||||||||||
| Dollars in Thousands |
Percentage of Net Sales |
Dollars in Thousands |
Percentage of Net Sales |
|||||||||||||
| Retail |
$ | 763,315 | 44.2 | % | $ | 711,468 | 43.4 | % | ||||||||
| Wholesale |
199,392 | 31.7 | 204,531 | 32.7 | ||||||||||||
|
|
|
|
|
|
|
|
|
|||||||||
| Total |
$ | 962,707 | 40.8 | % | $ | 915,999 | 40.4 | % | ||||||||
|
|
|
|
|
|
|
|
|
|||||||||
The gross profit margin on net sales at retail during 2017 was 44.2%. Such percentage was 80 basis points higher than during 2016. The benefits of increased share of shelf (i.e., the percentage of our retail product cost of sales supplied by our wholesale segment) and reduced product costs were partially offset by increased promotional activities. Our wholesale share of shelf at our Party City stores and our North American retail e-commerce operations increased from 76.6% during 2016 to 79.6% during 2017.
The gross profit on net sales at wholesale during 2017 and 2016 was 31.7% and 32.7%, respectively. The decrease was principally due to higher distribution costs, as well as sales mix.
Operating expenses
Wholesale selling expenses were $65.4 million during 2017 and $60.0 million during full-year 2016. The $5.4 million, or 9.0%, increase was mostly due to approximately $4.5 million of selling costs at Granmark
44
Table of Contents
(acquired in March 2017) and inflationary cost increases. Wholesale selling expenses were 10.4% and 9.6% of net wholesale sales during 2017 and 2016, respectively. The increase was principally due to Granmark’s selling expenses, as a percentage of net sales, being higher than the remainder of the Company’s wholesale segment.
Retail operating expenses during 2017 were $415.2 million and were $6.6 million, or 1.6%, higher than during 2016. The impact of the increased store count (discussed above) and inflationary cost increases were mostly offset by realized savings associated with improved labor productivity and efficiency in our stores and lower advertising expenses. Retail operating expenses were 24.0% and 24.9% of net retail sales during 2017 and 2016, respectively.
Franchise expenses during 2017 and 2016 were $15.0 million and $15.2 million, respectively.
General and administrative expenses during full-year 2017 totaled $168.4 million and were $15.5 million, or 10.1%, higher than in 2016. The increase was principally due to lower incentive-based compensation during 2016, general and administrative costs at acquired companies (approximately $3 million), and inflationary cost increases. Additionally, 2017 included severance charges related to a retail restructuring and the execution of a consulting agreement with Gerald Rittenberg (see Note 20 to our consolidated financial statements for further detail). General and administrative expenses as a percentage of total revenues increased from 6.7% in 2016 to 7.1% in 2017 principally due to the severance and the lower incentive-based compensation during 2016.
Art and development costs were $23.3 million and $22.2 million during 2017 and 2016, respectively. Such amounts represent 1.0% of total revenues in both periods.
Development stage expenses represent start-up costs related to Kazzam (see footnote 21 to the Company’s consolidated financial statements for further detail).
Interest expense, net
Interest expense, net, totaled $87.4 million during 2017, compared to $89.4 million during 2016. The decrease principally reflects a $100 million prepayment of the Company’s Term Loan Credit Agreement during the Company’s October 2016 refinancing; as well as the impact of the credit spread on such debt being reduced by 25 basis points at such time. The lower Term Loan Credit Agreement interest expense was partially offset by higher outstanding balances under the Company’s ABL Facility.
Other expense (income), net
During 2016, other income, net, totaled $2.0 million. Such amount included $7.4 million of foreign currency transaction gains, primarily the impact of the change in the U.S. Dollar from December 31, 2015 to December 31, 2016 and the corresponding re-measurement of the U.S. dollar-denominated receivables and payables of our foreign operations. Excluding such foreign currency gains, 2017 other expense and 2016 other expense were principally consistent.
Income tax (benefit) expense
The Company’s effective income tax rate was (14.5)% during 2017 and 37.1% during 2016.
On December 22, 2017, the Tax Cuts and Jobs Act of 2017 (“the Act”) was signed into law. The Act significantly changed U.S. tax law, including lowering the U.S. corporate income tax rate from 35% to 21%, effective January 1, 2018, and implementing a one-time “deemed repatriation” tax on unremitted earnings accumulated in non-U.S. jurisdictions since 1986. Due to the complexities of accounting for the Act, the SEC issued Staff Accounting Bulletin No. 118 which allows entities to include a provisional estimate of the impact of the Act in its 2017 financial statements. Therefore, based on currently available information, during 2017 the
45
Table of Contents
Company recorded a provisional estimate of the impact of the Act, which included an income tax benefit of $91.0 million related to the remeasurement of its domestic deferred tax liabilities and deferred tax assets due to the lower U.S. corporate tax rate. Additionally, during 2017, the Company recorded an income tax expense of $1.1 million as its provisional estimate of the Transition Tax related to the deemed repatriation of unremitted earnings of foreign subsidiaries. See footnote 13 to the consolidated financial statements in Item 8. for further discussion of the Act and the Company’s 2017 effective income tax rate.
The following tables set forth our operating results and operating results as a percentage of total revenues for the years ended December 31, 2016 and 2015.
| Years Ended December 31, | ||||||||||||||||
| 2016 | 2015 | |||||||||||||||
| (Dollars in thousands, except per share data) | ||||||||||||||||
| Revenues: |
||||||||||||||||
| Net sales |
$ | 2,266,386 | 99.3 | % | $ | 2,275,122 | 99.2 | % | ||||||||
| Royalties and franchise fees |
17,005 | 0.7 | 19,411 | 0.8 | ||||||||||||
|
|
|
|
|
|
|
|
|
|||||||||
| Total revenues |
2,283,391 | 100.0 | 2,294,533 | 100.0 | ||||||||||||
| Expenses: |
||||||||||||||||
| Cost of sales |
1,350,387 | 59.1 | 1,370,884 | 59.7 | ||||||||||||
| Wholesale selling expenses |
59,956 | 2.6 | 64,260 | 2.8 | ||||||||||||
| Retail operating expenses |
408,583 | 17.9 | 401,039 | 17.5 | ||||||||||||
| Franchise expenses |
15,213 | 0.7 | 14,394 | 0.6 | ||||||||||||
| General and administrative expenses |
152,919 | 6.7 | 151,097 | 6.6 | ||||||||||||
| Art and development costs |
22,249 | 1.0 | 20,640 | 0.9 | ||||||||||||
|
|
|
|
|
|
|
|
|
|||||||||
| Total expenses |
2,009,307 | 88.0 | 2,022,314 | 88.1 | ||||||||||||
|
|
|
|
|
|
|
|
|
|||||||||
| Income from operations |
274,084 | 12.0 | 272,219 | 11.9 | ||||||||||||
| Interest expense, net |
89,380 | 3.9 | 123,361 | 5.4 | ||||||||||||
| Other (income) expense, net |
(2,010 | ) | (0.1 | ) | 130,990 | 5.7 | ||||||||||
|
|
|
|
|
|
|
|
|
|||||||||
| Income before income taxes |
186,714 | 8.2 | 17,868 | 0.8 | ||||||||||||
| Income tax expense |
69,237 | 3.1 | 7,409 | 0.3 | ||||||||||||
|
|
|
|
|
|
|
|
|
|||||||||
| Net income. |
$ | 117,477 | 5.1 | % | $ | 10,459 | 0.5 | % | ||||||||
|
|
|
|
|
|
|
|
|
|||||||||
| Net income per common share—basic |
$ | 0.98 | $ | 0.09 | ||||||||||||
| Net income per common share—diluted |
$ | 0.98 | $ | 0.09 | ||||||||||||
46
Table of Contents
Revenues
Total revenues for the year ended December 31, 2016 were $2,283.4 million and were $11.1 million or 0.5% lower than 2015. The following table sets forth our total revenues for the years ended December 31, 2016 and 2015.
| Years Ended December 31, | ||||||||||||||||
| 2016 | 2015 | |||||||||||||||
| Dollars in Thousands |
Percentage of Total Revenues |
Dollars in Thousands |
Percentage of Total Revenues |
|||||||||||||
| Net Sales: |
||||||||||||||||
| Wholesale |
$ | 1,252,218 | 54.8 | % | $ | 1,226,989 | 53.5 | % | ||||||||
| Eliminations |
(626,900 | ) | (27.4 | )% | (573,391 | ) | (25.0 | )% | ||||||||
|
|
|
|
|
|
|
|
|
|||||||||
| Net wholesale |
625,318 | 27.4 | % | 653,598 | 28.5 | % | ||||||||||
| Retail |
1,641,068 | 71.9 | % | 1,621,524 | 70.7 | % | ||||||||||
|
|
|
|
|
|
|
|
|
|||||||||
| Total net sales |
2,266,386 | 99.3 | % | 2,275,122 | 99.2 | % | ||||||||||
| Royalties and franchise fees |
17,005 | 0.7 | % | 19,411 | 0.8 | % | ||||||||||
|
|
|
|
|
|
|
|
|
|||||||||
| Total revenues |
$ | 2,283,391 | 100.0 | % | $ | 2,294,533 | 100.0 | % | ||||||||
|
|
|
|
|
|
|
|
|
|||||||||
Retail
Retail net sales during 2016 were $1,641.1 million and increased $19.5 million, or 1.2%, compared to 2015. Retail net sales at our Party City stores totaled $1,429.5 million and were $34.6 million, or 2.5%, higher than 2015 as the effects of new store growth, franchise acquisitions and growing comp sales in Canada were partially offset by decreased comp sales in our U.S. stores and the impact of foreign currency translation. During 2016, we acquired 19 franchise stores, opened 29 new stores and closed ten stores. A strengthening of the U.S. Dollar, in comparison to the Canadian Dollar, negatively impacted our Canadian retail sales during 2016 by $2.6 million. Global retail e-commerce sales totaled $152.9 million during 2016 and were $10.0 million, or 7.0%, higher than during 2015. The e-commerce sales included in our same store sales for the Party City brand comp increased by 9.9% during the period (see below for further detail). This positive factor was partially offset by a $3.3 million decrease in e-commerce sales due to the strengthening of the U.S. Dollar in comparison to the British Pound Sterling. Sales at our temporary Halloween City stores were $58.7 million during 2016 or $25.1 million lower than in 2015. The decrease was principally due to making a strategic decision to open 65 fewer Halloween City stores during the 2016 Halloween selling season in response to the impact of the holiday falling on a Monday this year, as opposed to on a Saturday during 2015. Additionally, the average sales per Halloween City store decreased versus 2015, principally due to the shift to a Monday Halloween and the corresponding decrease in adult costume sales.
Same-store sales for the Party City brand (including North American retail e-commerce sales) decreased by 0.4% during 2016 as a 1.6% increase in average transaction dollar size was more than offset by a 2.0% decrease in transaction count. Our “everyday” business grew by approximately 3% versus the prior year, helping to mitigate the decline in our seasonal business, driven principally by the two-day shift to a Monday Halloween.
Excluding the impact of e-commerce, same-store sales decreased by 1.3% as a 1.3% increase in average transaction dollar size was more than offset by a 2.6% decrease in transaction count. The increase in average transaction dollar size was principally due to opportunistic price increases. The decrease in transaction count was primarily due to adult Halloween participation being impacted by the holiday shifting to a Monday.
The North American retail e-commerce sales included in our same store sales for the Party City brand comp increased by 9.9% as a 13.6% increase in transaction count was partially offset by a 3.7% decrease in average transaction dollar size. The increase in e-commerce transaction count reflects improved customer conversion (the
47
Table of Contents
percentage of website visitors who purchase product from the site), principally due to enhanced digital marketing, expanded product assortment and more effective promotional activity. The decrease in average transaction dollar size principally relates to the increased promotional activity, mostly related to free shipping of product, as units per transaction were essentially flat, year over year. Same-store sales percentages were not affected by foreign currency as such percentages are calculated in local currency.
Wholesale
Wholesale net sales during 2016 totaled $625.3 million and were $28.3 million, or 4.3%, lower than during 2015. Net sales to domestic party goods retailers and distributors (including our franchisee network) totaled $316.1 million and were $30.4 million, or 8.8%, lower than during 2015. The decrease was principally due to our acquisition of 23 franchise stores during December 2015 and January 2016; as post-acquisition sales to such stores (approximately $19 million during 2015) are now eliminated as intercompany sales. Additionally, gift product sales decreased by approximately $7 million due to the de-emphasis and reorganization of our Grasslands Road gift division. The remainder of the variance was principally due to slightly lower sales of Halloween product (due to the Monday Halloween). Net sales of metallic balloons to domestic distributors and retailers (including our franchisee network) totaled $82.0 million during 2016 and were $1.2 million, or 1.4%, lower than during 2015 as a portion of 2016 Valentine’s Day sales shifted into December 2015 (the corresponding 2017 Valentine’s Day sales occurred in January 2017). Excluding this shift, net sales of metallic balloons grew 1.4%, driven largely by increased assortment and overall category expansion. Our international sales (which include U.S. export sales and exclude U.S. import sales from foreign subsidiaries) totaled $227.2 million and were $3.3 million, or 1.5%, higher than in 2015, despite a $15.8 million negative impact from foreign currency translation during 2016. Our international business growth is reflective of a combination of acquisition, channel expansion, increased assortment and the growing consumer participation in parties and celebrations. International sales increased versus 2015 primarily due to the acquisition of Festival S.A. (impact of approximately $3 million), higher Halloween and Carnival sales in Germany (approximately $2 million), increased costumes sales in the U.K. (impact of approximately $2 million), higher sales of garments and accessories (impact of approximately $2 million, also principally into the U.K. market), increased sales of metallic balloons (approximately $2 million), higher sales of latex balloons (impact of approximately $2 million) and the success of a new store-in-store program with a mass merchandiser in Australia (impact of approximately $1 million).
Intercompany sales to our retail affiliates totaled $626.9 million during 2016 and were $53.5 million, or 9.3%, higher than during 2015. Intercompany sales represented 50.1% of total wholesale sales during 2016, compared to 46.7% during 2015. The increase in intercompany sales was principally due to the impact of the higher company store count (as discussed above under “-Retail”) and the increasing share of shelf (as noted below under “-Gross Profit”). The intercompany sales of our wholesale segment are eliminated against the intercompany purchases of our retail segment in the consolidated financial statements.
Royalties and franchise fees
Royalties and franchise fees for 2016 were $17.0 million and were $2.4 million lower than 2015 principally due to the acquisition of franchise stores during December 2015 and January 2016.
48
Table of Contents
Gross Profit
The following table sets forth our gross profit for the years ended December 31, 2016 and December 31, 2015.
| Year Ended December 31, | ||||||||||||||||
| 2016 | 2015 | |||||||||||||||
| Dollars in Thousands |
Percentage of Net Sales |
Dollars in Thousands |
Percentage of Net Sales |
|||||||||||||
| Retail |
$ | 711,468 | 43.4 | % | $ | 703,236 | 43.4 | % | ||||||||
| Wholesale |
204,531 | 32.7 | 201,002 | 30.8 | ||||||||||||
|
|
|
|
|
|
|
|
|
|||||||||
| Total |
$ | 915,999 | 40.4 | % | $ | 904,238 | 39.7 | % | ||||||||
|
|
|
|
|
|
|
|
|
|||||||||
The gross profit margin on net sales at retail during 2016 was 43.4%. Such percentage was consistent with 2015. Our wholesale share of shelf at our Party City stores and our North American retail e-commerce operations (i.e., the percentage of our retail product cost of sales supplied by our wholesale segment) increased from 75.0% during 2015 to 76.6% during 2016. However, the benefit of higher share of shelf and reduced product costs were offset by increased occupancy costs, associated with our store growth, and slightly higher promotions, due largely to the shift to a Monday Halloween.
The gross profit on net sales at wholesale during 2016 and 2015 was 32.7% and 30.8%, respectively. The increase was principally due to the benefits associated with improved sourcing efforts and favorable commodity costs, partially offset by the strengthening of the U.S. Dollar and its unfavorable impact on certain of our international subsidiaries that purchase product denominated in U.S. Dollars and sell in local currency.
Operating expenses
Wholesale selling expenses totaled $60.0 million in 2016 and were $4.3 million, or 6.7%, lower than 2015. The decrease was principally due to cost savings associated with the reorganization of our gift sales group (discussed above) and, to a lesser extent, the $1.5 million impact of foreign currency translation at international subsidiaries. Wholesale selling expenses were 9.6% and 9.8% of net wholesale sales during 2016 and 2015, respectively.
Retail operating expenses during 2016 were $408.6 million and were $7.5 million, or 1.9%, higher than during 2015. Higher payroll costs at our Party City stores (driven by the higher store count discussed above) were partially offset by 65 fewer temporary Halloween City stores and realized savings associated with improved labor productivity and efficiency. Foreign currency translation at international subsidiaries reduced retail operating expenses by approximately $1 million in comparison to 2015. Retail operating expenses were 24.9% and 24.7% of net retail sales during 2016 and 2015, respectively.
Franchise expenses during 2016 and 2015 were $15.2 million and $14.4 million, respectively. The $0.8 million variance was principally due to increased intangible asset amortization.
General and administrative expenses during 2016 totaled $152.9 million and were $1.8 million, or 1.2%, higher than in 2015. The increase was principally due to inflationary cost increases, higher professional fees (partially related to costs incurred in connection with Sarbanes-Oxley compliance procedures), increased store closing costs and higher stock-based compensation expense. These factors were substantially offset by lower incentive-based compensation and the impact of foreign currency translation at international subsidiaries (approximately $2 million). General and administrative expenses were 6.7% and 6.6% of total revenues during 2016 and 2015, respectively.
49
Table of Contents
Art and development costs were $22.2 million and $20.6 million during 2016 and 2015, respectively. The increase was principally due to increased head count and other product development and design costs incurred in order to support the expansion of our retail programs. Art and development costs were 1.0% and 0.9% of total revenues in 2016 and 2015, respectively.
Interest expense, net
Interest expense, net, totaled $89.4 million during 2016, compared to $123.4 million during 2015. The decrease principally reflects the reduction in interest rates following the Company’s third quarter 2015 debt refinancing (see below) and the repayment of the $350.0 million PIK notes (the “Nextco Notes”), which were fully redeemed during the second quarter 2015 with proceeds from our initial public offering (see below).
Other (income) expense, net
Other (income) expense, net generally includes foreign currency transaction (gains) losses, corporate development expenses and (gains) losses from unconsolidated joint ventures.
For 2016, other income, net, totaled $2.0 million. Foreign currency transaction gains, due to the movement of the U.S. Dollar during 2016 and the corresponding re-measurement of the U.S. dollar-denominated receivables and payables of our foreign operations, were partially offset by corporate development costs and refinancing charges. See Note 10 of the consolidated financial statements in Item 8, “Financial Statements and Supplementary Data,” for further detail.
For 2015, other expense, net, totaled $131.0 million, $79.1 million of which related to the refinancing of the Company’s debt (see below) and $46.3 million of which related to our initial public offering (see below).
During August 2015, PCHI redeemed its Old Senior Notes and refinanced its Old Term Loan Credit Agreement and Old ABL Facility with new indebtedness consisting of: (i) a senior secured term loan facility (“Term Loan Credit Agreement”), (ii) a $540 million asset-based revolving credit facility (with a seasonal increase to $640 million during a certain period of each calendar year) (“ABL Facility”) and (iii) $350 million of 6.125% senior notes (“Senior Notes”). The redemption price for the Old Senior Notes was 6.656 % of the principal amount, $46.6 million. We recorded such amount in other expense, net. Additionally, in conjunction with the refinancing, the Company wrote-off $22.7 million of previously capitalized deferred financing costs, original issuance discounts and call premiums and also recorded such amount in other expense, net. Further, in conjunction with the refinancing of the term loans, we incurred banker and legal fees, $9.8 million of which was recorded in other expense, net.
During April 2015, in conjunction with our initial public offering, we paid a 2% prepayment penalty, or $7.0 million, in order to redeem our Nextco Notes, and paid a management agreement termination fee of $30.7 million to affiliates of THL and Advent. Additionally, in conjunction with the redemption of the Nextco Notes, we wrote off $8.6 million of capitalized debt issuance costs and original issuance discounts.
Income tax expense
The decrease in our effective income tax rate from 41.5% in 2015 to 37.1% in 2016 was principally due to higher domestic and foreign pre-tax income in 2016. During 2015, domestic pre-tax income was impacted by a management agreement termination fee and refinancing-related costs (see above for further discussion).
Liquidity and Capital Resources
During August 2015, PCHI redeemed its $700.0 million Old Senior Notes and refinanced its existing $1,125.0 million Old Term Loan Credit Agreement and $400.0 million Old ABL Facility with new indebtedness consisting of: (i) a senior secured term loan facility (“Term Loan Credit Agreement”), (ii) a $540.0 million
50
Table of Contents
asset-based revolving credit facility (with a seasonal increase to $640.0 million during a certain period of each calendar year) (“ABL Facility”) and (iii) $350.0 million of 6.125% senior notes (“Senior Notes”).
ABL Facility
The ABL Facility, which matures on August 19, 2020, provides for (a) revolving loans in an aggregate principal amount at any time outstanding not to exceed $540.0 million (with a seasonal increase to $640.0 million during a certain period of each calendar year), subject to a borrowing base described below, and (b) letters of credit, in an aggregate face amount at any time outstanding not to exceed $50.0 million.
Under the ABL Facility, the borrowing base at any time equals (a) a percentage of eligible trade receivables, plus (b) a percentage of eligible inventory, plus (c) a percentage of eligible credit card receivables, less (d) certain reserves.
The ABL Facility generally provides for two pricing options: (i) an alternate base interest rate (“ABR”) equal to the greater of (a) the prime rate, (b) the federal funds rate plus 0.5% or (c) the LIBOR rate plus 1%, in each case, on the date of such borrowing or (ii) a LIBOR based interest rate, in each case plus an applicable margin. The applicable margin ranges from 0.25% to 0.50% with respect to ABR borrowings and from 1.25% to 1.50% with respect to LIBOR borrowings.
In addition to paying interest on outstanding principal, the Company is required to pay a commitment fee of 0.25% per annum in respect of unutilized commitments. The Company must also pay customary letter of credit fees.
All obligations under the ABL Facility are jointly and severally guaranteed by PC Intermediate, PCHI and each existing and future domestic subsidiary of PCHI. PCHI and each guarantor has secured its obligations, subject to certain exceptions and limitations, including obligations under its guaranty, as applicable, by a first-priority lien on its accounts receivable, inventory, cash and certain related assets and a second-priority lien on substantially all of its other assets.
The facility contains negative covenants that, among other things and subject to certain exceptions, restrict the ability of PCHI to:
| • | incur additional indebtedness; |
| • | pay dividends on capital stock or redeem, repurchase or retire capital stock; |
| • | make certain investments, loans, advances and acquisitions; |
| • | engage in transactions with affiliates; |
| • | create liens; and |
| • | transfer or sell certain assets. |
In addition, PCHI must comply with a fixed charge coverage ratio if excess availability under the ABL Facility on any day is less than the greater of: (a) 10% of the lesser of the aggregate commitments and the then borrowing base under the ABL Facility and (b) $40.0 million. The fixed charge coverage ratio is the ratio of (i) Adjusted EBITDA (as defined in the facility) minus maintenance-related capital expenditures (as defined in the facility) to (ii) fixed charges (as defined in the facility).
The ABL Facility also contains certain customary affirmative covenants and events of default.
Borrowings under the ABL Facility totaled $286.3 million at December 31, 2017, excluding the impact of deferred financing costs. The weighted average interest rate for such borrowings was 4.63%. Outstanding
51
Table of Contents
standby letters of credit totaled $26.3 million at December 31, 2017 and, after considering borrowing base restrictions, at December 31, 2017 PCHI had $172.0 million of available borrowing capacity under the terms of the facility.
Term Loan Credit Agreement
The Term Loan Credit Agreement provides for two pricing options for outstanding loans: (i) an ABR for any day, a rate per annum equal to the greater of (a) the prime rate in effect on such day, (b) the federal funds effective rate in effect on such day plus 0.5%, (c) the adjusted LIBOR rate plus 1% and (d) 1.75% or (ii) the LIBOR rate, with a LIBOR floor of 0.75%, in each case plus an applicable margin. At December 31, 2017, the applicable margin was 2.00% with respect to ABR borrowings and 3.00% with respect to LIBOR borrowings. At December 31, 2017, the weighted average interest rate for outstanding borrowings was 4.46%.
During February 2018, the Company amended the Term Loan Credit Agreement. At the time of the amendment, all outstanding term loans were replaced with new term loans for the same principal amount. The applicable margin for ABR borrowings was lowered from 2.00% to 1.75% and the applicable margin for LIBOR borrowings was lowered from 3.00% to 2.75%. Additionally, based on the terms of the amendment, the ABR and LIBOR margins will drop to 1.50% and 2.50%, respectively, if the Company’s Senior Secured Leverage Ratio, as defined by the agreement, falls below 3.2 to 1.0. The amendment provides that the term loans are subject to a 1.00% prepayment premium if voluntarily repaid within six months from the date of the amendment. Otherwise, the term loans may be voluntarily prepaid at any time without premium or penalty, other than customary breakage costs with respect to loans based on the LIBOR rate.
The term loans are subject to mandatory prepayment, subject to certain exceptions, with (i) 100% of net proceeds above a threshold amount of certain asset sales/insurance proceeds, subject to reinvestment rights and certain other exceptions, (ii) 100% of the net cash proceeds of any incurrence of debt other than debt permitted under the Term Loan Credit Agreement, (iii) 50% of Excess Cash Flow, as defined in the agreement, if any (reduced to 25% if PCHI’s first lien leverage ratio (as defined in the agreement) is less than 3.50 to 1.00, but greater than 2.50 to 1.00, and 0% if PCHI’s first lien leverage ratio is less than 2.50 to 1.00). In conjunction with the amendment of the agreement in February 2018, the requirement to make an Excess Cash Flow payment for the year ended December 31, 2017 was eliminated.
The term loans under the Term Loan Credit Agreement mature on August 19, 2022. The Company is required to repay installments on the loans in quarterly principal amounts of 0.25%, with the remaining amount payable on the maturity date.
All obligations under the agreement are jointly and severally guaranteed by PC Intermediate, PCHI and each existing and future domestic subsidiary of PCHI. PCHI and each guarantor has secured its obligations, subject to certain exceptions and limitations, by a first-priority lien on substantially all of its assets (other than accounts receivable, inventory, cash and certain related assets), including a pledge of all of the capital stock held by PC Intermediate, PCHI and each guarantor, and a second-priority lien on its accounts receivable, inventory, cash and certain related assets.
The Term Loan Credit Agreement contains certain customary affirmative covenants and events of default. Additionally, it contains negative covenants which, among other things and subject to certain exceptions, restrict the ability of PCHI to:
| • | incur additional indebtedness; |
| • | pay dividends on capital stock or redeem, repurchase or retire capital stock; |
| • | make certain investments, loans, advances and acquisitions; |
| • | engage in transactions with affiliates; |
52
Table of Contents
| • | create liens; and |
| • | transfer or sell certain assets. |
At December 31, 2017, the outstanding principal amount of term loans under the Term Loan Credit Agreement was $1,211.3 million, excluding the impact of deferred financing costs, original issue discounts and capitalized call premiums.
Senior Notes
The Senior Notes mature on August 15, 2023. Interest on the notes is payable semi-annually in arrears on February 15 and August 15 of each year.
The notes are guaranteed, jointly and severally, on a senior basis by each of PCHI’s existing and future wholly-owned domestic subsidiaries. The Senior Notes and the guarantees are general unsecured senior obligations and are effectively subordinated to all other secured debt to the extent of the assets securing such secured debt.
The indenture governing the Senior Notes contains certain covenants limiting, among other things and subject to certain exceptions, PCHI’s ability to:
| • | incur additional indebtedness or issue certain disqualified stock and preferred stock; |
| • | pay dividends or distributions, redeem or repurchase equity; |
| • | prepay subordinated debt or make certain investments; |
| • | engage in transactions with affiliates; |
| • | consolidate, merge or transfer all or substantially all of PCHI’s assets; |
| • | create liens; and |
| • | transfer or sell certain assets. |
The indenture governing the notes also contains certain customary affirmative covenants and events of default.
On or after August 15, 2018, the Company may redeem the Senior Notes, in whole or in part, at the following (expressed as a percentage of the principal amount to be redeemed):
| Twelve-month period beginning on August 15, |
Percentage | |||
| 2018 |
103.063 | % | ||
| 2019 |
101.531 | % | ||
| 2020 and thereafter |
100.000 | % | ||
In addition, the Company may redeem up to 40% of the aggregate principal amount outstanding on or before August 15, 2018 with the net cash proceeds from certain equity offerings at a redemption price of 106.125% of the principal amount. The Company may also redeem some or all of the Senior Notes before August 15, 2018 at a redemption price of 100% of the principal amount plus a premium that is defined in the indenture.
Also, if the Company experiences certain types of change in control, as defined, the Company may be required to offer to repurchase the Senior Notes at 101% of their principal amount.
At December 31, 2017, the balance of the Senior Notes, net of unamortized deferred financing costs, was $345.4 million. Such amount is recorded in “long-term obligations, excluding current portion” in the Company’s consolidated balance sheet.
53
Table of Contents
Other Credit Agreements
At December 31, 2017 and December 31, 2016, borrowings under the foreign facilities totaled $2.3 million and $1.2 million, respectively.
Other Indebtedness
Additionally, we have entered into various capital leases for machinery and equipment. At December 31, 2017 and December 31, 2016 the balances of such leases in our consolidated balance sheets were $3.3 million and $2.9 million, respectively. We also have numerous non-cancelable operating leases for retail store sites, as well as several leases for offices, distribution and manufacturing facilities, showrooms and equipment. These leases generally contain renewal options and require us to pay real estate taxes, utilities and related insurance costs.
Liquidity
We expect that cash generated from operating activities and availability under our credit agreements will be our principal sources of liquidity. Based on our current level of operations, we believe that these sources will be adequate to meet our liquidity needs for at least the next 12 months. We cannot assure you, however, that our business will generate sufficient cash flow from operations or that future borrowings will be available to us under the ABL Facility and the Term Loan Credit Agreement in amounts sufficient to enable us to repay our indebtedness or to fund our other liquidity needs. See “Risk Factors—We may not be able to generate sufficient cash to service all of our indebtedness and may be forced to take other actions to satisfy our obligations under our indebtedness, which may not be successful.”
Cash Flow Data—Year Ended December 31, 2017 Compared to Year Ended December 31, 2016
Net cash provided by operating activities totaled $267.9 million and $257.8 million during 2017 and 2016, respectively. Net cash flows provided by operating activities before changes in operating assets and liabilities were $219.3 million during 2017, compared to $234.1 million during 2016. The slight decrease was primarily due to a smaller increase in the Company’s deferred rent liability. Changes in operating assets and liabilities during 2017 and 2016 resulted in a source of cash of $48.6 million and $23.7 million, respectively. The source of cash was higher during 2017 principally due to the sell through of carryover inventory from the 2016 Halloween selling season.
Net cash used in investing activities totaled $141.6 million during 2017, as compared to $113.7 million during 2016. Investing activities during 2017 included $74.7 million paid in connection with acquisitions, principally related to franchise stores and Granmark (see footnote 5 to the consolidated financial statements in Item 8. for further detail). Capital expenditures during 2017 and 2016 were $67.0 million and $81.9 million, respectively. Retail capital expenditures totaled $34.5 million during 2017 and principally related to store conversions and information technology-related expenditures. Wholesale capital expenditures during 2017 totaled $32.5 million and primarily related to printing plates and dies, as well as machinery and equipment at the Company’s manufacturing operations and main distribution center.
Net cash used in financing activities was $140.0 million during 2017, as compared to $119.7 million during 2016. During 2017, the Company repurchased 23,379,567 shares of common stock for $286.7 million.
Cash Flow Data—Year Ended December 31, 2016 Compared to Year Ended December 31, 2015
Net cash provided by operating activities totaled $257.8 million during 2016. Net cash provided by operating activities totaled $80.2 million during 2015. Net cash flows provided by operating activities before changes in operating assets and liabilities were $234.1 million during 2016 and $140.8 million during 2015. The
54
Table of Contents
increase in net cash flows provided by operating activities before changes in operating assets and liabilities was due to improved profitability in 2016 principally driven by 2015 including refinancing costs and a management agreement termination fee (see “Results of Operations” above for further discussion) and 2016 including lower interest expense. Interest expense decreased due to the redemption of the Nextco Notes, which were fully redeemed during the second quarter of 2015 with proceeds from the Company’s initial public offering, and the reduction in interest rates following the Company’s third quarter 2015 debt refinancing. Changes in operating assets and liabilities during 2016 provided $23.7 million of cash. Changes in operating assets and liabilities during 2015 resulted in the use of cash of $60.6 million. The variance was principally due to the timing of trade payable payments and 2016 benefitting from lower income tax payments (as taxable income decreased in 2015 due to non-recurring payments related to the initial public offering and the debt refinancing). These positive factors were partially offset by higher inventory levels due to increased store count and Halloween carryover product.
Net cash used in investing activities totaled $113.7 million during 2016, as compared to $100.1 million during 2015. Investing activities during 2016 included $31.8 million paid in connection with the acquisitions of franchise stores and a costumes manufacturer. Capital expenditures during 2016 and 2015 were $81.9 million and $78.8 million, respectively. Retail capital expenditures totaled $55.0 million during 2016 and principally related to store conversions and new stores. Wholesale capital expenditures totaled $26.9 million and primarily related to printing plates and dies, as well as machinery and equipment at the Company’s manufacturing operations.
Net cash used in financing activities was $119.7 million during 2016, as compared to a source of $18.9 million during 2015. The variance was principally due to the lower interest payments (noted above) and 2015 including refinancing costs and the management agreement termination fee.
Tabular Disclosure of Contractual Obligations
Our contractual obligations at December 31, 2017 are summarized by the year in which the payments are due in the following table (amounts in thousands):
| Total | 2018 | 2019 | 2020 | 2021 | 2022 | Thereafter | ||||||||||||||||||||||
| Long-term debt obligations (a) |
$ | 1,561,268 | $ | 12,266 | $ | 12,266 | $ | 12,266 | $ | 12,266 | $ | 1,162,204 | $ | 350,000 | ||||||||||||||
| Capital lease obligations (a) |
3,276 | 793 | 716 | 604 | 800 | 363 | 0 | |||||||||||||||||||||
| Operating lease obligations (a) |
1,053,588 | 186,278 | 161,996 | 146,603 | 132,217 | 115,502 | 310,992 | |||||||||||||||||||||
| Transition Tax on unremitted foreign earnings(b) |
11,500 | 920 | 920 | 920 | 920 | 920 | 6,900 | |||||||||||||||||||||
| Minimum product royalty obligations (a) |
56,003 | 29,879 | 18,982 | 6,992 | 150 | 0 | 0 | |||||||||||||||||||||
|
|
|
|
|
|
|
|
|
|
|
|
|
|
|
|||||||||||||||
| Total contractual obligations |
$ | 2,685,635 | $ | 230,136 | $ | 194,880 | $ | 167,385 | $ | 146,353 | $ | 1,278,989 | $ | 667,892 | ||||||||||||||
|
|
|
|
|
|
|
|
|
|
|
|
|
|
|
|||||||||||||||
| (a) | See Item 8, “Financial Statements and Supplementary Data,” for further detail. |
| (b) | As a result of the Act, the U.S. is transitioning from a worldwide system of international taxation to a territorial tax system, thereby eliminating the U.S. federal tax on foreign earnings. However, the Act requires a one-time deemed repatriation tax on such earnings and, accordingly, during the fourth quarter of 2017, we provisionally recorded a transition tax of $11.5 million related to such requirement. Prior to the fourth quarter of 2017, we recorded deferred income tax liabilities for certain foreign earnings which were expected to be remitted to the U.S. in future periods. Therefore, the expense that was provisionally recorded due to the deemed repatriation tax, $11.5 million, was mostly offset by the reversal of previously recorded deferred income tax liabilities on unremitted foreign earnings, $10.4 million. |
Not included in the above table are borrowings under the ABL Facility of $286.3 million, with a maturity date of 2020, and borrowings under our foreign credit facilities of $2.3 million.
55
Table of Contents
Not included in the above table are $0.9 million of net potential cash obligations associated with unrecognized tax benefits due to the high degree of uncertainty regarding the timing of future cash outflows associated with such obligations. Refer to the notes to the consolidated financial statements which are included elsewhere in this Annual Report on Form 10-K for further information related to unrecognized tax benefits.
Additionally, not included in the above table are expected interest payments associated with the Term Loan Credit Agreement and the Senior Notes, of approximately $75.3 million in 2018, $74.7 million in 2019, $74.2 million in 2020, $73.6 million in 2021, $54.3 million in 2022 and $13.4 million thereafter. Interest payments are estimates based on our debt’s scheduled maturities and stated interest rates or, for variable rate debt, interest rates as of December 31, 2017. Our estimates do not reflect interest payments on the credit facilities or the possibility of additional interest from the refinancing of our debt as such amounts are not determinable.
Off-Balance Sheet Arrangements
We do not have any off-balance sheet arrangements.
Effects of Inflation
Although we expect that our operating results will be influenced by general economic conditions, we do not believe that inflation has had a material effect on our results of operations during the periods presented. However, there can be no assurance that our business will not be affected by inflation in the future.
Critical Accounting Policies and Procedures
The preparation of financial statements in conformity with accounting principles generally accepted in the United States of America requires the appropriate application of certain accounting policies, many of which require estimates and assumptions about future events and their impact on amounts reported in the financial statements and related notes. Since future events and their impact cannot be determined with certainty, the actual results will inevitably differ from our estimates. Such differences could be material to the consolidated financial statements included herein.
We believe our application of accounting policies, and the estimates inherently required by these policies, are reasonable. These accounting policies and estimates are constantly re-evaluated and adjustments are made when facts and circumstances dictate a change. Historically, we have found the application of accounting policies to be reasonable, and actual results generally do not differ materially from those determined using necessary estimates.
Revenue Recognition
Revenue from retail store operations is recognized at the point of sale. Retail e-commerce sales are recognized when the consumer receives the product. Due to its extensive history operating as the largest party goods retailer in North America, the Company has sufficient history with which to estimate future retail sales returns.
The transaction price for the overwhelming majority of the Company’s retail sales is based on either: 1) the item’s stated price or 2) the stated price adjusted for the impact of a coupon which can only be applied to such transaction. To the extent that the Company charges customers for freight costs on e-commerce sales, the Company records such amounts in revenue. The Company excludes all sales taxes and value-added taxes from revenue.
Under the terms of its agreements with its franchisees, the Company provides both: 1) brand value (via significant advertising spend) and 2) support with respect to planograms, in exchange for a royalty fee that ranges
56
Table of Contents
from 4% to 6% of the franchisees’ sales. The Company records the royalty fees at the time that the franchisees’ sales are recorded. Additionally, although the Company anticipates that future franchise store openings will be limited, when a franchisee opens a new store, the Company receives and records a one-time fee which is earned by the Company for its assistance with site selection and development of the new location. Both the sales-based royalty fee and the one-time fee are recorded in royalties and franchise fees in the Company’s consolidated statement of operations and comprehensive income.
For most of the Company’s wholesale sales, revenue is recognized upon the Company’s shipment of the product as: 1) legal title transfers on such date and 2) the Company has a present right to payment at such time. Wholesale sales returns are not significant as the Company generally only accepts the return of goods that were shipped to the customer in error or that were damaged when received by the customer. Additionally, due to its extensive history operating as a leading party goods wholesaler, the Company has sufficient history with which to estimate future sales returns.
In most cases, the determination of the transaction price is straight-forward as it is fixed based on the contract and/or purchase order. However, a limited number of customers receive volume-based rebates. Additionally, certain customers receive small discounts for early payment (generally 1% of the transaction price). Based on the business’ long history as a leading party goods wholesaler, the Company has sufficient history with which to estimate variable consideration for such volume-based rebates and early payment discounts. To the extent that the Company charges customers for freight costs, the Company records such amounts in revenue. The Company excludes all sales taxes and value-added taxes from revenue.
The majority of the sales for the Company’s wholesale business are due within 30 to 120 days from the transfer of control of the product and substantially all of the sales are collected within a year from such transfer.
Although most of the Company’s revenue transactions consist of fixed transaction prices and the transfer of control at either the point of sale (for retail) or when the product is shipped (for wholesale), certain transactions involve a limited number of judgments. For transactions for which control transfers to the customer when the freight carrier delivers the product to the customer, the Company estimates the date of such receipt based on historical shipping times. Additionally, the Company utilizes historical data to estimate sales returns, volume-based rebates and discounts for early payments by customers. Due to its extensive history operating as a leading party goods retailer and wholesaler, the Company has sufficient history with which to estimate such amounts.
Revenues, and the related profit, on sales from the Company’s wholesale segment to its retail segment are eliminated in consolidation.
Product Royalty Agreements
We enter into product royalty agreements that allow us to use licensed designs on certain of our products. These contracts require us to pay royalties, generally based on the sales of such product and may require guaranteed minimum royalties, a portion of which may be paid in advance. We match royalty expense with revenue by recording royalties at the time of sale, at the greater of the contractual rate or an effective rate calculated based on the guaranteed minimum royalty and our estimate of sales during the contract period. Guaranteed minimum royalties paid in advance are recorded in the consolidated balance sheets in either prepaid expenses and other current assets or other assets, depending on the nature of the royalties.
Allowance for Doubtful Accounts
We maintain allowances for doubtful accounts for estimated losses resulting from the inability of our customers and franchisees to make required payments. A considerable amount of judgment is required in assessing the ultimate realization of these receivables, including consideration of our history of receivable write-offs, the level of past due accounts and the economic status of our customers. In an effort to identify adverse
57
Table of Contents
trends relative to customer economic status, we assess the financial health of the markets we operate in and perform periodic credit evaluations of our customers and ongoing reviews of account balances and aging of receivables. Amounts are considered past due when payment has not been received within the time frame of the credit terms extended. Write-offs are charged directly against the allowance for doubtful accounts and occur only after all collection efforts have been exhausted. Because we cannot predict future changes in economic conditions and in the financial stability of our customers, actual future losses from uncollectible accounts may differ from our estimates and could impact our allowance for doubtful accounts.
Inventories
Inventories are valued at the lower of cost and net realizable value. In assessing the ultimate realization of inventories, we are required to make judgments regarding, among other things, future demand and market conditions, current inventory levels and the impact of the possible discontinuation of product designs.
We principally determine the cost of inventory using the weighted average method.
We estimate retail inventory shortage for the period between physical inventory dates on a store-by-store basis. Our inventory shortage estimate can be affected by changes in merchandise mix and changes in actual shortage trends. The shrinkage rate from the most recent physical inventory, in combination with historical experience, is the basis for estimating shrinkage.
Long-Lived and Intangible Assets (including Goodwill)
We review the recoverability of our long-lived assets, including finite-lived intangible assets, whenever facts and circumstances indicate that the carrying amount may not be fully recoverable. For purposes of recognizing and measuring impairment, we evaluate long-lived assets other than goodwill based upon the lowest level of independent cash flows ascertainable to evaluate impairment. If the sum of the undiscounted future cash flows expected over the remaining asset life is less than the carrying value of the assets, we may recognize an impairment loss. The impairment related to long-lived assets is measured as the amount by which the carrying amount of the asset(s) exceeds the fair value of the asset(s). When fair values are not readily available, we estimate fair values using discounted expected future cash flows. Such estimates of fair value require significant judgment, and actual fair value could differ due to changes in the expectations of cash flows or other assumptions, including discount rates.
In the evaluation of the fair value and future benefits of finite long-lived assets attached to retail stores, we perform our cash flow analysis on a store-by-store basis. Various factors including future sales growth and profit margins are included in this analysis. To the extent these future projections or strategies change, the conclusion regarding impairment may differ from the current estimates.
Goodwill is reviewed for potential impairment on an annual basis or more frequently if circumstances indicate a possible impairment.
For purposes of testing goodwill for impairment, reporting units are determined by identifying individual components within our organization which constitute a business for which discrete financial information is available and is reviewed by management. Components within a segment are aggregated to the extent that they have similar economic characteristics. Based on this evaluation, we have determined that our operating segments, wholesale and retail, represent our reporting units for the purposes of our goodwill impairment test.
If it is concluded that it is more likely than not that the fair value of a reporting unit is less than its carrying value, we estimate the fair value of the reporting unit using a combination of a market approach and an income approach. If the carrying amount of a reporting unit exceeds its fair value, the excess, if any, of the fair value of the reporting unit over amounts allocable to the unit’s other assets and liabilities is the implied fair value of
58
Table of Contents
goodwill. If the carrying amount of a reporting unit’s goodwill exceeds the implied fair value of that goodwill, an impairment loss will be recognized in an amount equal to that excess. The fair value of a reporting unit refers to the amount at which the unit as a whole could be sold in a current transaction between willing parties. The determination of such fair value is subjective, and actual fair value could differ due to changes in the expectations of cash flows or other assumptions including discount rates.
Income Taxes
Temporary differences arising from differing treatment of income and expense items for tax and financial reporting purposes result in deferred tax assets and liabilities that are recorded on the balance sheet. These balances, as well as income tax expense, are determined through management’s estimations, interpretation of tax law for multiple jurisdictions and tax planning. However, inherent in the measurement of deferred balances are certain judgments and interpretations of enacted tax laws and published guidance with respect to applicability to our operations. If our actual results differ from estimated results due to changes in tax laws or tax planning, our effective tax rate and tax balances could be affected. As such, these estimates may require adjustment in the future as additional facts become known or as circumstances change. A valuation allowance is established against deferred tax assets when it is more likely than not that some portion or all of the deferred tax assets will not be realized.
During the ordinary course of business, there are many transactions and calculations for which the ultimate tax determination is uncertain. Accounting Standards Codification Topic 740 prescribes a comprehensive model of how a company should recognize, measure, present and disclose in its financial statements uncertain tax positions that the company has taken or expects to take on a tax return. In accordance with these requirements, we recognize a tax benefit when a tax position is more-likely-than-not to be sustained upon examination, based solely on its technical merits. We measure the recognized tax benefit as the largest amount of tax benefit that has greater than a 50% likelihood of being realized upon the ultimate settlement with a taxing authority. We reverse previously recognized tax benefits if we determine that the tax position no longer meets the more-likely-than-not threshold of being sustained. We accrue interest and penalties related to unrecognized tax benefits in income tax expense.
Stock-Based Compensation
Accounting for stock-based compensation requires measurement of compensation cost for all stock-based awards at fair value on the date of grant and recognition of compensation over the service period for awards expected to vest. The value of our stock-based awards is recognized as expense over the service period, net of estimated forfeitures. The estimation of stock awards that will ultimately vest requires judgment, and to the extent actual results or updated estimates differ from our current estimates, such amounts will be recorded as a cumulative adjustment in the period estimates are revised. Actual results and future estimates may differ substantially from our current estimates.
The Company granted stock options during 2013, prior to the Company’s stock being publicly traded. With the assistance of an independent third-party valuation firm, we determined the fair value of the common stock underlying such options by using a market approach and an income approach and taking the average of the two approaches. The market approach involved estimating EBITDA multiples and the income approach involved estimating future cash flows and determining the present value of such cash flows based on a discount rate. The estimates are complex and subjective. See the footnotes of the consolidated financial statements, included in Item 8, “Financial Statements and Supplementary Data,” for a discussion of additional inputs which were used for purposes of determining the fair value of such stock options.
Recently Issued Accounting Pronouncements
In In August 2017, the Financial Accounting Standards Board (“FASB”) issued Accounting Standards Update (“ASU”) 2017-12, “Derivatives and Hedging: Targeted Improvements to Accounting for Hedging
59
Table of Contents
Activities”. The pronouncement amends the existing hedge accounting model in order to enable entities to better portray the economics of their risk management activities in their financial statements. The update is effective for the Company during the first quarter of 2019. Although the Company continues to evaluate this pronouncement, it does not believe that it will have a material impact on the Company’s consolidated financial statements.
In November 2016, the FASB issued ASU 2016-18, “Statement of Cash Flows: Restricted Cash”. The pronouncement clarifies how entities should present changes in restricted cash on the statement of cash flows. The update is effective for the Company during the first quarter of 2018. Although the Company continues to evaluate this pronouncement, it does not believe that it will have a material impact on the Company’s consolidated financial statements.
In August 2016, the FASB issued ASU 2016-15, “Statement of Cash Flows: Classification of Certain Cash Receipts and Cash Payments”. The pronouncement clarifies how entities should classify certain cash receipts and cash payments on the statement of cash flows. The update is effective for the Company during the first quarter of 2018. Although the Company continues to evaluate this pronouncement, it does not believe that it will have a material impact on the Company’s consolidated financial statements.
In March 2016, the FASB issued ASU 2016-09, “Compensation—Stock Compensation: Improvements to Employee Share-Based Payment Accounting”. The pronouncement simplifies several aspects of the accounting for share-based payment transactions. The Company adopted the pronouncement during the first quarter of 2017 and such adoption did not have a material impact on the Company’s consolidated financial statements.
In February 2016, the FASB issued ASU 2016-02, “Leases”. The ASU requires that companies recognize on their balance sheets assets and liabilities for the rights and obligations created by the companies’ leases. The update is effective for the Company during the first quarter of 2019. The Company is in the process of evaluating the impact of the pronouncement on the Company’s consolidated financial statements.
In January 2016, the FASB issued ASU 2016-01, “Financial Instruments – Overall: Recognition and Measurement of Financial Assets and Financial Liabilities”. The update impacts the accounting for equity investments and the recognition of changes in fair value of financial liabilities when the fair value option is elected. The pronouncement will be effective for the Company during the first quarter of 2018. Although the Company continues to evaluate this pronouncement, it does not believe that it will have a material impact on the Company’s consolidated financial statements.
In July 2015, the FASB issued ASU 2015-11, “Inventory: Simplifying the Measurement of Inventory”. The update changes the measurement principle for inventory from the lower of cost or market to lower of cost and net realizable value. The Company adopted the pronouncement during the first quarter of 2017 and such adoption did not have a material impact on the Company’s consolidated financial statements.
In May 2014, the FASB issued ASU 2014-09, “Revenue from Contracts with Customers (Topic 606)”. The pronouncement contains a five-step model which replaces most existing revenue recognition guidance. The new standard is effective for the Company during the first quarter of 2018. The pronouncement can be applied retrospectively to prior reporting periods or on a modified retrospective basis through a cumulative-effect adjustment as of the date of adoption. The Company has decided to adopt the pronouncement using the modified retrospective approach. The pronouncement will not have a material impact on the Company’s consolidated financial statements. On January 1, 2018, the Company will adjust its accounting for certain discounts which are tied to the timing of payments by customers of its wholesale business and the Company will record a cumulative-effect adjustment which will reduce retained earnings by less than $0.1 million. Additionally, as of such date, the Company will modify its accounting for certain metallic balloon sales of its wholesale segment and defer the recognition of revenue on such sales, and the related costs, until the balloons have been filled with helium. As a result, the Company will record a cumulative-effect adjustment which will increase retained earnings by less than
60
Table of Contents
$0.1 million. Finally, as of such date, the Company will adjust its accounting for certain discounts on wholesale sales of seasonal product and the Company will record a cumulative-effect adjustment which will reduce retained earnings by less than $0.1 million.
Quarterly Results
Despite a concentration of holidays in the fourth quarter of the year, as a result of our expansive product lines and customer base and increased promotional activities, the impact of seasonality on the quarterly results of our wholesale segment has been limited. However, due to Halloween and Christmas, the inventory balances of our wholesale segment are slightly higher during the third quarter than during the remainder of the year. Additionally, the promotional activities of our wholesale business, including special dating terms, particularly with respect to Halloween products sold to retailers and other distributors, result in slightly higher accounts receivable balances during the third quarter. Our retail segment is subject to significant seasonal variations. Historically, our retail segment has realized a significant portion of its revenues, cash flow and net income in the fourth quarter of the year, principally due to our Halloween sales in October and, to a lesser extent, year-end holiday sales. The table below sets forth our historical revenues, gross profit, income (loss) from operations, net income (loss), net income (loss) attributable to Party City Holdco Inc., net income (loss) per common share – Basic, and net income (loss) per common share—Diluted for each of the last twelve quarters (dollars in thousands):
| For the Three Months Ended, | ||||||||||||||||
| March 31, | June 30, | September 30, | December 31, | |||||||||||||
| 2017: |
||||||||||||||||
| Net sales |
$ | 473,963 | $ | 541,653 | $ | 557,350 | $ | 785,020 | ||||||||
| Royalties and franchise fees |
3,036 | 3,225 | 2,759 | 4,563 | ||||||||||||
| Gross profit |
175,244 | 219,753 | 199,827 | 367,883 | ||||||||||||
| Income from operations |
14,671 | 60,699 | 37,388 | 167,378 | ||||||||||||
| Net (loss) income |
(4,683 | ) | 24,982 | 10,084 | 184,957 | (a) | ||||||||||
| Net (loss) income per common share—Basic |
$ | (0.04 | ) | $ | 0.21 | $ | 0.08 | $ | 1.59 | (a) | ||||||
| Net (loss) income per common share—Diluted |
$ | (0.04 | ) | $ | 0.21 | $ | 0.08 | $ | 1.58 | (a) | ||||||
| For the Three Months Ended, | ||||||||||||||||
| March 31, | June 30, | September 30, | December 31, | |||||||||||||
| 2016: |
||||||||||||||||
| Net sales |
$ | 454,286 | $ | 515,426 | $ | 553,382 | $ | 743,292 | ||||||||
| Royalties and franchise fees |
3,454 | 3,987 | 3,568 | 5,996 | ||||||||||||
| Gross profit |
166,519 | 207,561 | 196,720 | 345,199 | ||||||||||||
| Income from operations |
19,556 | 58,480 | 36,918 | 159,130 | ||||||||||||
| Net (loss) income |
(394 | ) | 22,515 | 10,180 | 85,176 | |||||||||||
| Net (loss) income per common share—Basic |
$ | (0.00 | ) | $ | 0.19 | $ | 0.09 | $ | 0.71 | |||||||
| Net (loss) income per common share—Diluted |
$ | (0.00 | ) | $ | 0.19 | $ | 0.08 | $ | 0.71 | |||||||
| For the Three Months Ended, | ||||||||||||||||
| March 31, | June 30, | September 30, | December 31, | |||||||||||||
| 2015: |
||||||||||||||||
| Net sales |
$ | 458,195 | $ | 491,206 | $ | 551,380 | $ | 774,341 | ||||||||
| Royalties and franchise fees |
3,910 | 4,314 | 4,027 | 7,160 | ||||||||||||
| Gross profit |
163,921 | 188,343 | 189,850 | 362,124 | ||||||||||||
| Income from operations |
24,004 | 46,067 | 31,480 | 170,668 | ||||||||||||
| Net (loss) income |
(8,525 | ) | (23,050 | ) | (44,489 | ) | 86,523 | |||||||||
| Net (loss) income per common share—Basic |
$ | (0.09 | ) | $ | (0.20 | ) | $ | (0.37 | ) | $ | 0.73 | |||||
| Net (loss) income per common share—Diluted |
$ | (0.09 | ) | $ | (0.20 | ) | $ | (0.37 | ) | $ | 0.72 | |||||
61
Table of Contents
| (a) | On December 22, 2017, the Tax Cuts and Jobs Act of 2017 (“the Act”) was signed into law. The Act significantly changed U.S. tax law, including lowering the U.S. corporate income tax rate from 35% to 21%, effective January 1, 2018, and implementing a one-time “deemed repatriation” tax on unremitted earnings accumulated in non-U.S. jurisdictions since 1986. Due to the complexities of accounting for the Act, the SEC issued Staff Accounting Bulletin No. 118 which allows entities to include a provisional estimate of the impact of the Act in its 2017 financial statements. Therefore, based on currently available information, during 2017 the Company recorded a provisional estimate of the impact of the Act, which included an income tax benefit of $91.0 million related to the remeasurement of its domestic deferred tax liabilities and deferred tax assets due to the lower U.S. corporate tax rate. Additionally, during 2017, the Company recorded an income tax expense of $1.1 million as its provisional estimate of the Transaction Tax related to the deemed repatriation of unremitted earnings of foreign subsidiaries. |
62
Table of Contents
| Item 7A. | Quantitative and Qualitative Disclosures about Market Risk |
Interest Rate Risk
As a result of our variable rate ABL Facility and Term Loan Credit Agreement, our earnings are affected by changes in interest rates.
The Term Loan Credit Agreement provides for two pricing options for outstanding loans: (i) an ABR for any day, a rate per annum equal to the greater of (a) the prime rate in effect on such day, (b) the federal funds effective rate in effect on such day plus 0.5%, (c) the adjusted LIBOR rate plus 1% and (d) 1.75% or (ii) the LIBOR rate, with a LIBOR floor of 0.75%, in each case plus an applicable margin. As of December 31, 2017, the applicable margin was 2.00% with respect to ABR borrowings and 3.00% with respect to LIBOR borrowings. At December 31, 2017, the weighted average interest rate for outstanding borrowings was 4.46%.
Assuming that the Term Loan Credit Agreement did not have a LIBOR floor, if market interest rates for our variable rate indebtedness averaged 2% more than the actual market interest rates during the year ended December 31, 2017, our interest expense for the year would have increased by $27.8 million.
This amount is determined by considering the impact of the hypothetical interest rates on our borrowings. This analysis does not consider the effects of the reduced level of overall economic activity that could exist in such an environment. Further, in the event of a change of such magnitude, management could potentially take action to mitigate our exposure to the change. However, due to the uncertainty of the specific actions that we would take and their possible effects, the sensitivity analysis assumes no changes in our financial structure.
Foreign Currency Risk
As a result of the sale of our products in foreign markets, our earnings are affected by fluctuations in the value of the U.S. Dollar (“USD”) when compared to the values of foreign currencies. Specifically, foreign currency fluctuations impact us in four ways:
| 1) | Certain foreign subsidiaries purchase product or raw materials in U.S. Dollars and sell such product in their local currencies. To the extent that the subsidiaries cannot adjust their local currency selling prices to reflect the strengthening of the U.S. Dollar, the subsidiaries’ gross margins are negatively impacted when the related product is sold. The subsidiaries that are impacted by this risk principally operate in the Canadian dollar, Euro, British Pound Sterling, Australian dollar and Mexican Peso. Canadian dollar-based subsidiaries purchase approximately $40 million of USD-denominated product per year. Euro-based subsidiaries purchase approximately $25 million of USD-denominated product per year. British Pound Sterling-based subsidiaries and Australian Dollar-based subsidiaries purchase approximately $20 million and $10 million of USD-denominated product per year, respectively. Mexican Peso-based subsidiaries purchase approximately $5 million of USD-denominated raw materials per year. |
| 2) | Certain foreign subsidiaries sell product in U.S. Dollars and manufacture/purchase such product in their local currencies. To the extent that the subsidiaries cannot adjust their selling prices to reflect the weakening of the U.S. Dollar, the subsidiaries’ gross margins are negatively impacted when sales occur. The subsidiaries that are impacted by this risk principally operate in the Malaysian Ringgit. Ringgit-based subsidiaries sell approximately $20 million of product in U.S. Dollars on an annual basis. |
We periodically enter into foreign currency forward contracts to hedge against a portion of the earnings impact of the risks discussed in points 1. and 2. See Note 18 of Item 8, “Financial Statements and Supplementary Data,” for further detail of our existing contracts. Although we periodically enter into such contracts, we (1) may not be able to achieve hedge effectiveness in order to qualify for “hedge accounting” treatment and, therefore, would record any gain or loss on the mark-to-market of open contracts in our statement of income and (2) may not be able to hedge such risks completely or permanently.
| 3) | During our financial statement close process, we adjust open receivables and payables that are not in the functional currencies of our subsidiaries to the latest foreign currency exchange rates. These receivables and |
63
Table of Contents
| payables are principally generated through the sales and inventory purchases discussed in points 1. and 2. above. The gains and losses created by such adjustments are primarily recorded in our statement of income. During the year ended December 31, 2017, we recorded $0.5 million of foreign currency transaction losses in our statement of operations and comprehensive income. |
| 4) | Additionally, the financial statements of foreign subsidiaries with functional currencies other than the U.S. Dollar are translated into U.S. Dollars during our financial statement close process. To the extent that the U.S. Dollar fluctuates versus such functional currencies, our consolidated financial statements are impacted. Based on the income from operations for such subsidiaries for the year ended December 31, 2017, a uniform 10% change in such exchange rates versus the U.S. Dollar would have impacted our consolidated income from operations for the year by approximately $2.8 million. |
64
Table of Contents
| Item 8. | Financial Statements and Supplementary Data |
PARTY CITY HOLDCO INC.
INDEX TO CONSOLIDATED FINANCIAL STATEMENTS
| 66 | ||||
| Consolidated Balance Sheets at December 31, 2017 and December 31, 2016 |
69 | |||
| 70 | ||||
| 71 | ||||
| 72 | ||||
| 73 | ||||
| 109 | ||||
| 113 |
All other schedules for which provision is made in the applicable accounting regulations of the Securities and Exchange Commission are not required under the related instructions or are inapplicable and, therefore, have been omitted.
65
Table of Contents
Report of Independent Registered Public Accounting Firm
To the Board of Directors and Stockholders of
Party City Holdco Inc. and subsidiaries
Opinion on the Financial Statements
We have audited the accompanying consolidated balance sheets of Party City Holdco Inc. and subsidiaries (the “Company”) as of December 31, 2017 and 2016, and the related consolidated statements of operations and comprehensive income (loss), stockholders’ equity and cash flows for each of the three years in the period ended December 31, 2017 and the related notes and financial statement schedules listed in the Index at Item 15(a) (collectively referred to as the “consolidated financial statements”). In our opinion, the consolidated financial statements present fairly, in all material respects, the financial position of the Company at December 31, 2017 and 2016, and the consolidated results of its operations and its cash flows for each of the three years in the period ended December 31, 2017, in conformity with U.S. generally accepted accounting principles.
We also have audited, in accordance with the standards of the Public Company Accounting Oversight Board (United States) (PCAOB), the Company’s internal control over financial reporting as of December 31, 2017, based on criteria established in Internal Control—Integrated Framework issued by the Committee of Sponsoring Organizations of the Treadway Commission (2013 framework) and our report dated March 14, 2018 expressed an unqualified opinion thereon.
Basis for Opinion
These financial statements are the responsibility of the Company’s management. Our responsibility is to express an opinion on these financial statements based on our audits. We are a public accounting firm registered with the PCAOB and required to be independent with respect to the Company in accordance with the U.S. federal securities laws and the applicable rules and regulations of the Securities and Exchange Commission and the PCAOB.
We conducted our audits in accordance with the standards of the PCAOB. Those standards require that we plan and perform the audit to obtain reasonable assurance about whether the financial statements are free of material misstatement, whether due to error or fraud. Our audit included performing procedures to assess the risks of material misstatement of the financial statements, whether due to error or fraud, and performing procedures that respond to those risks. Such procedures included examining, on a test basis, evidence regarding the amounts and disclosures in the financial statements. Our audits also included evaluating the accounting principles used and significant estimates made by management, as well as evaluating the overall presentation of the financial statements. We believe that our audits provide a reasonable basis for our opinion.
/s/ Ernst & Young LLP
We have served as the Company’s auditor since 1998.
New York, New York
March 14, 2018
66
Table of Contents
Report of Independent Registered Public Accounting Firm
The Board of Directors and Stockholders of
Party City Holdco Inc. and subsidiaries
Opinion on Internal Control over Financial Reporting
We have audited Party City Holdco Inc. and subsidiaries’ internal control over financial reporting as of December 31, 2017, based on criteria established in Internal Control—Integrated Framework issued by the Committee of Sponsoring Organizations of the Treadway Commission (2013 framework) (the COSO criteria). In our opinion, Party City Holdco Inc. and subsidiaries’ (the Company) maintained, in all material respects, effective internal control over financial reporting as of December 31, 2017, based on the COSO criteria.
We also have audited, in accordance with the standards of the Public Company Accounting Oversight Board (United States) (PCAOB), the consolidated balance sheets of the Company as of December 31, 2017 and 2016, the related consolidated statements of operations and comprehensive income (loss), stockholders’ equity, and cash flows for each of the three years in the period ended December 31, 2017 and the related notes and financial statement schedules listed in the Index at Item 15(a) and our report dated March 14, 2018 expressed an unqualified opinion thereon.
Basis for Opinion
The Company’s management is responsible for maintaining effective internal control over financial reporting and for its assessment of the effectiveness of internal control over financial reporting included in the accompanying Management’s Annual Report on Internal Control Over Financial Reporting. Our responsibility is to express an opinion on the Company’s internal control over financial reporting based on our audit. We are a public accounting firm registered with the PCAOB and are required to be independent with respect to the Company in accordance with the U.S. federal securities laws and the applicable rules and regulations of the Securities and Exchange Commission and the PCAOB.
We conducted our audit in accordance with the standards of the PCAOB. Those standards require that we plan and perform the audit to obtain reasonable assurance about whether effective internal control over financial reporting was maintained in all material respects.
Our audit included obtaining an understanding of internal control over financial reporting, assessing the risk that a material weakness exists, testing and evaluating the design and operating effectiveness of internal control based on the assessed risk, and performing such other procedures as we considered necessary in the circumstances. We believe that our audit provides a reasonable basis for our opinion.
Definition and Limitations of Internal Control Over Financial Reporting
A company’s internal control over financial reporting is a process designed to provide reasonable assurance regarding the reliability of financial reporting and the preparation of financial statements for external purposes in accordance with generally accepted accounting principles. A company’s internal control over financial reporting includes those policies and procedures that (1) pertain to the maintenance of records that, in reasonable detail, accurately and fairly reflect the transactions and dispositions of the assets of the company; (2) provide reasonable assurance that transactions are recorded as necessary to permit preparation of financial statements in accordance with generally accepted accounting principles, and that receipts and expenditures of the company are being made only in accordance with authorizations of management and directors of the company; and (3) provide reasonable assurance regarding prevention or timely detection of unauthorized acquisition, use, or disposition of the company’s assets that could have a material effect on the financial statements.
67
Table of Contents
Because of its inherent limitations, internal control over financial reporting may not prevent or detect misstatements. Also, projections of any evaluation of effectiveness to future periods are subject to the risk that controls may become inadequate because of changes in conditions, or that the degree of compliance with the policies or procedures may deteriorate.
/s/ Ernst & Young LLP
New York, New York
March 14, 2018
68
Table of Contents
PARTY CITY HOLDCO INC.
(Dollars in thousands)
| December 31, 2017 | December 31, 2016 | |||||||
| ASSETS |
||||||||
| Current assets: |
||||||||
| Cash and cash equivalents |
$ | 54,291 | $ | 64,610 | ||||
| Accounts receivable, net |
140,980 | 134,091 | ||||||
| Inventories, net |
604,066 | 613,868 | ||||||
| Prepaid expenses and other current assets |
77,816 | 68,255 | ||||||
|
|
|
|
|
|||||
| Total current assets |
877,153 | 880,824 | ||||||
| Property, plant and equipment, net |
301,141 | 292,904 | ||||||
| Goodwill |
1,619,253 | 1,572,568 | ||||||
| Trade names |
568,681 | 566,599 | ||||||
| Other intangible assets, net |
75,704 | 76,581 | ||||||
| Other assets, net |
12,824 | 4,502 | ||||||
|
|
|
|
|
|||||
| Total assets |
$ | 3,454,756 | $ | 3,393,978 | ||||
|
|
|
|
|
|||||
| LIABILITIES, REDEEMABLE SECURITIES AND STOCKHOLDERS’ EQUITY |
||||||||
| Current liabilities: |
||||||||
| Loans and notes payable |
$ | 286,291 | $ | 120,138 | ||||
| Accounts payable |
160,994 | 163,415 | ||||||
| Accrued expenses |
176,609 | 149,683 | ||||||
| Income taxes payable |
45,568 | 46,675 | ||||||
| Current portion of long-term obligations |
13,059 | 13,348 | ||||||
|
|
|
|
|
|||||
| Total current liabilities |
682,521 | 493,259 | ||||||
| Long-term obligations, excluding current portion |
1,532,090 | 1,539,604 | ||||||
| Deferred income tax liabilities |
175,836 | 278,819 | ||||||
| Deferred rent and other long-term liabilities |
91,929 | 65,507 | ||||||
|
|
|
|
|
|||||
| Total liabilities |
2,482,376 | 2,377,189 | ||||||
| Redeemable securities |
3,590 | 0 | ||||||
| Commitments and contingencies |
||||||||
| Stockholders’ equity: |
||||||||
| Common stock (96,380,102 and 119,515,894 shares outstanding and 119,759,669 and 119,515,894 shares issued at December 31, 2017 and December 31, 2016, respectively) |
1,198 | 1,195 | ||||||
| Additional paid-in capital |
917,192 | 910,167 | ||||||
| Retained earnings |
372,596 | 157,666 | ||||||
| Accumulated other comprehensive loss |
(35,818 | ) | (52,239 | ) | ||||
|
|
|
|
|
|||||
| Total Party City Holdco Inc. stockholders’ equity before common stock held in treasury |
1,255,168 | 1,016,789 | ||||||
| Less: Common stock held in treasury, at cost (23,379,567 shares at December 31, 2017) |
(286,733 | ) | 0 | |||||
|
|
|
|
|
|||||
| Total Party City Holdco Inc. stockholders’ equity |
968,435 | 1,016,789 | ||||||
| Noncontrolling interests |
355 | 0 | ||||||
|
|
|
|
|
|||||
| Total stockholders’ equity |
968,790 | 1,016,789 | ||||||
|
|
|
|
|
|||||
| Total liabilities, redeemable securities and stockholders’ equity |
$ | 3,454,756 | $ | 3,393,978 | ||||
|
|
|
|
|
|||||
See accompanying notes to consolidated financial statements.
69
Table of Contents
PARTY CITY HOLDCO INC.
CONSOLIDATED STATEMENTS OF OPERATIONS AND COMPREHENSIVE INCOME (LOSS)
(In thousands, except share and per share data)
| Year Ended December 31, 2017 |
Year Ended December 31, 2016 |
Year Ended December 31, 2015 |
||||||||||
| Revenues: |
||||||||||||
| Net sales |
$ | 2,357,986 | $ | 2,266,386 | $ | 2,275,122 | ||||||
| Royalties and franchise fees |
13,583 | 17,005 | 19,411 | |||||||||
|
|
|
|
|
|
|
|||||||
| Total revenues |
2,371,569 | 2,283,391 | 2,294,533 | |||||||||
| Expenses: |
||||||||||||
| Cost of sales |
1,395,279 | 1,350,387 | 1,370,884 | |||||||||
| Wholesale selling expenses |
65,356 | 59,956 | 64,260 | |||||||||
| Retail operating expenses |
415,167 | 408,583 | 401,039 | |||||||||
| Franchise expenses |
14,957 | 15,213 | 14,394 | |||||||||
| General and administrative expenses |
168,369 | 152,919 | 151,097 | |||||||||
| Art and development costs |
23,331 | 22,249 | 20,640 | |||||||||
| Development stage expenses |
8,974 | 0 | 0 | |||||||||
|
|
|
|
|
|
|
|||||||
| Total expenses |
2,091,433 | 2,009,307 | 2,022,314 | |||||||||
|
|
|
|
|
|
|
|||||||
| Income from operations |
280,136 | 274,084 | 272,219 | |||||||||
| Interest expense, net |
87,366 | 89,380 | 123,361 | |||||||||
| Other expense (income), net |
4,626 | (2,010 | ) | 130,990 | ||||||||
|
|
|
|
|
|
|
|||||||
| Income before income taxes |
188,144 | 186,714 | 17,868 | |||||||||
| Income tax (benefit) expense |
(27,196 | ) | 69,237 | 7,409 | ||||||||
|
|
|
|
|
|
|
|||||||
| Net income |
$ | 215,340 | $ | 117,477 | $ | 10,459 | ||||||
|
|
|
|
|
|
|
|||||||
| Net income per common share-basic |
$ | 1.81 | $ | 0.98 | $ | 0.09 | ||||||
|
|
|
|
|
|
|
|||||||
| Net income per common share-diluted |
$ | 1.79 | $ | 0.98 | $ | 0.09 | ||||||
|
|
|
|
|
|
|
|||||||
| Weighted-average number of common shares-basic |
118,589,421 | 119,381,842 | 111,917,168 | |||||||||
| Weighted-average number of common shares-diluted |
119,894,021 | 120,369,672 | 112,943,807 | |||||||||
| Other comprehensive income (loss), net of tax: |
||||||||||||
| Foreign currency adjustments |
$ | 17,561 | $ | (19,770 | ) | $ | (20,432 | ) | ||||
| Cash flow hedges |
(1,140 | ) | 321 | 377 | ||||||||
|
|
|
|
|
|
|
|||||||
| Other comprehensive income (loss), net |
16,421 | (19,449 | ) | (20,055 | ) | |||||||
|
|
|
|
|
|
|
|||||||
| Comprehensive income (loss) |
$ | 231,761 | $ | 98,028 | $ | (9,596 | ) | |||||
|
|
|
|
|
|
|
|||||||
See accompanying notes to consolidated financial statements.
70
Table of Contents
PARTY CITY HOLDCO INC.
CONSOLIDATED STATEMENTS OF STOCKHOLDERS’ EQUITY
For the Years Ended December 31, 2015, December 31, 2016 and December 31, 2017
(In thousands, except share data)
| Common Stock |
Additional Paid-in Capital |
Retained Earnings |
Accumulated Other Comprehensive Loss |
Total Party City Holdco Inc. Stockholders’ Equity Before Common Stock Held In Treasury |
Common Stock Held In Treasury |
Total Party City Holdco Inc. Stockholders’ Equity |
Non- Controlling Interests |
Total Stockholders’ Equity |
||||||||||||||||||||||||||||
| Balance at December 31, 2014 |
$ | 910 | $ | 469,117 | $ | 29,934 | $ | (12,735 | ) | $ | 487,226 | $ | 0 | $ | 487,226 | $ | 0 | $ | 487,226 | |||||||||||||||||
| Net income |
10,459 | 10,459 | 10,459 | 10,459 | ||||||||||||||||||||||||||||||||
| Employee equity based compensation |
3,042 | 3,042 | 3,042 | 3,042 | ||||||||||||||||||||||||||||||||
| Adjustment to redeemable securities |
31 | 35,031 | 35,062 | 35,062 | 35,062 | |||||||||||||||||||||||||||||||
| Issuance of common stock |
252 | 396,907 | 397,159 | 397,159 | 397,159 | |||||||||||||||||||||||||||||||
| Exercise of stock options |
30 | 30 | 30 | 30 | ||||||||||||||||||||||||||||||||
| Foreign currency adjustments |
(20,432 | ) | (20,432 | ) | (20,432 | ) | (20,432 | ) | ||||||||||||||||||||||||||||
| Excess tax benefit from stock options |
298 | 298 | 298 | 298 | ||||||||||||||||||||||||||||||||
| Spin-off of subsidiary |
(204 | ) | (204 | ) | (204 | ) | (204 | ) | ||||||||||||||||||||||||||||
| Impact of foreign exchange contracts |
377 | 377 | 377 | 377 | ||||||||||||||||||||||||||||||||
|
|
|
|
|
|
|
|
|
|
|
|
|
|
|
|
|
|
|
|||||||||||||||||||
| Balance at December 31, 2015 |
$ | 1,193 | $ | 904,425 | $ | 40,189 | $ | (32,790 | ) | $ | 913,017 | $ | 0 | $ | 913,017 | $ | 0 | $ | 913,017 | |||||||||||||||||
| Net income |
117,477 | 117,477 | 117,477 | 117,477 | ||||||||||||||||||||||||||||||||
| Employee equity based compensation |
3,853 | 3,853 | 3,853 | 3,853 | ||||||||||||||||||||||||||||||||
| Exercise of stock options |
2 | 1,371 | 1,373 | 1,373 | 1,373 | |||||||||||||||||||||||||||||||
| Foreign currency adjustments |
(19,770 | ) | (19,770 | ) | (19,770 | ) | (19,770 | ) | ||||||||||||||||||||||||||||
| Excess tax benefit from stock options |
518 | 518 | 518 | 518 | ||||||||||||||||||||||||||||||||
| Impact of foreign exchange contracts |
321 | 321 | 321 | 321 | ||||||||||||||||||||||||||||||||
|
|
|
|
|
|
|
|
|
|
|
|
|
|
|
|
|
|
|
|||||||||||||||||||
| Balance at December 31, 2016 |
$ | 1,195 | $ | 910,167 | $ | 157,666 | $ | (52,239 | ) | $ | 1,016,789 | $ | 0 | $ | 1,016,789 | $ | 0 | $ | 1,016,789 | |||||||||||||||||
| Net income |
215,340 | 215,340 | 215,340 | 215,340 | ||||||||||||||||||||||||||||||||
| Employee equity based compensation |
5,309 | 5,309 | 5,309 | 5,309 | ||||||||||||||||||||||||||||||||
| Warrant |
421 | 421 | 421 | 421 | ||||||||||||||||||||||||||||||||
| Adjustment to redeemable securities |
(410 | ) | (410 | ) | (410 | ) | (410 | ) | ||||||||||||||||||||||||||||
| Exercise of stock options |
3 | 1,295 | 1,298 | 1,298 | 1,298 | |||||||||||||||||||||||||||||||
| Foreign currency adjustments |
17,561 | 17,561 | 17,561 | 17,561 | ||||||||||||||||||||||||||||||||
| Treasury stock purchases |
0 | (286,733 | ) | (286,733 | ) | (286,733 | ) | |||||||||||||||||||||||||||||
| Acquired noncontrolling interest |
0 | 0 | 355 | 355 | ||||||||||||||||||||||||||||||||
| Impact of foreign exchange contracts |
(1,140 | ) | (1,140 | ) | (1,140 | ) | (1,140 | ) | ||||||||||||||||||||||||||||
|
|
|
|
|
|
|
|
|
|
|
|
|
|
|
|
|
|
|
|||||||||||||||||||
| Balance at December 31, 2017 |
$ | 1,198 | $ | 917,192 | $ | 372,596 | $ | (35,818 | ) | $ | 1,255,168 | $ | (286,733 | ) | $ | 968,435 | $ | 355 | $ | 968,790 | ||||||||||||||||
|
|
|
|
|
|
|
|
|
|
|
|
|
|
|
|
|
|
|
|||||||||||||||||||
71
Table of Contents
PARTY CITY HOLDCO INC.
CONSOLIDATED STATEMENTS OF CASH FLOWS
(In thousands)
| Year Ended December 31, 2017 |
Year Ended December 31, 2016 |
Year Ended December 31, 2015 |
||||||||||
| Cash flows provided by operating activities: |
||||||||||||
| Net income |
$ | 215,340 | $ | 117,477 | $ | 10,459 | ||||||
| Adjustments to reconcile net income to net cash provided by operating activities: |
||||||||||||
| Depreciation and amortization expense |
85,168 | 83,630 | 80,515 | |||||||||
| Amortization of deferred financing costs |
4,937 | 5,818 | 40,516 | |||||||||
| Provision for doubtful accounts |
560 | 781 | 223 | |||||||||
| Deferred income tax (benefit) expense |
(102,651 | ) | 3,401 | (6,178 | ) | |||||||
| Deferred rent |
7,287 | 18,835 | 13,407 | |||||||||
| Undistributed (gain) loss in unconsolidated joint ventures |
(194 | ) | 314 | 562 | ||||||||
| Impairment of intangible assets |
0 | 0 | 852 | |||||||||
| Loss (gain) on disposal of equipment |
475 | 14 | (2,593 | ) | ||||||||
| Non-employee equity based compensation |
3,033 | 0 | 0 | |||||||||
| Employee equity based compensation |
5,309 | 3,853 | 3,042 | |||||||||
| Changes in operating assets and liabilities, net of effects of acquired businesses: |
||||||||||||
| Decrease (increase) in accounts receivable |
1,153 | (5,898 | ) | 6,868 | ||||||||
| Decrease (increase) in inventories |
37,175 | (42,819 | ) | 15,515 | ||||||||
| Increase in prepaid expenses and other current assets |
(9,079 | ) | (14,499 | ) | (4,683 | ) | ||||||
| Increase (decrease) in accounts payable, accrued expenses and income taxes payable |
19,408 | 86,893 | (78,293 | ) | ||||||||
|
|
|
|
|
|
|
|||||||
| Net cash provided by operating activities |
267,921 | 257,800 | 80,212 | |||||||||
| Cash flows used in investing activities: |
||||||||||||
| Cash paid in connection with acquisitions, net of cash acquired |
(74,710 | ) | (31,820 | ) | (22,615 | ) | ||||||
| Capital expenditures |
(66,970 | ) | (81,948 | ) | (78,825 | ) | ||||||
| Proceeds from disposal of property and equipment |
35 | 35 | 1,304 | |||||||||
|
|
|
|
|
|
|
|||||||
| Net cash used in investing activities |
(141,645 | ) | (113,733 | ) | (100,136 | ) | ||||||
| Cash flows (used in) provided by financing activities: |
||||||||||||
| Repayment of loans, notes payable and long-term obligations |
(234,619 | ) | (1,521,218 | ) | (2,561,594 | ) | ||||||
| Proceeds from loans, notes payable and long-term obligations |
380,092 | 1,399,717 | 2,198,600 | |||||||||
| Cash held in escrow in connection with acquisitions |
0 | 0 | (3,832 | ) | ||||||||
| Excess tax benefit from stock options |
0 | 518 | 298 | |||||||||
| Exercise of stock options |
1,298 | 1,373 | 30 | |||||||||
| Treasury stock purchases |
(286,733 | ) | 0 | 0 | ||||||||
| Issuance of common stock |
0 | 0 | 397,159 | |||||||||
| Debt issuance costs |
0 | (130 | ) | (11,720 | ) | |||||||
|
|
|
|
|
|
|
|||||||
| Net cash (used in) provided by financing activities |
(139,962 | ) | (119,740 | ) | 18,941 | |||||||
| Effect of exchange rate changes on cash and cash equivalents |
3,367 | (2,636 | ) | (3,312 | ) | |||||||
|
|
|
|
|
|
|
|||||||
| Net (decrease) increase in cash and cash equivalents |
(10,319 | ) | 21,691 | (4,295 | ) | |||||||
| Cash and cash equivalents at beginning of period |
64,610 | 42,919 | 47,214 | |||||||||
|
|
|
|
|
|
|
|||||||
| Cash and cash equivalents at end of period |
$ | 54,291 | $ | 64,610 | $ | 42,919 | ||||||
|
|
|
|
|
|
|
|||||||
| Supplemental disclosure of cash flow information: |
||||||||||||
| Cash paid during the period |
||||||||||||
| Interest |
$ | 76,171 | $ | 86,183 | $ | 143,458 | ||||||
| Income taxes, net of refunds |
$ | 66,445 | $ | 26,883 | $ | 40,134 | ||||||
Supplemental information on non-cash activities:
Capital lease obligations of $1,553, $1,623, and $223 were incurred during the years ended December 31, 2017, December 31, 2016, and December 31, 2015, respectively.
See accompanying notes to consolidated financial statements.
72
Table of Contents
PARTY CITY HOLDCO INC.
NOTES TO CONSOLIDATED FINANCIAL STATEMENTS
(Dollars in thousands, except per share)
Note 1 — Organization, Description of Business and Basis of Presentation
Party City Holdco Inc. (the “Company” or “Party City Holdco”) is a vertically integrated supplier of decorated party goods. The Company designs, manufactures, sources and distributes party goods, including paper and plastic tableware, metallic and latex balloons, Halloween and other costumes, accessories, novelties and stationery throughout the world. The Company’s operations include over 900 specialty retail party supply stores (including franchise stores) in the United States and Canada operating under the names Party City and Halloween City, and e-commerce websites, principally through the domain name PartyCity.com. Party City Holdco also franchises both individual stores and franchise areas throughout the United States, Mexico and Puerto Rico, principally under the name Party City.
Party City Holdco is a holding company with no operating assets or operations. The Company owns 100% of PC Nextco Holdings, LLC (“PC Nextco”), which owns 100% of PC Intermediate Holdings, Inc. (“PC Intermediate”). PC Intermediate owns 100% of Party City Holdings Inc. (“PCHI”), which owns most of the Company’s operating subsidiaries.
Note 2 — Summary of Significant Accounting Policies
Consolidated Financial Statements
The consolidated financial statements of the Company include the accounts of all majority-owned subsidiaries and controlled entities. All intercompany balances and transactions have been eliminated.
The Company’s retail operations define a fiscal year (“Fiscal Year”) as the 52-week period or 53-week period ended on the Saturday nearest December 31st of each year, and define their fiscal quarters (“Fiscal Quarter”) as the four interim 13-week periods following the end of the previous Fiscal Year, except in the case of a 53-week Fiscal Year when the fourth Fiscal Quarter is extended to 14 weeks. The consolidated financial statements of the Company combine the Fiscal Year and Fiscal Quarters of the Company’s retail operations with the calendar year and calendar quarters of the Company’s wholesale operations, as the differences are not significant.
Use of Estimates
The preparation of the consolidated financial statements in conformity with accounting principles generally accepted in the United States requires management to make estimates and assumptions that affect the amounts reported in the consolidated financial statements and accompanying notes. Actual results could differ from those estimates. Management periodically evaluates estimates used in the preparation of the consolidated financial statements for continued reasonableness. Appropriate adjustments, if any, to the estimates used are made prospectively based on such periodic evaluations.
Cash Equivalents
Highly liquid investments with a maturity of three months or less when purchased are considered to be cash equivalents. All credit card transactions that process in less than seven days are classified as cash and cash equivalents.
Inventories
Inventories are valued at the lower of cost and net realizable value.
73
Table of Contents
PARTY CITY HOLDCO INC.
NOTES TO CONSOLIDATED FINANCIAL STATEMENTS—(Continued)
(Dollars in thousands, except per share)
The Company principally determines the cost of inventory using the weighted average method.
The Company estimates retail inventory shrinkage for the period between physical inventory dates on a store-by-store basis. Inventory shrinkage estimates can be affected by changes in merchandise mix and changes in actual shortage trends. The shrinkage rate from the most recent physical inventory, in combination with historical experience, is the basis for estimating shrinkage.
Allowance for Doubtful Accounts
The Company maintains allowances for doubtful accounts for estimated losses resulting from the inability of the Company’s customers to make required payments. A considerable amount of judgment is required in assessing the ultimate realization of these receivables, including consideration of the Company’s history of receivable write-offs, the level of past due accounts and the economic status of the Company’s customers. In an effort to identify adverse trends relative to customer economic status, the Company assesses the financial health of the markets it operates in and performs periodic credit evaluations of its customers and ongoing reviews of account balances and aging of receivables. Amounts are considered past due when payment has not been received within the time frame of the credit terms extended. Write-offs are charged directly against the allowance for doubtful accounts and occur only after all collection efforts have been exhausted. At December 31, 2017 and December 31, 2016, the allowance for doubtful accounts was $2,971 and $2,683, respectively.
Long-Lived and Intangible Assets (including Goodwill)
Property, plant and equipment are stated at cost. Equipment under capital leases are stated at the present value of the minimum lease payments at the inception of the lease. Depreciation is calculated principally on the straight-line method over the estimated useful lives of the assets. Leasehold improvements are amortized on a straight-line basis over the shorter of the lease term or the estimated useful life of the asset.
The Company reviews the recoverability of its finite long-lived assets, including finite-lived intangible assets, whenever facts and circumstances indicate that the carrying amount may not be fully recoverable. For purposes of recognizing and measuring impairment, the Company evaluates long-lived assets other than goodwill based upon the lowest level of independent cash flows ascertainable to evaluate impairment. If the sum of the undiscounted future cash flows expected over the remaining asset life is less than the carrying value of the assets, the Company may recognize an impairment loss. The impairment related to long-lived assets is measured as the amount by which the carrying amount of the asset(s) exceeds the fair value of the asset(s).
In the evaluation of the fair value and future benefits of finite long-lived assets attached to retail stores, the Company performs its cash flow analysis on a store-by-store basis. Various factors including future sales growth and profit margins are included in this analysis.
Goodwill represents the excess of the purchase price of acquired companies over the estimated fair value of the net assets acquired. Goodwill and other intangibles with indefinite lives are not amortized, but are reviewed for impairment annually or more frequently if certain indicators arise.
The Company evaluates the goodwill associated with its acquisitions, and other intangibles with indefinite lives, for impairment as of the first day of its fourth quarter based on current and projected performance. For purposes of testing goodwill for impairment, reporting units are determined by identifying individual components within the Company’s organization which constitute a business for which discrete financial information is available and is reviewed by management. Components within a segment are aggregated to the extent that they
74
Table of Contents
PARTY CITY HOLDCO INC.
NOTES TO CONSOLIDATED FINANCIAL STATEMENTS—(Continued)
(Dollars in thousands, except per share)
have similar economic characteristics. Based on this evaluation, the Company has determined that its operating segments, wholesale and retail, represent reporting units for the purposes of its goodwill impairment test.
If it is concluded that it is more likely than not that the fair value of a reporting unit is less than its carrying value, the Company estimates the fair value of the reporting unit using a combination of a market approach and an income approach. If the carrying amount of a reporting unit exceeds its fair value, the excess, if any, of the fair value of the reporting unit over amounts allocable to the unit’s other assets and liabilities is the implied fair value of goodwill. If the carrying amount of a reporting unit’s goodwill exceeds the implied fair value of that goodwill, an impairment loss will be recognized in an amount equal to that excess. The fair value of a reporting unit refers to the amount at which the unit as a whole could be sold in a current transaction between willing parties.
Deferred Financing Costs
Deferred financing costs are netted against amounts outstanding under the related debt instruments. They are amortized to interest expense over the lives of the instruments using the effective interest method.
Deferred Rent and Rental Expenses
The Company leases its retail stores under operating leases that generally have initial terms of ten years, with two five year renewal options. The Company’s leases may have early cancellation clauses, which permit the lease to be terminated if certain sales levels are not met in specific periods, and may provide for the payment of contingent rent based on a percentage of the store’s net sales. The Company’s lease agreements generally have defined escalating rent provisions, which are reported as a deferred rent liability and expensed on a straight-line basis over the term of the related lease, commencing with the date of possession. In addition, the Company may receive cash allowances from its landlords on certain properties, which are reported as deferred rent and amortized to rent expense over the term of the lease, also commencing with the date of possession. Retail’s deferred rent liability at December 31, 2017 and 2016 was $76,994 and $68,857, respectively.
Equity Method Investments
The Company has an investment in Convergram Mexico, S. De R.L. De C.V., a joint venture distributing metallic balloons, principally in Mexico and Latin America. The Company accounts for its 49.9% investment in the joint venture using the equity method.
Additionally, the Company has an investment in PD Retail Group Limited, a joint venture operating party goods stores in the United Kingdom (“U.K.”). The Company accounts for its 50% investment using the equity method.
Also, during April 2017, the Company paid approximately $4,000 for a 28% ownership interest in Punchbowl, Inc., a provider of digital greeting cards and digital invitations. The Company is accounting for the investment under the equity method of accounting.
The Company’s investments are included in other assets on the consolidated balance sheet and the results of the investees’ operations are included in other expense (income) in the consolidated statement of operations and comprehensive income (loss) (see Note 10).
75
Table of Contents
PARTY CITY HOLDCO INC.
NOTES TO CONSOLIDATED FINANCIAL STATEMENTS—(Continued)
(Dollars in thousands, except per share)
Insurance Accruals
The Company maintains certain self-insured workers’ compensation and general liability insurance plans. The Company estimates the required liability for claims under such plans based upon various assumptions, which include, but are not limited to, historical loss experience, projected loss development factors, actual payroll and other data. The required liability is also subject to adjustment in the future based upon changes in claims experience, including changes in the number of incidents (frequency) and changes in the ultimate cost per incident (severity).
Revenue Recognition
Revenue from retail store operations is recognized at the point of sale. Retail e-commerce sales are recognized when the consumer receives the product. Due to its extensive history operating as the largest party goods retailer in North America, the Company has sufficient history with which to estimate future retail sales returns.
The transaction price for the overwhelming majority of the Company’s retail sales is based on either: 1) the item’s stated price or 2) the stated price adjusted for the impact of a coupon which can only be applied to such transaction. To the extent that the Company charges customers for freight costs on e-commerce sales, the Company records such amounts in revenue. The Company excludes all sales taxes and value-added taxes from revenue.
Under the terms of its agreements with its franchisees, the Company provides both: 1) brand value (via significant advertising spend) and 2) support with respect to planograms, in exchange for a royalty fee that ranges from 4% to 6% of the franchisees’ sales. The Company records the royalty fees at the time that the franchisees’ sales are recorded. Additionally, although the Company anticipates that future franchise store openings will be limited, when a franchisee opens a new store, the Company receives and records a one-time fee which is earned by the Company for its assistance with site selection and development of the new location. Both the sales-based royalty fee and the one-time fee are recorded in royalties and franchise fees in the Company’s consolidated statement of operations and comprehensive income.
For most of the Company’s wholesale sales, revenue is recognized upon the Company’s shipment of the product as: 1) legal title transfers on such date and 2) the Company has a present right to payment at such time. Wholesale sales returns are not significant as the Company generally only accepts the return of goods that were shipped to the customer in error or that were damaged when received by the customer. Additionally, due to its extensive history operating as a leading party goods wholesaler, the Company has sufficient history with which to estimate future sales returns.
In most cases, the determination of the transaction price is straight-forward as it is fixed based on the contract and/or purchase order. However, a limited number of customers receive volume-based rebates. Additionally, certain customers receive small discounts for early payment (generally 1% of the transaction price). Based on the business’ long history as a leading party goods wholesaler, the Company has sufficient history with which to estimate variable consideration for such volume-based rebates and early payment discounts. To the extent that the Company charges customers for freight costs, the Company records such amounts in revenue. The Company excludes all sales taxes and value-added taxes from revenue.
The majority of the sales for the Company’s wholesale business are due within 30 to 120 days from the transfer of control of the product and substantially all of the sales are collected within a year from such transfer.
76
Table of Contents
PARTY CITY HOLDCO INC.
NOTES TO CONSOLIDATED FINANCIAL STATEMENTS—(Continued)
(Dollars in thousands, except per share)
Although most of the Company’s revenue transactions consist of fixed transaction prices and the transfer of control at either the point of sale (for retail) or when the product is shipped (for wholesale), certain transactions involve a limited number of judgments. For transactions for which control transfers to the customer when the freight carrier delivers the product to the customer, the Company estimates the date of such receipt based on historical shipping times. Additionally, the Company utilizes historical data to estimate sales returns, volume-based rebates and discounts for early payments by customers. Due to its extensive history operating as a leading party goods retailer and wholesaler, the Company has sufficient history with which to estimate such amounts.
Revenues, and the related profit, on sales from the Company’s wholesale operations to its retail operations are eliminated in consolidation.
Cost of Sales
Cost of sales at wholesale reflects the production costs (i.e., raw materials, labor and overhead) of manufactured goods and the direct cost of purchased goods, inventory shrinkage at both retail and wholesale, inventory adjustments, inbound freight to the Company’s manufacturing and distribution facilities, distribution costs and outbound freight to transfer goods to the Company’s wholesale customers. At retail, cost of sales reflects the direct cost of goods purchased from third parties and the production or purchase costs of goods acquired from the Company’s wholesale operations. Retail cost of sales also includes inventory shrinkage, inventory adjustments, inbound freight, occupancy costs related to store operations, such as rent and common area maintenance, utilities and depreciation on assets, and all logistics costs (i.e., procurement, handling and distribution costs) associated with the Company’s e-commerce business.
Retail Operating Expenses
Retail operating expenses include the costs and expenses associated with the operation of the Company’s retail stores, with the exception of occupancy costs included in cost of sales. Retail operating expenses principally consist of employee compensation and benefits, advertising, supplies expense and credit card and banking fees.
Shipping and Handling
Outbound shipping costs billed to customers are included in net sales. The costs of shipping and handling incurred by the Company are included in cost of sales.
Product Royalty Agreements
The Company enters into product royalty agreements that allow the Company to use licensed designs on certain of its products. These contracts require the Company to pay royalties, generally based on the sales of such product, and may require guaranteed minimum royalties, a portion of which may be paid in advance. The Company matches royalty expense with revenue by recording royalties at the time of sale, at the greater of the contractual rate or an effective rate calculated based on the guaranteed minimum royalty and the Company’s estimate of sales during the contract period. If a portion of the guaranteed minimum royalty is determined to be unrecoverable, the unrecoverable portion is charged to expense at that time. Guaranteed minimum royalties paid in advance are recorded in the consolidated balance sheets in either prepaid expenses and other current assets or other assets, depending on the nature of the royalties.
Catalog Costs
The Company expenses costs associated with the production of catalogs when incurred.
77
Table of Contents
PARTY CITY HOLDCO INC.
NOTES TO CONSOLIDATED FINANCIAL STATEMENTS—(Continued)
(Dollars in thousands, except per share)
Advertising
Advertising costs are expensed as incurred. Retail advertising expenses for the years ended December 31, 2017, December 31, 2016, and December 31, 2015 were $61,187, $63,528, and $62,495, respectively.
Variable Interest Entities
When determining whether a legal entity should be consolidated, the Company first determines whether it has a variable interest in the legal entity. If a variable interest exists, the Company determines whether the legal entity is a variable interest entity due to either: 1) a lack of sufficient equity to finance its activities, 2) the equity holders lacking the characteristics of a controlling financial interest or 3) the legal entity being structured with non-substantive voting rights. If the Company concludes that the legal entity is a variable interest entity, the Company next determines whether it is the primary beneficiary due to it possessing both: 1) the power to direct the activities of a variable interest entity that most significantly impact the variable interest entity’s economic performance and 2) the obligation to absorb losses of the variable interest entity that potentially could be significant to the variable interest entity or the right to receive benefits from the variable interest entity which could be significant to the variable interest entity. If the Company concludes that it is the primary beneficiary, it consolidates the legal entity.
During the first quarter of 2017, the Company and Ampology, a subsidiary of Trivergence, reached an agreement to form a new legal entity, Kazzam, LLC (“Kazzam”), for the purpose of designing, developing and launching an online exchange platform for party-related services. Although the Company currently only owns 30% of Kazzam’s equity, the Company has concluded that: a) Kazzam is a variable interest entity as it has insufficient equity at risk and b) the Company is its primary beneficiary. Therefore, the Company has consolidated Kazzam into the Company’s financial statements.
As part of Ampology’s compensation for designing, developing and launching the exchange platform, Ampology received a 70% ownership interest in Kazzam. The 70% interest has been recorded as redeemable securities in the mezzanine of the Company’s consolidated balance sheet as, in the future, Ampology has the right to cause the Company to purchase the interest. On a recurring basis, the mezzanine liability is adjusted to the greater of: a) the interest’s carrying amount under Accounting Standards Codification (“ASC”) Topic 810, “Consolidation”, or b) the fair value of the interest.
Art and Development Costs
Art and development costs are primarily internal costs that are not easily associated with specific designs, some of which may not reach commercial production. Accordingly, the Company expenses these costs as incurred.
Derivative Financial Instruments
ASC Topic 815, “Accounting for Derivative Instruments and Hedging Activities”, requires that all derivative financial instruments be recognized on the balance sheet at fair value and establishes criteria for both the designation and effectiveness of hedging activities. The Company uses derivatives in the management of interest rate and foreign currency exposure. ASC Topic 815 requires the Company to formally document the assets, liabilities or other transactions the Company designates as hedged items, the risk being hedged and the relationship between the hedged items and the hedging instruments. The Company must measure the effectiveness of the hedging relationship at the inception of the hedge and on an on-going basis.
78
Table of Contents
PARTY CITY HOLDCO INC.
NOTES TO CONSOLIDATED FINANCIAL STATEMENTS—(Continued)
(Dollars in thousands, except per share)
If derivative financial instruments qualify as fair value hedges, the gain or loss on the instrument and the offsetting loss or gain on the hedged item attributable to the hedged risk are recognized in net income during the period of the change in fair values. For derivative financial instruments that qualify as cash flow hedges (i.e., hedging the exposure to variability in expected future cash flows that is attributable to a particular risk), the effective portion of the gain or loss on the derivative instrument is reported as a component of other comprehensive income and reclassified into net income in the same period or periods during which the hedged transaction affects earnings. The ineffective portion of a cash flow hedge, if any, is determined based on the dollar-offset method (i.e., the gain or loss on the derivative financial instrument in excess of the cumulative change in the present value of future cash flows of the hedged item) and is recognized in net income during the period of change. As long as hedge effectiveness is maintained, interest rate swap arrangements and foreign currency exchange agreements qualify for hedge accounting as cash flow hedges (see Note 18).
Income Taxes
Deferred tax assets and liabilities are determined based on the difference between the financial statement and tax bases of assets and liabilities (and operating loss and tax credit carryforwards) applying enacted statutory tax rates in effect for the years in which the differences are expected to reverse. Deferred tax assets are reduced by a valuation allowance when, in the judgment of management, it is more likely than not that some portion or all of the deferred tax assets will not be realized.
Stock-Based Compensation
Accounting for stock-based compensation requires measurement of compensation cost for all stock-based awards at fair value on the date of grant and recognition of compensation expense over the service period for awards expected to vest.
Accumulated Other Comprehensive Loss
Accumulated other comprehensive loss consists of the Company’s foreign currency adjustments and the impact of interest rate swap and foreign exchange contracts that qualify as hedges (see Notes 18 and 19).
Foreign Currency Transactions and Translation
The functional currencies of the Company’s foreign operations are the local currencies in which they operate. Foreign currency exchange gains or losses resulting from receivables or payables in currencies other than the functional currencies generally are credited or charged to operations. The balance sheets of foreign subsidiaries are translated into U.S. dollars at the exchange rates in effect on the balance sheet date. The results of operations of foreign subsidiaries are translated into U.S. dollars at the average exchange rates effective for the periods presented. The differences from historical exchange rates are recorded as comprehensive income (loss) and are included as a component of accumulated other comprehensive loss.
Earnings Per Share
Basic earnings per share are computed by dividing net income available for common stockholders by the weighted average number of common shares outstanding for the period. Diluted earnings per share are calculated based on the weighted average number of outstanding common shares plus the dilutive effect of stock options and warrants as if they were exercised.
79
Table of Contents
PARTY CITY HOLDCO INC.
NOTES TO CONSOLIDATED FINANCIAL STATEMENTS—(Continued)
(Dollars in thousands, except per share)
A reconciliation between basic and diluted income per share is as follows:
| Year Ended December 31, 2017 |
Year Ended December 31, 2016 |
Year Ended December 31, 2015 |
||||||||||
| Net income attributable to Party City Holdco Inc.: |
$ | 215,340 | $ | 117,477 | $ | 10,459 | ||||||
| Adjustment to Kazzam liability (see above): |
(410 | ) | 0 | 0 | ||||||||
|
|
|
|
|
|
|
|||||||
| Numerator for earnings per share: |
$ | 214,930 | $ | 117,477 | $ | 10,459 | ||||||
| Weighted average shares — Basic: |
118,589,421 | 119,381,842 | 111,917,168 | |||||||||
| Effect of dilutive warrants: |
0 | 0 | 0 | |||||||||
| Effect of dilutive stock options: |
1,304,600 | 987,830 | 1,026,639 | |||||||||
|
|
|
|
|
|
|
|||||||
| Weighted average shares — Diluted: |
119,894,021 | 120,369,672 | 112,943,807 | |||||||||
| Net income per common share — Basic: |
$ | 1.81 | $ | 0.98 | $ | 0.09 | ||||||
|
|
|
|
|
|
|
|||||||
| Net income per common share — Diluted: |
$ | 1.79 | $ | 0.98 | $ | 0.09 | ||||||
|
|
|
|
|
|
|
|||||||
During the years ended December 31, 2017, December 31, 2016 and December 31, 2015, 2,392,150 stock options, 2,371,876 stock options and 1,991,965 stock options, respectively, were excluded from the calculations of net income per common share — diluted as they were anti-dilutive. Additionally, during the years ended December 31, 2017, December 31, 2016 and December 31, 2015, 596,000 warrants, 0 warrants and 0 warrants, respectively, were excluded from the calculations of net income per common share — diluted as they were anti-dilutive.
Recently Issued Accounting Pronouncements
In August 2017, the Financial Accounting Standards Board (“FASB”) issued Accounting Standards Update (“ASU”) 2017-12, “Derivatives and Hedging: Targeted Improvements to Accounting for Hedging Activities”. The pronouncement amends the existing hedge accounting model in order to enable entities to better portray the economics of their risk management activities in their financial statements. The update is effective for the Company during the first quarter of 2019. Although the Company continues to evaluate this pronouncement, it does not believe that it will have a material impact on the Company’s consolidated financial statements.
In November 2016, the FASB issued ASU 2016-18, “Statement of Cash Flows: Restricted Cash”. The pronouncement clarifies how entities should present changes in restricted cash on the statement of cash flows. The update is effective for the Company during the first quarter of 2018. Although the Company continues to evaluate this pronouncement, it does not believe that it will have a material impact on the Company’s consolidated financial statements.
In August 2016, the FASB issued ASU 2016-15, “Statement of Cash Flows: Classification of Certain Cash Receipts and Cash Payments”. The pronouncement clarifies how entities should classify certain cash receipts and cash payments on the statement of cash flows. The update is effective for the Company during the first quarter of 2018. Although the Company continues to evaluate this pronouncement, it does not believe that it will have a material impact on the Company’s consolidated financial statements.
In March 2016, the FASB issued ASU 2016-09, “Compensation — Stock Compensation: Improvements to Employee Share-Based Payment Accounting”. The pronouncement simplifies several aspects of the accounting
80
Table of Contents
PARTY CITY HOLDCO INC.
NOTES TO CONSOLIDATED FINANCIAL STATEMENTS—(Continued)
(Dollars in thousands, except per share)
for share-based payment transactions. The Company adopted the pronouncement during the first quarter of 2017 and such adoption did not have a material impact on the Company’s consolidated financial statements.
In February 2016, the FASB issued ASU 2016-02, “Leases”. The ASU requires that companies recognize on their balance sheets assets and liabilities for the rights and obligations created by the companies’ leases. The update is effective for the Company during the first quarter of 2019. The Company is in the process of evaluating the impact of the pronouncement on the Company’s consolidated financial statements.
In January 2016, the FASB issued ASU 2016-01, “Financial Instruments — Overall: Recognition and Measurement of Financial Assets and Financial Liabilities”. The update impacts the accounting for equity investments and the recognition of changes in fair value of financial liabilities when the fair value option is elected. The pronouncement will be effective for the Company during the first quarter of 2018. Although the Company continues to evaluate this pronouncement, it does not believe that it will have a material impact on the Company’s consolidated financial statements.
In July 2015, the FASB issued ASU 2015-11, “Inventory: Simplifying the Measurement of Inventory”. The update changes the measurement principle for inventory from the lower of cost or market to lower of cost and net realizable value. The Company adopted the pronouncement during the first quarter of 2017 and such adoption did not have a material impact on the Company’s consolidated financial statements.
In May 2014, the FASB issued ASU 2014-09, “Revenue from Contracts with Customers (Topic 606)”. The pronouncement contains a five-step model which replaces most existing revenue recognition guidance. The new standard is effective for the Company during the first quarter of 2018. The pronouncement can be applied retrospectively to prior reporting periods or on a modified retrospective basis through a cumulative-effect adjustment as of the date of adoption. The Company has decided to adopt the pronouncement using the modified retrospective approach. The pronouncement will not have a material impact on the Company’s consolidated financial statements. On January 1, 2018, the Company will adjust its accounting for certain discounts which are tied to the timing of payments by customers of its wholesale business and the Company will record a cumulative-effect adjustment which will reduce retained earnings by $46. Additionally, as of such date, the Company will modify its accounting for certain metallic balloon sales of its wholesale segment and defer the recognition of revenue on such sales, and the related costs, until the balloons have been filled with helium. As a result, the Company will record a cumulative-effect adjustment which will increase retained earnings by $8. Finally, as of such date, the Company will adjust its accounting for certain discounts on wholesale sales of seasonal product and the Company will record a cumulative-effect adjustment which will reduce retained earnings by $40.
Note 3 — Inventories, Net
Inventories consisted of the following:
| December 31, | ||||||||
| 2017 | 2016 | |||||||
| Finished goods |
$ | 562,809 | $ | 581,277 | ||||
| Raw materials |
30,346 | 23,222 | ||||||
| Work in process |
10,911 | 9,369 | ||||||
|
|
|
|
|
|||||
| $ | 604,066 | $ | 613,868 | |||||
|
|
|
|
|
|||||
81
Table of Contents
PARTY CITY HOLDCO INC.
NOTES TO CONSOLIDATED FINANCIAL STATEMENTS—(Continued)
(Dollars in thousands, except per share)
Note 4 — Property, Plant and Equipment, Net
Property, plant and equipment, net consisted of the following:
| December 31, | ||||||||||||
| 2017 | 2016 | Useful lives | ||||||||||
| Machinery and equipment |
$ | 187,937 | $ | 157,170 | 3-15 years | |||||||
| Buildings |
68,451 | 67,851 | 40 years | |||||||||
| Data processing |
63,354 | 49,688 | 3-5 years | |||||||||
| Leasehold improvements |
120,146 | 109,218 | 1-10 years | |||||||||
| Furniture and fixtures |
177,309 | 163,539 | 5-10 years | |||||||||
| Land |
10,733 | 10,450 | ||||||||||
|
|
|
|
|
|||||||||
| 627,930 | 557,916 | |||||||||||
| Less: accumulated depreciation |
(326,789 | ) | (265,012 | ) | ||||||||
|
|
|
|
|
|||||||||
| $ | 301,141 | $ | 292,904 | |||||||||
|
|
|
|
|
|||||||||
Depreciation expense related to property, plant and equipment, including assets under capital leases, was $68,209, $66,383, and $61,630, for the years ended December 31, 2017, December 31, 2016, and December 31, 2015, respectively.
Note 5 — Acquisitions
During January 2017, the Company acquired 18 franchise stores, which are located mostly in Louisiana and Alabama, for total consideration of approximately $16, 000. The following summarizes the fair values of the major classes of assets acquired and liabilities assumed: inventories of $7,600, property, plant and equipment of $2,000, a reacquired right intangible asset in the amount of $3,900 and an asset in the amount of $1,400 due to leases that are favorable when compared to market rates. The allocation of the purchase price, which has been finalized, was based on the Company’s estimate of the fair value of the assets acquired and liabilities assumed. Goodwill, which is tax-deductible, arose due to numerous factors, including the wholesale profit generated via the sale of product from the Company’s wholesale operations through the 18 stores. Goodwill also arose due to the value to the Company of customers knowing that there are party stores in the locations (when the Company opens a new store, sales are initially lower than those of mature stores and increase over time), the Company’s ability to run the stores more efficiently than the franchisee based on the Company’s experience with its over 700 corporate-owned stores and the assembled workforce at the 18 stores.
During March 2017, the Company acquired 85% of the common stock of Granmark, S.A. de C.V. (“Granmark”), a Mexican manufacturer and wholesaler of party goods, for total consideration of approximately $22,000 (exclusive of $5,600 of cash acquired). Based on the terms of the acquisition agreement, the Company is required to acquire the remaining 15% interest over a three to five year period and it has recorded a liability for the estimated purchase price of such interest, $2,874 at December 31, 2017. The following summarizes the fair values of the major classes of assets acquired and liabilities assumed: accounts receivable of $4,600, inventories of $3,300, other current assets of $900, property, plant and equipment of $3,100, a customer lists intangible asset in the amount of $4,700, a trade name intangible asset in the amount of $900, accounts payable of $1,500, accrued expenses of $2,700, deferred tax liabilities of $800 and loans and notes payable of $6,500. The allocation of the purchase price, which has been finalized, was based on the Company’s estimate of the fair value of the assets acquired and liabilities assumed. Goodwill, which is not tax-deductible, arose due to numerous synergies, including: 1) the Company selling items, which Granmark manufactures, through the Company’s Party City
82
Table of Contents
PARTY CITY HOLDCO INC.
NOTES TO CONSOLIDATED FINANCIAL STATEMENTS—(Continued)
(Dollars in thousands, except per share)
stores and 2) Granmark selling items, which the Company manufactures, to Granmark’s significant Mexican customer base.
Also, during March 2017, the Company acquired an additional 18 franchise stores, which are located in North Carolina and South Carolina, for total consideration of approximately $32,000. The following summarizes the fair values of the major classes of assets acquired and liabilities assumed: inventories of $7,700, property, plant and equipment of $500, a reacquired right intangible asset in the amount of $5,500, an asset in the amount of $300 due to leases that are favorable when compared to market rates and a deferred tax asset in the amount of $800. The allocation of the purchase price, which has been finalized, was based on the Company’s estimate of the fair value of the assets acquired and liabilities assumed. Goodwill, which is tax-deductible, arose due to numerous factors, including the wholesale profit generated via the sale of product from the Company’s wholesale operations through the 18 stores. Goodwill also arose due to the value to the Company of customers knowing that there are party stores in the locations (when the Company opens a new store, sales are initially lower than those of mature stores and increase over time), the Company’s ability to run the stores more efficiently than the franchisee based on the Company’s experience with its over 700 corporate-owned stores and the assembled workforce at the 18 stores.
During April 2017, the Company paid approximately $4,000 for a 28% ownership interest in Punchbowl, Inc., a provider of digital greeting cards and digital invitations. The Company is accounting for the investment under the equity method of accounting.
During July 2017, the Company acquired 60% of the common stock of Print Appeal, Inc. (“Print Appeal”), a wholesaler of personalized cups, napkins, and other items, for total consideration of approximately $3,000 (exclusive of $600 of cash acquired). Based on the terms of the acquisition agreement, the Company is required to acquire the remaining 40% interest over a four to six year period and it has recorded a liability for the estimated purchase price of such interest, $3,063 at December 31, 2017. The allocation of the purchase price has been finalized.
During December 2017, the Company acquired seven independent party stores, which are located in Oklahoma, for total consideration of approximately $6,000. The Company is in the process of finalizing the purchase price allocation.
Pro forma financial information has not been presented because the impact of the acquisitions individually, and in the aggregate, is not material to the Company’s consolidated financial results.
83
Table of Contents
PARTY CITY HOLDCO INC.
NOTES TO CONSOLIDATED FINANCIAL STATEMENTS—(Continued)
(Dollars in thousands, except per share)
Goodwill Changes by Reporting Segment
For the years ended December 31, 2017 and December 31, 2016 goodwill changes, by reporting segment, were as follows:
| Year Ended December 31, 2017 |
Year Ended December 31, 2016 |
|||||||
| Wholesale segment: |
||||||||
| Beginning balance |
$ | 491,859 | $ | 494,299 | ||||
| Granmark acquisition |
13,241 | 0 | ||||||
| Print Appeal acquisition |
3,133 | 0 | ||||||
| Other acquisitions |
1,348 | 3,572 | ||||||
| Foreign currency impact |
4,365 | (6,012 | ) | |||||
|
|
|
|
|
|||||
| Ending balance |
513,946 | 491,859 | ||||||
| Retail segment: |
||||||||
| Beginning balance |
1,080,709 | 1,068,216 | ||||||
| Store acquisitions |
23,025 | 12,869 | ||||||
| Foreign currency impact |
1,573 | (376 | ) | |||||
|
|
|
|
|
|||||
| Ending balance |
1,105,307 | 1,080,709 | ||||||
|
|
|
|
|
|||||
| Total ending balance, both segments |
$ | 1,619,253 | $ | 1,572,568 | ||||
|
|
|
|
|
|||||
Note 6 — Intangible Assets
The Company had the following other identifiable intangible assets:
| December 31, 2017 | ||||||||||||||||
| Cost | Accumulated Amortization |
Net Carrying Value |
Useful lives | |||||||||||||
| Retail franchise licenses |
$ | 81,600 | $ | 35,700 | $ | 45,900 | 4-19 years | |||||||||
| Customer lists and relationships |
61,527 | 36,268 | 25,259 | 2-20 years | ||||||||||||
| Copyrights and designs |
29,030 | 27,406 | 1,624 | 5-7 years | ||||||||||||
| Leasehold interests |
16,850 | 14,229 | 2,621 | 1-17 years | ||||||||||||
| Non-compete agreements |
500 | 200 | 300 | 5 years | ||||||||||||
|
|
|
|
|
|
|
|||||||||||
| Total |
$ | 189,507 | $ | 113,803 | $ | 75,704 | ||||||||||
|
|
|
|
|
|
|
|||||||||||
| December 31, 2016 | ||||||||||||||||
| Cost | Accumulated Amortization |
Net Carrying Value |
Useful lives | |||||||||||||
| Retail franchise licenses |
$ | 72,200 | $ | 27,600 | $ | 44,600 | 4-19 years | |||||||||
| Customer lists and relationships |
56,385 | 30,796 | 25,589 | 3-20 years | ||||||||||||
| Copyrights and designs |
29,030 | 24,454 | 4,576 | 5-7 years | ||||||||||||
| Leasehold interests |
15,556 | 14,140 | 1,416 | 1-11 years | ||||||||||||
| Non-compete agreements |
500 | 100 | 400 | 5 years | ||||||||||||
|
|
|
|
|
|
|
|||||||||||
| Total |
$ | 173,671 | $ | 97,090 | $ | 76,581 | ||||||||||
|
|
|
|
|
|
|
|||||||||||
84
Table of Contents
PARTY CITY HOLDCO INC.
NOTES TO CONSOLIDATED FINANCIAL STATEMENTS—(Continued)
(Dollars in thousands, except per share)
The Company is amortizing the majority of its intangible assets utilizing accelerated patterns based on the discounted cash flows that were used to value such assets.
The amortization expense for finite-lived intangible assets for the years ended December 31, 2017, December 31, 2016, and December 31, 2015 was $16,959, $17,247, and $18,885, respectively. Estimated amortization expense for each of the next five years will be approximately $14,239, $12,987, $10,043, $8,461, and $6,034, respectively.
In addition to the Company’s finite-lived intangible assets, the Company has recorded indefinite-lived intangible assets for the Party City trade name, the Amscan trade name, the Halloween City trade name, the Christys trade name, the Granmark trade name, the partycity.com domain name and the partydelights.co.uk domain name.
Note 7 — Loans and Notes Payable
ABL Facility
The Company has a $540,000 asset-based revolving credit facility (with a seasonal increase to $640,000 during a certain period of each calendar year) (“ABL Facility”), which matures on August 19, 2020. It provides for (a) revolving loans, subject to a borrowing base described below, and (b) letters of credit, in an aggregate face amount at any time outstanding not to exceed $50,000.
Under the ABL Facility, the borrowing base at any time equals (a) a percentage of eligible trade receivables, plus (b) a percentage of eligible inventory, plus (c) a percentage of eligible credit card receivables, less (d) certain reserves.
The ABL Facility generally provides for two pricing options: (i) an alternate base interest rate (“ABR”) equal to the greater of (a) the prime rate, (b) the federal funds rate plus 0.5% or (c) the LIBOR rate plus 1%, in each case, on the date of such borrowing or (ii) a LIBOR based interest rate, in each case plus an applicable margin. The applicable margin ranges from 0.25% to 0.50% with respect to ABR borrowings and from 1.25% to 1.50% with respect to LIBOR borrowings.
In addition to paying interest on outstanding principal, the Company is required to pay a commitment fee of 0.25% per annum in respect of unutilized commitments. The Company must also pay customary letter of credit fees.
All obligations under the ABL Facility are jointly and severally guaranteed by PC Intermediate, PCHI and each existing and future domestic subsidiary of PCHI. PCHI and each guarantor has secured its obligations, subject to certain exceptions and limitations, including obligations under its guaranty, as applicable, by a first-priority lien on its accounts receivable, inventory, cash and certain related assets and a second-priority lien on substantially all of its other assets.
The facility contains negative covenants that, among other things and subject to certain exceptions, restrict the ability of PCHI to:
| • | incur additional indebtedness; |
| • | pay dividends on capital stock or redeem, repurchase or retire capital stock; |
| • | make certain investments, loans, advances and acquisitions; |
85
Table of Contents
PARTY CITY HOLDCO INC.
NOTES TO CONSOLIDATED FINANCIAL STATEMENTS—(Continued)
(Dollars in thousands, except per share)
| • | engage in transactions with affiliates; |
| • | create liens; and |
| • | transfer or sell certain assets. |
In addition, PCHI must comply with a fixed charge coverage ratio if excess availability under the ABL Facility on any day is less than the greater of: (a) 10% of the lesser of the aggregate commitments and the then borrowing base under the ABL Facility and (b) $40,000. The fixed charge coverage ratio is the ratio of (i) Adjusted EBITDA (as defined in the facility) minus maintenance-related capital expenditures (as defined in the facility) to (ii) fixed charges (as defined in the facility).
The ABL Facility also contains certain customary affirmative covenants and events of default.
In connection with entering into the ABL Facility, the Company incurred and capitalized third-party costs. All capitalized costs are being amortized over the life of the ABL Facility and are included in loans and notes payable in the Company’s consolidated balance sheet. The balance of related unamortized financing costs at December 31, 2017 was $2,210.
Borrowings under the ABL Facility totaled $286,250 at December 31, 2017. The weighted average interest rate for such borrowings was 4.63% at December 31, 2017. Outstanding standby letters of credit totaled $26,328 at December 31, 2017 and, after considering borrowing base restrictions, at December 31, 2017 PCHI had $171,955 of available borrowing capacity under the terms of the facility.
Other Credit Agreements
The Company’s subsidiaries have also entered into several foreign asset-based and overdraft credit facilities that provide the Company with additional borrowing capacity. At December 31, 2017 and December 31, 2016, there were $2,251 and $1,162 borrowings outstanding under the foreign facilities, respectively. The facilities contain customary affirmative and negative covenants.
Note 8 — Long-Term Obligations
Long-term obligations consisted of the following:
| December 31, | ||||||||
| 2017 | 2016 | |||||||
| Senior secured term loan facility (“Term Loan Credit Agreement”) |
$ | 1,196,505 | $ | 1,205,496 | ||||
| 6.125% senior notes (“Senior Notes”) |
345,368 | 344,544 | ||||||
| Capital lease obligations |
3,276 | 2,912 | ||||||
|
|
|
|
|
|||||
| Total long-term obligations |
1,545,149 | 1,552,952 | ||||||
| Less: current portion |
(13,059 | ) | (13,348 | ) | ||||
|
|
|
|
|
|||||
| Long-term obligations, excluding current portion |
$ | 1,532,090 | $ | 1,539,604 | ||||
|
|
|
|
|
|||||
Term Loan Credit Agreement
During October 2016, the Company amended its Term Loan Credit Agreement. In conjunction with the amendment, the Company borrowed $100,000 under its ABL Facility and used the proceeds to make a voluntary
86
Table of Contents
PARTY CITY HOLDCO INC.
NOTES TO CONSOLIDATED FINANCIAL STATEMENTS—(Continued)
(Dollars in thousands, except per share)
prepayment of a portion of the outstanding balance under the Term Loan Credit Agreement. At the time of the amendment, all outstanding term loans were replaced with new term loans for the same principal amount. The applicable margin for ABR borrowings was lowered from 2.25% to 2.00% and the applicable margin for LIBOR borrowings was lowered from 3.25% to 3.00%. Additionally, the LIBOR floor was lowered from 1.00% to 0.75%.
During February 2018, the Company amended the Term Loan Credit Agreement again. The applicable margin for ABR borrowings was lowered from 2.00% to 1.75% and the applicable margin for LIBOR borrowings was lowered from 3.00% to 2.75%. Additionally, based on the terms of the amendment, the ABR and LIBOR margins will drop to 1.50% and 2.50%, respectively, if the Company’s Senior Secured Leverage Ratio, as defined by the agreement, falls below 3.2 to 1.0. See Note 22 for further discussion.
The amended agreement provides for two pricing options: (i) an ABR for any day, a rate per annum equal to the greater of (a) the prime rate in effect on such day, (b) the federal funds effective rate in effect on such day plus 0.5%, (c) the adjusted LIBOR rate plus 1% and (d) 1.75% or (ii) the LIBOR rate, with a LIBOR floor of 0.75%, in each case plus an applicable margin. The February 2018 amendment provides that the term loans are subject to a 1.00% prepayment premium if voluntarily repaid within six months from the date of the amendment. Otherwise, the term loans may be voluntarily prepaid at any time without premium or penalty, other than customary breakage costs with respect to loans based on the LIBOR rate.
Outstanding term loans are subject to mandatory prepayment, subject to certain exceptions, with (i) 100% of net proceeds above a threshold amount of certain asset sales/insurance proceeds, subject to reinvestment rights and certain other exceptions, (ii) 100% of the net cash proceeds of any incurrence of debt other than debt permitted under the Term Loan Credit Agreement, (iii) 50% of Excess Cash Flow, as defined in the agreement, if any (reduced to 25% if PCHI’s first lien leverage ratio (as defined in the agreement) is less than 3.50 to 1.00, but greater than 2.50 to 1.00, and 0% if PCHI’s first lien leverage ratio is less than 2.50 to 1.00).
The term loans under the Term Loan Credit Agreement mature on August 19, 2022. The Company is required to repay installments on the loans in quarterly principal amounts of 0.25%, with the remaining amount payable on the maturity date.
All obligations under the agreement are jointly and severally guaranteed by PC Intermediate, PCHI and each existing and future domestic subsidiary of PCHI. PCHI and each guarantor has secured its obligations, subject to certain exceptions and limitations, by a first-priority lien on substantially all of its assets (other than accounts receivable, inventory, cash and certain related assets), including a pledge of all of the capital stock held by PC Intermediate, PCHI and each guarantor, and a second-priority lien on its accounts receivable, inventory, cash and certain related assets.
The Term Loan Credit Agreement contains certain customary affirmative covenants and events of default. Additionally, it contains negative covenants which, among other things and subject to certain exceptions, restrict the ability of PCHI to:
| • | incur additional indebtedness; |
| • | pay dividends on capital stock or redeem, repurchase or retire capital stock; |
| • | make certain investments, loans, advances and acquisitions; |
| • | engage in transactions with affiliates; |
| • | create liens; and |
87
Table of Contents
PARTY CITY HOLDCO INC.
NOTES TO CONSOLIDATED FINANCIAL STATEMENTS—(Continued)
(Dollars in thousands, except per share)
| • | transfer or sell certain assets. |
At December 31, 2017, the principal amount of term loans outstanding under the Term Loan Credit Agreement was $1,211,268. Such amount is recorded net of original issue discounts, capitalized call premiums and deferred financing costs on the Company’s consolidated balance sheet. At December 31, 2017, original issue discounts, capitalized call premiums and deferred financing costs totaled $14,763. At December 31, 2017, all outstanding borrowings were based on LIBOR and were at a weighted average interest rate of 4.46%.
Senior Notes
The Senior Notes mature on August 15, 2023. Interest on the notes is payable semi-annually in arrears on February 15 and August 15 of each year. Interest accrues at 6.125%.
The notes are guaranteed, jointly and severally, on a senior basis by each of PCHI’s existing and future wholly-owned domestic subsidiaries. The Senior Notes and the guarantees are general unsecured senior obligations and are effectively subordinated to all other secured debt to the extent of the assets securing such secured debt.
The indenture governing the Senior Notes contains certain covenants limiting, among other things and subject to certain exceptions, PCHI’s ability to:
| • | incur additional indebtedness or issue certain disqualified stock and preferred stock; |
| • | pay dividends or distributions, redeem or repurchase equity; |
| • | prepay subordinated debt or make certain investments; |
| • | engage in transactions with affiliates; |
| • | consolidate, merge or transfer all or substantially all of PCHI’s assets; |
| • | create liens; and |
| • | transfer or sell certain assets. |
The indenture governing the notes also contains certain customary affirmative covenants and events of default.
On or after August 15, 2018, the Company may redeem the Senior Notes, in whole or in part, at the following (expressed as a percentage of the principal amount to be redeemed):
| Twelve-month period beginning on August 15, |
Percentage | |||
| 2018 |
103.063 | % | ||
| 2019 |
101.531 | % | ||
| 2020 and thereafter |
100.000 | % | ||
In addition, the Company may redeem up to 40% of the aggregate principal amount outstanding on or before August 15, 2018 with the net cash proceeds from certain equity offerings at a redemption price of 106.125% of the principal amount. The Company may also redeem some or all of the Senior Notes before August 15, 2018 at a redemption price of 100% of the principal amount plus a premium that is defined in the indenture.
88
Table of Contents
PARTY CITY HOLDCO INC.
NOTES TO CONSOLIDATED FINANCIAL STATEMENTS—(Continued)
(Dollars in thousands, except per share)
Also, if the Company experiences certain types of change in control, as defined, the Company may be required to offer to repurchase the Senior Notes at 101% of their principal amount.
In connection with issuing the Senior Notes, the Company incurred and capitalized third-party costs. Capitalized costs are being amortized over the life of the debt and are included in long-term obligations, excluding current portion, in the Company’s consolidated balance sheet. At December 31, 2017, $4,632 of costs were capitalized.
Other Indebtedness
Additionally, the Company has entered into various capital leases for machinery and equipment. At December 31, 2017 and December 31, 2016 the balances of such leases were $3,276 and $2,912, respectively.
Subject to certain exceptions, PCHI may not make certain payments, including the payment of dividends to its shareholders (“restricted payments”), unless certain conditions are met under the terms of the indenture governing the Senior Notes, the ABL Facility and the Term Loan Credit Agreement. As of December 31, 2017, the most restrictive of these conditions existed in the indenture for the Senior Notes and in the Term Loan Credit Agreement, which both limit restricted payments based on PCHI’s consolidated net income and leverage ratios. As of December 31, 2017, PCHI had $87,087 of capacity under the two debt instruments to make restricted payments. PCHI’s parent companies, PC Intermediate, PC Nextco and Party City Holdco, have no assets or operations other than their investments in their subsidiaries and income from those subsidiaries.
At December 31, 2017, maturities of long-term obligations consisted of the following:
| Long-Term Debt Obligations |
Capital Lease Obligations |
Totals | ||||||||||
| 2018 |
$ | 12,266 | $ | 793 | $ | 13,059 | ||||||
| 2019 |
12,266 | 716 | 12,982 | |||||||||
| 2020 |
12,266 | 604 | 12,870 | |||||||||
| 2021 |
12,266 | 800 | 13,066 | |||||||||
| 2022 |
1,162,204 | 363 | 1,162,567 | |||||||||
| Thereafter |
350,000 | 0 | 350,000 | |||||||||
|
|
|
|
|
|
|
|||||||
| Long-term obligations |
$ | 1,561,268 | $ | 3,276 | $ | 1,564,544 | ||||||
|
|
|
|
|
|
|
|||||||
Note 9 — Capital Stock
At December 31, 2017, the Company’s authorized capital stock consisted of 300,000,000 shares of $0.01 par value common stock and 15,000,000 shares of $0.01 par value preferred stock.
89
Table of Contents
PARTY CITY HOLDCO INC.
NOTES TO CONSOLIDATED FINANCIAL STATEMENTS—(Continued)
(Dollars in thousands, except per share)
The changes in common shares outstanding during the three years ended December 31, 2015, December 31, 2016 and December 31, 2017 were as follows:
| Common Shares Outstanding at December 31, 2014 |
91,007,894 | |||
| Adjustment to redeemable securities |
3,088,630 | |||
| Issuance of common stock |
25,156,250 | |||
| Exercise of stock options |
5,600 | |||
|
|
|
|||
| Common Shares Outstanding at December 31, 2015 |
119,258,374 | |||
| Exercise of stock options |
257,520 | |||
|
|
|
|||
| Common Shares Outstanding at December 31, 2016 |
119,515,894 | |||
| Exercise of stock options |
243,775 | |||
| Treasury stock purchases |
(23,379,567 | ) | ||
|
|
|
|||
| Common Shares Outstanding at December 31, 2017 |
96,380,102 | |||
|
|
|
During the year ended December 31, 2017, the Company acquired 23,379,567 treasury shares for $286,733. The shares are included in “common stock held in treasury” on the Company’s consolidated balance sheet.
Note 10 — Other Expense (Income), net
| Year Ended December 31, 2017 |
Year Ended December 31, 2016 |
Year Ended December 31, 2015 |
||||||||||
| Other expense (income), net consists of the following: |
||||||||||||
| Undistributed (gain) loss in unconsolidated joint ventures |
$ | (194 | ) | $ | 314 | $ | 562 | |||||
| Foreign currency losses (gains) |
466 | (7,417 | ) | 3,691 | ||||||||
| Debt refinancings (a) |
0 | 1,458 | 94,607 | |||||||||
| Management agreement termination fee (b) |
0 | 0 | 30,697 | |||||||||
| Corporate development expenses |
2,660 | 3,290 | 1,786 | |||||||||
| Other, net |
1,694 | 345 | (353 | ) | ||||||||
|
|
|
|
|
|
|
|||||||
| Other expense (income), net |
$ | 4,626 | $ | (2,010 | ) | $ | 130,990 | |||||
|
|
|
|
|
|
|
|||||||
| (a) | In August 2015, the Company refinanced its debt and recorded $79,010 of charges in other expense related to call premiums, third-party costs and the write-off of existing deferred financing costs, original issue discounts and capitalized call premiums. Further, during April 2015, the Company consummated an initial public offering of its common stock and the net proceeds of the offering were used to, among other things, fully redeem outstanding notes. The Company recorded $15,597 of charges related to the early redemption of such notes and the write-off of existing deferred financing costs and original issue discounts. |
| (b) | In conjunction with the initial public offering, the Company paid a management agreement termination fee to affiliates of THL and Advent. See Note 14 for further discussion. |
Note 11 — Employee Benefit Plans
Certain subsidiaries of the Company maintain defined contribution plans for eligible employees. The plans require the subsidiaries to match from approximately 11% to 100% of voluntary employee contributions to the plans, not to exceed a maximum amount of the employee’s annual salary, ranging from 5% to 6%. Expense for the plans for the years ended December 31, 2017, December 31, 2016, and December 31, 2015 totaled $6,565, $5,792, and $5,196, respectively.
90
Table of Contents
PARTY CITY HOLDCO INC.
NOTES TO CONSOLIDATED FINANCIAL STATEMENTS—(Continued)
(Dollars in thousands, except per share)
Note 12 — Equity Incentive Plans
Party City Holdco has adopted the Amended and Restated 2012 Omnibus Equity Incentive Plan (the “2012 Plan”) under which it can grant incentive awards in the form of stock appreciation rights, restricted stock and common stock options to certain directors, officers, employees and consultants of Party City Holdco and its affiliates. A committee of Party City Holdco’s Board of Directors, or the Board itself in the absence of a committee, is authorized to make grants and various other decisions under the 2012 Plan. The maximum number of shares reserved under the 2012 Plan is 15,316,000 shares.
Time-based options
Party City Holdco grants time-based options to key eligible employees and outside directors. In conjunction with the options, the Company recorded compensation expense of $5,309, $3,853, and $3,042 during the years ended December 31, 2017, December 31, 2016, and December 31, 2015, respectively.
The fair value of time-based options granted during the year ended December 31, 2017 was estimated on the grant date using a Black-Scholes option valuation model based on the assumptions in the following table:
| Expected dividend rate |
0% | |
| Risk-free interest rate |
1.79% to 2.22% | |
| Volatility |
25.44% to 27.05% | |
| Expected option term |
5.5 years – 6.5 years |
As Party City Holdco’s stock only recently started trading publicly, the Company determined volatility based on the average historical volatility of guideline companies. Additionally, as there is not sufficient historical exercise data to provide a reasonable basis for determining the expected term, the Company estimated the expected term using the “simplified” method.
The Company based its estimated forfeiture rate on historical forfeitures for time-based options that were granted by PCHI between 2004 and 2012 as the number of options given to each of the various levels of management is principally consistent with historical grants and forfeitures are expected to be materially consistent with past experience.
Most of the time-based options that were granted during 2013 vested 20% on July 27, 2013 and vest 20% each July 27th thereafter. The Company’s other time-based options principally vest 20% on each anniversary date. The Company records compensation expense for such options on a straight-line basis. As of December 31, 2017, there was $5,248 of unrecognized compensation cost, which will be recognized over a weighted-average period of approximately 33 months.
Performance-based options
During 2013, Party City Holdco granted performance-based stock options to key employees and independent directors. For performance-based options, vesting is contingent upon THL achieving specified investment returns when it sells its ownership stake in Party City Holdco. Since the sale of THL’s shares cannot be assessed as probable before it occurs, no compensation expense has been recorded for the performance-based
91
Table of Contents
PARTY CITY HOLDCO INC.
NOTES TO CONSOLIDATED FINANCIAL STATEMENTS—(Continued)
(Dollars in thousands, except per share)
options that have been granted. As of December 31, 2017, 3,673,600 performance-based options were outstanding. Based on a Monte Carlo simulation and the following assumptions, the options have an average grant date fair value of $3.09 per option:
| Expected dividend rate |
0% | |
| Risk-free interest rate |
1.86% | |
| Volatility |
52.00% | |
| Expected option term |
5 years |
As Party City Holdco’s stock was not publicly traded when the performance-based options were granted, the Company determined volatility based on the average historical volatility of guideline companies.
The following table summarizes the changes in outstanding stock options for the years ended December 31, 2015, December 31, 2016 and December 31, 2017.
| Options | Average Exercise Price |
Average Fair Value of Time-Based Options at Grant Date |
Aggregate Intrinsic Value |
Weighted Average Remaining Contractual Term (Years) |
||||||||||||||||
| Outstanding at December 31, 2014 |
6,686,400 | |||||||||||||||||||
|
|
|
|||||||||||||||||||
| Granted |
2,013,764 | $ | 17.97 | $ | 6.04 | |||||||||||||||
| Exercised |
(5,600 | ) | 5.33 | |||||||||||||||||
| Forfeited |
(176,919 | ) | 7.36 | |||||||||||||||||
|
|
|
|
|
|
|
|||||||||||||||
| Outstanding at December 31, 2015 |
8,517,645 | 8.28 | $ | 39,453 | 7.8 | |||||||||||||||
|
|
|
|
|
|
|
|||||||||||||||
| Granted |
484,950 | 15.78 | 4.68 | |||||||||||||||||
| Exercised |
(257,520 | ) | 5.33 | |||||||||||||||||
| Forfeited |
(283,249 | ) | 10.05 | |||||||||||||||||
|
|
|
|
|
|
|
|||||||||||||||
| Outstanding at December 31, 2016 |
8,461,826 | 8.74 | 46,214 | 6.9 | ||||||||||||||||
|
|
|
|
|
|
|
|||||||||||||||
| Granted |
101,444 | 14.38 | 4.46 | |||||||||||||||||
| Exercised |
(243,775 | ) | 5.33 | |||||||||||||||||
| Forfeited |
(294,734 | ) | 9.47 | |||||||||||||||||
|
|
|
|
|
|
|
|||||||||||||||
| Outstanding at December 31, 2017 |
8,024,761 | $ | 8.89 | $ | 40,634 | 6.0 | ||||||||||||||
|
|
|
|
|
|
|
|||||||||||||||
| Exercisable at December 31, 2017 |
2,795,414 | $ | 9.07 | $ | 13,636 | 5.9 | ||||||||||||||
|
|
|
|
|
|
|
|||||||||||||||
| Expected to vest at December 31, 2017 (excluding performance-based options) |
1,555,747 | $ | 16.95 | $ | (4,667 | ) | 7.7 | |||||||||||||
|
|
|
|
|
|
|
|||||||||||||||
The intrinsic value of options exercised was $1,972, $2,726 and $60 for the years ended December 31, 2017, December 31, 2016, and December 31, 2015, respectively. The fair value of options vested was $4,354, $4,110, and $1,726, during the years ended December 31, 2017, December 31, 2016, and December 31, 2015, respectively.
92
Table of Contents
PARTY CITY HOLDCO INC.
NOTES TO CONSOLIDATED FINANCIAL STATEMENTS—(Continued)
(Dollars in thousands, except per share)
Note 13 — Income Taxes
On December 22, 2017, the Tax Cuts and Jobs Act of 2017 (“the Act”) was signed into law. The Act significantly changed U.S. tax law, including lowering the U.S. corporate income tax rate from 35% to 21%, effective January 1, 2018, and implementing a one-time “deemed repatriation” tax on unremitted earnings accumulated in non-U.S. jurisdictions since 1986 (the “Transition Tax”). Due to the complexities of accounting for the Act, the SEC issued Staff Accounting Bulletin (“SAB”) No. 118 which allows entities to include a provisional estimate of the impact of the Act in its 2017 financial statements. Therefore, based on currently available information, during the fourth quarter of 2017, the Company recorded a provisional estimate of the impact of the Act, which included an income tax benefit of $90,965 related to the remeasurement of its domestic net deferred tax liabilities and deferred tax assets due to the lower U.S. corporate tax rate. Additionally, the Company recorded a net income tax expense of $1,132 as its provisional estimate of the Transition Tax related to the deemed repatriation of unremitted earnings of foreign subsidiaries. While these amounts represent the Company’s best estimates of the impacts of the reduction in the federal corporate income tax rate and the deemed repatriation Transition Tax, the final impacts of the Act may differ from the Company’s estimates due to, among other things, changes in the Company’s interpretations and assumptions, additional guidance to be issued by the IRS, and actions the Company may take. As provided in SAB 118, any adjustments to these provisional amounts will be recorded as they are identified during the measurement period, which ends no later than December 22, 2018.
A summary of domestic and foreign income before income taxes and including noncontrolling interest follows:
| Year Ended December 31, 2017 |
Year Ended December 31, 2016 |
Year Ended December 31, 2015 |
||||||||||
| Domestic |
$ | 153,280 | $ | 152,800 | $ | 7,180 | ||||||
| Foreign |
34,864 | 33,914 | 10,688 | |||||||||
|
|
|
|
|
|
|
|||||||
| Total |
$ | 188,144 | $ | 186,714 | $ | 17,868 | ||||||
|
|
|
|
|
|
|
|||||||
The income tax (benefit) expense consisted of the following:
| Year Ended December 31, 2017 |
Year Ended December 31, 2016 |
Year Ended December 31, 2015 |
||||||||||
| Current: |
||||||||||||
| Federal |
$ | 61,890 | $ | 50,851 | $ | 8,137 | ||||||
| State |
6,267 | 8,121 | 2,652 | |||||||||
| Foreign |
7,298 | 6,864 | 2,798 | |||||||||
|
|
|
|
|
|
|
|||||||
| Total current expense |
75,455 | 65,836 | 13,587 | |||||||||
| Deferred: |
||||||||||||
| Federal |
(101,774 | ) | 3,290 | (6,710 | ) | |||||||
| State |
(796 | ) | (906 | ) | (1,086 | ) | ||||||
| Foreign |
(81 | ) | 1,017 | 1,618 | ||||||||
|
|
|
|
|
|
|
|||||||
| Total deferred (benefit) expense |
(102,651 | ) | 3,401 | (6,178 | ) | |||||||
|
|
|
|
|
|
|
|||||||
| Income tax (benefit) expense |
$ | (27,196 | ) | $ | 69,237 | $ | 7,409 | |||||
|
|
|
|
|
|
|
|||||||
93
Table of Contents
PARTY CITY HOLDCO INC.
NOTES TO CONSOLIDATED FINANCIAL STATEMENTS—(Continued)
(Dollars in thousands, except per share)
Deferred income taxes reflect the net tax effect of temporary differences between the carrying amounts of assets and liabilities for financial reporting purposes and the amounts used for income tax purposes.
The deferred federal income tax benefit for the year ended December 31, 2017 includes a $90,965 provisional benefit due to the Act lowering the U.S. corporate income tax rate from 35% to 21%. See above for further discussion.
Deferred income tax assets and liabilities consisted of the following:
| December 31, | ||||||||
| 2017 | 2016 | |||||||
| Deferred income tax assets: |
||||||||
| Inventory valuation |
$ | 7,064 | $ | 10,138 | ||||
| Allowance for doubtful accounts |
746 | 893 | ||||||
| Accrued liabilities |
8,130 | 10,402 | ||||||
| Equity based compensation |
3,145 | 3,236 | ||||||
| Federal tax loss carryforwards |
960 | 2,715 | ||||||
| State tax loss carryforwards |
1,726 | 1,070 | ||||||
| Foreign tax loss carryforwards |
14,151 | 13,992 | ||||||
| Foreign tax credit carryforwards |
6,412 | 1,418 | ||||||
| Deferred rent |
9,867 | 11,816 | ||||||
| Other |
166 | 509 | ||||||
|
|
|
|
|
|||||
| Deferred income tax assets before valuation allowances |
52,367 | 56,189 | ||||||
| Less: valuation allowances |
(24,073 | ) | (17,331 | ) | ||||
|
|
|
|
|
|||||
| Deferred income tax assets, net |
$ | 28,294 | $ | 38,858 | ||||
|
|
|
|
|
|||||
| Deferred income tax liabilities: |
||||||||
| Property, plant and equipment |
$ | 13,855 | $ | 24,055 | ||||
| Intangible assets |
145,066 | 218,046 | ||||||
| Amortization of goodwill and other assets |
42,297 | 61,163 | ||||||
| Foreign earnings expected to be repatriated |
586 | 10,954 | ||||||
| Other |
1,176 | 2,655 | ||||||
|
|
|
|
|
|||||
| Deferred income tax liabilities |
$ | 202,980 | $ | 316,873 | ||||
|
|
|
|
|
|||||
In the Company’s December 31, 2017 consolidated balance sheet, $1,150 was included in “other assets, net” and $175,836 was included in deferred income tax liabilities. At December 31, 2016, $804 was included in “other assets, net” and $278,819 was included in deferred income tax liabilities.
Management assesses the available positive and negative evidence to estimate if sufficient taxable income will be generated to realize existing deferred tax assets. On the basis of this evaluation, a valuation allowance was recorded to reduce the total deferred tax assets to an amount that will, more-likely-than-not, be realized in the future. The valuation allowance, and the net change during the year, relate primarily to foreign net operating loss carryforwards and foreign tax credit carryforwards, the latter of which principally resulted from the Transition Tax. The estimate of foreign source income incorporated assumptions based upon the best available interpretation of the Act and may change as additional clarification and implementation guidance is made available.
94
Table of Contents
PARTY CITY HOLDCO INC.
NOTES TO CONSOLIDATED FINANCIAL STATEMENTS—(Continued)
(Dollars in thousands, except per share)
As of December 31, 2017, the Company had foreign tax-effected net operating loss carryforwards in Germany of $9,074, the U.K. of $4,108, and Australia of $635, all of which have an unlimited carryforward; as well as $334 from other foreign countries, which expire at different dates. In addition, the U.S. federal net operating loss carryforwards begin to expire in 2020, the U.S. state net operating loss carryforwards begin to expire in 2018 and the foreign tax credit carryforwards begin to expire in 2020.
The difference between the Company’s effective income tax rate and the U.S. statutory income tax rate is as follows:
| Year Ended December 31, 2017 |
Year Ended December 31, 2016 |
Year Ended December 31, 2015 |
||||||||||
| Tax provision at U.S. statutory income tax rate |
35.0 | % | 35.0 | % | 35.0 | % | ||||||
| State income tax, net of federal income tax |
1.9 | 2.5 | 5.7 | |||||||||
| Domestic production activities deduction |
(1.4 | ) | (1.0 | ) | (5.1 | ) | ||||||
| Contingent consideration adjustment |
0.2 | (0.1 | ) | (6.0 | ) | |||||||
| Work Opportunity Tax Credit |
(0.4 | ) | (0.3 | ) | (3.2 | ) | ||||||
| Valuation allowances |
2.1 | 0.5 | 21.7 | |||||||||
| Foreign earnings |
(1.7 | ) | 2.3 | 9.1 | ||||||||
| U.S. — foreign rate differential |
(1.9 | ) | (2.4 | ) | (13.7 | ) | ||||||
| Transition Tax on unremitted foreign earnings, net |
0.6 | 0.0 | 0.0 | |||||||||
| Effect of the Act on Federal deferred income tax assets and liabilities |
(48.4 | ) | 0.0 | 0.0 | ||||||||
| Other |
(0.5 | ) | 0.6 | (2.0 | ) | |||||||
|
|
|
|
|
|
|
|||||||
| Effective income tax rate |
(14.5 | )% | 37.1 | % | 41.5 | % | ||||||
|
|
|
|
|
|
|
|||||||
Transition Tax on Unremitted Foreign Earnings: As a result of the Act, the U.S. is transitioning from a worldwide system of international taxation to a territorial tax system, thereby eliminating the U.S. federal tax on foreign earnings. However, the Act requires a one-time deemed repatriation tax on such earnings and, accordingly, during the fourth quarter of 2017, the Company provisionally recorded a Transition Tax of $11,500 related to such requirement. Of such amount, $920 will be paid in 2018 and is recorded in income taxes payable on the Company’s consolidated balance sheet. The remainder will be paid in subsequent years and is recorded in “deferred rent and other long-term liabilities” in the Company’s consolidated balance sheet. Prior to the fourth quarter of 2017, the Company recorded deferred income tax liabilities for certain foreign earnings which were expected to be remitted to the U.S. in future periods. Therefore, the expense that was provisionally recorded due to the deemed repatriation tax, $11,500, was mostly offset by the reversal of previously recorded deferred income tax liabilities on unremitted foreign earnings, $10,368. After such reversal, a deferred tax liability, in the amount of $586, remained recorded on the Company’s consolidated balance sheet due to the impact of foreign withholding taxes and state income taxes on the future repatriation of certain foreign earnings.
Effect of the Act on Federal Deferred Income Tax Assets and Liabilities: The deferred federal benefit for the year ended December 31, 2017 includes a $90,965 provisional benefit due to the Act changing the U.S. corporate income tax rate from 35% to 21%. See above for further discussion.
Other differences between the effective income tax rate and the federal statutory income tax rate are composed primarily of reserves for unrecognized tax benefits, non-deductible meals and entertainment expenses, and benefits related to the exercise of stock options.
95
Table of Contents
PARTY CITY HOLDCO INC.
NOTES TO CONSOLIDATED FINANCIAL STATEMENTS—(Continued)
(Dollars in thousands, except per share)
The following table summarizes the activity related to the Company’s gross unrecognized tax benefits:
| Year Ended December 31, 2017 |
Year Ended December 31, 2016 |
Year Ended December 31, 2015 |
||||||||||
| Balance as of beginning of period |
$ | 913 | $ | 765 | $ | 798 | ||||||
| Increases related to current period tax positions |
100 | 444 | 130 | |||||||||
| (Decreases) increases related to prior period tax positions |
(158 | ) | 339 | 0 | ||||||||
| Decreases related to settlements |
0 | (635 | ) | (92 | ) | |||||||
| Decreases related to lapsing of statutes of limitations |
0 | 0 | (71 | ) | ||||||||
|
|
|
|
|
|
|
|||||||
| Balance as of end of period |
$ | 855 | $ | 913 | $ | 765 | ||||||
|
|
|
|
|
|
|
|||||||
The Company’s total unrecognized tax benefits that, if recognized, would impact the Company’s effective tax rate were $855 and $913 at December 31, 2017 and 2016, respectively. As of December 31, 2017, we do not believe that there are any positions for which it is reasonably possible that the total amount of unrecognized tax benefits will significantly increase or decrease within the next 12 months.
The Company recognizes accrued interest and penalties related to unrecognized tax benefits in income tax expense. The Company has accrued $73 and $28 for the potential payment of interest and penalties at December 31, 2017 and 2016, respectively. Such amounts are not included in the table above.
The IRS is currently conducting an examination of the year ended December 31, 2015. For U.S. state income tax purposes, tax years 2013-2017 generally remain open; whereas for non-U.S. income tax purposes, tax years 2012-2017 generally remain open.
Note 14 — Commitments, Contingencies and Related Party Transactions
Lease Agreements
The Company has non-cancelable operating leases for its numerous retail store sites, as well as for its corporate offices, certain distribution and manufacturing facilities, showrooms, and warehouse equipment that expire on various dates, principally through 2029. These leases generally contain renewal options and require the Company to pay real estate taxes, utilities and related insurance.
At December 31, 2017, future minimum lease payments under all operating leases consisted of the following:
| Future Minimum Operating Lease Payments |
||||
| 2018 |
$ | 186,278 | ||
| 2019 |
161,996 | |||
| 2020 |
146,603 | |||
| 2021 |
132,217 | |||
| 2022 |
115,502 | |||
| Thereafter |
310,992 | |||
|
|
|
|||
| $ | 1,053,588 | |||
|
|
|
|||
96
Table of Contents
PARTY CITY HOLDCO INC.
NOTES TO CONSOLIDATED FINANCIAL STATEMENTS—(Continued)
(Dollars in thousands, except per share)
The future minimum lease payments included in the above table also do not include contingent rent based upon sales volumes or other variable costs, such as maintenance, insurance and taxes.
Rent expense for the years ended December 31, 2017, December 31, 2016, and December 31, 2015 was $255,615, $235,790, and $225,543, respectively, and included immaterial amounts of rent expense related to contingent rent.
Litigation
On April 5, 2016, a derivative complaint was filed in the Supreme Court for the State of New York, naming certain directors and executives as defendants, and naming the Company as a nominal defendant. The complaint seeks unspecified damages and costs, and corporate governance reforms, for alleged injury to the Company in connection with public filings related to the Company’s April 2015 IPO, compensation paid to executives, and the termination of the management agreement disclosed in the initial public offering-related public filings. The Company intends to vigorously defend itself against this action. The Company is unable, at this time, to determine whether the outcome of the litigation would have a material impact on its results of operations, financial condition or cash flows.
Additionally, the Company is a party to certain claims and litigation in the ordinary course of business. The Company does not believe that any of these proceedings will result, individually or in the aggregate, in a material adverse effect upon its financial condition or future results of operations.
Product Royalty Agreements
The Company has entered into product royalty agreements, with various licensors of copyrighted and trademarked characters and designs, which are used on the Company’s products, which require royalty payments based on sales of the Company’s products, and, in some cases, include annual minimum royalties.
At December 31, 2017, the Company’s commitment to pay future minimum product royalties was as follows:
| Future Minimum Royalty Payments |
||||
| 2018 |
$ | 29,879 | ||
| 2019 |
18,982 | |||
| 2020 |
6,992 | |||
| 2021 |
150 | |||
| 2022 |
0 | |||
| Thereafter |
0 | |||
|
|
|
|||
| $ | 56,003 | |||
|
|
|
|||
Product royalty expense for the years ended December 31, 2017, December 31, 2016, and December 31, 2015 was $46,242, $43,914, and $45,710, respectively.
Related Party Transactions
During 2012, Party City Holdco and PCHI entered into a management agreement with THL and Advent under which THL and Advent provided advice on, among other things, financing, operations, acquisitions and
97
Table of Contents
PARTY CITY HOLDCO INC.
NOTES TO CONSOLIDATED FINANCIAL STATEMENTS—(Continued)
(Dollars in thousands, except per share)
dispositions. Under the agreement, THL and Advent were paid, in aggregate, an annual management fee in the amount of the greater of $3,000 or 1.0% of Adjusted EBITDA, as defined in PCHI’s debt agreements. THL and Advent received annual management fees in the amounts of $692 and $238, respectively, during the year ended December 31, 2015. Such amounts were recorded in general and administrative expenses in the Company’s consolidated statement of operations and comprehensive income (loss). In the case of an initial public offering or a change in control, as defined in Party City Holdco’s stockholders’ agreement, at the time of such event the Company was required to pay THL and Advent the net present value of the remaining annual management fees that were payable over the agreement’s ten year term. Therefore, during April 2015, in conjunction with the Company’s initial public offering, the Company paid a management agreement termination fee of $30,697.
Morry Weiss became a member of the Company’s Board of Directors in June 2015. He is the Chairman of the Board of American Greetings Corporation (“American Greetings”). During the years ended December 31, 2017, December 31, 2016 and December 31, 2015, the Company had $22,100, $19,600 and $30,100, respectively, of sales to American Greetings in the ordinary course of business. Additionally, during such years, the Company purchased $3,700, $2,700 and $3,500, respectively, of product from American Greetings, also in the ordinary course.
Additionally, in the normal course of business, the Company buys and sells party goods from/to certain equity method investees. Such activity is immaterial to the Company’s consolidated financial statements.
Note 15 — Segment Information
Industry Segments
The Company has two identifiable business segments. The Wholesale segment designs, manufactures, contracts for manufacture and distributes party goods, including paper and plastic tableware, metallic and latex balloons, Halloween and other costumes, accessories, novelties and stationery throughout the world. The Retail segment operates specialty retail party supply stores in the United States and Canada, principally under the names Party City and Halloween City, and it operates e-commerce websites, principally through the domain name PartyCity.com. The Retail segment also franchises both individual stores and franchise areas throughout the United States, Mexico and Puerto Rico, principally under the name Party City.
The Company’s industry segment data for the years ended December 31, 2017, December 31, 2016, and December 31, 2015 are as follows:
| Wholesale | Retail | Consolidated | ||||||||||
| Year Ended December 31, 2017 |
||||||||||||
| Revenues: |
||||||||||||
| Net sales |
$ | 1,260,089 | $ | 1,728,589 | $ | 2,988,678 | ||||||
| Royalties and franchise fees |
0 | 13,583 | 13,583 | |||||||||
|
|
|
|
|
|
|
|||||||
| Total revenues |
1,260,089 | 1,742,172 | 3,002,261 | |||||||||
| Eliminations |
(630,692 | ) | 0 | (630,692 | ) | |||||||
|
|
|
|
|
|
|
|||||||
| Net revenues |
$ | 629,397 | $ | 1,742,172 | $ | 2,371,569 | ||||||
|
|
|
|
|
|
|
|||||||
| Income from operations |
$ | 68,130 | $ | 212,006 | $ | 280,136 | ||||||
|
|
|
|
|
|||||||||
| Interest expense, net |
87,366 | |||||||||||
| Other expense, net |
4,626 | |||||||||||
|
|
|
|||||||||||
| Income before income taxes |
$ | 188,144 | ||||||||||
|
|
|
|||||||||||
| Depreciation and amortization |
$ | 30,520 | $ | 54,648 | $ | 85,168 | ||||||
|
|
|
|
|
|
|
|||||||
| Capital expenditures |
$ | 32,490 | $ | 34,480 | $ | 66,970 | ||||||
|
|
|
|
|
|
|
|||||||
| Total assets |
$ | 1,050,620 | $ | 2,404,136 | $ | 3,454,756 | ||||||
|
|
|
|
|
|
|
|||||||
98
Table of Contents
PARTY CITY HOLDCO INC.
NOTES TO CONSOLIDATED FINANCIAL STATEMENTS—(Continued)
(Dollars in thousands, except per share)
| Wholesale | Retail | Consolidated | ||||||||||
| Year Ended December 31, 2016 |
||||||||||||
| Revenues: |
||||||||||||
| Net sales |
$ | 1,252,218 | $ | 1,641,068 | $ | 2,893,286 | ||||||
| Royalties and franchise fees |
0 | 17,005 | 17,005 | |||||||||
|
|
|
|
|
|
|
|||||||
| Total revenues |
1,252,218 | 1,658,073 | 2,910,291 | |||||||||
| Eliminations |
(626,900 | ) | 0 | (626,900 | ) | |||||||
|
|
|
|
|
|
|
|||||||
| Net revenues |
$ | 625,318 | $ | 1,658,073 | $ | 2,283,391 | ||||||
|
|
|
|
|
|
|
|||||||
| Income from operations |
$ | 91,920 | $ | 182,164 | $ | 274,084 | ||||||
|
|
|
|
|
|||||||||
| Interest expense, net |
89,380 | |||||||||||
| Other income, net |
(2,010 | ) | ||||||||||
|
|
|
|||||||||||
| Income before income taxes |
$ | 186,714 | ||||||||||
|
|
|
|||||||||||
| Depreciation and amortization |
$ | 29,695 | $ | 53,935 | $ | 83,630 | ||||||
|
|
|
|
|
|
|
|||||||
| Capital expenditures |
$ | 26,854 | $ | 55,094 | $ | 81,948 | ||||||
|
|
|
|
|
|
|
|||||||
| Total assets |
$ | 1,004,599 | $ | 2,389,379 | $ | 3,393,978 | ||||||
|
|
|
|
|
|
|
|||||||
| Wholesale | Retail | Consolidated | ||||||||||
| Year Ended December 31, 2015 |
||||||||||||
| Revenues: |
||||||||||||
| Net sales |
$ | 1,226,989 | $ | 1,621,524 | $ | 2,848,513 | ||||||
| Royalties and franchise fees |
0 | 19,411 | 19,411 | |||||||||
|
|
|
|
|
|
|
|||||||
| Total revenues |
1,226,989 | 1,640,935 | 2,867,924 | |||||||||
| Eliminations |
(573,391 | ) | 0 | (573,391 | ) | |||||||
|
|
|
|
|
|
|
|||||||
| Net revenues |
$ | 653,598 | $ | 1,640,935 | $ | 2,294,533 | ||||||
|
|
|
|
|
|
|
|||||||
| Income from operations |
$ | 85,728 | $ | 186,491 | $ | 272,219 | ||||||
|
|
|
|
|
|||||||||
| Interest expense, net |
123,361 | |||||||||||
| Other expense, net |
130,990 | |||||||||||
|
|
|
|||||||||||
| Income before income taxes |
$ | 17,868 | ||||||||||
|
|
|
|||||||||||
| Depreciation and amortization |
$ | 29,352 | $ | 51,163 | $ | 80,515 | ||||||
|
|
|
|
|
|
|
|||||||
| Capital expenditures |
$ | 18,849 | $ | 59,976 | $ | 78,825 | ||||||
|
|
|
|
|
|
|
|||||||
Geographic Segments
Export sales of metallic balloons of $22,812, $23,631, and $22,803 during the years ended December 31, 2017, December 31, 2016, and December 31, 2015, respectively, are included in domestic sales to unaffiliated customers below. Intercompany sales between geographic areas primarily consist of sales of finished goods and are generally made at cost plus a share of operating profit.
99
Table of Contents
PARTY CITY HOLDCO INC.
NOTES TO CONSOLIDATED FINANCIAL STATEMENTS—(Continued)
(Dollars in thousands, except per share)
The Company’s geographic area data follows:
| Domestic | Foreign | Eliminations | Consolidated | |||||||||||||
| Year Ended December 31, 2017 |
||||||||||||||||
| Revenues: |
||||||||||||||||
| Net sales to unaffiliated customers |
$ | 1,962,697 | $ | 395,289 | $ | 0 | $ | 2,357,986 | ||||||||
| Net sales between geographic areas |
54,268 | 64,585 | (118,853 | ) | 0 | |||||||||||
|
|
|
|
|
|
|
|
|
|||||||||
| Net sales |
2,016,965 | 459,874 | (118,853 | ) | 2,357,986 | |||||||||||
| Royalties and franchise fees |
13,583 | 0 | 0 | 13,583 | ||||||||||||
|
|
|
|
|
|
|
|
|
|||||||||
| Total revenues |
$ | 2,030,548 | $ | 459,874 | $ | (118,853 | ) | $ | 2,371,569 | |||||||
|
|
|
|
|
|
|
|
|
|||||||||
| Income from operations |
$ | 252,270 | $ | 27,866 | $ | 0 | $ | 280,136 | ||||||||
|
|
|
|
|
|
|
|||||||||||
| Interest expense, net |
87,366 | |||||||||||||||
| Other expense, net |
4,626 | |||||||||||||||
|
|
|
|||||||||||||||
| Income before income taxes |
$ | 188,144 | ||||||||||||||
|
|
|
|||||||||||||||
| Depreciation and amortization |
$ | 76,970 | $ | 8,198 | $ | 85,168 | ||||||||||
|
|
|
|
|
|
|
|||||||||||
| Total long-lived assets (excluding goodwill, trade names and other intangible assets, net) |
$ | 277,791 | $ | 36,174 | $ | 313,965 | ||||||||||
|
|
|
|
|
|
|
|||||||||||
| Total assets |
$ | 3,131,256 | $ | 323,500 | $ | 0 | $ | 3,454,756 | ||||||||
|
|
|
|
|
|
|
|
|
|||||||||
| Domestic | Foreign | Eliminations | Consolidated | |||||||||||||
| Year Ended December 31, 2016 |
||||||||||||||||
| Revenues: |
||||||||||||||||
| Net sales to unaffiliated customers |
$ | 1,917,158 | $ | 349,228 | $ | 0 | $ | 2,266,386 | ||||||||
| Net sales between geographic areas |
51,916 | 80,776 | (132,692 | ) | 0 | |||||||||||
|
|
|
|
|
|
|
|
|
|||||||||
| Net sales |
1,969,074 | 430,004 | (132,692 | ) | 2,266,386 | |||||||||||
| Royalties and franchise fees |
17,005 | 0 | 0 | 17,005 | ||||||||||||
|
|
|
|
|
|
|
|
|
|||||||||
| Total revenues |
$ | 1,986,079 | $ | 430,004 | $ | (132,692 | ) | $ | 2,283,391 | |||||||
|
|
|
|
|
|
|
|
|
|||||||||
| Income from operations |
$ | 257,774 | $ | 16,310 | $ | 0 | $ | 274,084 | ||||||||
|
|
|
|
|
|
|
|||||||||||
| Interest expense, net |
89,380 | |||||||||||||||
| Other income, net |
(2,010 | ) | ||||||||||||||
|
|
|
|||||||||||||||
| Income before income taxes |
$ | 186,714 | ||||||||||||||
|
|
|
|||||||||||||||
| Depreciation and amortization |
$ | 77,176 | $ | 6,454 | $ | 83,630 | ||||||||||
|
|
|
|
|
|
|
|||||||||||
| Total long-lived assets (excluding goodwill, trade names and other intangible assets, net) |
$ | 269,047 | $ | 28,359 | $ | 297,406 | ||||||||||
|
|
|
|
|
|
|
|||||||||||
| Total assets |
$ | 3,147,003 | $ | 246,975 | $ | 0 | $ | 3,393,978 | ||||||||
|
|
|
|
|
|
|
|
|
|||||||||
100
Table of Contents
PARTY CITY HOLDCO INC.
NOTES TO CONSOLIDATED FINANCIAL STATEMENTS—(Continued)
(Dollars in thousands, except per share)
| Domestic | Foreign | Eliminations | Consolidated | |||||||||||||
| Year Ended December 31, 2015 |
||||||||||||||||
| Revenues: |
||||||||||||||||
| Net sales to unaffiliated customers |
$ | 1,937,793 | $ | 337,329 | $ | 0 | $ | 2,275,122 | ||||||||
| Net sales between geographic areas |
47,752 | 74,974 | (122,726 | ) | 0 | |||||||||||
|
|
|
|
|
|
|
|
|
|||||||||
| Net sales |
1,985,545 | 412,303 | (122,726 | ) | 2,275,122 | |||||||||||
| Royalties and franchise fees |
19,411 | 0 | 0 | 19,411 | ||||||||||||
|
|
|
|
|
|
|
|
|
|||||||||
| Total revenues |
$ | 2,004,956 | $ | 412,303 | $ | (122,726 | ) | $ | 2,294,533 | |||||||
|
|
|
|
|
|
|
|
|
|||||||||
| Income from operations |
$ | 267,209 | $ | 5,010 | $ | 0 | $ | 272,219 | ||||||||
|
|
|
|
|
|
|
|||||||||||
| Interest expense, net |
123,361 | |||||||||||||||
| Other expense, net |
130,990 | |||||||||||||||
|
|
|
|||||||||||||||
| Income before income taxes |
$ | 17,868 | ||||||||||||||
|
|
|
|||||||||||||||
| Depreciation and amortization |
$ | 74,849 | $ | 5,666 | $ | 80,515 | ||||||||||
|
|
|
|
|
|
|
|||||||||||
Note 16 — Quarterly Results (Unaudited)
Despite a concentration of holidays in the fourth quarter of the year, as a result of the Company’s expansive product lines and customer base and increased promotional activities, the impact of seasonality on the quarterly results of the Company’s wholesale operations has been limited. However, due to Halloween and Christmas, the inventory balances of the Company’s wholesale operations are slightly higher during the third quarter than during the remainder of the year. Additionally, the promotional activities of the Company’s wholesale business, including special dating terms, particularly with respect to Halloween products sold to retailers and other distributors, result in slightly higher accounts receivable balances during the third quarter. The Company’s retail operations are subject to significant seasonal variations. Historically, the Company’s retail operations have realized a significant portion of their revenues, cash flow and net income in the fourth quarter of the year, principally due to Halloween sales in October and, to a lesser extent, year-end holiday sales.
The following table sets forth our historical revenues, gross profit, income (loss) from operations, net income (loss), net income (loss) attributable to Party City Holdco Inc., net income (loss) per common share – Basic, and net income (loss) per common share—Diluted for each of the following periods:
| For the Three Months Ended, | ||||||||||||||||
| 2017: |
March 31, | June 30, | September 30, | December 31, | ||||||||||||
| Revenues: |
||||||||||||||||
| Net sales |
$ | 473,963 | $ | 541,653 | $ | 557,350 | $ | 785,020 | ||||||||
| Royalties and franchise fees |
3,036 | 3,225 | 2,759 | 4,563 | ||||||||||||
| Gross profit |
175,244 | 219,753 | 199,827 | 367,883 | ||||||||||||
| Income from operations |
14,671 | 60,699 | 37,388 | 167,378 | ||||||||||||
| Net (loss) income |
(4,683 | ) | 24,982 | 10,084 | 184,957 | (a) | ||||||||||
| Net (loss) income per common share—Basic |
$ | (0.04 | ) | $ | 0.21 | $ | 0.08 | $ | 1.59 | (a) | ||||||
| Net (loss) income per common share—Diluted |
$ | (0.04 | ) | $ | 0.21 | $ | 0.08 | $ | 1.58 | (a) | ||||||
101
Table of Contents
PARTY CITY HOLDCO INC.
NOTES TO CONSOLIDATED FINANCIAL STATEMENTS—(Continued)
(Dollars in thousands, except per share)
| For the Three Months Ended, | ||||||||||||||||
| 2016: |
March 31, | June 30, | September 30, | December 31, | ||||||||||||
| Revenues: |
||||||||||||||||
| Net sales |
$ | 454,286 | $ | 515,426 | $ | 553,382 | $ | 743,292 | ||||||||
| Royalties and franchise fees |
3,454 | 3,987 | 3,568 | 5,996 | ||||||||||||
| Gross profit |
166,519 | 207,561 | 196,720 | 345,199 | ||||||||||||
| Income from operations |
19,556 | 58,480 | 36,918 | 159,130 | ||||||||||||
| Net (loss) income |
(394 | ) | 22,515 | 10,180 | 85,176 | |||||||||||
| Net (loss) income per common share—Basic |
$ | (0.00 | ) | $ | 0.19 | $ | 0.09 | $ | 0.71 | |||||||
| Net (loss) income per common share—Diluted |
$ | (0.00 | ) | $ | 0.19 | $ | 0.08 | $ | 0.71 | |||||||
| (a) | On December 22, 2017, the Tax Cuts and Jobs Act of 2017 (“the Act”) was signed into law. The Act significantly changed U.S. tax law, including lowering the U.S. corporate income tax rate from 35% to 21%, effective January 1, 2018, and implementing a one-time “deemed repatriation” tax on unremitted earnings accumulated in non-U.S. jurisdictions. Due to the complexities of accounting for the Act, SEC Staff Accounting Bulletin No. 118 allows entities to include a provisional estimate of the impact of the Act in its 2017 financial statements. Therefore, based on currently available information, during 2017 the Company recorded a provisional income tax benefit of $90,965 related to the remeasurement of its deferred tax liabilities and deferred tax assets due to the lower U.S. corporate tax rate. Additionally, during 2017, the Company recorded provisional income tax expense of $1,132 related to the deemed repatriation of unremitted earnings of foreign subsidiaries. See Note 13 for further discussion. |
Note 17 — Fair Value Measurements
The provisions of ASC Topic 820, “Fair Value Measurement”, define fair value as the exchange price that would be received for an asset or paid to transfer a liability (an exit price) in the principal or most advantageous market for the asset or liability in an orderly transaction between market participants at the measurement date. ASC Topic 820 established a three-level fair value hierarchy that prioritizes the inputs used to measure fair value. This hierarchy requires entities to maximize the use of observable inputs and minimize the use of unobservable inputs. The three levels of inputs used to measure fair value are as follows:
| • | Level 1 — Quoted prices in active markets for identical assets or liabilities. |
| • | Level 2 — Observable inputs other than quoted prices included in Level 1, such as quoted prices for similar assets and liabilities in active markets; quoted prices for identical or similar assets and liabilities in markets that are not active; or other inputs that are observable or can be corroborated by observable market data. |
| • | Level 3 — Unobservable inputs that are supported by little or no market activity and that are significant to the fair value of the assets or liabilities. This includes certain pricing models, discounted cash flow methodologies and similar techniques that use significant unobservable inputs. |
During 2017, the Company acquired a 28% ownership interest in Punchbowl, Inc. (“Punchbowl”), a provider of digital greeting cards and digital invitations. At such time, the Company provided Punchbowl’s other investors with the ability to “put” their interest in Punchbowl to the Company at a future date. The Company is adjusting such put liability to fair value on a recurring basis. The liability represents a Level 3 fair value measurement as it is based on unobservable inputs.
During 2017, the Company and Ampology, a subsidiary of Trivergence, reached an agreement to form a new legal entity, Kazzam, LLC (“Kazzam”), for the purpose of designing, developing and launching an online
102
Table of Contents
PARTY CITY HOLDCO INC.
NOTES TO CONSOLIDATED FINANCIAL STATEMENTS—(Continued)
(Dollars in thousands, except per share)
exchange platform for party-related services. As part of Ampology’s compensation for designing, developing and launching the exchange platform, Ampology received a 70% ownership interest in Kazzam. The 70% interest has been recorded as redeemable securities in the mezzanine of the Company’s consolidated balance sheet as, in the future, Ampology has the right to cause the Company to purchase the interest. The mezzanine liability is adjusted to fair value on a recurring basis. The liability represents a Level 3 fair value measurement as it is based on unobservable inputs.
During 2015, the Company acquired 75% of the operations of Accurate Custom Injection Molding Inc. (“ACIM”). Based on the terms of the acquisition agreement, the Company will acquire the remaining 25% interest in ACIM over the next five years and the Company’s liability for the estimated purchase price of such interest was $0 at December 31, 2017. The liability represents a Level 3 fair value measurement as it is based on unobservable inputs.
During 2017, the Company acquired 85% of the common stock of Granmark, S.A. de C.V., a Mexican manufacturer and wholesaler of party goods. See Note 5 for further discussion of the acquisition. Based on the terms of the acquisition agreement, the Company is required to acquire the remaining 15% interest over the next five years and it has recorded a liability for the estimated purchase price of such interest, $2,874 at December 31, 2017. The liability represents a Level 3 fair value measurement as it is based on unobservable inputs.
During 2017, the Company acquired 60% of Print Appeal, Inc. (“Print Appeal”). See Note 5 for further discussion of the acquisition. Based on the terms of the acquisition agreement, the Company will acquire the remaining 40% interest in Print Appeal over the next six years and the Company’s liability for the estimated purchase price of such interest was $3,063 at December 31, 2017. The liability represents a Level 3 fair value measurement as it is based on unobservable inputs.
The following table shows assets and liabilities as of December 31, 2017 that are measured at fair value on a recurring basis:
| Level 1 | Level 2 | Level 3 | Total as of December 31, 2017 |
|||||||||||||
| Derivative assets |
$ | 0 | $ | 95 | $ | 0 | $ | 95 | ||||||||
| Derivative liabilities |
0 | 99 | 0 | 99 | ||||||||||||
| Kazzam liability |
0 | 0 | 3,590 | 3,590 | ||||||||||||
| Punchbowl put liability |
0 | 0 | 2,122 | 2,122 | ||||||||||||
| Granmark noncontrolling interest liability |
0 | 0 | 2,874 | 2,874 | ||||||||||||
| Print Appeal noncontrolling interest liability |
0 | 0 | 3,063 | 3,063 | ||||||||||||
The following table shows assets and liabilities as of December 31, 2016 that are measured at fair value on a recurring basis:
| Level 1 | Level 2 | Level 3 | Total as of December 31, 2016 |
|||||||||||||
| Derivative assets |
$ | 0 | $ | 697 | $ | 0 | $ | 697 | ||||||||
| Derivative liabilities |
0 | 215 | 0 | 215 | ||||||||||||
| Noncontrolling interests liabilities |
0 | 0 | 0 | 0 | ||||||||||||
The majority of the Company’s non-financial instruments, which include goodwill, intangible assets, inventories and property, plant and equipment, are not required to be carried at fair value on a recurring basis.
103
Table of Contents
PARTY CITY HOLDCO INC.
NOTES TO CONSOLIDATED FINANCIAL STATEMENTS—(Continued)
(Dollars in thousands, except per share)
However, if certain triggering events occur (or at least annually for goodwill and indefinite-lived intangible assets), a non-financial instrument is required to be evaluated for impairment. If the Company determines that the non-financial instrument is impaired, the Company would be required to write down the non-financial instrument to its fair value. The carrying amounts for cash and cash equivalents, accounts receivable, prepaid expenses and other current assets, accounts payable, accrued expenses and other current liabilities approximated fair value at December 31, 2017 because of the short-term maturities of the instruments and/or their variable rates of interest.
The carrying amounts and fair values of borrowings under the Term Loan Credit Agreement and the Senior Notes as of December 31, 2017 are as follows:
| Carrying Amount | Fair Value | |||||||
| Term Loan Credit Agreement |
$ | 1,196,505 | $ | 1,217,324 | ||||
| Senior Notes |
345,368 | 362,250 | ||||||
The fair values of the Term Loan Credit Agreement and the Senior Notes represent Level 2 fair value measurements as the debt instruments trade in inactive markets. The carrying amounts for other long-term debt approximated fair value at December 31, 2017 based on the discounted future cash flows of each instrument at rates currently offered for similar debt instruments of comparable maturity.
Note 18 — Derivative Financial Instruments
The Company is directly and indirectly affected by changes in certain market conditions. These changes in market conditions may adversely impact the Company’s financial performance and are referred to as market risks. The Company, when deemed appropriate, uses derivatives as a risk management tool to mitigate the potential impact of certain market risks. The primary market risks managed through the use of derivative financial instruments are interest rate risk and foreign currency exchange rate risk.
Interest Rate Risk Management
As part of the Company’s risk management strategy, the Company periodically uses interest rate swap agreements to hedge the variability of cash flows on floating rate debt obligations. Accordingly, interest rate swap agreements are reflected in the consolidated balance sheets at fair value and the related gains and losses on these contracts are deferred in equity and recognized in interest expense over the same period in which the related interest payments being hedged are recognized in income. The fair value of an interest rate swap agreement is the estimated amount that the counterparty would receive or pay to terminate the swap agreement at the reporting date, taking into account current interest rates and the current creditworthiness of the swap counterparty. The Company did not utilize interest rate swap agreements during the years ended December 31, 2017, December 31, 2016 or December 31, 2015.
Foreign Exchange Risk Management
A portion of the Company’s cash flows is derived from transactions denominated in foreign currencies. In order to reduce the uncertainty of foreign exchange rate movements on transactions denominated in foreign currencies, including the British Pound Sterling, the Canadian Dollar, the Euro, the Malaysian Ringgit, the Australian Dollar, and the Mexican Peso, the Company enters into foreign exchange contracts with major international financial institutions. These forward contracts, which typically mature within one year, are designed to hedge anticipated foreign currency transactions, primarily inventory purchases and sales. For contracts that
104
Table of Contents
PARTY CITY HOLDCO INC.
NOTES TO CONSOLIDATED FINANCIAL STATEMENTS—(Continued)
(Dollars in thousands, except per share)
qualify for hedge accounting, the terms of the foreign exchange contracts are such that cash flows from the contracts should be highly effective in offsetting the expected cash flows from the underlying forecasted transactions.
The foreign currency exchange contracts are reflected in the consolidated balance sheets at fair value. At December 31, 2017 and 2016, the Company had foreign currency exchange contracts that qualified for hedge accounting. No components of these agreements were excluded in the measurement of hedge effectiveness. As these hedges are 100% effective, there is no current impact on earnings due to hedge ineffectiveness. The Company anticipates that substantially all unrealized gains and losses in accumulated other comprehensive loss related to these foreign currency exchange contracts will be reclassified into earnings by June 2019.
The following table displays the fair values of the Company’s derivatives at December 31, 2017 and December 31, 2016:
| Derivative Assets | Derivative Liabilities | |||||||||||||||||||||||||||||||
| Balance Sheet Line |
Fair Value |
Balance Sheet Line |
Fair Value |
Balance Sheet Line |
Fair Value |
Balance Sheet Line |
Fair Value |
|||||||||||||||||||||||||
| Derivative Instrument |
December 31, 2017 | December 31, 2016 | December 31, 2017 | December 31, 2016 | ||||||||||||||||||||||||||||
| Foreign Exchange Contracts |
(a | ) PP | $ | 95 | (a | ) PP | $ | 697 | (b | ) AE | $ | 99 | (b | ) AE | $ | 215 | ||||||||||||||||
|
|
|
|
|
|
|
|
|
|||||||||||||||||||||||||
| (a) | PP = Prepaid expenses and other current assets |
| (b) | AE = Accrued expenses |
The following table displays the notional amounts of the Company’s derivatives at December 31, 2017 and December 31, 2016:
| Derivative Instrument |
December 31, 2017 |
December 31, 2016 |
||||||
| Foreign Exchange Contracts |
$ | 21,672 | $ | 22,502 | ||||
|
|
|
|
|
|||||
Note 19 — Changes in Accumulated Other Comprehensive Loss
The changes in accumulated other comprehensive loss attributable to Party City Holdco Inc. consisted of the following:
| Year Ended December 31, 2017 | ||||||||||||
| Foreign Currency Adjustments |
Impact of Foreign Exchange Contracts, Net of Taxes |
Total, Net of Taxes |
||||||||||
| Balance at December 31, 2016 |
$ | (53,171 | ) | $ | 932 | $ | (52,239 | ) | ||||
| Other comprehensive income (loss) before reclassifications, net of income tax |
17,561 | (1,044 | ) | 16,517 | ||||||||
| Amounts reclassified from accumulated other comprehensive loss to the consolidated statement of operations and comprehensive income, net of income tax |
0 | (96 | ) | (96 | ) | |||||||
|
|
|
|
|
|
|
|||||||
| Net current-period other comprehensive income (loss) |
17,561 | (1,140 | ) | 16,421 | ||||||||
|
|
|
|
|
|
|
|||||||
| Balance at December 31, 2017 |
$ | (35,610 | ) | $ | (208 | ) | $ | (35,818 | ) | |||
|
|
|
|
|
|
|
|||||||
105
Table of Contents
PARTY CITY HOLDCO INC.
NOTES TO CONSOLIDATED FINANCIAL STATEMENTS—(Continued)
(Dollars in thousands, except per share)
| Year Ended December 31, 2016 | ||||||||||||
| Foreign Currency Adjustments |
Impact of Foreign Exchange Contracts, Net of Taxes |
Total, Net of Taxes |
||||||||||
| Balance at December 31, 2015 |
$ | (33,401 | ) | $ | 611 | $ | (32,790 | ) | ||||
| Other comprehensive (loss) income before reclassifications, net of income tax |
(19,770 | ) | 1,080 | (18,690 | ) | |||||||
| Amounts reclassified from accumulated other comprehensive loss to the consolidated statement of operations and comprehensive income, net of income tax |
0 | (759 | ) | (759 | ) | |||||||
|
|
|
|
|
|
|
|||||||
| Net current-period other comprehensive (loss) income |
(19,770 | ) | 321 | (19,449 | ) | |||||||
|
|
|
|
|
|
|
|||||||
| Balance at December 31, 2016 |
$ | (53,171 | ) | $ | 932 | $ | (52,239 | ) | ||||
|
|
|
|
|
|
|
|||||||
| Year Ended December 31, 2015 | ||||||||||||
| Foreign Currency Adjustments |
Impact of Foreign Exchange Contracts, Net of Taxes |
Total, Net of Taxes |
||||||||||
| Balance at December 31, 2014 |
$ | (12,969 | ) | $ | 234 | $ | (12,735 | ) | ||||
| Other comprehensive (loss) income before reclassifications, net of income tax |
(20,432 | ) | 675 | (19,757 | ) | |||||||
| Amounts reclassified from accumulated other comprehensive loss to the consolidated statement of operations and comprehensive loss, net of income tax |
0 | (298 | ) | (298 | ) | |||||||
|
|
|
|
|
|
|
|||||||
| Net current-period other comprehensive (loss) income |
(20,432 | ) | 377 | (20,055 | ) | |||||||
|
|
|
|
|
|
|
|||||||
| Balance at December 31, 2015 |
$ | (33,401 | ) | $ | 611 | $ | (32,790 | ) | ||||
|
|
|
|
|
|
|
|||||||
Note 20 — Organizational Restructuring
On March 15, 2017, the Company and its Chairman of the Board of Directors (“the Board”), Gerald Rittenberg, entered into a Transition and Consulting Agreement under which Mr. Rittenberg’s employment as Executive Chairman of the Company terminated effective March 31, 2017. Beginning on April 1, 2017 and continuing through December 31, 2020, unless earlier terminated as provided for in the agreement (the “Consulting Period”), Mr. Rittenberg will serve on a part-time basis as a non-employee senior adviser to the Company. Additionally, Mr. Rittenberg will remain as Chairman of the Board through the end of his existing director term (the Company’s 2018 annual meeting of shareholders) and, subsequently, he will be nominated by the Board to serve as a non-employee member of such Board throughout the remainder of the Consulting Period.
Under the Transition and Consulting Agreement, Mr. Rittenberg received payments from April 1, 2017 through December 31, 2017 in amounts equal to his base salary had he remained employed as Executive Chairman during such period (i.e., pay at an annual rate equal to $2,090). Additionally, he remained eligible to receive an annual bonus for full-year 2017 based on the terms of the Company’s 2017 bonus plan and the terms of his previous employment agreement (a target amount equal to 80% of his 2017 base salary). Further, during 2018, Mr. Rittenberg will receive severance payments aggregating $2,049, which will be made in four equal quarterly installments. Finally, beginning on January 1, 2018 and for the remainder of the Consulting Period, Mr. Rittenberg will receive payments equal to $40 per month in consideration for his consulting services.
106
Table of Contents
PARTY CITY HOLDCO INC.
NOTES TO CONSOLIDATED FINANCIAL STATEMENTS—(Continued)
(Dollars in thousands, except per share)
As a result of the Transition and Consulting Agreement, the Company recorded a $3,918 severance charge in general and administrative expenses during the year ended December 31, 2017. Such amount represents: (1) the amount that he was paid from April 1, 2017 – December 31, 2017 that was above and beyond the fair value ($40 per month) of his consulting services during such period, $1,207, (2) his bonus for the period from April 1, 2017 — December 31, 2017, $662, and (3) the severance to be paid during 2018, $2,049. Throughout the Consulting Period, the Company will record $40 per month in general and administrative expenses, such amount representing the fair value of his consulting services.
The Transition and Consulting Agreement allows Mr. Rittenberg’s existing unvested stock options to continue vesting (such options would have been forfeited had he left the Company) and allows his existing vested stock options to remain outstanding (had he left the Company, he would have only had 60 days to exercise vested options). As the remaining service period is non-substantive, during the year ended December 31, 2017 the Company recorded a $1,362 charge in general and administrative expenses due to the modification of such options.
Also, during the year ended December 31, 2017, the Company recorded a $3,195 severance charge related to the restructuring of its Retail segment. Of such amount, $2,291 was recorded in retail operating expenses and $904 was recorded in general and administrative expenses. The majority of the severance was paid during 2017.
Note 21 — Kazzam, LLC
During the first quarter of 2017, the Company and Ampology, a subsidiary of Trivergence, reached an agreement to form a new legal entity, Kazzam, LLC (“Kazzam”), for the purpose of designing, developing and launching an online exchange platform for party-related services. The website will allow consumers to select, schedule and pay for various services (including entertainment, activities and food) all through a single portal.
Although the Company currently only owns 30% of Kazzam’s equity, the Company has concluded that: a) Kazzam is a variable interest entity as it has insufficient equity at risk and b) the Company is its primary beneficiary. Therefore, the Company has consolidated Kazzam into the Company’s financial statements. Further, as the Company is currently funding all of Kazzam’s start-up activities via a loan to Kazzam (which will be repaid when the venture is profitable), the Company is recording 100% of Kazzam’s operating results in “development stage expenses” in the Company’s consolidated statement of operations and comprehensive income.
As part of Ampology’s compensation for designing, developing and launching the exchange platform, Ampology received a 70% ownership interest in Kazzam. The interest has been recorded in redeemable securities in the mezzanine of the Company’s consolidated balance sheet as, in the future, Ampology has the right to cause the Company to purchase the interest. During the year ended December 31, 2017, Kazzam recognized $2,682 of expense related to the 70% interest. Such amount was recorded in “development stage expenses” in the Company’s consolidated statement of operations and comprehensive income. Additionally, the Company capitalized $498 of the fair value of the 70% interest in property, plant and equipment as it related to website development costs.
Also, as compensation for its services, Ampology was granted a warrant to acquire 596,000 shares of Party City Holdco Inc. stock. During the year ended December 31, 2017, Kazzam recorded $351 of expense related to the warrant. The amount was recorded in “development stage expenses” in the Company’s consolidated statement of operations and comprehensive income. Additionally, the Company capitalized $70 of the value of the warrant in property, plant and equipment as it related to website development costs. The warrant has an exercise price of $15.60 and a fair value of $1,931, which is being amortized over approximately four years.
107
Table of Contents
PARTY CITY HOLDCO INC.
NOTES TO CONSOLIDATED FINANCIAL STATEMENTS—(Continued)
(Dollars in thousands, except per share)
Note 22 — Subsequent Events
During March 2018, the Company acquired an additional 11 franchise stores, which are located in Maryland, for total consideration of approximately $14,000.
During February 2018, the Company amended its Term Loan Credit Agreement. At the time of the amendment, all outstanding term loans were replaced with new term loans for the same principal amount. The applicable margin for ABR borrowings was lowered from 2.00% to 1.75% and the applicable margin for LIBOR borrowings was lowered from 3.00% to 2.75%. Additionally, based on the terms of the amendment, the ABR and LIBOR margins will drop to 1.50% and 2.50%, respectively, if the Company’s Senior Secured Leverage Ratio, as defined by the agreement, falls below 3.2 to 1.0.
The amendment provides that the term loans are subject to a 1.00% prepayment premium if voluntarily repaid within six months from the date of the amendment. Otherwise, the term loans may be voluntarily prepaid at any time without premium or penalty, other than customary breakage costs with respect to loans based on the LIBOR rate.
The term loans are subject to mandatory prepayment, subject to certain exceptions, with (i) 100% of net proceeds above a threshold amount of certain asset sales/insurance proceeds, subject to reinvestment rights and certain other exceptions, (ii) 100% of the net cash proceeds of any incurrence of debt other than debt permitted under the Term Loan Credit Agreement, (iii) 50% of Excess Cash Flow, as defined in the agreement, if any (reduced to 25% if PCHI’s first lien leverage ratio (as defined in the agreement) is less than 3.50 to 1.00, but greater than 2.50 to 1.00, and 0% if PCHI’s first lien leverage ratio is less than 2.50 to 1.00). In conjunction with the amendment of the agreement in February 2018, the requirement to make an Excess Cash Flow payment for the year ended December 31, 2017 was eliminated.
The Company incurred approximately $850 of costs, principally banker fees, in conjunction with the amendment.
108
Table of Contents
SCHEDULE I—CONDENSED FINANCIAL INFORMATION OF REGISTRANT
PARTY CITY HOLDCO INC.
(Parent company only)
CONDENSED BALANCE SHEETS
(Dollars in thousands)
| December 31, 2017 | December 31,2016 | |||||||
| ASSETS | ||||||||
| Other assets (principally investment in and amounts due from wholly-owned subsidiaries) |
$ | 972,025 | $ | 1,016,789 | ||||
|
|
|
|
|
|||||
| Total assets |
$ | 972,025 | $ | 1,016,789 | ||||
|
|
|
|
|
|||||
| LIABILITIES, REDEEMABLE SECURITIES AND STOCKHOLDERS’ EQUITY |
||||||||
| Total liabilities |
$ | 0 | $ | 0 | ||||
| Redeemable securities |
3,590 | 0 | ||||||
| Commitments and contingencies |
||||||||
| Stockholders’ equity: |
||||||||
| Common stock ($0.01 par value; 96,380,102 and 119,515,894 shares outstanding and 119,759,669 and 119,515,894 shares issued at December 31, 2017 and December 31, 2016, respectively ) |
1,198 | 1,195 | ||||||
| Additional paid-in capital |
917,192 | 910,167 | ||||||
| Retained earnings |
372,596 | 157,666 | ||||||
| Accumulated other comprehensive loss |
(35,818 | ) | (52,239 | ) | ||||
|
|
|
|
|
|||||
| Total stockholders’ equity before common stock held in treasury |
1,255,168 | 1,016,789 | ||||||
| Less: Common stock held in treasury, at cost (23,379,567 shares at December 31, 2017) |
(286,733 | ) | 0 | |||||
|
|
|
|
|
|||||
| Total stockholders’ equity |
968,435 | 1,016,789 | ||||||
|
|
|
|
|
|||||
| Total liabilities, redeemable securities and stockholders’ equity |
$ | 972,025 | $ | 1,016,789 | ||||
|
|
|
|
|
|||||
See accompanying notes to these condensed financial statements.
109
Table of Contents
PARTY CITY HOLDCO INC. (Parent company only)
CONDENSED STATEMENTS OF OPERATIONS AND COMPREHENSIVE INCOME (LOSS)
(Dollars in thousands)
| Year Ended December 31, 2017 |
Year Ended December 31, 2016 |
Year Ended December 31, 2015 |
||||||||||
| Equity in net income of subsidiaries |
$ | 215,340 | $ | 117,477 | $ | 10,459 | ||||||
|
|
|
|
|
|
|
|||||||
| Net income |
$ | 215,340 | $ | 117,477 | $ | 10,459 | ||||||
| Other comprehensive income (loss) |
16,421 | (19,449 | ) | (20,055 | ) | |||||||
|
|
|
|
|
|
|
|||||||
| Comprehensive income (loss) |
$ | 231,761 | $ | 98,028 | $ | (9,596 | ) | |||||
|
|
|
|
|
|
|
|||||||
See accompanying notes to these condensed financial statements.
110
Table of Contents
PARTY CITY HOLDCO INC. (Parent company only)
CONDENSED STATEMENTS OF CASH FLOWS
(Dollars in thousands)
| Year Ended December 31, 2017 |
Year Ended December 31, 2016 |
Year Ended December 31, 2015 |
||||||||||
| Cash flows provided by (used in) operating activities: |
||||||||||||
| Net income |
$ | 215,340 | $ | 117,477 | $ | 10,459 | ||||||
| Adjustments to reconcile net income to net cash provided by (used in) operating activities: |
||||||||||||
| Equity in net income of subsidiaries |
(215,340 | ) | (117,477 | ) | (10,459 | ) | ||||||
| Change in due to/from affiliates |
285,435 | (1,373 | ) | (397,189 | ) | |||||||
|
|
|
|
|
|
|
|||||||
| Net cash provided by (used in) operating activities |
285,435 | (1,373 | ) | (397,189 | ) | |||||||
| Cash flows (used in) provided by financing activities: |
||||||||||||
| Issuance of common stock |
0 | 0 | 397,159 | |||||||||
| Treasury stock purchases |
(286,733 | ) | 0 | 0 | ||||||||
| Exercise of stock options |
1,298 | 1,373 | 30 | |||||||||
|
|
|
|
|
|
|
|||||||
| Net cash (used in) provided by financing activities |
(285,435 | ) | 1,373 | 397,189 | ||||||||
| Net change in cash and cash equivalents |
0 | 0 | 0 | |||||||||
| Cash and cash equivalents at beginning of period |
0 | 0 | 0 | |||||||||
|
|
|
|
|
|
|
|||||||
| Cash and cash equivalents at end of period |
$ | 0 | $ | 0 | $ | 0 | ||||||
|
|
|
|
|
|
|
|||||||
See accompanying notes to these condensed financial statements.
111
Table of Contents
PARTY CITY HOLDCO INC. (Parent company only)
NOTES TO CONDENSED FINANCIAL STATEMENTS
(Dollars in thousands)
Note 1 — Basis of presentation and description of registrant
Party City Holdco Inc. (“Party City Holdco”) Schedule I Condensed Financial Information provides all parent company information that is required to be presented in accordance with the SEC rules and regulations for financial statement schedules. The consolidated financial statements of Party City Holdco are included elsewhere. The parent-company financial statements should be read in conjunction with the consolidated financial statements and the notes thereto.
Party City Holdco conducts no separate operations and acts only as a holding company. Its share of the net income of its unconsolidated subsidiaries is included in its statements of income using the equity method.
Since all material stock requirements, dividends and guarantees of the registrant have been disclosed in the consolidated financial statements, the information is not required to be repeated in this schedule.
Note 2 — Dividends from subsidiaries
No cash dividends were paid to Party City Holdco by its subsidiaries during the years included in these financial statements.
112
Table of Contents
PARTY CITY HOLDCO INC.
VALUATION AND QUALIFYING ACCOUNTS
The Years Ended December 31, 2015, December 31, 2016, and December 31, 2017
(Dollars in thousands)
| Beginning Balance |
Write-Offs | Additions | Ending Balance |
|||||||||||||
| Allowance for Doubtful Accounts: |
||||||||||||||||
| For the year ended December 31, 2015 |
$ | 2,889 | $ | 769 | $ | 223 | $ | 2,343 | ||||||||
| For the year ended December 31, 2016 |
2,343 | 441 | 781 | 2,683 | ||||||||||||
| For the year ended December 31, 2017 |
2,683 | 272 | 560 | 2,971 | ||||||||||||
| Sales Returns and Allowances: |
||||||||||||||||
| For the year ended December 31, 2015 |
$ | 526 | $ | 78,219 | $ | 78,348 | $ | 655 | ||||||||
| For the year ended December 31, 2016 |
655 | 80,317 | 80,128 | 466 | ||||||||||||
| For the year ended December 31, 2017 |
466 | 83,865 | 83,879 | 480 | ||||||||||||
113
Table of Contents
| Item 9. | Changes in and Disagreements with Accountants on Accounting and Financial Disclosure |
Not applicable.
| Item 9A. | Controls and Procedures |
Evaluation of Disclosure Controls and Procedures
Our management, with the participation of our Chief Executive Officer and Chief Financial Officer, evaluated the effectiveness of the design and operation of our disclosure controls and procedures as of December 31, 2017. The term “disclosure controls and procedures,” as defined in Rules 13a-15(e) and 15d-15(e) under the Exchange Act of 1934, as amended (the “Act”), means controls and other procedures of a company that are designed to ensure that information required to be disclosed by a company in the reports that it files or submits under the Exchange Act is recorded, processed, summarized and reported, within the time periods specified in the SEC’s rules and forms. Disclosure controls and procedures include, without limitation, controls and procedures designed to ensure that information required to be disclosed by a company in the reports that it files or submits under the Exchange Act is accumulated and communicated to the company’s management, including its principal executive and principal financial officers, or persons performing similar functions, as appropriate to allow timely decisions regarding required disclosure. Based on the evaluation of our disclosure controls and procedures as of December 31, 2017, our Chief Executive Officer and Chief Financial Officer concluded that, as of such date, our disclosure controls and procedures were effective at the reasonable assurance level.
Management’s Annual Report on Internal Control Over Financial Reporting
Our management is responsible for establishing and maintaining adequate internal control over financial reporting. Internal control over financial reporting is defined in Rules 13a-15(f) and 15d - 15(f) promulgated under the Exchange Act, as a process designed by, or under the supervision of a company’s chief executive officer and chief financial officer, or persons performing similar functions, and effected by a company’s board of directors, management and other personnel, to provide reasonable assurance regarding the reliability of financial reporting and the preparation of financial statements for external purposes in accordance with generally accepted accounting principles and includes those policies and procedures that:
| • | pertain to the maintenance of records that in reasonable detail accurately and fairly reflect the transactions and dispositions of the assets of the company; |
| • | provide reasonable assurance that transactions are recorded as necessary to permit preparation of the consolidated financial statements in accordance with generally accepted accounting principles, and that receipts and expenditures of the company are being made only in accordance with authorizations of management and directors of the company; and |
| • | provide reasonable assurance regarding prevention or timely detection of unauthorized acquisition, use or disposition of the company’s assets that could have a material effect on the consolidated financial statements. |
In designing and evaluating our disclosure controls and procedures, we and our management recognize that any controls and procedures, no matter how well designed and operated, can provide only reasonable assurance of achieving the desired control objectives, and our management necessarily was required to apply its judgment in evaluating and implementing possible controls and procedures. Our disclosure controls and procedures are designed to provide reasonable assurance of achieving their stated objectives. We review on an ongoing basis and document our disclosure controls and procedures, and our internal control over financial reporting, and we may from time to time make changes in an effort to enhance their effectiveness and ensure that our systems evolve with our business.
Under the supervision of our Chief Executive Officer and Chief Financial Officer, management conducted an evaluation of our internal control over financial reporting based on the framework in Internal Control —
114
Table of Contents
Integrated Framework issued by the Committee of Sponsoring Organizations of the Treadway Commission (“COSO”). Based on the evaluation performed, management concluded that its internal control over financial reporting, based on the COSO framework, was effective, at the reasonable assurance level, as of December 31, 2017. Our independent registered public accounting firm, Ernst & Young LLP, issued an attestation report on the effectiveness of our internal control over financial reporting. The Ernst & Young LLP report is included in Item 8 of this Annual Report on Form 10-K.
Changes in Internal Control Over Financial Reporting
There were no changes in our internal control over financial reporting (as defined in Rules 13a-15(f) and 15d-15(f) under the Act) during the quarter ended December 31, 2017 that have materially affected, or are reasonably likely to materially affect, our internal control over financial reporting.
| Item 9B. | Other Information |
Amended and Restated Employment Agreements
On March 12, 2018 the board of directors approved amended and restated employment agreements with each of James M. Harrison, Chief Executive Officer, Daniel Sullivan, Chief Financial Officer, and Ryan Vero, President, Retail. Each employment agreement was amended to provide for certain severance entitlements in the event the executive’s employment is terminated by the Company without cause (as defined in the applicable employment agreement), by the executive with good reason (as defined in the applicable employment agreement) or if the Company allows the employment agreement to expire, in any event within six months prior to, or 24 months following, the consummation of a change in control of the Company (such event, a “Qualifying Termination”).
Under the terms of the employment agreement for each of Messrs. Harrison, Sullivan and Vero, if the executive experiences a Qualifying Termination, he will be entitled to receive (i) a lump sum payment equal to a specified multiplier (two and one-half, in the case of Mr. Harrison, and two in the case of Messrs. Sullivan and Vero) multiplied by the sum of (a) his annual base salary and (b) his annual target bonus (ii) a pro rata annual bonus for the year of termination paid in a lump sum, and (iii) a monthly payment equal to the portion of the monthly health premiums paid by the Company on behalf of the executive prior to the date of termination for a specified period (24 months for Mr. Harrison, 12 months for Messrs. Sullivan and Vero).
In addition, pursuant to the terms of the employment agreements, upon the consummation of a change in control, any stock options, restricted stock, restricted stock units, performance stock units or similar awards granted to the executives on or after January 1, 2014 that vest solely based on the executive’s continued service over time will immediately become fully vested upon the occurrence of a Qualifying Termination. Any such awards that vest upon the occurrence of specified performance metrics shall be earned and vest as follows: (i) if the full performance period has elapsed as of the date of the Qualifying Termination, based on actual achievement of the applicable performance goals without pro-ration and (ii) otherwise, based on assumed achievement of the applicable performance goals at 100% of the performance target, prorated based on the number of days of the executive’s actual employment with the Company prior to the Qualifying Termination during the full performance period. If the executive does not experience a Qualifying Termination prior to the end of the original performance period, any awards will be earned based on assumed achievement of the applicable performance goals at 100% of the performance target, and will vest as of the last day of the original performance period without pro-ration.
All severance payments and benefits under the employment agreements are conditioned on the individual’s execution and non-revocation of a release of claims in favor of the Company, and the executives will continue to be bound by certain non-competition, non-solicitation and confidentiality obligations in favor of the Company under the amended and restated employment agreements.
115
Table of Contents
This summary of the Employment Agreements does not purport to be complete and is subject to and qualified in its entirety by reference to the text of each Employment Agreement, which have been filed as exhibits to this Annual Report on Form 10-K.
Amended and Restated Stockholders Agreement
On March 12, 2018, the Company, THL and certain members of management entered into an amended and restated stockholders agreement (the “Second Amended and Restated Stockholders Agreement”), which amends and restates the Amended and Restated Stockholders Agreement dated April 15, 2015. The amendment provide members of management party to the agreement customary tag-along rights in the event of a sale by THL of 50% or more of its stock to a third party.
This summary does not purport to be complete and is subject to and qualified in its entirety by reference to the text of Second Amended and Restated Stockholders Agreement, which has been filed as exhibits to this Annual Report on Form 10-K.
116
Table of Contents
| Item 10. | Directors, Executive Officers and Corporate Governance |
Executive Officers of the Registrant
The information required by this item will be set forth in our proxy statement for our 2018 Annual Meeting of shareholders (to be filed within 120 days after December 31, 2017) (the “Proxy Statement”), and is incorporated herein by reference.
| Item 11. | Executive Compensation |
Information required by this item will be set forth in our Proxy Statement, and is incorporated herein by reference.
| Item 12. | Security Ownership of Certain Beneficial Owners and Management and Related Stockholder Matters |
Information required by this item will be set forth in our Proxy Statement, and is incorporated herein by reference.
| Item 13. | Certain Relationships and Related Party Transactions and Director Independence |
Information required by this item will be set forth in our Proxy Statement, and is incorporated herein by reference.
| Item 14. | Principal Accountant Fees and Services |
Information required by this item will be set forth in our Proxy Statement, and is incorporated herein by reference.
117
Table of Contents
| Item 15. | Exhibits and Financial Statement Schedules |
The following documents are filed as part of this report.
| 1. | Financial Statements. The financial statements are set forth under Item 8, “Financial Statements and Supplementary Data,” of this Annual Report on Form 10-K. |
| 2. | Financial Statement Schedules. Schedule I, Condensed Financial Information of Registrant, and Schedule II, Valuation and Qualifying Accounts, is filed as part of this Annual Report on Form 10-K and should be read in conjunction with the financial statements and notes thereto contained in Item 8, “Financial Statements and Supplementary Data.” |
All other financial statements and financial statement schedules for which provision is made in the applicable accounting regulations of the SEC are not required under the related instruction, are not material or are not applicable and, therefore, have been omitted.
| 3. | Exhibits. |
Exhibit Index
118
Table of Contents
119
Table of Contents
120
Table of Contents
| Exhibit Number |
Description | |
| 32.2* | Certification of Chief Financial Officer pursuant to 18 U.S.C. Section 1350 as adopted pursuant to Section 906 of the Sarbanes-Oxley Act of 2002 | |
| 101* | Interactive Data Files pursuant to Rule 405 of Regulation S-T: (i) the Consolidated Balance Sheets at December 31, 2017 and December 31, 2016; (ii) the Consolidated Statements of Operations and Comprehensive Income (Loss) for the years ended December 31, 2017, 2016 and 2015; (iii) the Consolidated Statements of Stockholders’ Equity for the years ended December 31, 2017, 2016 and 2015; (iv) the Consolidated Statements of Cash Flows for the years ended December 31, 2017, 2016 and 2015; and (v) the Notes to the Consolidated Financial Statements. | |
| † | Management contract of compensatory plan or arrangement |
| * | Filed herewith. |
| Item 16. | Form 10-K Summary |
None.
121
Table of Contents
SIGNATURES
Pursuant to the requirements of Section 13 or 15(d) of the Securities Exchange Act of 1934, the registrant has duly caused this report to be signed on its behalf by the undersigned thereunto duly authorized.
| PARTY CITY HOLDCO INC.
| ||
| By: | /s/ Daniel J. Sullivan | |
| Daniel J. Sullivan | ||
| Chief Financial Officer | ||
Date: March 14, 2018
Pursuant to the requirements of the Securities Exchange Act of 1934, this report has been signed below by the following persons on behalf of the registrant in the capacities and on the dates indicated.
| Signature |
Title |
Date | ||
| /s/ James M. Harrison James M. Harrison |
Chief Executive Officer and Director (Principal Executive Officer) | March 14, 2018 | ||
| /s/ Daniel J. Sullivan Daniel J. Sullivan |
Chief Financial Officer (Principal Financial Officer) |
March 14, 2018 | ||
| /s/ Michael A. Correale Michael A. Correale |
Chief Accounting Officer (Principal Accounting Officer) |
March 14, 2018 | ||
| /s/ Gerald C. Rittenberg Gerald C. Rittenberg |
Executive Chairman and Director | March 14, 2018 | ||
| /s/ Todd M. Abbrecht Todd M. Abbrecht |
Director | March 14, 2018 | ||
| /s/ Steven J. Collins Steven J. Collins |
Director | March 14, 2018 | ||
| /s/ William S. Creekmuir William S. Creekmuir |
Director | March 14, 2018 | ||
| /s/ Uttam K. Jain Uttam K. Jain |
Director | March 14, 2018 | ||
| /s/ Lisa K. Klinger Lisa K. Klinger |
Director | March 14, 2018 | ||
| /s/ Norman S. Matthews Norman S. Matthews |
Director | March 14, 2018 | ||
122
Table of Contents
| Signature |
Title |
Date | ||
| /s/ Joshua M. Nelson Joshua M. Nelson |
Director | March 14, 2018 | ||
| /s/ Morry Weiss Morry Weiss |
Director | March 14, 2018 | ||
123