Attached files
| file | filename |
|---|---|
| EX-99.1 - EX-99.1 - Amplify Energy Corp. | a18-1061_1ex99d1.htm |
| EX-32.2 - EX-32.2 - Amplify Energy Corp. | a18-1061_1ex32d2.htm |
| EX-32.1 - EX-32.1 - Amplify Energy Corp. | a18-1061_1ex32d1.htm |
| EX-31.2 - EX-31.2 - Amplify Energy Corp. | a18-1061_1ex31d2.htm |
| EX-31.1 - EX-31.1 - Amplify Energy Corp. | a18-1061_1ex31d1.htm |
| EX-23.3 - EX-23.3 - Amplify Energy Corp. | a18-1061_1ex23d3.htm |
| EX-23.2 - EX-23.2 - Amplify Energy Corp. | a18-1061_1ex23d2.htm |
| EX-23.1 - EX-23.1 - Amplify Energy Corp. | a18-1061_1ex23d1.htm |
| EX-21.1 - EX-21.1 - Amplify Energy Corp. | a18-1061_1ex21d1.htm |
| EX-12.1 - EX-12.1 - Amplify Energy Corp. | a18-1061_1ex12d1.htm |
| EX-10.21 - EX-10.21 - Amplify Energy Corp. | a18-1061_1ex10d21.htm |
| EX-10.20 - EX-10.20 - Amplify Energy Corp. | a18-1061_1ex10d20.htm |
UNITED STATES
SECURITIES AND EXCHANGE COMMISSION
Washington, D.C. 20549
Form 10-K
x ANNUAL REPORT PURSUANT TO SECTION 13 OR 15(d) OF THE SECURITIES EXCHANGE ACT OF 1934
For the fiscal year ended December 31, 2017
OR
o TRANSITION REPORT PURSUANT TO SECTION 13 OR 15(d) OF THE SECURITIES EXCHANGE ACT OF 1934
For the transition period from to .
Commission File Number: 001-35512
MIDSTATES PETROLEUM COMPANY, INC.
(Exact name of registrant as specified in its charter)
|
Delaware |
|
45-3691816 |
|
(State or other jurisdiction of |
|
(I.R.S. Employer |
|
incorporation or organization) |
|
Identification No.) |
|
|
|
|
|
321 South Boston Avenue, Suite 1000 |
|
|
|
Tulsa, Oklahoma |
|
74103 |
|
(Address of principal executive offices) |
|
(Zip Code) |
Registrant’s telephone number, including area code: (918) 947-8550
Securities registered pursuant to Section 12(b) of the Act:
|
Common stock, $0.01 par value |
|
New York Stock Exchange |
|
(Title of each class) |
|
(Name of each exchange on which registered) |
Securities registered pursuant to Section 12(g) of the Act: None
Indicate by check mark if the registrant is a well-known seasoned issuer, as defined in Rule 405 of the Securities Act. Yes o No x
Indicate by check mark if the registrant is not required to file reports pursuant to Section 13 or Section 15(d) of the Act. Yes o No x
Indicate by check mark whether the registrant (1) has filed all reports required to be filed by Section 13 or 15(d) of the Securities Exchange Act of 1934 during the preceding 12 months (or for such shorter period that the registrant was required to file such reports), and (2) has been subject to such filing requirements for the past 90 days. Yes x No o
Indicate by check mark whether the registrant has submitted electronically and posted on its corporate Web site, if any, every Interactive Data File required to be submitted and posted pursuant to Rule 405 of Regulation S-T (§ 232.405 of this chapter) during the preceding 12 months (or for such shorter period that the registrant was required to submit and post such files). Yes x No o
Indicate by check mark if disclosure of delinquent filers pursuant to Item 405 of Regulation S-K is not contained herein, and will not be contained, to the best of registrant’s knowledge, in definitive proxy or information statements incorporated by reference in Part III or any amendment to the Form 10-K x
Indicate by check mark whether the registrant is a large accelerated filer, an accelerated filer, a non-accelerated filer, a smaller reporting company or an emerging growth company. See definition of “large accelerated filer,” “accelerated filer,” “smaller reporting company,” and “emerging growth company” in Rule 12b-2 of the Exchange Act. Check one:
|
Large accelerated filer o |
Accelerated filer x |
Non-accelerated filer o |
Smaller reporting company o |
|
Emerging growth company o |
|
(Do not check if a |
|
|
|
|
smaller reporting company) |
|
If an emerging growth company, indicate by check mark if the registrant has elected not to use the extended transition period for complying with any new or revised financial accounting standards provided pursuant to Section 13(a) of the Exchange Act. o
Indicate by check mark whether the registrant is a shell company (as defined in Rule 12b-2 of the Exchange Act). Yes o No x
The aggregate market value of the registrant’s Common Stock held by non-affiliates of the registrant was approximately $146.8 million based upon the closing price of such stock on June 30, 2017, the last business day of the registrant’s most recently completed second fiscal quarter, of $12.67 per share.
The number of shares outstanding of our stock at March 8, 2018 is shown below:
|
Class |
|
Number of shares outstanding |
|
Common stock, $0.01 par value |
|
25,153,381 |
DOCUMENTS INCORPORATED BY REFERENCE
Portions of the definitive Proxy Statement of Midstates Petroleum Company, Inc. for the Annual Meeting of Shareholders to be held in June 2018, which will be filed with the Securities and Exchange Commission within 120 days after the end of the fiscal year, are incorporated by reference into Part III of this Annual Report on Form 10-K.
MIDSTATES PETROLEUM COMPANY, INC.
|
Item |
|
|
Page |
|
|
|
| |
|
|
6 | ||
|
|
21 | ||
|
|
36 | ||
|
|
36 | ||
|
|
36 | ||
|
|
36 | ||
|
|
|
| |
|
|
37 | ||
|
|
39 | ||
|
|
MANAGEMENT’S DISCUSSION AND ANALYSIS OF FINANCIAL CONDITION AND RESULTS OF OPERATIONS |
42 | |
|
|
67 | ||
|
|
68 | ||
|
|
CHANGES IN AND DISAGREEMENTS WITH ACCOUNTANTS ON ACCOUNTING AND FINANCIAL DISCLOSURE |
68 | |
|
|
68 | ||
|
|
70 | ||
|
|
|
| |
|
|
71 | ||
|
|
71 | ||
|
|
SECURITY OWNERSHIP OF CERTAIN BENEFICIAL OWNERS AND MANAGEMENT AND RELATED STOCKHOLDER MATTERS |
71 | |
|
|
71 | ||
|
|
71 | ||
|
|
|
| |
|
|
72 | ||
|
|
74 |
CAUTIONARY NOTE REGARDING FORWARD-LOOKING STATEMENTS
This Annual Report on Form 10-K contains forward-looking statements that are subject to a number of risks and uncertainties, many of which are beyond our control. All statements other than statements of historical fact included in this annual report are forward-looking statements, including, without limitation, statements regarding our strategy, future operations, financial position, estimated revenues and income/loss, projected costs, prospects, plans and objectives of management. When used in this annual report, the words “could,” “believe,” “anticipate,” “intend,” “estimate,” “expect,” “may,” “continue,” “predict,” “potential,” “project” and similar expressions are intended to identify forward-looking statements, although not all forward-looking statements contain such identifying words.
Forward-looking statements may include statements about our:
· business strategy, including our business strategy post-emergence from our Chapter 11 cases (the “Chapter 11 Cases”);
· estimated future net reserves and present value thereof;
· technology;
· financial condition, revenues, cash flows and expenses;
· levels of indebtedness, liquidity, borrowing capacity and compliance with debt covenants;
· financial strategy, budget, projections and operating results;
· oil and natural gas realized prices;
· timing and amount of future production of oil and natural gas;
· availability of drilling and production equipment;
· the amount, nature and timing of capital expenditures, including future development costs;
· availability of oilfield labor;
· availability of third party natural gas gathering and processing capacity;
· availability and terms of capital;
· drilling of wells, including our identified drilling locations;
· successful results from our identified drilling locations;
· marketing of oil and natural gas;
· the integration and benefits of asset and property acquisitions or the effects of asset and property acquisitions or dispositions on our cash position and levels of indebtedness;
· infrastructure for salt water disposal and electricity;
· current and future ability to dispose of salt water;
· sources of electricity utilized in operations and the related infrastructures;
· costs of developing our properties and conducting other operations;
· general economic conditions;
· effectiveness of our risk management activities;
· environmental liabilities;
· counterparty credit risk;
· the outcome of pending and future litigation;
· governmental regulation and taxation of the oil and natural gas industry;
· developments in oil and natural gas producing countries;
· new capital structure;
· uncertainty regarding our future operating results; and
· plans, objectives, expectations and intentions contained in this annual report that are not historical.
All forward-looking statements speak only as of the date of this annual report. You should not place undue reliance on these forward-looking statements. These forward-looking statements are subject to a number of risks, uncertainties and assumptions. Although we believe that our plans, intentions and expectations reflected in or suggested by the forward-looking statements we make in this annual report are reasonable, we can give no assurance that these plans, intentions or expectations will be achieved or occur, and actual results could differ materially and adversely from those anticipated or implied in the forward-looking statements. We disclose important factors that could cause our actual results to differ materially from our expectations under “Risk Factors” and elsewhere in this annual report.
These factors include:
· variations in the market demand for, and prices of, oil, natural gas liquids (“NGLs”) and natural gas;
· uncertainties about our estimated quantities of oil and natural gas reserves;
· the adequacy of our capital resources and liquidity including, but not limited to, access to additional borrowing capacity under our reserves based revolving credit facility (the “Exit Facility”);
· access to capital and general economic and business conditions;
· uncertainties about our ability to replace reserves and economically develop our current reserves;
· risks in connection with acquisitions;
· risks related to the concentration of our operations onshore in Oklahoma and Texas;
· drilling results;
· the potential adoption of new governmental regulations, including future regulations regarding the disposal of salt water; and
· our ability to satisfy future cash obligations and environmental costs.
These cautionary statements qualify all forward-looking statements attributable to us or persons acting on our behalf.
Reserve engineering is a process of estimating underground accumulations of oil and natural gas that cannot be measured in an exact way. The accuracy of any reserves estimate depends on the quality of available data (including geoscience and engineering data), the interpretation of such data and price and cost assumptions made by our reserve engineers. In addition, the results of drilling, testing and production activities may justify revisions of estimates that were made previously. If significant, such revisions would change the schedule of any future production and development drilling. Accordingly, reserve estimates may differ from the quantities of oil and natural gas that are ultimately recovered.
GLOSSARY OF OIL AND NATURAL GAS TERMS
Bbl: One stock tank barrel, of 42 U.S. gallons liquid volume, used herein in reference to oil, condensate or natural gas liquids.
Boe: Barrels of oil equivalent, with 6,000 cubic feet of natural gas being equivalent to one barrel of oil.
Boe/day: Barrels of oil equivalent per day.
Completion: The process of treating a drilled well followed by the installation of permanent equipment for the production of natural gas or oil, or in the case of a dry hole, the reporting of abandonment to the appropriate agency.
Dry hole: A well found to be incapable of producing hydrocarbons in sufficient quantities such that proceeds from the sale of such production do not exceed production expenses and taxes.
Exploratory well: A well drilled to find a new field or to find a new reservoir in a field previously found to be productive of natural gas or oil in another reservoir.
MMBoe: One million barrels of oil equivalent.
MMBtu: One million British thermal units.
Net acres: The percentage of total acres an owner has out of a particular number of acres, or a specified tract.
NYMEX: The New York Mercantile Exchange.
Proved reserves: Those quantities of oil and gas, which, by analysis of geoscience and engineering data, can be estimated with reasonable certainty to be economically producible—from a given date forward, from known reservoirs, and under existing economic conditions, operating methods, and government regulations—prior to the time at which contracts providing the right to drill or operate expire, unless evidence indicates that renewal is reasonably certain, regardless of whether deterministic or probabilistic methods are used for the estimation. The project to extract the hydrocarbons must have commenced or the operator must be reasonably certain that it will commence the project within a reasonable time. The area of the reservoir considered as proved includes (i) the area identified by drilling and limited by fluid contacts, if any, and (ii) adjacent undrilled portions of the reservoir that can, with reasonable certainty, be judged to be continuous with it and to contain economically producible oil or natural gas on the basis of available geoscience and engineering data. In the absence of data on fluid contacts, proved quantities in a reservoir are limited by the lowest known hydrocarbons, as seen in a well penetration unless geoscience, engineering, or performance data and reliable technology establishes a lower contact with reasonable certainty. Where direct observation from well penetrations has defined a highest known oil elevation and the potential exists for an associated gas cap, proved oil reserves may be assigned in the structurally higher portions of the reservoir only if geoscience, engineering, or performance data and reliable technology establish the higher contact with reasonable certainty. Reserves which can be produced economically through application of improved recovery techniques (including, but not limited to, fluid injection) are included in the proved classification when (i) successful testing by a pilot project in an area of the reservoir with properties no more favorable than in the reservoir as a whole, the operation of an installed program in the reservoir or an analogous reservoir, or other evidence using reliable technology establishes the reasonable certainty of the engineering analysis on which the project or program was based; and (ii) the project has been approved for development by all necessary parties and entities, including governmental entities. Existing economic conditions include prices and costs at which economic producibility from a reservoir is to be determined. The price is the average price during the 12-month period prior to the ending date of the period covered by the report, determined as an unweighted arithmetic average of the first-day-of-the-month price for each month within such period, unless prices are defined by contractual arrangements, excluding escalations based upon future conditions.
Reasonable certainty: A high degree of confidence.
Recompletion: The process of re-entering an existing wellbore that is either producing or not producing and completing new reservoirs in an attempt to establish, re-establishing, or increase existing production.
Reserves: Estimated remaining quantities of oil and natural gas and related substances anticipated to be economically producible as of a given date by application of development projects to known accumulations.
Reservoir: A porous and permeable underground formation containing a natural accumulation of producible oil and/or natural gas that is confined by impermeable rock or water barriers and is individual and separate from other reservoirs.
Spud or Spudding: The commencement of drilling operations of a new well.
Wellbore: The hole drilled by the bit that is equipped for oil or gas production on a completed well. Also called well or borehole.
Working interest: The right granted to the lessee of a property to explore for and to produce and own oil, natural gas, or other minerals. The working interest owners bear the exploration, development, and operating costs on a cash, penalty, or carried basis.
General
Midstates Petroleum Company, Inc. is an independent exploration and production company focused on the application of modern drilling and completion techniques in oil and liquids-rich basins in the onshore United States. Our operations are concentrated in Oklahoma and Texas, with our corporate headquarters located in Tulsa, Oklahoma. Midstates Petroleum Company, Inc. was incorporated pursuant to the laws of the State of Delaware on October 25, 2011 to become a holding company for Midstates Petroleum Company LLC (“Midstates Sub” or “Debtor Affiliate”). In this Annual Report, references to “Company,” “we,” “us,” “our,” and “Midstates” when used in the present tense, prospectively or for historical periods, refer to Midstates Petroleum Company, Inc. and its wholly owned subsidiary.
On April 30, 2016, we filed voluntary petitions for reorganization under Chapter 11 of the United States Bankruptcy Code. On October 21, 2016, in connection with our emergence from Chapter 11, our existing common shares were cancelled and on October 24, 2016, our new common shares issued in connection with our successful reorganization and emergence from Chapter 11 were listed and began trading on the NYSE MKT under the symbol “MPO”. Our common stock began trading on the NYSE under the symbol “MPO” beginning on May 4, 2017. We currently lease office space in Tulsa, Oklahoma at 321 South Boston Avenue, Suite 1000, where our principal offices are located. The lease for our Tulsa office expires in 2026. We also lease one field office in Dacoma, Oklahoma and one in Perryton, Texas. As of December 31, 2017, we had 129 employees.
We are required to file annual, quarterly and current reports, proxy statements and other information with the Securities and Exchange Commission (“SEC”). You may read and copy any documents filed by us with the SEC at the SEC’s Public Reference Room at 100 F Street, N.E., Washington, D.C. 20549. You may obtain information on the operation of the Public Reference Room by calling the SEC at 1-800-SEC-0330. Our filings with the SEC are also available to the public from commercial document retrieval services and at the SEC’s website at http://www.sec.gov.
We also make available on our website (http://www.midstatespetroleum.com) all of the documents that we file with the SEC, free of charge, as soon as reasonably practicable after we electronically file such material with the SEC. Our Code of Business Conduct and Ethics, Corporate Governance Guidelines, Financial Code of Ethics, and the charters of our audit committee, compensation committee and nominating and governance committee are also available on our website and in print free of charge to any stockholder who requests them. Requests should be sent by mail to 321 South Boston Avenue, Suite 1000; Tulsa, Oklahoma 74103, attention Vice President — General Counsel. Information contained on our website is not incorporated by reference into this Annual Report on Form 10-K. We will disclose any amendments or waivers to our Code of Ethics on our website.
Business Strategy
Our goal is to grow shareholder value through optimized capital investments and generation of free cash flow. To achieve these objectives, we strive to:
· Operate in a safe and environmentally responsible manner;
· Maximize our return on capital deployed by utilizing our extensive technical and operating experience in our core areas of operations to focus on identifying opportunities to achieve the best rate of return and the highest probability of success;
· Maintain a best in class cost structure to maximize the cash flow margin of our production;
· Prioritize free cash flow generation over production growth. Strive towards the optimum balance between free cash flow generation and sustaining inventory for future investment. We will optimize free cash flow generation by focused capital investments, optimizing our base production, and maintaining a low-cost structure; and
· Maintain maximum optionality by maintaining low net debt, balancing shareholder cash returns with replenishing inventory, and evaluating strategic alternatives within and outside of our current asset base.
Our balance sheet and strong liquidity position provide us with significant resources to develop our multi-year drilling inventory and judiciously expand our core acreage positions. For 2018, we intend to opportunistically achieve the best return on investments by optimizing our drilling and completion design, focusing on minimizing well down time and optimizing well productivities while maintaining both capital discipline and a low-cost structure.
Chapter 11 Plan of Reorganization
On April 30, 2016 (the “Petition Date”), we filed voluntary petitions for reorganization under Chapter 11 of the United States Bankruptcy Code (the “Bankruptcy Code”) in the United States Bankruptcy Court for the Southern District of Texas (the “Bankruptcy Court”). Our Chapter 11 cases (the “Chapter 11 Cases”) were jointly administered under the case styled In re Midstates Petroleum Company, Inc., et al., Case No. 16-32237. On September 28, 2016, the Bankruptcy Court entered the Findings of Fact, Conclusions of Law, and Order Confirming Debtors’ First Amended Joint Chapter 11 Plan of Reorganization of Midstates Petroleum Company, Inc. and its Debtor Affiliate (the “Confirmation Order”), which approved and confirmed the First Amended Joint Chapter 11 Plan of Reorganization of Midstates Petroleum Company, Inc. and its Debtor Affiliate as filed on the same date (the “Plan”). On October 21, 2016 (the “Effective Date”), we satisfied the conditions to effectiveness set forth in the Confirmation Order and in the Plan, the Plan became effective in accordance with its terms and we emerged from the Chapter 11 Cases. Further information is set forth in “—Note 2. Emergence from Voluntary Reorganization under Chapter 11 Proceedings” in the Notes to the Consolidated Financial Statements set forth in Part IV, Item 15 of this Annual Report on Form 10-K.
Upon our emergence on the Effective Date, we adopted fresh start accounting as required by United States generally accepted accounting principles (“US GAAP”). We qualified for fresh start accounting because (i) the holders of existing voting shares of the pre-emergence debtor-in-possession received less than 50% of the voting shares of the post-emergence successor entity and (ii) the reorganization value of our assets immediately prior to confirmation was less than the post-petition liabilities and allowed claims. We applied fresh start accounting as of October 21, 2016. Adopting fresh start accounting results in a new reporting entity for financial reporting purposes with no beginning retained earnings or deficit. The cancellation of all existing shares outstanding on the Effective Date and issuance of new shares in the reorganized Company caused a related change of control under US GAAP. As a result of the application of fresh start accounting, as well as the effects of the implementation of the Plan, our consolidated financial statements on or after October 21, 2016, are not comparable with our consolidated financial statements prior to that date. References to “Successor Period” relate to the financial position and results of operations for the period October 21, 2016 through December 31, 2016 and references to “Predecessor Period” refer to the financial position and results of operations of the Company from January 1, 2016 through October 20, 2016.
Summary of Oil and Gas Properties and Operations
Mississippian Lime
Our Mississippian Lime assets are located in Oklahoma and target the Mississippian Lime formation. At December 31, 2017, our acreage consisted of approximately 97,762 net (117,451 gross) prospective acres in the Mississippian Lime trend in Woods and Alfalfa Counties of Oklahoma, which we currently intend to develop using horizontal wells.
Our properties in this area represented 92% of our total proved reserves as of December 31, 2017. As of December 31, 2017, we held an average working interest and average net revenue interest of 77% and 62%, respectively, in this area.
For the year ended December 31, 2017, the Successor Period and the Predecessor Period, our average daily production from our Mississippian Lime assets was as follows:
|
|
|
Successor |
|
|
Predecessor |
| ||
|
|
|
Year Ended |
|
Period October 21, 2016 |
|
|
Period January 1, 2016 |
|
|
|
|
|
|
|
|
|
|
|
|
Oil (Bbls) |
|
5,108 |
|
6,048 |
|
|
8,156 |
|
|
Natural gas liquids (Bbls) |
|
4,273 |
|
4,843 |
|
|
5,326 |
|
|
Natural gas (Mcf) |
|
52,797 |
|
58,816 |
|
|
68,107 |
|
|
Net Boe/day |
|
18,181 |
|
20,694 |
|
|
24,833 |
|
At December 31, 2017, we had one operated drilling rig in operation in the Mississippian Lime horizontal well program. For 2018, we anticipate investing between $100.0 million and $120.0 million in the area.
Anadarko Basin
Our Anadarko Basin assets are located in Western Oklahoma and the Texas panhandle and target, or are prospective in, the Cleveland, Marmaton, Cottage Grove, Osage, Meramac and Tonkawa formations. At December 31, 2017, our acreage consisted of approximately 76,409 net (92,289 gross) acres in Texas and 16,198 net (41,332 gross) acres in western Oklahoma.
Our properties in this area represented 8% of our total proved reserves as of December 31, 2017. As of December 31, 2017, we held an average working interest and average net revenue interest of 64% and 50%, respectively, in this area.
For the year end December 31, 2017, Successor Period and Predecessor Period, our average daily production from the Anadarko Basin area was as follows:
|
|
|
Successor |
|
|
Predecessor |
| ||
|
|
|
Year Ended |
|
Period October 21, 2016 |
|
|
Period January 1, 2016 |
|
|
|
|
|
|
|
|
|
|
|
|
Oil (Bbls) |
|
1,379 |
|
1,508 |
|
|
1,927 |
|
|
Natural gas liquids (Bbls) |
|
1,066 |
|
1,118 |
|
|
1,247 |
|
|
Natural gas (Mcf) |
|
9,135 |
|
9,903 |
|
|
10,856 |
|
|
Net Boe/day |
|
3,967 |
|
4,277 |
|
|
4,983 |
|
Other
On April 21, 2015, we closed on the sale of certain of our oil and gas properties in Beauregard and Calcasieu Parishes, Louisiana (the “Dequincy Divestiture”), for approximately $44.0 million, before customary post-closing adjustments. We have no proved reserves in Gulf Coast (or Louisiana) as of December 31, 2017, 2016 or 2015.
During the three months ended September 30, 2017, we closed on the sale of our oil and gas properties in Lincoln County, Oklahoma, which had approximately 12,894 net (19,888 gross) acres for $7.0 million in cash ($2.9 million, net after assumption of liabilities), subject to standard post-closing adjustments.
Reserves Information
Estimated Proved Reserves
The following table sets forth our estimated net proved reserves by product and type using SEC pricing:
|
|
|
Oil (MBbls) |
|
Natural |
|
NGLs |
|
Total |
|
PV-10 (1) |
|
|
Mississippian Lime: |
|
|
|
|
|
|
|
|
|
|
|
|
Proved developed producing |
|
12,606 |
|
148,052 |
|
11,359 |
|
48,640 |
|
333,398 |
|
|
Proved developed non-producing |
|
1,822 |
|
21,605 |
|
1,680 |
|
7,103 |
|
40,191 |
|
|
Proved undeveloped |
|
13,866 |
|
125,169 |
|
9,729 |
|
44,457 |
|
131,360 |
|
|
Anadarko Basin: |
|
|
|
|
|
|
|
|
|
|
|
|
Proved developed producing |
|
2,840 |
|
20,893 |
|
2,425 |
|
8,747 |
|
53,184 |
|
|
Proved developed non-producing |
|
— |
|
— |
|
— |
|
— |
|
— |
|
|
Proved undeveloped |
|
— |
|
— |
|
— |
|
— |
|
— |
|
|
Total: |
|
|
|
|
|
|
|
|
|
|
|
|
Proved developed producing |
|
15,446 |
|
168,945 |
|
13,784 |
|
57,387 |
|
386,582 |
|
|
Proved developed non-producing |
|
1,822 |
|
21,605 |
|
1,680 |
|
7,103 |
|
40,191 |
|
|
Proved undeveloped |
|
13,866 |
|
125,169 |
|
9,729 |
|
44,457 |
|
131,360 |
|
|
Total Proved at December 31, 2017 |
|
31,134 |
|
315,719 |
|
25,193 |
|
108,947 |
|
558,133 |
|
(1) We refer to PV-10 as the present value of estimated future net cash flows of estimated proved reserves as calculated in the respective reserves report using a discount rate of 10%. This amount includes projected revenues, estimated production costs, estimated future development costs and estimated cash flows related to future asset retirement obligations (“ARO”). PV-10 is a financial measure not defined under US GAAP. Accordingly, the following table reconciles total PV-10 to the standardized measure of discounted future net cash flows, which is the most directly comparable US GAAP financial measure. We believe the presentation of PV-10 provides useful information
because it is widely used by investors in evaluating oil and natural gas companies without regard to specific income tax characteristics of such entities. PV-10 is not a measure of financial or operating performance under US GAAP, nor is it intended to represent the current market value of our estimated proved reserves. PV-10 should not be considered in isolation or as a substitute for the standardized measure of discounted future net cash flows as defined under US GAAP.
The following table provides a reconciliation of PV-10 to the standardized measure of discounted cash flows (in thousands):
|
|
|
As of |
|
As of |
| ||
|
PV-10 |
|
$ |
558,133 |
|
$ |
578,155 |
|
|
Present value of future income tax, discounted at 10% |
|
(8,890 |
) |
(48,205 |
) | ||
|
Standardized measure of discounted future net cash flows |
|
$ |
549,243 |
|
$ |
529,950 |
|
Proved Undeveloped Reserves
The following table summarizes the changes in our estimated proved undeveloped reserves during the year ended December 31, 2017 (in MBoe):
|
Proved undeveloped reserves, December 31, 2016 |
|
107,366 |
|
|
Purchases of reserves in place |
|
— |
|
|
Sales of reserves |
|
— |
|
|
Extensions and discoveries |
|
13,663 |
|
|
Revisions of previous estimates |
|
(74,842 |
) |
|
Conversion to proved developed reserves |
|
(1,730 |
) |
|
Proved undeveloped reserves, December 31, 2017 |
|
44,457 |
|
No less than annually, we review our five-year development schedule. This review encompasses many factors, including current year drilling results, forward pricing curve, returns expected of our drilling program and cash available during this time period, which would include cash on hand, cash generated by operations and cash from borrowings. On November 1, 2017, David Sambrooks was appointed President and Chief Executive Officer of the Company. Upon David’s appointment, we began a strategic review of all areas of operations. This review was completed during the fourth quarter of 2017 and our strategy was refined to add further focus to optimizing free cash flows and keeping leverage to a minimum. As a result, in December of 2017 we decreased our current drilling activity from two drilling rigs to one drilling rig. Further, the five-year development plan was revised from a two-rig program to a one rig program. This change in strategy (reduced 5-year drilling activity) led to a reduction in our undeveloped proved inventory under SEC guidelines from 274 locations at year end 2016 to 139 locations at year end 2017. In addition, at year end 2017 our proved undeveloped type curve was revised downward by our third-party reserves engineering firm and capital costs assumptions were revised upward, both as a result of recent drilling results. The revised type curve still generates attractive capital returns of 30.6% IRR at year-end 2017 SEC pricing, and 39.1% IRR at December 31, 2017 strip pricing. As a result of our focus on optimizing free cash flow, keeping leverage to a minimum and optimizing drilling returns, all proved undeveloped reserves included in the December 31, 2017 reserve report are focused on infill drilling in the Carmen and Dacoma areas. All undeveloped locations not able to be drilled utilizing our anticipated five-year development schedule were excluded from the December 31, 2017 reserve report but continue to meet the definition of a proved undeveloped location from an engineering standpoint.
Independent Petroleum Engineers
For our Mississippian Lime and Anadarko Basin assets, our estimated reserves and related future net revenues at December 31, 2017, 2016 and 2015 are based on reports prepared by our independent third-party reserves engineering firm Cawley, Gillespie & Associates, Inc. (“CGA”), in accordance with generally accepted petroleum engineering and evaluation principles and definitions and guidelines in effect during such period as established by the SEC.
The reserve estimates shown herein for the periods indicated above have been independently evaluated by CGA, a worldwide leader of petroleum property analysis for industry and financial organizations and government agencies. CGA was founded in 1961 and performs consulting petroleum engineering services under Texas Board of Professional Engineers Registration No. F-693. Within CGA, the technical person primarily responsible for preparing the estimates set forth in the reserves report incorporated herein was Mr. Zane Meekins. Mr. Meekins has been a practicing consulting petroleum engineer at CGA since 1989. Mr. Meekins is a Registered Professional Engineer in the State of Texas (License No. 71055) and has over 30 years of practical experience in petroleum engineering, with over 28 years of experience in the estimation and evaluation of reserves. He graduated from Texas A&M University in 1987 with a Bachelor of Science degree in Petroleum Engineering. Mr. Meekins meets or exceeds the education, training, and experience requirements set forth in the Standards Pertaining to the Estimating and Auditing of Oil and Gas Reserves Information promulgated by the Society of Petroleum Engineers; he is proficient in judiciously applying industry standard practices to engineering and geoscience evaluations as well as applying SEC and other industry reserve definitions and guidelines.
Technology Used to Establish Proved Reserves
Under Rule 4-10(a)(22) of Regulation S-X, as promulgated by the SEC, proved reserves are those quantities of oil and natural gas, which, by analysis of geoscience and engineering data, can be estimated with reasonable certainty to be economically producible from a given date forward, from known reservoirs, and under existing economic conditions, operating methods, and government regulations. The term “reasonable certainty” implies a high degree of confidence that the quantities of oil and/or natural gas actually recovered will equal or exceed the estimate. Reasonable certainty can be established using techniques that have been proved effective by actual production from projects in the same reservoir or an analogous reservoir or by other evidence using reliable technology that establishes reasonable certainty. Reliable technology is a grouping of one or more technologies (including computational methods) that have been field tested and have been demonstrated to provide reasonably certain results with consistency and repeatability in the formation being evaluated or in an analogous formation.
In order to establish reasonable certainty with respect to our estimated proved reserves, CGA employed technologies that have been demonstrated to yield results with consistency and repeatability. The technologies and economic data used in the estimation of our proved reserves include, but are not limited to, electrical logs, radioactivity logs, core analyses, geologic maps and available downhole and production data, seismic data and well test data.
Internal Controls Over Reserves Estimation Process
We maintain an internal staff of petroleum engineers, land and geoscience professionals who work closely with our independent reserve engineers to ensure the integrity, accuracy and timeliness of data furnished to CGA in their reserves estimation process. The primary inputs to the reserves estimation process are comprised of technical information, financial data, ownership interests and production data. All field and reservoir technical information, which is updated annually, is assessed for validity when the reservoir engineers hold technical meetings with geoscientists, operations and land personnel to discuss field performance and to validate future development plans. Current revenue and expense information is obtained from our accounting records, which are subject to their own set of internal controls over financial reporting. All current financial data such as commodity prices, lease operating expenses, production taxes and field commodity price differentials are updated in the reserves database and then analyzed to ensure that they have been entered accurately and that all updates are complete. Our current ownership in mineral interests and well production data are incorporated into the reserves database as well and verified to ensure their accuracy and completeness. Throughout each fiscal year, our technical team meets with representatives of our independent reserve engineers to review properties and discuss methods and assumptions used in preparation of the proved reserve estimates. Each quarter, estimated proved oil and gas reserves are presented to a committee of executives and key management for review and approval and annually, our development plan for proved undeveloped reserves are reviewed and approved by our executives.
At December 31, 2017, Jeromy Garcia, our General Manager — Mississippian Lime and Anadarko Basin Assets and Reserves, was primarily responsible for overseeing the preparation of our reserve estimates and reported directly to our Chief Executive Officer. Mr. Garcia has more than 17 years of experience in the oil and gas industry. Mr. Garcia spent the first portion of his career working for El Paso Production Company — primarily working assets in the Gulf of Mexico. While at El Paso, Mr. Garcia served in multiple roles including reservoir and operational engineering. Mr. Garcia has also worked for small independents such as Whittier Energy and J&S Oil & Gas where he served as a reservoir engineer and Manager of Engineering. Mr. Garcia graduated from the University of Oklahoma in 2000 with a B.S degree in Petroleum Engineering and obtained his MBA from the University of Houston in 2009.
Production, Revenues and Price History
Oil, NGLs and natural gas are commodities. The price that we receive for the oil, NGLs and natural gas we produce is largely a function of market supply and demand. A decline in oil or natural gas prices from their current levels could have a material adverse effect on our financial position, results of operations, cash flows, quantities of oil and natural gas reserves that may be economically produced and our ability to access capital markets. For additional information on these and other risks, see information set forth in “Risk Factors”.
The following table sets forth information regarding our oil, NGLs and natural gas production, revenues and realized prices and production costs for the year ended December 31, 2017, the Successor Period, the Predecessor Period and the year ended December 31, 2015. For additional details, see information set forth in “Management’s Discussion and Analysis of Financial Condition and Results of Operations.”
|
|
|
Successor |
|
|
Predecessor |
| ||||||||
|
|
|
Year Ended |
|
Period October 21, |
|
|
Period January 1, |
|
Year Ended |
| ||||
|
Operating Data: |
|
|
|
|
|
|
|
|
|
| ||||
|
Net production volumes: |
|
|
|
|
|
|
|
|
|
| ||||
|
Oil (MBbls) |
|
2,368 |
|
544 |
|
|
2,964 |
|
4,794 |
| ||||
|
NGLs (MBbls) |
|
1,949 |
|
429 |
|
|
1,932 |
|
2,473 |
| ||||
|
Natural gas (MMcf) |
|
22,606 |
|
4,948 |
|
|
23,215 |
|
28,403 |
| ||||
|
Total oil equivalents (MBoe) |
|
8,084 |
|
1,798 |
|
|
8,765 |
|
12,001 |
| ||||
|
Average daily production (Boe/d) |
|
22,148 |
|
24,971 |
|
|
29,816 |
|
32,880 |
| ||||
|
Average Sales Prices: |
|
|
|
|
|
|
|
|
|
| ||||
|
Oil, without realized derivatives (per Bbl) |
|
$ |
49.45 |
|
$ |
46.96 |
|
|
$ |
37.99 |
|
$ |
45.40 |
|
|
Oil, with realized derivatives (per Bbl) |
|
$ |
50.92 |
|
$ |
46.96 |
|
|
$ |
37.99 |
|
$ |
74.74 |
|
|
Natural gas liquids, without realized derivatives (per Bbl) |
|
$ |
22.64 |
|
$ |
19.55 |
|
|
$ |
14.22 |
|
$ |
15.46 |
|
|
Natural gas liquids, with realized derivatives (per Bbl) |
|
$ |
22.64 |
|
$ |
19.55 |
|
|
$ |
14.22 |
|
$ |
15.46 |
|
|
Natural gas, without realized derivatives (per Mcf) |
|
$ |
2.64 |
|
$ |
2.76 |
|
|
$ |
2.08 |
|
$ |
2.35 |
|
|
Natural gas, with realized derivatives (per Mcf) |
|
$ |
2.79 |
|
$ |
2.76 |
|
|
$ |
2.08 |
|
$ |
3.30 |
|
|
Costs and Expenses (per Boe of production): |
|
|
|
|
|
|
|
|
|
| ||||
|
Lease operating and workover |
|
$ |
7.83 |
|
$ |
8.52 |
|
|
$ |
6.02 |
|
$ |
6.79 |
|
|
Gathering and transportation |
|
$ |
1.79 |
|
$ |
1.78 |
|
|
$ |
1.64 |
|
$ |
1.30 |
|
|
Severance and other taxes |
|
$ |
1.10 |
|
$ |
0.72 |
|
|
$ |
0.59 |
|
$ |
0.72 |
|
|
Asset retirement accretion |
|
$ |
0.14 |
|
$ |
0.12 |
|
|
$ |
0.16 |
|
$ |
0.13 |
|
|
Depreciation, depletion and amortization |
|
$ |
8.14 |
|
$ |
7.22 |
|
|
$ |
7.11 |
|
$ |
16.55 |
|
|
Impairment of oil and gas properties |
|
$ |
15.50 |
|
$ |
— |
|
|
$ |
26.48 |
|
$ |
135.47 |
|
|
General and administrative |
|
$ |
3.63 |
|
$ |
2.71 |
|
|
$ |
2.55 |
|
$ |
3.22 |
|
|
Acquisition and transaction costs |
|
$ |
— |
|
$ |
— |
|
|
$ |
— |
|
$ |
0.03 |
|
|
Debt restructuring costs and advisory fees |
|
$ |
— |
|
$ |
— |
|
|
$ |
0.87 |
|
$ |
3.01 |
|
|
Other |
|
$ |
— |
|
$ |
— |
|
|
$ |
— |
|
$ |
0.18 |
|
The following table sets forth information regarding oil, NGLs and natural gas daily production for each of the fields that represented more than 15% of our estimated total proved reserves for the year ended December 31, 2017, the Successor Period, the Predecessor Period and the year ended December 31, 2015:
|
|
|
Successor |
|
|
Predecessor |
| ||||
|
|
|
Year Ended |
|
Period October 21, |
|
|
Period January 1, |
|
Year Ended |
|
|
Mississippian(1) |
|
|
|
|
|
|
|
|
|
|
|
Daily production volumes: |
|
|
|
|
|
|
|
|
|
|
|
Oil (Bbls) |
|
5,108 |
|
6,035 |
|
|
8,147 |
|
10,187 |
|
|
NGLs (Bbls) |
|
4,273 |
|
4,464 |
|
|
4,968 |
|
4,900 |
|
|
Natural gas (Mcf) |
|
52,797 |
|
56,740 |
|
|
65,737 |
|
62,514 |
|
|
Total oil equivalents (Net Boe/day) |
|
18,181 |
|
19,956 |
|
|
24,071 |
|
25,506 |
|
|
Anadarko |
|
|
|
|
|
|
|
|
|
|
|
Daily production volumes: |
|
|
|
|
|
|
|
|
|
|
|
Oil (Bbls) |
|
1,379 |
|
1,508 |
|
|
1,927 |
|
2,680 |
|
|
NGLs (Bbls) |
|
1,066 |
|
1,118 |
|
|
1,247 |
|
1,388 |
|
|
Natural gas (Mcf) |
|
9,135 |
|
9,903 |
|
|
10,856 |
|
12,921 |
|
|
Total oil equivalents (Net Boe/day) |
|
3,967 |
|
4,277 |
|
|
4,983 |
|
6,222 |
|
(1) These volumes represent only Mississippian Lime production and do not include Hunton production volumes. We divested our Hunton producing properties in Lincoln County during the year ended December 31, 2017. Further information is set forth in “Summary of Oil and Gas Properties and Operations” above and “—Note 7. Property and Equipment” in the Notes to the Consolidated Financial Statements set forth in Part IV, Item 15 of this Annual Report on Form 10-K.
Productive Wells
The following table presents our total gross and net productive wells as of December 31, 2017:
|
|
|
Oil |
|
Natural Gas |
|
Total |
| ||||||
|
|
|
Gross |
|
Net |
|
Gross |
|
Net |
|
Gross |
|
Net |
|
|
Total productive wells |
|
779 |
|
550 |
|
64 |
|
46 |
|
843 |
|
596 |
|
Productive wells consist of producing wells and wells capable of producing. Gross wells are the total number of productive wells in which we have working interests, and net wells are the sum of our fractional working interests owned in gross wells. Each gross well completed in more than one producing zone is counted as a single well.
Acreage
The following table sets forth certain information regarding the developed and undeveloped acreage in which we have a controlling interest as of December 31, 2017 for each of our operating areas. Acreage related to royalty, overriding royalty and other similar interests is excluded from this summary:
|
|
|
Developed Acres |
|
Undeveloped Acres |
|
Total Acres |
| ||||||
|
|
|
Gross |
|
Net |
|
Gross |
|
Net |
|
Gross |
|
Net |
|
|
Mississippian Lime |
|
72,579 |
|
56,166 |
|
44,872 |
|
41,596 |
|
117,451 |
|
97,762 |
|
|
Anadarko Basin |
|
56,640 |
|
36,242 |
|
76,981 |
|
56,365 |
|
133,621 |
|
92,607 |
|
|
Total |
|
129,219 |
|
92,408 |
|
121,853 |
|
97,961 |
|
251,072 |
|
190,369 |
|
Undeveloped Acreage Expirations
The following table sets forth the number of gross and net undeveloped acres as of December 31, 2017 that will expire over the next three years by operating area unless operations are commenced upon or production is established upon the acreage (or upon lands spaced or pooled therewith) or we make additional lease rental payments prior to the expiration dates:
|
|
|
Expiring 2018 |
|
Expiring 2019 |
|
Expiring 2020 |
| ||||||
|
|
|
Gross |
|
Net |
|
Gross |
|
Net |
|
Gross |
|
Net |
|
|
Mississippian Lime |
|
4,441 |
|
3,200 |
|
1,478 |
|
823 |
|
4,462 |
|
3,139 |
|
|
Anadarko Basin |
|
1,720 |
|
611 |
|
8,709 |
|
1,397 |
|
8,252 |
|
1,435 |
|
|
Total Undeveloped Acreage Expirations |
|
6,161 |
|
3,811 |
|
10,187 |
|
2,220 |
|
12,714 |
|
4,574 |
|
Our typical lease terms along with unit regulatory rules generally provide us flexibility to continue lease ownership through either establishing production or actively drilling prospects. Because of our reduced activity levels in the Anadarko Basin, we may allow leasehold rights on acreage not held by production to expire in this area, which could reduce our future drilling opportunities. Additionally, to the extent we cannot commence drilling operations upon or establish production from certain leases in the Mississippian Lime asset, certain of the leases within that asset area will expire, unless extended or renewed.
Drilling Activity
The following table summarizes our drilling activity for the year ended December 31, 2017, the Successor Period, the Predecessor Period and the year ended December 31, 2015. Gross wells reflect the sum of all wells in which we own an interest. Net wells reflect the sum of our working interests in gross wells:
|
|
|
Successor |
|
|
Predecessor |
| ||||||||||||
|
|
|
Year Ended |
|
Period October 21, |
|
|
Period January 1, |
|
Year Ended |
| ||||||||
|
|
|
Gross |
|
Net |
|
Gross |
|
Net |
|
|
Gross |
|
Net |
|
Gross |
|
Net |
|
|
Development wells: |
|
|
|
|
|
|
|
|
|
|
|
|
|
|
|
|
|
|
|
Productive |
|
26 |
|
25 |
|
3 |
|
3 |
|
|
40 |
|
38 |
|
84 |
|
74 |
|
|
Dry holes |
|
— |
|
— |
|
— |
|
— |
|
|
— |
|
— |
|
— |
|
— |
|
|
Total |
|
26 |
|
25 |
|
3 |
|
3 |
|
|
40 |
|
38 |
|
84 |
|
74 |
|
|
Exploratory wells: |
|
|
|
|
|
|
|
|
|
|
|
|
|
|
|
|
|
|
|
Productive |
|
— |
|
— |
|
— |
|
— |
|
|
— |
|
— |
|
— |
|
— |
|
|
Dry holes |
|
— |
|
— |
|
— |
|
— |
|
|
— |
|
— |
|
3 |
|
— |
|
|
Total |
|
— |
|
— |
|
— |
|
— |
|
|
— |
|
— |
|
3 |
|
— |
|
|
Total wells |
|
26 |
|
25 |
|
3 |
|
3 |
|
|
40 |
|
38 |
|
87 |
|
74 |
|
As of December 31, 2017, there were 9 gross (and 9 net) development wells awaiting completion; one development well was being drilled and no exploratory wells were being drilled.
As of December 31, 2017, we had one drilling rig in operation. Our recent drilling activity has primarily focused on the development of our primary operating areas in our Mississippian Lime asset.
Marketing and Major Purchasers
We sell our oil, NGLs and natural gas to third-party purchasers. We are not dependent upon, or contractually limited to, any one purchaser or small group of purchasers other than in our Mississippian Lime asset, where the majority of our natural gas production is dedicated to one purchaser for the economic life of the relevant assets. For the year ended December 31, 2017, three purchasers accounted for 37%, 25% and 14%, respectively, of the Company’s revenue. For the Successor Period, two purchasers accounted for 40% and 29%, respectively, of the Company’s revenue. For the Predecessor Period, two purchasers accounted for 46% and 29%, respectively, of the Company’s revenue. For the year ended December 31, 2015, two purchasers accounted for 43% and 25%, respectively, of the Company’s revenue. Due to the nature of oil, NGLs and natural gas markets, and because we sell our oil production to purchasers that transport by truck rather than by pipelines, we do not believe the loss of a single purchaser or a few purchasers would materially adversely affect our ability to sell such production.
We are party to a gas purchase, gathering and processing contract in our Mississippian Lime asset, which includes certain minimum NGL volume commitments. To the extent we do not deliver natural gas volumes in sufficient quantities to generate, when processed, the minimum levels of recovered NGLs, we would be required to reimburse the counterparty an amount equal to the sum of the monthly shortfall, if any, multiplied by a fee of roughly $0.12 to $0.15 per gallon (subject to annual escalation). We have historically, and continue to currently, deliver at least the minimum volumes required under these contractual provisions.
Title to Properties
As is customary in the oil and natural gas industry, we initially conduct a preliminary review of the title to our properties on which we do not have proved reserves. Prior to the commencement of drilling operations on those properties, we conduct a more thorough title examination and undertake any title curative that is deemed necessary to address any significant title discrepancies. To the extent title opinions or other investigations reflect any such significant defects affecting those properties, we are responsible for curing any such defects at our expense to the extent that any such defect impacts our ownership interest. Likewise, we may choose to notify other owners whose title is subject to a title defect so that they may undertake the necessary efforts to attempt to cure the applicable title defect at their own expense. Our oil and natural gas properties are generally subject to customary royalty interests or other burdens, and a majority of our properties are subject to liens to secure borrowings under our Exit Facility as well as liens for current taxes and other burdens, none of which we believe materially interfere with our ability to operate or develop such properties.
Seasonality
Weather conditions often affect the demand for, and the associated prices of, crude oil, NGLs and natural gas. Further, weather conditions could delay our drilling and production activities, which impacts our ability to achieve our overall business objectives. Generally, demand for oil and natural gas decreases during the spring and fall months and increases during the summer and winter months. However, seasonal anomalies such as mild winters or mild summers sometimes lessen this fluctuation.
Competition
The oil and natural gas industry is a highly competitive environment for acquiring properties, attracting and retaining trained personnel and obtaining the equipment necessary to develop and produce reserves. We compete with numerous entities, including major domestic and foreign oil companies, other independent oil and natural gas companies and individual producers and operators. Many of these competitors are large, well established companies and have financial and other resources substantially greater than ours. Our ability to acquire additional oil and natural gas properties and to discover reserves in the future will depend upon our ability to evaluate and select suitable properties and successfully consummate transactions in this highly competitive environment.
Regulation of the Oil and Natural Gas Industry
Our operations are substantially affected by federal, state and local laws and regulations. In particular, oil and natural gas production and related operations are, or have been, subject to price controls, taxes and numerous other laws and regulations. All of the jurisdictions in which we own or operate properties for oil and natural gas production have statutory provisions regulating the exploration for and production of oil and natural gas, including provisions related to permits for the drilling of wells, bonding requirements to drill or operate wells, the location of wells, the method of drilling and casing wells, the surface use and restoration of properties upon which wells are drilled, sourcing and disposal of water used in the drilling and completion process and produced during operations and the abandonment of wells. Our operations are also subject to various conservation laws and regulations. These include regulation of the size of drilling and spacing units or proration units, the number of wells which may be drilled in any given area, and the unitization or pooling of oil and natural gas wells, as well as regulations that generally prohibit the venting or flaring of natural gas and impose certain requirements regarding the ratability or fair apportionment of production from fields and/or individual wells.
Failure to comply with applicable laws and regulations can result in substantial penalties. The regulatory burden on our industry increases the cost of doing business and affects profitability. Although we believe we are in substantial compliance with all applicable laws and regulations, and that continued substantial compliance with existing requirements will not have a material adverse effect on our financial position, cash flows or results of operations, such laws and regulations are frequently amended or reinterpreted. Additionally, currently unforeseen environmental incidents may occur or past non-compliance with environmental laws or regulations may be discovered. Therefore, we are unable to predict the future costs or impact of compliance. Additional proposals and proceedings that affect the oil and natural gas industry are regularly considered by Congress, the states, the Federal Energy Regulatory Commission (“FERC”) and the courts. We cannot predict when or whether any such proposals may become effective.
Regulation of Transportation and Sales of Natural Gas
Historically, the transportation and sale for resale of natural gas in interstate commerce has been regulated by the FERC under the Natural Gas Act of 1938 (“NGA”), the Natural Gas Policy Act of 1978 (“NGPA”) and regulations issued under those statutes.
FERC regulates interstate natural gas transportation rates, and terms and conditions of service, which affects the marketing of natural gas that we produce, as well as the revenues we receive for sales of our natural gas. Since 1985, the FERC has endeavored to make natural gas transportation more accessible to natural gas buyers and sellers on an open and non-discriminatory basis. The natural gas industry historically has been very heavily regulated. Therefore, we cannot provide any assurance that the less stringent regulatory approach that FERC has historically maintained will continue. However, we do not believe that any action taken will affect us in a way that materially differs from the way it affects other natural gas producers.
The price at which we sell natural gas is not currently subject to federal rate regulation and, for the most part, is not subject to state regulation. However, with regard to our physical sales of these energy commodities, we are required to observe anti-market manipulation laws and related regulations enforced by the FERC and/or the Commodity Futures Trading Commission (“CFTC”) and the Federal Trade Commission (“FTC”).
Gathering services, which occur upstream of FERC jurisdictional transmission services, are regulated by the states onshore and in state waters. Although the FERC has set forth a general test for determining whether facilities perform a non-jurisdictional gathering function or a jurisdictional transmission function, the FERC’s determinations as to the classification of facilities is done on a case by case basis. State regulation of natural gas gathering facilities generally includes various safety, environmental and, in some circumstances, nondiscriminatory take requirements.
Regulation of Production
The production of oil and natural gas is subject to regulation under a wide range of local, state and federal statutes, rules, orders and regulations. Federal, state and local statutes and regulations require permits for drilling operations, drilling bonds and reports concerning operations. All of the states in which we own and operate properties have regulations governing conservation matters, including provisions for the unitization or pooling of oil and natural gas properties, the establishment of maximum allowable rates of production from oil and natural gas wells, the regulation of well spacing, and plugging and abandonment of wells. The effect of these regulations is to limit the amount of oil and natural gas that we can produce from our wells and to limit the number of wells or the locations at which we can drill, although we can apply for exceptions to such regulations or to have reductions in well spacing. Moreover, each state generally imposes a production or severance tax with respect to the production and sale of oil, NGLs and natural gas within its jurisdiction.
The failure to comply with these rules and regulations can result in substantial penalties. Our competitors in the oil and natural gas industry are subject to the same regulatory requirements and restrictions that affect our operations.
Environmental and Occupational Health and Safety Regulation
Our oil and natural gas exploration, development and production operations are subject to stringent and complex federal, regional, state and local laws and regulations governing occupational safety and health, the emission or discharge of materials into the environment and environmental and natural resource protection. Numerous governmental entities, including the U.S. Environmental Protection Agency (“EPA”), analogous state agencies, and, in certain instances, citizens’ groups, have the power to enforce compliance with these laws and regulations and the permits issued under them, often requiring difficult and costly actions. These laws and regulations may, among other things (i) require the acquisition of permits to conduct drilling and other regulated activities; (ii) restrict the types, quantities and concentration of various substances that can be released into the environment or injected into formations in connection with oil and natural gas drilling and production activities; (iii) limit or prohibit drilling activities on certain lands lying within wilderness, wetlands and other protected areas; (iv) require remedial measures to mitigate pollution from former and ongoing operations, such as requirements to close waste pits and plug abandoned wells; (v) impose specific safety and health criteria addressing worker protection; and (vi) impose substantial liabilities for pollution resulting from drilling and production operations. Any failure to comply with these laws and regulations may result in the assessment of administrative, civil and criminal penalties, the imposition of corrective or remedial obligations and the issuance of injunctions prohibiting some or all of our operations. These laws and regulations may also restrict the rate of oil and natural gas production below the rate that would otherwise be possible. The regulatory burden on the oil and natural gas industry increases the cost of doing business in the industry and consequently affects profitability.
Any changes in federal or state environmental laws and regulations or re-interpretation of applicable enforcement policies that result in more stringent or costly well construction, drilling, water management or completion activities, waste handling, storage, transport, or disposal requirements, or remediation requirements or that limit or otherwise restrict the emission of certain listed pollutants or organic compounds from wells or surface equipment could have a material adverse effect on our operations and financial position. We may be unable to pass on such increased compliance costs. Moreover, accidental releases or spills may occur in the course of our operations, and we cannot assure you that we will not incur significant costs and liabilities as a result of such releases or spills, including any third-party claims for damage to property, natural resources or persons. While we believe that we are in substantial compliance with existing environmental laws and regulations and that continued compliance with current requirements would not have a material adverse effect on our financial condition or results of operations, there is no assurance that we will be able to remain in compliance in the future with existing or any new laws and regulations or that future compliance with such laws and regulations will not have a material adverse effect on our business and operating results.
The following is a summary of the more significant existing and proposed environmental and occupational health and safety laws and regulations to which our business operations are subject and for which compliance may have a material adverse impact on our capital expenditures, results of operations or financial position.
Hazardous Substances and Wastes
The Comprehensive Environmental Response, Compensation, and Liability Act, as amended (“CERCLA”), also known as the Superfund law, and comparable state laws impose liability without regard to fault or the legality of the original conduct on certain classes of persons who are considered to be responsible for the release of a “hazardous substance” into the environment. These classes of persons include current and prior owners or operators of the site where the release occurred and entities that disposed of or arranged for the disposal of the hazardous substances at a site where a release has occurred. Under CERCLA, these “responsible parties” may be subject to strict, joint and several liability for the costs of removing and cleaning up the hazardous substances that have been released into the environment, for damages to natural resources, and for the costs of certain health studies. CERCLA also authorizes the EPA and, in some instances, third parties to act in response to threats to the public health or the environment and to seek to recover from the responsible parties the costs they incur. It is not uncommon for neighboring landowners and other third parties to file claims for personal injury and property damage allegedly caused by the release of hazardous substances or other pollutants into the environment. Despite the “petroleum exclusion” of Section 101(14) of CERCLA, which currently encompasses crude oil and natural gas, we may nonetheless handle hazardous substances within the meaning of CERCLA, or similar state statutes, in the course of our ordinary operations and, as a result, may be jointly and severally liable under CERCLA for all or part of the costs required to clean up sites at which these hazardous substances have been released into the environment.
Certain of our operations or activities may also be subject to the requirements of the Resource Conservation and Recovery Act, as amended (“RCRA”), and comparable state statutes. RCRA imposes strict requirements on the generation, storage, treatment, transportation and disposal of hazardous and nonhazardous wastes. Under the authority of the EPA, most states administer some or all of the provisions of RCRA, sometimes in conjunction with their own, more stringent requirements. Although RCRA currently exempts certain drilling fluids, produced waters, and other wastes associated with exploration, development and production of oil and natural gas from regulation as hazardous wastes, we can provide no assurance that this exemption will be preserved in the future. From time to time the EPA and analogous state agencies have considered repealing or modifying this exemption, and citizens’ groups have also petitioned the agency to consider its repeal. Most recently, in August 2015, nonprofit environmental groups filed a notice of intent to sue the EPA regarding its failure to review the RCRA E&P waste exemption and subsequently filed an action for a declaratory judgment on May 4, 2016. In December 2016, the U.S. District Court for the District of Columbia approved a consent decree between the EPA and these groups, which requires the EPA to review and issue a notice of proposed rulemaking to revise the E&P waste exemption or a determination that revision is not necessary. Repeal or modification of this exemption or similar exemptions under state law could have a significant impact on our operating costs as well as the oil and natural gas industry in general. The impact of future revisions to environmental laws and regulations cannot be predicted. In any event, at present, these excluded wastes are subject to regulation as RCRA nonhazardous wastes. In addition, we generate petroleum hydrocarbon wastes and ordinary industrial wastes in the course of our operations that may become regulated as RCRA hazardous wastes if such wastes have hazardous characteristics.
We currently own or lease, and have in the past owned or leased, properties that have been used for numerous years to explore and produce oil and natural gas. Although we have utilized operating and disposal practices that were standard in the industry at the time, petroleum hydrocarbons and wastes may have been disposed of or released on or under the properties owned or leased by us or on or under other locations where these petroleum hydrocarbons and wastes have been taken for recycling or disposal. In addition, certain of these properties have been operated by third parties whose treatment and disposal or release of petroleum hydrocarbons and wastes was not under our control. We could be required to remove or remediate previously disposed wastes (including wastes disposed of or released by prior owners or operators), to clean up contaminated property (including contaminated groundwater) and to perform remedial operations to prevent future contamination.
Air Emissions
The Clean Air Act, as amended (“CAA”), and comparable state laws, regulate emissions of various air pollutants through air emissions standards, construction and operating permitting programs and the imposition of other compliance requirements. These laws and regulations may require us to obtain pre-approval for the construction or modification of certain projects or facilities expected to produce or significantly increase air emissions, obtain and strictly comply with stringent air permit requirements or utilize specific equipment or technologies to control emissions of certain pollutants. The need to obtain permits has the potential to delay the development of oil and natural gas projects. Over the next several years, we may be required to incur certain capital expenditures for air pollution control equipment or other air emissions related issues. For example, in May 2016, the EPA issued final rules that require the reduction of volatile organic compound and methane emissions from additional new, modified or reconstructed oil and gas emissions sources (the “2016 NSPS Rules”). In May 2017, the EPA announced a 90-day stay of portions of the 2016 NSPS Rules, which stay was vacated in part by the U.S. Court of Appeals for the D.C. Circuit on July 3, 2017. The EPA also proposed a two year stay of portions of the 2016 NSPS Rules on June 12, 2017, for which the public notice and comment period closed on August 9, 2017. These new regulations could, among other things, require installation of new emission controls on some of the drilling program’s equipment and production facilities, result in longer permitting timelines, and significantly increase our capital expenditures and drilling program’s operating costs, which could adversely impact our business. Compliance with any one or more of these requirements could increase our costs of development and production, which costs could be significant.
Climate Change
Based on the EPA’s determination that emissions of carbon dioxide, methane and other greenhouse gases (“GHGs”) present an endangerment to public health and the environment because emissions of such gases are, according to the EPA, contributing to the warming of the earth’s atmosphere and other climatic changes, the agency has adopted regulations under existing provisions of the federal CAA that, among other things, establish pre-construction and operating permit reviews for GHG emissions from certain large stationary sources that already are potential major sources of certain principal, or criteria, pollutant emissions. Facilities required to obtain permits for their GHG emissions also will be required to meet “best available control technology” standards that typically will be established by the states. In addition, the EPA has adopted regulations requiring the monitoring and annual reporting of GHG emissions from specified sources in the United States, including, among others, certain oil and natural gas production facilities, which includes certain of our operations. Most recently, in May 2016, the EPA finalized rules to reduce methane emissions from new, modified or reconstructed sources in the oil and natural gas sector. In November 2016, the Bureau of Land Management (“BLM”) issued final rules to reduce methane emissions from venting, flaring, and leaks during oil and gas operations on public lands. However, the Department of the Interior (the parent department of BLM) announced in October 2017 that it would delay the effectiveness of certain aspects of the BLM methane rules intended to go into effect in January 2018. We cannot predict which areas, if any, the EPA may choose to regulate with respect to GHG emissions next.
A number of state and regional efforts have emerged that are aimed at tracking and/or reducing GHG emissions by means of cap and trade programs that typically require major sources of GHG emissions to acquire and surrender emission allowances in return for emitting those GHGs. On an international level, the United States was one of almost 200 nations that is party to the Paris Agreement adopted in December 2015 to reduce global GHG emissions. However, on June 1, 2017, President Trump announced that the United States would withdraw from the Paris Agreement and that it would potentially seek to renegotiate the Paris Agreement on more favorable terms. Although President Trump has the authority to unilaterally withdraw the United States from the Paris Agreement, per the terms of the Paris Agreement, such a withdrawal may not be made until three years from the effective date of the Paris Agreement, which is November 4, 2019, and any such withdrawal only becomes effective one year after the notice of withdrawal is provided. Despite the planned withdrawal of the United States, various state and local governments have publicly committed to continue to further the goals of the Paris Agreement. Although it is not possible at this time to predict how legislation or new regulations that may be adopted to address GHG emissions would impact our business, such requirements could require us to obtain permits for our GHG emissions, install costly emission controls, pay fees on the emissions data, and adversely affect demand for the oil and natural gas that we produce. Moreover, incentives to conserve energy or use alternative energy sources as a means of addressing climate change
could reduce demand for oil, NGLs and natural gas. Finally, it should be noted that some scientists have concluded that increasing concentrations of GHGs in the Earth’s atmosphere may produce climate changes that have significant physical effects, such as increased frequency and severity of storms, droughts and floods and other climatic events. If any such effects were to occur, they could have an adverse effect on our financial condition and results of operations.
Water Discharges and Fluid Injections
The Federal Water Pollution Control Act, as amended (the “Clean Water Act”), and analogous state laws impose restrictions and strict controls regarding the discharge of pollutants into state waters and waters of the United States. The discharge of pollutants into regulated waters is prohibited, except in accordance with the terms of a permit issued by the EPA or the analogous state agency. Spill prevention, control and countermeasure requirements under federal law require appropriate containment berms and similar structures to help prevent the contamination of navigable waters in the event of a hydrocarbon tank spill, rupture or leak. In addition, the Clean Water Act and analogous state laws require individual permits or coverage under general permits for discharges of storm water runoff from certain types of facilities, including oil and natural gas production facilities. The Clean Water Act also prohibits the discharge of dredge and fill material in regulated waters, including wetlands, unless authorized by permit. Federal and state regulatory agencies can impose administrative, civil and criminal penalties, as well as require remedial or mitigation measures, for noncompliance with discharge permits or other requirements of the Clean Water Act and analogous state laws and regulations.
The Oil Pollution Act of 1990, as amended (“OPA”), amends the Clean Water Act and sets minimum standards for prevention, containment and cleanup of oil spills. The OPA applies to vessels, offshore facilities, and onshore facilities, including exploration and production facilities that may affect waters of the United States. Under OPA, responsible parties, including owners and operators of onshore facilities, may be held strictly liable for oil cleanup costs and natural resource damages as well as a variety of public and private damages that may result from oil spills. The OPA also requires owners or operators of certain onshore facilities to prepare Facility Response Plans for responding to a worst-case discharge of oil into waters of the United States.
Fluids resulting from oil and natural gas production, consisting primarily of salt water, are disposed by injection in belowground disposal wells. These disposal wells are regulated pursuant to the Underground Injection Control (“UIC”) program established under the federal Safe Drinking Water Act (“SDWA”) and analogous state laws. The UIC program requires permits from the EPA or an analogous state agency for the construction and operation of disposal wells, establishes minimum standards for disposal well operations, and may restrict the types and quantities of fluids that may be disposed. While we believe that our disposal well operations substantially comply with requirements under the applicable UIC programs, a change in disposal well regulations or the inability to obtain permits for new disposal wells in the future may affect our ability to dispose of salt water and ultimately increase the cost of our operations or reduce the amount of oil and/or natural gas that we can produce from our wells.
There continues to be a concern that the injection of saltwater into belowground disposal wells contribute to seismic activity in certain areas, including Oklahoma and Texas, where we operate. For instance, on April 21, 2015, the Oklahoma Geologic Survey (“OGS”) issued a document entitled “Statement of Oklahoma Seismicity,” in which the agency states “the OGS considers it very likely that the majority of recent earthquakes, particularly those in central and north-central Oklahoma, are triggered by the injection of produced water in disposal wells.” In response to these concerns, regulators in some states, including Oklahoma and Texas, are pursuing initiatives designed to impose additional requirements in the permitting and operation of saltwater disposal wells or otherwise to assess any relationship between seismicity and the use of such wells. For example, the Oklahoma Corporation Commission (“OCC”) has adopted rules for operators of saltwater disposal wells in certain seismically-active areas (“Areas of Interest”) in the Arbuckle formation, requiring operators to monitor and record well pressure and discharge volume on a daily basis and further requiring operators of wells permitted for disposal of 20,000 barrels per day or more of saltwater to conduct mechanical integrity testing. On March 25, 2015, the Oil and Gas Conservation Division (“OGCD”) issued a directive, expanding the Areas of Interest for induced seismicity. Under the new directive, operators of 347 disposal wells located within the expanded Areas of Interest of the Arbuckle formation were given until April 18, 2015 to demonstrate that their wells were not disposing into or in communication with the crystalline basement rock underlying the Arbuckle formation. Operators of wells in contact or communication with the basement rock were required to reduce the depth of, or “plug back,” those wells or, alternatively, to reduce disposal volume by 50 percent. On July 17, 2015, the OGCD issued another directive, further expanding the covered area to include an additional 211 disposal wells. Under this second directive, operators were given until August 14, 2015 to prove that they were not injecting below the Arbuckle formation or, as necessary, to plug back those wells in contact or communication with the crystalline basement rock, without the option of reducing disposal volume by 50 percent.
On November 19, 2015, the OGCD issued a directive to stop or reduce disposal volumes in the Cherokee-Carmen area, including 5 wells we currently operate. In addition, on January 13, 2016, the OGCD announced a plan in response to recent earthquakes in the Fairview area of Oklahoma. The plan calls for changes to the operations of oil and gas wastewater disposal wells in the area that dispose into the Arbuckle formation. Under the plan, a total of 27 Arbuckle disposal wells were required to reduce disposal volume. The plan affected 7 disposal wells we currently operate that dispose in the Arbuckle formation. On February 16, 2016, the OGCD requested we curtail our wastewater disposal volumes at 11 wells by approximately 40%. On March 7, 2016 and August 19, 2016, the OGCD identified additional wells that were required to reduce disposal volume, including nine that we operate. The OGCD established caps for additional wells, including 16 that we operate, on February 24, 2017. On March 1, 2017, the OGCD also issued a statement saying that further actions to reduce the earthquake rate in Oklahoma could be expected. While our current plans are for future disposal wells to inject into formations other than the Arbuckle and we currently operate 11 such non-Arbuckle formation disposal wells, we continue to utilize wells that dispose into the Arbuckle formation.
We have timely met and satisfied all requests of the OCC regarding changes and/or reductions in disposal capacity in our operated disposal wells, all while maintaining our production base without any negative material impact thereto. We believe we are currently in compliance with the OGCD’s latest requests regarding Arbuckle injection limits; however, a change in disposal well regulations or injection limits, or the inability to obtain permits for new disposal wells in the future may affect our ability to dispose of salt water and ultimately increase the cost of our operations and/or reduce the volume of oil and natural gas that we produce from our wells.
In Texas, effective on November 17, 2014, the Texas Railroad Commission adopted a new rule governing permitting or re-permitting of disposal wells that requires, among other things, the submission of information on seismic events occurring within a specified radius of the disposal well location, as well as logs, geologic cross sections and structure maps relating to the disposal area in question. If a permittee or a prospective permittee fails to demonstrate that the saltwater or other fluids are confined to the disposal zone or if scientific data indicates such a disposal well is likely to be or determined to be contributing to seismic activity, then the Commission may deny, modify, suspend or terminate the permit application or existing operating permit for that well.
Hydraulic Fracturing Activities
Hydraulic fracturing is an important and common industry practice that is used to stimulate production of natural gas and/or oil from dense subsurface rock formations. The hydraulic fracturing process involves the injection of water, sand, and/or chemicals under pressure into targeted subsurface formations to fracture the surrounding rock and stimulate production. We routinely use hydraulic fracturing techniques in many of our drilling and completion programs. Hydraulic fracturing is typically regulated by state oil and natural gas commissions, or similar state agencies, but several federal agencies have asserted regulatory authority over certain aspects of the process. For example, the EPA published permitting guidance in February 2014 addressing the use of diesel fuel in fracturing operations; issued final CAA regulations governing performance standards, including standards for the capture of air emissions released during hydraulic fracturing; issued in June 2016 final effluent limit guidelines that saltwater from shale resource extraction operations must meet before discharging to publicly owned wastewater treatment plants; and issued in May 2014 a prepublication of its Advance Notice of Proposed Rulemaking regarding Toxic Substances Control Act reporting of the chemical substances and mixtures used in hydraulic fracturing. Also, the BLM published a final rule containing disclosure requirements and other mandates for hydraulic fracturing on federal and Indian lands in March of 2015. The U.S. District Court of Wyoming struck down this rule in June 2016, but the decision was appealed to the U.S. Tenth Circuit Court of Appeals. Although the Trump Administration has indicated it would like to repeal this rule, the Tenth Circuit dismissed this appeal and the underlying case on September 21, 2017 and it is unclear whether the rule remains in effect. Compliance with these requirements could increase our costs of development and production, which costs may be significant.
In addition, Congress has from time to time considered the adoption of legislation to provide for federal regulation of hydraulic fracturing and to require disclosure of the chemicals used in the hydraulic fracturing process. Some states, including Texas and Oklahoma, where we operate, have adopted, and other states are considering adopting legal requirements that could impose more stringent permitting, public disclosure or well construction requirements on hydraulic fracturing activities. Some states have elected to prohibit hydraulic fracturing altogether, but not the states in which we own and operate oil and gas wells. Local governments may also seek to adopt ordinances within their jurisdictions regulating the time, place and manner of drilling activities in general or hydraulic fracturing activities in particular. We believe that we follow applicable standard industry practices and legal requirements for groundwater protection in our hydraulic fracturing activities. Nevertheless, if new or more stringent federal, state or local legal restrictions relating to the hydraulic fracturing process are adopted in areas where we operate, we could incur potentially significant added costs to comply with such requirements, experience delays or curtailment in the pursuit of exploration, development, or production activities, and perhaps even be precluded from drilling wells.
We do not have insurance policies in effect that are intended to provide coverage for losses solely related to hydraulic fracturing operations; however, we believe our general liability and excess liability insurance policies would cover third party claims related to hydraulic fracturing operations conducted by third parties and associated legal expenses in accordance with, and subject to, the terms and coverage limits of such policies.
Endangered Species
The Endangered Species Act restricts activities that may affect endangered and threatened species or their habitats. Similar protections are offered to migratory birds under the Migratory Bird Treaty Act. Oil and gas activities in our operating areas can be adversely affected by seasonal or permanent restrictions on drilling activities designed to protect various species and their habitat. Seasonal restrictions could limit our ability to operate in protected areas and can intensify competition for drilling rigs, oilfield equipment, services, supplies and qualified personnel, which could lead to periodic shortages when drilling is allowed. These constraints and the resulting shortages or high costs could delay our operations and materially increase our operating and capital costs. Permanent restrictions imposed to protect endangered species could prohibit drilling in certain areas or require the implementation of expensive mitigation measures. The U.S. Fish and Wildlife Service in February 2016 finalized a rule altering how it identifies critical habitat for endangered and threatened species. The designation of critical habitat areas could materially restrict use of or access to federal, state and private lands. In addition, as a result of a settlement approved by the U.S. District Court for the District of Columbia in September 2011, the U.S. Fish & Wildlife Service is required to make a determination on the listing of numerous species as endangered or threatened under the Endangered Species Act by 2017. The designation of previously unprotected species in areas where we operate as threatened or endangered could cause us to incur increased costs arising from species protection measures and could result in limitations on our exploration and production activities that could have an adverse impact on our ability to develop and produce our reserves.
Occupational Safety and Health Act, as amended (“OSHA”)
We are subject to the requirements of OSHA and comparable state statutes whose purpose is to protect the health and safety of workers. In addition, the OSHA hazard communication standard, the Emergency Planning and Community Right-to-Know Act and comparable state statutes and any implementing regulations require that we organize and/or disclose information about hazardous materials used or produced in our operations and that this information be provided to employees, state and local governmental authorities and citizens.
Our business involves a high degree of risk. If any of the following risks, or any risk described elsewhere in this Annual Report on Form 10-K, in our other public filings, press releases and discussions with our management actually occurs, our business, financial condition or results of operations could suffer. The risks described below are the known material risk factors facing us. Additional risks not presently known to us or which we currently consider immaterial also may adversely affect us or our operations.
Risks Related to the Oil and Gas Industry and Our Business
Oil, NGLs and natural gas prices are volatile. A sustained decline in oil, NGLs and natural gas prices could adversely affect our business, financial condition and results of operations and our ability to meet our capital expenditure obligations and financial commitments.
The price we receive for our oil and, to a lesser extent, NGLs and natural gas, heavily influences our revenue, profitability, access to capital and future rate of growth. Oil, NGLs and natural gas are commodities and, therefore, their prices are subject to wide fluctuations in response to relatively minor changes in supply and demand. Historically, the markets for these commodities have been volatile, and are likely to continue to be volatile in the future, especially given current economic and geopolitical conditions.
The prices we receive for our production and the levels of our production depend on numerous factors beyond our control. These factors include, but are not limited to, the following:
· worldwide and regional economic conditions impacting the global supply and demand for oil, NGLs and natural gas;
· the actions of the Organization of Petroleum Exporting Countries;
· the price and quantity of imports of foreign oil, NGLs and natural gas;
· political conditions in or affecting other oil, NGLs and natural gas-producing countries;
· the level of global oil and natural gas exploration and production;
· the level of global oil and natural gas inventories;
· localized supply and demand fundamentals and transportation availability;
· weather conditions and natural disasters;
· foreign, domestic and local governmental regulations and taxes;
· speculation as to the future price of oil, NGLs and natural gas and the speculative trading of oil, NGLs and natural gas futures contracts;
· price and availability of competitors’ supplies of oil, NGLs and natural gas;
· technological advances affecting energy consumption; and
· the price and availability of alternative fuels.
The majority of our oil production and a portion of our natural gas production is currently sold to purchasers under short-term (less than 12-month) contracts at market-based prices. Lower oil, NGLs and natural gas prices have in the past adversely affected our cash flows, borrowing ability and present value of our reserves. It may also reduce the amount of oil, NGLs and natural gas that we can produce economically. Any sustained periods of low prices for oil, NGLs and natural gas prices could render uneconomic a significant portion of our identified drilling locations. This may result in our having to make significant downward adjustments to our estimated proved reserves. As a result, a low commodity price environment and price volatility may materially and adversely affect our future business, financial condition, results of operations, liquidity or ability to finance planned capital expenditures.
There are no assurances that we will be able to successfully implement our business plan or successfully operate as a restructured business.
Following emergence from the Chapter 11 Cases in 2016, we significantly restructured our business and adopted a new business plan. The restructured Company and new business plan have been in effect for a limited period of time and there are no assurances that we will be able to successfully implement our business plan or successfully operate as a restructured business. Additionally, we cannot assure you that having been subject to bankruptcy protection will not adversely affect our operations in the future.
Our Exit Facility contains certain covenants that may inhibit our ability to make certain investments, incur additional indebtedness and engage in certain other transactions, which could adversely affect our ability to meet our future goals.
The Exit Facility limits our ability, among other things, to:
· incur additional indebtedness;
· incur liens;
· enter into sale and lease back transactions;
· make certain investments;
· consolidate, merge, sell, or otherwise dispose of all or substantially all of our assets;
· pay dividends or make other distributions or repurchase or redeem our stock;
· enter into transactions with our affiliates;
· engage or enter into any new lines of business;
· enter into certain marketing activities for hydrocarbons;
· create additional subsidiaries;
· prepay, redeem, or repurchase certain of our indebtedness; and
· amend or modify certain provisions of our (and Midstates Sub’s) organizational documents.
The Exit Facility also requires us to comply with certain financial maintenance covenants as discussed below. A breach of any of these covenants could result in a default under our Exit Facility. If a default occurs, the lenders under the Exit Facility may elect to declare all borrowings thereunder outstanding, together with accrued interest and other fees, to be immediately due and payable. The lenders under the Exit Facility would also have the right in these circumstances to terminate any commitments they have to provide further borrowings. If we are unable to repay our indebtedness when due or declared due, the lenders thereunder will also have the right to proceed against the collateral pledged to them to secure the indebtedness. If such indebtedness were to be accelerated, our assets may not be sufficient to repay in full our secured indebtedness.
We may be subject to risks in connection with divestitures and acquisitions.
In November 2017, we announced that the Company had engaged SunTrust Robinson Humphrey to explore and evaluate potential strategic alternatives for our Anadarko Basin and NW STACK assets. We may sell off any of these core or non-core assets in order to increase capital resources available for other core assets, create organizational and operational efficiencies or for other purposes. Various factors could materially affect our ability to dispose of such assets, including the approvals of governmental agencies or third parties and the availability of purchasers willing to acquire the assets with terms we deem acceptable. Though we continue to evaluate various options for the divestiture of such assets, there can be no assurance that this evaluation will result in any specific action.
In addition, in the future we may make acquisitions of businesses that complement or expand our current business. We may not be able to identify attractive acquisition opportunities. Even if we do identify attractive acquisition opportunities, we may not be able to complete the acquisition or do so on commercially acceptable terms. As a result, our acquisition activities may not be successful, which may hinder our replacement of reserves and adversely affect our results of operations.
We may be unable to obtain funding in the capital markets on terms we find acceptable, or our borrowings base may be subject to downward redeterminations in the future.
Historically, we have used our cash flows from operations and borrowings under our RBL to fund our capital expenditures and have relied on the capital markets and asset monetization transactions to provide us with additional capital for large or exceptional transactions or to refinance debt obligations. On the Effective Date, the existing RBL was superseded, and we entered into the Exit Facility with the lenders under the existing RBL. On May 24, 2017, the Company entered into the First Amendment to the Exit Facility (the “First Amendment”). The First Amendment, among other things, moved the first scheduled borrowing base redetermination from April 2018 to October 2017. On October 27, 2017, the Company’s borrowing base was redetermined at the existing amount of $170.0 million. The Company’s Anadarko Basin assets in Texas and Oklahoma were excluded from the redetermination of the borrowing base. Any potential future reduction in the borrowing base will reduce our available liquidity, and, if the reduction results in the outstanding amount under the facility exceeding the borrowing base, we will be required to repay the deficiency within 30 days or in six equal monthly installments thereafter, at our election. We may not have the financial resources in the future to make any mandatory deficiency principal prepayments required under our Exit Facility, which could result in an event of default.
In the future, we may not be able to access adequate funding under our Exit Facility as a result of (i) a decrease in our borrowing base due to the outcome of a subsequent borrowing base redetermination, or (ii) an unwillingness or inability on the part of our lending counterparties to meet their funding obligations. Since the process for determining the borrowing base under our Exit Facility involves evaluating the estimated value of some of our oil and natural gas properties using pricing models determined by the lenders at that time, a decline in those prices used, or further downward reductions of our reserves, likely will result in a redetermination of our borrowing base and a decrease in the available borrowing amount at the time of the next scheduled redetermination. In such case, we would be required to repay any indebtedness in excess of the borrowing base.
Our level of indebtedness may increase and reduce our financial flexibility.
At December 31, 2017, we had $130.0 million outstanding under our Exit Facility, including $1.9 million in letters of credit. We may incur a significant amount of additional indebtedness in the future. Should our current level of indebtedness increase significantly, it could affect our operations in several ways, including the following:
· causing a significant portion of our cash flows to be used to service our indebtedness, thereby reducing the availability of cash flows for working capital, capital expenditures and other general business activities;
· increasing our vulnerability to general adverse economic and industry conditions;
· limiting our ability to borrow additional funds, dispose of assets, pay dividends and make certain investments;
· placing us at a competitive disadvantage compared to our competitors that are less leveraged and, therefore, such competitors may be able to take advantage of opportunities that our indebtedness would prevent us from pursuing;
· causing our debt covenants to affect our flexibility in planning for, and reacting to, changes in the economy and in our industry;
· making it more likely that a reduction in our borrowing base following a redetermination could require us to repay a portion of our then outstanding bank borrowings; and
· impairing our ability to obtain additional financing in the future for working capital, capital expenditures, acquisitions, general corporate or other purposes.
A high level of indebtedness would increase the risk that we may default on our debt obligations. Our ability to meet our debt obligations and to reduce our level of indebtedness depends on our future performance. General economic conditions, oil, NGLs and natural gas prices and financial, business and other factors affect our operations and our future performance. Many of these factors are beyond our control.
We may be unable to maintain compliance with certain financial ratio covenants of our outstanding indebtedness which could result in an event of default that, if not cured or waived, would have a material adverse effect on our business, financial condition and results of operations.
The Exit Facility, as amended, includes certain financial maintenance covenants that are required to be calculated on a quarterly basis for compliance purposes. These financial maintenance covenants include EBITDA to interest expense for the trailing four fiscal quarters of not less than 2.50:1.00 and a limitation of Total Net Indebtedness (as defined in the Exit Facility) to EBITDA for the trailing four fiscal quarters of not more than 4.00:1.00.
In addition, the Exit Facility contains various other covenants that, among other things, may restrict our ability to: (i) incur additional indebtedness or guarantee indebtedness (ii) make loans and investments; (iii) pay dividends on capital stock and make other restricted payments, including the prepayment or redemption of other indebtedness; (iv) create or incur certain liens; (v) sell, transfer or otherwise dispose of certain assets; (vi) enter into certain types of transactions with our affiliates; (vii) acquire, consolidate or merge with another entity upon certain terms and conditions; (viii) sell all or substantially all of our assets; (ix) prepay, redeem or repurchase certain debt; (x) alter the business we conduct and make amendments to our organizational documents, (xi) enter into certain derivative transactions and (xii) enter into certain marketing agreements and take-or-pay arrangements.
As of December 31, 2017, we were in compliance with our financial covenants; however, we cannot guarantee that we will be able to comply with such terms at all times in the future. Any failure to comply with the conditions and covenants in our Exit Facility that is not waived by our lenders or otherwise cured could lead to a termination of our Exit Facility, acceleration of all amounts due under our Exit Facility, or trigger cross default provisions under other financing arrangements. These restrictions may limit our ability to obtain future financings to withstand a future downturn in our business or the economy in general, or to otherwise conduct necessary corporate activities. We may also be prevented from taking advantage of business opportunities that arise because of the limitations that the restrictive covenants under our indebtedness impose on us.
Our historical financial information may not be indicative of our future financial performance.
On the Effective Date we adopted fresh start accounting and our assets and liabilities were adjusted to fair values and our accumulated deficit was restated to zero. Accordingly, our financial condition and results of operations following our emergence from the Chapter 11 Cases are not comparable to the financial condition and results of operations reflected in our historical financial statements. Further, as a result of the implementation of the Plan and the transactions contemplated thereby, our historical financial information are not indicative of our future financial performance.
Drilling for and producing oil and natural gas are high risk activities with many uncertainties that could adversely affect our business, financial condition or results of operations.
Our future financial condition and results of operations will depend on the success of our development, drilling and production activities. Our oil and natural gas drilling and production activities are subject to numerous risks beyond our control, including the risk that drilling will not result in commercially viable oil or natural gas production. Our decisions to purchase, explore or develop drilling locations or properties will depend in part on the evaluation of data obtained through 2D and 3D seismic data, geophysical and geological analyses, production data and engineering studies, the results of which are often inconclusive or subject to varying interpretations. The production and operating data that is available with respect to our operating areas based on modern drilling and completion techniques is relatively limited compared to trends where multiple operators have been active for a significant period of time. As a result, we face more uncertainty in evaluating data than operators in more developed trends. Our costs of drilling, completing and operating wells are often uncertain before drilling commences. In addition, the application of new techniques in these trends, such as high-graded stimulation designs and horizontal completions, may make it more difficult to accurately estimate these costs. Overruns in budgeted expenditures are common risks that can make a particular project uneconomical. Further, many factors may curtail, delay or cancel our scheduled drilling projects, including the following:
· shortages of, or delays in, obtaining equipment and qualified personnel;
· facility or equipment malfunctions;
· unexpected operational events;
· ability to economically dispose of produced saltwater;
· pressure or irregularities in geological formations;
· adverse weather conditions;
· reductions in oil and natural gas prices;
· delays imposed by or resulting from compliance with regulatory requirements;
· proximity to and capacity of transportation facilities;
· title problems;
· limitations in the market for oil and natural gas; and
· cost associated with developing and operating oil and gas properties.
In addition, our hydraulic fracturing operations require significant quantities of water. Regions where we operate could experience drought conditions which would diminish our access to water for hydraulic fracturing operations. Any diminished access to water for use in hydraulic fracturing, whether due to usage restrictions or drought or other weather conditions, could curtail our operations or otherwise result in delays in operations or increased costs.
The standardized measure of discounted future net cash flows from our proved reserves will not be the same as the current market value of our estimated oil and natural gas reserves.
You should not assume that the standardized measure of discounted future net cash flows from our proved reserves is the current market value of our estimated oil and natural gas reserves. In accordance with SEC requirements in effect at December 31, 2017, 2016 and 2015, we based the discounted future net cash flows from our proved reserves on the 12-month unweighted arithmetic average of the first-day-of-the-month price for the preceding twelve months without giving effect to derivative transactions. Actual future net cash flows from our oil and natural gas properties will be affected by factors such as:
· actual prices we receive for oil and natural gas;
· actual cost of development and production expenditures;
· the amount and timing of actual production; and
· changes in governmental regulations or taxation.
The timing of both our production and our incurrence of expenses in connection with the development and production of oil and natural gas properties will affect the timing and amount of actual future net revenues from proved reserves, and thus their actual present value. In addition, the 10% discount factor we use when calculating standardized measure may not be the most appropriate discount factor based on interest rates in effect from time to time and risks associated with us or the oil and natural gas industry in general. Actual future prices and costs may differ materially from those used in the present value estimates included in this report which could have a material effect on the market value of our reserves.
If oil and natural gas prices decrease in the future, we may be required to take write-downs of the carrying values of our oil and natural gas properties.
We use the full cost method of accounting for our oil and gas properties. Accordingly, we capitalize and amortize all productive and nonproductive costs directly associated with property acquisition, exploration and development activities. Under the full cost method, the capitalized cost of oil and gas properties, less accumulated amortization and related deferred income taxes may not exceed the “cost center ceiling” which is equal to the sum of the present value of estimated future net revenues from proved reserves, less estimated future expenditures to be incurred in developing and producing the proved reserves computed using a discount factor of 10%, plus the costs of properties not subject to amortization, plus the lower of the cost or estimated fair value of unproved properties included in the costs being amortized, less related income tax effects. If the net capitalized costs exceed the cost center ceiling, we recognize the excess as an impairment of oil and gas properties. The risk that we will be required to recognize impairments of our oil and natural gas properties increases during periods of low commodity prices. In addition, impairments would occur if we were to experience sufficient downward adjustments to our estimated proved reserves or the present value of estimated future net revenues. An impairment recognized in one period may not be reversed in a subsequent period even if higher oil and gas prices increase the cost center ceiling applicable to the subsequent period. We could incur impairments of oil and natural gas properties in the future, particularly as a result of future declines in commodity prices.
Oil, NGLs and natural gas prices are volatile, and a portion of our production is not subject to hedging. As a result, a portion of our cash flows from operations will be subjected to increased volatility.
Historically, we have entered into hedging transactions of our oil, NGLs and natural gas production to reduce our exposure to fluctuations in the price of oil, NGLs and natural gas. At December 31, 2017, we had outstanding commodity derivative contracts that extend through December 2019. Although hedged through December 2019, a portion of our 2018 and 2019 production will be sold at market prices, leaving us exposed to the fluctuations in the price of oil, NGLs and natural gas and subjecting our cash flows from operations to increased volatility unless we enter into additional hedging transactions. We continually reevaluate and consider whether in the long-term we will hedge any of our future production. See “Management’s Discussion and Analysis of Financial Condition” and “—Note 6. Risk Management and Derivative Instruments” in the Notes to the Consolidated Financial Statements set forth in Part IV, Item 15 of this Annual Report on Form 10-K, for a summary of our commodity derivative positions.
Any future derivative activities could result in financial losses or could reduce our earnings.
To achieve a more predictable cash flow and to reduce our exposure to adverse fluctuations in the prices of oil, NGLs and natural gas, we currently and have historically chosen to enter into derivative instruments at times for a portion of our oil, NGLs and natural gas production. We do not designate derivative instruments as hedges for accounting purposes, and we record all derivative instruments in our balance sheet at fair value. Changes in the fair value of derivative instruments are recognized in current earnings. Accordingly, to the extent we enter into derivative instruments in the future, our earnings may fluctuate significantly as a result of changes in the fair value of any derivative instruments.
Derivative instruments would expose us to the risk of financial loss in some circumstances, including when:
· production is less than the volume covered by the derivative instruments;
· the counter-party to the derivative instrument defaults on its contractual obligations; or
· there is an increase in the differential between the underlying price in the derivative instrument and actual prices received for basis differentials.
In addition, any derivative arrangements in the future would likely limit the benefit we would receive from increases in the prices for oil, NGLs and natural gas.
We incurred losses from operations during the current year as well as certain periods historically and may continue to do so in the future.
We incurred net losses of $85.1 million and $1.8 billion for the years ended December 31, 2017 and 2015, respectively. Our development of, and participation in, an increasing number of drilling locations has required and will continue to require substantial capital expenditures. The uncertainty and risks described in this report may impede our ability to economically acquire and develop oil and natural gas reserves. As a result, we may not be able to achieve or sustain profitability or positive cash flows provided by operating activities in the future.
Our estimated proved reserves are based on many assumptions that may turn out to be inaccurate. Any significant inaccuracies in these assumptions will materially affect the quantities and estimated present value of our reserves.
The process of estimating oil and natural gas reserves is complex. It requires interpretations of available technical data and many assumptions, including assumptions relating to current and future economic conditions and commodity prices. Any significant inaccuracies in these assumptions could materially affect the estimated quantities and present value of reserves shown in this report. See “Summary of Oil and Gas Properties and Operations” for information about our estimated oil and natural gas reserves.
In order to prepare our estimates, we must estimate production rates and the timing of development expenditures. We must also analyze available geological, geophysical, production and engineering data. The extent, quality and reliability of this data can vary. The process also requires economic assumptions about matters such as oil and natural gas prices, drilling and operating expenses, capital expenditures, taxes and availability of funds. Estimates of oil and natural gas reserves are inherently imprecise. In addition, reserve estimates for properties that do not have a lengthy production history, including the areas in which we operate, are less reliable than estimates for fields with lengthy production histories. There can be no assurance that analysis of previous production data relating to the Mississippian Lime or Anadarko Basins will accurately predict future production, development expenditures or operating expenses from wells drilled and completed using modern techniques. In addition, this data is partially based on vertically drilled wells, which may not accurately reflect production, development expenditures or operating expenses that may result from the application of horizontal drilling techniques.
Actual future production, oil and natural gas prices, revenues, taxes, development expenditures, operating expenses and quantities of recoverable oil and natural gas reserves may vary from our estimates. Any significant variance could materially affect the estimated quantities and present value of reserves shown in this report. In addition, we may adjust estimates of proved reserves to reflect production history, results of exploration and development, prevailing oil and natural gas prices and other factors, many of which are beyond our control.
The development of our undeveloped reserves in our areas of operation may take longer and may require higher levels of capital expenditures than we currently anticipate. Therefore, our undeveloped reserves may not be ultimately developed or produced.
Development of these reserves may take longer and require higher levels of capital expenditures than we currently anticipate. Delays in the development of our reserves or increases in costs to drill and develop such reserves will reduce the future net revenues estimated for such reserves and may result in some projects becoming uneconomic. In addition, pursuant to existing SEC rules and guidance, subject to limited exceptions, proved undeveloped reserves may only be booked if they relate to wells scheduled to be drilled within five years of the date of booking. Accordingly, delays in the development of such reserves, increases in capital expenditures required to develop such reserves and changes in commodity prices may cause us to reclassify certain of our proved undeveloped reserves as unproved reserves, which may materially adversely affect our business, results of operations and financial condition.
Unless we replace our oil and natural gas reserves, our reserves and production will decline, which would adversely affect our business, financial condition and results of operations.
Unless we conduct successful development and exploration activities or acquire properties containing proved reserves, our proved reserves will decline as those reserves are produced. Producing oil and natural gas reservoirs generally are characterized by declining production rates that vary depending upon reservoir characteristics and other factors. Our future oil and natural gas reserves and production, and therefore our cash flows and income, are highly dependent on our success in efficiently developing our current reserves and economically finding or acquiring additional recoverable reserves. We may not be able to develop, find or acquire additional reserves to replace our current and future production at acceptable costs. If we are unable to replace our current and future production, the value of our reserves will decrease, and our business, financial condition and results of operations will be adversely affected.
Our producing properties are located in the Mississippian Lime and in the Anadarko Basin, making us vulnerable to risks associated with operating in a limited number of geographic areas.
All of our producing properties are geographically concentrated in the Mississippian Lime and Anadarko Basin, and at December 31, 2017, all of our total estimated proved reserves were attributable to properties located in these areas. As a result of this concentration, we may be disproportionately exposed to the impact of regional supply and demand factors, delays or interruptions of production from wells in these areas caused by governmental regulation, processing or transportation capacity constraints, market limitations, availability of equipment and personnel, water shortages or other drought related conditions or interruption of the processing or transportation of oil, NGLs or natural gas.
Drilling locations that we have identified may not yield oil, NGLs or natural gas in commercially viable quantities.
We describe some of our drilling locations and our plans to explore those drilling locations in this report. Our drilling locations are in various stages of evaluation, ranging from a location which is ready to drill to a location that will require substantial additional interpretation. It is extremely difficult to accurately predict with any level of certainty in advance of drilling and testing whether any particular location will yield oil or natural gas in sufficient quantities to recover drilling or completion costs or to be economically viable. The use of technologies and the study of producing fields in the same area will not enable us to know conclusively prior to drilling whether oil or natural gas will be present or, if present, whether oil or natural gas will be present in sufficient quantities to be economically viable. Even if sufficient amounts of oil or natural gas exist, we may damage the potentially productive hydrocarbon bearing formation or experience mechanical difficulties while drilling or completing the well, resulting in a reduction in production from or abandonment of the well. If we drill additional wells that we identify as dry holes in our current and future drilling locations, our drilling success rate may decline and materially harm our business. In sum, the cost of drilling, completing and operating any well is often uncertain, and new wells may not be productive.
Our identified drilling locations are scheduled out over many years, making them susceptible to uncertainties that could materially alter the occurrence or timing of their drilling, which in certain instances could prevent production prior to the expiration date of leases for such locations. In addition, we may not be able to raise or have reasonable access to the amount of capital that would be necessary to drill a substantial portion of our identified drilling locations.
Our management team has identified and scheduled certain drilling locations as an estimation of our future multi-year drilling activities on our existing acreage and acreage currently under option. These drilling locations represent a significant part of our growth strategy. Our ability to drill and develop these drilling locations depends on a number of uncertainties, including oil and natural gas prices, the availability and cost of capital, drilling and production costs, the availability of drilling services and equipment, drilling results, lease expirations, infrastructure and/or downstream constraints, regulatory approvals and other factors. Because of these uncertain factors, we do not know if the numerous drilling locations we have identified will ever be drilled or if we will be able to produce oil or natural gas from these or any other drilling locations. In addition, unless production is established within the spacing units covering the undeveloped acres on which some of the potential locations are obtained, the leases for such acreage could expire. As such, our actual drilling activities may materially differ from those presently identified.
Part of our strategy involves using some of the latest available horizontal drilling and completion techniques. The results of our horizontal drilling activities are subject to drilling and completion technique risks, and actual drilling results may not meet our expectations for reserves or production. As a result, the value of our undeveloped acreage could decline if drilling results are unsuccessful.
Risks that we face while horizontally drilling include, but are not limited to, landing our well bore in the desired drilling zone, staying in the desired drilling zone while drilling horizontally through the formation, running our casing the entire length of the well bore and being able to run tools and other equipment consistently through the horizontal well bore. Risks that we face while completing our horizontal wells include, but are not limited to, being able to fracture stimulate the planned number of stages, being able to run tools the entire length of the well bore during completion operations and successfully cleaning out the well bore after completion of the final fracture stimulation stage. Ultimately, the success of these horizontal drilling and completion techniques can only be evaluated over time as more wells are drilled in the Mississippian Lime and Anadarko Basin and production profiles are established over a sufficient period of time. If our horizontal drilling results in these trends are less than anticipated, the return on our investment in this area may not be as attractive as we anticipate and the value of our undeveloped acreage in this area could decline.
Our business depends on the availability of water and the ability to dispose of water. Limitations or restrictions on our ability to obtain or dispose of water may have an adverse effect on our financial condition, results of operations and cash flows.
With current technology, water is an essential component of drilling and hydraulic fracturing processes. Limitations or restrictions on our ability to secure sufficient amounts of water, or to dispose of or recycle water after use or its production, could adversely impact our operations. In some cases, water may need to be obtained from new sources and transported to drilling sites, resulting in increased costs. Moreover, the introduction of new environmental initiatives and regulations related to water acquisition, water use or waste water disposal, including produced water, drilling fluids and other wastes associated with the exploration, development or production of hydrocarbons, could limit or prohibit our ability to utilize hydraulic fracturing or waste water injection disposal wells.
In addition, concerns have been raised about the potential for earthquakes to occur from the use of underground injection disposal wells, a predominant method for disposing of waste water from oil and gas activities. As further discussed in the risk factor below, new rules and regulations may be developed to address these concerns, possibly limiting or eliminating the ability to use disposal wells in certain locations and/or injecting into certain formations, thereby increasing the cost of disposal in our operations. We operate our own injection wells in addition to using injection wells owned by third parties to dispose of waste water associated with our operations.
Compliance with environmental regulations and permit requirements governing the withdrawal, storage, and use of water necessary for hydraulic fracturing of wells or the disposal of water may increase our operating costs or may cause us to delay, curtail or discontinue our exploration and development plans, which could have a material adverse effect on our business, financial condition, results of operations and cash flows.
Legislation or regulatory initiatives intended to address seismic activity could restrict our ability to dispose of saltwater produced in conjunction with our hydrocarbons, which could limit our ability to produce oil and gas economically and have a material adverse effect on our business.
We dispose of large volumes of saltwater produced in conjunction with the oil and natural gas produced from our drilling and production operations pursuant to permits issued to us by governmental authorities overseeing such disposal activities. While these permits are issued pursuant to existing laws and regulations, the applicable legal requirements may be subject to change, which could result in the imposition of more stringent operating constraints or new monitoring and reporting requirements.
As stated in “Business—Regulation of the Oil and Natural Gas Industry—Water Discharges and Fluid Injections”, the adoption and implementation of any new laws, regulations, or directives that restrict our ability to dispose of saltwater by plugging back the depths of disposal wells, reducing the volume of oil and natural gas wastewater disposed in such wells, restricting disposal well locations, or requiring us to shut down disposal wells, could require the Company to cease operations at a substantial number of its oil and natural gas wells, which would have a material adverse effect on our ability to produce oil and gas economically and, accordingly, could materially and adversely affect our business, financial condition and results of operations.
The unavailability or high cost of additional drilling rigs, equipment, supplies, personnel and oilfield services could adversely affect our ability to execute our exploration and development plans within our budget and on a timely basis.
We utilize third-party services to maximize the efficiency of our organization. The cost of oilfield services may increase or decrease depending on the demand for services by other oil and gas companies. There is no assurance that we will be able to contract for such services on a timely basis or that the cost of such services will remain at a satisfactory or affordable level. Shortages or the high cost of fractionation crews, drilling rigs, equipment, supplies, personnel or oilfield services could delay or adversely affect our development and exploration operations or cause us to incur significant expenditures that are not provided for in our capital budget, which could have a material adverse effect on our business, financial condition or results of operations.
Our business depends on transportation by truck for our oil and condensate production, and our natural gas production depends on transportation facilities that are owned by third parties.
We transport all of our oil and condensate production by truck, which is more expensive and less efficient than transportation via pipeline. Our natural gas production depends in part on the availability, proximity and capacity of pipeline systems and processing facilities owned by third parties. Federal and state regulation of oil and natural gas production and transportation, tax and energy policies, changes in supply and demand, pipeline pressures, damage to or destruction of pipelines and general economic conditions could adversely affect our ability to produce, gather and transport oil and natural gas.
The disruption of third-party facilities due to maintenance, capacity constraints, or weather could negatively impact our ability to market and deliver our products. We have no control over when or if such facilities are restored or what prices will be charged. A total shut-in of production could materially affect us due to a lack of cash flows, and if a substantial portion of the production is hedged at lower than current market prices, those financial hedges would have to be paid from borrowings absent sufficient cash flows.
Our drilling and production programs may not be able to obtain access on commercially reasonable terms or otherwise to truck transportation, pipelines, gas gathering, transmission, storage and processing facilities to market our oil and natural gas production.
The marketing of oil and natural gas production depends in large part on the capacity and availability of trucks, pipelines and storage facilities, gas gathering systems and other transportation, processing and refining facilities. Access to such facilities is, in many respects, beyond our control. If these facilities were unavailable to us on commercially reasonable terms or otherwise, we could be forced to shut in some production or delay or discontinue drilling plans and commercial production following a discovery of hydrocarbons. We rely (and expect to rely in the future) on facilities developed and owned by third parties in order to store, process, transmit and sell our oil and natural gas production. Our plans to develop and sell our oil and natural gas reserves could be materially and adversely affected by the inability or unwillingness of third parties to provide sufficient facilities and services to us on commercially reasonable terms or otherwise. The amount of oil and gas that can be produced is subject to limitation in certain circumstances, such as pipeline interruptions due to scheduled and unscheduled maintenance, excessive pressure, physical damage to the gathering, transportation, refining or processing facilities, or lack of capacity on such facilities. The curtailments arising from these and similar circumstances may last from a few days to several months, and in many cases, we may be provided only limited, if any, notice as to when these circumstances will arise and their duration.
We may incur substantial losses and be subject to substantial liability claims as a result of our oil and natural gas operations. Additionally, we may not be insured for, or our insurance may be inadequate to protect us against, these risks.
We are not insured against all risks. Losses and liabilities arising from uninsured and underinsured events could materially and adversely affect our business, financial condition or results of operations. Our oil and natural gas exploration and production activities are subject to all of the operating risks associated with drilling for and producing oil and natural gas, including the possibility of:
· environmental hazards, such as unauthorized releases of oil, natural gas, brine, well fluids, toxic gas or other pollution into the environment, including soil and groundwater contamination;
· abnormally pressured formations;
· mechanical difficulties, such as stuck oilfield drilling and service tools and casing collapse;
· fires, explosions and ruptures of pipelines;
· personal injuries and death; and
· natural disasters.
Any of these risks could adversely affect our ability to conduct operations or result in substantial losses as a result of:
· injury or loss of life;
· damage to and destruction of property, natural resources and equipment;
· pollution and other environmental damage;
· regulatory investigations and penalties;
· suspension of our operations; and
· repair and remediation costs.
We may elect not to obtain insurance if we believe that the cost of available insurance is excessive relative to the risks presented. In addition, pollution and environmental risks generally are not fully insurable. The occurrence of an event that is not fully covered by insurance could have a material adverse effect on our business, financial condition and results of operations.
Increased costs of capital could adversely affect our business.
Our business and operating results can be harmed by factors such as the availability, terms and cost of capital, or increases in interest rates. Changes in any one or more of these factors could cause our cost of doing business to increase, limit our access to capital, limit our ability to drill our identified locations and pursue acquisition opportunities, reduce our cash flows available for drilling and place us at a competitive disadvantage. Continuing volatility in the global financial markets may lead to an increase in interest rates or a contraction in credit availability, impacting our ability to finance our operations. We require continued access to capital. A significant reduction in the availability of credit could materially and adversely affect our ability to achieve our planned growth and operating results.
The inability of our significant purchasers to meet their obligations to us may adversely affect our financial results.
We are subject to credit risk due to concentration of our oil, NGLs and natural gas receivables with several significant purchasers. We generally do not require our purchasers to post collateral. The inability or failure of any of our significant purchasers to meet their obligations to us or their insolvency or liquidation may adversely affect our financial condition and results of operations.
Large competitors may be attracted to our core operating areas, which may increase our costs.
Our operations in the Mississippian Lime formation in northwestern Oklahoma and the Anadarko Basin in the Texas panhandle and western Oklahoma may attract companies that have greater resources than we do. These companies may be able to pay more for productive oil and natural gas properties and exploratory prospects or identify, evaluate, bid for and purchase a greater number of properties and prospects than our financial or human resources permit. Their presence in our areas of operations may also restrict our access to, or increase the cost of, oil and natural gas infrastructure, drilling rigs, equipment, supplies, personnel and oilfield services, including fracking equipment and crews. In addition, these companies may have a greater ability to continue exploration activities during periods of low oil and natural gas prices. Our larger competitors may be able to absorb the burden of present and future federal, state, local and other laws and regulations more easily than we can, which would adversely affect our competitive position. Our ability to acquire additional properties and to discover reserves in the future will be dependent upon our ability to evaluate and select suitable properties and to consummate transactions in a highly competitive environment. See “Business—Competition” for additional discussion of the competitive environment in which we operate.
Title to the properties in which we have an interest may be impaired by title defects.
We do not obtain title insurance and have not necessarily obtained drilling title opinions on all of our oil and natural gas properties. The existence of title deficiencies with respect to our oil and natural gas properties could reduce the value or render such properties worthless, which could have a material adverse effect on our business and financial results. A portion of our acreage is undeveloped leasehold acreage, which has a greater risk of title defects than developed acreage. Frequently, as a result of title examinations, certain curative work may be required to correct identified title defects, and such curative work entails time and expense. Our inability or failure to cure title defects could render some locations undrillable or cause us to lose our rights to some or all production from some of our oil and natural gas properties, which could have a material adverse effect on our business and financial results if a comparable additional location to drill a development well cannot be identified.
Future legislation may result in the elimination of certain U.S. federal income tax deductions currently available with respect to oil and natural gas exploration and production. Additionally, future federal or state legislation may impose new or increased taxes or fees on oil and natural gas extraction, transportation and sales.
Potential legislation, if enacted into law, could make significant changes to U.S. federal and state income tax laws, including the elimination of certain key U.S. federal income tax incentives currently available to oil and gas exploration and production companies. These changes include, but are not limited to, (i) the repeal of the percentage depletion allowance for oil and natural gas properties, (ii) the elimination of current deductions for intangible drilling and development costs, (iii) the elimination of the deduction for certain U.S. production activities, and (iv) an extension of the amortization period for certain geological and geophysical expenditures. Although these provisions were largely unchanged in the Tax Cuts and Jobs Act of 2017, which was signed in December 2017, Congress could consider, and could include, some, or all of these proposals as part of future tax reform legislation, to accompany lower federal income tax rates. It is unclear when or if any of the foregoing or similar proposals will be considered and enacted as part of future tax reform legislation and, if enacted, how soon any such changes can become effective. The passage of any legislation or any other similar changes in U.S. federal and state income tax laws could eliminate or postpone certain tax deductions that are currently available with respect to oil and natural gas exploration and development, and any such change could negatively affect our financial condition and results of operations. Additionally, legislation could be enacted that increases the taxes states impose on oil and natural gas extraction.
We are subject to various governmental regulations that may cause us to incur substantial costs.
From time to time, in varying degrees, political developments and federal and state laws and regulations affect our operations. In particular, price controls, taxes and other laws relating to the oil and natural gas industry, changes in these laws and changes in administrative regulations have affected, and in the future could affect, oil and natural gas production, operations and economics. We cannot predict how agencies or courts will interpret existing laws and regulations or the effect these adoptions and interpretations may have on our business or financial condition.
Our business is subject to laws and regulations promulgated by federal, state and local authorities relating to the exploration for, and the development, production and marketing of, oil and natural gas, as well as safety matters. Legal requirements are frequently changed and subject to interpretation, and we are unable to predict the ultimate cost of compliance with these requirements or their effect on our operations. We may be required to make significant expenditures to comply with governmental laws and regulations. The discharge of oil, natural gas or other pollutants into the air, soil or water may give rise to significant liabilities on our part to the government and third parties and may require us to incur substantial costs of remediation.
Our sales of oil and natural gas may expose us to extensive regulation.
The FERC, the CFTC and the FTC hold statutory authority to monitor certain segments of the physical energy commodities markets relevant to our business. These agencies have imposed broad regulations prohibiting fraud and manipulation of such markets. With regard to our physical sales, if any, of oil, NGLs and natural gas, we are required to observe the market-related regulations enforced by these agencies.
Our operations are subject to stringent environmental laws and regulations that may expose us to significant costs and liabilities.
Our oil and natural gas exploration, production and development operations are subject to numerous stringent and complex federal, regional, state, local and other laws and regulations relating to pollution and protection of the environment, including those governing the release or disposal of materials into the environment. Potentially applicable environmental laws include, but are not limited to, (i) the CERCLA, and analogous state laws, which regulate the cleanup of hazardous substances that may have been released at properties currently or formerly owned or operated by us or locations to which we have sent wastes for disposal; (ii) the CWA and analogous state laws, which regulate the discharge of waste and storm waters from some of our facilities; (iii) the CAA, and analogous state laws, which impose obligations related to air emissions, including emissions limits and permitting requirements; (iv) the RCRA, and analogous state laws, which impose requirements for the handling and disposal of solid or hazardous waste; (v) the Endangered Species Act, and analogous state laws, which seek to ensure that activities do not jeopardize endangered animal, fish and plant species; (vi) the National Environmental Policy Act, which requires federal agencies to study potential environmental impacts of a proposed federal action before it is approved; and (vii) OSHA, and analogous state laws, which establish certain employer responsibilities, including maintenance of a workplace free of recognized hazards. These laws and regulations may, among other things, require the acquisition of a permit before drilling commences, require the maintenance of bonding requirements in order to drill or operate wells, restrict the types, quantities and concentration of substances that can be released into the environment in connection with drilling, completion and production activities, limit or prohibit construction or drilling activities on certain lands lying within wilderness, wetlands, and other protected areas, impose specific standards for the plugging and abandoning of wells and impose substantial liabilities for pollution resulting from our operations. We may be required to make significant capital and operating expenditures to prevent releases, manage wastewater discharges and control air emissions or perform remedial or other corrective actions at our wells and properties to comply with the requirements of these environmental laws and regulations or the terms or conditions of permits issued pursuant to such requirements. Failure to comply with these laws and regulations may result in the assessment of administrative, civil and criminal penalties, loss of our leases, incurrence of investigatory or remedial obligations and the issuance of orders limiting or prohibiting some or all of our operations.
There is inherent risk of incurring significant environmental costs and liabilities in the performance of our operations due to our handling of petroleum hydrocarbons and other hazardous substances and wastes, as a result of air emissions and wastewater discharges related to our operations, and because of historical operations and waste disposal practices at our leased, operated and owned properties. Spills or other releases of regulated substances, including such spills and releases that occur in the future, could expose us to material losses, expenditures and liabilities or remedial obligations under applicable environmental laws and regulations. Under certain of such laws and regulations, we could be subject to strict, joint and several liability for the removal or remediation of previously released materials or property contamination, regardless of whether we were responsible for the release or contamination and even if our operations met previous standards in the industry or complied with existing applicable laws at the time they were conducted.
Changes in environmental laws and regulations occur frequently, and any changes that result in more stringent or costly well drilling, construction, completion or water management activities, air emissions control or waste handling, storage, transport, disposal or cleanup requirements could require us to make significant expenditures to attain and maintain compliance and may otherwise have a material adverse effect on our industry in general in addition to our own results of operations, competitive position or financial condition. For example, in May 2016, the EPA issued final rules that require the reduction of volatile organic compound and methane emissions from additional new, modified or reconstructed oil and gas emissions sources (the “2016 NSPS Rules”). In May 2017, the EPA announced a 90-day stay of portions of the 2016 NSPS Rules, which stay was vacated in part by the U.S. Court of Appeals for the D.C. Circuit on July 3, 2017. The EPA also proposed a two year stay of portions of the 2016 NSPS Rules on June 12, 2017, for which the public notice and comment period closed on August 9, 2017. Compliance with these or other new regulations could, among other things, require installation of new emission controls on some of our equipment, result in longer permitting timelines, and significantly increase our expenditures and operating costs, which could adversely impact our business.
Climate change legislation or regulations restricting emissions of GHGs could result in increased operating costs and reduced demand for the oil and natural gas we produce.
Based on the EPA’s determination that emissions of GHGs present an endangerment to public health and the environment because emissions of such gases are contributing to warming of the earth’s atmosphere and other climatic changes, the EPA has adopted regulations under existing provisions of the CAA to address GHG emissions. For example, the EPA has adopted regulations that establish preconstruction and operating permit reviews for GHG emissions from certain large stationary sources that already are potential major sources of certain principal, or criteria, pollutant emissions. Facilities required to obtain permits for their GHG emissions also will be required to meet “best available control technology” standards that typically will be established by the states. In addition, the EPA has adopted regulations requiring the monitoring and annual reporting of GHGs from certain sources in the United States, including, among others, certain onshore and offshore oil and natural gas production facilities. Most recently, in May 2016, the EPA finalized rules to reduce methane emissions from new, modified or reconstructed sources in the oil and natural gas sector. In November 2016, the BLM issued final rules to reduce methane emissions from venting, flaring, and leaks during oil and gas operations on public lands. However, the Department of the Interior (the parent department of BLM) announced in October 2017 that it would delay the effectiveness of certain aspects of the BLM methane rules intended to go into effect in January 2018.
In addition, the U.S. Congress has from time to time considered adopting legislation to reduce emissions of GHGs and a number of states have already taken legal measures to reduce emissions of GHGs primarily through the planned development of GHG emission inventories and/or regional GHG cap and trade programs. On an international level, the United States was one of almost 200 nations that is party to the Paris Agreement adopted in December 2015 to reduce global GHG emissions. On June 1, 2017, President Trump announced that the United States would withdraw from the Paris Agreement and that it would potentially seek to renegotiate the Agreement on more favorable terms. Although President Trump has the authority to unilaterally withdraw the United States from the Paris Agreement, per the terms of the Agreement, such a withdrawal may not be made until three years from the effective date of the Agreement, which is November 4, 2019, and any such withdrawal only becomes effective one year after the notice of withdrawal is provided. Despite the planned withdrawal of the United States, various state and local governments have publicly committed to continue to further the goals of the Paris Agreement. The adoption of legislation or regulatory programs to reduce GHG emissions could require us to incur increased operating costs and could also increase the cost of consuming, and thereby reduce demand for, the oil and natural gas we produce. Consequently, legislation and regulatory programs to reduce emissions of GHGs could have an adverse effect on our business, financial condition and results of operations. Moreover, incentives to conserve energy or use alternative energy sources as a means of addressing climate change could reduce demand for oil, NGLs and natural gas. Finally, it should be noted that some scientists have concluded that increasing concentrations of GHGs in the Earth’s atmosphere may produce climate changes that have significant physical effects, such as increased frequency and severity of storms, droughts and floods and other climatic events. If any such effects were to occur, they could have an adverse effect on our financial condition and results of operations.
Federal and state legislative and regulatory initiatives relating to hydraulic fracturing as well as governmental reviews of such activities could result in increased costs, additional operating restrictions or delays, which could adversely affect our production.
Hydraulic fracturing is an important and common practice that is used to stimulate production of natural gas and/or oil from dense subsurface rock formations. The process involves the injection of water, sand and chemicals under pressure into the formation to fracture the surrounding rock and stimulate production. We routinely utilize hydraulic fracturing techniques in many of our oil and natural gas drilling and completion programs. The process is typically regulated by state oil and natural gas commissions or similar state agencies, but several federal agencies have asserted regulatory authority over certain aspects of the process. For example, the EPA has published permitting guidance in February 2014 addressing the use
of diesel fuel in fracturing operations; issued final CAA regulations governing performance standards, including standards for the capture of air emissions released during hydraulic fracturing; issued in June 2016 final effluent limit guidelines that saltwater from shale resource extraction operations must meet before discharging to publicly owned wastewater treatment plants; and issued in May 2014 a prepublication of its Advance Notice of Proposed Rulemaking regarding Toxic Substances Control Act reporting of the chemical substances and mixtures used in hydraulic fracturing. The air emissions standards issued in May 2016 and the effluent limit guidelines issued in June 2016 are potentially subject to repeal by the new Congress under the CRA. Also, the BLM published a final rule containing disclosure requirements and other mandates for hydraulic fracturing on federal and Indian lands in March of 2015. The U.S. District Court of Wyoming struck down this rule in June 2016, but the decision was appealed to the U.S. Tenth Circuit Court of Appeals. Although the Trump Administration has indicated it would like to repeal this rule, the Tenth Circuit dismissed this appeal and the underlying case on September 21, 2017 and it is unclear whether the rule remains in effect. Compliance with these requirements could increase our costs of development and production, which costs may be significant.
From time to time, Congress has considered legislation to provide for federal regulation of hydraulic fracturing and to require disclosure of the chemicals used in the fracturing process. Moreover, some states, including Texas and Oklahoma, where we operate, have adopted, and other states are considering adopting, regulations that could impose more stringent permitting, disclosure and well construction requirements on hydraulic fracturing operations under certain circumstances, or that prohibit hydraulic fracturing altogether. In addition, local government may seek to adopt ordinances within their jurisdictions regulating the time, place and manner of drilling activities in general or hydraulic fracturing activities in particular. If new or more stringent federal, state or local legal restrictions relating to the hydraulic fracturing process are adopted in areas where we operate, we could incur potentially significant added costs to comply with such requirements, and experience delays or curtailment in the pursuit of exploration, development, or production activities. Restrictions on hydraulic fracturing could also reduce the amount of oil and natural gas that we are ultimately able to produce from our reserves. In addition, there are also certain governmental reviews underway that focus on environmental aspects of hydraulic fracturing practices which could spur initiatives to further regulate hydraulic fracturing under the SDWA or otherwise.
Our operations are dependent on our rights and ability to receive or renew the required permits and other approvals from governmental authorities and other third parties.
Performance of our operations requires that we obtain and maintain numerous environmental, water access and land use permits and other approvals authorizing our regulated activities. We must renew these permits and approvals periodically, and the permits and approvals may be modified or revoked by the issuing agency. A decision by a governmental authority or other third party to deny, delay or restrictively condition the issuance of a new or renewed permit or other approval, or to revoke or substantially modify an existing permit or other approval, could have a material adverse effect on our ability to initiate or continue operations at the affected location or facility. Expansion of our existing operations is also predicated on securing the necessary environmental, water access or land use permits and other approvals, which we may not receive in a timely manner or at all.
The adoption of financial reform legislation by Congress could have an adverse effect on our ability to use derivative instruments to reduce the effect of commodity price, interest rate and other risks associated with our business.
In July 2010, new comprehensive financial reform legislation, known as the Dodd-Frank Wall Street Reform and Consumer Protection Act (the “DF Act”), was enacted that establishes federal oversight and regulation of the over-the-counter derivatives market and entities, such as us, that participate in that market. The DF Act requires the CFTC, the SEC and other regulators to promulgate rules and regulations implementing the DF Act. Although the CFTC has finalized certain regulations, others remain to be finalized or implemented and it is not possible at this time to predict when this will be accomplished.
In one of its rulemaking proceedings still pending under the DF Act, the CFTC issued on December 5, 2016, re-proposed rules imposing position limits for certain futures and option contracts in various commodities (including oil and gas) and for swaps that are their economic equivalents. Under the proposed rules on position limits, certain types of hedging transactions are exempt from these limits on the size of positions that may be held, provided that such hedging transactions satisfy the CFTC’s requirements for certain enumerated “bona fide hedging” transactions or positions. As these new position limit rules are not yet final, the impact of those provisions on us is uncertain at this time.
The CFTC has designated certain interest rate swaps and credit default swaps for mandatory clearing and the associated rules also will require us in connection with covered derivatives activities to comply with clearing and trade-execution requirements or take steps to qualify for an exemption to such requirements. Although the Company expects to qualify for the end-user exception from the mandatory clearing requirements for swaps entered to hedge its commercial risks, the application of the mandatory clearing and trade execution requirements to other market participants, such as swap dealers, may change the cost and availability of the swaps that the Company uses for hedging. In addition, for uncleared swaps, the CFTC or federal banking regulators may require end-users to enter into credit support documentation and/or post initial and variation margins. Posting of collateral could impact liquidity and reduce cash available to the Company for its needs. The DF Act may also require the counterparties to our derivative instruments to spin off some of their derivatives activities to separate entities, which may not be as creditworthy as the current counterparties.
The full impact of the DF Act and related regulatory requirements upon the Company’s business will not be known until the regulations are implemented and the market for derivatives contracts has adjusted. The DF Act and regulations could significantly increase the cost of derivative contracts, materially alter the terms of derivative contracts, reduce the availability of derivatives to protect against risks we encounter, reduce our ability to monetize or restructure our existing derivative contracts, increase our exposure to less creditworthy counterparties or reduce liquidity. If we reduce our use of derivatives as a result of the DF Act and regulations, our results of operations may become more volatile and our cash flows may be less predictable, which could adversely affect our ability to plan for and fund capital expenditures.
Finally, the DF Act was intended, in part, to reduce the volatility of oil and natural gas prices, which some legislators attributed to speculative trading in derivatives and commodity instruments related to oil and natural gas. Our revenues could therefore be adversely affected if a consequence of the DF Act is to lower commodity prices. Any of these consequences could have a material adverse effect on our consolidated financial position, results of operations and cash flows.
Our business could be adversely affected by security threats, including cyber-security threats, and related disruptions.
We rely heavily on our information systems, and the availability and integrity of these systems are essential for us to conduct our business and operations. As a producer of oil, NGLs and natural gas, we face various security threats, including cyber-security threats, to gain unauthorized access to our sensitive information or to render our information or systems unusable, and threats to the security of our facilities and infrastructure or third-party facilities and infrastructure, such as gathering and processing and other facilities, refineries and pipelines. The potential for such security threats subjects our operations to increased risks that could have a material adverse effect on our business, financial condition, results of operations and cash flows.
Our implementation of various procedures and controls to monitor and mitigate such security threats and to increase security for our information, systems, facilities and infrastructure may result in increased costs. Moreover, there can be no assurance that such procedures and controls will be sufficient to prevent security breaches from occurring. If any of these security breaches were to occur, they could lead to losses of, or damage to, sensitive information or facilities, infrastructure and systems essential to our business and operations, as well as data corruption, communication interruptions or other disruptions to our operations, which, in turn, could have a material adverse effect on our business, financial position, results of operations and cash flows.
Risks Relating to our Common Stock
The exercise of all or any number of outstanding warrants or the issuance of stock-based awards may dilute your holding of shares of our common stock.
Pursuant to the Plan, we issued 24,994,867 shares of common stock in the reorganized Company, 4,411,765 warrants with a strike price of $24.00 per common share of the reorganized equity and 2,213,789 warrants with a strike price of $46.00 per common share of the reorganized equity. Additionally, a total of 3,513,950 shares of common stock of the reorganized equity are reserved for issuance under the 2016 LTIP as equity-based awards to employees, directors and certain other persons. The exercise of equity awards, including any stock options that we may grant in the future, and warrants, and the sale of shares of our common stock underlying any such options or the warrants, could have an adverse effect on the market for our common stock, including the price that an investor could obtain for their shares. Investors may experience dilution in the net tangible book value of their investment upon the exercise of the warrants and any stock options that may be granted or issued pursuant to the 2016 LTIP in the future.
The price and trading volume of our common stock may fluctuate significantly.
The market price of our common stock may be highly volatile and could be subject to wide fluctuations. In addition, the trading volume of our common stock may fluctuate and cause significant price variations to occur. Volatility in the market price of our common stock may prevent you from being able to sell your shares at or above the price at which you were granted your shares of common stock or above the price you paid to acquire your shares of common stock. The market price for our common stock could fluctuate significantly for various reasons, including:
· our new capital structure as a result of the transactions contemplated by the Plan;
· our limited trading history subsequent to our emergence from the Chapter 11 Cases;
· our limited trading volume;
· the concentration of holdings of our common stock;
· the lack of comparable historical financial information due to our adoption of fresh start accounting;
· actual or anticipated variations in our operating results and cash flow;
· the nature and content of our earnings releases, announcements or events that impact our products, customers, competitors or markets;
· business conditions in our markets and the general state of the securities markets and the market for energy-related stocks, as well as fluctuations in the prices of oil, NGLs and natural gas and general economic and market conditions.
· additions or departures of key members of management;
· any increased indebtedness we may incur in the future;
· announcements by us or our competitors of significant contracts, acquisitions, dispositions, strategic partnerships, joint ventures or capital commitments; and
· changes or proposed changes in laws or regulations affecting the oil and gas industry or enforcement of these laws and regulations, or announcements relating to these matters.
Future sales of our common stock in the public market or the issuance of securities senior to our common stock, or the perception that these sales may occur, could adversely affect the trading price of our common stock and our ability to raise funds in stock offerings.
A large percentage of our shares of common stock are held by a relatively small number of investors. Further, we entered into a registration rights agreement with certain of those investors pursuant to which we filed a registration statement with the SEC to facilitate potential future sales of such shares by them. Sales by us or our stockholders of a substantial number of shares of our common stock in the public markets, or even the perception that these sales might occur, could cause the market price of our common stock to decline or could impair our ability to raise capital through a future sale of, or pay for acquisitions using, our equity securities.
We are currently authorized to issue 250,000,000 shares of common stock and 50,000,000 shares of preferred stock. As of December 31, 2017, we had outstanding approximately 25,173,346 shares of common stock and warrants to purchase an aggregate of 6,625,554 shares of our common stock. We have also reserved an additional 3,513,950 units for granting under the 2016 LTIP of which 2,129,011 units remain available at December 31, 2017. The potential issuance of such additional shares of common stock may create downward pressure on the trading price of our common stock.
We may issue common stock or other equity securities senior to our common stock in the future for a number of reasons, including to finance acquisitions, to adjust our leverage ratio, and to satisfy our obligations upon the exercise of warrants and options, or for other reasons. We cannot predict the effect, if any, that future sales or issuances of shares of our common stock or other equity securities, or the availability of shares of common stock or such other equity securities for future sale or issuance, will have on the trading price of our common stock.
There may be circumstances in which the interests of our significant stockholders could be in conflict with the interests of our other stockholders.
As of December 31, 2017, funds advised by Avenue Capital Group, Centerbridge Partners and Fir Tree Partners held approximately 13.9%, 9.8% and 25.4%, respectively, of our post-reorganization common stock. Circumstances may arise in which these stockholders may have an interest in pursuing or preventing acquisitions, divestitures or other transactions, including the issuance of additional shares or debt, that, in their judgment, could enhance their investment in us or another company in which they invest. Such transactions might adversely affect us or other holders of our common stock. In addition, our significant concentration of share ownership may adversely affect the trading price of our common shares because investors may perceive disadvantages in owning shares in companies with significant stockholders.
ITEM 1B. UNRESOLVED STAFF COMMENTS
As of December 31, 2017, we did not have any unresolved comments from the SEC staff that were received 180 or more days prior to year-end.
Information regarding our properties is included in “Item 1. Business” above.
The information set forth under “Litigation” in “—Note 16. Commitments and Contingencies” in the Notes to Consolidated Financial Statements set forth in Part IV, Item 15 of this Annual Report on Form 10-K is incorporated herein by reference.
ITEM 4. MINE SAFETY DISCLOSURES
None.
ITEM 5. MARKET FOR THE REGISTRANT’S COMMON EQUITY, RELATED STOCKHOLDER MATTERS AND ISSUER PURCHASES OF EQUITY SECURITIES
Market for Registrant’s Common Equity
Prior to October 24, 2016, our common stock traded on the OTC Pink market under the symbol “MPOY”. On October 24, 2016, our new common stock began trading on the NYSE MKT under the symbol “MPO”. On May 4, 2017, our common stock began trading on the NYSE under the symbol “MPO”. The following table sets forth the quarterly high and low sales prices per share as reported by the NYSE and NYSE MKT during 2017 and 2016:
|
|
|
Price Range |
| ||||
|
|
|
High |
|
Low |
| ||
|
Quarter Ended 2017: |
|
|
|
|
| ||
|
December 31, 2017 |
|
$ |
17.55 |
|
$ |
14.04 |
|
|
September 30, 2017 |
|
$ |
16.94 |
|
$ |
12.42 |
|
|
June 30, 2017 |
|
$ |
19.75 |
|
$ |
10.87 |
|
|
March 31, 2017 |
|
$ |
22.54 |
|
$ |
17.64 |
|
|
Quarter Ended 2016: |
|
|
|
|
| ||
|
December 31, 2016 (from October 24) |
|
$ |
25.00 |
|
$ |
17.01 |
|
On March 8, 2018, the last sales price of our common stock, as reported on the NYSE, was $13.56 per share.
As of March 8, 2018, there were 25,153,381 shares of common stock outstanding.
Holders
The number of shareholders of record of our common stock was thirteen on March 8, 2018.
Dividends
We have not paid any cash dividends since inception. In addition, our Exit Facility limits and restricts our ability to pay dividends on our capital stock. We currently intend to retain all future earnings for the development and growth of our business, and we do not currently anticipate declaring or paying any cash dividends to holders of our common stock in the foreseeable future.
Equity Compensation Plan Information
Information regarding securities authorized for issuance under our equity compensation plan is set forth in our definitive proxy statement for our 2017 Annual Meeting of Stockholders, which is incorporated by reference here.
Stock Performance Graph
The following performance graph and related information shall not be deemed “soliciting material” or to be filed with the SEC, such information shall not be incorporated by reference into any future filing under the Securities Act or Exchange Act, except to the extent that we specifically request that such information be treated as “soliciting material” or specifically incorporate such information by reference into such a filing.
The performance graph below shows the cumulative total return to our common stockholders from the date our common stock began trading on the NYSE MKT through December 31, 2017, as compared to the cumulative total returns on the Standard and Poor’s 500 Index (“S&P 500”) and the Standard and Poor’s 500 Oil & Gas Exploration & Production Index (“S&P O&G E&P”) for the same period of time. The comparison was prepared on the following assumptions:
· $100 was invested in our common stock at its opening price of $19.00 per share and invested in the S&P 500 and the S&P O&G E&P on October 24, 2016 at the closing price on such date; and
· Dividends, if any, are reinvested.
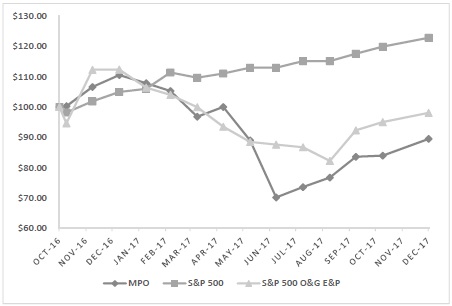
Issuer Purchases of Equity Securities
The following table provides information regarding the purchase of our common stock made during the fourth quarter of 2017. Shares purchased represent the net settlement on vesting of restricted stock necessary to satisfy the minimum statutory withholding requirements.
|
Period |
|
Total Number of Shares |
|
Average Price Paid |
| |
|
October 1, 2017 – October 31, 2017 |
|
65,869 |
|
$ |
14.75 |
|
|
November 1, 2017 – November 30, 2017 |
|
345 |
|
$ |
15.95 |
|
|
December 1, 2017 – December 31, 2017 |
|
— |
|
$ |
— |
|
|
Total |
|
66,214 |
|
$ |
14.76 |
|
ITEM 6. SELECTED FINANCIAL DATA
The following tables set forth our selected financial data over the five-year period ended December 31, 2017. The information in the table below has been derived from our consolidated financial statements and the notes thereto included in Item 15 in this Annual Report on Form 10-K. This information should be read in conjunction with, and is qualified in its entirety by, the more detailed information our consolidated financial statements set forth in Item 15 of this Annual Report on Form 10-K.
Presented below is our historical financial data for the periods indicated. The historical financial data for the year ended December 31, 2017, the Successor Period, the Predecessor Period and the year ended December 31, 2015 are derived from our audited consolidated financial statements and the notes thereto included in Item 15 in this Annual Report on Form 10-K. The historical financial data for the years ended December 31, 2014 and 2013 are derived from our audited financial statements not included in this Annual Report on Form 10-K. As discussed in “—Note 3. Fresh Start Accounting” in the Notes to the Consolidated Financial Statements set forth in Part IV, Item 15 of this Annual Report on Form 10-K, upon our emergence on the Effective Date, we adopted fresh start accounting as required by US GAAP. We applied fresh start accounting as of October 21, 2016. As a result of the application of fresh start accounting, as well as the effects of the implementation of the Plan, our consolidated financial statements on or after the Effective Date are not comparable with our consolidated financial statements prior to that date.
|
|
|
Successor |
|
|
Predecessor |
| |||||||||||||||
|
(in thousands, except per share |
|
|
|
For the Period |
|
|
For the Period |
|
December 31, |
| |||||||||||
|
amounts) |
|
December 31, 2017 |
|
31, 2016 |
|
|
20, 2016 |
|
2015(1) |
|
2014(2) |
|
2013(3) |
| |||||||
|
Income Statement Data |
|
|
|
|
|
|
|
|
|
|
|
|
|
| |||||||
|
Total revenues |
|
$ |
228,753 |
|
$ |
48,525 |
|
|
$ |
193,228 |
|
$ |
365,145 |
|
$ |
794,183 |
|
$ |
469,506 |
| |
|
Net income (loss) |
|
(85,077 |
) |
9,930 |
|
|
1,323,079 |
|
(1,797,195 |
) |
116,929 |
|
(343,985 |
) | |||||||
|
Net income (loss) attributable to common shareholders(4) |
|
(85,077 |
) |
9,650 |
|
|
1,306,557 |
|
(1,798,143 |
) |
67,271 |
|
(359,574 |
) | |||||||
|
Net income (loss) per share attributable to common shareholders |
|
|
|
|
|
|
|
|
|
|
|
|
|
| |||||||
|
Basic and diluted |
|
$ |
(3.39 |
) |
$ |
0.39 |
|
|
$ |
122.74 |
|
$ |
(232.74 |
) |
$ |
10.13 |
|
$ |
(54.68 |
) | |
|
Other Financial Data |
|
|
|
|
|
|
|
|
|
|
|
|
|
| |||||||
|
Net cash provided by operating activities |
|
$ |
119,602 |
|
$ |
23,644 |
|
|
$ |
61,997 |
|
$ |
213,383 |
|
$ |
351,544 |
|
$ |
237,588 |
| |
|
Net cash used in investing activities |
|
(125,964 |
) |
(23,346 |
) |
|
(133,307 |
) |
(294,556 |
) |
(404,264 |
) |
(1,204,332 |
) | |||||||
|
Net cash (used in) provided by financing activities |
|
(1,978 |
) |
— |
|
|
66,757 |
|
150,709 |
|
31,114 |
|
981,029 |
| |||||||
|
Adjusted EBITDA(5) |
|
125,166 |
|
26,766 |
|
|
93,465 |
|
315,340 |
|
474,098 |
|
330,759 |
| |||||||
(1) The year ended December 31, 2015 reflects the Dequincy Divestiture, which closed on April 21, 2015. For a discussion of significant divestitures, see “—Note 8. Acquisition and Divestitures of Oil and Gas Properties” in the Notes to the Consolidated Financial Statements set forth in Part IV, Item 15 of this Annual Report on Form 10-K.
(2) The year ended December 31, 2014 reflects the sale of all ownership interest in developed and undeveloped acreage in the Pine Prairie field area of Evangeline Parish, Louisiana (“Pine Prairie Disposition”), which closed on May 1, 2014.
(3) The year ended December 31, 2013 reflects the Anadarko Basin Acquisition, which closed on May 31, 2013.
(4) The years ended December 31, 2015, 2014 and 2013 include the effect of an undeclared Series A Preferred Stock dividend of $0.9 million, $10.4 million and $15.6 million, respectively, which was paid in shares upon the mandatory conversion of the Preferred Stock into common shares on September 30, 2015. See “—Note 11. Preferred Stock” in the Notes to the Consolidated Financial Statements set forth in Part IV, Item 15 of this Annual Report on Form 10-K.
(5) Adjusted EBITDA is a non-GAAP financial measure. For a definition of Adjusted EBITDA and a reconciliation of Adjusted EBITDA to our net income (loss) and net cash provided by operating activities, see “Non GAAP Financial Measures and Reconciliations” below.
Presented below is our historical financial data as of the dates indicated. The historical balance sheet data as of December 31, 2017 and December 31, 2016 are derived from our audited consolidated financial statements and the notes thereto included in Item 15 in this Annual Report on Form 10-K. The historical balance sheet data as of December 31, 2015, 2014 and 2013 are derived from our audited financial statements not included in this Annual Report on Form 10-K.
|
|
|
Successor |
|
|
Predecessor |
| |||||||||||
|
|
|
December 31, |
|
December 31, |
|
|
December 31, |
| |||||||||
|
(in thousands, except per share amounts) |
|
2017 |
|
2016 |
|
|
2015(1) |
|
2014(2) |
|
2013(3) |
| |||||
|
Balance Sheet Data |
|
|
|
|
|
|
|
|
|
|
|
| |||||
|
Cash and cash equivalents |
|
$ |
68,498 |
|
$ |
76,838 |
|
|
$ |
81,093 |
|
$ |
11,557 |
|
$ |
33,163 |
|
|
Net property and equipment |
|
574,462 |
|
631,595 |
|
|
523,869 |
|
2,123,116 |
|
2,094,894 |
| |||||
|
Total assets |
|
688,128 |
|
760,939 |
|
|
679,167 |
|
2,447,175 |
|
2,308,637 |
| |||||
|
Total debt, including debt classified as current (4) |
|
128,059 |
|
128,059 |
|
|
1,890,944 |
|
1,706,532 |
|
1,667,680 |
| |||||
|
Stockholders’ equity (deficit) |
|
485,587 |
|
561,814 |
|
|
(1,326,066 |
) |
465,862 |
|
339,999 |
| |||||
|
Weighted average number of common shares outstanding |
|
25,119 |
|
25,009 |
|
|
7,726 |
|
6,644 |
|
6,576 |
| |||||
(1) The year ended December 31, 2015 reflects the Dequincy Divestiture, which closed on April 21, 2015. For a discussion of significant divestitures, see “—Note 8. Acquisition and Divestitures of Oil and Gas Properties” in the Notes to the Consolidated Financial Statements set forth in Part IV, Item 15 of this Annual Report on Form 10-K.
(2) The year ended December 31, 2014 reflects the Pine Prairie Disposition, which closed on May 1, 2014.
(3) The year ended December 31, 2013 reflects the Anadarko Basin Acquisition, which closed on May 31, 2013.
(4) At December 31, 2015, we were in default under our RBL. As a result, our debt was classified as current as of December 31, 2015.
Non-GAAP Financial Measures and Reconciliations
Adjusted EBITDA is a supplemental non-GAAP financial measure that is used by management and external users of our consolidated financial statements, such as industry analysts, investors, lenders and rating agencies.
We define Adjusted EBITDA as earnings before interest income and expense, income taxes, depreciation, depletion and amortization, property impairments, asset retirement obligation accretion, unrealized derivative gains and losses, reorganization items and non-cash share-based compensation expense. Adjusted EBITDA is not a measure of net income or cash flows as determined by United States generally accepted accounting principles, or US GAAP. We believe that Adjusted EBITDA is useful because it allows us to more effectively evaluate our operating performance and compare the results of our operations from period to period without regard to our financing methods or capital structure. We exclude items such as property and inventory impairments, asset retirement obligation accretion, unrealized derivative gains and losses and non-cash share-based compensation expense, net of amounts capitalized, from net income in arriving at Adjusted EBITDA because these amounts can vary substantially from company to company within our industry depending upon accounting methods and book values of assets, capital structures and the method by which the assets were acquired. Adjusted EBITDA should not be considered as an alternative to, or more meaningful than, net income or cash flows from operating activities as determined in accordance with US GAAP or as an indicator of our operating performance or liquidity. Certain items excluded from Adjusted EBITDA are significant components in understanding and assessing a company’s financial performance, such as a company’s cost of capital and tax structure, as well as the historic costs of depreciable assets, none of which are components of Adjusted EBITDA. Our computations of Adjusted EBITDA may not be comparable to other similarly titled measures of other companies. We believe that Adjusted EBITDA is a widely followed measure of operating performance and may also be used by investors to measure our ability to meet debt service requirements.
The following table presents a reconciliation of the non-GAAP financial measure of Adjusted EBITDA to the US GAAP measure of net income (loss) and net cash provided by operating activities, respectively (in thousands).
|
|
|
Successor |
|
|
Predecessor |
| ||||||||||||||
|
|
|
December 31, |
|
For the Period |
|
|
For the Period |
|
December 31, |
| ||||||||||
|
|
|
2017 |
|
December 31, 2016 |
|
|
20, 2016 |
|
2015 |
|
2014 |
|
2013 |
| ||||||
|
Adjusted EBITDA reconciliation to net income (loss): |
|
|
|
|
|
|
|
|
|
|
|
|
|
| ||||||
|
Net income (loss) |
|
$ |
(85,077 |
) |
$ |
9,930 |
|
|
$ |
1,323,079 |
|
$ |
(1,797,195 |
) |
$ |
116,929 |
|
$ |
(343,985 |
) |
|
Depreciation, depletion and amortization |
|
65,832 |
|
12,974 |
|
|
62,302 |
|
198,643 |
|
269,935 |
|
250,396 |
| ||||||
|
Impairment in carrying value of oil and gas properties |
|
125,300 |
|
— |
|
|
232,108 |
|
1,625,776 |
|
86,471 |
|
453,310 |
| ||||||
|
Loss on sale/impairment of field equipment inventory |
|
— |
|
— |
|
|
— |
|
1,997 |
|
4,056 |
|
615 |
| ||||||
|
(Gains) losses on commodity derivative contracts—net |
|
(3,659 |
) |
— |
|
|
— |
|
(40,960 |
) |
(139,189 |
) |
44,284 |
| ||||||
|
Net cash received (paid) for commodity derivative contracts not designated as hedging instruments |
|
6,891 |
|
— |
|
|
— |
|
167,669 |
|
(18,332 |
) |
(17,585 |
) | ||||||
|
Reorganization items, net |
|
— |
|
— |
|
|
(1,594,281 |
) |
— |
|
— |
|
— |
| ||||||
|
Income tax expense (benefit) |
|
— |
|
— |
|
|
— |
|
(9,641 |
) |
6,395 |
|
(146,529 |
) | ||||||
|
Interest income |
|
(9 |
) |
— |
|
|
(81 |
) |
(115 |
) |
(39 |
) |
(33 |
) | ||||||
|
Interest expense—net of amounts capitalized (Predecessor Period excludes interest expense of $89.5 million on senior and secured notes) |
|
5,592 |
|
743 |
|
|
66,360 |
|
163,148 |
|
137,548 |
|
83,138 |
| ||||||
|
Asset retirement obligation accretion |
|
1,100 |
|
210 |
|
|
1,414 |
|
1,610 |
|
1,706 |
|
1,435 |
| ||||||
|
Share-based compensation, net of amounts capitalized |
|
9,196 |
|
2,909 |
|
|
2,564 |
|
4,408 |
|
8,618 |
|
5,713 |
| ||||||
|
Adjusted EBITDA |
|
$ |
125,166 |
|
$ |
26,766 |
|
|
$ |
93,465 |
|
$ |
315,340 |
|
$ |
474,098 |
|
$ |
330,759 |
|
ITEM 7. MANAGEMENT’S DISCUSSION AND ANALYSIS OF FINANCIAL CONDITION AND RESULTS OF OPERATIONS
The following discussion and analysis of our financial condition and results of operations should be read in conjunction with our consolidated financial statements and related notes appearing elsewhere in this Annual Report on Form 10-K. The following discussion contains “forward-looking statements” that are based on management’s current expectations, estimates and projections about our business and operations, and involves risks and uncertainties. Our actual results may differ materially from those currently anticipated and expressed in such forward-looking statements as a result of a number of factors, including those we discuss under “Risk Factors,” “Cautionary Note Regarding Forward-Looking Statements” and elsewhere in this Annual Report on Form 10-K.
Overview
We are an independent exploration and production company focused on the application of modern drilling and completion techniques in oil and liquids-rich basins in the onshore United States. Our operations are primarily focused on exploration and production activities in the Mississippian Lime and Anadarko Basin.
As of December 31, 2017, our properties consisted of approximately 190,400 net acres of leasehold, with 843 gross productive wells, 71% of which we operate, and in which we held an average working interest of approximately 86%. As of December 31, 2017, our estimated net proved reserves were 108,947 MMBoe, of which 52% was oil or NGLs and 59% was proved developed. During the year ended December 31, 2017, our properties had aggregate net daily production of approximately 22,148 Boe/d.
As discussed in “—Note 3. Fresh Start Accounting” in the Notes to the Consolidated Financial Statements set forth in Part IV, Item 15 of this Annual Report on Form 10-K, upon our emergence from the Chapter 11 cases on October 21, 2016, we adopted fresh start accounting as required by US GAAP. As a result of the application of fresh start accounting, as well as the effects of the implementation of the Plan, our consolidated financial statements on or after October 21, 2016, are not comparable with our consolidated financial statements prior to that date. References to “Successor Period” relate to the financial position and results of operations for the period October 21, 2016 through December 31, 2016 and references to “Predecessor Period” refer to the financial position and results of operations of the Company from January 1, 2016 through October 20, 2016.
Recent Developments
Appointment of David J. Sambrooks as President and Chief Executive Officer
On November 1, 2017, David J. Sambrooks was appointed to the position of President and Chief Executive Officer (“CEO”), effective immediately upon the resignation of the former President and CEO, Frederic Brace. The Board of Directors of the Company (the “Board”) also approved an increase in the number of directors, from seven directors to eight directors, and Mr. Sambrooks was appointed to the Board, effective concurrently with his appointment as President and CEO.
Emergence from Chapter 11 Bankruptcy
On the Petition Date, we filed voluntary petitions for reorganization under Chapter 11 of the Bankruptcy Code in the United States Bankruptcy Court. Our Chapter 11 cases were jointly administered under the case styled In re Midstates Petroleum Company, Inc., et al., Case No. 16-32237.
On September 28, 2016, the Bankruptcy Court entered the Confirmation Order, which approved and confirmed the Plan. On the Effective Date, we satisfied the conditions to effectiveness set forth in the Confirmation Order and in the Plan, and the Plan therefore became effective in accordance with its terms and we emerged from bankruptcy. Further information is set forth in “—Note 2. Emergence from Voluntary Reorganization under Chapter 11 Proceedings” in the Notes to the Consolidated Financial Statements set forth in Part IV, Item 15 of this Annual Report on Form 10-K.
Fresh Start Accounting
Upon our emergence on the Effective Date, we adopted fresh start accounting as required by US GAAP. We qualified for fresh start accounting because (i) the holders of existing voting shares of the pre-emergence debtor-in-possession received less than 50% of the voting shares of the post-emergence successor entity and (ii) the reorganization value of our assets immediately prior to confirmation was less than the post-petition liabilities and allowed claims.
As discussed in “—Note 3. Fresh Start Accounting” in the Notes to the Consolidated Financial Statements set forth in Part IV, Item 15 of this Annual Report on Form 10-K, we applied fresh start accounting as of October 21, 2016. Adopting fresh start accounting results in a new reporting entity for financial reporting purposes with no beginning retained earnings or deficit. The cancellation of all existing shares outstanding on the Effective Date and issuance of new shares in the reorganized Company caused a related change of control under US GAAP.
As a result of the application of fresh start accounting, as well as the effects of the implementation of the Plan, our consolidated financial statements on or after October 21, 2016, are not comparable with our consolidated financial statements prior to that date.
Stock Listing
Our common stock was listed on the NYSE on April 25, 2012 through February 3, 2016 under the symbol “MPO”. On February 3, 2016, our stock was delisted by the NYSE and began trading on the OTC Pink market under the symbol “MPOY” through October 21, 2016. On October 21, 2016, in connection with our emergence from Chapter 11, our existing common shares traded under the symbol MPOY were cancelled. On October 24, 2016, our newly issued shares of common stock in the reorganized equity were listed and began trading on the NYSE MKT under the symbol “MPO”. On May 4, 2017, our common stock began trading on the NYSE under the symbol “MPO”.
Results of Operations
Oil, NGLs and Natural Gas Revenue
Oil, NGLs and Natural Gas
Our revenues are derived from the sale of oil and natural gas production, as well as the sale of NGLs that are extracted from our high Btu content natural gas. Our oil and natural gas revenues do not include the effects of derivatives and may vary significantly from period to period as a result of changes in production volumes or commodity prices. Prices for oil, NGLs and natural gas fluctuate widely and affect:
· the amount of our cash flows available for capital expenditures;
· our ability to borrow and raise additional capital;
· the quantity of oil, NGLs and natural gas we can economically produce; and
· our revenues and profitability.
Average market prices for oil and NGLs have historically experienced significant volatility. For a description of factors that may impact future commodity prices, please read “Risk Factors—Risks Related to the Oil and Natural Gas Industry and our Business”.
Beginning January 1, 2018, Financial Accounting Standards Board (“FASB”) Accounting Standards Update (“ASU”) 2014-09 becomes effective for us. See “Critical Accounting Policies and Estimates” below as well as “Recent Accounting Pronouncements” in “—Note 4. Summary of Significant Accounting Policies” in the Notes to the Consolidated Financial Statements set forth in Part IV, Item 15 of this Annual Report on Form 10-K, for year ended December 31, 2017 for further discussion of anticipated updates to our revenues under FASB Accounting Standards Codification (“ASC”) 606.
The following table sets forth information regarding our oil, NGLs and natural gas revenues for the year ended December 31, 2017, the Successor Period, the Predecessor Period and the year ended December 31, 2015 (in thousands):
|
|
|
Crude Oil |
|
Natural Gas |
|
NGLs |
|
Total |
| ||||
|
Revenues for the year ended December 31, 2015 |
|
$ |
217,636 |
|
$ |
66,823 |
|
$ |
38,249 |
|
$ |
322,708 |
|
|
Changes due to volumes |
|
(69,486 |
) |
(10,827 |
) |
(7,708 |
) |
(88,021 |
) | ||||
|
Changes due to price |
|
(35,522 |
) |
(7,678 |
) |
(3,068 |
) |
(46,268 |
) | ||||
|
Revenues for the Predecessor Period (October 20, 2016) |
|
$ |
112,628 |
|
$ |
48,318 |
|
$ |
27,473 |
|
$ |
188,419 |
|
|
Changes due to volumes |
|
(113,672 |
) |
(50,479 |
) |
(29,379 |
) |
(193,530 |
) | ||||
|
Changes due to price |
|
26,593 |
|
15,796 |
|
10,297 |
|
52,686 |
| ||||
|
Revenues for the Successor Period (December 31, 2016) |
|
$ |
25,549 |
|
$ |
13,635 |
|
$ |
8,391 |
|
$ |
47,575 |
|
|
Changes due to volumes |
|
90,180 |
|
46,666 |
|
34,395 |
|
171,241 |
| ||||
|
Changes due to price |
|
1,354 |
|
(593 |
) |
1,326 |
|
2,087 |
| ||||
|
Revenues for the Successor Period (December 31, 2017) |
|
$ |
117,083 |
|
$ |
59,708 |
|
$ |
44,112 |
|
$ |
220,903 |
|
Oil, NGLs and Natural Gas Pricing
The following table sets forth information regarding average realized sales prices for the year ended December 31, 2017, the Successor Period, the Predecessor Period and the year ended December 31, 2015:
|
|
|
Successor |
|
|
Predecessor |
| ||||||||
|
|
|
|
|
For the Period |
|
|
For the Period |
|
|
| ||||
|
|
|
Year Ended |
|
Through |
|
|
Through |
|
Year Ended |
| ||||
|
AVERAGE SALES PRICES: |
|
|
|
|
|
|
|
|
|
| ||||
|
Oil, without realized derivatives (per Bbl) |
|
$ |
49.45 |
|
$ |
46.96 |
|
|
$ |
37.99 |
|
$ |
45.40 |
|
|
Oil, with realized derivatives (per Bbl) |
|
$ |
50.92 |
|
$ |
46.96 |
|
|
$ |
37.99 |
|
$ |
74.74 |
|
|
Natural gas liquids, without realized derivatives (per Bbl) |
|
$ |
22.64 |
|
$ |
19.55 |
|
|
$ |
14.22 |
|
$ |
15.46 |
|
|
Natural gas liquids, with realized derivatives (per Bbl) |
|
$ |
22.64 |
|
$ |
19.55 |
|
|
$ |
14.22 |
|
$ |
15.46 |
|
|
Natural gas, without realized derivatives (per Mcf) |
|
$ |
2.64 |
|
$ |
2.76 |
|
|
$ |
2.08 |
|
$ |
2.35 |
|
|
Natural gas, with realized derivatives (per Mcf) |
|
$ |
2.79 |
|
$ |
2.76 |
|
|
$ |
2.08 |
|
$ |
3.30 |
|
Crude Oil Prices
The majority of our crude oil production is sold at prevailing market prices with an adjustment for transportation and quality. The market pricing for oil fluctuates in response to many factors that are outside of our control such as supply and demand fluctuations, pipeline and refinery outages, weather patterns and global events and economics.
We currently utilize fixed price swaps, collars and three-way collars to manage the impact of changing crude prices. We did not have any open commodity derivative contract positions at December 31, 2016 or 2015.
As of December 31, 2017, we had the following oil derivative contracts that extend through December 2019, which are summarized as follows:
|
|
|
NYMEX WTI |
| ||||||||||||||||||||||
|
|
|
Fixed Swaps |
|
Collars |
|
Three-Way Collars |
| ||||||||||||||||||
|
|
|
Hedge |
|
Weighted |
|
Hedge |
|
Weighted |
|
Weighted |
|
Hedge |
|
Weighted |
|
Weighted |
|
Weighted |
| ||||||
|
Quarter Ended: |
|
|
|
|
|
|
|
|
|
|
|
|
|
|
|
|
|
|
| ||||||
|
December 31, 2017(1)(2) |
|
276,000 |
|
$ |
53.58 |
|
46,000 |
|
$ |
60.00 |
|
$ |
50.00 |
|
115,000 |
|
$ |
62.80 |
|
$ |
50.00 |
|
$ |
40.00 |
|
|
March 31, 2018(1) |
|
99,000 |
|
$ |
50.61 |
|
— |
|
$ |
— |
|
$ |
— |
|
225,000 |
|
$ |
62.14 |
|
$ |
50.00 |
|
$ |
40.00 |
|
|
June 30, 2018(1) |
|
145,600 |
|
$ |
51.22 |
|
— |
|
$ |
— |
|
$ |
— |
|
182,000 |
|
$ |
60.65 |
|
$ |
50.00 |
|
$ |
40.00 |
|
|
September 30, 2018(1) |
|
92,000 |
|
$ |
50.38 |
|
— |
|
$ |
— |
|
$ |
— |
|
184,000 |
|
$ |
59.93 |
|
$ |
50.00 |
|
$ |
40.00 |
|
|
December 31, 2018(1) |
|
92,000 |
|
$ |
50.38 |
|
— |
|
$ |
— |
|
$ |
— |
|
46,000 |
|
$ |
56.70 |
|
$ |
50.00 |
|
$ |
40.00 |
|
|
March 31, 2019(1) |
|
— |
|
$ |
— |
|
— |
|
$ |
— |
|
$ |
— |
|
45,000 |
|
$ |
56.20 |
|
$ |
50.00 |
|
$ |
40.00 |
|
|
June 30, 2019(1) |
|
— |
|
$ |
— |
|
— |
|
$ |
— |
|
$ |
— |
|
45,500 |
|
$ |
56.20 |
|
$ |
50.00 |
|
$ |
40.00 |
|
|
September 30, 2019(1) |
|
— |
|
$ |
— |
|
— |
|
$ |
— |
|
$ |
— |
|
46,000 |
|
$ |
56.20 |
|
$ |
50.00 |
|
$ |
40.00 |
|
|
December 31, 2019(1) |
|
— |
|
$ |
— |
|
— |
|
$ |
— |
|
$ |
— |
|
46,000 |
|
$ |
56.20 |
|
$ |
50.00 |
|
$ |
40.00 |
|
(1) Positions shown represent open commodity derivative contract positions as of December 31, 2017.
(2) During the second quarter of 2017, the Company entered into long call oil trades to offset its three-way collar short calls for the second half of 2017.
NGLs Prices
Our NGL production is sold under contracts with prices at market indices less the costs for transportation and fractionation. The market price of our NGL production, which primarily consists of ethane, propane, butane, iso-butane and natural gasoline, can be impacted by local market conditions, such as fractionation availability, and business conditions of the end users of such NGL products, such as chemical companies, plastic manufacturers and propane dealers.
We do not currently utilize any derivatives to manage the impact of changing NGLs pricing due to limited forward price information and minimal trading volume of such instruments.
Natural Gas Prices
Natural gas prices are subject to variances based on local supply and demand conditions as well as rapidly evolving market conditions. Our current natural gas sales contracts are based upon index pricing that varies widely as a result of many factors, such as geography and supply and demand. Our natural gas is sold on a monthly weighted average sales price utilizing a combination of first of month index and daily index pricing for a given period.
We currently utilize fixed price swaps, collars and three-way collars to manage the impact of changing natural gas prices. We did not have any open commodity derivative contract positions at December 31, 2016 or 2015.
As of December 31, 2017, we had the following natural gas derivative contracts that extend through March 2019, which are summarized as follows:
|
|
|
NYMEX HENRY HUB |
| ||||||||||||||||||||||
|
|
|
Fixed Swaps |
|
Collars |
|
Three-Way Collars |
| ||||||||||||||||||
|
|
|
Hedge |
|
Weighted |
|
Hedge |
|
Weighted |
|
Weighted |
|
Hedge Position |
|
Weighted |
|
Weighted |
|
Weighted |
| ||||||
|
Quarter Ended: |
|
|
|
|
|
|
|
|
|
|
|
|
|
|
|
|
|
|
| ||||||
|
December 31, 2017(1) |
|
1,907,000 |
|
$ |
3.43 |
|
551,000 |
|
$ |
3.84 |
|
$ |
3.23 |
|
610,000 |
|
$ |
4.30 |
|
$ |
3.25 |
|
$ |
2.50 |
|
|
March 31, 2018(1)(2) |
|
1,350,000 |
|
$ |
3.47 |
|
— |
|
$ |
— |
|
$ |
— |
|
1,530,000 |
|
$ |
4.38 |
|
$ |
3.25 |
|
$ |
2.50 |
|
|
June 30, 2018(1) |
|
— |
|
$ |
— |
|
— |
|
$ |
— |
|
$ |
— |
|
1,365,000 |
|
$ |
3.40 |
|
$ |
3.00 |
|
$ |
2.50 |
|
|
September 30, 2018(1) |
|
— |
|
$ |
— |
|
— |
|
$ |
— |
|
$ |
— |
|
1,380,000 |
|
$ |
3.40 |
|
$ |
3.00 |
|
$ |
2.50 |
|
|
December 31, 2018(1) |
|
— |
|
$ |
— |
|
— |
|
$ |
— |
|
$ |
— |
|
1,380,000 |
|
$ |
3.40 |
|
$ |
3.00 |
|
$ |
2.50 |
|
|
March 31, 2019(1) |
|
— |
|
$ |
— |
|
— |
|
$ |
— |
|
$ |
— |
|
1,350,000 |
|
$ |
3.40 |
|
$ |
3.00 |
|
$ |
2.50 |
|
(1) Positions shown represent open commodity derivative contract positions as of December 31, 2017.
(2) During the second quarter, the Company entered into natural gas three-way collars with long call ceilings in order to offset its Q1 2018 natural gas fixed swaps.
Oil Revenues
Year Ended December 31, 2017
For the year ended December 31, 2017, our oil sales revenues were $117.1 million. Our oil revenue was comprised of $92.9 million from our Mississippian Lime assets and $24.2 million from our Anadarko Basin assets.
Successor Period
For the Successor Period, our oil sales revenues were $25.5 million. Our oil revenue was comprised of $20.5 million from our Mississippian Lime assets and $5.0 million from our Anadarko Basin assets.
Predecessor Period
For the Predecessor Period, our oil sales revenues were $112.6 million. Our oil revenue was comprised of $91.5 million from our Mississippian Lime assets and $21.1 million from our Anadarko Basin assets.
Year Ended December 31, 2015
For the year ended December 31, 2015, our oil sales revenues were $217.6 million. Our oil revenue was comprised of $169.2 million from our Mississippian Lime assets, $43.7 million was from our Anadarko Basin assets and $4.7 million was from our Gulf Coast assets.
NGLs Revenues
Year Ended December 31, 2017
For the year ended December 31, 2017, our NGLs sales revenues were $44.1 million. Our NGLs revenue was comprised of $35.3 million from our Mississippian Lime assets and $8.8 million from our Anadarko Basin assets.
Successor Period
For the Successor Period, our NGLs sales revenues were $8.4 million. Our NGLs revenue was comprised of $6.8 million from our Mississippian Lime assets and $1.6 million from our Anadarko Basin assets.
Predecessor Period
For the Predecessor Period, our NGLs sales revenues were $27.5 million. Our NGLs revenue was comprised of $22.5 million from our Mississippian Lime assets and $5.0 million from our Anadarko Basin assets.
Year Ended December 31, 2015
For the year ended December 31, 2015, our NGLs sales revenues were $38.2 million. Our NGLs revenue was comprised of $30.7 million from our Mississippian Lime assets, $7.0 million from our Anadarko Basin assets and $0.5 million from our Gulf Coast assets.
Natural Gas Revenues
Year Ended December 31, 2017
For the year ended December 31, 2017, our natural gas sales revenues were $59.7 million. Our natural gas revenue was comprised of $51.6 million from our Mississippian Lime assets and $8.1 million from our Anadarko Basin assets.
Successor Period
For the Successor Period, our natural gas sales revenues were $13.6 million. Our natural gas revenue was comprised of $11.8 million from our Mississippian Lime assets and $1.8 million from our Anadarko Basin assets.
Predecessor Period
For the Predecessor Period, our natural gas sales revenues were $48.3 million. Our natural gas revenue was comprised of $42.6 million from our Mississippian Lime assets and $5.7 million from our Anadarko Basin assets.
Year Ended December 31, 2015
For the year ended December 31, 2015, our natural gas sales revenue were $66.8 million. Our natural gas revenue was comprised of $56.5 million from our Mississippian Lime assets, $10.1 million from our Anadarko Basin assets and $0.2 million from our Gulf Coast assets.
Gains/Losses on Commodity Derivative Contracts—Net
We currently utilize commodity derivatives to reduce our exposure to fluctuations in the prices of oil and natural gas. Accordingly, our income statements reflect (i) the recognition of unrealized gains and losses associated with our open derivative contracts as commodity prices change and commodity derivatives contracts expire or new ones are entered into, and (ii) our realized gains or losses on the settlement of these commodity derivative contracts. Unrealized gains and losses result from changes in market valuations of derivatives as future commodity price expectations change compared to the contract prices on the derivatives. If the expected future commodity prices increase compared to the contract prices on the derivatives, unrealized losses are recognized. Conversely, if the expected future commodity prices decrease compared to the contract prices on the derivatives, unrealized gains are recognized. Since we have elected not to apply hedge accounting to our derivatives, we reflect the unrealized and realized gains and losses in our current income statement periods based on the mark-to-market (“MTM”) value at the end of each month. Cash flows associated with derivative financial instruments are reflected in cash flows from operations in our consolidated statement of cash flows. We had open derivative contracts at December 31, 2017 that extend through December 2019. We did not have any open commodity derivative contract positions at December 31, 2016 or 2015.
The following table sets forth the components of our realized gain on commodity derivative contracts, net in our consolidated statements of operations (in thousands):
|
|
|
Successor |
|
|
Predecessor |
| ||||||||||||||
|
|
|
|
|
|
|
For the Period |
|
|
For the Period |
|
|
|
|
| ||||||
|
|
|
Year Ended |
|
Through |
|
|
Through |
|
Year Ended |
| ||||||||||
|
|
|
Realized |
|
Average |
|
Realized |
|
|
Realized |
|
Realized |
|
Average |
| ||||||
|
Oil commodity contracts |
|
$ |
3,490 |
|
$ |
50.92 |
|
$ |
— |
|
|
$ |
— |
|
$ |
140,656 |
|
$ |
74.74 |
|
|
Natural gas liquids commodity contracts |
|
— |
|
— |
|
— |
|
|
— |
|
— |
|
— |
| ||||||
|
Natural gas commodity contracts |
|
3,401 |
|
2.79 |
|
— |
|
|
— |
|
27,013 |
|
3.30 |
| ||||||
|
Total cash receipts |
|
$ |
6,891 |
|
|
|
$ |
— |
|
|
$ |
— |
|
$ |
167,669 |
|
|
| ||
Cash settlements, as presented in the table above, represent realized gains/losses related to our derivative instruments. In addition to cash settlements, we also recognize fair value changes on our derivative instruments in each reporting period. The changes in fair value result from new positions and settlements that may occur during each reporting period, as well as the relationships between contract prices and the associated forward curves.
Other Revenues
Year Ended December 31, 2017
For the year ended December 31, 2017, other revenues were $4.2 million. Other revenue for the year ended December 31, 2017 was primarily comprised of fees charged to outside working interest owners for salt water disposal as well as payments received from a customer for the extraction of iodine from our salt water.
Successor Period
For the Successor period, other revenues were $1.0 million. Other revenue for the Successor Period was primarily comprised of fees charged to outside working interest owners for salt water disposal.
Predecessor Period
For the Predecessor Period, other revenues were $4.8 million. Other revenue for the Predecessor Period was primarily comprised of fees charged to outside working interest owners for salt water disposal.
Year Ended December 31, 2015
For the year ended December 31, 2015, other revenues were $1.5 million. Other revenue was primarily comprised of payments received from a third party for the extraction of iodine from our produced salt water.
Oil, NGLs and Natural Gas Production
|
|
|
Successor |
|
|
Predecessor |
| ||||
|
|
|
|
|
For the Period |
|
|
For the Period |
|
|
|
|
|
|
Year Ended |
|
Through |
|
|
January 1, 2016 |
|
Year Ended |
|
|
PRODUCTION DATA: |
|
|
|
|
|
|
|
|
|
|
|
Oil (Bbls/d) |
|
|
|
|
|
|
|
|
|
|
|
Mississippian Lime |
|
5,108 |
|
6,048 |
|
|
8,156 |
|
10,194 |
|
|
Anadarko Basin |
|
1,379 |
|
1,508 |
|
|
1,927 |
|
2,680 |
|
|
Gulf Coast |
|
— |
|
— |
|
|
— |
|
260 |
|
|
Natural gas liquids (Bbls/d) |
|
|
|
|
|
|
|
|
|
|
|
Mississippian Lime |
|
4,273 |
|
4,843 |
|
|
5,326 |
|
5,307 |
|
|
Anadarko Basin |
|
1,066 |
|
1,118 |
|
|
1,247 |
|
1,388 |
|
|
Gulf Coast |
|
— |
|
— |
|
|
— |
|
81 |
|
|
Natural gas (Mcf/d) |
|
|
|
|
|
|
|
|
|
|
|
Mississippian Lime |
|
52,797 |
|
58,816 |
|
|
68,107 |
|
64,688 |
|
|
Anadarko Basin |
|
9,135 |
|
9,903 |
|
|
10,856 |
|
12,921 |
|
|
Gulf Coast |
|
— |
|
— |
|
|
— |
|
208 |
|
|
Combined (Boe/d) |
|
|
|
|
|
|
|
|
|
|
|
Mississippian Lime |
|
18,181 |
|
20,694 |
|
|
24,833 |
|
26,282 |
|
|
Anadarko Basin |
|
3,967 |
|
4,277 |
|
|
4,983 |
|
6,222 |
|
|
Gulf Coast |
|
— |
|
— |
|
|
— |
|
376 |
|
Crude Oil Production
Year Ended December 31, 2017
For the year ended December 31, 2017, our oil volumes sold averaged 6,487 Bbls/d, comprised of 5,108 Bbls/d from our Mississippian Lime assets and 1,379 Bbls/d from our Anadarko Basin assets.
Successor Period
For the Successor Period, our oil volumes sold averaged 7,556 Bbls/d, comprised of 6,048 Bbls/d from our Mississippian Lime assets and 1,508 Bbls/d from our Anadarko Basin assets.
Predecessor Period
For the Predecessor Period, our oil volumes sold averaged 10,083 Bbls/d, comprised of 8,156 Bbls/d from our Mississippian Lime assets and 1,927 Bbls/d from our Anadarko Basin assets.
Year Ended December 31, 2015
For the year ended December 31, 2015, our oil volumes sold averaged 13,134 Bbls/d, comprised of 10,194 Bbls/d from our Mississippian Lime assets, 2,680 Bbls/d from our Anadarko Basin assets and 260 Bbls/d from our Gulf Coast assets.
NGLs Production
Year Ended December 31, 2017
For the year ended December 31, 2017, our NGLs volumes sold averaged 5,339 Bbls/d, comprised of 4,273 Bbls/d from our Mississippian Lime assets and 1,066 Bbls/d from our Anadarko Basin assets.
Successor Period
For the Successor Period, our NGLs volumes sold averaged 5,961 Bbls/d, comprised of 4,843 Bbls/d from our Mississippian Lime assets and 1,118 Bbls/d from our Anadarko Basin assets.
Predecessor Period
For the Predecessor Period, our NGLs volumes sold averaged 6,573 Bbls/d, comprised of 5,326 Bbls/d from our Mississippian Lime assets and 1,247 Bbls/d from our Anadarko Basin assets.
Year Ended December 31, 2015
For the year ended December 31, 2015, our NGLs volumes sold averaged 6,776 Bbls/d, comprised of 5,307 Bbls/d from our Mississippian Lime assets, 1,388 Bbls/d from our Anadarko Basin assets and 81 Bbls/d from our Gulf Coast assets.
Natural Gas Production
Year Ended December 31, 2017
For the year ended December 31, 2017, our natural gas volumes sold averaged 61,932 Mcf/d, comprised of 52,797 Mcf/d from our Mississippian Lime assets and 9,135 Mcf/d from our Anadarko Basin assets.
Successor Period
For the Successor Period, our natural gas volumes sold averaged 68,719 Mcf/d, comprised of 58,816 Mcf/d from our Mississippian Lime assets and 9,903 Mcf/d from our Anadarko Basin assets.
Predecessor Period
For the Predecessor Period, our natural gas volumes sold averaged 78,963 Mcf/d, comprised of 68,107 Mcf/d from our Mississippian Lime operations and 10,856 Mcf/d from our Anadarko Basin assets.
Year Ended December 31, 2015
For the year ended December 31, 2015, our natural gas volumes sold averaged 77,817 Mcf/d, comprised of 64,688 Mcf/d from our Mississippian Lime assets, 12,921 Mcf/d from our Anadarko Basin assets and 208 Mcf/d from our Gulf Coast assets.
Expenses
|
|
|
Successor |
|
|
Predecessor |
|
|
Successor |
|
|
Predecessor |
| ||||||||||||||||
|
|
|
|
|
For the |
|
|
For the |
|
|
|
|
|
|
For the |
|
|
For the |
|
|
| ||||||||
|
|
|
Year Ended |
|
Through |
|
|
Through |
|
Year Ended |
|
|
Year Ended |
|
Through |
|
|
Through |
|
Year Ended |
| ||||||||
|
|
|
(in thousands) |
|
|
(in thousands) |
|
|
(per Boe) |
|
|
(per Boe) |
| ||||||||||||||||
|
EXPENSES: |
|
|
|
|
|
|
|
|
|
|
|
|
|
|
|
|
|
|
|
| ||||||||
|
Lease operating and workover |
|
$ |
63,287 |
|
$ |
15,324 |
|
|
$ |
52,803 |
|
$ |
81,473 |
|
|
$ |
7.83 |
|
$ |
8.52 |
|
|
$ |
6.02 |
|
$ |
6.79 |
|
|
Gathering and transportation |
|
14,507 |
|
3,194 |
|
|
14,362 |
|
15,546 |
|
|
1.79 |
|
1.78 |
|
|
1.64 |
|
1.30 |
| ||||||||
|
Severance and other taxes |
|
8,869 |
|
1,286 |
|
|
5,210 |
|
8,605 |
|
|
1.10 |
|
0.72 |
|
|
0.59 |
|
0.72 |
| ||||||||
|
Asset retirement accretion |
|
1,100 |
|
210 |
|
|
1,414 |
|
1,610 |
|
|
0.14 |
|
0.12 |
|
|
0.16 |
|
0.13 |
| ||||||||
|
Depreciation, depletion, and amortization |
|
65,832 |
|
12,974 |
|
|
62,302 |
|
198,643 |
|
|
8.14 |
|
7.22 |
|
|
7.11 |
|
16.55 |
| ||||||||
|
Impairment of oil and gas properties |
|
125,300 |
|
— |
|
|
232,108 |
|
1,625,776 |
|
|
15.50 |
|
— |
|
|
26.48 |
|
135.47 |
| ||||||||
|
General and administrative |
|
29,352 |
|
4,864 |
|
|
22,362 |
|
38,703 |
|
|
3.63 |
|
2.71 |
|
|
2.55 |
|
3.22 |
| ||||||||
|
Acquisition and transaction costs |
|
— |
|
— |
|
|
— |
|
330 |
|
|
— |
|
— |
|
|
— |
|
0.03 |
| ||||||||
|
Debt restructuring costs and advisory fees |
|
— |
|
— |
|
|
7,590 |
|
36,141 |
|
|
— |
|
— |
|
|
0.87 |
|
3.01 |
| ||||||||
|
Other |
|
— |
|
— |
|
|
— |
|
2,121 |
|
|
— |
|
— |
|
|
— |
|
0.18 |
| ||||||||
|
Total expenses |
|
$ |
308,247 |
|
$ |
37,852 |
|
|
$ |
398,151 |
|
$ |
2,008,948 |
|
|
$ |
38.13 |
|
$ |
21.07 |
|
|
$ |
45.42 |
|
$ |
167.40 |
|
Lease Operating and Workover
Lease operating expenses represent costs incurred to bring oil and gas out of the ground and to the market, together with the daily costs incurred to maintain our producing properties. Such costs also include natural gas treating expenses and the handling and disposal of produced water as well as maintenance and repair expenses related to our oil and gas properties. Lease operating expenses include both a portion of costs that are fixed in nature, such as infrastructure costs and compressor rental costs, as well as variable costs resulting from additional wells and production, such as chemicals and electricity. As production increases, our average lease operating expense per barrel of oil equivalent is typically reduced because fixed costs do not increase proportionately with production. Workover expense includes major remedial operations on a completed well to restore, maintain, or improve a well’s production and is closely correlated to the levels of workover activity. Because workover projects are pursued on an as needed basis and are not regularly scheduled, workover expense is not necessarily comparable from period to period.
Year Ended December 31, 2017
For the year ended December 31, 2017, our lease operating and workover expenses were $63.3 million at a cost of $7.83 per Boe. As discussed in “— Note 16. Commitments and Contingencies” in the Notes to the Consolidated Financial Statements set forth in Part IV, Item 15 of this Annual Report on Form 10-K, lease operating and workover expenses were positively impacted during the year ended December 31, 2017 by a $1.9 million reimbursement received for an insurance claim.
Successor Period
For the Successor Period, our lease operating and workover expenses were $15.3 million at a cost of $8.52 per Boe. Lease operating and workover expenses for the Successor Period were impacted by weather disruptions, which lowered production and increased costs during the period.
Predecessor Period
For the Predecessor Period, our lease operating and workover expenses were $52.8 million at a cost of $6.02 per Boe.
Year Ended December 31, 2015
For the year ended December 31, 2015, our lease operating and workover expenses were $81.5 million at a cost of $6.79 per Boe.
Gathering and Transportation
Gathering and transportation costs are incurred for the movement of natural gas to the contractual delivery point. For the year ended December 31, 2017, the Successor Period, the Predecessor Period and the year ended December 31, 2015, these costs relate to the amended gas transportation, gathering and processing contract which commenced during the third quarter of 2013 in our Mississippian Lime assets.
Year Ended December 31, 2017
For the year ended December 31, 2017, our gathering and transportation expenses were $14.5 million at a cost of $1.79 per Boe.
Successor Period
For the Successor Period, our gathering and transportation expenses were $3.2 million at a cost of $1.78 per Boe.
Predecessor Period
For the Predecessor Period, our gathering and transportation expenses were $14.4 million at a cost of $1.64 per Boe.
Year Ended December 31, 2015
For the year ended December 31, 2015, our gathering and transportation expenses were $15.5 million at a cost of $1.30 per Boe.
Severance and Other Taxes
Severance taxes are paid on produced oil and gas based on a percentage of revenues from products sold at market prices or at fixed rates established by federal, state, or local taxing authorities. We attempt to take full advantage of all credits and exemptions in our various taxing jurisdictions. In general, the severance taxes we pay correlate to the changes in oil and gas revenues. Ad valorem taxes are property taxes assessed based on the assessed value of property and are also included in this expense category.
|
|
|
Successor |
|
|
Predecessor |
| ||||||||
|
|
|
|
|
For the Period |
|
|
For the Period |
|
|
| ||||
|
|
|
Year Ended |
|
Through |
|
|
Through |
|
Year Ended |
| ||||
|
|
|
(in thousands) |
|
|
(in thousands) |
| ||||||||
|
Total oil, natural gas, and natural gas liquids sales |
|
$ |
220,903 |
|
$ |
47,575 |
|
|
$ |
188,419 |
|
$ |
322,708 |
|
|
Severance taxes |
|
8,314 |
|
1,093 |
|
|
4,058 |
|
5,754 |
| ||||
|
Ad valorem and other taxes |
|
555 |
|
193 |
|
|
1,152 |
|
2,851 |
| ||||
|
Severance and other taxes |
|
$ |
8,869 |
|
$ |
1,286 |
|
|
$ |
5,210 |
|
$ |
8,605 |
|
|
Severance taxes as a percentage of sales |
|
3.8 |
% |
2.3 |
% |
|
2.2 |
% |
1.8 |
% | ||||
|
Severance and other taxes as a percentage of sales |
|
4.0 |
% |
2.7 |
% |
|
2.8 |
% |
2.7 |
% | ||||
Year Ended December 31, 2017
For the year ended December 31, 2017, our severance and other tax expenses were $8.9 million or 4.0% of sales. Severance tax was $8.3 million or 3.8% of sales during the year ended December 31, 2017.
Prior to July 1, 2017, the State of Oklahoma had a crude oil and natural gas production tax incentive for wells that commenced production between July 1, 2011 and July 1, 2015, which allowed for a 1.0% production tax rate for the first 48 months of production. In May 2017, new legislation was signed into law in Oklahoma that increased the incentive tax rate from 1.0% to 4.0% on those wells. After the 48-month incentive period ends, the tax rate on such wells increases to 7.0%. The new 4.0% tax rate on these wells went into effect on July 1, 2017 and caused our average production tax rate to trend higher in 2017 compared to 2016 and 2015. Additionally, in November 2017, new legislation was signed into law in Oklahoma that increased the 4% tax rate to 7% effective with December 2017 production.
Successor Period
For the Successor Period, our severance and other tax expenses were $1.3 million or 2.7% of sales. Severance tax was $1.1 million or 2.3% of sales during the Successor Period.
Predecessor Period
For the Predecessor Period, our severance and other tax expenses were $5.2 million or 2.8% of sales. Severance tax was $4.1 million or 2.2% of sales during the Predecessor Period.
Year Ended December 31, 2015
For the year ended December 31, 2015, our severance and other tax expenses were $8.6 million or 2.7% of sales. Severance tax was $5.8 million or 1.8% of sales during the year ended December 31, 2015.
Depreciation, Depletion and Amortization (“DD&A”)
Under the full cost accounting method, we capitalize costs within a cost center and systematically expense those costs on a unit of production basis based on proved oil and natural gas reserve quantities. We calculate depletion on the following types of costs: (i) all capitalized costs, other than the cost of investments in unproved properties which remain to be evaluated, less accumulated amortization; (ii) estimated future expenditures to be incurred in developing proved reserves; and (iii) estimated dismantlement and abandonment costs, net of any associated salvage value.
Year Ended December 31, 2017
For the year ended December 31, 2017, our DD&A expenses were $65.8 million at a cost of $8.14 per Boe.
Successor Period
For the Successor Period, our DD&A expenses were $13.0 million at a cost of $7.22 per Boe.
Predecessor Period
For the Predecessor Period, our DD&A expenses were $62.3 million at a cost of $7.11 per Boe.
Year Ended December 31, 2015
For the year ended December 31, 2015, our DD&A expenses were $198.6 million at a cost of $16.55 per Boe.
Impairment of Oil and Gas Properties
Under the full cost method of accounting, we are required to perform a full-cost ceiling test on a quarterly basis. The test establishes a limit (ceiling) on the book value of oil and gas properties. The capitalized costs of proved oil and gas properties, net of accumulated DD&A and the related deferred income taxes, may not exceed this “ceiling.” The ceiling limitation is equal to the sum of: (i) the present value of estimated future net revenues from the projected production of proved oil and gas reserves, excluding future cash outflows associated with settling asset retirement obligations accrued on the balance sheet, calculated using the average oil and natural gas sales price we received as of the first trading day of each month over the preceding twelve months (such average price is held constant throughout the life of the properties) and a discount factor of 10%; (ii) the cost of unproved and unevaluated properties excluded from the costs being amortized; (iii) the lower of cost or estimated fair value of unproved properties included in the costs being amortized; and (iv) related income tax effects. If capitalized costs exceed this ceiling, the excess is charged to impairment expense in the accompanying consolidated statements of operations.
Year Ended December 31, 2017
On November 1, 2017, David Sambrooks was appointed President and Chief Executive Officer of the Company. Upon David’s appointment, we began a strategic review of all areas of operations. This review was completed during the fourth quarter of 2017 and our strategy was refined to add further focus to optimizing free cash flows and keeping leverage to a minimum. As a result, in December of 2017 we decreased our current drilling activity from two drilling rigs to one drilling rig. Further, the five-year development plan was revised from a two-rig program to a one rig program. This change in strategy (reduced 5-year drilling activity) led to a reduction in our undeveloped proved inventory under SEC guidelines from 274 locations at year end 2016 to 139 locations at year end 2017. In addition, at year end 2017 our proved undeveloped type curve was revised downward by our third-party reserves engineering firm and capital costs assumptions were revised upward,
both as a result of recent drilling results. The revised type curve still generates attractive capital returns of 30.6% IRR at year-end 2017 SEC pricing, and 39.1% IRR at December 31, 2017 strip pricing. As a result of our focus on optimizing free cash flow, keeping leverage to a minimum and optimizing drilling returns, all proved undeveloped reserves included in the December 31, 2017 reserve report are focused on infill drilling in the Carmen and Dacoma areas. All undeveloped locations not able to be drilled utilizing our anticipated five-year development schedule were excluded from the December 31, 2017 reserve report but continue to meet the definition of a proved undeveloped location from an engineering standpoint. We recorded an impairment of oil and gas properties of $125.3 million primarily as a result of the exclusion of proved undeveloped reserves not associated with infill drilling in the Carmen and Dacoma areas from our December 31, 2017 reserve report.
Successor Period
For the Successor Period, we did not incur any impairments of oil and gas properties.
Predecessor Period
For the Predecessor Period, our impairment of oil and gas properties was $232.1 million. The impairment expense recognized in the Predecessor Period was primarily due to a decrease in the PV-10 value of our proven oil and natural gas reserves as a result of low commodity prices, which are a significant input into the calculation of the discounted future cash flows associated with our proved oil and gas reserves.
Year Ended December 31, 2015
For the year ended December 31, 2015, our impairment of oil and gas properties was $1.6 billion. The impairment expense for the 2015 period was primarily due to a decrease in the PV-10 value of our proven oil and natural gas reserves as a result of low commodity prices, which are a significant input into the calculation of the discounted future cash flows associated with our proved oil and gas reserves.
General and Administrative (“G&A”)
G&A expense consists of, among other items, overhead, including payroll and benefits for our corporate staff, non-cash charges for share-based compensation, costs of maintaining our headquarters, franchise taxes, audit and other professional fees, legal compliance, reporting expenses, investor relations, director and officer liability insurance costs, and director compensation.
Year Ended December 31, 2017
For the year ended December 31, 2017, our G&A expense was $29.4 million at a cost of $3.63 per Boe. G&A for the year ended December 31, 2017 was impacted by non-cash stock based compensation expense for awards issued pursuant to the 2016 LTIP of $9.2 million, as well as trailing costs incurred related to the Chapter 11 Cases of $3.0 million.
Successor Period
For the Successor Period, our G&A expense was $4.9 million at a cost of $2.71 per Boe. G&A for the Successor Period includes primarily professional fees and credits to previously incurred professional fees for reorganization type items, resulting in credit of $1.1 million, and non-cash stock-based compensation expense for awards issued pursuant to the 2016 LTIP of $2.9 million.
Predecessor Period
For the Predecessor Period, our G&A expense was $22.4 million at a cost of $2.55 per Boe. G&A for the Predecessor Period includes $1.3 million of accelerated expense associated with cancelled stock compensation awards and $1.6 million in severance costs.
Year Ended December 31, 2015
For the year ended December 31, 2015, our G&A expense was $38.7 million at a cost of $3.22 per Boe. G&A for the year ended December 31, 2015 includes a $4.8 million reduction in employee costs due to reduced headcount in 2015, a $4.4 million increase in capitalized overhead costs and cost recoveries, as well as $0.6 million less in professional fees.
Acquisition and Transaction Costs
Acquisition and transaction costs are costs we have incurred as a result of acquisitions or as a result of asset disposition transactions and include finders’ fees, advisory, legal, accounting, valuation and other professional and consulting fees and other acquisition or disposition related general and administrative costs. Acquisition and transaction related costs are expensed as incurred and as services are received.
Year Ended December 31, 2017
For the year ended December 31, 2017, we did not incur any acquisition and transaction costs.
Successor Period
For the Successor Period, we did not incur any acquisition and transaction costs.
Predecessor Period
For the Predecessor Period, we did not incur any acquisition and transaction costs.
Year Ended December 31, 2015
For the year ended December 31, 2015, our acquisition and transaction costs were $0.3 million at a cost of $0.03 per Boe. Acquisition and transaction costs related to our expenses incurred with the Dequincy Divestiture.
Debt Restructuring Costs and Advisory Fees
Debt restructuring costs and advisory fees include costs incurred for legal, financing and advisor costs associated with specific transactions, such as troubled debt restructuring, or costs incurred prior to the Petition Date.
Year Ended December 31, 2017
For the year ended December 31, 2017, we did not incur any debt restructuring costs and advisory fees.
Successor Period
For the Successor Period, we did not incur any debt restructuring costs and advisory fees.
Predecessor Period
For the Predecessor Period, we incurred $7.6 million of debt restructuring costs and advisory fees related to our bankruptcy and restructuring process prior to the Petition Date.
Year Ended December 31, 2015
During the 2015 period, we engaged various advisors to assist us in analyzing options to improve our financial flexibility and provide additional long-term liquidity. For the year ended December 31, 2015, we incurred approximately $36.1 million in fees associated with these advisors as well as issuance costs associated with the Second Lien Notes offering and Third Lien Notes exchange.
Other
Other expense consists of, among other things, losses on disposal of, or market value adjustments to, field equipment inventory, penalties on early termination of drilling contracts and other miscellaneous expense items.
Year Ended December 31, 2017
For the year ended December 31, 2017, we did not incur any other expenses.
Successor Period
For the Successor Period, we did not incur any other expenses.
Predecessor Period
For the Predecessor Period, we did not incur any other expenses.
Year Ended December 31, 2015
For the year ended December 31, 2015, we incurred other expenses of $2.1 million related to the loss on disposal of, or market value adjustments to, field equipment inventory deemed no longer useful to current operations.
Other Income/Expense
|
|
|
Successor |
|
|
Predecessor |
| ||||||||
|
|
|
|
|
For the Period |
|
|
For the Period |
|
|
| ||||
|
|
|
Year Ended |
|
Through |
|
|
Through |
|
Year Ended |
| ||||
|
|
|
(in thousands) |
|
|
(in thousands) |
| ||||||||
|
OTHER INCOME (EXPENSE) |
|
|
|
|
|
|
|
|
|
| ||||
|
Interest income |
|
$ |
9 |
|
$ |
— |
|
|
$ |
81 |
|
$ |
115 |
|
|
Interest expense |
|
(7,647 |
) |
(1,409 |
) |
|
(70,019 |
) |
(182,955 |
) | ||||
|
Amortization of deferred financing costs |
|
(385 |
) |
(62 |
) |
|
(4,587 |
) |
— |
| ||||
|
Amortization of deferred gain |
|
— |
|
— |
|
|
8,246 |
|
14,948 |
| ||||
|
Capitalized interest |
|
2,440 |
|
728 |
|
|
— |
|
4,859 |
| ||||
|
Interest expense—net of amounts capitalized (Predecessor Period excludes interest expense of $89.5 million on senior and secured notes) |
|
(5,592 |
) |
(743 |
) |
|
(66,360 |
) |
(163,148 |
) | ||||
|
Reorganization items |
|
— |
|
— |
|
|
1,594,281 |
|
— |
| ||||
|
Total other income (expense) |
|
$ |
(5,583 |
) |
$ |
(743 |
) |
|
$ |
1,528,002 |
|
$ |
(163,033 |
) |
Interest Expense
Prior to the Effective Date, we had substantial long-term debt in the form of our 2020 Senior Notes, 2021 Senior Notes, Second Lien Notes and Third Lien Notes. Additionally, we financed a portion of our working capital requirements and capital expenditures with borrowings under our RBL. Included within interest expense for periods prior to the Successor Period is the amortization of the related deferred financing costs, net of any amounts capitalized to unproved properties, and amortization of the deferred gain recognized on the restructuring of our debt, which occurred in the second quarter of 2015 and was being recognized as a reduction to interest expense using the effective interest method.
Year Ended December 31, 2017
For the year ended December 31, 2017, we incurred $7.6 million of interest expense related to our Exit Facility which bears interest at LIBOR plus 4.50% per annum, subject to a 1.00% LIBOR floor. At December 31, 2017, the weighted average interest rate was 6.3%. We also capitalized $2.4 million of interest expense to our unevaluated oil and gas properties during the year.
Successor Period
For the Successor Period, we incurred $1.4 million of interest expense related to our Exit Facility. At December 31, 2016, the weighted average interest rate was 5.50%. We also capitalized $0.7 million of interest expense to our unevaluated oil and gas properties during the period.
Predecessor Period
For the Predecessor Period, we incurred $70.0 million of interest expense. During the Predecessor Period, we reclassified our Senior Notes, Second Lien Notes and Third Lien Notes to liabilities subject to compromise in connection with the Chapter 11 Cases. As such, we ceased recognizing interest expense for all debt except amounts outstanding under the RBL beginning at the Petition Date. Contractual interest not reflected in the consolidated statements of operations was approximately $89.5 million, which represents interest expense incurred subsequent to the Petition Date. No interest expense was capitalized during the period due to the transfer of all balances related to unevaluated property to the full cost pool at December 31, 2015.
Year Ended December 31, 2015
For the year ended December 31, 2015, we incurred $183.0 million of interest expense. During the year ended December 31, 2015, we issued Second Lien Notes on May 21, 2015 and Third Lien Notes on May 21, 2015 and June 2, 2015. The Second Lien Notes bore interest at 10.0% and a portion of the proceeds were used to repay outstanding borrowings under the RBL. Additionally, the Third Lien Notes bore interest at 12.0% and were exchanged for a portion of the 2020 Senior Notes and 2021 Senior Notes, which had stated interest rates of 10.75% and 9.25%, respectively. As a result of the Third Lien Notes exchange, there was $14.9 million in amortization of the deferred gain related to the forgiven debt. For the year ended December 31, 2015, approximately $4.9 million in interest expense was capitalized to oil and gas properties.
Reorganization Items, Net
Reorganization items, net, represent the direct and incremental costs of being in bankruptcy from the Petition Date through the Effective Date, and include such items as professional fees, gains from pre-petition liability claim adjustments and losses related to terminated contracts that are probable and can be estimated.
Year Ended December 31, 2017
For the year ended December 31, 2017, we did not recognize any reorganization items.
Successor Period
For the Successor Period, we did not recognize any reorganization items.
Predecessor Period
For the Predecessor Period, we recognized $1.6 billion of reorganization income related to our emergence from bankruptcy. Reorganization items include a $1.3 billion gain on the settlement of liabilities subject to compromise, $111.4 million of adjustments to unamortized gains on troubled debt restructuring related to the issuance of the Second Lien Notes and the Third Lien Notes, $23.4 million of adjustments to unamortized debt issuance costs, $38.8 million of professional fees incurred and $274.2 million of fresh start adjustments and other reorganization items.
Year Ended December 31, 2015
For the year ended December 31, 2015, we did not recognize any reorganization items.
Provision for Income Taxes
Year Ended December 31, 2017
For the year ended December 31, 2017, we had no provision for income taxes due to the change in our valuation allowance recorded against our net deferred tax assets.
The Tax Cuts and Jobs Act (“the Tax Act”) was enacted on December 22, 2017. The Tax Act reduces the U.S. federal corporate tax rate from 35% to 21%, limits deductions for, among other things, interest expense, executive compensation and meals and entertainment while enhancing deductions for equipment and other fixed assets. We have no additional expense or benefit from tax reform due to the valuation allowance set against the deferred tax assets. We will continue to monitor guidance from regulatory bodies regarding the Tax Act and its possible impacts on our business. See “Critical Accounting Policies and Estimates — Income Taxes” below and “—Note 13. Income Taxes” in the Notes to the Consolidated Financial Statements set forth in Part IV, Item 15 of this Annual Report on Form 10-K for further information related to the Tax Act.
Successor Period
For the Successor Period, we had no provision for income taxes due to the change in our valuation allowance recorded against our net deferred tax assets.
Predecessor Period
For the Predecessor Period, we had no provision for income taxes due to the change in our valuation allowance recorded against our net deferred tax assets.
Year Ended December 31, 2015
Our income tax benefit was $9.6 million for the year ended December 31, 2015 and represents an application of our estimated effective tax rate (including state income taxes) for the year ended December 31, 2015 of approximately 0.5% to the pre-tax loss incurred throughout the year.
Capital Resources, Uses and Liquidity
Overview
Our decisions regarding capital structure, hedging and drilling are based upon many factors, including anticipated future commodity pricing, expected economic conditions and recoverable reserves. Historically, our primary sources of liquidity have been our operating cash flows, proceeds from divestitures, cash on hand and cash available from borrowings under the Exit Facility.
We anticipate our operating cash flows, cash on hand and cash available from borrowings under the Exit Facility will be our primary sources of liquidity subsequent to the Effective Date, although we may seek to supplement our liquidity through divestitures, additional or refinanced borrowings or debt or equity securities offerings as circumstances and market conditions dictate. We believe the combination of these sources of liquidity will be adequate to fund anticipated capital expenditures, service our existing debt and remain compliant with all other contractual commitments.
Our cash flows from operations are impacted by various factors, the most significant of which is the market pricing for oil, NGLs and natural gas. The pricing for these commodities is volatile, and the factors that impact such market pricing are global and therefore outside of our control. Volatility in commodity prices also impacts estimated quantities of proved reserves. Our longer term operating cash flows are dependent upon reserve replacement and the level of costs required for ongoing operations. We are required to make investments to fund activity necessary to offset the inherent declines in production and proved crude oil and natural gas reserves. Our ability to maintain and grow reserves and production is highly dependent on the success of our drilling program and our ability to add reserves economically. As a result, it is not possible for us to precisely predict our future cash flows from operating revenues due to these market forces.
We have historically utilized derivatives to alleviate some of the volatility in market pricing. At December 31, 2017, we had derivative contracts covering a significant portion of our 2018 and 2019 production. Depending on changes in oil and gas futures markets and management’s view of underlying supply and demand trends, we may hedge up to 75.0% of our oil and natural gas production for the successive twelve months. For further information, see “—Note 6. Risk Management and Derivatives Instruments” in the Notes to the Consolidated Financial Statements set forth in Part IV, Item 15 of this Annual Report on Form 10-K.
Our Capital Requirements
The following table summarizes factors affecting our liquidity (in thousands):
|
|
|
December 31, 2017 |
|
December 31, 2016 |
| ||
|
Cash and cash equivalents |
|
$ |
68,498 |
|
$ |
76,838 |
|
|
Net working capital |
|
48,866 |
|
67,637 |
| ||
|
Total long-term debt |
|
128,059 |
|
128,059 |
| ||
|
Available borrowing capacity |
|
40,000 |
|
— |
| ||
At December 31, 2017, our liquidity was $108.5 million, composed of our cash and cash equivalents and available borrowing capacity. During the year ended December 31, 2017, we incurred operational capital expenditures of $131.3 million, which consisted primarily of the following (in thousands):
|
|
|
For the Year Ended |
| |
|
Drilling and completion activities |
|
$ |
121,753 |
|
|
Acquisition of acreage and seismic data |
|
9,523 |
| |
|
Operational capital expenditures incurred |
|
131,276 |
| |
|
Capitalized G&A, Office, ARO and Other |
|
6,672 |
| |
|
Capitalized interest |
|
2,440 |
| |
|
Total capital expenditures incurred |
|
$ |
140,388 |
|
Operational capital expenditures were incurred in the following areas for the year ended December 31, 2017 (in thousands):
|
|
|
For the Year Ended |
| |
|
Mississippian Lime |
|
$ |
128,808 |
|
|
Anadarko Basin |
|
2,468 |
| |
|
Operational capital expenditures incurred |
|
$ |
131,276 |
|
As of December 31, 2017, we had one drilling rig in operation in the Mississippian Lime. We currently anticipate operating one rig in the Mississippian Lime and investing between $100.0 million and $120.0 million of capital for exploration, development and lease and seismic acquisition during the year ended December 31, 2018. We expect cash generated by operations and cash on hand to be sufficient to fully fund our expected capital requirements.
Significant Sources of Capital
Exit Facility
At December 31, 2017, in addition to cash on hand of $68.5 million, we maintained the Exit Facility. The Exit Facility has a current borrowing base of $170.0 million. At December 31, 2017, we had $128.1 million drawn on the Exit Facility and had outstanding letters of credit obligations totaling $1.9 million. At December 31, 2017, we had $40.0 million of availability on the Exit Facility.
The Exit Facility matures on September 30, 2020 and bears interest at LIBOR plus 4.50% per annum, subject to a 1.00% LIBOR floor. At December 31, 2017, the weighted average interest rate was 6.3%.
On May 24, 2017, we entered into the First Amendment to the Exit Facility (the “First Amendment”). The First Amendment, among other items, (i) moved the first scheduled borrowing base redetermination from April 2018 to October 2017; (ii) removed the requirement to maintain a cash collateral account with the administrative agent in the amount of $40.0 million; (iii) removed the requirement to maintain at least 20% liquidity of the then effective borrowing base; (iv) amended the required mortgage threshold from 95% to 90%; and (v) amended the threshold amount for which the borrower is required to provide advance notice to the administrative agent of a sale or disposition of oil and gas properties which occurs during the period between two successive redeterminations of the borrowing base.
In addition to interest expense, the Exit Facility requires the payment of a commitment fee each quarter. The commitment fee is computed at the rate of 0.50% per annum based on the average daily amount by which the borrowing base exceeds the outstanding borrowings during each quarter.
Debt Covenants
The Exit Facility, as amended, includes certain financial maintenance covenants that are required to be calculated on a quarterly basis for compliance purposes. These financial maintenance covenants include EBITDA to interest expense for the trailing four fiscal quarters of not less than 2.50:1.00 and a limitation of Total Net Indebtedness (as defined in the Exit Facility) to EBITDA for the trailing four fiscal quarters of not more than 4.00:1.00.
In addition, the Exit Facility contains various other covenants that, among other things, may restrict our ability to: (i) incur additional indebtedness or guarantee indebtedness (ii) make loans and investments; (iii) pay dividends on capital stock and make other restricted payments, including the prepayment or redemption of other indebtedness; (iv) create or incur certain liens; (v) sell, transfer or otherwise dispose of certain assets; (vi) enter into certain types of transactions with our affiliates; (vii) acquire, consolidate or merge with another entity upon certain terms and conditions; (viii) sell all or substantially all of our assets; (ix) prepay, redeem or repurchase certain debt; (x) alter the business we conduct and make amendments to our organizational documents, (xi) enter into certain derivative transactions and (xii) enter into certain marketing agreements and take-or-pay arrangements.
We were in compliance with all debt covenants at December 31, 2017.
Cash Flows from Operating, Investing and Financing Activities
The following table summarizes our consolidated cash flows from operating, investing and financing activities for the periods presented. For information regarding the individual components of our cash flow amounts, please refer to the Consolidated Statements of Cash Flows included under Item 15 of this Annual Report.
Our operating cash flows are sensitive to a number of variables, the most significant of which is the volatility of oil and gas prices. Regional and worldwide economic activity, weather, infrastructure capacity to reach markets and other variable factors significantly impact the prices of these commodities. These factors are beyond our control and are difficult to predict. For additional information on the impact of changing prices on our financial position, see “Item 7A.—Quantitative and Qualitative Disclosures about Market Risk.”
The following information highlights the significant period-to-period variances in our cash flow amounts (in thousands):
|
|
|
Successor |
|
|
Predecessor |
| ||||||||
|
|
|
For the Year |
|
For the Period |
|
|
For the Period |
|
For the Year |
| ||||
|
Net cash provided by operating activities |
|
$ |
119,602 |
|
$ |
23,644 |
|
|
$ |
61,997 |
|
$ |
213,383 |
|
|
Net cash used in investing activities |
|
(125,964 |
) |
(23,346 |
) |
|
(133,307 |
) |
(294,556 |
) | ||||
|
Net cash (used in) provided by financing activities |
|
(1,978 |
) |
— |
|
|
66,757 |
|
150,709 |
| ||||
|
Net change in cash |
|
$ |
(8,340 |
) |
$ |
298 |
|
|
$ |
(4,553 |
) |
$ |
69,536 |
|
Cash flows provided by operating activities
Net cash provided by operating activities was $119.6 million, $23.6 million, $62.0 million and $213.4 million for the year ended December 31, 2017, the Successor Period, the Predecessor Period and the year ended December 31, 2015, respectively.
Cash flows used in investing activities
We had net cash used in investing activities of $126.0 million, $23.3 million, $133.3 million and $294.6 million for the year ended December 31, 2017, the Successor Period, the Predecessor Period and the year ended December 31, 2015, respectively. Net cash used in investing activities primarily represents cash invested in property and equipment.
Cash flows provided by financing activities
Net cash (used in) provided by financing activities was $(2.0) million, $66.8 million and $150.7 million for the year ended December 31, 2017, Predecessor Period and the year ended December 31, 2015, respectively. Net cash used in financing activities for the year ended December 31, 2017 primarily represents treasury shares acquired associated with the vesting of restricted stock and deferred financing costs incurred with the First Amendment. Net cash provided by financing activities for the Predecessor Period primarily represents borrowings from the RBL of $249.4 million offset partially by repayments of the RBL of $121.3 million and repayments of the Second Lien Notes of $60.0 million. Net cash provided by financing activities for the year ended December 31, 2015 primarily represents the issuance of the Second Lien Notes for proceeds of $625.0 million and borrowings from the RBL of $33.0 million. These proceeds were partially offset by repayments on the RBL of $468.2 million and $34.4 million paid for restructuring transaction costs.
Other Items
Obligations and commitments
We have the following contractual obligations and commitments as of December 31, 2017 (in thousands):
|
|
|
|
|
Payments Due by Period |
| |||||||||||
|
|
|
Total |
|
Less than |
|
1 - 3 years |
|
4 - 5 years |
|
More than |
| |||||
|
Reserves based revolving credit facility(1) |
|
$ |
128,059 |
|
$ |
— |
|
$ |
128,059 |
|
$ |
— |
|
$ |
— |
|
|
Non-cancellable office lease commitments(2) |
|
5,989 |
|
654 |
|
2,033 |
|
1,416 |
|
1,886 |
| |||||
|
Asset retirement obligations(3) |
|
15,506 |
|
— |
|
— |
|
— |
|
15,506 |
| |||||
|
Net minimum commitments(4) |
|
$ |
149,554 |
|
$ |
654 |
|
$ |
130,092 |
|
$ |
1,416 |
|
$ |
17,392 |
|
(1) Amount excludes interest on our reserves based revolving credit facility as both the amount borrowed and applicable interest rate is variable. As of December 31, 2017, we had drawn down $128.1 million on our reserves based revolving credit facility and had $1.9 million of outstanding letters of credit. See “—Note 10. Debt” in the Notes to the Consolidated Financial Statements set forth in Part IV, Item 15 of this Annual Report on Form 10-K for further information.
(2) See “—Note 16. Commitments and Contingencies” in the Notes to the Consolidated Financial Statements set forth in Part IV, Item 15 of this Annual Report on Form 10-K, for a description of operating lease and other obligations.
(3) Amounts represent our estimate of future asset retirement obligations on a discounted basis. Because these costs typically extend many years into the future, estimating these future costs requires management to make estimates and judgments that are subject to future revisions based upon numerous factors, including the rate of inflation, changing technology and the political and regulatory environment. See “—Note 9. Asset Retirement Obligations” in the Notes to the Consolidated Financial Statements set forth in Part IV, Item 15 of this Annual Report on Form 10-K.
(4) Excluded from these amounts are any payments that may become necessary under our minimum volume requirements in our gas purchase, gathering and processing contract in the Mississippian Lime region as further discussed in “Business—Marketing and Major Purchasers”.
Critical Accounting Policies and Estimates
We prepare our financial statements and the accompanying notes in conformity with US GAAP, which requires our management to make estimates and assumptions about future events that affect the reported amounts in our financial statements and the accompanying notes. We identify certain accounting policies as critical based on, among other things, their impact on the portrayal of our financial condition, results of operations or liquidity and the degree of difficulty, subjectivity and complexity in their deployment. Critical accounting policies cover accounting matters that are inherently uncertain because the future resolution of such matters is unknown. Our management routinely discusses the development, selection and disclosure of each of the critical accounting policies.
Full Cost Method of Accounting and Proved Reserve Estimates
Proved oil and gas reserves are the estimated quantities of crude oil, NGLs and natural gas that geological and engineering data demonstrates with reasonable certainty to be recoverable in future years from known reservoirs under existing operating conditions and government regulations. Proved undeveloped reserves include those reserves that are expected to be recovered from new wells on undrilled acreage, or from existing wells where a relatively major expenditure is required for recompletion. Undeveloped reserves may be classified as proved reserves on undrilled acreage directly offsetting development areas that are reasonably certain of production when drilled, or where reliable technology provides reasonable certainty of economic producibility. Undrilled locations may be classified as having undeveloped reserves only if a development plan has been adopted indicating that they are scheduled to be drilled within five years, unless specific circumstances justify a longer time.
Despite the inherent imprecision in these engineering estimates, our reserves are used throughout our financial statements. For example, since we use the units-of-production method to amortize our oil and gas properties, the quantity of reserves could significantly impact our DD&A expense. Our oil and gas properties are also subject to a ceiling limitation based in part on the quantity of our proved reserves. Finally, these reserves are the basis for our supplemental oil and gas disclosures.
Our estimates of reserves were calculated using an unweighted arithmetic average of commodity prices in effect on the first day of each month, held flat for the life of the production, except where prices are defined by contractual arrangements.
Because the ceiling calculation dictates the use of prices that are not representative of future prices and requires a 10% discount factor, the resulting value is not indicative of the true fair value of the reserves. Oil and gas prices have historically been cyclical and, for any particular 12-month period, can be either higher or lower than our long-term price forecast, which is a more appropriate input for estimating fair value. Therefore, oil and gas property write-downs that result from applying the full cost ceiling limitation, and that are caused by fluctuations in price as opposed to reductions to the underlying quantities of reserves, should not be viewed as absolute indicators of a reduction of the ultimate value of the related reserves. Because of the volatile nature of oil and gas prices, it generally is not possible to predict the timing or magnitude of full cost write-downs.
Revenue Recognition
Our revenue recognition policy is significant because revenue is a key component of the results of operations and of the forward-looking statements contained in the analysis of liquidity and capital resources. We record revenue in the month our production is delivered to the purchaser, but payment is generally received 30 to 90 days after the date of production. At the end of each month, we estimate the amount of production that was delivered to the purchaser and the price that will be received. We use our knowledge of our properties, their historical performance, the anticipated effect of weather conditions during the month of production, NYMEX and local spot market prices and other factors as the basis for these estimates. We record the variances between our estimates and the actual amounts received in the month payment is received and such variances have historically not been significant.
In May 2014, the FASB issued ASU 2014-09, which provides guidance concerning the recognition and measurement of revenue from contracts with customers. We completed our assessment of ASU 2014-09 during the fourth quarter of 2017. The primary update to our revenues as the result of adopting ASU 2014-09 will be the netting of certain deductions and costs, such as transportation and gathering expenses, against revenue instead of our historical practice of showing such expenses gross. These changes will not impact our revenue recognition, our financial position, net income or cash flows. The Company also completed its evaluation of information technology and internal control changes that will be required for adoption based on the Company’s contract review process, which primarily required the remapping of certain accounts utilized for tracking these deduction and expenses along with enhanced reviews of any new revenue contracts or modifications to existing revenue contracts. The Company will apply the modified retrospective approach upon adoption of this standard on the effective date of January 1, 2018. See “Recent Accounting Pronouncements” below for more information.
Share-Based Compensation
Compensation expense associated with granted stock options and restricted stock units (“RSUs”) (excluding RSUs containing a market condition) is determined based on our estimate of the fair value of those awards at the initial grant date.
The fair value of RSUs is based on the fair value of an unrestricted share of common stock at the grant date. We utilize the Black-Scholes-Merton option pricing model to measure the fair value of stock options. Key inputs used in the option pricing model include the risk-free interest rate, the expected volatility of the underlying stock and the expected life of the award. Non-employee director RSUs containing a market condition are treated as a liability award and the fair value is based upon a Monte Carlo simulation utilizing assumptions for expected volatility, risk-free interest rate and expected life that are updated quarterly until the award vests or expires. The CEO’s RSUs containing a market condition are treated as equity awards and the fair value is based on Monte Carlo simulation utilizing assumptions for actual and relative total shareholder return that was calculated at the grant date. The key assumptions used in measuring stock compensation expense for all awards are included in “—Note 12. Equity and Share-Based Compensation” in the Notes to the Consolidated Financial Statements set forth in Part IV, Item 15 of this Annual Report on Form 10-K. We include share-based compensation expense in “General and administrative expense” in our consolidated statements of operations.
Asset Retirement Obligations
We have obligations to remove tangible equipment and facilities associated with our oil and natural gas wells, and to restore land at the end of oil and natural gas production operations. The removal and restoration obligations are associated with plugging and abandoning wells. Estimating the future restoration and removal costs is difficult and requires us to make estimates and judgments because most removal obligations are many years in the future and contracts and regulations often have vague descriptions of what constitutes removal. Asset removal technologies and costs are constantly changing, as are regulatory, political, environmental, safety and public relations considerations. Inherent in the present value calculations are numerous assumptions and judgments including the ultimate settlement amounts, inflation factors, credit adjusted discount rates, timing of settlements and changes in the legal, regulatory, environmental and political environments.
The accounting guidance for asset retirement obligations requires that a liability for the present value of estimated future retirement obligations be recorded in the period in which it is incurred and the corresponding cost capitalized by increasing the carrying amount of the related long-lived asset. The discounted liability is then subsequently accreted to its new present value. The amount of liability recorded for our asset retirement obligation is significantly impacted by our estimate of when the liability will be settled because of the discounting effect that occurs to reflect the liability at the present value of the future obligation. For example, at December 31, 2017, an increase of 5 years in the estimated settlement date used for asset retirement purposes would decrease the present value of our asset retirement obligation by $4.3 million, while a decrease of 5 years in the estimated settlement date would increase the present value of our asset retirement obligation by $2.1 million.
Income Taxes
The amount of income taxes recorded requires interpretations of complex rules and regulations of federal, state, and provincial tax jurisdictions. We recognize current tax expense based on estimated taxable income for the current period and the applicable statutory tax rates. We routinely assess potential uncertain tax positions and, if required, estimate and establish accruals for such amounts. We regularly assess our deferred tax assets and reduce such assets by a valuation allowance if we deem it is more likely than not that some portion or all of the deferred tax assets will not be realized. The ultimate realization of our deferred tax assets is dependent upon the generation of taxable income during future periods. In light of a lack of positive evidence, we have recorded a full valuation allowance against our net deferred tax assets of $120.1 million at December 31, 2017.
The SEC staff issued Staff Accounting Bulletin (“SAB 118”), which provides guidance on accounting for the tax effects of the Tax Act. SAB 118 provides a measurement period that should not extend beyond one year from the Tax Act’s enactment date for companies to complete its accounting under ASC 740. In accordance with SAB 118, to the extent a company has not completed its analysis of the Tax Act but can provide a reasonable estimate, it must record a provisional estimate in its financial statements.
We have no additional expense or benefit from tax reform due to the valuation allowance. As the Tax Act was passed late in the fourth quarter of 2017, ongoing guidance from the Department of Treasury and state agencies and accounting interpretation is expected to be issued over the next 12 months. Therefore, we consider the accounting for certain items, as discussed below, to be incomplete due to forthcoming guidance and the ongoing analysis of final year-end data and tax positions.
We have estimated deductions of $10.9 million associated with the full expensing of the costs of qualified property that were incurred and placed in service during the period from September 27, 2017 to December 31, 2017. We continue to analyze assets placed in service after September 27, 2017, but not qualifying for full expensing as a result of being acquired under an agreement entered into prior to that date. In addition, further guidance and analysis is required in order to review the terms of its compensation plans and agreements and assess the impact of transitional guidance related to IRC Section 162(m) on awards granted prior to November 2, 2017, subject to the grandfather provisions. As a result, we have not adjusted certain tax items previously reported on its financial statements for IRC Section 162(m) until we are able to obtain sufficient information to make a reasonable estimate of the effects of the Tax Act. We expect to complete our analysis within the measurement period in accordance with SAB 118.
For further discussion please see “—Note 13. Income Taxes” in the Notes to the Consolidated Financial Statements set forth in Part IV, Item 15 of this Annual Report on Form 10-K.
Fresh Start Accounting
Upon our emergence on the Effective Date, we adopted fresh start accounting as required by US GAAP. We qualified for fresh start accounting because (i) the holders of existing voting shares of the pre-emergence debtor-in-possession received less than 50% of the voting shares of the post-emergence successor entity and (ii) the reorganization value of our assets immediately prior to confirmation was less than the post-petition liabilities and allowed claims. We applied fresh start accounting as of the Effective Date. Adopting fresh start accounting results in a new reporting entity for financial reporting purposes with no beginning retained earnings or deficit and all of our assets and liabilities marked to fair value as of the Effective Date. As a result of the application of fresh start accounting, as well as the effects of the implementation of the Plan, our consolidated financial statements on or after the Effective Date are not comparable with our consolidated financial statements prior to that date.
There are various assumptions we made in determining the fair values of our assets and liabilities at the Effective Date. The most significant assumptions involve the estimated fair values of our oil and gas properties. To determine the fair values of these properties, we prepared estimates of oil, natural gas and NGL reserves as of the Effective Date. The engineering assumptions contained within this reserves report were consistent with both (i) previous engineering assumptions made by us when preparing reserve reports in prior years and (ii) assumptions promulgated by the SEC. These assumptions include type curves and analogous reservoir characteristics determined utilizing electrical logs, radioactivity logs, core analyses, geologic maps and available downhole and production data, seismic data and well test data, to name a few. We then utilized an outside third-party expert to assist us in the preparation of a valuation report utilizing assumptions consistent with a market participant. This valuation report utilized the income approach in determining the fair value of our oil and gas reserves, excluding possible reserves, for which the market approach was utilized. The income approach involves the projection of cash flows a market participant would expect an asset or business to generate over its remaining useful life. These projected cash flows from our oil and gas properties are adjusted for risk based upon the reserves category before being further adjusted for estimates of various indirect costs associated with the production of such reserves, such as general and administrative costs, income taxes and the impact of inflation. These cash flows are projected on an annual basis for a discrete period of time and then converted to their present value using a rate of return that captures the relevant risk of achieving the projected cash flows, which is based upon an estimated required return of capital for debt and equity for a market participant. Finally, the present value of the residual value, or terminal value, is added to these discrete cash flows to arrive at the estimate of total value. The market approach, which was utilized to value possible reserves, measures value through the use of prices, market multiples and other relevant information involving identical or comparable assets or business interests, which were largely determined based upon widely utilized industry sources and other relevant data in the respective area.
Unproved properties generally represent the value of probable and possible reserves. Due to the inherent nature of such reserves, probable reserve estimates are more imprecise than those of proved reserves. In order to compensate for the inherent risk of estimating and valuing unproved reserves, the discounted future net revenues of probable reserves are reduced by an appropriate risk-weighting factor in each particular instance. Possible reserves were not valued utilizing a discounted cash flow approach, but rather through the use of industry data and specific transactions utilizing the market approach.
Off-Balance Sheet Arrangements
Currently, we do not have any off-balance sheet arrangements as defined under Item 303(a)(4)(ii) of Regulation S-K.
Recent Accounting Pronouncements
In May 2014, the FASB issued Accounting Standards Update 2014-09, “Revenue from Contracts with Customers (Topic 606)” (“ASU 2014-09”). ASU 2014-09 provides guidance concerning the recognition and measurement of revenue from contracts with customers. The objective of ASU 2014-09 is to increase the usefulness of information in the financial statements regarding the nature, timing and uncertainty of revenues. ASU 2014-09 requires an entity to perform the following steps:
Step 1— Identify the contract with a customer: A contract between two or more parties creates enforceable rights and obligations. A contract that identifies the relevant parties and has been approved by those parties, identifies the payment terms, has commercial substance and results in a probable collection of future consideration meets the definition of ASU 2014-09.
Step 2—Identify the performance obligations in the contract: A performance obligation is effectively a promise in a contract with a customer to transfer goods or services to the customer. If an entity promises to transfer more than one good or service to the customer, each performance obligation is accounted for separately if such performance obligations are distinct, as defined under ASU 2014-09.
Step 3—Determine the transaction price: The amount of consideration an entity expects to be entitled to as a result of performing services to a customer or transferring goods to a customer is the transaction price. The transaction price takes into account variable consideration, the existence of significant financing component, noncash consideration and the type of consideration payable to the entity.
Step 4—Allocate the transaction price to the performance obligations in the contract: An entity should allocate the transaction price to each performance obligation in an amount that represents the amount of the entity expects to be entitled to for satisfying each performance obligation.
Step 5—Recognize revenue when, or as, the entity satisfies a performance obligation: An entity recognizes revenue when, or as, it satisfies a performance obligation. A performance obligation can be satisfied over time or at a point in time. ASU 2014-09 provides criteria for determining the appropriate classification of each performance obligation.
Throughout 2015 and 2016, the FASB has issued a series of subsequent updates to the revenue recognition guidance in Topic 606, including ASU No. 2015-14, “Revenue from Contracts with Customers (Topic 606): Deferral of the Effective Date” ASU No. 2016-08, “Revenue from Contracts with Customers (Topic 606): Principal versus Agent Considerations”, ASU No. 2016-10, “Revenue from Contracts with Customers (Topic 606): Identifying Performance Obligations and Licensing”, ASU No. 2016-12, “Revenue from Contracts with Customers (Topic 606): Narrow-Scope Improvements and Practical Expedients” and ASU No. 2016-20, “Technical Corrections and Improvements to Topic 606, Revenue from Contracts with Customers”. ASU 2014-09 and the associated amendments mentioned above will be effective for us beginning on January 1, 2018, including interim periods within that reporting period.
We completed our assessment of ASU 2014-09 during the fourth quarter of 2017. The primary impact to our revenues as the result of adopting ASU 2014-09 will be the netting of certain deductions and costs, such as transportation and gathering expenses, against revenue instead of our historical practice of presenting such expenses gross. For example, revenues from oil, natural gas and NGL sales for the year ended December 31, 2017 would have been $15.8 million lower under ASU 2014-09, with an offsetting decrease to total expenses.
The implementation of ASU 2014-09 will not impact our revenue recognition, our financial position, net income or cash flows. We do not anticipate a material cumulative effect adjustment on January 1, 2018 as a result of adopting ASU 2014-09. The Company also completed its evaluation of information technology and internal control changes that will be required for adoption based on the Company’s contract review process, which primarily required the remapping of certain accounts utilized for tracking these deduction and expenses along with enhanced reviews of any new revenue contracts or modifications to existing revenue contracts. The Company will apply the modified retrospective approach upon adoption of this standard on the effective date of January 1, 2018.
In February 2016, the FASB issued Accounting Standards Update 2016-02, “Leases (Topic 842)” (“ASU 2016-02”). ASU 2016-02 establishes a right-of-use (“ROU”) model that requires a lessee to record a ROU asset and a lease liability on the balance sheet for all leases with terms longer than 12 months. All leases create an asset and a liability for the lessee and therefore recognition of those lease assets and lease liabilities is required by ASU 2016-02. When measuring lease assets and liabilities, payments to be made in optional extension periods should be included if the lessee is reasonably certain to exercise the option. Leases will be classified as either finance or operating, with classification affecting the pattern of expense recognition in the income statement.
For finance leases, we will recognize a ROU asset and liability, initially measured at the present value of the lease payments. Interest expense will be recognized on the lease liability separately from the amortization of the ROU asset. We will recognize payments of principal on the lease liability within financing activities in the consolidated statement of cash flows and payments of interest within operating activities in the consolidated statement of cash flows. For operating leases, we will recognize a ROU asset and liability, initially measured at the present value of the lease payments. We will recognize a single lease cost, calculated so that the cost of the lease is allocated over the lease term on a generally straight-line basis and all cash payments will be recognized in operating activities within the consolidated statement of cash flows.
The new standard is effective for fiscal years beginning after December 15, 2018, including interim periods within those fiscal years. A modified retrospective transition approach is required for lessees for capital and operating leases existing at, or entered into after, the beginning of the earliest comparative period presented in the financial statements, with certain practical expedients available. We are in the initial evaluation and planning stages for ASU 2016-02 and do not expect to move beyond this stage until early 2018.
In August 2016, the FASB issued ASU 2016-15, “Statement of Cash Flows — Classification of Certain Cash Receipts and Cash Payments” (“ASU 2016-15”). ASU 2016-15 addresses eight specific cash flow issues with the objective of reducing existing diversity of practice. The eight specific cash flow issues contained within ASU 2016-15 are debt prepayment or debt extinguishment costs, settlement of zero-coupon debt instruments or other debt instruments with coupon interest rates that are insignificant in relation to the effective interest rate of the borrowing, contingent consideration payments made after a business combination, proceeds from the settlement of insurance claims, proceeds from the settlement of corporate-owned life insurance policies, distributions received from equity method investees, beneficial interests in securitization transactions and separately identifiable cash flows and application of the predominance principle. ASU 2016-15 is effective for us for fiscal years beginning after December 15, 2017, and interim periods within those fiscal years. We do not believe the adoption of ASU 2016-15 will have a material impact on our cash flows.
In July 2017, the FASB issued Accounting Standards Update 2017-11, “Earnings Per Share (Topic 260), Distinguishing Liabilities from Equity (Topic 480), and Derivatives and Hedging (Topic 815)” (“ASU 2017-11”). ASU 2011-17 changes the classification analysis of certain equity-linked financial instruments (or embedded features) with down round features. The amendments require entities that present earnings per share (“EPS”) in accordance with Topic 260 to recognize the effect of the down round feature when triggered with the effect treated as a dividend and as a reduction of income available to common shareholders in basic EPS. The new standard is effective for fiscal years beginning after December 15, 2018, including interim periods within those fiscal years. We do not believe the adoption of ASU 2017-11 will have a material impact on our financial position, results of operations or cash flows.
ITEM 7A. QUANTITATIVE AND QUALITATIVE DISCLOSURES ABOUT MARKET RISK
We are exposed to a variety of market risks including commodity price risk, interest rate risk and counterparty and customer risk. We address these risks through a program of risk management including the use of derivative instruments.
The primary objective of the following information is to provide forward-looking quantitative and qualitative information about our potential exposure to market risks. The disclosures are not meant to be precise indicators of expected future losses or gains, but rather indicators of reasonably possible losses or gains. This forward-looking information provides indicators of how we view and manage our ongoing market risk exposures. All of our market risk sensitive instruments were entered into for purposes other than speculative trading. These derivative instruments are discussed in “—Note 6. Risk Management and Derivative Instruments” in the Notes to the Consolidated Financial Statements set forth in Part IV, Item 15 of this Annual Report on Form 10-K.
Commodity Price Exposure
We are exposed to market risk as the prices of oil, NGLs and natural gas fluctuate due to changes in supply and demand. To partially reduce price risk caused by these market fluctuations, we have hedged in the past and in the long-term, expect to hedge, a significant portion of our future production.
We utilize derivative financial instruments to manage risks related to changes in oil and natural gas prices. At December 31, 2017, we utilized fixed price swaps, collars and three-way collars to reduce the volatility of oil and natural gas prices on a portion of our future expected production. Please see “—Note 6. Risk Management and Derivative Instruments” in the Notes to the Consolidated Financial Statements set forth in Part IV, Item 15 of this Annual Report on Form 10-K for further information.
For derivative instruments recorded at fair value, the credit standing of our counterparties is analyzed and factored into the fair value amounts recognized on the balance sheet.
The fair values of our commodity derivatives are largely determined by estimates of the forward curves of the relevant price indices. At December 31, 2017, a 10% change in the forward curves associated with our commodity derivative instruments would have changed our net liability positions by the following amounts:
|
|
|
10% Increase |
|
10% Decrease |
| ||
|
|
|
(in thousands) |
| ||||
|
Gain (loss): |
|
|
|
|
| ||
|
Gas derivatives |
|
$ |
(1,568 |
) |
$ |
1,247 |
|
|
Oil derivatives |
|
$ |
(6,034 |
) |
$ |
4,607 |
|
Assets and liabilities recorded at fair value in the balance sheets are categorized based upon the level of judgment associated with the inputs used to measure their value. Our only financial assets and liabilities that are measured at fair value on a recurring basis are the derivative instruments discussed above. Our policy is to net derivative assets and liabilities where there is a legally enforceable master netting agreement with the counterparty.
Interest Rate Risk
At December 31, 2017, we had indebtedness outstanding under our Exit Facility of $128.1 million, which bears interest at LIBOR plus 4.50% per annum, subject to a 1.00% LIBOR floor. Assuming the Exit Facility is fully drawn, a one percent increase in interest rates would result in a $1.7 million increase in annual interest cost, before capitalization.
At December 31, 2017, we did not have any interest rate derivatives in place and have not historically utilized interest rate derivatives. In the future, we may utilize interest rate derivatives to alter interest rate exposure in an attempt to reduce interest rate expense related to existing debt issues. Interest rate derivatives are used solely to modify interest rate exposure and not to modify the overall leverage of the debt portfolio.
Counterparty and Customer Credit Risk
Joint interest receivables arise from billing entities that own partial interest in the wells we operate. These entities participate in our wells primarily based on their ownership in leases on which we wish to drill. We have limited ability to control participation in our wells. We are also subject to credit risk due to concentration of our oil and natural gas receivables with several significant customers. See “Business—Marketing and Major Purchasers” for further detail about our significant customers. The inability or failure of our significant customers to meet their obligations to us or their insolvency or liquidation may adversely affect our financial results. In addition, our future oil and natural gas derivative arrangements may expose us to credit risk in the event of nonperformance by counterparties.
We evaluate the credit standing of our various counterparties as we deem appropriate under the circumstances. This evaluation may include reviewing a counterparty’s credit rating, latest financial information and, in the case of a customer with which we have receivables, their historical payment record, the financial ability of the customer’s parent company to make payment if the customer cannot and undertaking the due diligence necessary to determine credit terms and credit limits. Some of our significant customers for oil and gas receivables may have a credit rating below investment grade or not have rated debt securities. In these circumstances, we have considered the lack of investment grade credit rating in addition to the other factors described above.
ITEM 8. FINANCIAL STATEMENTS AND SUPPLEMENTARY DATA
Our Consolidated Financial Statements, together with the report of our independent registered public accounting firm begin on page F-1 of this Annual Report.
ITEM 9. CHANGES IN AND DISAGREEMENTS WITH ACCOUNTANTS ON ACCOUNTING AND FINANCIAL DISCLOSURE
Pursuant to General Instructions G(3) to Form 10-K, we incorporate by reference into this Item the information to be disclosed in our definitive proxy statement for our 2017 Annual Meeting of Stockholders.
ITEM 9A. CONTROLS AND PROCEDURES
Evaluation of Disclosure Controls and Procedures
As required by Rule 13a-15(b) of the Exchange Act, we have evaluated, under the supervision and with the participation of our management, including our principal executive officer and principal financial officer, the effectiveness of the design and operation of our disclosure controls and procedures (as defined in Rules 13a-15(e) and 15d-15(e) under the Exchange Act) as of the end of the period covered by this Annual Report. Our disclosure controls and procedures are designed to provide reasonable assurance that the information required to be disclosed by us in reports that we file under the Exchange Act is accumulated and communicated to our management, including our principal executive officer and principal financial officer, as appropriate, to allow timely decisions regarding required disclosure and is recorded, processed, summarized and reported within the time periods specified in the rules and forms of the SEC. Based upon the evaluation, our principal executive officer and principal financial officer have concluded that our disclosure controls and procedures were effective at December 31, 2017 at the reasonable assurance level.
Management’s Annual Report on Internal Control over Financial Reporting
The management of the Company is responsible for establishing and maintaining adequate internal control over financial reporting, as such term is defined in Exchange Act Rule 13a-15(f) and 15d-15(f). Internal control over financial reporting is defined as a process designed by, or under the supervision of, the issuer’s principal executive and principal financial officers, or persons performing similar functions, and effected by the Company’s board of directors, management, and other personnel, to provide reasonable assurance regarding reliability of financial reporting and the preparation of financial statements for external purposes in accordance with generally accepted accounting principles and includes those policies and procedures which (a) pertain to the maintenance of records that, in reasonable detail, accurately and fairly reflect the transactions and dispositions of assets of the Company, (b) provide reasonable assurance that transactions are recorded as necessary to permit preparation of financial statements in accordance with generally accepted accounting principles, and that receipts and expenditures are being made only in accordance with authorizations of management and the board of directors, and (c) provide reasonable assurance regarding prevention or timely detection of unauthorized acquisition, use or disposition of assets that could have a material effect on the financial statements. A material weakness is a deficiency, or a combination of deficiencies, in internal control over financial reporting such that there is a reasonable possibility that a material misstatement of the annual or interim financial statements will not be prevented or detected on a timely basis.
Under the supervision and with the participation of our management, including our principal executive officer and principal financial officer, we conducted an evaluation of the effectiveness of our internal control over financial reporting based on the Internal Control Integrated Framework (2013) issued by the Committee of Sponsoring Organizations of The Treadway Commission. Based on our evaluation under the Internal Control Integrated Framework (2013), our management concluded that our internal control over financial reporting was effective as of December 31, 2017.
The effectiveness of our internal control over financial reporting as of December 31, 2017 has been audited by Grant Thornton LLP, an independent registered public accounting firm, as stated in their report that follows.
Changes in Internal Control over Financial Reporting
There were no changes in internal control over financial reporting during the quarter ended December 31, 2017 that have materially affected or are reasonably likely to materially affect the Company’s internal control over financial reporting.
REPORT OF INDEPENDENT REGISTERED PUBLIC ACCOUNTING FIRM
Board of Directors and Stockholders
Midstates Petroleum Company, Inc.
Opinion on internal control over financial reporting
We have audited the internal control over financial reporting of Midstates Petroleum Company, Inc. (a Delaware corporation) and subsidiary (the “Company”) as of December 31, 2017, based on criteria established in the 2013 Internal Control—Integrated Framework issued by the Committee of Sponsoring Organizations of the Treadway Commission (“COSO”). In our opinion, the Company maintained, in all material respects, effective internal control over financial reporting as of December 31, 2017, based on criteria established in the 2013 Internal Control—Integrated Framework issued by COSO.
We also have audited, in accordance with the standards of the Public Company Accounting Oversight Board (United States) (“PCAOB”), the consolidated financial statements of the Company as of and for the year ended December 31, 2017, and our report dated March 14, 2018 expressed an unqualified opinion on those financial statements.
Basis for opinion
The Company’s management is responsible for maintaining effective internal control over financial reporting and for its assessment of the effectiveness of internal control over financial reporting, included in the accompanying Management’s Annual Report on Internal Control over Financial Reporting. Our responsibility is to express an opinion on the Company’s internal control over financial reporting based on our audit. We are a public accounting firm registered with the PCAOB and are required to be independent with respect to the Company in accordance with the U.S. federal securities laws and the applicable rules and regulations of the Securities and Exchange Commission and the PCAOB.
We conducted our audit in accordance with the standards of the PCAOB. Those standards require that we plan and perform the audit to obtain reasonable assurance about whether effective internal control over financial reporting was maintained in all material respects. Our audit included obtaining an understanding of internal control over financial reporting, assessing the risk that a material weakness exists, testing and evaluating the design and operating effectiveness of internal control based on the assessed risk, and performing such other procedures as we considered necessary in the circumstances. We believe that our audit provides a reasonable basis for our opinion.
Definition and limitations of internal control over financial reporting
A company’s internal control over financial reporting is a process designed to provide reasonable assurance regarding the reliability of financial reporting and the preparation of financial statements for external purposes in accordance with generally accepted accounting principles. A company’s internal control over financial reporting includes those policies and procedures that (1) pertain to the maintenance of records that, in reasonable detail, accurately and fairly reflect the transactions and dispositions of the assets of the company; (2) provide reasonable assurance that transactions are recorded as necessary to permit preparation of financial statements in accordance with generally accepted accounting principles, and that receipts and expenditures of the company are being made only in accordance with authorizations of management and directors of the company; and (3) provide reasonable assurance regarding prevention or timely detection of unauthorized acquisition, use, or disposition of the company’s assets that could have a material effect on the financial statements.
Because of its inherent limitations, internal control over financial reporting may not prevent or detect misstatements. Also, projections of any evaluation of effectiveness to future periods are subject to the risk that controls may become inadequate because of changes in conditions, or that the degree of compliance with the policies or procedures may deteriorate.
/s/ GRANT THORNTON LLP
Kansas City, Missouri
March 14, 2018
ITEM 10. DIRECTORS, EXECUTIVE OFFICERS OF THE REGISTRANT AND CORPORATE GOVERNANCE
Pursuant to General Instructions G(3) to Form 10-K, we incorporate by reference into this Item the information to be disclosed in our definitive proxy statement for our 2017 Annual Meeting of Stockholders.
ITEM 11. EXECUTIVE COMPENSATION
Pursuant to General Instructions G(3) to Form 10-K, we incorporate by reference into this Item the information to be disclosed in our definitive proxy statement for our 2017 Annual Meeting of Stockholders.
ITEM 12. SECURITY OWNERSHIP OF CERTAIN BENEFICIAL OWNERS AND MANAGEMENT AND RELATED STOCKHOLDERS
Pursuant to General Instructions G(3) to Form 10-K, we incorporate by reference into this Item the information to be disclosed in our definitive proxy statement for our 2017 Annual Meeting of Stockholders.
ITEM 13. CERTAIN RELATIONSHIPS AND RELATED TRANSACTIONS
Pursuant to General Instructions G(3) to Form 10-K, we incorporate by reference into this Item the information to be disclosed in our definitive proxy statement for our 2017 Annual Meeting of Stockholders.
ITEM 14. PRINCIPAL ACCOUNTING FEES AND SERVICES
Pursuant to General Instructions G(3) to Form 10-K, we incorporate by reference into this Item the information to be disclosed in our definitive proxy statement for our 2017 Annual Meeting of Stockholders.
ITEM 15. EXHIBITS, FINANCIAL STATEMENT SCHEDULES
(a) The following documents are filed as a part of this Annual Report on Form 10-K or incorporated herein by reference:
(1) Financial Statements:
See Item 8. Financial Statements and Supplementary Data.
(2) Financial Statement Schedules:
None.
(3) Exhibits:
The following documents are included as exhibits to this report:
|
2.1 |
|
|
|
3.1 |
|
|
|
3.2 |
|
|
|
4.01 |
|
|
|
4.02 |
|
|
|
10.01 |
|
|
|
10.02 |
|
|
|
10.03 |
|
|
|
10.04 |
|
|
|
10.05** |
|
|
|
10.06 |
|
|
10.07 |
|
|
|
10.08 |
|
|
|
10.9** |
|
|
|
10.10** |
|
|
|
10.11** |
|
|
|
10.12** |
|
|
|
10.13** |
|
|
|
10.14** |
|
|
|
10.15** |
|
|
|
10.16** |
|
|
|
10.17** |
|
|
|
10.18** |
|
|
|
10.19** |
|
|
|
10.20(a)** |
|
|
|
10.21(a)** |
|
|
|
12.1(a) |
|
Statement of Computation of Ratio of Earnings to Fixed Charges |
|
21.1(a) |
|
|
|
23.1(a) |
|
|
|
23.2(a) |
|
|
|
23.3(a) |
|
Consent of Cawley, Gillespie & Associates, Inc.—Independent Petroleum Engineers |
|
31.1(a) |
|
Sarbanes-Oxley Section 302 certification of Principal Executive Officer. |
|
31.2(a) |
|
Sarbanes-Oxley Section 302 certification of Principal Financial Officer. |
|
32.1(b) |
|
Sarbanes-Oxley Section 906 certification of Principal Executive Officer. |
|
32.2(b) |
|
Sarbanes-Oxley Section 906 certification of Principal Financial Officer. |
|
99.1(a) |
|
|
|
101.INS(a) |
|
XBRL Instance Document. |
|
101.SCH(a) |
|
XBRL Schema Document. |
|
101.CAL(a) |
|
XBRL Calculation Linkbase Document. |
|
101.DEF(a) |
|
XBRL Definition Linkbase Document. |
|
101.LAB(a) |
|
XBRL Labels Linkbase Document |
|
101.PRE(a) |
|
XBRL Presentation Linkbase Document. |
(a) Filed herewith
(b) Furnished herewith
** Management contract or compensatory plan or arrangement
None.
Pursuant to the requirements of Section 13 or 15(d) of the Securities and Exchange Act of 1934, the registrant has duly caused this report to be signed on its behalf by the undersigned, hereunto duly authorized.
|
|
MIDSTATES PETROLEUM COMPANY, INC. |
|
|
|
|
Dated: March 14, 2018 |
/s/ DAVID J. SAMBROOKS |
|
|
David J. Sambrooks |
|
|
President, Chief Executive Officer and Director |
|
|
|
|
Dated: March 14, 2018 |
/s/ RICHARD W. MCCULLOUGH |
|
|
Richard W. McCullough |
|
|
Vice President and Chief Accounting Officer |
Dated: March 14, 2018
KNOWN ALL PERSONS BY THESE PRESENTS, that each person whose signature appears below constitutes and appoints David J. Sambrooks and Richard W. McCullough, each of whom may act without joinder of the other, as their true and lawful attorneys-in-fact and agents, each with full power of substitution and resubstitution, for such person and in his or her name, place and stead, in any and all capacities, to sign any and all amendments to this Annual Report on Form 10-K, and to file the same, with all exhibits thereto and other documents in connection therewith, with the Securities and Exchange Commission, granting unto said attorneys-in-fact and agents full power and authority to do and perform each and every act and thing requisite and necessary to be done in and about the premises, as fully to all intents and purposes as he might or could do in person, hereby ratifying and confirming all that said attorneys-in-fact and agents, or their substitutes, may lawfully do or cause to be done by virtue hereof.
Pursuant to the requirements of the Securities Exchange Act of 1934, this report has been signed below by the following persons on behalf of the registrant and in the capacities and on the dates indicated.
|
Signatures |
|
Title |
|
Date |
|
|
|
|
|
|
|
/s/ DAVID J. SAMBROOKS |
|
President, Chief Executive Officer and Director |
|
March 14, 2018 |
|
David J. Sambrooks |
|
(Principal Executive Officer) |
|
|
|
|
|
|
|
|
|
/s/ RICHARD W. MCCULLOUGH |
|
Vice President and Chief Accounting Officer |
|
March 14, 2018 |
|
Richard W. McCullough |
|
(Principal Financial Officer and Principal Accounting Officer) |
|
|
|
|
|
|
|
|
|
/s/ ALAN J. CARR |
|
Director (Chairman) |
|
March 14, 2018 |
|
Alan J. Carr |
|
|
|
|
|
|
|
|
|
|
|
/s/ PATRICE D. DOUGLAS |
|
Director |
|
March 14, 2018 |
|
Patrice D. Douglas |
|
|
|
|
|
|
|
|
|
|
|
/s/ NEAL P. GOLDMAN |
|
Director |
|
March 14, 2018 |
|
Neal P. Goldman |
|
|
|
|
|
|
|
|
|
|
|
/s/ MICHAEL S. REDDIN |
|
Director |
|
March 14, 2018 |
|
Michael S. Reddin |
|
|
|
|
|
|
|
|
|
|
|
/s/ TODD R. SNYDER |
|
Director |
|
March 14, 2018 |
|
Todd R. Snyder |
|
|
|
|
|
|
|
|
|
|
|
/s/ BRUCE H. VINCENT |
|
Director |
|
March 14, 2018 |
|
Bruce H. Vincent |
|
|
|
|
|
|
|
|
|
|
|
/s/ FREDERIC F. BRACE |
|
Director |
|
March 14, 2018 |
|
Frederic F. Brace |
|
|
|
|
MIDSTATES PETROLEUM COMPANY, INC.
INDEX TO CONSOLIDATED FINANCIAL STATEMENTS
|
|
Page |
|
F-2 | |
|
Consolidated balance sheets as of December 31, 2017 and 2016 |
F-4 |
|
F-5 | |
|
F-6 | |
|
F-7 | |
|
F-8 | |
|
F-44 | |
|
F-49 |
REPORT OF INDEPENDENT REGISTERED PUBLIC ACCOUNTING FIRM
Board of Directors and Stockholders
Midstates Petroleum Company, Inc.
Opinion on the financial statements
We have audited the accompanying consolidated balance sheets of Midstates Petroleum Company Inc. (a Delaware corporation) and subsidiary (the “Company”) as of December 31, 2017 and 2016, the related consolidated statements of operations, changes in stockholders’ equity (deficit), and cash flows for the year ended December 31, 2017 (Successor), the period from October 21, 2016 through December 31, 2016 (Successor) and the period from January 1, 2016 through October 20, 2016 (Predecessor), and the related notes (collectively referred to as the “financial statements”). In our opinion, the financial statements present fairly, in all material respects, the financial position of the Company as of December 31, 2017 and 2016, and the results of its operations and its cash flows for the year ended December 31, 2017 (Successor), the period from October 21, 2016 through December 31, 2016 (Successor) and the period from January 1, 2016 through October 20, 2016 (Predecessor), in conformity with accounting principles generally accepted in the United States of America.
We also have audited, in accordance with the standards of the Public Company Accounting Oversight Board (United States) (“PCAOB”), the Company’s internal control over financial reporting as of December 31, 2017, based on criteria established in the 2013 Internal Control—Integrated Framework issued by the Committee of Sponsoring Organizations of the Treadway Commission (“COSO”), and our report dated March 14, 2018 expressed an unqualified opinion.
Basis for opinion
These financial statements are the responsibility of the Company’s management. Our responsibility is to express an opinion on the Company’s financial statements based on our audits. We are a public accounting firm registered with the PCAOB and are required to be independent with respect to the Company in accordance with the U.S. federal securities laws and the applicable rules and regulations of the Securities and Exchange Commission and the PCAOB.
We conducted our audits in accordance with the standards of the PCAOB. Those standards require that we plan and perform the audit to obtain reasonable assurance about whether the financial statements are free of material misstatement, whether due to error or fraud. Our audits included performing procedures to assess the risks of material misstatement of the financial statements, whether due to error or fraud, and performing procedures that respond to those risks. Such procedures included examining, on a test basis, evidence supporting the amounts and disclosures in the financial statements. Our audits also included evaluating the accounting principles used and significant estimates made by management, as well as evaluating the overall presentation of the financial statements. We believe that our audits provide a reasonable basis for our opinion.
/s/ GRANT THORNTON LLP
We have served as the Company’s auditor since 2016.
Kansas City, Missouri
March 14, 2018
REPORT OF INDEPENDENT REGISTERED PUBLIC ACCOUNTING FIRM
To the Board of Directors and Stockholders of Midstates Petroleum Company, Inc.
Tulsa, Oklahoma
We have audited the accompanying consolidated statements of operations, changes in stockholders’ equity (deficit), and cash flows of Midstates Petroleum Company, Inc. and subsidiary (“Midstates”) for the year ended December 31, 2015. These financial statements are the responsibility of Midstates’ management. Our responsibility is to express an opinion on these financial statements based on our audit.
We conducted our audit in accordance with the standards of the Public Company Accounting Oversight Board (United States). Those standards require that we plan and perform the audit to obtain reasonable assurance about whether the financial statements are free of material misstatement. An audit includes examining, on a test basis, evidence supporting the amounts and disclosures in the financial statements. An audit also includes assessing the accounting principles used and significant estimates made by management, as well as evaluating the overall financial statement presentation. We believe that our audit provides a reasonable basis for our opinion.
In our opinion, such consolidated financial statements present fairly, in all material respects, the results of operations and cash flows of Midstates Petroleum Company, Inc. and subsidiary for the year ended December 31, 2015, in conformity with accounting principles generally accepted in the United States of America.
The accompanying 2015 consolidated financial statements have been prepared assuming that Midstates will continue as a going concern. Midstates’ event of default under the Credit Facility in 2015, a projected additional debt covenant violation, and resulting lack of liquidity as of December 31, 2015 raised substantial doubt about its ability to continue as a going concern. The consolidated financial statements for the year ended December 31, 2015 do not include any adjustments that might result from the outcome of this uncertainty.
/s/ DELOITTE & TOUCHE LLP
Houston, Texas
March 30, 2016
MIDSTATES PETROLEUM COMPANY, INC.
(In thousands, except share amounts)
|
|
|
December 31, 2017 |
|
December 31, 2016 |
| ||
|
ASSETS |
|
|
|
|
| ||
|
CURRENT ASSETS: |
|
|
|
|
| ||
|
Cash and cash equivalents |
|
$ |
68,498 |
|
$ |
76,838 |
|
|
Accounts receivable: |
|
|
|
|
| ||
|
Oil and gas sales |
|
32,455 |
|
36,988 |
| ||
|
Joint interest billing |
|
3,297 |
|
4,281 |
| ||
|
Other |
|
166 |
|
2,456 |
| ||
|
Commodity derivative contracts |
|
762 |
|
— |
| ||
|
Other current assets |
|
1,510 |
|
3,326 |
| ||
|
Total current assets |
|
106,688 |
|
123,889 |
| ||
|
PROPERTY AND EQUIPMENT: |
|
|
|
|
| ||
|
Oil and gas properties, on the basis of full-cost accounting |
|
|
|
|
| ||
|
Proved properties |
|
765,308 |
|
573,150 |
| ||
|
Unproved properties not being amortized |
|
7,065 |
|
65,080 |
| ||
|
Other property and equipment |
|
6,508 |
|
6,339 |
| ||
|
Less accumulated depreciation, depletion, amortization and impairment |
|
(204,419 |
) |
(12,974 |
) | ||
|
Net property and equipment |
|
574,462 |
|
631,595 |
| ||
|
OTHER NONCURRENT ASSETS |
|
6,978 |
|
5,455 |
| ||
|
TOTAL |
|
$ |
688,128 |
|
$ |
760,939 |
|
|
LIABILITIES AND EQUITY |
|
|
|
|
| ||
|
CURRENT LIABILITIES: |
|
|
|
|
| ||
|
Accounts payable |
|
$ |
11,547 |
|
$ |
2,521 |
|
|
Accrued liabilities |
|
42,842 |
|
53,731 |
| ||
|
Commodity derivative contracts |
|
3,433 |
|
— |
| ||
|
Total current liabilities |
|
57,822 |
|
56,252 |
| ||
|
LONG-TERM LIABILITIES: |
|
|
|
|
| ||
|
Asset retirement obligations |
|
15,506 |
|
14,200 |
| ||
|
Commodity derivative contracts |
|
562 |
|
— |
| ||
|
Long-term debt |
|
128,059 |
|
128,059 |
| ||
|
Other long-term liabilities |
|
592 |
|
614 |
| ||
|
Total long-term liabilities |
|
144,719 |
|
142,873 |
| ||
|
|
|
|
|
|
| ||
|
COMMITMENTS AND CONTINGENCIES (Note 16) |
|
|
|
|
| ||
|
|
|
|
|
|
| ||
|
STOCKHOLDERS’ EQUITY: |
|
|
|
|
| ||
|
Preferred stock, $0.01 par value, 50,000,000 shares authorized; no shares issued or outstanding at December 31, 2017 |
|
— |
|
— |
| ||
|
Warrants, 6,625,554 warrants outstanding at December 31, 2017 and 2016 |
|
37,329 |
|
37,329 |
| ||
|
Common stock, $0.01 par value, 250,000,000 shares authorized; 25,272,969 shares issued and 25,173,346 shares outstanding at December 31, 2017; and 24,994,867 shares issued and outstanding at December 31, 2016 |
|
253 |
|
250 |
| ||
|
Treasury stock |
|
(1,603 |
) |
— |
| ||
|
Additional paid-in-capital |
|
524,755 |
|
514,305 |
| ||
|
Retained earnings (deficit) |
|
(75,147 |
) |
9,930 |
| ||
|
Total stockholders’ equity |
|
485,587 |
|
561,814 |
| ||
|
TOTAL |
|
$ |
688,128 |
|
$ |
760,939 |
|
The accompanying notes are an integral part of these consolidated financial statements.
MIDSTATES PETROLEUM COMPANY, INC.
CONSOLIDATED STATEMENTS OF OPERATIONS
(In thousands, except per share amounts)
|
|
|
Successor |
|
|
Predecessor |
| ||||||||
|
|
|
For the |
|
For the Period |
|
|
For the Period |
|
For the |
| ||||
|
|
|
Year Ended |
|
through December |
|
|
through October |
|
Year Ended |
| ||||
|
REVENUES: |
|
|
|
|
|
|
|
|
|
| ||||
|
Oil sales |
|
$ |
117,083 |
|
$ |
25,549 |
|
|
$ |
112,628 |
|
$ |
217,636 |
|
|
Natural gas liquid sales |
|
44,112 |
|
8,391 |
|
|
27,473 |
|
38,249 |
| ||||
|
Natural gas sales |
|
59,708 |
|
13,635 |
|
|
48,318 |
|
66,823 |
| ||||
|
Gains on commodity derivative contracts—net |
|
3,659 |
|
— |
|
|
— |
|
40,960 |
| ||||
|
Other |
|
4,191 |
|
950 |
|
|
4,809 |
|
1,477 |
| ||||
|
Total revenues |
|
228,753 |
|
48,525 |
|
|
193,228 |
|
365,145 |
| ||||
|
EXPENSES: |
|
|
|
|
|
|
|
|
|
| ||||
|
Lease operating and workover |
|
63,287 |
|
15,324 |
|
|
52,803 |
|
81,473 |
| ||||
|
Gathering and transportation |
|
14,507 |
|
3,194 |
|
|
14,362 |
|
15,546 |
| ||||
|
Severance and other taxes |
|
8,869 |
|
1,286 |
|
|
5,210 |
|
8,605 |
| ||||
|
Asset retirement accretion |
|
1,100 |
|
210 |
|
|
1,414 |
|
1,610 |
| ||||
|
Depreciation, depletion, and amortization |
|
65,832 |
|
12,974 |
|
|
62,302 |
|
198,643 |
| ||||
|
Impairment in carrying value of oil and gas properties |
|
125,300 |
|
— |
|
|
232,108 |
|
1,625,776 |
| ||||
|
General and administrative |
|
29,352 |
|
4,864 |
|
|
22,362 |
|
38,703 |
| ||||
|
Acquisition and transaction costs |
|
— |
|
— |
|
|
— |
|
330 |
| ||||
|
Debt restructuring costs and advisory fees |
|
— |
|
— |
|
|
7,590 |
|
36,141 |
| ||||
|
Other |
|
— |
|
— |
|
|
— |
|
2,121 |
| ||||
|
Total expenses |
|
308,247 |
|
37,852 |
|
|
398,151 |
|
2,008,948 |
| ||||
|
OPERATING INCOME (LOSS) |
|
(79,494 |
) |
10,673 |
|
|
(204,923 |
) |
(1,643,803 |
) | ||||
|
OTHER INCOME (EXPENSE): |
|
|
|
|
|
|
|
|
|
| ||||
|
Interest income |
|
9 |
|
— |
|
|
81 |
|
115 |
| ||||
|
Interest expense—net of amounts capitalized (Predecessor Period excludes interest expense of $89.5 million on senior and secured notes) |
|
(5,592 |
) |
(743 |
) |
|
(66,360 |
) |
(163,148 |
) | ||||
|
Reorganization items, net (Note 3) |
|
— |
|
— |
|
|
1,594,281 |
|
— |
| ||||
|
Total other income (expense) |
|
(5,583 |
) |
(743 |
) |
|
1,528,002 |
|
(163,033 |
) | ||||
|
INCOME (LOSS) BEFORE TAXES |
|
(85,077 |
) |
9,930 |
|
|
1,323,079 |
|
(1,806,836 |
) | ||||
|
Income tax benefit |
|
— |
|
— |
|
|
— |
|
9,641 |
| ||||
|
NET INCOME (LOSS) |
|
$ |
(85,077 |
) |
$ |
9,930 |
|
|
$ |
1,323,079 |
|
$ |
(1,797,195 |
) |
|
Predecessor preferred stock dividend |
|
— |
|
— |
|
|
— |
|
(948 |
) | ||||
|
Predecessor participating securities—non-vested restricted stock |
|
— |
|
— |
|
|
(16,522 |
) |
— |
| ||||
|
Successor participating securities— non-vested restricted stock |
|
— |
|
(280 |
) |
|
— |
|
— |
| ||||
|
NET INCOME (LOSS) ATTRIBUTABLE TO COMMON SHAREHOLDERS |
|
$ |
(85,077 |
) |
$ |
9,650 |
|
|
$ |
1,306,557 |
|
$ |
(1,798,143 |
) |
|
Basic and diluted net income (loss) per share attributable to common shareholders |
|
$ |
(3.39 |
) |
$ |
0.39 |
|
|
$ |
122.74 |
|
$ |
(232.74 |
) |
|
Basic and diluted weighted average number of common shares outstanding (Note 14) |
|
25,119 |
|
25,009 |
|
|
10,645 |
|
7,726 |
| ||||
The accompanying notes are an integral part of these consolidated financial statements.
MIDSTATES PETROLEUM COMPANY, INC.
CONSOLIDATED STATEMENT OF CHANGES IN STOCKHOLDERS’ EQUITY (DEFICIT)
(See Notes 11 and 12 for share history)
(In thousands)
|
|
|
Series A |
|
Common |
|
Warrants |
|
Treasury |
|
Additional |
|
Retained |
|
Total |
| |||||||
|
Balance as of December 31, 2014 (Predecessor) |
|
$ |
3 |
|
$ |
70 |
|
$ |
— |
|
$ |
(2,592 |
) |
$ |
882,528 |
|
$ |
(414,147 |
) |
$ |
465,862 |
|
|
Share-based compensation |
|
— |
|
3 |
|
— |
|
— |
|
5,753 |
|
— |
|
5,756 |
| |||||||
|
Acquisition of treasury stock |
|
— |
|
— |
|
— |
|
(489 |
) |
— |
|
— |
|
(489 |
) | |||||||
|
Net loss |
|
— |
|
— |
|
— |
|
— |
|
— |
|
(1,797,195 |
) |
(1,797,195 |
) | |||||||
|
Conversion of preferred shares |
|
(3 |
) |
37 |
|
— |
|
— |
|
(34 |
) |
— |
|
— |
| |||||||
|
Balance as of December 31, 2015 (Predecessor) |
|
$ |
— |
|
$ |
110 |
|
$ |
— |
|
$ |
(3,081 |
) |
$ |
888,247 |
|
$ |
(2,211,342 |
) |
$ |
(1,326,066 |
) |
|
Share-based compensation |
|
— |
|
(6 |
) |
— |
|
— |
|
3,045 |
|
— |
|
3,039 |
| |||||||
|
Acquisition of treasury stock |
|
— |
|
— |
|
— |
|
(53 |
) |
— |
|
— |
|
(53 |
) | |||||||
|
Net income |
|
— |
|
— |
|
— |
|
— |
|
— |
|
1,323,079 |
|
1,323,079 |
| |||||||
|
Balance as of October 21, 2016 (Predecessor) |
|
$ |
— |
|
$ |
104 |
|
$ |
— |
|
$ |
(3,134 |
) |
$ |
891,292 |
|
$ |
(888,263 |
) |
$ |
(1 |
) |
|
Cancellation of predecessor equity |
|
— |
|
(104 |
) |
— |
|
3,134 |
|
(891,292 |
) |
888,263 |
|
1 |
| |||||||
|
Balance as of October 21, 2016 (Predecessor) |
|
$ |
— |
|
$ |
— |
|
$ |
— |
|
$ |
— |
|
$ |
— |
|
$ |
— |
|
$ |
— |
|
|
Issuance of successor common stock |
|
— |
|
247 |
|
— |
|
— |
|
510,905 |
|
— |
|
511,152 |
| |||||||
|
Issuance of successor warrants |
|
— |
|
— |
|
37,329 |
|
— |
|
— |
|
— |
|
37,329 |
| |||||||
|
Balance as of October 21, 2016 (Successor) |
|
$ |
— |
|
$ |
247 |
|
$ |
37,329 |
|
$ |
— |
|
$ |
510,905 |
|
$ |
— |
|
$ |
548,481 |
|
|
Issuance of successor common stock |
|
— |
|
3 |
|
— |
|
— |
|
— |
|
— |
|
3 |
| |||||||
|
Share-based compensation |
|
— |
|
— |
|
— |
|
— |
|
3,400 |
|
— |
|
3,400 |
| |||||||
|
Net income |
|
— |
|
— |
|
— |
|
— |
|
— |
|
9,930 |
|
9,930 |
| |||||||
|
Balance as of December 31, 2016 (Successor) |
|
$ |
— |
|
$ |
250 |
|
$ |
37,329 |
|
$ |
— |
|
$ |
514,305 |
|
$ |
9,930 |
|
$ |
561,814 |
|
|
Share-based compensation |
|
— |
|
3 |
|
— |
|
— |
|
10,450 |
|
— |
|
10,453 |
| |||||||
|
Acquisition of treasury stock |
|
— |
|
— |
|
— |
|
(1,603 |
) |
— |
|
— |
|
(1,603 |
) | |||||||
|
Net loss |
|
— |
|
— |
|
— |
|
— |
|
— |
|
(85,077 |
) |
(85,077 |
) | |||||||
|
Balance as of December 31, 2017 (Successor) |
|
$ |
— |
|
$ |
253 |
|
$ |
37,329 |
|
$ |
(1,603 |
) |
$ |
524,755 |
|
$ |
(75,147 |
) |
$ |
485,587 |
|
The accompanying notes are an integral part of these consolidated financial statements.
MIDSTATES PETROLEUM COMPANY, INC.
CONSOLIDATED STATEMENTS OF CASH FLOWS
(In thousands)
|
|
|
Successor |
|
|
Predecessor |
| ||||||||
|
|
|
Year Ended |
|
For the Period |
|
|
For the Period |
|
Year Ended |
| ||||
|
CASH FLOWS FROM OPERATING ACTIVITIES: |
|
|
|
|
|
|
|
|
|
| ||||
|
Net income (loss) |
|
$ |
(85,077 |
) |
$ |
9,930 |
|
|
$ |
1,323,079 |
|
$ |
(1,797,195 |
) |
|
Adjustments to reconcile net income/(loss) to net cash provided by operating activities: |
|
|
|
|
|
|
|
|
|
| ||||
|
Gains on commodity derivative contracts—net |
|
(3,659 |
) |
— |
|
|
— |
|
(40,960 |
) | ||||
|
Net cash received for commodity derivative contracts not designated as hedging instruments |
|
6,891 |
|
— |
|
|
— |
|
167,669 |
| ||||
|
Asset retirement accretion |
|
1,100 |
|
210 |
|
|
1,414 |
|
1,610 |
| ||||
|
Depreciation, depletion, and amortization |
|
65,832 |
|
12,974 |
|
|
62,302 |
|
198,643 |
| ||||
|
Impairment in carrying value of oil and gas properties |
|
125,300 |
|
— |
|
|
232,108 |
|
1,625,776 |
| ||||
|
Share-based compensation, net of amounts capitalized to oil and gas properties |
|
9,196 |
|
2,909 |
|
|
2,564 |
|
4,408 |
| ||||
|
Deferred income taxes |
|
— |
|
— |
|
|
— |
|
(9,641 |
) | ||||
|
Amortization of deferred financing costs |
|
385 |
|
63 |
|
|
4,587 |
|
11,316 |
| ||||
|
Paid-in-kind interest expense |
|
— |
|
— |
|
|
3,531 |
|
6,415 |
| ||||
|
Amortization of deferred gain on debt restructuring |
|
— |
|
— |
|
|
(8,246 |
) |
(14,948 |
) | ||||
|
Operating lease abandonment |
|
— |
|
— |
|
|
1,574 |
|
— |
| ||||
|
Non-cash reorganization items |
|
— |
|
— |
|
|
(1,630,873 |
) |
— |
| ||||
|
Transaction costs for debt restructuring |
|
— |
|
— |
|
|
— |
|
34,398 |
| ||||
|
Change in operating assets and liabilities: |
|
|
|
|
|
|
|
|
|
| ||||
|
Accounts receivable—oil and gas sales |
|
2,766 |
|
(115 |
) |
|
(2,391 |
) |
26,437 |
| ||||
|
Accounts receivable—JIB and other |
|
3,362 |
|
(1,812 |
) |
|
22,002 |
|
22,833 |
| ||||
|
Other current and noncurrent assets |
|
283 |
|
1,783 |
|
|
(5,868 |
) |
590 |
| ||||
|
Accounts payable |
|
2,961 |
|
(1,555 |
) |
|
1,797 |
|
(4,176 |
) | ||||
|
Accrued liabilities |
|
(8,973 |
) |
(740 |
) |
|
55,160 |
|
(20,887 |
) | ||||
|
Other |
|
(765 |
) |
(3 |
) |
|
(743 |
) |
1,095 |
| ||||
|
Net cash provided by operating activities |
|
$ |
119,602 |
|
$ |
23,644 |
|
|
$ |
61,997 |
|
$ |
213,383 |
|
|
CASH FLOWS FROM INVESTING ACTIVITIES: |
|
|
|
|
|
|
|
|
|
| ||||
|
Investment in property and equipment |
|
$ |
(130,199 |
) |
$ |
(23,346 |
) |
|
$ |
(133,307 |
) |
$ |
(336,922 |
) |
|
Proceeds from the sale of oil and gas properties |
|
4,235 |
|
— |
|
|
— |
|
42,366 |
| ||||
|
Net cash used in investing activities |
|
$ |
(125,964 |
) |
$ |
(23,346 |
) |
|
$ |
(133,307 |
) |
$ |
(294,556 |
) |
|
CASH FLOWS FROM FINANCING ACTIVITIES: |
|
|
|
|
|
|
|
|
|
| ||||
|
Proceeds from long-term borrowings |
|
$ |
— |
|
$ |
— |
|
|
$ |
— |
|
$ |
625,000 |
|
|
Proceeds from revolving credit facility |
|
— |
|
— |
|
|
249,384 |
|
33,000 |
| ||||
|
Repayment of long-term borrowings |
|
— |
|
— |
|
|
(60,000 |
) |
— |
| ||||
|
Repayment of revolving credit facility |
|
— |
|
— |
|
|
(121,324 |
) |
(468,150 |
) | ||||
|
Deferred financing costs |
|
(375 |
) |
— |
|
|
(1,250 |
) |
(4,254 |
) | ||||
|
Transaction costs for debt restructuring |
|
— |
|
— |
|
|
— |
|
(34,398 |
) | ||||
|
Repurchase of restricted stock for tax withholdings |
|
(1,603 |
) |
— |
|
|
(53 |
) |
(489 |
) | ||||
|
Net cash (used in) provided by financing activities |
|
$ |
(1,978 |
) |
$ |
— |
|
|
$ |
66,757 |
|
$ |
150,709 |
|
|
NET INCREASE (DECREASE) IN CASH AND CASH EQUIVALENTS |
|
$ |
(8,340 |
) |
$ |
298 |
|
|
$ |
(4,553 |
) |
$ |
69,536 |
|
|
Cash and cash equivalents, beginning of period |
|
$ |
76,838 |
|
$ |
76,540 |
|
|
$ |
81,093 |
|
$ |
11,557 |
|
|
Cash and cash equivalents, end of period |
|
$ |
68,498 |
|
$ |
76,838 |
|
|
$ |
76,540 |
|
$ |
81,093 |
|
The accompanying notes are an integral part of these consolidated financial statements.
MIDSTATES PETROLEUM COMPANY, INC.
Notes to Consolidated Financial Statements
1. Organization and Business
Midstates Petroleum Company, Inc. engages in the business of drilling for, and the production of, oil, natural gas liquids (“NGLs”) and natural gas in Oklahoma and Texas. Midstates Petroleum Company, Inc. was incorporated pursuant to the laws of the State of Delaware on October 25, 2011 to become a holding company for Midstates Petroleum Company LLC (“Midstates Sub”), which was previously a wholly-owned subsidiary of Midstates Petroleum Holdings LLC (“Holdings LLC”). Pursuant to the terms of a corporate reorganization that was completed in connection with the closing of Midstates Petroleum Company, Inc.’s initial public offering, all of the interests in Midstates Petroleum Holdings LLC were exchanged for newly issued common shares of Midstates Petroleum Company, Inc., and as a result, Midstates Petroleum Company LLC became a wholly-owned subsidiary of Midstates Petroleum Company, Inc. and Midstates Petroleum Holdings LLC ceased to exist as a separate entity. The terms “Company,” “we,” “us,” “our,” and similar terms when used in the present tense, prospectively or for historical periods since April 25, 2012, refer to Midstates Petroleum Company, Inc. and its subsidiary.
On April 21, 2015, the Company closed the sale of all of its ownership interest in its Dequincy assets, which constituted its remaining producing and proved reserve properties in Louisiana (the “Dequincy Divestiture”) to Pintail Oil and Gas LLC. The net proceeds, inclusive of amounts placed in escrow, were approximately $42.4 million. With the completion of the Dequincy Divestiture, the Company no longer has any operations in the Louisiana/Gulf Coast area.
On February 3, 2016, the Company received notice from the New York Stock Exchange (“NYSE”) that the Company’s common stock no longer met the NYSE continued listing requirements. As a result, the Company’s common stock was automatically delisted from the NYSE and began trading on an over the counter exchange under the symbol “MPOY”. On April 30, 2016, the Company filed voluntary petitions for reorganization under Chapter 11 of the United States Bankruptcy Code. On October 21, 2016, in connection with the Company’s emergence from Chapter 11, its existing common shares traded under the symbol MPOY were cancelled and on October 24, 2016, its new common shares issued in connection with the successful reorganization and emergence from Chapter 11 were listed and began trading on the NYSE MKT under the symbol “MPO”. On May 4, 2017, the Company’s common stock began trading on the NYSE under the symbol “MPO”.
2. Emergence from Voluntary Reorganization under Chapter 11 Proceedings
On April 30, 2016 (the “Petition Date”), the Company filed voluntary petitions for reorganization under Chapter 11 of the United States Bankruptcy Code (the “Bankruptcy Code”) in the United States Bankruptcy Court for the Southern District of Texas (the “Bankruptcy Court”). The Company’s Chapter 11 cases (the “Chapter 11 Cases”) were jointly administered under the case styled In re Midstates Petroleum Company, Inc., et al., Case No. 16-32237. On September 28, 2016, the Bankruptcy Court entered the Findings of Fact, Conclusions of Law, and Order Confirming Debtors’ First Amended Joint Chapter 11 Plan of Reorganization of Midstates Petroleum Company, Inc. and its Debtor Affiliate (the “Confirmation Order”), which approved and confirmed the First Amended Joint Chapter 11 Plan of Reorganization of Midstates Petroleum Company, Inc. and its Debtor Affiliate as filed on the same date (the “Plan”). On October 21, 2016 (the “Effective Date”), the Company satisfied the conditions to effectiveness set forth in the Confirmation Order and in the Plan, and, as a result, the Plan became effective in accordance with its terms and the Company emerged from the Chapter 11 Cases.
Plan of Reorganization
Pursuant to the confirmed Plan, the significant transactions that occurred upon the Effective Date were as follows:
· Substantial Deleveraging of the Balance Sheet: (i) The permanent pay-down of $81.3 million of the Company’s revolving credit facility (“RBL”), with a $170.0 million exit facility (the “Exit Facility”) established upon the Effective Date, (ii) the pay-down of $60.0 million of the Company’s Second Lien Notes in cash and (iii) the conversion into equity of all of the Company’s remaining debt junior to the RBL;
· Credit Facility Claims: Holders of allowed claims arising under the RBL (the “Credit Facility Claims”) received their pro rata share of approximately $81.3 million in cash and the RBL was superseded, pursuant to the Plan, by the Exit Facility, as further described below;
· Second Lien Notes Claims: Holders of allowed claims arising under the Second Lien Notes (the “Second Lien Notes Claims”) received their pro rata share of (i) 96.25% of the reorganized equity in the form of common stock and (ii) a cash payment of $60.0 million;
· Third Lien Notes Claims: Holders of allowed claims arising under the Third Lien Notes (the “Third Lien Notes Claims”), pursuant to a settlement with holders of Second Lien Notes Claims on terms more fully set forth in the Plan (the “Second/Third Lien Plan Settlement”), received their pro rata share of 2.5% of the reorganized equity in the form of common stock and warrants to acquire 4,411,765 shares of common stock at a strike price of $24.00 per common share with an expiration date 42 months after the Effective Date;
· Unsecured Claims: Holders (the “Unsecured Noteholders”) of allowed claims arising under the Debtors’ 10.75% Senior Unsecured Notes due 2020 (the “2020 Notes Claims”), the holders of allowed claims arising under the 9.25% Senior Unsecured Notes due 2021 (the “2021 Notes Claims” and together with the 2020 Notes Claims, the “Unsecured Notes Claims”), and the Holders of other general unsecured claims received their pro rata share of 1.25% of reorganized equity in the form of common stock and warrants to acquire 2,213,789 shares of common stock (the “Unencumbered Assets Equity Distribution”) at a strike price of $46.00 per common share with an expiration date 42 months after the Effective Date;
· Existing Equity: All existing equity interests were extinguished and existing equity holders did not receive any consideration in respect of their equity interests;
· New Equity: On the Effective Date, the Company issued 24,687,500 shares of common stock of the reorganized Company. On November 9, 2016, the Company issued an additional 294,967 shares of common stock of the reorganized Company pursuant to the Plan. The Company will issue 17,533 additional common shares, with respect to general unsecured claims, pursuant to the Plan in a future distribution. The total authorized reorganized capital stock consists of 250,000,000 shares of common stock and 50,000,000 shares of preferred stock;
· Exit Facility: The Company’s RBL, which was redetermined with a borrowing base of $170.0 million in April 2016, was superseded, pursuant to the Plan, by the Exit Facility. See “—Note 10. Debt” for further information regarding the Exit Facility; and
· Long-Term Incentive Plan: A management equity incentive plan (the “2016 LTIP”) was established under which 10.0% of the reorganized equity (on a fully-diluted/fully-distributed basis) was reserved for grants to be made from time to time to the directors, officers, and other members of management.
3. Fresh Start Accounting
Upon emergence on the Effective Date, the Company adopted fresh start accounting as required by generally accepted accounting principles in the United States (“US GAAP”). The Company qualified for fresh start accounting because (i) the holders of existing voting shares of the pre-emergence debtor-in-possession received less than 50% of the voting shares of the post-emergence successor entity and (ii) the reorganization value of the Company’s assets immediately prior to confirmation was less than the post-petition liabilities and allowed claims. The Company applied fresh start accounting as of October 21, 2016, the Effective Date.
Adopting fresh start accounting results in a new reporting entity for financial reporting purposes with no beginning retained earnings or deficit. The cancellation of all existing shares outstanding on the Effective Date and issuance of new shares in the reorganized Company caused a related change of control under US GAAP. As a result of the application of fresh start accounting, as well as the effects of the implementation of the Plan, the Company’s consolidated financial statements on or after October 21, 2016, are not comparable with the consolidated financial statements prior to that date. References to “Successor Period” relate to the financial position and results of operations for the period October 21, 2016 through December 31, 2016 and references to “Predecessor Period” refer to the financial position and results of operations of the Company from January 1, 2016 through October 20, 2016.
Reorganization Value
Reorganization value represents the fair value of the Company’s total assets prior to the consideration of liabilities and is intended to approximate the amount a willing buyer would pay for the Company’s assets immediately after restructuring. The reorganization value was allocated to the Company’s individual assets based on their estimated fair values.
The Company’s reorganization value was derived from its enterprise value. Enterprise value represents the estimated fair value of an entity’s long-term debt and equity. The enterprise value of the Company on the Effective Date, as approved by the Bankruptcy Court in support of the Plan, was estimated to be within a range of $500.0 million to $700.0 million, with a mid-point value of $600.0 million. Based upon the various estimates and assumptions necessary for fresh start accounting, as further discussed below, the estimated enterprise value was determined to be $600.0 million before consideration of cash and cash equivalents and outstanding debt at the Effective Date. As a result, the reorganization value was determined to be $751.3 million at the Effective Date, as reconciled below.
Valuation of Oil and Gas Properties
The Company’s principal assets are its oil and gas properties, which the Company accounts for under the full cost accounting method as described in “—Note 4. Summary of Significant Accounting Policies”. With the assistance of valuation experts, the Company determined the fair value of its oil and gas properties based on the discounted net cash flows expected to be generated from these assets. The computations were based on market conditions and reserves in place as of the Effective Date.
The foundation for the computation of the fair value of the Company was a reserves report prepared by its independent reserve auditors. The engineering assumptions contained within this reserves report were consistent with both (i) previous engineering assumptions made by the Company when preparing reserve reports in prior years and (ii) assumptions promulgated by the Securities and Exchange Commission (“SEC”). These assumptions include type curves and analogous reservoir characteristics determined utilizing electrical logs, radioactivity logs, core analyses, geologic maps and available downhole and production data, seismic data and well test data, among others.
Upon completion of the Company’s reserves report, it utilized outside third-party experts to assist management in the preparation of a valuation report utilizing assumptions consistent with a market participant. This valuation report utilized the income approach in determining the fair value of the Company’s oil and gas reserves, excluding possible reserves, for which the market approach was utilized. The income approach involves the projection of cash flows a market participant would expect an asset or business to generate over its remaining useful life. Cash flows are projected on an annual basis for a discrete period of time and then converted to their present value using a rate of return that captures the relevant risk of achieving the projected cash flows. Finally, the present value of the residual value, or terminal value, is added to these discrete cash flows to arrive at the estimate of total value. The market approach measures value through the use of prices, market multiples and other relevant information involving identical or comparable assets or business interests. The significant assumptions utilized within the valuation report included the following:
· Pricing—The Company utilized pricing based on the six year New York Mercantile Exchange strip as of the Effective Date. NGL prices were based upon a historical percentage correlation of the price of West Texas Intermediate to the price of a Y-grade barrel. Prices beyond six years were escalated at 2.0% to account for inflation. Price differentials that have been calculated utilizing historical results were applied to account for quality and transportation differentials.
· Weighted-Average Cost of Capital (“WACC”)—The WACC reflects the required return of capital providers, both debt and equity. Eight guideline companies were selected that had operations in the Mid-Continent area and were organized as C-corporations. A cost of equity was calculated using a capital asset pricing model, in which the cost of equity equals a risk-free rate plus a risk premium that is reflective of the asset or business interest. The risk free rate utilized was 2.2% based upon the normalized 20-year U.S. Treasury Bond rate as of the Effective Date. The risk premium was calculated utilizing three primary inputs. First, a beta was determined based upon the respective two-year weekly betas for each guideline company, adjusted for debt of their capital structures and then re-levered using the selected Company capital structure. Next, a market risk premium of 6.0% was utilized based upon industry data. Finally, a size premium of 3.6% was applied based upon the size of the interest in the assets of the Company utilizing industry data. A cost of debt was then calculated to be approximately 7.0% based upon the weighted average energy yield of the guideline companies at the Effective Date and then adjusted for a 35.0% tax effective to arrive at an estimated after-tax cost of debt of 4.6%. Based upon these inputs, the capital asset pricing model arrived at a WACC of 11.0%, which was utilized by the Company in its determination of fair value.
· Operating and Other Costs—Operating costs from the reserves report prepared by the Company were escalated by 2.0% to account for inflation. Ad valorem and production taxes were estimated as a percentage of revenue and applied to the forward price adjusted revenues. Corporate general and administrative costs were estimated based a blend of historical general and administrative expenses and forecasts of such expenses for the next five years. Corporate general and administrative expenses were escalated at 2.0% after five years to account for inflation.
· Capital Expenditures—Capital expenditures were based upon the average historical capital expended by the Company in the development of its wells and were escalated by 2.0% to account for inflation.
· Possible Reserves—The Company utilized the guideline transaction method to determine the value of possible reserve acreage. In determining the value of possible reserve acreage, the Company utilized data from widely utilized industry sources as well as data from other relevant transactions in the area. These industry sources publish oil and gas lease data compiled from private transactions, federal oil and gas lease sales as well as state oil and gas lease sales. The Company then utilized this data to arrive at a range of acreage values for each county.
Based upon the analysis completed by the Company with the assistance of outside third-party valuation experts, it concluded the fair value of its proved reserves was $539.0 million and the value of its probable and possible reserves, characterized as unproved properties, was $66.2 million as of the Effective Date.
The following table presents the estimated fair value of the Company’s stock as of the Effective Date (in thousands, except per share value):
|
|
|
As of |
| |
|
Enterprise value |
|
$ |
600,000 |
|
|
Plus: Cash and cash equivalents |
|
76,540 |
| |
|
Less: Fair value of debt |
|
(128,059 |
) | |
|
Less: Fair value of warrants |
|
(37,329 |
) | |
|
Fair value of stock on the Effective Date |
|
$ |
511,152 |
|
|
|
|
|
| |
|
Total shares issuable under the Plan |
|
25,000 |
| |
|
Restricted shares granted under 2016 LTIP at October 21, 2016 |
|
686 |
| |
|
Total shares |
|
25,686 |
| |
|
|
|
|
| |
|
Per share value (1) |
|
$ |
19.90 |
|
(1) The per share value shown above was calculated based upon the financial information determined using US GAAP at the Effective Date. The fair value per share agreed upon by the parties to the Chapter 11 Cases at the Effective Date was determined to be $19.66 per common share.
On the Effective Date, the Company entered into (i) a warrant agreement with holders of Allowed Third Lien Notes Claims (the “Third Lien Notes Warrant Agreement”) with respect to third lien warrants (the “Third Lien Notes Warrants”) and (ii) a warrant agreement with holders of Allowed Unsecured Notes Claims and Allowed General Unsecured Claims (the “Unsecured Creditor Warrant Agreement”, and together with the Third Lien Notes Warrant Agreement, the “Warrant Agreements”) with respect to warrants (the “Unsecured Creditor Warrants”, and together with the Third Lien Notes Warrants, the “Warrants”).
At the Effective Date, the Company issued 4,411,765 Third Lien Notes Warrants allowing for the purchase of up to an aggregate of 4,411,765 shares of common stock at an initial exercise price of $24.00 per share, and 2,213,789 Unsecured Creditor Warrants allowing for the purchase of up to an aggregate of 2,213,789 shares of common stock at an initial exercise price of $46.00 per share. The Warrants expire on April 21, 2020.
The Company utilized the Black-Scholes-Merton option pricing model to determine the fair value of the Warrants. Determining the fair value of the Warrants required judgment, including estimating the expected term and the associated volatility.
The assumptions used to estimate the fair value the Warrants are as follows:
|
|
|
Third Lien Notes |
|
Unsecured |
| |||
|
Risk-free interest rate (1) |
|
1.04 |
% |
1.04 |
% | |||
|
Dividend yield |
|
— |
|
— |
| |||
|
Expected life (2) |
|
3.50 |
|
3.50 |
| |||
|
Expected volatility (3) |
|
55.0 |
% |
55.0 |
% | |||
|
Strike Price |
|
$ |
24.00 |
|
$ |
|
46.00 |
|
|
Calculated fair value |
|
$ |
6.74 |
|
$ |
|
3.42 |
|
(1) U.S. Treasury yields as of the grant date were utilized for the risk-free interest rate assumption, matching the treasury yield terms to the expected life of the option.
(2) The expected life assumption was based upon the years until expiration of the Warrants.
(3) The Company utilized six peer companies of comparable size and industry to estimate asset volatility utilizing a period that is commensurate with the expected Warrant life. The Company weighted historical volatility and implied volatility 50/50 for those peer companies where both were available, with asset volatility ranging in the peer companies from 30.1% to 54.2%. The derived asset volatility was selected based upon the midpoint of the average and the third quartile of the peer group, and then relevered the utilizing the Company’s asset and equity information as of the Effective Date.
The following table reconciles the enterprise value to the estimated reorganization value as of the Effective Date (in thousands):
|
|
|
As of |
| |
|
Enterprise value |
|
$ |
600,000 |
|
|
Plus: cash and cash equivalents |
|
76,540 |
| |
|
Plus: other working capital liabilities |
|
60,118 |
| |
|
Plus: other long-term liabilities |
|
14,600 |
| |
|
Reorganization value |
|
$ |
751,258 |
|
Consolidated Balance Sheet
The following consolidated balance sheet is as of October 21, 2016. This consolidated balance sheet includes adjustments that reflect the consummation of the transactions contemplated by the Plan (reflected in the column “Reorganization Adjustments”) as well as fair value adjustments as a result of the adoption of fresh start accounting (reflected in the column “Fresh Start Adjustments”) as of the Effective Date (in thousands):
|
|
|
Predecessor |
|
Reorganization |
|
|
Fresh Start |
|
|
Successor |
| ||||
|
ASSETS |
|
|
|
|
|
|
|
|
|
|
| ||||
|
CURRENT ASSETS: |
|
|
|
|
|
|
|
|
|
|
| ||||
|
Cash and cash equivalents |
|
$ |
274,530 |
|
$ |
(197,990 |
){a} |
|
$ |
— |
|
|
$ |
76,540 |
|
|
Accounts receivable: |
|
|
|
|
|
|
|
|
|
|
| ||||
|
Oil and gas sales |
|
33,895 |
|
— |
|
|
— |
|
|
33,895 |
| ||||
|
Joint interest billing |
|
4,739 |
|
— |
|
|
— |
|
|
4,739 |
| ||||
|
Other |
|
26 |
|
— |
|
|
— |
|
|
26 |
| ||||
|
Other current assets |
|
8,425 |
|
(2,748 |
){b} |
|
— |
|
|
5,677 |
| ||||
|
Total current assets |
|
321,615 |
|
(200,738 |
) |
|
— |
|
|
120,877 |
| ||||
|
|
|
|
|
|
|
|
|
|
|
|
| ||||
|
PROPERTY AND EQUIPMENT: |
|
|
|
|
|
|
|
|
|
|
| ||||
|
Oil and gas properties, on the basis of full-cost accounting |
|
3,795,943 |
|
— |
|
|
(3,176,723 |
){h} |
|
619,220 |
| ||||
|
Other property and equipment |
|
12,175 |
|
— |
|
|
(5,965 |
){h} |
|
6,210 |
| ||||
|
Less accumulated depreciation, depletion, amortization and impairment |
|
(3,449,241 |
) |
— |
|
|
3,449,241 |
{h} |
|
— |
| ||||
|
Net property and equipment |
|
358,877 |
|
— |
|
|
266,553 |
|
|
625,430 |
| ||||
|
|
|
|
|
|
|
|
|
|
|
|
| ||||
|
OTHER NONCURRENT ASSETS |
|
3,701 |
|
1,250 |
{c} {a} |
|
— |
|
|
4,951 |
| ||||
|
TOTAL |
|
$ |
684,193 |
|
$ |
(199,488 |
) |
|
$ |
266,553 |
|
|
$ |
751,258 |
|
|
|
|
|
|
|
|
|
|
|
|
|
| ||||
|
LIABILITIES AND STOCKHOLDERS’ EQUITY/(DEFICIT) |
|
|
|
|
|
|
|
|
|
|
| ||||
|
CURRENT LIABILITIES: |
|
|
|
|
|
|
|
|
|
|
| ||||
|
Accounts payable |
|
$ |
10,294 |
|
$ |
— |
|
|
$ |
— |
|
|
$ |
10,294 |
|
|
Accrued liabilities |
|
65,240 |
|
(15,416 |
){a} |
|
— |
|
|
49,824 |
| ||||
|
Debt classified as current |
|
249,384 |
|
(249,384 |
){a} {d} |
|
— |
|
|
— |
| ||||
|
Total current liabilities |
|
324,918 |
|
(264,800 |
) |
|
— |
|
|
60,118 |
| ||||
|
|
|
|
|
|
|
|
|
|
|
|
| ||||
|
ASSET RETIREMENT OBLIGATIONS |
|
20,368 |
|
— |
|
|
(6,385 |
){h} |
|
13,983 |
| ||||
|
OTHER LONG-TERM LIABILITIES |
|
617 |
|
128,059 |
{d} |
|
— |
|
|
128,676 |
| ||||
|
LIABILITIES SUBJECT TO COMPROMISE |
|
1,882,187 |
|
(1,882,187 |
){e} {a} |
|
— |
|
|
— |
| ||||
|
|
|
|
|
|
|
|
|
|
|
|
| ||||
|
COMMITMENTS AND CONTINGENCIES |
|
|
|
|
|
|
|
|
|
|
| ||||
|
|
|
|
|
|
|
|
|
|
|
|
| ||||
|
STOCKHOLDERS’ EQUITY/(DEFICIT): |
|
|
|
|
|
|
|
|
|
|
| ||||
|
Preferred stock |
|
— |
|
— |
|
|
— |
|
|
— |
| ||||
|
Warrants |
|
— |
|
37,329 |
{e} |
|
— |
|
|
37,329 |
| ||||
|
Common stock - predecessor |
|
104 |
|
(104 |
){f} |
|
— |
|
|
— |
| ||||
|
Common stock - successor |
|
— |
|
247 |
{f} |
|
— |
|
|
247 |
| ||||
|
Treasury stock |
|
(3,134 |
) |
3,134 |
{f} |
|
— |
|
|
— |
| ||||
|
Additional paid-in-capital - predecessor |
|
891,292 |
|
(891,292 |
){f} |
|
— |
|
|
— |
| ||||
|
Additional paid-in-capital - successor |
|
— |
|
510,905 |
{f} |
|
— |
|
|
510,905 |
| ||||
|
Retained deficit |
|
(2,432,159 |
) |
2,159,221 |
{g} |
|
272,938 |
{i} |
|
— |
| ||||
|
Total stockholders’ equity/(deficit) |
|
(1,543,897 |
) |
1,819,440 |
|
|
272,938 |
|
|
548,481 |
| ||||
|
TOTAL |
|
$ |
684,193 |
|
$ |
(199,488 |
) |
|
$ |
266,553 |
|
|
$ |
751,258 |
|
Reorganization Adjustments
{a} Adjustments reflect the following net cash payments recorded as of the Effective Date from implementation of the Plan (in thousands):
|
Uses: |
|
|
| |
|
Cash pay down of RBL |
|
$ |
81,324 |
|
|
Cash payment to holders of Second Lien Notes Claims |
|
60,000 |
| |
|
Cash payment to the RBL lenders in consideration of a temporary reduction in the amount available to be drawn under the Exit Facility |
|
40,000 |
| |
|
Payment to escrow for professional fees related to the Plan incurred through the Effective Date |
|
15,416 |
| |
|
Debt issuance costs associated with the Exit Facility |
|
1,250 |
| |
|
Total uses |
|
$ |
197,990 |
|
{b} Adjustment reflects the write off of unamortized debt issuance costs associated with the RBL.
{c} Adjustment reflects the debt issuance costs associated with the Exit Facility.
{d} Adjustment represents the establishment of Exit Facility, which superceded the RBL.
{e} As part of the Plan, the Bankruptcy Court approved the settlement of certain allowable claims, reported as liabilities subject to compromise in the Company’s historical consolidated balance sheet. As a result, a gain of $1.3 billion was recognized on the settlement of liabilities subject to compromise. The gain was calculated as follows (in thousands):
|
|
|
Predecessor |
| |
|
Liabilities subject to compromise |
|
$ |
1,882,187 |
|
|
Cash paid to holders of Second Lien Notes Claims |
|
(60,000 |
) | |
|
Warrants issued to holders of Third Lien Notes Claims |
|
(29,753 |
) | |
|
Warrants issued to holders of Unsecured Notes Claims |
|
(7,575 |
) | |
|
Write-off of unamortized debt costs associated with RBL |
|
(2,748 |
) | |
|
Common stock issued |
|
(511,152 |
) | |
|
Gain on settlement |
|
$ |
1,270,959 |
|
{f} Adjustments represent (i) the cancellation of predecessor stock that was authorized and outstanding prior to the Effective Date and (ii) the issuance of 24,687,500 shares of new common stock upon emergence on the Effective Date.
{g} This adjustment reflects the cumulative impact of the following reorganization adjustments (in thousands):
|
|
|
Predecessor |
| |
|
Gain on settlement of liabilities subject to compromise |
|
$ |
1,270,959 |
|
|
Common stock - predecessor |
|
104 |
| |
|
Treasury stock |
|
(3,134 |
) | |
|
Additional paid-in-capital - predecessor |
|
891,292 |
| |
|
Net impact to Predecessor accumulated deficit |
|
$ |
2,159,221 |
|
Fresh Start Adjustments
{h} The adjustments primarily represent (i) the removal of $3.4 billion of accumulated depreciation, depletion, amortization and impairment due to fresh start accounting, (ii) the $269.7 million increase in oil and gas properties due to the application of fresh start accounting, (iii) the $6.4 million decrease in the asset retirement obligation due to the application of fresh start accounting and (iv) an increase in other property and equipment.
{i} This adjustment reflects the cumulative impact of the fresh start adjustments discussed herein.
Reorganization Items
Reorganization items represent the direct and incremental costs of being in bankruptcy, such as professional fees, pre-petition liability claim adjustments and losses related to terminated contracts that are probable and can be estimated. Unamortized deferred financing costs as well as unamortized gains on the May 2015 troubled debt restructuring associated with debt classified as liabilities subject to compromise were also reclassified to reorganization items in order to reflect the expected amounts of allowed claims. The following table summarizes the gain on reorganization items, net, in the consolidated statements of operations (in thousands):
|
|
|
Predecessor |
| |
|
|
|
For the Period January |
| |
|
Professional fees incurred |
|
$ |
(38,835 |
) |
|
Adjustment to unamortized debt issuance costs associated with 2020 Senior Notes |
|
(10,738 |
) | |
|
Adjustment to unamortized debt issuance costs associated with 2021 Senior Notes |
|
(12,671 |
) | |
|
Adjustment to unamortized gain on troubled debt restructuring associated with Second Lien Notes |
|
39,599 |
| |
|
Adjustment to unamortized gain on troubled debt restructuring associated with Third Lien Notes |
|
71,808 |
| |
|
Gain on settlement of liabilities subject to compromise |
|
1,270,959 |
| |
|
Fresh start adjustments |
|
272,938 |
| |
|
Other reorganization items (1) |
|
1,221 |
| |
|
Gain on reorganization items, net |
|
$ |
1,594,281 |
|
(1) Other reorganization items primarily included $0.2 million related to Houston office fixed assets, which were abandoned, as well as a $1.6 million decrease in the liability previously recorded for the abandonment of the Houston office lease.
4. Summary of Significant Accounting Policies
Basis of Presentation
The accompanying consolidated financial statements of the Company have been prepared pursuant to the rules and regulations of the SEC and have been prepared in accordance with US GAAP.
All intercompany transactions have been eliminated in consolidation. The consolidated financial statements for the period October 21, 2016 through December 31, 2016 are referred to as the Successor Period, and the period January 1, 2016 through October 20, 2016 is referred to as the Predecessor Period. The consolidated financial statements as of and for the year ended December 31, 2015 include the results of the Dequincy Divestiture from January 1, 2015 through April 21, 2015, the date of disposition. The Company’s management evaluates performance based on one reportable segment as all its operations are located in the United States and therefore it maintains one cost center.
Fresh Start Accounting
Upon emergence from bankruptcy, the Company adopted fresh start accounting. Adopting fresh start accounting results in a new reporting entity for financial reporting purposes with no beginning retained earnings or deficit. As a result of the application of fresh start accounting, as well as the effects of the implementation of the Plan, the Company’s consolidated financial statements on or after October 21, 2016 are not comparable with the Company’s consolidated financial statements prior to that date.
Use of Estimates
The preparation of financial statements in conformity with US GAAP requires management to make estimates and assumptions that affect the reported amounts of assets and liabilities and disclosure of contingent assets and liabilities at the date of the financial statements and the reported amounts of revenues and expenses during the reporting period. The Company utilizes historical experience as well as other assumptions that are believed to be reasonable under the circumstances in preparing its estimates. The Company evaluates estimates and assumptions on a regular basis. Actual results could differ from those estimates and assumptions used in the preparation of the Company’s financial statements.
Significant estimates include, but are not limited to the estimates of reorganization value, enterprise value and fair value of assets and liabilities upon emergence from bankruptcy and application of fresh start accounting, the estimate of recoverable oil and natural gas reserves and related present value estimates of future net cash flows derived therefrom, legal and environmental risks and exposures, the fair value of share-based compensation, income taxes and the valuation of future asset retirement obligations.
Cash and Cash Equivalents
The Company considers all short-term investments with an original maturity of three months or less to be cash equivalents. The Company’s total cash balances are insured by the Federal Deposit Insurance Corporation (“FDIC”) up to $250,000 per bank per depositor. The Company had cash balances on deposit at December 31, 2017 and 2016 that exceeded the balance insured by the FDIC in the amount of $70.4 million and $78.4 million, respectively.
Accounts Receivable and Allowance for Doubtful Accounts
Accounts receivable are stated at the historical carrying amount net of any allowance for uncollectible accounts. The carrying amount of the Company’s accounts receivable approximate fair value because of the short-term nature of the instruments. Many of the Company’s receivables are from joint interest owners in properties in which the Company is the operator. The Company may withhold future revenue disbursements to recover any non-payment of these joint interest billings under certain circumstances. The Company routinely assesses the collectability of all material trade and other receivables and the Company accrues a reserve on a receivable when, based on the judgment of management, it is probable that a receivable will not be collected and the amount of any reserve may be reasonably estimated. As of December 31, 2017 and 2016, the Company had no allowance for doubtful accounts.
Financial Instruments
The Company’s financial instruments consist of cash and cash equivalents, receivables, payables, debt, and commodity derivative contracts. Commodity derivative contracts are recorded at fair value; see “—Note 5. Fair Value Measurements of Financial Instruments”. The fair value of the Company’s long-term debt is disclosed, see “—Note 10. Debt”. The carrying amount of the Company’s other financial instruments approximate fair value because of the short-term nature of the items or variable pricing.
Derivative financial instruments, if held by the Company, are presented in the consolidated balance sheets as either an asset or liability measured at estimated fair value. Changes in the derivative’s fair value are recognized in the consolidated statement of operations as gains and losses in the period of change. The gains or losses are recorded in “Gains on commodity derivative contracts—net.” The related cash flow impact is reflected within cash flows from operating activities.
Property and Equipment
Oil and Gas Properties
The Company uses the full-cost method of accounting for its exploration and development activities. Under this method of accounting, costs of both successful and unsuccessful exploration and development activities are capitalized as property and equipment. This includes any internal costs that are directly related to exploration and development activities, but does not include any costs related to production, general corporate overhead or similar activities. Proceeds from the sale or disposition of oil and gas properties are accounted for as a reduction to capitalized costs unless a significant portion of the Company’s reserve quantities are sold such that it results in a significant alteration of the relationship between capitalized costs and remaining proved reserves, in which case a gain or loss is generally recognized in income.
Unevaluated Property
Oil and gas unevaluated properties and properties under development include costs that are not being depleted or amortized. These costs represent investments in unproved properties. The Company excludes these costs until proved reserves are found, until it is determined that the costs are impaired or until major development projects are placed in service, at which time the costs are moved into oil and natural gas properties subject to amortization. All unproved property costs are reviewed at least annually to determine if impairment has occurred. In addition, impairment assessments are made for interim reporting periods if facts and circumstances exist that suggest impairment may have occurred. During any period in which impairment is indicated, the accumulated costs associated with the impaired property are transferred to proved properties, become part of our depletion base and become subject to the full cost ceiling limitation.
During 2015, the Company transferred the remaining unevaluated property balance consisting of $56.3 million of Mississippian unevaluated property costs, $0.2 million of Anadarko Basin unevaluated property costs and $0.1 million of Gulf Coast unevaluated property costs to the full cost pool as a result of current pricing during 2015, its anticipated drilling plans and uncertainty regarding its ability to finance its future exploration activities at that time.
During the year ended December 31, 2017, the Company transferred $58.0 million of unevaluated property to the full cost pool. As discussed below under “Impairment of Oil and Gas Properties/Ceiling Test” the Company’s strategy was refined during the fourth quarter of 2017 to focus on optimizing free cash flow, keeping leverage to a minimum and drilling only those locations that had the best probability of a reasonable rate of return under the new proved undeveloped type curve. Therefore, unevaluated property value not associated with the Company’s refined drilling focus were allocated to the full cost pool at December 31, 2017.
Oil and Gas Reserves
Proved oil, NGLs and natural gas reserves utilized in the preparation of the consolidated financial statements are estimated in accordance with the rules established by the SEC and the Financial Accounting Standards Board (“FASB”), which require that reserve estimates be prepared under existing economic and operating conditions using a 12-month average price with no provision for price and cost escalations in future years except by contractual arrangements.
Reserve estimates are inherently imprecise. Accordingly, the estimates are expected to change as more current information becomes available. The Company depletes its oil and gas properties using the units-of-production method. Capitalized costs of oil and natural gas properties subject to amortization are depleted over proved reserves. It is possible that, because of changes in market conditions or the inherent imprecision of reserve estimates, the estimates of future cash inflows, future gross revenues, the amount of oil and natural gas reserves, the remaining estimated lives of oil and natural gas properties, or any combination of the above may be increased or reduced. Increases in recoverable economic volumes generally reduce per unit depletion rates while decreases in recoverable economic volumes generally increase per unit depletion rates.
Impairment of Oil and Gas Properties/Ceiling Test
The Company performs a full-cost ceiling test on a quarterly basis. The test establishes a limit, or ceiling, on the book value of oil and gas properties. The capitalized costs of proved oil and gas properties, net of accumulated depreciation, depletion and amortization (“DD&A”) and the related deferred income taxes, may not exceed this ceiling. The ceiling limitation is equal to the sum of: (i) the present value of estimated future net revenues from the projected production of proved oil and gas reserves, excluding future cash outflows associated with settling asset retirement obligations accrued on the balance sheet, calculated using the average oil and natural gas sales prices received by the Company as of the first trading day of each month over the preceding twelve months (such prices are held constant throughout the life of the properties) and a discount factor of 10%; (ii) the cost of unproved and unevaluated properties excluded from the costs being amortized; (iii) the lower of cost or estimated fair value of unproved properties included in the costs being amortized; and (iv) related income tax effects. If capitalized costs exceed this ceiling, the excess is charged to expense in the accompanying consolidated statements of operations.
On November 1, 2017, David Sambrooks was appointed President and Chief Executive Officer of the Company. Upon David’s appointment, the Company began a strategic review of all areas of operations. This review was completed during the fourth quarter of 2017 and its strategy was refined to add further focus to optimizing free cash flows and keeping leverage to a minimum. As a result, in December of 2017 the Company decreased its current drilling activity from two drilling rigs to one drilling rig. Further, the five-year development plan was revised from a two-rig program to a one rig program. This change in strategy (reduced 5-year drilling activity) lead to a reduction in the Company’s undeveloped proved inventory under SEC guidelines from 274 locations at year end 2016 to 139 locations at year end 2017. In addition, at year end 2017 our proved undeveloped type curve was revised downward by the Company’s third-party reserves engineering firm and capital costs assumptions were revised upward, both as a result of recent drilling results. As a result of the Company’s
focus on optimizing free cash flow, keeping leverage to a minimum and optimizing drilling returns, all proved undeveloped reserves included in the December 31, 2017 reserve report are focused on infill drilling in the Carmen and Dacoma areas. All undeveloped locations not able to be drilled utilizing the Company’s anticipated five-year development schedule were excluded from the December 31, 2017 reserve report but continue to meet the definition of a proved undeveloped location from an engineering standpoint. The Company recorded an impairment of oil and gas properties of $125.3 million primarily as a result of the exclusion of proved undeveloped reserves not associated with infill drilling in the Carmen and Dacoma areas from its December 31, 2017 reserve report.
For the year ended December 31, 2017, the Predecessor Period and the year ended December 31, 2015, the Company recorded impairments of oil and gas properties of $125.3 million, $232.1 million and $1.6 billion, respectively. During the Predecessor Period and the year ended December 31, 2015, a significant and sustained decline in the average oil and natural gas sales price utilized in calculating the present value of estimated future net revenues from projected production of oil and gas reserves was the primary factor that led to the full-cost ceiling impairments.
Depletion
Depletion of oil and gas properties is calculated using the units of production method (“UOP”). The UOP calculation, in its simplest terms, multiplies the percentage of estimated proved reserves produced by the cost of those reserves. The result is to recognize expense at the same pace that the reserves are estimated to be depleting. The amortization base in the UOP calculation includes the sum of proved property costs net of accumulated depletion, estimated future development costs (future costs to access and develop proved reserves) and asset retirement costs that are not already included in oil and gas property, less related salvage value.
Capitalized Interest
Interest is capitalized for certain unevaluated oil and gas properties with ongoing development activities using the weighted-average cost of outstanding borrowings, which also includes the amortization of debt costs. Capitalized interest is depleted over the useful lives of the assets in the same manner as the depletion of the underlying assets.
Other Property and Equipment
Other property and equipment consists of vehicles, furniture and fixtures, and computer hardware and software and is carried at cost. Depreciation is provided principally using the straight-line method over the estimated useful lives of the assets, which primarily range from two to ten years. Maintenance and repairs are charged to expense as incurred, while renewals and betterments are capitalized.
Accrued Liabilities
At December 31, 2017 and 2016, accrued liabilities consisted of the following (in thousands):
|
|
|
December 31, 2017 |
|
December 31, 2016 |
| ||
|
Accrued oil and gas capital expenditures |
|
$ |
9,081 |
|
$ |
6,118 |
|
|
Accrued revenue and royalty distributions |
|
18,701 |
|
28,262 |
| ||
|
Accrued lease operating and workover expense |
|
5,150 |
|
8,932 |
| ||
|
Accrued interest |
|
108 |
|
254 |
| ||
|
Accrued taxes |
|
2,758 |
|
2,537 |
| ||
|
Compensation and benefit related accruals |
|
4,520 |
|
3,516 |
| ||
|
Other |
|
2,524 |
|
4,112 |
| ||
|
Accrued liabilities |
|
$ |
42,842 |
|
$ |
53,731 |
|
Asset Retirement Obligations
The legal obligations associated with the retirement of long-lived assets are recognized at the time that the obligation is incurred.
Oil and gas producing companies incur such a liability upon drilling or acquiring a well. The Company estimates the amount of an asset retirement obligation in the period in which the obligation is incurred and can be reliably measured. The corresponding asset retirement cost is capitalized by increasing the carrying amount of the related long-lived asset. The liability is accreted to its then present value each period, and the capitalized cost is depleted over the useful life of the related asset. If the liability is settled for an amount other than the recorded amount, any adjustment is recorded to the full cost pool. See “—Note 9. Asset Retirement Obligations”.
Share-Based Compensation
The Company measures share-based compensation cost at fair value and generally recognizes the corresponding compensation expense on a straight-line basis over the service period during which awards are expected to vest for periods prior to the Effective Date. For periods subsequent to the Effective Date, the Company recognizes compensation expense on graded and straight-line vesting basis. Share-based compensation expense, net of amounts capitalized to oil and gas properties, is included in “General and administrative” expense in our consolidated statements of operations and “Accrued liabilities” in our consolidated balance sheets. See “—Note 12. Equity and Share-Based Compensation”.
Revenue Recognition
Oil, NGLs and natural gas revenues are recognized when production is sold to a purchaser at a fixed or determinable price, when delivery has occurred, title has transferred and collection of the revenues is reasonably assured. Cash received relating to future revenues is deferred and recognized when all revenue recognition criteria are met.
The Company follows the sales method of accounting for oil, NGLs and natural gas revenues, whereby revenue is recognized for all oil, NGLs and natural gas sold to purchasers regardless of whether the sales are proportionate to the Company’s ownership interest in the property. Production imbalances are recognized as a liability to the extent an imbalance on a specific property exceeds the Company’s share of remaining proved oil and gas reserves. The Company had no significant imbalances at December 31, 2017, 2016 or 2015.
Beginning January 1, 2018, the FASB Accounting Standards Update (“ASU”) 2014-09 becomes effective for the Company. See “Recent Accounting Pronouncements” below for further information.
Acquisition and Transaction Costs
Acquisition and transaction related costs are expensed as incurred and as services are received. Such costs include finders’ fees, advisory, legal, accounting, valuation and other professional and consulting fees, and acquisition related general and administrative costs. Costs incurred in 2015 relate to the Dequincy Divestiture. See “—Note 8. Acquisition and Divestitures of Oil and Gas Properties”.
Income Taxes
Income taxes are recorded for the tax effects of transactions reported in the financial statements and consist of taxes currently payable plus deferred income taxes related to certain income and expenses recognized in different periods for financial and income tax reporting purposes. Deferred income tax assets and liabilities represent the future tax return consequences of those differences, which will either be taxable or deductible when assets are recovered or liabilities are settled. Deferred income taxes also include tax credits and net operating losses that are available to offset future income taxes. Deferred income taxes are measured by applying currently enacted tax rates.
The Company accounts for uncertainty in income taxes for tax positions taken or expected to be taken in a tax return. Only tax positions that meet the more-than-likely-than-not recognition threshold are recognized.
In December of 2017, the U.S. government enacted comprehensive tax legislation that includes significant changes to the taxation of business entities, including, among other provisions, a permanent reduction to the corporate income tax rate. We will continue to monitor guidance and update account policies and procedures as needed. See “—Note 13. Income Taxes.”
Income (Loss) Per Share
Net income (loss) per common share is calculated utilizing the two-class method by dividing net income (loss) available to common shareholders by the weighted average number of common shares outstanding during each period. Diluted net income (loss) per common share is calculated under the two-class method and the treasury stock method by dividing net income (loss) available to common shareholders by the weighted average number of diluted common shares outstanding, which includes the effect of potentially dilutive securities. Potentially dilutive securities for the diluted net income (loss) per share calculations consist of unvested restricted stock awards, warrants and outstanding stock options for the Successor Period. Potentially dilutive securities for the diluted net income (loss) per share calculations consist of the Company’s Series A Preferred Stock using the if-converted method (in periods prior to the Preferred Stock’s mandatory conversion date) and unvested restricted stock awards for the Predecessor Period. When a loss from continuing operations exists, all potentially dilutive securities are anti-dilutive and are therefore excluded from the computation of diluted net income (loss) per share. See “—Note 14. Income (Loss) Per Share.”
Recent Accounting Pronouncements
In May 2014, the FASB issued Accounting Standards Update 2014-09, “Revenue from Contracts with Customers (Topic 606)” (“ASU 2014-09”). ASU 2014-09 provides guidance concerning the recognition and measurement of revenue from contracts with customers. The objective of ASU 2014-09 is to increase the usefulness of information in the financial statements regarding the nature, timing and uncertainty of revenues. ASU 2014-09 requires an entity to perform the following steps:
Step 1— Identify the contract with a customer: A contract between two or more parties creates enforceable rights and obligations. A contract that identifies the relevant parties and has been approved by those parties, identifies the payment terms, has commercial substance and results in a probable collection of future consideration meets the definition of ASU 2014-09.
Step 2—Identify the performance obligations in the contract: A performance obligation is effectively a promise in a contract with a customer to transfer goods or services to the customer. If an entity promises to transfer more than one good or service to the customer, each performance obligation is accounted for separately if such performance obligations are distinct, as defined under ASU 2014-09.
Step 3—Determine the transaction price: The amount of consideration an entity expects to be entitled to as a result of performing services to a customer or transferring goods to a customer is the transaction price. The transaction price takes into account variable consideration, the existence of significant financing component, noncash consideration and the type of consideration payable to the entity.
Step 4—Allocate the transaction price to the performance obligations in the contract: An entity should allocate the transaction price to each performance obligation in an amount that represents the amount of the entity expects to be entitled to for satisfying each performance obligation.
Step 5—Recognize revenue when, or as, the entity satisfies a performance obligation: An entity recognizes revenue when, or as, it satisfies a performance obligation. A performance obligation can be satisfied over time or at a point in time. ASU 2014-09 provides criteria for determining the appropriate classification of each performance obligation.
Throughout 2015 and 2016, the FASB has issued a series of subsequent updates to the revenue recognition guidance in Topic 606, including ASU No. 2015-14, “Revenue from Contracts with Customers (Topic 606): Deferral of the Effective Date” ASU No. 2016-08, “Revenue from Contracts with Customers (Topic 606): Principal versus Agent Considerations”, ASU No. 2016-10, “Revenue from Contracts with Customers (Topic 606): Identifying Performance Obligations and Licensing”, ASU No. 2016-12, “Revenue from Contracts with Customers (Topic 606): Narrow-Scope Improvements and Practical Expedients” and ASU No. 2016-20, “Technical Corrections and Improvements to Topic 606, Revenue from Contracts with Customers”. ASU 2014-09 and the associated amendments mentioned above will be effective for the Company beginning on January 1, 2018, including interim periods within that reporting period.
The Company completed its assessment of ASU 2014-09 during the fourth quarter of 2017. The primary impact to the Company’s revenues as the result of adopting ASU 2014-09 will be the netting of certain deductions and costs, such as transportation and gathering expenses, against revenue instead of its historical practice of presenting such expenses gross. For example, revenues from oil, natural gas and NGL sales for the year ended December 31, 2017 would have been $15.8 million lower under ASU 2014-09, with an offsetting decrease to total expenses.
The implementation of ASU 2014-09 will not impact the Company’s timing of revenue recognition, financial position, net income or cash flows. The Company does not anticipate a material cumulative effect adjustment on January 1, 2018 as a result of adopting ASU 2014-09. The Company also completed its evaluation of information technology and internal control changes that will be required for adoption based on the its contract review process, which primarily required the remapping of certain accounts utilized for tracking these deduction and expenses along with enhanced reviews of any new revenue contracts or modifications to existing revenue contracts. The Company will apply the modified retrospective approach upon adoption of this standard on the effective date of January 1, 2018.
In February 2016, the FASB issued Accounting Standards Update 2016-02, “Leases (Topic 842)” (“ASU 2016-02”). ASU 2016-02 establishes a right-of-use (“ROU”) model that requires a lessee to record a ROU asset and a lease liability on the balance sheet for all leases with terms longer than 12 months. All leases create an asset and a liability for the lessee and therefore recognition of those lease assets and lease liabilities is required by ASU 2016-02. When measuring lease assets and liabilities, payments to be made in optional extension periods should be included if the lessee is reasonably certain to exercise the option. Leases will be classified as either finance or operating, with classification affecting the pattern of expense recognition in the income statement.
For finance leases, the Company will recognize a ROU asset and liability, initially measured at the present value of the lease payments. Interest expense will be recognized on the lease liability separately from the amortization of the ROU asset. The Company will recognize payments of principal on the lease liability within financing activities in the consolidated statement of cash flows and payments of interest within operating activities in the consolidated statement of cash flows. For operating leases, the Company will recognize a ROU asset and liability, initially measured at the present value of the lease payments. The Company will recognize a single lease cost, calculated so that the cost of the lease is allocated over the lease term on a generally straight-line basis and all cash payments will be recognized in operating activities within the consolidated statement of cash flows.
The new standard is effective for fiscal years beginning after December 15, 2018, including interim periods within those fiscal years. A modified retrospective transition approach is required for lessees for capital and operating leases existing at, or entered into after, the beginning of the earliest comparative period presented in the financial statements, with certain practical expedients available. The Company is in the initial evaluation and planning stages for ASU 2016-02.
In August 2016, the FASB issued ASU 2016-15, “Statement of Cash Flows — Classification of Certain Cash Receipts and Cash Payments” (“ASU 2016-15”). ASU 2016-15 addresses eight specific cash flow issues with the objective of reducing existing diversity of practice. The eight specific cash flow issues contained within ASU 2016-15 are debt prepayment or debt extinguishment costs, settlement of zero-coupon debt instruments or other debt instruments with coupon interest rates that are insignificant in relation to the effective interest rate of the borrowing, contingent consideration payments made after a business combination, proceeds from the settlement of insurance claims, proceeds from the settlement of corporate-owned life insurance policies, distributions received from equity method investees, beneficial interests in securitization transactions and separately identifiable cash flows and application of the predominance principle. ASU 2016-15 is effective for the Company for fiscal years beginning after December 15, 2017, and interim periods within those fiscal years. The Company does not believe the adoption of ASU 2016-15 will have a material impact on its cash flows.
In July 2017, the FASB issued Accounting Standards Update 2017-11, “Earnings Per Share (Topic 260), Distinguishing Liabilities from Equity (Topic 480), and Derivatives and Hedging (Topic 815)” (“ASU 2017-11”). ASU 2011-17 changes the classification analysis of certain equity-linked financial instruments (or embedded features) with down round features. The amendments require entities that present earnings per share (“EPS”) in accordance with Topic 260 to recognize the effect of the down round feature when triggered with the effect treated as a dividend and as a reduction of income available to common shareholders in basic EPS. The new standard is effective for fiscal years beginning after December 15, 2018, including interim periods within those fiscal years. The Company does not believe the adoption of ASU 2017-11 will have a material impact on its financial position, results of operations or cash flows.
5. Fair Value Measurements of Financial Instruments
The Company uses a valuation framework based upon inputs that market participants use in pricing an asset or liability, which are classified into two categories: observable inputs and unobservable inputs. Observable inputs represent market data obtained from independent sources; whereas, unobservable inputs reflect a company’s own market assumptions, which are used if observable inputs are not reasonably available without undue cost and effort. These two types of inputs are further divided into the following fair value input hierarchy:
· Level 1—Inputs are unadjusted quoted prices in active markets for identical assets or liabilities at the measurement date.
· Level 2—Inputs, other than quoted prices included in Level 1, are observable for the asset or liability, either directly or indirectly. Level 2 inputs include quoted prices for similar instruments in active markets, and inputs other than quoted prices that are observable for the asset or liability. Fair value assets and liabilities that are generally included in this category are commodity derivative contracts. Commodity derivative contract fair values are determined using industry-standard models that consider various assumptions including current market and contractual prices for the underlying instruments, implied volatility, time value, nonperformance risk, as well as other relevant economic measures. Substantially all of these inputs are observable in the marketplace throughout the full term of the instrument and can be supported by observable data.
· Level 3—Inputs are unobservable for the asset or liability, and include situations where there is little, if any, market activity for the asset or liability.
Assets and liabilities are classified based on the lowest level of input that is significant to the fair value measurement. The Company’s assessment of the significance of a particular input to the fair value measurement requires judgment, and may affect the valuation of the fair value of assets and liabilities and their placement within the fair value hierarchy levels.
Assets and Liabilities Measured at Fair Value on a Recurring Basis
Derivative Instruments
Commodity derivative contracts reflected in the consolidated balance sheets are recorded at estimated fair value. At December 31, 2017, all of the Company’s commodity derivative contracts were with four bank counterparties and were classified as Level 2 in the fair value input hierarchy. The Company did not have any open commodity derivative contract positions at December 31, 2016.
Derivative instruments listed below are presented gross and include swaps and collars that are carried at fair value. The Company records the net change in the fair value of these positions in “Gains on commodity derivative contracts — net” in the Company’s consolidated statements of operations.
|
|
|
Fair Value Measurements at December 31, 2017 |
| ||||||||||
|
|
|
|
|
Significant Other |
|
Significant |
|
|
| ||||
|
|
|
Quoted Prices in Active |
|
Observable Inputs |
|
Unobservable Inputs |
|
Total |
| ||||
|
|
|
(in thousands) |
| ||||||||||
|
Derivative Assets: |
|
|
|
|
|
|
|
|
| ||||
|
Commodity derivative oil swaps |
|
$ |
— |
|
$ |
— |
|
$ |
— |
|
$ |
— |
|
|
Commodity derivative gas swaps |
|
$ |
— |
|
$ |
821 |
|
$ |
— |
|
$ |
821 |
|
|
Commodity derivative oil collars |
|
$ |
— |
|
$ |
952 |
|
$ |
— |
|
$ |
952 |
|
|
Commodity derivative gas collars |
|
$ |
— |
|
$ |
2,611 |
|
$ |
— |
|
$ |
2,611 |
|
|
Total assets |
|
$ |
— |
|
$ |
4,384 |
|
$ |
— |
|
$ |
4,384 |
|
|
|
|
|
|
|
|
|
|
|
| ||||
|
Derivative Liabilities: |
|
|
|
|
|
|
|
|
| ||||
|
Commodity derivative oil swaps |
|
$ |
— |
|
$ |
(3,679 |
) |
$ |
— |
|
$ |
(3,679 |
) |
|
Commodity derivative gas swaps |
|
$ |
— |
|
$ |
— |
|
$ |
— |
|
$ |
— |
|
|
Commodity derivative oil collars |
|
$ |
— |
|
$ |
(2,605 |
) |
$ |
— |
|
$ |
(2,605 |
) |
|
Commodity derivative gas collars |
|
$ |
— |
|
$ |
(1,333 |
) |
$ |
— |
|
$ |
(1,333 |
) |
|
Total liabilities |
|
$ |
— |
|
$ |
(7,617 |
) |
$ |
— |
|
$ |
(7,617 |
) |
At December 31, 2016, the Company did not have any open commodity derivative contract positions.
6. Risk Management and Derivative Instruments
The Company’s production is exposed to fluctuations in crude oil, NGLs and natural gas prices. The Company believes it is prudent to manage the variability in cash flows by, at times, entering into derivative financial instruments to economically hedge a portion of its crude and natural gas production. The Company utilizes various types of derivative financial instruments to manage fluctuations in cash flows resulting from changes in commodity prices.
· Swaps: The Company receives or pays a fixed price for the commodity and pays or receives a floating market price to the counterparty. The fixed-price payment and the floating-price payment are netted, resulting in a net amount due to or from the counterparty.
· Collars: A collar contains a fixed floor price (put) and a fixed ceiling price (call). If the market price exceeds the call strike price or falls below the put strike price, the Company receives the fixed price and pays the market price. If the market price is between the call and the put strike price, no payments are due from either party.
· Three-way collars: A three-way collar contains a fixed floor price (long put), fixed sub-floor price (short put), and a fixed ceiling price (short call). If the market price exceeds the ceiling strike price, the Company receives the ceiling strike price and pays the market price. If the market price is between the ceiling and the floor strike price, no payments are due from either party. If the market price is below the floor price but above the sub-floor price, the Company receives the floor strike price and pays the market price. If the market price is below the sub-floor price, the Company receives the market price plus the difference between the floor and the sub-floor strike prices and pays the market price.
These derivative contracts are placed with major financial institutions that the Company believes are minimal credit risks. The crude oil and natural gas reference prices upon which the commodity derivative contracts are based reflect various market indices that management believes correlates with actual prices received by the Company for its crude and natural gas production.
Inherent in the Company’s portfolio of commodity derivative contracts are certain business risks, including market risk and credit risk. Market risk is the risk that the price of the commodity will change, either favorably or unfavorably, in response to changing market conditions. Credit risk is the risk of loss from nonperformance by the Company’s counterparty to a contract. The Company does not require collateral from its counterparties but does attempt to minimize its credit risk associated with derivative instruments by entering into derivative instruments only with counterparties that are large financial institutions, which management believes present minimal credit risk. In addition, to mitigate its risk of loss due to default, the Company has entered into agreements with its counterparties of its derivative instruments that allow the Company to offset its asset position with its liability position in the event of default by the counterparty. Due to the netting arrangements, had the Company’s counterparties failed to perform under existing commodity derivative contracts at December 31, 2017, the Company would not have experienced a loss.
Commodity Derivative Contracts
The Company has entered into various oil and natural gas derivative contracts that extend through December 2019, summarized as follows:
|
|
|
NYMEX WTI |
| ||||||||||||||||||||||
|
|
|
Fixed Swaps |
|
Collars |
|
Three-Way Collars |
| ||||||||||||||||||
|
|
|
Hedge |
|
Weighted |
|
Hedge |
|
Weighted |
|
Weighted |
|
Hedge |
|
Weighted |
|
Weighted |
|
Weighted |
| ||||||
|
Quarter Ended: |
|
|
|
|
|
|
|
|
|
|
|
|
|
|
|
|
|
|
| ||||||
|
December 31, 2017(1)(2) |
|
276,000 |
|
$ |
53.58 |
|
46,000 |
|
$ |
60.00 |
|
$ |
50.00 |
|
115,000 |
|
$ |
62.80 |
|
$ |
50.00 |
|
$ |
40.00 |
|
|
March 31, 2018(1) |
|
99,000 |
|
$ |
50.61 |
|
— |
|
$ |
— |
|
$ |
— |
|
225,000 |
|
$ |
62.14 |
|
$ |
50.00 |
|
$ |
40.00 |
|
|
June 30, 2018(1) |
|
145,600 |
|
$ |
51.22 |
|
— |
|
$ |
— |
|
$ |
— |
|
182,000 |
|
$ |
60.65 |
|
$ |
50.00 |
|
$ |
40.00 |
|
|
September 30, 2018(1) |
|
92,000 |
|
$ |
50.38 |
|
— |
|
$ |
— |
|
$ |
— |
|
184,000 |
|
$ |
59.93 |
|
$ |
50.00 |
|
$ |
40.00 |
|
|
December 31, 2018(1) |
|
92,000 |
|
$ |
50.38 |
|
— |
|
$ |
— |
|
$ |
— |
|
46,000 |
|
$ |
56.70 |
|
$ |
50.00 |
|
$ |
40.00 |
|
|
March 31, 2019(1) |
|
— |
|
$ |
— |
|
— |
|
$ |
— |
|
$ |
— |
|
45,000 |
|
$ |
56.20 |
|
$ |
50.00 |
|
$ |
40.00 |
|
|
June 30, 2019(1) |
|
— |
|
$ |
— |
|
— |
|
$ |
— |
|
$ |
— |
|
45,500 |
|
$ |
56.20 |
|
$ |
50.00 |
|
$ |
40.00 |
|
|
September 30, 2019(1) |
|
— |
|
$ |
— |
|
— |
|
$ |
— |
|
$ |
— |
|
46,000 |
|
$ |
56.20 |
|
$ |
50.00 |
|
$ |
40.00 |
|
|
December 31, 2019(1) |
|
— |
|
$ |
— |
|
— |
|
$ |
— |
|
$ |
— |
|
46,000 |
|
$ |
56.20 |
|
$ |
50.00 |
|
$ |
40.00 |
|
|
|
|
NYMEX HENRY HUB |
| ||||||||||||||||||||||
|
|
|
Fixed Swaps |
|
Collars |
|
Three-Way Collars |
| ||||||||||||||||||
|
|
|
Hedge |
|
Weighted |
|
Hedge |
|
Weighted |
|
Weighted |
|
Hedge |
|
Weighted |
|
Weighted |
|
Weighted |
| ||||||
|
Quarter Ended: |
|
|
|
|
|
|
|
|
|
|
|
|
|
|
|
|
|
|
| ||||||
|
December 31, 2017(1) |
|
1,907,000 |
|
$ |
3.43 |
|
551,000 |
|
$ |
3.84 |
|
$ |
3.23 |
|
610,000 |
|
$ |
4.30 |
|
$ |
3.25 |
|
$ |
2.50 |
|
|
March 31, 2018(1)(3) |
|
1,350,000 |
|
$ |
3.47 |
|
— |
|
$ |
— |
|
$ |
— |
|
1,530,000 |
|
$ |
4.38 |
|
$ |
3.25 |
|
$ |
2.50 |
|
|
June 30, 2018(1) |
|
— |
|
$ |
— |
|
— |
|
$ |
— |
|
$ |
— |
|
1,365,000 |
|
$ |
3.40 |
|
$ |
3.00 |
|
$ |
2.50 |
|
|
September 30, 2018(1) |
|
— |
|
$ |
— |
|
— |
|
$ |
— |
|
$ |
— |
|
1,380,000 |
|
$ |
3.40 |
|
$ |
3.00 |
|
$ |
2.50 |
|
|
December 31, 2018(1) |
|
— |
|
$ |
— |
|
— |
|
$ |
— |
|
$ |
— |
|
1,380,000 |
|
$ |
3.40 |
|
$ |
3.00 |
|
$ |
2.50 |
|
|
March 31, 2019(1) |
|
— |
|
$ |
— |
|
— |
|
$ |
— |
|
$ |
— |
|
1,350,000 |
|
$ |
3.40 |
|
$ |
3.00 |
|
$ |
2.50 |
|
(1) Positions shown represent open commodity derivative contract positions as of December 31, 2017. The Company did not have any open commodity derivative contract positions as of December 31, 2016.
(2) During the second quarter, the Company entered into long call oil trades to offset its three-way collar short calls for the second half of 2017.
(3) During the second quarter, the Company entered into natural gas three-way collars with long call ceilings in order to offset its Q1 2018 natural gas fixed swaps.
Balance Sheet Presentation
The following table summarizes the net fair values of commodity derivative instruments by the appropriate balance sheet classification in the Company’s consolidated balance sheets at December 31, 2017 (in thousands):
|
Type |
|
Balance Sheet Location (1) |
|
December 31, 2017 |
| |
|
Gas swaps |
|
Derivative financial instruments — current assets |
|
$ |
821 |
|
|
Oil collars |
|
Derivative financial instruments — current assets |
|
(760 |
) | |
|
Gas collars |
|
Derivative financial instruments — current assets |
|
701 |
| |
|
Total derivative financial instruments — current assets |
|
|
|
$ |
762 |
|
|
|
|
|
|
|
| |
|
Oil swaps |
|
Derivative financial instruments — current liabilities |
|
$ |
(3,679 |
) |
|
Oil collars |
|
Derivative financial instruments — current liabilities |
|
(370 |
) | |
|
Gas collars |
|
Derivative financial instruments — current liabilities |
|
616 |
| |
|
Total derivative financial instruments — current liabilities |
|
|
|
$ |
(3,433 |
) |
|
|
|
|
|
|
| |
|
Oil collars |
|
Derivative financial instruments — noncurrent liabilities |
|
$ |
(523 |
) |
|
Gas collars |
|
Derivative financial instruments — noncurrent liabilities |
|
(39 |
) | |
|
Total derivative financial instruments — noncurrent liabilities |
|
|
|
$ |
(562 |
) |
|
|
|
|
|
|
| |
|
Total derivative fair value at period end |
|
|
|
$ |
(3,233 |
) |
(1) The fair values of commodity derivative instruments reported in the Company’s consolidated balance sheets are subject to netting arrangements and qualify for net presentation.
As of December 31, 2016, the Company did not have any open commodity derivative contract positions.
The following table summarizes the location and fair value amounts of all commodity derivative instruments in the consolidated balance sheets, as well as the gross recognized derivative assets, liabilities and amounts offset in the consolidated balance sheets at December 31, 2017 (in thousands):
|
|
|
|
|
December 31, 2017 |
| |||||||
|
Not Designated as |
|
|
|
Gross Recognized |
|
Gross Amounts |
|
Net Recognized |
| |||
|
ASC 815 Hedges |
|
Balance Sheet Location Classification |
|
Assets/Liabilities |
|
Offset |
|
Assets/Liabilities |
| |||
|
Derivative Assets: |
|
|
|
|
|
|
|
|
| |||
|
Commodity contracts |
|
Derivative financial instruments — current |
|
$ |
3,479 |
|
$ |
(2,717 |
) |
$ |
762 |
|
|
Commodity contracts |
|
Derivative financial instruments — noncurrent |
|
905 |
|
(905 |
) |
— |
| |||
|
|
|
|
|
$ |
4,384 |
|
$ |
(3,622 |
) |
$ |
762 |
|
|
Derivative Liabilities: |
|
|
|
|
|
|
|
|
| |||
|
Commodity contracts |
|
Derivative financial instruments — current |
|
$ |
(6,150 |
) |
$ |
2,717 |
|
$ |
(3,433 |
) |
|
Commodity contracts |
|
Derivative financial instruments — noncurrent |
|
(1,467 |
) |
905 |
|
(562 |
) | |||
|
|
|
|
|
$ |
(7,617 |
) |
$ |
3,622 |
|
$ |
(3,995 |
) |
As of December 31, 2016, the Company did not have any open commodity derivative contract positions.
Gains/Losses on Commodity Derivative Contracts
The Company does not designate its commodity derivative contracts as hedging instruments for financial reporting purposes. Accordingly, commodity derivative contracts are marked-to-market each quarter with the change in fair value during the periodic reporting period recognized currently as a gain or loss in “Gains on commodity derivative contracts—net” within revenues in the consolidated statements of operations.
The following table presents net cash received for commodity derivative contracts and unrealized net (losses) gains recorded by the Company related to the change in fair value of the derivative instruments in “Gains on commodity derivative contracts—net” for the periods presented (in thousands):
|
|
|
Successor |
|
|
Predecessor |
| ||||||||
|
|
|
For the Year |
|
For the Period |
|
|
For the Period |
|
For the Year |
| ||||
|
|
|
2017 |
|
December 31, 2016 |
|
|
October 20, 2016 |
|
2015 |
| ||||
|
Net cash received for commodity derivative contracts |
|
$ |
6,891 |
|
$ |
— |
|
|
$ |
— |
|
$ |
167,669 |
|
|
Unrealized net losses |
|
(3,232 |
) |
— |
|
|
— |
|
(126,709 |
) | ||||
|
Gains on commodity derivative contracts—net |
|
$ |
3,659 |
|
$ |
— |
|
|
$ |
— |
|
$ |
40,960 |
|
Cash settlements, as presented in the table above, represent realized gains related to the Company’s derivative instruments. In addition to cash settlements, the Company also recognizes fair value changes on its derivative instruments in each reporting period. The changes in fair value result from new positions and settlements that may occur during each reporting period, as well as the relationships between contract prices and the associated forward curves.
7. Property and Equipment
The Company’s property and equipment as of December 31, 2017 and 2016 was as follows (in thousands):
|
|
|
December 31, 2017 |
|
|
December 31, 2016 |
| ||
|
Oil and gas properties, on the basis of full-cost accounting: |
|
|
|
|
|
| ||
|
Proved properties |
|
$ |
765,308 |
|
|
$ |
573,150 |
|
|
Unproved properties not being amortized |
|
7,065 |
|
|
65,080 |
| ||
|
Other property and equipment |
|
6,508 |
|
|
6,339 |
| ||
|
Less accumulated depreciation, depletion, amortization and impairment |
|
(204,419 |
) |
|
(12,974 |
) | ||
|
Net property and equipment |
|
$ |
574,462 |
|
|
$ |
631,595 |
|
For the year ended December 31, 2017, Successor Period, Predecessor Period and the year ended December 31, 2015, depletion expense related to oil and gas properties was $63.4 million, $12.6 million, $59.9 million, and $195.2 million, respectively, and $7.85, $7.00, $6.84, and $16.26 per Boe, respectively. For the year ended December 31, 2017, the Successor Period, the Predecessor Period and the year ended December 31, 2015, depreciation expense related to other property and equipment was $2.4 million, $0.4 million, $2.4 million and $3.5 million, respectively.
For the year ended December 31, 2017, the Successor Period and the year ended December 31, 2015, interest capitalized to unevaluated properties was $2.4 million, $0.7 million and $4.9 million, respectively. The Company did not capitalized interest for the Predecessor Period. For the year ended December 31, 2017, the Successor Period, the Predecessor Period and the year ended December 31, 2015, the Company capitalized $5.3 million, $1.4 million, $3.4 million and $7.3 million, respectively, of internal costs to oil and gas properties, including $2.0 million, $0.6 million, $0.5 million and $1.3 million, respectively, of qualifying share-based compensation expense, see “—Note 12. Equity and Share-Based Compensation”.
During the year ended December 31, 2017, the Company disposed of certain oil and gas equipment for cash proceeds of $1.4 million, which were reflected as a reduction of oil and gas properties with no gain or loss recognized. On July 26, 2017, the Company closed on the sale of certain oil and gas properties in Lincoln County, Oklahoma, for $7.0 million in cash ($2.9 million, net after assumption of liabilities), subject to standard post-closing adjustments. The net proceeds from the sale were retained for general corporate purposes.
8. Acquisition and Divestitures of Oil and Gas Properties
Dequincy Divestiture
On April 21, 2015, the Company closed the Dequincy Divestiture for $44.0 million, completing the Company’s disposition of its producing properties and proved reserves in Louisiana. The net proceeds, inclusive of amounts placed in escrow, were approximately $42.4 million, which was net of customary closing adjustments. This amount was reflected as a reduction of oil and natural gas properties, with no gain or loss recognized. The net proceeds were retained for general corporate purposes.
Exploration Agreement with PetroQuest
On June 25, 2014, the Company entered into an exploration agreement with PetroQuest Energy LLC (“PetroQuest”) with an effective date of May 1, 2014, in which the Company conveyed to PetroQuest an undivided 50% of its right, title and interest in and to the acreage and other interests in the Fleetwood prospect area in Louisiana. With the execution of the agreement, PetroQuest paid $3.0 million in cash consideration and in January 2015, PetroQuest paid additional cash of $7.0 million. As further consideration, PetroQuest granted a credit to the Company of an additional non-interest bearing total sum of $14.0 million, to be credited or paid against the Company’s share of costs or expenses incurred to develop the prospect area, including but not limited to, all mineral lease acquisition or maintenance costs and all drilling, completion, equipping and facility costs. For any amounts not fully credited on or before December 31, 2015, the Company could elect to take the remaining portion in cash. The Company received the unutilized portion of the non-interest bearing amount of approximately $4.4 million during 2016.
Acquisition and Transaction Expenses
For the year ended December 31, 2015, acquisition and transaction costs of $0.3 million relate to the execution of the Dequincy Divestiture.
9. Asset Retirement Obligations
For the Company, asset retirement obligations (“AROs”) represent the future abandonment costs of tangible assets, such as wells, service assets and other facilities. The fair value of the AROs at inception are capitalized as part of the carrying amount of the related long-lived asset. AROs approximated $15.5 million and $14.2 million as of December 31, 2017 and 2016, respectively. At December 31, 2017 and 2016, all AROs represent long-term liabilities and are classified as such.
The following table details the change in the AROs for the year ended December 31, 2017 and the Successor Period, respectively (in thousands):
|
|
|
Successor |
| ||||
|
|
|
For the Year Ended |
|
For the Period October |
| ||
|
|
|
2017 |
|
December 31, 2016 |
| ||
|
Asset retirement obligations at beginning of period |
|
$ |
14,200 |
|
$ |
13,983 |
|
|
Liabilities incurred |
|
571 |
|
7 |
| ||
|
Revisions |
|
1,832 |
|
— |
| ||
|
Liabilities settled |
|
(744 |
) |
— |
| ||
|
Liabilities eliminated through asset sale (1) |
|
(1,453 |
) |
— |
| ||
|
Current period accretion expense |
|
1,100 |
|
210 |
| ||
|
Asset retirement obligations at end of year |
|
$ |
15,506 |
|
$ |
14,200 |
|
(1) Liabilities eliminated through asset sales for the year ended December 31, 2017 primarily relate to the sale of Lincoln County. See discussion of the sale in “—Note 7. Property and Equipment”.
10. Debt
Exit Facility
At December 31, 2017 and 2016, the Company maintained the Exit Facility with a borrowing base of $170.0 million. At December 31, 2017 and 2016, the Company had $128.1 million drawn on the Exit Facility and had outstanding letters of credit obligations totaling $1.9 million. At December 31, 2017, the Company had $40.0 million of availability on the Exit Facility.
The Exit Facility matures on September 30, 2020 and bears interest at LIBOR plus 4.50% per annum, subject to a 1.00% LIBOR floor. At December 31, 2017 and 2016, the weighted average interest rate was 6.3% and 5.5%, respectively. Unamortized debt issuance costs of $1.2 million associated with the Exit Facility are included in “Other noncurrent assets” on the consolidated balance sheets at December 31, 2017 and 2016, respectively.
In addition to interest expense, the Exit Facility requires the payment of a commitment fee each quarter. The commitment fee is computed at the rate of 0.50% per annum based on the average daily amount by which the borrowing base exceeds the outstanding borrowings during each quarter.
The Exit Facility, as amended, includes certain financial maintenance covenants that are required to be calculated on a quarterly basis for compliance purposes. These financial maintenance covenants include EBITDA to interest expense for the trailing four fiscal quarters of not less than 2.50:1.00 and a limitation of Total Net Indebtedness (as defined in the Exit Facility) to EBITDA for the trailing four fiscal quarters of not more than 4.00:1.00.
In addition, the Exit Facility contains various other covenants that, among other things, may restrict the Company’s ability to: (i) incur additional indebtedness or guarantee indebtedness (ii) make loans and investments; (iii) pay dividends on capital stock and make other restricted payments, including the prepayment or redemption of other indebtedness; (iv) create or incur certain liens; (v) sell, transfer or otherwise dispose of certain assets; (vi) enter into certain types of transactions with the Company’s affiliates; (vii) acquire, consolidate or merge with another entity upon certain terms and conditions; (viii) sell all or substantially all of the Company’s assets; (ix) prepay, redeem or repurchase certain debt; (x) alter the business the Company conducts and make amendments to the Company’s organizational documents, (xi) enter into certain derivative transactions and (xii) enter into certain marketing agreements and take-or-pay arrangements.
On May 24, 2017, the Company entered into the First Amendment to the Exit Facility (the “First Amendment”). The First Amendment, among other items, (i) moved the first scheduled borrowing base redetermination from April 2018 to October 2017; (ii) removed the requirement to maintain a cash collateral account with the administrative agent in the amount of $40.0 million; (iii) removed the requirement to maintain at least 20% liquidity of the then effective borrowing base; (iv) amended the required mortgage threshold from 95% to 90%; (v) amended the threshold amount for which the borrower is required to provide advance notice to the administrative agent of a sale or disposition of oil and gas properties which occurs during the period between two successive redeterminations of the borrowing base; (vi) amended the required ratio of total net indebtedness to EBITDA; (vii) amended the required EBITDA to interest coverage ratio and (viii) removed certain limitations on capital expenditures.
On October 27, 2017, the Company’s borrowing base was redetermined at the existing amount of $170.0 million. The Company’s Anadarko Basin assets in Texas and Oklahoma were excluded from the redetermination of the borrowing base.
The Company was in compliance with all debt covenants at December 31, 2017.
The Company believes the carrying amount of the Credit Facility at December 31, 2017 approximates its fair value (Level 2) due to the variable nature of the Exit Facility interest rate.
2016 Reorganization
On the Effective Date, the Company satisfied the conditions to effectiveness set forth in the Confirmation Order and in the Plan, and, as a result, the Plan became effective in accordance with its terms and the Company emerged from the Chapter 11 Cases. Pursuant to the confirmed Plan, the significant transactions impacting the Company’s outstanding debt balances as of the Effective Date were as follows:
· Credit Facility: (i) The permanent pay-down of $81.3 million of the Company’s RBL with a $170.0 million Exit Facility established upon the Effective Date, (ii) the pay-down of $60.0 million of our Second Lien Notes in cash, and (iii) the conversion into equity of all of the Company’s remaining debt junior to the RBL;
· Credit Facility Claims: Holders of allowed claims arising under the RBL (the “Credit Facility Claims”) received their pro rata share of approximately $81.3 million in cash and the RBL was superseded, pursuant to the Plan, by the Exit Facility, as further described below;
· Second Lien Notes Claims: Holders of allowed claims arising under the Second Lien Notes (the “Second Lien Notes Claims”) received their pro rata share of (i) 96.25% of the reorganized equity in the form of common stock and (ii) a cash payment of $60.0 million;
· Third Lien Notes Claims: Holders of Third Lien Notes Claims, pursuant to the Second/Third Lien Plan Settlement, received their pro rata share of 2.5% of the reorganized equity in the form of common stock and warrants to acquire 4,411,765 shares of common stock at a strike price of $24.00 per common share with an expiration date 42 months after the Effective Date;
· Unsecured Claims: Unsecured Notes Claims and the Holders of other general unsecured claims received their pro rata share of 1.25% of reorganized equity in the form of common stock and warrants to acquire 2,213,789 shares of common stock at a strike price of $46.00 per common share with an expiration date 42 months after the Effective Date; and
· Exit Facility: The Company’s RBL, which was redetermined with a borrowing base of $170.0 million in April 2016, was superseded, pursuant to the Plan, by the Exit Facility as further described above.
2015 Debt Restructuring
On May 21, 2015, the Company issued $625.0 million of Second Lien Notes and utilized the proceeds to repay the outstanding balance of the RBL in an amount of approximately $468.2 million, with the remainder utilized for general corporate purposes. Further, the Company exchanged approximately $504.1 million of Third Lien Notes for approximately $279.8 million of 2020 Senior Notes and $350.3 million of 2021 Senior Notes, representing an exchange at 80.0% of the exchanged Unsecured Notes’ par value. Additionally, on June 2, 2015, the Company exchanged approximately $20.0 million of Third Lien Notes for approximately $26.6 million of 2020 Senior Notes and $2.0 million of 2021 Senior Notes, representing an exchange at 70.0% of the exchanged Unsecured Notes’ par value. Approximately $63.9 million of the principal amount of 2020 Senior Notes and $70.7 million of the principal amount of 2021 Senior Notes was extinguished.
The exchanges of Third Lien Notes for the Unsecured Notes as well as the issuance of the Second Lien Notes were accounted for as a troubled debt restructuring. As the future cash flows of the modified debt instruments were greater than the carrying amount of the previous debt instruments, no debt extinguishment gain was recognized. The amount of extinguished debt was to be amortized over the remaining life of the Second Lien Notes and Third Lien Notes using the effective interest method and recognized as a reduction of interest expense. All costs incurred related to the May 21, 2015 and June 2, 2015 exchanges, including restructuring costs as well as the direct issuance costs of the Second Lien Notes and Third Lien Notes, were expensed and are included within debt restructuring costs and advisory fees in the consolidated statements of operations. As a result of the Company’s emergence on the Effective Date, the remaining unamortized gain on the troubled debt restructuring was eliminated at that time.
RBL
Prior to the Effective Date, the Company maintained the $750.0 million RBL with a borrowing base of $252.0 million. In February 2016, the Company borrowed approximately $249.2 million under the RBL, which represented the remaining undrawn availability. As a result of the semiannual redetermination on April 1, 2016, the borrowing base was reduced by $82.0 million to $170.0 million from the previous borrowing base of $252.0 million.
Borrowing under the RBL bore interest at LIBOR plus an applicable margin, depending upon the Company’s borrowing base utilization, between 2.00% and 3.00% per annum. In addition to interest expense, the RBL required the payment of a commitment fee each quarter at the rate of either 0.375% or 0.500% per annum based on the average daily amount by which the borrowing base exceeded the outstanding borrowings during each quarter.
The RBL was superseded and replaced by the Exit Facility on the Effective Date. On the Effective Date, $121.3 million of outstanding borrowings on the RBL were repaid, with the remaining outstanding balance carried over to the Exit Facility.
2020 Senior Notes
On October 1, 2012, the Company issued $600.0 million in aggregate principal amount of 2020 Senior Notes, conducted pursuant to Rule 144A and Regulation S under the Securities Act of 1933, as amended (the “Securities Act”). In October 2013, these notes were exchanged for an equal principal amount of identical registered notes. On May 21, 2015 and June 2, 2015, a total of approximately $306.4 million aggregate principal amount of 2020 Senior Notes were exchanged for Third Lien Notes. The 2020 Senior Notes had an interest rate of 10.75%.
On the Effective Date, the obligations of the Company with respect to the 2020 Senior Notes were cancelled and holders of the 2020 Senior Notes received their agreed upon pro-rata share of the Unencumbered Assets Equity Distribution. See “—Note 2. Emergence from Voluntary Reorganization under Chapter 11 Proceedings” for further discussion.
2021 Senior Notes
On May 31, 2013, the Company issued $700.0 million in aggregate principal amount of 2021 Senior Notes. In October 2013, these notes were exchanged for an equal principal amount of identical registered notes. On May 21, 2015 and June 2, 2015, a total of approximately $352.3 million aggregate principal amount of 2021 Senior Notes were exchanged for Third Lien Notes. The 2021 Senior Notes had an interest rate of 9.25%.
On the Effective Date, the obligations of the Company with respect to the 2021 Senior Notes were cancelled and holders of the 2021 Senior Notes received their agreed-upon pro-rata share of the Unencumbered Assets Equity Distribution. See “—Note 2. Emergence from Voluntary Reorganization under Chapter 11 Proceedings” for further discussion.
Second Lien Notes
On May 21, 2015, the Company and Midstates Sub issued and sold $625.0 million aggregate principal amount of Second Lien Notes, in a private placement conducted pursuant to Rule 144A under the Securities Act. In November 2015, these notes were exchanged for an equal principal amount of identical registered notes. The Second Lien Notes had an interest rate of 10.0%.
On the Effective Date, the obligations of the Company with respect to the Second Lien Notes were cancelled and holders of the Second Lien Notes received a cash payment of $60.0 million as well as their agreed-upon pro-rata share of equity in the reorganized Company. See “—Note 2. Emergence from Voluntary Reorganization under Chapter 11 Proceedings” for further discussion.
Third Lien Notes
On May 21, 2015 and June 2, 2015, the Company issued approximately $504.1 million and $20.0 million, respectively, in aggregate principal amount of Third Lien Notes in a private placement and in exchange for an aggregate $306.4 million of the 2020 Senior Notes and $352.3 million of the 2021 Senior Notes. In November 2015, these notes were exchanged for an equal principal amount of identical registered notes. The Third Lien Notes had an interest rate of 12.0%, consisting of cash interest of 10.0% and paid-in-kind interest of 2.0%, per annum.
On the Effective Date, the obligations of the Company with respect to the Third Lien Notes were cancelled and holders of the Third Lien Notes received their agreed upon pro-rata share of equity and warrants in the reorganized Company as set forth in the Second/Third Lien Plan Settlement embodied in the Plan. See “—Note 2. Emergence from Voluntary Reorganization under Chapter 11 Proceedings” for further discussion.
11. Preferred Stock
Series A Preferred Stock
On October 1, 2012, the Company issued 325,000 shares of Series A Mandatorily Convertible Preferred Stock (“Series A Preferred Stock”) with an initial liquidation preference of $1,000 per share and an 8.0% per annum dividend, payable semiannually at the Company’s option in cash or through an increase in the liquidation preference. Based on the liquidation preference at September 30, 2015, each Series A Preferred Share converted into approximately 11.5 shares of the Company’s Predecessor common stock pursuant to the Certificate of Designation, which governed the Series A Preferred Stock. As a result, the Company issued 3,738,424 shares of Predecessor common stock upon conversion of the Series A Preferred Stock during 2015.
At the Effective Date, the Company’s current common stock was cancelled and new common stock of the reorganized Company was issued. See “—Note 2. Emergence from Voluntary Reorganization under Chapter 11 Proceedings” for further discussion.
12. Equity and Share-Based Compensation
Emergence from Bankruptcy
On the Effective Date, the Company’s then existing common stock was canceled and new common stock in the reorganized Company was issued. In addition, Company’s previous share-based compensation awards were either vested or canceled upon the Company’s emergence from bankruptcy.
Common Shares
Successor Period
At December 31, 2017, the Company had 25,272,969 and 25,173,346 shares of its common stock issued and outstanding, respectively.
On the Effective Date, the Company issued 24,687,500 shares of Successor common stock in the reorganized Company. On November 8, 2016, the Company issued 12,400 shares of common stock to employees and non-employee directors, which vested immediately upon issuance. On November 9, 2016, the Company issued an additional 294,967 shares of common stock of the reorganized Company pursuant to the Plan. The Company will issue 17,533 additional common shares pursuant to the Plan in a future distribution. The total authorized common stock of the reorganized Company consists of 250,000,000 shares of common stock and 50,000,000 shares of preferred stock, par value $0.01 per share. Holders of the Company’s common shares are entitled to one vote for each share held of record on all matters submitted to a vote of stockholders and to receive ratably in proportion to the shares of common stock held by them any dividends declared from time to time by the board of directors. The common shares have no preferences or rights of conversion, exchange, pre-exemption or other subscription rights.
Share Activity
The following table summarizes changes in the number of shares of common stock and treasury stock since January 1, 2015:
|
|
|
Common |
|
Treasury |
|
|
Share count as of December 31, 2014 (Predecessor) |
|
7,049,173 |
|
(53,467 |
) |
|
Grants of restricted stock |
|
268,677 |
|
— |
|
|
Forfeitures of restricted stock |
|
(94,159 |
) |
— |
|
|
Acquisition of treasury stock |
|
— |
|
(42,824 |
) |
|
Fractional share adjustment due to reverse stock split |
|
(10 |
) |
— |
|
|
Issuance of common stock for Series A Preferred Stock conversion |
|
3,738,424 |
|
— |
|
|
Share count as of December 31, 2015 (Predecessor) |
|
10,962,105 |
|
(96,291 |
) |
|
Grants of restricted stock |
|
— |
|
— |
|
|
Forfeitures of restricted stock |
|
(47,325 |
) |
— |
|
|
Acquisition of treasury stock |
|
— |
|
(52,358 |
) |
|
Share count as of October 21, 2016 (Predecessor) |
|
10,914,780 |
|
(148,649 |
) |
|
Cancellation of common stock |
|
(10,914,780 |
) |
— |
|
|
Cancellation of treasury stock |
|
— |
|
148,649 |
|
|
Share count as of October 21, 2016 (Predecessor) |
|
— |
|
— |
|
|
Issuance of successor common stock |
|
24,687,500 |
|
— |
|
|
Share count as of October 21, 2016 (Successor) |
|
24,687,500 |
|
— |
|
|
Issuance of successor common stock |
|
307,367 |
|
— |
|
|
Acquisition of treasury stock |
|
— |
|
— |
|
|
Share count as of December 31, 2016 (Successor) |
|
24,994,867 |
|
— |
|
|
Issuance of successor common stock |
|
278,102 |
|
— |
|
|
Acquisition of treasury stock |
|
— |
|
(99,623 |
) |
|
Share count as of December 31, 2017 (Successor) |
|
25,272,969 |
|
(99,623 |
) |
(1) Treasury stock represents the net settlement on vesting of restricted stock necessary to satisfy the minimum statutory withholding requirements.
Warrants
At the Effective Date, the Company issued 4,411,765 Third Lien Notes Warrants to purchase up to an aggregate of 4,411,765 shares of common stock at an initial exercise price of $24.00 per share and 2,213,789 Unsecured Creditor Warrants to purchase up to an aggregate of 2,213,789 shares of common stock at an initial exercise price of $46.00 per share. The Warrants expire on April 21, 2020.
Holders of the Warrants do not have the right to vote, to consent, to receive any cash dividends, stock dividends, allotments or rights or other distributions paid, allotted or distributed or distributable to the holders of shares of common stock, or to exercise any rights whatsoever as a stockholder of the Company unless, until and only to the extent such holder of Warrants becomes a holder of record of shares of common stock issued upon settlement of Warrants.
The number of shares of common stock for which the Warrants is exercisable, and the exercise price per share of the Warrants are subject to adjustment from time to time upon the occurrence of certain events, including the issuance of common stock as a dividend or distribution to all holders of shares of common stock, a pro rata repurchase offer of common stock or a subdivision, combination, split, reverse split or reclassification of outstanding common stock into a greater or smaller number of shares of common stock.
Upon the occurrence of certain events constituting an organic change (as defined in the Warrant Agreements), holders of the Warrants will have the right to receive, upon exercise of the Warrants, the amount of securities, cash or other property received in connection with such event with respect to or in exchange for the number of shares of common stock for which such Warrants are exercisable immediately prior to such event.
The Warrants permit a holder to elect to exercise such that no payment of cash will be required (a “Net Share Settlement”). If Net Share Settlement is elected, the Company is authorized to withhold and not issue in payment of the exercise price, a number of shares of common stock equal to (i) the number of shares of common stock for which the Warrants are being exercised, multiplied by (ii) the exercise price, and divided by (iii) the current sale price (as defined in the Warrant Agreements) on the exercise date.
Share-Based Compensation
Emergence from Bankruptcy
The Company’s share-based compensation awards that remained unvested at the Effective Date were cancelled upon the Company’s emergence from the Chapter 11 Cases. The cancellation of these share-based compensation awards resulted in the recognition of $1.3 million of expense in the Predecessor Period to record any previously unamortized expense related to such awards. Also, at the Effective Date, the Company’s 2012 Long Term Incentive Plan (the “2012 LTIP”) was replaced by the Company’s 2016 LTIP. The types of awards that may be granted under the 2016 LTIP include stock options, restricted stock units (“RSUs”), restricted stock, performance and market awards and other forms of awards granted or denominated in shares of common stock of the reorganized Company, as well as certain cash-based awards (the “Awards”). The terms of each award are as determined by the Compensation Committee of the Board of Directors.
2016 Long Term Incentive Plan
On the Effective Date, the Company established the 2016 LTIP and filed a Form S-8 with the SEC, registering 3,513,950 shares for issuance under the terms of the 2016 LTIP to employees, directors and certain other persons (the “Award Shares”).
Subject to certain limitations as defined in the 2016 LTIP, the terms of each Award are to be determined by the Compensation Committee of the Board of Directors. Awards that expire, or are canceled, forfeited, exchanged, settled in cash or otherwise terminated, will again be available for future issuance under the 2016 LTIP. At December 31, 2017, 2,129,011 Award Shares remain available for issuance under the terms of the 2016 LTIP.
2012 Long Term Incentive Plan
On April 20, 2012, the Company established the 2012 LTIP and filed a Form S-8 with the SEC. The 2012 LTIP provided for the granting of Options (Incentive and other), Restricted Stock Awards, RSUs, Stock Appreciation Rights, Dividend Equivalents, Bonus Stock, Other Stock-Based Awards, Annual Incentive Awards, Performance Awards, or any combination of the foregoing. Subject to certain limitations as defined in the 2012 LTIP, the terms of each Award were determined by the Compensation Committee of the Board of Directors. The 2012 LTIP was cancelled upon the Company’s emergence on the Effective Date.
Restricted Stock Units
As of December 31, 2017, the Company had 324,984 shares of RSUs outstanding to employees and non-employee directors pursuant to the 2016 LTIP, excluding RSUs issued to non-employee directors containing a market condition and RSUs issued to the Chief Executive Officer (“CEO”) containing a market condition, which are discussed below. RSUs granted to employees under the 2016 LTIP vest ratably over a period of three years: one-sixth will vest on the six-month anniversary of the grant date, an additional one-sixth will vest on the twelve-month anniversary of the grant date, an additional one-third will vest on the twenty-four month anniversary of the grant date and the final one-third will vest on the thirty-six month anniversary of the grant date. RSUs granted to non-employee directors vest on the first to occur of (i) one-year elapses from the grant date, (ii) the date the non-employee director ceases to be a director of the Board (other than for cause), (iii) the director’s death, (iv) the director’s disability or (v) a change in control of the Company.
If an employee terminates employment prior to the vesting date, the outstanding award is forfeited. RSUs are subject to accelerated vesting in the event a recipient’s employment is terminated prior to the vesting date by the Company without “Cause” or by the participant with “Good Reason” (each, as defined in the 2016 LTIP) or due to the participant’s death or disability.
The fair value of RSUs was based on grant date fair value of the Company’s common stock. Compensation expense is recognized ratably over the requisite service period.
The following table summarizes the Company’s non-vested restricted stock unit award activity for the year ended December 31, 2017, the Successor Period, the Predecessor Period and the year ended December 31, 2015:
|
|
|
Restricted Stock |
|
Weighted Average |
| |
|
Non-vested shares outstanding at December 31, 2014 (Predecessor) |
|
306,202 |
|
$ |
52.76 |
|
|
Granted |
|
268,677 |
|
$ |
12.29 |
|
|
Vested |
|
(162,689 |
) |
$ |
54.39 |
|
|
Forfeited |
|
(94,159 |
) |
$ |
38.69 |
|
|
Non-vested shares outstanding at December 31, 2015 (Predecessor) |
|
318,031 |
|
$ |
21.46 |
|
|
Granted |
|
— |
|
$ |
— |
|
|
Vested |
|
(162,393 |
) |
$ |
23.09 |
|
|
Forfeited |
|
(47,325 |
) |
$ |
19.02 |
|
|
Non-vested shares outstanding at October 20, 2016 (Predecessor) |
|
108,313 |
|
$ |
20.08 |
|
|
Cancellation of non-vested shares |
|
(108,313 |
) |
$ |
20.08 |
|
|
Non-vested shares outstanding at October 20, 2016 (Predecessor) |
|
— |
|
$ |
— |
|
|
Granted at Effective Date |
|
686,324 |
|
$ |
19.66 |
|
|
Non-vested shares outstanding at October 21, 2016 (Successor) |
|
686,324 |
|
$ |
19.66 |
|
|
Granted |
|
2,035 |
|
$ |
20.97 |
|
|
Forfeited |
|
(2,697 |
) |
$ |
19.66 |
|
|
Non-vested shares outstanding at December 31, 2016 (Successor) |
|
685,662 |
|
$ |
19.66 |
|
|
Granted |
|
85,389 |
|
$ |
16.50 |
|
|
Vested(1) |
|
(335,958 |
) |
$ |
19.65 |
|
|
Forfeited |
|
(110,109 |
) |
$ |
19.66 |
|
|
Non-vested shares outstanding at December 31, 2017 (Successor) |
|
324,984 |
|
$ |
18.84 |
|
(1) Vested RSUs include 109,820 awards in which vesting was accelerated to October 21, 2017 as a result of the former CEO’s amended employment agreement, as well as, 57,856 director awards that vested at December 31, 2017 but receipt/issuance of the vested shares was deferred until 2020.
On August 22, 2017, the Company amended the employment agreement of Fredric F. Brace, former President and Chief Executive Officer (the “Executive Employment Amendment”). Among other provisions, the Executive Employment Amendment accelerated the vesting of all outstanding equity awards of Mr. Brace to October 21, 2017. As a result, approximately $1.2 million of compensation expense associated with Mr. Brace’s non-vested restricted stock was accelerated into the third and fourth quarters of 2017.
The share-based compensation costs (net of amounts capitalized to oil and gas properties) related to RSUs recognized as general and administrative expense by the Company for the year ended December 31, 2017, the Successor Period, the Predecessor Period and the year ended December 31, 2015, was $5.8 million, $1.7 million, $2.6 million and $4.4 million, respectively. For the year ended December 31, 2017, the Successor Period, the Predecessor Period and the year ended December 31, 2015, the Company capitalized $1.3 million, $0.4 million, $0.5 million and $1.3 million, respectively, of qualifying restricted stock unit share-based compensation costs to oil and gas properties.
For the year ended December 31, 2014, the Company announced that its corporate headquarters was relocating from Houston, Texas to Tulsa, Oklahoma, which resulted in the accelerated vesting of restricted stock awards under the 2012 LTIP in the period for Houston employees subject to a severance agreement. Of the $4.4 million in share-based compensation for year ended December 31, 2015, approximately $1.5 million was related to the accelerated vesting for employees impacted by the corporate relocation.
Unrecognized expense as of December 31, 2017 for all outstanding RSUs under the 2016 LTIP Plan was $3.5 million and will be recognized over a weighted average period of 1.4 years.
Stock Options
On December 31, 2017, the Company had 245,845 options outstanding pursuant to the 2016 LTIP. Stock Option Awards granted under the 2016 LTIP vest ratably over a period of three years: one-sixth will vest on the six-month anniversary of the grant date, an additional one-sixth will vest on the twelve-month anniversary of the grant date, an additional one-third will vest on the twenty-four month anniversary of the grant date and the final one-third will vest on the thirty-six month anniversary of the grant date. Stock Option Awards expire 10 years from the grant date.
If an employee terminates employment prior to the vesting date, the outstanding award is forfeited. Stock options are subject to accelerated vesting in the event a recipient’s employment is terminated prior to the vesting date by the Company without “Cause” or by the participant with “Good Reason” (each, as defined in the 2016 LTIP) or due to the participant’s death or disability.
The Company utilizes the Black-Scholes-Merton option pricing model to determine the fair value of stock option awards. Determining the fair value of equity-based awards requires judgment, including estimating the expected term that stock option awards will be outstanding prior to exercise and the associated volatility.
The weighted average assumptions used to estimate the fair value of stock option awards granted in 2017 and 2016 are as follows:
|
|
|
Awards Issued in |
|
Awards Issued in |
| ||
|
Weighted-average assumptions used: |
|
|
|
|
| ||
|
Risk-free interest rate (1) |
|
2.11 |
% |
1.38 |
% | ||
|
Dividend yield |
|
— |
|
— |
| ||
|
Expected option life (2) |
|
5.96 |
|
5.96 |
| ||
|
Expected volatility (3) |
|
65.0 |
% |
60.0 |
% | ||
|
Calculated fair value per stock option |
|
$ |
11.43 |
|
$ |
10.88 |
|
(1) U.S. Treasury yields as of the grant date were utilized for the risk-free interest rate assumption, matching the treasury yield terms to the expected life of the option.
(2) As the Company does not have significant history associated with stock options, expected option life assumptions were developed using the simplified method in accordance with US GAAP. A change in the expected option life of +/- 2 years would impact expense by $0.1 million and $(0.2) million for the Successor Period and $0.9 million and $(1.1) million over the vesting period of three years. Stock options granted during the year ended December 31, 2017 were not significant.
(3) As the Company does not have significant stock option history, it utilized six peer companies of comparable size and industry to estimate volatility utilizing a period that is commensurate with the expected option life. The Company weighted historical volatility and implied volatility 50/50 for those peer companies where both were available, with volatility ranging in the peer companies from 36.9% to 68.2% in 2017 and 38.5% to 65.9% in 2016.
The following table summarizes the Company’s 2016 LTIP non-vested stock option activity for the year ended December 31, 2017 and the Successor Period:
|
|
|
Options |
|
Range of |
|
Weighted |
|
Weighted |
| ||
|
Stock options outstanding at October 21, 2016 |
|
628,468 |
|
$ |
19.66 |
|
$ |
19.66 |
|
8.8 |
|
|
Granted |
|
2,035 |
|
$ |
20.97 |
|
$ |
20.97 |
|
8.9 |
|
|
Vested |
|
— |
|
$ |
— |
|
$ |
— |
|
— |
|
|
Forfeited |
|
(2,697 |
) |
|
|
$ |
19.66 |
|
— |
| |
|
Stock options outstanding at December 31, 2016 |
|
627,806 |
|
|
|
$ |
19.66 |
|
8.8 |
| |
|
Granted |
|
4,000 |
|
$ |
19.08 |
|
$ |
19.08 |
|
9.2 |
|
|
Vested (1) |
|
(253,678 |
) |
$ |
19.08-20.97 |
|
$ |
19.66 |
|
— |
|
|
Forfeited |
|
(132,283 |
) |
$ |
19.66 |
|
$ |
19.66 |
|
— |
|
|
Stock options outstanding at December 31, 2017 |
|
245,845 |
|
|
|
$ |
19.66 |
|
8.9 |
| |
|
Vested and exercisable at end of period (2) |
|
253,678 |
|
$ |
19.08-20.97 |
|
$ |
19.66 |
|
8.8 |
|
(1) Vested stock options include 109,820 awards in which vesting was accelerated to October 21, 2017 as a result of the former CEO’s amended employment agreement.
(2) Vested and exercisable options at December 31, 2017, had no aggregate intrinsic value. There were no vested options at December 31, 2016.
On August 22, 2017, the Company amended the Executive Employment Amendment. Among other provisions, the Executive Employment Amendment accelerated the vesting of all outstanding equity awards of Mr. Brace to October 21, 2017. As a result, approximately $0.7 million of compensation expense associated with Mr. Brace’s non-vested stock options was accelerated into the third and fourth quarters of 2017.
The share-based compensation costs (net of amounts capitalized to oil and gas properties) related to stock options recognized as general and administrative expense by the Company for the years ended December 31, 2017 and 2016 was $2.6 million and $0.8 million, respectively. For the years ended December 31, 2017 and 2016, the Company capitalized $0.7 million and $0.2 million, respectively, of qualifying stock option share-based compensation costs to oil and gas properties.
Unrecognized expense as of December 31, 2017 for all outstanding stock options was $1.3 million and will be recognized over a weighted average period of 1.3 years.
Non-Employee Director Restricted Stock Units Containing a Market Condition
On November 23, 2016, the Company issued certain RSUs to its non-employee directors that contain a market vesting condition. These RSUs will vest (i) on the first business day following the date on which the trailing 60-day average share price (including any dividends paid) of the Company’s common stock is equal to or greater than $30.00 or (ii) upon a change in control of the Company. Additionally, all unvested RSUs containing a market vesting condition will be immediately forfeited upon the first to occur of (i) the fifth (5th) anniversary of the grant date or (ii) any participant’s termination for any reason (except for a termination as part of a change in control of the Company).
These restricted stock awards are accounted for as liability awards under FASB Accounting Standards Codification (“ASC”) 718 as the awards allow for the withholding of taxes at the discretion of the non-employee director. The liability is re-measured, with a corresponding adjustment to earnings, at each fiscal quarter-end during the performance cycle. The liability and related compensation expense of these awards for each period is recognized by dividing the fair value of the total liability by the requisite service period and recording the pro rata share for the period for which service has already been provided. As there are inherent uncertainties related to these factors and the Company’s judgment in applying them to the fair value determinations, there is risk that the recorded compensation may not accurately reflect the amount ultimately earned by the non-employee directors.
A Monte Carlo simulation was used in order to determine the fair value of these awards as of December 31, 2017 and 2016. The assumptions used to estimate the fair value of restricted stock unit awards with a market condition at December 31, 2017 and 2016 are as follows:
|
|
|
December 31, 2017 |
|
December 31, 2016 |
| ||
|
Risk-free interest rate (1) |
|
2.06 |
% |
1.89 |
% | ||
|
Dividend yield |
|
— |
|
— |
| ||
|
Expected volatility (2) |
|
54.8 |
% |
60.0 |
% | ||
|
Market Price Hurdle |
|
$ |
30.00 |
|
$ |
30.00 |
|
|
Calculated fair value per restricted stock unit |
|
$ |
11.54 |
|
$ |
17.71 |
|
(1) U.S. Treasury yields as of the grant date were utilized for the risk-free interest rate assumption, matching the treasury yield terms to the expected life of the restricted stock unit.
(2) As the Company does not have a significant stock trading history, it utilized six peer companies of comparable size and industry to estimate volatility utilizing a period that is commensurate with the expected option life. The Company weighted historical volatility and implied volatility 50/50 for those peer companies where both were available, with volatility ranging in the peer companies from 55.1% to 89.0% and 39.8% to 61.4%, respectively.
The restricted stock unit awards issued to non-employee directors containing a market condition had a derived service period of one year. At December 31, 2017 and 2016, the Company recorded $0.9 million and $0.1 million, respectively, of liabilities included within accrued liabilities on the consolidated balance sheets related to the market condition awards. As of December 31, 2017, there was no unrecognized stock-based compensation related to director market condition awards.
The following table reflects the outstanding non-employee director restricted stock unit awards containing a market condition for the year ended December 31, 2017 and the Successor Period:
|
|
|
Shares |
|
Weighted Average |
| |
|
Outstanding at October 21, 2016 |
|
— |
|
$ |
— |
|
|
Granted |
|
76,296 |
|
$ |
17.71 |
|
|
Vested |
|
— |
|
$ |
— |
|
|
Forfeited |
|
— |
|
$ |
— |
|
|
Outstanding at December 31, 2016 |
|
76,296 |
|
$ |
17.71 |
|
|
Outstanding at December 31, 2017 |
|
76,296 |
|
$ |
17.71 |
|
Chief Executive Officer Restricted Stock Units Containing a Market Condition
On November 1, 2017, the Company issued certain RSUs to our CEO that contain a market vesting condition. These RSUs will vest, if at all, based on the Company’s total stockholder return for the performance period of October 25, 2017 through October 31, 2020. Market conditions under this grant are (1) with respect to 50% of the RSUs granted, the Company’s cumulative total shareholder return (“TSR”) which is defined as the change in the value of the stock over the performance period with the beginning and ending stock price based on a 20-day average stock price and (2) with respect to the remaining 50% of the RSUs granted, the Company’s “Relative TSR” as follows:
|
|
|
Actual TSR for the Performance Period |
|
Vesting as % of |
|
Relative TSR for the Performance Period |
|
Vesting as % of |
|
|
Maximum |
|
25% or greater compounded annual growth (“CAGR”) |
|
120 |
% |
Top 5% or better Relative TSR to Peer Group |
|
120 |
% |
|
Target |
|
20% or greater CAGR |
|
100 |
% |
Top 33.3% or better Relative TSR to Peer Group |
|
100 |
% |
|
Threshold |
|
15% or greater CAGR |
|
50 |
% |
Top 50% or better Relative TSR to Peer Group |
|
50 |
% |
|
Below Threshold |
|
Less than 15% CAGR |
|
0 |
% |
Less than 50% of Relative TSR to Peer Group |
|
0 |
% |
To the extent that actual TSR or Relative TSR for the performance period is between specified vesting levels, the portion of the RSUs that shall become vested based on actual and relative TSR performance shall be determined on a pro rata basis using straight-line interpolation; provided that the maximum portion of the RSUs that may become vested based on actual cumulative TSR or relative TSR for the performance period shall not exceed 120% of the awards granted.
If the CEO terminates employment prior to vesting, the outstanding award is forfeited. The CEO RSUs with a market condition are subject to accelerated vesting in the event the CEO’s employment is terminated prior to vesting by the Company without “Cause” or by the participant with “Good Reason” (each, as defined in the 2016 LTIP) or due to the participant’s death or disability. Upon a change in control, the compensation committee of the board of directors could (1) accelerate all or a portion of the award, (2) cancel all of the award and pay cash, stock or combination equal to the change in control price, (3) provide for the assumption or substitution or continuation by the successor company, (4) certify to the extent to which the vesting conditions had been achieved prior to the conclusion of the performance period or (5) adjust RSUs to reflect the change in control.
These restricted stock awards are accounted for as equity awards under FASB ASC 718 as the awards are settled in shares of the Company with no additional settlement options permitted. At the grant date, the Company estimated the fair value of this equity award. The compensation expense of this award each period is recognized by dividing the fair value of the total award by the requisite service period and recording the pro rata share for the period for which service has already been provided. As there are inherent uncertainties related to these factors and the Company’s judgment in applying them to the fair value determinations, there is risk that the recorded compensation may not accurately reflect the amount ultimately earned by the CEO.
A Monte Carlo simulation was used in order to determine the fair value of these awards at the grant date. The assumptions used to estimate the fair value of CEO’s restricted stock unit awards with a market condition are as follows:
|
|
|
Awards Issued |
|
|
Risk-free interest rate (1) |
|
1.74% |
|
|
Dividend yield |
|
— |
|
|
Expected volatility |
|
41.0% - 130.0% |
|
|
Calculated fair value per unit |
|
$10.92 |
|
(1) U.S. Treasury yields as of the grant date were utilized for the risk-free interest rate assumption, matching the treasury yield terms to the life of the CEO restricted stock unit award with a market condition.
The RSUs issued to the CEO containing a market condition have a service period of three years. The share-based compensation costs related to the CEO RSUs containing a market condition recognized as general and administrative expense by the Company was $0.1 million at December 31, 2017. As of December 31, 2017, unrecognized stock-based compensation related to CEO RSUs containing a market condition was $1.4 million and will be recognized over a weighted-average period of 2.8 years.
The following table reflects the outstanding CEO RSUs containing a market condition for the year ended December 31, 2017:
|
|
|
Shares |
|
Weighted Average |
| |
|
Outstanding at December 31, 2016 |
|
— |
|
$ |
— |
|
|
Granted |
|
135,778 |
|
$ |
10.92 |
|
|
Vested |
|
— |
|
$ |
— |
|
|
Forfeited |
|
— |
|
$ |
— |
|
|
Outstanding at December 31, 2017 |
|
135,778 |
|
$ |
10.92 |
|
Unrestricted Common Share Awards
On November 7, 2016, 12,400 shares of unrestricted stock were issued to employees and non-employee directors, which vested immediately upon issuance. For the Successor Period, total expense associated with these unrestricted vested common shares was $0.2 million. There was no unrecognized expense associated with these awards at December 31, 2017 or 2016.
Stock-Based Compensation Expense Summary
The following summarizes stock-based compensation expense for the periods presented (in thousands):
|
|
|
Successor |
|
|
Predecessor |
| ||||||||
|
|
|
For the Year |
|
For the |
|
|
For the |
|
For the Year |
| ||||
|
|
|
2017 |
|
31, 2016 |
|
|
2016 |
|
2015 |
| ||||
|
Restricted stock units (Predecessor) |
|
$ |
— |
|
$ |
— |
|
|
$ |
3,040 |
|
$ |
5,755 |
|
|
Restricted stock units (Successor) |
|
7,083 |
|
2,114 |
|
|
— |
|
— |
| ||||
|
Stock options (Successor) |
|
3,289 |
|
1,046 |
|
|
— |
|
— |
| ||||
|
Non-employee director restricted stock units with a market condition (Successor) |
|
736 |
|
142 |
|
|
— |
|
— |
| ||||
|
CEO restricted stock units with a market condition (Successor) |
|
83 |
|
— |
|
|
— |
|
— |
| ||||
|
Unrestricted stock awards (Successor) |
|
— |
|
244 |
|
|
— |
|
— |
| ||||
|
Total stock-based compensation |
|
11,191 |
|
3,546 |
|
|
3,040 |
|
5,755 |
| ||||
|
Less: amounts capitalized to oil and natural gas properties |
|
(1,995 |
) |
(637 |
) |
|
(476 |
) |
(1,347 |
) | ||||
|
Net stock-based compensation |
|
$ |
9,196 |
|
$ |
2,909 |
|
|
$ |
2,564 |
|
$ |
4,408 |
|
13. Income Taxes
The Company emerged from bankruptcy in October 2016. Under the Bankruptcy Plan, a substantial portion of the Company’s pre-petition debt securities were extinguished. Absent an exception, a debtor recognizes cancellation of indebtedness income (“CODI”) upon discharge of its outstanding indebtedness for an amount of consideration that is less than its adjusted issue price. The Internal Revenue Code of 1986, as amended (“IRC”), provides that a debtor in a bankruptcy case may exclude CODI from taxable income but must reduce certain of its tax attributes by the amount of any CODI realized as a result of the consummation of a plan of reorganization. The amount of CODI realized by a taxpayer is the adjusted issue price of any indebtedness discharged less the sum of (i) the amount of cash paid, (ii) the issue price of any new indebtedness issued and (iii) the fair market value of any other consideration, including equity, issued. As a result of the market value of equity upon emergence from Chapter 11 bankruptcy proceedings, the estimated amount of U.S. CODI is approximately $1.2 billion, which reduced the value of the Company’s U.S. net operating losses and other assets. The actual reduction in tax attributes occurred on the first day of the Company’s tax year subsequent to the date of emergence, or January 1, 2017.
The Company had a full reduction of its federal and state NOL carryforwards and a reduction of the tax basis in its fixed assets as of January 1, 2017, pursuant to IRC section 108.
On December 22, 2017, the Tax Cuts and Jobs Act (“the Tax Act”) was enacted into law and the new legislation contains several key tax provisions that affected the Company, primarily a reduction of the corporate income tax rate to 21% effective January 1, 2018. The Company is required to recognize the effect of the tax law changes in the period of enactment, such as re-measuring our U.S. deferred tax assets and liabilities as well as reassessing the net realizability of our deferred tax assets and liabilities. In December 2017, the SEC staff issued Staff Accounting Bulletin (“SAB”) No. 118, Income Tax Accounting Implications of the Tax Cuts and Jobs Act, which allows the Company to record provisional amounts during a measurement period not to extend beyond one year of the enactment date. As the Tax Act was passed late in the fourth quarter of 2017, ongoing guidance from the Department of Treasury and state agencies and accounting interpretation is expected to be issued over the next 12 months. Therefore, the Company considers the accounting of certain items, as discussed below, to be incomplete due to forthcoming guidance and the ongoing analysis of final year-end data and tax positions.
The Company has estimated deductions of $10.9 million associated with the full expensing of the costs of qualified property that were incurred and placed in service during the period from September 27, 2017 to December 31, 2017. The Company continues to analyze assets placed in service after September 27, 2017, but not qualifying for full expensing as a result of being acquired under an agreement entered into prior to that date. In addition, further guidance and analysis is required in order to review the terms of our compensation plans and agreements and assess the impact of transitional guidance related to IRC Section 162(m) on awards granted prior to November 2, 2017, subject to the grandfather provisions. As a result, the Company has not adjusted certain tax items previously reported on its financial statements for IRC Section 162(m) until it is able to obtain sufficient information to make a reasonable estimate of the effects of the Tax Act. The Company expects to complete its analysis within the measurement period in accordance with SAB No. 118.
As of December 31, 2017, the Company has recorded a full valuation allowance against its net deferred tax assets of $120.1 million, of which $72.6 million relates to deferred tax assets on the Company’s property and equipment. The change in the Company’s valuation allowance was driven by two amounts; (1) a $32.5 million increase due to the Company’s yearly activity from December 31, 2016 to December 31, 2017; and (2) a $73.2 million reduction as a result of the reduction of the corporate tax rate in the Tax Act.
As of December 31, 2017, the Company has not recorded a reserve for any uncertain tax positions. The Company believes that there are no new items, nor changes in facts or judgments that should impact the Company’s tax position. No federal income tax payments are expected in the upcoming four quarterly reporting periods.
|
|
|
Successor |
|
|
Predecessor |
| ||||||||
|
|
|
For the Year Ended |
|
For the Period |
|
|
For the Period |
|
For the Year Ended |
| ||||
|
|
|
December 31, 2017 |
|
December 31, 2016 |
|
|
October 20, 2016 |
|
December 31, 2015 |
| ||||
|
|
|
(in thousands) |
|
|
(in thousands) |
| ||||||||
|
Current |
|
|
|
|
|
|
|
|
|
| ||||
|
United States |
|
$ |
— |
|
$ |
— |
|
|
$ |
— |
|
$ |
— |
|
|
State |
|
— |
|
— |
|
|
— |
|
— |
| ||||
|
Total current |
|
— |
|
— |
|
|
— |
|
— |
| ||||
|
Deferred |
|
|
|
|
|
|
|
|
|
| ||||
|
United States |
|
— |
|
— |
|
|
— |
|
(3,864 |
) | ||||
|
State |
|
— |
|
— |
|
|
— |
|
(5,777 |
) | ||||
|
Total deferred |
|
— |
|
— |
|
|
— |
|
(9,641 |
) | ||||
|
Total income tax provision (benefit) |
|
$ |
— |
|
$ |
— |
|
|
$ |
— |
|
$ |
(9,641 |
) |
The Company’s estimated income tax expense differs from the amount derived by applying the statutory federal rate to pretax income principally due the effect of the following items:
|
|
|
Successor |
|
|
Predecessor |
| ||||||||
|
|
|
For the Year Ended |
|
For the Period |
|
|
For the Period |
|
Year Ended |
| ||||
|
|
|
December 31, 2017 |
|
December 31, 2016 |
|
|
October 20, 2016 |
|
December 31, 2015 |
| ||||
|
|
|
(in thousands) |
|
|
(in thousands) |
| ||||||||
|
Income (loss) before taxes |
|
$ |
(85,077 |
) |
$ |
9,930 |
|
|
$ |
1,323,079 |
|
$ |
(1,806,836 |
) |
|
Statutory rate |
|
35 |
% |
35 |
% |
|
35 |
% |
35 |
% | ||||
|
Income tax provision (benefit) computed at statutory rate |
|
(29,777 |
) |
3,475 |
|
|
463,078 |
|
(632,393 |
) | ||||
|
Reconciling items: |
|
|
|
|
|
|
|
|
|
| ||||
|
State income taxes, net of federal benefit |
|
(2,864 |
) |
296 |
|
|
39,424 |
|
(65,904 |
) | ||||
|
Change in valuation allowance |
|
(40,700 |
) |
(3,876 |
) |
|
(528,706 |
) |
689,419 |
| ||||
|
Adjustment to deferred tax assets and liabilities for enacted change in federal tax rate |
|
73,182 |
|
— |
|
|
— |
|
— |
| ||||
|
Change in state rate |
|
(606 |
) |
(1 |
) |
|
(153 |
) |
(612 |
) | ||||
|
Bankruptcy items |
|
— |
|
— |
|
|
12,262 |
|
— |
| ||||
|
Deferred tax true-ups |
|
(140 |
) |
74 |
|
|
9,891 |
|
— |
| ||||
|
Other, net |
|
905 |
|
32 |
|
|
4,204 |
|
(151 |
) | ||||
|
Total income tax provision (benefit) |
|
$ |
— |
|
$ |
— |
|
|
$ |
— |
|
$ |
(9,641 |
) |
Deferred income taxes primarily represent the net tax effect of temporary differences between the carrying amounts of assets and liabilities for financial reporting purposes and the amounts used for income tax purposes. The components of our deferred taxes are detailed in the table below (in thousands):
|
|
|
As of |
|
As of |
| ||
|
|
|
2017 |
|
2016 |
| ||
|
Deferred tax assets |
|
|
|
|
| ||
|
Federal tax loss carryforwards |
|
36,429 |
|
— |
| ||
|
Derivative instruments and other |
|
813 |
|
— |
| ||
|
State tax loss carryforwards |
|
7,195 |
|
— |
| ||
|
Employee benefit plans |
|
3,053 |
|
3,649 |
| ||
|
Oil and gas properties and equipment |
|
72,568 |
|
157,113 |
| ||
|
Other |
|
33 |
|
27 |
| ||
|
Less valuation allowance |
|
(120,091 |
) |
(160,789 |
) | ||
|
Total deferred tax assets |
|
$ |
— |
|
$ |
— |
|
|
Deferred tax liabilities |
|
|
|
|
| ||
|
Oil and gas properties and equipment |
|
— |
|
— |
| ||
|
Total deferred tax liabilities |
|
$ |
— |
|
$ |
— |
|
|
Reflected in the accompanying balance sheet as: |
|
|
|
|
| ||
|
Net deferred tax asset (liability) |
|
$ |
— |
|
$ |
— |
|
14. Income (Loss) Per Share
Successor
The following table provides a reconciliation of net income (loss) attributable to common shareholders and weighted average common shares outstanding for basic and diluted income (loss) per share for the year ended December 31, 2017 and the Successor Period:
|
|
|
|
|
For the Period |
| ||
|
|
|
Year Ended |
|
October 21, 2016 through |
| ||
|
|
|
(in thousands, except per |
|
(in thousands, except per |
| ||
|
Net Income (Loss): |
|
|
|
|
| ||
|
Net income (loss) |
|
$ |
(85,077 |
) |
$ |
9,930 |
|
|
Participating securities—non-vested restricted stock |
|
— |
|
(280 |
) | ||
|
Basic and diluted income (loss) |
|
$ |
(85,077 |
) |
$ |
9,650 |
|
|
|
|
|
|
|
| ||
|
Common Shares: |
|
|
|
|
| ||
|
Common shares outstanding — basic (1) |
|
25,119 |
|
25,009 |
| ||
|
Dilutive effect of potential common shares |
|
— |
|
— |
| ||
|
Common shares outstanding — diluted |
|
25,119 |
|
25,009 |
| ||
|
|
|
|
|
|
| ||
|
Net Income (Loss) Per Share: |
|
|
|
|
| ||
|
Basic |
|
$ |
(3.39 |
) |
$ |
0.39 |
|
|
Diluted |
|
$ |
(3.39 |
) |
$ |
0.39 |
|
|
Antidilutive stock options (2) |
|
466 |
|
627 |
| ||
|
Antidilutive warrants (3) |
|
6,626 |
|
6,626 |
| ||
(1) Weighted-average common shares outstanding for basic and diluted income (loss) per share purposes includes 17,533 shares of common stock that, while not issued and outstanding at December 31, 2017 or 2016, are required by the Plan to be issued. Weighted-average common shares outstanding for basic and diluted income (loss) per share purposes also includes 57,856 director shares that vested at December 31, 2017 but final issuance of the vested shares was deferred until 2020.
(2) Amount represents options to purchase common stock that are excluded from the diluted net income (loss) per share calculations because the options are antidilutive.
(3) Amount represents warrants to purchase common stock that are excluded from the diluted net income (loss) per share calculations because the warrants are antidilutive.
Predecessor
The following table provides a reconciliation of net income (loss) to preferred shareholders, common shareholders, and participating securities for purposes of computing net income (loss) per share for the Predecessor Period and the year ended December 31, 2015:
|
|
|
For the Period |
|
|
| ||
|
|
|
January 1, 2016 through |
|
Year Ended |
| ||
|
|
|
(in thousands, except per share amounts) |
| ||||
|
Net income (loss) |
|
$ |
1,323,079 |
|
$ |
(1,797,195 |
) |
|
Preferred dividend(1) |
|
— |
|
(948 |
) | ||
|
Net income (loss) attributable to shareholders |
|
$ |
1,323,079 |
|
$ |
(1,798,143 |
) |
|
Participating securities—Series A preferred stock(2) |
|
— |
|
— |
| ||
|
Participating securities—Non-vested restricted stock(2) |
|
(16,522 |
) |
— |
| ||
|
Net income (loss) attributable to common shareholders |
|
$ |
1,306,557 |
|
$ |
(1,798,143 |
) |
|
Weighted average shares outstanding |
|
10,645 |
|
7,726 |
| ||
|
Basic and diluted net income (loss) per share |
|
$ |
122.74 |
|
$ |
(232.74 |
) |
(1) Calculation of the preferred stock dividend is discussed in “—Note 11. Preferred Stock”.
(2) As these shares are participating securities that participate in earnings, but are not required to participate in losses, this calculation demonstrates that there is not an allocation of the loss to the non-vested restricted stockholders.
15. Concentrations of Credit Risk
Financial instruments which potentially subject the Company to credit risk consist primarily of cash balances, accounts receivable and derivative financial instruments.
The Company maintains cash and cash equivalents in bank deposit accounts which, at times, may exceed the federally insured limits. The Company has not experienced any significant losses from such investments.
The Company normally sells production to a relatively small number of purchasers, as is customary in the exploration, development and production business. The Company typically sells a substantial portion of production under short-term (usually one-month) contracts tied to a local index. The Company does not have any long-term, fixed-price sales contracts. For the year ended December 31, 2017, three purchasers accounted for 37%, 25% and 14%, respectively, of the Company’s revenue. For the Successor Period, two purchasers accounted for 40% and 29%, respectively, of the Company’s revenue. For the Predecessor Period, two purchasers accounted for 46% and 29%, respectively, of the Company’s revenue. For the year ended December 31, 2015, two purchasers accounted for 43% and 25%, respectively, of the Company’s revenue.
Substantially all of the Company’s accounts receivable result from the sale of oil, NGLs and natural gas. At December 31, 2017, three purchasers accounted for approximately 42%, 35% and 10%, respectively, of the accounts receivable balance. At December 31, 2016, two purchasers accounted for approximately 44% and 26%, respectively, of the accounts receivable balance.
Derivative financial instruments are generally executed with major financial institutions that expose the Company to market and credit risks and which may, at times, be concentrated with certain counterparties. The credit worthiness of the counterparties is subject to continual review. The Company also has netting arrangements in place with counterparties to reduce credit exposure. The Company has not experienced any losses from such instruments. The Company had commodity derivative contract positions in place at December 31, 2017. The Company did not have any open commodity derivative contract positions at December 31, 2016 and all of our derivative positions at December 31, 2015 had expired.
16. Commitments and Contingencies
Contractual Obligations
At December 31, 2017, contractual obligations for drilling contracts, long-term operating leases and other contracts are as follows (in thousands):
|
|
|
Total |
|
2018 |
|
2019 |
|
2020 |
|
2021 |
|
2022 and |
| ||||||
|
Drilling contracts |
|
$ |
— |
|
$ |
— |
|
$ |
— |
|
$ |
— |
|
$ |
— |
|
$ |
— |
|
|
Non-cancellable office lease commitments |
|
5,989 |
|
654 |
|
665 |
|
678 |
|
690 |
|
3,302 |
| ||||||
|
Net minimum commitments |
|
$ |
5,989 |
|
$ |
654 |
|
$ |
665 |
|
$ |
678 |
|
$ |
690 |
|
$ |
3,302 |
|
For the year ended December 31, 2017, the Successor Period, the Predecessor Period and year ended December 31, 2015, the Company expensed $0.6 million, $0.1 million, $4.3 million and $2.3 million, respectively, for office rent.
In addition to the commitments noted in the above table, the Company is party to a gas purchase, gathering and processing contract in the Mississippian Lime region, which includes certain minimum NGL volume commitments. To the extent we do not deliver natural gas volumes in sufficient quantities to generate, when processed, the minimum levels of recovered NGLs, we would be required to reimburse the counterparty an amount equal to the sum of the monthly shortfall, if any, multiplied by a fee. We are currently delivering at least the minimum volumes required under these contractual provisions. However, decreased drilling activity could result in the inability to meet these commitments in the future.
Commitments related to ARO’s are not included in the table above. For additional information, please see “—Note 9. Asset Retirement Obligations” for further discussion.
Litigation
The Company is involved in various matters incidental to its operations and business that might give rise to a loss contingency. These matters may include legal and regulatory proceedings, commercial disputes, claims from royalty, working interest and surface owners, property damage and personal injury claims and environmental authorities or other matters. In addition, the Company may be subject to customary audits by governmental authorities regarding the payment and reporting of various taxes, governmental royalties and fees as well as compliance with unclaimed property (escheatment) requirements and other laws. Further, other parties with an interest in wells operated by the Company have the ability under various contractual agreements to perform audits of its joint interest billing practices.
The Company vigorously defends itself in these matters. If the Company determines that an unfavorable outcome or loss of a particular matter is probable and the amount of loss can be reasonably estimated, it accrues a liability for the contingent obligation. As new information becomes available or as a result of legal or administrative rulings in similar matters or a change in applicable law, the Company’s conclusions regarding the probability of outcomes and the amount of estimated loss, if any, may change. The impact of subsequent changes to the Company’s accruals could have a material effect on its results of operations. As of December 31, 2017 and 2016, the Company’s total accrual for all loss contingencies was $1.1 million.
During the year ended December 31, 2017, the Company received an insurance reimbursement in the amount of $1.9 million, which was reflected as a reduction of “Lease operating and workover” expenses in the consolidated statements of operations.
17. Supplemental Information to Consolidated Statement of Cash Flows
The following table summarizes interest and income taxes paid for the periods presented and supplemental non-cash investing and financing activities (in thousands):
|
|
|
Successor |
|
|
Predecessor |
| ||||||||
|
|
|
Year Ended |
|
Period |
|
|
Period |
|
Year Ended |
| ||||
|
|
|
December 31, |
|
December 31, |
|
|
October 20, |
|
December 31, |
| ||||
|
SUPPLEMENTAL INFORMATION: |
|
|
|
|
|
|
|
|
|
| ||||
|
Non-cash investment in property and equipment |
|
$ |
17,164 |
|
$ |
8,135 |
|
|
$ |
12,995 |
|
$ |
21,507 |
|
|
Non-cash component of Dequincy Divestiture: |
|
|
|
|
|
|
|
|
|
| ||||
|
—Asset retirement obligation disposed |
|
$ |
— |
|
$ |
— |
|
|
$ |
— |
|
$ |
(4,699 |
) |
|
Non-cash exchange of third lien notes for 2020 senior notes and 2021 senior notes |
|
$ |
— |
|
$ |
— |
|
|
$ |
— |
|
$ |
524,121 |
|
|
Non-cash exchange of common equity of the reorganized Company for second lien notes |
|
$ |
— |
|
$ |
— |
|
|
$ |
591,042 |
|
$ |
— |
|
|
Non-cash exchange of common equity and warrants of the reorganized Company for third lien notes |
|
$ |
— |
|
$ |
— |
|
|
$ |
556,136 |
|
$ |
— |
|
|
Non-cash exchange of common equity and warrants of the reorganized Company for 2020 senior notes |
|
$ |
— |
|
$ |
— |
|
|
$ |
312,039 |
|
$ |
— |
|
|
Non-cash exchange of common equity and warrants of the reorganized Company for 2021 senior notes |
|
$ |
— |
|
$ |
— |
|
|
$ |
361,050 |
|
$ |
— |
|
|
Cash paid for interest, net of capitalized interest for the year ended December 31, 2017, Successor Period and the year ended December 31, 2015 of $2.4 million, $0.7 million and $4.9 million, respectively (no capitalized interest for the Predecessor Period) |
|
$ |
5,353 |
|
$ |
426 |
|
|
$ |
6,709 |
|
$ |
161,285 |
|
|
Cash paid for reorganization items |
|
$ |
— |
|
$ |
— |
|
|
$ |
36,325 |
|
$ |
— |
|
18. Related Party Transactions
During the year ended December 31, 2017, the Company entered into an arrangement with EcoStim Energy Solutions, Inc. (“EcoStim”) for well stimulation and completion services. EcoStim is an affiliate of Fir Tree Inc., an entity holding approximately 25.4% of the Company’s outstanding common stock. For the year ended December 31, 2017, the Company paid approximately $11.6 million to EcoStim for services provided. The Company had $2.1 million included in accounts payable at December 31, 2017 to EcoStim in the consolidated balance sheets. No transactions with EcoStim occurred in the Successor Period, the Predecessor Period or the year ended December 31, 2015.
During the Predecessor Period, First Reserve Corporation, which owned an economic interest in the Company through FR Midstates Interholding LP, also owned an economic interest in Dixie Electric. For the Predecessor Period, the Company paid approximately $1.7 million for electrical equipment and related services from Dixie Electric. No transactions with Dixie Electric occurred in the year ended December 31, 2015.
19. Subsequent Event
On January 24, 2018, the Company had a reduction in workforce resulting in severance costs of $1.6 million. In addition, $1.4 million in additional costs were incurred as a result of accelerated vesting of shares granted to employees under the 2016 LTIP.
20. Supplemental Oil and Gas Disclosures (Unaudited)
The supplemental data presented herein reflects information for all of the Company’s oil and natural gas producing activities.
Costs Incurred in Oil and Natural Gas Property Acquisition, Exploration and Development Activities
The following table sets forth costs incurred related to the Company’s oil and natural gas activities for the year ended December 31, 2017, the Successor Period, the Predecessor Period and the year ended December 31, 2015 (in thousands):
|
|
|
Successor |
|
|
Predecessor |
| ||||||||
|
|
|
For the Year |
|
For the Period |
|
|
For the Period |
|
For the Year |
| ||||
|
|
|
December 31, |
|
through December 31, |
|
|
through October 20, |
|
December 31, |
| ||||
|
Acquisition costs: |
|
|
|
|
|
|
|
|
|
| ||||
|
Proved properties |
|
$ |
— |
|
$ |
— |
|
|
$ |
— |
|
$ |
— |
|
|
Unproved properties |
|
11,964 |
|
1,430 |
|
|
6,869 |
|
8,448 |
| ||||
|
Exploration costs |
|
— |
|
— |
|
|
— |
|
— |
| ||||
|
Development costs |
|
128,424 |
|
17,708 |
|
|
121,668 |
|
274,978 |
| ||||
|
Total costs incurred |
|
$ |
140,388 |
|
$ |
19,138 |
|
|
$ |
128,537 |
|
$ |
283,426 |
|
The Company capitalizes certain of its general and administrative expenses that are incurred as a result of acquisition, exploration and development activities. These amounts are included in the above table under development costs and totaled $5.3 million, $1.4 million, $3.4 million and $7.3 million for the year ended December 31, 2017, the Successor Period, the Predecessor Period and the year ended December 31, 2015, respectively. In addition, the Company capitalizes interest costs incurred and attributable to unproved oil and gas properties as well as major development projects of oil and gas properties. Capitalized interest expenses, which are included in the development costs in the above table, were $2.4 million, $0.7 million and $4.9 million for the year ended December 31, 2017, the Successor Period and the year ended December 31, 2015.
Capitalized Costs
The following table sets forth the capitalized costs related to the Company’s oil and natural gas producing activities as of December 31, 2017 and 2016 (in thousands):
|
|
|
December 31, 2017 |
|
|
December 31, 2016 |
| ||
|
Proved properties |
|
$ |
765,308 |
|
|
$ |
573,150 |
|
|
Unproved properties not being amortized |
|
7,065 |
|
|
65,080 |
| ||
|
Gross capitalized costs |
|
772,373 |
|
|
638,230 |
| ||
|
Less: Accumulated depreciation, depletion, amortization and impairment |
|
(201,722 |
) |
|
(12,587 |
) | ||
|
Net capitalized costs |
|
$ |
570,651 |
|
|
$ |
625,643 |
|
At December 31, 2017, the Company had $7.1 million of oil and gas property costs that are not being amortized. The value of the Company’s oil and gas properties not being amortized are primarily associated with the Company’s Mississippian Lime area. We expect the majority of these costs will be evaluated and either impaired or become subject to depletion within five years.
Estimated Quantities of Proved Oil and Natural Gas Reserves
The reserve estimates at December 31, 2017, 2016 and 2015 for Company were based on reports prepared by Cawley, Gillespie & Associates, Inc., independent reserve engineers.
The Company emphasizes that reserve estimates are inherently imprecise and that estimates of new discoveries and undeveloped locations are more imprecise than estimates of established proved producing oil and gas properties. Accordingly, these estimates are expected to change as future information becomes available. Proved oil and natural gas reserves are the estimated quantities of oil and natural gas which geological and engineering data demonstrate, with reasonable certainty, to be recoverable in future years from known reservoirs under economic and operating conditions (i.e., prices and costs) existing at the time the estimate is made. Proved developed oil and natural gas reserves are proved reserves that can be expected to be recovered through existing wells and equipment in place and under operating methods being utilized at the time the estimates were made.
The following table sets forth the Company’s net proved, proved developed and proved undeveloped reserves at December 31, 2017, 2016 and 2015:
|
|
|
Oil |
|
NGL |
|
Gas |
|
Total |
|
|
2015 (Predecessor) |
|
|
|
|
|
|
|
|
|
|
Proved Reserves |
|
|
|
|
|
|
|
|
|
|
Beginning Balance |
|
58,242 |
|
32,528 |
|
377,845 |
|
153,744 |
|
|
Revision of previous estimates |
|
(30,490 |
) |
(15,495 |
) |
(178,287 |
) |
(75,700 |
) |
|
Extensions, discoveries and other additions |
|
2,189 |
|
1,371 |
|
17,026 |
|
6,398 |
|
|
Sales of reserves in place |
|
(2,871 |
) |
(843 |
) |
(7,834 |
) |
(5,019 |
) |
|
Purchases of reserves in place |
|
2,437 |
|
1,157 |
|
15,145 |
|
6,118 |
|
|
Production |
|
(4,794 |
) |
(2,473 |
) |
(28,403 |
) |
(12,001 |
) |
|
Net proved reserves at December 31, 2015 |
|
24,713 |
|
16,245 |
|
195,492 |
|
73,540 |
|
|
Proved developed reserves, December 31, 2015 |
|
23,006 |
|
15,376 |
|
184,365 |
|
69,110 |
|
|
Proved undeveloped reserves, December 31, 2015 |
|
1,707 |
|
869 |
|
11,127 |
|
4,430 |
|
|
|
|
|
|
|
|
|
|
|
|
|
2016 (Predecessor) |
|
|
|
|
|
|
|
|
|
|
Proved Reserves |
|
|
|
|
|
|
|
|
|
|
Beginning Balance |
|
24,713 |
|
16,245 |
|
195,492 |
|
73,540 |
|
|
Revision of previous estimates |
|
(3,089 |
) |
(459 |
) |
(946 |
) |
(3,706 |
) |
|
Extensions, discoveries and other additions |
|
1,566 |
|
840 |
|
11,052 |
|
4,249 |
|
|
Sales of reserves in place |
|
— |
|
— |
|
— |
|
— |
|
|
Purchases of reserves in place |
|
— |
|
— |
|
— |
|
— |
|
|
Production |
|
(2,964 |
) |
(1,932 |
) |
(23,215 |
) |
(8,765 |
) |
|
Net proved reserves at October 20, 2016 |
|
20,226 |
|
14,694 |
|
182,383 |
|
65,318 |
|
|
Proved developed reserves, October 20, 2016 |
|
20,226 |
|
14,694 |
|
182,383 |
|
65,318 |
|
|
Proved undeveloped reserves, October 20, 2016 |
|
— |
|
— |
|
— |
|
— |
|
|
|
|
|
|
|
|
|
|
|
|
|
2016 (Successor) |
|
|
|
|
|
|
|
|
|
|
Proved Reserves |
|
|
|
|
|
|
|
|
|
|
Beginning Balance |
|
20,226 |
|
14,694 |
|
182,383 |
|
65,318 |
|
|
Revision of previous estimates |
|
19,137 |
|
11,421 |
|
147,688 |
|
55,172 |
|
|
Extensions, discoveries and other additions |
|
22,571 |
|
11,186 |
|
147,236 |
|
58,296 |
|
|
Sales of reserves in place |
|
— |
|
— |
|
— |
|
— |
|
|
Purchases of reserves in place |
|
— |
|
— |
|
— |
|
— |
|
|
Production |
|
(544 |
) |
(429 |
) |
(4,948 |
) |
(1,798 |
) |
|
Net proved reserves at December 31, 2016 |
|
61,390 |
|
36,872 |
|
472,359 |
|
176,988 |
|
|
Proved developed reserves, December 31, 2016 |
|
19,698 |
|
16,349 |
|
201,454 |
|
69,622 |
|
|
Proved undeveloped reserves, December 31, 2016 |
|
41,692 |
|
20,523 |
|
270,905 |
|
107,366 |
|
|
2017 |
|
|
|
|
|
|
|
|
|
|
Proved Reserves |
|
|
|
|
|
|
|
|
|
|
Beginning Balance |
|
61,390 |
|
36,872 |
|
472,359 |
|
176,988 |
|
|
Revision of previous estimates |
|
(33,608 |
) |
(13,010 |
) |
(178,388 |
) |
(76,350 |
) |
|
Extensions, discoveries and other additions |
|
5,819 |
|
4,003 |
|
51,849 |
|
18,464 |
|
|
Sales of reserves in place |
|
(99 |
) |
(723 |
) |
(7,495 |
) |
(2,071 |
) |
|
Purchases of reserves in place |
|
— |
|
— |
|
— |
|
— |
|
|
Production |
|
(2,368 |
) |
(1,949 |
) |
(22,606 |
) |
(8,084 |
) |
|
Net proved reserves at December 31, 2017 |
|
31,134 |
|
25,193 |
|
315,719 |
|
108,947 |
|
|
Proved developed reserves, December 31, 2017 |
|
17,268 |
|
15,464 |
|
190,550 |
|
64,490 |
|
|
Proved undeveloped reserves, December 31, 2017 |
|
13,866 |
|
9,729 |
|
125,169 |
|
44,457 |
|
Revision of Previous Estimates
For the year ended December 31, 2017, the Company had net negative revisions of 76,350 MBoe primarily as a result of updates to the Company’s anticipated five-year development schedule. On November 1, 2017, David Sambrooks was appointed President and Chief Executive Officer of the Company. Upon David’s appointment, the Company began a strategic review of all areas of operations. This review was completed during the fourth quarter of 2017 and the Company’s strategy was refined to add further focus to optimizing free cash flows and keeping leverage to a minimum. As a result, in December of 2017 the Company decreased its current drilling activity from two drilling rigs to one drilling rig. Further, the five-year development plan was revised from a two-rig program to a one rig program. This change in strategy (reduced 5-year drilling activity) lead to a reduction in the Company’s undeveloped proved inventory under SEC guidelines from 274 locations at year end 2016 to 139 locations at year end 2017. In addition, at year end 2017 the Company’s proved undeveloped type curve was revised downward by its third-party reserves engineering firm and capital costs assumptions were revised upward, both as a result of recent drilling results. As a result of the Company’s focus on optimizing free cash flow, keeping leverage to a minimum and optimizing drilling returns, all proved undeveloped reserves included in the December 31, 2017 reserve report are focused on infill drilling in the Carmen and Dacoma areas. All undeveloped locations not able to be drilled utilizing the Company’s anticipated five-year development schedule were excluded from the December 31, 2017 reserve report but continue to meet the definition of a proved undeveloped location from an engineering standpoint.
For the Successor Period, the Company had positive revisions of 55,172 MBoe. Upon the Company’s emergence on the Effective Date, it undertook a process to review its five-year development schedule in light of improved commodity pricing and the significant improvement in the Company’s liquidity and outstanding long-term debt. In developing the Company’s updated five-year development schedule, the Company considered the forward pricing curve, the returns expected of its drilling program and cash available during this time period, which would include cash on hand, cash generated by operations and cash from borrowings. Based upon these factors, the Company developed an updated five-year development plan and booked proved undeveloped reserves based upon its strategy to capture additional acreage through drilling. Proved undeveloped reserves that were removed from proved category in prior years but subsequently reinstated after this review were classified as a revision in the above tables.
For the year ended December 31, 2015, the Company had net negative revisions of 75,700 MBoe related to proved undeveloped reserves, of which approximately 98% related to reductions in the Mississippian Lime area due to the transfer of 77,362 MBoe of proved undeveloped reserves comprising $179.0 million of PV-10 value (at SEC pricing) to the probable reserves category due to uncertainty around financing the development of our proved undeveloped reserves within a five year period.
Extensions, Discoveries and Other Additions
For the year ended December 31, 2017, the Company had 18,464 MBoe of extensions and discoveries, all of which occurred in the Mississippian Lime area.
For the Successor Period, the Company had 58,296 MBoe of extensions and discoveries associated with its proved undeveloped reserves in the Mississippian Lime area. Upon the Company’s emergence on the Effective Date, it undertook a process to review its five-year development schedule in light of improved commodity pricing and the significant improvement in the Company’s liquidity and outstanding long-term debt. In developing the Company’s updated five-year development schedule, the Company considered the forward pricing curve, the returns expected of its drilling program and cash available during this time period, which would include cash on hand, cash generated by operations and cash from borrowings. Based upon these factors, the Company developed an updated five-year development plan and booked proved undeveloped reserves based upon this expected development plan. Proved undeveloped reserves that were not included in any proved category in prior years but included in the Company’s updated five-year development schedule were classified as an extension in the above tables.
For the Predecessor Period and the year ended December 31, 2015, the Company had 4,249 MBoe and 6,398 MBoe, respectively, of additions from extensions and discoveries, all of which related to the Mississippian Lime area.
Sales of Reserves in Place
For the year ended December 31, 2017, the Company had 2,071 MBoe in sales of reserves in place, all of which was associated with the divestiture of its oil and gas properties in Lincoln County, Oklahoma, which occurred during July 2017.
For the year ended December 31, 2015, the Company had 5,019 MBoe in sales of reserves in place, of which 2,307 MBoe of the sale related to the Dequincy Divestiture, which closed on April 21, 2015, and 2,712 MBoe resulted from the swap of leasehold interests in the Mississippian Lime area in the second quarter of 2015.
Purchases of Reserves in Place
For the year ended December 31, 2015, the Company had 6,118 MBoe of additions from purchases of reserves in place resulting from a swap of leasehold interests in the Mississippian Lime area.
Standardized Measure of Discounted Future Net Cash Flows Relating to Proved Oil and Natural Gas Reserves
The standardized measure represents the present value of estimated future cash inflows from proved oil and natural gas reserves, less future development, production, plugging and abandonment costs and income tax expenses, discounted at 10% per annum to reflect timing of future cash flows. Production costs do not include depreciation, depletion and amortization of capitalized acquisition, exploration and development costs.
Our estimated proved reserves and related future net revenues and standardized measure were determined using the unweighted arithmetic average first-of-the-month price for the preceding 12-month period, without giving effect to derivative transactions, and were held constant throughout the life of the properties. Estimated future production of proved reserves and estimated future production and development costs of proved reserves are based on current costs and economic conditions. The following table sets forth the benchmark prices used to determine our estimated proved reserves for the periods indicated:
|
|
|
Successor |
|
|
Predecessor |
| |||||
|
|
|
At December 31, |
|
|
At December 31, |
| |||||
|
|
|
2017 |
|
2016 |
|
|
2015 |
| |||
|
Oil and Natural Gas Prices: |
|
|
|
|
|
|
|
| |||
|
Oil (per barrel) |
|
$ |
51.34 |
|
$ |
42.75 |
|
|
$ |
50.28 |
|
|
Natural gas (per million British thermal units) |
|
$ |
2.98 |
|
$ |
2.48 |
|
|
$ |
2.59 |
|
The following table sets forth the standardized measure of discounted future net cash flows from projected production of the Company’s oil and natural gas reserves at December 31, 2017, 2016, and 2015 (in thousands):
|
|
|
Successor |
|
|
Predecessor |
| |||||
|
|
|
At December 31, |
|
|
Year Ended |
| |||||
|
|
|
2017 |
|
2016 |
|
|
2015 |
| |||
|
Future cash inflows |
|
$ |
3,023,929 |
|
$ |
4,186,389 |
|
|
$ |
1,902,184 |
|
|
Future production costs |
|
(1,536,332 |
) |
(2,078,640 |
) |
|
(1,024,314 |
) | |||
|
Future development costs |
|
(370,972 |
) |
(692,533 |
) |
|
(47,532 |
) | |||
|
Future income tax expense |
|
(16,289 |
) |
(106,563 |
) |
|
— |
| |||
|
Future net cash flows |
|
1,100,336 |
|
1,308,653 |
|
|
830,338 |
| |||
|
10% annual discount for estimated timing of cash flows |
|
(551,093 |
) |
(778,703 |
) |
|
(317,519 |
) | |||
|
Standardized measure of discounted future net cash flows |
|
$ |
549,243 |
|
$ |
529,950 |
|
|
$ |
512,819 |
|
The following table sets forth the changes in the standardized measure of discounted future net cash flows applicable to proved oil and natural gas reserves for the year ended December 31, 2017, the Successor Period, the Predecessor Period and the year ended December 31, 2015 (in thousands):
|
|
|
Successor |
|
|
Predecessor |
| ||||||||
|
|
|
Year Ended |
|
For the Period October |
|
|
For the Period January |
|
Year Ended |
| ||||
|
|
|
2017 |
|
December 31, 2016 |
|
|
October 20, 2016 |
|
2015 |
| ||||
|
Standardized measure, beginning of period |
|
$ |
529,950 |
|
$ |
349,905 |
|
|
$ |
512,819 |
|
$ |
1,873,361 |
|
|
Net changes in prices and production costs |
|
173,991 |
|
78,103 |
|
|
(113,313 |
) |
(960,245 |
) | ||||
|
Net changes in future development costs |
|
(29,711 |
) |
2,022 |
|
|
175 |
|
57,357 |
| ||||
|
Sales of oil and natural gas, net |
|
(148,746 |
) |
(27,292 |
) |
|
(116,043 |
) |
(232,630 |
) | ||||
|
Extensions |
|
92,776 |
|
102,087 |
|
|
29,871 |
|
38,550 |
| ||||
|
Discoveries |
|
— |
|
— |
|
|
— |
|
— |
| ||||
|
Purchases of reserves in place |
|
— |
|
— |
|
|
— |
|
34,369 |
| ||||
|
Divestiture of reserves |
|
(8,079 |
) |
— |
|
|
— |
|
(77,445 |
) | ||||
|
Revisions of previous quantity estimates |
|
(152,517 |
) |
102,623 |
|
|
(22,194 |
) |
(1,174,997 |
) | ||||
|
Previously estimated development costs incurred |
|
7,909 |
|
— |
|
|
29,975 |
|
198,564 |
| ||||
|
Accretion of discount |
|
57,816 |
|
5,832 |
|
|
42,735 |
|
238,639 |
| ||||
|
Net change in income taxes |
|
39,316 |
|
(48,206 |
) |
|
— |
|
513,024 |
| ||||
|
Changes in timing, other |
|
(13,462 |
) |
(35,124 |
) |
|
(14,120 |
) |
4,272 |
| ||||
|
Standardized measure, end of period |
|
$ |
549,243 |
|
$ |
529,950 |
|
|
$ |
349,905 |
|
$ |
512,819 |
|
21. Selected Quarterly Financial Data (Unaudited)
The following table presents selected quarterly financial data derived from the Company’s unaudited interim financial statements. The following data is only a summary and should be read with the Company’s historical consolidated financial statements and related notes contained in this document.
|
|
|
First |
|
Second |
|
Third |
|
Fourth |
| ||||
|
|
|
(in thousands, except per share amounts) |
| ||||||||||
|
2017 (Successor) |
|
|
|
|
|
|
|
|
| ||||
|
Total revenues |
|
$ |
65,015 |
|
$ |
60,679 |
|
$ |
49,715 |
|
$ |
53,344 |
|
|
Operating income (loss) |
|
19,462 |
|
14,970 |
|
5,312 |
|
(119,238 |
) | ||||
|
Net income (loss) |
|
18,485 |
|
13,742 |
|
3,663 |
|
(120,967 |
) | ||||
|
Net income (loss) available to common shareholders |
|
17,939 |
|
13,382 |
|
3,581 |
|
(120,967 |
) | ||||
|
Net income (loss) per share: |
|
|
|
|
|
|
|
|
| ||||
|
Basic and Diluted |
|
$ |
0.72 |
|
$ |
0.53 |
|
$ |
0.14 |
|
$ |
(4.78 |
) |
|
Shares used in computation: |
|
|
|
|
|
|
|
|
| ||||
|
Basic and Diluted |
|
25,012 |
|
25,093 |
|
25,116 |
|
25,253 |
| ||||
|
2016 (Successor) |
|
|
|
|
|
|
|
|
| ||||
|
Total revenues |
|
$ |
— |
|
$ |
— |
|
$ |
— |
|
$ |
48,525 |
|
|
Operating income |
|
— |
|
— |
|
— |
|
10,673 |
| ||||
|
Net income |
|
— |
|
— |
|
— |
|
9,930 |
| ||||
|
Net income available to common shareholders |
|
— |
|
— |
|
— |
|
9,650 |
| ||||
|
Net income per share: |
|
|
|
|
|
|
|
|
| ||||
|
Basic and Diluted |
|
$ |
— |
|
$ |
— |
|
$ |
— |
|
$ |
0.39 |
|
|
Shares used in computation: |
|
|
|
|
|
|
|
|
| ||||
|
Basic and Diluted |
|
— |
|
— |
|
— |
|
25,009 |
| ||||
|
2016 (Predecessor) |
|
|
|
|
|
|
|
|
| ||||
|
Total revenues |
|
$ |
51,961 |
|
$ |
62,559 |
|
$ |
64,193 |
|
$ |
14,514 |
|
|
Operating income (loss) |
|
(135,119 |
) |
(52,759 |
) |
(12,944 |
) |
(4,101 |
) | ||||
|
Net income (loss) |
|
(179,274 |
) |
8,962 |
|
(38,384 |
) |
1,531,775 |
| ||||
|
Net loss available to common shareholders |
|
(179,274 |
) |
8,864 |
|
(38,384 |
) |
1,515,351 |
| ||||
|
Net loss per share: |
|
|
|
|
|
|
|
|
| ||||
|
Basic and Diluted |
|
$ |
(16.88 |
) |
$ |
0.83 |
|
$ |
(3.60 |
) |
$ |
142.19 |
|
|
Shares used in computation: |
|
|
|
|
|
|
|
|
| ||||
|
Basic and Diluted |
|
10,621 |
|
10,653 |
|
10,657 |
|
10,657 |
| ||||
(1) Fourth quarter for the 2016 Predecessor Period is for the period October 1, 2016 through October 20, 2016. Fourth quarter for the 2016 Successor Period is the period October 21, 2016 through December 31, 2016.