Attached files
| file | filename |
|---|---|
| EX-32.2 - EXHIBIT 32.2 - Stock Yards Bancorp, Inc. | ex_106112.htm |
| EX-32.1 - EXHIBIT 32.1 - Stock Yards Bancorp, Inc. | ex_106111.htm |
| EX-31.2 - EXHIBIT 31.2 - Stock Yards Bancorp, Inc. | ex_106110.htm |
| EX-31.1 - EXHIBIT 31.1 - Stock Yards Bancorp, Inc. | ex_106109.htm |
| EX-23 - EXHIBIT 23 - Stock Yards Bancorp, Inc. | ex_106108.htm |
| EX-21 - EXHIBIT 21 - Stock Yards Bancorp, Inc. | ex_106107.htm |
| EX-14 - EXHIBIT 14 - Stock Yards Bancorp, Inc. | ex_106105.htm |
| EX-10.37 - EXHIBIT 10.37 - Stock Yards Bancorp, Inc. | ex_106106.htm |
UNITED STATES
SECURITIES AND EXCHANGE COMMISSION
Washington, DC 20549
Form 10-K
Annual Report Pursuant to Section 13
or 15(d) of the Securities Exchange Act of 1934
|
For the Fiscal Year Ended |
Commission File Number |
|
|
December 31, 2017 |
1-13661 |
STOCK YARDS BANCORP, INC.
1040 East Main Street
Louisville, Kentucky 40206
(502) 582-2571
|
Incorporated in Kentucky |
I.R.S. No. 61-1137529 |
Securities registered pursuant to Section 12(b) of the Act:
|
Title of each class: |
Name of each exchange on which registered: |
|
Common Stock, no par value |
NASDAQ |
Securities registered pursuant to Section 12(g) of the Act:
None
Indicate by check mark if the registrant is a well-known seasoned issuer (as defined in Rule 405 of the Securities Act).
Yes ☐ No ☑
Indicate by check mark if the registrant is not required to file reports pursuant to Section 13 or Section 15(d) of the Act.
Yes ☐ No ☑
Indicate by check mark whether the registrant (1) has filed all reports required to be filed by Section 13 or 15(d) of the Securities Exchange Act of 1934 during the preceding 12 months (or for such shorter period that the registrant was required to file such reports), and (2) has been subject to such filing requirements for the past 90 days.
Yes ☑ No ☐
Indicate by check mark whether the registrant has submitted electronically and posted on its corporate Web site, if any, every Interactive Data File required to be submitted and posted pursuant to Rule 405 of Regulation S-T (§232.405 of this chapter) during the preceding 12 months (or for such shorter period that the registrant was required to submit and post such files). Yes ☑ No ☐
Indicate by check mark if disclosure of delinquent filers pursuant to Item 405 of Regulation S-K is not contained herein, and will not be contained, to the best of the registrant’s knowledge, in definitive proxy or information statements incorporated by reference in Part III of this Form 10-K or any amendment to this Form 10-K. ☐
Indicate by check mark whether the registrant is a large accelerated filer, an accelerated filer, a non-accelerated filer, smaller reporting company, or an emerging growth company. See the definitions of “large accelerated filer,” “accelerated filer,” “smaller reporting company,” and “emerging growth company” in Rule 12b-2 of the Exchange Act.
| Large accelerated filer | ☑ | Accelerated filer | ☐ |
| Non-accelerated filer (Do not check if a smaller reporting company) | ☐ | Smaller reporting company | ☐ |
| Emerging growth company | ☐ |
If an emerging growth company, indicate by check mark if the registrant has elected not to use the extended transition period for complying with any new or revised financial accounting standards provided pursuant to Section 13(a) of the Exchange Act. ☐
Indicate by check mark whether the registrant is a shell company (as defined in Rule 12b-2 of the Exchange Act).
Yes ☐ No ☑
The aggregate market value of registrant’s voting stock (Common Stock, no par value) held by non-affiliates of the registrant as of June 30, 2017 (the last business day of the registrant’s most recently completed second fiscal quarter) was $802,453,551.
The number of shares of the registrant’s Common Stock, no par value, outstanding as of February 23, 2018, was 22,715,321.
Documents Incorporated By Reference
Portions of Registrant’s definitive proxy statement related to Registrant’s Annual Meeting of Shareholders to be held on April 26, 2018 (the “Proxy Statement”), to be filed with the Securities and Exchange Commission, are incorporated by reference into Part III of this Form 10-K.
STOCK YARDS BANCORP, INC.
Form 10-K
Index
|
|
|
|
|
Item 1. |
1 |
|
|
Item 1A. |
3 |
|
|
Item 1B. |
8 |
|
|
Item 2. |
8 |
|
|
Item 3. |
8 |
|
|
Item 4. |
8 |
|
|
|
|
|
|
Item 5. |
10 |
|
|
|
|
|
|
Item 6. |
12 |
|
|
Item 7. |
Management’s Discussion and Analysis of Financial Condition and Results of Operations |
13 |
|
Item 7A. |
46 |
|
|
Item 8. |
46 |
|
|
Item 9. |
Changes in and Disagreements with Accountants on Accounting and Financial Disclosure |
96 |
|
Item 9A. |
96 |
|
|
Item 9B. |
99 |
|
|
|
|
|
|
Item 10. |
99 |
|
|
Item 11. |
99 |
|
|
Item 12. |
Security Ownership of Certain Beneficial Owners and Management and Related Stockholder Matters |
99 |
|
|
|
|
|
Item 13. |
Certain Relationships and Related Transactions, and Director Independence |
100 |
|
Item 14. |
100 |
|
|
|
|
|
|
Item 15. |
100 |
|
|
Item 16. |
103 |
|
|
Signatures |
|
104 |
Glossary of Acronyms and Terms
The following listing provides a comprehensive reference of common acronyms and terms used throughout the document:
|
ASU |
Accounting Standards Update |
|
Bancorp |
Stock Yards Bancorp, Inc. |
|
Bank |
Stock Yards Bank & Trust Company |
|
BOLI |
Bank Owned Life Insurance |
|
BP |
Basis Point = 1/100th of one percent |
|
COSO |
Committee of Sponsoring Organizations |
|
CRA |
Community Reinvestment Act of 1977 |
|
Dodd-Frank Act |
Dodd-Frank Wall Street Reform and Consumer Protection Act |
|
EPS |
Earnings Per Share |
|
FASB |
Financial Accounting Standards Board |
|
FDIC |
Federal Deposit Insurance Corporation |
|
FHA |
Federal Housing Administration |
|
FHC |
Financial Holding Company |
|
FHLB |
Federal Home Loan Bank |
|
FHLMC |
Federal Home Loan Mortgage Corporation |
|
FNMA |
Federal National Mortgage Association |
|
GLB Act |
Gramm-Leach-Bliley Act |
|
GNMA |
Government National Mortgage Association |
|
WM&T |
Wealth management and trust |
|
KSOP |
Combined employee profit sharing and stock ownership plan |
|
LIBOR |
London Interbank Offered Rate |
|
MSA |
Metropolitan Statistical Area |
|
MSR |
Mortgage Servicing Right |
|
OAEM |
Other Assets Especially Mentioned |
|
Oldham |
THE BANCORP, Inc. |
|
OREO |
Other Real Estate Owned |
|
OTTI |
Other-Than-Temporary Impairment |
|
PSU |
Performance Stock Unit |
|
RSU |
Restricted Stock Unit |
|
SAR |
Stock Appreciation Right |
|
SEC |
Securities and Exchange Commission |
|
TDRs |
Troubled Debt Restructurings |
|
US GAAP |
United States Generally Accepted Accounting Principles |
|
VA |
U.S. Department of Veterans Affairs |
|
Item 1. |
Business |
Stock Yards Bancorp, Inc. (“Bancorp” or “Company”), headquartered in Louisville, Kentucky, is the holding company for Stock Yards Bank & Trust Company (“Bank”). Bancorp, which was incorporated in 1988 in Kentucky, is registered with, and subject to supervision, regulation and examination by, the Board of Governors of the Federal Reserve System. The Bank is wholly owned and is a state chartered bank. Because Bancorp has no significant operations of its own, its business and that of the Bank are essentially the same. The operations of the Bank are fully reflected in the consolidated financial statements of Bancorp. Accordingly, references to “Bancorp” in this document may encompass both the holding company and the Bank.
Stock Yards Bank & Trust Company
Stock Yards Bank & Trust Company is the banking and sole subsidiary of Bancorp and was chartered in 1904. The Bank is headquartered in Louisville, Kentucky and provides commercial and personal banking services in the Louisville, Kentucky, Indianapolis, Indiana and Cincinnati, Ohio metropolitan markets through 37 full service banking offices. The Bank is chartered under the laws of the Commonwealth of Kentucky. In addition to traditional commercial and personal banking activities, the Bank has a wealth management and trust department (WM&T) offering a wide range of investment management, trust, employee benefit plan, estate administration, and financial planning services. The Bank also originates and sells single-family residential mortgages. Additionally, the Bank offers securities brokerage services via its branch network through an arrangement with a third party broker-dealer. See Note 25 to Bancorp’s consolidated financial statements for information relating to the Bank’s business segments and “Item 2. Properties” for information regarding owned and leased properties.
At December 31, 2017, Stock Yards Bank & Trust Company had 580 full-time equivalent employees. Employees of Stock Yards Bank & Trust Company are entitled to participate in a variety of employee benefit programs including a combined employee profit sharing and stock ownership plan (“KSOP”). Management of Bancorp strives to be an employer of choice and considers the relationship with employees to be good.
Supervision and Regulation
Bank holding companies and commercial banks are extensively regulated under both federal and state laws. Changes in applicable laws or regulations may have a material effect on the business and prospects of Bancorp.
Bancorp, as a registered bank holding company, is subject to the supervision of and regulation by the Federal Reserve Board under the Bank Holding Company Act of 1956. In addition, Bancorp is subject to the provisions of Kentucky’s banking laws regulating bank acquisitions and certain activities of controlling bank shareholders.
Kentucky and federal banking statutes delineate permissible activities for Kentucky state-chartered banks. Kentucky’s statutes, however, contain a super parity provision for Kentucky chartered banks having one of the top two ratings in its most recent regulatory examination. This provision allows these state banks to engage in any banking activity in which a national bank, a state bank operating in any other state, or a federally chartered thrift could engage. The bank must first obtain a legal opinion specifying the statutory or regulatory provisions that permit the activity.
The Bank is subject to the supervision of the Kentucky Department of Financial Institutions and the Federal Deposit Insurance Corporation. The Federal Deposit Insurance Corporation (“FDIC”) insures the deposits of the Bank to the current maximum of $250,000 per depositor.
The Gramm-Leach-Bliley Act (the “GLB Act”) allows for affiliations among banks, securities firms and insurance companies by means of a financial holding company (“FHC”). The GLB Act requires that, at the time of establishment of an FHC, all depository institutions within that corporate group must be “well managed” and “well capitalized” and must have received a rating of “satisfactory” or better under its most recent Community Reinvestment Act examination. Further, non-banking financial firms (for example an insurance company or securities firm) may establish an FHC and acquire a depository institution. While the distinction between banks and non-banking financial firms has been blurring over recent years, the GLB Act makes it less cumbersome for banks to offer services “financial in nature” but beyond traditional commercial banking activities. Likewise, non-banking financial firms may find it easier to offer services that had, heretofore, been provided primarily by depository institutions. In 2012, management of Bancorp chose to become an FHC.
The Dodd-Frank Wall Street Reform and Consumer Protection Act of 2010 (the “Dodd-Frank Act”) was signed into law in 2010. Generally, the Dodd-Frank Act was effective the day after it was signed into law, but different effective dates apply to specific sections of the law. This extensive and complex legislation contained many provisions affecting the banking industry, including:
|
● |
Creation of a Bureau of Consumer Financial Protection overseeing banks with assets totaling $10 billion or greater while writing and maintaining several regulations that apply to all banks, |
|
● |
Determination of debit card interchange rates by the Federal Reserve Board, |
|
● |
New regulation over derivative instruments, |
|
● |
Phase outs of certain forms of trust preferred debt and hybrids previously included as bank capital, and |
|
● |
Increases to FDIC deposit coverage, revised calculations for assessing bank premiums, and numerous other provisions affecting financial institution regulation, oversight of certain non-banking organizations, investor protection, etc. |
Bancorp continues to be subject to regulation under the Dodd-Frank Act; however, the current presidential administration has instructed federal agencies to reduce the regulatory burden on financial institutions.
The Community Reinvestment Act of 1977 (CRA) requires depository institutions to assist in meeting the credit needs of their market areas consistent with safe and sound banking practice. Under the CRA, each depository institution is required to help meet the credit needs of its market areas by, among other things, providing credit to low- and moderate-income individuals and communities. Depository institutions are periodically examined for compliance with the CRA, and banking regulators take into account CRA ratings when considering approval of certain applications. An unsatisfactory CRA rating could, among other things, result in the denial or delay of corporate applications filed by Bancorp or the Bank for proposed activities such as branch openings or relocations and applications to acquire, merge or consolidate with another banking institution or holding company.
The federal banking regulators have adopted rules limiting the ability of banks and other financial institutions to disclose non-public information about consumers to unaffiliated third parties. These limitations require disclosure of privacy policies to consumers and, in some circumstances, allow consumers to prevent disclosure of certain personal information to an unaffiliated third party. These regulations affect how consumer information is conveyed to outside vendors. The Bank is also subject to regulatory guidelines establishing standards for safeguarding customer information. These guidelines describe the federal banking agencies’ expectations for the creation, implementation and maintenance of an information security program, which would include administrative, technical and physical safeguards appropriate to the size and complexity of the institution and the nature and scope of its activities.
The Bank is subject to the Bank Secrecy Act and the USA Patriot Act. These statutes and related rules and regulations impose requirements and limitations on specified financial transactions and accounts and other relationships intended to guard against money laundering and terrorism financing. Financial institutions must take certain steps to assist government agencies in detecting and preventing money laundering and report certain types of suspicious transactions. Regulatory authorities routinely examine financial institutions for compliance with these obligations, and failure of a financial institution to maintain and implement adequate programs to combat money laundering and terrorist financing, or to comply with all of the relevant laws or regulations, could have serious legal and reputational consequences for the institution, including causing applicable bank regulatory authorities not to approve merger or acquisition transactions when regulatory approval is required or to prohibit such transactions even if approval is not required.
In 2013, the Federal Reserve Board and the FDIC approved rules that substantially amended the regulatory risk-based capital rules applicable to Bancorp and Bank. The rules implemented the regulatory capital reforms of the Basel Committee on Banking Supervision reflected in “Basel III: A Global Regulatory Framework for More Resilient Banks and Banking Systems” (“Basel III”) and changes required by the Dodd-Frank Act. The Basel III regulatory capital reforms became effective for Bancorp and Bank on January 1, 2015, and included new minimum risk-based capital and leverage ratios. The minimum capital level requirements applicable to bank holding companies and banks subject to the rules are:
|
● |
a common equity Tier 1 capital ratio of 4.5%, |
|
● |
a Tier 1 risk-based capital ratio of 6% (increased from 4%), |
|
● |
a total risk-based capital ratio of 8% (unchanged from previous rules), and |
|
● |
a Tier 1 leverage ratio of 4% for all institutions. |
The rules also established a “capital conservation buffer” of 2.5%, to be phased in over three years, above the regulatory minimum risk-based capital ratios, and will result in the following minimum ratios once the capital conservation buffer is fully phased in:
|
● |
a common equity Tier 1 risk-based capital ratio of 7.0%, |
|
● |
a Tier 1 risk-based capital ratio of 8.5%, and |
|
● |
a total risk-based capital ratio of 10.5%. |
The capital conservation buffer requirement began being phased in January 2016 at 0.625% of risk-weighted assets and will increase each year until fully implemented in January 2019. An institution will be subject to limitations on paying dividends, engaging in share repurchases and paying discretionary bonuses if capital levels fall below minimum levels plus the buffer amounts. These limitations establish a maximum percentage of eligible retained income that could be utilized for such actions.
Under these rules, Tier 1 capital generally consists of common stock (plus related surplus) and retained earnings, limited amounts of minority interest in the form of additional Tier 1 capital instruments, and non-cumulative preferred stock and related surplus, subject to certain eligibility standards, less goodwill and other specified intangible assets and other regulatory deductions. The definition of Tier 2 capital is generally unchanged for most banking organizations, subject to certain new eligibility criteria.
Common equity Tier 1 capital generally consists of common stock, additional paid-in capital and retained earnings plus limited amounts of minority interest in the form of common stock, less goodwill and other specified intangible assets and other regulatory deductions.
The rules allowed banks and their holding companies with less than $250 billion in assets a one-time opportunity to opt-out of a requirement to include unrealized gains and losses in accumulated other comprehensive income in their capital calculation. Bancorp opted-out of this requirement.
As of December 31, 2017, Bancorp met the requirements to be considered well-capitalized and is not subject to limitations due to the capital conservation buffer.
Available Information
Bancorp files reports with the SEC including the Annual Report on Form 10-K, quarterly reports on Form 10-Q, current event reports on Form 8-K, and proxy statements, as well as any amendments to those reports. The public may read and copy any materials the Registrant files with the SEC at the SEC’s Public Reference Room at 100 F Street, NE, Washington, DC 20549. The public may obtain information on the operation of the Public Reference Room by calling the SEC at 1-800-SEC-0330. The SEC maintains an internet site that contains reports, proxy and information statements and other information regarding issuers that file electronically with the SEC at http://www.sec.gov. Bancorp’s Annual Report on Form 10-K, quarterly reports on Form 10-Q, current reports on Form 8-K, and amendments to those reports filed or furnished pursuant to section 13(a) or 15(d) of the Exchange Act are also accessible at no cost on Bancorp’s web site at http://www.syb.com after they are electronically filed with the SEC.
|
Item 1A. |
Risk Factors |
Investment in Bancorp’s common stock involves risk, and Bancorp’s profitability and success may be affected by a number of factors including those discussed below.
Financial condition and profitability depend significantly on local and national economic conditions.
The Company’s success depends on general economic conditions both locally and nationally. Most of Bancorp’s customers are in the Louisville, Indianapolis, and Cincinnati metropolitan areas. Compared to regional or national financial institutions, Bancorp is less able to spread the risks of unfavorable local economic conditions across a large number of diversified economies. Some of Bancorp’s customers are directly impacted by the local economy while others have more national or global business dealings. Deterioration in the quality of the credit portfolio could have a material adverse effect on financial condition, results of operations, and ultimately capital.
Financial condition and profitability depend on real estate values in the Company’s market area.
Bancorp offers a variety of secured loans, including commercial lines of credit, commercial term loans, real estate, construction, home equity, consumer and other loans. Bancorp’s loans are secured by real estate (both residential and commercial) primarily in Bancorp’s market areas. In instances where borrowers are unable to repay their loans and there has been deterioration in the value of the loan collateral, Bancorp could experience higher loan losses which could have a material adverse effect on financial condition, and results of operations.
If actual loan losses are greater than Bancorp’s assumption for loan losses, earnings could decrease.
Bancorp’s loan customers may not repay their loans according to the terms of these loans, the collateral securing the payment of these loans may be insufficient to ensure repayment and the wealth of guarantors providing guarantees to support these loans may be insufficient to aid in the repayment of these loans. Accordingly, Bancorp might experience significant credit losses which could have a material adverse effect on operating results. Bancorp makes various assumptions and judgments about the collectability of the loan portfolio, including the creditworthiness of borrowers and the value of collateral for repayment of many loans. In determining the adequacy of the allowance for loan losses, Bancorp considers, among other factors, an evaluation of economic conditions and Bancorp’s loan loss experience. If Bancorp’s assumptions prove to be incorrect or economic problems are worse than projected, the current allowance may not be sufficient to cover loan losses and adjustments may be necessary to allow for different economic conditions or adverse developments in the loan portfolio. Such additions to the allowance, if necessary, could have a material adverse impact on financial results.
Federal and state regulators annually review Bancorp’s allowance for loan losses and may require an increase in the provision for loan losses or loan charge-offs. If regulatory agencies require any increase in the provision for loan losses or loan charge-offs for which Bancorp had not allocated, it would have a negative effect on financial results.
Fluctuations in interest rates could reduce profitability.
Bancorp’s primary source of income is from the net interest spread, the difference between interest earned on loans and investments and the interest paid on deposits and borrowings. Bancorp expects to periodically experience gaps in interest rate sensitivities of Bancorp’s assets and liabilities, meaning that either interest-bearing liabilities will be more sensitive to changes in market interest rates than interest-earning assets, or vice versa. In either event, if market interest rates should move contrary to Bancorp’s position, this gap will work against Bancorp and earnings will be negatively affected.
Many factors affect fluctuation of market interest rates, including, but not limited to the following:
|
● |
inflation or deflation |
|
● |
recession |
|
● |
a rise in unemployment |
|
● |
tightening money supply |
|
● |
international disorder and instability in foreign financial markets |
|
● |
the Federal Reserve’s actions to control interest rates |
The Federal Reserve increased the overnight federal funds rate three times in 2017 which led to the prime lending rate increasing from 3.75% to 4.50%. Bancorp benefits from rates increasing as the majority of variable rate loans are tied to prime with a lesser amount tied to LIBOR. While variable rate loans have re-priced at higher rates Bancorp has largely held deposit rates unchanged. Deposit rates generally do not reprice as quickly as loans which positively affects earnings as rates rise in the short term. Market expectations for 2018 include three additional 25 bps federal funds rate increases. Bancorp recognizes that eventually deposit rates will be adjusted upward which poses a risk to earnings. Migration of deposits out of Bancorp, as customers pursue higher rates, could impact liquidity and earnings as Bancorp competes for deposits. Changes in the mix of deposits could result in increased average rates paid on deposits, and lower earnings to Bancorp. Bancorp’s asset-liability management strategy, which is designed to mitigate risk from changes in market interest rates, may not be able to prevent changes in interest rates from having a material adverse effect on Bancorp’s results of operations and financial condition. Bancorp’s most recent earnings simulation model estimated the impact of changing interest rates on earnings for the next 12 months indicates net interest income will decrease approximately 3% if interest rates immediately increase 200 basis points and decrease approximately 5% if rates decrease 200 basis points.
Bancorp is subject to funding risk.
Funding risk represents the dependence Bancorp has on large commercial deposit relationships. Approximately 40% of Bancorp’s total deposits are centralized in accounts with balances $500,000 or greater. Bancorp considers these deposits core funds as they represent long-standing relationships and are a testament to Bancorp’s commitment to partner with business clients by providing exemplary service and competitive products. A sudden shift in customer behavior within these deposits resulting in balances being reduced or moved out of the bank altogether could impact Bancorp’s ability to capitalize on growth opportunities and meet current obligations. Bancorp has secondary sources of funding to draw upon as needed but the cost of those funds would be higher than typical deposit accounts which would negatively impact the financial condition and results of operation.
Significant stock market volatility could negatively affect Bancorp’s financial results.
Income from wealth management and trust constitutes approximately 44% of non-interest income. Trust assets under management are expressed in terms of market value, and a significant portion of fee income is based upon those values. A large majority of wealth management and trust fees are based on market values which generally fluctuate with the overall capital markets.
Capital and credit markets experience volatility and disruption from time to time. These conditions place downward pressure on credit availability, credit worthiness and customers’ inclinations to borrow. Prolonged volatility or a significant disruption could negatively impact customers’ ability to seek new loans or to repay existing loans. The personal wealth of many borrowers and guarantors has historically added a source of financial strength to certain loans and would be negatively impacted by severe market declines. Sustained reliance on their personal assets to make loan payments would result in deterioration of their liquidity, and could result in loan defaults.
Competition with other financial institutions could adversely affect profitability.
Bancorp operates in a highly competitive industry that could become even more so as a result of earnings pressure of contending banks, legislative, regulatory and technological changes and continued consolidation. Bancorp faces vigorous competition in price and structure of financial products from banks and other financial institutions. In recent years, credit unions have expanded their lending mix and now compete heavily with banks in the commercial real estate market. Their high risk tolerance for fixed rate, long-term loans has adversely affected Bancorp’s net loan growth and results of operations. Bancorp also competes with other non-traditional providers of financial services, such as brokerage firms and insurance companies. As internet-based financial services continue to grow in acceptance, Bancorp must remain relevant as a place where consumers and businesses value personal service while competitors offer these services without human interaction. The variety of sources of competition may reduce or limit margins on banking services, reduce market share and adversely affect results of operations and financial condition. Bancorp’s growth and expansion may adversely affect customer perceptions of the community based, customer oriented service Bancorp provides, thus damaging Bancorp’s image in the market.
An extended disruption of vital infrastructure could negatively impact Bancorp’s business, results of operations, and financial condition.
Bancorp’s operations depend upon, among other things, infrastructure, including equipment and facilities. Extended disruption of vital infrastructure by fire, power loss, natural disaster, telecommunications failure, information systems breaches, terrorist activity or the domestic and foreign response to such activity, or other events outside of Bancorp’s control could have a material adverse impact on the financial services industry as a whole and on Bancorp’s business, results of operations and financial condition. Bancorp’s business continuity plan may not work as intended or may not prevent significant interruption of operations. Occurrence of any failures, interruptions, or security breaches of information systems could damage Bancorp’s reputation, result in loss of customer business, subject the Company to additional regulatory scrutiny, or expose Bancorp to civil litigation and possible financial liability, any of which could have an adverse effect on Bancorp’s financial condition and results of operation.
Security breaches or incidences of fraud could negatively impact Bancorp’s business, results of operations, and financial condition.
Bancorp’s assets which are at risk for cyber-attacks include financial assets and non-public information belonging to customers. Cyber security risks include cyber espionage, blackmail, ransom, theft, and corporate account takeovers. Bancorp employs many preventive and detective controls to protect its assets, and provides mandatory recurring information security training to all employees. Bancorp has invested in multiple preventative tools in an attempt to protect customers from cyber threats and corporate account takeover. Bancorp regularly provides educational information regarding cyber threats to customers. Bancorp utilizes multiple third-party vendors who have access to the Company’s assets via electronic media. While Bancorp requires third parties, many of whom are small companies, to have similar or superior controls in place there is no guarantee that a breach of information could occur. Activities of the Bank that subject Bancorp to risk of fraud by customers, employees, vendors, or members of the general public include ACH transactions, wire transactions, ATM transactions, checking transactions, and loan originations. Repeated incidences of fraud or a single large occurrence would adversely impact Bancorp’s reputation and results of operation.
Bancorp’s credit metrics are at historically strong levels.
During 2017, Bancorp’s solid asset quality metrics trended within a narrow range and exceeded solid benchmarks of the past several years to reach historically strong levels. Bancorp realizes that present asset quality metrics are exceptionally positive and, recognizing the cyclical nature of the lending business, the Company anticipates this trend will most likely normalize over time.
Bancorp’s accounting policies and methods are critical to how Bancorp reports its financial condition and results of operations. They require management to make estimates about matters that are uncertain.
Accounting policies and methods are fundamental to how Bancorp records and reports its financial condition and results of operations. Bancorp must exercise judgment in selecting and applying these accounting policies and methods so they comply with United States generally accepted accounting principles (“US GAAP”).
Bancorp has identified certain accounting policies as being critical because they require management’s judgment to ascertain the valuations of assets, liabilities, commitments and contingencies. A variety of factors could affect the ultimate value that is obtained either when earning income, recognizing an expense, recovering an asset, or reducing a liability. Bancorp has established detailed policies and control procedures intended to ensure these critical accounting estimates and judgments are well controlled and applied consistently.
The policies and procedures are intended to ensure that the process for changing methodologies occurs in an appropriate manner. Because of the uncertainty surrounding Bancorp’s judgments and the estimates pertaining to these matters, there can be no assurances that actual results will not differ from those estimates. See the “Critical Accounting Policies” in the “Management’s Discussion and Analysis of Financial Condition and Results of Operations” for more information.
Bancorp operates in a highly regulated environment and may be adversely affected by changes to or lack of compliance with federal, state and local laws and regulations.
Bancorp is subject to extensive regulation, supervision and examination by federal and state banking authorities. Any change in applicable regulations or federal or state legislation could have a substantial impact on Bancorp and its operations. Additional legislation and regulations may be enacted or adopted in the future that could significantly affect Bancorp’s powers, authority and operations, which could have a material adverse effect on Bancorp’s financial condition and results of operations. If Bancorp’s policies, procedures and systems are deemed deficient, the Company would be subject to liability, including fines and regulatory actions, which may include restrictions on the ability to pay dividends and the requirement to obtain regulatory approvals to proceed with certain aspects of Bancorp’s business plan, including branching and acquisition plans.
Bancorp’s ability to stay current on technological changes in order to compete and meet customer demands is constantly being challenged.
The financial services industry is constantly undergoing rapid technological changes, with frequent introductions of new technology-driven products and services. Future success of Bancorp will depend, in part, upon its ability to address the needs of its customers by using technology to provide products and services that will satisfy customer demands for convenience, as well as to create additional operational efficiencies and greater privacy and security protection for customers and their personal information. Many of Bancorp’s competitors have substantially greater resources to invest in technological improvements. Bancorp may not be able to effectively implement new technology-driven products and services as quickly as competitors or be successful in marketing these products and services to its customers. Bancorp relies on third party providers for many of its technology-driven banking products and services. Some of these companies may be slow to respond with upgrades or enhancements to their products to keep pace with improvements in technology or the introduction of competing products. Failure to successfully keep pace with technological change affecting the financial services industry could impair Bancorp’s ability to effectively compete to retain or acquire new business and could have an adverse impact on its business, financial position, results of operations and liquidity.
Bancorp is dependent upon outside third parties for the processing and handling of the Company’s records and data.
Bancorp relies on software developed by third-party vendors to process various transactions. In some cases, Bancorp has contracted with third parties to run their proprietary software on the Company’s behalf. While Bancorp performs a review of controls instituted by the applicable vendors over these programs in accordance with industry standards and performs testing of user controls, the Company relies on the continued maintenance of controls by these third-party vendors, including safeguards over the security of client data. Bancorp may incur a temporary disruption in the Company’s ability to conduct business or process transactions, or incur reputational, if the third-party vendor fails to adequately maintain internal controls or institute necessary changes to systems. Such a disruption or breach of security could have a material adverse effect on Bancorp’s business. Further, if these third-party service providers experience difficulties, or should terminate their services, and the Company is unable to replace them on a timely basis, Bancorp’s business operations could be interrupted. If an interruption were to continue for a significant period of time, the Company’s business, financial condition and results of operations could be adversely affected.
Bancorp may not be able to attract and retain skilled people.
Bancorp’s success depends, in large part, on its ability to attract and retain key people. Competition for the best people in the industry and the markets in which Bancorp engages can be intense, and the Company may not be able to retain or hire the people wanted or needed. To attract and retain qualified employees, Bancorp must compensate them at market levels. If Bancorp is unable to continue to attract and retain qualified employees, or do so at rates necessary to maintain the Company’s competitive position, Bancorp’s performance, including the Company’s competitive position, could suffer, and, in turn, adversely affect Bancorp’s business, financial condition or results of operations.
Bancorp invests in partnerships that generate federal income tax savings and these may not continue.
Bancorp invests in certain partnerships that yield federal income tax credits resulting in higher net income for Bancorp. These transactions may also include lending to the developer, further enhancing the profitability of the transaction. These transactions typically involve a very limited number of counterparties. The availability and suitability of these transactions are not particularly predictable and may not continue to be favorable to Bancorp. The recently enacted income tax reform could result in fewer transactions and the extent to which federal income tax credits favorably effect Bancorp’s net income. Therefore the positive effect on Bancorp’s net income may not continue.
Changes in customer use of banks could adversely affect Bancorp’s financial condition and results of operation.
The rapid evolution of non-bank alternatives for initiation and completion of financial transactions puts Bancorp at risk of losing sources of revenue and funding. The ability of customers to pay bills, transfer funds, and purchase assets without utilizing the banking system could result in loss of fee income, deposits, and loans. If Bancorp is unable to continue timely development of competitive new products and services, its business, financial condition and results of operations could be adversely affected.
The Current Expected Credit Loss (CECL) accounting standard will result in a significant change in how Bancorp recognizes credit losses and may have a material impact on the Company’s financial condition or results of operations.
In June 2016, the Financial Accounting Standards Board issued an accounting standard update, “Financial Instruments-Credit Losses (Topic 326), Measurement of Credit Losses on Financial Instruments,” which replaces the current “incurred loss” model for recognizing credit losses with an “expected loss” model. Whereas the incurred loss model delays recognition of loss on financial instruments until it is probable a loss has occurred, the expected loss model will necessitate recognizing a loss at the time the loan is first added to the balance sheet. As result of this differing methodology, Bancorp expects the adoption of the CECL model will materially affect the determination of the allowance for loan losses and could require a significant increase to the allowance. Any material increase to the required level of loan loss allowance could adversely affect Bancorp’s business, financial condition, and results of operation.
The CECL standard will become effective for Bancorp for fiscal years beginning after December 15, 2019 and for interim periods beginning with the first quarter of 2020. While the impact of implementing the CECL model cannot be quantified at this time, Bancorp expects to recognize a one-time cumulative-effect adjustment to the allowance for loan losses and stockholders’ equity in the first quarter of 2020, consistent with interagency guidance issued in 2016.
|
Item 1B. |
Unresolved Staff Comments |
Bancorp has no unresolved SEC staff comments.
|
Item 2. |
Properties |
The principal offices of Bancorp are located at 1040 East Main Street, Louisville, Kentucky. Bancorp’s operations center is at a separate location. In addition to the main office complex and the operations center, Bancorp owned 20 branch properties at December 31, 2017, two of which are located on leased land. At that date, Bancorp also leased 17 branch facilities as well as its wealth management and trust facility. Of the 37 banking locations, 28 are located in the Louisville Metropolitan Statistical Area (“MSA”), four are located in the Indianapolis MSA and five are located in the Cincinnati MSA. See Notes 6 and 19 to Bancorp’s consolidated financial statements for the year ended December 31, 2017, for additional information relating to amounts invested in premises and equipment and lease commitments.
|
Item 3. |
Legal Proceedings |
See Note 19 to Bancorp’s consolidated financial statements for the year ended December 31, 2017, for information relating to legal proceedings.
|
Item 4. |
Mine Safety Disclosures |
Not applicable.
Executive Officers of the Registrant
The following table lists the names and ages as of December 31, 2017 of all current executive officers of Bancorp and the Bank. Each executive officer is appointed by Bancorp’s Board of Directors to serve at the discretion of the Board.
There is no arrangement or understanding between any executive officer of Bancorp or the Bank and any other person(s) pursuant to which he/she was or is to be selected as an officer.
|
Name and Age |
Position and Offices |
|
|
David P. Heintzman |
Chairman of the Board of Directors and Chief Executive Officer of Bancorp and the Bank |
|
|
James A. Hillebrand |
President and Director of Bancorp and the Bank |
|
|
Kathy C. Thompson |
Senior Executive Vice President and Director of Bancorp and the Bank |
|
|
Nancy B. Davis |
Executive Vice President, Treasurer and Chief Financial Officer of Bancorp and the Bank |
|
|
William M. Dishman III |
Executive Vice President and Chief Risk Officer of the Bank |
|
|
Philip S. Poindexter |
Executive Vice President and Chief Lending Officer of the Bank |
|
|
T. Clay Stinnett |
Executive Vice President and Chief Strategic Officer of Bancorp and the Bank |
|
|
Michael J. Croce |
Executive Vice President and Director of Retail Banking of the Bank |
Mr. Heintzman was appointed Chairman and Chief Executive Officer in January 2006. Prior thereto, he served as President of Bancorp and the Bank since 1992. Mr. Heintzman joined the Bank in 1985.
Mr. Hillebrand was appointed President in July 2008. Prior thereto, he served as Executive Vice President and Director of Private Banking of the Bank since 2005. From 2000 to 2004, he served as Senior Vice President of Private Banking. Mr. Hillebrand joined the Bank in 1996.
Ms. Thompson was appointed Senior Executive Vice President in January 2006. Prior thereto, she served as Executive Vice President of Bancorp and the Bank. She joined the Bank in 1992 and is Manager of the Wealth Management and Trust Department.
Ms. Davis was appointed Executive Vice President of Bancorp and the Bank in 1999 and Chief Financial Officer in 1993. She joined the Bank in 1991.
Mr. Dishman joined the Bank as Executive Vice President and Chief Risk Officer in February 2009.
Mr. Poindexter was appointed Chief Lending Officer in July 2008. Prior thereto, he served as Executive Vice President and Director of Commercial Banking. Mr. Poindexter joined the Bank in 2004.
Mr. Stinnett was appointed Executive Vice President and Chief Strategic Officer in February 2011. Prior thereto, he served as Senior Vice President and Chief Strategic Officer since 2005. Mr. Stinnett joined the Bank in 2000.
Mr. Croce was appointed Executive Vice President and Director of Retail Banking in July 2014. Prior thereto, he served as Senior Vice President and Division Manager of Business Banking. Mr. Croce joined the Bank in 2004.
|
Item 5. |
Market for Registrant’s Common Equity, Related Stockholder Matters and Issuer Purchases of Equity Securities |
Bancorp’s common stock is traded on the NASDAQ Global Select Market under the ticker symbol SYBT. The table below sets forth the quarterly high and low market closing prices of Bancorp’s common stock and dividends declared per share. In April 2016, Bancorp declared a 3 for 2 stock split which was effected as a 50% stock dividend. Share and per share information has been adjusted for this split. The payment of dividends by the Bank to Bancorp is subject to the restriction described in Note 18 to the consolidated financial statements. Management believes that Bancorp will continue to generate adequate earnings to continue to pay dividends on a quarterly basis. On December 31, 2017, Bancorp had approximately 1,600 shareholders of record, and approximately 5,300 beneficial owners holding shares in nominee or “street” name.
|
2017 |
2016 |
|||||||||||||||||||||||
|
Cash Dividends |
Cash Dividends |
|||||||||||||||||||||||
|
Quarter |
High |
Low |
Declared |
High |
Low |
Declared |
||||||||||||||||||
|
First |
$ | 47.50 | $ | 39.25 | $ | 0.19 | $ | 26.09 | $ | 23.27 | $ | 0.17 | ||||||||||||
|
Second |
43.75 | 36.20 | 0.20 | 29.03 | 24.55 | 0.18 | ||||||||||||||||||
|
Third |
40.00 | 32.25 | 0.20 | 33.25 | 27.52 | 0.18 | ||||||||||||||||||
|
Fourth |
41.60 | 36.50 | 0.21 | 46.95 | 32.93 | 0.19 | ||||||||||||||||||
The following table shows information relating to the repurchase of shares of common stock by Bancorp during the three months ended December 31, 2017.
|
Total number of |
Average price paid per share |
Total number of shares purchased as part of publicly announced plan |
Maximum number of shares that may yet be purchased under the plan |
|||||||||||||
|
October 1-October 31 |
2,095 | $ | 38.97 | – | – | |||||||||||
|
November 1-November 30 |
4,300 | 38.58 | – | – | ||||||||||||
|
December 1-December 31 |
748 | 38.02 | – | – | ||||||||||||
|
Total |
7,143 | $ | 38.64 | – | – | |||||||||||
Activity represents shares of stock withheld to satisfy employee tax obligations due upon the exercise of stock appreciation rights, on lapsed shares of restricted stock and on performance stock unit awards. Bancorp does not have an active stock repurchase program.
The following performance graphs and data shall not be deemed filed for purposes of Section 18 of the Securities Exchange Act of 1934 or otherwise subject to the liabilities of that section, nor shall it be deemed soliciting material or subject to Regulation 14A of the Exchange Act or incorporated by reference in any filing under the Exchange Act or the Securities Act of 1933, except as shall be expressly set forth by specific reference in such filing.
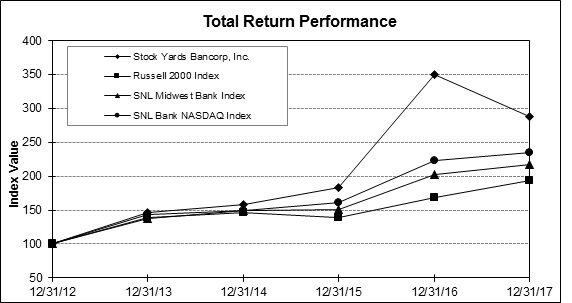
The first graph below compares performance of Bancorp Common Stock to the Russell 2000 index, the SNL NASDAQ Bank index and the SNL Midwest Bank index for Bancorp’s last five fiscal years. The graph assumes the value of the investment in Bancorp Common Stock and in each index was $100 at December 31, 2012 and that all dividends were reinvested.
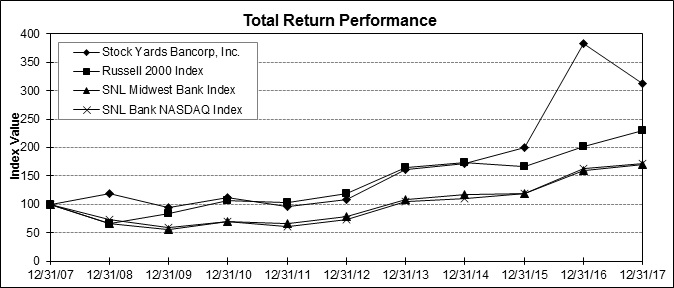
In addition to the five-year period required by the SEC, the ten-year period is presented because it provides additional perspective, and Bancorp management believes that longer-term performance is of greater interest. The ten-year graph assumes the value of the investment in Bancorp Common Stock and in each index was $100 at December 31, 2007 and that all dividends were reinvested.
|
Period Ending |
||||||||||||||||||||||||
|
Index |
12/31/12 |
12/31/13 |
12/31/14 |
12/31/15 |
12/31/16 |
12/31/17 |
||||||||||||||||||
|
Stock Yards Bancorp, Inc. |
$ | 100.00 | $ | 146.87 | $ | 157.88 | $ | 183.76 | $ | 350.33 | $ | 287.39 | ||||||||||||
|
Russell 2000 Index |
100.00 | 138.82 | 145.62 | 139.19 | 168.85 | 193.58 | ||||||||||||||||||
|
SNL Midwest Bank Index |
100.00 | 136.91 | 148.84 | 151.10 | 201.89 | 216.95 | ||||||||||||||||||
|
SNL Bank NASDAQ Index |
100.00 | 143.73 | 148.86 | 160.70 | 222.81 | 234.58 | ||||||||||||||||||
|
Period Ending |
||||||||||||||||||||||||||||||||||||||||||||
|
Index |
12/31/07 |
12/31/08 |
12/31/09 |
12/31/10 |
12/31/11 |
12/31/12 |
12/31/13 |
12/31/14 |
12/31/15 |
12/31/16 |
12/31/17 |
|||||||||||||||||||||||||||||||||
|
Stock Yards Bancorp, Inc. |
$ | 100.00 | $ | 118.05 | $ | 94.46 | $ | 111.79 | $ | 96.62 | $ | 109.17 | $ | 160.34 | $ | 172.37 | $ | 200.62 | $ | 382.47 | $ | 312.04 | ||||||||||||||||||||||
|
Russell 2000 Index |
100.00 | 66.21 | 84.20 | 106.82 | 102.36 | 119.09 | 165.33 | 173.42 | 165.76 | 201.08 | 230.54 | |||||||||||||||||||||||||||||||||
|
SNL Midwest Bank Index |
100.00 | 65.79 | 55.75 | 69.23 | 65.39 | 78.71 | 107.76 | 117.15 | 118.92 | 158.90 | 170.75 | |||||||||||||||||||||||||||||||||
|
SNL Bank NASDAQ Index |
100.00 | 72.62 | 58.91 | 69.51 | 61.67 | 73.51 | 105.65 | 109.42 | 118.12 | 163.78 | 172.43 | |||||||||||||||||||||||||||||||||
|
Item 6. |
Selected Financial Data |
Selected Consolidated Financial Data
|
(In thousands except |
Years ended December 31 |
|||||||||||||||||||
|
per share data and ratios) |
2017 |
2016 |
2015 |
2014 |
2013 |
|||||||||||||||
|
Income statement data |
||||||||||||||||||||
|
Interest income |
$ | 110,849 | $ | 102,172 | $ | 93,170 | $ | 89,087 | $ | 86,464 | ||||||||||
|
Interest expense |
7,246 | 4,918 | 4,852 | 5,330 | 9,166 | |||||||||||||||
|
Net interest income |
103,603 | 97,254 | 88,318 | 83,757 | 77,298 | |||||||||||||||
|
Provision (credit) for loan losses |
2,550 | 3,000 | 750 | (400 | ) | 6,550 | ||||||||||||||
|
Non-interest income |
45,120 | 43,537 | 39,950 | 39,155 | 39,002 | |||||||||||||||
|
Non-interest expenses |
90,991 | 81,520 | 73,398 | 73,209 | 71,352 | |||||||||||||||
|
Income before income taxes |
55,182 | 56,271 | 54,120 | 50,103 | 38,398 | |||||||||||||||
|
Income tax expense |
17,139 | 15,244 | 16,933 | 15,281 | 11,228 | |||||||||||||||
|
Net income |
$ | 38,043 | $ | 41,027 | $ | 37,187 | $ | 34,822 | $ | 27,170 | ||||||||||
|
Per share data |
||||||||||||||||||||
|
Net income, basic |
$ | 1.69 | $ | 1.84 | $ | 1.68 | $ | 1.59 | $ | 1.27 | ||||||||||
|
Net income, diluted |
1.66 | 1.80 | 1.65 | 1.57 | 1.26 | |||||||||||||||
|
Cash dividends declared |
0.80 | 0.72 | 0.64 | 0.59 | 0.54 | |||||||||||||||
|
Book value |
14.71 | 13.88 | 12.80 | 11.75 | 10.47 | |||||||||||||||
|
Market value |
37.70 | 46.95 | 25.19 | 22.23 | 21.28 | |||||||||||||||
|
Weighted average common and common equivalent shares - diluted |
22,983 | 22,792 | 22,459 | 22,144 | 21,530 | |||||||||||||||
|
Balance sheet data |
||||||||||||||||||||
|
Total assets |
$ | 3,239,646 | $ | 3,039,481 | $ | 2,816,801 | $ | 2,563,868 | $ | 2,389,262 | ||||||||||
|
Loans |
2,409,570 | 2,305,375 | 2,033,007 | 1,868,550 | 1,721,350 | |||||||||||||||
|
Allowance for loan losses |
24,885 | 24,007 | 22,441 | 24,920 | 28,522 | |||||||||||||||
|
Available for sale securities |
574,524 | 570,074 | 565,876 | 513,056 | 490,031 | |||||||||||||||
|
Deposits |
2,578,295 | 2,520,548 | 2,371,702 | 2,123,627 | 1,980,937 | |||||||||||||||
|
Federal funds purchased |
161,352 | 47,374 | 22,477 | 47,390 | 55,295 | |||||||||||||||
|
Federal Home Loan Bank advances |
49,458 | 51,075 | 43,468 | 36,832 | 34,329 | |||||||||||||||
|
Stockholders’ equity |
333,644 | 313,872 | 286,519 | 259,895 | 229,444 | |||||||||||||||
|
Average balances |
||||||||||||||||||||
|
Stockholders’ equity |
$ | 327,798 | $ | 304,151 | $ | 274,451 | $ | 245,425 | $ | 220,107 | ||||||||||
|
Assets |
3,037,581 | 2,886,396 | 2,573,901 | 2,398,430 | 2,232,868 | |||||||||||||||
|
Federal Home Loan Bank advances |
50,300 | 45,455 | 41,041 | 35,709 | 32,518 | |||||||||||||||
|
Long-term debt |
– | – | – | – | 30,477 | |||||||||||||||
|
Selected ratios |
||||||||||||||||||||
|
Return on average assets |
1.25 | % | 1.42 | % | 1.44 | % | 1.45 | % | 1.22 | % | ||||||||||
|
Return on average stockholders’ equity |
11.61 | 13.49 | 13.55 | 14.19 | 12.34 | |||||||||||||||
|
Average stockholders’ equity to average assets |
10.79 | 10.54 | 10.66 | 10.23 | 9.86 | |||||||||||||||
|
Net interest rate spread |
3.52 | 3.51 | 3.59 | 3.67 | 3.59 | |||||||||||||||
|
Net interest rate margin, fully tax-equivalent |
3.63 | 3.59 | 3.67 | 3.75 | 3.74 | |||||||||||||||
|
Efficiency ratio |
60.86 | 57.56 | 56.81 | 59.09 | 60.82 | |||||||||||||||
|
Non-performing loans to total loans |
0.31 | 0.29 | 0.44 | 0.64 | 1.33 | |||||||||||||||
|
Non-performing assets to total assets |
0.31 | 0.39 |
|
0.48 |
|
0.70 |
|
1.19 | ||||||||||||
|
Net charge offs to average loans |
0.07 | 0.07 | 0.17 | 0.18 | 0.60 | |||||||||||||||
|
Allowance for loan losses to total loans |
1.03 | 1.04 |
|
1.10 |
|
1.33 |
|
1.66 | ||||||||||||
Share and per share information has been adjusted to reflect the April 2016 3 for 2 stock-split effected in the form of a 50% stock dividend.
|
Management’s Discussion and Analysis of Financial Condition and Results of Operations |
Financial Section Summary
The financial section of this Form 10-K includes management’s discussion and analysis, consolidated financial statements, and the notes to those financial statements. Bancorp has prepared the following summary to assist in your review of the financial section. It is designed to give you an overview of Stock Yards Bancorp, Inc. and summarize some of the more important activities and events that occurred during 2017. Share and per share information has been adjusted to reflect the April 2016 3 for 2 stock-split which was effected in the form of a 50% stock dividend.
The financial section includes the following:
Management’s discussion and analysis, or MD&A provides information regarding the consolidated financial condition and results of operations of Bancorp. It contains management’s view about industry trends, risks, uncertainties, accounting policies that Bancorp views as critical in light of its business, results of operations including discussion of the key performance drivers, financial position, cash flows, commitments and contingencies, important events, transactions that have occurred over the last three years, and forward-looking information, as appropriate.
Financial statements include Consolidated Balance Sheets as of the end of the last two years, and Consolidated Statements of Income, Comprehensive Income, Changes in Stockholders’ Equity, and Cash Flows, for each of the last three years. Bancorp’s financial statements are prepared in accordance with US GAAP.
Notes to the financial statements provide insight into, and are an integral part of, the financial statements. These notes contain explanations of significant accounting policies, details about certain captions on the financial statements, information about significant events or transactions that have occurred, discussions about legal proceedings, commitments and contingencies, and selected financial information relating to business segments. The notes to the financial statements also are prepared in accordance with US GAAP.
Reports related to the financial statements and internal controls over financial reporting include the following:
|
● |
A report from KPMG LLP, an independent registered public accounting firm, which includes their opinion on the presentation of Bancorp’s consolidated financial statements in conformity with US GAAP based on their audits; |
|
● |
A report from management indicating Bancorp’s responsibility for financial reporting and the financial statements; |
|
● |
A report from management indicating Bancorp’s responsibility for the system of internal control over financial reporting, including an assessment of the effectiveness of those controls; and |
|
● |
A report from KPMG LLP, which includes their opinion on the effectiveness of Bancorp’s internal control over financial reporting. |
Our Business
Stock Yards Bancorp, Inc. was incorporated in 1988, and its business is substantially the same as that of its wholly owned subsidiary, Stock Yards Bank & Trust Company. The Bank has operated continuously since it opened in 1904. The Bank conducted business at one location for 85 years and began branching in 1989. At December 31, 2017, the Bank had 28 full service banking locations in the Louisville MSA, 4 full service banking locations in the Indianapolis MSA, and 5 full service banking locations in the Cincinnati MSA. Bancorp’s focus on flexible, attentive customer service has been key to its growth and profitability. The wide range of services provided by wealth management and trust, investment product sales, and mortgage origination helps support the corporate philosophy of capitalizing on full service customer relationships.
Forward-Looking Statements
This report contains forward-looking statements under the Private Securities Litigation Reform Act that involve risks and uncertainties. These forward-looking statements may be identified by the use of words such as “expect”, “anticipate”, “plan”, “foresee”, “believe” or other words with similar meaning. Although Bancorp believes assumptions underlying forward-looking statements contained herein are reasonable, any of these assumptions could be inaccurate. Factors that could cause actual results to differ from results discussed in forward-looking statements include, but are not limited to: economic conditions both generally and more specifically in markets in which Bancorp and its subsidiary operate; competition for Bancorp’s customers from other providers of financial services; government legislation and regulation which change from time to time and over which Bancorp has no control; changes in interest rates; material unforeseen changes in liquidity, deterioration in the real estate market, results of operations or financial condition of Bancorp’s customers; or other risks detailed in Bancorp’s filings with the Securities and Exchange Commission and Item 1A of this Form 10-K, all of which are difficult to predict and many of which are beyond the control of Bancorp.
Critical Accounting Policies
Bancorp has prepared consolidated financial information in this report in accordance with US GAAP. In preparing the consolidated financial statements, Bancorp makes estimates and assumptions that affect the reported amount of assets and liabilities, disclosure of contingent assets and liabilities at the date of the financial statements, and the reported amounts of revenue and expenses during the reporting period. There can be no assurances that actual results will not differ from those estimates.
Management has identified the accounting policy related to the allowance and provision for loan losses as critical to the understanding of Bancorp’s results of operations and discussed this conclusion with the Audit Committee of the Board of Directors. Since the application of this policy requires significant management assumptions and estimates, it could result in materially different amounts to be reported if conditions or underlying circumstances were to change. The provision for loan losses reflects an allowance methodology driven by risk ratings, historical losses, specific loan loss allocations, and qualitative factors. Assumptions include many factors such as changes in borrowers’ financial condition which can change quickly or historical loss ratios related to certain loan portfolios which may or may not be indicative of future losses. In the first quarter of 2017, Bancorp extended the historical period used to capture Bancorp’s historical loss ratios from 24 quarters to 28 quarters. This extension of the historical period was applied to all classes and segments of our portfolio. The expansion of the look-back period for the quantitative historical loss rate caused us to review the overall methodology for the qualitative factors to ensure we were appropriately capturing the risk not addressed in the quantitative historical loss rate. Management believes the extension of the look-back period is appropriate to capture the impact of a full economic cycle and more accurately represents the current level of risk inherent in the loan portfolio.
The quarterly allowance calculation has both quantitative and qualitative factors which support the total balance of the allowance at period end. The effect of the extension of the look-back period to 28 quarters in the first quarter of 2017 resulted in a net decrease to the calculated quantitative portion of the allowance, but this was more than offset by an increase to the qualitative factors. The net impact of the extension of the look-back period was an increase in the allowance during the first quarter of 2017 of approximately $474 thousand. The change in methodology was consistent with management’s judgment regarding the risk in the loan portfolio and consistent with internal analysis showing continued strong asset quality related not only in the Company’s loan portfolio, but the Bank’s peer group as well, validating the continuation of the current economic cycle and thus the reasoning to extend the look-back period. Management will continue to evaluate the appropriateness of the look-back period based on the status of the economic cycle. To the extent that management’s assumptions prove incorrect, results from operations could be materially affected by a higher or lower provision for loan losses. The accounting policy related to the allowance for loan losses is applicable to the commercial banking segment of Bancorp. The impact and any associated risks related to this policy on Bancorp’s business operations are discussed in the “Allowance for Loan Losses” section below.
The allowance for loan losses is management’s estimate of probable losses inherent in the loan portfolio as of the balance sheet date. Loan losses are charged against the allowance when management believes the uncollectibility of a loan balance is confirmed. Subsequent recoveries, if any, are credited to the allowance.
Bancorp’s allowance calculation includes allocations to loan portfolio segments at December 31, 2017 for qualitative factors including, among other factors, local economic and business conditions in each of our primary markets, quality and experience of lending staff and management, exceptions to lending policies, levels of and trends in past due loans and loan classifications, concentrations of credit such as collateral type, trends in portfolio growth, trends in value of underlying collateral for collateral-dependent loans, effect of other external factors such as the national economic and business trends, quality and depth of the loan review function, and management’s judgement of current trends and potential risks. Bancorp utilizes the sum of all allowance amounts derived as described above as the appropriate level of allowance for loan and lease losses. Changes in criteria used in this evaluation or availability of new information could cause the allowance to be increased or decreased in future periods. In addition, bank regulatory agencies, as part of their examination process, may require adjustments to the allowance for loan and lease losses based on their judgments and estimates.
Overview of 2017
The following discussion should be read in conjunction with Bancorp’s consolidated financial statements and accompanying notes and other schedules presented elsewhere in this report.
In 2017, Bancorp completed another strong year of revenue, asset, and deposit growth. Total revenue, comprising net interest income and non-interest income, increased 6% to $148.7 million in 2017 from $140.8 million in 2016. Net income for the year ended December 31, 2017, was $38.0 million or $1.66 per diluted share compared with $41.0 million or $1.80 per diluted shares for 2016. Net income for the fourth quarter and full year 2017 reflected a non-cash charge of $5.9 million or $0.25 per diluted share to revalue the Company’s net deferred tax asset in connection with the Tax Cuts and Jobs Act (tax reform) enacted on December 22, 2017.
Key aspects of the Company’s performance for the year included:
|
● |
Solid loan growth during 2017, which increased the Company’s loan portfolio nearly 5% for 2017; |
|
● |
Consistently strong net interest margin; |
|
● |
Credit quality remained at historically strong levels; |
|
● |
Continued growth in fee income, led by the Wealth Management and Trust Group; and |
|
● |
Solid returns on average assets and equity of 1.25% and 11.61%, respectively, despite the negative impact of 0.20% on return on average assets and 1.81% on return on average equity due to the year-end remeasurement charge noted above. |
As is the case with most banks, the primary source of Bancorp’s revenue is net interest income and fees from various financial services provided to customers. Net interest income is the difference between interest income earned on loans, investment securities and other interest earning assets less interest expense on deposit accounts and other interest bearing liabilities. Loan growth and interest rates earned on those loans are critical to overall profitability. Similarly, deposit growth is crucial to funding loans and rates paid on deposits directly impact profitability. New business volume is influenced by economic factors including market interest rates, business spending, consumer confidence and competitive conditions within the marketplace.
As a result of near-record loan production and sustained utilization of available lines of credit, Bancorp was able to overcome elevated loan pre-payment activity and increase the loan portfolio $104 million, or almost 5%, to $2.4 billion as of December 31, 2017. Increasing average rates on interest earning assets, along with the impact of increased volumes on loans contributed to higher interest income for 2017, as interest income increased $8.6 million, or 8%, over the same period in 2016. Deposit growth during 2017, and more significantly higher funding costs on deposits and borrowings, resulted in an increase in interest expense of $2.3 million or 47%, year over year. Bancorp benefited in recent years from historically low costs of funding, so that even a modest increase in interest expense results in a significant percentage change over prior periods. Net interest margin in 2017 increased to 3.63%, as compared with 3.59% in 2016 despite the continuing pressure of a highly competitive lending environment and increasing rates paid on deposits.
Total non-interest income increased $1.6 million, or 4% in 2017, as compared with 2016, and represented 30% of total revenues, down slightly from 31% in 2016. Wealth management and trust department (WM&T) income, service charges on deposits, treasury management fees, and investment products fees all increased in 2017 over 2016, with the greatest dollar increase from WM&T. WM&T represents an important part of the relationship focused philosophy of the Company and, accordingly, income from the department represents approximately 45% of total non-interest income for the Bancorp. The magnitude of WM&T revenue distinguishes Bancorp from other community banks of similar asset size and although the 2017 increase was partially the result of a rising stock market during the year, it also represented a strong year for WM&T in terms of new clients added.
Higher non-interest expenses for 2017 were primarily the result of increased personnel and technology costs, associated with growth and operational support, and increased amortization and impairment charges for investments in tax credit partnerships as the Bancorp increased its commitment to customers pursuing tax-advantaged projects, primarily involving historical redevelopment. Bancorp’s efficiency ratio for 2017 of 60.9% was up from 57.6% in 2016.
For the year ended December 31, 2017, Bancorp recorded a $2.6 million provision for loan losses, compared with $3.0 million for the same period in 2016. The provision for loan losses represents a charge to earnings necessary to maintain an allowance for loan losses that, in management’s evaluation, is adequate to provide coverage for the inherent losses on outstanding loans. The decrease in the provision was a reflection of continued historically strong credit quality metrics. Bancorp’s allowance for loan losses was 1.03% of total loans at December 31, 2017, compared with 1.04% of total loans at December 31, 2016.
Bancorp’s effective tax rate increased to 31.1% in 2017 from 27.1% in 2016 due to the $5.9 million charge to remeasure Bancorp’s net deferred tax asset necessitated by tax reform. Bancorp anticipates an overall effective tax rate of approximately 17% in 2018. Bancorp invests in certain partnerships that yield federal income tax credits. The tax benefit of these investments exceeds the impairment charge associated with them, resulting in a positive impact on net income. In 2018, the Company expects a lower level of participation in tax-credit partnerships due to reduced investment opportunities.
In 2017 Bancorp adopted ASU 2016-09 “Compensation – Stock Compensation Improvements to Employee Share-Based Payment Accounting”. The new standard requires excess tax benefits and deficiencies related to share-based payment awards to be reflected in the statement of operations as a component of the provision for income taxes. In 2017 Bancorp recorded a benefit of $1.5 million for such tax benefits against the provision for income tax expense. Prior to adoption of ASU 2016-09, these tax benefits were recorded directly to additional paid-in capital.
As of December 31, 2017, the Company’s total equity to total assets was 10.30% compared with 10.33% at December 31, 2016. Tangible common equity (TCE), a non-GAAP measure, is a measure of a company’s capital which is useful in evaluating the quality and adequacy of capital. It is calculated by subtracting the value of intangible assets and any preferred equity from Bancorp’s stockholders’ equity. The ratio of tangible common equity to total tangible assets was 10.25% as of December 31, 2017, compared with 10.26% at December 31, 2016. See the Non-GAAP Financial Measures section for details on reconcilement to US GAAP measures.
Challenges for 2018 will include managing net interest margin, achieving continued loan growth, managing credit quality and adapting to technology changes and evolving customer behavior.
|
● |
Considering the increases in short-term interest rates implemented by the Federal Open Market Committee and with the expectation of additional increases in 2018, management anticipates that net interest margins will increase during the coming year. Although rising rates should have a positive effect on net interest margin, competitive pressures on rates for loans and deposits will likely result in a continued pressure on the net interest margin for 2018. Increased deposit rates will also negatively impact this expectation. |
|
● |
Bancorp’s goals for 2018 include net loan growth at a pace greater than that experienced in 2017. This will be impacted by competition, prevailing economic conditions, line of credit utilization and prepayments in the loan portfolio. Bancorp believes there is continued opportunity for loan growth in all three of its markets, and Bancorp’s ability to deliver attractive loan growth over the long-term is linked to Bancorp’s success. |
|
● |
Bancorp has been successful at gathering sufficient deposits to fund loan growth. While deposits in all market areas have grown, the most significant increases arose in the Louisville market. Bancorp will need to continue to increase deposits to support loan growth in all markets. |
|
● |
Bancorp derives significant non-interest income from fees earned from wealth management and trust services. Most of these fees are based upon the market value of assets under management (AUM). To continue growth of this income source Bancorp must attract new customers and retain existing customers. Bancorp believes there is opportunity for net growth in its three markets. Growth in market values of AUM and fees is also dependent upon positive returns in the overall capital markets. Bancorp has no control over market volatility. |
|
● |
Technological advances are consistently providing opportunities for Bancorp to consider potential new products and delivery channels. Bancorp’s customers’ demand for innovative and relevant products and services is expected to trend along with the changing technology. Bancorp will need to continue to make prudent investments in technology while managing associated risks so as to remain competitive with other financial service providers. |
The following sections provide more details on subjects presented in this overview.
Results of Operations
Net income was $38.0 million or $1.66 per share on a diluted basis for 2017 compared with $41.0 million or $1.80 per share for 2016 and $37.2 million or $1.65 per share for 2015.
Net income for 2017 was positively impacted by:
|
● |
a $6.3 million, or 7% increase in net interest income, and |
|
● |
a $1.6 million, or 4% increase in non-interest income, and |
|
● |
a $450 thousand, or 15% decrease in provision for loan losses. |
Net income for 2017 was negatively impacted by:
|
● |
an $9.5 million, or 12% increase in non-interest expense |
|
● |
a $1.9 million, or 12% increase in income tax. |
The following paragraphs provide a more detailed analysis of significant factors affecting operating results.
Net Interest Income
Net interest income, the most significant component of Bancorp’s earnings, represents total interest income less total interest expense. Net interest spread is the difference between the taxable equivalent rate earned on average interest earning assets and the rate expensed on average interest bearing liabilities. Net interest margin represents net interest income on a taxable equivalent basis as a percentage of average earning assets. Net interest margin is affected by both interest rate spread and the level of non-interest bearing sources of funds. The level of net interest income is determined by the mix and volume of interest earning assets, interest bearing deposits and interest bearing liabilities and by changes in interest rates. The discussion that follows is based on tax-equivalent interest data.
Comparative information regarding net interest income follows:
|
(Dollars in thousands) |
2017/2016 |
2016/2015 |
||||||||||||||||||
|
2017 |
2016 |
2015 |
Change |
Change |
||||||||||||||||
|
Net interest income, tax- equivalent basis |
$ | 104,396 | $ | 98,088 | $ | 89,246 | 6.4 |
% |
9.9 |
% |
||||||||||
|
Net interest spread |
3.52 | % | 3.51 | % | 3.59 | % | 1.0 | bp | (8 | )bp | ||||||||||
|
Net interest margin |
3.63 | % | 3.59 | % | 3.67 | % | 4.0 | bp | (8 | )bp | ||||||||||
|
Average earning assets |
$ | 2,872,717 | $ | 2,730,949 | $ | 2,430,400 | 2.1 |
% |
12.4 |
% |
||||||||||
|
Five year Treasury note rate at year end |
2.20 | % | 1.93 | % | 1.76 | % | 27 | bp | 17 | bp | ||||||||||
|
Average five year Treasury note rate |
1.91 | % | 1.33 | % | 1.53 | % | 58 | bp | (20 | )bp | ||||||||||
|
Prime rate at year end |
4.50 | % | 3.75 | % | 3.50 | % | 75 | bp | 25 | bp | ||||||||||
|
Average prime rate |
4.10 | % | 3.51 | % | 3.26 | % | 59 | bp | 25 | bp | ||||||||||
|
One month LIBOR at year end |
1.56 | % | 0.77 | % | 0.43 | % | 79 | bp | 34 | bp | ||||||||||
|
Average one month LIBOR |
1.11 | % | 0.50 | % | 0.20 | % | 61 | bp | 30 | bp | ||||||||||
bp = basis point = 1/100th of a percent
All references above to net interest margin and net interest spread exclude the sold portion of certain participation loans from calculations. Such loans remain on Bancorp’s balance sheet as required by US GAAP because Bancorp retains some form of effective control; however, Bancorp receives no interest income on the sold portion of these loans. These participation loans sold are excluded in the calculation of margins, because Bancorp believes it provides a more accurate depiction of the performance of its loan portfolio.
Prime rate, the five year Treasury note rate and the one month LIBOR are included above to provide a general indication of the interest rate environment in which Bancorp operated. Approximately $959 million, or 40%, of Bancorp’s loans are variable rate, of which 97% are indexed to either the prime rate or the one month LIBOR and generally reprice as those rates change. As of December 31, 2017, virtually all variable rate loans with floors have increased to or beyond their floor rates and will reprice at the next index rate change. At inception, most of Bancorp’s fixed rate loans are priced in relation to the five year Treasury note.
Average loan balances increased $143 million or 7% in 2017. The Federal Reserve increased the target federal funds rate three times during the year, and rising interest rates allowed for an increase in loan yields of 9 basis points despite an intensely competitive lending environment. Bancorp grew average interest bearing deposits $76 million or 4%. Average interest costs on interest bearing deposits increased 10 basis points as management increased rates on certain deposit accounts during 2017. Average Federal Home Loan Bank (“FHLB”) advances increased by $4.8 million or 10.7%, with average rates increasing by 22 basis points.
Considering the recent increase in short-term interest rates implemented by the Federal Open Market Committee and with the expectation of additional increases in 2018, management anticipates that net interest margins will increase modestly during the coming year. However, competitive pressures on rates for new loans could result in pressure on the net interest margin for 2018. Approximately 60% of the Company’s loans are fixed-rate loans so future rate increases may begin to benefit this part of the portfolio as existing fixed-rate loans renew and new fixed-rate loans originate at higher rates. The margin could be affected negatively if competition causes further increases in deposit rates or if competitive conditions for loan pricing within Bancorp’s markets prevents the realization of higher fixed rates. Bancorp recognizes that higher rates paid on alternative investments available to customers will eventually force deposit interest rates to increase more quickly and severely than what has been experienced to date.
Asset/Liability Management and Interest Rate Risk
Managing interest rate risk is critical to Bancorp. The primary objective of interest rate risk management is to neutralize effects of interest rate changes on net income. By considering both on and off-balance sheet financial instruments, management evaluates interest rate sensitivity while attempting to optimize net interest income within the constraints of prudent capital adequacy, liquidity needs, market opportunities and customer requirements.
Interest Rate Simulation Sensitivity Analysis
Bancorp uses an earnings simulation model to estimate and evaluate the impact of an immediate change in interest rates on earnings in a one year forecast. The simulation model is designed to reflect dynamics of interest earning assets, interest bearing liabilities and off-balance sheet financial instruments. By estimating effects of interest rate increases and decreases, the model can reveal approximate interest rate risk exposure. This simulation model is used by management to gauge approximate results given a specific change in interest rates at a given point in time. The model is therefore a tool to indicate earnings trends in given interest rate scenarios and may not indicate actual expected results.
The December 31, 2017 simulation analysis, which shows little interest rate sensitivity, indicates that Bancorp is liability sensitive as increases in interest rates of 100 to 200 basis points have a negative effect on net interest income. If rates raise 200 basis points, net interest income would decrease 2.90%. The excess liquidity held in interest bearing deposit accounts and other short-term investments along with variable rate loans now at or above their floors gives Bancorp significant assets that will reprice as rates move. However, expected rate increases on non-maturity deposit accounts result in increased interest expense that would exceed additional interest income earned. Asset balances subject to immediate repricing cause an estimated decline in net interest income in down 100 and 200 basis point rate scenarios as rates on non-maturity deposits cannot be lowered sufficiently to offset declining interest income. These estimates are summarized below.
|
Net interest income % change |
||
|
Increase 200 bp |
(2.90) |
|
|
Increase 100 bp |
(1.46) |
|
|
Decrease 100 bp |
(1.40) |
|
|
Decrease 200 bp |
(4.83) |
Approximately 60% of Bancorp’s loan portfolio has fixed rates and 40% of its loan portfolio is priced at variable rates. With the Prime rate currently at 4.50%, and after the .25% increase in Prime in December 2017, virtually all of Bancorp’s variable rate loans now have interest rates at or above their floors. This effect is captured in the simulation analysis above.
Undesignated derivative instruments described in Note 22 to Bancorp’s consolidated financial statements are recognized on the consolidated balance sheet at fair value, with changes in fair value due to changes in prevailing interest rates, recorded in other non-interest income. Because of matching terms of offsetting contracts, in addition to collateral provisions which mitigate the impact of non-performance risk, changes in fair value subsequent to initial recognition have a minimal effect on earnings, and are therefore not included in the simulation analysis results above.
Derivatives designated as cash flow hedges described in Note 22 to Bancorp’s consolidated financial statements are recognized on the consolidated balance sheet at fair value, with changes in fair value due to changes in prevailing interest rates, recorded net of tax in other comprehensive income.
The following table presents the increases in net interest income due to changes in rate and volume computed on a tax-equivalent basis and indicates how net interest income in 2017 and 2016 was impacted by volume increases and the lower average interest rate environment. Tax-equivalent adjustments are based on a 35% federal tax rate. The change in interest due to both rate and volume has been allocated to the change due to rate and the change due to volume in proportion to the relationship of the absolute dollar amounts of the change in each.
Taxable Equivalent Rate/Volume Analysis
|
2017/2016 |
2016/2015 |
|||||||||||||||||||||||
|
Increase (decrease) |
Increase (decrease) |
|||||||||||||||||||||||
|
due to |
due to |
|||||||||||||||||||||||
|
(In thousands) |
Net change |
Rate |
Volume |
Net change |
Rate |
Volume |
||||||||||||||||||
|
Interest income |
||||||||||||||||||||||||
|
Loans |
$ | 8,081 | $ | 1,851 | $ | 6,230 | $ | 8,321 | $ | (1,804 | ) | $ | 10,125 | |||||||||||
|
Federal funds sold and interest bearing deposits |
839 | 714 | 125 | 228 | 191 | 37 | ||||||||||||||||||
|
Mortgage loans held for sale |
(46 | ) | 24 | (70 | ) | (12 | ) | 10 | (22 | ) | ||||||||||||||
|
Securities |
||||||||||||||||||||||||
|
Taxable |
(86 | ) | 142 | (228 | ) | 331 | (787 | ) | 1,118 | |||||||||||||||
|
Tax-exempt |
(152 | ) | 79 | (231 | ) | 40 | 12 | 28 | ||||||||||||||||
|
Total interest income |
8,636 | 2,810 | 5,826 | 8,908 | (2,378 | ) | 11,286 | |||||||||||||||||
|
Interest expense |
||||||||||||||||||||||||
|
Deposits |
||||||||||||||||||||||||
|
Interest bearing demand deposits |
596 | 540 | 56 | 385 | 171 | 214 | ||||||||||||||||||
|
Savings deposits |
132 | 127 | 5 | 4 | (1 | ) | 5 | |||||||||||||||||
|
Money market deposits |
1,263 | 1,172 | 91 | 172 | 144 | 28 | ||||||||||||||||||
|
Time deposits |
41 | 129 | (88 | ) | (357 | ) | (166 | ) | (191 | ) | ||||||||||||||
|
Securities sold under agreements to repurchase |
(2 | ) | (17 | ) | 15 | (13 | ) | (7 | ) | (6 | ) | |||||||||||||
|
Federal funds purchased and other short-term borrowings |
106 | 117 | (11 | ) | 51 | 33 | 18 | |||||||||||||||||
|
Federal Home Loan Bank advances |
192 | 106 | 86 | (176 | ) | (269 | ) | 93 | ||||||||||||||||
|
Total interest expense |
2,328 | 2,174 | 154 | 66 | (95 | ) | 161 | |||||||||||||||||
|
Net interest income |
$ | 6,308 | $ | 636 | $ | 5,672 | $ | 8,842 | $ | (2,283 | ) | $ | 11,125 | |||||||||||
Bancorp’s tax equivalent net interest income increased $6.3 million for the year ended December 31, 2017 compared with the same period of 2016, while 2016 increased $8.8 million compared with 2015.
As shown in the table above, net interest income for 2017 compared with 2016 was positively impacted, most significantly by an increase in loan volume and to a lesser extent interest rates earned on loans. Investments in federal funds sold and interest bearing deposits volume and rates positively impacted net interest income. Declines in securities volumes, increased rates paid on deposit balances, and to a lesser extent increased rates paid on federal funds purchased, other short-term borrowings, and FHLB advances negatively impacted net interest income. Net interest income for the comparative periods was positively impacted by an increase in the average rate earned on assets, which exceeded the increase in the average rate paid on deposits.
For the year 2016 compared with 2015, net interest income was positively impacted, most significantly by an increase in loan volume and to a lesser extent by securities volume, a more favorable mix of deposits, and a decrease in interest rates of FHLB advances. Net interest income for the comparative periods was negatively impacted by a decline in the average rate earned on assets. The change in average rates on deposits was slight with only a minimal impact on earnings.
Provision for Loan Losses
In determining the provision for loan losses, management considers many factors. Among these are the quality of the loan portfolio, underlying collateral, previous loss experience, the size and composition of the loan portfolio and an assessment of the impact of current economic conditions on borrowers’ ability to pay. The provision for loan losses and resulting ratios are summarized below:
|
(Dollars in thousands) |
2017 |
2016 |
2015 |
|||||||||
|
Provision (credit) for loan losses |
$ | 2,550 | $ | 3,000 | $ | 750 | ||||||
|
Allowance to loans at year end |
1.03 | % | 1.04 | % | 1.10 | % | ||||||
|
Allowance to average loans for year |
1.08 | 1.11 | 1.17 | |||||||||
The provision for loan losses represents a charge to earnings necessary to maintain an allowance for loan losses that, in management’s evaluation, is adequate to provide coverage for inherent losses on outstanding loans. The allowance for loan losses is calculated after considering credit quality factors, and ultimately relies on an overall internal analysis of risk in the loan portfolio. Based on this analysis, the provision for loan losses is determined and recorded. The provision reflects the results of an allowance methodology that is driven by risk ratings, historical losses, specific loan loss allocations, and qualitative factors. The 2017 provision reflected a number of factors, including loan growth and qualitative considerations. Key indicators of loan quality remained consistent with prior years. Bancorp considers the present asset quality metrics to be exceptionally strong. Recognizing the cyclical nature of the lending business, this trend will most likely normalize over the long term. More information on this process can be found in the “Allowance for loan losses” section.
Non-performing loans increased to $7.4 million at December 31, 2017 from $6.7 million at year-end 2016, primarily due to an increase in non-accrual loans. Troubled debt restructurings (TDRs) currently accruing interest, decreased from $974 thousand at December 31, 2016 to $869 thousand at December 31, 2017, declining as a result of payments applied to principal on the four loans involved. The ratio of non-performing loans to total loans was 0.31% at December 31, 2017, compared with 0.29% at December 31, 2016, with both ratios representing historic lows. Another key metric, net charge-offs, totaled 0.07% of average loans for 2017 equaling the 0.07% reported for 2016. See “Financial Condition-Non-performing Loans and Assets” for further discussion of non-performing loans. See “Financial Condition-Summary of Loan Loss Experience” for further discussion of loans charged off during the year.
Bancorp’s loan portfolio is diversified with no significant concentrations of credit. Geographically, most loans are extended to borrowers in the metropolitan areas of Louisville, Indianapolis and Cincinnati. The adequacy of the allowance is monitored on an ongoing basis and it is the opinion of management that the balance of the allowance for loan losses at December 31, 2017 is adequate to absorb probable losses inherent in the loan portfolio as of the financial statement date. See “Financial Condition-Allowance for Loan Losses” for more information on the allowance for loan losses.
Non-Interest Income and Non-Interest Expenses
The following table provides a comparison of components of non-interest income for 2017, 2016 and 2015. Below the table is a discussion of significant changes and trends. To provide more granularity, certain non-interest income and expense amounts have been re-categorized from prior years with the changes reflected in all periods presented.
|
2017/2016 |
2016/2015 |
|||||||||||||||||||||||||||
|
(Dollars in thousands) |
2017 |
2016 |
2015 |
Change |
% |
Change |
% |
|||||||||||||||||||||
|
Wealth management and trust services |
$ | 20,505 | $ | 19,155 | $ | 18,026 | $ | 1,350 | 7.0 |
% |
$ | 1,129 | 6.3 |
% |
||||||||||||||
|
Deposit service charges |
6,461 | 6,253 | 6,010 | 208 | 3.3 | 243 | 4.0 | |||||||||||||||||||||
|
Debit and credit cards |
5,979 | 5,655 | 4,876 | 324 | 5.7 | 779 | 16.0 | |||||||||||||||||||||
|
Treasury management |
4,008 | 3,651 | 3,404 | 357 | 9.8 | 247 | 7.3 | |||||||||||||||||||||
|
Mortgage banking |
3,221 | 3,897 | 3,488 | (676 | ) | (17.3 | ) | 409 | 11.7 | |||||||||||||||||||
|
Loss on sale of securities |
(232 | ) | – | – | (232 | ) | – | – | – | |||||||||||||||||||
|
Investment product sales commissions and fees |
2,200 | 2,145 | 1,994 | 55 | 2.6 | 151 | 7.6 | |||||||||||||||||||||
|
Bank owned life insurance |
1,159 | 871 | 889 | 288 | 33.1 | (18 | ) | (2.0 | ) | |||||||||||||||||||
|
Other |
1,819 | 1,910 | 1,263 | (91 | ) | (4.8 | ) | 647 | 51.2 | |||||||||||||||||||
| $ | 45,120 | $ | 43,537 | $ | 39,950 | $ | 1,583 | 3.6 |
% |
$ | 3,587 | 9.0 |
% |
|||||||||||||||
Wealth Management and Trust
The largest component of non-interest income is wealth management and trust (“WM&T”) revenue. The magnitude of WM&T revenue distinguishes Bancorp from other community banks of similar asset size. Trust assets under management totaled $2.8 billion at December 31, 2017, a 12% increase compared with $2.5 billion at December 31, 2016. Assets under management are stated at market value. WM&T revenue, which constitutes an average of 45% of non-interest income, increased $1.4 million, or 7.0%, for 2017 compared with 2016. The 2017 increase in WM&T revenue was the result of both a rising stock market and a continuance of new clients added. Recurring fees, which generally comprise over 97% of the WM&T revenue, increased $2.3 million, or 13.3%, in 2017, compared with 2016. Recurring fees earned for managing accounts are based on a percentage of market value of the assets under management and are typically assessed on a monthly basis. Some revenues of the WM&T department, most notably executor, insurance, and some employee benefit plan-related fees, are non-recurring in nature and the timing of these revenues corresponds with the related administrative activities, and is also based on the market value of assets under management. Total non-recurring fees decreased $334 thousand for 2017, compared with 2016. Contracts between WM&T and their clients do not permit performance based fees and accordingly, none of the fees earned by WM&T are performance based. Management believes the WM&T department will continue to factor significantly in Bancorp’s financial results and provide strategic diversity to revenue streams. Management is optimistic that the WM&T department will deliver consistent growth in 2018, but notes that increased market volatility could affect near-term results.
The following table provides information regarding assets under management (AUM) by WM&T as of December 31, 2017 and 2016. This table demonstrates that:
|
● |
Approximately 79% of AUM are actively managed. |
|
● |
Corporate retirement plan accounts consist primarily of participant directed assets. |
|
● |
The amount of custody and safekeeping accounts is insignificant, and |
|
● |
The majority of managed assets are in personal trust and investment advisory accounts. |
|
Assets Under Management by Account Type |
December 31, 2017 |
December 31, 2016 |
||||||||||||||
|
(In thousands) |
Managed |
Non-managed (1) |
Managed |
Non-managed (1) |
||||||||||||
|
Personal trust accounts |
$ | 535,931 | $ | 98,358 | $ | 548,132 | $ | 92,880 | ||||||||
|
Personal individual retirement accounts |
350,841 | 7,407 | 306,496 | 8,150 | ||||||||||||
|
Corporate retirement accounts |
54,688 | 400,793 | 52,047 | 355,150 | ||||||||||||
|
Investment advisory accounts |
1,079,569 | 21,213 | 847,587 | 18,356 | ||||||||||||
|
Foundation and endowment accounts |
208,314 | – | 223,741 | – | ||||||||||||
|
Total fiduciary accounts |
$ | 2,229,343 | $ | 527,771 | $ | 1,978,003 | $ | 474,536 | ||||||||
|
Custody and safekeeping accounts |
– | 52,385 | – | 70,872 | ||||||||||||
|
Totals |
$ | 2,229,343 | $ | 580,156 | $ | 1,978,003 | $ | 545,408 | ||||||||
|
Total managed and non-managed assets |
$ | 2,809,499 | $ | 2,523,411 | ||||||||||||
|
(1) Non-managed assets represent those for which WM&T does not have investment discretion. |
The table below presents data regarding WM&T managed assets by class of investment as of December 31, 2017 and 2016. Managed assets are invested in instruments for which market values can be readily determined, the majority of which are sensitive to market fluctuations. This table demonstrates that:
|
● |
Managed assets are invested in instruments for which market values can be readily determined. |
|
● |
The majority of these instruments are sensitive to market fluctuations. |
|
● |
The composition of managed assets is divided approximately 63% in equities and 37% in fixed income, and this composition is relatively consistent from year to year, and |
|
● |
The Bank has no proprietary mutual funds. |
|
Managed Assets by Class of Investment |
||||||||
|
As of December 31, |
||||||||
|
(In thousands) |
2017 |
2016 |
||||||
|
Non-interest bearing deposits |
$ | – | $ | 145 | ||||
|
Interest bearing deposits |
127,237 | 148,751 | ||||||
|
US Treasury and government agency obligations |
43,582 | 39,862 | ||||||
|
State, county and municipal obligations |
135,056 | 120,576 | ||||||
|
Money market mutual funds |
7,811 | 12,908 | ||||||
|
Equity mutual funds |
560,605 | 452,593 | ||||||
|
Other mutual funds - fixed, balanced, and municipal |
304,765 | 300,811 | ||||||
|
Other notes and bonds |
124,380 | 92,338 | ||||||
|
Common and preferred stocks |
843,006 | 708,782 | ||||||
|
Real estate mortgages |
369 | 388 | ||||||
|
Real estate |
49,344 | 45,502 | ||||||
|
Other miscellaneous assets (1) |
33,188 | 55,347 | ||||||
|
Total managed assets |
$ | 2,229,343 | $ | 1,978,003 | ||||
|
(1) Includes rights, warrants, annuities, insurance policies, unit investment trusts, and oil and gas rights. |
||||||||
The table below provides information regarding fee income earned by Bancorp’s WM&T department for the years ended December 31, 2017, 2016 and 2015. It demonstrates that WM&T fee revenue is earned most significantly from personal trust and investment advisory accounts. Fees are based on AUM and tailored for individual accounts and/or relationships. WM&T uses a fee structure that considers and tailors based on type of account and other factors. For example, fee structures are in place for investment management, irrevocable trusts, revocable trusts, IRA accounts, and accounts holding only fixed income securities. There are also fee structures for estate settlements, which are non-recurring, and retirement plan services which typically consist of a one-time conversion fee with recurring AUM fees to follow. All fees are based on the market value of each account and are tiered based on account size, with larger relationships paying a lower percentage of AUM in fees. Fees are agreed upon at the time the account is opened and these and any subsequent revisions are communicated in writing to the customer. Fees earned are not performance based nor are they based on investment strategy or transactions.
|
Wealth Management and Trust Services Income |
||||||||||||
|
Years Ended December 31, |
||||||||||||
|
(In thousands) |
2017 |
2016 |
2015 |
|||||||||
|
Personal trust accounts |
$ | 7,285 | $ | 7,142 | $ | 6,825 | ||||||
|
Personal individual retirement accounts |
4,829 | 4,649 | 4,339 | |||||||||
|
Corporate retirement accounts |
2 | 3 | 3 | |||||||||
|
Investment advisory accounts |
7,464 | 6,521 | 6,087 | |||||||||
|
Foundation and endowment accounts |
540 | 491 | 433 | |||||||||
|
Custody and safekeeping accounts |
152 | 104 | 90 | |||||||||
|
Brokerage and insurance services |
40 | 45 | 132 | |||||||||
|
Other |
193 | 200 | 117 | |||||||||
|
Total |
$ | 20,505 | $ | 19,155 | $ | 18,026 | ||||||
Other Non-interest Income
Deposit service charges increased $208 thousand, or 3.3%, for 2017 compared with 2016. Service charge income is driven by transaction volume, which can fluctuate throughout the year. The increases for 2017 are primarily due to the introduction of a new checking account in the third quarter of 2016. This product provides ancillary services to customers, while carrying a monthly service charge. Fees earned on this product in 2017 totaled $846 thousand compared with $440 thousand in 2016. Another significant component of service charges is related to fees earned on checking account overdrafts, which declined $145 thousand in 2017 compared with 2016. Management expects this source of revenue to slowly decline due to anticipated changes in customer behavior, including reduced check volume, and ongoing regulatory restrictions.
Deposit service charges increased $243 thousand, or 4.0%, for 2016 compared with 2015. The increase for 2016 was primarily due to the introduction of the new checking account product introduced during the year as referenced above.
Debit and credit card revenue increased $324 thousand, or 5.7%, for 2017 compared with 2016. Bankcard revenue primarily represents income the Bank derives from customers’ use of debit and credit cards. The increase in 2017 reflected volume resulting from commercial credit cards, as this product is still in its early development at the Company. Volume, which is dependent on customer behavior and new accounts, is expected to continue to increase. In contrast, interchange income is based on rates set by service providers in a competitive market. Bancorp expects a slight decrease in interchange rates as service providers gravitate to lower cost options within the market.
Debit and credit card revenue increased $779 thousand or 16.0% in 2016 compared with 2015 due largely to increased volume resulting from newly offered commercial credit cards.
Treasury management revenue primarily consists of fees earned for cash management services provided to commercial customers. This category has been a growing source of revenue for Bancorp including an increase in 2017 of $357 thousand or 9.8% compared with 2016. Treasury management revenue increased $247 thousand or 7.3% in 2016 compared with 2015. Bancorp expects this category to continue to grow in 2018 at a pace comparable to 2017 due to an expanding customer base and as more existing customers take advantage of offered services.
Mortgage banking revenue primarily includes gains on sales of mortgage loans. Bancorp’s mortgage banking department originates residential mortgage loans to be sold in the secondary market. Interest rates on loans sold are locked with the investor prior to closing the loans, thus Bancorp bears no interest rate risk related to these loans. The department offers conventional, VA and FHA financing, for purchases and refinances, as well as programs for first-time home buyers. Interest rates on mortgage loans directly impact the volume of business transacted by the mortgage banking division. Mortgage banking revenue decreased $676 thousand, or 17.3%, in 2017 compared with 2016 after having increased $409 thousand or 11.7% in 2016 compared with 2015. In Bancorp’s primary market of Louisville, Kentucky, the housing inventory was low, contributing to this decline. As interest rates have risen, Bancorp has also experienced a slowing of refinancing activity.
In 2017, Bancorp sold an equity security realizing a loss of $263 thousand. One security was called prior to maturity in 2017 resulting in the receipt of a $31 thousand pre-payment penalty. The penalty income was classified as a realized gain on the call of available for sale securities. In 2016, Bancorp did not sell any securities. In 2015, Bancorp sold securities with total fair market value of $5.9 million, generating no gain or loss. These securities consisted of agency and mortgage-backed securities with small remaining balances. Management has the intent and ability to hold all remaining investment securities available-for-sale for the foreseeable future.
Investment product sales commissions and fees increased $55 thousand, or 2.6% in 2017 despite Department of Labor regulations that resulted in fee restructuring, and in many cases reductions, for many types of investment products. Investment product sales commissions increased $151 thousand or 7.6% in 2016, corresponding to overall brokerage volume. Investment products commissions and fees consist primarily of stock, bond and mutual fund sales as well as wrap fees on accounts. Wrap fees are charges for investment programs that bundle together a suite of services, such as brokerage, advisory, research and management, and are based on a percentage of assets. Bancorp deploys its brokers primarily through its branch network via an arrangement with a third party broker-dealer, while larger managed accounts are serviced in the Bank’s WM&T department.
Income related to bank-owned life insurance (“BOLI”) increased to $1.2 million in 2017 compared with $871 thousand for 2016. The increase is attributable to receipt of a $348 thousand death benefit during 2017. BOLI income decreased $18 thousand or 2% in 2016 compared with 2015. BOLI assets represent the cash surrender value of life insurance policies on certain key employees who have provided consent for Bancorp to be the beneficiary of a portion of such policies. The related change in cash surrender value and any death benefits received under the policies are recorded as non-interest income. This income helps offset the cost of various employee benefits.
Other non-interest income decreased $91 thousand, or 4.8%, during 2017 compared with 2016. Included in this category is swap fee income, which totaled $227 thousand and $527 thousand for 2017 and 2016, respectively. Opportunities to earn swap fee income are sporadic due to the specialized nature of the transactions. Somewhat offsetting the swap fee income decline in 2017 was additional income related to the exit of a tax credit partnership totaling $154 thousand. 2016 other non-interest income increased $647 thousand in 2016 compared with 2015. Swap fees in 2015 were down $467 thousand compared with 2016. This category contains a variety of other income sources, none of which resulted in individually significant variances in either comparison.
Non-interest expenses
The following table provides a comparison of components of non-interest expenses for 2017, 2016 and 2015. Below the table is a discussion of significant changes and trends.
|
2017/2016 |
2016/2015 |
|||||||||||||||||||||||||||
|
(Dollars in thousands) |
2017 |
2016 |
2015 |
Change |
% |
Change |
% |
|||||||||||||||||||||
|
Compensation |
$ | 42,584 | $ | 40,817 | $ | 36,597 | $ | 1,767 | 4.3 | % | $ | 4,220 | 11.5 | % | ||||||||||||||
|
Employee benefits |
9,987 | 8,368 | 8,112 | 1,619 | 19.3 | 256 | 3.2 | |||||||||||||||||||||
|
Net occupancy and equipment |
7,393 | 7,422 | 6,986 | (29 | ) | (0.4 | ) | 436 | 6.2 | |||||||||||||||||||
|
Technology and communications |
8,525 | 7,619 | 6,891 | 906 | 11.9 | 728 | 10.6 | |||||||||||||||||||||
|
Marketing and business development |
2,716 | 2,464 | 2,579 | 252 | 10.2 | (115 | ) | (4.5 | ) | |||||||||||||||||||
|
Postage, printing and supplies |
1,475 | 1,521 | 1,436 | (46 | ) | (3.0 | ) | 85 | 5.9 | |||||||||||||||||||
|
Legal and professional |
2,393 | 1,869 | 1,832 | 524 | 28.0 | 37 | 2.0 | |||||||||||||||||||||
|
FDIC insurance |
960 | 1,181 | 1,258 | (221 | ) | (18.7 | ) | (77 | ) | (6.1 | ) | |||||||||||||||||
|
Amortization/impairment of investment in tax credit partnerships |
7,124 | 4,458 | 634 | 2,666 | 59.8 | 3,824 | 603.2 | |||||||||||||||||||||
|
Capital and deposits based taxes |
3,440 | 2,800 | 2,413 | 640 | 22.9 | 387 | 16.0 | |||||||||||||||||||||
|
Other |
4,394 | 3,001 | 4,660 | 1,393 | 46.4 | (1,659 | ) | (35.6 | ) | |||||||||||||||||||
| $ | 90,991 | $ | 81,520 | $ | 73,398 | $ | 9,471 | 11.6 | % | $ | 8,122 | 11.1 | % | |||||||||||||||
Compensation, which includes salaries, incentives, bonuses, and share based compensation, increased $1.8 million in 2017 compared with 2016. Much of the increase reflected a full year’s impact in 2017 from the addition of personnel associated with growth and operational support during 2016. At December 31, 2017, Bancorp had 580 full-time equivalent employees compared with 578 at December 31, 2016 and 555 at December 31, 2015. The increase from 2015 to 2016 was due to adding personnel associated with growth and operational support and higher incentive compensation related to accelerating loan and earnings growth.
Employee benefits consists of all personnel related expense not included in compensation, with the two most significant items being health insurance and payroll taxes. Employee benefits increased $1.6 million or 19.3% in 2017 compared with 2016, primarily due to increased health insurance costs year over year of $1.4 million. Bancorp is self-insured, and health insurance costs fluctuate based on levels of claims. The increase in employee benefits in 2016 compared with 2015 was due primarily to an increase in retirement plan costs.
Net occupancy and equipment expense decreased $29 thousand, or 0.4%, from 2017 to 2016 with no one factor driving the variance. 2016 expense increased $436 thousand or 6.2% compared with 2015 largely due to higher rent and depreciation for locations added during 2015 and increased maintenance costs company-wide. At December 31, 2017, Bancorp had 37 banking center locations, including the main office, and a separate operations center. Costs of capital asset additions flow through the statement of income over the lives of the assets in the form of depreciation expense.
Technology and communications expenses increased $906 thousand, or 11.9%, from 2016 to 2017, largely due to increases in computer system improvements. This category includes computer software amortization, equipment depreciation, and expenditures related to investments in new technology needed to maintain and improve the quality of customer delivery channels and internal resources. 2016 expense increased $728 thousand or 10.6% compared with 2015 largely due to increases in computer maintenance and repair costs resulting from system improvements and expenses related to the issuance and processing of business credit cards.
Marketing and business development expenses include all costs associated with promoting Bancorp, community investment, retaining customers and acquiring new business. Category expense increased $252 thousand or 10.2% in 2017 compared with 2016, due largely to an increase in community donations within Bancorp’s market areas offset somewhat by decreased advertising expense. 2016 expense compared with 2015 decreased $115 thousand or 4.5% due to lower advertising costs and community donations.
Postage, printing and supplies expenses decreased $46 thousand or 3.0% in 2017 compared with 2016. The decline year over year was comprised of numerous items, none of which were individually significant. 2016 expense increased $85 thousand or 5.9% compared with 2015. The increase was largely due to increased printing costs associated with outsourcing statement printing and mailing services.
Legal and professional fees increased $524 thousand to $2.4 million in 2017 from $1.9 million in 2016. Legal fees increased $174 thousand or 34% in 2017 compared with 2016 primarily due to increased litigation costs arising through the normal course of business. Professional and consulting fees increased $350 thousand or 26.5% due to increased fees associated with out-sourcing assistance for loan review and tax services. Legal and professional fees increased $37 thousand or 2% in 2016 compared with 2015 with no one factor driving the variance.
FDIC insurance expense decreased $221 thousand, or 18.7% for the year ended December 31, 2017, as compared with the same period in 2016. The assessment is calculated by the FDIC on a quarterly basis, and the decline in expense is due primarily to a change in assessment methodology. During 2016, the FDIC revised the assessment criteria to more closely align FDIC assessments with each financial institution’s risks. Bancorp benefited from this change which resulted in 2016 expense decreasing $77 thousand or 6.1% compared with 2015.
Capital and deposit based taxes increased $640 thousand or 22.9%, and $387 thousand or 16% in 2017 and 2016, respectively. The 2017 increase was largely due to increased capital-based franchise tax, while the 2016 increase was primarily due to increased city and county deposit based taxes as deposits grew across Bancorp’s markets.
Amortization/impairment of investments in tax credit partnership increased $2.7 million for the year ended December 31, 2017 compared with the same period of 2016. The 2016 expense represented a $3.8 million increase compared with 2015. These partnerships generate federal income tax credits. The amounts of credits and corresponding expenses can vary widely depending upon the timing and magnitude of investments. For each of Bancorp’s investments in tax credit partnerships, the tax benefit compared to related expenses results in a positive effect on net income. See the Income Taxes section below for details on these credits and expenses.
Other non-interest expenses increased $1.4 million, or 46.4% for the year ended December 31, 2017 compared with the same period of 2016. Significant items impacting the variance consist of the following:
|
● |
A recovery of $588 thousand in 2016 of a 2008 impairment loss. In 2004, Bancorp invested in Indiana Business Bancorp (“IBB”). Due to a decline in the market value of the stock, Bancorp recorded an impairment charge in 2008. In April 2016, IBB entered into an agreement to be acquired. The transaction was completed in October 2016, resulting in the $588 thousand pre-tax recovery, which was recorded in other expense in the fourth quarter of 2016. |
|
● |
A decrease of $370 thousand on gains from the sale of repossessed assets as 2017 net gains totaled $39 thousand compared with $409 thousand in 2016. |
|
● |
A $266 thousand liability accrual in 2017 related to an estimated loss from certain administrative proceedings arising in the course of our business. |
|
● |
Expenses associated with the services offered on a new checking account product increased $137 thousand in 2017 over 2016. |
|
● |
Losses on debit cards and check loss increased $165 thousand in 2017 compared with 2016. |
|
● |
These decreases were partially offset by reduced losses on the sale of other assets in 2017 as compared with 2016. |
Other non-interest expenses decreased $1.7 million, or 35.6% for the year ended December 31, 2016 compared with the same period of 2015. Significant items impacting the variance consisting of the following:
|
● |
A recovery of $588 thousand in 2016 of a 2008 impairment loss. In 2004, Bancorp invested in Indiana Business Bancorp (“IBB”). Due to a decline in the market value of the stock, Bancorp recorded an impairment charge in 2008. In April 2016, IBB entered into an agreement to be acquired. The transaction was completed in October 2016, resulting in the $588 thousand pre-tax recovery, which was recorded in other expense in the fourth quarter of 2016. |
|
● |
A decrease in the provision expense for estimated losses on unfunded commitments; expense of $432 thousand for 2015 as compared to a net reduction of $82 thousand in 2016. |
|
● |
A decrease of $366 thousand in amortization expense for mortgage servicing rights, 2016 compared to 2015, as pools of MSRs added several years ago were fully amortized in 2015. |
Bancorp’s efficiency ratio for 2017 of 60.9% increased from 57.6% in 2016. Excluding the amortization of the investments in tax credit partnerships, the adjusted efficiency ratio, a non-GAAP measure, would have been 56.1% and 54.4% for 2017 and 2016, respectively. See the Non-GAAP Financial Measures section for details on reconcilement to US GAAP measures.
Income Taxes
A three year comparison of income tax expense and effective tax rate follows:
|
(Dollars in thousands) |
2017 |
2016 |
2015 |
|||||||||
|
Income tax expense |
$ | 17,139 | $ | 15,244 | $ | 16,933 | ||||||
|
Effective tax rate |
31.06 | % | 27.1 | % | 31.3 | % | ||||||
The increase in the effective tax rate, 2016 to 2017, is the result of the non-cash charge of $5.9 million resulting from tax reform offset partially by higher utilization of federal income tax credits in 2017. Bancorp invests in certain partnerships that yield federal income tax credits. For each of Bancorp’s investments in tax credit partnerships the tax benefit compared to related expenses results in a positive effect on net income. Also partially offsetting the effect of the tax reform related charge was the adoption of ASU 2016-09 “Compensation – Stock Compensation Improvements to Employee Share-Based Payment Accounting”. The new standard requires excess tax benefits and deficiencies related to share-based payment awards to be reflected in the statement of operations as a component of the provision for income taxes. For 2017 Bancorp recorded a benefit of $1.5 million for such excess benefits against the provision for income tax expense. Prior to adoption of ASU 2016-09, these tax benefits were recorded directly to additional paid-in capital. Tax benefits recorded to capital for 2016 and 2015 were $1.7 million and $673 thousand, respectively.
The decrease in the effective tax rate from 2015 to 2016 was largely the result of higher utilization of federal income tax credits in 2016. For more information regarding income taxes and the effective tax rate see Note 8 to Bancorp’s consolidated financial statements.
Financial Condition
Earning Assets and Interest Bearing Liabilities
Summary information with regard to Bancorp’s financial condition follows:
|
2017/2016 |
2016/2015 |
|||||||||||||||||||||||||||
|
(Dollars in thousands) |
2017 |
2016 |
2015 |
Change |
% |
Change |
% |
|||||||||||||||||||||
|
Average earning assets |
$ | 2,872,717 | $ | 2,730,949 | $ | 2,430,400 | $ | 141,768 | 5.2 | % | $ | 300,549 | 12.4 | % | ||||||||||||||
|
Average interest bearing liabilities |
1,980,873 | 1,895,258 | 1,715,584 | 85,615 | 4.3 | 179,674 | 10.5 | |||||||||||||||||||||
|
Average total assets |
3,037,581 | 2,886,396 | 2,573,901 | 151,185 | 5.0 | 312,495 | 12.1 | |||||||||||||||||||||
|
Total year end assets |
3,239,646 | 3,039,481 | 2,816,801 | 200,165 | 6.2 | 222,680 | 7.9 | |||||||||||||||||||||
Bancorp continues to experience growth in earning assets primarily in the area of loans. From 2016 to 2017, average loans increased 6.7%, or $143.3 million, compared with 12.3% or $235.2 million from 2015 to 2016. Growth has been all organic as each of Bancorp’s three markets continued to participate in accelerated loan production and net loan growth. Bancorp was able to achieve 4.5% annual loan growth in 2017 despite elevated levels of commercial real estate (CRE) loan payoffs, resulting from borrowers moving elsewhere for permanent financing and CRE loans for which collateral was sold. These repayments were largely anticipated. Loan growth during 2017 reflected ongoing expansion in key lending categories such as commercial and industrial lending and non-owner occupied commercial real estate lending. Bancorp has remained well under regulatory guidelines for commercial investment real estate. Utilization rates on lines of credit excluding construction loans were 52%, 51% and 49% as of December 31 2017, 2016 and 2015, respectively. Somewhat offsetting loan growth, average securities available-for-sale decreased $21.0 million, or 4.37% from 2016 to 2017, compared with increasing $55.2 million, or 13.0% from 2015 to 2016. In anticipation of loan growth, management did not replace maturing securities.
The increase in average interest bearing liabilities from 2016 to 2017 occurred primarily in demand deposits and money market deposit accounts (MMDAs) as customers continued to have excess cash balances and few short-term investment alternatives in the current rate environment. Average total interest bearing deposit accounts increased 4.3% and non-interest bearing deposit accounts increased 5.2% in 2017. Time deposits decreased 5.9% or $14.8 million in 2017 as compared with 11.2% or $31.9 million in 2016, as Bancorp intentionally did not renew higher cost deposits. Bancorp continued to utilize fixed rate advances from the FHLB during 2017 as these rates compared favorably to similar term time deposits. Bancorp had an average of $50.3 million in outstanding FHLB advances in 2017 compared with $45.5 million and $41.0 million in 2016 and 2015, respectively. Securities sold under agreement to repurchase averaged $70.1 million in 2017 compared with $62.7 million in 2016. Securities sold under agreements to repurchase represent excess funds from certain commercial customers as part of a cash management service.
At December 31, 2017, Bancorp had excess cash balances resulting from seasonal deposits of approximately $100 million. These funds are invested in short-term investments, as deposit balances are expected to return to normal levels during the first two quarters of 2018. While these accounts are profitable, the excess investment is expected to have a negative effect on net interest margin for the first six months of 2018 since short term rates are significantly lower than rates for longer term earning assets.
Average Balances and Interest Rates – Taxable Equivalent Basis
|
Year 2017 |
Year 2016 |
Year 2015 |
||||||||||||||||||||||||||||||||||
|
(Dollars in thousands) |
Average balances |
Interest |
Average rate |
Average balances |
Interest |
Average rate |
Average balances |
Interest |
Average rate |
|||||||||||||||||||||||||||
|
Earning assets |
||||||||||||||||||||||||||||||||||||
|
Federal funds sold and interest bearing due from banks |
$ | 113,088 | $ | 1,330 | 1.18 | % | $ | 92,994 | $ | 491 | 0.53 | % | $ | 82,405 | $ | 263 | 0.32 | % | ||||||||||||||||||
|
Mortgage loans held for sale |
3,545 | 191 | 5.39 | 4,881 | 237 | 4.86 | 5,345 | 249 | 4.66 | |||||||||||||||||||||||||||
|
Securities |
||||||||||||||||||||||||||||||||||||
|
Taxable |
406,342 | 8,030 | 1.98 | 419,422 | 8,197 | 1.95 | 365,188 | 7,867 | 2.15 | |||||||||||||||||||||||||||
|
Tax-exempt |
52,614 | 1,558 | 2.96 | 60,516 | 1,710 | 2.83 | 59,535 | 1,670 | 2.81 | |||||||||||||||||||||||||||
|
FHLB stock and other securities |
7,016 | 335 | 4.77 | 6,347 | 254 | 4.00 | 6,347 | 253 | 3.99 | |||||||||||||||||||||||||||
|
Loans, net of unearned income |
2,290,112 | 100,198 | 4.38 | 2,146,789 | 92,117 | 4.29 | 1,911,580 | 83,796 | 4.38 | |||||||||||||||||||||||||||
|
Total earning assets |
2,872,717 | 111,642 | 3.89 | % | 2,730,949 | 103,006 | 3.77 | % | 2,430,400 | 94,098 | 3.87 | % | ||||||||||||||||||||||||
|
Less allowance for loan losses |
24,974 | 23,454 | 23,827 | |||||||||||||||||||||||||||||||||
| 2,847,743 | 2,707,495 | 2,406,573 | ||||||||||||||||||||||||||||||||||
|
Non-earning assets |
||||||||||||||||||||||||||||||||||||
|
Cash and due from banks |
41,621 | 41,043 | 38,952 | |||||||||||||||||||||||||||||||||
|
Premises and equipment |
41,793 | 41,813 | 39,957 | |||||||||||||||||||||||||||||||||
|
All other assets |
106,424 | 96,045 | 88,419 | |||||||||||||||||||||||||||||||||
|
Total assets |
$ | 3,037,581 | $ | 2,886,396 | $ | 2,573,901 | ||||||||||||||||||||||||||||||
|
Interest bearing liabilities |
||||||||||||||||||||||||||||||||||||
|
Deposits |
||||||||||||||||||||||||||||||||||||
|
Interest bearing demand deposits |
$ | 757,023 | $ | 1,574 | 0.21 | % | $ | 717,800 | $ | 978 | 0.14 | % | $ | 545,158 | $ | 593 | 0.11 | % | ||||||||||||||||||
|
Savings deposits |
148,510 | 179 | 0.12 | 135,051 | 47 | 0.03 | 119,821 | 43 | 0.04 | |||||||||||||||||||||||||||
|
Money market deposits |
697,182 | 2,740 | 0.39 | 658,837 | 1,477 | 0.22 | 645,215 | 1,305 | 0.20 | |||||||||||||||||||||||||||
|
Time deposits |
237,368 | 1,482 | 0.62 | 252,170 | 1,441 | 0.57 | 284,062 | 1,798 | 0.63 | |||||||||||||||||||||||||||
|
Securities sold under agreements to repurchase |
70,187 | 134 | 0.19 | 62,670 | 136 | 0.22 | 65,140 | 149 | 0.23 | |||||||||||||||||||||||||||
|
Federal funds purchased and other short-term borrowings |
20,303 | 182 | 0.90 | 23,275 | 76 | 0.33 | 15,147 | 25 | 0.17 | |||||||||||||||||||||||||||
|
FHLB advances |
50,300 | 955 | 1.90 | 45,455 | 763 | 1.68 | 41,041 | 939 | 2.29 | |||||||||||||||||||||||||||
|
Total interest bearing liabilities |
1,980,873 | 7,246 | 0.37 | % | 1,895,258 | 4,918 | 0.26 | % | 1,715,584 | 4,852 | 0.28 | % | ||||||||||||||||||||||||
|
Non-interest bearing liabilities |
||||||||||||||||||||||||||||||||||||
|
Non-interest bearing demand deposits |
684,044 | 650,036 | 558,185 | |||||||||||||||||||||||||||||||||
|
Accrued interest payable and other liabilities |
44,866 | 36,951 | 25,681 | |||||||||||||||||||||||||||||||||
|
Total liabilities |
2,709,783 | 2,582,245 | 2,299,450 | |||||||||||||||||||||||||||||||||
|
Stockholders’ equity |
327,798 | 304,151 | 274,451 | |||||||||||||||||||||||||||||||||
|
Total liabilities and stockholders’ equity |
$ | 3,037,581 | $ | 2,886,396 | $ | 2,573,901 | ||||||||||||||||||||||||||||||
|
Net interest income |
$ | 104,396 | $ | 98,088 | $ | 89,246 | ||||||||||||||||||||||||||||||
|
Net interest spread |
3.52 | % | 3.51 | % | 3.59 | % | ||||||||||||||||||||||||||||||
|
Net interest margin |
3.63 | % | 3.59 | % | 3.67 | % | ||||||||||||||||||||||||||||||
Notes:
|
● |
Yields on municipal securities have been computed on a fully tax-equivalent basis using a federal income tax rate of 35%. |
|
● |
The approximate tax-equivalent adjustments to interest income were $794,000, $834,000 and $928,000 for the years ended December 31, 2017, 2016 and 2015, respectively. |
|
● |
Average balances for loans include the principal balance of non-accrual loans and exclude participation loans accounted for as secured borrowings. The average balance of these participation loans totaled $18,744,000, $12,364,000 and $7,621,000 for the years ended December 31, 2017, 2016 and 2015. |
|
● |
Loan interest income includes loan fees and is computed on a fully tax-equivalent basis using the federal income tax rate of 35%. Loan fees, net of deferred costs, included in interest income amounted to $1,013,000, $1,367,000 and $843,000 in 2017, 2016 and 2015, respectively. |
Securities
The primary purpose of the securities portfolio is to provide another source of interest income, as well as liquidity management. In managing the composition of the balance sheet, Bancorp seeks a balance between earnings sources and credit and liquidity considerations.
Securities available-for-sale include securities that may be sold in response to changes in interest rates, resultant prepayment risk and other factors related to interest rate and prepayment risk changes. Securities available-for-sale are carried at fair value with unrealized gains or losses, net of tax effect, included in stockholders’ equity.
All of Bancorp’s securities are available for sale. The carrying value is summarized as follows:
|
December 31 |
||||||||
|
(In thousands) |
2017 |
2016 |
||||||
|
U.S. Treasury obligations |
$ | 149,984 | $ | 74,998 | ||||
|
Government sponsored enterprise obligations |
213,844 | 268,090 | ||||||
|
Mortgage-backed securities – government agencies |
161,507 | 168,843 | ||||||
|
Obligations of states and political subdivisions |
49,189 | 57,444 | ||||||
|
Corporate equity securities |
– | 699 | ||||||
| $ | 574,524 | $ | 570,074 | |||||
Corporate equity securities in 2016 consisted of common stock in a publicly-traded small business investment company. Bancorp sold the security in 2017.
The maturity distribution and weighted average interest rates of debt securities available-for-sale at December 31, 2017 are as follows:
|
Within one year |
After one but within five years |
After five but within ten years |
After ten years |
|||||||||||||||||||||||||||||
|
(Dollars in thousands) |
Amount |
Rate |
Amount |
Rate |
Amount |
Rate |
Amount |
Rate |
||||||||||||||||||||||||
|
U.S. Treasury Obligations |
$ | 149,984 | 0.98 |
% |
$ | – | – |
% |
$ | – | – |
% |
$ | – | – |
% |
||||||||||||||||
|
Government sponsored enterprise obligations |
26,086 | 1.53 | 65,258 | 1.5 | 7,387 | 2.07 | 115,114 | 2.61 | ||||||||||||||||||||||||
|
Mortgage-backed securities – government agencies |
– | – | 9,842 | 1.83 | 41,584 | 1.96 | 110,081 | 2.31 | ||||||||||||||||||||||||
|
Obligations of states and political subdivisions |
11,705 | 1.69 | 31,183 | 2.36 | 6,300 | 1.73 | – | – | ||||||||||||||||||||||||
| $ | 187,775 | 1.10 |
% |
$ | 106,283 | 1.78 |
% |
$ | 55,271 | 1.95 |
% |
$ | 225,195 | 2.46 |
% |
|||||||||||||||||
U.S. Treasury securities totaling $150 million consisted of short-term treasury bills, which matured in January 2017 and were purchased in the fourth quarter of 2017 as a tax reduction strategy. In this regard, Bancorp typically purchases $150 million in short term securities over each quarter end.
Actual maturities for mortgage-backed securities may differ from contractual maturities due to prepayments on underlying collateral.
Loan Portfolio
Bancorp’s primary source of income is interest on loans. The composition of loans as of December 31 for each of the last five years follows:
|
(In thousands) |
2017 |
2016 |
2015 |
2014 |
2013 |
|||||||||||||||
|
Commercial and industrial |
$ | 779,014 | $ | 736,841 | $ | 644,398 | $ | 571,754 | $ | 510,739 | ||||||||||
|
Construction and development, excluding undeveloped land |
195,912 | 192,348 | 134,482 | 95,733 | 99,719 | |||||||||||||||
|
Undeveloped land (1) |
18,988 | 21,496 | 21,185 | 21,268 | 29,871 | |||||||||||||||
|
Real estate mortgage: |
||||||||||||||||||||
|
Commercial investment |
594,902 | 538,886 | 436,989 | 448,567 | 405,554 | |||||||||||||||
|
Owner Occupied commercial |
398,685 | 408,292 | 420,666 | 380,237 | 353,915 | |||||||||||||||
|
1-4 family residential |
262,110 | 249,498 | 226,575 | 211,548 | 183,700 | |||||||||||||||
|
Home equity - first lien |
57,110 | 55,325 | 50,115 | 43,779 | 40,251 | |||||||||||||||
|
Home equity - junior lien |
63,981 | 67,519 | 63,066 | 66,268 | 63,403 | |||||||||||||||
|
Subtotal: Real estate mortgage |
1,376,788 | 1,319,520 | 1,197,411 | 1,150,399 | 1,046,823 | |||||||||||||||
|
Consumer |
38,868 | 35,170 | 35,531 | 29,396 | 34,198 | |||||||||||||||
|
Total loans |
$ | 2,409,570 | $ | 2,305,375 | $ | 2,033,007 | $ | 1,868,550 | $ | 1,721,350 | ||||||||||
|
(1) |
Undeveloped land consists of land acquired for development by the borrower, but for which no development has yet taken place. |
Bancorp’s loan portfolio increased $104 million, or 4.5%, during 2017 as a result of near-record loan production and stable utilization of available lines of credit challenged by elevated levels of prepayments and payoffs.
Bancorp occasionally enters into loan participation agreements with other banks to diversify credit risk. For certain sold participation loans, Bancorp has retained effective control of the loans, typically by restricting the participating institutions from pledging or selling their share of the loan without permission from Bancorp. US GAAP requires the participated portion of these loans to be recorded as secured borrowings. These participated loans are included in commercial and industrial and real estate mortgage loan totals above, and a corresponding liability is recorded in other liabilities. At December 31, 2017 and 2016, total participated portions of loans of this nature were $18.2 million and $15.8 million respectively.
The following tables detail amounts of loans at December 31, 2017 which, based on remaining scheduled repayments of principal, are due in the periods indicated. Also shown are commercial and industrial loans due after one year and construction, development and undeveloped land loans due after one year, classified according to sensitivity to changes in interest rates.
|
Maturing |
||||||||||||||||
|
(In thousands) |
Within one year |
After one but within five years |
After five years |
Total |
||||||||||||
|
Commercial and industrial |
$ | 312,331 | $ | 293,718 | $ | 172,965 | $ | 779,014 | ||||||||
|
Construction and development including undeveloped land |
66,086 | 95,814 | 53,000 | 214,900 | ||||||||||||
|
Real estate mortgage |
184,861 | 647,296 | 544,631 | 1,376,788 | ||||||||||||
|
Consumer |
23,159 | 15,514 | 195 | 38,868 | ||||||||||||
|
Total loans |
$ | 586,437 | $ | 1,052,342 | $ | 770,791 | $ | 2,409,570 | ||||||||
|
Commercial and industrial loans due after one year |
Interest sensitivity |
|||||||
|
(In thousands) |
Fixed rate |
Variable rate |
||||||
|
Due after one but within five years |
$ | 168,696 | $ | 125,022 | ||||
|
Due after five years |
68,633 | 104,332 | ||||||
| $ | 237,329 | $ | 229,354 | |||||
|
Construction and development including undeveloped land due after one year |
Interest sensitivity |
|||||||
|
(In thousands) |
Fixed rate |
Variable rate |
||||||
|
Due after one but within five years |
$ | 23,101 | $ | 72,713 | ||||
|
Due after five years |
6,037 | 46,963 | ||||||
| $ | 29,138 | $ | 119,676 | |||||
To limit interest rate sensitivity on commercial and commercial real estate loans, whenever possible, Bancorp seeks to structure loans with maturity dates longer than five years with a rate adjustment occurring no longer than five years from origination date.
Non-performing Loans and Assets
Information summarizing non-performing assets, including non-accrual loans follows:
|
December 31 |
||||||||||||||||||||
|
(Dollars in thousands) |
2017 |
2016 |
2015 |
2014 |
2013 |
|||||||||||||||
|
Non-accrual loans (1) |
$ | 6,511 | $ | 5,295 | $ | 7,693 | $ | 5,199 | $ | 15,258 | ||||||||||
|
Troubled debt restructurings (TDRs) |
869 | 974 | 1,060 | 6,352 | 7,249 | |||||||||||||||
|
Loans past due 90 days or more and still accruing |
2 | 438 | 176 | 329 | 437 | |||||||||||||||
|
Non-performing loans |
7,382 | 6,707 | 8,929 | 11,880 | 22,944 | |||||||||||||||
|
Foreclosed property |
2,640 | 5,033 | 4,541 | 5,977 | 5,592 | |||||||||||||||
|
Non-performing assets |
$ | 10,022 | $ | 11,740 | $ | 13,470 | $ | 17,857 | $ | 28,536 | ||||||||||
|
Non-performing loans as a percentage of total loans |
0.31 | % | 0.29 | % | 0.44 | % | 0.64 | % | 1.33 | % | ||||||||||
|
Non-performing assets as a percentage of total assets |
0.31 | % | 0.39 | % | 0.48 | % | 0.70 | % | 1.19 | % | ||||||||||
|
Allowance for loan loss as a percentage of non- performing loans |
337 | % | 358 | % | 251 | % | 210 | % | 124 | % | ||||||||||
|
(1) Includes TDRs previously accruing of: |
$ | – | $ | – | $ | 400 | $ | – | $ | – | ||||||||||
At December 31, 2017, loans accounted for as TDRs included modifications from original terms such as those due to bankruptcy proceedings, certain changes to amortization periods or extended suspension of principal payments due to customer financial difficulties. To the extent that Bancorp chooses to work with borrowers by providing reasonable concessions rather than initiating collection, this would result in an increase in loans accounted for as TDRs. TDRs that are in non-accrual status are reported as non-accrual loans. Loans accounted for as TDRs are individually evaluated for impairment and are reported as non-performing loans. The table above includes information regarding loans reported as TDRs that moved from an accrual status to non-accrual during the periods reporting. (See (1) above)
At December 31, 2017, TDRs which have not defaulted and are still accruing interest had a total allowance allocation of $48 thousand, compared with $207 thousand at December 31, 2016. The decrease was attributable to two borrowers, and included a consumer loan and two cross collateralized commercial loans. The same loans experienced principal repayment of $153 thousand during the twelve months ended December 31, 2017.
No loans restructured in a troubled debt restructuring were removed from TDR reporting during 2017. The reduction in TDR balances, 2016 to 2017, was the result of principal repayment on the loans involved. No loans were removed from TDR status during the twelve month period ended 2016. Two loans were removed from TDR reporting during 2015, one of which was originated at a market rate and had performed as required by regulatory requirements and the second of which was downgraded to nonaccrual status. Two loans were designated as TDRs during 2017. A commercial loan with a pre- and post-modification recorded investment of $39 thousand was given a payment concession so as to enable the borrower to fulfill the loan agreement. A consumer loan with a pre-modification recorded investment of $12 thousand was renewed with interest capitalized resulting in a post-modification recorded investment of $14 thousand. Specific reserves for the full amounts of both loans were established. No new loans were designated as TDRs in the twelve-month periods ended 2016 or 2015.
The following table sets forth the major classifications of non-accrual loans:
|
December 31, |
||||||||
|
Non-accrual loans by type |
2017 |
2016 |
||||||
|
(In thousands) |
||||||||
|
Commercial and industrial |
$ | 321 | $ | 1,767 | ||||
|
Construction and development, excluding undeveloped land |
664 | 538 | ||||||
|
Undeveloped land |
474 | 474 | ||||||
|
Real estate mortgage - commercial investment |
52 | 107 | ||||||
|
Real estate mortgage - owner occupied commercial |
3,332 | 1,042 | ||||||
|
Real estate mortgage - 1-4 family residential |
1,637 | 984 | ||||||
|
Home equity |
31 | 383 | ||||||
|
Consumer |
– | – | ||||||
|
Total |
$ | 6,511 | $ | 5,295 | ||||
Loans are placed in a non-accrual income status when prospects for recovering both principal and accrued interest are considered doubtful or when a default of principal or interest has existed for 90 days or more, unless such a loan is well secured and in the process of collection. Interest income recorded on non-accrual loans was $338 thousand, $307 thousand, and $521 thousand for 2017, 2016, and 2015, respectively. Interest income that would have been recorded if non-accrual loans were on a current basis in accordance with their original terms was $159 thousand, $149 thousand, and $465 thousand for 2017, 2016, and 2015, respectively.
In addition to non-performing loans discussed above, there were loans, which are accruing interest, for which payments were current or less than 90 days past due where borrowers are experiencing elevated financial difficulties. These potential problem loans totaled approximately $17.9 million, $9.3 million, and $12.2 million at December 31, 2017, 2016, and 2015, respectively. These relationships are monitored closely for possible future inclusion in non-performing loans. Management believes it has adequately reflected credit exposure in these loans in its determination of the allowance for loan losses.
Non-performing assets as a percentage of total assets decreased 8 basis points from 2016 to 2017, reflecting improved credit quality and asset growth. At December 31, 2017 and 2016, the carrying value of other real estate owned was $2.6 million and $5.0 million, respectively. In 2017, Bancorp recorded impairment charges on such OREO totaling $171 thousand, compared with $62 thousand in 2016 and $210 thousand in 2015.
Allowance for Loan Losses
An allowance for loan losses has been established to provide for probable losses on loans that may not be fully repaid. The allowance for loan losses is increased by provisions charged to expense and decreased by charge-offs, net of recoveries. Loans are typically charged off when management deems them uncollectible and after underlying collateral has been liquidated; however, collection efforts continue and future recoveries may occur. Periodically, loans are partially charged off to the net realizable value based upon evaluation of related underlying collateral, including Bancorp’s proclivity for resolution.
Bancorp’s lending policies and procedures center on mitigating credit risk and include procedures to identify and measure this risk. These procedures begin with lenders assigning a risk rating to each of their credits, and this rating is confirmed in the loan approval process for new and renewed loans. Internal loan review, through a year-round process of examining individually significant obligor relationships, concentrations, and a broad sample of Bancorp’s portfolio, tests the reliability of these risk assessments. Additionally, a review of this process is an integral part of regulatory bank examinations.
Adversely rated credits are included on a classified loan list which incorporates loans requiring closer monitoring due to borrower’s circumstances. Loans are added to the classified loan list when circumstances are detected which might affect the borrower’s ability to comply with terms of the loan. This could include any of the following:
|
● |
Delinquency of a scheduled loan payment, |
|
● |
Deterioration in the borrower’s or guarantor’s financial condition identified in a review of periodic financial statements, which will impair repayment or collection, |
|
● |
Decrease in the value of collateral securing the loan, or |
|
● |
Change in the economic environment in which the borrower operates. |
Classified loans require detailed status reports, including recommended corrective actions, prepared periodically by the responsible loan officer. These reports are reviewed by management. The list of classified loans is also discussed quarterly with the Risk Committee of the Bank’s Board of Directors.
Changes in loan risk ratings are typically initiated by the responsible loan officer, but may also be initiated by internal loan review or Bancorp’s Loan Committees at any time.
In determining the allowance and related provision for loan losses, these principal elements are considered:
|
● |
Specific allocations are based upon probable losses on individually evaluated impaired loans. These loans are measured based on the present value of future cash flows discounted at the loans’ effective interest rate or at the estimated fair value of the loans’ collateral, if applicable. Other objective factors such as payment history and financial condition of the borrower or guarantor may be used as well. |
|
● |
Allocations for loans not defined as impaired are based on estimates for pools of loans with similar risk based upon Bancorp’s historical net loss percentages by loan type. |
|
● |
Additional allowance allocations are based on environmental or qualitative factors not necessarily associated with a specific credit or loan category and represent management’s effort to ensure that the overall allowance for loan losses appropriately reflects changes in trends, conditions and other relevant factors that may cause estimated credit losses to differ from historical experience. Management considers a number of environmental or qualitative factors, including local and general economic business factors and trends and portfolio concentrations. |
Allocation of the allowance for loan losses by loan category is a result of the analysis above. The same procedures used to determine requirements for the allowance for loan losses establish the distribution of the allowance by loan category. Distribution of the allowance will change from period to period due to changes in the identified risk in each loan segment, changes in the aggregate loan balances by loan category, and changes in management’s view of the environmental or qualitative factors noted above. Although the allowance for loan losses is comprised of specific and general allocations, the entire allowance is available to absorb any credit losses.
Historical net loss percentages are updated quarterly based on actual losses experienced by each loan type. The perception of risk with respect to particular loans within the portfolio will change over time as a result of characteristics and performance of those loans, overall economic and market trends, and actual and expected trends in non-performing loans. In the first quarter of 2017, Bancorp extended the historical period used to capture Bancorp’s historical loss ratios from 24 quarters to 28 quarters. This extension of the historical period used to capture Bancorp’s historical loss ratios was applied to all classes and segments of our loan portfolio. The expansion of the look-back period for the quantitative historical loss rate caused us to review the overall methodology for the qualitative factors to ensure we were appropriately capturing the risk not addressed in the quantitative historical loss rate. Management believes the extension of the look-back period is appropriate to capture the impact of a full economic cycle and provides sufficient loss observations to develop a reliable estimate.
Bancorp’s allowance calculation includes allocations to loan portfolio segments at December 31, 2017 for qualitative factors including, among other factors, local economic and business conditions, quality and experience of lending staff and management, exceptions to lending policies, levels of and trends in past due loans and loan classifications, concentrations of credit such as collateral type, trends in portfolio growth, trends in the value of underlying collateral for collateral-dependent loans, effect of other external factors such as the national economic and business trends, and the quality and depth of the loan review function. Bancorp utilizes the sum of all allowance amounts derived as described above as the appropriate level of allowance for loan and lease losses. Changes in criteria used in this evaluation or availability of new information could cause the allowance to be increased or decreased in future periods. Based on this quantitative and qualitative analysis, provisions (reductions) are made to the allowance for loan losses. Such provisions (reductions) are reflected as a charge against (benefit to) current earnings in Bancorp’s consolidated statements of income.
The adequacy of the allowance for loan losses is monitored by Executive Management and reported quarterly to the Audit Committee of the Board of Directors. This committee has approved the overall allowance methodology. In addition, various regulatory agencies, as an integral part of their examination process, periodically review the adequacy of Bancorp’s allowance for loan losses. Such agencies may require Bancorp to make additional provisions to the allowance based upon their judgments about information available to them at the time of their examinations. As of balance sheet date, using the current model, management believes that the allowance for loan losses is adequate to absorb probable inherent losses on existing loans that may become uncollectible.
In June of 2016 FASB issued ASU 2016-13, Classification of Credit Losses on Financial Instruments, which significantly changes the way entities recognize impairment of many financial assets by requiring immediate recognition of estimated credit losses expected to occur over the remaining life of the asset, determined at origination of the relationship. Implementation of this standard, which is required for interim and annual reporting periods beginning after December 15, 2019, could have a significant impact on the level of the allowance, and on earnings of Bancorp. See “Provision for Loan Losses” for further discussion of the allowance for loan losses.
Summary of Loan Loss Experience
The following table summarizes average loans outstanding, changes in the allowance for loan losses arising from loans charged off and recoveries on loans previously charged off by loan category and additions to the allowance charged (credited) to expense.
|
Year ended December 31 |
||||||||||||||||||||
|
(Dollars in thousands) |
2017 |
2016 |
2015 |
2014 |
2013 |
|||||||||||||||
|
Average loans |
$ | 2,308,856 | $ | 2,159,153 | $ | 1,919,201 | $ | 1,773,011 | $ | 1,656,777 | ||||||||||
|
Balance of allowance for loan losses at beginning of year |
$ | 24,007 | $ | 22,441 | $ | 24,920 | $ | 28,522 | $ | 31,881 | ||||||||||
|
Loans charged off |
||||||||||||||||||||
|
Commercial and industrial |
(1,782 | ) | (1,216 | ) | (4,065 | ) | (661 | ) | (457 | ) | ||||||||||
|
Construction and development excluding undeveloped land |
– | (133 | ) | (26 | ) | (250 | ) | (25 | ) | |||||||||||
|
Undeveloped land |
– | – | – | (1,753 | ) | (7,961 | ) | |||||||||||||
|
Real estate mortgage |
(98 | ) | (576 | ) | (693 | ) | (993 | ) | (2,758 | ) | ||||||||||
|
Consumer |
(549 | ) | (568 | ) | (597 | ) | (587 | ) | (763 | ) | ||||||||||
|
Total loans charged off |
(2,429 | ) | (2,493 | ) | (5,381 | ) | (4,244 | ) | (11,964 | ) | ||||||||||
|
Recoveries of loans previously charged off |
||||||||||||||||||||
|
Commercial and industrial |
202 | 279 | 98 | 243 | 569 | |||||||||||||||
|
Construction and development excluding undeveloped land |
– | 21 | – | – | 163 | |||||||||||||||
|
Undeveloped land |
– | – | 1,400 | 166 | 81 | |||||||||||||||
|
Real estate mortgage |
154 | 342 | 155 | 120 | 584 | |||||||||||||||
|
Consumer |
401 | 417 | 499 | 513 | 658 | |||||||||||||||
|
Total recoveries |
757 | 1,059 | 2,152 | 1,042 | 2,055 | |||||||||||||||
|
Net loans charged off |
(1,672 | ) | (1,434 | ) | (3,229 | ) | (3,202 | ) | (9,909 | ) | ||||||||||
|
Provision (credit) for loan losses charged (credited) to expense |
2,550 | 3,000 | 750 | (400 | ) | 6,550 | ||||||||||||||
|
Balance at end of year |
$ | 24,885 | $ | 24,007 | $ | 22,441 | $ | 24,920 | $ | 28,522 | ||||||||||
|
Ratio of net charge-offs during year to average loans |
0.07 | % | 0.07 | % | 0.17 | % | 0.18 | % | 0.60 | % | ||||||||||
See “Provision for Loan Losses” for discussion of the provision for loan losses and 2017 charge-offs.
The following table sets forth allocation of the allowance for loan losses to the loan categories shown. Although specific allocations exist, the entire allowance is available to absorb losses in any particular loan category.
|
December 31 |
||||||||||||||||||||
|
(In thousands) |
2017 |
2016 |
2015 |
2014 |
2013 |
|||||||||||||||
|
Commercial and industrial |
$ | 11,276 | $ | 10,483 | $ | 8,645 | $ | 11,819 | $ | 7,644 | ||||||||||
|
Construction and development, excluding undeveloped land |
1,724 | 1,923 | 1,760 | 721 | 2,555 | |||||||||||||||
|
Undeveloped land |
521 | 684 | 814 | 1,545 | 5,376 | |||||||||||||||
|
Real estate mortgage |
11,012 | 10,573 | 10,875 | 10,541 | 12,604 | |||||||||||||||
|
Consumer |
352 | 344 | 347 | 294 | 343 | |||||||||||||||
|
Total allowance for loan losses |
$ | 24,885 | $ | 24,007 | $ | 22,441 | $ | 24,920 | $ | 28,522 | ||||||||||
Changes in the allocation of the allowance from year to year in various categories are influenced by the level of net charge-offs in respective categories and other factors including, but not limited to, an evaluation of the impact of current economic conditions and trends, risk allocations tied to specific loans or groups of loans and changes in qualitative allocations. Management believes that allocations for each loan category are reflective of risk inherent in the portfolio.
Selected ratios relating to the allowance for loan losses follow:
|
Years ended December 31 |
||||||||||||
|
2017 |
2016 |
2015 |
||||||||||
|
Provision for loan losses to average loans |
0.11 | % | 0.14 | % | 0.04 | % | ||||||
|
Net charge-offs to average loans |
0.07 | 0.07 | 0.17 | |||||||||
|
Allowance for loan losses to average loans |
1.08 | 1.11 | 1.17 | |||||||||
|
Allowance for loan losses to year end loans |
1.03 | 1.04 | 1.10 | |||||||||
Deposits
Average amounts of deposits in Bancorp and average rates paid on such deposits for the years indicated are summarized as follows:
|
Years ended December 31 |
||||||||||||||||||||||||
|
2017 |
2016 |
2015 |
||||||||||||||||||||||
|
(Dollars in thousands) |
Average balance |
Average rate |
Average balance |
Average rate |
Average balance |
Average rate |
||||||||||||||||||
|
Non-interest bearing demand deposits |
$ | 684,044 | – | $ | 650,036 | – | $ | 558,185 | – | |||||||||||||||
|
Interest bearing demand deposits |
757,023 | 0.21 | % | 717,800 | 0.14 | % | 545,158 | 0.11 | % | |||||||||||||||
|
Savings deposits |
148,510 | 0.12 | 135,051 | 0.03 | 119,821 | 0.04 | ||||||||||||||||||
|
Money market deposits |
697,182 | 0.39 | 658,837 | 0.22 | 645,215 | 0.20 | ||||||||||||||||||
|
Time deposits |
237,368 | 0.62 | 252,170 | 0.57 | 284,062 | 0.63 | ||||||||||||||||||
| $ | 2,524,127 | $ | 2,413,894 | $ | 2,152,441 | |||||||||||||||||||
Maturities of time deposits of more than $250,000 at December 31, 2017, are summarized as follows:
|
(In thousands) |
Amount |
|||
|
3 months or less |
$ | 11,338 | ||
|
Over 3 through 6 months |
6,064 | |||
|
Over 6 through 12 months |
10,572 | |||
|
Over 12 months |
10,465 | |||
| $ | 38,439 | |||
Securities Sold Under Agreement to Repurchase
Securities sold under agreements to repurchase represent excess funds from certain commercial customers as part of a cash management service. These agreements have maturities of one business day from the transaction date. Bancorp considers these a core funding since they represent excess cash balances of relationship business customers.
Information regarding securities sold under agreements to repurchase follows:
|
Years ended December 31 |
||||||||||||||||||||||||
|
2017 |
2016 |
2015 |
||||||||||||||||||||||
|
(Dollars in thousands) |
Amount |
Rate |
Amount |
Rate |
Amount |
Rate |
||||||||||||||||||
|
Securities sold under agreements to repurchase |
||||||||||||||||||||||||
|
Year end |
$ | 70,473 | 0.17 | % | $ | 67,595 | 0.21 | % | $ | 64,526 | 0.23 | % | ||||||||||||
|
Average during year |
70,187 | 0.19 | 62,670 | 0.22 | 65,140 | 0.23 | ||||||||||||||||||
|
Maximum month end balance during year |
$ | 75,365 | $ | 72,029 | $ | 82,467 | ||||||||||||||||||
Liquidity
The role of liquidity management is to ensure funds are available to meet depositors’ withdrawal and borrowers’ credit demands while at the same time maximizing profitability. This is accomplished by balancing changes in demand for funds with changes in supply of those funds. Liquidity is provided by short-term liquid assets that can be converted to cash, investment securities available-for-sale, various lines of credit available to Bancorp, and the ability to attract funds from external sources, principally deposits. Management believes it has the ability to increase deposits at any time by offering rates slightly higher than market rate.
Bancorp’s Asset/Liability Committee is primarily comprised of senior management and has direct oversight responsibility for Bancorp’s liquidity position and profile. A combination of reports provided to management detail internal liquidity metrics, composition and level of the liquid asset portfolio, timing differences in short-term cash flow obligations, and exposure to contingent draws on Bancorp’s liquidity.
Bancorp’s most liquid assets are comprised of cash and due from banks, federal funds sold, and available-for-sale marketable investment securities. Federal funds sold and interest bearing deposits totaled $97.3 million at December 31, 2017. Federal funds sold normally have overnight maturities while interest bearing deposits in banks are accessible on demand. These investments are used for general daily liquidity purposes. The fair value of the available-for-sale investment portfolio was $574.5 million at December 31, 2017. The portfolio includes maturities of approximately $187.7 million over the next twelve months, including $150 million in U.S. Treasury obligations which matured in January 2018. Combined with federal funds sold and interest bearing deposits from banks, these offer substantial resources to meet either loan growth or reductions in Bancorp’s deposit funding base. Bancorp pledges portions of its investment securities portfolio to secure public fund deposits, cash balances of certain wealth management and trust accounts, and securities sold under agreements to repurchase. At December 31, 2017, total investment securities pledged for these purposes comprised 67% of the available-for-sale investment portfolio, leaving $190 million of unpledged securities.
Bancorp has a large base of core customer deposits, defined as demand, savings, money market deposit accounts and time deposits less than or equal to $250,000. At December 31, 2017, such deposits totaled $2.6 billion and represented 99% of Bancorp’s total deposits. Because these core deposits are less volatile and are often tied to other products of Bancorp through long lasting relationships they do not place undue pressure on liquidity. However, many of Bancorp’s individual depositors currently maintain historically high balances. When market conditions improve, these balances may decrease and could put some strain on Bancorp’s liquidity position.
As of December 31, 2017, Bancorp did not have any brokered deposits.
Other sources of funds available to meet daily needs include the sales of securities under agreements to repurchase. Also, Bancorp is a member of the FHLB of Cincinnati. As a member of the FHLB, Bancorp has access to credit products of the FHLB. Bancorp views these borrowings as a potential low cost alternative to brokered deposits. At December 31, 2017, the amount of available credit from the FHLB totaled $333 million. See Note 11 to Bancorp’s consolidated financial statements for further information regarding advances from the FHLB. Also, Bancorp has available federal funds purchased lines with correspondent banks totaling $105 million. Bancorp also is eligible to borrow from the Federal Reserve Bank of St. Louis based upon value of posted collateral.
At December 31, 2017, Bancorp had an outstanding $150 million cash management advance from the FHLB. This advance matured in the first week of January 2018 and was used to manage Bancorp’s overall cash position. Due to the short term of the advance, it was recorded on the consolidated balance sheet within federal funds purchased and other short-term borrowings.
Over the normal course of business, Bancorp enters into certain forms of off-balance sheet transactions, including unfunded loan commitments and letters of credit. These transactions are managed through Bancorp’s various risk management processes. Management considers both on-balance sheet and off-balance sheet transactions in its evaluation of Bancorp’s liquidity.
Sources and Uses of Cash
Cash flow is provided primarily through financing activities of Bancorp which include raising deposits and borrowing of funds from institutional sources such as advances from FHLB and federal funds purchased as well as scheduled loan repayments. These funds are primarily used to facilitate investment activities of Bancorp which include making loans and purchasing securities for the investment portfolio. Another important source of cash is from the net income of the Bank from operating activities. As discussed in Note 18 to Bancorp’s consolidated financial statements, as of January 1 of any year the Bank may pay dividends in an amount equal to the Bank’s net income of the prior two years less any dividends paid for the same two years. Regulatory approval is required for dividends exceeding these amounts. Prior to declaration of dividends, management considers the effect such payments will have on total stockholders’ equity and capital ratios. For more specific information, see the consolidated statement of cash flows in Bancorp’s consolidated financial statements.
Commitments
In the normal course of business, Bancorp is party to activities that contain credit, market and operational risk that are not reflected in whole or in part in Bancorp’s consolidated financial statements. Such activities include traditional off-balance sheet credit-related financial instruments, commitments under operating leases and long-term debt.
Bancorp provides customers with off-balance sheet credit support through loan commitments and standby letters of credit. Summarized credit-related financial instruments, including both commitments to extend credit and letters of credit at December 31, 2017 are as follows:
|
Amount of commitment expiration per period |
||||||||||||||||||||
|
Less than |
1-3 | 3-5 |
Over 5 |
|||||||||||||||||
|
(In thousands) |
Total |
1 year |
years |
years |
years |
|||||||||||||||
|
Unused loan commitments |
$ | 673,490 | $ | 343,346 | $ | 148,664 | $ | 32,906 | $ | 148,574 | ||||||||||
|
Standby letters of credit |
16,949 | 13,661 | 3,288 | – | – | |||||||||||||||
Since some of the unused commitments are expected to expire or may not be fully used, the total amount of commitments in the preceding table does not necessarily represent future cash requirements.
In addition to owned banking facilities, Bancorp has entered into long-term leasing arrangements for certain branch facilities. Bancorp also has required future payments for a non-qualified defined benefit retirement plan, long-term debt and the maturity of time deposits. See Note 11, Note 16 and Note 19 to Bancorp’s consolidated financial statements for further information on Federal Home Loan Bank advances, the defined benefit retirement plan and operating leases.
Required payments under such commitments at December 31, 2017 are as follows:
|
Payments due by period |
||||||||||||||||||||
|
Less than |
1-3 | 3-5 |
Over 5 |
|||||||||||||||||
|
(In thousands) |
Total |
1 year |
years |
Years |
years |
|||||||||||||||
|
Time deposit maturities |
$ | 235,574 | $ | 166,219 | $ | 55,957 | $ | 13,299 | $ | 99 | ||||||||||
|
Federal Home Loan Bank advances |
49,458 | 30,000 | 1,741 | 288 | 17,429 | |||||||||||||||
|
Operating leases |
11,024 | 1,847 | 3,412 | 2,892 | 2,873 | |||||||||||||||
|
Defined benefit retirement plan |
3,530 | 84 | 168 | – | 3,278 | |||||||||||||||
|
Other |
1,100 | 400 | 700 | – | – | |||||||||||||||
Capital
Information pertaining to Bancorp’s capital balances and ratios follows:
|
Years ended December 31 |
||||||||||||
|
(Dollars in thousands, except share data) |
2017 |
2016 |
2015 |
|||||||||
|
Stockholders’ equity |
$ | 333,644 | $ | 313,872 | $ | 286,519 | ||||||
|
Dividends per share |
0.80 | 0.72 | 0.64 | |||||||||
|
Dividend payout ratio, based on basic EPS |
47.34 | % | 38.95 | % | 37.94 | % | ||||||
|
Tier 1 risk-based capital |
12.57 | 12.10 | 12.32 | |||||||||
|
Total risk-based capital |
13.52 | 13.04 | 13.31 | |||||||||
|
Leverage ratio |
10.70 | 10.54 | 10.53 | |||||||||
Bancorp increased its cash dividends declared to stockholders during 2017 to an annual dividend of $0.80, up from $0.72 per share in 2016 and $0.64 in 2015. This represents a payout ratio of 47.34% based on basic EPS and an annual yield of 2.23% based upon an annualized fourth quarter dividend rate and year-end closing stock price. Since 2008, Bancorp has had no share buyback plan.
Bank holding companies and their subsidiary banks are required by regulators to meet risk-based capital standards. These standards, or ratios, measure the relationship of capital to a combination of balance sheet and off-balance sheet risks. The value of both balance sheet and off-balance sheet items are adjusted to reflect credit risks. The increase in risk-based capital ratios from 2016 to 2017 resulted from capital growth in retained earnings outpacing loan growth. Note 23 to the consolidated financial statements provide more details of regulatory capital requirements, as well as capital ratios of Bancorp and the Bank. The Bank exceeds regulatory capital ratios required to be well capitalized. Regulatory framework does not define well capitalized for holding companies. Management considers the effects of growth on capital ratios as it contemplates plans for expansion.
Final rules implementing the Basel III regulatory capital reforms became effective for Bancorp and Bank on January 1, 2015, and included new minimum risk-based capital and leverage ratios. Management believes that as of December 31, 2017, Bancorp met the requirements to be considered well-capitalized under these rules.
One component of equity is accumulated other comprehensive income (loss) which, for Bancorp, consists of net unrealized gains or losses on securities available-for-sale, a minimum pension liability, both net of taxes, and a disproportionate tax effect balance created when the net deferred tax asset was remeasured in 2017 as a result of the enacted tax legislation. Accumulated other comprehensive loss was $1.9 million at December 31, 2017, as compared with accumulated other comprehensive loss of $1.5 million at December 31, 2016. The $400 thousand decrease is primarily a reflection of the effect of the changing interest rate environment during fiscal year 2017 on the valuation of Bancorp’s portfolio of securities available-for-sale.
The following table presents various key financial ratios:
|
Years ended December 31 |
||||||||||||
|
2017 |
2016 |
2015 |
||||||||||
|
Return on average assets |
1.25 | % | 1.42 | % | 1.44 | % | ||||||
|
Return on average stockholders’ equity |
11.61 | 13.49 | 13.55 | |||||||||
|
Average stockholders’ equity to average assets |
10.79 | 10.54 | 10.66 | |||||||||
Addressing the decline from 2016 to 2017 in Bancorp’s returns on average assets and average stockholders’ equity, the tax reform related DTA charge in 2017 reduced those ratios by 0.20% and 1.81%, respectively.
Fair Value Measurements
Bancorp follows the provisions of authoritative guidance for fair value measurements. This guidance is definitional and disclosure oriented and addresses how companies should approach measuring fair value when required by US GAAP. It prescribes various disclosures about financial statement categories and amounts which are measured at fair value, if such disclosures are not already specified elsewhere in US GAAP.
Authoritative guidance defines fair value as the price that would be received to sell an asset or paid to transfer a liability in an orderly transaction between participants at the measurement date. The guidance, which requires fair value measurements to be classified as Level 1 (quoted prices), Level 2 (based on observable inputs) or Level 3 (based on significant unobservable, internally-derived inputs), is discussed in more detail in Note 20 to the consolidated financial statements.
Bancorp’s investment securities available-for-sale and interest rate swaps are recorded at fair value on a recurring basis. Other accounts including mortgage loans held for sale, mortgage servicing rights, impaired loans and other real estate owned may be recorded at fair value on a non-recurring basis, generally in the application of lower of cost or market adjustments or write-downs of specific assets.
The portfolio of investment securities available-for-sale is comprised of U.S. Treasury and other U.S. government obligations, debt securities of U.S. government-sponsored corporations (including mortgage-backed securities), and obligations of state and political subdivisions. U.S. Treasury securities are priced using quoted prices of identical securities in an active market. These measurements are classified as Level 1 in the hierarchy above. All other securities are priced using standard industry models or matrices with various assumptions such as yield curves, volatility, prepayment speeds, default rates, time value, credit rating and market prices for similar instruments. These assumptions are generally observable in the market place and can be derived from or supported by observable data. These measurements are classified as Level 2 in the hierarchy above.
Interest rate swaps are valued using primarily Level 2 inputs. Fair value measurements generally based on benchmark forward yield curves and other relevant observable market data. For purposes of potential valuation adjustments to derivative positions, Bancorp evaluates the credit risk of its counterparties as well as its own credit risk. To date, Bancorp has not realized any losses due to a counterparty’s inability to perform and the change in value of derivative assets and liabilities attributable to credit risk was not significant during 2017.
Mortgage servicing rights (“MSRs”), carried in other assets, are recorded at fair value upon capitalization, are amortized to correspond with estimated servicing income, and are periodically assessed for impairment based on fair value at the reporting date. Fair value is based on a valuation model that calculates the present value of estimated net servicing income. The model incorporates assumptions that market participants would use in estimating future net servicing income. These measurements are classified as Level 3. At December 31, 2017 and 2016 there was no valuation allowance for MSRs, as fair value exceeded carrying value.
Loans are measured for impairment and, if indicated, a specific allocation is established based on the value of underlying collateral. Impaired loans include non-accrual loans and loans accounted for as troubled debt restructuring. For impaired loans, fair value amounts represent only those impaired loans with specific valuation allowances and collateral dependent impaired loans charged down to their carrying value. At December 31, 2017 and December 31, 2016, carrying value of impaired loans measured at fair value on a non-recurring basis was $2.6 million and $2.9 million, respectively. These measurements are classified as Level 3.
Other real estate owned, which is carried in other assets at the lower of cost or fair value, is periodically assessed for impairment based on fair value at the reporting date. Fair value is determined from external appraisals using judgments and estimates of external professionals. Many of these inputs are not observable and, accordingly, these measurements are classified as Level 3. For the purposes of the tables in Note 20, fair value for OREO is equal to the carrying value of only parcels of OREO for which carrying value equals appraised value. If a parcel of OREO has a carrying value below its appraised value, it is not considered to be carried at fair value, and is therefore not included in the table in Note 20. The losses represent write-downs which occurred during the period indicated. At December 31, 2017 and 2016, the carrying value of other real estate owned was $2.6 million and $5.0 million, respectively.
See Note 20 to Bancorp’s consolidated financial statements for details of fair value measurements.
Non-GAAP Financial Measures
Bancorp considers various ratios when evaluating capital adequacy, including tangible common equity to tangible assets, and tangible common equity per share, both of which are non-GAAP measures. Bancorp believes these ratios are important because of their widespread use by investors as means to evaluate capital adequacy, as they better reflect the level of capital available to withstand unexpected market conditions.
The following table reconciles Bancorp’s calculation of these measures to amounts reported under US GAAP.
|
December 31, |
||||||||
|
(In thousands, except per share data) |
2017 |
2016 |
||||||
|
Total equity |
$ | 333,644 | $ | 313,872 | ||||
|
Less core deposit intangible |
(1,225 | ) | (1,405 | ) | ||||
|
Less goodwill |
(682 | ) | (682 | ) | ||||
|
Tangible common equity |
$ | 331,737 | $ | 311,785 | ||||
|
Total assets |
$ | 3,239,646 | $ | 3,039,481 | ||||
|
Less core deposit intangible |
(1,225 | ) | (1,405 | ) | ||||
|
Less goodwill |
(682 | ) | (682 | ) | ||||
|
Total tangible assets |
$ | 3,237,739 | $ | 3,037,394 | ||||
|
Total shareholders’ equity to total assets |
10.30 | % | 10.33 | % | ||||
|
Tangible common equity ratio |
10.25 | % | 10.26 | % | ||||
|
Number of outstanding shares |
22,679 | 22,617 | ||||||
|
Book value per share |
$ | 14.71 | $ | 13.88 | ||||
|
Tangible common equity per share |
14.63 | 13.79 | ||||||
In addition to the efficiency ratio normally presented, Bancorp considers an adjusted efficiency ratio which is a non-GAAP measure. Bancorp believes this ratio is important because of it provides a comparable ratio after eliminating the fluctuation in non-interest expenses related to amortization/impairment of investments in tax credit partnerships. The following table reconciles Bancorp’s calculation of this measure to the ratio reported under US GAAP.
|
(Amounts in thousands) |
2017 |
2016 |
||||||
|
Non-interest expenses |
$ | 90,991 | $ | 81,520 | ||||
|
Net interest income (tax-equivalent) |
104,396 | 98,088 | ||||||
|
Non-interest income |
45,120 | 43,537 | ||||||
|
Total revenue |
$ | 149,516 | $ | 141,625 | ||||
|
Efficiency ratio |
60.9 | % | 57.6 | % | ||||
|
Non-interest expenses |
$ | 90,991 | $ | 81,520 | ||||
|
Less: amortization/impairment of investments in tax credit partnerships |
(7,124 | ) | (4,458 | ) | ||||
|
Adjusted non-interest expenses |
83,867 | 77,062 | ||||||
|
Net interest income (tax-equivalent) |
104,396 | 98,088 | ||||||
|
Non-interest income |
45,120 | 43,537 | ||||||
|
Total revenue |
$ | 149,516 | $ | 141,625 | ||||
|
Adjusted efficiency ratio |
56.1 | % | 54.4 | % | ||||
Recently Issued Accounting Pronouncements
In May 2014, the Financial Accounting Standards Board (“FASB”) issued Accounting Standards Update (“ASU”) No. 2014-09, Revenue from Contracts with Customers, which outlines a single comprehensive model for use in accounting for revenue arising from contracts with customers, and supersedes most current revenue recognition guidance. The effective date will be annual reporting periods beginning after December 15, 2017, and the interim periods within that year. Two options are permitted for transitioning, a full retrospective application which takes into account the requirements of ASC 250, and a modified retrospective approach in which the cumulative effect of initially applying the new standard is taken to retained earnings. Bancorp expects to use the modified retrospective approach. Bancorp has reviewed existing contractual arrangements and believes the majority of its revenue earned is excluded from the scope of the pronouncement and the impact of adoption will be minimal. Significant sources of revenue included within the scope of the standard are service charges on deposits, debit and credit card interchange fees, brokerage income, and wealth management revenue. Bancorp has analyzed each revenue stream to identify the contract with the customer, the performance obligation(s) defined in the contract, the transaction price, and timing for when revenue should be recognized. Within wealth management each unique service from which fees are derived was reviewed to ensure processes are in place to allocate fees within the proper reporting period. Changes to existing recognition practices have not been found to be necessary, and Bancorp expects no adjustment, as described above, to retained earnings Additional disclosures will be required including information on disaggregation of revenue into categories depicting the nature, amount, timing, extent, and uncertainty of revenue. Bancorp is still evaluating options for disaggregation presentation beyond segments currently identified.
The FASB also issued a series of other ASUs, which update ASU 2014-09. The effective dates for ASU 2014-09 have been updated by ASU 2015-14, Deferral of the Effective Date. For public business entities, certain employee benefit plans, and certain not-for-profit entities, ASU 2014-09 is effective for annual and interim periods in fiscal years beginning after December 15, 2017. Earlier application is permitted only as of annual and interim periods in fiscal years beginning after December 15, 2016. Bancorp is including these ASUs in its evaluation and implementation efforts relative to ASU 2014-09.
|
● |
ASU 2016-08, Revenue from Contracts with Customers (Topic 606): Principal versus Agent Considerations (Reporting Revenue Gross versus Net) |
|
● |
ASU 2016-10, Revenue from Contracts with Customers (Topic 606): Identifying Performance Obligations and Licensing |
|
● |
ASU 2016-12, Revenue from Contracts with Customers (Topic 606): Narrow-Scope Improvements and Practical Expedients |
|
● |
ASU 2016-20, Technical Corrections and Improvements to Topic 606, Revenue from Contracts with Customers |
In January 2016, the Financial Accounting Standards Board (“FASB”) issued Accounting Standards Update (“ASU”) No. 2016-01, Financial Instruments – Overall: Recognition and Measurement of Financial Assets and Financial Liabilities, which requires equity investments to be measured at fair value with changes in fair value recognized in net income. The ASU is effective for fiscal years and interim periods beginning after December 15, 2017. Because Bancorp does not have investments in equity securities, the adoption of ASU 2016-01 is not expected to have an impact on Bancorp’s operations or financial statements.
In February 2016, FASB issued ASU No. 2016-02, Leases, which requires lessees to recognize the assets and liabilities that arise from leases on the balance sheet. A lessee should recognize on the balance sheet a liability to make lease payments (the lease liability) and a right-of-use asset representing its right to use the underlying asset for lease term. The new guidance is effective for annual and interim reporting periods beginning after December 15, 2018. The standard should be applied at the beginning of the earliest period presented using a modified retrospective approach with earlier application permitted as of the beginning of an interim or annual reporting period. Bancorp has evaluated existing lease commitments and expects to record a right-of-use asset and lease liability of approximately $11 million upon adoption. Bancorp’s financial condition and results of operations are not otherwise expected to be impacted.
In June 2016, FASB issued ASU 2016-13, Measurement of Credit Losses on Financial Instruments, which significantly changes the way entities recognize impairment of many financial assets by requiring immediate recognition of estimated credit losses expected to occur over their remaining life. This standard will likely have a significant impact on the way Bancorp recognizes credit impairment on loans. Under current US GAAP, credit impairment losses are determined using an incurred-loss model, which recognizes credit losses only when it is probable that all contractual cash flows will not be collected. The initial recognition of loss under CECL differs from current US GAAP because recognition of credit losses will not be based on any triggering event. This should generally result in credit impairment being recognized earlier and immediately after the financial asset is originated or purchased. Bancorp continues to evaluate existing accounting processes, internal controls, and technology capabilities to determine what additional changes will be needed to address the new requirements. These processes and controls require significant judgment, collection and analysis of additional data, and use of estimates. Technology and other resources have been upgraded or modified to capture additional data to support the accounting and disclosure requirements. The new guidance is effective for annual and interim reporting periods beginning after December 15, 2019. While the impact of implementing the CECL model cannot be quantified at this time, Bancorp expects to recognize a one-time cumulative-effect adjustment to the allowance in the first quarter of 2020, consistent with interagency guidance issued in 2016.
In August 2016, FASB issued ASU 2016-15, Classification of Certain Cash Receipts and Cash Payments, which amends guidance in ASC 230 on the classification of certain cash receipts and payments in the statement of cash flows. The primary purpose of the ASU is to reduce the diversity in practice that has resulted from the lack of consistent principles on this topic. The ASU’s amendments add or clarify guidance on eight cash flow issues. The guidance in the ASU is effective for fiscal years beginning after December 15, 2017, including interim periods within those fiscal years. Early adoption is permitted. Entities must apply the guidance retrospectively to all periods presented but may apply it prospectively from the earliest date practicable if retrospective application would be impracticable. Bancorp does not anticipate that adoption of the ASU will have a significant impact on the consolidated financial statements of the Company.
In October 2016, the FASB issued ASU 2016-16, Income Taxes (Topic 740): Intra-Entity Transfers of Assets Other Than Inventory, which requires entities to recognize at the transaction date the income tax consequences of inter-company asset transfers other than inventory. This ASU is effective for public business entities for annual and interim periods in fiscal years beginning after December 15, 2017. Entities may early adopt the ASU, but only at the beginning of an annual period for which no financial statements (interim or annual) have already been issued or made available for issuance. Bancorp does not expect adoption of this standard to have an impact on the consolidated financial statements of the Company.
In November 2016, the FASB issued ASU 2016-18, Statement of Cash Flows (Topic 230): Restricted Cash, which requires companies to include cash and cash equivalents that have restrictions on withdrawal or use in total cash and cash equivalents on the statement of cash flows. This ASU is effective for public business entities for annual and interim periods in fiscal years beginning after December 15, 2017. Early adoption is permitted, including adoption in an interim period. If an entity early adopts the amendments in an interim period, adjustments should be reflected at the beginning of the fiscal year that includes that interim period. Bancorp does not expect adoption of this standard to have a significant impact on the consolidated financial statements of the Company.
In January 2017, the FASB issued ASU 2017-01, Business Combinations (Topic 805): Clarifying the Definition of a Business, which provides a new framework for determining whether transactions should be accounted for as acquisitions (or disposals) of assets or businesses. This ASU is effective for public business entities for annual and interim periods in fiscal years beginning after December 15, 2017. For all other entities, the ASU is effective for annual periods in fiscal years beginning after December 15, 2018, and interim periods in fiscal years beginning after December 15, 2019. Entities may early adopt the ASU and apply it to transactions that have not been reported in financial statements that have been issued or made available for issuance. Bancorp does not expect adoption of this standard to have a significant impact on the consolidated financial statements of the Company.
In January 2017, the FASB issued ASU 2017-03, Accounting Changes and Error Corrections (Topic 250) and Investments—Equity Method and Joint Ventures (Topic 323): Amendments to SEC Paragraphs Pursuant to Staff Announcements at the September 22, 2016 and November 17, 2016 EITF Meetings (SEC Update), which incorporates into the FASB Accounting Standards Codification recent SEC guidance about disclosing, under SEC SAB Topic 11.M, the effect on financial statements of adopting the revenue, leases, and credit losses standards. The SEC staff had previously announced that registrants should include the disclosures starting with their December 2017 financial statements.
In January 2017, the FASB issued ASU 2017-04, Intangibles—Goodwill and Other (Topic 350): Simplifying the Test for Goodwill Impairment, which requires an entity to no longer perform a hypothetical purchase price allocation to measure goodwill impairment. Instead, impairment will be measured using the difference between the carrying amount and the fair value of the reporting unit. The changes are effective for public business entities that are SEC filers, for annual and interim periods in fiscal years beginning after December 15, 2019. All entities may early adopt the standard for goodwill impairment tests with measurement dates after January 1, 2017. Bancorp does not expect adoption of this standard to have a significant impact on the consolidated financial statements of the Company.
In February 2017, the FASB issued ASU 2017-05, Other Income—Gains and Losses from the Derecognition of Nonfinancial Assets (Subtopic 610-20): Clarifying the Scope of Asset Derecognition Guidance and Accounting for Partial Sales of Nonfinancial Assets, which clarifies the guidance in Subtopic 610-20 on accounting for derecognition of a nonfinancial asset. The ASU also defines in-substance nonfinancial assets and includes guidance on partial sales of nonfinancial assets. An entity is required to apply the amendments in this ASU at the same time that it applies ASU 2014-09. Bancorp does not expect adoption of this standard to have a significant impact on the consolidated financial statements of the Company.
In March 2017, the FASB issued ASU 2017-07, Compensation—Retirement Benefits (Topic 715): Improving the Presentation of Net Periodic Pension Cost and Net Periodic Postretirement Benefit Cost, which requires companies to present the service cost component of net benefit cost in the same line items in which they report compensation cost. Companies will present all other components of net benefit cost outside operating income, if this subtotal is presented. This ASU is effective for public business entities for annual and interim periods in fiscal years beginning after December 15, 2017. Early adoption is permitted as of the beginning of an annual period for which financial statements (interim or annual) have not been issued or made available for issuance. Bancorp does not expect adoption of this standard to have a significant impact on the consolidated financial statements of the Company.
In May 2017, the FASB issued ASU 2017-09, Compensation – Stock Compensation (Topic 718): Scope of Modification Accounting which clarifies what constitutes a modification of a share-based payment award. This ASU is effective for all entities for annual and interim periods in fiscal years beginning after December 15, 2017. Early adoption is permitted as of the beginning of an annual period for which financial statements (interim or annual) have not been issued or made available for issuance. Bancorp does not expect adoption of this standard to have a significant impact on the consolidated financial statements of the Company.
In July 2017, the FASB issued ASU 2017-11, Earnings Per Share (Topic 260), Distinguishing Liabilities from Equity (Topic 480), Derivatives and Hedging (Topic 815); I. Accounting for Certain Financial Instruments with Down Round Features. II. Replacement of the Indefinite Deferral for Mandatory Redeemable Financial Instruments of Certain Nonpublic Entities and Certain Mandatory Redeemable Noncontrolling Interests with a Scope Exception, which makes limited changes to as to classifying certain financial instruments as either liabilities or equity. This ASU is effective for public business entities for annual and interim periods in fiscal years beginning after December 15, 2018. Early adoption is permitted, including adoption in an interim period. Because Bancorp does not have financial instruments with a down round feature, the implementation of ASU 2017-11 is not expected to have a significant impact on the consolidated financial statements of the Company.
In August 2017, the FASB issued ASU 2017-12, Derivatives and Hedging (Topic 815); Targeted Improvements for Accounting for Hedging Activities, which amends the hedge accounting recognition and presentation requirements under ASC 815. This ASU is effective for public business entities for annual and interim periods in fiscal years beginning after December 15, 2018. Early adoption of this standard is permitted upon its issuance. Bancorp does not expect adoption of this standard to have a significant impact on the consolidated financial statements of the Company.
In February 2018, the FASB issued ASU 2018-02, Income Statement Reporting Comprehensive Income (Topic 220), Reclassification of Certain Tax Effects from Accumulated Other Comprehensive Income, which provides guidance for the reclassification from other comprehensive income to retained earnings stranded tax effects resulting from the Tax Cuts and Jobs Act enacted on December 22, 2017. The amendments of the update are effective for all entities for fiscal years beginning after December 15, 2018, and interim periods within those fiscal years. Early adoption of this standard is permitted. Bancorp is evaluating early adoption of ASU 2018-02. Upon adoption Bancorp will reclassify $506 thousand from other comprehensive income to retained earnings.
Item 7A. Quantitative and Qualitative Disclosures About Market Risk
Information required by this item is included in Item 7, “Management’s Discussion and Analysis of Financial Condition and Results of Operations” of this Form 10-K.
Item 8. Financial Statements and Supplementary Data
The following consolidated financial statements of Bancorp, and reports of independent registered public accounting firm and management are included below:
Consolidated Balance Sheets - December 31, 2017 and 2016
Consolidated Statements of Income - years ended December 31, 2017, 2016 and 2015
Consolidated Statements of Comprehensive Income - years ended December 31, 2017, 2016 and 2015
Consolidated Statements of Cash Flows - years ended December 31, 2017, 2016 and 2015
Notes to Consolidated Financial Statements
Report of Independent Registered Public Accounting Firm
Management’s Report on Consolidated Financial Statements
|
December 31, |
||||||||
|
(Dollars in thousands) |
2017 |
2016 |
||||||
|
Assets |
||||||||
|
Cash and due from banks |
$ | 41,982 | $ | 39,709 | ||||
|
Federal funds sold and interest bearing due from banks |
97,266 | 8,264 | ||||||
|
Cash and cash equivalents |
139,248 | 47,973 | ||||||
|
Mortgage loans held for sale |
2,964 | 3,213 | ||||||
|
Securities available-for-sale (amortized cost of $577,406 in 2017 and $571,936 in 2016) |
574,524 | 570,074 | ||||||
|
Federal Home Loan Bank stock and other securities |
7,646 | 6,347 | ||||||
|
Loans |
2,409,570 | 2,305,375 | ||||||
|
Less allowance for loan losses |
24,885 | 24,007 | ||||||
|
Net loans |
2,384,685 | 2,281,368 | ||||||
|
Premises and equipment, net |
41,655 | 42,384 | ||||||
|
Bank owned life insurance |
32,049 | 31,867 | ||||||
|
Accrued interest receivable |
8,369 | 6,878 | ||||||
|
Other assets |
48,506 | 49,377 | ||||||
|
Total assets |
$ | 3,239,646 | $ | 3,039,481 | ||||
|
Liabilities |
||||||||
|
Deposits |
||||||||
|
Non-interest bearing |
$ | 674,697 | $ | 680,156 | ||||
|
Interest bearing |
1,903,598 | 1,840,392 | ||||||
|
Total deposits |
2,578,295 | 2,520,548 | ||||||
|
Securities sold under agreements to repurchase |
70,473 | 67,595 | ||||||
|
Federal funds purchased |
161,352 | 47,374 | ||||||
|
Accrued interest payable |
232 | 144 | ||||||
|
Other liabilities |
46,192 | 38,873 | ||||||
|
Federal Home Loan Bank advances |
49,458 | 51,075 | ||||||
|
Total liabilities |
2,906,002 | 2,725,609 | ||||||
|
Stockholders’ equity |
||||||||
|
Preferred stock, no par value; 1,000,000 shares authorized; no shares issued or outstanding |
– | – | ||||||
|
Common stock, no par value; 40,000,000 shares authorized; 22,679,362 and 22,617,098 shares issued and outstanding in 2017 and 2016, respectively |
36,457 | 36,250 | ||||||
|
Additional paid-in capital |
31,924 | 26,682 | ||||||
|
Retained earnings |
267,193 | 252,439 | ||||||
|
Accumulated other comprehensive (loss) |
(1,930 | ) | (1,499 | ) | ||||
|
Total stockholders’ equity |
333,644 | 313,872 | ||||||
|
Total liabilities and stockholders’ equity |
$ | 3,239,646 | $ | 3,039,481 | ||||
|
See accompanying notes to consolidated financial statements. |
|
Years ended December 31, |
||||||||||||
|
(In thousands, except per share data) |
2017 |
2016 |
2015 |
|||||||||
|
Interest income |
||||||||||||
|
Loans |
$ | 99,874 | $ | 91,798 | $ | 83,371 | ||||||
|
Federal funds sold and interest bearing deposits |
1,330 | 491 | 263 | |||||||||
|
Mortgage loans held for sale |
191 | 237 | 249 | |||||||||
|
Securities |
||||||||||||
|
Taxable |
8,365 | 8,451 | 8,120 | |||||||||
|
Tax-exempt |
1,089 | 1,195 | 1,167 | |||||||||
|
Total interest income |
110,849 | 102,172 | 93,170 | |||||||||
|
Interest expense |
||||||||||||
|
Deposits |
5,975 | 3,943 | 3,739 | |||||||||
|
Securities sold under agreements to repurchase and other short term borrowing |
316 | 212 | 174 | |||||||||
|
Long term debt |
955 | 763 | 939 | |||||||||
|
Total interest expense |
7,246 | 4,918 | 4,852 | |||||||||
|
Net interest income |
103,603 | 97,254 | 88,318 | |||||||||
|
Provision for loan losses |
2,550 | 3,000 | 750 | |||||||||
|
Net interest income after provision for loan losses |
101,053 | 94,254 | 87,568 | |||||||||
|
Non-interest income |
||||||||||||
|
Wealth management and trust services |
20,505 | 19,155 | 18,026 | |||||||||
|
Deposit service charges |
6,461 | 6,253 | 6,010 | |||||||||
|
Debit and credit cards |
5,979 | 5,655 | 4,876 | |||||||||
|
Treasury management |
4,008 | 3,651 | 3,404 | |||||||||
|
Mortgage banking |
3,221 | 3,897 | 3,488 | |||||||||
|
(Loss) on sale of securities available-for-sale |
(232 | ) | – | – | ||||||||
|
Investment product sales commissions and fees |
2,200 | 2,145 | 1,994 | |||||||||
|
Bank owned life insurance |
1,159 | 871 | 889 | |||||||||
|
Other |
1,819 | 1,910 | 1,263 | |||||||||
|
Total non-interest income |
45,120 | 43,537 | 39,950 | |||||||||
|
Non-interest expenses |
||||||||||||
|
Compensation |
42,584 | 40,817 | 36,597 | |||||||||
|
Employee benefits |
9,987 | 8,368 | 8,112 | |||||||||
|
Net occupancy and equipment |
7,393 | 7,422 | 6,986 | |||||||||
|
Technology and communication |
8,525 | 7,619 | 6,891 | |||||||||
|
Marketing and business development |
2,716 | 2,464 | 2,579 | |||||||||
|
Postage, printing and supplies |
1,475 | 1,521 | 1,436 | |||||||||
|
Legal and professional |
2,393 | 1,869 | 1,832 | |||||||||
|
FDIC insurance |
960 | 1,181 | 1,258 | |||||||||
|
Amortization/impairment of investments in tax credit partnerships |
7,124 | 4,458 | 634 | |||||||||
|
Capital and deposit based taxes |
3,440 | 2,800 | 2,413 | |||||||||
|
Other |
4,394 | 3,001 | 4,660 | |||||||||
|
Total non-interest expenses |
90,991 | 81,520 | 73,398 | |||||||||
|
Income before income taxes |
55,182 | 56,271 | 54,120 | |||||||||
|
Income tax expense |
17,139 | 15,244 | 16,933 | |||||||||
|
Net income |
$ | 38,043 | $ | 41,027 | $ | 37,187 | ||||||
|
Net income per share, basic |
$ | 1.69 | $ | 1.84 | $ | 1.68 | ||||||
|
Net income per share, diluted |
$ | 1.66 | $ | 1.80 | $ | 1.65 | ||||||
|
Average common shares: |
||||||||||||
|
Basic |
22,532 | 22,356 | 22,088 | |||||||||
|
Diluted |
22,983 | 22,792 | 22,459 | |||||||||
See accompanying notes to consolidated financial statements.
|
Years ended December 31, |
||||||||||||
|
(In thousands) |
2017 |
2016 |
2015 |
|||||||||
|
Net income |
$ | 38,043 | $ | 41,027 | $ | 37,187 | ||||||
|
Other comprehensive income (loss), net of tax: |
||||||||||||
|
Unrealized (losses) gains on securities available-for-sale: |
||||||||||||
|
Unrealized (losses) gains arising during the period (net of tax of ($531), ($1,171), and ($839), respectively) |
(721 | ) | (2,176 | ) | (1,558 | ) | ||||||
|
Unrealized (losses) gains on hedging instruments: |
||||||||||||
|
Unrealized (losses) gains arising during the period (net of tax of $112, $24, and ($41), respectively) |
209 | 44 | (76 | ) | ||||||||
|
Minimum pension liability adjustment (net of tax of ($9), $1, and $69, respectively) |
(70 | ) | 1 | 114 | ||||||||
|
Reclassification adjustment for impairment of equity security realized in income (net of tax of $0, $0, and $36, respectively) |
– | – | 67 | |||||||||
|
Reclassification adjustment for securities losses reclassified out of other comprehensive income into loss on sale of securities available-for-sale (net of tax of $81, $0, and $0, respectively) |
151 | – | – | |||||||||
|
Other comprehensive (loss) income |
(431 | ) | (2,131 | ) | (1,453 | ) | ||||||
|
Comprehensive income |
$ | 37,612 | $ | 38,896 | $ | 35,734 | ||||||
|
See accompanying notes to consolidated financial statements. |
|
For each of the years in the three year period ended December 31, 2017 |
||||||||||||||||||||||||
|
Accumulated |
||||||||||||||||||||||||
|
Common stock |
Additional |
other |
||||||||||||||||||||||
|
|
Number of |
paid-in |
Retained |
comprehensive |
||||||||||||||||||||
|
(In thousands, except per share data) |
shares |
Amount |
capital |
earnings |
income (loss) |
Total |
||||||||||||||||||
|
Balance December 31, 2014 |
14,745 | $ | 10,035 | $ | 38,191 | $ | 209,584 | $ | 2,085 | $ | 259,895 | |||||||||||||
|
Net income |
– | – | – | 37,187 | – | 37,187 | ||||||||||||||||||
|
Other comprehensive loss, net of tax |
– | – | – | – | (1,453 | ) | (1,453 | ) | ||||||||||||||||
|
Stock compensation expense |
– | – | 2,134 | – | – | 2,134 | ||||||||||||||||||
|
Stock issued for share-based awards, net of withholdings to satisfy employee tax obligations upon award |
179 | 596 | 3,972 | (1,564 | ) | – | 3,004 | |||||||||||||||||
|
Cash dividends declared, $0.64 per share |
– | – | – | (14,248 | ) | – | (14,248 | ) | ||||||||||||||||
|
Shares repurchased or cancelled |
(5 | ) | (15 | ) | (117 | ) | 132 | – | – | |||||||||||||||
|
Balance December 31, 2015 |
14,919 | $ | 10,616 | $ | 44,180 | $ | 231,091 | $ | 632 | $ | 286,519 | |||||||||||||
|
Net income |
– | – | – | 41,027 | – | 41,027 | ||||||||||||||||||
|
Other comprehensive loss, net of tax |
– | – | – | – | (2,131 | ) | (2,131 | ) | ||||||||||||||||
|
Stock compensation expense |
– | – | 2,473 | – | – | 2,473 | ||||||||||||||||||
|
Stock issued for share-based awards, net of withholdings to satisfy employee tax obligations upon award |
214 | 711 | 5,217 | (3,804 | ) | – | 2,124 | |||||||||||||||||
|
3 for 2 stock split (see note 14) |
7,494 | 24,956 | (24,956 | ) | – | – | – | |||||||||||||||||
|
Cash dividends declared, $0.72 per share |
– | – | – | (16,140 | ) | – | (16,140 | ) | ||||||||||||||||
|
Shares repurchased or cancelled |
(10 | ) | (33 | ) | (232 | ) | 265 | – | – | |||||||||||||||
|
Balance December 31, 2016 |
22,617 | $ | 36,250 | $ | 26,682 | $ | 252,439 | $ | (1,499 | ) | $ | 313,872 | ||||||||||||
|
Net income |
– | – | – | 38,043 | – | 38,043 | ||||||||||||||||||
|
Other comprehensive loss, net of tax |
– | – | – | – | (431 | ) | (431 | ) | ||||||||||||||||
|
Stock compensation expense |
– | – | 2,892 | – | – | 2,892 | ||||||||||||||||||
|
Stock issued for share-based awards, net of withholdings to satisfy employee tax obligations upon award |
69 | 231 | 2,500 | (5,336 | ) | – | (2,605 | ) | ||||||||||||||||
|
Cash dividends declared, $0.80 per share |
– | – | – | (18,127 | ) | – | (18,127 | ) | ||||||||||||||||
|
Shares repurchased or cancelled |
(7 | ) | (24 | ) | (150 | ) | 174 | – | – | |||||||||||||||
|
Balance December 31, 2017 |
22,679 | $ | 36,457 | $ | 31,924 | $ | 267,193 | $ | (1,930 | ) | $ | 333,644 | ||||||||||||
|
See accompanying notes to consolidated financial statements. |
|
Years ended December 31, |
||||||||||||
|
(In thousands) |
2017 |
2016 |
2015 |
|||||||||
|
Operating activities |
||||||||||||
|
Net income |
$ | 38,043 | $ | 41,027 | $ | 37,187 | ||||||
|
Adjustments to reconcile net income to net cash provided by operating activities: |
||||||||||||
|
Provision (credit) for loan losses |
2,550 | 3,000 | 750 | |||||||||
|
Depreciation, amortization and accretion, net |
13,640 | 11,142 | 6,902 | |||||||||
|
Deferred income tax expense (benefit) |
3,971 | 276 | 847 | |||||||||
|
Loss on sale of securities available-for-sale |
232 | – | – | |||||||||
|
Impairment loss on available-for-sale securities |
– | – | 103 | |||||||||
|
Gains on sales of mortgage loans held for sale |
(1,989 | ) | (2,482 | ) | (2,167 | ) | ||||||
|
Origination of mortgage loans held for sale |
(97,623 | ) | (123,347 | ) | (116,385 | ) | ||||||
|
Proceeds from sale of mortgage loans held for sale |
99,861 | 129,416 | 115,499 | |||||||||
|
Bank owned life insurance income |
(1,159 | ) | (871 | ) | (889 | ) | ||||||
|
Proceeds from liquidation of private investment fund |
(92 | ) | – | – | ||||||||
|
(Gain) Loss on other real estate owned |
(39 | ) | (409 | ) | 147 | |||||||
|
Loss (gain) on the disposal of premises and equipment |
– | 202 | (51 | ) | ||||||||
|
Recovery of impairment loss on other assets held for investment |
– | (588 | ) | – | ||||||||
|
Stock compensation expense |
2,892 | 2,473 | 2,134 | |||||||||
|
Excess tax benefits from share-based compensation arrangements |
(1,463 | ) | (1,705 | ) | (673 | ) | ||||||
|
Increase in accrued interest receivable and other assets |
(13,848 | ) | (7,438 | ) | (2,540 | ) | ||||||
|
Increase in accrued interest payable and other liabilities |
8,700 | 12,566 | 2,307 | |||||||||
|
Net cash provided by operating activities |
53,676 | 63,262 | 43,171 | |||||||||
|
Investing activities |
||||||||||||
|
Purchases of securities available-for-sale |
(661,086 | ) | (478,798 | ) | (384,260 | ) | ||||||
|
Proceeds from sale of securities available-for-sale |
421 | – | 5,934 | |||||||||
|
Proceeds from maturities of securities available-for-sale |
652,411 | 468,271 | 320,952 | |||||||||
|
Purchase of Federal Home Loan Bank Stock |
(2,254 | ) | – | – | ||||||||
|
Proceeds from sale of Federal Home Loan Bank stock |
955 | – | – | |||||||||
|
Proceeds from liquidation of private investment fund |
92 | – | – | |||||||||
|
Net increase in loans |
(105,867 | ) | (275,718 | ) | (168,832 | ) | ||||||
|
Purchases of premises and equipment |
(2,786 | ) | (6,327 | ) | (3,459 | ) | ||||||
|
Proceeds from disposal of equipment |
– | 66 | – | |||||||||
|
Proceeds from mortality benefit of bank owned life insurance |
977 | – | – | |||||||||
|
Proceeds from sale of other real estate owned |
2,432 | 1,826 | 2,541 | |||||||||
|
Proceeds from the sale of other assets held for investment |
– | 1,108 | – | |||||||||
|
Net cash used in investing activities |
(114,705 | ) | (289,572 | ) | (227,124 | ) | ||||||
|
Financing activities |
||||||||||||
|
Net increase in deposits |
57,747 | 148,846 | 248,075 | |||||||||
|
Net increase (decrease) in securities sold under agreements to repurchase and federal funds purchased |
116,856 | 27,966 | (29,946 | ) | ||||||||
|
Proceeds from Federal Home Loan Bank advances |
120,000 | 289,000 | 108,200 | |||||||||
|
Repayments of Federal Home Loan Bank advances |
(121,617 | ) | (281,393 | ) | (101,564 | ) | ||||||
|
Proceeds (used for) and received from settlement of stock awards |
(216 | ) | 2,337 | 3,249 | ||||||||
|
Excess tax benefits from share-based compensation arrangements |
– | 1,705 | 673 | |||||||||
|
Common stock repurchases |
(2,389 | ) | (1,918 | ) | (918 | ) | ||||||
|
Cash dividends paid |
(18,077 | ) | (16,093 | ) | (14,224 | ) | ||||||
|
Net cash provided by financing activities |
152,304 | 170,450 | 213,545 | |||||||||
|
Net increase (decrease) in cash and cash equivalents |
91,275 | (55,860 | ) | 29,592 | ||||||||
|
Cash and cash equivalents at beginning of year |
47,973 | 103,833 | 74,241 | |||||||||
|
Cash and cash equivalents at end of period |
$ | 139,248 | $ | 47,973 | $ | 103,833 | ||||||
|
See accompanying notes to consolidated financial statements. |
Notes to Consolidated Financial Statements
(1) Summary of Significant Accounting Policies
Principles of Consolidation and Nature of Operations
The consolidated financial statements include accounts of Stock Yards Bancorp, Inc. (“Bancorp”) and its wholly owned subsidiary, Stock Yards Bank & Trust Company (“the Bank”). Significant intercompany transactions and accounts have been eliminated in consolidation. Certain prior year amounts have been reclassified to conform to 2017 presentation. Bancorp has evaluated subsequent events for recognition or disclosure up to the date on which financial statements were issued and determined there were none.
In addition to traditional commercial and personal banking activities, Bancorp has a wealth management and trust department offering a wide range of investment management, retirement planning, trust and estate administration and financial planning services. Bancorp’s primary market area is Louisville, Kentucky and surrounding communities including southern Indiana. Other markets include Indianapolis, Indiana and Cincinnati, Ohio.
Basis of Financial Statement Presentation and Use of Estimates
The consolidated financial statements of Bancorp and its subsidiary have been prepared in conformity with U.S. generally accepted accounting principles (“US GAAP”) and conform to predominant practices within the banking industry. In preparing the consolidated financial statements, management is required to make estimates and assumptions that affect the reported amounts of certain assets and liabilities and disclosure of contingent assets and liabilities at the date of the financial statements and the reported amounts of related revenues and expenses during the reporting period. Actual results could differ from those estimates. Material estimates particularly susceptible to significant change relate to determination of the allowance for loan losses, and income tax assets, liabilities and expense.
Cash Equivalents and Cash Flows
Cash and cash equivalents include cash and due from banks, federal funds sold and interest bearing due from banks as segregated in the accompanying consolidated balance sheets. The following supplemental cash flow information addresses certain cash payments and noncash transactions for each of the years in the three-year period ended December 31, 2017 as follows:
|
(In thousands) |
Years ended December 31, |
|||||||||||
|
2017 |
2016 |
2015 |
||||||||||
|
Cash payments: |
||||||||||||
|
Income tax payments |
$ | 15,838 | $ | 12,860 | $ | 13,831 | ||||||
|
Cash paid for interest |
7,158 | 4,901 | 4,856 | |||||||||
|
Non-cash transactions: |
||||||||||||
|
Transfers from loans to other real estate owned |
$ | – | $ | 1,916 | $ | 1,146 | ||||||
Securities
All of Bancorp’s investments are available-for-sale. Securities available-for-sale include securities that may be sold in response to changes in interest rates, resultant prepayment risk and other factors related to interest rate and prepayment risk changes. Securities available-for-sale are carried at fair value with unrealized gains or losses, net of tax effect, included in stockholders’ equity. Amortization of premiums and accretion of discounts are recorded using the interest method over the expected life of the security. Gains or losses on sales of securities are computed on a specific identification basis. Declines in fair value of investment securities available-for-sale (with certain exceptions for debt securities noted below) that are deemed to be other-than-temporary are charged to earnings as a realized loss, and a new cost basis for the securities is established. In evaluating other-than-temporary impairment, management considers the length of time and extent to which fair value has been less than cost, financial condition and near-term prospects of the issuer, and the intent and ability of Bancorp to retain its investment in the issuer for a period of time sufficient to allow for any anticipated recovery in fair value in the near term. Declines in fair value of debt securities below amortized cost are deemed to be other-than-temporary in circumstances where: (1) Bancorp has the intent to sell a security; (2) it is more likely than not that Bancorp will be required to sell the security before recovery of its amortized cost basis; or (3) Bancorp does not expect to recover the entire amortized cost basis of the security. If Bancorp intends to sell a security or if it is more likely than not that Bancorp will be required to sell the security before recovery, an other-than-temporary impairment write-down is recognized in earnings equal to the difference between the security’s amortized cost basis and its fair value. If Bancorp does not intend to sell the security or it is not more likely than not that it will be required to sell the security before recovery, the other-than-temporary impairment write-down is separated into an amount representing credit loss, which is recognized in earnings, and an amount related to all other factors, which is recognized in other comprehensive income. Declines in value judged to be other-than-temporary are included in other non-interest expense in the consolidated statements of income. See Note 4 to Bancorp’s consolidated financial statements for additional information on investment securities.
Mortgage Loans Held for Sale
Mortgage loans held for sale are initially recorded at the lower of cost or market value on an individual loan basis. The sales prices of all of these loans are covered by investor commitments.
Loans
Loans are stated at the unpaid principal balance plus deferred loan origination fees, net of deferred loan costs. Loan fees, net of any costs, are deferred and amortized over the life of the related loan on an effective yield basis. Interest income on loans is recorded on the accrual basis except for those loans in a non-accrual income status. Loans are placed in a non-accrual income status when prospects for recovering both principal and accrued interest are considered doubtful or when a default of principal or interest has existed for 90 days or more unless such loan is well secured and in the process of collection. When a loan is placed on non-accrual status, any interest previously accrued but not yet collected is reversed against current income. No interest income is recorded while a loan is on non-accrual until principal has been fully collected. Non-accrual loans may be returned to accrual status once prospects for recovering both principal and accrued interest are reasonably assured. Loans are accounted for as troubled debt restructurings (TDRs) when Bancorp, for economic or legal reasons related to the debtor’s financial difficulties, grants a concession to the debtor that it would not otherwise consider. If a loan is restructured at a market rate for a new loan with comparable risk, no principal forgiveness has been granted, and the loan is not impaired based on the terms specified by the restructuring agreement, it shall be removed from TDR status generally after six months of performance.
Loans are classified as impaired when it is probable Bancorp will be unable to collect interest and principal according to the terms of the loan agreement. These loans are measured based on the present value of future cash flows discounted at the loans’ effective interest rate or at the estimated fair value of the loans’ collateral, if applicable. Impaired loans consist of loans in non-accrual status and loans accounted for as troubled debt restructuring.
Allowance for Loan Losses
The allowance for loan losses is management’s estimate of probable losses inherent in the loan portfolio as of the balance sheet date. Loan losses are charged against the allowance when management believes the uncollectibility of a loan balance is confirmed. Subsequent recoveries, if any, are credited to the allowance.
Bancorp’s allowance methodology is driven by risk ratings, historical losses, and qualitative factors. Assumptions include many factors such as changes in borrowers’ financial condition or historical loss ratios related to certain loan portfolios which may or may not be indicative of future losses. To the extent that management’s assumptions prove incorrect, the results from operations could be materially affected by a higher or lower provision for loan losses. In the first quarter of 2017, Bancorp extended the historical period used to capture Bancorp’s historical loss ratios from 24 quarters to 28 quarters. This extension of the historical period used to capture Bancorp’s historical loss ratios was applied to all classes and segments of our loan portfolio. The expansion of the look-back period for the quantitative historical loss rate caused us to review the overall methodology for the qualitative factors to ensure we were appropriately capturing the risk not addressed in the quantitative historical loss rate. The effect of the extension of the look-back period to 28 quarters resulted in a net decrease to the calculated quantitative portion of the allowance, but this was more than offset by an increase to the qualitative factors. The net impact of the extension of the look-back period was an increase in the allowance during the first quarter of 2017 of approximately $474 thousand. The change in methodology was consistent with management’s judgment regarding the risk in the loan portfolio and consistent with internal analysis showing continued strong asset quality not only in the Company’s loan portfolio, but the Bank’s peer group as well, validating the continuation of the current economic cycle and thus the reasoning to extend the look-back period. Management believes the extension of the look-back period is appropriate to capture the impact of a full economic cycle and provides sufficient loss observations to develop a reliable estimate. Management will continue to evaluate the appropriateness of the look-back period based on the status of the economic cycle.
Bancorp’s allowance calculation includes allocations to loan portfolio segments for qualitative factors including, among other factors, local economic and business conditions, the quality and experience of lending staff and management, exceptions to lending policies, levels of and trends in past due loans and loan classifications, concentrations of credit such as collateral type, trends in portfolio growth, trends in the value of underlying collateral for collateral-dependent loans, effect of other external factors such as the national economic and business trends, and the quality and depth of the loan review function. Bancorp utilizes the sum of all allowance amounts derived as described above as the appropriate level of allowance for loan and lease losses. Changes in the criteria used in this evaluation or the availability of new information could cause the allowance to be increased or decreased in future periods.
Based on this quantitative and qualitative analysis, provisions (reductions) are made to the allowance for loan losses. Such provisions (reductions) are reflected as a charge against (benefit to) current earnings in Bancorp’s consolidated statements of income.
The adequacy of the allowance for loan losses is monitored by executive management and reported quarterly to the Audit Committee of the Board of Directors. This committee has approved the overall methodology. Various regulatory agencies, as an integral part of their examination process, periodically review the adequacy of Bancorp’s allowance for loan losses. Such agencies may require Bancorp to make additional provisions to the allowance based upon their judgments about information available to them at the time of their examinations.
The accounting policy related to the allowance for loan losses is applicable to the commercial banking segment of Bancorp.
Acquired loans
Bancorp acquired loans in 2013 as part of the acquisition referenced in Note 3 to the consolidated financial statements. Acquired loans were initially recorded at their acquisition date fair values. Credit losses in the loans are included in the determination of the fair value of the loans at the acquisition date. Fair values for acquired loans were based on a discounted cash flow methodology that involves assumptions and judgments as to credit risk, default rates, loss severity, collateral values, discount rates, payment speeds, prepayment risk, and liquidity risk at the time of acquisition.
Acquired loans that had evidence of deterioration in credit quality since origination and for which it was probable, at acquisition, that Bancorp would be unable to collect all contractually required payments were specifically identified and analyzed. The excess of cash flows expected at acquisition over the estimated fair value is referred to as accretable discount and is recognized as interest income over the remaining life of the loan. The difference between contractually required payments at acquisition and the cash flows expected to be collected at acquisition is referred to as non-accretable discount. Subsequent decreases to the expected cash flows require Bancorp to evaluate the need for an allowance for loan losses on these loans. Charge-offs of the principal amount on credit-impaired acquired loans would be first applied to non-accretable discount. Periodically the loans are re-evaluated to determine if subsequent credit deterioration has occurred or if cash flow expectations have improved. Based upon the evaluation loans may be reclassified between the accretable and non-accretable categories.
For acquired loans that are not deemed impaired at acquisition, the methods used to estimate the required allowance for loan losses for acquired loans is the same for originated loans except that any initial fair value adjustment is taken into consideration when calculating any required allowance.
Premises and Equipment
Premises and equipment are carried at cost, less accumulated depreciation and amortization. Depreciation of premises and equipment is computed using straight-line methods over the estimated useful lives of the assets ranging from 3 to 40 years. Leasehold improvements are amortized on the straight-line method over the terms of the related leases, including expected renewals, or over the useful lives of the improvements, whichever is shorter. Maintenance and repairs are expensed as incurred while major additions and improvements are capitalized.
Other Assets
Bank-owned life insurance (“BOLI”) is carried at net realizable value, which considers any applicable surrender charges. Also, Bancorp maintains life insurance policies in conjunction with its non-qualified defined benefit and non-qualified compensation plans.
Other real estate is carried at the lower of cost or estimated fair value minus estimated selling costs. Any write downs to fair value at the date of acquisition are charged to the allowance for loan losses. In certain situations, improvements to prepare assets for sale are capitalized if those costs increase the estimated fair value of the asset. Expenses incurred in maintaining assets, write downs to reflect subsequent declines in value, and realized gains or losses are reflected in operations and are included in non-interest income and expense.
Mortgage servicing rights (MSRs) are amortized in proportion to and over the period of estimated net servicing income, considering appropriate prepayment assumptions. MSRs are evaluated quarterly for impairment by comparing the carrying value to fair value.
Goodwill is measured and evaluated at least annually for impairment. No impairment charges have been deemed necessary or recorded to date, as the fair value is substantially in excess of the carrying value.
Securities Sold Under Agreements to Repurchase
Bancorp enters into sales of securities under agreement to repurchase. Such repurchase agreements are considered financing agreements, and mature within one business day from the transaction date. Accordingly, the obligation to repurchase assets sold is reflected as a liability in the consolidated balance sheets of Bancorp. Repurchase agreements are collateralized by debt securities which are owned and under the control of Bancorp. These agreements are used in conjunction with collateralized corporate customer cash management accounts.
Income Taxes
Bancorp accounts for income taxes using the asset and liability method. The objective of the asset and liability method is to establish deferred tax assets and liabilities for temporary differences between the financial reporting and the tax bases of Bancorp’s assets and liabilities at enacted tax rates expected to be in effect when such amounts are realized or settled. The effect on deferred tax assets and liabilities of a change in tax rates is recognized in the statement of income in the period that includes the enactment date. These balances were previously recorded using a 35% Federal marginal tax rate. The Tax Cuts and Jobs Act was enacted on December 22, 2017 requiring an immediate recalculation of Bancorp’s net deferred tax asset. The remeasurement was made using the 21% Federal marginal tax rate which became effective January 1, 2018, and resulted in $5.9 million of additional income tax expense in the fourth quarter of 2017.
Bancorp periodically invests in certain partnerships with customers that yield historic tax credits, which are accounted for using the flow through method, which approximates the equity method, and/or low-income housing tax credits as well as tax deductible losses, which are accounted for using the effective yield method for older transactions or proportional amortization method for more recent transactions. The tax benefit of these investments exceeds amortization/impairment expense associated with them, resulting in a positive impact on net income.
Realization of deferred tax assets associated with the investment in partnerships is dependent upon generating sufficient taxable capital gain income prior to their expiration. A valuation allowance to reflect management’s estimate of the temporary deductible differences that may expire prior to their utilization has been recorded at year-end 2017 and 2016.
To the extent unrecognized income tax benefits become realized or the related accrued interest is no longer necessary, Bancorp’s provision for income taxes would be favorably impacted. As of December 31, 2017 and 2016, the gross amount of unrecognized tax benefits was $40 thousand, details of which are included in Note 8 to these consolidated financials. If recognized, the tax benefits would reduce tax expense and accordingly, increase net income. The amount of unrecognized tax benefits may increase or decrease in the future for various reasons including adding amounts for current tax year positions, expiration of open income tax returns due to statutes of limitation, changes in management’s judgment about the level of uncertainty, status of examination, litigation and legislative activity and the addition or elimination of uncertain tax positions. Stock Yards Bancorp, Inc. and its wholly-owned subsidiary file consolidated income tax returns in applicable jurisdictions.
Bancorp’s policy is to report interest and penalties, if any, related to unrecognized tax benefits in income tax expense. As of December 31, 2017 and 2016, the amount accrued for the potential payment of interest and penalties was immaterial.
Net Income Per Share
Basic net income per common share is determined by dividing net income by the weighted average number of shares of common stock outstanding. Diluted net income per share is determined by dividing net income by the weighted average number of shares of common stock outstanding plus the weighted average number of shares that would be issued upon exercise of dilutive options and stock appreciation rights, assuming proceeds are used to repurchase shares under the treasury stock method.
Comprehensive Income
Comprehensive income is defined as the change in equity (net assets) of a business enterprise during a period from transactions and other events and circumstances from non-owner sources. For Bancorp, this includes net income, changes in unrealized gains and losses on available-for-sale investment securities and cash flow hedging instruments, net of reclassification adjustments and taxes, and minimum pension liability adjustments, net of taxes.
Segment Information
Bancorp provides a broad range of financial services to individuals, corporations and others through its 37 full service banking locations as of December 31, 2017. These services include loan and deposit services, cash management services, securities brokerage activities, mortgage origination and wealth management and trust activities. Bancorp’s operations are considered by management to be aggregated in two reportable operating segments: commercial banking and wealth management and trust.
Stock-Based Compensation
For all awards, stock-based compensation expense is recognized over the period in which it is earned based on the grant-date fair value of the portion of stock-based payment awards that are ultimately expected to vest, reduced for estimated forfeitures. US GAAP requires forfeitures to be estimated at the time of grant and revised, if necessary, in subsequent periods if actual forfeitures differ from those estimates.
Derivatives
Bancorp uses derivative financial instruments as part of its interest rate risk management, including interest rate swaps. US GAAP establishes accounting and reporting standards for derivative instruments and hedging activities. As required by US GAAP, Bancorp’s interest rate swaps are recognized as other assets and liabilities in the consolidated balance sheet at fair value. Accounting for changes in the fair value of derivatives depends on the intended use of the derivative and the resulting designation. Derivatives used to hedge exposure to variability in expected future cash flows, or other types of forecasted transactions, are considered cash flow hedges. To qualify for hedge accounting, Bancorp must comply with detailed rules and documentation requirements at inception of the hedge, and hedge effectiveness is assessed at inception and periodically throughout the life of each hedging relationship. Hedge ineffectiveness, if any, is measured periodically throughout the life of the hedging relationship.
For derivatives designated as cash flow hedges, the effective portion of changes in fair value of the derivative is initially reported in other comprehensive income and subsequently reclassified to interest income or expense when the hedged transaction affects earnings, while the ineffective portion of changes in fair value of derivative, if any, is recognized immediately in other noninterest income. Bancorp assesses effectiveness of each hedging relationship by comparing the cumulative changes in cash flows of the derivative hedging instrument with the cumulative changes in cash flows of the designated hedged item or transaction. No component of the change in the fair value of the hedging instrument is excluded from the assessment of hedge effectiveness.
Periodically, Bancorp enters into an interest rate swap transaction with a borrower, who desires to hedge exposure to rising interest rates, while at the same time entering into an offsetting interest rate swap, with substantially matching terms, with another approved independent counterparty. Because of matching terms of offsetting contracts and the collateral provisions mitigating any non-performance risk, changes in fair value subsequent to initial recognition have an insignificant effect on earnings. Because these derivative instruments have not been designated as hedging instruments, the derivative instruments are recognized on the consolidated balance sheet at fair value, with changes in fair value, due to changes in prevailing interest rates, recorded in other noninterest income.
Bancorp had no fair value hedging relationships at December 31, 2017 or 2016. Bancorp does not use derivatives for trading or speculative purposes. See Note 22 to the consolidated financial statements for more information regarding derivatives.
(2) Restrictions on Cash and Due from Banks
Bancorp is required to maintain an average reserve balance in cash or with the Federal Reserve Bank relating to customer deposits. The amount of those required reserve balances was approximately $8,071,000 and $6,338,000 at December 31, 2017 and 2016, respectively, and is included in federal funds sold and interest bearing due from banks in the consolidated balance sheet.
(3) Acquisition
In 2013, Bancorp completed the acquisition of 100% of the outstanding shares of THE BANCorp, Inc. (“Oldham”), parent company of THE BANK – Oldham County, Inc. The transaction was accounted for using the acquisition method of accounting and, accordingly, assets acquired, liabilities assumed and consideration transferred were recorded at estimated fair value on the acquisition date. Bancorp recorded a core deposit intangible of $2.5 million which is being amortized using methods that anticipate the life of the underlying deposits to which the intangible is attributable. At December 31, 2017, the unamortized core deposit intangible was $1.2 million. See Note 7 for details on the core deposit intangible.
(4) Securities
All of Bancorp’s securities are available-for-sale. The amortized cost, unrealized gains and losses, and fair value of these securities follow:
|
(In thousands) |
Amortized |
Unrealized |
Fair |
|||||||||||||
|
December 31, 2017 |
cost |
Gains |
Losses |
value | ||||||||||||
|
U.S. Treasury and other U.S. government obligations |
$ | 149,996 | $ | – | $ | (12 | ) | $ | 149,984 | |||||||
|
Government sponsored enterprise obligations |
214,852 | 474 | (1,482 | ) | 213,844 | |||||||||||
|
Mortgage-backed securities - government agencies |
163,571 | 383 | (2,447 | ) | 161,507 | |||||||||||
|
Obligations of states and political subdivisions |
48,987 | 365 | (163 | ) | 49,189 | |||||||||||
|
Total securities available-for-sale |
$ | 577,406 | $ | 1,222 | $ | (4,104 | ) | $ | 574,524 | |||||||
|
(In thousands) |
Amortized |
Unrealized |
Fair |
|||||||||||||
|
December 31, 2016 |
cost |
Gains |
Losses |
value | ||||||||||||
|
U.S. Treasury and other U.S. government obligations |
$ | 74,997 | $ | 1 | $ | – | $ | 74,998 | ||||||||
|
Government sponsored enterprise obligations |
268,784 | 800 | (1,494 | ) | 268,090 | |||||||||||
|
Mortgage-backed securities - government agencies |
170,344 | 735 | (2,236 | ) | 168,843 | |||||||||||
|
Obligations of states and political subdivisions |
57,158 | 682 | (396 | ) | 57,444 | |||||||||||
|
Corporate equity securities |
653 | 46 | – | 699 | ||||||||||||
|
Total securities available-for-sale |
$ | 571,936 | $ | 2,264 | $ | (4,126 | ) | $ | 570,074 | |||||||
Corporate equity securities, included in the available-for-sale portfolio at December 31, 2016, consisted of common stock in a publicly-traded small business investment company. Bancorp sold this security in 2017 for a loss of $263 thousand. One security was called prior to maturity in the third quarter of 2017 resulting in the receipt of a $31 thousand pre-payment penalty. The penalty income was classified as a realized gain on the call of available for sale securities. In 2016, Bancorp did not sell any securities. In 2015 Bancorp sold securities with total fair market value of $5.9 million, generating no gain or loss. These securities consisted of agency and mortgage-backed securities with small remaining balances. Sales were made in the ordinary course of portfolio management. Management has the intent and ability to hold all remaining investment securities available-for-sale for the foreseeable future.
A summary of the securities available-for-sale by maturity as of December 31, 2017 is shown below.
| (In thousands) | ||||||||
|
Securities available-for-sale |
Amortized cost |
Fair value |
||||||
|
Due within 1 year |
$ | 187,792 | $ | 187,775 | ||||
|
Due after 1 but within 5 years |
97,119 | 96,441 | ||||||
|
Due after 5 but within 10 years |
13,807 | 13,687 | ||||||
|
Due after 10 years |
115,117 | 115,114 | ||||||
|
Mortgage-backed securities - government agencies |
163,571 | 161,507 | ||||||
|
Total securities available for sale |
$ | 577,406 | $ | 574,524 | ||||
Actual maturities may differ from contractual maturities because some issuers have the right to call or prepay obligations with or without call or prepayment penalties. The investment portfolio includes agency mortgage-backed securities, which are guaranteed by agencies such as the FHLMC, FNMA, and GNMA. These securities differ from traditional debt securities primarily in that they may have uncertain principal payment dates and are priced based on estimated prepayment rates on the underlying collateral.
Securities with a carrying value of $384.7 million and $380.4 million were pledged at December 31, 2017 and 2016, respectively, to secure accounts of commercial depositors in cash management accounts, public deposits, and uninsured cash balances for wealth management and trust accounts.
At December 31, 2017 and 2016, there were no holdings of securities of any one issuer, other than the U.S. Government and its agencies, in an amount greater than 10% of stockholders’ equity.
Securities with unrealized losses not recognized in the statements of income are as follows:
|
(In thousands) |
Less than 12 months |
12 months or more |
Total |
|||||||||||||||||||||
|
Fair |
Unrealized |
Fair |
Unrealized |
Fair |
Unrealized |
|||||||||||||||||||
|
December 31, 2017 |
value |
losses |
value |
losses |
value |
losses |
||||||||||||||||||
|
U.S. Treasury and U.S. obligations |
$ | 149,984 | $ | (12 | ) | $ | – | $ | – | $ | 149,984 | $ | (12 | ) | ||||||||||
|
Government sponsored enterprise obligations |
95,139 | (586 | ) | 49,870 | (896 | ) | 145,009 | (1,482 | ) | |||||||||||||||
|
Mortgage-backed securities - government agencies |
69,290 | (440 | ) | 67,047 | (2,007 | ) | 136,337 | (2,447 | ) | |||||||||||||||
|
Obligations of states and political subdivisions |
22,366 | (107 | ) | 5,064 | (56 | ) | 27,430 | (163 | ) | |||||||||||||||
|
Total temporarily impaired securities |
$ | 336,779 | $ | (1,145 | ) | $ | 121,981 | $ | (2,959 | ) | $ | 458,760 | $ | (4,104 | ) | |||||||||
|
December 31, 2016 |
||||||||||||||||||||||||
|
Government sponsored enterprise obligations |
$ | 154,951 | $ | (1,344 | ) | $ | 3,485 | $ | (150 | ) | $ | 158,436 | $ | (1,494 | ) | |||||||||
|
Mortgage-backed securities - government agencies |
115,374 | (1,873 | ) | 9,914 | (363 | ) | 125,288 | (2,236 | ) | |||||||||||||||
|
Obligations of states and political subdivisions |
29,893 | (380 | ) | 1,478 | (16 | ) | 31,371 | (396 | ) | |||||||||||||||
|
Total temporarily impaired securities |
$ | 300,218 | $ | (3,597 | ) | $ | 14,877 | $ | (529 | ) | $ | 315,095 | $ | (4,126 | ) | |||||||||
The applicable dates for determining when securities are in an unrealized loss position are December 31, 2017 and 2016. As such, it is possible that a security had a market value lower than its amortized cost on other days during the past twelve months, but is not in the “Investments with an unrealized loss of less than 12 months” category above.
Unrealized losses on Bancorp’s investment securities portfolio have not been recognized as expense because the securities are of high credit quality, and the decline in fair values is due to changes in the prevailing interest rate environment since the purchase date. Fair value is expected to recover as securities reach their maturity date and/or the interest rate environment returns to conditions similar to when these securities were purchased. Because management does not intend to sell the investments, and it is not likely that Bancorp will be required to sell the investments before recovery of their amortized cost bases, which may be maturity, Bancorp does not consider these securities to be other-than-temporarily impaired at December 31, 2017.
FHLB stock and other securities are investments held by Bancorp which are not readily marketable and are carried at cost. This category consists of holdings of Federal Home Loan Bank of Cincinnati (“FHLB”) stock which are required for access to FHLB borrowing, and are classified as restricted securities.
(5) Loans
The composition of loans by primary loan portfolio class follows:
|
December 31, |
||||||||
|
(In thousands) |
2017 |
2016 |
||||||
|
Commercial and industrial |
$ | 779,014 | $ | 736,841 | ||||
|
Construction and development, excluding undeveloped land |
195,912 | 192,348 | ||||||
|
Undeveloped land |
18,988 | 21,496 | ||||||
|
Real estate mortgage: |
||||||||
|
Commercial investment |
594,902 | 538,886 | ||||||
|
Owner occupied commercial |
398,685 | 408,292 | ||||||
|
1-4 family residential |
262,110 | 249,498 | ||||||
|
Home equity - first lien |
57,110 | 55,325 | ||||||
|
Home equity - junior lien |
63,981 | 67,519 | ||||||
|
Subtotal: Real estate mortgage |
1,376,788 | 1,319,520 | ||||||
|
Consumer |
38,868 | 35,170 | ||||||
|
Total loans |
$ | 2,409,570 | $ | 2,305,375 | ||||
Fees and costs of originating loans are deferred at origination and amortized over the life of the loan. Loan balances reported herein include deferred loan origination fees, net of deferred loan costs. At December 31, 2017 and 2016, net deferred loan origination costs exceeded deferred loan origination fees, resulting in net negative balances of $600 thousand and $459 thousand, respectively. The higher net balance at December 31, 2017, as compared to the same point in 2016, is primarily due to a reduction in origination fees attributed to lower loan volume, as well as increased costs arising from increases in salaries and benefits expenses.
Bancorp’s credit exposure is diversified with secured and unsecured loans to individuals and businesses. No specific industry concentration exceeds ten percent of loans. While Bancorp has a diversified loan portfolio, a customer’s ability to honor contracts is somewhat dependent upon the economic stability and/or industry in which that customer does business. Loans outstanding and related unfunded commitments are primarily concentrated within Bancorp’s current market areas, which encompass the Louisville, Indianapolis and Cincinnati metropolitan markets.
Bancorp occasionally enters into loan participation agreements with other banks in the ordinary course of business to diversify credit risk. For certain sold participation loans, Bancorp has retained effective control of the loans, typically by restricting the participating institutions from pledging or selling their share of the loan without permission from Bancorp. US GAAP requires the participated portion of these loans to be recorded as secured borrowings. The participated portions of these loans are included in the commercial and industrial loan (C&I) totals above, and a corresponding liability is reflected in other liabilities. At December 31, 2017 and 2016, the total participated portions of loans of this nature were $18.2 million and $15.8 million respectively.
Loans to directors and their associates, including loans to companies for which directors are principal owners and executive officers are presented in the following table.
|
(In thousands) |
Year ended December 31, |
|||||||
|
Loans to directors and executive officers |
2017 |
2016 |
||||||
|
Balance as of January 1 |
$ | 969 | $ | 866 | ||||
|
New loans |
– | – | ||||||
|
Repayment of term loans |
(175 | ) | (340 | ) | ||||
|
Changes in balances of revolving lines of credit |
(165 | ) | 443 | |||||
|
Balance as of December 31 |
$ | 629 | $ | 969 | ||||
None of the loans to directors and executive officers were past due or considered potential problem loans during 2017 or 2016.
The following tables present balances in the recorded investment in loans and allowance for loan losses by portfolio segment and based on impairment evaluation method as of December 31, 2017, 2016 and 2015.
|
(In thousands) |
Type of loan |
|||||||||||||||||||||||
|
Construction |
||||||||||||||||||||||||
|
and development |
||||||||||||||||||||||||
|
Commercial |
excluding |
|||||||||||||||||||||||
|
and |
undeveloped |
Undeveloped |
Real estate |
|||||||||||||||||||||
|
December 31, 2017 |
industrial |
land |
land |
mortgage |
Consumer |
Total |
||||||||||||||||||
|
Loans |
$ | 779,014 | $ | 195,912 | $ | 18,988 | $ | 1,376,788 | $ | 38,868 | $ | 2,409,570 | ||||||||||||
|
Loans individually evaluated for impairment |
$ | 1,176 | $ | 664 | $ | 474 | $ | 5,066 | $ | – | $ | 7,380 | ||||||||||||
|
Loans collectively evaluated for impairment |
$ | 777,838 | $ | 195,248 | $ | 18,514 | $ | 1,371,246 | $ | 38,868 | $ | 2,401,714 | ||||||||||||
|
Loans acquired with deteriorated credit quality |
$ | – | $ | – | $ | – | $ | 476 | $ | – | $ | 476 | ||||||||||||
|
Construction |
||||||||||||||||||||||||
|
and development |
||||||||||||||||||||||||
|
Commercial |
excluding |
|||||||||||||||||||||||
|
and |
undeveloped |
Undeveloped |
Real estate |
|||||||||||||||||||||
|
industrial |
land |
land |
mortgage |
Consumer |
Total |
|||||||||||||||||||
|
Allowance for loan losses |
||||||||||||||||||||||||
|
At December 31, 2016 |
$ | 10,483 | $ | 1,923 | $ | 684 | $ | 10,573 | $ | 344 | $ | 24,007 | ||||||||||||
|
Provision (credit) |
2,373 | (199 | ) | (163 | ) | 383 | 156 | 2,550 | ||||||||||||||||
|
Charge-offs |
(1,782 | ) | – | – | (98 | ) | (549 | ) | (2,429 | ) | ||||||||||||||
|
Recoveries |
202 | – | – | 154 | 401 | 757 | ||||||||||||||||||
|
At December 31, 2017 |
$ | 11,276 | $ | 1,724 | $ | 521 | $ | 11,012 | $ | 352 | $ | 24,885 | ||||||||||||
|
Allowance for loans individually evaluated for impairment |
$ | 34 | $ | – | $ | – | $ | 14 | $ | – | $ | 48 | ||||||||||||
|
Allowance for loans collectively evaluated for impairment |
$ | 11,242 | $ | 1,724 | $ | 521 | $ | 10,998 | $ | 352 | $ | 24,837 | ||||||||||||
|
Allowance for loans acquired with deteriorated credit quality |
$ | – | $ | – | $ | – | $ | – | $ | – | $ | – | ||||||||||||
|
(In thousands) |
Type of loan |
|||||||||||||||||||||||
|
Construction |
||||||||||||||||||||||||
|
and development |
||||||||||||||||||||||||
|
Commercial |
excluding |
|||||||||||||||||||||||
|
and |
undeveloped |
Undeveloped |
Real estate |
|||||||||||||||||||||
|
December 31, 2016 |
industrial |
land |
land |
mortgage |
Consumer |
Total |
||||||||||||||||||
|
Loans |
$ | 736,841 | $ | 192,348 | $ | 21,496 | $ | 1,319,520 | $ | 35,170 | $ | 2,305,375 | ||||||||||||
|
Loans individually evaluated for impairment |
$ | 2,682 | $ | 538 | $ | 474 | $ | 2,516 | $ | 59 | $ | 6,269 | ||||||||||||
|
Loans collectively evaluated for impairment |
$ | 734,139 | $ | 191,810 | $ | 21,022 | $ | 1,316,400 | $ | 35,111 | $ | 2,298,482 | ||||||||||||
|
Loans acquired with deteriorated credit quality |
$ | 20 | $ | – | $ | – | $ | 604 | $ | – | $ | 624 | ||||||||||||
|
Construction |
||||||||||||||||||||||||
|
and development |
||||||||||||||||||||||||
|
Commercial |
excluding |
|||||||||||||||||||||||
|
and |
undeveloped |
Undeveloped |
Real estate |
|||||||||||||||||||||
|
industrial |
land |
land |
mortgage |
Consumer |
Total |
|||||||||||||||||||
|
Allowance for loan losses |
||||||||||||||||||||||||
|
At December 31, 2015 |
$ | 8,645 | $ | 1,760 | $ | 814 | $ | 10,875 | $ | 347 | $ | 22,441 | ||||||||||||
|
Provision (credit) |
2,775 | 275 | (130 | ) | (68 | ) | 148 | 3,000 | ||||||||||||||||
|
Charge-offs |
(1,216 | ) | (133 | ) | – | (576 | ) | (568 | ) | (2,493 | ) | |||||||||||||
|
Recoveries |
279 | 21 | – | 342 | 417 | 1,059 | ||||||||||||||||||
|
At December 31, 2016 |
$ | 10,483 | $ | 1,923 | $ | 684 | $ | 10,573 | $ | 344 | $ | 24,007 | ||||||||||||
|
Allowance for loans individually evaluated for impairment |
$ | 1,207 | $ | – | $ | 1 | $ | – | $ | 59 | $ | 1,267 | ||||||||||||
|
Allowance for loans collectively evaluated for impairment |
$ | 9,276 | $ | 1,923 | $ | 683 | $ | 10,573 | $ | 285 | $ | 22,740 | ||||||||||||
|
Allowance for loans acquired with deteriorated credit quality |
$ | – | $ | – | $ | – | $ | – | $ | – | $ | – | ||||||||||||
|
(In thousands) |
Type of loan |
|||||||||||||||||||||||
|
Construction |
||||||||||||||||||||||||
|
and development |
||||||||||||||||||||||||
|
Commercial |
excluding |
|||||||||||||||||||||||
|
and |
undeveloped |
Undeveloped |
Real estate |
|||||||||||||||||||||
|
December 31, 2015 |
industrial |
land |
land |
mortgage |
Consumer |
Total |
||||||||||||||||||
|
Loans |
$ | 644,398 | $ | 134,482 | $ | 21,185 | $ | 1,197,411 | $ | 35,531 | $ | 2,033,007 | ||||||||||||
|
Loans individually evaluated for impairment |
$ | 4,635 | $ | – | $ | – | $ | 4,050 | $ | 68 | $ | 8,753 | ||||||||||||
|
Loans collectively evaluated for impairment |
$ | 639,760 | $ | 134,160 | $ | 21,185 | $ | 1,192,864 | $ | 35,463 | $ | 2,023,432 | ||||||||||||
|
Loans acquired with deteriorated credit quality |
$ | 3 | $ | 322 | $ | – | $ | 497 | $ | – | $ | 822 | ||||||||||||
|
Construction |
||||||||||||||||||||||||
|
and development |
||||||||||||||||||||||||
|
Commercial |
excluding |
|||||||||||||||||||||||
|
and |
undeveloped |
Undeveloped |
Real estate |
|||||||||||||||||||||
|
industrial |
land |
land |
mortgage |
Consumer |
Total |
|||||||||||||||||||
|
Allowance for loan losses |
||||||||||||||||||||||||
|
At December 31, 2014 |
$ | 11,819 | $ | 721 | $ | 1,545 | $ | 10,541 | $ | 294 | $ | 24,920 | ||||||||||||
|
Provision (credit) |
793 | 1,065 | (2,131 | ) | 872 | 151 | 750 | |||||||||||||||||
|
Charge-offs |
(4,065 | ) | (26 | ) | – | (693 | ) | (597 | ) | (5,381 | ) | |||||||||||||
|
Recoveries |
98 | – | 1,400 | 155 | 499 | 2,152 | ||||||||||||||||||
|
At December 31, 2015 |
$ | 8,645 | $ | 1,760 | $ | 814 | $ | 10,875 | $ | 347 | $ | 22,441 | ||||||||||||
|
Allowance for loans individually evaluated for impairment |
$ | 268 | $ | – | $ | – | $ | 208 | $ | 68 | $ | 544 | ||||||||||||
|
Allowance for loans collectively evaluated for impairment |
$ | 8,377 | $ | 1,760 | $ | 814 | $ | 10,667 | $ | 279 | $ | 21,897 | ||||||||||||
|
Allowance for loans acquired with deteriorated credit quality |
$ | – | $ | – | $ | – | $ | – | $ | – | $ | – | ||||||||||||
The considerations by Bancorp in computing its allowance for loan losses are determined based on the various risk characteristics of each loan segment. Relevant risk characteristics are as follows:
|
● |
Commercial and industrial loans: Loans in this category are made to businesses. Generally these loans are secured by assets of the business and repayment is expected from cash flows of the business. A decline in the strength of the business or a weakened economy and resultant decreased consumer and/or business spending may have a negative effect on credit quality in this loan category. |
|
● |
Construction and development, excluding undeveloped land: Loans in this category primarily include owner-occupied and investment construction loans and commercial development projects. In most cases, construction loans require only interest to be paid during construction. Upon completion or stabilization, the construction loan may convert to permanent financing in the real estate mortgage segment, requiring principal amortization. Repayment of development loans is derived from sale of lots or units including any pre-sold units. Credit risk is affected by construction delays, cost overruns, market conditions and availability of permanent financing, to the extent such permanent financing is not being provided by Bancorp. |
|
● |
Undeveloped land: Loans in this category are secured by land acquired for development by the borrower, but for which no development has yet taken place. Credit risk is primarily dependent upon financial strength of the borrower, but can also be affected by market conditions and time to sell lots at an adequate price. Credit risk is also affected by availability of permanent financing, including to the end user, to the extent such permanent financing is not being provided by Bancorp. |
|
● |
Real estate mortgage: Loans in this category are made to and secured by owner-occupied residential real estate, owner-occupied real estate used for business purposes, and income-producing investment properties. For owner-occupied residential and owner-occupied commercial real estate, repayment is dependent on financial strength of the borrower. For income-producing investment properties, repayment is dependent on financial strength of both the tenants and the borrower. Underlying properties are generally located in Bancorp’s primary market area. Cash flows of income producing investment properties may be adversely impacted by a downturn in the economy as reflected in increased vacancy rates, which in turn, will have an effect on credit quality and property values. Overall health of the economy, including unemployment rates and real estate prices, has an effect on credit quality in this loan category. |
|
● |
Consumer: Loans in this category may be either secured or unsecured and repayment is dependent on credit quality of the individual borrower and, if applicable, adequacy of collateral securing the loan. Therefore, overall health of the economy, including unemployment rates, as well as home and securities prices, will have a significant effect on credit quality in this loan category. |
Bancorp had loans that were acquired in a 2013 acquisition, for which there was, at acquisition, evidence of deterioration of credit quality since origination and for which it was probable, at acquisition, that all contractually required payments would not be collected. 15 of those 19 loans originally identified as such have subsequently paid off with full collection of all principal and interest owed. The remaining four loans were re-evaluated in 2017 and based upon performance to date and the expectation that all cash flow will be consistent with the contractual terms, the remaining loans were re-classified into the accretable category with the remaining credit discount to be amortized into income over the remaining lives of the loans. The carrying amount of those loans is included in the balance sheet amounts for total loans at December 31, 2017 and 2016. Changes in the interest component of the fair value adjustment for acquired impaired loans for the years ended December 31, 2016 and 2017 are shown in the following table:
|
(In thousands) |
Accretable discount |
Non- accretable discount |
||||||
|
Balance at December 31, 2015 |
$ | 3 | $ | 189 | ||||
|
Accretion |
(3 | ) | (41 | ) | ||||
|
Reclassifications from (to) non-accretable difference |
– | – | ||||||
|
Disposals |
– | – | ||||||
|
Balance at December 31, 2016 |
– | 148 | ||||||
|
Accretion |
– | (43 | ) | |||||
|
Reclassifications from (to) non-accretable difference |
105 | (105 | ) | |||||
|
Disposals |
||||||||
|
Balance at December 31, 2017 |
$ | 105 | $ | – | ||||
Accretion in the non-accretable discount column represents accretion recorded upon payoff of loans.
The following tables present loans individually evaluated for impairment as of December 31, 2017 and 2016.
|
(In thousands) |
Unpaid |
Average |
||||||||||||||
|
Recorded |
principal |
Related |
recorded |
|||||||||||||
|
December 31, 2017 |
investment |
balance |
allowance |
investment |
||||||||||||
|
Loans with no related allowance recorded: |
||||||||||||||||
|
Commercial and industrial |
$ | 1,142 | $ | 2,202 | $ | – | $ | 411 | ||||||||
|
Construction and development, excluding undeveloped land |
664 | 834 | – | 559 | ||||||||||||
|
Undeveloped land |
474 | 506 | – | 425 | ||||||||||||
|
Real estate mortgage |
||||||||||||||||
|
Commercial investment |
52 | 53 | – | 110 | ||||||||||||
|
Owner occupied commercial |
3,332 | 3,789 | – | 1,678 | ||||||||||||
|
1-4 family residential |
1,637 | 1,657 | – | 935 | ||||||||||||
|
Home equity - first lien |
– | – | – | – | ||||||||||||
|
Home equity - junior lien |
31 | 31 | – | 186 | ||||||||||||
|
Subtotal: Real estate mortgage |
5,052 | 5,530 | – | 2,909 | ||||||||||||
|
Consumer |
– | – | – | – | ||||||||||||
|
Subtotal |
$ | 7,332 | $ | 9,072 | $ | – | $ | 4,304 | ||||||||
|
Loans with an allowance recorded: |
||||||||||||||||
|
Commercial and industrial |
$ | 34 | $ | 34 | $ | 34 | $ | 1,882 | ||||||||
|
Construction and development, excluding undeveloped land |
– | |||||||||||||||
|
Undeveloped land |
– | 48 | ||||||||||||||
|
Real estate mortgage |
||||||||||||||||
|
Commercial investment |
– | – | – | – | ||||||||||||
|
Owner occupied commercial |
– | – | – | – | ||||||||||||
|
1-4 family residential |
14 | 14 | 14 | 5 | ||||||||||||
|
Home equity - first lien |
– | – | – | – | ||||||||||||
|
Home equity - junior lien |
– | – | – | – | ||||||||||||
|
Subtotal: Real estate mortgage |
14 | 14 | 14 | 5 | ||||||||||||
|
Consumer |
– | – | – | 46 | ||||||||||||
|
Subtotal |
$ | 48 | $ | 48 | $ | 48 | $ | 1,981 | ||||||||
|
Total: |
||||||||||||||||
|
Commercial and industrial |
$ | 1,176 | $ | 2,236 | $ | 34 | $ | 2,293 | ||||||||
|
Construction and development, excluding undeveloped land |
664 | 834 | – | 559 | ||||||||||||
|
Undeveloped land |
474 | 506 | – | 473 | ||||||||||||
|
Real estate mortgage |
||||||||||||||||
|
Commercial investment |
52 | 53 | – | 110 | ||||||||||||
|
Owner occupied commercial |
3,332 | 3,789 | – | 1,678 | ||||||||||||
|
1-4 family residential |
1,651 | 1,671 | 14 | 940 | ||||||||||||
|
Home equity - first lien |
– | – | – | – | ||||||||||||
|
Home equity - junior lien |
31 | 31 | – | 186 | ||||||||||||
|
Subtotal: Real estate mortgage |
5,066 | 5,544 | 14 | 2,914 | ||||||||||||
|
Consumer |
– | – | – | 46 | ||||||||||||
|
Total |
$ | 7,380 | $ | 9,120 | $ | 48 | $ | 6,285 | ||||||||
|
(In thousands) |
Unpaid |
Average |
||||||||||||||
|
Recorded |
principal |
Related |
recorded |
|||||||||||||
|
December 31, 2016 |
investment |
balance |
allowance |
investment |
||||||||||||
|
Loans with no related allowance recorded: |
||||||||||||||||
|
Commercial and industrial |
$ | 322 | $ | 465 | $ | – | $ | 1,947 | ||||||||
|
Construction and development, excluding undeveloped land |
538 | 708 | – | 108 | ||||||||||||
|
Undeveloped land |
233 | 265 | – | 76 | ||||||||||||
|
Real estate mortgage |
||||||||||||||||
|
Commercial investment |
107 | 107 | – | 193 | ||||||||||||
|
Owner occupied commercial |
1,042 | 1,479 | – | 1,356 | ||||||||||||
|
1-4 family residential |
984 | 985 | – | 980 | ||||||||||||
|
Home equity - first lien |
– | – | – | 3 | ||||||||||||
|
Home equity - junior lien |
383 | 383 | – | 315 | ||||||||||||
|
Subtotal: Real estate mortgage |
2,516 | 2,954 | – | 2,847 | ||||||||||||
|
Consumer |
– | – | – | 18 | ||||||||||||
|
Subtotal |
$ | 3,609 | $ | 4,392 | $ | – | $ | 4,996 | ||||||||
|
Loans with an allowance recorded: |
||||||||||||||||
|
Commercial and industrial |
$ | 2,360 | $ | 2,835 | $ | 1,207 | $ | 1,619 | ||||||||
|
Construction and development, excluding undeveloped land |
– | – | – | 182 | ||||||||||||
|
Undeveloped land |
241 | 241 | 1 | 149 | ||||||||||||
|
Real estate mortgage |
||||||||||||||||
|
Commercial investment |
– | – | – | – | ||||||||||||
|
Owner occupied commercial |
– | – | – | 554 | ||||||||||||
|
1-4 family residential |
– | – | – | – | ||||||||||||
|
Home equity - first lien |
– | – | – | – | ||||||||||||
|
Home equity - junior lien |
– | – | – | – | ||||||||||||
|
Subtotal: Real estate mortgage |
– | – | – | 554 | ||||||||||||
|
Consumer |
59 | 59 | 59 | 63 | ||||||||||||
|
Subtotal |
$ | 2,660 | $ | 3,135 | $ | 1,267 | $ | 2,567 | ||||||||
|
Total: |
||||||||||||||||
|
Commercial and industrial |
$ | 2,682 | $ | 3,300 | $ | 1,207 | $ | 3,566 | ||||||||
|
Construction and development, excluding undeveloped land |
538 | 708 | – | 290 | ||||||||||||
|
Undeveloped land |
474 | 506 | 1 | 225 | ||||||||||||
|
Real estate mortgage |
– | – | – | – | ||||||||||||
|
Commercial investment |
107 | 107 | – | 193 | ||||||||||||
|
Owner occupied commercial |
1,042 | 1,479 | – | 1,910 | ||||||||||||
|
1-4 family residential |
984 | 985 | – | 980 | ||||||||||||
|
Home equity - first lien |
– | – | – | 3 | ||||||||||||
|
Home equity - junior lien |
383 | 383 | – | 315 | ||||||||||||
|
Subtotal: Real estate mortgage |
2,516 | 2,954 | – | 3,401 | ||||||||||||
|
Consumer |
59 | 59 | 59 | 81 | ||||||||||||
|
Total |
$ | 6,269 | $ | 7,527 | $ | 1,267 | $ | 7,563 | ||||||||
Differences between recorded investment amounts and unpaid principal balance amounts less related allowance are due to partial charge-offs which have occurred over the life of loans and fair value adjustments recorded for loans acquired.
Interest paid on impaired or non-accrual loans that was used to reduce principal was $338 thousand, $307 thousand and $521 thousand in 2017, 2016 and 2015, respectively. Interest income that would have been recorded if non-accrual loans were on a current basis in accordance with their original terms was $159 thousand, $149 thousand and $465 thousand in 2017, 2016 and 2015, respectively.
Impaired loans include non-accrual loans and loans accounted for as troubled debt restructurings (TDRs), which continue to accrue interest. Non-performing loans include the balance of impaired loans plus any loans over 90 days past due and still accruing interest. Loans past due more than 90 days or more and still accruing interest amounted to $2 thousand and $438 thousand at December 31, 2017 and 2016, respectively.
The following table presents the recorded investment in non-accrual loans as of December 31, 2017 and 2016.
|
December 31, |
||||||||
|
(In thousands) |
2017 |
2016 |
||||||
|
Commercial and industrial |
$ | 321 | $ | 1,767 | ||||
|
Construction and development, excluding undeveloped land |
664 | 538 | ||||||
|
Undeveloped land |
474 | 474 | ||||||
|
Real estate mortgage |
||||||||
|
Commercial investment |
52 | 107 | ||||||
|
Owner occupied commercial |
3,332 | 1,042 | ||||||
|
1-4 family residential |
1,637 | 984 | ||||||
|
Home equity - first lien |
– | – | ||||||
|
Home equity - junior lien |
31 | 383 | ||||||
|
Subtotal: Real estate mortgage |
5,052 | 2,516 | ||||||
|
Consumer |
– | – | ||||||
|
Total |
$ | 6,511 | $ | 5,295 | ||||
In the course of working with borrowers, Bancorp may elect to restructure the contractual terms of certain loans. A troubled debt restructuring (TDRs) occurs when, for economic or legal reasons related to a borrower’s financial difficulties, Bancorp grants a concession to the borrower that it would not otherwise consider. Bancorp had $869 thousand and $974 thousand of accruing loans classified as TDRs, at December 31, 2017 and 2016, respectively. Two loans were designated as TDRs during 2017. A commercial loan with a pre- and post-modification recorded investment of $39 thousand was given a payment concession so as to enable the borrower to fulfill the loan agreement. A 1-4 family residential loan with a pre-modification recorded investment of $12 thousand was renewed with interest capitalized resulting in a post-modification recorded investment of $14 thousand. Specific reserves for the full amounts of both loans were established. Two other commercial loans were considered TDRs as of December 31, 2017. Loans reported in 2016 as TDRs consisted of two commercial loans, to a single borrower, and one consumer loan. Bancorp did not identify and report any additional loans as TDRs during the years ended December 31, 2016 and 2015. No loans classified as TDRs in 2015, 2016 or 2017 subsequently defaulted within 12 months.
Loans accounted for as TDRs are individually evaluated for impairment. At December 31, 2017 loans reported as TDRs had a total allowance allocation of $48 thousand, compared to $207 thousand at December 31, 2016. At December 31, 2017 and 2016, Bancorp had no outstanding commitments to lend additional funds to borrowers whose loans have been classified as TDRs. As of December 31, 2017 formal foreclosure proceedings were in process on two loans with a total recorded investment of $62 thousand.
The following table presents the aging of the recorded investment in loans as of December 31, 2017 and 2016.
|
Recorded |
||||||||||||||||||||||||||||
|
(In thousands) |
90 or more |
investment |
||||||||||||||||||||||||||
|
days past |
> 90 days |
|||||||||||||||||||||||||||
|
30-59 days |
60-89 days |
due (includes) |
Total |
Total |
and |
|||||||||||||||||||||||
|
December 31, 2017 |
Current |
past due |
past due |
non-accrual) |
past due |
loans |
accruing |
|||||||||||||||||||||
|
Commercial and industrial |
$ | 776,118 | $ | 2,571 | $ | 4 | $ | 321 | $ | 2,896 | $ | 779,014 | $ | – | ||||||||||||||
|
Construction and development, excluding undeveloped land |
194,936 | – | 312 | 664 | 976 | 195,912 | – | |||||||||||||||||||||
|
Undeveloped land |
18,514 | – | – | 474 | 474 | 18,988 | – | |||||||||||||||||||||
|
Real estate mortgage |
||||||||||||||||||||||||||||
|
Commercial investment |
594,242 | 608 | – | 52 | 660 | 594,902 | – | |||||||||||||||||||||
|
Owner occupied Commercial |
394,623 | 455 | 275 | 3,332 | 4,062 | 398,685 | – | |||||||||||||||||||||
|
1-4 family residential |
259,994 | 172 | 307 | 1,637 | 2,116 | 262,110 | – | |||||||||||||||||||||
|
Home equity - first lien |
56,938 | 172 | – | – | 172 | 57,110 | – | |||||||||||||||||||||
|
Home equity - junior lien |
63,667 | 87 | 194 | 33 | 314 | 63,981 | 2 | |||||||||||||||||||||
|
Subtotal: Real estate mortgage |
1,369,464 | 1,494 | 776 | 5,054 | 7,324 | 1,376,788 | 2 | |||||||||||||||||||||
|
Consumer |
38,699 | 86 | 83 | – | 169 | 38,868 | – | |||||||||||||||||||||
|
Total |
$ | 2,397,731 | $ | 4,151 | $ | 1,175 | $ | 6,513 | $ | 11,839 | $ | 2,409,570 | $ | 2 | ||||||||||||||
|
December 31, 2016 |
||||||||||||||||||||||||||||
|
Commercial and industrial |
$ | 734,682 | $ | 84 | $ | 290 | $ | 1,785 | $ | 2,159 | $ | 736,841 | $ | 18 | ||||||||||||||
|
Construction and development, excluding undeveloped land |
191,810 | – | – | 538 | 538 | 192,348 | – | |||||||||||||||||||||
|
Undeveloped land |
21,022 | – | – | 474 | 474 | 21,496 | – | |||||||||||||||||||||
|
Real estate mortgage |
||||||||||||||||||||||||||||
|
Commercial investment |
537,998 | 631 | 64 | 193 | 888 | 538,886 | 86 | |||||||||||||||||||||
|
Owner occupied commercial |
406,726 | 342 | – | 1,224 | 1,566 | 408,292 | 182 | |||||||||||||||||||||
|
1-4 family residential |
246,730 | 1,174 | 576 | 1,018 | 2,768 | 249,498 | 34 | |||||||||||||||||||||
|
Home equity - first lien |
55,027 | 231 | 21 | 46 | 298 | 55,325 | 46 | |||||||||||||||||||||
|
Home equity - junior lien |
66,911 | 99 | 126 | 383 | 608 | 67,519 | 72 | |||||||||||||||||||||
|
Subtotal: Real estate mortgage |
1,313,392 | 2,477 | 787 | 2,864 | 6,128 | 1,319,520 | 420 | |||||||||||||||||||||
|
Consumer |
34,965 | 28 | 105 | 72 | 205 | 35,170 | – | |||||||||||||||||||||
|
Total |
$ | 2,295,871 | $ | 2,589 | $ | 1,182 | $ | 5,733 | $ | 9,504 | $ | 2,305,375 | $ | 438 | ||||||||||||||
Consistent with regulatory guidance, Bancorp categorizes loans into credit risk categories based on relevant information about the ability of borrowers to service their debt such as current financial information, historical payment experience, credit documentation, public information and current economic trends. Pass-rated loans include all risk-rated loans other than those classified as other assets especially mentioned, substandard, and doubtful, which are defined below:
|
● |
Other assets especially mentioned (“OAEM”): Loans classified as OAEM have a potential weakness that deserves management’s close attention. These potential weaknesses may result in deterioration of repayment prospects for the loan or of Bancorp’s credit position at some future date. |
|
● |
Substandard: Loans classified as substandard are inadequately protected by the paying capacity of the obligor or of collateral pledged, if any. Loans so classified have well-defined weaknesses that may jeopardize repayment of the debt. Default is a distinct possibility if the deficiencies are not corrected. |
|
● |
Substandard non-performing: Loans classified as substandard non-performing have deteriorated beyond the characteristics of substandard loans and have been placed on non-accrual status or have been accounted for as troubled debt restructurings. |
|
● |
Doubtful: Loans classified as doubtful have all the weaknesses inherent in those classified as substandard, with the added characteristic that weaknesses make collection or repayment in full, on the basis of currently existing facts, conditions and values, highly questionable and improbable. |
As of December 31, 2017 and 2016, internally assigned risk grades of loans by category were as follows:
|
(In thousands) |
Substandard |
Total |
||||||||||||||||||||||
|
December 31, 2017 |
Pass |
OAEM |
Substandard |
non-performing |
Doubtful |
loans |
||||||||||||||||||
|
Commercial and industrial |
$ | 751,628 | $ | 12,032 | $ | 14,178 | $ | 1,176 | $ | – | $ | 779,014 | ||||||||||||
|
Construction and development, excluding undeveloped land |
195,248 | – | – | 664 | – | 195,912 | ||||||||||||||||||
|
Undeveloped land |
18,484 | – | 30 | 474 | – | 18,988 | ||||||||||||||||||
|
Real estate mortgage |
||||||||||||||||||||||||
|
Commercial investment |
591,232 | 3,599 | 19 | 52 | – | 594,902 | ||||||||||||||||||
|
Owner occupied commercial |
383,455 | 8,683 | 3,215 | 3,332 | – | 398,685 | ||||||||||||||||||
|
1-4 family residential |
256,968 | 2,477 | 1,014 | 1,651 | – | 262,110 | ||||||||||||||||||
|
Home equity - first lien |
57,110 | – | – | – | – | 57,110 | ||||||||||||||||||
|
Home equity - junior lien |
63,471 | 247 | 230 | 33 | – | 63,981 | ||||||||||||||||||
|
Subtotal: Real estate mortgage |
1,352,236 | 15,006 | 4,478 | 5,068 | – | 1,376,788 | ||||||||||||||||||
|
Consumer |
38,747 | 117 | 4 | – | – | 38,868 | ||||||||||||||||||
|
Total |
$ | 2,356,343 | $ | 27,155 | $ | 18,690 | $ | 7,382 | $ | – | $ | 2,409,570 | ||||||||||||
|
December 31, 2016 |
||||||||||||||||||||||||
|
Commercial and industrial |
$ | 714,025 | $ | 14,266 | $ | 5,850 | $ | 2,700 | $ | – | $ | 736,841 | ||||||||||||
|
Construction and development, excluding undeveloped land |
191,455 | – | 355 | 538 | – | 192,348 | ||||||||||||||||||
|
Undeveloped land |
21,022 | – | – | 474 | – | 21,496 | ||||||||||||||||||
|
Real estate mortgage |
||||||||||||||||||||||||
|
Commercial investment |
538,688 | – | 5 | 193 | – | 538,886 | ||||||||||||||||||
|
Owner occupied Commercial |
396,997 | 7,960 | 2,111 | 1,224 | – | 408,292 | ||||||||||||||||||
|
1-4 family residential |
247,888 | – | 592 | 1,018 | – | 249,498 | ||||||||||||||||||
|
Home equity - first lien |
55,279 | – | – | 46 | – | 55,325 | ||||||||||||||||||
|
Home equity - junior lien |
66,710 | – | 426 | 383 | – | 67,519 | ||||||||||||||||||
|
Subtotal: Real estate mortgage |
1,305,562 | 7,960 | 3,134 | 2,864 | – | 1,319,520 | ||||||||||||||||||
|
Consumer |
35,039 | – | – | 131 | – | 35,170 | ||||||||||||||||||
|
Total |
$ | 2,267,103 | $ | 22,226 | $ | 9,339 | $ | 6,707 | $ | – | $ | 2,305,375 | ||||||||||||
(6) Premises and Equipment
A summary of premises and equipment follows:
|
December 31, |
||||||||
|
(In thousands) |
2017 |
2016 |
||||||
|
Land |
$ | 7,118 | $ | 7,118 | ||||
|
Buildings and improvements |
47,924 | 47,398 | ||||||
|
Furniture and equipment |
18,511 | 20,758 | ||||||
|
Construction in progress |
1,496 | 51 | ||||||
| 75,049 | 75,325 | |||||||
|
Accumulated depreciation and amortization |
(33,394 | ) | (32,941 | ) | ||||
|
Total premises and equipment |
$ | 41,655 | $ | 42,384 | ||||
Depreciation expense related to premises and equipment was $3.5 million in 2017, $3.2 million in 2016 and $3.0 million in 2015.
(7) Other Assets
A summary of major components of other assets follows:
|
December 31, |
||||||||
|
(In thousands) |
2017 |
2016 |
||||||
|
Cash surrender value of life insurance other than BOLI |
$ | 16,213 | $ | 13,543 | ||||
|
Net deferred tax asset |
9,206 | 12,896 | ||||||
|
Investments in tax credit related ventures |
3,216 | 5,244 | ||||||
|
Other real estate owned and other foreclosed property |
2,640 | 5,033 | ||||||
|
Other short term receivables |
2,215 | 2,100 | ||||||
|
Core deposit intangible |
1,225 | 1,405 | ||||||
|
Mortgage servicing rights (MSRs) |
875 | 921 | ||||||
|
Goodwill |
682 | 682 | ||||||
|
Other |
12,234 | 7,553 | ||||||
|
Total |
$ | 48,506 | $ | 49,377 | ||||
Bancorp maintains life insurance policies other than BOLI in conjunction with its non-qualified defined benefit retirement and non-qualified compensation plans.
Mortgage servicing rights (MSRs) are initially recognized at fair value when mortgage loans are sold and amortized in proportion to and over the period of estimated net servicing income, considering appropriate prepayment assumptions. MSRs are evaluated quarterly for impairment by comparing carrying value to fair value. Estimated fair values of MSRs at December 31, 2017 and 2016 were $3.1 million and $2.7 million, respectively. Total outstanding principal balances of loans serviced by Bancorp were $344.5 million and $372.2 million at December 31, 2017, and 2016 respectively.
Changes in the net carrying amount of MSRs are shown in the following table.
|
(In thousands) |
2017 |
2016 |
||||||
|
Balance at January 1 |
$ | 921 | $ | 1,018 | ||||
|
Originations |
225 | 177 | ||||||
|
Amortization |
(271 | ) | (274 | ) | ||||
|
Balance at December 31 |
$ | 875 | $ | 921 | ||||
(8) Income Taxes
Components of income tax expense (benefit) from operations were as follows:
|
(In thousands) |
2017 |
2016 |
2015 |
|||||||||
|
Current tax expense |
||||||||||||
|
Federal |
$ | 12,622 | $ | 14,270 | $ | 15,478 | ||||||
|
State |
546 | 698 | 608 | |||||||||
|
Total current tax expense |
13,168 | 14,968 | 16,086 | |||||||||
|
Deferred tax expense (benefit) |
||||||||||||
|
Federal |
3,783 | 192 | 748 | |||||||||
|
State |
(4 | ) | 36 | 54 | ||||||||
|
Total deferred tax expense (benefit) |
3,779 | 228 | 802 | |||||||||
|
Change in valuation allowance |
192 | 48 | 45 | |||||||||
|
Total income tax expense |
$ | 17,139 | $ | 15,244 | $ | 16,933 | ||||||
Components of income tax (benefit) expense recorded directly to stockholders’ equity were as follows:
|
(In thousands) |
2017 |
2016 |
2015 |
|||||||||
|
Unrealized (loss) gain on securities available for sale |
$ | (531 | ) | $ | (1,171 | ) | $ | (839 | ) | |||
|
Reclassification adjustment for securities losses realized in income |
81 | – | – | |||||||||
|
Reclassification adjustment for securities impairment realized in income |
– | – | 36 | |||||||||
|
Unrealized (loss) gain on derivatives |
112 | 24 | (41 | ) | ||||||||
|
Minimum pension liability adjustment |
(9 | ) | 1 | 61 | ||||||||
|
Compensation expense for tax purposes in excess of amounts recognized for financial reporting purposes |
– | (1,705 | ) | (673 | ) | |||||||
|
Total income tax (benefit) expense recorded directly to stockholders’ equity |
$ | (347 | ) | $ | (2,851 | ) | $ | (1,456 | ) | |||
An analysis of the difference between the statutory and effective tax rates from operations follows:
|
Year ended December 31, |
||||||||||||
|
2017 |
2016 |
2015 |
||||||||||
|
U.S. federal income tax rate |
35.0 |
% |
35.0 |
% |
35.0 |
% |
||||||
|
Tax credits |
(14.4 | ) | (9.7 | ) | (2.5 | ) | ||||||
|
Net deferred tax asset remeasurement |
10.8 | – | – | |||||||||
|
Amortization/impairment of investments in tax credit partnerships |
3.4 | 2.8 | 0.4 | |||||||||
|
Stock based compensation |
(2.6 | ) | – | – | ||||||||
|
Cash surrender value of life insurance |
(1.5 | ) | (0.9 | ) | (0.8 | ) | ||||||
|
Tax exempt interest income |
(1.2 | ) | (1.2 | ) | (1.4 | ) | ||||||
|
Other, net |
0.9 | 0.3 | (0.2 | ) | ||||||||
|
State income taxes |
0.7 | 0.8 | 0.8 | |||||||||
|
Effective tax rate |
31.1 |
% |
27.1 |
% |
31.3 |
% |
||||||
The increase in effective tax rate from 2016 to 2017 was the result of the one-time, non-cash charge resulting from the remeasurement of deferred taxes as a result of tax reform somewhat offset by higher utilization of tax credits during the year. The Tax Cuts and Jobs Act was enacted in December 2017 requiring an immediate recalculation of Bancorp’s net deferred tax asset which resulted in $5.9 million of additional income tax expense in the fourth quarter of 2017. The effective tax rate in 2017 was also reduced by the adoption of ASU 2016-09 “Compensation – Stock Compensation Improvements to Employee Share-Based Payment Accounting”. The new standard requires excess tax benefits and deficiencies related to share-based payment awards to be reflected in the statement of operations as a component of the provision for income taxes. For 2017 Bancorp recorded a benefit of $1.5 million for such excess benefits against the provision for income tax expense. Prior to adoption of ASU 2016-09, these tax benefits were recorded directly to additional paid-in capital. Tax benefits recorded to capital for 2016 and 2015 were $1.7 million and $673 thousand, respectively.
The decrease in the effective tax rate from 2015 to 2016 was largely the result of higher utilization of tax credits in 2016. Bancorp invests in certain partnerships that yield federal income tax credits. The tax benefit of these investments exceeds the amortization and impairment expense associated with them, resulting in a positive impact on income.
In December 2017, the U.S. Securities and Exchange Commission (“SEC”) released Staff Accounting Bulletin No. 118 (“SAB 118”) to address any uncertainty or diversity of views in practice in accounting for the income tax effects of tax reform in situations where a registrant does not have the necessary information available, prepared or analyzed in reasonable detail to complete this accounting in the reporting period that includes the enactment date. SAB 118 allows a measurement period not to extend beyond one year from the tax reform’s enactment date to complete the necessary accounting.
In two areas, Bancorp recorded provisional amounts of deferred taxes where the information was not available to complete the accounting: 1) the Company’s deferred tax assets of $565 thousand for temporary differences in certain tax credit investments is awaiting receipt of Schedule K-1s from outside preparers. 2) Bancorp estimated that no reductions are required to deferred tax assets included in the $19 thousand of future deductions for compensation that might be subject to new limitations under Code Sec. 162(m) which, generally, limits to $1 million annual deductions for certain compensation paid to certain executives. There is uncertainty in applying new rules to existing contracts, and Bancorp is seeking clarification before finalizing its analysis. In a third area, the Company recorded no provisional amounts to its deferred tax liability for temporary differences between the tax and financial reporting bases of certain property and equipment items. These cannot be reasonably estimated. Bancorp’s deferred tax liability of $541 thousand for temporary differences between the tax and financial reporting bases of fixed assets is awaiting completion of a cost segregation study to take advantage of additional depreciation deductions available through tax reform. Bancorp will complete and record income tax effects of tax reform during the period the necessary information becomes available. This measurement period will not extend beyond December 22, 2018.
The effects of temporary differences that gave rise to significant portions of deferred tax assets and deferred tax liabilities follows:
|
December 31, |
||||||||
|
(In thousands) |
2017 |
2016 |
||||||
|
Allowance for loan loss |
$ | 5,422 | $ | 8,581 | ||||
|
Deferred compensation |
4,148 | 5,589 | ||||||
|
Accrued expenses |
798 | 1,360 | ||||||
|
Investments in partnerships |
565 | 905 | ||||||
|
Write-downs and costs associated with other real estate owned |
39 | 29 | ||||||
|
Loans |
442 | 685 | ||||||
|
Other-than-temporary impairment |
– | 37 | ||||||
|
Securities |
121 | – | ||||||
|
Other assets |
186 | 185 | ||||||
|
Total deferred tax assets |
11,721 | 17,371 | ||||||
|
Securities |
– | 438 | ||||||
|
Property and equipment |
764 | 1,409 | ||||||
|
Loan costs |
588 | 923 | ||||||
|
Mortgage servicing rights |
161 | 280 | ||||||
|
Leases |
149 | 381 | ||||||
|
Core deposit intangible |
267 | 502 | ||||||
|
Other liabilities |
260 | 408 | ||||||
|
Total deferred tax liabilities |
2,189 | 4,341 | ||||||
|
Valuation allowance |
(326 | ) | (134 | ) | ||||
|
Net deferred tax asset |
$ | 9,206 | $ | 12,896 | ||||
A valuation allowance is recognized for a deferred tax asset if, based on the weight of available evidence, it is more-likely-than-not that some portion of the entire deferred tax asset will not be realized. The ultimate realization of deferred tax assets is dependent upon the generation of future taxable income during the periods in which those temporary differences become deductible. Management considers the scheduled reversal of deferred tax liabilities, projected future taxable income and tax planning strategies in making this assessment. Based upon the level of historical taxable income and projection for future taxable income over the periods which the temporary differences resulting in the remaining deferred tax assets are deductible, management believes it is more-likely-than-not that Bancorp will realize the benefits of these deductible differences, net of the valuation allowance, at December 31, 2017.
Realization of deferred tax assets associated with the investment in tax credit partnerships is dependent upon generating sufficient taxable capital gain income prior to their expiration. A valuation allowance of $326 thousand and $134 thousand to reflect management’s estimate of the temporary deductible differences that may expire prior to their utilization has been recorded as of December 31, 2017 and 2016, respectively.
US GAAP provides guidance on financial statement recognition and measurement of tax positions taken, or expected to be taken, in tax returns. As December 31, 2017 and 2016, the gross amount of unrecognized tax benefits, including penalties and interest, was $40 thousand. If recognized, tax benefits would reduce tax expense and accordingly, increase net income. The amount of unrecognized tax benefits may increase or decrease in the future for various reasons including adding amounts for current year tax positions, expiration of open income tax returns due to statutes of limitation, changes in management’s judgment about the level of uncertainty, status of examination, litigation and legislative activity and addition or elimination of uncertain tax positions. Federal and state income tax returns are subject to examination for the years after 2013.
A reconciliation of the amount of unrecognized tax benefits follows:
|
(In thousands) |
2017 |
2016 |
||||||
|
Balance as of January 1 |
$ | 40 | $ | 40 | ||||
|
Increases - current year tax positions |
11 | 11 | ||||||
|
Increases - prior year tax positions |
– | – | ||||||
|
Settlements |
– | – | ||||||
|
Lapse of statute of limitations |
(11 | ) | (11 | ) | ||||
|
Balance as of December 31 |
$ | 40 | $ | 40 | ||||
(9) Deposits
The composition of interest bearing deposits follows:
|
December 31, |
||||||||
|
(In thousands) |
2017 |
2016 |
||||||
|
Interest bearing demand |
$ | 833,450 | $ | 768,139 | ||||
|
Savings |
152,348 | 140,030 | ||||||
|
Money market |
682,226 | 682,421 | ||||||
|
Time deposits of more than $250,000 |
38,439 | 40,427 | ||||||
|
Other time deposits |
197,135 | 209,375 | ||||||
|
Total interest bearing deposits |
$ | 1,903,598 | $ | 1,840,392 | ||||
Interest expense related to certificates of deposit and other time deposits in denominations of $250 thousand or more was $161 thousand, $231 thousand and $313 thousand, respectively, for the years ended December 31, 2017, 2016 and 2015.
At December 31, 2017, the scheduled maturities of time deposits were as follows (in thousands):
|
2018 |
$ | 166,219 | ||
|
2019 |
42,857 | |||
|
2020 |
13,100 | |||
|
2021 |
7,646 | |||
|
2022 and thereafter |
5,752 | |||
|
Total time deposits |
$ | 235,574 |
Deposits of directors and their associates, including deposits of companies for which directors are principal owners, and executive officers were $28.5 million and $30.5 million at December 31, 2017 and 2016, respectively.
At December 31, 2017 and 2016, Bancorp had $614 thousand and $449 thousand, respectively, of deposits accounts in overdraft status and thus have been reclassified to loans on the accompanying consolidated balance sheets.
(10) Securities Sold Under Agreements to Repurchase
Securities sold under agreements to repurchase are a funding source of Bancorp and are primarily used by commercial customers in conjunction with collateralized corporate cash management accounts. Such repurchase agreements are considered financing agreements and mature within one business day from the transaction date. At December 31, 2017, all of these financing arrangements had overnight maturities and were secured by government sponsored enterprise obligations and government agency mortgage-backed securities which were owned and controlled by Bancorp.
Information concerning securities sold under agreements to repurchase is summarized as follows:
|
(Dollars in thousands) |
2017 |
2016 |
||||||
|
Average balance during the year |
$ | 70,187 | $ | 62,670 | ||||
|
Average interest rate during the year |
0.19 | % | 0.22 | % | ||||
|
Maximum month-end balance during the year |
$ | 75,365 | $ | 72,029 | ||||
(11) Advances from the Federal Home Loan Bank
Bancorp had outstanding borrowings of $49.5 million at December 31, 2017, via fourteen separate fixed-rate advances. For two advances totaling $30 million, both of which are non-callable, interest payments are due monthly, with principal due at maturity. For the remaining advances totaling $19.5 million, principal and interest payments are due monthly based on an amortization schedule.
The following is a summary of the contractual maturities and average effective rates of outstanding advances:
|
(In thousands) |
December 31, 2017 |
December 31, 2016 |
||||||||||||||
|
Year |
Advance |
Fixed Rate |
Advance |
Fixed Rate |
||||||||||||
|
2018 |
$ | 30,000 | 1.48 | % | $ | 30,000 | 0.70 | % | ||||||||
|
2020 |
1,741 | 2.23 | 1,790 | 2.23 | ||||||||||||
|
2021 |
288 | 2.12 | 359 | 2.12 | ||||||||||||
|
2024 |
2,454 | 2.36 | 2,661 | 2.36 | ||||||||||||
|
2025 |
5,149 | 2.42 | 6,025 | 2.43 | ||||||||||||
|
2026 |
8,564 | 1.99 | 8,936 | 1.99 | ||||||||||||
|
2028 |
1,262 | 1.49 | 1,304 | 1.48 | ||||||||||||
|
Total |
$ | 49,458 | 1.74 |
% |
$ | 51,075 | 1.30 |
% |
||||||||
In addition to fixed-rate advances listed above, at December 31, 2017, Bancorp had a $150 million cash management advance from the FHLB. This advance matured in the first week of January 2018 and was used to manage Bancorp’s overall cash position. Due to the short-term nature of the advance, it was recorded on the consolidated balance sheet within federal funds purchased.
Advances from the FHLB are collateralized by certain commercial and residential real estate mortgage loans under a blanket mortgage collateral agreement and FHLB stock. Bancorp views the borrowings as an effective alternative to brokered deposits to fund loan growth. At December 31, 2017, the amount of available credit from the FHLB totaled $333 million.
(12) Other Comprehensive Income (Loss)
The following table illustrates activity within the balances in accumulated other comprehensive income (loss) by component, and is shown for the years ended December 31, 2017, 2016, and 2015.
|
Net unrealized |
Net unrealized |
Minimum |
||||||||||||||
|
gains (losses) |
gains (losses) |
pension |
||||||||||||||
|
on securities |
on cash |
liability |
||||||||||||||
|
(In thousands) |
available-for-sale |
flow hedges |
adjustment |
Total |
||||||||||||
|
Balance at December 31, 2014 |
$ | 2,456 | $ | 16 | $ | (387 | ) | $ | 2,085 | |||||||
|
Other comprehensive (loss) income before reclassifications |
(1,558 | ) | (76 | ) | 114 | (1,520 | ) | |||||||||
|
Amounts reclassified from accumulated other comprehensive income |
67 | – | – | 67 | ||||||||||||
|
Net current period other comprehensive (loss) income |
(1,491 | ) | (76 | ) | 114 | (1,453 | ) | |||||||||
|
Balance at December 31, 2015 |
$ | 965 | $ | (60 | ) | $ | (273 | ) | $ | 632 | ||||||
|
Other comprehensive (loss) income before reclassifications |
(2,176 | ) | 44 | 1 | (2,131 | ) | ||||||||||
|
Amounts reclassified from accumulated other comprehensive income |
– | – | – | – | ||||||||||||
|
Net current period other comprehensive (loss) income |
(2,176 | ) | 44 | 1 | (2,131 | ) | ||||||||||
|
Balance at December 31, 2016 |
$ | (1,211 | ) | $ | (16 | ) | $ | (272 | ) | $ | (1,499 | ) | ||||
|
Other comprehensive income (loss) before reclassifications |
(721 | ) | 209 | (70 | ) | (582 | ) | |||||||||
|
Amounts reclassified from accumulated other comprehensive income |
151 | – | – | 151 | ||||||||||||
|
Net current period other comprehensive income (loss) |
(1,067 | ) | 250 | (120 | ) | (431 | ) | |||||||||
|
Balance at December 31, 2017 |
$ | (2,278 | ) | $ | 234 | $ | (392 | ) | $ | (1,930 | ) | |||||
2017 other comprehensive income includes a total of $506 thousand income from remeasurement of deferred tax assets and liabilities. ASU 2018-02, issued in February 2018, provides for the reclassification into retained earnings of tax effects stranded in other comprehensive income as a result of tax reform. Bancorp is evaluating timing of adopting ASU 2018-02 guidance, which will result in $506 thousand being reclassified into retained earnings.
The following table illustrates activity within the reclassifications out of accumulated other comprehensive income (loss), for the years ended December 31, 2017, 2016 and 2015.
|
Details of accumulated |
Affected line item in |
||||||||||||
|
other comprehensive |
Amount reclassified from Accumulated |
the consolidated |
|||||||||||
|
income (loss) components |
other comprehensive income (loss) |
statements of income |
|||||||||||
|
For the years ended December 31, |
|||||||||||||
|
(In thousands) |
2017 |
2016 |
2015 |
||||||||||
|
Unrealized gains (losses) on securities available-for-sale: |
|||||||||||||
|
Realized loss on sale of available-for-sale securities |
$ | (232 | ) | $ | – | $ | – |
Loss on sale of securities |
|||||
|
OTTI impairment of equity security |
– | – | (103 | ) |
Other non-interest expense |
||||||||
|
Effect of income taxes |
81 | – | 36 |
Income tax expense |
|||||||||
|
Reclassifications, net of income taxes |
$ | (151 | ) | $ | – | $ | (67 | ) | |||||
(13) Preferred Stock and Common Stock
Bancorp has a class of preferred stock (no par value; 1,000,000 shares authorized); the relative rights, preferences and other terms of the class or any series within the class will be determined by the Board of Directors prior to any issuance. None of this stock has been issued to date.
At Bancorp’s 2015 Annual Meeting of Shareholders, shareholders approved increasing the number of authorized common shares from 20,000,000 to 40,000,000.
(14) Stock Split
On April 29, 2016 Bancorp declared a 3 for 2 stock split to be effected as a 50% stock dividend to shareholders of record on May 13, 2016, paid May 27, 2016 in the form of a 50% stock dividend. Share and per share information has been adjusted as necessary to reflect this split.
(15) Net Income per Share and Common Stock Dividends
The following table reflects the numerators (net income) and denominators (average shares outstanding) for the basic and diluted net income per share computations:
|
(In thousands, except per share data) |
2017 |
2016 |
2015 |
|||||||||
|
Net income, basic and diluted |
$ | 38,043 | $ | 41,027 | $ | 37,187 | ||||||
|
Average shares outstanding, basic |
22,532 | 22,356 | 22,088 | |||||||||
|
Effect of dilutive securities |
451 | 436 | 371 | |||||||||
|
Average shares outstanding including dilutive securities |
22,983 | 22,792 | 22,459 | |||||||||
|
Net income per share, basic |
$ | 1.69 | $ | 1.84 | $ | 1.68 | ||||||
|
Net income per share, diluted |
$ | 1.66 | $ | 1.80 | $ | 1.65 | ||||||
(16) Employee Benefit Plans
Bancorp has a combined employee stock ownership and profit sharing plan (“KSOP”). The plan is a defined contribution plan and is available to all employees meeting certain eligibility requirements. In general, for employees who work more than 1,000 hours per year, Bancorp matches employee contributions up to 6% of the employee’s salary, and contributes an amount of Bancorp stock equal to 2% of the employee’s salary. Employer matching expenses related to contributions to the plan for 2017, 2016, and 2015 were $2.0 million, $1.9 million and $1.8 million, respectively, and are recorded on the consolidated statements of income within employee benefits. Employee and employer contributions are made in accordance with the terms of the plan. As of December 31, 2017 and 2016, the KSOP held 577 thousand and 567 thousand shares of Bancorp stock, respectively.
In addition Bancorp has non-qualified plans into which directors and certain senior officers may defer director fees or salary/incentives. Bancorp matched certain executives’ deferrals into the senior officers’ plan amounting to approximately $232 thousand, $293 thousand and $171 thousand in 2017, 2016 and 2015 respectively. At December 31, 2017 and 2016, the amounts included in other liabilities in the consolidated financial statements for this plan were $8.2 million and $5.6 million, were comprised primarily of participants’ contributions, and represented the fair value of mutual fund investments directed by participants.
Bancorp sponsors an unfunded non-qualified defined benefit retirement plan for three key officers (two current and one retired), and has no plans to increase the number of or the benefits to participants. Benefits vest based on 25 years of service. Participants are fully vested. Bancorp uses a December 31 measurement date for this plan. The accumulated benefit obligation for the plan included in other liabilities in the consolidated financial statements was $2.2 million and $2.1 million as of December 31, 2017 and December 31, 2016, respectively. Discount rates of 3.59% and 4.10% were used in 2017 and 2016, respectively, in determining the actuarial present value of the projected benefit obligation. Actuarially determined pension costs are expensed and accrued over the service period, and benefits are paid from Bancorp’s assets. Bancorp maintains life insurance policies, for which it is the ultimate beneficiary, on participants and certain former executives. Income from these policies helps offset the cost of benefits. The liability for Bancorp’s plan met the benefit obligation as of December 31, 2017 and 2016.
Information about the components of the net periodic benefit cost of the defined benefit plan, recorded in salaries and employee benefits, is as follows:
|
Year ended December 31, |
||||||||||||
|
(In thousands) |
2017 |
2016 |
2015 |
|||||||||
|
Components of net periodic benefit cost: |
||||||||||||
|
Service cost |
$ | – | $ | – | $ | – | ||||||
|
Interest cost |
79 | 87 | 83 | |||||||||
|
Expected return on plan assets |
– | – | – | |||||||||
|
Amortization of prior service cost |
– | – | – | |||||||||
|
Amortization of net losses |
71 | 47 | 59 | |||||||||
|
Net periodic benefit cost |
$ | 150 | $ | 134 | $ | 142 | ||||||
Benefits expected to be paid in each year from 2018 to 2020 and beyond are listed in the table below.
|
(In thousands) |
||||
|
2018 |
$ | 84 | ||
|
2019 |
84 | |||
|
2020 |
84 | |||
|
Beyond 2020 |
3,278 | |||
|
Total future payments |
$ | 3,530 |
Expected benefits to be paid are based on the same assumptions used to measure Bancorp’s benefit obligation at December 31, 2017. There are no obligations for other post-retirement and post-employment benefits.
(17) Stock-Based Compensation
The fair value of all stock-based awards granted, net of estimated forfeitures, is recognized as compensation expense over the respective service period.
Bancorp currently has one stock-based compensation plan. At Bancorp’s 2015 Annual Meeting of Shareholders, shareholders approved the 2015 Omnibus Equity Compensation Plan and authorized the shares available from the expiring 2005 plan for future awards under the 2015 plan. No additional shares were made available. As of December 31, 2017, there were 302,727 shares available for future awards. The 2005 Stock Incentive Plan expired in April 2015; however, SARs granted under this plan expire as late as 2025.
Bancorp no longer has stock options outstanding at December 31, 2017. Stock appreciation rights (“SARs”) granted have a vesting schedule of 20% per year and expire ten years after the grant date unless forfeited due to employment termination.
Restricted shares granted to officers vest over five years. All restricted shares have been granted at a price equal to the market value of common stock at the time of grant. For all grants prior to 2015, grantees are entitled to dividend payments during the vesting period. For grants in 2015 and forward, forfeitable dividends are deferred until shares are vested. Fair value of restricted shares is equal to the market value of the shares on the date of grant.
Grants of performance stock units (“PSUs”) vest based upon service, a single three-year performance period, and are based upon certain three-year performance criterion which begins January 1 of the first year of the performance period. Because grantees are not entitled to dividend payments during the performance period, the fair value of these PSUs is estimated based upon the market value of the underlying shares on the date of grant, adjusted for non-payment of dividends. Beginning in 2015, grants require a one year post-vesting holding periods and the fair value of such grants incorporates a liquidity discount related to the holding period of 5.1%, 4.5% and 3.6% for 2017, 2016 and 2015 grants, respectively.
Grants of restricted stock units (“RSUs”) to directors are time-based and vest 12 months after grant date. Because grantees are entitled to deferred dividend payments at the end of the vesting period, fair value of the RSUs is estimated based on market value of underlying shares on the date of grant.
Bancorp has recognized stock-based compensation expense for SARs, PSUs, and RSUs, within employee benefits for employees, and within other non-interest expense for directors, in the consolidated statements of income as follows:
|
(In thousands) |
||||||||||||
|
2017 |
2016 |
2015 |
||||||||||
|
Stock-based compensation expense before income taxes |
$ | 2,892 | $ | 2,473 | $ | 2,134 | ||||||
|
Less: deferred tax benefit |
(607 | ) | (866 | ) | (747 | ) | ||||||
|
Reduction of net income |
$ | 2,285 | $ | 1,607 | $ | 1,387 | ||||||
Bancorp’s net income for 2017 reflected the implementation of ASU 2016-09 which changed the way excess tax benefits and deficiencies related to share-based compensation are recorded. Prior to 2017, these were recorded directly to additional paid-in capital and, thus did not affect earnings. Beginning in 2017, these are recorded as a tax expense or benefit in the income statement. These benefits resulted in a $1.5 million increase in net income for 2017. This tax benefit is not reflected in the table above.
As of December 31, 2017 Bancorp has $4.8 million of unrecognized stock-based compensation expense that will be recorded as compensation expense over the next five years as awards vest. In 2017 Bancorp used cash of $216 thousand for the purchase of shares related to RSUs. Bancorp received cash of $2.3 million and $3.3 million from the exercise of options during 2016 and 2015, respectively.
Fair values of Bancorp’s SARs are estimated at the date of grant using the Black-Scholes option pricing model, a leading formula for calculating the value of stock options and SARs. This model requires the input of assumptions, changes to which can materially affect the fair value estimate. Fair value of restricted shares is determined by Bancorp’s closing stock price on the date of grant. The following assumptions were used in SAR valuations at the grant date in each year:
|
Assumptions |
2017 |
2016 |
2015 |
|||||||||
|
Dividend yield |
2.72 |
% |
2.94 |
% |
2.97 |
% |
||||||
|
Expected volatility |
19.47 |
% |
19.31 |
% |
22.81 |
% |
||||||
|
Risk free interest rate |
2.29 |
% |
1.70 |
% |
1.91 |
% |
||||||
|
Expected life of SARs (in years) |
7.0 | 7.3 | 7.5 | |||||||||
Dividend yield and expected volatility are based on historical information for Bancorp corresponding to the expected life of SARs granted. Expected volatility is the volatility of the underlying shares for the expected term on a monthly basis. The risk free interest rate is the implied yield currently available on U.S. Treasury issues with a remaining term equal to the expected life of the awards. The expected life of SARs is based on actual experience of past like-term SARs. Bancorp evaluates historical exercise and post-vesting termination behavior when determining the expected life.
A summary of stock option and SARs activity and related information for the years ended December 31, 2016 and 2017 follows.
|
Weighted |
|||||||||||||||||||||||||
|
Weighted |
Aggregate |
Weighted |
average |
||||||||||||||||||||||
|
Options |
average |
intrinsic |
average |
remaining |
|||||||||||||||||||||
|
and SARs |
Exercise |
exercise |
value |
fair |
contractual |
||||||||||||||||||||
|
(In thousands) |
price |
price |
(In thousands) |
value |
life (In years) |
||||||||||||||||||||
|
At December 31, 2015 |
|||||||||||||||||||||||||
|
Vested and exercisable |
656 | $14.02 | - | 19.44 | $ | 15.75 | $ | 6,191 | $ | 3.39 | 3.7 | ||||||||||||||
|
Unvested |
266 | 15.24 | - | 24.55 | 18.66 | 1,733 | 3.29 | 7.7 | |||||||||||||||||
|
Total outstanding |
922 | 14.02 | - | 24.55 | 16.59 | 7,924 | 3.36 | 4.8 | |||||||||||||||||
|
Activity during 2016 |
|||||||||||||||||||||||||
|
SARs granted |
88 | 25.76 | - | 33.08 | 25.84 | 1,866 | 3.56 | ||||||||||||||||||
|
Exercised |
(272 | ) | 14.02 | - | 17.89 | 16.38 | 4,155 | 3.73 | |||||||||||||||||
|
Forfeited |
(3 | ) | 14.02 | - | 15.84 | 15.18 | 60 | 2.94 | |||||||||||||||||
|
At December 31, 2016 |
|||||||||||||||||||||||||
|
Vested and exercisable |
475 | 14.02 | - | 24.56 | 15.72 | 14,820 | 3.16 | 4.3 | |||||||||||||||||
|
Unvested |
260 | 15.24 | - | 33.08 | 21.53 | 6,623 | 3.43 | 7.8 | |||||||||||||||||
|
Total outstanding |
735 | 14.02 | - | 33.08 | 17.78 | 21,443 | 3.26 | 5.5 | |||||||||||||||||
|
Activity during 2017 |
|||||||||||||||||||||||||
|
SARs granted |
46 | 40.00 | - | 40.00 | 40.00 | – | 6.34 | ||||||||||||||||||
|
Exercised |
(77 | ) | 14.02 | - | 17.89 | 15.41 | 1,855 | 3.18 | |||||||||||||||||
|
Forfeited |
– | – | – | – | – | ||||||||||||||||||||
|
At December 31, 2017 |
|||||||||||||||||||||||||
|
Vested and exercisable |
490 | 14.02 | - | 33.08 | 16.46 | 10,408 | 3.16 | 4.0 | |||||||||||||||||
|
Unvested |
214 | 15.26 | - | 40.00 | 26.46 | 2,515 | 4.17 | 7.7 | |||||||||||||||||
|
Total outstanding |
704 | 14.02 | - | 40.00 | 19.51 | 12,923 | 3.47 | 5.1 | |||||||||||||||||
|
Vested year-to-date |
93 | $15.24 | - | 33.08 | $ | 19.37 | $ | 1,696 | $ | 3.18 | |||||||||||||||
Intrinsic value for stock options and SARs is defined as the amount by which the current market price of the underlying stock exceeds the exercise or grant price.
The aggregate intrinsic value of stock options and SARs exercised in 2017, 2016 and 2015 was $1.9 million, $4.2 million and $2.0 million, respectively. The aggregate intrinsic value of stock options and SARs exercised was calculated as the difference in the closing price of Bancorp’s common shares on the date of exercise and the exercise price, multiplied by the number of shares exercised.
The weighted average Black-Scholes fair values of SARs granted in 2017, 2016 and 2015 were $6.34, $3.56 and $5.95, respectively.
SARs outstanding, stated in thousands, at December 31, 2017 were as follows:
|
Expiration |
Number of SARs outstanding |
SARs exercisable |
Weighted average exercise price of SARs outstanding |
|||||||||
|
2018 |
17 | 17 | $ | 15.58 | ||||||||
|
2019 |
40 | 40 | 14.76 | |||||||||
|
2020 |
73 | 73 | 14.02 | |||||||||
|
2021 |
74 | 74 | 15.86 | |||||||||
|
2022 |
117 | 117 | 15.25 | |||||||||
|
2023 |
80 | 66 | 15.26 | |||||||||
|
2024 |
94 | 56 | 19.37 | |||||||||
|
2025 |
76 | 30 | 22.99 | |||||||||
|
2026 |
88 | 17 | 25.84 | |||||||||
|
2027 |
45 | – | 40.00 | |||||||||
| 704 | 490 | $ | 19.51 | |||||||||
A summary of Bancorp granted shares of restricted common stock, for the three year period ending December 31, 2017, follows.
|
Grant date |
||||||||
|
weighted- |
||||||||
|
Number |
average cost |
|||||||
|
Unvested at December 31, 2014 |
171,139 | $ | 16.63 | |||||
|
Shares awarded |
52,898 | 22.99 | ||||||
|
Restrictions lapsed and shares released to employees/directors |
(61,205 | ) | 15.89 | |||||
|
Shares forfeited |
(6,974 | ) | 18.97 | |||||
|
Unvested at December 31, 2015 |
155,858 | $ | 18.98 | |||||
|
Shares awarded |
51,122 | 25.78 | ||||||
|
Restrictions lapsed and shares released to employees/directors |
(49,265 | ) | 17.98 | |||||
|
Shares forfeited |
(12,480 | ) | 20.69 | |||||
|
Unvested at December 31, 2016 |
145,235 | $ | 21.57 | |||||
|
Shares awarded |
28,625 | 44.85 | ||||||
|
Restrictions lapsed and shares released to employees/directors |
(46,797 | ) | 19.79 | |||||
|
Shares forfeited |
(7,691 | ) | 25.18 | |||||
|
Unvested at December 31, 2017 |
119,372 | $ | 27.62 | |||||
Bancorp awarded performance-based restricted stock units (“PSUs”) to executive officers of Bancorp, the single three-year performance period for which began January 1 of the award year. The following table outlines the PSU grants.
|
Fair |
||||||||||||
|
Vesting |
value at |
Expected |
||||||||||
|
Grant |
period |
grant |
shares to |
|||||||||
|
year |
in years |
date |
be awarded |
|||||||||
|
2015 |
3 | $ | 20.02 | 43,011 | ||||||||
|
2016 |
3 | 22.61 | 69,161 | |||||||||
|
2017 |
3 | 35.66 | 43,325 | |||||||||
In the first quarter of 2017, Bancorp awarded 4,680 RSUs to directors of Bancorp with a grant date fair value of $220 thousand.
Bancorp has no equity compensation plans which have not been approved by shareholders. The following table provides detail of the number of shares to be issued upon exercise of outstanding stock-based awards and remaining shares available for future issuance under all the Bancorp’s equity compensation plans as of December 31, 2017.
|
Plan category (Shares in thousands) |
Number of shares to be issued upon exercise/vesting |
Weighted average exercise price |
Shares available for future issuance (a) |
|||||||||
|
Equity compensation plans approved by security holders: |
||||||||||||
|
Stock appreciation rights (SARs) |
(b) | (b) | 303 | |||||||||
|
Restricted common stock |
119 | N/A | (a) | |||||||||
|
Performance stock units |
(c) | N/A | (a) | |||||||||
|
Restricted stock units |
5 | N/A | (a) | |||||||||
|
Total shares |
124 | 303 | ||||||||||
|
(a) |
Under the 2015 Omnibus Equity Compensation Plan, shares of stock are authorized for issuance as incentive and nonqualified stock options, SARs, restricted stock, and restricted stock units |
|
(b) |
At December 31, 2017, approximately 704,000 SARs were outstanding at a weighted average grant price of $19.51. The number of shares to be issued upon exercise will be determined based on the difference between the grant price and the market price at the date of exercise. |
|
(c) |
The number of shares to be issued is dependent upon Bancorp achieving certain predefined performance targets and ranges from zero shares to approximately 205,000 shares. As of December 31, 2017, the expected shares to be awarded are 155,497. |
(18) Dividend
Bancorp’s principal source of cash revenues is dividends paid to it as the sole shareholder of the Bank. At any balance sheet date, the Bank’s regulatory dividend restriction represents the Bank’s net income of the current year plus the prior two years less any dividends paid for the same time period. At December 31, 2017, the Bank may pay an amount equal to $70.4 million in dividends to Bancorp without regulatory approval subject to the ongoing capital requirements of the Bank.
(19) Commitments and Contingent Liabilities
As of December 31, 2017, Bancorp had various commitments outstanding that arose in the normal course of business, including standby letters of credit and commitments to extend credit, which are properly not reflected in the consolidated financial statements. In management’s opinion, commitments to extend credit of $688.3 million including standby letters of credit of $14.8 million represent normal banking transactions. Commitments to extend credit were $628.3 million, including letters of credit of $15.6 million, as of December 31, 2016. Commitments to extend credit are agreements to lend to a customer contingent upon the availability of collateral and no existing violation of any condition established in the contract. Commitments generally have fixed expiration dates or other termination clauses. Commitments to extend credit are mainly comprised of commercial lines of credit, construction and home equity credit lines and credit cards issued to commercial customers. Since some of the commitments are expected to expire without being drawn upon, the total commitment amounts do not necessarily represent future cash requirements. Bancorp uses the same credit and collateral policies in making commitments and conditional guarantees as for on-balance sheet instruments. Bancorp evaluates each customer’s creditworthiness on a case by case basis. The amount of collateral obtained is based on management’s credit evaluation of the customer. Collateral held varies but may include accounts receivable, inventory, equipment, and real estate. However, should the commitments be drawn upon and should our customers default on their resulting obligation to us, our maximum exposure to credit loss, without consideration of collateral, is represented by the contractual amount of those instruments. At December 31, 2017, Bancorp accrued $350 thousand in other liabilities for unfunded credit commitments.
Standby letters of credit and financial guarantees written are conditional commitments issued by Bancorp to guarantee the performance of a customer to a third party. Those guarantees are primarily issued to support private commercial transactions. Standby letters of credit generally have maturities of one to two years.
Bancorp leases certain facilities under non-cancelable operating leases. Future minimum lease commitments for these leases are outlined in the table below.
|
(In thousands) |
||||
|
Year |
Total amount |
|||
|
2018 |
$ | 1,847 | ||
|
2019 |
1,880 | |||
|
2020 |
1,532 | |||
|
2021 |
1,391 | |||
|
2022 |
1,501 | |||
|
Thereafter |
2,873 | |||
|
Total |
$ | 11,024 | ||
Rent expense, net of sublease income, was $1.9 million in 2017, $1.8 million in 2016, and $1.7 million in 2015.
Certain commercial customers require confirmation of Bancorp’s letters of credit by other banks since Bancorp does not have a rating by a national rating agency. Terms of the agreements range from 1 to 19 months. If an event of default on all contracts had occurred at December 31, 2017, Bancorp would have been required to make payments of approximately $1.5 million. The maximum amount payable under those contracts was $1.5 million. No payments have ever been required as a result of default on these contracts. These agreements are normally secured by collateral acceptable to Bancorp, which limits credit risk associated with the agreements.
Also, as of December 31, 2017, in the normal course of business, there were pending legal actions and proceedings in which claims for damages are asserted. Management, after discussion with legal counsel, believes the ultimate result of these legal actions and proceedings will not have a material adverse effect on the consolidated financial position or results of operations of Bancorp.
(20) Assets and Liabilities Measured and Reported at Fair Value
Bancorp follows provisions of authoritative guidance for fair value measurements. This guidance is definitional and disclosure oriented and addresses how companies should approach measuring fair value when required by US GAAP. The guidance also prescribes various disclosures about financial statement categories and amounts which are measured at fair value, if such disclosures are not already specified elsewhere in US GAAP.
Authoritative guidance defines fair value as the price that would be received to sell an asset or paid to transfer a liability in an orderly transaction between participants at the measurement date. The guidance also establishes a hierarchy to group assets and liabilities carried at fair value in three levels based upon markets in which the assets and liabilities trade and reliability of assumptions used to determine fair value.
These levels are:
|
● |
Level 1: Valuation is based upon quoted prices for identical instruments traded in active markets. |
|
● |
Level 2: Valuation is based upon quoted prices for similar instruments in active markets, quoted prices for identical or similar instruments in markets that are not active, and model-based valuation techniques for which all significant assumptions are observable in the market. |
|
● |
Level 3: Valuation is generated from model-based techniques that use significant assumptions not observable in the market. These unobservable assumptions would reflect our own estimates of assumptions that market participants would use in pricing the asset or liability. Valuation techniques could include pricing models, discounted cash flows and other similar techniques. |
Authoritative guidance requires maximization of use of observable inputs and minimization of use of unobservable inputs in fair value measurements. Where there exists limited or no observable market data, Bancorp derives its own estimates by generally considering characteristics of the asset/liability, the current economic and competitive environment and other factors. For this reason, results cannot be determined with precision and may not be realized on an actual sale or immediate settlement of the asset or liability.
Bancorp’s investment securities available-for-sale and interest rate swaps are recorded at fair value on a recurring basis. Other accounts including mortgage servicing rights, impaired loans and other real estate owned may be recorded at fair value on a non-recurring basis, generally in the application of lower of cost or market adjustments or write-downs of specific assets.
The portfolio of investment securities available-for-sale is comprised of U.S. Treasury and other U.S. government obligations, debt securities of U.S. government-sponsored corporations (including mortgage-backed securities), obligations of state and political subdivisions and corporate equity securities. U.S. Treasury and corporate equity securities are priced using quoted prices of identical securities in an active market. These measurements are classified as Level 1 in the hierarchy above. All other securities are priced using standard industry models or matrices with various assumptions such as yield curves, volatility, prepayment speeds, default rates, time value, credit rating and market prices for similar instruments. These assumptions are observable in the market place and can be derived from or supported by observable data. These measurements are classified as Level 2 in the hierarchy above.
Interest rate swaps are valued using primarily Level 2 inputs. Fair value measurements are based on benchmark forward yield curves and other relevant observable market data. For purposes of potential valuation adjustments to derivative positions, Bancorp evaluates the credit risk of its counterparties as well as its own credit risk. To date, Bancorp has not realized any losses due to counterparty’s inability to perform and the change in value of derivative assets and liabilities attributable to credit risk was not significant during 2017.
Below are carrying values of assets measured at fair value on a recurring basis.
|
(In thousands) |
Fair value at December 31, 2017 |
|||||||||||||||
|
Assets |
Total |
Level 1 |
Level 2 |
Level 3 |
||||||||||||
|
Investment securities available-for-sale: |
||||||||||||||||
|
U.S. Treasury and other U.S. government obligations |
$ | 149,984 | $ | 149,984 | $ | – | $ | – | ||||||||
|
Government sponsored enterprise obligations |
213,844 | – | 213,844 | – | ||||||||||||
|
Mortgage-backed securities - government agencies |
161,507 | – | 161,507 | – | ||||||||||||
|
Obligations of states and political subdivisions |
49,189 | – | 49,189 | – | ||||||||||||
|
Total investment securities available-for-sale |
574,524 | 149,984 | 424,540 | – | ||||||||||||
|
Interest rate swaps |
579 | – | 579 | – | ||||||||||||
|
Total assets |
$ | 575,079 | $ | 149,984 | $ | 425,095 | $ | – | ||||||||
|
Liabilities |
||||||||||||||||
|
Interest rate swaps |
$ | 259 | $ | – | $ | 259 | $ | – | ||||||||
|
(In thousands) |
Fair value at December 31, 2016 |
|||||||||||||||
|
Assets |
Total |
Level 1 |
Level 2 |
Level 3 |
||||||||||||
|
Investment securities available-for-sale: |
||||||||||||||||
|
U.S. Treasury and other U.S. government obligations |
$ | 74,998 | $ | 74,998 | $ | – | $ | – | ||||||||
|
Government sponsored enterprise obligations |
268,090 | – | 268,090 | – | ||||||||||||
|
Mortgage-backed securities - government agencies |
168,843 | – | 168,843 | – | ||||||||||||
|
Obligations of states and political subdivisions |
57,444 | – | 57,444 | – | ||||||||||||
|
Corporate equity securities |
699 | 699 | – | – | ||||||||||||
|
Total investment securities available-for-sale |
570,074 | 75,697 | 494,377 | – | ||||||||||||
|
Interest rate swaps |
178 | – | 178 | – | ||||||||||||
|
Total assets |
$ | 570,252 | $ | 75,697 | $ | 494,555 | $ | – | ||||||||
|
Liabilities |
||||||||||||||||
|
Interest rate swaps |
$ | 203 | $ | – | $ | 203 | $ | – | ||||||||
Bancorp had no financial instruments classified within Level 3 of the valuation hierarchy for assets and liabilities measured at fair value on a recurring basis at December 31, 2017 or 2016.
MSRs are recorded at fair value upon capitalization, are amortized to correspond with estimated servicing income, and are periodically assessed for impairment based on fair value at the reporting date. Fair value is based on a valuation model that calculates the present value of estimated net servicing income. The model incorporates assumptions that market participants would use in estimating future net servicing income. These measurements are classified as Level 3. At December 31, 2017 and 2016 there was no valuation allowance for mortgage servicing rights, as fair value exceeded cost. Accordingly, MSRs are not included in either table below for December 31, 2017 or 2016. See Note 7 for more information regarding MSRs.
For impaired loans in the table below, fair value is calculated carrying value of loans with a specific valuation allowance, less the specific allowance, and the carrying value of collateral dependent loans that have been charged down to their fair value. Fair value of impaired loans was primarily measured based on the value of collateral securing these loans. Impaired loans are classified within Level 3 of the fair value hierarchy. Collateral may be real estate and/or business assets including equipment, inventory, and/or accounts receivable. Bancorp determines the value of the collateral based on independent appraisals performed by qualified licensed appraisers. These appraisals may utilize a single valuation approach or a combination of approaches including comparable sales and the income approach. Appraised values are discounted for costs to sell and may be discounted further based on management’s historical knowledge, changes in market conditions from the date of the most recent appraisal, and/or management’s expertise and knowledge of the customer and the customer’s business. Such discounts by management are subjective and are typically significant unobservable inputs for determining fair value. As of December 31, 2017, total impaired collateral dependent loans charged down to their fair value and impaired loans with a valuation allowance were $2.6 million, and the specific allowance totaled $48 thousand, resulting in a fair value of $2.6 million, compared with total collateral dependent loans charged down to their fair value and impaired loans with a valuation allowance of $4.2 million, and the specific allowance allocation totaling $1.3 million, resulting in a fair value of $2.9 million at December 31, 2016. Losses represent charge offs and changes in specific allowances for the period indicated.
Other real estate owned (“OREO”), which is carried at the lower of cost or fair value, is periodically assessed for impairment based on fair value at the reporting date. Fair value is based on appraisals performed by external parties which use judgments and assumptions that are property-specific and sensitive to changes in the overall economic environment. Appraisals may be further discounted based on management’s historical knowledge and/or changes in market conditions from the date of the most recent appraisal. Many of these inputs are not observable and, accordingly, these measurements are classified as Level 3. For OREO in the table below, fair value is the carrying value of only parcels of OREO which have a carrying value equal to appraised value. Losses represent write-downs which occurred during the period indicated. At December 31, 2017 and 2016, carrying value of all other real estate owned was $2.6 million and $5.0 million, respectively.
Below are carrying values of assets measured at fair value on a non-recurring basis.
|
(In thousands) |
Fair value at December 31, 2017 |
|
||||||||||||||||||
|
Total |
Level 1 |
Level 2 |
Level 3 |
Total losses | ||||||||||||||||
|
Impaired loans |
$ | 2,569 | $ | – | $ | – | $ | 2,569 | $ | (121 | ) | |||||||||
|
Other real estate owned |
2,640 | – | – | 2,640 | (171 | ) | ||||||||||||||
|
Total |
$ | 5,209 | $ | – | $ | – | $ | 5,209 | $ | (292 | ) | |||||||||
|
(In thousands) |
Fair value at December 31, 2016 |
|||||||||||||||||||
|
Total |
Level 1 |
Level 2 |
Level 3 |
Total losses | ||||||||||||||||
|
Impaired loans |
$ | 2,933 | $ | – | $ | – | $ | 2,933 | $ | (1,470 | ) | |||||||||
|
Other real estate owned |
4,488 | – | – | 4,488 | (62 | ) | ||||||||||||||
|
Total |
$ | 7,421 | $ | – | $ | – | $ | 7,421 | $ | (1,532 | ) | |||||||||
In the case of the securities portfolio, Bancorp monitors the valuation technique utilized by pricing agencies to ascertain when transfers between levels have occurred. The nature of the remaining assets and liabilities is such that transfers in and out of any level are expected to be rare. For the years ended December 31, 2017, 2016 and 2015, there were no transfers between Levels 1, 2, or 3. For Level 3 assets measured at fair value on a non-recurring basis as of December 31, 2017, the significant unobservable inputs used in the fair value measurements are presented below.
|
Significant |
Weighted |
||||||||||
|
Carrying |
Valuation |
unobservable |
average of |
||||||||
|
(Dollars in thousands) |
amount |
technique |
input |
input |
|||||||
|
Impaired loans - collateral dependent |
$ | 2,569 |
Appraisal |
Appraisal discounts (%) |
11.5 | % | |||||
|
Other real estate owned |
2,640 |
Appraisal |
Appraisal discounts (%) |
23.4 | |||||||
(21) Disclosure of Financial Instruments Not Reported at Fair Value
US GAAP requires disclosure of the fair value of financial assets and liabilities, including those financial assets and financial liabilities that are not measured and reported at fair value on a recurring basis or nonrecurring basis. Carrying amounts, estimated fair values, and placement in the fair value hierarchy of Bancorp’s financial instruments are as follows:
|
(In thousands) |
Carrying |
|||||||||||||||||||
|
December 31, 2017 |
amount |
Fair value |
Level 1 |
Level 2 |
Level 3 |
|||||||||||||||
|
Financial assets |
||||||||||||||||||||
|
Cash and short-term investments |
$ | 139,248 | $ | 139,248 | $ | 139,248 | $ | – | $ | – | ||||||||||
|
Mortgage loans held for sale |
2,964 | 2,964 | – | 2,964 | – | |||||||||||||||
|
Federal Home Loan Bank stock and other securities |
7,646 | 7,646 | – | 7,646 | – | |||||||||||||||
|
Loans, net |
2,384,685 | 2,338,464 | – | – | 2,338,464 | |||||||||||||||
|
Accrued interest receivable |
8,369 | 8,369 | 8,369 | – | – | |||||||||||||||
|
Financial liabilities |
||||||||||||||||||||
|
Deposits |
2,578,295 | 2,576,385 | – | – | 2,576,385 | |||||||||||||||
|
Securities sold under agreement to repurchase |
70,473 | 70,473 | – | 70,473 | – | |||||||||||||||
|
Federal funds purchased |
161,352 | 161,352 | – | 161,352 | – | |||||||||||||||
|
FHLB Advances |
49,458 | 48,642 | – | 48,642 | – | |||||||||||||||
|
Accrued interest payable |
232 | 232 | 232 | – | – | |||||||||||||||
|
December 31, 2016 |
||||||||||||||||||||
|
Financial assets |
||||||||||||||||||||
|
Cash and short-term investments |
$ | 47,973 | $ | 47,973 | $ | 47,973 | $ | – | $ | – | ||||||||||
|
Mortgage loans held for sale |
3,213 | 3,481 | – | 3,481 | – | |||||||||||||||
|
Federal Home Loan Bank stock and other securities |
6,347 | 6,347 | – | 6,347 | – | |||||||||||||||
|
Loans, net |
2,281,368 | 2,284,569 | – | – | 2,284,569 | |||||||||||||||
|
Accrued interest receivable |
6,878 | 6,878 | 6,878 | – | – | |||||||||||||||
|
Financial liabilities |
||||||||||||||||||||
|
Deposits |
2,520,548 | 2,519,725 | – | – | 2,519,725 | |||||||||||||||
|
Securities sold under agreement to repurchase |
67,595 | 67,595 | – | 67,595 | – | |||||||||||||||
|
Federal funds purchased |
47,374 | 47,374 | – | 47,374 | – | |||||||||||||||
|
FHLB Advances |
51,075 | 50,806 | – | 50,806 | – | |||||||||||||||
|
Accrued interest payable |
144 | 144 | 144 | – | – | |||||||||||||||
Management used the following methods and assumptions to estimate the fair value of each class of financial instrument for which it is practicable to estimate the value.
Cash, short-term investments, accrued interest receivable/payable and short-term borrowings
For these short-term instruments, carrying amount is a reasonable estimate of fair value.
Mortgage loans held for sale
Mortgage loans held for sale are initially recorded at the lower of cost or market value. The portfolio is comprised of residential real estate loans and fair value is determined by market quotes for similar loans based on loan type, term, rate, size and the borrower’s credit score.
Federal Home Loan Bank stock and other securities
For these securities without readily available market values, carrying amount is a reasonable estimate of fair value as it equals the amount due from FHLB or other issuer at upon redemption.
Loans, net
US GAAP prescribes the exit price concept for estimating fair value of loans. Because there is not an active market (exit price) for trading virtually all types of loans in Bancorp’s portfolio, fair value of loans is estimated by discounting future cash flows using current rates at which similar loans would be made by the Bank to borrowers with similar credit ratings and for the same remaining maturities (entrance price).
Deposits
Fair value of demand deposits, savings accounts, and certain money market deposits is the amount payable on demand at the reporting date. Fair value of fixed-rate certificates of deposits is estimated by discounting future cash flows using the rates currently offered by the Bank for deposits of similar remaining maturities.
Federal Home Loan Bank advances
Fair value of FHLB advances is estimated by discounting future cash flows using estimates of current market rate for instruments with similar terms and remaining maturities.
Commitments to extend credit and standby letters of credit
Fair values of commitments to extend credit are estimated using fees currently charged to enter into similar agreements and the creditworthiness of the customers. Fair values of standby letters of credit are based on fees currently charged for similar agreements or estimated cost to terminate them or otherwise settle obligations with counterparties at the reporting date.
Limitations
Fair value estimates are made at a specific point in time based on relevant market information and information about financial instruments. Because no market exists for a significant portion of Bancorp’s financial instruments, fair value estimates are based on judgments regarding future expected losses, current economic conditions, risk characteristics of various financial instruments, and other factors. These estimates are subjective in nature and involve uncertainties and matters of significant judgment and therefore cannot be determined with precision. Therefore, calculated fair value estimates in many instances cannot be substantiated by comparison to independent markets and, in many cases, may not be realizable in a current sale of the instrument. Changes in assumptions could significantly affect estimates.
(22) Derivative Financial Instruments
Periodically, Bancorp enters into an interest rate swap transaction with a borrower, who desires to hedge their exposure to rising interest rates, while at the same time entering into an offsetting interest rate swap, with substantially matching terms, with another approved independent counterparty. These are undesignated derivative instruments and are recognized on the consolidated balance sheet at fair value. Because of matching terms of offsetting contracts and collateral provisions mitigating any non-performance risk, changes in fair value subsequent to initial recognition are expected to have an insignificant effect on earnings. Exchanges of cash flows related to the undesignated interest rate swap agreements for 2017 were offsetting and therefore had no net effect on Bancorp’s earnings or cash flows.
Interest rate swap agreements derive their value from underlying interest rates. These transactions involve both credit and market risk. Notional amounts are amounts on which calculations, payments, and the value of the derivative are based. Notional amounts do not represent direct credit exposures. Direct credit exposure is limited to the net difference between the calculated amounts to be received and paid, if any. Bancorp is exposed to credit-related losses in the event of nonperformance by counterparties to these agreements. Bancorp mitigates the credit risk of its financial contracts through credit approvals, limits, collateral, and monitoring procedures, and does not expect any counterparties to fail their obligations.
At December 31, 2017 and 2016, Bancorp had outstanding undesignated interest rate swap contracts as follows:
|
(Dollar amounts in thousands) |
Receiving |
Paying |
||||||||||||||
|
December 31, |
December 31, |
December 31, |
December 31, |
|||||||||||||
|
2017 |
2016 |
2017 |
2016 |
|||||||||||||
|
Notional amount |
$ | 54,964 | $ | 43,986 | $ | 54,964 | $ | 43,986 | ||||||||
|
Weighted average maturity (years) |
8.7 | 9.9 | 8.7 | 9.9 | ||||||||||||
|
Fair value |
$ | (259 | ) | $ | (178 | ) | $ | 283 | $ | 178 | ||||||
In 2016, Bancorp entered into an interest rate swap to hedge cash flows of a $10 million rolling fixed-rate three-month FHLB borrowing. The swap began in December 2016 and ends in December 2021. In 2015, Bancorp entered into an interest rate swap to hedge cash flows of a $20 million rolling fixed-rate three-month FHLB borrowing. The swap began in December 2015 and matures in December 2020. For purposes of hedging, rolling fixed rate advances are considered to be floating rate liabilities. Interest rate swaps involve exchange of Bancorp’s floating rate interest payments for fixed rate swap payments on underlying principal amounts. These swaps were designated, and qualified, for cash-flow hedge accounting. For derivative instruments that are designated and qualify as cash flow hedging instruments, the effective portion of gains or losses is reported as a component of other comprehensive income, and is subsequently reclassified into earnings as an adjustment to interest expense in periods in which the hedged forecasted transaction affects earnings. The following table details Bancorp’s derivative position designated as a cash flow hedge, and the fair values as of December 31, 2017 and 2016.
|
(Dollars in thousands) |
|||||||||||||||||
|
Notional |
Maturity |
Receive (variable) |
Pay fixed |
Fair value |
Fair value |
||||||||||||
|
amount |
date |
index |
swap rate |
December 31, 2017 |
December 31, 2016 |
||||||||||||
| $ | 10,000 |
12/6/2021 |
US 3 Month LIBOR |
1.89 |
% |
$ | 106 | $ | 16 | ||||||||
| 20,000 |
12/6/2020 |
US 3 Month LIBOR |
1.79 | 190 | 9 | ||||||||||||
| $ | 30,000 | 1.82 |
% |
$ | 296 | $ | 25 | ||||||||||
(23) Regulatory Matters
Bancorp and the Bank are subject to various capital requirements prescribed by banking regulations and administered by state and federal banking agencies. Under these requirements, Bancorp and the Bank must meet minimum amounts and percentages of Tier 1, common equity Tier 1, and total capital, as defined, to risk weighted assets and Tier 1 capital to average assets. Risk weighted assets are determined by applying certain risk weightings prescribed by the regulations to various categories of assets and off-balance sheet commitments. Capital and risk weighted assets may be further subject to qualitative judgments by regulators as to components, risk weighting and other factors. Failure to meet the capital requirements can result in certain mandatory, and possibly discretionary, corrective actions prescribed by the regulations or determined to be necessary by the regulators, which could materially affect the unaudited consolidated financial statements.
In 2013, the Federal Reserve Board and the FDIC approved rules that substantially amended the regulatory risk-based capital rules applicable to Bancorp and Bank. The rules implemented the regulatory capital reforms of the Basel Committee on Banking Supervision reflected in “Basel III: A Global Regulatory Framework for More Resilient Banks and Banking Systems” (“Basel III”) and changes required by the Dodd-Frank Act. The Basel III regulatory capital reforms became effective for Bancorp and Bank on January 1, 2015, and included new minimum risk-based capital and leverage ratios. For Bancorp, key differences under Basel III include risk weighting for loan commitments under one year and higher risk weighting for certain commercial real estate and construction loans. These differences resulted in higher risk-weighted assets, and therefore, somewhat lower risk-based capital ratios. Bancorp and the Bank met all capital requirements to which they were subject as of December 31, 2017 and 2016.
The following table sets forth consolidated Bancorp’s and the Bank’s risk based capital amounts and ratios as of December 31, 2017 and 2016 follows:
|
(Dollars in thousands) |
Actual |
Minimum for adequately capitalized |
Minimum for well capitalized |
|||||||||||||||||||||
|
December 31, 2017 |
Amount |
Ratio |
Amount |
Ratio |
Amount |
Ratio |
||||||||||||||||||
|
Total risk-based capital |
||||||||||||||||||||||||
|
Consolidated |
$ | 359,866 | 13.52 |
% |
$ | 213,012 | 8.0 |
% |
NA | NA | ||||||||||||||
|
Bank |
347,840 | 13.07 | 212,891 | 8.0 | $ | 266,114 | 10.0 |
% |
||||||||||||||||
|
Common Equity Tier 1 risk-based capital |
||||||||||||||||||||||||
|
Consolidated |
334,631 | 12.57 | 119,820 | 4.5 | NA | NA | ||||||||||||||||||
|
Bank |
322,605 | 12.12 | 212,891 | 4.5 | 172,974 | 6.5 | ||||||||||||||||||
|
Tier 1 risk-based capital |
||||||||||||||||||||||||
|
Consolidated |
334,631 | 12.57 | 159,760 | 6.0 | NA | NA | ||||||||||||||||||
|
Bank |
322,605 | 12.12 | 159,668 | 6.0 | 212,891 | 8.0 | ||||||||||||||||||
|
Leverage (1) |
||||||||||||||||||||||||
|
Consolidated |
334,631 | 10.70 | 125,122 | 4.0 | NA | NA | ||||||||||||||||||
|
Bank |
322,605 | 10.32 | 125,040 | 4.0 | 156,300 | 5.0 | ||||||||||||||||||
|
Actual |
Minimum for adequately capitalized |
Minimum for well capitalized |
||||||||||||||||||||||
|
December 31, 2016 |
Amount |
Ratio |
Amount |
Ratio |
Amount |
Ratio |
||||||||||||||||||
|
Total risk-based capital |
||||||||||||||||||||||||
|
Consolidated |
$ | 338,525 | 13.04 |
% |
$ | 207,684 | 8.0 |
% |
NA | NA | ||||||||||||||
|
Bank |
325,630 | 12.57 | 207,243 | 8.0 | $ | 258,986 | 10.0 |
% |
||||||||||||||||
|
Common Equity Tier 1 risk-based capital |
||||||||||||||||||||||||
|
Consolidated |
314,147 | 12.10 | 116,832 | 4.5 | NA | NA | ||||||||||||||||||
|
Bank |
301,252 | 11.63 | 116,564 | 4.5 | 168,341 | 6.5 | ||||||||||||||||||
|
Tier 1 risk-based capital |
||||||||||||||||||||||||
|
Consolidated |
314,147 | 12.10 | 155,775 | 6.0 | NA | NA | ||||||||||||||||||
|
Bank |
301,252 | 11.63 | 155,418 | 6.0 | 207,189 | 8.0 | ||||||||||||||||||
|
Leverage (1) |
||||||||||||||||||||||||
|
Consolidated |
314,147 | 10.54 | 119,221 | 4.0 | NA | NA | ||||||||||||||||||
|
Bank |
301,252 | 10.11 | 119,190 | 4.0 | 148,927 | 5.0 | ||||||||||||||||||
Ratio is computed in relation to risk-weighted assets.
(1) Ratio is computed in relation to average assets.
NA – Not applicable. Regulatory framework does not define well capitalized for holding companies.
(24) Stock Yards Bancorp, Inc. (parent company only)
|
Condensed Balance Sheets |
||||||||
|
December 31, |
||||||||
|
(In thousands) |
2017 |
2016 |
||||||
|
Assets |
||||||||
|
Cash on deposit with subsidiary bank |
$ | 10,648 | $ | 6,972 | ||||
|
Investment in and receivable from subsidiaries |
321,617 | 300,977 | ||||||
|
Other assets |
1,521 | 6,005 | ||||||
|
Total assets |
$ | 333,786 | $ | 313,954 | ||||
|
Liabilities and stockholders’ equity |
||||||||
|
Other liabilities |
$ | 142 | $ | 82 | ||||
|
Total stockholders’ equity |
333,644 | 313,872 | ||||||
|
Total liabilities and stockholders’ equity |
$ | 333,786 | $ | 313,954 | ||||
|
Condensed Statements of Income |
||||||||||||
|
Years ended December 31, |
||||||||||||
|
(In thousands) |
2017 |
2016 |
2015 |
|||||||||
|
Income - dividends and interest from subsidiaries |
$ | 18,160 | $ | 16,147 | $ | 14,244 | ||||||
|
Other income |
82 | 1 | 15 | |||||||||
|
Less expenses |
3,255 | 2,235 | 2,511 | |||||||||
|
Income before income taxes and equity in undistributed net income of subsidiary |
14,987 | 13,913 | 11,748 | |||||||||
|
Income tax benefit |
(1,985 | ) | (987 | ) | (1,016 | ) | ||||||
|
Income before equity in undistributed net income of subsidiary |
16,972 | 14,900 | 12,764 | |||||||||
|
Equity in undistributed net income of subsidiary |
21,071 | 26,127 | 24,423 | |||||||||
|
Net income |
$ | 38,043 | $ | 41,027 | $ | 37,187 | ||||||
|
Condensed Statements of Cash Flows |
||||||||||||
|
Years ended December 31 |
||||||||||||
|
(In thousands) |
2017 |
2016 |
2015 |
|||||||||
|
Operating activities |
||||||||||||
|
Net income |
$ | 38,043 | $ | 41,027 | $ | 37,187 | ||||||
|
Adjustments to reconcile net income to net cash provided by operating activities: |
||||||||||||
|
Equity in undistributed net income of subsidiaries |
(21,071 | ) | (26,127 | ) | (24,423 | ) | ||||||
|
(Increase) decrease in receivable from subsidiaries |
– | – | (842 | ) | ||||||||
|
Stock compensation expense |
2,892 | 2,473 | 2,134 | |||||||||
|
Excess tax benefits from share-based compensation arrangements |
(1,463 | ) | (1,705 | ) | (673 | ) | ||||||
|
Recover of impairment loss on other assets held for investment |
(588 | ) | – | |||||||||
|
Depreciation, amortization and accretion, net |
4 | 10 | 11 | |||||||||
|
Proceeds from liquidation of private investment fund |
(81 | ) | – | – | ||||||||
|
Decrease (increase) in other assets |
5,943 | (990 | ) | 531 | ||||||||
|
Increase in other liabilities |
10 | 11 | 91 | |||||||||
|
Net cash provided by operating activities |
24,277 | 14,111 | 14,016 | |||||||||
|
Investing activities |
||||||||||||
|
Proceeds from sale of other assets held for investment |
– | 1,108 | – | |||||||||
|
Proceeds from liquidation of private investment fund |
81 | – | – | |||||||||
|
Net cash provided by investing activities |
81 | 1,108 | – | |||||||||
|
Financing activities |
||||||||||||
|
Common stock repurchases |
(2,389 | ) | 2,337 | 3,249 | ||||||||
|
Excess tax benefit from share-based compensation arrangements |
– | 1,705 | 673 | |||||||||
|
Proceeds (used for) and received from settlement of stock awards |
(216 | ) | (1,918 | ) | (918 | ) | ||||||
|
Cash dividends paid |
(18,077 | ) | (16,093 | ) | (14,224 | ) | ||||||
|
Net cash used in financing activities |
(20,682 | ) | (13,969 | ) | (11,220 | ) | ||||||
|
Net increase (decrease) in cash |
3,676 | 1,250 | 2,796 | |||||||||
|
Cash at beginning of year |
6,972 | 5,722 | 2,926 | |||||||||
|
Cash at end of year |
$ | 10,648 | $ | 6,972 | $ | 5,722 | ||||||
(25) Segments
Bancorp’s principal activities include commercial banking and wealth management and trust (WM&T). Commercial banking provides a full range of loan and deposit products to individual consumers and businesses, plus origination of consumer mortgages and investment product sales. WM&T provides investment management, trust and estate administration, and retirement plan services.
Financial information for each business segment reflects that which is specifically identifiable or allocated based on an internal allocation method. Income taxes are allocated based on the effective federal income tax rate adjusted for any tax exempt activity. All tax exempt activity and provision for loan losses have been allocated to the commercial banking segment. Measurement of the performance of the business segments is based on the management structure of Bancorp and is not necessarily comparable with similar information for any other financial institution. Information presented is also not necessarily indicative of the segments’ operations if they were independent entities.
Principally, all of the net assets of Stock Yards Bancorp, Inc. are involved in the commercial banking segment. Bancorp has goodwill of $682,000 related to a bank acquisition in 1996 which has been assigned to the commercial banking segment. Assets assigned to WM&T consist of premises and equipment, net of accumulated depreciation.
Selected financial information by business segment follows:
|
Wealth |
||||||||||||
|
Commercial |
management |
|||||||||||
|
(In thousands) |
banking |
and trust |
Total |
|||||||||
|
Year ended December 31, 2017 |
||||||||||||
|
Net interest income |
$ | 103,302 | $ | 301 | $ | 103,603 | ||||||
|
Provision for loan losses |
2,550 | – | 2,550 | |||||||||
|
Investment management and trust services |
– | 20,505 | 20,505 | |||||||||
|
All other non-interest income |
24,615 | – | 24,615 | |||||||||
|
Non-interest expense |
78,752 | 12,239 | 90,991 | |||||||||
|
Income before income taxes |
46,615 | 8,567 | 55,182 | |||||||||
|
Income tax expense |
14,080 | 3,059 | 17,139 | |||||||||
|
Net income |
$ | 32,535 | $ | 5,508 | $ | 38,043 | ||||||
|
Segment assets |
$ | 3,237,656 | $ | 1,990 | $ | 3,239,646 | ||||||
|
Year ended December 31, 2016 |
||||||||||||
|
Net interest income |
$ | 96,986 | $ | 268 | $ | 97,254 | ||||||
|
Provision for loan losses |
3,000 | – | 3,000 | |||||||||
|
Investment management and trust services |
– | 19,155 | 19,155 | |||||||||
|
All other non-interest income |
24,382 | – | 24,382 | |||||||||
|
Non-interest expense |
70,230 | 11,290 | 81,520 | |||||||||
|
Income before income taxes |
48,138 | 8,133 | 56,271 | |||||||||
|
Income tax expense |
12,340 | 2,904 | 15,244 | |||||||||
|
Net income |
$ | 35,798 | $ | 5,229 | $ | 41,027 | ||||||
|
Segment assets |
$ | 3,037,394 | $ | 2,087 | $ | 3,039,481 | ||||||
|
Year ended December 31, 2015 |
||||||||||||
|
Net interest income |
$ | 88,124 | $ | 194 | $ | 88,318 | ||||||
|
Credit for loan losses |
750 | – | 750 | |||||||||
|
Investment management and trust services |
– | 18,026 | 18,026 | |||||||||
|
All other non-interest income |
21,924 | – | 21,924 | |||||||||
|
Non-interest expense |
62,748 | 10,650 | 73,398 | |||||||||
|
Income before income taxes |
46,550 | 7,570 | 54,120 | |||||||||
|
Income tax expense |
14,238 | 2,695 | 16,933 | |||||||||
|
Net income |
$ | 32,312 | $ | 4,875 | $ | 37,187 | ||||||
|
Segment assets |
$ | 2,816,373 | $ | 428 | $ | 2,816,801 | ||||||
(26) Quarterly Operating Results (unaudited)
Following is a summary of quarterly operating results for 2017, 2016 and 2015:
|
2017 |
||||||||||||||||
|
4th quarter |
3rd quarter |
2nd quarter |
1st quarter |
|||||||||||||
|
Interest income |
$ | 29,092 | $ | 28,111 | $ | 27,013 | $ | 26,633 | ||||||||
|
Interest expense |
2,069 | 1,947 | 1,781 | 1,449 | ||||||||||||
|
Net interest income |
27,023 | 26,164 | 25,232 | 25,184 | ||||||||||||
|
Provision for loan losses |
900 | 150 | 600 | 900 | ||||||||||||
|
Net interest income after provision |
26,123 | 26,014 | 24,632 | 24,284 | ||||||||||||
|
Non-interest income |
11,545 | 11,103 | 11,675 | 10,797 | ||||||||||||
|
Non-interest expenses |
27,180 | 21,317 | 21,346 | 21,148 | ||||||||||||
|
Income before income taxes |
10,488 | 15,800 | 14,961 | 13,933 | ||||||||||||
|
Income tax expense |
5,542 | 4,096 | 4,359 | 3,142 | ||||||||||||
|
Net income |
$ | 4,946 | $ | 11,704 | $ | 10,602 | $ | 10,791 | ||||||||
|
Basic earnings per share |
$ | 0.22 | $ | 0.52 | $ | 0.47 | $ | 0.48 | ||||||||
|
Diluted earnings per share |
0.22 | 0.51 | 0.46 | 0.47 | ||||||||||||
|
2016 |
||||||||||||||||
|
(In thousands, except per share data) |
4th quarter |
3rd quarter |
2nd quarter |
1st quarter |
||||||||||||
|
Interest income |
$ | 26,368 | $ | 25,942 | $ | 25,162 | $ | 24,700 | ||||||||
|
Interest expense |
1,293 | 1,182 | 1,212 | 1,231 | ||||||||||||
|
Net interest income |
25,075 | 24,760 | 23,950 | 23,469 | ||||||||||||
|
Provision for loan losses |
500 | 1,250 | 750 | 500 | ||||||||||||
|
Net interest income after provision |
24,575 | 23,510 | 23,200 | 22,969 | ||||||||||||
|
Non-interest income |
11,319 | 11,358 | 10,778 | 10,082 | ||||||||||||
|
Non-interest expenses |
21,269 | 20,518 | 20,193 | 19,540 | ||||||||||||
|
Income before income taxes |
14,625 | 14,350 | 13,785 | 13,511 | ||||||||||||
|
Income tax expense |
4,009 | 3,883 | 3,676 | 3,676 | ||||||||||||
|
Net income |
$ | 10,616 | $ | 10,467 | $ | 10,109 | $ | 9,835 | ||||||||
|
Basic earnings per share |
$ | 0.47 | $ | 0.47 | $ | 0.45 | $ | 0.44 | ||||||||
|
Diluted earnings per share |
0.46 | 0.46 | 0.45 | 0.44 | ||||||||||||
|
2015 |
||||||||||||||||
|
(In thousands, except per share data) |
4th quarter |
3rd quarter |
2nd quarter |
1st quarter |
||||||||||||
|
Interest income |
$ | 24,039 | $ | 23,284 | $ | 23,000 | $ | 22,847 | ||||||||
|
Interest expense |
1,217 | 1,203 | 1,199 | 1,233 | ||||||||||||
|
Net interest income |
22,822 | 22,081 | 21,801 | 21,614 | ||||||||||||
|
Provision for loan losses |
750 | – | – | – | ||||||||||||
|
Net interest income after provision |
22,072 | 22,081 | 21,801 | 21,614 | ||||||||||||
|
Non-interest income |
10,073 | 9,985 | 10,219 | 9,673 | ||||||||||||
|
Non-interest expenses |
18,322 | 18,430 | 18,867 | 17,779 | ||||||||||||
|
Income before income taxes |
13,823 | 13,636 | 13,153 | 13,508 | ||||||||||||
|
Income tax expense |
4,177 | 4,352 | 4,151 | 4,253 | ||||||||||||
|
Net income |
$ | 9,646 | $ | 9,284 | $ | 9,002 | $ | 9,255 | ||||||||
|
Basic earnings per share |
$ | 0.43 | $ | 0.42 | $ | 0.41 | $ | 0.42 | ||||||||
|
Diluted earnings per share |
0.43 | 0.41 | 0.40 | 0.42 | ||||||||||||
|
Note: |
The sum of earnings per share of each of the quarters in 2017, 2016 and 2015 may not add to the year-to-date amount reported in Bancorp’s consolidated financial statements due to rounding. |
Report of Independent Registered Public Accounting Firm
To the Board of Directors and Stockholders
Stock Yards Bancorp, Inc.:
Opinion on the Consolidated Financial Statements
We have audited the accompanying consolidated balance sheets of Stock Yards Bancorp, Inc. and subsidiary (the Company) as of December 31, 2017 and 2016, the related consolidated statements of income, comprehensive income, changes in stockholders’ equity, and cash flows for each of the years in the three-year period ended December 31, 2017 and the related notes (collectively, the consolidated financial statements). In our opinion, the consolidated financial statements present fairly, in all material respects, the financial position of the Company as of December 31, 2017 and 2016, and the results of its operations and its cash flows for each of the years in the three-year period ended December 31, 2017, in conformity with U.S. generally accepted accounting principles.
We also have audited, in accordance with the standards of the Public Company Accounting Oversight Board (United States) (PCAOB), the Company’s internal control over financial reporting as of December 31, 2017, based on criteria established in Internal Control – Integrated Framework (2013) issued by the Committee of Sponsoring Organizations of the Treadway Commission, and our report dated March 13, 2018 expressed an unqualified opinion on the effectiveness of the Company’s internal control over financial reporting.
Basis for Opinion
These consolidated financial statements are the responsibility of the Company’s management. Our responsibility is to express an opinion on these consolidated financial statements based on our audits. We are a public accounting firm registered with the PCAOB and are required to be independent with respect to the Company in accordance with the U.S. federal securities laws and the applicable rules and regulations of the Securities and Exchange Commission and the PCAOB.
We conducted our audits in accordance with the standards of the PCAOB. Those standards require that we plan and perform the audit to obtain reasonable assurance about whether the consolidated financial statements are free of material misstatement, whether due to error or fraud. Our audits included performing procedures to assess the risks of material misstatement of the consolidated financial statements, whether due to error or fraud, and performing procedures that respond to those risks. Such procedures included examining, on a test basis, evidence regarding the amounts and disclosures in the consolidated financial statements. Our audits also included evaluating the accounting principles used and significant estimates made by management, as well as evaluating the overall presentation of the consolidated financial statements. We believe that our audits provide a reasonable basis for our opinion.
(signed) KPMG LLP
We have served as the Company’s auditor since 1988.
Atlanta, Georgia
March 13, 2018
Management’s Report on Consolidated Financial Statements
The accompanying consolidated financial statements and other financial data were prepared by the management of Stock Yards Bancorp, Inc. (Bancorp), which has the responsibility for the integrity of the information presented. The consolidated financial statements have been prepared in conformity with U.S. generally accepted accounting principles and, as such, include amounts that are the best estimates and judgments of management with consideration given to materiality.
Management is further responsible for maintaining a system of internal controls designed to provide reasonable assurance that the books and records reflect the transactions of Bancorp and that its established policies and procedures are carefully followed. Management believes that Bancorp’s system, taken as a whole, provides reasonable assurance that transactions are executed in accordance with management’s general or specific authorization; transactions are recorded as necessary to permit preparation of financial statements in conformity with U.S. generally accepted accounting principles and to maintain accountability for assets; access to assets is permitted only in accordance with management’s general or specific authorization, and the recorded accountability for assets is compared with the existing assets at reasonable intervals and appropriate action is taken with respect to any differences.
Management also seeks to assure the objectivity and integrity of Bancorp’s financial data by the careful selection and training of qualified personnel, an internal audit function and organizational arrangements that provide an appropriate division of responsibility.
KPMG LLP, the independent registered public accounting firm that audited the consolidated financial statements of Bancorp included in this Annual Report on Form 10-K, has issued a report on Bancorp’s internal control over financial reporting as of December 31, 2017. The report expresses an unqualified opinion on the effectiveness of the Company’s internal control over financial reporting as of December 31, 2017.
The Board of Directors provides its oversight role for the consolidated financial statements through the Audit Committee. The Audit Committee meets periodically with management, the internal auditors, and the independent auditors, each on a private basis, to review matters relating to financial reporting, the internal control systems, and the scope and results of audit efforts. The internal and independent auditors have unrestricted access to the Audit Committee, with and without the presence of management, to discuss accounting, auditing, and financial reporting matters. The Audit Committee also recommends the appointment of the independent auditors to the Board of Directors, and ultimately has sole authority to appoint or replace the independent auditors.
|
/s/ David P. Heintzman |
|
|
David P. Heintzman |
|
|
Chairman and Chief Executive Officer |
|
|
|
|
|
/s/ Nancy B. Davis |
|
|
Nancy B. Davis |
|
|
Executive Vice President and Chief Financial Officer |
|
|
Item 9. |
Changes in and Disagreements with Accountants on Accounting and Financial Disclosure |
None
|
Item 9A. |
Controls and Procedures |
Disclosure Controls and Procedures
Bancorp maintains disclosure controls and procedures designed to ensure that it is able to collect the information it is required to disclose in the reports it files with the Securities and Exchange Commission (SEC), and to record, process, summarize and disclose this information within the time periods specified in the rules of the SEC. Based on their evaluation of Bancorp’s disclosure controls and procedures which took place as of December 31, 2017, the Chief Executive and Chief Financial Officers believe that these controls and procedures are effective to ensure that Bancorp is able to collect, process and disclose the information it is required to disclose in the reports it files with the SEC within the required time periods.
As described in Management’s Report on Internal Control Over Financial Reporting in Bancorp’s Annual Report on Form 10-K for the year ended December 31, 2016, during the fourth quarter of 2016 management identified a material weakness in internal control related to operating effectiveness of the Company’s control over the assessment of the appropriateness of loan grades used in the allowance for loan losses estimate, including completeness and accuracy of information used to assess loan grades. This material weakness in internal controls occurred due to the control operator not consistently executing the loan grade review control, as designed, including the use of complete and accurate information. No restatement of prior period financial statements, no change in previously issued financial results, and no adjustment to the fourth quarter 2016 allowance for loan losses calculation were required as a result of this material weakness in internal control, however, a reasonable possibility existed that material misstatements in Bancorp’s financial statements would not be prevented or detected on a timely basis.
To remediate the material weakness described above, management designed and implemented controls and enhanced and revised existing controls and procedures over completeness and accuracy of information used to assess loan grades. During the fourth quarter of 2017, management successfully completed testing necessary to conclude the material weakness had been remediated.
Based on the evaluation of Bancorp’s disclosure controls and procedures by the Chief Executive and Chief Financial Officers, except for the foregoing, no changes occurred during the fiscal quarter ended December 31, 2017 in Bancorp’s internal control over financial reporting that has materially affected, or is reasonably likely to materially affect, Bancorp’s internal control over financial reporting.
Management’s Report on Internal Control Over Financial Reporting
The management of Stock Yards Bancorp, Inc. and subsidiary (Bancorp) is responsible for establishing and maintaining adequate internal control over financial reporting. Bancorp’s internal control over financial reporting is a process designed under the supervision of Bancorp’s Chief Executive Officer and Chief Financial Officer, and effected by Bancorp’s board of directors, management and other personnel, to provide reasonable assurance regarding the reliability of financial reporting and the preparation of financial statements for external purposes in accordance with U.S. generally accepted accounting principles. This process includes those policies and procedures that:
|
1. |
Pertain to the maintenance of records, that in reasonable detail, accurately and fairly reflect the transactions and dispositions of the assets of Bancorp; |
|
2. |
Provide reasonable assurance that transactions are recorded as necessary to permit preparation of financial statements in accordance with U.S. generally accepted accounting principles, and that receipts and expenditures of Bancorp are being made only in accordance with authorizations of management and directors of Bancorp; and |
|
3. |
Provide reasonable assurance regarding prevention or timely detection of unauthorized acquisition, use or disposition of Bancorp’s assets that could have a material effect on the financial statements. |
Because of its inherent limitations, internal control over financial reporting may not prevent or detect misstatements. Also, projections of any evaluation of effectiveness to future periods are subject to the risk that controls may become inadequate because of changes in conditions, or that the degree of compliance with policies or procedures may deteriorate.
Management has assessed the effectiveness of its internal control over financial reporting as of December 31, 2017, based on the control criteria established in a report entitled Internal Control – Integrated Framework (2013), issued by the Committee of Sponsoring Organizations of the Treadway Commission (COSO). Based on such assessment, management has concluded that Bancorp’s internal control over financial reporting is effective as of December 31, 2017.
KPMG LLP, the independent registered public accounting firm that audited the consolidated financial statements of Bancorp included in this Annual Report on Form 10-K, has also audited Bancorp’s internal control over financial reporting as of December 31, 2017. Their report expressed an unqualified opinion on the effectiveness of Bancorp’s internal control over financial reporting as of December 31, 2017.
|
/s/ David P. Heintzman |
|
|
David P. Heintzman |
|
|
Chairman and Chief Executive Officer |
|
|
|
|
|
/s/ Nancy B. Davis |
|
|
Nancy B. Davis |
|
|
Executive Vice President and Chief Financial Officer |
|
Report of Independent Registered Public Accounting Firm
To the Board of Directors and Stockholders
Stock Yards Bancorp, Inc.:
Opinion on Internal Control Over Financial Reporting
We have audited Stock Yards Bancorp, Inc.’s (the Company) internal control over financial reporting as of December 31, 2017, based on criteria established in Internal Control – Integrated Framework (2013) issued by the Committee of Sponsoring Organizations of the Treadway Commission. In our opinion, the Company maintained, in all material respects, effective internal control over financial reporting as of December 31, 2017, based on criteria established in Internal Control – Integrated Framework (2013) issued by the Committee of Sponsoring Organizations of the Treadway Commission.
We also have audited, in accordance with the standards of the Public Company Accounting Oversight Board (United States) (PCAOB), the consolidated balance sheets of the Company and subsidiary as of December 31, 2017 and 2016, the related consolidated statements of income, comprehensive income, changes in stockholders’ equity, and cash flows for each of the years in the three-year period ended December 31, 2017, and the related notes (collectively, the consolidated financial statements), and our report dated March 13, 2018 expressed an unqualified opinion on those consolidated financial statements.
Basis for Opinion
The Company’s management is responsible for maintaining effective internal control over financial reporting and for its assessment of the effectiveness of internal control over financial reporting, included in the accompanying Management’s Report on Internal Control over Financial Reporting. Our responsibility is to express an opinion on the Company’s internal control over financial reporting based on our audit. We are a public accounting firm registered with the PCAOB and are required to be independent with respect to the Company in accordance with the U.S. federal securities laws and the applicable rules and regulations of the Securities and Exchange Commission and the PCAOB.
We conducted our audit in accordance with the standards of the PCAOB. Those standards require that we plan and perform the audit to obtain reasonable assurance about whether effective internal control over financial reporting was maintained in all material respects. Our audit of internal control over financial reporting included obtaining an understanding of internal control over financial reporting, assessing the risk that a material weakness exists, and testing and evaluating the design and operating effectiveness of internal control based on the assessed risk. Our audit also included performing such other procedures as we considered necessary in the circumstances. We believe that our audit provides a reasonable basis for our opinion.
Definition and Limitations of Internal Control Over Financial Reporting
A company’s internal control over financial reporting is a process designed to provide reasonable assurance regarding the reliability of financial reporting and the preparation of financial statements for external purposes in accordance with generally accepted accounting principles. A company’s internal control over financial reporting includes those policies and procedures that (1) pertain to the maintenance of records that, in reasonable detail, accurately and fairly reflect the transactions and dispositions of the assets of the company; (2) provide reasonable assurance that transactions are recorded as necessary to permit preparation of financial statements in accordance with generally accepted accounting principles, and that receipts and expenditures of the company are being made only in accordance with authorizations of management and directors of the company; and (3) provide reasonable assurance regarding prevention or timely detection of unauthorized acquisition, use, or disposition of the company’s assets that could have a material effect on the financial statements.
Because of its inherent limitations, internal control over financial reporting may not prevent or detect misstatements. Also, projections of any evaluation of effectiveness to future periods are subject to the risk that controls may become inadequate because of changes in conditions, or that the degree of compliance with the policies or procedures may deteriorate.
(signed) KPMG LLP
Louisville, Kentucky
March 13, 2018
None
Item 10. Directors, Executive Officers and Corporate Governance
Information regarding the directors and executive officers of Bancorp is incorporated herein by reference to the discussion under the headings, “ITEM 1. ELECTION OF TWELVE DIRECTORS,” and “SECTION 16(A) BENEFICIAL OWNERSHIP REPORTING COMPLIANCE” in Bancorp’s Proxy Statement to be filed with the Securities and Exchange Commission for the 2018 Annual Meeting of Shareholders (“Proxy Statement”) and the section captioned EXECUTIVE OFFICERS OF THE REGISTRANT in this Form 10-K.
Information regarding the Audit Committee is incorporated herein by reference to the discussion under the heading, “BOARD OF DIRECTORS’ MEETINGS AND COMMITTEES” in Bancorp’s Proxy Statement.
Information regarding principal occupation of directors of Bancorp follows:
Paul J. Bickel III – Founder and President, U.S. Specialties
J. McCauley Brown – Retired Vice President, Brown-Forman Corporation;
Charles R. Edinger, III – President, J. Edinger & Son., Inc.;
David P. Heintzman – Chairman and Chief Executive Officer, Stock Yards Bancorp, Inc. and Stock Yards Bank & Trust Company;
Donna Heitzman – Retired portfolio manager, KKR Prisma Capital;
Carl G. Herde – Vice President/Finance, Kentucky Hospital Association;
James A. Hillebrand –President, Stock Yards Bancorp, Inc. and Stock Yards Bank & Trust Company;
Richard A. Lechleiter – President, Catholic Education Foundation of Louisville;
Richard Northern – Partner, Wyatt, Tarrant & Combs LLP;
Stephen M. Priebe – President, Hall Contracting of Kentucky;
Norman Tasman – President, Tasman Industries Inc. and Tasman Hide Processing Inc.;
Kathy C. Thompson – Senior Executive Vice President, Stock Yards Bancorp, Inc. and Stock Yards Bank & Trust Company.
The Board of Directors of Bancorp has adopted a code of ethics for its chief executive officer and financial executives. A copy of the code of ethics is filed as an exhibit to this Annual Report.
Item 11. Executive Compensation
Information regarding the compensation of Bancorp’s executive officers and directors is incorporated herein by reference to the discussion under the heading, “EXECUTIVE COMPENSATION AND OTHER INFORMATION – REPORT ON EXECUTIVE COMPENSATION” in Bancorp’s Proxy Statement.
Information regarding the Compensation Committee is incorporated herein by reference to the discussion under the heading, “TRANSACTIONS WITH MANAGEMENT AND OTHERS” in Bancorp’s Proxy Statement. The report of the Compensation Committee shall not be deemed filed for purposes of Section 18 of the Securities Exchange Act of 1934 or otherwise subject to the liabilities of that section, nor shall it be deemed soliciting material or subject to Regulation 14A of the Exchange Act or incorporated by reference in any filing under the Exchange Act or the Securities Act of 1933, except as shall be expressly set forth by specific reference in such filing.
Item 12. Security Ownership of Certain Beneficial Owners and Management and Related Stockholder Matters
The information required by this item is incorporated herein by reference to the discussion under the headings, “ITEM 1. ELECTION OF TWELVE DIRECTORS” and “SECURITY OWNERSHIP OF CERTAIN BENEFICIAL OWNERS AND MANAGEMENT,” in Bancorp’s Proxy Statement.
The information required by this item concerning equity compensation plan information is included in Note 17 of the Notes to Consolidated Financial Statements.
Item 13. Certain Relationships and Related Transactions, and Director Independence
The information required by this item is incorporated herein by reference to the discussion under the headings, “ITEM 1. ELECTION OF TWELVE DIRECTORS” and “TRANSACTIONS WITH MANAGEMENT AND OTHERS,” in Bancorp’s Proxy Statement.
Item 14. Principal Accounting Fees and Services
The information required by this item is incorporated herein by reference to the discussion under the heading, “REPORT OF THE AUDIT COMMITTEE” in Bancorp’s Proxy Statement.
Item 15. Exhibits and Financial Statement Schedules
|
(a) 1. |
The following financial statements are included in this Form 10-K: |
|
Consolidated Balance Sheets – December 31, 2017 and 2016 |
|
Consolidated Statements of Income - years ended December 31, 2017, 2016 and 2015 |
|
Consolidated Statements of Comprehensive Income - years ended December 31, 2017, 2016 and 2015 Consolidated Statements of Changes in Stockholders’ Equity - years ended December 31, 2017, 2016 and 2015 |
|
Consolidated Statements of Cash Flows - years ended December 31, 2017, 2016 and 2015 |
|
Notes to Consolidated Financial Statements |
|
Report of Independent Registered Public Accounting Firm |
|
(a) 2. |
List of Financial Statement Schedules |
Schedules to the consolidated financial statements of Bancorp are omitted since they are either not required under the related instructions, are inapplicable, or the required information is shown in the consolidated financial statements or notes thereto.
|
(a) 3. |
List of Exhibits |
Exhibit Number
|
2.1 |
||
|
2.2 |
||
|
3.1 |
|
|
|
3.2 |
|
|
|
3.3 |
||
|
3.4 |
||
|
10.1* |
|
|
10.2* |
|
|
|
10.3* |
|
|
|
10.4* |
|
|
|
10.5* |
||
|
10.6* |
||
|
10.7* |
||
|
10.8* |
||
|
10.9* |
||
|
10.10* |
||
|
10.11* |
||
|
10.12* |
||
|
10.13* |
||
|
10.14* |
||
|
10.15* |
||
|
10.16* |
||
|
10.17* |
||
|
10.18* |
||
|
10.19* |
||
|
10.20* |
||
|
10.21* |
||
|
10.22* |
||
|
10.23* |
||
|
10.24* |
||
|
10.25* |
||
|
10.26* |
|
10.27* |
||
|
10.28* |
||
|
10.29* |
||
|
10.30* |
||
|
10.31* |
||
|
10.32* |
||
|
10.33* |
||
|
10.34* |
||
|
10.35* |
||
|
10.36* |
||
| 10.37* | Amendment No. 1 to the Stock Yards Bancorp 2015 Omnibus Equity Compensation Plan. | |
|
14 |
|
Code of Ethics for the Chief Executive Officer and Financial Executives. |
|
21 |
|
|
|
23 |
|
|
|
31.1 |
|
Certifications pursuant to Section 302 of the Sarbanes-Oxley Act by David P. Heintzman. |
|
31.2 |
|
Certifications pursuant to Section 302 of the Sarbanes-Oxley Act by Nancy B. Davis. |
|
32.1 |
||
|
32.2 |
||
| 101 |
The following financial statements from the Stock Yards Bancorp, Inc. December 31, 2017 Annual Report on Form 10-K, filed on March 13, 2017, formatted in eXtensible Business Reporting Language (XBRL): |
|
(1) |
Consolidated Balance Sheets |
|
(2) |
Consolidated Statements of Income |
|
(3) |
Consolidated Statements of Comprehensive Income |
|
(4) |
Consolidated Statements of Changes in Stockholders’ Equity |
|
(5) |
Consolidated Statements of Cash Flows |
|
(6) |
Notes to Consolidated Financial Statements |
* Indicates matters related to executive compensation or other management contracts.
Copies of the foregoing Exhibits will be furnished to others upon request and payment of Bancorp’s reasonable expenses in furnishing the exhibits.
|
(b) |
Exhibits |
The exhibits listed in response to Item 15(a) 3 are filed or furnished as a part of this report.
|
(c) |
Financial Statement Schedules |
None
Where You Can Find More Information
Bancorp is subject to the informational requirements of the Securities Exchange Act of 1934 and accordingly files its annual report on Form 10-K, quarterly reports on Form 10-Q, current reports on Form 8-K, proxy statements and other information with the Securities and Exchange Commission (“SEC”). The public may read and copy any materials filed with the SEC at the SEC’s Public Reference Room at 100 F Street, NE, Washington, DC 20549. Please call the SEC at (800) SEC-0330 for further information on the Public Reference Room. Bancorp’s public filings are also maintained on the SEC’s Internet site that contains reports, proxy and information statements and other information regarding issuers that file electronically with the SEC. The address of that web site is http://www.sec.gov. In addition, Bancorp’s annual report on Form 10-K, quarterly reports on Form 10-Q, current reports on Form 8-K and amendments to those reports filed or furnished pursuant to Section 13(a) or 15(d) of the Exchange Act may be accessed free of charge through Bancorp’s web site after we have electronically filed such material with, or furnished it to, the SEC. The address of that web site is http://www.syb.com.
None
Pursuant to the requirements of Section 13 or 15(d) of the Securities Exchange Act of 1934, the registrant has duly caused this report to be signed on its behalf by the undersigned, thereunto duly authorized.
|
March 13, 2018 |
STOCK YARDS BANCORP, INC. |
||
|
|
|
|
|
|
|
BY: |
/s/ David P. Heintzman |
|
|
|
|
David P. Heintzman |
|
|
|
|
Chairman and |
|
Pursuant to the requirements of the Securities Exchange Act of 1934, this report has been signed below by the following persons on behalf of the registrant and in the capacities and on the dates indicated.
|
/s/ David P. Heintzman |
Chairman, Chief Executive Officer and Director |
March 13, 2018 |
|
|
David P. Heintzman |
(principal executive officer) |
|
|
|
/s/ James A. Hillebrand |
President and Director |
March 13, 2018 |
|
|
James A. Hillebrand |
|
|
|
|
|
|
|
|
|
/s/ Nancy B. Davis |
Executive Vice President and Chief Financial |
March 13, 2018 |
|
|
Nancy B. Davis |
Officer (principal financial and accountin gofficer) |
|
|
|
|
|
|
|
|
/s/ Paul J. Bickel III |
Director |
March 13, 2018 |
|
|
Paul J. Bickel III |
|
|
|
|
/s/ J. McCauley Brown |
Director |
March 13, 2018 |
|
|
J. McCauley Brown |
|
|
|
|
/s/ Charles R. Edinger, III |
Director |
March 13, 2018 |
|
|
Charles R. Edinger, III |
|
|
|
|
|
|
|
|
|
/s/ Donna L. Heitzman |
Director |
March 13, 2018 |
|
|
Donna L. Heitzman |
|
|
|
|
/s/ Carl G. Herde |
Director |
March 13, 2018 |
|
Carl G. Herde |
|||
|
|
|
|
|
|
/s/ Richard A. Lechleiter |
Director |
March 13, 2018 |
|
|
Richard A. Lechleiter |
|
|
|
|
/s/ Richard Northern |
Director |
March 13, 2018 |
|
|
Richard Northern |
|
|
|
|
/s/ Stephen M. Priebe |
Director |
March 13, 2018 |
|
|
Stephen M. Priebe |
|
|
|
|
|
|
|
|
|
/s/ Norman Tasman |
Director |
March 13, 2018 |
|
|
Norman Tasman |
|
|
|
|
|
|
|
|
|
/s/ Kathy C. Thompson |
Senior Executive Vice President and Director |
March 13, 2018 |
|
|
Kathy C. Thompson |
|
|