Attached files
| file | filename |
|---|---|
| EX-32.2 - EX-32.2 - MCCLATCHY CO | mni-20171231ex32289fc52.htm |
| EX-32.1 - EX-32.1 - MCCLATCHY CO | mni-20171231ex3213c5bb5.htm |
| EX-31.2 - EX-31.2 - MCCLATCHY CO | mni-20171231ex312957964.htm |
| EX-31.1 - EX-31.1 - MCCLATCHY CO | mni-20171231ex311ea064c.htm |
| EX-23 - EX-23 - MCCLATCHY CO | mni-20171231xex23.htm |
| EX-21 - EX-21 - MCCLATCHY CO | mni-20171231ex21dbc0b58.htm |
| EX-12 - EX-12 - MCCLATCHY CO | mni-20171231ex1234aff8e.htm |
UNITED STATES
SECURITIES AND EXCHANGE COMMISSION
Washington, D.C. 20549
FORM 10‑K
|
☒ |
ANNUAL REPORT PURSUANT TO SECTION 13 OR 15(d) OF THE SECURITIES EXCHANGE ACT OF 1934 |
|
For the fiscal year ended: December 31, 2017 |
|
|
or |
|
|
☐ |
TRANSITION REPORT PURSUANT TO SECTION 13 OR 15(d) OF THE SECURITIES EXCHANGE ACT OF 1934 |
For the transition period from to
Commission file number: 1‑9824

The McClatchy Company
(Exact name of registrant as specified in its charter)
|
Delaware |
|
52‑2080478 |
|
(State or other jurisdiction of incorporation or organization) |
|
(I.R.S. Employer Identification No.) |
|
2100 Q Street, Sacramento, CA |
|
95816 |
|
(Address of principal executive offices) |
|
(Zip Code) |
|
916‑321‑1844 |
|
Registrant’s telephone number, including area code |
Securities registered pursuant to Section 12(b) of the Act:
|
Title of each class |
|
Name of each exchange on which registered |
|
Class A Common Stock, par value $.01 per share |
|
NYSE American LLC |
Securities registered pursuant to Section 12 (g) of the Act: None
Indicate by check mark if the registrant is a well‑known seasoned issuer, as defined in Rule 405 of the Securities Act. ☐ Yes ☒ No
Indicate by check mark if the registrant is not required to file reports pursuant to Section 13 or Section 15(d) of the Act. ☐ Yes ☒ No
Indicate by check mark whether the registrant (1) has filed all reports required to be filed by Section 13 or 15(d) of the Securities Exchange Act of 1934 during the preceding 12 months (or for such shorter period that the registrant was required to file such reports), and (2) has been subject to such filing requirements for the past 90 days. ☒ Yes ☐ No
Indicate by check mark whether the registrant has submitted electronically and posted on its corporate website, if any, every Interactive Data File required to be submitted and posted pursuant to Rule 405 of Regulation S‑T (§ 232.405 of this chapter) during the preceding 12 months (or for such shorter period that the registrant was required to submit and post such files). ☒ Yes ☐ No
Indicate by check mark if disclosure of delinquent filers pursuant to Item 405 of Regulation S‑K (§ 229.405 of this chapter) is not contained herein, and will not be contained, to the best of registrant’s knowledge, in definitive proxy or information statements incorporated by reference in Part III of this Form 10‑K or any amendment to this Form 10‑K. ☐
Indicate by check mark whether the registrant is a large accelerated filer, an accelerated filer, a non‑accelerated filer, a smaller reporting company, or an emerging growth company. See the definitions of “large accelerated filer,” “accelerated filer,” “smaller reporting company,” and “emerging growth company” in Rule 12b‑2 of the Exchange Act. (Check one):
|
Large accelerated filer ☐ |
|
Accelerated filer ☒ |
|
|
Non-accelerated filer (Do not check if a smaller reporting company) ☐ |
Smaller reporting company ☐ |
Emerging growth company ◻ |
|
If an emerging growth company, indicate by check mark if the registrant has elected not to use the extended transition period for complying with any new or revised financial accounting standards provided pursuant to Section 13(a) of the Exchange Act. ☐
Indicate by check mark whether the registrant is a shell company (as defined in Rule 12b‑2 of the Exchange Act). ☐ Yes ☒ No
Based on the closing price of the registrant’s Class A Common Stock on the New York Stock Exchange on June 23, 2017, the last business day of the registrant’s second fiscal quarter, the aggregate market value of the voting and non‑voting common equity held by non‑affiliates was approximately $63.6 million. For purposes of the foregoing calculation only, as required by Form 10‑K, the Registrant has included in the shares owned by affiliates, the beneficial ownership of Common Stock of officers and directors of the Registrant and members of their families, and such inclusion shall not be construed as an admission that any such person is an affiliate for any purpose.
Shares outstanding as of March 2, 2018:
|
Class A Common Stock |
5,264,080 |
|
Class B Common Stock |
2,443,191 |
DOCUMENTS INCORPORATED BY REFERENCE
Portions of the registrant’s Definitive Proxy Statement for the Annual Meeting of Shareholders to be filed pursuant to Regulation 14A within 120 days after our fiscal year end of December 31, 2017, are incorporated by reference in Part III of this Annual Report on Form 10‑K.
Forward‑Looking Statements:
This annual report on Form 10‑K contains forward‑looking statements within the meaning of the Private Securities Litigation Reform Act of 1995, as amended, including statements relating to our future financial performance, business, strategies and operations. These statements are based upon our current expectations and knowledge of factors impacting our business and are generally preceded by, followed by or are a part of sentences that include the words “believes,” “expects,” “anticipates,” “estimates” or similar expressions. All statements, other than statements of historical fact, are statements that could be deemed forward‑looking statements. For all of those statements, we claim the protection of the safe harbor for forward‑looking statements contained in the Private Securities Litigation Reform Act of 1995. Such statements are subject to risks, trends and uncertainties. A detailed discussion of these and other risks and uncertainties that could cause actual results and events to differ materially from such forward‑looking statements is included in the section entitled “Risk Factors” (refer to Part I, Item 1A). We undertake no obligation to revise or update any forward‑looking statements except as required under applicable law.
Overview
The McClatchy Company (the “Company,” “we,” “us” or “our”) operates 30 media companies in 14 states, providing each of its communities with high-quality news and advertising services in a wide array of digital and print formats. We are a publisher of well-respected brands such as the Miami Herald, The Kansas City Star, The Sacramento Bee, The Charlotte Observer, The (Raleigh) News & Observer, and the (Fort Worth) Star-Telegram. Incorporated in Delaware, we are headquartered in Sacramento, California, and our Class A Common Stock is listed on the NYSE American under the symbol MNI.
Our businesses are comprised of websites and mobile applications, mobile news and advertising, video products, a digital marketing agency, daily newspapers, niche publications, other print and digital direct marketing services and community newspapers. Our media companies range from large daily newspapers and news websites serving metropolitan areas to non‑daily newspapers with news websites and online platforms serving small communities. We had 71.2 million average monthly unique visitors to our online platforms and 3.9 billion page views of our digital products for the full year ended December 31, 2017. Our local websites, e-editions of the printed newspaper and mobile applications in each of our markets now provide us fully developed but rapidly evolving channels to extend our journalism and advertising products to our audience in each market. In 2017, we continued to expand our full-service digital agency, excelerateTM, which provides digital marketing tools designed to customize digital marketing plans for our customers. For the year ended December 31, 2017, we had an average aggregate paid daily print circulation of 1.3 million and Sunday print circulation of 1.9 million.
Our business is roughly divided between those media companies operated west of the Mississippi River and those that are east of it, but includes four operating regions: the West, Midwest, Carolinas and East regions. For the year ended December 31, 2017, no single media company represented more than 12.0% of our total revenues.
On July 31, 2017, we sold a majority of our interest in CareerBuilder LLC (“CareerBuilder”), which reduced our ownership interest in CareerBuilder from 15.0% to approximately 3.0%.
Our fiscal year ends on the last Sunday in December. Fiscal year ended December 31, 2017, consisted of a 53-week period. Fiscal years ended December 25, 2016, and December 26, 2015, consisted of 52‑week periods.
Strategy
Our mission is to deliver high-quality journalism and information. To accomplish this goal, we are committed to a three‑pronged strategy to grow our businesses and total revenues as a leading local media company:
|
· |
First, to maintain our position as the leading local media company in each of our markets by providing high-quality journalism and advertising information essential to our communities throughout the day on digital platforms and in our printed newspapers; and to grow these audiences for the benefit of our |
2
advertisers; |
|
· |
Second, to grow digital revenues as we transition to a digitally focused, digitally driven media company. This strategy includes being a leader of local digital businesses in each of our markets, including websites, e-editions of the printed newspaper, mobile applications, e‑mail products, mobile services, video products and other electronic media; and |
|
· |
Third, to extend these franchises by supplementing the reach of the printed newspaper and digital businesses with direct marketing, niche publications and events and direct mail products so advertisers can capture both mass and targeted audiences with one‑stop shopping. |
To assist us with these strategies, we continually improve existing digital products and develop new ones, reengineer our operations to reduce legacy costs and strengthen areas driving performance in news, audience, advertising and digital growth. As a result of our efforts, we saw growth in total digital-only revenues in 2017, and we continued our focus on driving results in direct marketing and audience revenues, while continuing to drive operating expenses down.
Business Initiatives
Our local media companies continue to undergo tremendous structural and cyclical change. In order to strengthen our position as a leading local media company and implement our strategies, we are focused on the following five major business initiatives:
Increasing and Broadening Total Revenues
Revenue initiatives in 2017 included aligning us for digital growth by revamping and centralizing certain departments and focusing on digital marketing; digital subscription growth through new audiences and subscribers; organizing our technology groups to help us better serve our customers; growing our video market share and developing innovation teams that help us implement additional customer-focused approaches to running our businesses. In 2017, we expanded our full-service digital agency, excelerateTM, which provides customized digital marketing plans for our customers. We also continued to expand our video efforts to improve storytelling and generate additional advertising revenues.
Revenues exclusive of print newspaper advertising continue to grow as a percentage of total revenues and represented 75.2%, 70.6% and 66.7% of total revenues in 2017, 2016 and 2015, respectively. Our strategy has been to focus on growing revenue sources that include digital and direct marketing advertising, audience and other non-traditional revenues. Management expects newspaper print advertising to continue to be a smaller share of total revenues in the future, due in part to expected strong growth in digital-only advertising revenues and certain areas of direct marketing advertising, and more stable performance in audience revenues. However, we continue to look for opportunities to expand our advertiser base, including advertisers outside of our markets using our excelerateTM agency services.
Currently, advertising revenues comprise a majority of our total revenues, making the quality of our sales force and sales tools critically important to this revenue source. Advertising revenues were approximately 55.2% of total revenues in 2017, 58.2% in 2016 and 60.3% in 2015. In 2017, we had a local sales force in each of our markets, which we believe was the largest local sales force as compared to other local media companies and websites in those markets. Our sales force is responsible for delivering to advertisers a broad array of advertising products, including print, direct marketing and digital marketing solutions. Our advertisers range from large national retail chains to regional automobile dealerships and grocers to small local businesses and even individuals.
Increasingly, our emphasis has been on growing the breadth of products offered to advertisers, particularly our digital and direct marketing products, while expanding our relationships with current advertisers and growing new accounts. For 2017, total digital and direct marketing advertising revenues combined represented 55.1% of total advertising revenues compared to 49.5% and 44.9% in 2016 and 2015, respectively. Our digital products are discussed in more detail below.
In 2017, we continued to sponsor special events in our markets, designed for advertisers to connect with their customers, and we expect this type of advertising to grow in 2018.
Audience revenues were approximately 40.2%, 37.3% and 34.8% of consolidated total revenues in 2017, 2016 and 2015,
3
respectively. Our subscription packages have helped diversify our revenues while continuing to drive growth in digital audience revenues.
Expanding Our Digital Business
We continue to be a leader in digital advertising revenues generated in part on our media companies’ websites and mobile platforms as a percent of total advertising. In 2017, 34.7% of advertising revenues came from digital products compared to 30.6% in 2016. In 2017, 77.2% of our digital advertising revenues came from digital-only advertisements where the online buy was not bundled with a print buy, compared to 69.9% in 2016. Digital-only advertising revenues grew 9.8%, to $133.7 million in 2017 from $121.7 million in 2016. We believe this independent advertising revenue stream positions us well for the future of our digital business. During 2017, total digital advertising revenues decreased 0.6% compared to an increase of 4.3% in 2016, reflecting the negative impact of lower print advertising revenues on bundled sales.
Our media companies’ websites and mobile applications, e‑mail products, video and mobile services and other electronic media enable us to engage our readers with real‑time news and information that matters to them. As discussed below in Maintaining Our Commitment to Public Service Journalism, our storytelling capability is not only contributing to our growth in digital subscribers, but also to our digital advertising revenue growth. During 2017, our websites attracted an average of approximately 71.2 million unique visitors per month, up 18.3%, compared to 2016. Increasing our number of unique visitors brings additional digital advertising revenue opportunities to our sales teams. We had 3.9 billion page views of our digital products for the full year of 2017, up 9.0% from 2016. In addition, our average mobile traffic was up 45.3% as compared to 2016, and accounted for 61.3% of all digital traffic we received on a monthly basis.
In 2016, we, along with Gannett Co., Inc., Hearst, and tronc, Inc., launched Nucleus Marketing Solutions, LLC (“Nucleus”). This marketing solutions provider connects national advertisers with the top 30 U.S. local publishers’ highly engaged audiences across existing and emerging digital platforms. We expect Nucleus to improve our reach with national advertisers in 2018 and beyond.
We continue to pursue additional new digital products and offerings. In 2017, we continued to expand our concept of comprehensive digital marketing solutions for local businesses via our digital marketing agency called excelerateTM. We also expanded the footprint of excelerateTM to markets beyond those served by our media companies. By offering advertisers integrated packages including website customization, search engine marketing and optimization, social media presence and marketing services, and other multi‑platform advertising opportunities, excelerateTM helps businesses improve the effectiveness of their marketing efforts.
In 2017, we continued to expand our advertising efforts on advertising exchanges. Our real-time, programmatic buying and selling of digital advertising inventory – often targeting very specific audiences at very specific times – grew 32.3% in 2017 compared to 2016. Our growth continues to be strengthened by our participation in the Local Media Consortium (“LMC”) and its more than 75 member companies representing more than 1,700 daily newspapers and broadcast members. The LMC created a private advertising exchange that includes high-quality, brand friendly advertising inventory from member publishers. The LMC’s goal is to provide advertisers with efficient access to high-quality advertising impressions. In total, LMC members serve more than 13 billion impressions monthly.
Video revenue increased 57.0% in 2017 compared to 2016, due to our focus on the use of video in our digital products to both enhance the content that we bring to readers and viewers and also to compete for a growing advertising stream. During 2017, more than 366 million video views were recorded across all of our digital platforms, including those on social media platforms and distribution partners, up from 225 million video views in 2016.
All of our markets offer audience subscription packages for digital content. The packages include a combined digital and print subscription and a digital‑only subscription. Digital‑only subscriptions grew to approximately 102,900, an increase of 23.8% in 2017 compared to 83,100 subscriptions in 2016.
Maintaining Our Commitment to Public Service Journalism
We believe that independent journalism in the public interest is critical to our democracy. It is also the underpinning of our success as a business.
4
We are committed to producing best‑in‑class journalism and local content in every community we serve. Each of our newsrooms is expected to improve annually, whether measured by growth in readership, loyalty of readers, our own assessments of journalistic strengths or recognition by peers and others. And each of our newsrooms is expected to serve our core public service mission – holding leaders and institutions accountable and making our communities better places in which to live.
During the digital transition that has reshaped the industry over the past decade, we have moved quickly to expand our digital reach and deliver news to readers when they want it and where they want it. Through an initiative called “Newsroom Reinvention,” we have placed an intense focus on what our readers want and need from us in a fast-changing news landscape. We continue to produce ground-breaking accountability journalism – from The Kansas City Star’s expose on secrecy in state government to the Miami Herald’s in-depth report on abuses in the juvenile justice system in Florida to numerous reports that have held politicians accountable for misbehavior in office. Meanwhile, we have intensified our efforts on breaking news and real-time news, and we have restructured our Washington, D.C., bureau to work more closely with our local newsrooms while also becoming a significant force on the national stage.
Our heritage of public service journalism is the cornerstone of our business, and the work of our journalists received significant recognition in 2017. Journalists from our Washington bureau and the Miami Herald teamed up with the International Consortium of Investigative Journalists to win the 2017 Pulitzer Prize for explanatory reporting. A journalist at the Miami Herald won the 2017 Pulitzer Prize for editorial cartooning. With these honors we extend our Pulitzer Prize wins to 54 and our impressive streak of being a Pulitzer winner or finalist every year for more than a decade.
Our video journalists continued to produce ambitious stories around breaking news, projects and series that have gained industry recognition. Titletown, TX, the collaborative effort between our Video Lab and the Star-Telegram on a high school football powerhouse in Texas, won three Emmys and is the only show produced by a local media company that is part of Facebook's new 'Watch' platform. The Video Lab also contributed to our Pulitzer Prize in explanatory reporting through an animation that illustrated the complex world of offshore corporations.
These are just a few of the hundreds of examples of our powerful journalism published across the company. We intend to build on our legacy in the years ahead, propelled by the success of our ongoing digital transformation. For instance, our replica edition of each of our daily newspapers, found on our websites and mobile applications, includes stories from our 30 newsrooms and other journalistic organizations that on many days more than doubles the news that could be found in the daily newspaper delivered to subscribers’ doorsteps. This additional content, known as “Extra Extra” and “SportsXtra,” has been well received by readers of our digital products.
Broadening Our Audience in Our Local Markets
Each of our media companies has the largest print circulation of any news media source serving its respective community, and coupled with its local website and other digital platforms in each community, reaches a broad audience in each market. We believe that our broad reach in each market is of primary importance in attracting advertising, which is currently our largest source of revenues.
Our digital audience continues to grow, which is partially driven by traffic on our websites and other digital platforms. During 2017, average monthly unique visitors to our digital sites grew 18.3% as a result of continued focus and initiatives to improve our total revenues. As discussed above, we realigned and improved delivery of our content on all platforms, from websites to mobile applications in nearly every market. Due to our investment in technology and behind the scenes improvements, our websites, including the news content and advertising, are responsive or formatted to fit the screen of whatever device the content is viewed on for a seamless reading or viewing experience.
As noted earlier, in 2017 our monthly mobile traffic was up 45.3% as compared to 2016 and accounted for 61.3% of all monthly digital traffic we received. We work hard to appeal to our mobile audience. We have invested in new digital publishing systems to better serve these mobile readers, and we have rebuilt all of our news websites to be responsive – that is, to automatically resize to best fit a user’s screen, be it a smartphone or a tablet or desktop computer, and provide the optimal viewing experience.
Our news and information follows readers throughout their day. To start their day, we reach our readers who can check out our latest headlines and stories on their mobile phones or with the morning newspaper. Our news websites, updated frequently throughout the day, are available to readers via their desktop computers and optimized for all of their different
5
mobile devices.
Daily newspapers paid circulation volumes for 2017 were down 12.4% compared to 2016. The declines in daily circulation reflect the fragmentation of audiences faced by all media, including our own digital‑only subscriptions, as available media outlets proliferate and readership trends change. Our Sunday circulation volumes were down 12.1% in 2017 compared to 2016.
We also reach audiences through our direct marketing products. In 2017, we distributed approximately 641,000 Sunday Select packages per week, which are packages of preprinted advertisements generally delivered on Sunday to non‑newspaper subscribers who have interest in circulars. We also distribute thousands of e-mail messages each day, including editorial and advertising content, as well as other alerts to subscribers and non‑subscribers in our markets which supplement the reach of our print and digital subscriptions.
To remain the leading local media company for the communities we serve and a must‑buy for advertisers, we are focused on maintaining a broad reach of print and digital audiences in each of our markets. We will continue to refine and strengthen our print platform, but our growth increasingly comes from our digital products and the beneficial impact those products have on the total audience we deliver for our advertisers.
Focusing on Cost Efficiencies While Investing for the Future
While continuing to maintain our core business in news, advertising sales and digital media, we are also focused on cost efficiencies. Our cost initiatives in 2017 were focused on continuing to reduce legacy costs from our traditional print business, and we have realized significant savings from these efforts, primarily in production and distribution, including substantial savings in newsprint costs. In addition, in 2017, we made additional reductions in costs to help protect our profitability in a period of declining print advertising. Total expenses, excluding depreciation, amortization and non-cash impairment charges, declined $82.9 million in 2017 compared to 2016. This decline was net of investments made in 2017 intended to generate future savings or that were necessary to invest in revenue generating strategies. The ongoing structural and cyclical changes in our markets demand that we respond by reengineering our operations, as needed, to achieve an efficient and sustainable cost structure. Over the past several years, we have substantially lowered our cost structure through reducing our workforce, optimizing technology and maximizing printing, distribution and content efficiencies, all while maintaining operating profitability at each of our media companies.
In 2017, in order to ensure a more collaborative enterprise, we began the process of regionalizing certain areas of our operations, including publisher and editorial leadership, and we completed reorganizing our technology, marketing, innovation and other certain finance functions. We will continue to outsource, regionalize and consolidate operations to achieve a more streamlined and efficient cost structure. These changes will result in cost savings in future years, while giving our operating executives, regionally and in each market, the ability to focus more of their time on our growing digital and direct marketing media businesses.
As of the end of 2017, we have outsourced printing operations at 20 of our 30 media companies, which are printed through arrangements with nearby newspapers owned by us or third-party companies. In markets where we own printing presses we in‑source the printing of nearby newspapers for other companies. This allows us to maximize the use of our existing press capacity and generate additional revenues. Five markets (Charlotte, Columbia, Kansas City, Miami and Sacramento) have become hubs for in-sourcing printing in their areas.
Other Operational Information
Historically, each of our media companies was largely autonomous in their local advertising and editorial operations in order to meet the needs of the particular community it served. However, as discussed above, we continue to regionalize or centralize certain operations across our local markets to strengthen the local media company's ability to increase its performance in news, audience, advertising and digital growth.
We have two operating segments that are aggregated into a single reportable segment. Each operating segment consists primarily of a group of local media companies with similar economic characteristics, products, customers and distribution methods. Both operating segments report to one segment manager. One of our operating segments (“Western Segment”) consists of our media operations in the West and Midwest, while the other operating segment (“Eastern Segment”) consists primarily of media operations in the Carolinas and East. Regional or local publishers of the media companies make day‑to‑day decisions and report to the segment manager, who is responsible for implementing the operating and financial plans at each operation within the respective operating segment. The corporate managers, including executive officers, set the basic business, accounting, financial and reporting policies.
6
As noted previously, our media companies also work together to consolidate functions and share resources regionally and across operating segments that lend themselves to such efficiencies, such as certain regional or national sales efforts, certain editorial functions, accounting functions, digital publishing systems and products, information technology functions and others. These efforts are often coordinated through the vice president of operations and corporate personnel.
Our business is somewhat seasonal, with peak revenues and profits generally occurring in the fourth quarter of each year, reflecting the Thanksgiving and Christmas holidays. The other quarters, when holidays are not as prevalent, are historically the slower quarters for revenues and operating profits.
The following table summarizes our media companies, their digital platforms, newspaper circulation and total unique visitors:
|
|
|
|
|
Total |
|
Circulation (1) |
|
||
|
Media Company |
Website |
Location |
|
UV (2) |
|
Daily |
|
Sunday |
|
|
Miami Herald |
www.miamiherald.com |
Miami, FL |
|
14,406,000 |
|
92,260 |
|
121,971 |
|
|
The Kansas City Star |
www.kansascity.com |
Kansas City, MO |
|
6,854,000 |
|
114,144 |
|
155,794 |
|
|
The Charlotte Observer |
www.charlotteobserver.com |
Charlotte, NC |
|
6,430,000 |
|
83,609 |
|
118,903 |
|
|
The Sacramento Bee |
www.sacbee.com |
Sacramento, CA |
|
5,833,000 |
|
122,600 |
|
225,343 |
|
|
Star-Telegram |
www.star-telegram.com |
Fort Worth, TX |
|
3,618,000 |
|
188,257 |
|
194,457 |
|
|
The Wichita Eagle |
www.kansas.com |
Wichita, KS |
|
3,267,000 |
|
37,843 |
|
86,848 |
|
|
El Nuevo Herald |
www.elnuevoherald.com |
Miami, FL |
|
3,091,000 |
|
30,065 |
|
40,885 |
|
|
The News & Observer |
www.newsobserver.com |
Raleigh, NC |
|
3,084,000 |
|
84,287 |
|
113,790 |
|
|
The State |
www.thestate.com |
Columbia, SC |
|
2,450,000 |
|
43,948 |
|
97,109 |
|
|
The Telegraph |
www.macon.com |
Macon, GA |
|
2,187,000 |
|
21,849 |
|
27,985 |
|
|
Lexington Herald-Leader |
www.kentucky.com |
Lexington, KY |
|
2,024,000 |
|
49,169 |
|
79,192 |
|
|
The Fresno Bee |
www.fresnobee.com |
Fresno, CA |
|
1,882,000 |
|
73,529 |
|
107,136 |
|
|
The News Tribune |
www.thenewstribune.com |
Tacoma, WA |
|
1,779,000 |
|
43,452 |
|
93,476 |
|
|
Belleville News-Democrat |
www.bnd.com |
Belleville, IL |
|
1,722,000 |
|
23,628 |
|
56,120 |
|
|
Idaho Statesman |
www.idahostatesman.com |
Boise, ID |
|
1,658,000 |
|
36,006 |
|
64,723 |
|
|
Ledger-Enquirer |
www.ledger-enquirer.com |
Columbus, GA |
|
1,254,000 |
|
17,444 |
|
21,434 |
|
|
The Tribune |
www.sanluisobispo.com |
San Luis Obispo, CA |
|
1,227,000 |
|
19,409 |
|
29,787 |
|
|
McClatchy DC Bureau |
www.mcclatchydc.com |
|
|
1,191,000 |
|
N/A |
|
N/A |
|
|
The Island Packet |
www.islandpacket.com |
Hilton Head, SC |
|
1,127,000 |
|
15,639 |
|
17,038 |
|
|
The Bradenton Herald |
www.brandenton.com |
Bradenton, FL |
|
986,000 |
|
20,235 |
|
25,139 |
|
|
The Modesto Bee |
www.modbee.com |
Modesto, CA |
|
977,000 |
|
37,792 |
|
64,477 |
|
|
Centre Daily Times |
www.centredaily.com |
State College, PA |
|
927,000 |
|
11,976 |
|
15,647 |
|
|
Sun Herald |
www.sunherald.com |
Biloxi, MS |
|
815,000 |
|
21,013 |
|
31,563 |
|
|
The Sun News |
www.thesunnews.com |
Myrtle Beach, SC |
|
743,000 |
|
23,204 |
|
30,259 |
|
|
The Herald |
www.heraldonline.com |
Rock Hill, SC |
|
710,000 |
|
10,786 |
|
13,346 |
|
|
The Bellingham Herald |
www.bellinghamherald.com |
Bellingham, WA |
|
675,000 |
|
11,749 |
|
15,186 |
|
|
Tri-City Herald |
www.tri-cityherald.com |
Kennewick, WA |
|
660,000 |
|
18,438 |
|
29,998 |
|
|
The Olympian |
www.theolympian.com |
Olympia, WA |
|
625,000 |
|
13,524 |
|
29,521 |
|
|
Merced Sun-Star |
www.mercedsunstar.com |
Merced, CA |
|
453,000 |
|
11,089 |
|
— |
|
|
The Herald-Sun |
www.heraldsun.com |
Durham, NC |
|
323,000 |
|
10,676 |
|
11,156 |
|
|
The Beaufort Gazette |
www.beaufortgazette.com |
Beaufort, SC |
(3) |
N/A |
|
5,066 |
|
5,442 |
|
|
|
|
|
|
72,978,000 |
|
1,292,686 |
|
1,923,725 |
|
|
(1) |
Circulation figures are reported as of the end of our fiscal year and are not meant to reflect Alliance for Audited Media (“AAM”) reported figures. |
|
(2) |
Total monthly unique visitors for December 2017 according to Adobe Analytics. |
|
(3) |
The Beaufort Gazette unique visitor activity is included in The Island Packet activity. |
Other Operations
On July 31, 2017, we sold a majority of our interest in CareerBuilder LLC (“CareerBuilder”), which reduced our ownership interest from 15.0% to approximately 3.0%. Our ownership interests and investments in unconsolidated companies and joint ventures including but not limited to CareerBuilder, provided us with $73.9 million of cash distributions in 2017, which includes $7.3 million in normal distributions and $66.6 million of gross proceeds from the sales of assets.
7
We own 49.5% of the voting stock and 70.6% of the nonvoting stock of The Seattle Times Company. The Seattle Times Company owns The Seattle Times newspaper, weekly newspapers in the Puget Sound area and daily newspapers located in Walla Walla and Yakima, Washington, and all of their related websites and mobile applications.
In addition, three of our wholly-owned subsidiaries own a combined 27.0% interest in Ponderay Newsprint Company (“Ponderay”), a general partnership that owns and operates a newsprint mill in the state of Washington.
We also own a 25.0% interest in Nucleus Marketing Solutions, LLC (“Nucleus”) a marketing solutions provider as described above.
Raw Materials
During 2017, we consumed approximately 67,000 metric tons of newsprint for all of our operations compared to 84,000 metric tons in 2016. The decrease in tons consumed was primarily due to changes in our print products at numerous media companies, as well as lower print advertising sales and print circulation volumes. We estimate that we will use approximately 54,000 metric tons of newsprint in 2018, depending on the level of print advertising, circulation volumes and other business considerations.
During 2017, our consumed newsprint was purchased through a third-party intermediary, of which approximately 17,000 metric tons of those purchases were newsprint from Ponderay.
Our earnings are sensitive to changes in newsprint prices. In 2017, 2016 and 2015, newsprint expense accounted for 4.4%, 4.9% and 5.7%, respectively, of total operating expenses, excluding impairments and other asset write-downs.
Competition
Our newspapers, direct marketing programs, websites and mobile content compete for advertising revenues and readers’ time with television, radio, other media websites, social network sites and mobile applications, direct mail companies, free shoppers, suburban neighborhood and national newspapers and other publications, and billboard companies, among others. In some of our markets, our newspapers also compete with other newspapers published in nearby cities and towns. Competition for advertising is generally based upon digital and print readership levels and demographics, advertising rates, internet usage and advertiser results, while competition for circulation and readership (digital and print) is generally based upon the content, journalistic quality, service, competing news sources and the price of the newspaper or digital service.
Our media companies’ internet sites are generally a leading local website in each of our major daily markets. We have continued to shift advertising to digital advertising to stay current with reader trends. Our media companies are also the largest print circulation of any news media source in each of their respective markets. However, our media companies have experienced difficulty maintaining print circulation levels because of a number of factors. These include increased competition from other publications and other forms of media technologies, including the internet and other new media formats that are often free for users; and a proliferation of news outlets that fragments audiences. We face greater competition, particularly in the areas of employment, automotive and real estate advertising, from online competitors.
To address the structural shift to digital media, we reengineered our operations to strengthen areas driving performance in news, audience, advertising and digital growth. Our newsrooms also provide editorial content on a wide variety of platforms and formats from our daily newspaper to leading local websites; on social network sites such as Facebook and Twitter; on smartphones and on e‑readers; on websites and blogs; in niche online publications and in e‑mail newsletters; and mobile applications. Upgrades are continually made to our mobile applications and websites.
Employees — Labor
As of December 31, 2017, we had approximately 4,200 full and part‑time employees (equating to approximately 3,900 full‑time equivalent employees), of whom approximately 5.7% were represented by unions. Most of our union‑represented employees are currently working under labor agreements with expiration dates through 2020. We have unions at 5 of our 30 media companies.
While our media companies have not had a strike for decades, and we do not currently anticipate a strike occurring, we cannot preclude the possibility that a strike may occur at one or more of our media companies when future negotiations take place. We believe that in the event of a strike we would be able to continue to publish and deliver to subscribers, a
8
capability that is critical to retaining revenues from advertising and audience, although there can be no assurance that we will be able to continue to publish in the event of a strike.
Compliance with Environmental Laws
We use appropriate waste disposal techniques for hazardous materials. As of December 31, 2017, we have $1.0 million in a letter of credit shared among various state environmental agencies and the U.S. Environmental Protection Agency to provide collateral related to existing or previously removed storage tanks. However, we do not believe that we currently have any significant environmental issues and in 2017, 2016 and 2015 had no significant expenses or capital expenditures related to environmental control facilities.
Available Information
Our Annual Report on Form 10‑K, Quarterly Reports on Form 10‑Q, Current Reports on Form 8‑K, and amendments to reports filed pursuant to Sections 13(a) and 15(d) of the Securities Exchange Act of 1934, as amended (the “Exchange Act”), are made available, free of charge, on our website at www.mcclatchy.com, as soon as reasonably practicable after we file or furnish them with the U.S. Securities and Exchange Commission (the “SEC”).
We have significant competition in the market for news and advertising, which may reduce our advertising and audience revenues in the future.
Currently, our primary source of revenues is advertising, followed by audience. The competition we face in the advertising industry generally results from an increasing number of digital media options available on the internet, which are expanding advertiser and consumer choices significantly, including social networking tools and mobile and other devices distributing news and other content. Faced with a multitude of media choices and a dramatic increase in accessible information, consumers may place greater value on when, where, how and at what price they consume digital content than they do on the source or reliability of such content. News aggregation websites and customized news feeds (often free to users) may reduce our traffic levels by minimizing the need for the audience to visit our websites or use our digital applications directly. Online traffic is also driven by internet search results and referrals from social media platforms; therefore, such search results and referrals are critical to our ability to compete successfully. Search engines frequently update and change the methods for directing search queries to web pages or change methodologies and metrics for valuing the quality and performance of internet traffic on delivering cost‑per‑click advertisements. Social media platforms may also change their emphasis on what content to highlight for users. The failure to successfully adapt to these changes across our businesses could result in significant decreases in traffic to our various websites, which could result in substantial decreases in conversion rates and repeat business, as well as increased costs if we were to replace free traffic with paid traffic, any or all of which could adversely affect our business, financial condition and results of operations. If traffic levels stagnate or decline, we may not be able to create sufficient advertiser interest in our digital businesses or to maintain or increase the advertising rates of the inventory on our digital platforms. In addition, the proliferation of news sources and advertising platforms has resulted in significant competition and a negative impact on our traditional print business. This increased competition for our advertisers and consumers has had and is expected to continue to have an adverse effect on our business and financial results, including negatively impacting revenues and operating income.
Our advertising revenues may decline due to weak general economic and business conditions.
Our advertising revenues are dependent on general economic and business conditions in our markets or those impacting our customers. Many traditional retail companies face greater competition from online retailers and have faced uncertainty in their businesses, affecting their advertising spending. These changes in business conditions have had and may continue to have an adverse effect on our advertising revenues. To the extent economic conditions were to worsen, our business and advertising revenues could be further adversely affected, which could negatively impact our operations and cash flows and our ability to meet the covenants in our debt agreements. Our advertising revenues will be particularly adversely affected if advertisers respond to weak and uneven economic conditions or online competition by continuing to reduce their budgets or shift spending patterns or priorities, or if they are forced to consolidate or cease operations. Consolidation across various industries may also reduce our overall advertising revenues. Further, we are subject to fluctuating economic conditions in the local markets we serve. For example, real estate advertising fluctuates
9
with the health of the real estate market. In addition, seasonal variations in consumer spending cause our quarterly advertising revenues to fluctuate. Advertising revenues in the fourth quarter, which contain more holidays, are typically higher than in the first three quarters, in which economic activity is generally slower. If general economic conditions and other factors cause a decline in revenues, particularly during the fourth quarter, we may not be able to increase or maintain our revenues for the year, which would have an adverse effect on our business and financial results.
To remain competitive, we must be able to respond to and exploit changes in technology, services and standards and changes in consumer behavior. Significant capital investments may be required.
Technology in the media industry continues to evolve rapidly. Advances in technology have led to an increasing number of methods for delivery of news and other content and have resulted in a wide variety of consumer demands and expectations, which are also rapidly evolving. For example, the number of people who access online services through devices other than personal computers, including smartphones, handheld tablets and other mobile devices has increased dramatically in the past several years and is projected to continue to increase. If we are unable to exploit new and existing technologies to distinguish our products and services from those of our competitors or adapt to new distribution methods that provide optimal user experiences, our business and financial results may be adversely affected.
Technological developments also pose other challenges that could adversely affect our revenues and competitive position. New delivery platforms may lead to pricing restrictions, the loss of distribution control and the loss of a direct relationship with consumers. We may also be adversely affected if the use of technology developed to block the display of advertising on websites proliferates.
Technological developments and any changes we make to our business model may require significant capital investments. We may be limited in our ability to invest funds and resources in digital products, services or opportunities and we may incur costs of research and development in building and maintaining the necessary and continually evolving technology infrastructure. Some of our existing competitors and new entrants may have greater operational, financial and other resources or may otherwise be better positioned to compete for opportunities and as a result, our digital businesses may be less successful, which could adversely affect our business and financial results.
If we are not successful in growing and managing our digital businesses, our business, financial condition will be adversely affected.
Our future growth depends to a significant degree upon the development and management of our digital businesses. The growth of our digital businesses over the long term depends on various factors, including, among other things, the ability to:
|
· |
continue to increase digital audiences; |
|
· |
attract advertisers to our digital products; |
|
· |
tailor our product for mobile devices; |
|
· |
maintain or increase the advertising rates on our digital products; |
|
· |
improve our ability to increase the relevance of advertisements shown to users; |
|
· |
manage the impact of new technologies that could block or obscure the display of advertisements; |
|
· |
exploit new and existing technologies to distinguish our products and services from those of competitors and develop new content, products and services; and |
|
· |
invest funds and resources in digital opportunities. |
In addition, we expect that our digital business will continue to increase as a percentage of our total revenues in future periods. For 2017, digital advertising revenues comprised 34.7% of total advertising revenues compared to 30.6% in 2016. Digital‑only advertising revenues increased 9.8% in 2017 compared to 14.8% in 2016. Total digital‑only, which
10
includes digital‑only revenues from advertising and audience, was up 9.4% in 2017 compared to 14.3% in 2016. As our digital business becomes a greater portion of our overall business, we will face a number of increased risks from managing our digital operations, including, but not limited to, the following:
|
· |
structuring our sales force to effectively sell advertising in the digital advertising arena versus our historical print advertising business; |
|
· |
attracting and retaining employees with the skill sets and knowledge base needed to successfully operate in digital business; and |
|
· |
managing the transition to a digital business from a historical print-focused business and the need to concurrently reduce the physical infrastructure, distribution infrastructure and related fixed costs associated with the historical print business. |
If we are unable to execute cost‑control measures successfully, our total operating costs may be greater than expected, which may adversely affect our profitability.
As a result of adverse general business conditions in our industry and our operating results, we have taken steps to lower operating costs by reducing workforce, consolidating or regionalizing operations and implementing general cost‑control measures. If we do not achieve expected savings from these initiatives, or if our operating costs increase as a result of these initiatives, our total operating costs may be greater than anticipated. These cost‑control measures may also affect our business and our ability to generate future revenue. Because portions of our expenses are fixed costs that neither increase nor decrease proportionately with revenues, we may be limited in our ability to reduce costs in the short term to offset any declines in revenues. If these cost‑control efforts do not reduce costs sufficiently or otherwise adversely affect our business, income may decline.
Difficult business conditions in the economy generally and in our industry specifically, or changes to our business and operations may result in goodwill and masthead impairment charges.
Due to business conditions, including lower revenues and operating cash flow, we recorded masthead impairment charges of $21.5 million and $9.2 million in 2017 and 2016, respectively. We also recorded goodwill impairment charges of $290.9 million in 2015 and masthead impairment charges of $13.9 million, $5.2 million and $5.3 million in 2015, 2014 and 2013, respectively. As of December 31, 2017, we have goodwill of $705.2 million and mastheads of $150.0 million. Further erosion of general economic, market or business conditions (nationally and in our local markets) could have a negative impact on our business and stock price, which may require that we record additional impairment charges in the future, which negatively affects our results of operations.
Our business, reputation and results of operations could be negatively impacted by data security breaches and other security threats and disruptions.
Certain network and information systems are critical to our business activities. Network and information systems may be affected by cybersecurity incidents that can result from deliberate attacks or system failures. Threats include, but are not limited to, computer hackings, computer viruses, denial of service attacks, worms or other destructive or disruptive software, or other malicious activities.
Our security measures may also be breached due to employee error, malfeasance, or otherwise. As a result of these breaches, an unauthorized party may obtain access to our data or our users’ data or our systems may be compromised. These events evolve quickly and often are not recognized until after an attack is launched, so we may be unable to anticipate these attacks or to implement adequate preventative measures. Our network and information systems may also be compromised by power outages, fire, natural disasters, terrorist attacks, war or other similar events. There can be no assurance that the actions, measures and controls we have implemented will be sufficient to prevent disruptions to mission-critical systems, the unauthorized release of confidential information or corruption of data.
Although we have experienced cybersecurity incidents, to date none has had a material impact on our financial condition, results of operations or liquidity. Nonetheless, these types of events are likely to occur in the future and such events could disrupt our operations or other third-party information technology systems in which we are involved. A significant breakdown, invasion, corruption, destruction or interruption of critical information technology systems or
11
infrastructure by employees, others with authorized access to our systems, or unauthorized persons could result in legal or financial liability or otherwise negatively impact our operations. They also could require significant management attention and resources, and could negatively impact our reputation among our customers, advertisers and the public, which could have a negative impact on our financial condition, results of operations or liquidity.
We are subject to significant financial risk as a result of our $710 million in total consolidated debt.
As of December 31, 2017, we had approximately $805.0 million in total principal indebtedness outstanding, including the current portion of long-term debt of $75.0 million in 9.00% senior secured notes due in 2022 (“9.00% Notes”), resulting from our commitment to redeem such portion of the 9.00% Notes by January 25, 2018. We redeemed the 9.00% Notes as of January 25, 2018 and in February 2018, we repurchased an additional $20.0 million of our 9.00% Notes. As a result of the redemption and repurchase, we reduced our total consolidated debt to $710.0 million as of the filing of this annual report on Form 10-K. Despite these repurchases, this level of debt increases our vulnerability to general adverse economic and industry conditions and we may need to refinance our debt prior to its scheduled maturity. Higher leverage ratios, our credit ratings, our economic performance, adverse financial markets or other factors could adversely affect our future ability to refinance maturing debt on commercially acceptable terms, or at all, or the ultimate structure of such refinancing.
Covenants in the indenture governing the notes and our other existing debt agreements will restrict our business.
The indenture governing our 9.00% Notes and our secured credit agreement contain various covenants that limit, subject to certain exceptions, our ability and/or our restricted subsidiaries’ ability to, among other things:
|
· |
incur or assume liens; |
|
· |
incur additional debt or provide guarantees in respect of obligations of other persons; |
|
· |
issue redeemable stock and preferred stock; |
|
· |
pay dividends or make distributions on capital stock, repurchase, redeem or make payments on capital stock or prepay, repurchase, redeem, retire, defease, acquire or cancel certain of our existing notes or debentures prior to the stated maturity thereof; |
|
· |
make loans, investments or acquisitions; |
|
· |
create or permit restrictions on the ability of our subsidiaries to pay dividends or make other distributions to us or to guarantee our debt, limit our or any of our subsidiaries’ ability to create liens, or make or pay intercompany loans or advances; |
|
· |
enter into certain transactions with affiliates; |
|
· |
sell, transfer, license, lease or dispose of our or our subsidiaries’ assets, including the capital stock of our subsidiaries; and |
|
· |
dissolve, liquidate, consolidate or merge with or into, or sell substantially all the assets of us and our subsidiaries, taken as a whole, to, another person. |
The restrictions contained in the indenture governing the 9.00% Notes and the secured credit agreement could adversely affect our ability to:
|
· |
finance our operations; |
|
· |
make needed capital expenditures; |
|
· |
dispose of assets; |
12
|
· |
make strategic acquisitions or investments or enter into alliances; |
|
· |
withstand a future downturn in our business or the economy in general; |
|
· |
refinance our outstanding indebtedness prior to maturity; |
|
· |
engage in business activities, including future opportunities, that may be in our interest; and |
|
· |
plan for or react to market conditions or otherwise execute our business strategies. |
Our ability to comply with covenants contained in the indenture for the 9.00% Notes and our secured credit agreement may be affected by events beyond our control, including prevailing economic, financial and industry conditions. Even if we are able to comply with all of the applicable covenants, the restrictions on our ability to manage our business in our sole discretion could adversely affect our business by, among other things, limiting our ability to take advantage of financings, mergers, acquisitions and other corporate opportunities that we believe would be beneficial to us. In addition, our obligations under the 9.00% Notes and the secured credit agreement are secured, subject to permitted liens, on a first‑priority basis, and in the event of default such security interests could be enforced by the collateral agent for the secured credit agreement. In the event of such enforcement, we cannot be assured that the proceeds from the enforcement would be sufficient to pay our obligations under the 9.00% Notes or secured credit agreement.
We have significant financial obligations and in the future we will need cash to repay our existing indebtedness and meet our other obligations. Our inability to generate sufficient cash to pay our obligations would adversely affect our business.
We may not be able to generate sufficient cash internally to repay all of our indebtedness at maturity or to meet our other obligations. As of December 31, 2017, we had approximately $805.0 million of total indebtedness outstanding, which was reduced to $710.0 million by the end of February 2018, with our redemption and repurchase of a portion of the 9.00% Notes. Of the remaining $710.0 million aggregate principal amount, we have approximately $344.6 million of 9.00% Notes due in 2022; approximately $89.2 million of debentures with an interest rate of 7.150% due in 2027 and approximately $276.2 million of debentures with an interest rate of 6.875% due in 2029. As of December 31, 2017, we had approximately $31.7 million in face amount of letters of credit outstanding, which are fully collateralized with certificates of deposits, under a Collateralized Issuance and Reimbursement Agreement.
As of December 31, 2017, the projected benefit obligations of our qualified defined benefit pension plan (“Pension Plan”) exceeded Pension Plan assets by $476.7 million. Future contributions are subject to numerous assumptions, including, among others, changes in interest rates, returns on assets in the Pension Plan and future government regulations. In addition, we have a limited number of supplemental retirement plans, which provide certain key employees with additional retirement benefits. These plans have no assets; however as of December 31, 2017, our projected benefit obligation of these plans was $125.4 million. These plans are on a pay‑as‑you‑go basis.
Our ability to make payments on and to refinance our indebtedness, including the 9.00% Notes and our other series of outstanding notes, to make required contributions to the Pension Plan, to fund the supplemental retirement plans and to fund working capital needs and planned capital expenditures will depend on our ability to generate cash in the future. Our ability to generate cash, to a certain extent, is subject to general economic, financial, competitive, business, legislative, regulatory and other factors that are beyond our control.
If our business does not generate sufficient cash flow from operations or if future borrowings are not available to us in an amount sufficient to enable us to pay our indebtedness, including the 9.00% Notes and our other series of outstanding notes or to fund our other liquidity needs, we may need to refinance all or a portion of our indebtedness on or before the maturity thereof, reduce or delay capital investments or seek to raise additional capital, any of which could have a material adverse effect on our operations. In addition, we may not be able to effect any of these actions, if necessary, on commercially reasonable terms or at all. Our ability to restructure or refinance our indebtedness will depend on the condition of the capital markets and our financial condition at such time. Any refinancing of our debt could be at higher interest rates and may require us to comply with more onerous covenants, which could further restrict our business operations or our ability to refinance our existing debt. The terms of existing or future debt instruments, including the indenture governing the 9.00% Notes and the secured credit agreement, may limit or prevent us from taking any of these actions. In addition, any failure to make scheduled payments of interest and principal on our outstanding indebtedness would likely result in a reduction of our credit rating, which could harm our ability to incur additional indebtedness on
13
commercially reasonable terms or at all. Our inability to generate sufficient cash flow to satisfy our debt service obligations, or to refinance or restructure our obligations on commercially reasonable terms or at all, would have an adverse effect, which could be material, on our business, financial condition and results of operations, as well as on our ability to satisfy our obligations with respect to our outstanding debt.
We may be required to make greater contributions to our qualified defined benefit pension plan in the next several years than previously required, placing greater liquidity needs upon our operations.
The projected benefit obligations of the Pension Plan exceeded Pension Plan assets by $476.7 million as of December 31, 2017, a decrease of $10.7 million from December 31, 2016, primarily due to favorable market returns that were partially offset by unfavorable changes in the discount rate. The value of the Pension Plan assets fluctuates based on many factors, including changes in interest rates and market returns.
The excess of benefit obligations over pension assets is expected to give rise to required pension contributions over the next several years. Over the last several years federal legislation has provided for pension funding relief in the form of mandated changes in the discount rates used to calculate the projected benefit obligations for purposes of funding pension plans. Legislation and calculations use historical averages of long‑term highly‑rated corporate bonds (within ranges as defined in the legislation) which have an impact of applying a higher discount rate to determine the projected benefit obligations for funding and current long‑term interest rates, but also mandated increases in fees paid to the Pension Benefit Guaranty Corporation, also known as the PBGC, based in part on the level of underfunding in the company’s qualified defined pension plan. Even with the relief provided by these legislative rules, we expect future contributions to be required. In addition, adverse conditions in the capital markets and/or lower long‑term interest rates may result in greater annual contribution requirements, placing greater liquidity needs upon our operations.
We require newsprint for operations and, therefore, our operating results may be adversely affected if the price of newsprint increases or if we experience disruptions in our newsprint supply chain that reduce the availability of newsprint in our markets.
We require newsprint to deliver our daily and Sunday newspapers and maintain our print subscriber revenues. Newsprint accounted for 4.4% of our operating expenses, excluding impairments, in 2017 compared to 4.9% in 2016. The price of newsprint has historically been volatile. More recently newsprint availability has tightened in the United States. The price and availability of newsprint are affected by various factors, including:
|
· |
declining newsprint supply from mill closures; |
|
· |
reduction in newsprint suppliers because of consolidation in the newsprint industry; |
|
· |
tariffs on supply from other countries, primarily Canada: |
|
· |
paper mills reducing their newsprint supply because of switching their production to other paper grades; and |
|
· |
a decline in the financial situation of newsprint suppliers. |
We have not attempted to hedge price fluctuations in the normal purchases of newsprint or enter into contracts with embedded derivatives for the purchase of newsprint other than the natural hedge created by our ownership interest in Ponderay. If the price of newsprint increases materially, our operating results could be adversely affected. In addition, we rely on a limited number of suppliers for deliveries of newsprint. If newsprint suppliers experience labor unrest, transportation difficulties or other supply disruptions, our ability to produce and deliver newspapers could be impaired and/or the cost of the newsprint could increase, both of which would negatively affect our operating results.
A portion of our employees are members of unions, and if we experience labor unrest, our ability to produce and deliver newspapers could be impaired.
If we experience labor unrest, our ability to produce and deliver newspapers could be impaired in some locations. In addition, the results of future labor negotiations could harm our operating results. Our media companies have not experienced a labor strike for decades. However, we cannot ensure that a strike will not occur at one or more of our
14
media companies in the future. As of December 31, 2017, approximately 5.7% of full‑time and part‑time employees were represented by unions. Most of our union‑represented employees are currently working under labor agreements, with expiration dates through 2020. We face collective bargaining upon the expirations of these labor agreements. Even if our media companies do not suffer a labor strike, our operating results could be harmed if the results of labor negotiations restrict our ability to maximize the efficiency of our newspaper operations. In addition, our ability to make short‑term adjustments to control compensation and benefits costs, rebalance our portfolio of businesses or otherwise adapt to changing business needs may be limited by the terms and duration of our collective bargaining agreements.
We have invested in certain digital or other ventures, but such ventures may not be as successful as expected, which could adversely affect our results of operations.
We continue to evaluate our business and make strategic investments in digital ventures, either alone or with partners, to further our digital growth. We have numerous small “seed” investments in other digital companies. We also own 25.0% of Nucleus, a national marketing agency, and, through three wholly-owned subsidiaries, a combined 27.0% interest in the Ponderay Newsprint Company. We also continue to hold a small interest in CareerBuilder. The success of these ventures is dependent to an extent on the efforts and strategic plans of our partners. Further, our ability to monetize the investments and/or the value we may receive upon any disposition may depend on the actions of our partners. As a result, our ability to control the timing or process relating to a disposition may be limited, which could adversely affect the liquidity of these investments or the value we may ultimately attain upon disposition. If the value of the companies in which we invest declines, we may be required to record a charge to earnings. There can be no assurances that we will receive a return on these investments or that they will result in advertising growth or will produce equity income or capital gains in future years.
Circulation volume declines will adversely affect our print audience and print advertising revenues, and audience price increases could exacerbate declines in circulation volumes.
Print advertising and audience revenues are affected by changes in customer habits, which impact circulation volumes and readership levels of our print newspapers. In recent years, newspaper companies, including us, have experienced difficulty maintaining or increasing print circulation levels because of a number of factors, including:
|
· |
increased competition from other publications and other forms of media technologies available in various markets, including the internet and other new media formats that are often free for users; |
|
· |
continued fragmentation of media audiences; |
|
· |
a growing preference among some consumers to receive all or a portion of their news online or other than from a traditional printed newspaper; and |
|
· |
increases in subscription and newsstand rates. |
These factors could also affect our media companies’ ability to institute circulation price increases for print products. Also, print price increases have historically had an initial negative impact on circulation volumes that may not be mitigated with additional marketing and promotion. A prolonged reduction in circulation volumes would have a material adverse effect on print advertising revenues. To maintain our circulation base, we may be required to incur additional costs that we may not be able to recover through audience and advertising revenues.
We rely on third party vendors for various services and if any of those third parties fail to fulfill their obligations to us with quality and timeliness we expect, or if our relationship with such vendors is damaged, our business may be harmed.
We rely on third party vendors to provide various services such as printing, distribution and production, as well as various information technology systems and services. We do not control the operation of these vendors. If any of these third party vendors terminate their relationship with us, or do not provide an adequate level of service, it would be disruptive to our business as we seek to replace the vendor or remedy the inadequate level of service. This disruption may adversely affect our operating results.
15
Developments in the laws and regulations to which we are subject may result in increased costs and lower advertising revenues from our digital businesses.
We are generally subject to government regulation in the jurisdictions in which we operate. In addition, our websites are available worldwide and are subject to laws regulating the internet both within and outside the United States. The adoption of any laws or regulations that limit use of the internet, including laws or practices limiting internet neutrality, could decrease demand for, or the usage of, our products and services, which could adversely affect our operating results. We may incur increased costs necessary to comply with existing and newly adopted laws and regulations or penalties for any failure to comply. Advertising revenues from our digital businesses could be adversely affected, directly or indirectly, by existing or future laws and regulations relating to the use of consumer data in digital media.
Adverse results from litigation or governmental investigations can impact our business practices and operating results.
In the ordinary course of business, we and our subsidiaries are parties to litigation and regulatory, environmental and other proceedings with governmental authorities and administrative agencies. For example, we are currently involved in two class action lawsuits that are described further in Part II, Item 8, Note 8, Commitments and Contingencies to the consolidated financial statements. Adverse outcomes in lawsuits or investigations could result in significant monetary damages or injunctive relief that could adversely affect our operating results or financial condition as well as our ability to conduct our business as it is presently being conducted.
ITEM 1B. UNRESOLVED STAFF COMMENTS
None
Our corporate headquarters are located at 2100 Q Street, Sacramento, California. At December 31, 2017, we had newspaper production facilities in 10 markets in 9 states. Our facilities vary in size and in total occupy about 4.8 million square feet. Approximately 2.8 million of the total square footage is leased from others, while we own the properties for the remaining square footage. We own substantially all of our production equipment, although certain office equipment is leased.
We maintain our properties in good condition and believe that our current facilities are adequate to meet the present needs of our media companies.
See Part II, Item 8, Note 8, Commitments and Contingencies to the consolidated financial statements included as part of this Annual Report on Form 10-K.
ITEM 4. MINE SAFETY DISCLOSURES
None
16
ITEM 5. MARKET FOR REGISTRANT’S COMMON EQUITY, RELATED STOCKHOLDER MATTERS AND ISSUER PURCHASES OF EQUITY SECURITIES.
Since September 12, 2017, our Class A Common Stock has been listed on the NYSE American under the symbol MNI. Prior to that time, our Class A Common Stock was listed on the New York Stock Exchange under the same symbol. A small amount of Class A Common Stock is also traded on other exchanges. Our Class B Common Stock is not publicly traded. As of March 2, 2018, there were approximately 3,294 and 20 record holders of our Class A and Class B Common Stock, respectively. We believe that the total number of holders of our Class A Common Stock is much higher since many shares are held in street name. The following table lists the high and low prices of our Class A Common Stock as reported by the NYSE American or New York Stock Exchange, as applicable, for each fiscal quarter of 2017 and 2016:
|
Fiscal Year 2017 Quarters Ended: |
|
High |
|
Low |
||
|
March 26, 2017 |
|
$ |
13.92 |
|
$ |
9.32 |
|
June 25, 2017 |
|
$ |
12.99 |
|
$ |
8.01 |
|
September 24, 2017 |
|
$ |
10.48 |
|
$ |
5.75 |
|
December 31, 2017 |
|
$ |
11.04 |
|
$ |
6.64 |
|
Fiscal Year 2016 Quarters Ended: |
|
High |
|
Low |
||
|
March 27, 2016 |
|
$ |
14.50 |
|
$ |
8.30 |
|
June 26, 2016 |
|
$ |
17.32 |
|
$ |
9.90 |
|
September 25, 2016 |
|
$ |
19.77 |
|
$ |
13.05 |
|
December 25, 2016 |
|
$ |
19.00 |
|
$ |
12.94 |
Dividends:
In 2009, we suspended our quarterly dividend; therefore, we have not paid any cash dividends since the first quarter of 2009. Our credit agreement prohibits the payment of a dividend if a payment would not be permitted under the indenture for the 9.00% Notes (discussed below). Dividends under the indenture for the 9.00% Notes are allowed if the consolidated leverage ratio (as defined in the indenture) is less than 5.25 to 1.00 and we have sufficient amounts under our restricted payments basket (as determined pursuant to the indenture), or if we use other available exceptions provided for under the indenture. However, the payment and amount of future dividends remain within the discretion of the Board of Directors and will depend upon our future earnings, financial condition, and other factors considered relevant by the Board of Directors.
Equity Securities:
In 2015 and as amended in 2016, our Board of Directors authorized a share repurchase program for the repurchase of up to $20.0 million of our Class A Common Stock through December 31, 2016. The shares were repurchased from time to time depending on prevailing market prices, availability, and market conditions, among other factors. From inception through December 31, 2016, we repurchased 1.3 million shares at an average price of $12.28 per share. No shares were repurchased during the year ended December 31, 2017, as the plan had expired.
During the year ended December 31, 2017, we did not sell any equity securities of the Company that were not registered under the Securities Act of 1933, as amended.
Performance Graph:
The following graph compares the cumulative five‑year total return attained by shareholders on The McClatchy Company’s common stock versus the cumulative total returns of the S&P Midcap 400 index and a customized peer group composed of six companies (“Peer Group”).
Our Peer Group is customized to include six companies that are publicly traded with at least 40% of their revenues from print and digital newspaper publishing. This peer group includes: A.H. Belo Corp., Gannett Co. Inc., Lee Enterprises, Inc., New Media Investment Group, Inc., The New York Times Company and tronc, Inc.
17
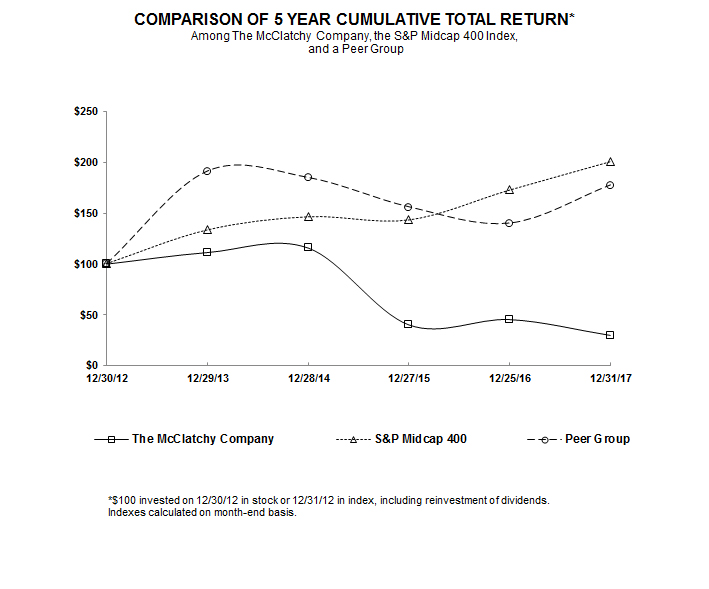
|
|
|
Fiscal Years Ended: |
|
||||||||||||||||
|
|
|
12/30/2012 |
|
12/29/2013 |
|
12/28/2014 |
|
12/27/2015 |
|
12/25/2016 |
|
12/31/2017 |
|
||||||
|
The McClatchy Company |
|
$ |
100 |
|
$ |
111 |
|
$ |
116 |
|
$ |
40 |
|
$ |
45 |
|
$ |
30 |
|
|
S&P Midcap 400 |
|
$ |
100 |
|
$ |
134 |
|
$ |
147 |
|
$ |
143 |
|
$ |
173 |
|
$ |
201 |
|
|
Peer Group |
|
$ |
100 |
|
$ |
191 |
|
$ |
185 |
|
$ |
156 |
|
$ |
140 |
|
$ |
178 |
|
18
ITEM 6. SELECTED FINANCIAL DATA
The selected financial data set forth below should be read in conjunction with Item 7, “Management’s Discussion and Analysis of Financial Condition and Results of Operations,” our consolidated financial statements and the related notes, and other financial data included elsewhere in this annual report. Historical results are not necessarily indicative of the results to be expected in future periods.
|
|
|
December 31, |
|
December 25, |
|
December 27, |
|
December 28, |
|
December 29, |
|
|||||
|
(in thousands, except per share amounts) |
|
2017 (1) |
|
2016 |
|
2015 |
|
2014 |
|
2013 |
|
|||||
|
REVENUES — NET: |
|
|
|
|
|
|
|
|
|
|
|
|
|
|
|
|
|
Advertising |
|
$ |
498,639 |
|
$ |
568,735 |
|
$ |
637,415 |
|
$ |
731,783 |
|
$ |
822,128 |
|
|
Audience |
|
|
363,497 |
|
|
364,830 |
|
|
367,858 |
|
|
366,592 |
|
|
346,311 |
|
|
Other |
|
|
41,456 |
|
|
43,528 |
|
|
51,301 |
|
|
48,177 |
|
|
46,409 |
|
|
|
|
|
903,592 |
|
|
977,093 |
|
|
1,056,574 |
|
|
1,146,552 |
|
|
1,214,848 |
|
|
OPERATING EXPENSES: |
|
|
|
|
|
|
|
|
|
|
|
|
|
|
|
|
|
Other operating expenses (2) |
|
|
757,856 |
|
|
840,805 |
|
|
885,499 |
|
|
937,732 |
|
|
942,991 |
|
|
Depreciation and amortization |
|
|
80,129 |
|
|
89,446 |
|
|
101,595 |
|
|
113,638 |
|
|
121,570 |
|
|
Asset impairments |
|
|
23,442 |
|
|
9,526 |
|
|
304,848 |
|
|
8,227 |
|
|
17,181 |
|
|
|
|
|
861,427 |
|
|
939,777 |
|
|
1,291,942 |
|
|
1,059,597 |
|
|
1,081,742 |
|
|
OPERATING INCOME (LOSS) |
|
|
42,165 |
|
|
37,316 |
|
|
(235,368) |
|
|
86,955 |
|
|
133,106 |
|
|
NON-OPERATING INCOME (EXPENSE) : |
|
|
|
|
|
|
|
|
|
|
|
|
|
|
|
|
|
Interest expense |
|
|
(81,501) |
|
|
(83,168) |
|
|
(85,973) |
|
|
(127,503) |
|
|
(135,381) |
|
|
Interest income |
|
|
558 |
|
|
463 |
|
|
331 |
|
|
254 |
|
|
53 |
|
|
Equity income (loss) in unconsolidated companies, net |
|
|
(1,698) |
|
|
13,519 |
|
|
18,252 |
|
|
26,925 |
|
|
48,776 |
|
|
Impairments related to equity investments, net |
|
|
(170,007) |
|
|
(1,027) |
|
|
(8,166) |
|
|
(7,841) |
|
|
(3,096) |
|
|
Gains related to equity investments |
|
|
— |
|
|
— |
|
|
8,061 |
|
|
705,247 |
|
|
— |
|
|
Gain (loss) on extinguishment of debt |
|
|
(2,700) |
|
|
431 |
|
|
1,167 |
|
|
(72,777) |
|
|
(13,643) |
|
|
Retirement benefit expense (2) |
|
|
(13,404) |
|
|
(14,776) |
|
|
(9,971) |
|
|
(4,632) |
|
|
(12,162) |
|
|
Other — Miami property gain |
|
|
— |
|
|
— |
|
|
— |
|
|
— |
|
|
9,909 |
|
|
Other — net |
|
|
(312) |
|
|
(16) |
|
|
(292) |
|
|
579 |
|
|
541 |
|
|
|
|
|
(269,064) |
|
|
(84,574) |
|
|
(76,591) |
|
|
520,252 |
|
|
(105,003) |
|
|
Income (loss) from continuing operations before income taxes |
|
|
(226,899) |
|
|
(47,258) |
|
|
(311,959) |
|
|
607,207 |
|
|
28,103 |
|
|
Income tax provision (benefit) |
|
|
105,459 |
|
|
(13,065) |
|
|
(11,797) |
|
|
231,230 |
|
|
11,659 |
|
|
NET INCOME (LOSS) FROM CONTINUING OPERATIONS |
|
|
(332,358) |
|
|
(34,193) |
|
|
(300,162) |
|
|
375,977 |
|
|
16,444 |
|
|
Income (loss) from discontinued operations, net of tax |
|
|
— |
|
|
— |
|
|
— |
|
|
(1,988) |
|
|
2,359 |
|
|
NET INCOME (LOSS) |
|
$ |
(332,358) |
|
$ |
(34,193) |
|
$ |
(300,162) |
|
$ |
373,989 |
|
$ |
18,803 |
|
|
Basic earnings per common share: |
|
|
|
|
|
|
|
|
|
|
|
|
|
|
|
|
|
Income (loss) from continuing operations |
|
$ |
(43.55) |
|
$ |
(4.41) |
|
$ |
(34.66) |
|
$ |
43.32 |
|
$ |
1.90 |
|
|
Discontinued operations, net of tax |
|
|
— |
|
|
— |
|
|
— |
|
|
(0.23) |
|
|
0.30 |
|
|
Net income (loss) per basic common share |
|
$ |
(43.55) |
|
$ |
(4.41) |
|
$ |
(34.66) |
|
$ |
43.09 |
|
$ |
2.20 |
|
|
Diluted earnings per common share: |
|
|
|
|
|
|
|
|
|
|
|
|
|
|
|
|
|
Income (loss) from continuing operations |
|
$ |
(43.55) |
|
$ |
(4.41) |
|
$ |
(34.66) |
|
$ |
42.55 |
|
$ |
1.90 |
|
|
Discontinued operations, net of tax |
|
|
— |
|
|
— |
|
|
— |
|
|
(0.22) |
|
|
0.30 |
|
|
Net income (loss) per diluted common share |
|
$ |
(43.55) |
|
$ |
(4.41) |
|
$ |
(34.66) |
|
$ |
42.33 |
|
$ |
2.20 |
|
|
Dividends per common share: |
|
$ |
— |
|
$ |
— |
|
$ |
— |
|
$ |
— |
|
$ |
— |
|
|
CONSOLIDATED BALANCE SHEET DATA: |
|
|
|
|
|
|
|
|
|
|
|
|
|
|
|
|
|
Total assets |
|
$ |
1,505,918 |
|
$ |
1,836,754 |
|
$ |
1,923,034 |
|
$ |
2,540,716 |
|
$ |
2,577,739 |
|
|
Long-term debt |
|
|
707,252 |
|
|
829,415 |
|
|
905,425 |
|
|
994,812 |
|
|
1,473,460 |
|
|
Financing obligations |
|
|
91,905 |
|
|
51,616 |
|
|
32,398 |
|
|
34,551 |
|
|
40,264 |
|
|
Stockholders’ equity (deficit) |
|
|
(204,332) |
|
|
113,913 |
|
|
192,763 |
|
|
503,385 |
|
|
240,386 |
|
|
(1) |
Due to our fiscal calendar, the year ended on December 31, 2017 encompassed a 53‑week period as compared to the other fiscal year ends identified in this table, which only have 52‑week periods. |
|
(2) |
In 2017, we early adopted FASB issued Accounting Standards Update (“ASU”) No. 2017-07 (see Note 1 to our consolidated financial statements). This standard was applied retrospectively and therefore for fiscal years 2013-2016, we reclassified all of our retirement benefit expenses from compensation in operating income (loss) to non-operating income (expense) on the consolidated statements of operations. |
19
ITEM 7. MANAGEMENT’S DISCUSSION AND ANALYSIS OF FINANCIAL CONDITION AND RESULTS OF OPERATIONS
Reference is made to Part I, Item 1 “Forward‑Looking Statements” and Item 1A “Risk Factors,” which describes important factors that could cause actual results to differ from expectations and non‑historical information contained herein. In addition, the following Management’s Discussion and Analysis of Financial Condition and Results of Operations (“MD&A”) is intended to help the reader understand our results of operations and financial condition. MD&A should be read in conjunction with our audited consolidated financial statements and accompanying notes to the consolidated financial statements (“Notes”) as of and for each of the three years ended December 31, 2017, December 25, 2016, and December 27, 2015, included elsewhere in this Annual Report on Form 10‑K.
Overview
We operate 30 media companies in 14 states, providing each of its communities with high-quality news and advertising services in a wide array of digital and print formats. We are a publisher of well-respected brands such as the Miami Herald, The Kansas City Star, The Sacramento Bee, The Charlotte Observer, The (Raleigh) News & Observer, and the (Fort Worth) Star-Telegram. We are headquartered in Sacramento, California, and our Class A Common Stock is listed on the NYSE American under the symbol MNI.
On July 31, 2017, we closed a transaction to sell a majority of our interest in CareerBuilder LLC (“CareerBuilder”), which reduced our ownership interest in CareerBuilder from 15.0% to approximately 3.0%.
Our fiscal year ends on the last Sunday in December. Fiscal year ended December 31, 2017, consisted of a 53-week period. Fiscal years ended December 25, 2016, and December 26, 2015, consisted of 52‑week periods.
The following table reflects our sources of revenues as a percentage of total revenues for the periods presented:
|
|
|
Years Ended |
|||||
|
|
|
December 31, |
|
December 25, |
|
December 27, |
|
|
|
|
2017 |
|
2016 |
|
2015 |
|
|
Revenues: |
|
|
|
|
|
|
|
|
Advertising |
|
55.2 |
% |
58.2 |
% |
60.3 |
% |
|
Audience |
|
40.2 |
% |
37.3 |
% |
34.8 |
% |
|
Other |
|
4.6 |
% |
4.5 |
% |
4.9 |
% |
|
Total revenues |
|
100.0 |
% |
100.0 |
% |
100.0 |
% |
Our primary sources of revenues are digital and print advertising and audience subscriptions. All categories (retail, national and classified) of advertising discussed below include both digital and print advertising. Retail advertising revenues (from retail clients) include advertising delivered digitally and/or advertising carried as a part of newspapers (run of press (“ROP”) advertising), advertising inserts placed in newspapers (“preprint advertising”). Audience revenues include either digital-only subscriptions, or bundled subscriptions, which include both digital and print. Our print newspapers are delivered by large distributors and independent contractors. Other revenues include, among others, commercial printing and distribution revenues.
See “Results of Operations” section below for a discussion of our revenue performance and contribution by category for 2017, 2016 and 2015.
Recent Developments
Deferred Tax Valuation Allowance
As discussed further in Note 5, as a result of our deferred tax asset valuation assessment, we recorded a valuation allowance charge of $192.3 million in 2017, primarily because we have incurred three years of cumulative pre-tax losses. The amount of the valuation allowance that we recorded represents the deferred taxes for which we determined it is not more-likely-than-not that we will realize the benefits in future periods. We will continue to evaluate the valuation allowance and if actual outcomes differ from our current expectations, we may record additional valuation allowance or reverse the allowance, in whole or in part, through income tax expense in the period such determination is made. Despite having this valuation allowance, for the 2017 tax year, we anticipate being a U.S. taxpayer and benefiting from our deferred taxes as they become realized in our federal tax return.
20
CareerBuilder Transaction and Impairment Charge
As discussed further in Note 2, in July 2017, we - along with the then existing ownership group of CareerBuilder - sold a majority of the collective ownership interest in CareerBuilder. We received $73.9 million from the closing of the transaction, consisting of approximately $7.3 million in normal distributions and $66.6 million of gross proceeds. As a result of the closing of the transaction, our ownership interest in CareerBuilder was reduced to approximately 3.0% from 15.0%. As a result, we recorded impairment charges of $168.2 million on our equity investment in CareerBuilder during 2017.
Under the terms of the indenture for our 9.00% Notes, we were required to use the after-tax proceeds from the sale of our interest in CareerBuilder to reinvest in the company within 365 days from the date of the sale or to make an offer to the holders of the 9.00% Notes to purchase their notes at par plus accrued and unpaid interest. On August 1, 2017, we announced an offer to purchase up to $65.0 million of the 9.00% Notes using the net cash proceeds from the sale of our interests in CareerBuilder at par plus accrued and unpaid interest. As a result of this offer to purchase the 9.00% Notes, $1.7 million of notes were tendered in the offer and were redeemed by us at par in September 2017.
Asset sales and leasebacks
During 2017, we sold various real estate (“Property Sales”) totaling gross proceeds of approximately $90.0 million. The largest of these was a sale of land and buildings in Sacramento, California, home of The Sacramento Bee. We are leasing back the Sacramento property under a 15-year lease with initial annual payments totaling approximately $4.4 million. Accordingly, the lease is treated as financing lease, and we continue to depreciate the carrying value of the property in our financial statements. No gain or loss will be recognized on the sale and leaseback of the property until we no longer have a continuing involvement in the property.
Under the terms of the indenture for our 7.150% notes due in 2027 ("7.150% Notes") and 6.875% notes due in 2029 ("6.875% Notes"), we were required to repurchase approximately $32.0 million in publicly traded notes within 90 days following the execution of the lease on the Sacramento property. As discussed below, we repurchased $35.0 million of our 9.00% Notes during September 2017, which satisfied our obligation under the indenture for the 7.150% Notes and the 6.875% Notes to repurchase publicly traded notes.
We are also required under the indenture for the 9.00% Notes to use the net after tax proceeds of $44.8 million from the Property Sales to reinvest in the Company within 365 days from the date of the sale or to make an offer to the holders of the 9.00% Notes to purchase their notes at 100% of the principal amount plus accrued and unpaid interest. On September 20, 2017, we announced an offer to purchase up to $40.0 million of the 9.00% Notes using the net after tax proceeds from the Property Sales at par plus accrued and unpaid interest. The offer expired on October 19, 2017, and $0.1 million principal amount of the 9.00% Notes were tendered in the offer and redeemed by us at par.
We also have various sales agreements or letters of intent to sell other smaller properties that are expected to close in 2018, including the building and land in Columbia, South Carolina. The Columbia, South Carolina transaction will be structured similar to the Sacramento sale and leaseback transaction.
Debt Repurchase and Extinguishment of Debt
During 2017, we (i) retired $16.9 million of the 5.75% Notes due in 2017 (“5.75% Notes”) that matured on September 1, 2017; (ii) repurchased a total $50.0 million of our 9.00% Senior Secured Notes due in 2022 (“9.00% Notes”) through privately negotiated transactions; and (iii) we redeemed $1.8 million of the 9.00% Notes from the offers to purchase that we announced in 2017. As a result of these transactions, we recorded a loss on the extinguishment of debt of $2.7 million in 2017.
On January 25, 2018, pursuant to the terms of the indenture for the 9.00% Notes, we redeemed $75.0 million aggregate principal amount of our 9.00% Notes at a premium and we wrote off the associated debt issuance costs. In addition, in February 2018, we repurchased $20.0 million of our 9.00% Notes. As a result of these transactions, we expect to record a loss on the extinguishment of debt of approximately $5.3 million during the quarter ending April 1, 2018.
21
Listing on NYSE American
Effective September 12, 2017, we voluntarily transferred our Class A Common Stock listing from the NYSE to the NYSE American, which is an enhanced market for small to –mid-cap companies, that more closely reflects our current size and capital structure. We continue to trade under the symbol MNI.
Tax Legislation
On December 22, 2017, the Tax Cuts and Jobs Act of 2017 (“Tax Act”) was enacted. The Tax Act makes broad and complex changes to the U.S. tax code, including, but not limited to, (i) reducing the U.S. federal corporate rate from 35% to 21%; (ii) eliminating the corporate alternative minimum tax (“AMT”) and changing how existing AMT credits can be realized; (iii) creating a new limitation on deductible interest expense; (iv) changing rules related to uses and limitations of net operating loss carryforwards created in tax years beginning after December 31, 2017; (v) bonus depreciation that will allow for full expensing of qualified property; and (vi) limitations on the deductibility of certain executive compensation. See Notes 1 and 5 for more detailed discussion of the Tax Act and the impact to us.
Results of Operations
The following table reflects our financial results on a consolidated basis for 2017, 2016 and 2015:
|
|
|
Years Ended |
|||||||
|
|
|
December 31, |
|
December 25, |
|
December 27, |
|||
|
(in thousands, except per share amounts) |
|
2017 |
|
2016 |
|
2015 |
|||
|
Net loss |
|
$ |
(332,358) |
|
$ |
(34,193) |
|
$ |
(300,162) |
|
|
|
|
|
|
|
|
|
|
|
|
Net loss per diluted common share |
|
$ |
(43.55) |
|
$ |
(4.41) |
|
$ |
(34.66) |
The increase in net loss in 2017 compared to 2016 was primarily due to a pre-tax impairment charges of $193.4 million (see Recent Developments above regarding the $168.2 million CareerBuilder impairment) and a non-cash charge to establish a deferred tax valuation allowance of $192.3 million (see Recent Developments above). In addition, advertising revenues were lower, which were partially offset by a decrease in expenses, as described more fully below.
The decrease in net loss in 2016 compared to 2015 was largely due to non-cash impairment charges of $9.5 million in 2016 compared to impairment charges of $304.8 million in 2015.
2017 Compared to 2016
Revenues
The following table summarizes our revenues by category, which compares 2017 to 2016:
|
|
|
Years Ended |
|||||||||
|
|
|
December 31, |
|
December 25, |
|
$ |
|
% |
|||
|
(in thousands) |
|
2017 |
|
2016 |
|
Change |
|
Change |
|||
|
Advertising: |
|
|
|
|
|
|
|
|
|
|
|
|
Retail |
|
$ |
236,130 |
|
$ |
280,916 |
|
$ |
(44,786) |
|
(15.9) |
|
National |
|
|
40,338 |
|
|
42,925 |
|
|
(2,587) |
|
(6.0) |
|
Classified |
|
|
120,586 |
|
|
137,347 |
|
|
(16,761) |
|
(12.2) |
|
Direct marketing and other |
|
|
101,585 |
|
|
107,547 |
|
|
(5,962) |
|
(5.5) |
|
Total advertising |
|
|
498,639 |
|
|
568,735 |
|
|
(70,096) |
|
(12.3) |
|
Audience |
|
|
363,497 |
|
|
364,830 |
|
|
(1,333) |
|
(0.4) |
|
Other |
|
|
41,456 |
|
|
43,528 |
|
|
(2,072) |
|
(4.8) |
|
Total revenues |
|
$ |
903,592 |
|
$ |
977,093 |
|
$ |
(73,501) |
|
(7.5) |
During 2017, total revenues decreased 7.5% compared to 2016 primarily due to the continued decline in demand for print advertising. Consistent with the end of 2016, the decline in print advertising was primarily a result of large retail advertisers continuing to reduce preprinted insert and in-newspaper ROP advertising. The decline in print advertising revenues is the result of the desire of advertisers to reach customers directly through online advertising, and the secular shift in advertising demand from print to digital products. We expect these trends to continue for the foreseeable future. The decrease in total revenues was partially offset by the 53rd week in 2017 that we estimate provide for an additional $6.6 million in advertising revenues, $6.7 million in audience revenues and $14.0 million in total revenues.
22
Advertising Revenues
Total advertising revenues decreased 12.3% during 2017 compared to 2016. While we experienced declines in all of our advertising revenue categories, the decrease in total advertising revenues was primarily related to declines in print retail and print and digital classified advertising revenues. These decreases in advertising revenues were partially offset by increases in several digital revenue categories, as discussed below, as well as the impact of a 53rd week in 2017.
Digital advertising can come in many forms, including banner ads, video, search advertising and/or liner ads, while print advertising is typically display advertising, or in the case of classified, display and/or liner advertising. Advertising printed directly in the newspaper is considered ROP advertising while preprint advertising consists of preprinted advertising inserts delivered with the newspaper.
The following table reflects the category of advertising revenues as a percentage of total advertising revenues for the periods presented:
|
|
|
Years Ended |
|
||
|
|
|
December 31, |
|
December 25, |
|
|
|
|
2017 |
|
2016 |
|
|
Advertising: |
|
|
|
|
|
|
Retail |
|
47.4 |
% |
49.4 |
% |
|
National |
|
8.1 |
% |
7.5 |
% |
|
Classified |
|
24.2 |
% |
24.2 |
% |
|
Direct marketing and other |
|
20.4 |
% |
18.9 |
% |
|
Total advertising |
|
100.0 |
% |
100.0 |
% |
We categorize advertising revenues as follows:
|
· |
Retail – local retailers, local stores of national retailers, department and furniture stores, restaurants and other consumer‑related businesses. Retail advertising also includes revenues from preprinted advertising inserts distributed in the newspaper. |
|
· |
National – national and major accounts such as telecommunications companies, financial institutions, movie studios, airlines and other national companies. |
|
· |
Classified – local auto dealers, employment, real estate and other classified advertising, which includes remembrances, legal advertisements and other miscellaneous advertising. |
|
· |
Direct Marketing and Other – primarily preprint advertisements in direct mail, shared mail and niche publications, events programs, total market coverage publications and other miscellaneous advertising not included in the daily newspaper. |
Retail:
During 2017, retail advertising revenues decreased 15.9%, compared to 2016. In 2017, the decrease in retail advertising revenues was primarily due to decreases of 22.9% in print ROP advertising revenues and 25.5% in preprint advertising revenues, compared to 2016. These decreases were partially offset by an increase in digital retail advertising of 2.0% in 2017 compared to 2016. The overall decreases in retail advertising revenues for 2017 were spread among all of the ROP and preprint categories.
National:
National advertising revenues decreased 6.0% during 2017 compared to 2016. While we experienced a 34.0% decrease in print national advertising during 2017 compared to 2016, we recorded an increase of 16.1% in digital national advertising. Overall, the increase in digital national advertising revenues during 2017 was largely led by programmatic digital advertising, including mobile and video revenues.
Classified:
During 2017, classified advertising revenues decreased 12.2% compared to 2016. Automotive, employment and real estate categories combined accounted for 54.9% of our classified advertising revenues during 2017 compared to 58.2%
23
in 2016. During 2017, we experienced decreases of 13.1% and 11.1% in print classified advertising and digital classified advertising, respectively, compared to 2016, which were led by automotive and employment advertising. Our decrease in print classified advertising revenues resulted from the continued shift of print advertising to digital platforms, while the decrease in digital classified advertising was primarily due to the large number of competitors in the digital environment. Accordingly, we expect this market will continue to be volatile and highly competitive. The real estate category had similar results, although to a lesser extent, due to similar trends. Other classified advertising revenues, which is our largest classified category and includes legal, remembrance and celebration notices and miscellaneous advertising, also experienced decreases in both print and digital in 2017 compared to 2016.
Digital Advertising:
Digital advertising revenues, which are included in each of the advertising categories discussed above, constituted 34.7% of total advertising revenues during 2017 compared to 30.6% during 2016. Total digital advertising includes digital advertising bundled with print and digital-only advertising. Digital-only advertising is defined as digital advertising sold on a stand-alone basis or as the primary advertising buy with print sold as an “up-sell.” Digital-only advertising revenues increased 9.8% to $133.7 million in 2017 compared to 2016. In 2017, total digital advertising revenues decreased 0.6% to $173.1 million compared to 2016 reflecting the negative impact of lower print advertising revenues on bundled sales. Digital advertising revenues bundled with print products declined 24.8% in 2017 compared to 2016 as a result of fewer print advertising sales. The advertising industry continues to experience a secular shift in advertising demand from print to digital products as advertisers look for multiple advertising channels to reach their customers and are increasingly focused on online customers. While our product offerings and collaboration efforts in digital advertising have grown, we expect to continue to face intense competition in the digital advertising space.
Direct Marketing and Other:
Direct marketing and other advertising revenues decreased 5.5% during 2017 compared to 2016. This represents a lower rate of decline from trends in 2016 when these revenues decreased by 9.5% compared to 2015. The lower rate of decline in 2017 versus in 2016 was partially due to the addition of new customers in certain markets in the second half of 2016, which was largely offset by the declines in preprint retail advertising by large retail customers as described above.
Audience Revenues
Audience revenues decreased slightly at 0.4% during 2017 compared to 2016. Overall, digital audience revenues increased 0.9% during 2017 and digital-only audience revenues associated with digital subscriptions increased 9.8% in 2017 compared to 2016. The increase in digital-only audience revenues during 2017 was a result of (i) a 23.8% increase in our digital-only subscribers to 102,900 as of the end of 2017 compared to 2016, (ii) digital subscription rate increases in some markets, and (iii) the revenues received in the 53rd week of 2017. Print audience revenues decreased 0.8% in 2017 compared to 2016, primarily due to pricing adjustments that were implemented and were partially offset by lower print circulation volumes and the 53rd week of 2017. We have a dynamic pricing model for our traditional print subscriptions for which pricing is constantly being adjusted based upon the market’s ability to accept pricing adjustments. Print circulation volumes continue to decline as a result of fragmentation of audiences faced by all media as available media outlets proliferate and readership trends change. To help reduce potential attrition due to the increased pricing, we also increased our subscription related marketing and promotion efforts.
Operating Expenses
Total operating expenses decreased 8.3% in 2017, compared to 2016. Retirement benefit expenses related to the pension and post-retirement benefits are now recorded as non-operating costs (see Note 1) and therefore, excluded from this discussion in all periods presented. The decreases during 2017 were primarily due to decreases in compensation and other operating expenses compared to 2016, as discussed below. Our total operating expenses reflect our continued effort to reduce costs through streamlining processes to gain efficiencies. These decreases in total operating expenses were partially offset by an increase in impairment charges recorded during 2017, as discussed below. As discussed above, our operating expenses for 2017 also include a 53rd week, which results in higher expenses during the period than the comparable period in 2016.
24
The following table summarizes our operating expenses, which compares 2017 to 2016:
|
|
Years Ended |
|||||||||
|
|
December 31, |
|
December 25, |
|
$ |
|
% |
|||
|
(in thousands) |
2017 |
|
2016 |
|
Change |
|
Change |
|||
|
Compensation expenses |
$ |
338,588 |
|
$ |
368,897 |
|
$ |
(30,309) |
|
(8.2) |
|
Newsprint, supplements and printing expenses |
|
66,438 |
|
|
78,893 |
|
|
(12,455) |
|
(15.8) |
|
Depreciation and amortization expenses |
|
80,129 |
|
|
89,446 |
|
|
(9,317) |
|
(10.4) |
|
Other operating expenses |
|
352,830 |
|
|
393,015 |
|
|
(40,185) |
|
(10.2) |
|
Goodwill impairment and other asset write-downs |
|
23,442 |
|
|
9,526 |
|
|
13,916 |
|
146.1 |
|
|
$ |
861,427 |
|
$ |
939,777 |
|
$ |
(78,350) |
|
(8.3) |
Compensation expenses, which included both payroll and fringe benefit costs, decreased 8.2% in 2017 compared to 2016. Payroll expenses declined 7.5% during 2017 compared to 2016, reflecting a 13.3% decline in average full-time equivalent employees. Similarly, fringe benefits costs decreased 12.3% in 2017 compared to 2016. These decreases were primarily due to decreases in health benefit costs and other fringe benefit costs, a result of lower headcount. The decrease in fringe benefit costs is also impacted by the $2.3 million charge we incurred during 2016 when we outsourced the printing production at one of our media companies and exited the multiemployer pension plans that covered the impacted employees that was not repeated in 2017.
Newsprint, supplements and printing expenses decreased 15.8% in 2017 compared to 2016. Newsprint expense declined 20.1% during 2017 compared to 2016. The decline in newsprint expense reflects a decrease in newsprint usage of 21.1% in 2017, partially offset by an increase in newsprint prices of 1.3%, in both cases compared to 2016. During this same period, printing expenses, which are primarily outsourced printing costs, decreased $3.0 million or 9.3%.
Depreciation and amortization expenses decreased 10.4% in 2017 compared to 2016. Depreciation expense decreased $10.6 million in 2017 compared to 2016, as a result of assets becoming fully depreciated in previous periods and due to $7.0 million in accelerated depreciation charges taken in 2016 compared to only $0.3 million in 2017. The decrease in depreciation expense was partially offset by the 53rd week in 2017. Amortization expense increased $1.3 million in 2017 compared to 2016 due to the intangible assets acquired in December 2016 when we purchased The (Durham, NC) Herald-Sun and due to the 53rd week in 2017.
Other operating expenses decreased 10.2% in 2017 compared to 2016. In 2017, other operating expenses included $23.6 million gain on the disposal of property and equipment compared to $5.8 million in 2016. In addition, as a result of our efforts to reduce operational costs, we had decreases of $8.8 million in circulation delivery costs, $2.6 million in production costs, and $10.5 million in relocation and other costs, which were partially offset by an increase of $4.9 million in professional fees, $1.3 million in other miscellaneous expenses and the 53rd week in 2017.
Other asset write-downs include an impairment charge of $21.5 million related to intangible newspaper mastheads during 2017, and a write down of $2.0 million of non-newsprint inventory during 2017. During 2016, other asset write-downs include $9.2 million write-downs of intangible newspaper mastheads and $0.3 million related to certain assets held for sale. See Notes 1 and 4 for additional discussion.
Non‑Operating Items
Interest Expense:
Total interest expense decreased 2.0% in 2017 compared to 2016. Interest expense related to debt balances decreased by $4.8 million in 2017 as a result of lower overall debt balances reflecting repurchases of debt made during 2016 and in 2017. In 2017, this was offset by a $2.0 million increase of non-cash imputed interest related to our financing obligations that increased due to our contribution of real properties to our Pension Plan and due to the sale and leaseback of our Sacramento property.
Equity Income (Loss) in Unconsolidated Companies, Net:
During 2017, we recorded equity losses in unconsolidated companies of $1.7 million as compared to income of $13.4 million in 2016. The decreases during 2017 compared to 2016 are due to lower income from our equity method
25
investments. Following the sale of CareerBuilder in the third quarter of 2017, we expect income from unconsolidated equity investments to continue to be lower than historical levels.
Impairments Related to Equity Investments, Net:
As described more fully in Note 2, during 2017, we recorded $1.8 million in impairment charges related to certain other unconsolidated equity investments and $168.2 million in impairment charges related to our equity investment in CareerBuilder. During 2016, we recorded a $0.9 million write-down related to our equity investment in HomeFinder, LLC (“HomeFinder”), which was sold in the first quarter of 2016.
Extinguishment of Debt:
During 2017, we retired, repurchased or redeemed $68.7 million aggregate principal amount of various series of our outstanding notes. We repurchased some of these notes at a price higher than par value and redeemed some at par value. We wrote off historical debt issuance costs and as a result, we recorded a loss on the extinguishment of debt of $2.7 million during 2017. See Note 2 for further discussion.
During 2016, we repurchased $63.6 million aggregate principal amount of various series of our outstanding notes. We repurchased these notes at a price higher or lower than par value and wrote off historical discounts and unamortized issuance costs related to these notes, as applicable, which resulted in a net gain on extinguishment of debt of $0.4 million in 2016.
Income Taxes:
In 2017, we recorded an income tax expense of $105.5 million. As discussed more fully in Note 1(under Income Taxes) and Note 5, during 2017, we recorded a $192.3 million valuation allowance related to our deferred tax assets because we determined that it is not more-likely-than-not that we will realize such deferred tax assets. The remaining income tax benefit differed from the expected federal tax amounts primarily due to the inclusion of state income taxes, the tax impact of stock compensation, the benefit from the reduced federal tax rate as a result of the Tax Act on our deferred tax liabilities, and certain permanently non-deductible expenses.
In 2016, we recorded an income tax benefit of $13.1 million. The income tax benefit differs from the expected federal tax amounts primarily due to the inclusion of state income taxes, non-deductible stock related compensation, certain discrete tax items and the impact from a non-deductible loss for tax purposes related to the transfer of real property to our Pension Plan.
2016 Compared to 2015
Revenues
The following table summarizes our revenues by category, which compares 2016 to 2015:
|
|
|
Years Ended |
|||||||||
|
|
|
December 25, |
|
December 27, |
|
|
$ |
|
% |
||
|
(in thousands) |
|
2016 |
|
2015 |
|
|
Change |
|
Change |
||
|
Advertising: |
|
|
|
|
|
|
|
|
|
|
|
|
Retail |
|
$ |
280,916 |
|
$ |
318,953 |
|
$ |
(38,037) |
|
(11.9) |
|
National |
|
|
42,925 |
|
|
45,861 |
|
|
(2,936) |
|
(6.4) |
|
Classified |
|
|
137,347 |
|
|
153,699 |
|
|
(16,352) |
|
(10.6) |
|
Direct marketing and other |
|
|
107,547 |
|
|
118,902 |
|
|
(11,355) |
|
(9.5) |
|
Total advertising |
|
|
568,735 |
|
|
637,415 |
|
|
(68,680) |
|
(10.8) |
|
Audience |
|
|
364,830 |
|
|
367,858 |
|
|
(3,028) |
|
(0.8) |
|
Other |
|
|
43,528 |
|
|
51,301 |
|
|
(7,773) |
|
(15.2) |
|
Total revenues |
|
$ |
977,093 |
|
$ |
1,056,574 |
|
$ |
(79,481) |
|
(7.5) |
In 2016, total revenues decreased 7.5% compared to 2015 primarily due to the continued decline in demand for print advertising. The largest impact on print advertising came from large retail advertisers who began reducing preprinted insert and in-newspaper ROP advertising in 2015, which continued in 2016. Other long-term factors contributing to the
26
decline in print advertising revenues was the desire of advertisers to reach online customers, and the secular shift in advertising demand from print to digital products. As a result, the print advertising revenues declines were partially offset by growth in digital advertising.
Advertising Revenues
Total advertising revenues decreased 10.8% in 2016 compared to 2015. While we experienced declines in all of our advertising revenue categories, the decrease in total advertising revenues was primarily related to declines in print retail and print and digital classified advertising revenues. These decreases in advertising revenues were partially offset by increases in certain digital revenue categories, as discussed below.
The following table reflects the category of advertising revenues as a percentage of total advertising revenues for the periods presented:
|
|
|
Years Ended |
|
||
|
|
|
December 25, |
|
December 27, |
|
|
|
|
2016 |
|
2015 |
|
|
Advertising: |
|
|
|
|
|
|
Retail |
|
49.4 |
% |
50.0 |
% |
|
National |
|
7.5 |
% |
7.2 |
% |
|
Classified |
|
24.2 |
% |
24.1 |
% |
|
Direct marketing and other |
|
18.9 |
% |
18.7 |
% |
|
Total advertising |
|
100.0 |
% |
100.0 |
% |
Retail:
In 2016, retail advertising revenues decreased 11.9% compared to 2015, primarily due to decreases of 19.6% in print ROP advertising revenues and 18.6% in preprint advertising revenues, compared to 2015. These decreases were partially offset by increases in digital retail advertising of 8.5% in 2016 compared to 2015 as advertisers continued to move to digital. The overall decreases in retail advertising revenues in 2016 were widespread among ROP and preprint categories.
National:
National advertising revenues decreased 6.4% during 2016 compared to 2015. For 2016, we experienced a 25.3% decrease in print national advertising and a 17.0% increase in digital national advertising compared to 2015. Overall, the decrease in total national advertising revenues during 2016 was led by the telecommunications category. The increase in digital national advertising revenues during 2016 was largely led by programmatic digital advertising, including mobile, political and video revenues.
Classified:
In 2016, classified advertising revenues decreased 10.6% compared to 2015. Automotive, employment and real estate categories combined for 58.2% of our total classified advertising revenues during 2016 compared to 61.8% in 2015.
During 2016, we experienced decreases of 14.5% and 5.2% in print classified advertising and digital classified advertising, respectively, compared to 2015, which was led by automotive and employment advertising in the print category and by employment in the digital category. Our decrease in print classified advertising revenues resulted from the continued shift of print advertising to digital platforms, while the decrease in digital classified advertising was primarily due to the large number of competitors in digital environment. The real estate category had similar results in print classified advertising, although to a lesser extent due to similar trends. The real estate category increased slightly in the digital classified advertising. Other classified advertising revenues, which is our largest classified category and includes legal, remembrance and celebration notices and miscellaneous advertising, also experienced decreases in both print and digital in 2016 compared to 2015 and we believe these trends will continue in the near term.
27
Digital Advertising:
Digital advertising revenues, which were included in each of the advertising categories discussed above, constituted 30.6% of total advertising revenues in 2016 compared to 26.2% in 2015. Total digital advertising includes digital advertising bundled with print and digital-only advertising. As described above, digital-only advertising is defined as digital advertising sold on a stand-alone basis or as the primary advertising buy with print sold as an “up-sell.” Digital-only advertising revenues increased 14.8% to $121.7 million in 2016 compared to 2015. In 2016, total digital advertising revenues increased 4.3% to $174.1 million compared to 2015. Digital advertising revenues bundled with print products declined 14.0% in 2016 compared to 2015 as a result of fewer print advertising sales. The advertising industry was still experiencing a secular shift in advertising demand from print to digital products as advertisers looked for multiple advertising channels to reach their customers. While our product offerings and collaboration efforts in digital advertising had grown, we expected and continue to expect to face intense competition in the digital advertising space.
Direct Marketing and Other:
Direct marketing and other advertising revenues decreased 9.5% during 2016 compared to 2015. The decrease was partially due to the declines in the preprint retail advertising by large retail customers as described above and, to a lesser extent, the elimination of certain niche products during fiscal years 2015 and 2016 that did not meet our profit expectations.
Audience Revenues
Audience revenues decreased 0.8% during 2016 compared to 2015. Overall, digital audience revenues increased 1.7% in 2016 and digital-only audience revenues increased 9.0% in 2016. The increase in digital-only audience revenues resulted in a 4.8% increase in digital-only subscribers to 83,100 at the end of 2016 compared to 79,300 at the end of 2015, and to digital rate increases in our markets. Print audience revenues declined 1.8% in 2016 compared to 2015. We used a dynamic pricing model for our traditional subscriptions for which pricing was constantly being adjusted based upon a variety of market factors. This dynamic pricing model helped to partially offset print circulation declines. Print circulation volumes continued to decline as a result of fragmentation of audiences faced by all media as available media outlets proliferate and readership trends change. To help reduce potential attrition due to the increased pricing, we also increased our subscription-related marketing and promotion efforts.
Operating Expenses
Total operating expenses decreased 27.3% in 2016 compared to 2015. Retirement benefit expenses related to the pension and post-retirement benefits are now recorded as non-operating costs (see Note 1) and therefore excluded from this discussion in all periods presented. The decrease in 2016 was primarily due to lower impairment charges incurred during 2016 compared to 2015. The decreases in 2016 were also due in part to our continued effort to reduce costs. Our total operating expenses, excluding impairments and asset write-downs, reflect our continued effort to reduce costs through streamlining processes to gain efficiencies as well as staff reductions.
The following table summarizes our operating expenses, which compares 2016 to 2015:
|
|
|
Years Ended |
|
|||||||||||
|
|
|
December 25, |
|
December 27, |
|
$ |
|
% |
|
|||||
|
(in thousands) |
|
2016 |
|
2015 |
|
Change |
|
Change |
|
|||||
|
Compensation expenses |
|
$ |
368,897 |
|
$ |
385,478 |
|
$ |
(16,581) |
|
(4.3) |
|
||
|
Newsprint, supplements and printing expenses |
|
|
78,893 |
|
|
95,674 |
|
|
(16,781) |
|
(17.5) |
|
||
|
Depreciation and amortization expenses |
|
|
89,446 |
|
|
101,595 |
|
|
(12,149) |
|
(12.0) |
|
||
|
Other operating expenses |
|
|
393,015 |
|
|
404,347 |
|
|
(11,332) |
|
(2.8) |
|
||
|
Goodwill impairment and other asset write-downs |
|
|
9,526 |
|
|
304,848 |
|
|
(295,322) |
|
nm |
|
||
|
|
|
$ |
939,777 |
|
$ |
1,291,942 |
|
$ |
(352,165) |
|
(27.3) |
|
||
nm – not meaningful
Compensation expenses, which include payroll and fringe benefit costs, decreased 4.3% in 2016 compared to 2015. Payroll expenses declined 4.6% in 2016 compared to 2015, reflecting a 9.1% decline in average full-time equivalent
28
employees. Payroll expenses included approximately $6.2 million more in severance costs in 2016 compared to 2015 related to outsourcing printing production and co-sourcing certain other functions. Fringe benefit costs decreased 1.7% in 2016 compared to 2015. The decrease was primarily due to lower health care costs, partially offset by a $2.3 million charge incurred when we outsourced the printing production at one of our media companies and exited the multiemployer pension plans that covered the impacted employees.
Newsprint, supplements and printing expenses decreased 17.5% in 2016 compared to 2015. Newsprint expense declined 18.4% in 2016 compared to 2015. The newsprint expenses declines reflected a 15.8% decrease in newsprint usage and a 3.4% decrease in newsprint prices during 2016 compared to 2015. Printing expenses decreased 15.3% in 2016 compared to 2015 due to lower outsourced printing costs and lower direct marketing printing costs, as discussed above.
Depreciation and amortization expenses decreased 12.0% in 2016 compared to 2015. Depreciation expense decreased $11.8 million in 2016 compared to 2015, partially due to the impact and timing of accelerated depreciation during the periods and due to assets that became fully depreciated in 2015 or early 2016. During 2016, we incurred accelerated depreciation of $7.0 million compared to $10.3 million in accelerated depreciation during 2015. The accelerated depreciation during 2016 and 2015 related to production equipment associated with outsourcing our printing process at certain of our media companies. Amortization expense decreased $0.4 million in 2016 compared to 2015.
Other operating expenses decreased 2.8% in 2016 compared to 2015. In 2016, other operating expenses included decreases in circulation delivery costs of $12.8 million as expected due to decreased circulation volumes, professional fees of $2.1 million, postage of $2.8 million, as well as other miscellaneous expenses of $11.0 million, which were partially offset by increases in sales costs for digital advertising of $5.4 million and $12.0 million in relocation and other costs, which we believed would result in significant future cost savings.
In 2016, goodwill impairment and other asset write-downs included $9.2 million in non-cash impairment charges related to intangible newspaper mastheads and $0.3 million related to classifying certain assets as assets held for sale during 2016. In 2015, we recorded non-cash impairment charges related to goodwill of $290.9 million resulting from an interim goodwill impairment test during the second quarter of 2015, and to intangible newspaper mastheads of $13.9 million resulting from interim and annual impairment testing. See Notes 1 and 3 for additional discussion.
Non‑Operating Items
Interest Expense:
Total interest expense decreased 3.3% in 2016 compared to 2015, primarily reflecting lower overall debt balances due to the repurchases made in 2016 and 2015. Interest expense on debt declined by $7.4 million, or 8.7% in 2016 compared to 2015. The lower interest expense on debt was partially offset by a $3.8 million increase of non-cash imputed interest related to our financing obligations that grew due to the contributed real properties to our Pension Plan in January 2016.
Equity Income in Unconsolidated Companies, Net:
Total income from unconsolidated investments increased 23.8% during 2016 compared to 2015. While we had lower income from our equity method investments in 2016 compared to 2015, the increase in income from unconsolidated investments was due to the timing of write-downs. During 2016 and 2015, we recorded write‑downs of $1.0 million and $8.2 million, respectively, which reduced our equity income in unconsolidated companies, net, in the consolidated statements of operations. The write-down in 2016 was related to our HomeFinder investment, which was sold in the first quarter of 2016. The write-down in 2015 was primarily related to CareerBuilder, LLC, which recorded a non-cash, goodwill impairment charge related to their international reporting unit in the fourth quarter of 2015. Our portion of that impairment charge was $7.5 million.
Gains related to equity investments:
We recognized $8.1 million in gains related to equity investments during 2015, from a previously sold equity investment, as a result of a final cash distribution of $7.5 million that was received in the second quarter of 2015 and a final working capital adjustment of $0.6 million that was received in the first quarter of 2015. There were no such gains in 2016.
29
Extinguishment of Debt:
During 2016, we repurchased $63.6 million aggregate principal amount of various series of our outstanding notes. We repurchased these notes at a price higher or lower than par value and wrote off historical discounts and unamortized issuance costs related to these notes, as applicable, which resulted in a net gain on extinguishment of debt of $0.4 million in 2016.
During 2015, we repurchased $95.2 million aggregate principal amount of various series of our outstanding notes. We repurchased these notes at either par or at a price lower than par value and wrote off historical discounts and unamortized issuance costs related to these notes, as applicable, which resulted in a net gain on extinguishment of debt of $1.2 million in 2015.
Income Taxes:
In 2016, we recorded an income tax benefit of $13.1 million. The income tax benefit differed from the expected federal tax amounts primarily due to the inclusion of state income taxes, non-deductible stock related compensation, certain discrete tax items and the impact from a non-deductible loss for tax purposes related to the transfer of real property to our Pension Plan.
In 2015, we recorded an income tax benefit of $11.8 million. The income tax benefit differed from the expected federal tax amounts primarily due to the tax impact of state income taxes, the impact of non-tax-deductible goodwill, the reversal of unrecognized tax benefits and certain expenses not deductible for income tax purposes.
Liquidity and Capital Resources
Sources and Uses of Liquidity and Capital Resources:
Our cash and cash equivalents were $99.4 million as of December 31, 2017, compared to $5.3 million of cash and cash equivalents at December 25, 2016. Our cash balance at the end of 2017 reflects the receipt of sales proceeds from the sale or sale and leaseback of some of our buildings and land during 2017, the remaining proceeds received from sale of a portion of our investment in CareerBuilder in the third quarter of 2017, and cash from operations. See Recent Developments for more on our divestitures. However, in January 2018 we used a significant portion of the cash on hand to redeem $75.0 million aggregate principal amount of our 9.00% Notes as announced in December 2017, and in February 2018 we repurchase an additional $20.0 million aggregate principal amount of our 9.00% Notes. Following the redemption of notes in January 2018 and repurchases in February 2018, we had approximately $710.0 million remaining in outstanding indebtedness.
We expect that most of our cash and cash equivalents, and our cash generated from operations, for the foreseeable future will be used to repay debt, pay income taxes, fund our capital expenditures, invest in new revenue initiatives, digital investments and enterprise-wide operating systems, make required contributions to the Pension Plan, and for other corporate uses as determined by management and our Board of Directors. As discussed above and in Note 4, following the partial redemption in January 2018 and the repurchases in February 2018, we had approximately $710.0 million in total aggregate principal amount of debt outstanding, consisting of $344.6 million of our 9.00% Notes due 2022 and $365.4 million of our notes due in 2027 and 2029. We expect to continue to opportunistically repurchase or restructure our debt from time to time if market conditions are favorable, whether through privately negotiated repurchases of debt using cash from operations, or other types of tender offers or exchange offers or other means. We also expect that we will refinance or restructure a significant portion of this debt prior to the scheduled maturity of such debt. However, we may not be able to do so on terms favorable to us or at all. We may also be required to use cash on hand or cash from operations to meet these obligations. We believe that our cash from operations is sufficient to satisfy our liquidity needs over the next 12 months, while maintaining adequate cash and cash equivalents to fund our operations.
30
The following table summarizes our cash flows:
|
|
|
Years Ended |
|
|||||||
|
|
|
December 31, |
|
December 25, |
|
December 27, |
|
|||
|
(in thousands) |
|
2017 |
|
2016 |
|
2015 |
|
|||
|
Cash flows provided by (used in) |
|
|
|
|
|
|
|
|
|
|
|
Operating activities |
|
$ |
18,113 |
|
$ |
75,383 |
|
$ |
(122,529) |
|
|
Investing activities |
|
|
102,506 |
|
|
(9,272) |
|
|
13,840 |
|
|
Financing activities |
|
|
(26,523) |
|
|
(70,152) |
|
|
(102,840) |
|
|
Increase (decrease) in cash and cash equivalents |
|
$ |
94,096 |
|
$ |
(4,041) |
|
$ |
(211,529) |
|
Operating Activities:
We generated $18.1 million of cash from operating activities in 2017, compared to generating $75.4 million of cash in 2016. The change is partially due to the timing of income tax payments in 2017 compared to 2016. In 2017, we had net income tax payments of $12.4 million compared to $2.5 million in 2016. In addition, the change in cash generated from operating activities was due to the timing of collections of accounts receivable, which were lower by $11.5 million. The remaining changes in operating activities related to miscellaneous timing differences in various receipts and payments.
We generated $75.4 million of cash from operating activities in 2016 compared to using $122.5 million of cash from operating activities in 2015. The change is primarily due to the timing of income tax payments of $2.5 million in 2016 compared to $207.0 million in 2015. This difference was primarily related to the tax payments made in the first quarter of 2015 related to the gain on sale of a previously owned equity investment that was recorded in the fourth quarter of 2014, offset by the tax losses on bond repurchases in the fourth quarter of 2014.
Pension Plan Matters
We made no cash contributions to the Pension Plan during 2017, 2016 or 2015. In February 2016, we contributed certain of our real property appraised at $47.1 million to our Pension Plan. The contribution of real property exceeded our required pension contribution for 2016. After applying credits, which resulted from contributing more than the Pension Plan’s minimum required contribution amounts in prior years, we did not have a required cash contribution for 2017 and we do not expect to have a required pension contribution under the Employee Retirement Income Security Act in fiscal year 2018. However, we expect to have material contributions in the future.
Investing Activities:
We generated $102.5 million of cash from investing activities in 2017. We received proceeds from the sale of property, plant and equipment (“PP&E”) of $43.9 million, proceeds from the sale of our interest in equity investments of $66.9 million, and $7.3 million in distributions from our equity investments that exceeded the cumulative earnings from the investee and such amounts were considered a return of investment. These amounts were partially offset by the purchase of PP&E for $11.1 million and contributions to equity investments of $3.9 million.
We used $9.3 million of cash from investing activities in 2016, which was primarily due to the purchase of PP&E of $13.0 million.
We generated $13.8 million of cash from investing activities in 2015, which reflected the receipts associated with the sale of a former equity investment of $25.6 million from an escrow account and a final cash distribution of $7.5 million from an equity investment, offset by the purchase of PP&E of $18.6 million.
Financing Activities:
We used $26.5 million of cash from financing activities in 2017. During 2017, we retired $16.9 million principal amount of the 5.75% Notes that matured on September 1, 2017, and we repurchased or redeemed $51.8 million principal amount of our 9.00% Notes, for $70.7 million in cash. See Note 4 for further discussion. These repurchases were partially offset by the $44.0 million increase in our financial obligations as a result of the sale and leaseback of one of our real properties, as described in Recent Developments previously.
31
We used $70.2 million of cash from financing activities in 2016, primarily related to the repurchase of debt and our Class A Common Stock. During 2016, we repurchased a total of $63.6 million in aggregate principal amount of our 5.75% Notes due in 2017 and our 9.00% Notes for an aggregate of $62.3 million in cash. In addition, $8.1 million was used to repurchase our Class A Common Stock during 2016, primarily related to the repurchases of 656 thousand shares of our Class A Common Stock under our previously announced repurchase plan for $7.8 million.
We used $102.8 million of cash from financing activities in 2015 primarily related to the repurchase of our 5.75% Notes and 9.00% Notes. During 2015, we repurchased $95.2 million of aggregate principal amount of notes for $92.3 million in cash. In addition, $8.4 million was used to purchase our Class A Common Stock during 2015, primarily related to the use of $7.8 million to repurchase 615 thousand shares of our Class A Common Stock under our previously announced repurchase plan.
Off‑Balance‑Sheet Arrangements
As of December 31, 2017, we did not have any significant off‑balance sheet arrangements as defined in Item 303(a)(4)(ii) of Regulation S‑K.
Contractual Obligations:
As of the end of 2017 our contractual obligations were as follows:
|
|
|
Payments Due By Period |
|
|||||||||||||
|
|
|
|
|
|
Less than |
|
1-3 |
|
3-5 |
|
More than |
|
||||
|
(in thousands) |
|
Total |
|
1 Year |
|
Years |
|
Years |
|
5 Years |
|
|||||
|
Long-term debt principal |
|
$ |
805,048 |
|
$ |
75,000 |
|
$ |
— |
|
$ |
364,630 |
|
$ |
365,418 |
|
|
Interest on long-term debt |
|
|
446,995 |
|
|
58,934 |
|
|
116,368 |
|
|
116,368 |
|
|
155,325 |
|
|
Pension obligations (a) |
|
|
602,087 |
|
|
8,941 |
|
|
113,280 |
|
|
160,556 |
|
|
319,310 |
|
|
Post-retirement obligations (a) |
|
|
7,625 |
|
|
1,008 |
|
|
1,759 |
|
|
1,466 |
|
|
3,392 |
|
|
Workers’ compensation obligations (b) |
|
|
12,110 |
|
|
2,593 |
|
|
2,705 |
|
|
1,512 |
|
|
5,300 |
|
|
Other long-term obligations (c) |
|
|
20,652 |
|
|
3,430 |
|
|
3,959 |
|
|
1,554 |
|
|
11,709 |
|
|
Financing obligations (d) |
|
|
101,048 |
|
|
9,152 |
|
|
18,409 |
|
|
16,550 |
|
|
56,937 |
|
|
Other obligations: |
|
|
|
|
|
|
|
|
|
|
|
|
|
|
|
|
|
Purchase obligations (e) |
|
|
41,942 |
|
|
19,674 |
|
|
21,041 |
|
|
1,227 |
|
|
— |
|
|
Operating leases (f) |
|
|
92,888 |
|
|
12,763 |
|
|
21,697 |
|
|
19,022 |
|
|
39,406 |
|
|
Total (g) |
|
$ |
2,130,395 |
|
$ |
191,495 |
|
$ |
299,218 |
|
$ |
682,885 |
|
$ |
956,797 |
|
|
(a) |
Pension and Post-retirement obligations do not take into account the tax‑deductibility of the payments. |
|
(b) |
Future expected workers’ compensation payments are based on undiscounted ultimate losses and are shown net of estimated recoveries. |
|
(c) |
Primarily deferred compensation, future lease obligations and indemnification obligation reserves related to a disposed media companies. |
|
(d) |
Financing obligations include the obligations related to our contribution and leaseback of certain property to the Pension Plan in 2016 and 2011 and our sale and leaseback of our Sacramento property. |
|
(e) |
Primarily printing outsource agreements and capital expenditures for PP&E. |
|
(f) |
Excludes payments on leases included in financing obligation above. |
|
(g) |
The table excludes unrecognized tax benefits, and related penalties and interest, totaling $25.1 million because a reasonably reliable estimate of the timing of future payments, if any, cannot be determined. |
Critical Accounting Policies
This MD&A is based upon our consolidated financial statements, which have been prepared in accordance with generally accepted accounting principles in the United States. The preparation of these financial statements requires us to make estimates and judgments that affect the reported amounts of assets, liabilities, revenues and expenses, and related disclosure of contingent assets and liabilities. These estimates form the basis for making judgments about the carrying values of assets and liabilities that are not readily apparent from other sources. We base our estimates and judgments on
32
historical experience and on various other assumptions that we believe are reasonable under the circumstances. However, future events are subject to change and the best estimates and judgments routinely require adjustment. The most significant areas involving estimates and assumptions are amortization and/or impairment of goodwill and other intangibles, pension and post‑retirement expenses, and our accounting for income taxes. We believe the following critical accounting policies, in particular, affect our more significant judgments and estimates used in the preparation of our consolidated financial statements.
Goodwill:
Goodwill consists of the excess of cost of acquired enterprises over the sum of the amounts assigned to identifiable assets acquired less liabilities assumed. We assess goodwill for impairment on an annual basis at a reporting unit level, and we have identified two reporting units. One reporting unit (“West” reporting unit) consists of operations in our West and Midwest regions and the other reporting unit (“East” reporting unit) consists of operations primarily in our Carolinas and East regions. Goodwill is assessed between annual tests if an event occurs or circumstances change that would more likely than not reduce the fair value of a reporting unit below its carrying value. These events or circumstances could include a significant change in the business climate, a change in strategic direction, legal factors, operating performance indicators, a change in the competitive environment, the sale or disposition of a significant portion of a reporting unit, or future economic factors such as unfavorable changes in our stock price and market capitalization or unfavorable changes in the estimated future discounted cash flows of our reporting units. Our annual test is performed at our fiscal year end.
Application of the goodwill impairment test requires judgment, including the identification of reporting units, assignment of assets and liabilities to reporting units, assignment of goodwill to reporting units, and determination of the fair value of each reporting unit. We considered both a market approach and an income approach in order to develop an estimate of the fair value of each reporting unit for purposes of our annual impairment test. When available, and as appropriate, we use market multiples derived from a set of competitors or companies with comparable market characteristics to establish fair values for a particular reporting unit (market approach). We also estimate fair value using discounted projected cash flow analysis (income approach). Potential impairment is indicated when the carrying value of a reporting unit, including goodwill, exceeds its estimated fair value. This analysis requires significant judgments, including estimation of future cash flows, which is dependent on internal forecasts, estimation of the long‑term rate of growth for our business, estimation of the useful life over which cash flows will occur, and determination of our weighted average cost of capital. Changes in these estimates and assumptions could materially affect the determination of fair value and goodwill impairment for each reporting unit. In addition, financial and credit market volatility directly impacts our fair value measurement through our weighted average cost of capital, used to determine our discount rate, and through our stock price, used to determine our market capitalization. We may be required to recognize impairment of goodwill based on future economic factors such as unfavorable changes in our stock price and market capitalization or unfavorable changes in the estimated future discounted cash flows of our reporting units.
An impairment loss is recognized when the carrying amount of the reporting unit's net assets exceed the estimated fair value of the reporting unit. If goodwill on our consolidated balance sheet becomes impaired during a future period, the resulting impairment charge could have a material impact on our results of operations and financial condition.
Due to the economic environment in our industry and the uncertainties regarding potential future economic impacts on our reporting units, there can be no assurances that estimates and assumptions made for purposes of our annual goodwill impairment test will prove to be accurate predictions of the future. If assumptions regarding forecasted revenues or margins of certain of our reporting units are not achieved, we may be required to record goodwill impairment losses in future periods. It is not possible at this time to determine if any such future impairment loss would occur, and if it did occur, whether such charge would be material.
We performed an interim goodwill impairment testing at June 28, 2015, based on the reporting units that existed at that time. Based on that testing, the fair value of our reporting unit that primarily consisted of operations in California, the Northwest and Texas, exceeded the carrying value and we did not incur any goodwill impairment for that reporting unit. The reporting unit that primarily consisted of operations in the Southeast, Florida and the Midwest, recorded an impairment charge of $290.9 million during the quarter and six months ended June 28, 2015, as described. No additional impairment was recorded during 2015 and no goodwill impairments were recorded in 2016 or 2017.
Based on our annual impairment testing analysis, at December 31, 2017, the fair value of our West reporting unit exceeded the carrying value by approximately 13.1%, and the fair value of the East reporting unit exceeded the carrying value by approximately 33.5%. Assumptions, including projected revenues, are highly subjective and sensitive to industry and our performance.
33
Mastheads:
Newspaper mastheads (newspaper titles and website domain names) are not subject to amortization and are tested for impairment annually, at year‑end, or more frequently if events or changes in circumstances indicate that the asset might be impaired. The impairment test consists of a comparison of the fair value of each newspaper masthead with its carrying amount. We use a relief-from-royalty approach that utilizes the discounted cash flow model discussed above, to determine the fair value of each newspaper masthead. Our judgments and estimates of future operating results in determining the reporting unit fair values are consistently applied to each newspaper in determining the fair value of each newspaper masthead.
We performed our year-end masthead impairment tests in 2016, and interim and annual tests were performed in 2015 and 2017. As a result of our testing, we recorded total impairment charges of $21.5 million, $9.2 million and $13.9 million in 2017, 2016 and 2015, respectively.
Other Intangible Assets:
Long‑lived assets such as other intangible assets subject to amortization (primarily advertiser and subscriber lists) are tested for recoverability whenever events or changes in circumstances indicate that their carrying amounts may not be recoverable. The carrying amount of each asset group is not recoverable if it exceeds the sum of the undiscounted cash flows expected to result from the use of such asset group. No impairment loss was recognized on intangible assets subject to amortization in 2017, 2016 or 2015.
Pension and Post‑Retirement Benefits:
We have significant pension and post‑retirement benefit costs and credits that are developed from actuarial valuations. Inherent in these valuations are key assumptions including discount rates and expected returns on plan assets. We are required to consider current market conditions, including changes in interest rates, in establishing these assumptions. Changes in the related pension and post‑retirement benefit costs or credits may occur in the future because of changes resulting from fluctuations in our employee headcount and/or changes in the various assumptions.
Current standards of accounting for defined benefit pension plans and post‑retirement benefit plans require recognition of (1) the funded status of a pension plan (difference between the plan assets at fair value and the projected benefit obligation) and (2) the funded status of a post‑retirement plan (difference between the plan assets at fair value and the accumulated benefit obligation), as an asset or liability on the balance sheet. At December 31, 2017 and December 25, 2016, we had a total pension and post-retirement obligation of $602.1 million and $606.5 million, respectively.
We maintain a qualified defined benefit pension plan (“Pension Plan”), which covers certain eligible employees. Benefits are based on years of service that continue to count toward early retirement calculations and vesting previously earned. No new participants may enter the Pension Plan and no further benefits will accrue. For our Pension Plan, the net retirement obligations in excess of the retirement plan assets were $476.7 million and $487.4 million as of December 31, 2017, and December 25, 2016, respectively. We used a discount rate of 4.53% and an assumed long‑term return on assets of 7.75% to calculate our retirement plan expenses in 2017.
We also have a limited number of supplemental and post-retirement plans to provide certain key employees and retirees with additional retirement benefits. These plans are funded on a pay‑as‑you‑go basis. For these non‑qualified plans that do not have assets, the post-retirement obligations were $125.4 million and $119.1 million as of December 31, 2017, and December 25, 2016, respectively. We used discount rates of 4.13% to 4.50% to calculate our retirement plan expenses in 2017.
For 2017, for the Pension Plan and the non-qualified post-retirement plans combined, a change in the weighted average rates would have had the following impact on our net benefit cost:
|
· |
A decrease of 50 basis points in the long‑term rate of return would have increased our net benefit cost by approximately $6.7 million; and |
|
· |
A decrease of 25 basis points in the discount rate would not have a material effect on our net benefit cost. |
34
Income Taxes:
Our current and deferred income tax provisions are calculated based on estimates and assumptions that could differ from the actual results reflected in income tax returns filed during the subsequent year. These estimates are reviewed and adjusted, if needed, throughout the year. Adjustments between our estimates and the actual results of filed returns are recorded when identified.
The amount of income taxes paid is subject to periodic audits by federal and state taxing authorities, which may result in proposed assessments. These audits may challenge certain aspects of our tax positions such as the timing and amount of deductions and allocation of taxable income to the various tax jurisdictions. Income tax contingencies require significant judgment in estimating final outcomes. Actual results could materially differ from these estimates and could significantly affect the effective tax rate and cash flows in future periods.
We account for income taxes using the liability method. Under this method, deferred tax assets and liabilities are determined based on differences between the financial reporting and tax bases of assets and liabilities and are measured using the enacted tax rates and laws that are expected to be in effect when the differences are expected to reverse.
As of December 31, 2017, we have not completed our accounting for the tax effects of enactment of the Tax Act; however, we have made a reasonable estimate of the effects on our existing deferred tax balances. We re-measured certain deferred tax assets and liabilities based on the rates at which they are expected to reverse in the future. We are still analyzing certain aspects of the Tax Act, including the impact of the limitations on certain employee compensation, the deductibility of certain purchases of fixed assets, and the allowance of an indefinite carryforward period of net operating losses, which could potentially affect the measurement of these balances or potentially give rise to new deferred tax amounts. The provisional amount recorded related to the re-measurement of our net deferred tax balance using the new federal tax rate was a benefit of $5.5 million.
The timing of recording or releasing a valuation allowance requires significant judgment. A valuation allowance is required when it is more-likely-than-not that all or a portion of deferred tax assets may not be realized. Establishment and removal of a valuation allowance requires us to consider all positive and negative evidence and to make a judgmental decision regarding the timing and amount of valuation allowance required as of a reporting date. The assessment takes into account expectations of future taxable income or loss, available tax planning strategies and the reversal of temporary differences. The development of these expectations involves the use of estimates such as operating profitability. The weight given to the evidence is commensurate with the extent to which it can be objectively verified.
We performed an assessment of the deferred tax assets during the third and fourth quarters of 2017, weighing the positive and negative evidence as outlined in ASC 740, Income Taxes. As we have incurred three years of cumulative pre-tax losses, such objective negative evidence limits our ability to give significant weight to other positive subjective evidence, such as projections for future growth and profitability. Accordingly, we recorded a valuation allowance charge of $192.3 million for 2017, which was recorded in income tax (benefit) expense on our consolidated statements of operations. During the quarter ended December 31, 2017, as a result of the Tax Act, principally the change to allow an indefinite carryforward period of net operating losses, we reassessed our analysis and decreased our related valuation allowance by $53.6 million. As of December 31, 2017, our valuation allowance against a majority of our net deferred tax assets was $109.7 million. As a result of these adjustments in 2017, our effective tax rate for 2017 is not comparable to the effective tax rate for 2016.
We will continue to maintain a valuation allowance against our deferred tax assets until we believe it is more-likely-than-not that these assets will be realized in the future. If sufficient positive evidence, such as three-year cumulative pre-tax income, arises in the future that provides an indication that all or a portion of the deferred tax assets meet the more-likely-than-not standard, the valuation allowance may be reversed, in whole or in part, in the period that such determination is made.
Recent Accounting Pronouncements
For information regarding the impact of certain recent accounting pronouncements, see Note 1.
35
ITEM 7A. QUANTITATIVE AND QUALITATIVE DISCLOSURES ABOUT MARKET RISK
The primary objective of the following information is to provide forward‑looking quantitative and qualitative information about our potential exposure to market risks. The term “market risk” refers to the risk of loss arising from adverse changes in interest rates and credit risk. The disclosure is not meant to be a precise indicator of expected future losses but rather an indicator of reasonably possible losses. Our exposure to market risk primarily relates to discount rates used in our pension liabilities.
Interest Rate Risks in Our Debt Obligations
Substantially all of our outstanding debt is composed of fixed‑rate bonds and, therefore, is not subject to interest rate fluctuations.
Discount Rate Risks in Our Pension and Post‑Retirement Obligations
The discount rate used to measure our obligations under our qualified defined benefit pension plan is generally based upon long‑term interest rates on highly‑rated corporate bonds. Hence, changes in long‑term interest rates may have a significant impact on the funding position of our qualified defined pension plan. We estimate that a 1.0% increase in our discount rate could decrease our pension obligations by approximately $218 million. Conversely, a 1.0% decrease in our discount rate could increase our pension obligations by approximately $264 million. Based on current interest rates, the amount of contributions due to the plan and the timing of the payments of these obligations are included in the table of contractual obligations above and reflect actuarial estimates we believe to be reasonable.
36
37
REPORT OF INDEPENDENT REGISTERED PUBLIC ACCOUNTING FIRM
To the Stockholders and Board of Directors of The McClatchy Company:
Opinions on the Financial Statements and Internal Control over Financial Reporting
We have audited the accompanying consolidated balance sheets of The McClatchy Company and subsidiaries (the “Company”) as of December 31, 2017 and December 25, 2016, and the related consolidated statements of operations, comprehensive income (loss), stockholders' equity, and cash flows for each of the three years in the period ended December 31, 2017, and the related notes (collectively referred to as the "financial statements"). We also have audited the Company’s internal control over financial reporting as of December 31, 2017, based on criteria established in Internal Control — Integrated Framework (2013) issued by the Committee of Sponsoring Organizations of the Treadway Commission (COSO).
In our opinion, the financial statements referred to above present fairly, in all material respects, the financial position of the Company as of December 31, 2017 and December 25, 2016, and the results of its operations and its cash flows for each of the three years in the period ended December 31, 2017, in conformity with accounting principles generally accepted in the United States of America. Also, in our opinion, the Company maintained, in all material respects, effective internal control over financial reporting as of December 31, 2017, based on criteria established in Internal Control — Integrated Framework (2013) issued by COSO.
Basis for Opinions
The Company’s management is responsible for these financial statements, for maintaining effective internal control over financial reporting, and for its assessment of the effectiveness of internal control over financial reporting, included in the accompanying “Management Report on Internal Control over Financial Reporting.” Our responsibility is to express an opinion on these financial statements and an opinion on the Company’s internal control over financial reporting based on our audits. We are a public accounting firm registered with the Public Company Accounting Oversight Board (United States) (PCAOB) and are required to be independent with respect to the Company in accordance with the U.S. federal securities laws and the applicable rules and regulations of the Securities and Exchange Commission and the PCAOB.
We conducted our audits in accordance with the standards of the PCAOB. Those standards require that we plan and perform the audits to obtain reasonable assurance about whether the financial statements are free of material misstatement, whether due to error or fraud, and whether effective internal control over financial reporting was maintained in all material respects.
Our audits of the financial statements included performing procedures to assess the risks of material misstatement of the financial statements, whether due to error or fraud, and performing procedures to respond to those risks. Such procedures included examining, on a test basis, evidence regarding the amounts and disclosures in the financial statements. Our audits also included evaluating the accounting principles used and significant estimates made by management, as well as evaluating the overall presentation of the financial statements. Our audit of internal control over financial reporting included obtaining an understanding of internal control over financial reporting, assessing the risk that a material weakness exists, and testing and evaluating the design and operating effectiveness of internal control based on the assessed risk. Our audits also included performing such other procedures as we considered necessary in the circumstances. We believe that our audits provide a reasonable basis for our opinions.
Definition and Limitations of Internal Control over Financial Reporting
A company’s internal control over financial reporting is a process designed to provide reasonable assurance regarding the reliability of financial reporting and the preparation of financial statements for external purposes in accordance with generally accepted accounting principles. A company’s internal control over financial reporting includes those policies and procedures that (1) pertain to the maintenance of records that, in reasonable detail, accurately and fairly reflect the transactions and dispositions of the assets of the company; (2) provide reasonable assurance that transactions are recorded as necessary to permit preparation of financial statements in accordance with generally accepted accounting principles, and that receipts and expenditures of the company are being made only in accordance with authorizations of management and directors of the company; and (3) provide reasonable assurance regarding prevention or timely detection of unauthorized acquisition, use, or disposition of the company’s assets that could have a material effect on the financial statements.
38
Because of its inherent limitations, internal control over financial reporting may not prevent or detect misstatements. Also, projections of any evaluation of effectiveness to future periods are subject to the risk that controls may become inadequate because of changes in conditions, or that the degree of compliance with the policies or procedures may deteriorate.
/s/ Deloitte & Touche LLP
Sacramento, California
March 12, 2018
We have served as the Company’s auditor since at least 1984; however, the specific year has not been determined.
39
THE MCCLATCHY COMPANY
CONSOLIDATED STATEMENTS OF OPERATIONS
(Amounts in thousands, except per share amounts)
|
|
|
Years Ended |
|||||||
|
|
|
December 31, |
|
December 25, |
|
December 27, |
|||
|
|
|
2017 |
|
2016 |
|
2015 |
|||
|
|
|
(53 weeks) |
|
(52 weeks) |
|
(52 weeks) |
|||
|
REVENUES — NET: |
|
|
|
|
|
|
|
|
|
|
Advertising |
|
$ |
498,639 |
|
$ |
568,735 |
|
$ |
637,415 |
|
Audience |
|
|
363,497 |
|
|
364,830 |
|
|
367,858 |
|
Other |
|
|
41,456 |
|
|
43,528 |
|
|
51,301 |
|
|
|
|
903,592 |
|
|
977,093 |
|
|
1,056,574 |
|
OPERATING EXPENSES: |
|
|
|
|
|
|
|
|
|
|
Compensation |
|
|
338,588 |
|
|
368,897 |
|
|
385,478 |
|
Newsprint, supplements and printing expenses |
|
|
66,438 |
|
|
78,893 |
|
|
95,674 |
|
Depreciation and amortization |
|
|
80,129 |
|
|
89,446 |
|
|
101,595 |
|
Other operating expenses |
|
|
352,830 |
|
|
393,015 |
|
|
404,347 |
|
Other asset write-downs (see Notes 1 and 2) |
|
|
23,442 |
|
|
9,526 |
|
|
304,848 |
|
|
|
|
861,427 |
|
|
939,777 |
|
|
1,291,942 |
|
|
|
|
|
|
|
|
|
|
|
|
OPERATING INCOME (LOSS) |
|
|
42,165 |
|
|
37,316 |
|
|
(235,368) |
|
|
|
|
|
|
|
|
|
|
|
|
NON-OPERATING INCOME (EXPENSE): |
|
|
|
|
|
|
|
|
|
|
Interest expense |
|
|
(81,501) |
|
|
(83,168) |
|
|
(85,973) |
|
Interest income |
|
|
558 |
|
|
463 |
|
|
331 |
|
Equity income (loss) in unconsolidated companies, net |
|
|
(1,698) |
|
|
13,384 |
|
|
10,086 |
|
Impairments related to equity investments, net |
|
|
(170,007) |
|
|
(892) |
|
|
— |
|
Gains related to equity investments |
|
|
— |
|
|
— |
|
|
8,061 |
|
Gain (loss) on extinguishment of debt, net |
|
|
(2,700) |
|
|
431 |
|
|
1,167 |
|
Retirement benefit expense |
|
|
(13,404) |
|
|
(14,776) |
|
|
(9,971) |
|
Other — net |
|
|
(312) |
|
|
(16) |
|
|
(292) |
|
|
|
|
(269,064) |
|
|
(84,574) |
|
|
(76,591) |
|
|
|
|
|
|
|
|
|
|
|
|
Loss before income taxes |
|
|
(226,899) |
|
|
(47,258) |
|
|
(311,959) |
|
Income tax (benefit) expense (see Note 1) |
|
|
105,459 |
|
|
(13,065) |
|
|
(11,797) |
|
NET LOSS |
|
$ |
(332,358) |
|
$ |
(34,193) |
|
$ |
(300,162) |
|
|
|
|
|
|
|
|
|
|
|
|
Net loss per common share: |
|
|
|
|
|
|
|
|
|
|
Basic |
|
$ |
(43.55) |
|
$ |
(4.41) |
|
$ |
(34.66) |
|
Diluted |
|
$ |
(43.55) |
|
$ |
(4.41) |
|
$ |
(34.66) |
|
|
|
|
|
|
|
|
|
|
|
|
Weighted average number of common shares: |
|
|
|
|
|
|
|
|
|
|
Basic |
|
|
7,632 |
|
|
7,750 |
|
|
8,659 |
|
Diluted |
|
|
7,632 |
|
|
7,750 |
|
|
8,659 |
See notes to consolidated financial statements.
40
THE MCCLATCHY COMPANY
CONSOLIDATED STATEMENTS OF COMPREHENSIVE LOSS
(Amounts in thousands)
|
|
|
Years Ended |
|
|||||||
|
|
|
December 31, |
|
December 25, |
|
December 27, |
|
|||
|
|
|
2017 |
|
2016 |
|
2015 |
|
|||
|
|
|
(53 weeks) |
|
(52 weeks) |
|
(52 weeks) |
|
|||
|
NET LOSS |
|
$ |
(332,358) |
|
$ |
(34,193) |
|
$ |
(300,162) |
|
|
OTHER COMPREHENSIVE INCOME (LOSS): |
|
|
|
|
|
|
|
|
|
|
|
Pension and post retirement plans: (1) |
|
|
|
|
|
|
|
|
|
|
|
Change in pension and post-retirement benefit plans, net of taxes of $0, $25,700 and $2,936 |
|
|
8,100 |
|
|
(38,550) |
|
|
(4,404) |
|
|
Investment in unconsolidated companies: |
|
|
|
|
|
|
|
|
|
|
|
Other comprehensive income (loss), net of taxes of ($2,697), $772 and $534 |
|
|
4,046 |
|
|
(1,157) |
|
|
(801) |
|
|
Other comprehensive income (loss) |
|
|
12,146 |
|
|
(39,707) |
|
|
(5,205) |
|
|
Comprehensive loss |
|
$ |
(320,212) |
|
$ |
(73,900) |
|
$ |
(305,367) |
|
_____________________
|
(1) |
There is no income tax benefit associated with the year ended December 31, 2017, due to the recognition of a valuation allowance. |
See notes to consolidated financial statements.
41
THE MCCLATCHY COMPANY
(Amounts in thousands, except share and per share amounts)
|
|
|
December 31, |
|
December 25, |
|
||
|
|
|
2017 |
|
2016 |
|
||
|
ASSETS |
|
|
|
|
|
|
|
|
Current assets: |
|
|
|
|
|
|
|
|
Cash and cash equivalents |
|
$ |
99,387 |
|
$ |
5,291 |
|
|
Trade receivables (net of allowances of $3,225 and $3,254 ) |
|
|
101,081 |
|
|
112,583 |
|
|
Other receivables |
|
|
11,556 |
|
|
11,883 |
|
|
Newsprint, ink and other inventories |
|
|
7,918 |
|
|
13,939 |
|
|
Assets held for sale |
|
|
6,332 |
|
|
9,040 |
|
|
Other current assets |
|
|
19,000 |
|
|
14,809 |
|
|
|
|
|
245,274 |
|
|
167,545 |
|
|
|
|
|
|
|
|
|
|
|
Property, plant and equipment, net |
|
|
257,639 |
|
|
297,506 |
|
|
Intangible assets: |
|
|
|
|
|
|
|
|
Identifiable intangibles — net |
|
|
228,222 |
|
|
298,986 |
|
|
Goodwill |
|
|
705,174 |
|
|
705,174 |
|
|
|
|
|
933,396 |
|
|
1,004,160 |
|
|
Investments and other assets: |
|
|
|
|
|
|
|
|
Investments in unconsolidated companies |
|
|
7,172 |
|
|
242,382 |
|
|
Deferred income taxes |
|
|
— |
|
|
60,821 |
|
|
Other assets |
|
|
62,437 |
|
|
64,340 |
|
|
|
|
|
69,609 |
|
|
367,543 |
|
|
|
|
$ |
1,505,918 |
|
$ |
1,836,754 |
|
|
LIABILITIES AND STOCKHOLDERS’ EQUITY (DEFICIT) |
|
|
|
|
|
|
|
|
Current liabilities: |
|
|
|
|
|
|
|
|
Current portion of long-term debt |
|
$ |
74,140 |
|
$ |
16,749 |
|
|
Accounts payable |
|
|
31,856 |
|
|
36,822 |
|
|
Accrued pension liabilities |
|
|
8,941 |
|
|
8,647 |
|
|
Accrued compensation |
|
|
24,050 |
|
|
25,577 |
|
|
Income taxes payable |
|
|
10,133 |
|
|
7,930 |
|
|
Unearned revenue |
|
|
60,436 |
|
|
64,728 |
|
|
Accrued interest |
|
|
7,954 |
|
|
8,602 |
|
|
Other accrued liabilities |
|
|
18,832 |
|
|
20,994 |
|
|
|
|
|
236,342 |
|
|
190,049 |
|
|
Non-current liabilities: |
|
|
|
|
|
|
|
|
Long-term debt |
|
|
707,252 |
|
|
829,415 |
|
|
Deferred income taxes |
|
|
28,062 |
|
|
— |
|
|
Pension and postretirement obligations |
|
|
599,763 |
|
|
604,165 |
|
|
Financing obligations |
|
|
91,905 |
|
|
51,616 |
|
|
Other long-term obligations |
|
|
46,926 |
|
|
47,596 |
|
|
|
|
|
1,473,908 |
|
|
1,532,792 |
|
|
Commitments and contingencies |
|
|
|
|
|
|
|
|
|
|
|
|
|
|
|
|
|
Stockholders’ equity (deficit): |
|
|
|
|
|
|
|
|
Common stock $.01 par value: |
|
|
|
|
|
|
|
|
Class A (authorized 200,000,000 shares, issued 5,256,325 shares and 5,132,417 shares) |
|
|
52 |
|
|
51 |
|
|
Class B (authorized 60,000,000 shares, issued 2,443,191 shares and 2,443,191 shares) |
|
|
24 |
|
|
24 |
|
|
Additional paid-in-capital |
|
|
2,215,109 |
|
|
2,213,098 |
|
|
Accumulated deficit |
|
|
(1,970,097) |
|
|
(1,637,739) |
|
|
Treasury stock at cost, 3,157 shares and 34 shares |
|
|
(51) |
|
|
(6) |
|
|
Accumulated other comprehensive loss |
|
|
(449,369) |
|
|
(461,515) |
|
|
|
|
|
(204,332) |
|
|
113,913 |
|
|
|
|
$ |
1,505,918 |
|
$ |
1,836,754 |
|
See notes to consolidated financial statements.
42
THE MCCLATCHY COMPANY
CONSOLIDATED STATEMENTS OF CASH FLOWS
(Amounts in thousands)
|
|
|
Years Ended |
|||||||
|
|
|
December 31, |
|
December 25, |
|
December 27, |
|||
|
|
|
2017 |
|
2016 |
|
2015 |
|||
|
CASH FLOWS FROM OPERATING ACTIVITIES: |
|
|
|
|
|
|
|
|
|
|
Net loss |
|
$ |
(332,358) |
|
$ |
(34,193) |
|
$ |
(300,162) |
|
|
|
|
|
|
|
|
|
|
|
|
Reconciliation to net cash provided by (used in) operating activities: |
|
|
|
|
|
|
|
|
|
|
Depreciation and amortization |
|
|
80,129 |
|
|
89,446 |
|
|
101,595 |
|
(Gain) loss on disposal of property and equipment (excluding other asset write-downs) |
|
|
(23,590) |
|
|
(5,844) |
|
|
347 |
|
Retirement benefit expense |
|
|
13,404 |
|
|
14,776 |
|
|
9,971 |
|
Stock-based compensation expense |
|
|
2,475 |
|
|
3,130 |
|
|
3,178 |
|
Deferred income taxes |
|
|
86,400 |
|
|
(33,275) |
|
|
(23,087) |
|
Equity (income) loss in unconsolidated companies |
|
|
1,698 |
|
|
(13,384) |
|
|
(10,086) |
|
Impairments related to equity investments, net |
|
|
170,007 |
|
|
892 |
|
|
— |
|
Gains related to equity investments |
|
|
— |
|
|
— |
|
|
(8,061) |
|
Distributions of income from equity investments |
|
|
— |
|
|
6,000 |
|
|
7,500 |
|
(Gain) loss on extinguishment of debt, net |
|
|
2,700 |
|
|
(431) |
|
|
(1,167) |
|
Other asset write-downs |
|
|
23,442 |
|
|
9,526 |
|
|
304,848 |
|
Other |
|
|
(6,225) |
|
|
(6,141) |
|
|
(5,501) |
|
Changes in certain assets and liabilities: |
|
|
|
|
|
|
|
|
|
|
Trade receivables |
|
|
11,502 |
|
|
26,057 |
|
|
6,412 |
|
Inventories |
|
|
4,064 |
|
|
2,720 |
|
|
2,832 |
|
Other assets |
|
|
(1,615) |
|
|
2,744 |
|
|
(7,707) |
|
Accounts payable |
|
|
(4,966) |
|
|
(4,964) |
|
|
(7,344) |
|
Accrued compensation |
|
|
(1,472) |
|
|
(3,600) |
|
|
(3,529) |
|
Income taxes |
|
|
2,211 |
|
|
11,872 |
|
|
(190,581) |
|
Accrued interest |
|
|
(648) |
|
|
(821) |
|
|
(1,169) |
|
Other liabilities |
|
|
(9,045) |
|
|
10,873 |
|
|
(818) |
|
Net cash provided by (used in) operating activities |
|
|
18,113 |
|
|
75,383 |
|
|
(122,529) |
|
|
|
|
|
|
|
|
|
|
|
|
CASH FLOWS FROM INVESTING ACTIVITIES: |
|
|
|
|
|
|
|
|
|
|
Purchases of property, plant and equipment |
|
|
(11,114) |
|
|
(13,019) |
|
|
(18,605) |
|
Proceeds from sale of property, plant and equipment and other |
|
|
43,944 |
|
|
9,241 |
|
|
414 |
|
Purchase of certificates of deposit |
|
|
(4,040) |
|
|
— |
|
|
— |
|
Proceeds from redemption of certificates of deposit |
|
|
3,433 |
|
|
2,323 |
|
|
— |
|
Distributions from equity investments |
|
|
7,318 |
|
|
— |
|
|
7,428 |
|
Contributions to cost and equity investments |
|
|
(3,937) |
|
|
(3,817) |
|
|
(1,583) |
|
Proceeds from sale of equity investments and other-net |
|
|
66,913 |
|
|
— |
|
|
25,553 |
|
Other-net |
|
|
(11) |
|
|
(4,000) |
|
|
633 |
|
Net cash provided by (used in) investing activities |
|
|
102,506 |
|
|
(9,272) |
|
|
13,840 |
|
|
|
|
|
|
|
|
|
|
|
|
CASH FLOWS FROM FINANCING ACTIVITIES: |
|
|
|
|
|
|
|
|
|
|
Repurchase of public notes |
|
|
(70,715) |
|
|
(62,331) |
|
|
(92,254) |
|
Proceeds from sale-leaseback financial obligations |
|
|
43,971 |
|
|
— |
|
|
— |
|
Purchase of treasury shares |
|
|
(508) |
|
|
(8,080) |
|
|
(8,434) |
|
Other |
|
|
729 |
|
|
259 |
|
|
(2,152) |
|
Net cash used in financing activities |
|
|
(26,523) |
|
|
(70,152) |
|
|
(102,840) |
|
Increase (decrease) in cash and cash equivalents |
|
|
94,096 |
|
|
(4,041) |
|
|
(211,529) |
|
Cash and cash equivalents at beginning of period |
|
|
5,291 |
|
|
9,332 |
|
|
220,861 |
|
CASH AND CASH EQUIVALENTS AT END OF PERIOD |
|
$ |
99,387 |
|
$ |
5,291 |
|
$ |
9,332 |
See notes to consolidated financial statements.
43
THE MCCLATCHY COMPANY
CONSOLIDATED STATEMENTS OF STOCKHOLDERS’ EQUITY (DEFICIT)
(Amounts in thousands, except share and per share amounts)
|
|
|
Common Stock |
|
|
|
|
|
|
|
Accumulated |
|
|
|
|
|
|
|
|||||
|
|
|
Class A |
|
Class B |
|
Additional |
|
|
|
|
Other |
|
|
|
|
|
|
|
||||
|
|
|
$.01 par |
|
$.01 par |
|
Paid-In |
|
Accumulated |
|
Comprehensive |
|
Treasury |
|
|
|
|
||||||
|
|
|
value |
|
value |
|
Capital |
|
Deficit |
|
Income (Loss) |
|
Stock |
|
Total |
|
|||||||
|
Balance at December 28, 2014 |
|
$ |
63 |
|
$ |
24 |
|
$ |
2,223,460 |
|
$ |
(1,303,384) |
|
$ |
(416,603) |
|
$ |
(175) |
|
$ |
503,385 |
|
|
Net loss |
|
|
— |
|
|
— |
|
|
— |
|
|
(300,162) |
|
|
— |
|
|
— |
|
|
(300,162) |
|
|
Other comprehensive loss |
|
|
— |
|
|
— |
|
|
— |
|
|
— |
|
|
(5,205) |
|
|
— |
|
|
(5,205) |
|
|
Conversion of 15,400 Class B shares to Class A shares |
|
|
— |
|
|
— |
|
|
— |
|
|
— |
|
|
— |
|
|
— |
|
|
— |
|
|
Issuance of 91,555 Class A shares under stock plans |
|
|
1 |
|
|
— |
|
|
— |
|
|
— |
|
|
— |
|
|
— |
|
|
1 |
|
|
Stock compensation expense |
|
|
— |
|
|
— |
|
|
3,178 |
|
|
— |
|
|
— |
|
|
— |
|
|
3,178 |
|
|
Purchase of 649,448 shares of treasury stock |
|
|
— |
|
|
— |
|
|
— |
|
|
— |
|
|
— |
|
|
(8,434) |
|
|
(8,434) |
|
|
Retirement of 488,769 shares of treasury stock |
|
|
(5) |
|
|
— |
|
|
(6,408) |
|
|
— |
|
|
— |
|
|
6,413 |
|
|
— |
|
|
Balance at December 27, 2015 |
|
|
59 |
|
|
24 |
|
|
2,220,230 |
|
|
(1,603,546) |
|
|
(421,808) |
|
|
(2,196) |
|
|
192,763 |
|
|
Net loss |
|
|
— |
|
|
— |
|
|
— |
|
|
(34,193) |
|
|
— |
|
|
— |
|
|
(34,193) |
|
|
Other comprehensive loss |
|
|
— |
|
|
— |
|
|
— |
|
|
— |
|
|
(39,707) |
|
|
— |
|
|
(39,707) |
|
|
Issuance of 102,681 Class A shares under stock plans |
|
|
1 |
|
|
— |
|
|
(1) |
|
|
— |
|
|
— |
|
|
— |
|
|
— |
|
|
Stock compensation expense |
|
|
— |
|
|
— |
|
|
3,130 |
|
|
— |
|
|
— |
|
|
— |
|
|
3,130 |
|
|
Purchase of 683,334 shares of treasury stock |
|
|
— |
|
|
— |
|
|
— |
|
|
— |
|
|
— |
|
|
(8,080) |
|
|
(8,080) |
|
|
Retirement of 848,517 shares of treasury stock |
|
|
(9) |
|
|
— |
|
|
(10,261) |
|
|
— |
|
|
— |
|
|
10,270 |
|
|
— |
|
|
Balance at December 25, 2016 |
|
|
51 |
|
|
24 |
|
|
2,213,098 |
|
|
(1,637,739) |
|
|
(461,515) |
|
|
(6) |
|
|
113,913 |
|
|
Net loss |
|
|
— |
|
|
— |
|
|
— |
|
|
(332,358) |
|
|
— |
|
|
— |
|
|
(332,358) |
|
|
Other comprehensive income |
|
|
— |
|
|
— |
|
|
— |
|
|
— |
|
|
12,146 |
|
|
— |
|
|
12,146 |
|
|
Issuance of 172,781 Class A shares under stock plans |
|
|
2 |
|
|
— |
|
|
(2) |
|
|
— |
|
|
— |
|
|
— |
|
|
— |
|
|
Stock compensation expense |
|
|
— |
|
|
— |
|
|
2,475 |
|
|
— |
|
|
— |
|
|
— |
|
|
2,475 |
|
|
Purchase of 51,996 shares of treasury stock |
|
|
— |
|
|
— |
|
|
— |
|
|
— |
|
|
— |
|
|
(508) |
|
|
(508) |
|
|
Retirement of 48,873 shares of treasury stock |
|
|
(1) |
|
|
— |
|
|
(462) |
|
|
— |
|
|
— |
|
|
463 |
|
|
— |
|
|
Balance at December 31, 2017 |
|
$ |
52 |
|
$ |
24 |
|
$ |
2,215,109 |
|
$ |
(1,970,097) |
|
$ |
(449,369) |
|
$ |
(51) |
|
$ |
(204,332) |
|
See notes to consolidated financial statements.
44
THE MCCLATCHY COMPANY
NOTES TO CONSOLIDATED FINANCIAL STATEMENTS
YEARS ENDED DECEMBER 31, 2017, DECEMBER 25, 2016, AND DECEMBER 27, 2015
1. SIGNIFICANT ACCOUNTING POLICIES
The McClatchy Company (the “Company,” “we,” “us” or “our”) operates 30 media companies in 14 states, providing each of its communities with high-quality news and advertising services in a wide array of digital and print formats. We are a publisher of brands such as the Miami Herald, The Kansas City Star, The Sacramento Bee, The Charlotte Observer, The (Raleigh) News & Observer, and the (Fort Worth) Star-Telegram. We are headquartered in Sacramento, California, and our Class A Common Stock is listed on the NYSE American under the symbol MNI.
On July 31, 2017, we sold a majority of our interest in CareerBuilder LLC (“CareerBuilder”), which reduced our ownership interest in CareerBuilder from 15.0% to approximately 3.0%.
Our fiscal year ends on the last Sunday in December. Fiscal year December 31, 2017, consisted of a 53-week period. Fiscal years ended December 25, 2016, and December 27, 2015, consisted of 52-week periods.
Preparation of the financial statements in conformity with accounting principles generally accepted in the United States and pursuant to the rules and regulation of the Securities and Exchange Commission (“SEC”) requires management to make estimates and assumptions that affect the reported amounts of assets and liabilities at the date of the financial statements and the reported amounts of revenues and expenses during the reporting period. Actual results could differ materially from those estimates. The consolidated financial statements include the Company and our subsidiaries. Intercompany items and transactions are eliminated.
Reclassifications
Certain prior year amounts have been reclassified to conform to the current year presentation in our consolidated financial statements related to the early retrospective adoption of Accounting Standards Update (“ASU”) No. 2017-07 relating to the classification of net periodic pension expense, as described below. In accordance with the early adoption of ASU No. 2017-07 for 2016 and 2015, we reclassified net periodic pension and postretirement costs of $14.8 million and $10.0 million, respectively, from the compensation line item in operating expenses to the retirement benefit expense line item in non-operating income (expense) on the consolidated statements of operations.
Revenue recognition
We recognize revenues (i) from advertising placed in a newspaper, on a website and/or a mobile service over the advertising contract period or as services are delivered, as appropriate; (ii) from the sale of certain third party digital advertising products and services on a net basis, with wholesale fees reported as a reduction of the associated revenues; and (iii) for audience subscriptions as newspapers and access to online sites are delivered over the applicable subscription term. Print audience revenues are recorded net of direct delivery costs for contracts that are not on a “fee-for-service” arrangement. Print audience revenues on our “fee-for-service” contracts are recorded on a gross basis and associated delivery costs are recorded as other operating expenses.
We enter into certain revenue transactions, primarily related to advertising contracts and circulation subscriptions that are considered multiple element arrangements (arrangements with more than one deliverable). As such we must: (i) determine whether and when each element has been delivered; (ii) determine fair value of each element using the selling price hierarchy of vendor‑specific objective evidence of fair value, third party evidence or best estimated selling price, as applicable and (iii) allocate the total price among the various elements based on the relative selling price method.
Other revenues are recognized when the related product or service has been delivered. Revenues are recorded net of estimated incentives, including special pricing agreements, promotions and other volume‑based incentives and net of sales tax collected from the customer. Revisions to these estimates are charged to revenues in the period in which the facts that give rise to the revision become known.
45
THE MCCLATCHY COMPANY
NOTES TO CONSOLIDATED FINANCIAL STATEMENTS
YEARS ENDED DECEMBER 31, 2017, DECEMBER 25, 2016, AND DECEMBER 27, 2015
Concentrations of credit risks
Financial instruments, which potentially subject us to concentrations of credit risks, are principally cash and cash equivalents and trade accounts receivables. Cash and cash equivalents are placed with major financial institutions. As of December 31, 2017, substantially all of our cash and cash equivalents are in excess of the FDIC insured limits. We have not experienced any losses related to amounts in excess of FDIC limits. We routinely assess the financial strength of significant customers and this assessment, combined with the large number and geographic diversity of our customers, limits our concentration of risk with respect to trade accounts receivable.
Allowance for doubtful accounts
We maintain an allowance account for estimated losses resulting from the risk that our customers will not make required payments. At certain of our media companies we establish our allowances based on collection experience, aging of our receivables and significant individual account credit risk. At the remaining media companies we use the aging of accounts receivable, reserving for all accounts due 90 days or longer, to establish allowances for losses on accounts receivable; however, if we become aware that the financial condition of specific customers has deteriorated, additional allowances are provided.
We provide an allowance for doubtful accounts as follows:
|
|
|
Years Ended |
|
|||||||
|
|
|
December 31, |
|
December 25, |
|
December 27, |
|
|||
|
(in thousands) |
|
2017 |
|
2016 |
|
2015 |
|
|||
|
Balance at beginning of year |
|
$ |
3,254 |
|
$ |
4,451 |
|
$ |
5,900 |
|
|
Charged to costs and expenses |
|
|
10,870 |
|
|
10,137 |
|
|
8,181 |
|
|
Amounts written off |
|
|
(10,899) |
|
|
(11,334) |
|
|
(9,630) |
|
|
Balance at end of year |
|
$ |
3,225 |
|
$ |
3,254 |
|
$ |
4,451 |
|
Newsprint, ink and other inventories
Newsprint, ink and other inventories are stated at the lower of cost (based principally on the first‑in, first‑out method) and net realizable value. During 2017, we recorded a $2.0 million write‑down of non-newsprint inventory, which is reflected in the other asset write-downs line on our consolidated statement of operations.
Property, plant and equipment
Property, plant and equipment (“PP&E”) are recorded at cost. Additions and substantial improvements, as well as interest expense incurred during construction, are capitalized. Capitalized interest was not material in 2017, 2016 or 2015. Expenditures for maintenance and repairs are charged to expense as incurred. When PP&E is sold or retired, the asset and related accumulated depreciation are removed from the accounts and the associated gain or loss is recognized.
Property, plant and equipment consisted of the following:
|
|
|
December 31, |
|
December 25, |
|
Estimated |
|
|||||
|
(in thousands) |
|
2017 |
|
2016 |
|
Useful Lives |
|
|||||
|
Land |
|
$ |
36,491 |
|
$ |
50,844 |
|
|
|
|
|
|
|
Building and improvements |
|
|
289,574 |
|
|
314,018 |
|
5 |
- |
60 |
years |
|
|
Equipment |
|
|
555,204 |
|
|
594,005 |
|
2 |
- |
25 |
years |
(1) |
|
Construction in process |
|
|
2,696 |
|
|
1,489 |
|
|
|
|
|
|
|
|
|
|
883,965 |
|
|
960,356 |
|
|
|
|
|
|
|
Less accumulated depreciation |
|
|
(626,326) |
|
|
(662,850) |
|
|
|
|
|
|
|
Property, plant and equipment, net |
|
$ |
257,639 |
|
$ |
297,506 |
|
|
|
|
|
|
|
(1) |
Presses are 9 - 25 years and other equipment is 2 - 15 years |
46
THE MCCLATCHY COMPANY
NOTES TO CONSOLIDATED FINANCIAL STATEMENTS
YEARS ENDED DECEMBER 31, 2017, DECEMBER 25, 2016, AND DECEMBER 27, 2015
We record depreciation using the straight‑line method over estimated useful lives. The useful lives are estimated at the time the assets are acquired and are based on historical experience with similar assets and anticipated technological changes. Our depreciation expense was $30.8 million, $41.5 million and $53.2 million in 2017, 2016 and 2015, respectively.
During 2017, 2016 and 2015, we incurred $0.3 million, $7.0 million and $10.3 million, respectively, in accelerated depreciation related to the production equipment no longer needed as a result of either outsourcing our printing process at certain of our media companies or replacing an old printing press at one of our media companies.
We review the carrying amount of long‑lived assets for impairment whenever events or changes in circumstances indicate that the carrying amount of an asset may not be recoverable. Events that result in an impairment review include the decision to close a location or a significant decrease in the operating performance of the long‑lived asset. Long‑lived assets are considered impaired if the estimated undiscounted future cash flows of the asset or asset group are less than the carrying amount. For impaired assets, we recognize a loss equal to the difference between the carrying amount of the asset or asset group and its estimated fair value, which is recorded in operating expenses in the consolidated statements of operations. The estimated fair value of the asset or asset group is based on the discounted future cash flows of the asset or asset group. The asset group is defined as the lowest level for which identifiable cash flows are available.
Assets held for sale
Assets held for sale includes land and buildings at four of our media companies that we began to actively market for sale during 2017. No impairment charges were incurred during 2017 as a result of classifying these assets into assets held for sale.
Investments in unconsolidated companies
We have accounted for non-marketable equity investments either under the equity or cost method. Investments through which we exercise significant influence but do not have control over the investee are accounted for under the equity method. Investments through which we are not able to exercise significant influence over the investee are accounted for under the cost method. See Note 2 for discussion of investments in unconsolidated companies.
Financial obligations
Financial obligations consists of contributions of real properties to the Pension Plan in 2016 and 2011 (see Note 6), and real property previously owned by The Sacramento Bee that was sold and leased back during the third quarter of 2017.
Segment reporting
We operate 30 media companies, providing each of our communities with high-quality news and advertising services in a wide array of digital and print formats. We have two operating segments that we aggregate into a single reportable segment because each has similar economic characteristics, products, customers and distribution methods. Our operating segments are based on how our chief executive officer, who is also our Chief Operating Decision Maker (“CODM”), makes decisions about allocating resources and assessing performance. The CODM is provided discrete financial information for the two operating segments. Each operating segment consists of a group of media companies and both operating segments report to the same segment manager. One of our operating segments (“Western Segment”) consists of our media companies operations in the West and Midwest, while the other operating segment (“Eastern Segment”) consists primarily of media company operations in the Carolinas and East.
Goodwill and intangible impairment
We test for impairment of goodwill annually, at year‑end, or whenever events occur or circumstances change that would more likely than not reduce the fair value of a reporting unit below its carrying amount. The required approach uses accounting judgments and estimates of future operating results. Changes in estimates or the application of alternative assumptions could produce significantly different results. Impairment testing is done at a reporting unit level. We perform this testing on operating segments, which are also considered our reporting units. An impairment loss is recognized when the carrying amount of the reporting unit’s net assets exceeds the estimated fair value of the reporting unit. The fair value of our reporting units is determined using a combination of a discounted cash flow model and market based approaches. The estimates and judgments that most significantly affect the fair value calculation are assumptions
47
THE MCCLATCHY COMPANY
NOTES TO CONSOLIDATED FINANCIAL STATEMENTS
YEARS ENDED DECEMBER 31, 2017, DECEMBER 25, 2016, AND DECEMBER 27, 2015
related to revenue growth, newsprint prices, compensation levels, discount rate, hypothetical transaction structures, and for the market based approach, private and public market trading multiples for newspaper assets. We consider current market capitalization, based upon the recent stock market prices, plus an estimated control premium in determining the reasonableness of the aggregate fair value of the reporting units. We determined that no impairment charge was required in 2017 or 2016. We determined an impairment charge of $290.9 million in 2015 was required. Also see Note 3.
Newspaper mastheads (newspaper titles and website domain names) are not subject to amortization and are tested for impairment annually, at year‑end, or more frequently if events or changes in circumstances indicate that the asset might be impaired. The impairment test consists of a comparison of the fair value of each newspaper masthead with its carrying amount. We use a relief-from-royalty approach which utilizes a discounted cash flow model, to determine the fair value of each newspaper masthead. We performed an interim testing of impairment of intangible newspaper mastheads as of September 24, 2017, due to the continuing challenging business conditions and the resulting weakness in our stock price as of the end of our third quarter of 2017. Individual newspaper masthead fair values were estimated using the present value of expected future cash flows, using estimates, judgments and assumptions discussed above that we believe were appropriate in the circumstances. As a result, we recorded an intangible newspaper masthead impairment charge of $8.7 million in the quarter and nine months ended September 24, 2017, and a total of $21.5 million in 2017. We determined that impairment charges of $9.2 million and $13.9 million in 2016 and 2015, respectively, were required. Also see Note 3.
Long‑lived assets such as intangible assets subject to amortization (primarily advertiser and subscriber lists) are tested for recoverability whenever events or changes in circumstances indicate that their carrying amounts may not be recoverable. The carrying amount of each asset group is not recoverable if it exceeds the sum of the undiscounted cash flows expected to result from the use of such asset group. We had no impairment of long‑lived assets subject to amortization during 2017, 2016 or 2015.
Stock‑based compensation
All stock‑based compensation, including grants of stock appreciation rights, restricted stock units and common stock under equity incentive plans, are recognized in the financial statements based on their fair values. At December 31, 2017, we had two stock‑based compensation plans. See Note 9.
Income taxes
We account for income taxes using the liability method. Under this method, deferred tax assets and liabilities are determined based on differences between the financial reporting and tax bases of assets and liabilities and are measured using the enacted tax rates and laws that are expected to be in effect when the differences are expected to reverse.
On December 22, 2017, the Tax Cuts and Jobs Act of 2017 (“Tax Act”) was enacted. The Tax Act makes broad and complex changes to the U.S. tax code, including, but not limited to, (i) reducing the U.S. federal corporate rate from 35% to 21%; (ii) eliminating the corporate alternative minimum tax (“AMT”) and changing how existing AMT credits can be realized; (iii) creating a new limitation on deductible interest expense; (iv) changing rules related to uses and limitations of net operating loss carryforwards created in tax years beginning after December 31, 2017; (v) bonus depreciation that will allow for full expensing of qualified property; and (vi) limitations on the deductibility of certain executive compensation.
The SEC staff issued Staff Accounting Bulletin 118 (“SAB 118”) in December 2017, which provides guidance on accounting for the tax effects of the Tax Act. SAB 118 provides that the measurement period for the tax effects of the Tax Act should not extend more than one year from the date the Tax Act was enacted. To the extent that a company’s accounting for certain income tax effects of the Tax Act is incomplete but the company is able to determine a reasonable estimate, the company must record a provisional estimate in the financial statements. If a company cannot determine a provisional estimate to be included in the financial statements, it should continue to apply ASC 740, Income Taxes, on a basis of the provisions of the tax laws that were in effect immediately before the Tax Act was enacted.
The timing of recording or releasing a valuation allowance requires significant judgment. A valuation allowance is required when it is more-likely-than-not that all or a portion of deferred tax assets may not be realized. Establishment
48
THE MCCLATCHY COMPANY
NOTES TO CONSOLIDATED FINANCIAL STATEMENTS
YEARS ENDED DECEMBER 31, 2017, DECEMBER 25, 2016, AND DECEMBER 27, 2015
and removal of a valuation allowance requires us to consider all positive and negative evidence and to make a judgmental decision regarding the amount of valuation allowance required as of a reporting date. The assessment takes into account expectations of future taxable income or loss, available tax planning strategies and the reversal of temporary differences. The development of these expectations involves the use of estimates such as operating profitability. The weight given to the evidence is commensurate with the extent to which it can be objectively verified.
We will continue to maintain a valuation allowance against our deferred tax assets until we believe it is more-likely-than-not that these assets will be realized in the future. If sufficient positive evidence, such as three-year cumulative pre-tax income, arises in the future that provides an indication that all of or a portion of the deferred tax assets meet the more-likely-than-not standard, the valuation allowance may be reversed, in whole or in part, in the period that such determination is made.
Current accounting standards in the United States prescribe a recognition threshold and measurement of a tax position taken or expected to be taken in an enterprise’s tax returns. We recognize accrued interest related to unrecognized tax benefits in interest expense. Accrued penalties are recognized as a component of income tax expense.
Fair value of financial instruments
We account for certain assets and liabilities at fair value. The hierarchy below lists three levels of fair value based on the extent to which inputs used in measuring fair value are observable in the market. We categorize each of our fair value measurements in one of these three levels based on the lowest level input that is significant to the fair value measurement in its entirety. These levels are:
|
|
Level 1 |
— |
Unadjusted quoted prices available in active markets for identical investments as of the reporting date. |
|
|
Level 2 |
— |
Observable inputs to the valuation methodology are other than Level 1 inputs and are either directly or indirectly observable as of the reporting date and fair value can be determined through the use of models or other valuation methodologies. |
|
|
Level 3 |
— |
Inputs to the valuation methodology are unobservable inputs in situations where there is little or no market activity for the asset or liability, and the reporting entity makes estimates and assumptions related to the pricing of the asset or liability including assumptions regarding risk. |
Our policy is to recognize significant transfers between levels at the actual date of the event or circumstance that caused the transfer.
The following methods and assumptions were used to estimate the fair value of each class of financial instruments:
Cash and cash equivalents, accounts receivable and accounts payable. As of December 31, 2017, and December 25, 2016, the carrying amount of these items approximates fair value because of the short maturity of these financial instruments.
Long‑term debt. The fair value of long‑term debt is determined using quoted market prices and other inputs that were derived from available market information, including the current market activity of our publicly‑traded notes and bank debt, trends in investor demand for debt and market values of comparable publicly‑traded debt. These are considered to be Level 2 inputs under the fair value measurements and disclosure guidance, and may not be representative of actual value. At December 31, 2017, and December 25, 2016, the estimated fair value of long‑term debt, including the current portion, was $810.7 million and $844.0 million, respectively. At December 31, 2017, and December 25, 2016, the carrying value of long‑term debt, including the current portion, was $781.4 million and $846.2 million, respectively.
Pension plan. As of December 31, 2017, and December 25, 2016, we had assets related to our qualified defined benefit pension plan measured at fair value. The required disclosures regarding such assets are presented in Note 6.
49
THE MCCLATCHY COMPANY
NOTES TO CONSOLIDATED FINANCIAL STATEMENTS
YEARS ENDED DECEMBER 31, 2017, DECEMBER 25, 2016, AND DECEMBER 27, 2015
Certain assets are measured at fair value on a nonrecurring basis; that is, they are subject to fair value adjustments only in certain circumstances (for example, when there is evidence of impairment). Our non‑financial assets that are measured at fair value on a nonrecurring basis are assets held for sale, goodwill, indefinite or finite lived intangible assets and equity method investments. All of these are measured using Level 3 inputs. We utilize valuation techniques that seek to maximize the use of observable inputs and minimize the use of unobservable inputs. The significant unobservable inputs include our expected cash flows and the discount rate that we estimate market participants would seek for bearing the risk associated with such assets. We incurred impairment charges during 2017 and 2016 on our newspaper masthead intangible assets (see above in Note 1) and equity method investments (see Note 2).
Accumulated other comprehensive loss
We record changes in our net assets from non‑owner sources in our consolidated statements of stockholders’ equity (deficit). Such changes relate primarily to valuing our pension liabilities, net of tax effects.
Our accumulated other comprehensive loss (“AOCL”) and reclassifications from AOCL, net of tax, consisted of the following:
|
|
|
|
|
|
Other |
|
|
|
|
|
|
|
|
Minimum |
|
Comprehensive |
|
|
|
|
||
|
|
|
Pension and |
|
Loss |
|
|
|
|
||
|
|
|
Post- |
|
Related to |
|
|
|
|
||
|
|
|
Retirement |
|
Equity |
|
|
|
|
||
|
(in thousands) |
|
Liability |
|
Investments |
|
Total |
|
|||
|
Balance at December 27, 2015 |
|
$ |
(411,956) |
|
$ |
(9,852) |
|
$ |
(421,808) |
|
|
Other comprehensive income (loss) before reclassifications |
|
|
— |
|
|
(1,157) |
|
|
(1,157) |
|
|
Amounts reclassified from AOCL |
|
|
(38,550) |
|
|
— |
|
|
(38,550) |
|
|
Other comprehensive income (loss) |
|
|
(38,550) |
|
|
(1,157) |
|
|
(39,707) |
|
|
Balance at December 25, 2016 |
|
$ |
(450,506) |
|
$ |
(11,009) |
|
$ |
(461,515) |
|
|
Other comprehensive income (loss) before reclassifications |
|
|
— |
|
|
4,046 |
|
|
4,046 |
|
|
Amounts reclassified from AOCL |
|
|
8,100 |
|
|
— |
|
|
8,100 |
|
|
Other comprehensive income |
|
|
8,100 |
|
|
4,046 |
|
|
12,146 |
|
|
Balance at December 31, 2017 |
|
$ |
(442,406) |
|
$ |
(6,963) |
|
$ |
(449,369) |
|
|
|
|
Amount Reclassified from AOCL (in thousands) |
|
|
|
||||
|
|
|
Year Ended |
|
Year Ended |
|
|
|
||
|
|
|
December 31, |
|
December 25, |
|
Affected Line in the |
|
||
|
AOCL Component |
|
2017 |
|
2016 |
|
Consolidated Statements of Operations |
|
||
|
Minimum pension and post-retirement liability |
|
$ |
8,100 |
|
$ |
(64,250) |
|
Retirement benefit expense |
|
|
|
|
|
— |
|
|
25,700 |
|
Income tax provision (benefit) (1) |
|
|
|
|
$ |
8,100 |
|
$ |
(38,550) |
|
Net of tax |
|
_____________________
(1) There is no income tax benefit associated with the year ended December 31, 2017, due to the recognition of a valuation allowance.
50
THE MCCLATCHY COMPANY
NOTES TO CONSOLIDATED FINANCIAL STATEMENTS
YEARS ENDED DECEMBER 31, 2017, DECEMBER 25, 2016, AND DECEMBER 27, 2015
Earnings per share (EPS)
Basic EPS excludes dilution from common stock equivalents and reflects income divided by the weighted average number of common shares outstanding for the period. Diluted EPS is based upon the weighted average number of outstanding shares of common stock and dilutive common stock equivalents in the period. Common stock equivalents arise from dilutive stock appreciation rights and restricted stock units, and are computed using the treasury stock method. Anti-dilutive common stock equivalents are excluded from diluted EPS. The weighted average anti‑dilutive common stock equivalents that could potentially dilute basic EPS in the future, but were not included in the weighted average share calculation, consisted of the following:
|
|
|
Years Ended |
||||
|
|
|
December 31, |
|
December 25, |
|
December 27, |
|
(shares in thousands) |
|
2017 |
|
2016 |
|
2015 |
|
Anti-dilutive stock options |
|
278 |
|
431 |
|
517 |
Recently Adopted Accounting Pronouncements
In July 2015, the Financial Accounting Standards Board (“FASB”) issued ASU No. 2015-11, “Inventory (Topic 330): Simplifying the Measurement of Inventory.” ASU 2015-11 simplified the measurement of inventory by requiring certain inventory to be measured at the “lower of cost and net realizable value” and options that existed for “market value” were eliminated. The ASU defined net realizable value as the “estimated selling prices in the ordinary course of business, less reasonably predictable costs of completion, disposal, and transportation.” Effective December 26, 2016, we adopted this standard and applied it prospectively. We did not have a material impact to our primary categories of inventory such as newsprint for our operations or to our consolidated statement of operations from the adoption of this standard.
In January 2017, the FASB issued ASU No. 2017-04, “Intangibles-Goodwill and Other (Topic 350): Simplifying the Test for Goodwill Impairment.” ASU 2017-04 simplified the subsequent measurement of goodwill and eliminated the Step 2 from the goodwill impairment test. This standard was effective for us in fiscal year 2020 with early adoption permitted. We early adopted this standard for any impairment test performed after January 1, 2017, as permitted under the standard. The adoption of this guidance did not impact our consolidated financial statements.
In March 2017, the FASB issued ASU No. 2017-07, “Compensation-Retirement Benefits (Topic 715): Improving the Presentation of Net Periodic Pension Cost and Net Periodic Postretirement Benefit Cost.” ASU 2017-07 required that an employer report the service cost component in the same line items or items as other compensation costs arising from services rendered by the pertinent employees during the period. The other components of net benefit cost, as defined in the standard, are required to be presented in the income statement separately from the service cost component and outside a subtotal of income from operations. It was effective for us in fiscal year 2018 with early adoption permitted. The amendments in this ASU are required to be applied retrospectively for the presentation of the service cost component and the other components of net periodic benefit costs. The amendments allow a practical expedient that permits an employer to use the amounts disclosed in its pension and other postretirement benefit plan note for the prior comparative periods as the estimation basis for applying the retrospective presentation requirements. Effective as of the beginning of fiscal year 2017, we early adopted this standard using the practical expedient. For 2016 and 2015, we reclassified net periodic pension and postretirement costs of $14.8 million and $10.0 million, respectively, from the compensation line item within operating expenses to the retirement benefit expense line item in non-operating income (expense) in the consolidated statement of operations to conform to the current year presentation.
In May 2017, the FASB issued ASU No. 2017-09, “Compensation-Stock Compensation (Topic 718): Scope of Modification Accounting.” ASU 2017-09 provides guidance about which changes to the terms or conditions of a share-based payment award require an entity to apply modification accounting. This standard was effective for us in fiscal year 2018 with early adoption permitted. We early adopted this standard in the second quarter of 2017. The adoption of this guidance did not impact our consolidated financial statements.
51
THE MCCLATCHY COMPANY
NOTES TO CONSOLIDATED FINANCIAL STATEMENTS
YEARS ENDED DECEMBER 31, 2017, DECEMBER 25, 2016, AND DECEMBER 27, 2015
Recently Issued Accounting Pronouncements Not Yet Adopted
In May 2014, the FASB issued Accounting Standards Update (“ASU”) ASU No. 2014-09, “Revenue from Contracts with Customers (Topic 606).” Topic 606 supersedes the revenue recognition requirements in Topic 605 “Revenue Recognition.” ASU 2014-09 outlines a new, single comprehensive model for entities to use in accounting for revenue arising from contracts with customers and supersedes most current revenue recognition guidance. This new revenue recognition model provides a five-step analysis in determining when and how revenue is recognized. The new model will require revenue recognition to depict the transfer of promised goods or services to customers in an amount that reflects the consideration a company expects to receive in exchange for those goods or services. In 2016 and 2017, the FASB issued additional updates: ASU No. 2016-08, 2016-10, 2016-11, 2016-12, 2016-20 and 2017-05. These updates provide further guidance and clarification on specific items within the previously issued update.
We will adopt Topic 606 on January 1, 2018, using the modified retrospective method applied to those contracts which were not completed as of that date. Upon adoption, we will recognize a cumulative adjustment related to audience grace period revenues that will increase our accumulated deficit by approximately $2.7 million, rather than retrospectively adjusting prior periods. We will begin to recognize audience grace period revenues based on variable consideration. We have completed our assessment and have not identified any other significant changes to our revenue recognition policies. We expect to identify similar performance obligations under Topic 606 as compared with the deliverables and separate units of account previously identified. As a result, we expect the timing of our revenue recognition to remain the same. We have also assessed the new accounting principles related to the deferral and amortization of contract acquisition and fulfillment costs and due to the short-term nature of such costs, we will utilize the practical expedient to continue to expense as incurred. Internal controls were assessed during our analysis of Topic 606. As a result, certain controls related to assessment, implementation and monitoring of contracts and revenue recognition were created and implemented to ensure revenue is recognized timely and accurately. We expect the adoption of Topic 606 will not have a material impact to our consolidated financial statements.
In January 2016, the FASB issued ASU No. 2016-01, “Financial Instruments – Overall (Subtopic 825-10): Recognition and Measurement of Financial Assets and Financial Liabilities.” ASU 2016-01 addresses certain aspects of recognition, measurement, presentation, and disclosure of financial instruments. ASU 2016-01 is effective for us for interim and annual reporting periods beginning after December 15, 2017. The adoption of this guidance will not have an impact on our consolidated financial statements.
In February 2016, the FASB issued ASU No. 2016-02, “Leases (Topic 842)” and it replaces the existing guidance in Topic 840, “Leases.” Topic 842 requires lessees to recognize most leases on their balance sheets as lease liabilities with corresponding right-of-use assets. The new lease standard does not substantially change lessor accounting. In 2017, the FASB issued an additional update: ASU No. 2018-01, which provides further guidance and clarification on specific items within the previously issued update. It is effective for us for interim and annual reporting periods beginning after December 15, 2018, with early adoption permitted. We are in the process of reviewing the impact this standard will have on our existing lease population and the impact the adoption will have on our consolidated financial statements.
In June 2016, the FASB issued ASU No. 2016-13, “Financial Instruments – Credit Losses (Topic 326): Measurement of Credit Losses on Financial Instruments.” ASU 2016-13 requires that financial assets measured at amortized cost be presented at the net amount expected to be collected. The allowance for credit losses is a valuation account that is deducted from the amortized cost basis. The income statement reflects the measurement of credit losses for newly recognized financial assets, as well as the expected credit losses during the period. The measurement of expected credit losses is based upon historical experience, current conditions, and reasonable and supportable forecasts that affect the collectability of the reported amount. It is effective for us for interim and annual reporting periods beginning after December 15, 2019, and early adoption is permitted for interim or annual reporting periods beginning after December 15, 2018. We are currently in the process of evaluating the impact of the adoption on our consolidated financial statements.
In August 2016, the FASB issued ASU No. 2016-15, “Statement of Cash Flows (Topic 230): Classification of Certain Cash Receipts and Cash Payments.” ASU 2016-15 addresses eight specific cash flow issues and is intended to reduce diversity in practice in how certain cash receipts and cash payments are presented and classified in the statement of cash flows. It is effective for us for interim and annual reporting periods beginning after December 15, 2017, and early
52
THE MCCLATCHY COMPANY
NOTES TO CONSOLIDATED FINANCIAL STATEMENTS
YEARS ENDED DECEMBER 31, 2017, DECEMBER 25, 2016, AND DECEMBER 27, 2015
adoption is permitted. The adoption of this guidance is not expected to have an impact on our consolidated financial statements.
In February 2018, the FASB issued ASU No. 2018-02, “Income Statement-Reporting Comprehensive Income (Topic 220): Reclassification of Certain Tax Effects from Accumulated Other Comprehensive Income.” ASU 2018-02 allows for reclassification of stranded tax effects resulting from the Tax Act from accumulated other comprehensive income to retained earnings. Consequently, the standard eliminates the stranded tax effects resulting from the Tax Act and will improve the usefulness of information reported to financial statement users. However, because the standard only relates to the reclassification of the income tax effects of the Tax Act, the underlying guidance that requires that the effect of a change in tax laws or rates be included in income from continuing operations is not affected. This standard also requires certain disclosures about the stranded tax effects. It is effective for us for interim and annual reporting periods beginning after December 15, 2018, and early adoption is permitted. We are currently in the process of evaluating the impact of the adoption on our consolidated financial statements.
2. INVESTMENTS IN UNCONSOLIDATED COMPANIES
Our ownership interest and investment in unconsolidated companies consisted of the following:
|
(in thousands) |
|
% Ownership |
|
December 31, |
|
December 25, |
|
||
|
Company |
|
Interest |
|
2017 |
|
2016 |
|
||
|
CareerBuilder, LLC |
|
3.0 |
|
$ |
3,579 |
|
$ |
236,936 |
|
|
Other |
|
Various |
|
|
3,593 |
|
|
5,446 |
|
|
|
|
|
|
$ |
7,172 |
|
$ |
242,382 |
|
CareerBuilder, LLC
On June 19, 2017, we along with the then existing ownership group of CareerBuilder at that time announced that we had entered into an agreement to sell a majority of the collective ownership interest in CareerBuilder to an investor group led by investment funds managed by affiliates of Apollo Management Group along with the Ontario Teachers' Pension Plan Board. The transaction closed on July 31, 2017. We received $73.9 million from the closing of the transaction, consisting of approximately $7.3 million in normal distributions and $66.6 million of gross proceeds.
As a result of the closing of the transaction, our new ownership interest in CareerBuilder was reduced to approximately 3.0% from 15.0%. As a result of the transaction, we recorded a total of $168.2 million in pre-tax impairment charges on our equity investment in CareerBuilder during 2017.
HomeFinder, LLC
In February 2016, we, along with the other selling partners sold all of the assets in HomeFinder LLC (“HomeFinder”) to Placester Inc. (“Placester”) in exchange for a small stock ownership in Placester and a 3-year affiliate agreement with Placester to continue to allow the selling partners to sell Placester and HomeFinder’s products and services. As a result of this transaction, during 2016, we wrote off our HomeFinder investment of $0.9 million, which was recorded to equity income in unconsolidated companies, net, on our consolidated statements of operations. During 2017, the final transaction accounting was completed for the HomeFinder transaction. As a result, we received our proportional share of the remaining proceeds from HomeFinder of $0.6 million, which is recorded as an offset to impairments related to equity investments, in the consolidated statements of operations.
Write-downs
During 2017 and 2016, excluding the CareerBuilder impairments noted above, we recorded write‑downs of $2.4 million and $1.0 million, respectively, which is recorded in impairments related to equity investments, in the consolidated statements of operations. The write-downs in 2017 were related to various investments, while the write-downs in 2016 was primarily due to HomeFinder, LLC, as discussed above.
53
THE MCCLATCHY COMPANY
NOTES TO CONSOLIDATED FINANCIAL STATEMENTS
YEARS ENDED DECEMBER 31, 2017, DECEMBER 25, 2016, AND DECEMBER 27, 2015
Distributions
We received $7.3 million and $6.0 million in distributions from CareerBuilder in 2017 and 2016, respectively.
Other
Three of our wholly-owned subsidiaries have a combined 27.0% general partnership interest in Ponderay Newsprint Company (“Ponderay”). The investment in Ponderay is zero as a result of a write off in 2014 and accumulative losses exceeding our carrying value. No future income or losses from Ponderay will be recorded until our carrying value on our balance sheet is restored through future earnings by Ponderay.
We have a 49.5% ownership interest in The Seattle Times Company (“STC”). Our investment in STC is zero as a result of accumulative losses in previous years exceeding our carrying value. No future income or losses from STC will be recorded until our carrying value on our balance sheet is restored through future earnings by STC.
We also incurred expenses related to the purchase of products and services provided by these companies. We purchased some of our newsprint supply from Ponderay through a third-party intermediary and we incurred wholesale fees from CareerBuilder for the uploading and hosting of online advertising on behalf of our media companies’ advertisers. We recorded these expenses for CareerBuilder as a reduction to the associated digital classified advertising revenues and expenses related to Ponderay were recorded in newsprint expenses.
The following table summarizes expenses incurred for products and services provided by unconsolidated companies:
|
|
|
Years Ended |
|
|||||||
|
|
|
December 31, |
|
December 25, |
|
December 27, |
|
|||
|
(in thousands) |
|
2017 |
|
2016 |
|
2015 |
|
|||
|
CareerBuilder, LLC |
|
$ |
354 |
|
$ |
863 |
|
$ |
1,001 |
|
|
Ponderay (general partnership) |
|
|
9,162 |
|
|
10,767 |
|
|
8,200 |
|
The tables below present the summarized financial information, as provided to us by these investees, for our investments in unconsolidated companies on a combined basis:
|
|
|
December 31, |
|
December 25, |
|
||
|
(in thousands) |
|
2017 |
|
2016 |
|
||
|
Current assets |
|
$ |
112,694 |
|
$ |
332,602 |
|
|
Noncurrent assets |
|
|
57,477 |
|
|
629,604 |
|
|
Current liabilities |
|
|
61,996 |
|
|
263,200 |
|
|
Noncurrent liabilities |
|
|
161,440 |
|
|
187,188 |
|
|
Equity |
|
|
(53,235) |
|
|
511,818 |
|
|
|
|
Years Ended |
|
||||||||
|
|
|
December 31, |
|
December 25, |
|
December 27, |
|
||||
|
(in thousands) |
|
2017 |
|
2016 |
|
2015 |
|
||||
|
Net revenues |
|
$ |
685,415 |
|
$ |
1,058,296 |
|
$ |
988,871 |
|
|
|
Gross profit |
|
|
508,248 |
|
|
882,493 |
|
|
843,680 |
|
|
|
Operating income |
|
|
4,027 |
|
|
80,830 |
|
|
38,561 |
|
|
|
Net income |
|
|
(5,121) |
|
|
68,534 |
|
|
39,143 |
|
|
54
THE MCCLATCHY COMPANY
NOTES TO CONSOLIDATED FINANCIAL STATEMENTS
YEARS ENDED DECEMBER 31, 2017, DECEMBER 25, 2016, AND DECEMBER 27, 2015
3. INTANGIBLE ASSETS AND GOODWILL
Changes in identifiable intangible assets and goodwill consisted of the following:
|
|
|
December 25, |
|
|
|
Impairment |
|
Amortization |
|
December 31, |
|
|||||||||
|
(in thousands) |
|
2016 |
|
Additions |
|
Charges |
|
Expense |
|
2017 |
|
|||||||||
|
Intangible assets subject to amortization |
|
$ |
839,273 |
|
$ |
11 |
|
$ |
— |
|
$ |
— |
|
$ |
839,284 |
|
||||
|
Accumulated amortization |
|
|
(711,723) |
|
|
— |
|
|
— |
|
|
(49,290) |
|
|
(761,013) |
|
||||
|
|
|
|
127,550 |
|
|
11 |
|
|
— |
|
|
(49,290) |
|
|
78,271 |
|
||||
|
Mastheads |
|
|
171,436 |
|
|
— |
|
|
(21,485) |
|
|
— |
|
|
149,951 |
|
||||
|
Goodwill |
|
|
705,174 |
|
|
— |
|
|
— |
|
|
— |
|
|
705,174 |
|
||||
|
Total |
|
$ |
1,004,160 |
|
$ |
11 |
|
$ |
(21,485) |
|
$ |
(49,290) |
|
$ |
933,396 |
|
||||
|
|
|
December 27, |
|
|
|
Impairment |
|
Amortization |
|
December 25, |
|
||||||||||
|
(in thousands) |
|
2015 |
|
Additions |
|
Charges |
|
Expense |
|
2016 |
|
||||||||||
|
Intangible assets subject to amortization |
|
$ |
833,254 |
|
$ |
6,019 |
|
$ |
— |
|
$ |
— |
|
$ |
839,273 |
|
|||||
|
Accumulated amortization |
|
|
(663,735) |
|
|
— |
|
|
— |
|
|
(47,988) |
|
|
(711,723) |
|
|||||
|
|
|
|
169,519 |
|
|
6,019 |
|
|
— |
|
|
(47,988) |
|
|
127,550 |
|
|||||
|
Mastheads |
|
|
179,132 |
|
|
1,500 |
|
|
(9,196) |
|
|
— |
|
|
171,436 |
|
|||||
|
Goodwill |
|
|
705,174 |
|
|
— |
|
|
— |
|
|
— |
|
|
705,174 |
|
|||||
|
Total |
|
$ |
1,053,825 |
|
$ |
7,519 |
|
$ |
(9,196) |
|
$ |
(47,988) |
|
$ |
1,004,160 |
|
|||||
As discussed more fully in Note 1, based on our interim and annual impairment testing of intangible newspaper mastheads we recorded a total of $21.5 million in masthead impairments in 2017, which was recorded in the other asset write-downs line item on our consolidated statements of operations. We had no goodwill impairments as a result of our annual impairment testing as of December 31, 2017.
Based on our annual impairment testing of goodwill and intangible newspaper mastheads at December 25, 2016, we recorded $9.2 million in masthead impairments, which was recorded in the goodwill impairment and other asset write-downs line item on our consolidated statements of operations.
In December 2016, we completed a small acquisition of The (Durham, NC) Herald-Sun. We also recognized an intangible asset related to an agreement we entered into with the purchasers of a covered parking garage under which we will receive parking spaces, at no cost, with an estimated useful life of 20 years. The transactions are reflected in intangible assets subject to amortization and in Mastheads. The impact of the acquisition was not material to our consolidated financial statements, and no other material amounts of assets were acquired or liabilities assumed in these transactions.
55
THE MCCLATCHY COMPANY
NOTES TO CONSOLIDATED FINANCIAL STATEMENTS
YEARS ENDED DECEMBER 31, 2017, DECEMBER 25, 2016, AND DECEMBER 27, 2015
Accumulated changes in indefinite lived intangible assets and goodwill as of December 31, 2017, and December 25, 2016, consisted of the following:
|
|
|
December 31, 2017 |
|
|
December 25, 2016 |
|
||||||||||||||
|
|
|
Original Gross |
|
Accumulated |
|
Carrying |
|
|
Original Gross |
|
Accumulated |
|
Carrying |
|
||||||
|
(in thousands) |
|
Amount |
|
Impairment |
|
Amount |
|
|
Amount |
|
Impairment |
|
Amount |
|
||||||
|
Mastheads |
|
$ |
684,500 |
|
$ |
(534,549) |
|
$ |
149,951 |
|
|
$ |
684,500 |
|
$ |
(513,064) |
|
$ |
171,436 |
|
|
Goodwill |
|
|
3,571,111 |
|
|
(2,865,937) |
|
|
705,174 |
|
|
|
3,571,111 |
|
|
(2,865,937) |
|
|
705,174 |
|
|
Total |
|
$ |
4,255,611 |
|
$ |
(3,400,486) |
|
$ |
855,125 |
|
|
$ |
4,255,611 |
|
$ |
(3,379,001) |
|
$ |
876,610 |
|
Amortization expense was $49.3 million, $48.0 million and $48.4 million in 2017, 2016 and 2015, respectively. The estimated amortization expense for the five succeeding fiscal years is as follows:
|
|
|
Amortization |
|
|
|
|
|
Expense |
|
|
|
Year |
|
(in thousands) |
|
|
|
2018 |
|
$ |
47,660 |
|
|
2019 |
|
|
24,154 |
|
|
2020 |
|
|
803 |
|
|
2021 |
|
|
680 |
|
|
2022 |
|
|
655 |
|
4. LONG‑TERM DEBT
All of our long‑term debt is in fixed rate obligations. As of December 31, 2017, and December 25, 2016, our outstanding long‑term debt consisted of senior secured notes and unsecured notes. They are stated net of unamortized debt issuance costs and unamortized discounts, if applicable, totaling $23.7 million and $27.5 million as of December 31, 2017, and December 25, 2016, respectively. The unamortized discounts resulted from recording assumed liabilities at fair value during a 2006 acquisition.
The face values of the notes, as well as the carrying values are as follows:
|
|
|
Face Value at |
|
Carrying Value |
|
|||||
|
|
|
December 31, |
|
December 31, |
|
December 25, |
|
|||
|
(in thousands) |
|
2017 |
|
2017 |
|
2016 |
|
|||
|
Notes: |
|
|
|
|
|
|
|
|
|
|
|
9.00% senior secured notes due in 2022 |
|
$ |
439,630 |
|
$ |
433,819 |
|
$ |
483,492 |
|
|
5.750% notes due in 2017 |
|
|
— |
|
|
— |
|
|
16,749 |
|
|
7.150% debentures due in 2027 |
|
|
89,188 |
|
|
85,262 |
|
|
84,862 |
|
|
6.875% debentures due in 2029 |
|
|
276,230 |
|
|
262,311 |
|
|
261,061 |
|
|
Long-term debt |
|
$ |
805,048 |
|
$ |
781,392 |
|
$ |
846,164 |
|
|
Less current portion |
|
|
75,000 |
|
|
74,140 |
|
|
16,749 |
|
|
Total long-term debt, net of current |
|
$ |
730,048 |
|
$ |
707,252 |
|
$ |
829,415 |
|
56
THE MCCLATCHY COMPANY
NOTES TO CONSOLIDATED FINANCIAL STATEMENTS
YEARS ENDED DECEMBER 31, 2017, DECEMBER 25, 2016, AND DECEMBER 27, 2015
Debt Maturities, Repurchases, Redemptions and Extinguishment of Debt
The total face value of the notes that matured, were repurchased in privately negotiated transactions, or were redeemed via offers in 2017 and 2016 are as follows:
|
|
December 31, |
|
December 25, |
||
|
|
2017 |
|
2016 |
||
|
(in thousands) |
Face Value |
|
Face Value |
||
|
9.00% senior secured notes due in 2022 |
$ |
51,785 |
|
$ |
25,000 |
|
5.750% notes due in 2017 |
|
16,865 |
|
|
38,577 |
|
Total notes matured, repurchased or redeemed |
$ |
68,650 |
|
$ |
63,577 |
During 2017, (i) we retired $16.9 million of the 5.75% Notes due in 2017 (“5.75% Notes”); (ii) we repurchased a total $50.0 million of our 9.00% Senior Secured Notes due in 2022 (“9.00% Notes”) through privately negotiated transactions; and (iii) we redeemed $1.8 million of the 9.00% Notes from the offers to purchase that we announced in the third and fourth quarters of 2017. The notes that matured and the notes that were redeemed as a result of our offer to purchase were transacted at the principal amount plus accrued and unpaid interest. The 9.00% Notes that we repurchased through privately negotiated transactions were repurchased at a premium, and we wrote off the associated debt issuance costs. As a result of these transactions, we recorded a loss on the extinguishment of debt of $2.7 million during 2017.
As announced in December 2017, we called for a partial redemption of $75.0 million aggregate principal amount of our 9.00% Notes at a price of 104.5% of par as allowed under the bond indentures. The bonds were redeemed on January 25, 2018. Accordingly, these bonds are classified as current portion of long-term debt in our balance sheet as of December 31. 2017. Also, February 2018, we repurchased an additional $20.0 million aggregate principal amount of our 9.00% Notes through privately negotiated transactions. As a result of these transactions, we expect to record a loss on the extinguishment of debt of approximately $5.3 million during the quarter ending April 1, 2018.
During 2016, we repurchased $63.6 million aggregate principal amount of various series of our outstanding notes. We repurchased these notes at either a price higher or lower than par value and wrote off historical discounts and unamortized issuance costs related to these notes, as applicable, which resulted in a net gain on extinguishment of debt of $0.4 million in 2016.
Credit Agreement
Our Third Amended and Restated Credit Agreement, as amended (“Credit Agreement”), is secured by a first-priority security interest in certain of our assets as described below. The Credit Agreement, among other things, provides for commitments of $65 million and a maturity date of December 18, 2019. Pursuant to the terms of our Collateralized Issuance and Reimbursement Agreement (“LC Agreement”), we may request letters of credit be issued on our behalf in an aggregate face amount not to exceed $35.0 million. We are required to provide cash collateral equal to 101% of the aggregate undrawn stated amount of each outstanding letter of credit.
As of December 31, 2017, there were $31.7 million face amount of letters of credit outstanding under the LC Agreement and no amounts drawn under the Credit Agreement. The amounts of standby letters of credit declined to $29.7 million in January 2018.
Under the Credit Agreement, we may borrow at either the London Interbank Offered Rate plus a spread ranging from 275 basis points to 425 basis points, or at a base rate plus a spread ranging from 175 basis points to 325 basis points, in each case based upon our consolidated total leverage ratio. The Credit Agreement provides for a commitment fee payable on the unused revolving credit ranging from 50 basis points to 62.5 basis points, based upon our consolidated total leverage ratio.
Senior Secured Notes and Indenture
Substantially all of our subsidiaries guarantee the obligations under the 9.00% Notes and the Credit Agreement. We own 100% of each of the guarantor subsidiaries, and we have no significant independent assets or operations separate from
57
THE MCCLATCHY COMPANY
NOTES TO CONSOLIDATED FINANCIAL STATEMENTS
YEARS ENDED DECEMBER 31, 2017, DECEMBER 25, 2016, AND DECEMBER 27, 2015
the subsidiaries that guarantee our 9.00% Notes and the Credit Agreement. The guarantees provided by the guarantor subsidiaries are full and unconditional and joint and several, and the subsidiaries, other than the subsidiary guarantors, are minor.
In addition, we have granted a security interest to the banks that are a party to the Credit Agreement and the trustee under the indenture governing the 9.00% Notes that includes, but is not limited to, intangible assets, inventory, receivables and certain minority investments as collateral for the debt. The security interest does not include any PP&E, leasehold interests and improvements with respect to such PP&E which would be reflected on our consolidated balance sheets or shares of stock and indebtedness of our subsidiaries.
Covenants under the Senior Debt Agreements
Under the Credit Agreement, we are required to comply with a maximum consolidated total leverage ratio measured on a quarterly basis. As of December 31, 2017, we are required to maintain a consolidated total leverage ratio of not more than 6.00 to 1.00. For purposes of the consolidated total leverage ratio, debt is largely defined as debt, net of cash on hand in excess of $20 million. As of December 31, 2017, we were in compliance with all financial debt covenants.
The Credit Agreement also prohibits the payment of a dividend if a payment would not be permitted under the indenture for the 9.00% Notes (discussed below). Dividends under the indenture for the 9.00% Notes are allowed if the consolidated leverage ratio (as defined in the indenture) is less than 5.25 to 1.00 and we have sufficient amounts under our restricted payments basket (as determined pursuant to the indenture) or if we use other available exceptions provided under the indenture.
The indenture for the 9.00% Notes and the Credit Agreement include a number of restrictive covenants that are applicable to us and our restricted subsidiaries. The covenants are subject to a number of important exceptions and qualifications set forth in those agreements. These covenants include, among other things, restrictions on our ability to incur additional debt; make investments and other restricted payments; pay dividends on capital stock or redeem or repurchase capital stock or certain of our outstanding notes or debentures prior to stated maturity; sell assets or enter into sale/leaseback transactions; create specified liens; create or permit restrictions on the ability of our restricted subsidiaries to pay dividends or make other distributions; engage in certain transactions with affiliates; and consolidate or merge with or into other companies or sell all or substantially all of the Company’s and our subsidiaries’ assets, taken as a whole.
Maturities
The following table presents the approximate annual maturities of outstanding long‑term debt as of December 31, 2017, based upon our required payments, for the next five years and thereafter:
|
|
|
Payments |
|
|
Year |
|
(in thousands) |
|
|
2018 |
|
$ |
75,000 |
|
2019 |
|
|
— |
|
2020 |
|
|
— |
|
2021 |
|
|
— |
|
2022 |
|
|
364,630 |
|
Thereafter |
|
|
365,418 |
|
Debt principal |
|
$ |
805,048 |
58
THE MCCLATCHY COMPANY
NOTES TO CONSOLIDATED FINANCIAL STATEMENTS
YEARS ENDED DECEMBER 31, 2017, DECEMBER 25, 2016, AND DECEMBER 27, 2015
5. INCOME TAXES
Income tax provision (benefit) consisted of:
|
|
|
Years Ended |
|
|||||||
|
|
|
December 31, |
|
December 25, |
|
December 27, |
|
|||
|
(in thousands) |
|
2017 |
|
2016 |
|
2015 |
|
|||
|
Current: |
|
|
|
|
|
|
|
|
|
|
|
Federal |
|
$ |
15,042 |
|
$ |
17,641 |
|
$ |
13,317 |
|
|
State |
|
|
4,017 |
|
|
2,569 |
|
|
(2,027) |
|
|
Deferred: |
|
|
|
|
|
|
|
|
|
|
|
Federal |
|
|
80,293 |
|
|
(26,857) |
|
|
(17,642) |
|
|
State |
|
|
6,107 |
|
|
(6,418) |
|
|
(5,445) |
|
|
Income tax provision (benefit) |
|
$ |
105,459 |
|
$ |
(13,065) |
|
$ |
(11,797) |
|
As of December 31, 2017, we have not completed our accounting for the tax effects of enactment of the Tax Act; however, we have made a reasonable estimate of the effects on our existing deferred tax balances. We re-measured certain deferred tax assets and liabilities based on the rates at which they are expected to reverse in the future. We are still analyzing certain aspects of the Tax Act, including the impact of the limitations on certain employee compensation, the deductibility of certain purchases of fixed assets, and the allowance of an indefinite carryforward period of net operating losses, which could potentially affect the measurement of these balances or potentially give rise to new deferred tax amounts. The provisional amount recorded related to the re-measurement of our net deferred tax balance using the new federal tax rate was a benefit of $5.5 million.
The effective tax rate expense (benefit) and the statutory federal income tax rate are reconciled as follows:
|
|
|
Years Ended |
|
||||
|
|
|
December 31, |
|
December 25, |
|
December 27, |
|
|
|
|
2017 |
|
2016 |
|
2015 |
|
|
Statutory rate |
|
(35.0) |
% |
(35.0) |
% |
(35.0) |
% |
|
State taxes, net of federal benefit |
|
2.4 |
|
(4.6) |
|
(2.1) |
|
|
Changes in estimates |
|
— |
|
(0.1) |
|
0.1 |
|
|
Changes in unrecognized tax benefits |
|
0.6 |
|
(0.3) |
|
0.3 |
|
|
Other |
|
0.3 |
|
3.1 |
|
— |
|
|
Impact of valuation allowance |
|
80.0 |
|
— |
|
— |
|
|
Impact of tax rate changes |
|
(2.4) |
|
— |
|
— |
|
|
Impact on pension transaction |
|
— |
|
6.9 |
|
— |
|
|
Goodwill impairment |
|
— |
|
— |
|
32.5 |
|
|
Stock compensation |
|
0.6 |
|
2.3 |
|
0.4 |
|
|
Effective tax rate |
|
46.5 |
% |
(27.7) |
% |
(3.8) |
% |
59
THE MCCLATCHY COMPANY
NOTES TO CONSOLIDATED FINANCIAL STATEMENTS
YEARS ENDED DECEMBER 31, 2017, DECEMBER 25, 2016, AND DECEMBER 27, 2015
The components of deferred tax assets and liabilities consisted of the following:
|
|
|
December 31, |
|
December 25, |
|
||
|
(in thousands) |
|
2017 |
|
2016 |
|
||
|
Deferred tax assets: |
|
|
|
|
|
|
|
|
Compensation benefits |
|
$ |
144,084 |
|
$ |
259,684 |
|
|
State taxes |
|
|
2,861 |
|
|
3,659 |
|
|
State loss carryovers |
|
|
4,338 |
|
|
3,889 |
|
|
Investments in unconsolidated subsidiaries |
|
|
4,981 |
|
|
— |
|
|
Other |
|
|
2,945 |
|
|
4,345 |
|
|
Total deferred tax assets |
|
|
159,209 |
|
|
271,577 |
|
|
Valuation allowance |
|
|
(109,718) |
|
|
(3,889) |
|
|
Net deferred tax assets |
|
|
49,491 |
|
|
267,688 |
|
|
Deferred tax liabilities: |
|
|
|
|
|
|
|
|
Depreciation and amortization |
|
|
68,665 |
|
|
136,159 |
|
|
Investments in unconsolidated subsidiaries |
|
|
— |
|
|
50,323 |
|
|
Debt discount |
|
|
4,512 |
|
|
7,345 |
|
|
Deferred gain on debt |
|
|
4,376 |
|
|
13,040 |
|
|
Total deferred tax liabilities |
|
|
77,553 |
|
|
206,867 |
|
|
Net deferred tax assets (liabilities) |
|
$ |
(28,062) |
|
$ |
60,821 |
|
The valuation allowance increased by $105.8 million and $1.0 million in 2017 and 2016, respectively.
The timing of recording or releasing a valuation allowance requires significant judgment. A valuation allowance is required when it is more-likely-than-not that all or a portion of deferred tax assets may not be realized. Establishment and removal of a valuation allowance requires us to consider all positive and negative evidence and to make a judgmental decision regarding the timing and amount of valuation allowance required as of a reporting date. The assessment takes into account expectations of future taxable income or loss, available tax planning strategies and the reversal of temporary differences. The development of these expectations involves the use of estimates such as operating profitability. The weight given to the evidence is commensurate with the extent to which it can be objectively verified.
We performed an assessment of the deferred tax assets during the third and fourth quarters of 2017, weighing the positive and negative evidence as outlined in ASC 740, Income Taxes. As we have incurred three years of cumulative pre-tax losses, such objective negative evidence limits our ability to give significant weight to other positive subjective evidence, such as projections for future growth and profitability. Accordingly, we recorded a valuation allowance charge of $192.3 million for 2017, which was recorded in income tax (benefit) expense on our consolidated statements of operations. During the quarter ended December 31, 2017, as a result of the Tax Act, principally the change to allow an indefinite carryforward period of net operating losses, we reassessed our analysis and decreased our related valuation allowance by $53.6 million. As of December 31, 2017, our valuation allowance against a majority of our net deferred tax assets was $109.7 million.
We will continue to maintain a valuation allowance against our deferred tax assets until we believe it is more-likely-than-not that these assets will be realized in the future. If sufficient positive evidence, such as three-year cumulative pre-tax income, arises in the future that provides an indication that all or a portion of the deferred tax assets meet the more-likely-than-not standard, the valuation allowance may be reversed, in whole or in part, in the period that such determination is made.
As of December 31, 2017, we have net operating loss carryforwards in various states totaling approximately $278.9 million, which expire in various years between 2024 and 2037 if not used.
As of December 31, 2017, we had approximately $25.1 million of long‑term liabilities relating to uncertain tax positions consisting of approximately $20.8 million in gross unrecognized tax benefits (primarily state tax positions before the offsetting effect of federal income tax) and $4.3 million in gross accrued interest and penalties. If recognized, approximately $11.1 million of the net unrecognized tax benefits would impact the effective tax rate, with the remainder impacting other accounts, primarily deferred taxes. It is reasonably possible that up to $4.3 million reduction of
60
THE MCCLATCHY COMPANY
NOTES TO CONSOLIDATED FINANCIAL STATEMENTS
YEARS ENDED DECEMBER 31, 2017, DECEMBER 25, 2016, AND DECEMBER 27, 2015
unrecognized tax benefits and related interest may occur within the next 12 months as a result of the expiration of statutes of limitations.
We record interest on unrecognized tax benefits as a component of interest expense, while penalties are recorded as part of income tax expense. Related to the unrecognized tax benefits noted below, we recorded interest expense (benefit), of $1.1 million, $0.5 million and ($0.3) million for 2017, 2016 and 2015, respectively. We recorded penalty expense (benefit) of $0.3 million, $0.0 million and $0.1 million during 2017, 2016 and 2015, respectively. Accrued interest and penalties at December 31, 2017, December 25, 2016, and December 27, 2015, were approximately $4.3 million, $3.0 million and $2.5 million, respectively.
A reconciliation of the beginning and ending amount of unrecognized tax benefits consists of the following:
|
|
|
Years Ended |
|
|||||||
|
|
|
December 31, |
|
December 25, |
|
December 27, |
|
|||
|
(in thousands) |
|
2017 |
|
2016 |
|
2015 |
|
|||
|
Balance at beginning of fiscal year |
|
$ |
16,477 |
|
$ |
15,621 |
|
$ |
13,046 |
|
|
Increases based on tax positions in prior year |
|
|
3,299 |
|
|
294 |
|
|
4,433 |
|
|
Decreases based on tax positions in prior year |
|
|
— |
|
|
(177) |
|
|
— |
|
|
Increases based on tax positions in current year |
|
|
1,642 |
|
|
1,516 |
|
|
1,435 |
|
|
Settlements |
|
|
(164) |
|
|
— |
|
|
— |
|
|
Lapse of statute of limitations |
|
|
(490) |
|
|
(777) |
|
|
(3,293) |
|
|
Balance at end of fiscal year |
|
$ |
20,764 |
|
$ |
16,477 |
|
$ |
15,621 |
|
As of December 31, 2017, the following tax years and related taxing jurisdictions were open:
|
|
|
Open |
|
Years Under |
|
|
Taxing Jurisdiction |
|
Tax Year |
|
Exam |
|
|
Federal |
|
2014-2017 |
|
— |
|
|
California |
|
2013-2017 |
|
2013-2014 |
|
|
Other States |
|
2006-2017 |
|
2013-2015 |
|
6. EMPLOYEE BENEFITS
We maintain a qualified defined benefit pension plan (“Pension Plan”), which covers certain eligible employees. Benefits are based on years of service that continue to count toward early retirement calculations and vesting previously earned. No new participants may enter the Pension Plan and no further benefits will accrue.
We also have a limited number of supplemental retirement plans to provide certain key employees and retirees with additional retirement benefits. These plans are funded on a pay‑as‑you‑go basis and the accrued pension obligation is largely included in other long‑term obligations. We paid $8.7 million, $8.7 million and $8.5 million in 2017, 2016 and 2015, respectively, for these plans. We also provide or subsidize certain life insurance benefits for employees.
As discussed more fully in Note 1, we recently adopted ASU No. 2017-07, which provides guidance on presentation of service costs and the other components of net retirement expenses.
Service costs represent the annual growth in benefits earned by participants over the 12 months of the fiscal year. Since our Pension Plan is frozen and no benefits continue to accrue for our participants, we have determined in connection with the adoption of ASU 2017-07 that service costs are zero for all periods presented. Historically, we have included expenses paid from the Pension Plan trust, including Public Benefit Guaranty Corporation (PBGC), audit, actuarial, legal and administrative fees as service costs in our footnote presentation of the components of net periodic pension cost. We have determined that the vast majority of these types of expenses reflect a reduction to the expected return on plan assets because they reduce the expected growth of the trust assets. As such, we have elected to reclassify the trust-paid expenses related to our Pension Plan as a reduction to expected return on plan assets for all periods presented. For 2016
61
THE MCCLATCHY COMPANY
NOTES TO CONSOLIDATED FINANCIAL STATEMENTS
YEARS ENDED DECEMBER 31, 2017, DECEMBER 25, 2016, AND DECEMBER 27, 2015
and 2015, we have reclassified service costs of $18.8 million and $11.7 million, respectively, as an offset to expected return on plan assets in the table below. This change in presentation had no impact on net retirement expenses.
The following tables provide reconciliations of the pension and post‑ retirement benefit plans’ benefit obligations, fair value of assets and funded status as of December 31, 2017, and December 25, 2016:
|
|
|
Pension Benefits |
|
Post-retirement Benefits |
|
||||||||
|
(in thousands) |
|
2017 |
|
2016 |
|
2017 |
|
2016 |
|
||||
|
Change in Benefit Obligation |
|
|
|
|
|
|
|
|
|
|
|
|
|
|
Benefit obligation, beginning of year |
|
$ |
1,941,907 |
|
$ |
1,931,320 |
|
$ |
7,403 |
|
$ |
9,883 |
|
|
Interest cost |
|
|
85,468 |
|
|
88,668 |
|
|
271 |
|
|
389 |
|
|
Plan participants’ contributions |
|
|
— |
|
|
— |
|
|
12 |
|
|
21 |
|
|
Actuarial (gain)/loss |
|
|
152,353 |
|
|
78,058 |
|
|
707 |
|
|
(1,937) |
|
|
Gross benefits paid |
|
|
(99,715) |
|
|
(106,639) |
|
|
(768) |
|
|
(953) |
|
|
Plan settlements (1) |
|
|
— |
|
|
(49,500) |
|
|
— |
|
|
— |
|
|
Benefit obligation, end of year |
|
$ |
2,080,013 |
|
$ |
1,941,907 |
|
$ |
7,625 |
|
$ |
7,403 |
|
|
|
|
Pension Benefits |
|
Post-retirement Benefits |
|
||||||||
|
(in thousands) |
|
2017 |
|
2016 |
|
2017 |
|
2016 |
|
||||
|
Change in Plan Assets |
|
|
|
|
|
|
|
|
|
|
|
|
|
|
Fair value of plan assets, beginning of year |
|
$ |
1,335,435 |
|
$ |
1,349,603 |
|
$ |
— |
|
$ |
— |
|
|
Actual return on plan assets |
|
|
233,495 |
|
|
86,154 |
|
|
— |
|
|
— |
|
|
Employer contribution |
|
|
8,711 |
|
|
55,817 |
|
|
756 |
|
|
932 |
|
|
Plan participants’ contributions |
|
|
— |
|
|
— |
|
|
12 |
|
|
21 |
|
|
Gross benefits paid |
|
|
(99,715) |
|
|
(106,639) |
|
|
(768) |
|
|
(953) |
|
|
Plan settlements (1) |
|
|
— |
|
|
(49,500) |
|
|
— |
|
|
— |
|
|
Fair value of plan assets, end of year |
|
$ |
1,477,926 |
|
$ |
1,335,435 |
|
$ |
— |
|
$ |
— |
|
|
(1) |
During 2016, the pension plan purchased annuities and settled obligations for a group of annuitants including retirees and surviving beneficiaries who currently receive a benefit of $180.00 per month or less from the Pension Plan. |
|
|
|
Pension Benefits |
|
Post-retirement Benefits |
|
||||||||
|
(in thousands) |
|
2017 |
|
2016 |
|
2017 |
|
2016 |
|
||||
|
Funded Status |
|
|
|
|
|
|
|
|
|
|
|
|
|
|
Fair value of plan assets |
|
$ |
1,477,926 |
|
$ |
1,335,435 |
|
$ |
— |
|
$ |
— |
|
|
Benefit obligations |
|
|
(2,080,013) |
|
|
(1,941,907) |
|
|
(7,625) |
|
|
(7,403) |
|
|
Funded status and amount recognized, end of year |
|
$ |
(602,087) |
|
$ |
(606,472) |
|
$ |
(7,625) |
|
$ |
(7,403) |
|
62
THE MCCLATCHY COMPANY
NOTES TO CONSOLIDATED FINANCIAL STATEMENTS
YEARS ENDED DECEMBER 31, 2017, DECEMBER 25, 2016, AND DECEMBER 27, 2015
Amounts recognized in the consolidated balance sheets at December 31, 2017, and December 25, 2016, consists of:
|
|
|
Pension Benefits |
|
Post-retirement Benefits |
|
|||||||||||||
|
(in thousands) |
|
2017 |
|
2016 |
|
2017 |
|
2016 |
|
|||||||||
|
Current liability |
|
$ |
(8,941) |
|
$ |
(8,647) |
|
$ |
(1,008) |
|
$ |
(1,063) |
|
|||||
|
Noncurrent liability |
|
|
(593,146) |
|
|
(597,825) |
|
|
(6,617) |
|
|
(6,340) |
|
|||||
|
|
|
$ |
(602,087) |
|
$ |
(606,472) |
|
$ |
(7,625) |
|
$ |
(7,403) |
|
|||||
Amounts recognized in accumulated other comprehensive income for the years ended December 31, 2017, and December 25, 2016, consist of:
|
|
|
Pension Benefits |
|
Post-retirement Benefits |
|
||||||||
|
(in thousands) |
|
2017 |
|
2016 |
|
2017 |
|
2016 |
|
||||
|
Net actuarial loss/(gain) |
|
$ |
757,096 |
|
$ |
769,004 |
|
$ |
(7,820) |
|
$ |
(8,745) |
|
|
Prior service cost/(credit) |
|
|
— |
|
|
— |
|
|
(6,534) |
|
|
(9,414) |
|
|
|
|
$ |
757,096 |
|
$ |
769,004 |
|
$ |
(14,354) |
|
$ |
(18,159) |
|
The elements of retirement and post‑retirement costs are as follows:
|
|
|
Years Ended |
|
|||||||
|
|
|
December 31, |
|
December 25, |
|
December 27, |
|
|||
|
(in thousands) |
|
2017 |
|
2016 |
|
2015 |
|
|||
|
Pension plans: |
|
|
|
|
|
|
|
|
|
|
|
Interest Cost |
|
$ |
85,468 |
|
$ |
88,668 |
|
$ |
84,994 |
|
|
Expected return on plan assets |
|
|
(89,569) |
|
|
(89,629) |
|
|
(94,603) |
|
|
Actuarial loss |
|
|
20,335 |
|
|
18,382 |
|
|
22,194 |
|
|
Net pension expense |
|
|
16,234 |
|
|
17,421 |
|
|
12,585 |
|
|
Net post-retirement benefit credit |
|
|
(2,830) |
|
|
(2,645) |
|
|
(2,614) |
|
|
Net retirement expenses |
|
$ |
13,404 |
|
$ |
14,776 |
|
$ |
9,971 |
|
Our discount rate was determined by matching a portfolio of long‑term, non‑callable, high-quality bonds to the plans’ projected cash flows.
Weighted average assumptions used for valuing benefit obligations were:
|
|
|
Pension Benefit |
|
Post-retirement |
|
||||
|
|
|
Obligations |
|
Obligations |
|
||||
|
|
|
2017 |
|
2016 |
|
2017 |
|
2016 |
|
|
Discount rate |
|
3.91 |
% |
4.52 |
% |
3.60 |
% |
3.95 |
% |
Weighted average assumptions used in calculating expense:
|
|
|
Pension Benefit Expense |
|
Post-retirement Expense |
|
|
||||||||
|
|
|
December 31, |
|
December 25, |
|
December 27, |
|
December 31, |
|
December 25, |
|
December 27, |
|
|
|
|
|
2017 |
|
2016 |
|
2015 |
|
2017 |
|
2016 |
|
2015 |
|
|
|
Expected long-term return on plan assets |
|
7.75 |
% |
7.75 |
% |
7.75 |
% |
N/A |
|
N/A |
|
N/A |
|
|
|
Discount rate |
|
4.52 |
% |
4.71 |
% |
4.24 |
% |
3.95 |
% |
4.21 |
% |
3.69 |
% |
|
Contributions and Cash Flows
In February 2016, we voluntarily contributed certain of our real property appraised at $47.1 million to our Pension Plan, and we entered into leases for the contributed properties. We expected our required pension contribution under the Employee Retirement Income Security Act to be approximately $2.0 million in 2016, and the contribution of real
63
THE MCCLATCHY COMPANY
NOTES TO CONSOLIDATED FINANCIAL STATEMENTS
YEARS ENDED DECEMBER 31, 2017, DECEMBER 25, 2016, AND DECEMBER 27, 2015
property exceeded our required pension contribution for 2016. The contribution and leaseback of these properties in 2016 was treated as a financing transaction and, accordingly, we continue to depreciate the carrying value of the properties in our financial statements. No gain or loss will be recognized on the contributions until the sale of the property by the Pension Plan. At the time of our contribution, our pension obligation was reduced and a financing obligation was recorded. The financing obligation will be reduced by a portion of the lease payments made to the Pension Plan each month.
We did not have a required cash minimum contribution to the Pension Plan in 2017 or 2015 and made no voluntary cash contributions.
Expected benefit payments to retirees under our retirement and post‑retirement plans over the next 10 years are summarized below:
|
|
|
Retirement |
|
Post-retirement |
|
||
|
(in thousands) |
|
Plans (1) |
|
Plans |
|
||
|
2018 |
|
$ |
107,928 |
|
$ |
1,008 |
|
|
2019 |
|
|
111,699 |
|
|
919 |
|
|
2020 |
|
|
111,894 |
|
|
840 |
|
|
2021 |
|
|
115,898 |
|
|
768 |
|
|
2022 |
|
|
119,016 |
|
|
698 |
|
|
2023-2027 |
|
|
615,986 |
|
|
2,612 |
|
|
Total |
|
$ |
1,182,421 |
|
$ |
6,845 |
|
|
(1) |
Largely to be paid from the qualified defined benefit pension plan. |
Pension Plan Assets
Our investment policies are designed to maximize Pension Plan returns within reasonable and prudent levels of risk, with an investment horizon of greater than 10 years so that interim investment returns and fluctuations are viewed with appropriate perspective. The policy also aims to maintain sufficient liquid assets to provide for the payment of retirement benefits and plan expenses, hence, small portions of the equity and debt investments are held in marketable mutual funds.
Our policy seeks to provide an appropriate level of diversification of assets, as reflected in its target allocations, as well as limits placed on concentrations of equities in specific sectors or industries. It uses a mix of active managers and passive index funds and a mix of separate accounts, mutual funds, common collective trusts and other investment vehicles.
Our assumed long‑term return on assets was developed using a weighted average return based upon the Pension Plan’s portfolio of assets and expected returns for each asset class, taking into account projected inflation, interest rates and market returns. The assumed return was also reviewed in light of historical and recent returns in total and by asset class.
As of December 31, 2017, and December 25, 2016, the target allocations for the Pension Plan assets were 61% equity securities, 33% debt securities and 6% real estate securities.
64
THE MCCLATCHY COMPANY
NOTES TO CONSOLIDATED FINANCIAL STATEMENTS
YEARS ENDED DECEMBER 31, 2017, DECEMBER 25, 2016, AND DECEMBER 27, 2015
The table below summarizes the Pension Plan’s financial instruments that are carried at fair value on a recurring basis by the fair value hierarchy levels discussed above, as of the year ended December 31, 2017:
|
|
|
2017 |
|
|||||||||||||
|
|
|
Plan Assets |
|
|||||||||||||
|
(in thousands) |
|
Level 1 |
|
Level 2 |
|
Level 3 |
|
NAV |
|
Total |
|
|||||
|
Cash and cash equivalents |
|
$ |
8,498 |
|
$ |
— |
|
$ |
— |
|
$ |
— |
|
$ |
8,498 |
|
|
Mutual funds |
|
|
478,565 |
|
|
— |
|
|
— |
|
|
— |
|
|
478,565 |
|
|
Common collective trusts |
|
|
— |
|
|
— |
|
|
— |
|
|
923,304 |
|
|
923,304 |
|
|
Real estate |
|
|
— |
|
|
— |
|
|
58,050 |
|
|
— |
|
|
58,050 |
|
|
Private equity funds |
|
|
— |
|
|
— |
|
|
9,509 |
|
|
— |
|
|
9,509 |
|
|
Total |
|
$ |
487,063 |
|
$ |
— |
|
$ |
67,559 |
|
$ |
923,304 |
|
$ |
1,477,926 |
|
The table below summarizes changes in the fair value of the Pension Plan’s Level 3 investment assets held for the year ended December 31, 2017:
|
(in thousands) |
|
Real Estate |
|
Private Equity |
|
Total |
|
|||
|
Beginning Balance, December 25, 2016 |
|
$ |
57,531 |
|
$ |
8,149 |
|
$ |
65,680 |
|
|
Realized gains (losses) |
|
|
4,632 |
|
|
— |
|
|
4,632 |
|
|
Transfer in or out of level 3 |
|
|
(4,614) |
|
|
— |
|
|
(4,614) |
|
|
Unrealized gains (losses) |
|
|
501 |
|
|
1,360 |
|
|
1,861 |
|
|
Ending Balance, December 31, 2017 |
|
$ |
58,050 |
|
$ |
9,509 |
|
$ |
67,559 |
|
The table below summarizes the Pension Plan’s financial instruments that are carried at fair value on a recurring basis by the fair value hierarchy levels discussed above, as of the year ended December 25, 2016:
|
|
|
2016 |
|
|||||||||||||
|
|
|
Plan Assets |
|
|||||||||||||
|
(in thousands) |
|
Level 1 |
|
Level 2 |
|
Level 3 |
|
NAV |
|
Total |
|
|||||
|
Cash and cash equivalents |
|
$ |
677 |
|
$ |
— |
|
$ |
— |
|
$ |
— |
|
$ |
677 |
|
|
Mutual funds |
|
|
444,698 |
|
|
— |
|
|
— |
|
|
— |
|
|
444,698 |
|
|
Common collective trusts |
|
|
— |
|
|
— |
|
|
— |
|
|
816,435 |
|
|
816,435 |
|
|
Real estate |
|
|
— |
|
|
— |
|
|
57,531 |
|
|
— |
|
|
57,531 |
|
|
Private equity funds |
|
|
— |
|
|
— |
|
|
8,149 |
|
|
— |
|
|
8,149 |
|
|
Total |
|
$ |
445,375 |
|
$ |
— |
|
$ |
65,680 |
|
$ |
816,435 |
|
$ |
1,327,490 |
|
|
Pending trades |
|
|
|
|
|
|
|
|
|
|
|
|
|
|
7,945 |
|
|
|
|
|
|
|
|
|
|
|
|
|
|
|
|
$ |
1,335,435 |
|
65
THE MCCLATCHY COMPANY
NOTES TO CONSOLIDATED FINANCIAL STATEMENTS
YEARS ENDED DECEMBER 31, 2017, DECEMBER 25, 2016, AND DECEMBER 27, 2015
The table below summarizes changes in the fair value of the Pension Plan’s Level 3 investment assets held for the year ended December 25, 2016:
|
(in thousands) |
|
Real Estate |
|
Private Equity |
|
Total |
|
|||
|
Beginning Balance, December 27, 2015 |
|
$ |
50,360 |
|
$ |
7,282 |
|
$ |
57,642 |
|
|
Purchases, issuances, sales, settlements |
|
|
47,130 |
|
|
(186) |
|
|
46,944 |
|
|
Realized gains |
|
|
8,746 |
|
|
— |
|
|
8,746 |
|
|
Transfer in or out of level 3 |
|
|
(43,046) |
|
|
— |
|
|
(43,046) |
|
|
Unrealized gains |
|
|
(5,659) |
|
|
1,053 |
|
|
(4,606) |
|
|
Ending Balance, December 25, 2016 |
|
$ |
57,531 |
|
$ |
8,149 |
|
$ |
65,680 |
|
Cash and cash equivalents: The carrying value of these items approximates fair value.
Mutual funds: These investments are publicly traded investments, which are valued using the Net Asset Value (NAV). The NAV of the mutual funds is a quoted price in an active market. The NAV is determined once a day after the closing of the exchange based upon the underlying assets in the fund, less the fund’s liabilities, expressed on a per‑share basis.
Corporate debt instruments: The fair value of corporate debt instruments is based on yields currently available on comparable securities of issuers with similar credit ratings. When quoted prices are not available for identical or similar debt instruments, the fair value is based upon an industry valuation model, which maximizes observable inputs.
Common collective trusts: These investments are valued based on the NAV of the underlying investments and are provided by the fund issuers. NAV for these funds represent the quoted price in a non‑market environment. There are no restrictions on participants’ ability to withdraw funds from the common collective trusts. The attributes relating to the nature and risk of such investments are as follows:
|
(in thousands) |
2017 |
|
2016 |
|
Redemption Frequency (if Currently Eligible) |
|
Redemption Notice Period |
||
|
U.S equity funds (1) |
$ |
353,555 |
|
$ |
310,616 |
|
Daily |
|
None |
|
International equity funds (2) |
|
569,749 |
|
|
505,819 |
|
Daily-Monthly |
|
None |
|
Total |
$ |
923,304 |
|
$ |
816,435 |
|
|
|
|
________________
|
(1) |
U.S. equity fund strategies - Investments in U.S. equities are defined as commitments to U.S. dollar-denominated, publicly traded common stocks of U.S. domiciled companies and securities convertible into common stock. The aggregate U.S. equity portfolio is expected to exhibit characteristics comparable to, but not necessarily equal to, that of the Russell 3000 Index. |
|
(2) |
International equity funds strategies - Investments in international developed markets equities are defined as commitments to publicly traded common stocks and securities convertible into common stock issued by companies primarily domiciled in countries outside of the U.S. |
Real estate: In February 2016, we contributed certain of our real property appraised at $47.1 million to our Pension Plan, and we entered into leaseback arrangements for the contributed facilities. The Pension Plan obtained independent appraisals of the property, and based on these appraisals, the Pension Plan recorded the contribution at fair value. This contribution was measured at fair value using Level 3 inputs, which primarily consisted of expected cash flows and discount rate that we estimated market participants would seek for bearing the risk associated with such assets. The properties are managed on behalf of the Pension Plan by an independent fiduciary, and the terms of the leases between us and the Pension Plan were negotiated with the fiduciary. We leased back the contributed facilities under 11-year leases with initial annual payments totaling approximately $3.5 million. A similar contribution of properties was made to the Pension Plan in 2011, and the accounting treatment for both contributions is described below.
The contributions and leasebacks of these properties are treated as financing transactions and, accordingly, we continue to depreciate the carrying value of the properties in our financial statements. No gain or loss will be recognized on the contributions of any property until the sale of the property by the Pension Plan. At the time of our contributions, our pension obligation was reduced and our financing obligations were recorded equal to the fair market value of the properties. The financing obligations are reduced by a portion of the lease payments made to the Pension Plan each
66
THE MCCLATCHY COMPANY
NOTES TO CONSOLIDATED FINANCIAL STATEMENTS
YEARS ENDED DECEMBER 31, 2017, DECEMBER 25, 2016, AND DECEMBER 27, 2015
month, and increased for imputed interest expense on the obligations to the extent imputed interest exceeds monthly payments.
Certain properties from the 2011 contributions have been sold by the Pension Plan and others may be sold by the Pension Plan in the future.
In May 2016, the Pension Plan sold certain real property in Charlotte, North Carolina, for approximately $34.3 million, and we terminated our lease on the property. The property was included in the 2011 contributions to the Pension Plan discussed previously. As a result of the sale by the Pension Plan, we recognized a $1.1 million loss on the sale of the Charlotte property in the other operating expenses on the consolidated statement of operations for 2016. At the time of sale, our financial obligation was reduced by $25.1 million and we derecognized the assets with a carrying value of $26.2 million from PP&E.
In October 2016, the Pension Plan sold certain real property in Olympia, Washington, for approximately $4.8 million. The property was included in the 2011 contributions to the Pension Plan discussed previously. As a result of the sale by the Pension Plan, we recognized approximately $0.2 million loss on the sale of the Olympia property in other operating expenses on the consolidated statement of operations during the quarter ended December 25, 2016. At the time of sale, our financial obligation was reduced by $2.6 million and we derecognized the assets with a carrying value of $2.8 million from PP&E.
Private equity funds: Private equity funds represent investments in limited partnerships, which invest in start‑up or other private companies. Fair value was estimated based on valuations of comparable public companies, recent sales of comparable private and public companies and discounted cash flow analysis of portfolio companies and was measured using Level 3 inputs.
401(k) Plan
We have a deferred compensation plan (“401(k) plan”), which enables eligible employees to voluntarily defer compensation. During the fourth quarter of 2017, we announced the reinstatement of a company matching contribution program beginning with the first pay check paid in 2018. The company matching contributions had been previously suspended in 2009. Also during the fourth quarter of 2017, we terminated the 401(k) plan supplemental contribution that was tied to performance, effective immediately.
7. CASH FLOW INFORMATION
Cash paid for interest and income taxes and other non-cash activities consisted of the following:
|
|
|
Year Ended |
|
|||||||
|
|
|
December 31, |
|
December 25, |
|
December 27, |
|
|||
|
(in thousands) |
|
2017 |
|
2016 |
|
2015 |
|
|||
|
Interest paid (net of amount capitalized) |
|
$ |
68,861 |
|
$ |
73,373 |
|
$ |
80,514 |
|
|
Income taxes paid (net of refunds) |
|
|
12,437 |
|
|
2,454 |
|
|
207,043 |
|
|
|
|
|
|
|
|
|
|
|
|
|
|
Other non-cash investing and financing activities related to pension plan transactions: |
|
|
|
|
|
|
|
|
|
|
|
Increase of financing obligation for contribution of real property to pension plan |
|
|
— |
|
|
47,130 |
|
|
— |
|
|
Reduction of pension obligation for contribution of real property to pension plan |
|
|
— |
|
|
(47,130) |
|
|
— |
|
|
Reduction of financing obligation due to sale of real properties by pension plan |
|
|
— |
|
|
(27,632) |
|
|
— |
|
|
Reduction of PP&E due to sale of real properties by pension plan |
|
|
— |
|
|
(29,002) |
|
|
— |
|
The income tax payments in 2015 were primarily related to the net taxes paid for a gain on the sale of a previously owned equity investment in the fourth quarter of 2014, offset by tax losses on bond repurchases in the fourth quarter of 2014. While the transactions occurred in the fourth quarter 2014, the actual tax payments were made in the first quarter of 2015.
67
THE MCCLATCHY COMPANY
NOTES TO CONSOLIDATED FINANCIAL STATEMENTS
YEARS ENDED DECEMBER 31, 2017, DECEMBER 25, 2016, AND DECEMBER 27, 2015
Other non-cash investing and financing activities related to pension plan transactions consists of the contribution of real property to the Pension Plan in 2016, the sale of two of the properties by the Pension Plan in 2016, described further in Note 6.
For 2017, the $7.3 million in distributions from CareerBuilder, which represented a return of investment, was recorded as an investing activity. For 2016 and 2015, distributions from CareerBuilder of $6.0 million and $7.5 million, respectively, represented a return on investment, and were recorded as operating activities on our consolidated statements of cash flows.
Other non-cash investing activities from operations, related to the recognition of intangible assets during 2016 were $3.1 million. There were no such transactions in 2017 or 2015.
8. COMMITMENTS AND CONTINGENCIES
We have certain other obligations for various contractual agreements that secure future rights to goods and services to be used in the normal course of operations. These include purchase commitments for printing outsource agreements, planned capital expenditures, lease commitments and self‑insurance obligations.
The following table summarizes our minimum annual contractual obligations as of December 31, 2017:
|
|
|
Payments Due By Period |
|
|||||||||||||||||||
|
(in thousands) |
|
2018 |
|
2019 |
|
2020 |
|
2021 |
|
2022 |
|
Thereafter |
|
Total |
|
|||||||
|
Purchase obligations (1) |
|
$ |
19,674 |
|
$ |
16,956 |
|
$ |
4,085 |
|
$ |
1,227 |
|
$ |
— |
|
$ |
— |
|
$ |
41,942 |
|
|
Operating leases (2) |
|
|
|
|
|
|
|
|
|
|
|
|
|
|
|
|
|
|
|
|
|
|
|
Lease obligations |
|
|
12,763 |
|
|
11,301 |
|
|
10,396 |
|
|
9,602 |
|
|
9,420 |
|
|
39,406 |
|
|
92,888 |
|
|
Sublease income |
|
|
(3,837) |
|
|
(2,150) |
|
|
(637) |
|
|
(572) |
|
|
(565) |
|
|
(634) |
|
|
(8,395) |
|
|
Net lease obligation |
|
|
8,926 |
|
|
9,151 |
|
|
9,759 |
|
|
9,030 |
|
|
8,855 |
|
|
38,772 |
|
|
84,493 |
|
|
Workers’ compensation obligations (3) |
|
|
2,593 |
|
|
1,578 |
|
|
1,127 |
|
|
844 |
|
|
668 |
|
|
5,300 |
|
|
12,110 |
|
|
Total |
|
$ |
31,193 |
|
$ |
27,685 |
|
$ |
14,971 |
|
$ |
11,101 |
|
$ |
9,523 |
|
$ |
44,072 |
|
$ |
138,545 |
|
|
(1) |
Represents our purchase obligations primarily related to printing outsource agreements and capital expenditures for PP&E expiring at various dates through 2021. |
|
(2) |
Represents minimum rental commitments under operating leases with non‑cancelable terms in excess of one year and sublease income from leased space with non-cancelable terms in excess of one year. We rent certain facilities and equipment under operating leases expiring at various dates through 2028. Total rental expense, included in other operating expenses, amounted to $13.4 million, $15.4 million and $11.6 million in 2017, 2016 and 2015, respectively. Most of the leases provide that we pay taxes, maintenance, insurance and certain other operating expenses applicable to the leased premises in addition to the minimum monthly payments. Some of the operating leases have built in escalation clauses. We sublease office space to other companies under non-cancellable agreements that expire at various dates through 2023. Sublease income from operating leases totaled $4.8 million, $4.6 million and $4.6 million in 2017, 2016 and 2015, respectively. |
|
(3) |
We retain the risk for workers’ compensation resulting from uninsured deductibles per accident or occurrence that are subject to annual aggregate limits. Losses up to the deductible amounts are accrued based upon known claims incurred and an estimate of claims incurred but not reported. For the year ended December 31, 2017, we compiled our historical data pertaining to the self‑insurance experiences and actuarially developed the ultimate loss associated with our self‑insurance programs for workers’ compensation liability. We believe that the actuarial valuation provides the best estimate of the ultimate losses to be expected under these programs. At December 31, 2017, the undiscounted ultimate losses of all our self‑insurance reserves related to our workers’ compensation liabilities were $13.0 million, net of estimated insurance recoveries of approximately $2.2 million. At December 25, 2016, the undiscounted ultimate losses of all our self-insurance reserves related to workers’ compensation liabilities were $12.2 million, net of estimated insurance recoveries of approximately $3.2 million. |
68
THE MCCLATCHY COMPANY
NOTES TO CONSOLIDATED FINANCIAL STATEMENTS
YEARS ENDED DECEMBER 31, 2017, DECEMBER 25, 2016, AND DECEMBER 27, 2015
We discount the net amounts above to present value using an approximate risk‑free rate over the average life of our insurance claims. For the years ended December 31, 2017, and December 25, 2016, the discount rate used was 2.3% and 1.6%, respectively. The present value of all self‑insurance reserves, net of estimated insurance recoveries, for our workers’ compensation liability recorded at December 31, 2017, and December 25, 2016, was $12.1 million and $13.1 million, respectively.
Legal Proceedings and other contingent claims
In December 2008, carriers of The Fresno Bee filed a class action lawsuit against us and The Fresno Bee in the Superior Court of the State of California in Fresno County captioned Becerra v. The McClatchy Company (“Fresno case”) alleging that the carriers were misclassified as independent contractors and seeking mileage reimbursement. In February 2009, a substantially similar lawsuit, Sawin v. The McClatchy Company, involving similar allegations was filed by carriers of The Sacramento Bee (“Sacramento case”) in the Superior Court of the State of California in Sacramento County. The class consists of roughly 5,000 carriers in the Sacramento case and 3,500 carriers in the Fresno case. The plaintiffs in both cases are seeking unspecified restitution for mileage reimbursement. With respect to the Sacramento case, in September 2013, all wage and hour claims were dismissed and the only remaining claim is an equitable claim for mileage reimbursement under the California Civil Code. In the Fresno case, in March 2014, all wage and hour claims were dismissed and the only remaining claim is an equitable claim for mileage reimbursement under the California Civil Code.
The court in the Sacramento case trifurcated the trial into three separate phases: independent contractor status, liability and restitution. On September 22, 2014, the court in the Sacramento case issued a tentative decision following the first phase, finding that the carriers that contracted directly with The Sacramento Bee during the period from February 2005 to July 2009 were misclassified as independent contractors. We objected to the tentative decision but the court ultimately adopted it as final. In June 2016, The McClatchy Company was dismissed from the lawsuit, leaving The Sacramento Bee as the sole defendant. On August 30, 2017, the court issued a statement of decision ruling that the court would not hold a phase two trial but would, instead, assume liability from the evidence previously submitted and from the independent contractor agreements. We objected to this decision but the court adopted it as final. There have been no additional decisions issued by the court as to the third phase.
The court in the Fresno case bifurcated the trial into two separate phases: the first phase addressed independent contractor status and liability for mileage reimbursement and the second phase was designated to address restitution, if any. The first phase of the Fresno case began in the fourth quarter of 2014 and concluded in late March 2015. On April 14, 2016, the court in the Fresno case issued a statement of final decision in favor of us and The Fresno Bee. Accordingly, there will be no second phase. The plaintiffs filed a Notice of Appeal on November 10, 2016.
We continue to defend these actions vigorously and expect that we will ultimately prevail. As a result, we have not established a reserve in connection with the cases. While we believe that a material impact on our consolidated financial position, results of operations or cash flows from these claims is unlikely, given the inherent uncertainty of litigation, a possibility exists that future adverse rulings or unfavorable developments could result in future charges that could have a material impact. We have and will continue to periodically reexamine our estimates of probable liabilities and any associated expenses and make appropriate adjustments to such estimates based on experience and developments in litigation.
In January 2016, Ponderay Newsprint Company (“PNC”), a general partnership that owns and operates a newsprint mill in the state of Washington, and of which three of our wholly-owned subsidiaries own a combined 27% interest, filed a complaint in the Superior Court of the State of Washington seeking declaratory judgment and alleging breach of contract and breach of the duty of good faith and fair dealing against Public Utility District No. 1 of Pend Oreille County (“PUD”) relating to the industrial power supply contracts. In March 2016, the PUD filed a counterclaim against PNC and a third-party complaint against the individual partners of PNC, alleging breach of contract. This matter has been fully resolved by the parties and the Court dismissed all claims, with prejudice, on February 7, 2018.
Other than the cases described above, we are subject to a variety of legal proceedings (including libel, employment, wage and hour, independent contractor and other legal actions) and governmental proceedings (including environmental matters) that arise from time to time in the ordinary course of our business. We are unable to estimate the amount or
69
THE MCCLATCHY COMPANY
NOTES TO CONSOLIDATED FINANCIAL STATEMENTS
YEARS ENDED DECEMBER 31, 2017, DECEMBER 25, 2016, AND DECEMBER 27, 2015
range of reasonably possible losses for these matters. However, we currently believe, after reviewing such actions with counsel, that the expected outcome of pending actions will not have a material effect on our consolidated financial statements. No material amounts for any losses from litigation that may ultimately occur have been recorded in the consolidated financial statements as we believe that any such losses are not probable.
We have certain indemnification obligations related to the sale of assets including but not limited to insurance claims and multi‑employer pension plans of disposed newspaper operations. We believe the remaining obligations related to disposed assets will not be material to our financial position, results of operations or cash flows.
As of December 31, 2017, we had $31.7 million of standby letters of credit secured under the LC Agreement. The amounts of standby letters of credit declined to $29.7 million in January 2018.
9. COMMON STOCK AND STOCK PLANS
Common Stock
We have two classes of stock; Class A and Class B Common Stock. Both classes of stock participate equally in dividends. Holders of Class B are entitled to one vote per share and to elect as a class 75% of the Board of Directors, rounded down to the nearest whole number. Holders of Class A Common Stock are entitled to one-tenth of a vote per share and to elect as a class 25% of the Board of Directors, rounded up to the nearest whole number.
Class B Common Stock is convertible at the option of the holder into Class A Common Stock on a share‑for‑share basis.
The holders of shares of Class B Common Stock are parties to an agreement, the intent of which is to preserve control of the Company by the McClatchy family. Under the terms of the agreement, the Class B shareholders have agreed to restrict the transfer of any shares of Class B Common Stock to one or more “Permitted Transferees,” subject to certain exceptions. A “Permitted Transferee” is any of our current holders of shares of Class B Common Stock; any lineal descendant of Charles K. McClatchy (1858 to 1936); or a trust for the exclusive benefit of, or in which all of the remainder beneficial interests are owned by, one or more lineal descendants of Charles K. McClatchy.
Generally, Class B shares can be converted into shares of Class A Common Stock and then transferred freely (unless, following conversion, the outstanding shares of Class B Common Stock would constitute less than 25% of the total number of all our outstanding shares of common stock). In the event that a Class B shareholder attempts to transfer any shares of Class B Common Stock in violation of the agreement, or upon the happening of certain other events enumerated in the agreement as “Option Events,” each of the remaining Class B shareholders has an option to purchase a percentage of the total number of shares of Class B Common Stock proposed to be transferred equal to such remaining Class B shareholder’s ownership percentage of the total number of outstanding shares of Class B Common Stock. If all the shares proposed to be transferred are not purchased by the remaining Class B shareholders, we have the option of purchasing the remaining shares. The agreement can be terminated by the vote of the holders of 80% of the outstanding shares of Class B Common Stock who are subject to the agreement. The agreement will terminate on September 17, 2047, unless terminated earlier in accordance with its terms.
In 2015, our Board of Directors authorized a share repurchase program for the repurchase of up to $15.0 million of our Class A Common Stock through December 31, 2016. This program was further amended in May 2016 to authorize a total of up to $20.0 million to repurchase shares. The shares were repurchased from time to time depending on prevailing market prices, availability, and market conditions, among other factors. During the year ended December 25, 2016, we repurchased approximately 0.7 million shares at an average price of $11.83 per share. Inception to date, we repurchased 1.3 million shares at an average price of $12.28 per share or $15.6 million of the total buyback approved.
70
THE MCCLATCHY COMPANY
NOTES TO CONSOLIDATED FINANCIAL STATEMENTS
YEARS ENDED DECEMBER 31, 2017, DECEMBER 25, 2016, AND DECEMBER 27, 2015
Stock Plans
During 2017, we had two stock‑based compensation plans, which are described below.
The McClatchy Company 2004 Stock Incentive Plan (“2004 Plan”) reserved 900,000 Class A Common shares for issuance to key employees and outside directors. The options vested in installments over four years, and once vested are exercisable up to 10 years from the date of grant. In addition, the 2004 Plan permitted the following type of incentive awards in addition to common stock, stock options and stock appreciation rights (“SARs”): restricted stock, unrestricted stock, stock units and dividend equivalent rights. The 2004 Plan was frozen in May 2012 so that no additional awards could be granted under the plan.
The McClatchy Company 2012 Omnibus Incentive Plan (“2012 Plan”) was adopted in 2012 and 500,000 shares of Class A Common Stock were reserved for issuance under the 2012 Plan plus the number of shares available for future awards under the 2004 Plan as of the date of May 16, 2012 (the shareholder meeting date) plus the number of shares subject to awards outstanding under the 2004 Plan as of May 16, 2012, which terminate by expiration, forfeiture, cancellation or otherwise without the issuance of such shares. The 2012 Plan was further amended in May 2017, among other things, to increase the number of shares of Class A Common Stock reserved for issuance by 500,000 shares. The 2012 Plan, as amended, generally provides for granting of stock options or SARs only at an exercise price at least equal to fair market value on the grant date; a 10-year maximum term for stock options and SARs; no re-pricing of stock options or SARs without prior shareholder approval; and no reload or “evergreen” share replenishment features.
Stock Plans Activity
In 2017, we granted 4,500 shares of Class A Common Stock to each non-employee director under the 2012 Plan. In accordance with The McClatchy Company Director Deferral Program (“Deferral Program”), two directors elected to defer issuance of their 2017 grants. As such, 36,000 shares were issued and 9,000 were deferred until the director terminates from the board of directors.
In 2016, we granted 4,500 shares of Class A Common Stock to each non-employee director under the 2012 Plan. Three directors elected to defer issuance of their 2016 grants under the Deferral Program. As such, 31,500 shares were issued and 13,500 were deferred until the director terminates from the board of directors. One of the directors who deferred his award in 2016 terminated from the board of directors during 2017 and therefore was issued his shares.
In 2015, we granted 1,500 shares of Class A Common Stock to each non‑employee director, resulting in the issuance of 15,000 shares from the 2012 Plan.
We granted restricted stock units (“RSUs”) at the grant date fair value to certain key employees under the 2012 Plan as summarized below. Fair value for RSUs is based on our Class A Common Stock closing price, as reported by the NYSE American, on the date of grant. The RSUs generally vest over three years after grant date but terms of each grant are at the discretion of the compensation committee of the board of directors.
71
THE MCCLATCHY COMPANY
NOTES TO CONSOLIDATED FINANCIAL STATEMENTS
YEARS ENDED DECEMBER 31, 2017, DECEMBER 25, 2016, AND DECEMBER 27, 2015
The following table summarizes the RSUs stock activity:
|
|
|
|
|
Weighted |
|
|
|
|
|
|
|
Average Grant |
|
|
|
|
|
|
|
Date Fair |
|
|
|
|
|
RSUs |
|
Value |
|
|
|
Nonvested — December 28, 2014 |
|
132,955 |
|
$ |
36.20 |
|
|
Granted |
|
136,530 |
|
$ |
22.80 |
|
|
Vested |
|
(97,000) |
|
$ |
28.50 |
|
|
Forfeited |
|
(18,605) |
|
$ |
30.80 |
|
|
Nonvested — December 27, 2015 |
|
153,880 |
|
$ |
29.83 |
|
|
Granted |
|
170,440 |
|
$ |
11.80 |
|
|
Vested |
|
(112,895) |
|
$ |
24.57 |
|
|
Forfeited |
|
(7,280) |
|
$ |
16.32 |
|
|
Nonvested — December 25, 2016 |
|
204,145 |
|
$ |
18.17 |
|
|
Granted |
|
254,405 |
|
$ |
9.99 |
|
|
Vested |
|
(206,776) |
|
$ |
16.14 |
|
|
Forfeited |
|
(5,980) |
|
$ |
12.86 |
|
|
Nonvested — December 31, 2017 |
|
245,794 |
|
$ |
11.55 |
|
As of December 31, 2017, the total fair value of the RSUs that vested during the period was $2.1 million. As of December 31, 2017, there were $1.7 million of unrecognized compensation costs for nonvested RSUs, which are expected to be recognized over 1.7 years.
When SARs are granted, they are granted at grant date fair value to certain key employees from the 2012 Plan. Fair value for SARs is determined using a Black-Scholes option valuation model that uses various assumptions, including expected life in years, volatility and risk-free interest rate. The SARs generally vest four years after grant date but terms of each grant is at the discretion of the compensation committee of the board of directors.
Outstanding SARs are summarized as follows:
|
|
|
|
|
Weighted |
|
Aggregate |
|
||
|
|
|
|
|
Average |
|
Intrinsic Value |
|
||
|
|
|
SARs |
|
Exercise Price |
|
(in thousands) |
|
||
|
Outstanding December 28, 2014 |
|
384,875 |
|
$ |
92.81 |
|
$ |
1,542 |
|
|
Forfeited |
|
(6,875) |
|
$ |
26.09 |
|
|
|
|
|
Expired |
|
(57,875) |
|
$ |
207.56 |
|
|
|
|
|
Outstanding December 27, 2015 |
|
320,125 |
|
$ |
73.49 |
|
$ |
— |
|
|
Forfeited |
|
(50) |
|
$ |
27.60 |
|
|
|
|
|
Expired |
|
(27,325) |
|
$ |
322.20 |
|
|
|
|
|
Outstanding December 25, 2016 |
|
292,750 |
|
$ |
50.29 |
|
$ |
— |
|
|
Expired |
|
(136,575) |
|
$ |
71.07 |
|
|
|
|
|
Outstanding December 31, 2017 |
|
156,175 |
|
$ |
32.12 |
|
$ |
— |
|
|
Vested and Expected to Vest December 31, 2017 |
|
156,175 |
|
$ |
32.12 |
|
$ |
— |
|
|
SARs exercisable: |
|
|
|
|
|
|
|
|
|
|
December 27, 2015 |
|
277,413 |
|
|
|
|
$ |
— |
|
|
December 25, 2016 |
|
279,100 |
|
|
|
|
$ |
— |
|
|
December 31, 2017 |
|
156,175 |
|
|
|
|
$ |
— |
|
As of December 31, 2017, there was no unrecognized compensation costs related to SARs granted under our plans. The weighted average remaining contractual life of SARs vested and exercisable at December 31, 2017, was 2.5 years.
72
THE MCCLATCHY COMPANY
NOTES TO CONSOLIDATED FINANCIAL STATEMENTS
YEARS ENDED DECEMBER 31, 2017, DECEMBER 25, 2016, AND DECEMBER 27, 2015
The following tables summarize information about SARs outstanding in the stock plans at December 31, 2017:
|
|
|
|
|
Average |
|
|
|
|
|
|
|
|
|
|
|
|
|
|
Remaining |
|
Weighted |
|
|
|
Weighted |
|
||
|
Range of Exercise |
|
SARs |
|
Contractual |
|
Average |
|
SARs |
|
Average |
|
||
|
Prices |
|
Outstanding |
|
Life |
|
Exercise Price |
|
Exercisable |
|
Exercise Price |
|
||
|
$17.00 – $27.60 |
|
85,925 |
|
2.82 |
|
$ |
25.03 |
|
85,925 |
|
$ |
25.03 |
|
|
$34.20 – $97.30 |
|
70,250 |
|
2.12 |
|
$ |
40.79 |
|
70,250 |
|
$ |
40.79 |
|
|
Total |
|
156,175 |
|
2.50 |
|
$ |
32.12 |
|
156,175 |
|
$ |
32.12 |
|
Stock‑Based Compensation
Total stock‑based compensation expense consisted of the following:
|
|
|
Years Ended |
|||||||
|
|
|
December 31, |
|
December 25, |
|
December 27, |
|||
|
(in thousands) |
|
2017 |
|
2016 |
|
2015 |
|||
|
Stock-based compensation expense |
|
$ |
2,475 |
|
$ |
3,130 |
|
$ |
3,178 |
10. QUARTERLY RESULTS OF OPERATIONS (UNAUDITED)
Our business is somewhat seasonal with peak revenues and profits generally occurring in the fourth quarter of each year as a result of increased advertising activity during the holiday season. The other quarters are historically slower quarters for revenues and profits. As discussed in Note 1, our fiscal year 2017 consisted of a 53-week period and therefore, each quarter represented 13 weeks, except for the quarter ended December 31, 2017, which was 14 weeks. All quarters in 2016 consisted of 13 weeks each. Our quarterly results are summarized as follows:
|
|
|
Quarters Ended |
|
||||||||||
|
|
|
March 26, |
|
June 25, |
|
September 24, |
|
December 31, |
|
||||
|
(in thousands, except per share amounts) |
|
2017 |
|
2017 |
|
2017 |
|
2017 |
|
||||
|
Net revenues |
|
$ |
221,212 |
|
$ |
225,120 |
|
$ |
212,604 |
|
$ |
244,656 |
|
|
Operating income (loss) |
|
$ |
(4,519) |
|
$ |
12,110 |
|
$ |
4,611 |
|
$ |
29,963 |
|
|
Net income (loss) |
|
$ |
(95,575) |
|
$ |
(37,446) |
|
$ |
(260,476) |
|
$ |
61,139 |
|
|
|
|
|
|
|
|
|
|
|
|
|
|
|
|
|
Net income (loss) per share - diluted |
|
$ |
(12.60) |
|
$ |
(4.91) |
|
$ |
(34.11) |
|
$ |
7.91 |
|
|
|
|
Quarters Ended |
|
||||||||||
|
|
|
March 27, |
|
June 26, |
|
September 25, |
|
December 25, |
|
||||
|
(in thousands, except per share amounts) |
|
2016 |
|
2016 |
|
2016 |
|
2016 |
|
||||
|
Net revenues |
|
$ |
237,979 |
|
$ |
242,234 |
|
$ |
234,701 |
|
$ |
262,179 |
|
|
Operating income (loss) |
|
$ |
(2,353) |
|
$ |
1,001 |
|
$ |
5,229 |
|
$ |
33,439 |
|
|
Net income (loss) |
|
$ |
(12,741) |
|
$ |
(14,734) |
|
$ |
(9,804) |
|
$ |
3,086 |
|
|
|
|
|
|
|
|
|
|
|
|
|
|
|
|
|
Net income (loss) per share - diluted |
|
$ |
(1.58) |
|
$ |
(1.89) |
|
$ |
(1.30) |
|
$ |
0.40 |
|
The following are significant activities in 2017:
|
· |
During the quarters ended March 26, 2017, and June 25, 2017, we recognized impairment charges of $123.0 million and $45.6 million, respectively, related our investment in CareerBuilder, as described in Note 2. |
|
· |
During the quarter ended September 24, 2017, we recognized masthead impairment charges of $8.7 million (see Note 1 and Note 3) and we recorded a valuation allowance charge related to our deferred tax assets of $245.4 million (see Note 1 and Note 5). |
73
THE MCCLATCHY COMPANY
NOTES TO CONSOLIDATED FINANCIAL STATEMENTS
YEARS ENDED DECEMBER 31, 2017, DECEMBER 25, 2016, AND DECEMBER 27, 2015
|
· |
During the quarter ended December 31, 2017, we recognized masthead impairment charges of $12.8 million as described in Note 1 and Note 3. We also recorded a reduction to our valuation allowance charge of $53.6 million along with a benefit of $5.5 million due to the Tax Act. (see Note 1 and Note 5) |
The following are significant activities in 2016:
|
· |
During the quarter ended December 25, 2016, we recognized masthead impairment charges of $9.2 million as described in Note 1 and Note 3. |
74
ITEM 9. CHANGES IN AND DISAGREEMENTS WITH ACCOUNTANTS ON ACCOUNTING AND FINANCIAL DISCLOSURE
Not applicable.
ITEM 9A. CONTROLS AND PROCEDURES
Evaluation of disclosure controls and procedures.
Our management evaluated, with the participation of our Chief Executive Officer (“CEO”) and Chief Financial Officer (“CFO”), the effectiveness of the design and operation of our disclosure controls and procedures (as defined in Rules 13a ‑ 15(e) or 15d ‑ 15(e) under the Securities Exchange Act of 1934, as amended) as of the end of the period covered by this Annual Report on Form 10‑K. Based on this evaluation, our management, including the CEO and CFO, concluded that our disclosure controls and procedures were effective at that time to ensure that information we are required to disclose in reports that we file or submit under the Securities Exchange Act of 1934 is accumulated and communicated to our management, including our principal executive and principal financial officers, as appropriate, to allow timely decisions regarding required disclosure and that such information is recorded, processed, summarized and reported within the time periods specified in the Securities and Exchange Commission Rules and Forms.
Changes in internal control over financial reporting.
There was no change in our internal control over financial reporting that occurred during the fourth fiscal quarter of fiscal 2017 that has materially affected, or is reasonably likely to materially affect, our internal control over financial reporting.
MANAGEMENT REPORT ON INTERNAL CONTROL OVER FINANCIAL REPORTING
The Company’s management is responsible for establishing and maintaining adequate internal control over financial reporting, as such term is defined in the Securities Exchange Act of 1934, as amended Rules 13a‑15(f). The Company’s internal control system over financial reporting is designed to provide reasonable assurance regarding the preparation and fair presentation of the Company’s financial statements presented in accordance with generally accepted accounting principles in the United States of America.
An internal control system over financial reporting has inherent limitations and may not prevent or detect misstatements. Therefore, even those systems determined to be effective can provide only reasonable assurance with respect to financial statement preparation and presentation.
Management of the Company assessed the effectiveness of the Company’s internal control over financial reporting as of December 31, 2017. In making this assessment, management used the criteria set forth by the Committee of Sponsoring Organizations of the Treadway Commission (COSO) in the Internal Control – Integrated Framework (2013 framework). Based on management’s assessment and those criteria, management believes that the Company’s internal control over financial reporting was effective as of December 31, 2017.
The McClatchy Company’s independent registered public accounting firm has issued an attestation report on the Company’s internal control over financial reporting. This report appears in Item 8 – “Financial Statements and Supplementary Data.”
Not Applicable.
75
ITEM 10. DIRECTORS, EXECUTIVE OFFICERS AND CORPORATE GOVERNANCE
Incorporated herein by reference from the proxy statement for the annual meeting of our stockholders to be filed pursuant to Regulation 14A within 120 days after our fiscal year‑end of December 31, 2017.
ITEM 11. EXECUTIVE COMPENSATION
Incorporated herein by reference from the proxy statement for the annual meeting of our stockholders to be filed pursuant to Regulation 14A within 120 days after our fiscal year‑end of December 31, 2017.
ITEM 12. SECURITY OWNERSHIP OF CERTAIN BENEFICIAL OWNERS AND MANAGEMENT AND RELATED STOCKHOLDER MATTERS
Incorporated herein by reference from the proxy statement for the annual meeting of our stockholders to be filed pursuant to Regulation 14A within 120 days after our fiscal year‑end of December 31, 2017.
ITEM 13. CERTAIN RELATIONSHIPS AND RELATED TRANSACTIONS, AND DIRECTOR INDEPENDENCE
Incorporated herein by reference from the proxy statement for the annual meeting of our stockholders to be filed pursuant to Regulation 14A within 120 days after our fiscal year‑end of December 31, 2017.
ITEM 14. PRINCIPAL ACCOUNTING FEES AND SERVICES
Incorporated herein by reference from the proxy statement for the annual meeting of our stockholders to be filed pursuant to Regulation 14A within 120 days after our fiscal year‑end of December 31, 2017.
76
ITEM 15. EXHIBITS, FINANCIAL STATEMENT SCHEDULES
(a) List of documents filed as part of this report:
1.Financial Statements
Our consolidated financial statements are as set forth under Item 8 of this report on Form 10-K.
2. Financial Statement Schedules
All schedules are omitted because they are not applicable, not required or the information is included in the consolidated financial statements.
3. Exhibits
|
|
|
|
Incorporated by reference herein |
||
|
Exhibit |
|
Description |
Form |
Exhibit |
File Date |
|
3.1 |
|
The Company’s Restated Certificate of Incorporation, dated June 26, 2006 |
10‑Q |
3.1 |
June 25, 2006 |
|
3.2 |
|
The Company’s Bylaws as amended and restated effective March 20, 2012 |
8‑K |
3.1 |
March 22, 2012 |
|
3.3 |
|
Amended and restated Certificate of Incorporation of The McClatchy Company |
8‑K |
3.1 |
June 7, 2016 |
|
10.1 |
|
8‑K |
10.3 |
September 30, 2008 |
|
|
10.2 |
|
8‑K |
10.2 |
September 30, 2008 |
|
|
10.3 |
|
8‑K |
10.1 |
June 25, 2012 |
|
|
10.4 |
|
8‑K |
10.1 |
December 20, 2012 |
|
|
10.5 |
|
8‑K |
10.1 |
October 23, 2014 |
|
|
10.6 |
|
8-K |
10.2 |
January 11, 2017 |
|
|
10.7 |
|
8-K |
10.2 |
October 23, 2014 |
|
77
|
|
|
|
Incorporated by reference herein |
||
|
Exhibit |
|
Description |
Form |
Exhibit |
File Date |
|
10.8 |
|
S‑3 |
4.1 |
October 10, 1997 |
|
|
10.9 |
|
8‑K |
4 |
June 1, 2001 |
|
|
10.10 |
|
8‑K |
4.1 |
November 4, 2004 |
|
|
10.11 |
|
8‑K |
4.1 |
August 22, 2005 |
|
|
10.12 |
|
Fourth Supplemental Indenture dated June 27, 2006, between the Company and Knight‑Ridder Inc. |
10‑Q |
10.4 |
June 25, 2006 |
|
10.13 |
|
8‑K |
4.2 |
December 20, 2012 |
|
|
10.14 |
|
8‑K |
4.3 |
December 20, 2012 |
|
|
10.15 |
* |
The McClatchy Company Management Objective Plan Description. |
10‑K |
10.4 |
December 30, 2000 |
|
10.16 |
* |
10‑K |
10.4 |
December 30, 2001 |
|
|
10.17 |
* |
Amendment Number 1 to The McClatchy Company Supplemental Executive Retirement Plan |
8‑K |
10.1 |
February 10, 2009 |
|
10.18 |
* |
Amended and Restated McClatchy Company Benefit Restoration Plan |
8‑K |
10.1 |
July 29, 2011 |
|
10.19 |
* |
Amended and Restated McClatchy Company Bonus Recognition Plan |
8‑K |
10.2 |
July 29, 2011 |
|
10.20 |
* |
The Company’s 2004 Stock Incentive Plan, as amended and restated |
10‑Q |
10.25 |
June 29, 2008 |
|
10.21 |
* |
The McClatchy Company 2012 Omnibus Incentive Plan, as amended and restated |
DEF |
Appendix A |
April 4, 2017 |
|
10.22 |
* |
8‑K |
10.2 |
May 19, 2017 |
|
|
10.23 |
* |
8‑K |
10.1 |
May 19, 2017 |
|
78
|
|
|
|
Incorporated by reference herein |
||
|
Exhibit |
|
Description |
Form |
Exhibit |
File Date |
|
10.24 |
* |
Waiver and Release Agreement between the Company and Patrick Talamantes |
8‑K/A |
10.1 |
February 24, 2017 |
|
10.25 |
* |
Form of Indemnification Agreement between the Company and each of its officers and directors |
8‑K |
99.1 |
May 23, 2005 |
|
|
|
|
|
|
|
|
10.26 |
* |
10-K |
10.30 |
December 27, 2015 |
|
|
10.27 |
* |
10-K |
10.31 |
December 27, 2015 |
|
|
|
|
|
|
|
|
|
10.28 |
* |
The McClatchy Company Executive Supplemental Retirement Plan |
8-K |
10.1 |
January 29, 2018 |
|
10.29 |
* |
Employment Agreement dated January 25, 2017 by and between Craig I. Forman and the Company |
8-K |
10.1 |
January 31, 2017 |
|
10.30 |
* |
8-K |
10.1 |
February 28, 2017 |
|
|
10.31 |
* |
8-K |
10.2 |
February 28, 2017 |
|
|
10.32 |
* |
8-K |
10.3 |
May 19, 2017 |
|
|
10.33 |
|
8-K |
10.1 |
February 12, 2016 |
|
|
10.34 |
|
10-Q |
10.1 |
June 25, 2017 |
|
|
12 |
|
|
|
|
|
|
21 |
|
|
|
|
|
|
23 |
|
|
|
|
|
|
31.1 |
|
|
|
|
|
|
31.2 |
|
|
|
|
|
|
32.1 |
** |
|
|
|
|
|
32.2 |
** |
|
|
|
|
|
101.INS |
|
XBRL Instance Document |
|
|
|
|
101.SCH |
|
XBRL Taxonomy Extension Schema |
|
|
|
|
101.CAL |
|
XBRL Taxonomy Extension Calculation Linkbase |
|
|
|
|
101.DEF |
|
XBRL Extension Definition Linkbase |
|
|
|
|
101.LAB |
|
XBRL Taxonomy Extension Label Linkbase |
|
|
|
|
101.PRE |
|
XBRL Taxonomy Extension Presentation Linkbase |
|
|
|
*Compensation plans or arrangements for the Company’s executive officers and directors
**Furnished, not filed
79
80
Pursuant to the requirements of Section 13 or 15(d) of the Securities Exchange Act of 1934, the registrant has duly caused this report to be signed on its behalf by the undersigned, thereunto duly authorized.
THE MCCLATCHY COMPANY
(Registrant)
|
|
/s/ Craig I. Forman
Craig I. Forman, |
|
March 12, 2018 |
|
81
SIGNATURES
Pursuant to the requirements of the Securities Exchange Act of 1934, this report has been signed below by the following persons on behalf of the Registrant and in the capacities and on the dates indicated.
|
Signature |
Title |
Date |
|
|
|
|
|
/s/ Craig I. Forman Craig I. Forman |
President, Chief Executive Officer |
March 12, 2018 |
|
|
|
|
|
/s/ R. Elaine Lintecum R. Elaine Lintecum |
Vice President‑Finance, Chief Financial |
March 12, 2018 |
|
|
|
|
|
/s/ Kevin S. McClatchy Kevin S. McClatchy |
Chairman of the Board |
March 9, 2018 |
|
|
|
|
|
/s/ Elizabeth Ballantine Elizabeth Ballantine |
Director |
March 9, 2018 |
|
|
|
|
|
/s/ Leroy Barnes, Jr. Leroy Barnes, Jr. |
Director |
March 9, 2018 |
|
|
|
|
|
/s/ Molly Maloney Evangelisti Molly Maloney Evangelisti |
Director |
March 9, 2018 |
|
|
|
|
|
/s/ Anjali Joshi Anjali Joshi |
Director |
March 9, 2018 |
|
|
|
|
|
/s/ Brown McClatchy Maloney Brown McClatchy Maloney |
Director |
March 9, 2018 |
|
|
|
|
|
/s/ William B. McClatchy William B. McClatchy |
Director |
March 9, 2018 |
|
|
|
|
|
/s/ Theodore R. Mitchell Theodore R. Mitchell |
Director |
March 9, 2018 |
|
|
|
|
|
/s/ Clyde W. Ostler Clyde W. Ostler |
Director |
March 9, 2018 |
|
|
|
|
|
/s/ Maria Thomas Maria Thomas |
Director |
March 9, 2018 |
|
|
|
|
|
|
|
|
82