Attached files
| file | filename |
|---|---|
| EX-32 - EXHIBIT 32 - FARMERS CAPITAL BANK CORP | ex_107264.htm |
| EX-31.2 - EXHIBIT 31.2 - FARMERS CAPITAL BANK CORP | ex_107263.htm |
| EX-31.1 - EXHIBIT 31.1 - FARMERS CAPITAL BANK CORP | ex_107262.htm |
| EX-23.1 - EXHIBIT 23.1 - FARMERS CAPITAL BANK CORP | ex_107261.htm |
| EX-21 - EXHIBIT 21 - FARMERS CAPITAL BANK CORP | ex_107260.htm |
UNITED STATES
SECURITIES AND EXCHANGE COMMISSION
Washington, D.C. 20549
FORM 10-K
|
☒ |
ANNUAL REPORT PURSUANT TO SECTION 13 OR 15(d) OF THE SECURITIES EXCHANGE ACT OF 1934 |
For the Fiscal Year Ended December 31, 2017
or
|
☐ |
TRANSITION REPORT PURSUANT TO SECTION 13 OR 15(d) OF THE SECURITIES EXCHANGE ACT OF 1934 |
Commission File Number 000-14412
|
Farmers Capital Bank Corporation |
|
(Exact name of registrant as specified in its charter) |
|
Kentucky |
61-1017851 |
|
|
(State or other jurisdiction of |
(I.R.S. Employer |
|
P.O. Box 309 202 West Main St. |
||
|
Frankfort, Kentucky |
40601 |
|
|
(Address of principal executive offices) |
(Zip Code) |
Registrant's telephone number, including area code: (502) 227-1668
Securities registered pursuant to Section 12(b) of the Act:
|
Common Stock - $.125 per share Par Value |
The NASDAQ Global Select Market |
|
|
(Title of each class) |
(Name of each exchange on which registered) |
Securities registered pursuant to Section 12(g) of the Act:
|
None |
||
|
(Title of Class) |
Indicate by check mark if the registrant is a well-known seasoned issuer, as defined in Rule 405 of the Securities Act.
|
Yes ☐ |
No ☒ |
Indicate by check mark if the registrant is not required to file reports pursuant to Section 13 or Section 15(d) of the Act.
|
Yes ☐ |
No ☒ |
Indicate by check mark whether the registrant: (1) has filed all reports required to be filed by Section 13 or 15(d) of the Securities Exchange Act of 1934 during the preceding 12 months (or for such shorter period that the registrant was required to file such reports), and (2) has been subject to such filing requirements for the past 90 days.
|
Yes ☒ |
No ☐ |
Indicate by check mark whether the registrant has submitted electronically and posted on its corporate Web site, if any, every Interactive Data File required to be submitted and posted pursuant to Rule 405 of Regulation S-T (§ 232.405 of this chapter) during the preceding 12 months (or for such shorter period that the registrant was required to submit and post such files).
|
Yes ☒ |
No ☐ |
Indicate by check mark if disclosure of delinquent filers pursuant to Item 405 of Regulation S-K (§229.405 of this chapter) is not contained herein, and will not be contained, to the best of registrant's knowledge, in definitive proxy or information statements incorporated by reference in Part III of this Form 10-K or any amendment to this Form 10-K.☐
Indicate by check mark whether the registrant is a large accelerated filer, an accelerated filer, a non-accelerated filer, smaller reporting company, or an emerging growth company. See the definitions of “large accelerated filer,” “accelerated filer,” “smaller reporting company,” and “emerging growth company” in Rule 12b-2 of the Exchange Act.
| Large accelerated filer ☐ | Accelerated filer ☒ |
| Non-accelerated filer ☐ (Do not check if a smaller reporting company) | Smaller reporting company ☐ |
| Emerging growth company ☐ |
If an emerging growth company, indicate by check mark if the registrant has elected not to use the extended transition period for complying with any new or revised financial accounting standards provided pursuant to Section 13(a) of the Exchange Act. ☐
Indicate by check mark whether the registrant is a shell company (as defined in Rule 12b-2 of the Act).
|
Yes ☐ |
No ☒ |
The aggregate market value of the registrant’s outstanding voting stock held by non-affiliates on June 30, 2017 (the last business day of the registrant’s most recently completed second fiscal quarter) was $274 million based on the closing price per share of the registrant’s common stock reported on the NASDAQ.
As of March 1, 2018, there were 7,517,893 shares of common stock outstanding.
Documents incorporated by reference:
Portions of the Registrant’s Proxy Statement relating to the Registrant’s 2018 Annual Meeting of Shareholders are incorporated by reference into Part III.
An index of exhibits filed with this Form 10-K can be found on page 124.
FARMERS CAPITAL BANK CORPORATION
FORM 10-K
INDEX
|
Page |
||
|
Part I |
||
|
Item 1. |
Business |
4 |
|
Item 1A. |
Risk Factors |
19 |
|
Item 1B. |
Unresolved Staff Comments |
29 |
|
Item 2. |
Properties |
29 |
|
Item 3. |
Legal Proceedings |
31 |
|
Item 4. |
Mine Safety Disclosures |
31 |
|
Part II |
||
|
Item 5. |
Market for Registrant's Common Equity, Related Stockholder Matters and Issuer Purchases of Equity Securities |
31 |
|
Item 6. |
Selected Financial Data |
34 |
|
Item 7. |
Management's Discussion and Analysis of Financial Condition and Results of Operations |
35 |
|
Item 7A. |
Quantitative and Qualitative Disclosures About Market Risk |
67 |
|
Item 8. |
Financial Statements and Supplementary Data |
68 |
|
Item 9. |
Changes in and Disagreements With Accountants on Accounting and Financial Disclosure |
119 |
|
Item 9A. |
Controls and Procedures |
119 |
|
Item 9B. |
Other Information |
120 |
|
Part III |
||
|
Item 10. |
Directors, Executive Officers and Corporate Governance |
120 |
|
Item 11. |
Executive Compensation |
120 |
|
Item 12. |
Security Ownership of Certain Beneficial Owners and Management and Related Stockholder Matters |
120 |
|
Item 13. |
Certain Relationships and Related Transactions, and Director Independence |
120 |
|
Item 14. |
Principal Accounting Fees and Services |
120 |
|
Part IV |
||
|
Item 15. |
Exhibits, Financial Statement Schedules |
121 |
|
Signatures |
123 |
|
|
Index of Exhibits |
124 |
|
PART I
Item 1. Business
The disclosures set forth in this item are qualified by Item 1A (“Risk Factors”) beginning on page 19 and the section captioned “Forward-Looking Statements” in Item 7 (“Management’s Discussion and Analysis of Financial Condition and Results of Operations”) beginning on page 35 of this report and other cautionary statements contained elsewhere in this report.
Organization
Farmers Capital Bank Corporation (the “Registrant,” “Company,” “we,” “us,” or “Parent Company”) is a financial holding company which had one wholly-owned subsidiary bank, United Bank & Capital Trust Company (“United Bank” or the “Bank”) in Frankfort, KY, at year-end 2017. The Registrant was originally formed as a bank holding company under the Bank Holding Company Act of 1956, as amended, on October 28, 1982 under the laws of the Commonwealth of Kentucky (“Commonwealth”). During 2016, the Company elected financial holding company status. The Company’s bank subsidiary, United Bank, provides a wide range of banking and bank-related services to customers throughout Central and Northern Kentucky. In February 2017, the Company merged three of its subsidiary banks (United Bank & Trust Company [“United Versailles”] in Versailles, KY; First Citizens Bank, Inc. [“First Citizens”] in Elizabethtown, KY; and Citizens Bank of Northern Kentucky, Inc. [“Citizens Northern”] in Newport, KY) and its data processing subsidiary (FCB Services, Inc. [“FCB Services”] in Frankfort, KY) into its subsidiary bank Farmers Bank & Capital Trust Company (“Farmers Bank”) in Frankfort, KY, the name of which was immediately changed under the merger to United Bank & Capital Trust Company.
At year-end 2017 the Company had the following wholly-owned nonbank subsidiaries: FFKT Insurance Services, Inc., (“FFKT Insurance”), Farmers Capital Bank Trust I (“Trust I”), and Farmers Capital Bank Trust III (“Trust III”). FFKT Insurance is a captive property and casualty insurance company in Frankfort, Kentucky. Trust I and Trust III are unconsolidated trusts established to complete the private offering of trust preferred securities. For Trust I and Farmers Capital Bank Trust II (“Trust II”), the proceeds of the offerings were used to finance the cash portion of the acquisition in 2005 of Citizens Bancorp Inc. (“Citizens Bancorp”), the former parent company of Citizens Northern. In January 2016, the Company terminated Trust II as a result of the early extinguishment of debt. For Trust III, the proceeds of the offering were used to finance the cost of acquiring Company shares under a share repurchase program during 2007.
The Company provides a broad range of financial services at its 34 locations in 21 communities throughout Central and Northern Kentucky to individual, business, agriculture, governmental, and educational customers. Its primary deposit products are checking, savings, and term certificate accounts. Its primary lending products are residential mortgage, commercial lending, and consumer installment loans. Substantially all loans are secured by specific items of collateral including business assets, consumer assets, and commercial and residential real estate. Commercial loans are expected to be repaid from cash flow from operations of businesses. Other services provided by the Company include, but are not limited to, cash management services, issuing letters of credit, safe deposit box rental, and providing funds transfer services. The Company has other financial instruments, including deposit accounts in other financial institutions and federal funds sold, which could potentially represent a concentration of credit risk.
While the chief decision-makers monitor the revenue streams of the various products and services, operations are managed and financial performance is evaluated on a Company-wide basis. Operating segments are aggregated into one as operating results for all segments are similar. Accordingly, all of the financial service operations are considered by management to be aggregated in one reportable segment. As of December 31, 2017, the Company had $1.7 billion in consolidated total assets.
Organization Chart
Subsidiaries of Farmers Capital Bank Corporation at December 31, 2017 are indicated in the table that follows. Percentages reflect the ownership interest held by the parent company of each of the subsidiaries. Tier 2 subsidiaries are direct subsidiaries of Farmers Capital Bank Corporation. Tier 3 subsidiaries are direct subsidiaries of the Tier 2 subsidiary listed immediately above them.
|
Tier |
Entity |
|||
|
1 |
Farmers Capital Bank Corporation, Frankfort, KY (Parent Company) |
|||
|
2 |
United Bank & Capital Trust Company, Frankfort, KY 100% |
|||
|
3 |
Farmers Bank Realty Co., Frankfort, KY 100% |
|||
|
3 |
EG Properties, Inc., Frankfort, KY 100% |
|||
|
3 |
Farmers Capital Insurance Corporation, Frankfort, KY 100% |
|||
|
2 |
FFKT Insurance Services, Inc., Frankfort, KY 100% |
|||
|
2 |
Farmers Capital Bank Trust I, Frankfort, KY 100% |
|||
|
2 |
Farmers Capital Bank Trust III, Frankfort, KY 100% |
|||
United Bank
United Bank is a state chartered bank originally organized in 1850. In February 2017, the Company merged United Versailles, First Citizens, Citizens Northern, and FCB Services into Farmers Bank, the name of which was immediately changed to United Bank & Capital Trust Company. United Bank is engaged in a wide range of commercial and personal banking activities, which include accepting savings, time and demand deposits; making secured and unsecured loans to corporations, individuals and others; providing cash management services to corporate and individual customers; issuing letters of credit; renting safe deposit boxes; and providing funds transfer services. The bank's lending activities include making commercial, construction, mortgage, and personal loans and lines of credit. The bank serves as an agent in providing credit card loans. It acts as trustee of personal trusts, as executor of estates, as trustee for employee benefit trusts and to a limited extent as registrar, transfer agent and paying agent for bond issues.
United Bank conducts business at its principal office and four branches in Frankfort, the capital of Kentucky, as well as branches in the following counties in Kentucky: Anderson, Boone, Bullitt, Campbell, Fayette, Hardin, Jessamine, Kenton, Mercer, Scott, and Woodford Counties. It is the largest bank operating in Anderson, Franklin and Scott Counties based on total bank deposits. The market served by United Bank is diverse, and includes government, commerce, finance, industry, medicine, education, and agriculture. On December 31, 2017, it had total consolidated assets of $1.6 billion, including loans of $1.0 billion. On the same date, total deposits were $1.4 billion and shareholders' equity totaled $162 million.
United Bank also provides bill payment services under the name of FirstNet. This service specializes in federal benefit and military allotment processing. United Bank processes payments to unaffiliated third parties, including those that are initiated under the U.S. military’s allotment system. It processes payments by active duty and retired service members and civilians made to third party lenders. The Company does not provide credit to individuals under the program. Over the last several years it has diversified its customer base to include nonmilitary payment processing, such as for unrelated insurance companies and other service providers.
The military discretionary allotment system in place prior to 2015 allowed service members to automatically direct a portion of their paycheck to financial institutions or individuals of their choosing to pay for various items or services. As announced by the U.S. Department of Defense (“DOD”), active duty service members are no longer able to enter into new contracts to purchase, lease, or rent tangible consumer items such as vehicles, appliances, and electronics using the military allotment system for payment as of January 1, 2015. Contracts existing prior to January 1, 2015 were not affected. Payments for the purpose of savings, insurance premiums, mortgage and rent payments, support for dependents, or investments were also not affected. The restrictions do not apply to military retirees or civilians.
As previously disclosed by the Company, military allotment processing volumes and related revenue began to decline in 2015 as a result of the new DOD policy. This decline has been partially offset by United Bank’s efforts to expand its base of nonmilitary customers.
United Bank had three active direct subsidiaries at year-end 2017: Farmers Bank Realty Co. ("Farmers Realty"), Farmers Capital Insurance Corporation (“Farmers Insurance”), and EG Properties, Inc. (“EG Properties”).
Farmers Realty was incorporated in 1978 for the purpose of owning certain real estate used by the Company and United Bank in the ordinary course of business. Farmers Realty had total assets of $3.2 million on December 31, 2017.
Farmers Insurance was organized in 1988 to engage in insurance activities permitted to the Company under federal and state law. United Bank capitalized this corporation in December 1998. Farmers Insurance acts as an agent for an otherwise unrelated title insurance company and offers title insurance coverage on property financed by the Company. At year-end 2017, it had total assets of $597 thousand.
EG Properties was incorporated in November 2002 and is involved in real estate management and liquidation for certain properties repossessed by United Bank. In May 2017, the Company merged the nonbank subsidiaries of each of its pre-merger subsidiary banks (EGT Properties, Inc. [“EGT Properties”], HBJ Properties, LLC [“HBJ Properties”], and ENKY Properties, Inc. [“ENKY”]) into EG Properties. EG Properties previously held a 93.4% interest in WCO, LLC (“WCO”), which was formed during 2012 to hold certain real estate repossessed by United Bank and United Versailles. WCO was dissolved during September 2016. EG Properties had total assets of $36.6 million at year-end 2017.
Leasing One Corporation (“Leasing One”) was incorporated in August 1993 to operate as a commercial equipment leasing company. Activity at Leasing One declined significantly as a result of its board deciding in 2010 to reduce staff and curtail new lending. The extent of its activity had been to service existing loans and terming out residuals until it was dissolved effective at year-end 2015.
United Bank previously was a limited partner in Austin Park Apartments, LTD and Frankfort Apartments II, LTD, two low income housing tax credit partnerships located in Frankfort, Kentucky. These investments provided federal income tax credits to the Company over a 10 year period which have since been fully exhausted; however, the Company maintained its investment in these partnerships over a 15 year compliance period in order to avoid possible recapture of the tax credits. The compliance period has since ended and United Bank liquidated its investments in these partnerships during 2016.
United Versailles
On February 15, 1985, the Company acquired United Versailles, a state chartered bank originally organized in 1880. In February 2017, United Versailles was merged into Farmers Bank, the name of which was immediately changed to United Bank & Capital Trust Company.
United Versailles had one direct subsidiary, EGT Properties. EGT Properties was created in March 2008 and was involved in real estate management and liquidation for certain repossessed properties of United Versailles. EGT Properties was merged into EG Properties in May 2017. EGT Properties held a 6.6% interest in WCO, which was dissolved during September 2016. EGT Properties held an 83% interest in NUBT Properties, LLC (“NUBT”), the parent company of Flowing Creek Realty, LLC (“Flowing Creek”). Flowing Creek held certain real estate repossessed by United Versailles and Citizens Northern along with parties unrelated to the Company. NUBT held a 67% interest in Flowing Creek and unrelated financial institutions held the remaining 33% interest. NUBT and Flowing Creek were dissolved during November 2015.
First Citizens
On March 31, 1986, the Company acquired First Citizens, a state chartered bank originally organized in 1964. In February 2017, First Citizens was merged into Farmers Bank, the name of which was immediately changed to United Bank & Capital Trust Company. First Citizens incorporated HBJ Properties during 2012 to hold, manage, and liquidate certain properties repossessed by First Citizens. HBJ Properties was merged into EG Properties in May 2017.
Citizens Northern
On December 6, 2005, the Company acquired Citizens Bancorp in Newport, Kentucky, a state chartered bank organized in 1993. Citizens Bancorp was subsequently merged into Citizens Acquisition, a former bank holding company subsidiary of the Company. During January 2007, Citizens Acquisition was merged into the Company, leaving Citizens Northern as a direct subsidiary of the Parent Company. In February 2017, Citizens Northern was merged into Farmers Bank, the name of which was immediately changed to United Bank & Capital Trust Company.
In March 2008, Citizens Northern incorporated ENKY. ENKY was established to manage and liquidate certain real estate properties repossessed by Citizens Northern. ENKY was merged into EG Properties in May 2017. ENKY held a 17% interest in NUBT, the parent company of Flowing Creek. Flowing Creek held real estate repossessed by Citizens Northern and United Versailles along with parties unrelated to the Company. NUBT held a 67% interest in Flowing Creek and unrelated financial institutions held the remaining 33% interest. NUBT and Flowing Creek were dissolved during November 2015.
Nonbank Subsidiaries
FFKT Insurance was incorporated during 2005. It is a captive insurance company that provides property and casualty coverage to the Parent Company and its subsidiaries for risk management purposes or where insurance may not be available or economically feasible. FFKT Insurance had total assets of $5.6 million at December 31, 2017.
Trust I, Trust II, and Trust III are each separate Delaware statutory business trusts sponsored by the Company. The Company completed two private offerings of trust preferred securities during 2005 through Trust I and Trust II totaling $25.0 million. During 2007, the Company completed a private offering of trust preferred securities through Trust III totaling $22.5 million. The Company owns all of the common securities of Trust I and Trust III. The Company does not consolidate the Trusts into its financial statements consistent with applicable accounting standards. In January 2016, the Company terminated Trust II as a result of the early extinguishment of debt issued by Trust II.
FCB Services was organized in 1992 in Frankfort, Kentucky and provided data processing services and support for the Company and its subsidiaries. It also provided data processing services for nonaffiliated entities. In February 2017, FCB Services was merged into Farmers Bank, the name of which was immediately changed to United Bank & Capital Trust Company. United Bank no longer provides data processing services for nonaffiliated entities.
Lending Summary
A significant part of the Company’s operating activities include originating loans, approximately 89% of which are secured by real estate at December 31, 2017. Real estate lending primarily includes loans secured by owner and non-owner occupied one-to-four family residential properties as well as commercial real estate mortgage loans to developers and owners of other commercial real estate. Real estate lending primarily includes both variable and adjustable rate products. Loan rates on variable rate loans generally adjust upward or downward immediately based on changes in the loan’s index, normally prime rate as published by the Wall Street Journal. Rates on adjustable rate loans move upward or downward after an initial fixed term of normally one, three, five, or seven years. Rate adjustments on adjustable rate loans are made annually after the initial fixed term expires and are indexed mainly to shorter-term Treasury indexes. Generally, variable and adjustable rate loans contain provisions that cap the amount of interest rate increases of up to 600 basis points and rate decreases of up to 100 basis points over the life of the loan. In recent years, it has been increasingly common for the Company to set a floor equal to the initial rate without further downward adjustments. In addition to the lifetime caps and floors on rate adjustments, loans secured by residential real estate typically contain provisions that limit annual increases at a maximum of 100 basis points. There is typically no annual limit applied to loans secured by commercial real estate.
The Company also makes fixed rate commercial real estate loans to a lesser extent with repayment periods generally ranging from three to seven years. The Bank makes first and second residential mortgage loans secured by real estate not to exceed 90% loan to value without seeking third party guarantees. Commercial real estate loans are made primarily to small and mid-sized businesses, secured by real estate not exceeding 80% loan to value. Other commercial loans are asset based loans secured by equipment and lines of credit secured by receivables and include lending across a diverse range of business types.
Commercial lending and real estate construction lending, including commercial leasing, generally includes a higher degree of credit risk than other loans, such as residential mortgage loans. Commercial loans, like other loans, are evaluated at the time of approval to determine the adequacy of repayment sources and collateral requirements. Collateral requirements vary to some degree among borrowers and depend on the borrower’s financial strength, the terms and amount of the loan, and collateral available to secure the loan. Credit risk results from the decreased ability or willingness to pay by a borrower. Credit risk also results when a liquidation of collateral occurs and there is a shortfall in collateral value as compared to a loan’s outstanding balance. For construction loans, inaccurate initial estimates of a project’s costs or the property’s completed value could weaken the Company’s position and lead to the property having a value that is insufficient to satisfy full payment of the amount of funds advanced for the property. Secured and unsecured direct consumer lending generally is made for automobiles, boats, and other motor vehicles. The Company does not presently engage in indirect consumer lending. The Bank’s credit card portfolio was sold during the fourth quarter of 2017. In most cases loans are restricted to the Bank’s general market area.
Loan Policy
The Company has a lending policy in place that is amended and approved from time to time as needed to reflect current economic conditions, law and regulatory changes, and product offerings in its markets. The policy has established minimum standards that its bank subsidiary must adopt. Additionally, the policy is subject to amendment based on positive and negative trends observed within the lending portfolio as a whole. For example, the loan to value limits and amortization terms contained within the policy were reduced during the most recent economic and related real estate market decline. While new appraisals now reflect that decline, appraisal reviews and downward adjustments are a continuing area of focus when evaluating credit risk. The lending policy is evaluated for underwriting criteria by the Company’s internal audit department in its loan review capacity as well as by the Bank’s Chief Credit Officer and its regulatory authorities. Suggested revisions from these groups are taken into account, analyzed, and implemented by management where improvements are warranted.
The Bank’s Chief Credit Officer oversees all lending at the institution where the size and risk of individual credits are deemed significant to the Company. This position also monitors trends in asset quality, portfolio composition, concentrations of credit, reports of examinations, internal audit reports, work-out strategies for large credits, and other responsibilities as matters evolve.
Procedures
The lending policy lists the products and credit services offered by the Bank. Each product and service has an established written procedure to adhere to when transacting business with a customer. The lending policy also establishes pre-determined lending authorities for loan officers commensurate with their abilities and experience. Further, the policy establishes committees to review and approve or deny credit requests at various lending amounts. This includes subcommittees of the Bank’s board of directors and, at certain lending levels, the entire bank board.
For loan relationships of $2.5 million to $7.5 million, either a subcommittee of the Bank’s board of directors or the board of directors will be presented with the loan request. For loan relationships of $7.5 million and above, the Bank’s full board of directors will be presented with the loan request. This only occurs when the potential credit has first been recommended by the loan officer and the Chief Credit Officer. When loan requests are within policy guidelines and the amount requested is within their lending authority, lenders are permitted to approve and close the transaction. A review of the loan file and documentation takes place within 30 days to ensure policy and procedures are being followed. Approval authorities are under regular review for adjustment by affiliate management and the Parent Company. Loan requests outside of standard policy may be made on a case by case basis when justified, documented, and approved by either the board of directors of the subsidiary bank, committee, or other authorized person as determined by the size of the transaction. Procedures are in place which require ongoing monitoring subsequent to loan approval. For example, updated financial statements are required periodically for certain types of credits and risk ratings are re-evaluated at least annually for credit relationships in excess of $500 thousand, which includes analyzing updated cash flows and loan to value ratios. Certain types of credit relationships of $1.0 million or above receive annual site visits.
Underwriting
Underwriting criteria for all types of loans are prescribed within the lending policy.
Residential Real Estate
Residential real estate mortgage lending made up 34% of the loan portfolio at year-end 2017. Underwriting criteria and procedures for residential real estate mortgage loans include:
|
● |
Monthly debt payments of the borrower to gross monthly income should not exceed 45% with stable employment; |
|
● |
Interest rate shocks are applied for variable rate loans to determine repayment capabilities at elevated rates; |
|
● |
Loan to value limits of up to 90%. Loan to value ratios exceeding 90% require additional third party guarantees; |
|
● |
A thorough credit investigation using the three nationally available credit repositories; |
|
● |
Incomes and employment is verified; |
|
● |
Insurance is required in an amount to fully replace the improvements with the lending bank named as loss payee/mortgagee; |
|
● |
Flood certifications are procured to ensure the improvements are not in a flood plain or are insured if they are within the flood plain boundaries; |
|
● |
Collateral is investigated using current appraisals and is supplemented by the loan officer’s knowledge of the locale and salient factors of the local market. Only appraisers which are state certified or licensed and on the bank’s approved list are utilized to perform this service; |
|
● |
Title attorneys and closing agents are required to maintain malpractice liability insurance and be on the bank’s approved list; |
|
● |
Secondary market mortgages must meet the underwriting criteria of the purchasers, which is generally the Federal National Mortgage Association and the Federal Home Loan Mortgage Corporation; |
|
● |
Adjustable rate owner occupied home loans are tied to market based rates such as are published by the Federal Reserve Board (“Federal Reserve” or “FRB”), commonly the one year constant maturity Treasury bill is used; and |
|
● |
Residential real estate mortgage loans are made for terms not to exceed 30 years. |
The Company strives to offer qualified mortgages as defined by the Consumer Financial Protection Bureau. However, the Company will also allow non-qualified mortgages with the review and approval of the appropriate loan committee of the Bank. The qualified mortgage rule applies to home loans and is designed to ensure that borrowers can afford to repay loans by prohibiting or limiting certain high risk products and features such as charging excessive upfront points and fees, prohibiting interest-only loans, negative amortizing loans, loans exceeding repayment terms of 30 years, and, in most cases, balloon loans. Qualified mortgages also limit the borrower’s debt to income ratio to 43%.
Commercial Real Estate
Commercial real estate lending made up 42% of the loan portfolio at year-end 2017. Commercial real estate lending underwriting criteria is documented in the lending policy and includes loans secured by office buildings, retail stores, warehouses, hotels, and other commercial properties. Underwriting criteria and procedures for commercial real estate loans include:
|
● |
Procurement of Federal income tax returns and financial statements for the past three years and related supplemental information deemed relevant; |
|
● |
Detailed financial and credit analysis is performed and presented to various committees; |
|
● |
Cash investment from the applicant in an amount equal to 20% of cost (loan to value ratio not to exceed 80%). Additional collateral may be taken in lieu of a full 20% investment in limited circumstances; |
|
● |
Cash flows from the project financed and global cash flow of the principals and their entities must produce a minimum debt coverage ratio of 1.25:1; |
|
● |
For non-profits, including churches, a 1.0:1 debt coverage minimum ratio; |
|
● |
Past experience of the customer with the bank; |
|
● |
Experience of the investor in commercial real estate; |
|
● |
Tangible net worth analysis; |
|
● |
Interest rate shocks for variable rate loans; |
|
● |
General and local commercial real estate conditions; |
|
● |
Alternative uses of the security in the event of a default; |
|
● |
Thorough analysis of appraisals; |
|
● |
References and resumes are procured for background knowledge of the principals/guarantors; |
|
● |
Credit enhancements are utilized when necessary and/or desirable such as assignments of life insurance and the use of guarantors and firm take-out commitments; |
|
● |
Frequent financial reporting is required for income generating real estate such as: rent rolls, tenant listings, average daily rates and occupancy rates for hotels; |
|
● |
Commercial real estate loans are made with amortization terms generally not to exceed 20 years; and |
|
● |
For lending arrangements determined to be more complex, loan agreements with financial and collateral representations and warranties are employed to ensure the ongoing viability of the borrower. |
Real Estate Construction
At year-end 2017, real estate construction lending comprised approximately 13% of the total loan portfolio. Real estate construction lending underwriting criteria is documented in the lending policy and includes loans to individuals for home construction, loans to businesses primarily for the construction of owner-occupied commercial real estate, and for land development activities. Underwriting criteria and procedures for such lending include:
|
● |
20% capital injection from the applicant (loan to value ratio not to exceed 80%); |
|
● |
25% capital injection for land acquisition for development (loan to value ratio not to exceed 75%); |
|
● |
Pre-sell, pre-lease, and take-out commitments are procured and evaluated/verified; |
|
● |
Draw requests require documentation of expenses; |
|
● |
On site progress inspections are completed to protect the lending bank affiliate; |
|
● |
Control procedures are in place to minimize risk on construction projects such as conducting lien searches and requiring affidavits; |
|
● |
Lender on site visits and periodic financial discussions with owners/operators; and |
|
● |
Real estate construction loans are generally made for terms not to exceed 12 months and 18 months for residential and commercial purposes, respectively. |
Commercial, Financial, and Agriculture
Commercial, financial, and agriculture lending underwriting criteria is documented in the lending policy and includes loans to small and medium sized businesses secured by business assets, loans to financial institutions, and loans to farmers and for the production of agriculture. At year-end 2017, these loans made up approximately 11% of the total loan portfolio. Underwriting criteria and procedures for such loans are detailed below.
For commercial loans secured by business assets, the following loan to value ratios and debt coverage are required by policy:
|
● |
Inventory 50%; |
|
● |
Accounts receivable less than 90 days past due 75%; |
|
● |
Furniture, fixtures, and equipment 60%; |
|
● |
Borrowing-base certificates are required for monitoring asset based loans; |
|
● |
Stocks, bonds, and mutual funds are often pledged by business owners. Marketability and volatility is taken into account when valuing these types of collateral and lending is generally limited to 60% of their value; |
|
● |
Debt coverage ratios from cash flows must meet the policy minimum of 1.25:1. This coverage applies to global cash flow and guarantors, if any; and |
|
● |
Commercial loans secured by business assets are made for terms to match the economic useful lives of the asset securing the loan. Loans secured by furniture, fixtures, and equipment are made for terms not to exceed seven years. Lien searches are performed to ensure lien priority for credits exceeding certain thresholds. |
Loans to financial institutions are generally secured by the capital stock of the financial institution with a loan to value ratio not to exceed 60% and repayment terms not exceeding 10 years. Capital stock values of non-public companies are determined by common metrics such as a multiple of tangible book value or by obtaining third party estimates. Financial covenants are also obtained that require the borrower to maintain certain levels of asset quality, capital adequacy, liquidity, profitability, and regulatory compliance. At year-end 2017, loans to financial institutions were zero.
Agricultural lending, such as for tobacco or corn, is limited to 75% of expected sales proceeds while lending for cattle and farm equipment is capped at 80% loan to value.
Interest Only Loans
Interest only loans are limited to construction lending and properties recently completed and undergoing an occupancy stabilization period. These loans are short-term in nature, usually with maturities of less than one year.
Installment Loans
Installment lending is a small component of the Company’s portfolio mix, reflecting approximately 1% of outstanding loans at year-end 2017. These loans predominantly are direct loans to established bank customers and primarily include the financing of automobiles, boats, and other consumer goods. The character, capacity, collateral, and conditions are evaluated using policy restraints. Installment loans are made for terms of up to five years.
Installment lending underwriting criteria and procedures for such financing include:
|
● |
Required financial statement of the applicant for loans in excess of $20,000; |
|
● |
Past experience of the customer with the bank and other creditors of the applicant; |
|
● |
Monthly debt payments of the borrower to gross monthly income should not exceed 45% with stable employment; |
|
● |
Secured and unsecured loans are made with a definite repayment plan which coincides with the purpose of the loan; |
|
● |
Borrower’s unsecured debt must not exceed 25% of the borrower’s net worth; and |
|
● |
Verification of borrower’s credit and income. |
Lease Financing
The Company has no lease receivables as of December 31, 2017. The Company’s leasing subsidiary, Leasing One, was dissolved effective year-end 2015.
Hybrid Loans
The Company and the Bank have a policy of not underwriting, originating, selling or holding hybrid loans. The Company does not currently hold hybrid loans. Hybrid loans include payment option adjustable rate mortgages, negative amortization loans, and stated income/stated asset loans.
Appraisals
The Company uses appraisals to value the collateral securing loans and to help manage credit risk, particularly related to loans secured by real estate. The Company uses independent third party state certified or licensed appraisers. These appraisers take into account local market conditions when preparing their estimate of a property’s fair value. The Company evaluates appraisals it receives from independent third parties subsequent to the appraisal date by monitoring transactions in its markets and comparing them to its other projects that are similar in nature. The Company’s internal audit department reviews appraisals on a test basis to determine that assumptions used in appraisals remain valid and are not stale. New appraisals are obtained if market conditions significantly impact collateral values for those loans that are identified as impaired. Internal audit reviews appraisals related to all of the Company’s impaired loans and repossessed properties at least annually.
The Company considers appraisals it receives on one property as a means to extrapolate the estimated value for other collateral of similar characteristics if that property may not otherwise have a need for an appraisal. Should a borrower’s financial condition continue to deteriorate, an updated appraisal on that specific collateral will be obtained.
Appraisals obtained for construction and development lending purposes are performed by state licensed or state certified appraisers who are credentialed and on the Company’s approved list. Plans and specifications are provided to the appraiser by bank personnel not directly involved in the credit approval process. The appraisals conform to the standards of appraisal practices established by the Appraisal Standards Board in effect at the time of the appraisal. This includes net present value accounting for construction and development loans on an “as completed” and “as is” basis.
Appraisal reviews are conducted internally by bank personnel familiar with the local market and who are not directly involved in the credit approval process and externally by state licensed and certified appraisers. Bank personnel do not increase the valuation from the appraisal but may, in some instances, make a reduction. Upon completion, a follow up site visit by the appraiser is completed to verify the property was improved in accordance with the original plans and specifications and recertify, if appropriate, the original estimate of “as completed” market value. Circumstances where management may make adjustments to appraisals include the following:
As discussed above, construction and development appraisals are on an “as completed” basis. If work remains to be completed on a financed project, management will reduce the estimated value in the appraisal by the estimated cost to complete the work and, if required by the loan balance, establish reserves allocated to the loan or write down the loan based on the need to complete such work.
If an appraisal for given collateral is still valid (e.g. less than one year old, etc.), but due to market conditions and the bank’s familiarity with comparable property sales in the market the appraised value appears high, management may adjust downward from the last appraisal its estimate of the value of the collateral and, in turn, establish reserves allocated to the loan or write down the loan to reflect this downward adjustment.
Certain appraisals, such as for subdivision development and for other projects expected to take over one year to liquidate, are required to include estimated costs to sell. For others, management adjusts the appraised value by the estimated selling costs when they are either absent or not required. Additional reserves or direct write downs are made to the loan to reflect these adjustments.
Loan to value ratios are typically well under 100% at inception, which gives the Company a cushion if collateral values fall. However, when updated appraisals reveal collateral exposure (i.e. the value of the collateral for a nonperforming loan is less than originally estimated and no longer supports the outstanding loan amount), negotiations ensue with the borrower aimed at providing additional collateral support for the credit. This may be in many forms as determined by the financial holdings of the borrower. If not available, third party support for the credit is pursued (e.g., guarantors or equity investors). If negotiations fail to provide additional adequate collateral support, reserves are allocated to the loan or the loan is written down to the fair value of the collateral less the estimated costs to sell.
When a construction loan or development loan is downgraded, a new appraisal is ordered contemporaneously with the downgrade. The appraisers are instructed to give a fair value based upon both an “as is” basis and an “as completed” basis. The twofold purpose is to facilitate management’s decision making process in determining the cost benefits of completing a project compared with marketing the project “as is.”
The carrying value of a downgraded loan or nonperforming asset wherein the underlying collateral is an incomplete project is based on an updated appraisal at the “as is” value. The current appraisal is a compilation of the most recent sales available and therefore includes the risk premium established by market conditions. When comparable sales are not deemed to be reliable or the adjustments are not satisfactory, management will make appropriate adjustments to the fair value which includes a risk premium (discount) deducted using the discounted cash flow framework. The reserve or write down is expended upon completion of the appraisal and other relevant information assessment.
Interest Reserves
Interest reserves represent funds loaned to a borrower for the payment of interest during the development phase on certain construction and development loans. Interest reserves were a common industry practice when banks were more actively lending and the predictability of a sale or stabilization of the project had a high probability. The interest reserve is a component of the loan proceeds which is determined at the loan’s inception after a full evaluation of the sources and uses of funds for the project, and is intended to match the project’s debt service requirements with its expected cash flows. In all construction lending projects, the Company monitors the project to determine if it is being completed as planned and if sales/stabilization projections are being met.
For present and future construction and development loan requests, borrowers must show sufficient cash reserves and significant excess cash flow from all sources in addition to other underwriting criteria measures. A project’s viability is a major consideration as well, along with the probability of its stabilization and/or sale. Interest reserves are primarily used for construction on large commercial, income producing property. Interest reserves on development loans are not commonplace due to the general lack of risk-appropriate opportunities currently in our markets combined with our low desire for this segment of the lending portfolio.
Supervision and Regulation
The Company and its subsidiaries are subject to comprehensive supervision and regulation that affect virtually all aspects of their operations. The laws and regulations are primarily intended for the protection of depositors, borrowers, and federal deposit insurance funds, and, to a lesser extent, for the protection of stockholders and creditors. Changes in applicable laws, regulations, or in the policies of banking and other government regulators may have a material adverse effect on our current or future business. The following discussion is a summary of certain of the more important aspects of the relevant statutory and regulatory provisions and does not purport to be complete nor does it address all applicable statutes and regulations.
Supervisory Authorities
The Company is a financial holding company, registered with and regulated by the Federal Reserve. Its subsidiary bank, United Bank, is a Kentucky state-chartered bank and a member of the Federal Reserve Bank of St. Louis. The Company and the Bank are subject to supervision, regulation, and examination by the Federal Reserve, Federal Deposit Insurance Corporation (“FDIC”), and the Kentucky Department of Financial Institutions (“KDFI”). The Company and the Bank are required to file regular reports with the FRB, the FDIC, and the KDFI. The regulatory authorities routinely examine the Company and the Bank to monitor compliance with laws and regulations, financial condition, adequacy of capital and reserves, quality and documentation of loans, payment of dividends, adequacy of systems and controls, credit underwriting, asset liability management, and the establishment of branches.
The Company is also subject to disclosure and other regulatory requirements of the Securities Act of 1933 and the Securities Exchange Act of 1934 (as amended), as administered by the Securities and Exchange Commission. Regulatory authorities may initiate enforcement proceeding against the Company for violations of laws or regulations, or for engaging in unsafe and unsound practices. Enforcement powers available to the regulatory agencies include the ability to assess civil monetary penalties, issuing cease and desist and similar orders, and initiating injunctive actions.
Capital
The FRB, the FDIC, and the KDFI require the Company and United Bank to meet certain ratios of capital to assets in order to conduct their activities. Current risk-based capital standards are based on the Basel Committee on Banking Supervision final rules issued in December 2010 related to global regulatory standards on bank capital adequacy and liquidity (commonly referred to as “Basel III”) previously agreed on by the Group of Governors and Heads of Supervision (the oversight body of the Basel Committee). U.S. federal banking agencies adopted final rules during 2013 to bring U.S. banking organizations into compliance with Basel III. Under the current rules, which were effective January 1, 2015, the Company is subject to capital requirements that include: (i) creation of a required ratio for common equity Tier 1 (“CET1”) capital, (ii) an increase to the minimum Tier 1 Risk-based Capital ratio, (iii) changes to risk-weightings of certain assets for purposes of the risk-based capital ratios, (iv) creation of an additional capital conservation buffer in excess of the required minimum capital ratios, and (v) changes to what qualifies as capital for purposes of meeting these capital requirements.
Under Basel III, the Company is required to maintain a minimum CET1 ratio of 4.5% of risk-weighted assets. CET1 consists of common stock, related surplus, and retained earnings less certain deductions that primarily include goodwill, other intangible assets, and deferred tax assets. The deductions to CET1 are being phased-in over a four-year period beginning at 40% on January 1, 2015 and an additional 20% per year thereafter.
The Company is required to maintain a minimum Tier 1 Risk-based Capital ratio of 6%, a Total Risk-based Capital ratio of 8%, and a Tier 1 Leverage ratio of 4%. Tier 1 Capital consists of common equity and related surplus, retained earnings, and a limited amount of qualifying preferred stock, less goodwill (net of certain deferred tax liabilities) and certain core deposit intangibles. Tier 2 Capital consists of non-qualifying preferred stock, certain types of debt and a limited amount of other items. Total Capital is the sum of Tier 1 and Tier 2 Capital. Under the capital rules effective January 1, 2015, the effects of certain accumulated other comprehensive income items (primarily unrealized gains and losses on available for sale investment securities) are not excluded from capital; however, non-advanced approaches banking organizations, including the Company, could make a one-time permanent election to continue excluding these items comparable to their previous treatment. The Company made this election in order to avoid potentially significant fluctuations in its capital levels which can occur from the impact of changing market interest rates on the fair value of the Company’s investment securities portfolio.
Capital rules prohibit including certain hybrid and preferred securities in Tier 1 capital. Non-qualifying capital instruments under the final rule include trust preferred securities and cumulative perpetual preferred stock. The rules grandfather these non-qualifying capital instruments that were issued before May 19, 2010 (subject to 25% of Tier 1 capital) for bank holding companies with total consolidated assets of less than $15 billion as of December 31, 2009, including the Company. As of January 1, 2015, the Company’s non-qualifying capital instruments are subject to a limit of 25% of Tier 1 capital elements, excluding the non-qualifying capital instruments and after all regulatory capital deductions and adjustments applied to Tier 1 capital. Non-qualifying capital instruments excluded from Tier 1 capital under the 25% limitation may be included as a component of Tier 2 capital.
In measuring the adequacy of capital, assets are generally weighted for risk. Certain assets, such as cash and U.S. government securities, have a risk weighting of zero. Others, such as commercial and consumer loans, are generally risk weighted at 100%. Changes to risk-weighted assets that went into effect January 1, 2015 include: i) 150% risk weighting for non-residential mortgage loans past due more than 90 days or classified as nonaccrual; ii) 150% risk weighting (from 100%) for certain high volatility commercial real estate acquisition, development, and construction loans; iii) a 20% (from 0%) credit conversion factor for the unused portion of commitments with an original maturity of one year or less (except those unconditionally cancellable by the Company); and, iv) a 250% (from 100%) risk weighting for mortgage servicing and deferred tax assets that are not deducted from CET1. Risk weightings are also assigned for off-balance sheet items such as loan commitments. The various items are multiplied by the appropriate risk-weighting to determine risk-adjusted assets for the capital calculations. For the leverage ratio mentioned above, average quarterly assets (as defined) are used and are not risk-weighted.
In order to avoid restrictions on distributions, including dividend payments and discretionary bonus payments to its executives, the Company is required to maintain a capital conservation buffer of an additional 2.5% of risk-weighted assets once fully phased in. The capital conservation buffer is designed to create incentives for banking organizations to conserve capital during periods of economic stress. The addition of the capital conservation buffer, once fully phased in, effectively results in minimum ratios of 7%, 8.5%, and 10.5% for CET1, Tier 1 capital, and total capital, respectively, in order to avoid the restrictions on distributions and discretionary bonus payments to executives. The capital conservation buffer is being phased in over a four year period that began in 2016 by increments of 0.625% annually until reaching 2.5%. At year-end 2017, the Company meets the minimum capital ratios and a fully phased-in capital conservation buffer.
If an institution fails to remain well-capitalized, it will be subject to a series of restrictions that increase as the capital condition worsens. For instance, federal law generally prohibits a depository institution from making any capital distribution, including the payment of a dividend or paying any management fee to its holding company, if the depository institution would be undercapitalized as a result. Undercapitalized depository institutions may not accept brokered deposits absent a waiver from the FDIC, are subject to growth limitations, and are required to submit a capital restoration plan for approval, which must be guaranteed by the institution’s parent holding company. Significantly undercapitalized depository institutions may be subject to a number of requirements and restrictions, including orders to sell sufficient voting stock to become adequately capitalized, requirements to reduce total assets, and cessation of receipt of deposits from correspondent banks. Critically undercapitalized institutions are subject to the appointment of a receiver or conservator. The Company is well-capitalized under the current rules, which require a CET1 ratio of 6.5%, a Tier 1 Risk-based Capital ratio of 8%, a Total Capital ratio of 10%, and a Tier 1 Leverage ratio of 5%.
Expansion and Activity Limitations
With prior regulatory approval, the Company may acquire other banks or bank holding companies and its subsidiaries may merge with other banks. Acquisitions of banks located in other states may be subject to certain deposit-percentage, age, or other restrictions. In addition, as a financial holding company, the Company and its subsidiaries are permitted to acquire or engage in activities that are not permitted for bank holding companies such as insurance underwriting, securities underwriting and distribution, travel agency activities, broad insurance agency activities, merchant banking, and other activities that the FRB determines to be financial in nature or complementary to these activities. The FRB normally requires some form of notice or application to engage in or acquire companies engaged in such activities. Under the Bank Holding Company Act, the Company is generally prohibited from engaging in or acquiring direct or indirect control of more than 5% of the voting shares of any company engaged in activities that are deemed not closely related to banking.
Limitations on Acquisitions of Bank Holding Companies
In general, other companies seeking to acquire control of a financial holding company such as the Company would require the approval of the FRB under the Bank Holding Company Act. In addition, individuals or groups of individuals seeking to acquire control of a financial holding company would need to file a prior notice with the FRB (which the FRB may disapprove under certain circumstances) under the Change in Bank Control Act. Control is conclusively presumed to exist if an individual or company acquires 25% or more of any class of voting securities of the bank holding company. Control may exist under the Change in Bank Control Act if the individual or company acquires 10% or more of any class of voting securities of the bank holding company and no shareholder holds a larger percentage of the subject class of voting securities.
Deposit Insurance
The Company’s subsidiary bank is a member of the FDIC, and its deposits are insured by the FDIC’s Deposit Insurance Fund (“DIF”) up to prescribed limits of $250 thousand per depositor. The Company’s subsidiary bank is subject to quarterly FDIC deposit insurance assessments to maintain the DIF. The FDIC utilizes a risk-based assessment system that imposes insurance premiums based upon a risk matrix that takes into account a bank’s capital level and supervisory rating.
The Dodd-Frank Wall Street Reform and Consumer Protection Act (“Dodd-Frank Act”) required changes to a number of components of the FDIC insurance assessment that was effective April 1, 2011. The Dodd-Frank Act required the FDIC to adopt a new DIF restoration plan to increase its reserve ratio to 1.35% from 1.15% of insured deposits by 2020. Under the restoration plan, the FDIC adopted regulations that redefined the assessment base as average consolidated assets less average tangible equity (as defined) during the assessment period. Since this resulted in a larger overall base when compared to the previous domestic deposits base methodology, overall assessment rates were lowered and the secured liability adjustment was eliminated from the rate calculation in an attempt to make the new assessments revenue neutral. At least semi-annually, the FDIC updates its loss and income projections for the DIF and, if needed, increase or decrease assessment rates. In establishing assessments, the FDIC is required to offset the effect of the higher reserve ratio against insured depository institutions with total consolidated assets of less than $10 billion.
To determine the Company’s deposit insurance premiums, the Bank computes its assessment base, composed of average consolidated assets less average tangible equity (as defined), then applies the appropriate assessment rate. Graduated assessment rate decreases are set to phase in when the DIF reserve ratio exceeds 1.15%, 2.0%, and 2.5%. On June 30, 2016, the DIF reserve ratio surpassed the goal of 1.15%. As a result, assessment rates were lowered and the risk categories used in determining assessment rates were eliminated and assessment rates were established based on supervisory ratings (“CAMELS ratings”). Effective July 1, 2016, assessment rates range from 1.5 to 16 basis points for banks designated in the lowest risk category and between 11 to 30 basis points for banks designated in the highest risk category. The range of assessment rates applicable to each category varies depending on the level of the banks unsecured debt and brokered deposits.
The FDIC may terminate insurance for depository institutions upon a finding that the institution has engaged in unsafe and unsound practices, is in an unsafe or unsound financial condition, or has violated an applicable law, rule, regulation, order, or condition imposed by the FDIC.
In addition to deposit insurance assessments, all FDIC insured institutions are required to pay assessments to the FDIC to fund interest payments on bonds issued by the Financing Corporation (“FICO”), a mixed-ownership government corporation established by the Competitive Equality Banking Act of 1987 possessing assessment powers in addition to the FDIC. The FDIC acts as a collection agent for FICO, whose sole purpose was to function as a financing vehicle for the now defunct Federal Savings & Loan Insurance Corporation. FICO assessment rates are determined quarterly and will continue until the FICO bonds mature through 2019.
Other Statutes and Regulations
The Company and the Bank are subject to numerous other statutes and regulations affecting their activities. Some of the more important are summarized below.
Anti-Money Laundering. Financial institutions are required to establish anti-money laundering programs that must include the development of internal policies, procedures, and controls; the designation of a compliance officer; an ongoing employee training program; and an independent audit function to test the performance of the programs. The Company and the Bank are also subject to prohibitions against specified financial transactions and account relationships as well as enhanced due diligence and “know your customer” standards in their dealings with foreign financial institutions and foreign customers. Financial institutions must take reasonable steps to conduct enhanced scrutiny of account relationships in order to guard against money laundering and to report any suspicious transactions. Recent laws provide law enforcement authorities with increased access to financial information maintained by banks.
Sections 23A and 23B of the Federal Reserve Act. The Bank is limited in its ability to lend funds or engage in transactions with the Company or other nonbank affiliates of the Company, and all transactions must be on an arm’s-length basis and on terms at least as favorable to the Bank as prevailing at the time for transactions with unaffiliated companies.
Dividends. The Parent Company’s principal source of cash flow, including cash flow to pay dividends to its shareholders, is the dividends that it receives from United Bank. Statutory and regulatory limitations apply to the Bank’s payments of dividends to the Parent Company as well as to the Parent Company’s payment of dividends to its shareholders. A depository institution may not pay any dividend if payment would cause it to become undercapitalized or if it already is undercapitalized. The federal banking agencies may prevent the payment of a dividend if they determine that the payment would be an unsafe and unsound banking practice. Moreover, the federal agencies have issued policy statements that provide financial holding companies and insured banks should generally only pay dividends out of current operating earnings.
Community Reinvestment Act. United Bank is subject to the provisions of the Community Reinvestment Act of 1977 (“CRA”), as amended, and the federal banking agencies’ related regulations, stating that all banks have a continuing and affirmative obligation, consistent with safe and sound operations, to help meet the credit needs of the communities they serve. The CRA requires a depository institution’s primary federal regulator, in connection with its examination of the institution or its evaluation of certain regulatory applications, to evaluate the institution’s record in assessing and meeting the credit needs of the community served by that institution, including low and moderate-income neighborhoods. The regulatory agency’s assessment of the institution’s record is made available to the public. Failure of an institution to receive at least a “satisfactory” rating on a CRA examination could prevent a bank or its parent company from engaging in certain activities such as establishing de novo branches and branch relocations or acquiring other financial institutions.
Insurance Regulation. The Company’s subsidiaries that may underwrite or sell insurance products are subject to regulation by the Kentucky Department of Insurance.
Consumer Regulation. The activities of the Company and the Bank are subject to a variety of statutes and regulations designed to protect consumers. These laws and regulations:
|
● |
limit the interest and other charges collected or contracted for by the Bank; |
|
● |
govern disclosures of credit terms to consumer borrowers; |
|
● |
require financial institutions to provide information to enable the public and public officials to determine whether a financial institution is fulfilling its obligation to help meet the housing needs of the community it serves; |
|
● |
prohibit discrimination on the basis of race, creed, or other prohibited factors in extending credit; |
|
● |
require the Bank to safeguard the personal non-public information of its customers, provide annual notices to consumers regarding the usage and sharing of such information and limit disclosure of such information to third parties except under specific circumstances; and |
|
● |
govern the manner in which consumer debts may be collected by collection agencies. |
The deposit operations of the Bank are also subject to laws and regulations that:
|
● |
require disclosure of the interest rate and other terms of consumer deposit accounts; |
|
● |
impose a duty to maintain the confidentiality of consumer financial records and prescribe procedures for complying with administrative subpoenas of financial records; and |
|
● |
govern automatic deposits to and withdrawals from deposit accounts and customers’ rights and liabilities arising from the use of automated teller machines and other electronic banking services. |
Emergency Economic Stabilization Act of 2008 (“EESA”). EESA was signed into law during 2008 as a measure to stabilize and provide liquidity to the U.S. financial markets. Under EESA, the Troubled Asset Relief Program (“TARP”) was created. TARP granted the U.S. Treasury (“Treasury”) authority to, among other things, invest in financial institutions and purchase troubled assets in an aggregate amount up to $700 billion.
In connection with TARP, the Capital Purchase Program (“CPP”) was launched on October 14, 2008. Under the CPP, the Treasury announced a plan to use up to $250 billion of TARP funds to purchase equity stakes in certain eligible financial institutions, including the Company. The Company received $30.0 million of equity capital under the CPP in January 2009. In the transaction, the Company issued 30,000 shares of fixed-rate cumulative perpetual preferred stock to the Treasury. The terms of the preferred shares required the Company to pay a 5% cumulative dividend during the first five years the shares were outstanding, resetting to 9% thereafter, and includes certain restrictions on dividend payments of lower ranking equity. The Company repurchased 20,000 of its outstanding preferred shares during 2014 for $20.0 million and repurchased the remaining 10,000 shared during 2015 for $10.0 million. No additional debt or equity was issued in connection with any of the shares redeemed.
During June 2012, the Treasury conducted an auction as part of ongoing efforts to wind down and recover its remaining CPP investments. The auction included preferred stock positions held by the Treasury of seven banks participating in the CPP, including the $30.0 million investment in the Company’s Series A preferred stock. The Treasury was successful in selling all of its investment in the Company’s Series A preferred stock to private investors through a registered public offering. The Company received no proceeds as part of the transaction.
Dodd-Frank Act. The Dodd-Frank Act was signed into law in July 2010. The Dodd-Frank Act implements far-reaching changes to the regulation of the financial services industry, including provisions that:
|
● |
centralize responsibility for consumer financial protection by creating the Consumer Financial Protection Bureau, a new agency responsible for implementing, examining, and enforcing compliance with federal consumer financial laws; |
|
● |
apply the same leverage and risk-based capital requirements that apply to insured depository institutions to bank holding companies; |
|
● |
require the federal banking regulators to seek to make their capital requirements countercyclical, so that capital requirements increase in times of economic expansion and decreases in times of economic contraction; |
|
● |
change the assessment base for federal deposit insurance from the amount of insured deposits to consolidated assets less tangible capital; |
|
● |
provide for new disclosure and other requirements relating to executive compensation and corporate governance; |
|
● |
make permanent the $250 thousand limit for federal deposit insurance; |
|
● |
repeal the federal prohibitions on the payment of interest on commercial demand deposits, thereby permitting depository institutions to pay interest on business transaction and other accounts; |
|
● |
increase the authority of the Federal Reserve to examine non-bank subsidiaries; and |
|
● |
codify and expand the “source of strength” doctrine as a statutory requirement. The source of strength doctrine represents the long held policy view by the Federal Reserve that a bank holding company should serve as a source of financial strength for its subsidiary banks. The Parent Company, under this requirement, is expected to commit resources to support a distressed subsidiary bank. |
Volcker Rule. The Dodd-Frank Act prohibits insured depository institutions and their holding companies from engaging in proprietary trading except in limited circumstances, and prohibits certain ownership interests in and relationships with private equity and hedge funds (commonly referred to as the “Volcker Rule”). On December 10, 2013, U.S. financial regulators, including the Federal Reserve, adopted final rules to implement the Volcker Rule. The final rules were effective April 1, 2014, but the conformance period to bring activities and investments into compliance was extended to July 21, 2015. The Company currently does not have any impermissible holdings under the rule.
Competition
The Company faces vigorous competition for banking services from various types of businesses other than commercial banks and savings and loan associations. These include, but are not limited to, credit unions, mortgage lenders, finance companies, insurance companies, stock and bond brokers, financial planning firms, and department stores, which compete for one or more lines of banking business. The Company also competes for commercial and retail business not only with banks in Central and Northern Kentucky, but with banking organizations from Ohio, Indiana, Tennessee, Pennsylvania, and North Carolina which have banking subsidiaries located in Kentucky. These competing businesses may possess greater resources and offer a greater number of branch locations, higher lending limits, and may offer other services not provided by the Company. In addition, the Company’s competitors that are not depository institutions are generally not subject to the extensive regulations that apply to the Company and its subsidiary bank. As financial services become increasingly dependent on technology, permitting transactions to be conducted by telephone, mobile banking, and the internet, non-depository institutions are able to attract funds and provide lending and other financial services without offices located in our market area. The Company has attempted to offset some of the advantages of its competitors by arranging participations with other banks for loans above its legal lending limits, expanding into additional markets and product lines, and entering into third party arrangements to better compete for its targeted customer base. Competition from other providers of financial services may reduce or limit the Company’s profitability and market share.
The Company competes primarily on the basis of quality of services, interest rates and fees charged on loans, and the rates of interest paid on deposit funds. The business of the Company is not dependent upon any one customer or on a few customers, and the loss of any one or a few customers would not have a material adverse effect on the Company.
No material portion of the business of the Company is seasonal. No material portion of the business of the Company is subject to renegotiation of profits or termination of contracts or subcontracts at the election of the government, though certain contracts are subject to such renegotiation or termination.
The Company is not engaged in operations in foreign countries.
Employees
As of December 31, 2017, the Company had 426 full-time equivalent employees. Employees are offered a variety of benefits. A salary savings plan, group life insurance, hospitalization, dental, vision, and major medical insurance along with postretirement health insurance benefits are available to eligible personnel. The Company maintains two postretirement health insurance benefit plans. Employees hired on or after January 1, 2016 are not eligible for the benefits related to those plans. Employees are not represented by a union. Management and employee relations are considered good.
The Company previously granted certain eligible employees the option to purchase a limited number of the Company’s common stock under a Stock Option Plan (“Plan”) approved by its shareholders in 1998. The Plan included the conditions and terms that the grantee must meet in order to exercise the options. No options have been granted under the Plan since 2004 and all unexercised options granted under the Plan expired during 2014. The Company has no current intention to grant any additional options under the Plan.
In 2004, the Company’s Board of Directors adopted an Employee Stock Purchase Plan (“ESPP”). The ESPP was subsequently approved by the Company’s shareholders and became effective July 1, 2004. Under the ESPP, at the discretion of the Board of Directors, employees of the Company and its subsidiaries can purchase Company common stock at a discounted price and without payment of brokerage costs or other fees and in the process benefit from the favorable tax treatment afforded such plans pursuant to Section 423 of the Internal Revenue Code.
Available Information
The Company makes available free of charge through its website (www.farmerscapital.com) its Code of Ethics and other filings with the Securities and Exchange Commission (“SEC”), including its annual reports on Form 10-K, quarterly reports on Form 10-Q, current reports on Form 8-K, and amendments to these reports filed or furnished pursuant to Section 13(a) or 15(d) of the Exchange Act as soon as reasonably practicable after electronically filing such material with the SEC. Any amendments to the Code of Ethics and any waiver applicable to the Company’s chief executive officer and chief financial officer are also posted on the website.
Item 1A. Risk Factors
Investing in the Company’s common stock is subject to risks inherent to the Company’s business. The material risks and uncertainties that management believes affect the Company are described below. Before making an investment decision, you should carefully consider the risks and uncertainties described below together with all of the other information included or incorporated by reference in this report. The risks and uncertainties described below are not the only ones facing the Company. Additional risks and uncertainties that management is not aware of or focused on or that management currently deems immaterial may also impair the Company’s business operations. This report is qualified in its entirety by these risk factors.
If any of the following risks actually occur, the Company’s financial condition and results of operations could be materially and adversely affected. If this were to happen, the market price of the Company’s common stock could decline significantly, and shareholders could lose all or part of their investment.
The Company operates in a highly regulated environment and may be adversely affected by changes in federal and state laws and regulations.
The Company is subject to extensive regulation, supervision, and examination by federal and state banking authorities. Any change in applicable regulations or laws could have a substantial adverse impact on the Company and its operations. Additional legislation and regulations that could significantly affect the Company’s powers, authority, and operations may be enacted or adopted in the future, which could have a material adverse effect on the Company’s results of operations and financial condition. Further, in the performance of their supervisory duties and enforcement powers, the Company’s banking regulators have significant discretion and authority to prevent or remedy practices they deem as unsafe or unsound or violations of law. The exercise of regulatory authority may have a negative impact on the Company’s operations, which may be material to its results of operations and financial condition.
The Company in the future may become subject to supervisory actions and/or enhanced regulation that could have a material negative effect on its business, operating flexibility, financial condition and the value of its common stock.
Under federal and state laws and regulations pertaining to the safety and soundness of insured depository institutions, the KDFI (for state-chartered banks), the Federal Reserve (for bank holding companies), and the FDIC as the insurer of bank deposits, have the authority to compel or restrict certain actions on the Company’s part if they determine that the Company has insufficient capital or is otherwise operating in a manner that may be deemed to be inconsistent with safe and sound banking practices. Under this authority, bank regulators can require the Company to enter into informal or formal enforcement orders, including board resolutions, memoranda of understanding, written agreements and consent or cease and desist orders, pursuant to which the Company would be required to take identified corrective actions to address cited concerns and to refrain from taking certain actions.
If the Company is unable to comply with the terms of future regulatory orders to which it may become subject, then it could become subject to additional, heightened supervisory actions and orders, possibly including cease and desist orders, prompt corrective actions, and/or other regulatory enforcement actions. If the Company’s regulators were to take such additional supervisory actions, then we could, among other things, become subject to significant restrictions on our ability to develop any new business, as well as restrictions on our existing business, and we could be required to raise additional capital, dispose of certain assets and liabilities within a prescribed period of time, or both. If the Company’s bank is unable to comply with regulatory requirements, it could ultimately face failure. The terms of any such supervisory action could have a material negative effect on our business, operating flexibility, financial condition and the value of our common stock.
Our nonperforming assets adversely affect our results of operations and financial condition and take significant management time to resolve.
Nonperforming assets are made up of nonperforming loans, other real estate owned, and other foreclosed assets. Nonperforming loans include nonaccrual loans, performing restructured loans, and loans 90 days or more past due and still accruing interest. Nonperforming assets adversely affect the Company’s net income in several ways. The Company does not record interest income on nonaccrual loans or other real estate owned, thereby adversely affecting interest income. When the Company repossesses collateral in foreclosures and similar proceedings, it is required to record the property at its fair value less estimated selling costs, which typically decreases net income. The Company’s level of nonperforming assets have improved considerably in the last few years. At year-end 2017, nonperforming assets are $20.9 million, the lowest level since the third quarter of 2007. As a percent of total assets, nonperforming assets are 1.2% at year-end 2017.
Nonperforming loans and other real estate owned also increase our risk profile and the amount of capital the Company’s regulators believe is appropriate in light of such risks. While the Company seeks to limit its problem loans through workouts, restructurings, and otherwise, decreases in the value of these assets, the underlying collateral, or our borrowers’ performance or financial conditions have adversely affected, and may continue to adversely affect, the Company’s results of operations and financial condition. Moreover, the resolution of nonperforming assets requires significant time commitments from management of our bank, which can be detrimental to the performance of their other responsibilities. There can be no assurance that the Company will not experience further increases in nonperforming loans in the future. If economic conditions do not improve or worsen in our markets, the Company could continue to incur additional losses relating to an increase in nonperforming assets.
Losses from loan defaults may exceed the allowance established for that purpose, which will have an adverse effect on the Company’s financial condition.
Volatility and deterioration in the broader economy increase the Company’s risk of credit losses, which could have a material adverse effect on its operating results. If a significant number of loans in the Company’s portfolio are not repaid, it would have an adverse effect on its earnings and overall financial condition. The Company’s bank subsidiary maintains an allowance for loan losses to provide for losses inherent in the loan portfolio. The allowance for loan losses reflects management’s best estimate of probable incurred credit losses in their loan portfolio at the balance sheet date. This evaluation is primarily based upon a review of the bank’s historical loan loss experience, known risks contained in the bank’s loan portfolio, composition and growth of the bank’s loan portfolio, and other economic and qualitative factors. Additionally, the bank’s regulators may require additional provision for the loan portfolio in connection with their examinations, agreements, or orders. The determination of an appropriate level of loan loss allowance is an inherently difficult process and is based on numerous assumptions. As a result, the Company’s allowance for loan losses may be inadequate to cover actual losses in its loan portfolio. Consequently, the Company risks having additional future provision for loan losses that may materially affect its earnings.
If the Company’s local markets experience a prolonged recession or economic downturn, it may be required to make further increases in its allowance for loan losses and to charge off additional loans, which would adversely affect its results of operations and capital.
Substantially all of the Company’s loans are to businesses and individuals located in Kentucky. A downturn or prolonged decline in the Central and Northern Kentucky economies could negatively impact demand for the Company’s products and services, the ability of customers to repay their loans, collateral values securing loans, and the stability of funding sources. This could result in a material adverse effect on the Company’s financial condition, results of operations and prospects. Further, approximately 62% of the Company’s investments in municipal bonds are issued by political subdivisions or agencies located in Kentucky.
Generally, the Company’s nonperforming loans and assets reflect operating difficulties of individual borrowers. Deterioration in real estate and other financial markets could adversely impact the Company’s financial performance. If trends in the housing and real estate markets worsen, the Company could experience an increase in delinquencies and credit losses. As a result, the Company may be required to increase its provision for loan losses and charge off additional loans in the future, which could adversely affect the Company’s financial condition and results of operations, perhaps materially. If additional provisions and charge-offs cause the Company to experience losses, it may be required to contribute additional capital to the bank to maintain capital ratios required by regulators.
The Company’s exposure to credit risk is increased by its real estate development lending.
Real estate development lending has historically been considered to be higher credit risk than that of other types of lending, such as for single-family residential properties. At year-end 2017, $3.7 million or 3% of the outstanding balance of our real estate development loans was classified as impaired. Real estate development loans typically involve larger loan balances to a single borrower or related borrowers. These loans can be affected by adverse conditions in real estate markets or the economy in general because commercial real estate borrowers’ ability to repay their loans depends on successful development and, in most cases, sale of the underlying property. These loans also involve greater risk because they generally are not fully amortized over the loan period, but have a balloon payment due at maturity of the loan. A borrower’s ability to make a balloon payment typically depends on being able to either refinance the loan or timely sell the underlying property. If the real estate markets were to worsen or not improve, the Company likely will experience increased credit losses and require additional provisions to our allowance for loan losses, which would adversely impact the Company’s earnings and financial condition.
Changes in consumer use of banks and changes in consumer spending and saving habits could adversely affect our financial results.
Technology and other changes now allow many consumers to complete financial transactions without using banks. For example, consumers can pay bills and transfer funds directly without going through a bank. This “disintermediation” could result in the loss of fee income, as well as the loss of customer deposits and income generated from those deposits. In addition, changes in consumer spending and saving habits could adversely affect the Company’s operations, and it may be unable to timely develop competitive new products and services in response to these changes that are accepted by new and existing customers.
Maintaining or increasing the Company’s market share may depend on lowering prices and market acceptance of new products and services.
The Company’s success depends, in part, on its ability to adapt products and services to evolving industry standards. There is increasing pressure to provide products and services at lower prices. Lower prices can reduce net interest margin and revenues from fee-based products and services. In addition, the widespread adoption of new technologies, including internet services, could require the Company to make substantial expenditures to modify or adapt existing products and services. Also, these and other capital investments may not produce expected growth in earnings anticipated at the time of the expenditure. The Company might not be successful in introducing new products and services, achieving market acceptance of its products and services, or developing and maintaining loyal customers.
The Company’s investment securities portfolio is comparatively larger than other community banks and it is more dependent on its investment portfolio to generate net income.
The Company relies more heavily on its investment securities portfolio as a source of interest income than many other community banks because its loan portfolio makes up a smaller proportion of its earning assets. If the Company is not able to successfully manage the interest rate spread on the investment portfolio, its net interest income will decrease, which would adversely affect its results of operations and negatively impact net income. Investment securities tend to have a lower risk than loans, and as such, generally provide a lower yield. For 2017, average investment securities made up 28.7% of the Company’s average total assets. Interest income on investment securities accounted for 16.9% of total interest income for 2017.
The Company periodically sells investment securities at irregular intervals in the normal course of business to execute its current asset/liability management strategies. This will result in the realization of either a net gain or loss. Moreover, proceeds from sales may be reinvested in investment securities with lower yields, which could reduce future earnings from investment securities. The Company monitors its investment securities portfolio for deteriorating values and for other-than-temporary impairment. Uncertainty surrounding the credit risk associated with mortgage collateral or guarantors may cause material discrepancies in valuation estimates obtained from third parties. Volatile market conditions may reduce the valuations of investment securities due to the perception of heightened credit and liquidity risks in addition to interest rate risk. There can be no assurance that declines in market value associated with these disruptions will not result in material impairments of these assets, which could have an adverse effect on the Company’s results of operations and could lead to additional losses.
The Company is exposed to risk of environmental liability when it takes title to properties.
In the course of its business, the Company may foreclose on and take title to real estate. As a result, it could be subject to environmental liabilities with respect to these properties. The Company may be held liable to a governmental entity or to third parties for property damage, personal injury, investigation and clean-up costs incurred by these parties in connection with environmental contamination or may be required to investigate or clean up hazardous or toxic substances or chemical releases at a property. The costs associated with investigation or remediation activities could be substantial. Additionally, if the Company is the owner or former owner of a contaminated site, it may be subject to common law claims by third parties based on damages and costs resulting from environmental contamination stemming from the property. If the Company becomes subject to significant environmental liabilities, it could have a material adverse effect on its business, results of operations, and financial condition.
The Company may not realize the anticipated benefits of merging its subsidiary banks and data processing company into one bank.
On February 20, 2017, the Company merged its four subsidiary banks and data processing subsidiary into one bank. The Company experienced a decline in overall operating costs as a result of the merger. However, further cost reductions may differ materially from expectations, which could have an adverse impact on the Company’s financial condition.
The Company cannot accurately predict the effect of the current economy on its future results of operations or the market price of its stock.
The Company cannot accurately predict the timing, severity, or duration of an economic slowdown, which can adversely impact its performance and the markets it serves. Any deterioration in the economies of the nation as a whole or in the Company’s local markets would have an adverse effect, which could be material, on the Company’s financial condition, results of operations, and prospects and could also cause the market price of the Company’s stock to decline. While it is impossible to predict how long these conditions may exist, economic uncertainty could continue to present risks for some time for our industry and the Company.
Interest rate volatility could significantly harm the Company’s results of operations.
The Company’s results of operations are affected by the monetary and fiscal policies of the federal government, the policies of its regulators, and the prevailing interest rates in the United States and the Company’s markets. In addition, it is increasingly common for the Company’s competitors, who may be aggressively seeking to attract deposits as a result of liquidity concerns arising from changing economic or other conditions, to pay rates on deposits that are much higher than normal market rates. A significant component of the Company’s earnings is net interest income, which is the difference between the income from interest earning assets, such as loans, and the expense on interest bearing liabilities, such as deposits. A change in market interest rates could adversely affect the Company’s earnings if market interest rates change such that the interest it pays on deposits and borrowings increases faster than the interest it collects on loans and investments; or, alternatively, if interest rates earned on earning assets decline faster than those rates paid on interest paying liabilities. Consequently, as with most financial institutions, the Company is sensitive to interest rate fluctuations. Changes in market interest rates may also affect the level of voluntary prepayments on loans and mortgage-back investment securities resulting in the receipt of funds that may be reinvested at a lower rate.
The FDIC periodically amends its deposit insurance rate assessment structure, which can increase costs to the Company.
Under the Federal Deposit Insurance Act, as amended by the Dodd-Frank Act, the FDIC must establish and implement a plan to restore the deposit insurance fund’s designated reserve ratio to 1.35% of insured deposits by 2020. The FDIC must continue to assess and consider the appropriate level of the reserve ratio annually by considering each of the following: risk of loss to the insurance fund; economic conditions affecting the banking industry; the prevention of sharp swings in the assessment rates; and any other factors the FDIC deems important. The FDIC’s current fund management strategy includes a targeted long-term reserve ratio of 2.0%.
The Dodd-Frank Act required changes to a number of components of the FDIC insurance assessment. While these changes have resulted in a lower amount of deposit insurance assessments for the Company, future changes in assessment rates or methodology could adversely impact the Company’s future earnings and liquidity in a material amount.
Changes in the corporate federal, state or local income tax laws may adversely impact the Company’s results of operations.
The Company is subject to changes in tax law that could increase its effective tax rates. These changes may be retroactive to previous periods and as a result could negatively affect the Company’s current and future financial performance. On December 22, 2017, President Trump signed into law the Tax Cuts and Jobs Act (“Tax Act”) that significantly reforms the Internal Revenue Code of 1986, as amended. The Tax Act could have both positive and negative effects on our financial performance. The new legislation, among other things, includes a reduction in the federal corporate tax rate from 35% to 21% beginning in 2018, which will have a favorable impact on the Company’s results of operations. However, under accounting principles generally accepted in the United States of America, the Company recorded tax expense of $5.9 million in the fourth quarter of 2017 due to revaluing its net deferred tax assets as a result of the lower corporate tax rate. The Company’s customers are likely to experience varying effects from both the individual and business tax provisions of the Tax Act, which could adversely impact demand for the Company’s products and services. The Company continues to examine the impact this tax reform legislation may have on its financial condition and results of operations.
Transactions between the Company and its captive insurance subsidiary (the “Captive”) may be subject to certain IRS responsibilities and penalties.
The Company’s Captive is a Kentucky-based, wholly-owned insurance subsidiary of the Company that provides property and casualty insurance coverage to its subsidiaries for risk management purposes or where insurance may not be available or economically feasible. The Treasury Department of the United States and the IRS by way of Notice 2016-66 have stated that transactions believed similar in nature to transactions between the Captive and the Company’s other subsidiaries may have the potential for tax avoidance or evasion and may be deemed by the IRS as an abusive tax structure subject to significant penalties, interest and possible criminal prosecution.
Any future losses may require the Company to raise additional capital; however, such capital may not be available to us on favorable terms or at all.
The Company is required by federal and state regulatory authorities to maintain certain levels of capital to support its operations. While the Company’s current capital levels materially exceed regulatory requirements, the Company’s ability to raise additional capital, if ever needed, will depend on conditions in the capital markets at that time and on the Company’s future financial condition and performance. Accordingly, the Company cannot make assurances with respect to its ability to raise additional capital on favorable terms, or at all. If the Company cannot raise additional capital when needed, its ability to further expand its operations through internal growth and acquisitions could be materially impaired and its financial condition and liquidity could be materially and adversely affected. The Company is currently under no directive by its regulators to raise any additional capital.
The tightening of available liquidity could limit the Company’s ability to replace deposits and fund loan demand, which could adversely affect its earnings and capital levels.
Liquidity is crucial to the Company’s business. While the Company’s liquidity materially exceeds regulatory requirements, a tightening of the credit and liquidity markets and the Company’s inability to obtain adequate funding to replace deposits may negatively affect its earnings and capital levels. In addition to deposit growth, maturity of investment securities, and loan payments from borrowers, the Company relies from time to time on advances from the Federal Home Loan Bank and other wholesale funding sources to fund loans and replace deposits. In the event of a downturn in the economy, these additional funding sources could be negatively affected which could limit the funds available to the Company. The Company’s liquidity position could be significantly constrained if it were unable to access funds from the Federal Home Loan Bank or other wholesale funding sources.
The Company’s financial condition and outlook may be adversely affected by damage to its reputation.
The Company’s financial condition and outlook is highly dependent upon perceptions of its business practices and reputation. Its ability to attract and retain customers and employees could be adversely affected to the extent its reputation is damaged. Negative public opinion could result from its actual or alleged conduct in any number of activities, including regulatory actions taken against the Company, lending practices, corporate governance, regulatory compliance, mergers of its subsidiaries, or sharing or inadequate protection of customer information. Damage to the Company’s reputation could give rise to loss of customers and legal risks, which could have an adverse impact on its financial condition.
The Company faces strong competition from financial services companies and other companies that offer banking services.
The Company conducts most of its operations in Central and Northern Kentucky. The banking and financial services businesses in these areas are highly competitive and increased competition in its primary market areas may adversely impact the level of its loans and deposits. Ultimately, the Company may not be able to compete successfully against current and future competitors. These competitors include national banks, regional banks, and other community banks. The Company also faces competition from other types of financial institutions, including savings and loan associations, finance companies, brokerage firms, insurance companies, credit unions, mortgage banks, and other financial intermediaries. The Company’s competitors include major financial companies whose greater resources may afford them a marketplace advantage by enabling them to maintain numerous locations and mount extensive promotional and advertising campaigns. Areas of competition include interest rates for loans and deposits, efforts to obtain loan and deposit customers, and the range of products and services provided, including new technology-driven products and services. If the Company is unable to attract and retain banking customers, it may be unable to increase its loans and level of deposits.
The price of the Company’s common stock may fluctuate significantly, and this may make it difficult to resell the stock when you want or at prices you find attractive.
The Company cannot predict how its common stock will trade in the future. The market value of its common stock will likely continue to fluctuate in response to a number of factors including the following, most of which are beyond our control, as well as the other factors described in this “Risk Factors” section:
|
● |
general economic conditions and conditions in the financial markets; |
|
● |
changes in global financial markets, such as interest or foreign exchange rates, stock, commodity or real estate valuations or volatility, and other geopolitical events; |
|
● |
conditions in our local and national credit, mortgage, and housing markets; |
|
● |
developments with respect to financial institutions generally, including government regulation; |
|
● |
our dividend practice; |
|
● |
actual and anticipated quarterly fluctuations in our operating results and earnings; |
|
● |
recommendations by securities analysts; |
|
● |
operating and stock price performance of other companies that investors deem comparable to us; |
|
● |
news reporting relating to trends, concerns and other issues in the financial services industry; and |
|
● |
perceptions in the marketplace regarding us and/or our competitors. |
The market value of the Company’s common stock may also be impacted by conditions affecting the financial markets in general, including price and trading fluctuations. These conditions may result in: (1) volatility in the level of, and fluctuations in, the market prices of stocks generally and, in turn, the Company’s common stock and (2) sales of substantial amounts of the Company’s common stock in the market, in each case that could be unrelated or disproportionate to changes in the Company’s operating performance. These broad market fluctuations may adversely affect the market value of the Company’s common stock.
There may be future sales of additional common stock or other dilution of the Company’s equity, which may adversely affect the market price of the Company’s common stock.
The Company is not restricted from issuing additional common or preferred stock, including any securities that are convertible into or exchangeable for, or that represent the right to receive, common stock or preferred stock or any substantially similar securities. The market price of the Company’s common stock could decline as a result of sales by the Company of a large number of shares of common stock or preferred stock or similar securities in the market or from the perception that such sales could occur.
The Company’s board of directors is authorized generally to cause it to issue additional common and preferred stock without any action on the part of the Company’s shareholders, except as may be required under the listing requirements of the NASDAQ Stock Market. In addition, the board has the power, without shareholder approval, to set the terms of any series of preferred stock that may be issued, including voting rights, dividend rights, preferences, and other terms. This could include preferences over the common stock with respect to dividends or upon liquidation. If the Company issues preferred stock in the future that has a preference over the common stock with respect to the payment of dividends or upon liquidation, or if the Company issues preferred stock with voting rights that dilute the voting power of the common stock, the rights of holders of the common stock or the market price of the common stock could be adversely affected.
You may not receive dividends on the Company’s common stock.
Holders of the Company’s common stock are entitled to receive dividends only when, as, and if its board of directors declares them and as permitted by its regulators. Although we have recently declared cash dividends on our common stock, we are not required to do so and may reduce or eliminate our common stock dividends in the future. This could adversely affect the market price of our common stock. Also, the Company’s ability to declare and pay dividends is dependent on certain federal regulatory considerations, including the guidelines of the Federal Reserve Board regarding capital adequacy and dividends.
The Company’s ability to pay dividends depends upon the results of operations of its subsidiary bank and certain regulatory considerations.
The Parent Company is a financial holding company that conducts substantially all of its operations through its subsidiary bank. As a result, the Company’s ability to make dividend payments on its common stock depends primarily on certain federal and state regulatory considerations and the receipt of dividends and other distributions from its bank subsidiary.
The trading volume in the Company’s common stock is less than that of many other similar companies.
The Company’s common stock is listed for trading on the NASDAQ Global Select Stock Market. As of December 31, 2017, the 50-day average trading volume of the Company’s common stock on NASDAQ was 13,158 shares or .18% of the total common shares outstanding of 7,517,446. An efficient public trading market is dependent upon the existence in the marketplace of willing buyers and willing sellers of a stock at any given time. The Company has no control over such individual decisions of investors and general economic and market conditions. Given the lower trading volume of the Company’s common stock, larger sales volumes of its common stock could cause the value of its common stock to decrease. Moreover, due to its lower trading volume, it may take longer to liquidate your position in the Company’s common stock without detrimentally affecting the price.
The Company’s common stock constitutes equity and is subordinate to its existing and future indebtedness, and is effectively subordinated to all the indebtedness and other non-common equity claims against its subsidiaries.
Shares of the Company’s common stock represent equity interests in the Company and do not constitute indebtedness. Accordingly, the shares of the Company’s common stock rank junior to all of its indebtedness and to other non-equity claims on Farmers Capital Bank Corporation with respect to assets available to satisfy such claims.
The Company’s right to participate in any distribution of assets of any of its subsidiaries upon the subsidiary’s liquidation or otherwise, and thus the ability of the Company’s common stockholders to benefit indirectly from such distribution, will be subject to the prior claims of creditors of that subsidiary. As a result, holders of the Company’s common stock are effectively subordinated to all existing and future liabilities and obligations of its subsidiaries, including claims of bank depositors.
Market volatility could adversely impact the Company’s results of operations, liquidity position, and access to additional capital.
The capital and credit markets experienced heavy volatility and disruptions during much of the most recent economic downturn, with unprecedented levels of volatility and other disruptions. In many cases, this led to downward pressure on stock prices and credit availability for certain issuers without regard to those issuers’ underlying financial strength. If similar market disruptions and volatility recur, the Company may experience a material adverse effect on its results of operations and liquidity position or on its ability to access additional capital.
Risks associated with unpredictable economic and political conditions may be amplified as a result of our limited market area.
Commercial banks and other financial institutions, including the Company, are affected by economic and political conditions, both domestic and international, and by governmental monetary policies. These conditions and other factors beyond the Company’s control may adversely affect profitability. In addition, almost all of the Company’s primary business area is located in Central and Northern Kentucky. Significant downturns in this economic region may result in a deterioration of the Company’s credit quality, reduce demand for credit, and may harm the financial stability of the Company’s customers. Due to the Company’s regional market area, these negative conditions may have a more noticeable effect on the Company than would be experienced by an institution with a larger, more diverse market area.
The Company’s results of operations are significantly affected by the ability of its borrowers to repay their loans.
Lending money is an essential part of the banking business. However, borrowers do not always repay their loans. The risk of non-payment is affected by:
|
● |
unanticipated declines in borrower income or cash flow; |
|
● |
changes in economic and industry conditions; |
|
● |
the duration of the loan; and |
|
● |
in the case of a collateralized loan, uncertainties as to the future value of the collateral. |
Due to the fact that the outstanding principal balances can be larger for commercial loans than other types of loans, such loans present a greater risk to the Company than other types of loans when non-payment by a borrower occurs.
Consumer loans typically have shorter terms and lower balances with higher yields compared to real estate mortgage loans, but generally carry higher risks of default than real estate mortgage and commercial loans. Consumer loan collections are dependent on the borrower’s continuing financial stability, and thus are more likely to be affected by adverse personal circumstances. Furthermore, the application of various federal and state laws, including bankruptcy and insolvency laws, may limit the amount that can be recovered on these loans.
Inability to hire or retain certain key professionals, management, and staff could adversely affect the Company’s revenues and net income.
The Company relies on key personnel to manage and operate its business, including major revenue-generating functions such as its loan and deposit portfolios. The loss of key staff may adversely affect the Company’s ability to maintain and manage these portfolios effectively, which could negatively affect our revenues. In addition, loss of key personnel could result in increased recruiting and hiring expenses, which could cause a decrease in our net income.
The Company’s controls and procedures may fail or be circumvented.
The Company’s management regularly reviews and updates its internal controls, disclosure controls and procedures, and corporate governance policies and procedures. Any system of controls, however well-designed and operated, can provide only reasonable, not absolute, assurances that the objectives of the system of controls are met. Any failure or circumvention of the Company’s controls and procedures or failure to comply with regulations related to controls and procedures could have a material and adverse effect on the Company’s business, results of operations, and financial condition.
Because the nature of the financial services business involves a high volume of transactions, the Company faces significant operational risks.
Operational risk is the risk of loss resulting from operations, including, but not limited to, the risk of fraud by employees or persons outside of the Company, the execution of unauthorized transactions by employees, errors relating to transaction processing and technology, breaches of the internal control system and compliance requirements, and business continuation and disaster recovery. This risk of loss also includes the potential legal actions that could arise as a result of an operational deficiency or as a result of noncompliance with applicable regulatory standards, adverse business decisions or their implementation, and customer attrition due to potential negative publicity. In the event of a breakdown in the internal control system, improper operation of systems or improper employee actions, the Company could suffer financial loss, face regulatory action and suffer damage to its reputation.
A failure in or breach, including cyber attacks, of the Company’s operational or security systems, or those of its third party vendors and other service providers, could disrupt its businesses, result in the disclosure or misuse of confidential or proprietary information, damage its reputation, increase its costs and cause losses.
As a financial institution, the Company is susceptible to fraudulent activity that may be committed against it or its customers and that may result in financial losses to the Company or its customers, privacy breaches against its customers, or damage to the Company’s reputation. Such fraudulent activity may be in various forms, including check fraud, electronic fraud, wire fraud, phishing, and other dishonest acts. In recent periods, there has been a rise in electronic fraudulent activity within the financial services industry, especially in the commercial banking sector, due to cyber criminals targeting commercial bank accounts. Consistent with industry trends, the Company has also experienced an increase in attempted electronic fraudulent activity.
In addition, the Company’s operations rely on the secure processing, storage and transmission of confidential and other information on its computer systems and networks. Although the Company takes protective measures to maintain the confidentiality, integrity, and availability of its and its customers’ information, and modifies these protective measures as circumstances warrant, the nature of the threats continues to evolve. As a result, the Company’s computer systems, software and networks and those of its customers may be vulnerable to unauthorized access, loss or destruction of data (including confidential customer information), account takeovers, unavailability of service, computer viruses or other malicious code, cyber attacks and other events that could have an adverse security impact and result in significant losses by the Company and its customers. Despite the defensive measures the Company takes to manage its internal technological and operational infrastructure, these threats may originate externally from third parties, such as foreign governments, organized crime and other hackers, and outsource or infrastructure-support providers and application developers, or the threats may originate from within the Company. Given the increasingly high volume of transactions, certain errors may be repeated or compounded before they can be discovered and remedied.
The Company also faces the risk of operational disruption, failure, termination or capacity constraints of any of the third parties that facilitate its business activities, including exchanges, clearing agents, clearing houses or other financial intermediaries. Such parties could also be the source of an attack on, or breach of, the Company’s operational systems, data or infrastructure. In addition, as interconnectivity with its customers grows, the Company increasingly faces the risk of operational failure with respect to its customers’ electronic systems.
Although to date the Company has not experienced any material losses relating to cyber attacks or other information security breaches, there can be no assurance that it will not suffer such losses in the future. The Company’s risk and exposure to these matters remains heightened because of, among other things, the evolving nature of these threats, the outsourcing of some of the Company’s business operations, and the continued uncertain global economic environment. As cyber threats continue to evolve, the Company may be required to expend significant additional resources to continue to modify or enhance its protective measures or to investigate and remediate any information security vulnerabilities.
The Company maintains an insurance policy which it believes provides sufficient coverage at a manageable expense for an institution of its size and scope with similar technological systems. However, the Company cannot assure that this policy will afford coverage for all possible losses or would be sufficient to cover all financial losses, damages, or penalties, including lost revenues, should it experience any one or more of its or a third party’s systems failing or experiencing an attack.
The Company’s operations rely on certain external vendors.
The Company utilizes certain external vendors to provide products and services necessary to maintain its day-to-day operations. The Company is exposed to the risk that such vendors fail to perform under these arrangements. This could result in disruption to the Company’s business and have a material adverse impact on the Company’s results of operations and financial condition. There can be no assurance that the Company’s policies and procedures designed to monitor and mitigate vendor risks will be effective in preventing or limiting the effect of vendor non-performance.
Significant legal actions could subject the Company to substantial uninsured liabilities.
From time to time the Company is subject to claims related to its operations. These claims and legal actions, including supervisory actions by regulators, could involve large monetary claims and significant costs to defend. To protect the Company from the cost of these claims, it maintains insurance coverage in amounts and with deductibles that are believed to be appropriate for its operations. However, the insurance coverage may not cover all claims against the Company or continue to be available at a reasonable cost. As a result, the Company may be exposed to substantial uninsured liabilities, which could have a material adverse effect on the Company’s business, results of operations, and financial condition.
The Company is subject to claims and litigation pertaining to fiduciary responsibility.
Customers or others may make claims and take legal action against the Company related to fiduciary responsibilities. If claims and legal action against the Company are not resolved in a favorable manner to the Company, it could result in a material financial liability or damage to our reputation.
The Dodd-Frank Act has increased the Company’s costs of operations which could adversely impact the Company's results of operations, financial condition or liquidity
The goals of the Dodd-Frank Act include restoring public confidence in the financial system, preventing another financial crisis, and allowing regulators to identify failings in the system before another crisis can occur. As part of the reform, the Dodd-Frank Act created the Financial Stability Oversight Council, with oversight authority for monitoring and regulating systemic risk, and the Consumer Financial Protection Bureau, which has broad regulatory and enforcement powers over consumer financial products and services. The Dodd-Frank Act also changes the responsibilities of the current federal banking regulators, imposes additional corporate governance and disclosure requirements in areas such as executive compensation and proxy access, and limits or prohibits proprietary trading, hedge fund, and private equity activities of banks. It also impacts areas such as deposit insurance, mortgage lending, capital requirements, securitizations, and insurance.
The scope of the Dodd-Frank Act impacts many aspects of the financial services industry and requires the development and adoption of numerous implementing regulations, some of which have yet to be finalized. Consequently, the effects of the Dodd-Frank Act on the financial services industry and the Company will depend, in large part, upon the extent to which regulators exercise the authority granted to them and the approaches taken to implement the regulations. The Company continually assesses the impact of the Dodd-Frank Act on its business and operations and believes that compliance with these new laws and regulations has resulted in higher costs, but the probable impact cannot be measured with a high degree of certainty. Compliance with the new laws and regulations could adversely impact the Company’s results of operations, financial condition, or liquidity, any of which may impact the market price of the Company’s common stock.
Item 1B. Unresolved Staff Comments
None.
Item 2. Properties
The Company owns or leases buildings that are used in the normal course of its business. The corporate headquarters is located at 202 W. Main Street, Frankfort, Kentucky, in a building owned by the Company. The Company’s subsidiaries own or lease various other offices in the counties and cities in which they operate. See the Notes to Consolidated Financial Statements contained in Item 8, “Financial Statement and Supplementary Data,” of this Form 10-K for information with respect to the amounts at which bank premises and equipment are carried and commitments under long-term leases.
Unless otherwise indicated, the properties listed below are owned by the Company and its subsidiaries as of December 31, 2017.
Corporate Headquarters
202 – 208 W. Main Street, Frankfort, KY
|
Banking Offices |
||
|
Bourbon Region: |
||
|
125 W. Main Street, Frankfort, KY |
||
|
555 Versailles Road, Frankfort, KY |
||
|
1401 Louisville Road, Frankfort, KY |
||
|
154 Versailles Road, Frankfort, KY |
||
|
1301 US 127 South, Frankfort, KY (leased) |
||
|
128 S. Main Street, Lawrenceburg, KY |
||
|
201 West Park Shopping Center, Lawrenceburg, KY |
||
|
838 N. College Street, Harrodsburg, KY |
||
|
Bluegrass Region: |
||
|
100 United Drive, Versailles, KY |
||
|
146 N. Locust Street, Versailles, KY |
||
|
206 N. Gratz, Midway, KY |
||
|
200 E. Main Street, Georgetown, KY |
||
|
100 Farmers Bank Drive, Georgetown, KY (leased) |
||
|
100 N. Bradford Lane, Georgetown, KY |
||
|
3285 Main Street, Stamping Ground, KY |
||
|
2509 Sir Barton Way, Lexington, KY |
||
|
3098 Harrodsburg Road, Lexington, KY (leased) |
||
|
201 N. Main Street, Nicholasville, KY |
||
|
995 S. Main Street (Kroger Store), Nicholasville, KY (leased) |
||
|
986 N. Main Street, Nicholasville, KY |
||
|
106 S. Lexington Avenue, Wilmore, KY |
||
|
Heartland Region: |
||
|
425 W. Dixie Avenue, Elizabethtown, KY |
||
|
3030 Ring Road, Elizabethtown, KY |
||
|
111 Towne Drive (Kroger Store), Elizabethtown, KY (leased) |
||
|
645 S. Dixie Blvd., Radcliff, KY |
||
|
4810 N. Preston Highway, Shepherdsville, KY |
||
|
157 Eastbrooke Court, Mt. Washington, KY |
||
|
Riverfront Region: |
||
|
103 Churchill Drive, Newport, KY |
||
|
7300 Alexandria Pike, Alexandria, KY |
||
|
164 Fairfield Avenue, Bellevue, KY |
||
|
8730 US Highway 42, Florence, KY |
||
|
34 N. Ft. Thomas Avenue, Ft. Thomas, KY |
||
|
2911 Alexandria Pike, Highland Heights, KY |
||
|
2774 Town Center Blvd., Crestview Hills, KY (leased) |
Service Support Center
102 Bypass Plaza, Frankfort, KY
Other
201 W. Main Street, Frankfort, KY
The Company considers its properties to be suitable and adequate based on its present needs.
Item 3. Legal Proceedings
As of December 31, 2017, there were various pending legal actions and proceedings against the Company arising from the normal course of business and in which claims for damages are asserted. It is the opinion of management, after discussion with legal counsel, that the disposition or ultimate resolution of such claims and legal actions will not have a material effect upon the consolidated financial statements of the Company.
Item 4. Mine Safety Disclosures
Not applicable.
PART II
Item 5. Market for Registrant's Common Equity, Related Stockholder Matters and Issuer Purchases of Equity Securities
Beginning January 1, 2014, the Company changed the payment form of its board meeting fees and quarterly fees from 100% cash to 50% in cash and 50% in Company common stock. The shares are issued as part of a plan adopted by the board of directors. Each director has elected to participate by entering an agreement with the Company to accept common stock in lieu of cash for 50% of the director’s board meeting and quarterly fees. As the shares are only issued to directors as part of a plan approved by the board, the shares are exempt from the registration requirements of the Securities Act of 1933, as amended (the “1933 Act”), as a sale not involving any public offering under Section 4(2) of the 1933 Act. The value of the shares issued in payment is determined by the closing price of the Company’s common stock on the NASDAQ Global Select Market on the business trading day immediately preceding the meeting day for board meeting fees and the business trading day immediately preceding the first meeting of the quarter for each quarterly fee. Attendance for committee meetings continue to be paid completely in cash. As employee directors are not paid director’s fees, only non-employee directors receive stock under this plan.
During 2017, the Company issued a total of 2,635 shares of common stock to its non-employee directors under this plan as compensation for $105 thousand of director fees. The cash retained by the Company by issuing common stock in lieu of paying cash is used for general corporate purposes. There are no brokers involved in the issuance of stock to directors and no commissions or other broker fees are paid.
At various times, the Company’s Board of Directors has authorized the purchase of shares of the Company’s outstanding common stock. No stated expiration dates have been established under any of the previous authorizations. There were no shares of common stock repurchased by the Company during the quarter ended December 31, 2017. There are 84,971 shares that may still be purchased under the various authorizations, though no shares have been purchased since 2008.
Performance Graph
The following graph sets forth a comparison of the five-year cumulative total returns among the shares of Company Common Stock, the NASDAQ Composite Index ("broad market index"), and Southeastern Banks Under $1 Billion Market-Capitalization ("peer group index"). Cumulative shareholder return is computed by dividing the sum of the cumulative amount of dividends for the measurement period and the difference between the share price at the end and the beginning of the measurement period by the share price at the beginning of the measurement period.
The broad market index includes over 3,000 domestic and international based common shares listed on The NASDAQ Stock Market. The peer group index consists of 23 banking companies in the Southeastern United States. The Company is included among those in the peer group index.
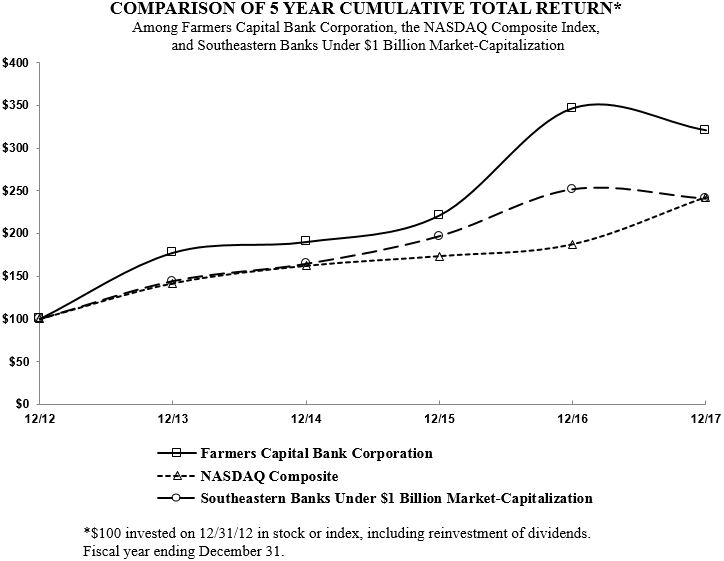
|
2012 |
2013 |
2014 |
2015 |
2016 |
2017 |
|||||||||||||||||||
|
Farmers Capital Bank Corporation |
$ | 100.00 | $ | 177.55 | $ | 190.12 | $ | 221.31 | $ | 346.85 | $ | 321.02 | ||||||||||||
|
NASDAQ Composite |
100.00 | 141.63 | 162.09 | 173.33 | 187.19 | 242.29 | ||||||||||||||||||
|
Southeastern Banks Under $1 Billion Market-Capitalization |
100.00 | 144.38 | 164.09 | 196.89 | 251.71 | 240.67 | ||||||||||||||||||
Corporate Address
The headquarters of Farmers Capital Bank Corporation is located at:
202 West Main Street
Frankfort, Kentucky 40601
Direct correspondence to:
Farmers Capital Bank Corporation
P.O. Box 309
Frankfort, Kentucky 40602-0309
Phone: (502) 227-1668
www.farmerscapital.com
Annual Meeting
The annual meeting of shareholders of Farmers Capital Bank Corporation will be held Tuesday, May 8, 2018 at 11:00 a.m. at the main office of United Bank & Capital Trust Company, 125 West Main Street, Frankfort, Kentucky.
Form 10-K
For a free copy of Farmers Capital Bank Corporation's Annual Report on Form 10-K filed with the Securities and Exchange Commission, please write:
Mark A. Hampton, Executive Vice President, Chief Financial Officer, and Secretary
Farmers Capital Bank Corporation
P.O. Box 309
Frankfort, Kentucky 40602-0309
Phone: (502) 227-1668
Web Site Access to Filings
All reports filed electronically by the Company with the United States Securities and Exchange Commission, including annual reports on Form 10-K, quarterly reports on Form 10-Q, current reports on Form 8-K, and all amendments to those reports, are available at no cost on the Company’s website at www.farmerscapital.com.
|
NASDAQ Market Participants |
|
J.J.B. Hilliard, W.L. Lyons, LLC |
|
(502) 588-8400 |
|
(800) 444-1854 |
|
Raymond James & Associates, Inc. |
|
(800) 248-8863 |
|
UBS Securities, LLC |
|
(859) 269-6900 |
|
(502) 420-7600 |
The Transfer Agent and Registrar for Farmers Capital Bank Corporation is American Stock Transfer & Trust Company, LLC.
American Stock Transfer & Trust Company, LLC
Shareholder Relations
6201 15th Avenue
Brooklyn, NY 11219
Phone: (800) 937-5449
Fax: (718) 236-2641
Email: Info@amstock.com
Website: www.amstock.com
Additional information is set forth under the captions “Shareholder Information” and “Common Stock Price” on page 65 under Part II, Item 7 and Note 18 “Regulatory Matters” in the notes to the Company's 2017 audited consolidated financial statements on pages 109 to 110 of this Form 10-K and is hereby incorporated by reference.
Item 6. Selected Financial Data
|
Selected Financial Highlights |
||||||||||||||||||||
|
December 31, (In thousands, except per share data) |
2017 |
2016 |
2015 |
2014 |
2013 |
|||||||||||||||
|
Results of Operations |
||||||||||||||||||||
|
Interest income |
$ | 59,286 | $ | 59,371 | $ | 61,236 | $ | 64,352 | $ | 66,733 | ||||||||||
|
Interest expense |
3,510 | 6,755 | 8,641 | 10,153 | 11,995 | |||||||||||||||
|
Net interest income |
55,776 | 52,616 | 52,595 | 54,199 | 54,738 | |||||||||||||||
|
Provision for loan losses |
(211 | ) | (644 | ) | (3,429 | ) | (4,364 | ) | (2,600 | ) | ||||||||||
|
Noninterest income |
21,165 | 31,186 | 22,211 | 23,273 | 22,116 | |||||||||||||||
|
Noninterest expense |
52,823 | 61,400 | 57,950 | 59,278 | 61,573 | |||||||||||||||
|
Income tax expense |
12,641 | 6,441 | 5,293 | 6,099 | 4,435 | |||||||||||||||
|
Net income |
11,688 | 16,605 | 14,992 | 16,459 | 13,446 | |||||||||||||||
|
Dividends and accretion on preferred shares |
- | - | 395 | 1,927 | 1,951 | |||||||||||||||
|
Net income available to common shareholders |
11,688 | 16,605 | 14,597 | 14,532 | 11,495 | |||||||||||||||
|
Per Common Share Data |
||||||||||||||||||||
|
Basic and diluted net income |
$ | 1.56 | $ | 2.21 | $ | 1.95 | $ | 1.94 | $ | 1.54 | ||||||||||
|
Cash dividends declared |
.425 | .31 | - | - | - | |||||||||||||||
|
Book value |
25.72 | 24.51 | 23.43 | 21.75 | 18.73 | |||||||||||||||
|
Tangible book value1 |
25.72 | 24.51 | 23.43 | 21.69 | 18.61 | |||||||||||||||
|
Selected Ratios |
||||||||||||||||||||
|
Percentage of net income to: |
||||||||||||||||||||
|
Average shareholders’ equity (ROE) |
6.07 | % | 8.94 | % | 8.61 | % | 9.30 | % | 7.97 | % | ||||||||||
|
Average total assets (ROA) |
.70 | .96 | .84 | .92 | .74 | |||||||||||||||
|
Percentage of common dividends declared to net income |
27.24 | 14.01 | - | - | - | |||||||||||||||
|
Percentage of average shareholders’ equity to average total assets |
11.56 | 10.68 | 9.77 | 9.84 | 9.34 | |||||||||||||||
|
Total shareholders’ equity |
$ | 193,353 | $ | 184,066 | $ | 175,698 | $ | 172,929 | $ | 170,055 | ||||||||||
|
Total assets |
1,673,872 | 1,671,030 | 1,775,950 | 1,782,606 | 1,809,555 | |||||||||||||||
|
Long term borrowings2 |
37,496 | 53,437 | 169,250 | 168,694 | 176,850 | |||||||||||||||
|
Senior perpetual preferred stock |
- | - | - | 10,000 | 29,988 | |||||||||||||||
|
Weighted average common shares outstanding - basic and diluted |
7,513 | 7,504 | 7,494 | 7,483 | 7,474 | |||||||||||||||
1Represents total common equity less intangible assets divided by the number of common shares outstanding at the end of the period.
2Based on original term at time of borrowing.
Item 7. Management’s Discussion and Analysis of Financial Condition and Results of Operations
Glossary of Financial Terms
Allowance for loan losses
A valuation allowance to offset credit losses specifically identified in the loan portfolio, as well as management’s best estimate of probable incurred losses in the remainder of the portfolio at the balance sheet date. Management estimates the allowance balance required using past loan loss experience, an assessment of the financial condition of individual borrowers, a determination of the value and adequacy of underlying collateral, the condition of the local economy, an analysis of the levels and trends of the loan portfolio, and a review of delinquent and classified loans. Actual losses could differ significantly from the amounts estimated by management.
Dividend payout ratio
Cash dividends declared on common shares, divided by net income.
Basis points
Each basis point is equal to one hundredth of one percent. Basis points are calculated by multiplying percentage points times 100. For example: 3.7 percentage points equals 370 basis points.
Interest rate sensitivity
The relationship between interest sensitive earning assets and interest bearing liabilities.
Net charge-offs
The amount of total loans charged off net of recoveries of loans that have been previously charged off.
Net interest income
Total interest income less total interest expense.
Net interest margin
Taxable equivalent net interest income expressed as a percentage of average earning assets.
Net interest spread
The difference between the taxable equivalent yield on earning assets and the rate paid on interest bearing funds.
Other real estate owned
Real estate not used for banking purposes. For example, real estate acquired through foreclosure.
Provision for loan losses
The charge against current income needed to maintain an adequate allowance for loan losses.
Return on average assets (ROA)
Net income (loss) divided by average total assets. Measures the relative profitability of the resources utilized by the Company.
Return on average equity (ROE)
Net income (loss) divided by average shareholders’ equity. Measures the relative profitability of the shareholders' investment in the Company.
Tax equivalent basis (TE)
Income from tax-exempt loans and investment securities has been increased by an amount equivalent to the taxes that would have been paid if this income were taxable at statutory rates. In order to provide comparisons of yields and margins for all earning assets, the interest income earned on tax-exempt assets is increased to make them fully equivalent to other taxable interest income investments.
Weighted average number of common shares outstanding
The number of shares determined by relating (a) the portion of time within a reporting period that common shares have been outstanding to (b) the total time in that period.
Management’s Discussion and Analysis of Financial Condition and Results of Operations
The following pages present management’s discussion and analysis of the consolidated financial condition and results of operations of Farmers Capital Bank Corporation (the “Company” or “Parent Company”), a financial holding company, its bank subsidiary, United Bank & Capital Trust Company (“United Bank” or the “Bank”) in Frankfort, Kentucky, and nonbank subsidiary, FFKT Insurance Services, Inc. (“FFKT Insurance”). In February 2017, the Company merged three of its subsidiary banks (United Bank & Trust Company [“United Versailles”] in Versailles, KY; First Citizens Bank, Inc. [“First Citizens”] in Elizabethtown, KY; and Citizens Bank of Northern Kentucky, Inc. [“Citizens Northern”] in Newport, KY) and its data processing subsidiary (FCB Services, Inc. [“FCB Services”] in Frankfort, KY) into its subsidiary bank Farmers Bank & Capital Trust Company (“Farmers Bank”) in Frankfort, KY, the name of which was immediately changed under the merger to United Bank & Capital Trust Company. All significant intercompany transactions and balances are eliminated in consolidation.
At year-end 2017, United Bank had two primary subsidiaries, which include EG Properties, Inc., and Farmers Capital Insurance Corporation (“Farmers Insurance”). EG Properties, Inc. is involved in real estate management and liquidation for certain repossessed properties of United Bank. Farmers Insurance is an insurance agency in Frankfort, KY. In May 2017, the Company merged the nonbank subsidiaries of each of its pre-merger subsidiary banks (EGT Properties, Inc. [“EGT Properties”], HBJ Properties, LLC [“HBJ Properties”], and ENKY Properties, Inc. [“ENKY”]) into EG Properties.
The Company had one active nonbank subsidiary at year-end 2017, FFKT Insurance, a captive insurance company that provides property and casualty coverage to its subsidiaries for risk management purposes or where insurance may not be available or economically feasible. The Company has two subsidiaries organized as Delaware statutory trusts that were not consolidated into its financial statements. These trusts were formed for the purpose of issuing trust preferred securities.
For a complete list of the Company’s subsidiaries, please refer to the discussion under the heading “Organization” included in Part 1, Item 1 of this Form 10-K. The following discussion should be read in conjunction with the audited consolidated financial statements and related footnotes that follow.
Forward-Looking Statements
This report contains forward-looking statements with the meaning of Section 27A of the Securities Act of 1933, as amended (the “Securities Act”) and Section 21E of the Securities Exchange Act of 1934, as amended (the “Exchange Act”), under the Private Securities Litigation Reform Act of 1995 that involve risks and uncertainties. Statements in this report that are not statements of historical fact are forward-looking statements. In general, forward-looking statements relate to a discussion of future financial results or projections, future economic performance, the financial impact of the Tax Cuts and Jobs Act (“Tax Act”) on the Company’s results of operations, future operational plans and objectives, and statements regarding the underlying assumptions of such statements. Although management of the Company believes that the assumptions underlying the forward-looking statements contained herein are reasonable, any of the assumptions could be inaccurate, and therefore, there can be no assurance that the forward-looking statements included herein will prove to be accurate.
Various risks and uncertainties may cause actual results to differ materially from those indicated by the Company’s forward-looking statements. In addition to the risks described under Part 1, Item 1A “Risk Factors” in this report, factors that could cause actual results to differ from the results discussed in the forward-looking statements include, but are not limited to: economic conditions (both generally and more specifically in the markets in which the Company and its subsidiaries operate) and lower interest margins; competition for the Company’s customers from other providers of financial services; deposit outflows or reduced demand for financial services and loan products; government legislation, regulation, and changes in monetary and fiscal policies (which changes from time to time and over which the Company has no control); unanticipated effects from the Tax Act may limit its benefits; changes in interest rates; changes in prepayment speeds of loans or investment securities; inflation; material unforeseen changes in the liquidity, results of operations, or financial condition of the Company’s customers; changes in the level of non-performing assets and charge-offs; changes in the number of common shares outstanding; the capability of the Company to successfully enter into a definitive agreement for, close, and realize the benefits of anticipated transactions; unexpected claims or litigation against the Company; expected insurance or other recoveries; technological or operational difficulties; technological changes; changes in the reliability of our vendors, internal control systems or information systems; the impact of new accounting pronouncements and changes in policies and practices that may be adopted by regulatory agencies; political instability; acts of war or terrorism; the ability of the Parent Company to receive dividends from its subsidiaries; the impact of larger or similar financial institutions encountering difficulties, which may adversely affect the banking industry or the Company; the Company or its United Bank’s ability to maintain required capital levels and adequate funding sources and liquidity; and other risks or uncertainties detailed in the Company’s filings with the Securities and Exchange Commission, all of which are difficult to predict and many of which are beyond the control of the Company.
The Company’s forward-looking statements are based on information available at the time such statements are made. The Company expressly disclaims any intent or obligation to update any forward-looking statements to reflect changes in underlying assumptions or factors, new information, future events, or other changes.
Application of Critical Accounting Policies
The Company’s audited consolidated financial statements are prepared in accordance with accounting principles generally accepted in the United States of America and follow general practices applicable to the banking industry. Application of these principles requires management to make estimates, assumptions, and judgments that affect the reported amounts of assets and liabilities and disclosure of contingent assets and liabilities at the date of the financial statements and the reported amounts of revenues and expenses during the reported period. These estimates, assumptions, and judgments are based on information available as of the date of the financial statements. Certain policies inherently have a greater reliance on the use of estimates, assumptions, and judgments and as such have a greater possibility of producing results that could be materially different than originally reported. Estimates, assumptions, and judgments are necessary when assets and liabilities are required to be recorded at fair value, when a decline in the value of an asset warrants an impairment write-down or valuation reserve to be established, or when an asset or liability needs to be recorded contingent upon a future event. Carrying assets and liabilities at fair value inherently results in more financial statement volatility between reporting periods. The fair values and the information used to record valuation adjustments for certain assets and liabilities are based either on quoted market prices or are provided by third-party sources, when available. When third-party information is not available, valuation adjustments are estimated in good faith by management primarily through the use of internal cash flow modeling techniques.
The most significant accounting policies followed by the Company are presented in Note 1 of the Company’s 2017 audited consolidated financial statements. These policies, along with the disclosures presented in other financial statement notes and in this Management’s Discussion and Analysis of Financial Condition and Results of Operations, provide information on how significant assets and liabilities are valued in the financial statements and how those values are determined. Based on the valuation techniques used and the sensitivity of financial statement amounts to the methods, assumptions, and estimates underlying those amounts, management has identified the determination of the allowance for loan losses and fair value measurements to be the accounting areas that require the most subjective or complex judgments, and as such could be most subject to revision as new information becomes available.
Allowance for Loan Losses
The allowance for loan losses represents credit losses specifically identified in the loan portfolio, as well as management's estimate of probable incurred credit losses in the loan portfolio at the balance sheet date. Determining the amount of the allowance for loan losses and the related provision for loan losses is considered a critical accounting estimate because it requires significant judgment and the use of estimates related to the amount and timing of expected future cash flows on impaired loans, estimated losses on pools of homogeneous loans based on historical loss experience, and consideration of current economic trends and conditions, all of which may be susceptible to significant changes. The loan portfolio also represents the largest asset group on the consolidated balance sheets. Additional information related to the allowance for loan losses that describes the methodology and risk factors can be found under the captions “Asset Quality” and “Nonperforming Assets” in this Management’s Discussion and Analysis of Financial Condition and Results of Operations, as well as Notes 1 and 4 of the Company’s 2017 audited consolidated financial statements.
Fair Value Measurements
The carrying value of certain financial assets and liabilities of the Company is impacted by the application of fair value measurements, either directly or indirectly. Fair value is the price that would be received to sell an asset or paid to transfer a liability (exit price) in the principal or most advantageous market for the asset or liability in an orderly transaction between market participants at the measurement date. In certain cases, an asset or liability is measured and reported at fair value on a recurring basis, such as investment securities classified as available for sale and money market mutual funds. In other cases, management must rely on estimates or judgments to determine if an asset or liability not measured at fair value warrants an impairment write-down or whether a valuation reserve should be established.
The Company estimates the fair value of a financial instrument using a variety of valuation methods. Where financial instruments are actively traded and have quoted market prices, quoted market prices are used for fair value. Active markets are those where transaction volumes are sufficient to provide objective pricing information with reasonably narrow bid/ask spreads and where quoted prices do not vary widely. When the financial instruments are not actively traded, other observable market inputs such as quoted prices of securities with similar characteristics may be used, if available, to determine fair value. Inactive markets are characterized by low transaction volumes, price quotations that vary substantially among market participants, or in which minimal information is released publicly.
When observable market prices do not exist, the Company estimates fair value primarily by using cash flow and other financial modeling methods. The valuation methods may also consider factors such as liquidity and concentration concerns. Other factors such as model assumptions, market dislocations, and unexpected correlations can affect estimates of fair value. Changes in these underlying factors, assumptions, or estimates in any of these areas could materially impact the amount of revenue or loss recorded.
Additional information regarding fair value measurements can be found in Notes 1 and 19 of the Company’s 2017 audited consolidated financial statements. The following is a summary of the Company’s more significant assets that may be affected by fair value measurements, as well as a brief description of the current accounting practices and valuation methodologies employed by the Company:
Available For Sale Investment Securities and Money Market Mutual Funds
Investment securities classified as available for sale and money market mutual funds are measured and reported at fair value on a recurring basis. These instruments are valued primarily by independent third party pricing services under the market valuation approach that include, but are not limited to, the following inputs:
|
● |
Mutual funds and equity securities are priced utilizing real-time data feeds from active market exchanges for identical securities; and |
|
● |
Government-sponsored agency debt securities, obligations of states and political subdivisions, mortgage-backed securities, corporate bonds, and other similar investment securities are priced with available market information through processes using benchmark yields, matrix pricing, prepayment speeds, cash flows, live trading data, and market spreads sourced from new issues, dealer quotes, and trade prices, among others sources. |
At December 31, 2017, all of the Company’s available for sale investment securities and money market mutual funds were measured using observable market data.
Other Real Estate Owned
Other real estate owned (“OREO”) includes properties acquired by the Company through, or in lieu of, actual loan foreclosures and initially carried at fair value less estimated costs to sell. Fair value is generally based on third party appraisals of the property that includes comparable sales data. The carrying value of each OREO property is updated at least annually and more frequently when market conditions significantly impact the value of the property. If the carrying amount exceeds fair value less estimated costs to sell, an impairment loss is recorded through expense. OREO is subsequently accounted for at the lower of carrying amount or fair value less estimated costs to sell. At December 31, 2017, OREO was $5.5 million compared to $10.7 million at year-end 2016.
Impaired Loans
Loans are considered impaired when it is probable that the Company will be unable to collect all amounts due under the contractual terms of the loan agreement. Impaired loans are measured at the present value of expected future cash flows, discounted at the loan’s effective interest rate, at the loan’s observable market price, or at the fair value of the collateral based on recent appraisals if the loan is collateral dependent. If the value of an impaired loan is less than the unpaid balance, the difference is credited to the allowance for loan losses with a corresponding charge to provision for loan losses. Loan losses are charged against the allowance for loan losses when management believes the uncollectibility of a loan is confirmed.
Appraisals used in connection with valuing collateral-dependent loans may utilize a single valuation approach or a combination of approaches including comparable sales and the income approach. Appraisers take absorption rates into consideration and adjustments are routinely made in the appraisal process to identify differences between the comparable sales and income data available. Such adjustments consist mainly of estimated costs to sell that are not included in certain appraisals or to update appraised collateral values as a result of market declines of similar properties for which a newer appraisal is available. These adjustments can be significant. Impaired loans were $23.1 million and $41.9 million at year-end 2017 and 2016, respectively.
EXECUTIVE LEVEL OVERVIEW
The Company offers a variety of financial products and services at its 34 banking locations in 21 communities throughout Central and Northern Kentucky. During the first quarter 2017, the Company completed the consolidation of its subsidiary banks and data processing subsidiary into one chartered commercial bank, United Bank. While benefiting from the resources of a large bank, United Bank continues to operate under a community banking philosophy. This philosophy focuses primarily on understanding the banking needs of those in our local and surrounding communities and providing them with competitively priced products and a high level of personalized service. The most significant products and services the Company offers include consumer and business lending, checking, savings, and other deposit accounts, automated teller machines, electronic bill payments, and providing trust services and other traditional banking products and services. The primary goals of the Company are to continually improve profitability and shareholder value, increase and maintain a strong capital position, provide excellent service to our customers through our community banking structure, and to provide a challenging and rewarding work environment for our employees.
During 2017, the Company focused on increasing productivity and lowering operating costs to increase profitability and value for its shareholders. As a result of the merger of the Company’s subsidiaries, salaries and employee benefits expenses declined $2.0 million, or 6.2%, to $30.3 million for the year. The decline is net of $1.4 million the Company reinvested into incentive plans and related payroll taxes for employees who met the qualifications of their plan.
The Company generates a significant amount of its revenue, cash flows, and net income from interest income and net interest income. The ability to properly manage net interest income under changing market environments is crucial to the success of the Company. During 2017, the Company took initiatives to improve its interest income and net interest income and build on the positive momentum of the initiatives taken during 2016. The series of transactions to deleverage the balance sheet during the last half of 2016 drove the increase in net interest margin in 2017. Average loans grew $31.4 million during the year and, as a percent of earnings assets, increased 400 basis points to 63.3%. The Company repositioned its investment securities portfolio in the fourth quarter of 2017 which, in addition to repositioning during the last half of 2016, drove an increase in the average yield of 9 basis points.
The Company’s loan portfolio increased for the third year in a row. Although loan balances increased, the Company continues its commitment to strong credit underwriting standards which has resulted in steady improvement in the overall credit quality of the portfolio and a decrease to the allowance for loan losses as a percent of the portfolio. Nonperforming loans are at the lowest level since the third quarter of 2007 and are down $92.5 million or 85.8% since peaking at $108 million in the first quarter of 2010.
Net income for 2017 declined compared to the prior year driven by an income tax expense adjustment of $5.9 million recorded during the fourth quarter of 2017 related to the Tax Act signed into law during December. The Tax Act lowered the corporate Federal income tax rate from 35% to 21% effective January 1, 2018. Accounting principles generally accepted in the United States of America (“GAAP”) require the Company to revalue its net deferred tax assets using the new rate and record the adjustment through income tax expense. While the reduced tax rates resulted in lower net income for the year, the Company expects to benefit from the lower rate in future periods.
For 2018, the Company will focus on stability and growth to increase profitability and shareholder value. In the coming year, the Company plans to fine tune operations at the newly consolidated subsidiary bank, increasing productivity and lowering operating costs. The overall economic and business environment outlook for 2018 is positive. In 2018, the Company intends to build on its recent loan growth and continue to reduce nonperforming assets.
RESULTS OF OPERATIONS
The Company reported net income of $11.7 million or $1.56 per common share for 2017, a decrease of $4.9 million or 29.6% compared to $16.6 million or $2.21 per common share for 2016. Non-GAAP adjusted net income was $17.9 million or $2.38 per common share, an increase of $562 thousand or 3.2% compared to non-GAAP adjusted net income of $17.3 million or $2.31 per common share for 2016.
Non-GAAP adjusted net income for the current year excludes an income tax expense adjustment of $5.9 million recorded in the fourth quarter related to the Tax Act. The adjustment relates to revaluing its net deferred tax assets using the new lower corporate Federal income tax rate of 21% effective January 1, 2018, a reduction from the current rate of 35%. Non-GAAP adjusted net income also excludes pre-tax expenses of $472 thousand ($307 thousand after tax) in 2017 and $1.1 million ($697 thousand after tax) in 2016 related to the Company’s consolidation of its subsidiaries. Refer to the heading captioned “Use of Non-GAAP Financial Measures” for a reconciliation of non-GAAP financial measures.
Selected income statement amounts and related information is presented in the table below.
|
(In thousands, except per share data) |
2017 |
2016 |
Increase |
|||||||||
|
Interest income |
$ | 59,286 | $ | 59,371 | $ | (85 | ) | |||||
|
Interest expense |
3,510 | 6,755 | (3,245 | ) | ||||||||
|
Net interest income |
55,776 | 52,616 | 3,160 | |||||||||
|
Provision for loan losses |
(211 | ) | (644 | ) | 433 | |||||||
|
Net interest income after provision for loan losses |
55,987 | 53,260 | 2,727 | |||||||||
|
Noninterest income |
21,165 | 31,186 | (10,021 | ) | ||||||||
|
Noninterest expenses |
52,823 | 61,400 | (8,577 | ) | ||||||||
|
Income before income taxes |
24,329 | 23,046 | 1,283 | |||||||||
|
Income tax expense |
12,641 | 6,441 | 6,200 | |||||||||
|
Net income |
$ | 11,688 | $ | 16,605 | $ | (4,917 | ) | |||||
|
Basic and diluted net income per common share |
$ | 1.56 | $ | 2.21 | $ | (.65 | ) | |||||
|
Cash dividends declared per common share |
.425 | .31 | .115 | |||||||||
|
Weighted average common shares outstanding – basic and diluted |
7,513 | 7,504 | 9 | |||||||||
|
Return on average assets |
.70 | % | .96 | % |
|
(26 | ) bp | |||||
|
Return on average equity |
6.07 | % | 8.94 | % |
|
(287 | ) bp | |||||
bp – basis points.
The more significant components related to the Company’s results of operations are included below.
Use of Non-GAAP Financial Measures
In addition to disclosing financial results calculated in accordance with GAAP, the financial information in this Management’s Discussion and Analysis of Financial Condition and Results of Operations contains non-GAAP financial measures, including adjusted net income and adjusted net income per common share. Adjusted net income and adjusted net income per common share reflect adjustments for expenses incurred in connection with the Company’s consolidation and integration of its subsidiaries announced during the third quarter of 2016. Additionally, adjusted net income and adjusted net income per common share exclude the income tax expense adjustment during the fourth quarter of 2017 of $5.9 million related to the Tax Act that was signed into law during December. Management believes providing these non-GAAP adjusted financial measures, combined with the primary GAAP presentation of net income and net income per common share, to be useful for investors to understand the Company’s results of operations in comparison to prior periods. It also considers them to be important supplemental measures of the Company’s performance. The non-GAAP financial measures should not be considered superior to, or a substitute for, financial measures calculated in accordance with GAAP. A reconciliation of non-GAAP adjusted net income and non-GAAP adjusted net income per common share is included in the tables below.
The Company’s methods for determining these non-GAAP financial measures may differ from the methods used by other companies for these or similar non-GAAP financial measures. Accordingly, these non-GAAP financial measures may not be comparable to methods used by other companies.
Reconcilement of Non-GAAP Financial Measures
|
Twelve Months Ended |
||||||||
|
(In thousands, except per share data) |
December 31, |
December 31, |
||||||
|
Net income |
$ | 11,688 | $ | 16,605 | ||||
|
Adjustments: |
||||||||
|
Noninterest expense1 |
||||||||
|
Severance costs |
195 | 391 | ||||||
|
Data processing and systems integration |
95 | 187 | ||||||
|
Other |
17 | 119 | ||||||
|
Income tax expense related to 2017 Tax Act |
5,869 | - | ||||||
|
Adjusted net income |
$ | 17,864 | $ | 17,302 | ||||
|
Basic and diluted net income per common share |
$ | 1.56 | $ | 2.21 | ||||
|
Adjustments: |
||||||||
|
Noninterest expense1 |
||||||||
|
Severance costs |
.03 | .05 | ||||||
|
Data processing and systems integration |
.01 | .03 | ||||||
|
Other |
- | .02 | ||||||
|
Income tax expense related to 2017 Tax Act |
.78 | - | ||||||
|
Adjusted basic and diluted net income per common share |
$ | 2.38 | $ | 2.31 | ||||
1All noninterest expense adjustments are net of tax using the 2017 marginal corporate Federal tax rate of 35%.
Interest Income
Interest income results from interest earned on earning assets, which primarily includes loans and investment securities. Interest income is affected by volume (average balance), the composition of earning assets, and the related rates earned on those assets. Total interest income for 2017 was $59.3 million, a decrease of $85 thousand or 0.1% compared to $59.4 million for 2016. The decrease in interest income was driven by lower interest from investment securities of $1.4 million or 12.1%, partially offset by an increase in interest income on loans of $813 thousand or 1.7%. While the average rate earned on investment securities was up 9 basis points, the effect on interest income was more than offset by the negative impact of a decline in the average balance of $82.9 million. The increase in interest income on loans was driven by a higher average loan balance outstanding of $31.4 million, partially offset by lower average rate earned of seven basis points to 4.93%.
The overall interest rate environment at year-end 2017, as measured by the Treasury yield curve, remains at very low levels when compared with historical trends. During the year, the shape of the yield curve flattened as a result of yields on short-term maturities increasing while yields on longer-term maturities declined. The most significant change was a 92 basis point increase in the yield for the six-month maturity period. The two and three-year maturities increased 70 and 52 basis points, respectively, while yields on the ten and thirty-year maturities decreased 4 and 33 basis points, respectively. At year-end 2017, the short-term federal funds interest rate target range was between 1.25% and 1.50%, which increased 75 basis points during the year (25 basis points in each of March, June, and December) from the target at year-end 2016 of 0.50% to 0.75%. The Federal Reserve Board (“Federal Reserve”) has indicated that it will continue to assess realized and expected economic conditions relative to its objective of maximum employment and two percent inflation when determining the timing and size of future adjustments to the target rate. At December 31, 2017, the national and Kentucky unemployment rates were 4.1% and 4.4%, respectively. While the national inflation rate was 2.1% at both year-end 2017 and 2016, the average inflation rate for 2017 was also 2.1%, up from 1.3% in 2016, based on the Consumer Price Index published by the Bureau of Labor Statistics.
Interest Expense
Interest expense results from interest bearing liabilities, which are made up of interest bearing deposits, federal funds purchased, securities sold under agreements to repurchase, and other borrowed funds. Interest expense is affected by volume, composition of interest bearing liabilities, and the related rates paid on those liabilities. Total interest expense was $3.5 million for 2017, a decrease of $3.2 million or 48.0% compared to $6.8 million for 2016. The decrease in interest expense is attributed primarily to lower interest on securities sold under agreements to repurchase of $2.9 million or 97.4%, primarily due to the early repayment of $100 million of high fixed-rate borrowings during the third quarter of 2016 and, to a lesser extent, the maturity of $15.0 million of Federal Home Loan Bank advances during the year. Interest expense on deposits declined $219 thousand or 9.3%. Lower volume and rates on time deposits drove the decrease, which was partially offset by an increase in rates paid on interest bearing demand deposits of eight basis points. The Company has continued to aggressively reprice higher-rate maturing time deposits downward to lower market rates or to allow them to mature without renewal.
Net Interest Income
Net interest income is the most significant component of the Company’s operating earnings. Net interest income is the excess of the interest income earned on earning assets over the interest paid for funds to support those assets. The two most common metrics used to analyze net interest income are net interest spread and net interest margin. Net interest spread represents the difference between the taxable equivalent yields on earning assets and the rates paid on interest bearing liabilities. Net interest margin represents the percentage of taxable equivalent net interest income to average earning assets. Net interest margin will exceed net interest spread because of the existence of noninterest bearing sources of funds, principally demand deposits and shareholders’ equity, which are also available to fund earning assets.
Changes in net interest income and margin result from the interaction between the volume and composition of earning assets, their related yields, and the associated cost and composition of the interest bearing liabilities. Accordingly, portfolio size, composition, and the related yields earned and the average rates paid have a significant impact on net interest spread and margin. The table following this discussion represents the major components of interest earning assets and interest bearing liabilities on a tax equivalent basis. To compare the tax-exempt asset yields to taxable yields, amounts in the table are adjusted to pretax equivalents based on the 2017 marginal corporate Federal tax rate of 35%.
Tax equivalent net interest income was $57.2 million for 2017, an increase of $3.1 million or 5.7% compared to $54.1 million for 2016. Net interest margin was 3.67% for 2017, up 31 basis points from 3.36% for the prior year. Net interest spread increased 36 basis point to 3.57% for 2017 from 3.21% for 2016. The increase in net interest margin and spread was due mainly to a 24 basis point decline in cost of funds to 0.32%.
As part of its strategy to improve net interest income and net interest margin, the Company completed a series of transactions during the last half of 2016 to deleverage its balance sheet and reposition its investment securities portfolio. The Company used a mixture of $10.4 million of excess cash and $93.4 million of proceeds from the sale of investment securities to prepay $100 million of high fixed-rate borrowings that were due to mature in November 2017. The Company incurred a prepayment fee of $3.8 million, which was offset by a gain in the same amount on the sale of investment securities. The average yield on the mix of cash and investment securities sold to fund the debt prepayment was 2.97%. The average cost of the fixed rate borrowings that were repaid was 3.95%. The Company also took action during the last half of 2016 to reposition its investment securities portfolio by replacing approximately $78 million of certain lower yielding, short-term investments with longer-term, higher-yielding investments consistent with a more normalized strategy and maturity periods. The lower yielding short-term investments had been built up in anticipation of the November 2017 debt repayment. The average yield on the investments identified for the repositioning strategy was 0.85% compared to a targeted reinvestment yield of 1.85%.
During the fourth quarter of 2017, the Company again refined the investment portfolio, replacing $76.5 million of lower-yielding investment securities. The sale of investment securities resulted in a net loss of $3 thousand. However, this increased the yield on the investments portfolio by 11 basis points.
The Company actively monitors and proactively manages the rate sensitive components of both its assets and liabilities in a continuously changing and difficult market environment. Competition in the Company’s market areas continues to be intense, and market interest rates remain very low by historical measures. During 2017, the Federal Reserve increased the short-term federal funds target rate 75 basis points, compared to a 25 basis point increase during each of 2016 and 2015. The Federal Reserve has indicated that it continues to expect only gradual adjustments in its stance on monetary policy relative to longer term expectations.
Similar to the short-term federal funds target rate, the prime interest rate rose 75 basis points during 2017 (25 basis points in each of March, June, and December). The Company uses the prime interest rate as part of its pricing model primarily on variable rate commercial real estate loans. The prime interest rate can have a significant impact on the Company’s interest income from loans that reprice based on changes to this rate. The Company’s variable interest rate loans contain provisions that limit the amount of increase or decrease in the interest rate during the life of a loan. This will limit the increase or decrease in interest income on loans that have interest rates tied to the prime interest rate. For 2017, the average yield earned on loans was 4.93%, which exceeded the prime interest rate of 4.50% at year-end. Predicting the direction and timing of future interest rates is uncertain.
For 2017, the average rate of the Company’s most significant component of interest income, loans, and the most significant component of interest expense, time deposits, both declined. The average rate earned on the Company’s loan portfolio for 2017 declined seven basis points to 4.93% and the average rate paid on time deposits decreased nine basis points to 0.45% compared to 2016. The Company expects its net interest margin to trend slightly upward in 2018 as compared to 2017 according to internal modeling using expectations about future market interest rates, loan volume, the maturity structure of the Company’s earning assets and liabilities, and other factors. Future results, however, could be significantly different than expectations.
Distribution of Assets, Liabilities and Shareholders’ Equity: Interest Rates and Interest Differential
|
Years Ended December 31, |
2017 |
2016 |
2015 |
|||||||||||||||||||||||||||||||||
|
Average |
Average |
Average |
Average |
Average |
Average |
|||||||||||||||||||||||||||||||
|
(In thousands) |
Balance |
Interest |
Rate |
Balance |
Interest |
Rate |
Balance |
Interest |
Rate |
|||||||||||||||||||||||||||
|
Earning Assets |
||||||||||||||||||||||||||||||||||||
|
Investment securities1 |
||||||||||||||||||||||||||||||||||||
|
Taxable |
$ | 362,748 | $ | 7,787 | 2.15 | % | $ | 438,106 | $ | 8,969 | 2.05 | % | $ | 493,594 | $ | 10,468 | 2.12 | % | ||||||||||||||||||
|
Nontaxable2 |
115,319 | 3,386 | 2.94 | 122,820 | 3,660 | 2.98 | 130,548 | 3,974 | 3.04 | |||||||||||||||||||||||||||
|
Interest bearing deposits with banks, federal funds sold and securities purchased under agreements to resell, and money market mutual funds |
94,878 | 899 | .95 | 95,629 | 418 | .44 | 90,135 | 192 | .21 | |||||||||||||||||||||||||||
|
Loans 2,3,4 |
987,877 | 48,666 | 4.93 | 956,463 | 47,831 | 5.00 | 933,260 | 48,257 | 5.17 | |||||||||||||||||||||||||||
|
Total earning assets |
1,560,822 | $ | 60,738 | 3.89 | % | 1,613,018 | $ | 60,878 | 3.77 | % | 1,647,537 | $ | 62,891 | 3.82 | % | |||||||||||||||||||||
|
Allowance for loan losses |
(9,389 | ) | (9,593 | ) | (12,255 | ) | ||||||||||||||||||||||||||||||
|
Total earning assets, net of allowance for loan losses |
1,551,433 | 1,603,425 | 1,635,282 | |||||||||||||||||||||||||||||||||
|
Nonearning Assets |
||||||||||||||||||||||||||||||||||||
|
Cash and due from banks |
24,020 | 23,275 | 23,639 | |||||||||||||||||||||||||||||||||
|
Premises and equipment, net |
31,594 | 32,491 | 34,145 | |||||||||||||||||||||||||||||||||
|
Other assets |
59,707 | 78,616 | 89,854 | |||||||||||||||||||||||||||||||||
|
Total assets |
$ | 1,666,754 | $ | 1,737,807 | $ | 1,782,920 | ||||||||||||||||||||||||||||||
|
Interest Bearing Liabilities |
||||||||||||||||||||||||||||||||||||
|
Deposits |
||||||||||||||||||||||||||||||||||||
|
Interest bearing demand |
$ | 356,023 | $ | 576 | .16 | % | $ | 334,818 | $ | 256 | .08 | % | $ | 334,281 | $ | 200 | .06 | % | ||||||||||||||||||
|
Savings |
418,507 | 467 | .11 | 407,353 | 506 | .12 | 385,932 | 496 | .13 | |||||||||||||||||||||||||||
|
Time |
245,215 | 1,093 | .45 | 296,258 | 1,593 | .54 | 356,419 | 2,265 | .64 | |||||||||||||||||||||||||||
|
Federal funds purchased |
19 | - | - | 153 | 1 | .65 | 24 | - | - | |||||||||||||||||||||||||||
|
Short-term securities sold under agreements to repurchase |
34,180 | 70 | .20 | 35,328 | 98 | .28 | 30,380 | 50 | .16 | |||||||||||||||||||||||||||
|
Long-term securities sold under agreements to repurchase |
883 | 7 | .79 | 71,851 | 2,843 | 3.96 | 101,171 | 4,012 | 3.97 | |||||||||||||||||||||||||||
|
Federal Home Loan Bank advances |
11,098 | 427 | 3.85 | 18,863 | 735 | 3.90 | 18,883 | 752 | 3.98 | |||||||||||||||||||||||||||
|
Subordinated notes payable to unconsolidated trusts |
33,506 | 870 | 2.60 | 34,545 | 723 | 2.09 | 48,970 | 866 | 1.77 | |||||||||||||||||||||||||||
|
Total interest bearing liabilities |
1,099,431 | $ | 3,510 | .32 | % | 1,199,169 | $ | 6,755 | .56 | % | 1,276,060 | $ | 8,641 | .68 | % | |||||||||||||||||||||
|
Noninterest Bearing Liabilities |
||||||||||||||||||||||||||||||||||||
|
Demand deposits |
347,355 | 324,596 | 304,516 | |||||||||||||||||||||||||||||||||
|
Other liabilities |
27,343 | 28,374 | 28,220 | |||||||||||||||||||||||||||||||||
|
Total liabilities |
1,474,129 | 1,552,139 | 1,608,796 | |||||||||||||||||||||||||||||||||
|
Shareholders’ equity |
192,625 | 185,668 | 174,124 | |||||||||||||||||||||||||||||||||
|
Total liabilities and shareholders’ equity |
$ | 1,666,754 | $ | 1,737,807 | $ | 1,782,920 | ||||||||||||||||||||||||||||||
|
Net interest income |
57,228 | 54,123 | 54,250 | |||||||||||||||||||||||||||||||||
|
TE basis adjustment |
(1,452 | ) | (1,507 | ) | (1,655 | ) | ||||||||||||||||||||||||||||||
|
Net interest income |
$ | 55,776 | $ | 52,616 | $ | 52,595 | ||||||||||||||||||||||||||||||
|
Net interest spread |
3.57 | % | 3.21 | % | 3.14 | % | ||||||||||||||||||||||||||||||
|
Impact of noninterest bearing sources of funds |
.10 | .15 | .15 | |||||||||||||||||||||||||||||||||
|
Net interest margin |
3.67 | % | 3.36 | % | 3.29 | % | ||||||||||||||||||||||||||||||
1Average yields on securities available for sale have been calculated based on amortized cost.
2Income and yield stated at a fully tax equivalent basis using the marginal corporate Federal tax rate of 35%.
3Loan balances include principal balances on nonaccrual loans.
4Loan fees included in interest income amounted to $1.3 million, $1.4 million, and $1.3 million for 2017, 2016, and 2015.
The following table is an analysis of the change in net interest income.
Analysis of Changes in Net Interest Income (tax equivalent basis)
|
Variance |
Variance Attributed to |
Variance |
Variance Attributed to |
|||||||||||||||||||||
|
(In thousands) |
2017/20161 |
Volume |
Rate |
2016/20151 |
Volume |
Rate |
||||||||||||||||||
|
Interest Income |
||||||||||||||||||||||||
|
Taxable investment securities |
$ | (1,182 | ) | $ | (1,603 | ) | $ | 421 | $ | (1,499 | ) | $ | (1,158 | ) | $ | (341 | ) | |||||||
|
Nontaxable investment securities2 |
(274 | ) | (225 | ) | (49 | ) | (314 | ) | (236 | ) | (78 | ) | ||||||||||||
|
Interest bearing deposits with banks, federal funds sold and securities purchased under agreements to resell, and money market mutual funds |
481 | (3 | ) | 484 | 226 | 12 | 214 | |||||||||||||||||
|
Loans2 |
835 | 1,525 | (690 | ) | (426 | ) | 1,183 | (1,609 | ) | |||||||||||||||
|
Total interest income |
(140 | ) | (306 | ) | 166 | (2,013 | ) | (199 | ) | (1,814 | ) | |||||||||||||
|
Interest Expense |
||||||||||||||||||||||||
|
Interest bearing demand deposits |
320 | 19 | 301 | 56 | - | 56 | ||||||||||||||||||
|
Savings deposits |
(39 | ) | 10 | (49 | ) | 10 | 37 | (27 | ) | |||||||||||||||
|
Time deposits |
(500 | ) | (254 | ) | (246 | ) | (672 | ) | (349 | ) | (323 | ) | ||||||||||||
|
Federal funds purchased |
(1 | ) | - | (1 | ) | 1 | - | 1 | ||||||||||||||||
|
Short-term securities sold under agreements to repurchase |
(28 | ) | (3 | ) | (25 | ) | 48 | 9 | 39 | |||||||||||||||
|
Long-term securities sold under agreements to repurchase |
(2,836 | ) | (1,566 | ) | (1,270 | ) | (1,169 | ) | (1,159 | ) | (10 | ) | ||||||||||||
|
Federal Home Loan Bank advances |
(308 | ) | (299 | ) | (9 | ) | (17 | ) | (1 | ) | (16 | ) | ||||||||||||
|
Subordinated notes payable to unconsolidated trusts |
147 | (23 | ) | 170 | (143 | ) | (283 | ) | 140 | |||||||||||||||
|
Total interest expense |
(3,245 | ) | (2,116 | ) | (1,129 | ) | (1,886 | ) | (1,746 | ) | (140 | ) | ||||||||||||
|
Net interest income |
$ | 3,105 | $ | 1,810 | $ | 1,295 | $ | (127 | ) | $ | 1,547 | $ | (1,674 | ) | ||||||||||
|
Percentage change |
100.0 | % | 58.3 | % | 41.7 | % | 100.0 | % | (1,218.1 | )% | 1,318.1 | % | ||||||||||||
1The changes which are not solely due to rate or volume are allocated on a percentage basis using the absolute values of rate and volume variances as a basis for allocation.
2Income stated at fully tax equivalent basis using the marginal corporate Federal tax rate of 35%.
Provision for Loan Losses
The Company recorded a credit to the provision for loan losses in the amount of $211 thousand and $644 thousand for 2017 and 2016, respectively. The lower credit is due to greater improvement in historical loss rates in the prior year compared to the current year and the increase in specific reserves allocated to impaired loans during the current year, partially offset by net recoveries. While historical loss rates continued to be low, the effect of the improvement in loss rates on the allowance for loan losses has diminished now that the higher levels experienced during 2008 through the first quarter of 2014 have already rolled out of the three year look-back period used when evaluating the allowance for loan losses. Although impaired loans declined $18.8 million during 2017, the specific reserves on impaired loans increased $234 thousand primarily due to a single credit relationship secured by a combination of real estate development and residential real estate properties.
Net recoveries were $650 thousand for 2017 compared to net charge-offs of $327 thousand for 2016. Net recoveries were 0.07% of average loans outstanding for 2017 compared to 0.03% for the net charge-offs in the prior year. Net recoveries during 2017, include $1.3 million from a real estate development project. The Company recorded a total of $2.1 million in principal charge-offs between 2010 and 2012 related to this project and anticipates it could receive an additional $575 thousand in recoveries related to this credit. The timing and amount of these possible recoveries are subject to change and are dependent on the price and volume of lots sold by the developer, however, the Company expects to receive the recoveries during the first half of 2018.
The allowance for loan losses as a percentage of outstanding loans was 0.94% at December 31, 2017 compared to 0.96% at year-end 2016. Further information about improvements in the Company’s overall credit quality is included under the captions “Allowance for Loan Losses” and “Nonperforming Loans” that follows.
Noninterest Income
The components of noninterest income are as follows for the periods indicated:
|
(Dollars in thousands) |
2017 |
2016 |
Increase |
% |
||||||||||||
|
Service charges and fees on deposits |
$ | 7,987 | $ | 7,856 | $ | 131 | 1.7 | % | ||||||||
|
Allotment processing fees |
2,716 | 3,232 | (516 | ) | (16.0 | ) | ||||||||||
|
Other service charges, commissions, and fees |
5,347 | 5,558 | (211 | ) | (3.8 | ) | ||||||||||
|
Trust income |
2,704 | 2,664 | 40 | 1.5 | ||||||||||||
|
Net gain on sales of available for sale investment securities |
20 | 3,998 | (3,978 | ) | (99.5 | ) | ||||||||||
|
Net gain on sales of cost method investment securities |
82 | - | 82 | NM | ||||||||||||
|
Gain on sale of mortgage loans, net |
662 | 942 | (280 | ) | (29.7 | ) | ||||||||||
|
Income from company-owned life insurance |
1,138 | 1,016 | 122 | 12.0 | ||||||||||||
|
Gain on debt extinguishment |
- | 4,050 | (4,050 | ) | (100.0 | ) | ||||||||||
|
Legal settlement |
- | 1,450 | (1,450 | ) | (100.0 | ) | ||||||||||
|
Other |
509 | 420 | 89 | 21.2 | ||||||||||||
|
Total noninterest income |
$ | 21,165 | $ | 31,186 | $ | (10,021 | ) | (32.1 | )% | |||||||
NM – not meaningful.
The more significant items impacting noninterest income in the annual comparison are included below.
|
● |
Service charges and fees on deposits increased primarily due to higher service charges related to demand deposits and savings accounts of $126 thousand or 12.9% and $62 thousand or 65.5%, respectively, partially offset by lower dormant account fees of $56 thousand or 2.1%. During the second quarter of 2016, the Company standardized and reduced the number of its deposit account product offerings throughout each of its markets. This has contributed to higher overall service charges since completion. |
|
● |
Allotment processing fees are down 16.0% in the comparison primarily due to lower volume stemming from the U.S. Department of Defense policy that became effective January 1, 2015, restricting the types of purchases active service members are able to make using the military allotment system for payment. The rate of decline in allotment processing fees began to subside during 2017, as existing contracts for the types of purchases affected by the new policy have steadily decreased and the Company continues its efforts to diversify its customer base and expand its payment processing options. |
|
● |
The net gain on investment securities in the prior year relates primarily to the series of transactions during the last half of 2016 to deleverage and reposition the balance sheet discussed earlier under the caption “Net Interest Income” above, which completely offset the related loss during 2016 on the early repayment of long-term borrowings. |
|
● |
Net gains on the sale of cost method investment securities during 2017 relates to the sale of stock held in connection with a correspondent banking relationship that ended during 2017. |
|
● |
Net gains on the sale of mortgage loans were down mainly due to lower sales volume of $12.2 million or 33.3%. |
|
● |
The increase in income from company-owned life insurance was driven by a $245 thousand tax-free death benefit that exceeded the cash surrender value during the current year, partially offset by a similar benefit received during the prior-year first quarter of $81 thousand. |
|
● |
The gain on debt extinguishment during the prior year relates to the early extinguishment of $15.5 million of debt under favorable market conditions to the Company during the first quarter of 2016. |
|
● |
During 2016, the Company received $1.5 million related to a litigation settlement; no similar transaction occurred in the current year. |
Noninterest Expense
The components of noninterest expense are as follows for the periods indicated:
|
(Dollars in thousands) |
2017 |
2016 |
Increase |
% |
||||||||||||
|
Salaries and employee benefits |
$ | 30,296 | $ | 32,296 | $ | (2,000 | ) | (6.2 | )% | |||||||
|
Occupancy expenses, net |
4,672 | 4,742 | (70 | ) | (1.5 | ) | ||||||||||
|
Equipment expenses |
2,379 | 2,403 | (24 | ) | (1.0 | ) | ||||||||||
|
Data processing and communication expenses |
4,571 | 4,596 | (25 | ) | (0.5 | ) | ||||||||||
|
Bank franchise tax |
2,325 | 2,421 | (96 | ) | (4.0 | ) | ||||||||||
|
Deposit insurance expense |
520 | 841 | (321 | ) | (38.2 | ) | ||||||||||
|
Other real estate expenses, net |
845 | 2,189 | (1,344 | ) | (61.4 | ) | ||||||||||
|
Legal expenses |
86 | 474 | (388 | ) | (81.9 | ) | ||||||||||
|
Loss on debt extinguishment |
- | 3,776 | (3,776 | ) | (100.0 | ) | ||||||||||
|
Other |
7,129 | 7,662 | (533 | ) | (7.0 | ) | ||||||||||
|
Total noninterest expense |
$ | 52,823 | $ | 61,400 | $ | (8,577 | ) | (14.0 | )% | |||||||
The more significant items impacting noninterest expenses in the annual comparison are included below.
|
● |
Employee benefits decreased $1.5 million or 26.7%, primarily due to lower claims activity related to the Company’s self-funded health insurance plan of $951 thousand or 17.9% and a curtailment gain of $351 thousand as a result of revaluing the Company’s postretirement benefits plan liability, each due to a reduction in workforce occurring in the first quarter of 2017. The reduced workforce also drove the decline in salaries and related payroll taxes of $1.6 million or 6.0%. Severance pay accruals related to the consolidation were $301 thousand for 2017, down $301 thousand or 50.0% from 2016. These declines were partially offset by $1.4 million of incentive pay accruals in the current year. The Company had 426 full time equivalent employees at year-end 2017, down from 472 a year earlier. |
|
● |
The decline in occupancy expenses was driven by lower depreciation expense of $70 thousand or 2.7%. |
|
● |
Bank franchise tax expense declined due to a lower assessment base, which is based primarily on the five-year average of the Bank’s capital, net of certain deductions. |
|
● |
The decrease to deposit insurance expense for 2017 is primarily the result of the Federal Deposit Insurance Corporation (“FDIC”) lowering assessment rates beginning in the third quarter of 2016. |
|
● |
Other real estate expenses declined as a combination of a net gain on property sales of $208 thousand in 2017 compared to a net loss of $473 thousand in 2016, and lower impairment charges of $658 thousand or 45.3%. |
|
● |
The decrease in legal expenses was led by the receipt of a $197 thousand insurance payment during the third quarter of 2017 as reimbursement for expenses previously incurred. |
|
● |
The $3.8 million loss related to the early extinguishment of debt during the third quarter of 2016 was completely offset by the net gain on the sale of investment securities discussed under the “Noninterest Income” caption above. No similar transactions occurred in the current year. |
|
● |
Included in other noninterest expense is $504 thousand of directors’ fees in 2017, down $183 thousand or 26.7% compared to 2016. The decline is mainly attributable to having fewer boards of directors due to the consolidation of subsidiaries during the first quarter of 2017. Other noninterest expenses include amounts related to the consolidation of the Company’s subsidiaries of $22 thousand for 2017, down $161 thousand or 88.0% from $183 thousand in 2016. |
Income Taxes
Income tax expense was $12.6 million for 2017, an increase of $6.2 million compared to $6.4 million for 2016. For 2017, income tax expense includes $5.9 million related to the 2017 Tax Act, which increased the effective income tax rate by 24.1 percentage points. The effective income tax rate for the current year was 52.0% compared to 27.9% for 2016. The effective income tax rate for 2016 is lower than the U.S. statutory federal rate of 35% primarily as a result of tax-exempt interest income from loans and investment securities, income from life insurance policies, and premium income associated with the Company’s captive insurance subsidiary.
FINANCIAL CONDITION
Total assets of the Company were $1.7 billion at year-end 2017, up $2.8 million or 0.2% compared with year-end 2016. The Company’s overall financial condition continued to improve in the current year with loan growth of $64.3 million or 6.6% to $1.0 billion at year-end 2017. Total nonperforming assets were $20.9 million and $40.0 million at year-end 2017 and 2016, respectively. Nonperforming assets have declined $114 million or 84.5% from their peak of $135 million in the first quarter of 2010. Loan quality metrics continued to improve throughout 2017, and regulatory capital levels remain significantly above the “well-capitalized” threshold.
Temporary Investments
Temporary investments consist of interest bearing deposits in other banks, federal funds sold and securities purchased under agreements to resell, and money market mutual funds. The Company uses these funds in the management of liquidity and interest rate sensitivity or as a short-term holding prior to subsequent movement into other investments with higher yields or for other purposes. At December 31, 2017, temporary investments were $94.8 million, an increase of $7.0 million or 7.9% compared to $87.9 million at year-end 2016.
Investment Securities
The investment securities portfolio is comprised primarily of residential mortgage-backed securities, tax-exempt securities of states and political subdivisions, and debt securities issued by U.S. government-sponsored agencies. Substantially all of the Company’s investment securities are designated as available for sale. Total investment securities had a carrying amount of $428 million at year-end 2017, a decrease of $56.7 million or 11.7% compared to $484 million at year-end 2016.
The decrease in investment securities was driven by loan demand as net proceeds from maturities, calls, and sales in excess of purchases were used to fund higher-earning loans. Maturities, calls, and sales of $188 million in the aggregate outpaced purchases totaling $134 million. The remainder of the decrease in investment securities was due to $3.4 million of net premium amortization, partially offset by a $732 thousand decline in the net unrealized loss on securities classified as available for sale. The decrease in the amount of net unrealized loss on available for sale securities is attributed to the decline in longer-term market interest rates, which was more impactful than the increase in shorter-term interest rates. In general, as market interest rates fall, the value of fixed rate investments increase. The smaller portfolio also contributed to the decline in net unrealized loss.
At year-end 2017, the net unrealized loss on investment securities was $4.3 million, an improvement of $737 thousand or 14.6% from $5.1 million at year-end 2016. The Company attributes the unrealized losses in the investment securities portfolio to changes in market interest rates and volatility, and thus identifies them as temporary. As discussed further above, market interest rates generally increased throughout 2017. Investment securities with an unrealized loss at December 31, 2017 are performing according to their contractual terms, and the Company does not expect to incur a loss on these securities unless they are sold prior to maturity. The Company does not have the intent to sell these securities nor does it believe it is likely that it will be required to sell these securities prior to their anticipated recovery. The Company does not consider any of the securities to be impaired due to reasons of credit quality or other factors. All investment securities in the Company’s portfolio are currently performing.
Proceeds received from maturing or called investment securities are used to fund higher-earning loans, reinvested in similar investments or used to manage liquidity, such as for deposit outflows or other payment obligations. The Company periodically sells investment securities in response to its overall asset/liability management strategy to lock in gains, increase yield, restructure expected future cash flows, and/or enhance its capital position. The purchase of nontaxable obligations of states and political subdivisions is one of the primary means of managing the Company’s tax position. The Company does not have direct exposure to the subprime mortgage market. The Company does not originate subprime mortgages nor has it invested in bonds that are secured by such mortgages.
The following table summarizes the carrying values of investment securities on December 31, 2017, 2016, and 2015. Available for sale securities are carried at estimated fair value and held to maturity securities are carried at amortized cost. Corporate debt securities consist primarily of debt issued by a large global financial services firm. Mutual funds and equity securities are attributed to the Company’s captive insurance subsidiary.
|
December 31, |
2017 |
2016 |
2015 |
|||||||||||||||||||||
|
(In thousands) |
Available for Sale |
Held to Maturity |
Available for Sale |
Held to Maturity |
Available for Sale |
Held to Maturity |
||||||||||||||||||
|
Obligations of U.S. government-sponsored entities |
$ | 43,208 | $ | - | $ | 71,694 | $ | - | $ | 106,906 | $ | - | ||||||||||||
|
Obligations of states and political subdivisions |
114,249 | 3,364 | 132,292 | 3,488 | 150,266 | 3,611 | ||||||||||||||||||
|
Mortgage-backed securities – residential |
193,393 | - | 224,307 | - | 297,861 | - | ||||||||||||||||||
|
Mortgage-backed securities – commercial |
49,352 | - | 45,613 | - | 20,584 | - | ||||||||||||||||||
|
Asset-backed securities |
15,574 | - | - | - | - | - | ||||||||||||||||||
|
Corporate debt securities |
7,542 | - | 6,125 | - | 5,840 | - | ||||||||||||||||||
|
Mutual funds and equity securities |
935 | - | 833 | - | 745 | - | ||||||||||||||||||
|
Total |
$ | 424,253 | $ | 3,364 | $ | 480,864 | $ | 3,488 | $ | 582,202 | $ | 3,611 | ||||||||||||
The following table presents an analysis of the contractual maturity and tax equivalent weighted average interest rates of investment securities at December 31, 2017. Available for sale securities are stated at estimated fair value and held to maturity securities are stated at amortized cost. Mortgage-backed securities are included in maturity categories based on their stated maturity dates. Expected maturities may differ from contractual maturities because issuers may have the right to call or prepay obligations. Mutual funds and equity securities have no stated maturity date and are not included in the table.
Available for Sale
|
Within One Year |
After One But Within Five Years |
After Five But Within Ten Years |
After Ten Years |
|||||||||||||||||||||||||||||
|
(In thousands) |
Amount |
Rate |
Amount |
Rate |
Amount |
Rate |
Amount |
Rate |
||||||||||||||||||||||||
|
Obligations of U.S. government-sponsored entities |
$ | 14,081 | 1.1 | % | $ | 5,233 | 1.6 | % | $ | 22,412 | 2.0 | % | $ | 1,482 | 2.2 | % | ||||||||||||||||
|
Obligations of states and political subdivisions |
12,194 | 3.3 | 44,955 | 2.8 | 39,509 | 3.0 | 17,591 | 3.5 | ||||||||||||||||||||||||
|
Mortgage-backed securities – residential |
- | - | 7,331 | 1.6 | 25,498 | 1.7 | 160,564 | 2.5 | ||||||||||||||||||||||||
|
Mortgage-backed securities – commercial |
- | - | 6,241 | 1.4 | 24,333 | 1.9 | 18,778 | 2.8 | ||||||||||||||||||||||||
|
Asset-backed securities |
- | - | - | - | 376 | 1.9 | 15,198 | 2.1 | ||||||||||||||||||||||||
|
Corporate debt securities |
1,001 | 1.2 | 488 | 2.0 | 154 | 2.9 | 5,899 | 2.9 | ||||||||||||||||||||||||
|
Total |
$ | 27,276 | 2.1 | % | $ | 64,248 | 2.4 | % | $ | 112,282 | 2.3 | % | $ | 219,512 | 2.5 | % | ||||||||||||||||
Held to Maturity
|
After One But |
After Five But |
|||||||||||||||||||||||||||||||
|
Within One Year |
Within Five Years |
Within Ten Years |
After Ten Years |
|||||||||||||||||||||||||||||
|
(In thousands) |
Amount |
Rate |
Amount |
Rate |
Amount |
Rate |
Amount |
Rate |
||||||||||||||||||||||||
|
Obligations of states and political subdivisions |
$ | - | - | % | $ | - | - | % | $ | 1,322 | 4.7 | % | $ | 2,156 | 3.3 | % | ||||||||||||||||
The calculation of the weighted average interest rates for each category is based on the weighted average amortized cost of the securities. The weighted average tax rates on exempt state and political subdivisions are computed based on the 2017 marginal corporate Federal tax rate of 35%.
Loans
Loans, net of unearned income, were $1.0 billion at December 31, 2017, an increase of $64.3 million or 6.6% compared to year-end 2016. While recent loan demand and near term prospects are encouraging, the Company continues a conservative approach to loan originations. The loan portfolio grew in three of the four quarters in 2017, with the majority of the growth occurring during the fourth quarter. Loan payments during the year include $2.3 million related to nonaccrual loans and $725 thousand related to performing restructured loans.
From time to time the Company may purchase a limited amount of loans originated by otherwise nonaffiliated third parties. The Company performs its own risk assessment and makes the credit decision on each loan prior to purchase. The Company purchased smaller balance commercial loans totaling $2.8 million and $2.5 million in the aggregate during 2017 and 2016, respectively. The average individual balance of the purchased loans was $123 thousand for 2017 and $120 thousand for 2016.
The composition of the loan portfolio is summarized in the table that follows. Based on economic forecasts and other available information, the Company expects continued gradual improvements to the local and regional economy during the coming year. An improving economy, particularly where the labor force participation rates increase, could lead to continued growth in the loan portfolio.
|
December 31, (In thousands) |
2017 |
% |
2016 |
% |
2015 |
% |
2014 |
% |
2013 |
% |
||||||||||||||||||||||||||||||
|
Real estate mortgage – construction and land development |
$ | 129,181 | 12.5 | % | $ | 120,230 | 12.4 | % | $ | 115,516 | 12.0 | % | $ | 97,045 | 10.4 | % | $ | 101,352 | 10.1 | % | ||||||||||||||||||||
|
Real estate mortgage – residential |
355,304 | 34.3 | 350,295 | 36.1 | 355,134 | 37.0 | 361,022 | 38.7 | 371,582 | 37.2 | ||||||||||||||||||||||||||||||
|
Real estate mortgage – farmland and other commercial enterprises |
432,321 | 41.8 | 400,367 | 41.2 | 386,386 | 40.3 | 375,277 | 40.3 | 418,147 | 41.8 | ||||||||||||||||||||||||||||||
|
Commercial, financial, and agricultural |
110,542 | 10.7 | 90,848 | 9.4 | 89,820 | 9.4 | 85,028 | 9.1 | 92,827 | 9.3 | ||||||||||||||||||||||||||||||
|
Installment |
7,915 | .7 | 9,235 | .9 | 12,419 | 1.3 | 13,413 | 1.5 | 15,092 | 1.5 | ||||||||||||||||||||||||||||||
|
Lease financing |
- | - | - | - | - | - | 158 | - | 883 | .1 | ||||||||||||||||||||||||||||||
|
Total |
$ | 1,035,263 | 100.0 | % | $ | 970,975 | 100.0 | % | $ | 959,275 | 100.0 | % | $ | 931,943 | 100.0 | % | $ | 999,883 | 100.0 | % | ||||||||||||||||||||
On an average basis, loans represented 63.3% of earning assets for 2017, an increase of 400 basis points compared to 59.3% for 2016. As loan demand changes, available funds are reallocated between temporary investments or investment securities, which typically involve lower credit risk and yields. The Company does not have direct exposure to the subprime mortgage market. The Company does not originate subprime mortgages nor has it invested in bonds that are secured by such mortgages. Subprime mortgage lending is defined by the Company generally as lending to a borrower that would not qualify for a mortgage loan at prevailing market rates or whereby the underwriting decision is based on limited or no documentation of the ability to repay.
The following table presents the amount of commercial, financial, and agricultural loans and loans secured by real estate outstanding at December 31, 2017 which, based on remaining scheduled repayments of principal, are due in the periods indicated.
Loan Maturities
|
(In thousands) |
Within One Year |
After One But Within Five Years |
After Five Years |
Total |
||||||||||||
|
Real estate mortgage – construction and land development |
$ | 42,697 | $ | 51,408 | $ | 35,076 | $ | 129,181 | ||||||||
|
Real estate mortgage – residential |
22,493 | 57,496 | 275,315 | 355,304 | ||||||||||||
|
Real estate mortgage – farmland and other commercial enterprises |
27,886 | 158,058 | 246,377 | 432,321 | ||||||||||||
|
Commercial, financial, and agricultural |
42,265 | 38,765 | 29,512 | 110,542 | ||||||||||||
|
Total |
$ | 135,341 | $ | 305,727 | $ | 586,280 | $ | 1,027,348 | ||||||||
The table below presents the amount of commercial, financial, and agricultural loans and loans secured by real estate outstanding at December 31, 2017 that are due after one year, classified according to sensitivity to changes in interest rates.
Interest Sensitivity
|
Fixed |
Variable |
|||||||
|
(In thousands) |
Rate |
Rate |
||||||
|
Due after one but within five years |
$ | 245,791 | $ | 59,936 | ||||
|
Due after five years |
144,622 | 441,658 | ||||||
|
Total |
$ | 390,413 | $ | 501,594 | ||||
Asset Quality
The Company’s loan portfolio is subject to varying degrees of credit risk. Credit risk is mitigated by diversification within the portfolio, limiting exposure to any single customer or industry, rigorous lending policies and underwriting criteria, and collateral requirements. The Company maintains policies and procedures to ensure that the granting of credit is done in a sound and consistent manner. The Company’s internal audit department performs loan reviews during the year to evaluate loan administration, credit quality, documentation, compliance with Company loan standards, and the adequacy of the allowance for loan losses.
The provision for loan losses represents charges or credits made to earnings to maintain an allowance for loan losses at a level considered adequate to provide for probable incurred credit losses at the balance sheet date. The allowance for loan losses is a valuation allowance increased by the provision for loan losses and decreased by net charge-offs. Loan losses are charged against the allowance when management believes the uncollectibility of a loan is confirmed. Subsequent recoveries, if any, are credited to the allowance.
The allowance for loan losses and related provision for loan losses generally fluctuate relative to the level of nonperforming and impaired loans, but other factors impact the amount of the allowance. The Company estimates the adequacy of the allowance using a risk-rated methodology based on the Company’s past loan loss experience, known and inherent risks in the loan portfolio, adverse situations that may affect the borrower’s ability to repay, the estimated value of any underlying collateral securing loans, composition of the loan portfolio, current economic conditions, and other relevant factors. This evaluation is inherently subjective as it requires significant judgment and the use of estimates that may be susceptible to change.
The allowance for loan losses consists of specific and general components. The specific component relates to loans that are individually classified as impaired. The general component covers non-impaired loans and is based on historical loss experience adjusted for current risk factors. Allocations of the allowance may be made for specific loans, but the entire allowance is available for any loan that, in management’s judgment, should be charged off. Actual loan losses could differ significantly from the amounts estimated by management.
The general portfolio is segregated into portfolio segments having similar risk characteristics identified as follows: real estate loans, commercial loans, and consumer loans. Each of these portfolio segments is assigned a loss percentage based on their respective rolling historical loss rates, adjusted for the qualitative risk factors summarized below. During the first quarter of 2017, the Company shortened the look-back period it uses to determine historical loss rates to the previous twelve quarters from sixteen quarters. The change in the look-back period is the result of the Company’s ongoing monitoring and evaluation of the adequacy of its allowance for loan losses. The shorter look-back period better reflects the Company’s loss estimates based on current market conditions. Shortening the look-back period increased the allowance for loan losses by $49 thousand compared to the previous sixteen quarter look-back period.
The qualitative risk factors used in the methodology are consistent with the guidance in the most recent Interagency Policy Statement on the Allowance for Loan Losses issued. Each factor is supported by a detailed analysis and is both measureable and supportable. Some factors include a minimum allocation in instances where loss levels are extremely low and it is determined to be prudent from a safety and soundness perspective. Qualitative risk factors that are used in the methodology include the following for each loan portfolio segment:
| ● |
Delinquency trends |
● |
Management experience risk |
| ● |
Trends in net charge-offs |
● |
Concentration of credit risk |
| ● |
Trends in loan volume |
● |
Economic conditions risk |
| ● |
Lending philosophy risk |
A loan is impaired when, based on current information and events, it is probable that the Company will be unable to collect all amounts due according to the contractual terms of the loan agreement. Loans for which the terms have been modified resulting in a concession, and for which the borrower is experiencing financial difficulties, are considered troubled debt restructurings and classified as impaired. Factors considered by management in determining impairment include payment status, collateral value, and the probability of collecting scheduled principal and interest payments when due. Loans that experience insignificant payment delays and payment shortfalls generally are not classified as impaired. Management determines the significance of payment delays and payment shortfalls on a case-by-case basis, taking into consideration all of the circumstances surrounding the loan and the borrower, including the length of the delay, the reasons for the delay, the borrower’s prior payment record, and the amount of the shortfall in relation to the principal and interest owed.
While the overall economy experienced further improvement in 2017, the Company continued its steady progress in reducing its level of nonperforming assets. The recessionary period between 2007 and 2009 (the “Recession”) resulted in an accumulation of nonperforming assets and significant deterioration in the Company’s credit quality and collateral values, primarily in residential real estate lending. Credit quality has improved significantly over the last few years, as loan underwriting standards have been strengthened. Additionally, nonperforming asset levels have declined 85% from the peak that occurred in 2010. Overall economic growth is improving and key economic measures have largely recovered from the Recession. In Kentucky, housing starts continue to gradually increase and foreclosure rates are at the lowest rate since 2007. At year-end 2017, the national and Kentucky unemployment rate was 4.1% and 4.4%, respectively.
With the continued improvement in the credit quality of the loan portfolio, the level of nonperforming assets are at the lowest level since the third quarter of 2007. Nonperforming loans were $15.4 million at year-end, a decrease of $14.0 million for the year and $92.5 million or 85.8% since peaking at $108 million in the first quarter of 2010. The Company includes accruing restructured loans as a component of its nonperforming loans. Such loans were $11.5 million at year-end 2017 and account for 74.7% of nonperforming loans. Of the $11.5 million in accruing restructured loans, $10.3 million consist of two larger-balance credit relationships secured by various types of real estate collateral. Restructured loans declined $11.5 million or 50.0% during 2017, primarily due to a $10.7 million credit secured by commercial real estate that refinanced during the fourth quarter of 2017 and was upgraded to performing status. Nonaccrual loans were $3.9 million at year-end 2017, down $2.5 million or 39.5% for the year.
Nonperforming assets as a percent of total assets fell 115 basis points to 1.2%. High levels of nonperforming assets generally result in loan charge-offs, provisions for loan losses, and impairment charges on repossessed real estate. The Company works with its loan customers on an individual case-by-case basis in order to maximize loan repayments on its challenged credits and typically does not restructure those that are past due.
Impaired loans are those in which the Company does not expect to receive full payment under the contractual terms. Impaired loans are measured at the present value of expected future cash flows discounted at the loan’s effective interest rate, at the loan’s observable market price, or at the fair value of the collateral taking into consideration estimated costs to sell if the loan is collateral dependent. Collateral values are updated in accordance with policy guidelines by obtaining independent third party appraisals and monitoring sales activity of similar properties in our market area.
The allowance specifically allocated to impaired loans was $3.2 million or 13.8% of such loans at year-end 2017 compared with $2.9 million or 7.0% a year earlier. Of the $3.2 million, $2.1 million or 66.6% is attributed to a group of loans to a single creditor with an outstanding balance of $7.5 million secured by a combination of a real estate development and residential real estate properties. This group of collateral dependent loans is classified as performing restructured loans at year-end 2017.
The allowance for loan losses was $9.8 million, or 0.94% of outstanding loans at year-end 2017. This compares to $9.3 million, or 0.96% of loans outstanding at year-end 2016. The decline in the allowance as a percentage of loans outstanding from the prior year is the result of a credit to the provision for loan losses of $211 thousand and net recoveries of $650 thousand combined with loan growth during the current year.
As a percentage of nonperforming loans, the allowance for loan losses was 63.7% and 31.8% at year-end 2017 and 2016, respectively. The allowance for loan losses as a percentage of nonaccrual loans increased to 252% at year-end 2017 compared with 145% at year-end 2016. The relatively low amount of the allowance for loan losses as a percentage of nonperforming loans is due mainly to the makeup of nonperforming loans, where performing restructured loans represent 74.7% of total nonperforming loans outstanding at year-end 2017. The allowance attributed to credits that are restructured with lower interest rates generally represents the difference in the present value of future cash flows calculated at the loan’s original effective interest rate and the new lower rate. This typically results in a reserve for loan losses that is less severe than for other loans that are collateral dependent.
Net recoveries during 2017 include $1.3 million from a real estate development project. The Company recorded a total of $2.1 million in principal charge-offs between 2010 and 2012 related to this project and anticipates it could receive an additional $575 thousand in recoveries related to this credit. The timing and amount of these possible recoveries are subject to change and are dependent on the price and volume of lots sold by the developer, however, the Company expects to receive the recoveries during the first half of 2018.
Historical loss rates continued to be low, the effect of the improvement in loss rates on the allowance for loan losses has diminished now that the higher levels experienced during 2008 through the first quarter of 2014 have already rolled out of the three year look-back period used when evaluating the allowance for loan losses. The decrease in historical loss rates and charge-off activity is due primarily to stabilizing real estate values, which serves as collateral for 89% of the Company’s loan portfolio. The rapid declines in real estate values experienced beginning in 2008 and continuing through 2011 have leveled off significantly, and the allowance for loan losses reflects this improvement. The Company has also implemented stronger credit underwriting standards in recent years, which has improved overall credit quality measures.
While historical loss rates may continue improving in the near term due to elevated charge-offs falling out of the look-back period, this improvement may not necessarily correlate to a lower provision for loan losses. Other qualitative factors, such as changes in loan volume, the overall makeup of the portfolio, economic conditions, and other risk factors applied to historical loss rates may offset to some degree the impact of decreases to the historical loss rates. Certain credit quality measures are summarized in the table that follows for the periods indicated. Several of these measures are at or near the best level in the last three years.
|
(In thousands) December 31, |
2017 |
2016 |
2015 |
Three-year |
Three-year |
|||||||||||||||
|
Nonperforming loans |
$ | 15,369 | $ | 29,365 | $ | 32,211 | $ | 36,948 | $ | 15,369 | ||||||||||
|
Nonaccrual loans |
3,887 | 6,423 | 8,380 | 11,113 | 3,887 | |||||||||||||||
|
Loans past due 30-89 days and still accruing |
2,099 | 2,259 | 588 | 2,719 | 588 | |||||||||||||||
|
Loans graded substandard or below |
30,121 | 37,650 | 44,220 | 50,518 | 30,110 | |||||||||||||||
|
Impaired loans |
23,141 | 41,895 | 37,182 | 45,574 | 23,141 | |||||||||||||||
|
Loans, net of unearned income |
1,035,263 | 970,975 | 959,275 | 1,035,263 | 927,389 | |||||||||||||||
1Based on quarter-end balances over the previous three years.
The table below summarizes the loan loss experience for the past five years.
Allowance For Loan Losses
|
Years Ended December 31, (In thousands) |
2017 |
2016 |
2015 |
2014 |
2013 |
|||||||||||||||
|
Balance of allowance for loan losses at beginning of year |
$ | 9,344 | $ | 10,315 | $ | 13,968 | $ | 20,577 | $ | 24,445 | ||||||||||
|
Loans charged off: |
||||||||||||||||||||
|
Real estate mortgage – construction and land development |
- | - | 37 | 50 | 251 | |||||||||||||||
|
Real estate mortgage – residential |
139 | 276 | 696 | 956 | 908 | |||||||||||||||
|
Real estate mortgage – farmland and other commercial enterprises |
406 | 131 | - | 870 | 274 | |||||||||||||||
|
Commercial, financial, and agricultural |
279 | 219 | 91 | 1,630 | 257 | |||||||||||||||
|
Installment |
106 | 114 | 182 | 214 | 281 | |||||||||||||||
|
Lease financing |
- | - | 3 | 32 | - | |||||||||||||||
|
Total loans charged off |
930 | 740 | 1,009 | 3,752 | 1,971 | |||||||||||||||
|
Recoveries of loans previously charged off: |
||||||||||||||||||||
|
Real estate mortgage – construction and land development |
1,296 | 51 | 261 | 292 | 70 | |||||||||||||||
|
Real estate mortgage – residential |
70 | 63 | 155 | 185 | 200 | |||||||||||||||
|
Real estate mortgage – farmland and other commercial enterprises |
20 | 27 | 47 | 147 | 57 | |||||||||||||||
|
Commercial, financial, and agricultural |
138 | 180 | 78 | 782 | 143 | |||||||||||||||
|
Installment |
55 | 69 | 112 | 97 | 221 | |||||||||||||||
|
Lease financing |
1 | 23 | 132 | 4 | 12 | |||||||||||||||
|
Total recoveries |
1,580 | 413 | 785 | 1,507 | 703 | |||||||||||||||
|
Net loan (recoveries) charge-offs |
(650 | ) | 327 | 224 | 2,245 | 1,268 | ||||||||||||||
|
Amount credited to provision for loan losses |
(211 | ) | (644 | ) | (3,429 | ) | (4,364 | ) | (2,600 | ) | ||||||||||
|
Balance at end of year |
$ | 9,783 | $ | 9,344 | $ | 10,315 | $ | 13,968 | $ | 20,577 | ||||||||||
|
Average loans net of unearned income |
$ | 987,877 | $ | 956,463 | $ | 933,260 | $ | 968,489 | $ | 1,006,662 | ||||||||||
|
Ratio of net (recoveries) charge-offs during year to average loans, net of unearned income |
(.07 | )% | .03 | % | .02 | % | 0.23 | % | 0.13 | % | ||||||||||
The following table presents an estimate of the allocation of the allowance for loan losses by type for the dates indicated. Although specific allocations exist, the entire allowance is available to absorb losses in any particular category.
|
December 31, (In thousands) |
2017 |
2016 |
2015 |
2014 |
2013 |
|||||||||||||||||||||||||||||||||||
|
Amount |
% of Respective Loan Category |
Amount |
% of Respective Loan Category |
Amount |
% of Respective Loan Category |
Amount |
% of Respective Loan Category |
Amount |
% of Respective Loan Category |
|||||||||||||||||||||||||||||||
|
Real estate mortgage – construction and land development |
$ | 1,361 | 1.05 | % | $ | 2,059 | 1.71 | % | $ | 1,554 | 1.35 | % | $ | 1,809 | 1.86 | % | $ | 2,567 | 2.53 | % | ||||||||||||||||||||
|
Real estate mortgage – residential |
3,638 | 1.02 | 3,422 | .98 | 3,723 | 1.05 | 4,778 | 1.32 | 6,200 | 1.67 | ||||||||||||||||||||||||||||||
|
Real estate mortgage – farmland and other commercial enterprises |
3,510 | .81 | 2,724 | .68 | 3,896 | 1.01 | 5,955 | 1.59 | 9,949 | 2.38 | ||||||||||||||||||||||||||||||
|
Commercial, financial, and agricultural |
951 | .86 | 854 | .94 | 820 | .91 | 1,146 | 1.35 | 1,389 | 1.50 | ||||||||||||||||||||||||||||||
|
Installment |
323 | 4.08 | 285 | 3.09 | 322 | 2.59 | 273 | 2.04 | 452 | 2.99 | ||||||||||||||||||||||||||||||
|
Lease financing |
- | - | - | - | - | - | 7 | 4.43 | 20 | 2.27 | ||||||||||||||||||||||||||||||
|
Total |
$ | 9,783 | .94 | % | $ | 9,344 | .96 | % | $ | 10,315 | 1.08 | % | $ | 13,968 | 1.50 | % | $ | 20,577 | 2.06 | % | ||||||||||||||||||||
Additional information concerning the Company’s asset quality is presented under the caption “Nonperforming Assets” which follows and “Investment Securities” beginning on page 48.
Nonperforming Assets
The Company’s nonperforming assets consist of nonperforming loans, OREO, and other foreclosed assets. Nonperforming loans include nonaccrual loans, performing restructured loans, and loans 90 days or more past due and still accruing interest. Nonaccrual loans are considered to be an indicator of potential losses. The accrual of interest on loans is discontinued when it is determined that the collection of interest or principal is doubtful, or when a default of interest or principal has existed for 90 days or more, unless such loan is well secured and in the process of collection. Restructured loans occur when a lender, because of economic or legal reasons related to a borrower’s financial difficulty, grants a concession to the borrower that it would not otherwise consider. Restructured loans typically include a reduction of the stated interest rate or an extension of the maturity date. The Company gives careful consideration to identifying which of its challenged credits merit a restructuring of terms that it believes will result in maximum loan repayments and mitigate possible losses. Cash flow projections are carefully scrutinized prior to restructuring any credits; past due credits are typically not granted concessions.
Nonperforming assets were $20.9 million at year-end 2017, a decrease of $19.2 million or 47.9% compared to $40.0 million at year-end 2016. Such assets have been reduced to the lowest level since peaking at $135 million in the first quarter of 2010. Nonperforming assets increased sharply during 2009 mainly as a result of prolonged weaknesses in the overall economy.
Nonperforming assets by category are presented in the table below for the dates indicated.
|
December 31, (In thousands) |
2017 |
2016 |
2015 |
2014 |
2013 |
|||||||||||||||
|
Loans accounted for on nonaccrual basis |
$ | 3,887 | $ | 6,423 | $ | 8,380 | $ | 11,508 | $ | 23,838 | ||||||||||
|
Loans past due 90 days or more and still accruing |
- | - | - | - | 444 | |||||||||||||||
|
Restructured loans |
11,482 | 22,942 | 23,831 | 24,429 | 26,255 | |||||||||||||||
|
Total nonperforming loans |
15,369 | 29,365 | 32,211 | 35,937 | 50,537 | |||||||||||||||
|
Other real estate owned |
5,489 | 10,673 | 21,843 | 31,960 | 37,826 | |||||||||||||||
|
Other foreclosed assets |
- | - | - | 52 | - | |||||||||||||||
|
Total nonperforming assets |
$ | 20,858 | $ | 40,038 | $ | 54,054 | $ | 67,949 | $ | 88,363 | ||||||||||
|
Ratio of total nonperforming loans to total loans (net of unearned income) |
1.5 | % | 3.0 | % | 3.4 | % | 3.9 | % | 5.1 | % | ||||||||||
|
Ratio of total nonperforming assets to total assets |
1.2 | 2.4 | 3.0 | 3.8 | 4.9 | |||||||||||||||
Additional details related to nonperforming loans were as follows at year-end 2017 and 2016:
| Nonperforming Loans | ||||||||
|
December 31, (In thousands) |
2017 |
2016 |
||||||
|
Nonaccrual Loans |
||||||||
|
Real estate mortgage – construction and land development |
$ | 151 | $ | 712 | ||||
|
Real estate mortgage – residential |
1,763 | 2,316 | ||||||
|
Real estate mortgage – farmland and other commercial enterprises |
1,752 | 3,383 | ||||||
|
Commercial, financial, and agriculture |
53 | - | ||||||
|
Installment |
168 | 12 | ||||||
|
Total nonaccrual loans |
$ | 3,887 | $ | 6,423 | ||||
|
Restructured Loans |
||||||||
|
Real estate mortgage – construction and land development |
$ | 1,955 | $ | 3,637 | ||||
|
Real estate mortgage – residential |
5,326 | 4,006 | ||||||
|
Real estate mortgage – farmland and other commercial enterprises |
3,703 | 14,787 | ||||||
|
Commercial, financial, and agriculture |
370 | 377 | ||||||
|
Installment |
128 | 135 | ||||||
|
Total restructured loans |
$ | 11,482 | $ | 22,942 | ||||
|
Past Due 90 Days or More and Still Accruing |
$ | - | $ | - | ||||
|
Total nonperforming loans |
$ | 15,369 | $ | 29,365 | ||||
Nonperforming loan activity during 2017 was as follows:
|
(In thousands) |
Nonaccrual |
Restructured |
||||||
|
Balance at December 31, 2016 |
$ | 6,423 | $ | 22,942 | ||||
|
Additions |
1,541 | - | ||||||
|
Principal paydowns |
(2,283 | ) | (725 | ) | ||||
|
Transfers to performing status |
(469 | ) | (10,735 | ) | ||||
|
Transfers to other real estate owned |
(687 | ) | - | |||||
|
Charge-offs |
(638 | ) | - | |||||
|
Balance at December 31, 2017 |
$ | 3,887 | $ | 11,482 | ||||
Restructured loans transferred to performing status consists of a single larger-balance credit secured by commercial real estate that was upgraded as a result of the underwriting and approval of a new loan during the fourth quarter of 2017.
The Company gives careful consideration to identifying which of its challenged credits merit a restructuring of terms that it believes will result in maximum loan repayments and mitigate possible losses. From time to time the Company may modify a customer’s loan, but such modifications may or may not meet the criteria for classification as a restructured troubled debt. Modifications that do not meet the criteria of a troubled debt include:
|
● |
repricing a loan to a current market rate of interest to a borrower with good credit and adequate collateral value in order to retain the customer; |
|
● |
changing the payment frequency from monthly to quarterly, semi-annually, or annually where the loan is performing, the borrower has good credit and adequate collateral value, and the Company believes valid reasons exist for the change; or |
|
● |
extending the interest only payment period of a performing loan where the borrower has good credit and adequate collateral value in instances where a project may still be in a phase of development or leasing-up, and where the Company believes completion will occur in the near future, or such extension is otherwise in the Company’s best interest. |
As modifications are made, management evaluates whether the modification meets the criteria to be classified as a troubled debt. These criteria include two components:
|
1. |
The bank makes a concession on the loan terms that it would not otherwise consider, and |
|
2. |
The borrower is experiencing financial difficulty. |
The Company’s loan policy provides guidance to its lending personnel regarding restructured loans to ensure those that are troubled debt are properly identified. Additional attention is given to restructured loans through the oversight of the Chief Credit Officer to ensure that modifications meeting criteria for restructured loans are identified and properly reported.
The Company has not engaged in loan splitting. Loan splitting is a practice that may occur in work-out situations whereby a loan is divided into two parts – a performing part and a nonperforming part. This benefits a lender by potentially replacing one impaired loan by one smaller good loan and one smaller bad loan. Overall charge-offs and reserve amounts are potentially reduced and the effects of adverse loan classifications may be diminished.
The Company’s comprehensive risk-grading and loan review program includes a review of loans to assess risk and assign a grade to those loans, a review of delinquencies, and an assessment of loans for needed charge-offs or placement on nonaccrual status. The Company had loans in the amount of $32.7 million and $44.0 million at year-end 2017 and year-end 2016, respectively, which were performing but considered potential problem loans and are not included in the nonperforming loan totals in the tables above. These loans, however, are considered in establishing an appropriate allowance for loan losses. Potential problem loans include a variety of borrowers and are secured primarily by various types of real estate including commercial, construction properties, and residential real estate developments. The $11.3 million or 25.7% decrease during the year in the level of potential problem loans is attributed primarily to an overall improvement in credit quality similar to that of the overall portfolio. At December 31, 2017, the five largest potential problem credits were $9.3 million in the aggregate compared to $11.5 million at year-end 2016.
Potential problem loans are identified on the Company’s watch list and consist of loans that require close monitoring by management. Credits may be considered as a potential problem loan for reasons that are temporary or correctable, such as for a deficiency in loan documentation or absence of current financial statements of the borrower. Potential problem loans may also include credits where adverse circumstances are identified that may affect the borrower’s ability to comply with the contractual terms of the loan. Other factors which might indicate the existence of a potential problem loan include the delinquency of a scheduled loan payment, deterioration in a borrower’s financial condition identified in a review of periodic financial statements, a decrease in the value of the collateral securing the loan, or a change in the economic environment in which the borrower operates. Certain loans on the Company’s watch list are also considered impaired and specific allowances related to these loans are established in accordance with the appropriate accounting guidance.
Other real estate owned includes real estate properties acquired by the Company through, or in lieu of, actual loan foreclosures. At year-end 2017, OREO was $5.5 million, a decrease of $5.2 million or 48.6% compared to $10.7 million at year-end 2016. OREO has declined $47.1 million or 89.6% from its peak of $52.6 million, which occurred at year-end 2012.
OREO activity for 2017 was as follows:
|
(In thousands) |
Amount |
|||
|
Balance at December 31, 2016 |
$ | 10,673 | ||
|
Transfers from loans and other increases |
821 | |||
|
Proceeds from sales |
(5,419 | ) | ||
|
Gain on sales, net |
208 | |||
|
Write downs and other decreases, net |
(794 | ) | ||
|
Balance at December 31, 2017 |
$ | 5,489 | ||
The reduction in OREO was driven by sales activity and impairment charges of $5.2 million and $794 thousand, respectively, which more than offset new acquisitions. Property sales during the year include the sale of two residential real estate development property that sold for $2.0 million with a related gain of $147 thousand in the aggregate and three larger-balance commercial real estate development properties which sold for $1.4 million at a related net loss of $62 thousand. Sales of OREO during 2017 include $2.9 million financed by the Company.
Deposits
The Company’s primary source of funding for its lending and investment activities results from its customer deposits, which consist of noninterest and interest bearing demand, savings, and time deposits. A summary of the Company’s deposits is presented in the table that follows. The decrease in time deposits is a result of the Company’s strong liquidity position and its strategy to lower overall funding costs, mainly by allowing higher-rate certificates of deposit to roll off or reprice at lower interest rates. Many of those balances have been moved into noninterest bearing demand or lower-rate interest bearing demand or savings accounts by the customer. The Company has not sought out or accepted brokered deposits in the past nor does it have plans to do so in the future.
A summary of the Company’s deposits is as follows for the dates indicated:
|
December 31, (In thousands) |
2017 |
2016 |
Increase |
|||||||||
|
Noninterest Bearing |
$ | 361,855 | $ | 334,676 | $ | 27,179 | ||||||
|
Interest Bearing |
||||||||||||
|
Demand |
379,027 | 348,197 | 30,830 | |||||||||
|
Savings |
416,163 | 416,611 | (448 | ) | ||||||||
|
Time |
222,858 | 270,423 | (47,565 | ) | ||||||||
|
Total interest bearing |
1,018,048 | 1,035,231 | (17,183 | ) | ||||||||
|
Total deposits |
$ | 1,379,903 | $ | 1,369,907 | $ | 9,996 | ||||||
A summary of average balances for deposits by type and the related weighted average rates paid is as follows for the periods presented:
|
Years Ended December 31, |
2017 |
2016 |
2015 |
|||||||||||||||||||||
|
(In thousands) |
Average Balance |
Average Rate Paid |
Average Balance |
Average Rate Paid |
Average Balance |
Average Rate Paid |
||||||||||||||||||
|
Noninterest bearing demand |
$ | 347,355 | - | % | $ | 324,596 | - | % | $ | 304,516 | - | % | ||||||||||||
|
Interest bearing demand |
356,023 | .16 | 334,818 | .08 | 334,281 | .06 | ||||||||||||||||||
|
Savings |
418,507 | .11 | 407,353 | .12 | 385,932 | .13 | ||||||||||||||||||
|
Time |
245,215 | .45 | 296,258 | .54 | 356,419 | .64 | ||||||||||||||||||
|
Total interest bearing |
1,019,745 | .21 | 1,038,429 | .23 | 1,076,632 | .28 | ||||||||||||||||||
|
Total |
$ | 1,367,100 | .16 | % | $ | 1,363,025 | .17 | % | $ | 1,381,148 | .21 | % | ||||||||||||
Maturities of time deposits of $100,000 or more outstanding at December 31, 2017 are summarized as follows:
|
(In thousands) |
Amount |
|||
|
3 months or less |
$ | 8,831 | ||
|
Over 3 through 6 months |
11,553 | |||
|
Over 6 through 12 months |
21,903 | |||
|
Over 12 months |
23,305 | |||
|
Total |
$ | 65,592 | ||
Securities Sold Under Agreements to Repurchase
Securities sold under agreements to repurchase represent transactions where the Company sells certain of its investment securities and agrees to repurchase them at a specific date in the future. Securities sold under agreements to repurchase are accounted for as secured borrowings and reflect the amount of cash received in connection with the transaction. Information on securities sold under agreements to repurchase is as follows:
|
(In thousands) |
2017 |
2016 |
2015 |
|||||||||
|
Amount outstanding at year-end |
$ | 34,252 | $ | 36,370 | $ | 135,827 | ||||||
|
Maximum month-end balance during the year |
38,079 | 140,218 | 139,474 | |||||||||
|
Average outstanding |
35,063 | 107,179 | 131,551 | |||||||||
|
Weighted average rate during the year |
.22 | % | 2.74 | % | 3.09 | % | ||||||
|
Weighted average rate at year-end |
.22 | .36 | 2.97 | |||||||||
The Company entered into a balance sheet leverage transaction in 2007 whereby it borrowed $200 million through multiple fixed rate repurchase agreements with an initial weighted average cost of 3.95% and used the proceeds to purchase fixed rate Government National Mortgage Association (“GNMA”) bonds which were pledged as collateral. During September 2016, the Company prepaid the remaining balance of $100 million on the repurchase agreements, which were due to mature in November 2017.
Other Borrowings
Other borrowings consist of long-term Federal Home Loan Bank (“FHLB”) advances and subordinated notes payable to unconsolidated trusts. At times the Company’s short-term borrowings include federal funds purchased and FHLB advances. At year-end 2017 and 2016, short-term borrowings consist entirely of securities sold under agreements to repurchase
FHLB advances to the Company are secured by restricted holdings of FHLB stock which participating banks are required to own as well as certain qualifying mortgage loans as required by the FHLB, consisting primarily of 1-4 family first mortgage loans. FHLB advances are made pursuant to several different credit programs, which have their own interest rates and range of maturities. Interest rates on FHLB advances are fixed and range between 2.99% and 5.81% at year-end 2017, with a weighted average rate of 3.27%. Remaining maturities of FHLB advances extend over multiple time periods through 2020, with a weighted average remaining term of 0.9 years. FHLB advances are generally used to increase the Company’s lending activities and to aid the efforts of its asset and liability management by utilizing various repayment options offered by the FHLB. Long-term advances from the FHLB totaled $3.5 million and $18.6 million at December 31, 2017 and 2016, respectively. This represents a decrease of $15.2 million or 81.3% and is attributed to scheduled repayment activity. The Company had FHLB advances of $10.0 million with a fixed interest rate of 3.95% that matured in September, and $5.0 million with a fixed interest rate of 4.45% that matured in February. The Company has not initiated any long-term FHLB borrowings since 2008.
In 2005 and 2007, the Company completed a total of three private offerings of trust preferred securities through separate Delaware statutory trusts (the “Trusts”) sponsored by the Company in the aggregate amount of $47.5 million. The combined $25.0 million proceeds from the first two trusts (“Trusts I and II”) established in 2005 were used to fund the acquisition of Citizens Bancorp, Inc. Proceeds from the third trust (“Trust III”) were used primarily to acquire Company shares through a tender offer during 2007. The Company owns all of the common securities of each of Trusts I and Trust III. During 2016, the Company terminated Trust II as a result of the early extinguishment of debt issued by the trust.
The Trusts used the proceeds from the sale of preferred securities, plus capital of $1.5 million contributed by the Company to establish the trusts, to purchase the Company’s subordinated notes in amounts and bearing terms that parallel the amounts and terms of the respective preferred securities. Amounts and general terms related to the Trusts at year-end 2017 are summarized in the table below.
|
(Dollars in thousands) |
Trust I |
Trust III |
||||||
|
Subordinated notes payable |
$ | 10,310 | $ | 23,196 | ||||
|
Interest rate terms |
3-month LIBOR +150 BP |
3-month LIBOR +132 BP |
||||||
|
Interest rate in effect at year-end |
3.19 | % | 2.70 | % | ||||
|
Stated maturity date |
September 30, 2035 |
November 1, 2037 |
||||||
The subordinated notes of the Trusts are redeemable in whole or in part, without penalty, at the Company’s option and are junior in right of payment of all present and future senior indebtedness of the Company. The weighted average interest rate in effect as of the last determination date in 2017 and 2016 was 2.85% and 2.30%, respectively.
Contractual Obligations
The Company’s contractual obligations to make future payments as of December 31, 2017 are as follows:
|
Payments Due by Period |
||||||||||||||||||||
|
Contractual Obligations (In thousands) |
Total |
One Year or Less |
Over One Year to Three Years |
Over Three Years to Five Years |
More Than Five Years |
|||||||||||||||
|
Time deposits |
$ | 222,858 | $ | 143,185 | $ | 57,048 | $ | 17,215 | $ | 5,410 | ||||||||||
|
Long-term FHLB debt |
3,479 | 3,000 | 479 | - | - | |||||||||||||||
|
Subordinated notes payable |
33,506 | - | - | - | 33,506 | |||||||||||||||
|
Long-term securities sold under agreements to repurchase |
511 | 254 | 257 | - | - | |||||||||||||||
|
Unfunded postretirement benefit obligations |
17,811 | 517 | 1,105 | 1,259 | 14,930 | |||||||||||||||
|
Operating leases |
1,833 | 408 | 629 | 298 | 498 | |||||||||||||||
|
Employment agreements |
3,242 | 1,462 | 1,780 | - | - | |||||||||||||||
|
Total |
$ | 283,240 | $ | 148,826 | $ | 61,298 | $ | 18,772 | $ | 54,344 | ||||||||||
Long-term FHLB debt represents advances pursuant to several different credit programs. Long-term FHLB debt, subordinated notes payable, and securities sold under agreements to repurchase are more fully described under the captions “Securities Sold Under Agreements to Repurchase” and “Other Borrowings” above and in Notes 8 and 9 of the Company’s 2017 audited consolidated financial statements. Payments for borrowings in the table above do not include interest. Postretirement benefit obligations are determined by actuaries and estimated based on various assumptions with payouts projected in the time periods identified above. Estimates can vary significantly each year due to changes in significant assumptions. Operating leases include standard business equipment used in the Company’s day-to-day business as well as the lease of certain branch sites. Operating lease terms generally range from one to five years, with the ability to extend certain branch site leases at the Company’s option. Payments related to leases are based on actual payments specified in the contracts. Employment agreements represent annual minimum base salary amounts payable by the Company to six employees. The Company has employment agreements with its Chief Executive Officer, Chief Operating Officer, Chief Financial Officer, and three other key officers.
Guarantees
During 2007, the Parent Company entered into a guarantee agreement whereby it agreed to become unconditionally and irrevocably the guarantor of the obligations of three of its previous subsidiary banks in connection with the $200 million balance sheet leverage transaction. The borrowings were required to be secured by GNMA bonds valued at 106% of the amount outstanding, although the banks typically maintained an amount in excess of the required minimum. During September 2016, the Company prepaid the remaining balance of $100 million of the obligation which was due to mature in 2017. Since the debt has been repaid, the Parent Company is no longer obligated as guarantor.
Effects of Inflation
The majority of the Company’s assets and liabilities are monetary in nature. Therefore, the Company differs greatly from most commercial and industrial companies that have significant investments in nonmonetary assets, such as fixed assets and inventories. However, inflation does have an important impact on the growth of assets in the banking industry and on the resulting need to increase equity capital at higher than normal rates in order to maintain an appropriate equity to assets ratio. Inflation also affects other noninterest expense, which tends to rise during periods of general inflation.
Market Risk Management
Market risk is the risk of loss arising from adverse changes in market prices and rates. The Company’s market risk is comprised primarily of interest rate risk created by its core banking activities of extending loans and receiving deposits. The Company’s success is largely dependent upon its ability to manage this risk. Interest rate risk is defined as the exposure of the Company’s net interest income to adverse movements in interest rates. Although the Company manages other risks, such as credit and liquidity risk, management considers interest rate risk to be its most significant risk, which could potentially have the largest and a material effect on the Company’s financial condition and results of operations. A sudden and substantial change in interest rates may adversely impact the Company’s earnings to the extent that the interest rates earned on assets and paid on liabilities do not change at the same speed, to the same extent, or on the same basis. Other events that could have an adverse impact on the Company’s performance include changes in general economic and financial conditions, general movements in market interest rates, and changes in consumer preferences. The Company’s primary purpose in managing interest rate risk is to effectively invest the Company’s capital and to manage and preserve the value created by its core banking business.
Management believes the most significant impact on financial and operating results is the Company’s ability to react to changes in interest rates. Management seeks to maintain an essentially balanced position between interest sensitive assets and liabilities in order to protect against the effects of wide interest rate fluctuations. The Company has an Asset and Liability Management Committee (“ALCO”) which monitors the composition of the balance sheet to ensure comprehensive management of interest rate risk and liquidity.
The Company uses a simulation model as a tool to monitor and evaluate interest rate risk exposure. The model is designed to measure the sensitivity of net interest income and net income to changing interest rates over future periods. Forecasting net interest income and its sensitivity to changes in interest rates requires the Company to make assumptions about the volume and characteristics of many attributes, including assumptions relating to the replacement of maturing earning assets and liabilities. Other assumptions include, but are not limited to, projected prepayments, projected new volume, and the predicted relationship between changes in market interest rates and changes in customer account balances. These effects are combined with the Company’s estimate of the most likely rate environment to produce a forecast for the next twelve months. The forecasted results are then compared to the effect of a gradual 200 basis point increase and decrease in market interest rates on the Company’s net interest income and net income. Because assumptions are inherently uncertain, the model cannot precisely estimate net interest income and net income or the effect of interest rate changes on net interest income and net income. Actual results could differ significantly from simulated results.
At December 31, 2017, the model indicated that if rates were to gradually increase by 200 basis points over the next twelve months, then net interest income (TE) and net income would increase 0.84% and 1.99%, respectively, compared to forecasted results. The model indicated that if rates were to gradually decrease by 200 basis points over the next twelve months, then net interest income (TE) and net income would decrease 2.79% and 6.49%, respectively, compared to forecasted results.
In the current low interest rate environment, it is not practical or possible to reduce certain deposit rates by the same magnitude as rates on earning assets. The average rate paid on the Company’s deposits is already below 2%. This situation magnifies the model’s predicted results when modeling a decrease in interest rates, as earning assets with higher yields have more of an opportunity to reprice at lower rates than lower-rate deposits.
LIQUIDITY
Liquidity measures the ability to meet current and future cash flow needs as they become due. For financial institutions, liquidity reflects the capacity to meet loan demand, accommodate possible outflows in deposits, and to react and capitalize on interest rate market opportunities. A financial institution’s ability to meet its current financial obligations is dependent upon the structure of its balance sheet, its ability to liquidate assets, and its access to alternative sources of funds. The Company’s goal is to meet its near-term funding needs by maintaining a level of liquid funds through its asset/liability management. For the longer term, the liquidity position is managed by balancing the maturity structure of the balance sheet. This process allows for an orderly flow of funds over an extended period of time. The Company’s ALCO meets regularly and monitors the composition of the balance sheet to ensure comprehensive management of interest rate risk and liquidity.
The Company's objective as it relates to liquidity is to ensure that it has funds available to meet deposit withdrawals and credit demands without unduly penalizing profitability. In order to maintain a proper level of liquidity, the Bank has several sources of funds available on a daily basis. For assets, those sources of funds include liquid assets that are readily marketable or that can be pledged, or which mature in the near future. These assets primarily include cash and due from banks, federal funds sold, investment securities, and cash flow generated by the repayment of principal and interest on loans and investment securities. For liabilities, sources of funds primarily include the Bank’s core deposits, FHLB and other borrowings, and federal funds purchased and securities sold under agreements to repurchase. While maturities and scheduled amortization of loans and investment securities are generally a predictable source of funds, deposit outflows and mortgage prepayments are influenced significantly by general interest rates, economic conditions, and competition in our local markets.
The Company uses a liquidity ratio metric, which is monitored by ALCO, to help measure its ability to meet its cash flow needs. The liquidity ratio is based on current and projected levels of sources and uses of funds. This measure is useful in analyzing cash needs and formulating strategies to achieve desired results. For example, a low liquidity ratio could indicate that the Company’s ability to fund loans might become more difficult. A high liquidity ratio could indicate that the Company may have a disproportionate amount of funds in low yielding assets, which is more likely to occur during periods of sluggish loan demand or economic difficulties. The Company’s liquidity position, as measured by its liquidity ratio, declined at year-end 2017 when compared to year-end 2016, but is within its ALCO guidelines. The Company’s liquidity ratio, although lower than a year ago, remains well above its policy minimum as a result of its overall net funding position and, until more recently, having relatively slow, quality loan demand.
As of December 31, 2017, the Company had $406 million of additional borrowing capacity under various FHLB, federal funds, and other agreements. However, there is no guarantee that these sources of funds will continue to be available to the Company, or that current borrowings can be refinanced upon maturity, although the Company is not aware of any events or uncertainties that are likely to cause a decrease in the Company’s liquidity from these sources.
Liquidity at the Parent Company level is primarily affected by the receipt of dividends from United Bank, cash and cash equivalents maintained, and borrowings from nonaffiliated sources. Payment of dividends by the Company’s subsidiary bank is subject to certain regulatory restrictions as set forth in national and state banking laws and regulations. Capital ratios at the Company’s subsidiary bank exceed regulatory established “well-capitalized” status at December 31, 2017 under the prompt corrective action regulatory framework. The Parent Company’s primary uses of cash include the payment of dividends to its common shareholders, injecting capital into subsidiaries, paying interest expense on borrowings, and payments for general operating expenses.
The Parent Company had cash and cash equivalents of $61.6 million at year-end 2017, an increase of $17.3 million or 39.1% compared to $44.3 million at year-end 2016. Significant cash receipts of the Parent Company for 2017 include dividend payments from United Bank of $23 million and management fees from subsidiaries of $551 thousand. Significant cash payments by the Parent Company in 2017 include $3.0 million for the payment of dividends on common stock; $1.5 million to the Bank in connection with the transfer of Parent Company personnel and related liabilities resulting from the consolidation of its subsidiaries; $1.4 million for salaries, payroll taxes, and employee benefits incurred prior to the consolidation of subsidiaries; and $851 thousand for the payment of interest on subordinated notes payable.
Liquid assets consist of cash and cash equivalents and available for sale investment securities. At December 31, 2017, consolidated liquid assets were $545 million, a decrease of $49.7 million or 8.4% from year-end 2016. The decrease in liquid assets was driven by lower available for sale investment securities of $56.6 million or 11.8%, partially offset by higher money market mutual funds of $18.1 million or 97.7%. Although liquid assets decreased in the comparison, they remain elevated mainly as a result of the Company’s overall net funding position and unsteady, high-quality loan demand. The overall funding position of the Company changes as loan demand, deposit levels, and other sources and uses of funds fluctuate.
Net cash provided by operating activities was $28.0 million and $20.7 million for 2017 and 2016, respectively. This represents an increase of $7.3 million or 35.2%. Net cash used in investing activities was $11.1 million compared to net cash provided of $87.2 million for 2016. This represents a change of $98.2 million, driven by loan and net investment securities activity. The Company had net cash outflow related to loans representing overall net principal advances in the current period of $63.2 million compared with $6.0 million for 2016. For investment securities, the Company had net cash proceeds of $53.9 million for 2017, down $37.2 million compared to a year earlier. Net cash inflows represent proceeds from the sale, maturity, and call of investment securities in excess of purchases. The decrease in net cash inflows related to investment securities was driven by additional proceeds related to the series of transactions during the last half of 2016 to deleverage the balance sheet and reposition the investment securities portfolio, as discussed in further detail under the “Net Interest Income” captions on page 42.
Net cash used in financing activities was $10.1 million for 2017, a decrease of $105 million from $115 million for 2016. The decline was driven primarily by cash payments in the prior year to extinguish long-term debt. During 2016, the Company paid $104 million to extinguish long-term securities sold under agreements to repurchase as part of a balance sheet deleveraging transaction. The Company also paid $11.0 million during 2016 to purchase the preferred securities issued by Trust II and subsequently extinguished the subordinated debt issued by the trust. There was no similar transaction in the current year. For 2017, the Company had net repayments of FHLB advances of $15.2 million, up $15.0 million from $160 thousand in 2016. Deposits increased $10.0 million during 2017, compared to an increase of $913 thousand in 2016.
Information relating to commitments to extend credit is disclosed in Note 15 of the Company’s 2017 audited consolidated financial statements. These transactions are entered into in the ordinary course of providing traditional banking services and are considered in managing the Company’s liquidity position. The Company does not expect these commitments to significantly affect the liquidity position in future periods. The Company has not entered into any contracts for financial derivative instruments such as futures, swaps, options, or similar instruments.
CAPITAL RESOURCES
Shareholders’ equity was $193 million at year-end 2017, an increase of $9.3 million or 5.0% compared to $184 million at year-end 2016. Net income and other comprehensive income for the period increased shareholders’ equity by $11.7 million and $475 thousand, respectively, partially offset by dividends declared on common stock of $3.2 million. Other comprehensive income includes a $489 thousand decrease in the after-tax amount of the unrealized loss on available for sale investment securities. The decrease in the unrealized loss on available for sale investment securities is attributed to the decline in longer-term market interest rates combined with the overall decline in the outstanding balance of the investment portfolio due to loan demand. Generally, as market interest rates fall, the value of fixed rate investments such as those held by the Company, increases.
On January 9, 2009, the Company issued 30,000 shares of Series A, no par value cumulative perpetual preferred stock. The Company redeemed 20,000 of the preferred shares during 2014. In June 2015, the Company redeemed the final 10,000 shares at the stated liquidation value of $1,000 per share, plus accrued dividends of $58 thousand. There was no additional debt or equity issued by the Company in connection with any of the shares redeemed.
At December 31, 2017 and 2016, the Company’s tangible common equity ratio was 11.55% and 11.02%, respectively. The tangible common equity ratio is defined as tangible common equity as a percentage of tangible assets. The 53 basis point increase in the tangible common equity ratio is the result of an increase in tangible common equity of $9.3 million in the comparison. Tangible assets were relatively unchanged.
Consistent with the objective of operating a sound financial organization, the Company’s goal is to maintain capital ratios well above the regulatory minimum requirements. The Company's capital ratios as of December 31, 2017 and the regulatory minimums were as follows:
|
Farmers Capital Bank Corporation |
Regulatory Minimum |
||||||||
|
Common Equity Tier 1 Risk-based Capital1 |
16.56 | % | 4.50 | % | |||||
|
Tier 1 Risk-based Capital1 |
19.30 | 6.00 | |||||||
|
Total Risk-based Capital1 |
20.12 | 8.00 | |||||||
|
Tier 1 Leverage Capital2 |
13.75 | 4.00 | |||||||
1Common Equity Tier 1 (“CET1”) Risk-based, Tier 1 Risk-based, and Total Risk-based Capital ratios are computed by dividing Common Equity Tier 1, Tier 1, or Total Capital, as defined by regulation, by a risk-weighted sum of the assets, with the risk weighting determined by general standards established by regulation.
2Tier 1 Leverage ratio is computed by dividing Tier 1 Capital by total quarterly average assets, as defined by regulation.
In July 2013, banking regulators issued final rules to bring U.S. banking organizations into compliance with the Basel III capital framework effective in 2015. The Company remains well-capitalized under the current rules, including meeting the effective minimum capital ratios with a fully phased-in capital conservation buffer. For further information, see discussion in Part I, Item 1 under the caption “Capital” beginning on page 14 of this Form 10-K.
The table below represents an analysis of dividend payout ratios and equity to asset ratios for the previous five years.
|
Years Ended December 31, |
2017 |
2016 |
2015 |
2014 |
2013 |
|||||||||||||||
|
Percentage of common dividends declared to net income |
27.24 | % | 14.01 | % | - | % | - | % | - | % | ||||||||||
|
Percentage of average shareholders’ equity to average total assets |
11.56 | 10.68 | 9.77 | 9.84 | 9.34 | |||||||||||||||
Subsidiary Bank
United Bank is subject to capital-based regulatory requirements which place banks in one of five categories based upon their capital levels and other supervisory criteria. These five categories are: (1) well-capitalized, (2) adequately capitalized, (3) undercapitalized, (4) significantly undercapitalized, and (5) critically undercapitalized. To be well-capitalized, a bank must have a CET1 Risk-based Capital ratio of at least 6.5%, a Tier 1 Risk-based Capital ratio of 8%, a Total Risk-based Capital ratio of at least 10%, and a Tier 1 Leverage ratio of at least 5%. As of December 31, 2017, the Company’s subsidiary bank had the following capital ratios for regulatory purposes:
|
Common Equity Tier 1 Risk-based Capital Ratio |
Tier 1 Risk- based Capital Ratio |
Total Risk- based Capital Ratio |
Tier 1 Leverage Capital Ratio |
|||||||||||||
|
United Bank |
14.05 | % | 14.05 | % | 14.88 | % | 10.13 | % | ||||||||
Share Buy Back Program
At various times, the Company’s Board of Directors has authorized the purchase of shares of the Company’s outstanding common stock. No stated expiration dates have been established under any of the previous authorizations. There are 84,971 shares that may still be purchased under the various authorizations, though no shares have been purchased since 2008.
Shareholder Information
As of February 20, 2018, the Company had 2,949 shareholders of record, which includes individual participants in securities positions listings.
Common Stock Price
The Company’s common stock is traded on the NASDAQ Stock Market LLC exchange in the Global Select Market tier, with sales prices reported under the symbol: FFKT. The table below lists the high and low sales prices of the Company’s common stock for 2017 and 2016, along with dividends declared in each of those periods.
|
High |
Low |
Dividends Declared |
||||||||||
|
2017 |
||||||||||||
|
Fourth Quarter |
$ | 44.30 | $ | 38.45 | $ | .125 | ||||||
|
Third Quarter |
43.45 | 36.10 | .10 | |||||||||
|
Second Quarter |
42.80 | 37.20 | .10 | |||||||||
|
First Quarter |
44.25 | 34.05 | .10 | |||||||||
|
2016 |
||||||||||||
|
Fourth Quarter |
$ | 44.65 | $ | 29.24 | $ | .10 | ||||||
|
Third Quarter |
30.98 | 26.63 | .07 | |||||||||
|
Second Quarter |
29.00 | 24.71 | .07 | |||||||||
|
First Quarter |
27.31 | 24.65 | .07 | |||||||||
The closing price per share of the Company’s common stock on December 30, 2017, the last trading day of the Company’s fiscal year, was $38.50.
Recently Issued Accounting Standards
See Note 1 – “Summary of Significant Accounting Policies,” under the caption “Recently Issued But Not Yet Effective Accounting Standards,” in the Company’s 2017 audited consolidated financial statements for further information about recently issued accounting pronouncements and their expected impact on the Company’s financial statements.
2016 Compared to 2015
The Company reported net income of $16.6 million or $2.21 per common share in 2016 compared to $15.0 million or $1.95 per common share for 2015. This represents an increase in net income of $1.6 million or 10.8%. On a per common share basis, net income was up $.26 or 13.3%. The increase in net income is primarily attributed to greater noninterest income of $9.0 million or 40.4%, partially offset by an increase in noninterest expense of $3.5 million or 6.0%, and a lower credit to the provision for loan losses of $2.8 million. Non-GAAP adjusted net income, which excludes after-tax consolidation expenses of $697 thousand related to the merger of subsidiaries, was $17.3 million or $2.31 per common share for 2016.
For 2016, net interest income was relatively unchanged from 2015. Interest income declined $1.9 million or 3.0%, but was offset by a decrease in interest expense of $1.9 million or 21.8%. Interest income on loans and investment securities decreased $373 thousand or 0.8% and $1.7 million or 13.1%, respectively. Interest expense on deposits and borrowed funds decreased $606 thousand or 20.5% and $1.3 million or 22.5%, respectively. As part of its strategy to improve net interest income and net interest margin, the Company completed a series of transactions during the last half of the year to deleverage its balance sheet and reposition its investment securities portfolio. The Company used a mixture of $10.4 million of excess cash and $93.4 million of proceeds from the sale of investment securities to prepay $100 million of high fixed-rate borrowings that were due to mature in November 2017. The Company incurred a prepayment fee of $3.8 million, which was offset by a gain in the same amount on the sale of investment securities.
Interest on deposits decreased due to both rate declines and lower volume, with a significant amount of the decrease related to time deposits. The Company continued to reprice its higher-rate maturing time deposits downward to lower market interest rates or allowing them to mature without renewing. Net interest margin was 3.36% for 2016 compared to 3.29% for 2015. Net interest spread was 3.21% and 3.14%, up seven basis points compared to 2015. Overall cost of funds decreased 12 basis points to 0.56%.
The Company recorded a credit to the provision for loan losses in the amount of $644 thousand and $3.4 million for 2016 and 2015, respectively. The credit to the provision for loan losses is attributed to continued improvement in the credit quality of the loan portfolio. The decrease in the credit to the provision is mainly driven by a smaller rate of improvement in historical loss rates during 2016 compared to 2015.
Nonperforming loans decreased $2.8 million or 8.8% in 2016, primarily as a result of lower nonaccrual loans of $2.0 million or 23.4%. Nonperforming loans, watch list loans, and loans graded as substandard or below each improved in the yearly comparison. The ratio of nonperforming loans to total loans at year-end 2016 was 3.0% compared to 3.4% at year-end 2015. The allowance for loan losses was $9.3 million and $10.3 million at year-end 2016 and 2015, respectively. As a percentage of loans, the allowance for loan losses decreased 12 basis points to 0.96% at year-end 2016 compared to 1.08% a year earlier.
Noninterest income for 2016 was $31.2 million, an increase of $9.0 million or 40.4% from 2015. This was driven by a $4.1 million gain on the early extinguishment of debt and higher net gains on the sale of investment securities of $3.8 million related to a balance sheet deleveraging transaction. Noninterest income also includes $1.5 million in payments related to a litigation settlement. These were partially offset by a decrease in allotment processing fees of $1.1 million or 25.2% from lower processing volume. Other significant components of the increase in noninterest income include higher trust income of $291 thousand or 12.3%. Service charges and fees on deposits were up $266 thousand or 3.5%, driven by higher service charges of $329 thousand or 71.9% and higher dormant account fees of $226 thousand or 9.5%, partially offset by lower overdraft fees of $259 thousand or 6.1%. During the second quarter of 2016, the Company standardized and reduced the number of its deposit account product offerings throughout each of its markets. This contributed to an overall increase in service charges during the year. Net gains on the sale of mortgage loans increased $118 thousand or 14.3% despite lower sales volume of $3.0 million or 7.6%. The decline in sales volume is mainly due to two larger-balance commercial loans with an aggregate balance of $12.3 million sold during 2015.
Total noninterest expenses were $61.4 million for 2016, an increase of $3.5 million or 6.0% compared to $58.0 million a year earlier. The increase in noninterest expenses was mainly attributed to a $3.8 million loss related to the early extinguishment of debt during 2016 and $1.1 million related to the consolidation of the Company’s subsidiaries. Expenses related to repossessed real estate were up $481 thousand or 28.2%, driven by higher impairment charges of $351 thousand or 31.9% and a higher net loss from property sales of $285 thousand, partially offset by lower development, operating, and maintenance expenses of $155 thousand.
Deposit insurance expense was down $695 thousand or 45.2% mainly due to a combination of lower risk ratings for the Company’s subsidiary banks and lower assessment rates. Amortization of intangible assets declined $449 thousand or 100% as a result of being fully amortized at year-end 2015. Legal expenses declined $369 thousand or 43.8% mainly due to fees related to a legal settlement during the first quarter of 2015. Salaries and employee benefits were up $288 thousand or 0.9%, which included $601 thousand of severance pay accruals related to the consolidation of subsidiaries. Employee benefits decreased $499 thousand or 8.0%, mainly from lower claims activity related to the Company’s self-funded health insurance plan and lower actuary-determined postretirement benefit expense. Salaries and related payroll taxes were up $185 thousand or 0.7%. Data processing and communication expense increased $348 thousand or 8.1% mainly due to expenses of $165 thousand in 2016 related to the consolidation of subsidiaries and $137 thousand related to a change in card vendor.
Income tax expense was $6.4 million for 2016, an increase of $1.1 million or 21.7% compared to $5.3 million for 2015. The effective income tax rates were 27.9% and 26.1% for 2016 and 2015, respectively. The increase in income tax expense and the effective tax rate for 2016 is attributed to a higher mix of taxable versus tax-exempt sources of revenue, driven by the gain on early extinguishment of debt and the legal settlement.
Item 7A. Quantitative and Qualitative Disclosures About Market Risk
The information required by this item is incorporated by reference to Part II, Item 7 under the caption “Market Risk Management” beginning on page 61 of this Form 10-K.
Item 8. Financial Statements and Supplementary Data
MANAGEMENT’S RESPONSIBILITY FOR FINANCIAL REPORTING
The management of Farmers Capital Bank Corporation has the responsibility for preparing the accompanying consolidated financial statements and for their integrity and objectivity. The statements were prepared in accordance with accounting principles generally accepted in the United States of America. The consolidated financial statements include amounts that are based on management’s best estimates and judgments. Management also prepared other information in the annual report and is responsible for its accuracy and consistency with the financial statements.
The Company’s 2017 consolidated financial statements have been audited by BKD, LLP (“BKD”) independent accountants. Management has made available to BKD all financial records and related data, as well as the minutes of Boards of Directors’ meetings. Management believes that all representations made to BKD during the audit were valid and appropriate.
 |
 |
|
Lloyd C. Hillard, Jr. |
Mark A. Hampton |
|
President and Chief Executive Officer |
Executive Vice President, Chief Financial Officer, and Secretary |
|
March 12, 2018 |
Report of Independent Registered Public Accounting Firm
To the Shareholders, Board of Directors
and Audit Committee
Farmers Capital Bank Corporation
Frankfort, Kentucky
Opinion on the Internal Control Over Financial Reporting
We have audited Farmers Capital Bank Corporation’s (Company) internal control over financial reporting as of December 31, 2017, based on criteria established in Internal Control – Integrated Framework (2013) issued by the Committee of Sponsoring Organizations of the Treadway Commission (COSO).
In our opinion, the Company maintained, in all material respects, effective internal control over financial reporting as of December 31, 2017, based on criteria established in Internal Control – Integrated Framework (2013) issued by COSO.
We also have audited, in accordance with the standards of the Public Company Accounting Oversight Board (United States), the consolidated financial statements of the Company and our report dated March 12, 2018, expressed an unqualified opinion thereon.
Basis for Opinion
The Company’s management is responsible for maintaining effective internal control over financial reporting and for its assessment of the effectiveness of internal control over financial reporting, included in the accompanying management’s report on internal control over financial reporting. Our responsibility is to express an opinion on the Company’s internal control over financial reporting based on our audit.
We are a public accounting firm registered with the Public Company Accounting Oversight Board (United States) and are required to be independent with respect to the Company in accordance with the U.S. federal securities laws and the applicable rules and regulations of the U.S. Securities and Exchange Commission and the Public Company Accounting Oversight Board (United States).
We conducted our audit in accordance with the standards of the Public Company Accounting Oversight Board (United States). Those standards require that we plan and perform the audit to obtain reasonable assurance about whether effective internal control over financial reporting was maintained, in all material respects.
Our audit included obtaining an understanding of internal control over financial reporting, assessing the risk that a material weakness exists and testing and evaluating the design and operating effectiveness of internal control based on the assessed risk. Our audit also included performing such other procedures as we considered necessary in the circumstances. We believe that our audit provides a reasonable basis for our opinion.
Definitions and Limitations of Internal Control Over Financial Reporting
A company’s internal control over financial reporting is a process designed to provide reasonable assurance regarding the reliability of financial reporting and the preparation of financial statements for external purposes in accordance with generally accepted accounting principles. A company’s internal control over financial reporting includes those policies and procedures that (1) pertain to the maintenance of records that, in reasonable detail, accurately and fairly reflect the transactions and dispositions of the assets of the company; (2) provide reasonable assurance that transactions are recorded as necessary to permit preparation of financial statements in accordance with generally accepted accounting principles, and that receipts and expenditures of the company are being made only in accordance with authorizations of management and directors of the company; and (3) provide reasonable assurance regarding prevention or timely detection of unauthorized acquisition, use or disposition of the company’s assets that could have a material effect on the financial statements.
Because of its inherent limitations, internal control over financial reporting may not prevent or detect misstatements. Also, projections of any evaluation of effectiveness to future periods are subject to the risk that controls may become inadequate because of changes in conditions or that the degree of compliance with the policies or procedures may deteriorate.

Louisville, Kentucky
March 12, 2018
Report of Independent Registered Public Accounting Firm
To the Shareholders, Board of Directors
and Audit Committee
Farmers Capital Bank Corporation
Frankfort, Kentucky
Opinion on the Financial Statements
We have audited the accompanying consolidated balance sheets of Farmers Capital Bank Corporation (Company) as of December 31, 2017 and 2016, the related consolidated statements of income, comprehensive income, shareholders’ equity and cash flows for each of the years in the three-year period ended December 31, 2017, and the related notes (collectively referred to as the financial statements). In our opinion, the consolidated financial statements referred to above present fairly, in all material respects, the financial position of the Company as of December 31, 2017 and 2016, and the results of its operations and its cash flows for each of the years in the three-year period ended December 31, 2017, in conformity with accounting principles generally accepted in the United States of America.
We also have audited, in accordance with the standards of the Public Company Accounting Oversight Board (United States), the Company’s internal control over financial reporting as of December 31, 2017, based on criteria established in Internal Control – Integrated Framework (2013) issued by the Committee of Sponsoring Organizations of the Treadway Commission (COSO) and our report dated March 12, 2018, expressed an unqualified opinion on the effectiveness of the Company’s internal control over financial reporting.
Basis for Opinion
These financial statements are the responsibility of the Company’s management. Our responsibility is to express an opinion on the Company’s financial statements based on our audits.
We are a public accounting firm registered with the Public Company Accounting Oversight Board (United States) and are required to be independent with respect to the Company in accordance with the U.S. federal securities laws and the applicable rules and regulations of the U.S. Securities and Exchange Commission and the Public Company Accounting Oversight Board (United States).
We conducted our audits in accordance with the standards of the Public Company Accounting Oversight Board (United States). Those standards require that we plan and perform the audits to obtain reasonable assurance about whether the financial statements are free of material misstatement, whether due to error or fraud. Our audits included performing procedures to assess the risks of material misstatement of the financial statements, whether due to error or fraud, and performing procedures that respond to those risks. Such procedures include examining, on a test basis, evidence regarding the amounts and disclosures in the financial statements. Our audits also included evaluating the accounting principles used and significant estimates made by management, as well as evaluating the overall presentation of the financial statements. We believe that our audits provide a reasonable basis for our opinion.
We have served as the Company’s auditor since 2012.
Louisville, Kentucky
March 12, 2018
Consolidated Balance Sheets
|
December 31, (In thousands, except share and per share data) |
2017 |
2016 |
||||||
|
Assets |
||||||||
|
Cash and cash equivalents: |
||||||||
|
Cash and due from banks |
$ | 25,581 | $ | 25,666 | ||||
|
Interest bearing deposits in other banks |
58,154 | 62,696 | ||||||
|
Federal funds sold and securities purchased under agreements to resell |
- | 6,622 | ||||||
|
Money market mutual funds |
36,673 | 18,550 | ||||||
|
Total cash and cash equivalents |
120,408 | 113,534 | ||||||
|
Investment securities: |
||||||||
|
Available for sale, amortized cost of $428,695 (2017) and $486,038 (2016) |
424,253 | 480,864 | ||||||
|
Held to maturity, fair value of $3,478 (2017) and $3,597 (2016) |
3,364 | 3,488 | ||||||
|
Total investment securities |
427,617 | 484,352 | ||||||
|
Loans, net of unearned income |
1,035,263 | 970,975 | ||||||
|
Allowance for loan losses |
(9,783 | ) | (9,344 | ) | ||||
|
Loans, net |
1,025,480 | 961,631 | ||||||
|
Premises and equipment, net |
30,928 | 31,900 | ||||||
|
Company-owned life insurance |
30,817 | 30,914 | ||||||
|
Other real estate owned |
5,489 | 10,673 | ||||||
|
Other assets |
33,133 | 38,026 | ||||||
|
Total assets |
$ | 1,673,872 | $ | 1,671,030 | ||||
|
Liabilities |
||||||||
|
Deposits: |
||||||||
|
Noninterest bearing |
$ | 361,855 | $ | 334,676 | ||||
|
Interest bearing |
1,018,048 | 1,035,231 | ||||||
|
Total deposits |
1,379,903 | 1,369,907 | ||||||
|
Securities sold under agreements to repurchase |
34,252 | 36,370 | ||||||
|
Federal Home Loan Bank advances |
3,479 | 18,646 | ||||||
|
Subordinated notes payable to unconsolidated trusts |
33,506 | 33,506 | ||||||
|
Dividends payable, common stock |
939 | 751 | ||||||
|
Other liabilities |
28,440 | 27,784 | ||||||
|
Total liabilities |
1,480,519 | 1,486,964 | ||||||
|
Commitments and contingencies (Notes 15 and 17) |
||||||||
|
Shareholders’ Equity |
||||||||
|
Common stock, par value $.125 per share; 14,608,000 shares authorized; 7,517,446 and 7,509,444 shares issued and outstanding at December 31, 2017 and 2016, respectively |
940 | 939 | ||||||
|
Capital surplus |
52,201 | 51,885 | ||||||
|
Retained earnings |
143,778 | 134,650 | ||||||
|
Accumulated other comprehensive loss |
(3,566 | ) | (3,408 | ) | ||||
|
Total shareholders’ equity |
193,353 | 184,066 | ||||||
|
Total liabilities and shareholders’ equity |
$ | 1,673,872 | $ | 1,671,030 | ||||
See accompanying notes to consolidated financial statements.
Consolidated Statements of Income
|
(In thousands, except per share data) |
||||||||||||
|
Years Ended December 31, |
2017 |
2016 |
2015 |
|||||||||
|
Interest Income |
||||||||||||
|
Interest and fees on loans |
$ | 48,347 | $ | 47,534 | $ | 47,907 | ||||||
|
Interest on investment securities: |
||||||||||||
|
Taxable |
7,787 | 8,969 | 10,468 | |||||||||
|
Nontaxable |
2,253 | 2,450 | 2,669 | |||||||||
|
Interest on deposits in other banks |
715 | 372 | 182 | |||||||||
|
Interest on federal funds sold, securities purchased under agreements to resell, and money market mutual funds |
184 | 46 | 10 | |||||||||
|
Total interest income |
59,286 | 59,371 | 61,236 | |||||||||
|
Interest Expense |
||||||||||||
|
Interest on deposits |
2,136 | 2,355 | 2,961 | |||||||||
|
Interest on federal funds purchased |
- | 1 | - | |||||||||
|
Interest on securities sold under agreements to repurchase |
77 | 2,941 | 4,062 | |||||||||
|
Interest on Federal Home Loan Bank advances |
427 | 735 | 752 | |||||||||
|
Interest on subordinated notes payable to unconsolidated trusts |
870 | 723 | 866 | |||||||||
|
Total interest expense |
3,510 | 6,755 | 8,641 | |||||||||
|
Net interest income |
55,776 | 52,616 | 52,595 | |||||||||
|
Provision for loan losses |
(211 | ) | (644 | ) | (3,429 | ) | ||||||
|
Net interest income after provision for loan losses |
55,987 | 53,260 | 56,024 | |||||||||
|
Noninterest Income |
||||||||||||
|
Service charges and fees on deposits |
7,987 | 7,856 | 7,590 | |||||||||
|
Allotment processing fees |
2,716 | 3,232 | 4,321 | |||||||||
|
Other service charges, commissions, and fees |
5,347 | 5,558 | 5,545 | |||||||||
|
Trust income |
2,704 | 2,664 | 2,373 | |||||||||
|
Net gain on sales of available for sale investment securities |
20 | 3,998 | 171 | |||||||||
|
Net gain on sales of cost method investment securities |
82 | - | - | |||||||||
|
Gains on sale of mortgage loans, net |
662 | 942 | 824 | |||||||||
|
Income from company-owned life insurance |
1,138 | 1,016 | 937 | |||||||||
|
Gain on debt extinguishment |
- | 4,050 | - | |||||||||
|
Legal settlement |
- | 1,450 | - | |||||||||
|
Other |
509 | 420 | 450 | |||||||||
|
Total noninterest income |
21,165 | 31,186 | 22,211 | |||||||||
|
Noninterest Expense |
||||||||||||
|
Salaries and employee benefits |
30,296 | 32,296 | 32,008 | |||||||||
|
Occupancy expenses, net |
4,672 | 4,742 | 4,776 | |||||||||
|
Equipment expenses |
2,379 | 2,403 | 2,106 | |||||||||
|
Data processing and communications expenses |
4,571 | 4,596 | 4,377 | |||||||||
|
Bank franchise tax |
2,325 | 2,421 | 2,426 | |||||||||
|
Amortization of intangibles |
- | - | 449 | |||||||||
|
Deposit insurance expense |
520 | 841 | 1,536 | |||||||||
|
Other real estate expenses, net |
845 | 2,189 | 1,708 | |||||||||
|
Legal expenses |
86 | 474 | 843 | |||||||||
|
Loss on debt extinguishment |
- | 3,776 | - | |||||||||
|
Other |
7,129 | 7,662 | 7,721 | |||||||||
|
Total noninterest expense |
52,823 | 61,400 | 57,950 | |||||||||
|
Income before income taxes |
24,329 | 23,046 | 20,285 | |||||||||
|
Income tax expense |
12,641 | 6,441 | 5,293 | |||||||||
|
Net income |
11,688 | 16,605 | 14,992 | |||||||||
|
Less preferred stock dividends and discount accretion |
- | - | 395 | |||||||||
|
Net income available to common shareholders |
$ | 11,688 | $ | 16,605 | $ | 14,597 | ||||||
|
Per Common Share |
||||||||||||
|
Net income – basic and diluted |
$ | 1.56 | $ | 2.21 | $ | 1.95 | ||||||
|
Cash dividends declared |
.425 | .31 | - | |||||||||
|
Weighted Average Common Shares Outstanding |
||||||||||||
|
Basic and diluted |
7,513 | 7,504 | 7,494 | |||||||||
See accompanying notes to consolidated financial statements.
Consolidated Statements of Comprehensive Income
|
(In thousands) |
||||||||||||
|
Years Ended December 31, |
2017 |
2016 |
2015 |
|||||||||
|
Net income |
$ | 11,688 | $ | 16,605 | $ | 14,992 | ||||||
|
Other comprehensive income (loss): |
||||||||||||
|
Unrealized holding gain (loss) on available for sale securities arising during the period, net of tax of $263, $(2,146), and $(992), respectively |
489 | (3,983 | ) | (1,844 | ) | |||||||
|
Reclassification adjustment for net realized gain included in net income, net of tax of $7, $1,399, and $60, respectively |
(13 | ) | (2,599 | ) | (111 | ) | ||||||
|
Change in unfunded portion of postretirement benefit obligations, net of tax of $(1), $211, and $(74), respectively |
(1 | ) | 392 | (138 | ) | |||||||
|
Other comprehensive income (loss) |
475 | (6,190 | ) | (2,093 | ) | |||||||
|
Comprehensive income |
$ | 12,163 | $ | 10,415 | $ | 12,899 | ||||||
See accompanying notes to consolidated financial statements.
Consolidated Statements of Changes in Shareholders’ Equity
|
(In thousands, except per share data) |
Accumulated Other |
Total |
||||||||||||||||||||||||||
|
Years Ended |
Preferred |
Common Stock |
Capital |
Retained |
Comprehensive |
Shareholders’ |
||||||||||||||||||||||
|
December 31, 2017, 2016, and 2015 |
Stock |
Shares |
Amount |
Surplus |
Earnings |
Income (Loss) |
Equity |
|||||||||||||||||||||
|
Balance at January 1, 2015 |
$ | 10,000 | 7,489 | $ | 936 | $ | 51,344 | $ | 105,774 | $ | 4,875 | $ | 172,929 | |||||||||||||||
|
Net income |
- | - | - | - | 14,992 | - | 14,992 | |||||||||||||||||||||
|
Other comprehensive loss |
- | - | - | - | - | (2,093 | ) | (2,093 | ) | |||||||||||||||||||
|
Cash dividends declared – preferred, $39.50 per share |
- | - | - | - | (395 | ) | - | (395 | ) | |||||||||||||||||||
|
Redemption of preferred stock |
(10,000 | ) | - | - | - | - | - | (10,000 | ) | |||||||||||||||||||
|
Shares issued under director compensation plan |
- | 4 | - | 104 | - | - | 104 | |||||||||||||||||||||
|
Shares issued pursuant to employee stock purchase plan |
- | 7 | 1 | 129 | - | - | 130 | |||||||||||||||||||||
|
Expense related to employee stock purchase plan |
- | - | - | 31 | - | - | 31 | |||||||||||||||||||||
|
Balance at December 31, 2015 |
- | 7,500 | 937 | 51,608 | 120,371 | 2,782 | 175,698 | |||||||||||||||||||||
|
Net income |
- | - | - | - | 16,605 | - | 16,605 | |||||||||||||||||||||
|
Other comprehensive loss |
- | - | - | - | - | (6,190 | ) | (6,190 | ) | |||||||||||||||||||
|
Cash dividends declared – common, $.31 per share |
- | - | - | - | (2,326 | ) | - | (2,326 | ) | |||||||||||||||||||
|
Shares issued under director compensation plan |
- | 3 | 1 | 91 | - | - | 92 | |||||||||||||||||||||
|
Shares issued pursuant to employee stock purchase plan |
- | 6 | 1 | 154 | - | - | 155 | |||||||||||||||||||||
|
Expense related to employee stock purchase plan |
- | - | - | 32 | - | - | 32 | |||||||||||||||||||||
|
Balance at December 31, 2016 |
- | 7,509 | 939 | 51,885 | 134,650 | (3,408 | ) | 184,066 | ||||||||||||||||||||
|
Net income |
- | - | - | - | 11,688 | - | 11,688 | |||||||||||||||||||||
|
Other comprehensive income |
- | - | - | - | - | 475 | 475 | |||||||||||||||||||||
|
Adoption of Accounting Standards Update 2018-02 |
- | - | - | - | 633 | (633 | ) | - | ||||||||||||||||||||
|
Cash dividends declared – common, $.425 per share |
- | - | - | - | (3,193 | ) | - | (3,193 | ) | |||||||||||||||||||
|
Shares issued under director compensation plan |
- | 3 | - | 105 | - | - | 105 | |||||||||||||||||||||
|
Shares issued pursuant to employee stock purchase plan |
- | 5 | 1 | 178 | - | - | 179 | |||||||||||||||||||||
|
Expense related to employee stock purchase plan |
- | - | - | 33 | - | - | 33 | |||||||||||||||||||||
|
Balance at December 31, 2017 |
$ | - | 7,517 | $ | 940 | $ | 52,201 | $ | 143,778 | $ | (3,566 | ) | $ | 193,353 | ||||||||||||||
See accompanying notes to consolidated financial statements.
Consolidated Statements of Cash Flows
|
Years Ended December 31, (In thousands) |
2017 |
2016 |
2015 |
|||||||||
|
Cash Flows from Operating Activities |
||||||||||||
|
Net income |
$ | 11,688 | $ | 16,605 | $ | 14,992 | ||||||
|
Adjustments to reconcile net income to net cash provided by operating activities: |
||||||||||||
|
Depreciation and amortization |
3,507 | 3,649 | 4,155 | |||||||||
|
Net premium amortization of investment securities: |
||||||||||||
|
Available for sale |
3,307 | 4,020 | 5,570 | |||||||||
|
Held to maturity |
54 | 53 | 52 | |||||||||
|
Provision for loan losses |
(211 | ) | (644 | ) | (3,429 | ) | ||||||
|
Deferred income tax expense |
6,139 | 885 | 1,631 | |||||||||
|
Noncash employee stock purchase plan expense |
33 | 32 | 31 | |||||||||
|
Noncash director fee compensation |
105 | 92 | 104 | |||||||||
|
Mortgage loans originated for sale |
(22,764 | ) | (37,692 | ) | (40,027 | ) | ||||||
|
Proceeds from sale of mortgage loans |
25,141 | 37,627 | 40,513 | |||||||||
|
Gains on sale of mortgage loans, net |
(662 | ) | (942 | ) | (824 | ) | ||||||
|
(Gain) loss on disposal of premises and equipment, net |
(17 | ) | 22 | 20 | ||||||||
|
Net loss on sale and write downs of other real estate |
586 | 1,925 | 1,289 | |||||||||
|
Gain on extinguishment of subordinated notes payable to unconsolidated trusts |
- | (4,050 | ) | - | ||||||||
|
Loss on extinguishment of long-term securities sold under agreements to repurchase |
- | 3,776 | - | |||||||||
|
Net gain on sale of available for sale investment securities |
(20 | ) | (3,998 | ) | (171 | ) | ||||||
|
Net gain on sale of cost method investment securities |
(82 | ) | - | - | ||||||||
|
Curtailment gain on postretirement benefits plan liability |
(351 | ) | - | - | ||||||||
|
Increase in cash surrender value of company-owned life insurance |
(868 | ) | (905 | ) | (906 | ) | ||||||
|
Death benefits in excess of cash surrender value on company-owned life insurance |
(245 | ) | (81 | ) | - | |||||||
|
Decrease in accrued interest receivable |
84 | 373 | 233 | |||||||||
|
Decrease (increase) in other assets |
1,613 | (739 | ) | 400 | ||||||||
|
Decrease in accrued interest payable |
(60 | ) | (530 | ) | (93 | ) | ||||||
|
Increase in other liabilities |
1,065 | 1,262 | 2,390 | |||||||||
|
Net cash provided by operating activities |
28,042 | 20,740 | 25,930 | |||||||||
|
Cash Flows from Investing Activities |
||||||||||||
|
Proceeds from maturities and calls of investment securities: |
||||||||||||
|
Available for sale |
106,015 | 123,712 | 133,886 | |||||||||
|
Held to maturity |
70 | 70 | 65 | |||||||||
|
Proceeds from sale of available for sale investment securities |
81,823 | 219,181 | 11,570 | |||||||||
|
Purchase of available for sale investment securities |
(133,961 | ) | (251,822 | ) | (109,675 | ) | ||||||
|
Proceeds from sale of cost method investment securities |
132 | - | - | |||||||||
|
Purchase of cost method investment securities |
(3,445 | ) | (472 | ) | - | |||||||
|
Loans originated for investment greater than principal collected, net |
(63,180 | ) | (7,059 | ) | (22,237 | ) | ||||||
|
Purchase of loans held for investment |
(2,830 | ) | (2,512 | ) | (8,613 | ) | ||||||
|
Principal collected on purchased loans |
2,855 | 3,588 | 2,638 | |||||||||
|
Proceeds from death benefits of company-owned life insurance |
1,210 | 341 | - | |||||||||
|
Purchases of premises and equipment |
(2,395 | ) | (2,245 | ) | (1,721 | ) | ||||||
|
Proceeds from sale of other real estate |
2,558 | 4,367 | 9,939 | |||||||||
|
Proceeds from disposals of premises and equipment |
95 | 2 | 23 | |||||||||
|
Net cash (used in) provided by investing activities |
(11,053 | ) | 87,151 | 15,875 | ||||||||
|
Cash Flows from Financing Activities |
||||||||||||
|
Net increase (decrease) in deposits |
9,996 | 913 | (18,167 | ) | ||||||||
|
Net increase (decrease) short-term securities sold under agreements to repurchase |
(1,344 | ) | 732 | 5,763 | ||||||||
|
Proceeds from long-term securities sold under agreements to repurchase |
8 | 11 | 711 | |||||||||
|
Repayments of long-term securities sold under agreements to repurchase |
(782 | ) | (103,976 | ) | - | |||||||
|
Repayments of Federal Home Loan Bank advances |
(15,167 | ) | (160 | ) | (155 | ) | ||||||
|
Cash paid to extinguish subordinated notes payable to unconsolidated trusts |
- | (10,950 | ) | - | ||||||||
|
Dividends paid, common stock |
(3,005 | ) | (1,575 | ) | - | |||||||
|
Redemption of preferred stock |
- | - | (10,000 | ) | ||||||||
|
Dividends paid, preferred stock |
- | - | (508 | ) | ||||||||
|
Shares issued under employee stock purchase plan |
179 | 155 | 130 | |||||||||
|
Net cash used in financing activities |
(10,115 | ) | (114,850 | ) | (22,226 | ) | ||||||
|
Net increase (decrease) in cash and cash equivalents |
6,874 | (6,959 | ) | 19,579 | ||||||||
|
Cash and cash equivalents at beginning of year |
113,534 | 120,493 | 100,914 | |||||||||
|
Cash and cash equivalents at end of year |
$ | 120,408 | $ | 113,534 | $ | 120,493 | ||||||
Consolidated Statements of Cash Flows—(Continued)
|
Years Ended December 31, (In thousands) |
2017 |
2016 |
2015 |
|||||||||
|
Supplemental Disclosures |
||||||||||||
|
Cash paid during the year for: |
||||||||||||
|
Interest |
$ | 3,570 | $ | 7,285 | $ | 8,734 | ||||||
|
Income taxes |
5,135 | 5,600 | 2,718 | |||||||||
|
Transfers from loans to other real estate |
663 | 1,885 | 1,397 | |||||||||
|
Sale and financing of other real estate |
2,861 | 6,922 | 403 | |||||||||
|
Cancelation of investment in Farmers Capital Bank Trust II |
- | 464 | - | |||||||||
|
Extinguishment of subordinated notes payable to Farmers Capital Bank Trust II |
- | 15,464 | - | |||||||||
|
See accompanying notes to consolidated financial statements. |
NOTES TO CONSOLIDATED FINANCIAL STATEMENTS
|
1. |
Summary of Significant Accounting Policies |
The accounting and reporting policies of Farmers Capital Bank Corporation and subsidiaries conform to accounting principles generally accepted in the United States of America (“U.S. GAAP”) and general practices applicable to the banking industry. Significant accounting policies are summarized below.
Principles of Consolidation and Nature of Operations
The consolidated financial statements include the accounts of Farmers Capital Bank Corporation (the “Company” or “Parent Company”), a financial holding company, its wholly-owned subsidiaries bank subsidiary, United Bank & Capital Trust Company (“United Bank” or the “Bank”) in Frankfort, KY, and its wholly-owned nonbank subsidiary, FFKT Insurance Services, Inc. (“FFKT Insurance”). In February 2017, the Company merged three of its subsidiary banks (United Bank & Trust Company in Versailles, KY; First Citizens Bank, Inc. in Elizabethtown, KY; and Citizens Bank of Northern Kentucky, Inc. in Newport, KY) and its data processing subsidiary (FCB Services, Inc. in Frankfort, KY) into its subsidiary bank Farmers Bank & Capital Trust Company in Frankfort, KY, the name of which was immediately changed under the merger to United Bank & Capital Trust Company. The Company accounted for the transfer of assets and liabilities of the merged subsidiaries at their respective historical cost amounts as of the date of the merger.
FFKT Insurance is a captive insurance company in Frankfort, KY that provides property and casualty coverage to the Parent Company and its subsidiaries for risk management purposes or where insurance may not be available or economically feasible. The Company has two subsidiaries organized as Delaware statutory trusts that are not consolidated into its financial statements. These trusts were formed in 2005 and 2007 for the purpose of issuing trust preferred securities.
United Bank’s significant subsidiaries include EG Properties, Inc. and Farmers Capital Insurance Corporation (“Farmers Insurance”). EG Properties, Inc. is involved in real estate management and liquidation for certain repossessed properties of United Bank. Farmers Insurance is an insurance agency in Frankfort, KY.
The Company provides financial services at its 34 locations in 21 communities throughout Central and Northern Kentucky to individual, business, agriculture, government, and educational customers. Its primary deposit products are checking, savings, and term certificate accounts. Its primary lending products are residential mortgage, commercial lending, and consumer installment loans. Substantially all loans are secured by specific items of collateral including business assets, consumer assets, and commercial and residential real estate. Commercial loans are expected to be repaid from cash flow from operations of businesses. Other services include, but are not limited to, cash management services, issuing letters of credit, safe deposit box rental, and providing funds transfer services. Other financial instruments, which could potentially represent concentrations of credit risk, include deposit accounts in other financial institutions and federal funds sold.
Use of Estimates
The preparation of financial statements in conformity with U.S. GAAP requires management to make estimates and assumptions that affect the reported amounts of assets and liabilities and disclosure of contingent assets and liabilities at the date of the financial statements and the reported amounts of revenues and expenses during the reporting period. Estimates used in the preparation of the financial statements are based on various factors including the current interest rate environment and the general strength of the local economy. Changes in the overall interest rate environment can significantly affect the Company’s net interest income and the value of its recorded assets and liabilities. Actual results could differ from those estimates used in the preparation of the financial statements. The allowance for loan losses, carrying value of other real estate owned, actuarial assumptions used to calculate postretirement benefits, and the fair values of financial instruments are estimates that are particularly subject to change.
Reclassifications
Certain amounts in the accompanying consolidated financial statements presented for prior years have been reclassified to conform to the 2017 presentation. These reclassifications do not affect net income or total shareholders’ equity as previously reported.
Segment Information
The Company provides a broad range of financial services to individuals, corporations, and others through its 34 banking locations throughout Central and Northern Kentucky. These services primarily include the activities of lending, receiving deposits, providing cash management services, safe deposit box rental, and trust activities. While the chief decision-makers monitor the revenue streams of the various products and services, operations are managed and financial performance is evaluated on a Company-wide basis. Operating segments are aggregated into one as operating results for all segments are similar. Accordingly, all of the financial service operations are considered by management to be aggregated in one reportable segment.
Cash Flows
For purposes of reporting cash flows, cash and cash equivalents include the following: cash on hand, deposits from other financial institutions that have an initial maturity of less than 90 days when acquired by the Company, federal funds sold and securities purchased under agreements to resell, and money market mutual funds. Generally, federal funds sold and securities purchased under agreements to resell are purchased and sold for one-day periods. Net cash flows are reported for loan, deposit, and short-term borrowing transactions.
Investment Securities
Investments in debt and equity securities are classified into three categories. Securities that management has the positive intent and ability to hold until maturity are classified as held to maturity. Securities that are bought and held specifically for the purpose of selling them in the near term are classified as trading securities. The Company had no securities classified as trading during 2017, 2016, or 2015. All other securities are classified as available for sale. Securities are designated as available for sale if they might be sold before maturity. Securities classified as available for sale are carried at estimated fair value. Unrealized holding gains and losses for available for sale securities are reported net of deferred income taxes in other comprehensive income. Investments classified as held to maturity are carried at amortized cost. Amortized cost basis for investment securities includes adjustments made to the cost for previous other-than-temporary impairment (“OTTI”) recognized in earnings, amortization, accretion, and collection of cash.
Interest income includes amortization and accretion of purchase premiums or discounts. Premiums and discounts on securities are amortized using the interest method over the expected life of the securities without anticipating prepayments, except for mortgage backed securities where prepayments are anticipated. Realized gains and losses on the sales of securities are recorded on the trade date and computed on the basis of specific identification of the adjusted cost of each security and are included in noninterest income.
The Company evaluates investment securities for OTTI at least on a quarterly basis, and more frequently when economic or market conditions warrant such an evaluation. A decline in the market value of investment securities below cost that is deemed other-than-temporary results in a charge to earnings and the establishment of a new cost basis for the security. Substantially all of the Company’s investment securities are debt securities. In estimating OTTI for debt securities, management considers each of the following: (1) the length of time and extent to which fair value has been less than cost, (2) the financial condition and near-term prospects of the issuer, (3) whether market decline was affected by macroeconomic conditions, and (4) whether the Company has the intent to sell the debt security or more likely than not will be required to sell the debt security before its anticipated recovery in fair value. The assessment of whether an OTTI charge exists involves a high degree of subjectivity and judgment and is based on the information available to the Company at a point in time. The Company had no OTTI losses during any year in each of the three years in the period ended December 31, 2017.
Investment securities classified as available for sale or held-to-maturity are generally evaluated for OTTI under Financial Accounting Standard Board (“FASB”) Accounting Standards CodificationTM (“ASC”) Topic 320, “Investments-Debt and Equity Securities.” In determining OTTI under ASC Topic 320 the Company considers many factors, including those enumerated above. When OTTI occurs, the amount of the OTTI recognized in earnings depends on whether the Company intends to sell the security or it is more likely than not it will be required to sell the security before recovery of its amortized cost basis. If the Company intends to sell or it is more likely than not it will be required to sell the security before recovery of its amortized cost basis, OTTI is recognized in earnings equal to the entire difference between the investment’s amortized cost basis and its fair value at the balance sheet date. If the Company does not intend to sell the security and it is not more likely than not that it will be required to sell the security before recovery of its amortized cost basis, OTTI is separated into the amount representing the credit loss and the amount related to all other factors. The amount of the total OTTI related to the credit loss is determined based on the present value of cash flows expected to be collected and is recognized in earnings. The amount of the total OTTI related to other factors is recognized in other comprehensive income, net of applicable taxes. The previous amortized cost basis less OTTI recognized in earnings becomes the new amortized cost basis of the investment.
Federal Home Loan Bank and Federal Reserve Bank Stock
Federal Home Loan Bank (“FHLB”) and Federal Reserve Bank stock is carried at cost and recognized in other assets on the consolidated balance sheets under the caption “Other assets.” These stocks are classified as restricted securities and periodically evaluated for impairment based on ultimate recovery of par value. Both cash and stock dividends are reported as income. The amount outstanding at December 31, 2017 and 2016 was $13.2 million and $9.8 million, respectively.
Loans and Interest Income
Loans that management has the intent and ability to hold for the foreseeable future or until maturity or pay-off are reported at their unpaid principal amount outstanding adjusted for any charge-offs, deferred fees or costs on originated loans, and unamortized premiums and discounts on purchased loans. Interest income on loans is recognized using the interest method based on loan principal amounts outstanding during the period. Interest income also includes amortization and accretion of any premiums or discounts over the expected life of acquired loans at the time of purchase or business acquisition. Loan origination fees, net of certain direct origination costs, are deferred and amortized as yield adjustments over the contractual term of the loans.
The Company disaggregates certain disclosure information related to loans, the related allowance for loan losses, and credit quality measures by either portfolio segment or by loan class. The Company segregates its loan portfolio segments based on similar risk characteristics as follows: real estate loans, commercial loans, and consumer loans. Portfolio segments are further disaggregated into classes for certain required disclosures as follows:
|
Portfolio Segment |
Class |
|
Real estate loans |
Real estate mortgage – construction and land development Real estate mortgage – residential Real estate mortgage – farmland and other commercial enterprises |
|
Commercial loans |
Commercial and industrial Depository institutions Agriculture production and other loans to farmers States and political subdivisions Other |
|
Consumer loans |
Secured Unsecured |
Loan disclosures include presenting certain disaggregated information based on recorded investment. The recorded investment in a loan includes its principal amount outstanding adjusted for certain items that include net deferred loan costs or fees, unamortized premiums or discounts, charge offs, and accrued interest. The Company had a total of $83 thousand of net deferred loan fees at year-end 2017 and $301 thousand of net deferred loan costs at year-end 2016, included in the carrying amount of loans on the balance sheet, which represents .01% and .03% of loans outstanding at year-end 2017 and 2016, respectively. The amount of net deferred loans costs and fees are not material and are omitted from the computation of the recorded investment included in Note 4 that follows. Similarly, accrued interest receivable on loans was $3.1 million and $2.8 million at year-end 2017 and 2016, respectively, or 0.3% of loans for both years and has also been omitted from certain information presented in Note 4.
The Company has a loan policy in place that is amended and approved from time to time as needed to reflect current economic conditions and product offerings in its markets. The policy establishes written procedures concerning areas such as the lending authorities of loan officers, committee review and approval of certain credit requests, underwriting criteria, policy exceptions, appraisal requirements, and loan review. Credit is extended to borrowers based primarily on their ability to repay as demonstrated by income and cash flow analysis.
Loans secured by real estate make up the largest segment of the Company’s loan portfolio. If a borrower fails to repay a loan secured by real estate, the Company may liquidate the collateral in order to satisfy the amount owed. Determining the value of real estate is a key component to the lending process for real estate backed loans. If the fair value of real estate (less estimated cost to sell) securing a collateral dependent loan declines below the outstanding loan amount, the Company will write down the carrying value of the loan and thereby incur a loss. The Company uses independent third party state certified or licensed appraisers in accordance with its loan policy to mitigate risk when underwriting real estate loans. Cash flow analysis of the borrower, loan to value limits as adopted by loan policy, and other customary underwriting standards are also in place which are designed to maximize credit quality and mitigate risks associated with real estate lending.
Commercial loans are made to businesses and are secured mainly by assets such as inventory, accounts receivable, machinery, fixtures and equipment, or other business assets. Commercial lending involves significant risk, as loan repayments are more dependent on the successful operation or management of the business and its cash flows. Consumer lending includes loans to individuals mainly for personal autos, boats, or a variety of other personal uses and may be secured or unsecured. Loan repayment associated with consumer loans is highly dependent upon the borrower’s continuing financial stability, which is heavily influenced by local unemployment rates. The Company mitigates its risk exposure to each of its loan segments by analyzing the borrower’s repayment capacity, imposing restrictions on the amount it will loan compared to estimated collateral values, limiting the payback periods, and following other customary underwriting practices as adopted in its loan policy.
The accrual of interest on loans is discontinued when it is determined that the collection of interest or principal is doubtful, or when a default of interest or principal has existed for 90 days or more, unless such loan is well secured and in the process of collection. Past due status is based on the contractual terms of the loan. Interest accrued but not received for a loan placed on nonaccrual status is reversed against interest income. Cash payments received on nonaccrual loans generally are applied to principal until qualifying for return to accrual status. Loans are returned to accrual status when all the principal and interest amounts contractually due are brought current and future payments are reasonably assured. The Company’s policy for placing a loan on nonaccrual status or subsequently returning a loan to accrual status does not differ based on its portfolio class or segment.
Commercial and real estate loans delinquent in excess of 120 days and consumer loans delinquent in excess of 180 days are charged off, unless the collateral securing the debt is of such value that any loss appears to be unlikely. In all cases, loans are charged off at an earlier date if classified as loss under the Company’s loan grading process or as a result of regulatory examination. The Company’s charge-off policy for impaired loans does not differ from the charge-off policy for loans outside the definition of impaired.
Loans Held for Sale
Mortgage banking activities include the origination of fixed-rate residential mortgage loans for sale to various third-party investors. Mortgage loans originated and intended for sale in the secondary market, principally under programs with the Federal National Mortgage Association, are carried at the lower of cost or estimated fair value determined in the aggregate and included in net loans on the balance sheet until sold. These loans are sold with the related servicing rights either retained or released by the Company depending on the economic conditions present at the time of origination. The Company had no mortgage loans held for sale at December 31, 2017. Mortgage loans held for sale included in net loans at December 31, 2016 totaled $1.7 million. Mortgage banking revenues, including origination fees, servicing fees, net gains on sales of mortgage loans, and other fee income were 1.4%, 1.6%, and 1.6% of the Company’s total revenue for the years ended December 31, 2017, 2016, and 2015, respectively.
Provision and Allowance for Loan Losses
The provision for loan losses represents charges or credits made to earnings to maintain an allowance for loan losses at a level considered adequate to provide for probable incurred credit losses at the balance sheet date. The allowance for loan losses is a valuation allowance increased by the provision for loan losses and decreased by net charge-offs. Loan losses are charged against the allowance when management believes the uncollectibility of a loan is confirmed. Subsequent recoveries, if any, are credited to the allowance.
The Company estimates the adequacy of the allowance using a risk-rated methodology which is based on the Company’s past loan loss experience, known and inherent risks in the loan portfolio, adverse situations that may affect the borrower’s ability to repay, the estimated value of any underlying collateral securing loans, composition of the loan portfolio, current economic conditions, and other relevant factors. This evaluation is inherently subjective as it requires significant judgment and the use of estimates that may be susceptible to change.
The allowance for loan losses consists of specific and general components. The specific component relates to loans that are individually classified as impaired. The general component covers non-impaired loans and is based on historical loss experience adjusted for current risk factors. Allocations of the allowance may be made for specific loans, but the entire allowance is available for any loan that, in management’s judgment, should be charged off. Actual loan losses could differ significantly from the amounts estimated by management.
The general portion of the Company’s loan portfolio is segregated into portfolio segments having similar risk characteristics identified as follows: real estate loans, commercial loans, and consumer loans. Each of these portfolio segments is assigned a loss percentage based on their respective rolling historical loss rates, adjusted for the qualitative risk factors summarized below. During the first quarter of 2017, the Company shortened the look-back period it uses to determine historical loss rates to the previous twelve quarters from sixteen quarters. The change in the look-back period is the result of the Company’s ongoing monitoring and evaluation of the adequacy of its allowance for loan losses. The shorter look-back period better reflects the Company’s loss estimates based on current market conditions. Shortening the look-back period increased the allowance for loan losses by $49 thousand compared to the previous sixteen quarter look-back period.
The qualitative risk factors used in the methodology are consistent with the guidance in the most recent Interagency Policy Statement on the Allowance for Loan Losses issued. Each factor is supported by a detailed analysis and is both measureable and supportable. Some factors include a minimum allocation in instances where loss levels are extremely low and it is determined to be prudent from a safety and soundness perspective. Qualitative risk factors that are used in the methodology include the following for each loan portfolio segment:
|
● |
Delinquency trends |
|
● |
Trends in net charge-offs |
|
● |
Trends in loan volume |
|
● |
Lending philosophy risk |
|
● |
Management experience risk |
|
● |
Concentration of credit risk |
|
● |
Economic conditions risk |
A loan is impaired when, based on current information and events, it is probable that the Company will be unable to collect all amounts due according to the contractual terms of the loan agreement. Loans for which the terms have been modified resulting in a concession, and for which the borrower is experiencing financial difficulties, are considered troubled debt restructurings and classified as impaired. Factors considered by management in determining impairment include payment status, collateral value, and the probability of collecting scheduled principal and interest payments when due. Loans that experience insignificant payment delays and payment shortfalls generally are not classified as impaired. Management determines the significance of payment delays and payment shortfalls on a case-by-case basis, taking into consideration all of the circumstances surrounding the loan and the borrower, including the length of the delay, the reasons for the delay, the borrower’s prior payment record, and the amount of the shortfall in relation to the principal and interest owed.
The Company accounts for impaired loans in accordance with ASC Topic 310, “Receivables.” ASC Topic 310 requires that impaired loans be measured at the present value of expected future cash flows, discounted at the loan’s effective interest rate, at the loan’s observable market price, or at the fair value of the collateral if the loan is collateral dependent. Impaired loans may also be classified as nonaccrual. In many circumstances, however, the Company continues to accrue interest on an impaired loan. Cash receipts on accruing impaired loans are applied to the recorded investment in the loan, including any accrued interest receivable. Cash payments received on nonaccrual impaired loans generally are applied to principal until qualifying for return to accrual status. Loans that are part of a large group of smaller-balance homogeneous loans, such as residential mortgage, consumer, and smaller-balance commercial loans, are collectively evaluated for impairment. Troubled debt restructurings are measured at the present value of estimated future cash flows using the loan’s effective interest rate at inception, or at the fair value of collateral. For troubled debt restructurings that subsequently default, the Company determines the amount of the allowance in accordance with its accounting policy for the allowance for loan losses on loans individually identified as impaired.
Mortgage Servicing Rights
Mortgage servicing rights are recognized in other assets on the Company’s consolidated balance sheet at their initial fair value on loans sold with servicing retained. Fair value is based on market prices for comparable mortgage servicing contracts when available, or alternatively, is based on a valuation model that calculates the present value of estimated future net servicing income. Mortgage servicing rights are subsequently measured using the amortization method in which the mortgage servicing right is expensed in proportion to, and over the period of, the estimated future net servicing income of the underlying loans. Impairment is evaluated based on the fair value of the rights, grouping the underlying loans by interest rates. Impairment of a grouping is reported as a valuation allowance. Capitalized mortgage servicing rights were $719 thousand and $731 thousand at December 31, 2017 and 2016, respectively. No impairment of the asset was determined to exist on either of these dates. Mortgage loans serviced for others totaled $198 million and $202 million at December 31, 2017 and 2016, respectively. Mortgage loans serviced for others are not included in the Company’s balance sheets.
Fair Value of Financial Instruments
Fair values of financial instruments are estimated using relevant market information and other assumptions, as more fully disclosed in Note 19. Fair value estimates involve uncertainties and matters of significant judgment regarding interest rates, credit risk, prepayments, and other factors, especially in the absence of broad markets for particular items. Changes in assumptions or in market conditions could significantly affect the estimates.
Loan Commitments and Related Financial Instruments
Financial instruments include off-balance sheet credit instruments, such as commitments to make loans and commercial letters of credit, which are issued to meet customer financing needs. The face amount for these items represents the exposure to loss, before considering customer collateral or ability to repay. Such financial instruments are recorded when they are funded.
Intangible Assets
Intangible assets consist of core deposit and customer relationship intangible assets arising from business acquisitions. Intangible assets are initially measured at fair value and then amortized on an accelerated method over their estimated useful lives, which range between seven and ten years. Such assets are evaluated for impairment whenever changes in circumstances indicate that such an evaluation is necessary. The Company had no core deposit or customer relationship intangible assets recorded at any of the years ending December 31, 2017, 2016, or 2015.
Other Real Estate Owned
Other real estate owned (“OREO”) and held for sale in the accompanying consolidated balance sheets includes properties acquired by the Company through, or in lieu of, actual loan foreclosures. OREO is initially carried at fair value less estimated costs to sell. Fair value is generally based on third party appraisals of the property that includes comparable sales data. If the carrying amount exceeds fair value less estimated costs to sell, an impairment loss is recorded through expense. These assets are subsequently accounted for at the lower of carrying amount or fair value less estimated costs to sell. Operating costs after acquisition are expensed.
Income Taxes
Income tax expense is the total of current year income tax due or refundable and the change in deferred tax assets and liabilities, except for the deferred tax assets and liabilities related to business combinations or components of other comprehensive income. Deferred income tax assets and liabilities result from temporary differences between the tax basis of assets and liabilities and their reported amounts in the consolidated financial statements that will result in taxable or deductible amounts in future years. Deferred tax assets and liabilities are measured using enacted tax rates expected to apply to taxable income in years in which those temporary differences are expected to be recovered or settled. As changes in tax laws or rates are enacted, deferred tax assets and liabilities are adjusted through income tax expense. A valuation allowance, if needed, reduces deferred tax assets to the amount expected to be realized.
A tax position is recognized as a benefit only if it is “more likely than not” that the tax position would be sustained in a tax examination, with a tax examination being presumed to occur. The amount recognized is the largest amount of tax benefit that is greater than 50% likely of being realized on examination. For tax positions not meeting the “more likely than not” test, no tax benefit is recorded.
The Company files a consolidated federal income tax return with its subsidiaries. Federal income tax expense or benefit has been allocated to subsidiaries on a separate return basis. The Company’s policy is to record the accrual of interest and/or penalties relative to income tax matters, if any, in income tax expense.
Premises and Equipment
Premises, equipment, and leasehold improvements are stated at cost less accumulated depreciation and amortization. Depreciation is computed primarily on the straight-line method over the estimated useful lives generally ranging from two to seven years for furniture and equipment and generally ten to 40 years for buildings and related components. Leasehold improvements are amortized over the shorter of the estimated useful lives or terms of the related leases on the straight-line method. Maintenance, repairs, and minor improvements are charged to operating expenses as incurred and major improvements are capitalized. The cost of assets sold or retired and the related accumulated depreciation are removed from the accounts and any resulting gain or loss is included in noninterest income. Land is carried at cost.
Company-owned Life Insurance
The Company has purchased life insurance policies on certain key employees with their knowledge and written consent. Company-owned life insurance is recorded on the consolidated balance sheet at its cash surrender value, which is the amount that can be realized under the insurance contract at the balance sheet date. The related change in cash surrender value and proceeds received under the policies are reported on the consolidated statements of income under the caption “Income from company-owned life insurance.”
Related Party Transactions
In the ordinary course of business, the Company offers loan and deposit products to its directors, executive officers, and principal shareholders – including affiliated companies of which they are principal owners (“Related Parties”). These products are offered on substantially the same terms as those prevailing at the time for comparable transactions with unrelated parties, and these receivables and deposits are included in loans and deposits in the Company’s consolidated balance sheets. Additional information related to these transactions can be found in Note 4 and Note 7.
The Company makes payments to Related Parties in the normal course of business for various services, primarily related to legal fees. For example, certain directors of the Parent Company and its subsidiary bank are partners in law firms that act as counsel to the Company. The following table represents the amount and type of payments to Related Parties, other than director fees, for the periods indicated:
|
(In thousands) Years Ended December 31, |
2017 |
2016 |
2015 |
|||||||||
|
Legal fees |
$ | 139 | $ | 257 | $ | 221 | ||||||
|
Commissions and fees related to the sale of repossessed commercial real estate and property management |
- | - | 9 | |||||||||
|
Insurance premiums/commissions |
- | - | 1 | |||||||||
|
Other |
27 | 2 | 5 | |||||||||
|
Total |
$ | 166 | $ | 259 | $ | 236 | ||||||
Retirement Plans
The Company maintains a 401(k) salary savings plan and records expense based on the amount of its matching contributions of employee deferrals. The Company also has a nonqualified supplemental retirement plan for certain key employees that it acquired in connection with the Citizens Bank of Northern Kentucky, Inc. acquisition. Supplemental retirement plan expense allocates the benefits over years of service.
Net Income Per Common Share
Basic net income per common share is determined by dividing net income available to common shareholders by the weighted average total number of common shares issued and outstanding. Net income available to common shareholders represents net income adjusted for preferred stock dividends including dividends declared, accretion of discounts on preferred stock issuances, and cumulative dividends related to the current dividend period that have not been declared as of the end of the period. There were no dilutive instruments at year-end 2017, 2016, and 2015.
Net income per common share computations were as follows for the years ended December 31, 2017, 2016, and 2015.
|
(In thousands, except per share data) Years Ended December 31, |
2017 |
2016 |
2015 |
|||||||||
|
Net income, basic and diluted |
$ | 11,688 | $ | 16,605 | $ | 14,992 | ||||||
|
Less preferred stock dividends and discount accretion |
- | - | 395 | |||||||||
|
Net income available to common shareholders, basic and diluted |
$ | 11,688 | $ | 16,605 | $ | 14,597 | ||||||
|
Average common shares issued and outstanding, basic and diluted |
7,513 | 7,504 | 7,494 | |||||||||
|
Net income per common share, basic and diluted |
$ | 1.56 | $ | 2.21 | $ | 1.95 | ||||||
Comprehensive Income
Comprehensive income is defined as the change in equity (net assets) of a business enterprise during a period from transactions and other events and circumstances from nonowner sources. For the Company this includes net income, the after tax effect of changes in the net unrealized gains and losses on available for sale investment securities, and the after tax changes to the funded status of postretirement benefit plans.
Dividend Restrictions
Banking regulations require maintaining certain capital levels which limit the amount of dividends paid to the Company by its bank subsidiary. Generally, capital distributions are limited to undistributed net income for the current and prior two years.
Restrictions on Cash
The Company is required to maintain funds in cash and/or on deposit with the Federal Reserve Bank in accordance with reserve requirements specified by the Federal Reserve Board of Governors. The required reserve was $17.3 million and $18.0 million at December 31, 2017 and 2016, respectively.
Equity
Outstanding common shares purchased by the Company are retired. When common shares are purchased, the Company allocates a portion of the purchase price of the common shares that are retired to each of the following balance sheet line items: common stock, capital surplus, and retained earnings. The Company did not purchase any of its outstanding common shares during 2017 or 2016.
Trust Assets
Assets of the Company’s trust department, other than cash on deposit by trust customers at the Bank, are not included in the accompanying financial statements because they are not assets of the Company.
Transfers of Financial Assets
Transfers of financial assets are accounted for as sales when control over the assets has been relinquished. Control over transferred assets is deemed to be surrendered when the assets have been isolated from the Company, the transferee obtains the right (free of conditions that constrain it from taking advantage of that right) to pledge or exchange the transferred assets, and the Company does not maintain effective control over the transferred assets through an agreement to repurchase them before their maturity.
Long-term Assets
Premises and equipment, core deposit and other intangible assets, and other long-term assets are reviewed for impairment when events indicate their carrying amount may not be recoverable from future undiscounted cash flows. If impaired, the assets are recorded at fair value.
Stock-Based Compensation
The Company recognizes compensation cost for its Employee Stock Purchase Plan (“ESPP”) based on the fair value of these awards at the date of grant. A Black-Scholes model is utilized to estimate the fair value of shares issued under the ESPP. Compensation cost is recognized over the required service period, generally defined as the vesting period, on a straight-line basis.
The ESPP was approved by the Company’s shareholders in 2004. The purpose of the ESPP is to provide a means by which eligible employees may purchase, at a discount, shares of the Company’s common stock through payroll withholding. The purchase price of the shares is equal to 85% of their fair market value on specified dates as defined in the plan. The ESPP was effective beginning July 1, 2004. There were 5,367, 6,631, and 6,329 shares issued under the plan during 2017, 2016, and 2015, respectively. Compensation expense related to the ESPP included in the accompanying statements of income was $33 thousand, $32 thousand, and $31 thousand in 2017, 2016, and 2015, respectively.
Following are the weighted average assumptions used and estimated fair market value for the ESPP, which is considered a compensatory plan under ASC Topic 718, “Compensation-Stock Compensation.”
|
ESPP |
||||||||||||
|
2017 |
2016 |
2015 |
||||||||||
|
Expected volatility |
23.2 | % | 26.3 | % | 32.6 | % | ||||||
|
Dividend yield |
1.04 | .83 | - | |||||||||
|
Risk-free interest rate |
.85 | .26 | .02 | |||||||||
|
Expected life (in years) |
.25 | .25 | .25 | |||||||||
|
Fair value |
$ | 7.43 | $ | 5.31 | $ | 5.08 | ||||||
Recently Issued But Not Yet Effective Accounting Standards
In May 2014, the FASB issued Accounting Standards Update (“ASU”) No. 2014-09, Revenue from Contracts with Customers (Topic 606), and subsequently issued several amendments to the standard during 2015, 2016, and 2017. The primary principle of ASU No. 2014-09 is that entities should recognize revenue to depict the transfer of promised goods or services to customers in an amount that reflects the consideration to which the entity expects to be entitled in exchange for those goods or services. This ASU also requires disclosure of the nature, amount, timing, and uncertainty of revenue and cash flows arising from contracts with customers.
As amended, ASU No. 2014-09 is effective for the Company in annual reporting periods beginning after December 15, 2017, including interim periods within that reporting period. Earlier application is permitted, but only as of annual reporting periods beginning after December 15, 2016, including interim reporting periods within those reporting periods. The majority of the Company’s revenues earned are excluded from the scope of the new standard. Revenue streams within the scope of this ASU include services charges and fees on deposits, allotment processing fees, trust income, and components of other service charges, commission, and fees. The Company adopted ASU No. 2014-09 effective January 1, 2018 using a modified retrospective approach with no material impact to the Company’s consolidated financial statements. The Company is in the process of finalizing the additional disclosures required by the new standard.
In January 2016, the FASB issued ASU No. 2016-01, Financial Instruments – Overall (Subtopic 825-10): Recognition and Measurement of Financial Assets and Financial Liabilities and, in February 2018, issued an amendment for technical corrections and improvements related to this ASU. The amendments in this ASU require all equity investments to be measured at fair value with changes in the fair value recognized through net income (other than those accounted for under equity method of accounting or those that result in consolidation of the investee). In addition, this ASU eliminates the requirement to disclose the method(s) and significant assumptions used to estimate the fair value that is required to be disclosed for financial instruments measured at amortized cost on the balance sheet for public business entities. Public business entities will be required to use the exit price notion when measuring the fair value of financial instruments for disclosure purposes. For public business entities, the amendments in this ASU are effective for fiscal years beginning after December 15, 2017, including interim periods within those fiscal years. The amendments should be applied by means of a cumulative-effect adjustment to the balance sheet as of the beginning of the year of adoption. The amendments related to equity securities without readily determinable fair values (including disclosure requirements) should be applied prospectively to equity investments that exist as of the date of adoption. The Company adopted ASU No. 2016-01 effective January 1, 2018 with no material impact to the Company’s consolidated financial statements.
In February 2016, the FASB issued ASU No. 2016-02, “Leases (Topic 842),” to improve financial reporting about leasing transactions. This ASU will require organizations that lease assets (“lessees”) to recognize a lease liability and a right-of-use asset on its balance sheet for all leases with terms of more than twelve months. A lease liability is a lessee’s obligation to make lease payments arising from a lease, measured on a discounted basis and a right-of-use asset represents the lessee’s right to use, or control use of, a specified asset for the lease term. The amendments in this ASU simplify the accounting for sale and leaseback transactions primarily because lessees must recognize lease assets and lease liabilities. This ASU leaves the accounting for the organizations that own the assets leased to the lessee (“lessor”) largely unchanged except for targeted improvements to align it with the lessee accounting model and Topic 606, Revenue from Contracts with Customers.
For public companies, ASU No. 2016-02 is effective for fiscal years beginning after December 15, 2018, including interim periods within those fiscal years. Lessees (for capital and operating leases) and lessors (for sales-type, direct financing, and operating leases) must apply a modified retrospective transition approach for leases existing at, or entered into after, the beginning of the earliest comparative period presented in the financial statements. The modified retrospective approach would not require any transition accounting for leases that expired before the earliest comparative period presented. Lessees and lessors may not apply a full retrospective transition approach. The Company has identified a project team to review its leases and to assess the impact of ASU No. 2016-02 on its consolidated financial position, results of operations, and cash flows.
In June 2016, the FASB issued ASU No. 2016-13, “Financial Instruments—Credit Losses (Topic 326): Measurement of Credit Losses on Financial Instruments,” to improve financial reporting by requiring timelier recording of credit losses on loans and other financial instruments held by financial institutions and other organizations. The ASU requires an organization to measure all expected credit losses for financial assets held at the reporting date based on historical experience, current conditions, and reasonable and supportable forecasts. The ASU requires enhanced disclosures, including qualitative and quantitative requirements, which provide additional information about the amounts recorded in the financial statements. Additionally, the ASU amends the accounting for credit losses on available-for-sale debt securities and purchased financial assets with credit deterioration.
ASU No. 2016-13 is effective for the Company in annual and interim reporting periods beginning after December 15, 2019. Although early adoption is permitted for fiscal years beginning after December 15, 2018, the Company does not plan to early adopt. The Company has been preserving certain historical loan information from its core processing system in anticipation of adopting the standard. The Company has identified a project team to assess the impact of this ASU on its consolidated financial position, results of operations, and cash flows. The project team has developed a timeline for implementing the standard, has begun working with a third party software solution provider, and has identified an independent third party for validation of the impending changes to our credit loss methodologies and processes. The team continues to assess the impact of the standard; however, the Company expects adopting this ASU will result in an increase in its allowance for loan losses. The amount of the increase in the allowance for loan losses upon adoption will be dependent upon the characteristics of the portfolio at the adoption date, as well as macroeconomic conditions and forecasts at that date. A cumulative effect adjustment will be made to retained earnings for the impact of the standard at the beginning of the period the standard is adopted.
In March 2017, the FASB issued ASU NO. 2017-07, “Compensation—Retirement Benefits (Topic 715): Improving the Presentation of Net Periodic Pension Cost and Net Periodic Postretirement Benefit Cost,” which requires that employers offering benefit plans accounted for under Topic 715 report the service cost component in the same line item or items as other compensation costs arising from services rendered by the pertinent employees during the period. The other components of net benefit cost are required to be presented in the income statement separately from the service cost component. If a separate line item or items are not used, the line item or items used in the income statement to present the other components of net benefit cost must be disclosed. This ASU is effective for the Company in annual and interim reporting periods beginning after December 15, 2017. The Company does not expect ASU No. 2017-07 to have a material impact on its consolidated financial position, results of operations, or cash flows upon adoption.
In March 2017, the FASB issued ASU No. 2017-08, “Receivables—Nonrefundable Fees and Other Costs (Subtopic 310-20): Premium Amortization on Purchased Callable Debt Securities.” This ASU shortens the amortization period for certain callable debt securities held at a premium and requires the premium to be amortized to the earliest call date. The ASU does not change the accounting for securities held at a discount; the discount will continue to be amortized to maturity. This ASU is effective for the Company in annual and interim reporting periods beginning after December 15, 2018, with early adoption permitted. The Company early adopted this standard with no material impact on its consolidated financial position, results of operations, or cash flows.
In February 2018, the FASB issued ASU No. 2018-02, “Income Statement—Reporting Comprehensive Income (Topic 220): Reclassification of Certain Tax Effects from Accumulated Other Comprehensive Income,” which allows entities to reclassify the stranded tax effects caused by the Tax Cuts and Jobs Act (“Tax Act”), which was enacted in December 2017, from accumulated other comprehensive income (“AOCI”) to retained earnings. This ASU will be effective for annual and interim periods beginning after December 15, 2018, with early adoption permitted. The Company early adopted this standard, resulting in the reclassification of $633 thousand from AOCI to retained earnings for the year ended December 31, 2017. There was no impact on total equity. Additional information related to the reclassification can be found in Note 2.
Other accounting standards that have been issued or proposed by the FASB or other standards-setting bodies are not expected to have a material impact on the Company’s financial position, results of operations or cash flows.
2. Accumulated Other Comprehensive Income
The following table presents changes in AOCI by component, net of tax, for the periods indicated. The table also includes a total of $633 thousand reclassified from AOCI to retained earnings related to the adoption of ASU 2018-02. The Tax Act, among other things, reduced the US Federal corporate tax rate from 35% to 21% effective January 1, 2018. As a result, under U.S. GAAP, the Company was required to remeasure its net deferred tax assets at the new tax rate and recognize the adjustment through income tax expense. The adjustment through income tax expense leaves items presented in AOCI, for which the related income tax effects were originally recognized in other comprehensive income, unadjusted for the new tax rate. ASU 2018-02 allows the Company to reclassify the effect of the change in the tax rate from AOCI to retained earnings, which results in AOCI reflecting the new tax rate. Additional information related to the Company’s income tax expense and net deferred tax assets can be found in Note 10.
|
Year Ended December 31, |
2017 |
2016 |
||||||||||||||||||||||
|
(In thousands) |
Unrealized Gains and Losses on Available for Sale Investment Securities |
Postretirement Benefit Obligation |
Total |
Unrealized Gains and Losses on Available for Sale Investment Securities |
Postretirement Benefit Obligation |
Total |
||||||||||||||||||
|
Beginning balance |
$ | (3,363 | ) | $ | (45 | ) | $ | (3,408 | ) | $ | 3,219 | $ | (437 | ) | $ | 2,782 | ||||||||
|
Other comprehensive income (loss) before reclassifications |
489 | (53 | ) | 436 | (3,983 | ) | 356 | (3,627 | ) | |||||||||||||||
|
Amounts reclassified from accumulated other comprehensive income |
(13 | ) | 52 | 39 | (2,599 | ) | 36 | (2,563 | ) | |||||||||||||||
|
Net current-period other comprehensive income (loss) |
$ | 476 | $ | (1 | ) | $ | 475 | $ | (6,582 | ) | $ | 392 | $ | (6,190 | ) | |||||||||
|
Adoption of Accounting Standards Update 2018-02 |
(623 | ) | (10 | ) | (633 | ) | - | - | - | |||||||||||||||
|
Ending balance |
$ | (3,510 | ) | $ | (56 | ) | $ | (3,566 | ) | $ | (3,363 | ) | $ | (45 | ) | $ | (3,408 | ) | ||||||
The following table presents amounts reclassified out of accumulated other comprehensive income by component for the period indicated. Line items in the statement of income affected by the reclassification are also presented.
|
(In thousands) |
Amount Reclassified from Accumulated Other Comprehensive Income |
Affected Line Item in the Statement Where Net Income is Presented |
|||||||||||
|
Year Ended December 31, |
2017 |
2016 |
2015 |
||||||||||
|
Unrealized gains on available for sale investment securities |
$ | 20 | $ | 3,998 | $ | 171 |
Net gain on sales of available for sale investment securities |
||||||
| (7 | ) | (1,399 | ) | (60 | ) |
Income tax expense |
|||||||
| $ | 13 | $ | 2,599 | $ | 111 |
Net of tax |
|||||||
|
Amortization related to postretirement benefits |
|||||||||||||
|
Prior service costs |
$ | (75 | ) | $ | (50 | ) | $ | (51 | ) |
Salaries and employee benefits |
|||
|
Actuarial losses |
(5 | ) | (5 | ) | (42 | ) |
Salaries and employee benefits |
||||||
| (80 | ) | (55 | ) | (93 | ) |
Total before tax |
|||||||
| 28 | 19 | 33 |
Income tax expense |
||||||||||
| $ | (52 | ) | $ | (36 | ) | $ | (60 | ) |
Net of tax |
||||
|
Total reclassifications for the period |
$ | (39 | ) | $ | 2,563 | $ | 51 |
Net of tax |
|||||
3. Investment Securities
The following tables summarize the amortized cost and estimated fair values of the securities portfolio at December 31, 2017 and 2016.
|
December 31, 2017 (In thousands) |
Amortized |
Gross Unrealized |
Gross Unrealized |
Estimated |
||||||||||||
|
Available For Sale |
||||||||||||||||
|
Obligations of U.S. government-sponsored entities |
$ | 43,601 | $ | 44 | $ | 437 | $ | 43,208 | ||||||||
|
Obligations of states and political subdivisions |
114,960 | 562 | 1,273 | 114,249 | ||||||||||||
|
Mortgage-backed securities – residential |
195,605 | 523 | 2,735 | 193,393 | ||||||||||||
|
Mortgage-backed securities – commercial |
50,518 | 42 | 1,208 | 49,352 | ||||||||||||
|
Asset-backed securities |
15,569 | 9 | 4 | 15,574 | ||||||||||||
|
Corporate debt securities |
7,578 | 1 | 37 | 7,542 | ||||||||||||
|
Mutual funds and equity securities |
864 | 71 | - | 935 | ||||||||||||
|
Total securities – available for sale |
$ | 428,695 | $ | 1,252 | $ | 5,694 | $ | 424,253 | ||||||||
|
Held To Maturity |
||||||||||||||||
|
Obligations of states and political subdivisions |
$ | 3,364 | $ | 114 | $ | - | $ | 3,478 | ||||||||
|
December 31, 2016 (In thousands) |
Amortized |
Gross Unrealized |
Gross Unrealized |
Estimated |
||||||||||||
|
Available For Sale |
||||||||||||||||
|
Obligations of U.S. government-sponsored entities |
$ | 71,941 | $ | 213 | $ | 460 | $ | 71,694 | ||||||||
|
Obligations of states and political subdivisions |
134,055 | 773 | 2,536 | 132,292 | ||||||||||||
|
Mortgage-backed securities – residential |
225,489 | 1,505 | 2,687 | 224,307 | ||||||||||||
|
Mortgage-backed securities – commercial |
47,164 | 6 | 1,557 | 45,613 | ||||||||||||
|
Corporate debt securities |
6,565 | 1 | 441 | 6,125 | ||||||||||||
|
Mutual funds and equity securities |
824 | 20 | 11 | 833 | ||||||||||||
|
Total securities – available for sale |
$ | 486,038 | $ | 2,518 | $ | 7,692 | $ | 480,864 | ||||||||
|
Held To Maturity |
||||||||||||||||
|
Obligations of states and political subdivisions |
$ | 3,488 | $ | 109 | $ | - | $ | 3,597 | ||||||||
Investment securities with a carrying value of $214 million and $191 million at December 31, 2017 and 2016, respectively, were pledged to secure public and trust deposits, repurchase agreements, and for other purposes.
At year-end 2017 and 2016, the Company held no investment securities of any single issuer, other than the U.S. Government and its agencies, in an amount greater than 10% of shareholders’ equity.
The amortized cost and estimated fair value of the debt securities portfolio at December 31, 2017, by contractual maturity, are detailed below. Expected maturities may differ from contractual maturities because issuers may have the right to call or prepay obligations with or without call or prepayment penalties. Mutual funds and equity securities in the available for sale portfolio at December 31, 2017 consist of investments by the Company’s captive insurance subsidiary. These securities have no stated maturity and are not included in the maturity schedule that follows.
Mortgage-backed securities are stated separately due to the nature of payment and prepayment characteristics of these securities, as principal is not due at a single date.
|
Available For Sale |
Held To Maturity |
|||||||||||||||
|
December 31, 2017 (In thousands) |
Amortized |
Estimated |
Amortized |
Estimated |
||||||||||||
|
Due in one year or less |
$ | 27,301 | $ | 27,276 | $ | - | $ | - | ||||||||
|
Due after one year through five years |
50,953 | 50,676 | - | - | ||||||||||||
|
Due after five years through ten years |
63,345 | 62,451 | 1,232 | 1,322 | ||||||||||||
|
Due after ten years |
40,109 | 40,170 | 2,132 | 2,156 | ||||||||||||
|
Mortgage-backed securities |
246,123 | 242,745 | - | - | ||||||||||||
|
Total |
$ | 427,831 | $ | 423,318 | $ | 3,364 | $ | 3,478 | ||||||||
Gross realized gains and losses on the sale of available for sale investment securities were as follows for the year indicated.
|
(In thousands) |
2017 |
2016 |
2015 |
|||||||||
|
Gross realized gains |
$ | 501 | $ | 4,191 | $ | 224 | ||||||
|
Gross realized losses |
481 | 193 | 53 | |||||||||
|
Net realized gain |
$ | 20 | $ | 3,998 | $ | 171 | ||||||
|
Income tax provision related to net realized gain |
$ | 7 | $ | 1,399 | $ | 60 | ||||||
Investment securities with unrealized losses at year-end 2017 and 2016 not recognized in income are presented in the tables below. The tables segregate investment securities that have been in a continuous unrealized loss position for less than twelve months from those that have been in a continuous unrealized loss position for twelve months or more. The table also includes the fair value of the related securities.
|
Less than 12 Months |
12 Months or More |
Total |
||||||||||||||||||||||
|
December 31, 2017 (In thousands) |
Fair Value |
Unrealized Losses |
Fair Value |
Unrealized Losses |
Fair Value |
Unrealized Losses |
||||||||||||||||||
|
Obligations of U.S. government-sponsored entities |
$ | 11,544 | $ | 43 | $ | 25,298 | $ | 394 | $ | 36,842 | $ | 437 | ||||||||||||
|
Obligations of states and political subdivisions |
40,402 | 413 | 33,965 | 860 | 74,367 | 1,273 | ||||||||||||||||||
|
Mortgage-backed securities – residential |
77,312 | 481 | 99,986 | 2,254 | 177,298 | 2,735 | ||||||||||||||||||
|
Mortgage-backed securities – commercial |
7,758 | 62 | 34,139 | 1,146 | 41,897 | 1,208 | ||||||||||||||||||
|
Asset-backed securities |
1,166 | 4 | - | - | 1,166 | 4 | ||||||||||||||||||
|
Corporate debt securities |
7,251 | 36 | 200 | 1 | 7,451 | 37 | ||||||||||||||||||
|
Total |
$ | 145,433 | $ | 1,039 | $ | 193,588 | $ | 4,655 | $ | 339,021 | $ | 5,694 | ||||||||||||
|
Less than 12 Months |
12 Months or More |
Total |
||||||||||||||||||||||
|
December 31, 2016 (In thousands) |
Fair Value |
Unrealized Losses |
Fair Value |
Unrealized Losses |
Fair Value |
Unrealized Losses |
||||||||||||||||||
|
Obligations of U.S. government-sponsored entities |
$ | 51,657 | $ | 460 | $ | - | $ | - | $ | 51,657 | $ | 460 | ||||||||||||
|
Obligations of states and political subdivisions |
91,728 | 2,526 | 1,999 | 10 | 93,727 | 2,536 | ||||||||||||||||||
|
Mortgage-backed securities – residential |
154,397 | 2,485 | 5,841 | 202 | 160,238 | 2,687 | ||||||||||||||||||
|
Mortgage-backed securities – commercial |
43,309 | 1,557 | - | - | 43,309 | 1,557 | ||||||||||||||||||
|
Corporate debt securities |
536 | 6 | 5,476 | 435 | 6,012 | 441 | ||||||||||||||||||
|
Mutual funds and equity securities |
128 | 2 | 113 | 9 | 241 | 11 | ||||||||||||||||||
|
Total |
$ | 341,755 | $ | 7,036 | $ | 13,429 | $ | 656 | $ | 355,184 | $ | 7,692 | ||||||||||||
Unrealized losses included in the tables above have not been recognized in income since they have been identified as temporary. The Company attributes the unrealized losses in its investment securities portfolio to changes in market interest rates and volatility. Investment securities with unrealized losses at December 31, 2017 are performing according to their contractual terms, and the Company does not expect to incur a loss on these securities unless they are sold prior to maturity. The Company does not have the intent to sell these securities nor does it believe it is likely that it will be required to sell these securities prior to their anticipated recovery. The Company does not consider any of the securities to be impaired due to reasons of credit quality or other factors.
4. Loans and Allowance for Loan Losses
Major classifications of loans are summarized in the following table.
|
December 31, (In thousands) |
2017 |
2016 |
||||||
|
Real Estate |
||||||||
|
Real estate mortgage – construction and land development |
$ | 129,181 | $ | 120,230 | ||||
|
Real estate mortgage – residential |
355,304 | 350,295 | ||||||
|
Real estate mortgage – farmland and other commercial enterprises |
432,321 | 400,367 | ||||||
|
Commercial |
||||||||
|
Commercial and industrial |
63,417 | 48,607 | ||||||
|
States and political subdivisions |
27,209 | 18,933 | ||||||
|
Other |
19,916 | 23,308 | ||||||
|
Consumer |
||||||||
|
Secured |
4,853 | 4,554 | ||||||
|
Unsecured |
3,062 | 4,681 | ||||||
|
Total loans |
1,035,263 | 970,975 | ||||||
|
Less unearned income |
- | - | ||||||
|
Total loans, net of unearned income |
$ | 1,035,263 | $ | 970,975 | ||||
From time to time the Company may purchase a limited amount of loans originated by otherwise nonaffiliated third parties. The Company performs its own risk assessment and makes the credit decision on each loan prior to purchase. The Company purchased smaller balance commercial loans totaling $2.8 million and $2.5 million in the aggregate during 2017 and 2016, respectively. The average individual balance of the purchased loans was $123 thousand for 2017 and $120 thousand for 2016.
Loans to directors, executive officers, and principal shareholders of the Company and its subsidiaries (including loans to affiliated companies of which they are principal owners) and loans to members of the immediate family of such persons were $13.1 million at December 31, 2017. Such loans were made in the normal course of business on substantially the same terms, including interest rates and collateral, as those prevailing at the time for comparable transactions with other customers and did not involve more than the normal risk of collectability. An analysis of the activity with respect to these loans is presented in the table below.
|
(In thousands) |
Amount |
|||
|
Balance at December 31, 2016 |
$ | 13,499 | ||
|
New loans |
11,549 | |||
|
Repayments |
(5,693 | ) | ||
|
Loans no longer meeting disclosure requirements, new loans meeting disclosure requirements, and other adjustments, net |
(6,231 | ) | ||
|
Balance at December 31, 2017 |
$ | 13,124 | ||
Activity in the allowance for loan losses by portfolio segment was as follows for each of the three years in the period ended December 31, 2017:
|
(In thousands) |
Real Estate |
Commercial |
Consumer |
Total |
||||||||||||
|
2017 |
||||||||||||||||
|
Balance at beginning of period |
$ | 8,205 | $ | 854 | $ | 285 | $ | 9,344 | ||||||||
|
Provision for loan losses |
(537 | ) | 237 | 89 | (211 | ) | ||||||||||
|
Recoveries |
1,386 | 139 | 55 | 1,580 | ||||||||||||
|
Loans charged off |
(545 | ) | (279 | ) | (106 | ) | (930 | ) | ||||||||
|
Balance at end of period |
$ | 8,509 | $ | 951 | $ | 323 | $ | 9,783 | ||||||||
|
2016 |
||||||||||||||||
|
Balance at beginning of period |
$ | 9,173 | $ | 820 | $ | 322 | $ | 10,315 | ||||||||
|
Provision for loan losses |
(702 | ) | 50 | 8 | (644 | ) | ||||||||||
|
Recoveries |
141 | 203 | 69 | 413 | ||||||||||||
|
Loans charged off |
(407 | ) | (219 | ) | (114 | ) | (740 | ) | ||||||||
|
Balance at end of period |
$ | 8,205 | $ | 854 | $ | 285 | $ | 9,344 | ||||||||
|
2015 |
||||||||||||||||
|
Balance at beginning of period |
$ | 12,542 | $ | 1,153 | $ | 273 | $ | 13,968 | ||||||||
|
Provision for loan losses |
(3,099 | ) | (449 | ) | 119 | (3,429 | ) | |||||||||
|
Recoveries |
463 | 210 | 112 | 785 | ||||||||||||
|
Loans charged off |
(733 | ) | (94 | ) | (182 | ) | (1,009 | ) | ||||||||
|
Balance at end of period |
$ | 9,173 | $ | 820 | $ | 322 | $ | 10,315 | ||||||||
The following tables present individually impaired loans by class of loans for the dates indicated.
|
As of and for the Year Ended December 31, 2017 |
Unpaid Principal Balance |
Recorded Investment With No Allowance |
Recorded Investment With Allowance |
Total Recorded Investment |
Allowance for |
Average |
Interest Income Recognized |
Cash Basis Interest Recognized |
||||||||||||||||||||||||
|
Real Estate |
||||||||||||||||||||||||||||||||
|
Real estate mortgage – construction and land development |
$ | 4,076 | $ | 1,746 | $ | 1,955 | $ | 3,701 | $ | 402 | $ | 5,124 | $ | 239 | $ | 239 | ||||||||||||||||
|
Real estate mortgage – residential |
10,112 | 3,233 | 6,877 | 10,110 | 1,973 | 10,337 | 525 | 521 | ||||||||||||||||||||||||
|
Real estate mortgage – farmland and other commercial enterprises |
8,737 | 2,203 | 6,367 | 8,570 | 319 | 19,139 | 917 | 908 | ||||||||||||||||||||||||
|
Commercial |
||||||||||||||||||||||||||||||||
|
Commercial and industrial |
448 | - | 448 | 448 | 270 | 440 | 25 | 25 | ||||||||||||||||||||||||
|
Other |
- | - | - | - | - | 6 | - | - | ||||||||||||||||||||||||
|
Consumer |
||||||||||||||||||||||||||||||||
|
Unsecured |
312 | - | 312 | 312 | 218 | 329 | 17 | 17 | ||||||||||||||||||||||||
|
Total |
$ | 23,685 | $ | 7,182 | $ | 15,959 | $ | 23,141 | $ | 3,182 | $ | 35,375 | $ | 1,723 | $ | 1,710 | ||||||||||||||||
|
As of and for the Year Ended December 31, 2016 |
Unpaid Principal Balance |
Recorded Investment With No Allowance |
Recorded Investment With Allowance |
Total Recorded Investment |
Allowance for |
Average |
Interest Income Recognized |
Cash Basis Interest Recognized |
||||||||||||||||||||||||
|
Real Estate |
||||||||||||||||||||||||||||||||
|
Real estate mortgage – construction and land development |
$ | 9,076 | $ | 2,599 | $ | 3,800 | $ | 6,399 | $ | 759 | $ | 7,706 | $ | 310 | $ | 298 | ||||||||||||||||
|
Real estate mortgage – residential |
9,930 | 4,388 | 5,590 | 9,978 | 1,503 | 9,146 | 491 | 465 | ||||||||||||||||||||||||
|
Real estate mortgage – farmland and other commercial enterprises |
25,045 | 9,699 | 15,235 | 24,934 | 304 | 25,557 | 1,197 | 1,153 | ||||||||||||||||||||||||
|
Commercial |
||||||||||||||||||||||||||||||||
|
Commercial and industrial |
435 | 20 | 418 | 438 | 236 | 419 | 23 | 21 | ||||||||||||||||||||||||
|
Consumer |
||||||||||||||||||||||||||||||||
|
Unsecured |
146 | - | 146 | 146 | 146 | 151 | 7 | 6 | ||||||||||||||||||||||||
|
Total |
$ | 44,632 | $ | 16,706 | $ | 25,189 | $ | 41,895 | $ | 2,948 | $ | 42,979 | $ | 2,028 | $ | 1,943 | ||||||||||||||||
|
Year Ended December 31, 2015 |
Average |
Interest Income Recognized |
Cash Basis Interest Recognized |
|||||||||
|
Real Estate |
||||||||||||
|
Real estate mortgage – construction and land development |
$ | 9,409 | $ | 343 | $ | 337 | ||||||
|
Real estate mortgage – residential |
9,810 | 448 | 438 | |||||||||
|
Real estate mortgage – farmland and other commercial enterprises |
22,439 | 890 | 887 | |||||||||
|
Commercial |
||||||||||||
|
Commercial and industrial |
523 | 16 | 16 | |||||||||
|
Consumer |
||||||||||||
|
Unsecured |
127 | 6 | 6 | |||||||||
|
Total |
$ | 42,308 | $ | 1,703 | $ | 1,684 | ||||||
The following tables present the balance of the allowance for loan losses and the recorded investment in loans by portfolio segment based on impairment method as of December 31, 2017 and 2016.
|
December 31, 2017 (In thousands) |
Real Estate |
Commercial |
Consumer |
Total |
||||||||||||
|
Allowance for Loan Losses |
||||||||||||||||
|
Ending allowance balance attributable to loans: |
||||||||||||||||
|
Individually evaluated for impairment |
$ | 2,694 | $ | 270 | $ | 218 | $ | 3,182 | ||||||||
|
Collectively evaluated for impairment |
5,815 | 681 | 105 | 6,601 | ||||||||||||
|
Total ending allowance balance |
$ | 8,509 | $ | 951 | $ | 323 | $ | 9,783 | ||||||||
|
Loans |
||||||||||||||||
|
Loans individually evaluated for impairment |
$ | 22,381 | $ | 448 | $ | 312 | $ | 23,141 | ||||||||
|
Loans collectively evaluated for impairment |
894,425 | 110,094 | 7,603 | 1,012,122 | ||||||||||||
|
Total ending loan balance, net of unearned income |
$ | 916,806 | $ | 110,542 | $ | 7,915 | $ | 1,035,263 | ||||||||
|
December 31, 2016 (In thousands) |
Real Estate |
Commercial |
Consumer |
Total |
||||||||||||
|
Allowance for Loan Losses |
||||||||||||||||
|
Ending allowance balance attributable to loans: |
||||||||||||||||
|
Individually evaluated for impairment |
$ | 2,566 | $ | 236 | $ | 146 | $ | 2,948 | ||||||||
|
Collectively evaluated for impairment |
5,639 | 618 | 139 | 6,396 | ||||||||||||
|
Total ending allowance balance |
$ | 8,205 | $ | 854 | $ | 285 | $ | 9,344 | ||||||||
|
Loans |
||||||||||||||||
|
Loans individually evaluated for impairment |
$ | 41,311 | $ | 438 | $ | 146 | $ | 41,895 | ||||||||
|
Loans collectively evaluated for impairment |
829,581 | 90,410 | 9,089 | 929,080 | ||||||||||||
|
Total ending loan balance, net of unearned income |
$ | 870,892 | $ | 90,848 | $ | 9,235 | $ | 970,975 | ||||||||
The following tables present the recorded investment in nonperforming loans by class of loans as of December 31, 2017 and 2016.
|
December 31, 2017 (In thousands) |
Nonaccrual |
Restructured Loans |
Loans Past Due 90 Days or More and Still Accruing |
|||||||||
|
Real Estate |
||||||||||||
|
Real estate mortgage – construction and land development |
$ | 151 | $ | 1,955 | $ | - | ||||||
|
Real estate mortgage – residential |
1,763 | 5,326 | - | |||||||||
|
Real estate mortgage – farmland and other commercial enterprises |
1,752 | 3,703 | - | |||||||||
|
Commercial |
||||||||||||
|
Commercial and industrial |
53 | 370 | - | |||||||||
|
Consumer |
||||||||||||
|
Unsecured |
168 | 128 | - | |||||||||
|
Total |
$ | 3,887 | $ | 11,482 | $ | - | ||||||
|
December 31, 2016 (In thousands) |
Nonaccrual |
Restructured Loans |
Loans Past Due 90 Days or More and Still Accruing |
|||||||||
|
Real Estate |
||||||||||||
|
Real estate mortgage – construction and land development |
$ | 712 | $ | 3,637 | $ | - | ||||||
|
Real estate mortgage – residential |
2,316 | 4,006 | - | |||||||||
|
Real estate mortgage – farmland and other commercial enterprises |
3,383 | 14,787 | - | |||||||||
|
Commercial |
||||||||||||
|
Commercial and industrial |
- | 377 | - | |||||||||
|
Consumer |
||||||||||||
|
Secured |
4 | - | - | |||||||||
|
Unsecured |
8 | 135 | - | |||||||||
|
Total |
$ | 6,423 | $ | 22,942 | $ | - | ||||||
The Company has allocated $1.8 million and $2.0 million of specific reserves to customers whose loan terms have been modified in troubled debt restructurings and that are in compliance with those terms as of December 31, 2017 and 2016, respectively. The Company had no commitments to lend additional amounts to customers with outstanding loans that are classified as troubled debt restructurings at December 31, 2017 and 2016. There were no loans modified as troubled debt restructurings during 2017 or 2016.
The tables below present an age analysis of loans past due 30 days or more by class of loans as of the dates indicated. Past due loans that are also classified as nonaccrual are included in their respective past due category.
|
December 31, 2017 (In thousands) |
30-89 Days Past Due |
90 Days or More Past Due |
Total |
Current |
Total Loans |
Loans Past Due 90 Days or More and Still Accruing |
Nonaccrual Loans |
|||||||||||||||||||||
|
Real Estate |
||||||||||||||||||||||||||||
|
Real estate mortgage – construction and land development |
$ | 15 | $ | 87 | $ | 102 | $ | 129,079 | $ | 129,181 | $ | - | $ | 151 | ||||||||||||||
|
Real estate mortgage – residential |
1,160 | 538 | 1,698 | 353,606 | 355,304 | - | 1,763 | |||||||||||||||||||||
|
Real estate mortgage – farmland and other commercial enterprises |
966 | 948 | 1,914 | 430,407 | 432,321 | - | 1,752 | |||||||||||||||||||||
|
Commercial |
||||||||||||||||||||||||||||
|
Commercial and industrial |
62 | - | 62 | 63,355 | 63,417 | - | 53 | |||||||||||||||||||||
|
States and political subdivisions |
- | - | - | 27,209 | 27,209 | - | - | |||||||||||||||||||||
|
Other |
21 | - | 21 | 19,895 | 19,916 | - | - | |||||||||||||||||||||
|
Consumer |
||||||||||||||||||||||||||||
|
Secured |
- | - | - | 4,853 | 4,853 | - | - | |||||||||||||||||||||
|
Unsecured |
9 | - | 9 | 3,053 | 3,062 | - | 168 | |||||||||||||||||||||
|
Total |
$ | 2,233 | $ | 1,573 | $ | 3,806 | $ | 1,031,457 | $ | 1,035,263 | $ | - | $ | 3,887 | ||||||||||||||
|
December 31, 2016 (In thousands) |
30-89 Days Past Due |
90 Days or More Past Due |
Total |
Current |
Total Loans |
Loans Past Due 90 Days or More and Still Accruing |
Nonaccrual Loans |
|||||||||||||||||||||
|
Real Estate |
||||||||||||||||||||||||||||
|
Real estate mortgage – construction and land development |
$ | 393 | $ | 227 | $ | 620 | $ | 119,610 | $ | 120,230 | $ | - | $ | 712 | ||||||||||||||
|
Real estate mortgage – residential |
1,935 | 798 | 2,733 | 347,562 | 350,295 | - | 2,316 | |||||||||||||||||||||
|
Real estate mortgage – farmland and other commercial enterprises |
- | 2,483 | 2,483 | 397,884 | 400,367 | - | 3,383 | |||||||||||||||||||||
|
Commercial |
||||||||||||||||||||||||||||
|
Commercial and industrial |
- | - | - | 48,607 | 48,607 | - | - | |||||||||||||||||||||
|
States and political subdivisions |
- | - | - | 18,933 | 18,933 | - | - | |||||||||||||||||||||
|
Other |
24 | - | 24 | 23,284 | 23,308 | - | - | |||||||||||||||||||||
|
Consumer |
||||||||||||||||||||||||||||
|
Secured |
13 | - | 13 | 4,541 | 4,554 | - | 4 | |||||||||||||||||||||
|
Unsecured |
30 | 8 | 38 | 4,643 | 4,681 | - | 8 | |||||||||||||||||||||
|
Total |
$ | 2,395 | $ | 3,516 | $ | 5,911 | $ | 965,064 | $ | 970,975 | $ | - | $ | 6,423 | ||||||||||||||
The Company categorizes loans into risk categories based on relevant information about the ability of borrowers to service their debt such as: current financial information, historical payment experience, credit documentation, public information, and current economic trends and conditions. The Company analyzes loans individually by classifying the loans as to credit risk. This analysis includes large-balance loans and non-homogeneous loans, such as commercial real estate and certain residential real estate loans. Loan rating grades, as described further below, are assigned based on a continuous process. The amount and adequacy of the allowance for loan loss is determined on a quarterly basis. The Company uses the following definitions for its risk ratings:
Special Mention. Loans classified as special mention have a potential weakness that deserves management's close attention. If left uncorrected, these potential weaknesses may result in deterioration of the borrower’s repayment ability, weaken the collateral, or inadequately protect the Company’s credit position at some future date. These credits pose elevated risk, but their weaknesses do not yet justify a substandard classification.
Substandard. Loans classified as substandard are inadequately protected by the current net worth and paying capacity of the obligor or of the collateral pledged, if any. Loans so classified have a well-defined weakness or weaknesses that jeopardize the liquidation of the debt. They are characterized by the distinct possibility that the Company will sustain some loss if the deficiencies are not corrected.
Doubtful. Loans classified as doubtful have all the weaknesses inherent of those classified as substandard, with the added characteristic that the weaknesses make collection or liquidation in full, on the basis of currently existing facts, conditions, and values, highly questionable and improbable.
Loans not meeting the criteria above which are analyzed individually as part of the above described process are considered to be pass rated loans and are considered to have a low risk of loss. Based on the most recent analysis performed, the risk category of loans by class of loans is as follows for the dates indicated.
|
Real Estate |
Commercial |
|||||||||||||||||||||||
|
December 31, 2017 |
Real Estate Mortgage – Construction and Land Development |
Real Estate Mortgage – Residential |
Real Estate Mortgage – Farmland and Other Commercial Enterprises |
Commercial and Industrial |
States and Political Subdivisions |
Other |
||||||||||||||||||
|
Credit risk profile by internally assigned rating grades |
||||||||||||||||||||||||
|
Pass |
$ | 124,926 | $ | 330,401 | $ | 414,663 | $ | 62,490 | $ | 27,209 | $ | 19,898 | ||||||||||||
|
Special Mention |
396 | 9,196 | 7,556 | 474 | - | 18 | ||||||||||||||||||
|
Substandard |
3,859 | 15,707 | 10,102 | 453 | - | - | ||||||||||||||||||
|
Doubtful |
- | - | - | - | - | - | ||||||||||||||||||
|
Total |
$ | 129,181 | $ | 355,304 | $ | 432,321 | $ | 63,417 | $ | 27,209 | $ | 19,916 | ||||||||||||
|
Real Estate |
Commercial |
|||||||||||||||||||||||
|
December 31, 2016 |
Real Estate Mortgage – Construction and Land Development |
Real Estate Mortgage – Residential |
Real Estate Mortgage – Farmland and Other Commercial Enterprises |
Commercial and Industrial |
States and Political Subdivisions |
Other |
||||||||||||||||||
|
Credit risk profile by internally assigned rating grades |
||||||||||||||||||||||||
|
Pass |
$ | 112,435 | $ | 323,300 | $ | 363,448 | $ | 47,254 | $ | 18,933 | $ | 23,308 | ||||||||||||
|
Special Mention |
1,413 | 12,147 | 21,088 | 764 | - | - | ||||||||||||||||||
|
Substandard |
6,382 | 14,806 | 15,831 | 589 | - | - | ||||||||||||||||||
|
Doubtful |
- | 42 | - | - | - | - | ||||||||||||||||||
|
Total |
$ | 120,230 | $ | 350,295 | $ | 400,367 | $ | 48,607 | $ | 18,933 | $ | 23,308 | ||||||||||||
The Company considers the performance of the loan portfolio and its impact on the allowance for loan losses. For consumer loan classes, the Company also evaluates credit quality based on the aging status of the loan, which was previously presented, and by payment activity. The following table presents the consumer loans outstanding based on payment activity as of December 31, 2017 and 2016.
|
December 31, 2017 |
December 31, 2016 |
|||||||||||||||
|
Consumer |
Consumer |
|||||||||||||||
|
(In thousands) |
Secured |
Unsecured |
Secured |
Unsecured |
||||||||||||
|
Credit risk profile based on payment activity |
||||||||||||||||
|
Performing |
$ | 4,853 | $ | 2,766 | $ | 4,550 | $ | 4,538 | ||||||||
|
Nonperforming |
- | 296 | 4 | 143 | ||||||||||||
|
Total |
$ | 4,853 | $ | 3,062 | $ | 4,554 | $ | 4,681 | ||||||||
The Company evaluates the loan risk grading system definitions and allowance for loan loss methodology on an ongoing basis. During the first quarter of 2017, the Company shortened the look-back period it uses to determine historical loss rates to the previous twelve quarters from sixteen quarters. No other significant changes were made to the loan risk grading system definitions or allowance for loan loss methodology during the past year.
5. Premises and Equipment
Premises and equipment consist of the following:
|
December 31, (In thousands) |
2017 |
2016 |
||||||
|
Land, buildings, and leasehold improvements |
$ | 60,980 | $ | 60,399 | ||||
|
Furniture and equipment |
19,020 | 18,188 | ||||||
|
Total premises and equipment |
80,000 | 78,587 | ||||||
|
Less accumulated depreciation and amortization |
49,072 | 46,687 | ||||||
|
Premises and equipment, net |
$ | 30,928 | $ | 31,900 | ||||
Depreciation and amortization of premises and equipment was $3.3 million, $3.4 million, and $3.5 million for 2017, 2016, and 2015, respectively.
6. Other Real Estate Owned
OREO was as follows as of the date indicated:
|
December 31, (In thousands) |
2017 |
2016 |
||||||
|
Construction and land development |
$ | 4,433 | $ | 7,996 | ||||
|
Residential real estate |
157 | 871 | ||||||
|
Farmland and other commercial enterprises |
899 | 1,806 | ||||||
|
Total |
$ | 5,489 | $ | 10,673 | ||||
OREO activity for 2017 and 2016 was as follows:
|
(In thousands) |
2017 |
2016 |
||||||
|
Beginning balance |
$ | 10,673 | $ | 21,843 | ||||
|
Transfers from loans and other increases |
821 | 2,044 | ||||||
|
Proceeds from sales |
(5,419 | ) | (11,289 | ) | ||||
|
Gain (loss) on sales, net |
208 | (473 | ) | |||||
|
Write downs and other decreases, net |
(794 | ) | (1,452 | ) | ||||
|
Ending balance |
$ | 5,489 | $ | 10,673 | ||||
At December 31, 2017, the Company had a total of $886 thousand of loans secured by residential real estate mortgages that were in the process of foreclosure.
7. Deposit Liabilities
Major classifications of deposits are summarized as follows for the dates indicated:
|
December 31, (In thousands) |
2017 |
2016 |
||||||
|
Noninterest Bearing |
$ | 361,855 | $ | 334,676 | ||||
|
Interest Bearing |
||||||||
|
Demand |
379,027 | 348,197 | ||||||
|
Savings |
416,163 | 416,611 | ||||||
|
Time |
222,858 | 270,423 | ||||||
|
Total interest bearing |
1,018,048 | 1,035,231 | ||||||
|
Total Deposits |
$ | 1,379,903 | $ | 1,369,907 | ||||
At December 31, 2017, the scheduled maturities of time deposits were as follows:
|
(In thousands) |
Amount |
|||
|
2018 |
$ | 143,185 | ||
|
2019 |
37,422 | |||
|
2020 |
19,626 | |||
|
2021 |
12,887 | |||
|
2022 |
4,328 | |||
|
Thereafter |
5,410 | |||
|
Total |
$ | 222,858 | ||
Time deposits that meet or exceed the Federal Deposit Insurance Corporation (“FDIC”) limit of $250 thousand were $14.8 million and $18.6 million at December 31, 2017 and 2016, respectively.
Deposits from directors, executive officers, and principal shareholders of the Parent Company and its subsidiaries (including deposits from affiliated companies of which they are principal owners) and deposits from members of the immediate family of such persons were $19.3 million and $28.6 million at December 31, 2017 and 2016, respectively. Such deposits were accepted in the normal course of business on substantially the same terms as those prevailing at the time for comparable transactions with other customers.
8. Securities Sold Under Agreements to Repurchase
Securities sold under agreements to repurchase represent transactions where the Company sells certain of its investment securities and agrees to repurchase them at a specific date in the future. Securities sold under agreements to repurchase are accounted for as secured borrowings and reflect the amount of cash received in connection with the transaction. Information on securities sold under agreements to repurchase is as follows:
|
December 31, (Dollars in thousands) |
2017 |
2016 |
||||||
|
Securities sold under agreements to repurchase |
||||||||
|
Amount outstanding at year-end |
$ | 34,252 | $ | 36,370 | ||||
|
Average balance during the year |
35,063 | 107,179 | ||||||
|
Maximum month-end balance during the year |
38,079 | 140,218 | ||||||
|
Average interest rate during the year |
.22 | % | 2.74 | % | ||||
|
Average interest rate at year-end |
.22 | .36 | ||||||
Securities sold under agreements to repurchase are collateralized by U.S. government agency securities, primarily mortgage-backed securities. The Company may be required to provide additional collateral securing the borrowings in the event of principal pay downs or a decrease in the market value of the pledged securities. The Company mitigates this risk by monitoring the market value and liquidity of the collateral and ensuring that it holds a sufficient level of eligible securities to cover potential increases in collateral requirements.
The following table represents the remaining maturity of repurchase agreements disaggregated by the class of securities pledged as of the dates indicated.
|
Remaining Contractual Maturity of the Agreements |
||||||||||||||||||||||||
|
December 31, 2017 (In thousands) |
Overnight/ |
Less Than 30 Days |
30-89 |
90 Days to One Year |
Over One Year to Three Years |
Total |
||||||||||||||||||
|
Mortgage-backed securities – residential |
$ | 32,341 | $ | 1,200 | $ | - | $ | 454 | $ | 257 | $ | 34,252 | ||||||||||||
|
Total |
$ | 32,341 | $ | 1,200 | $ | - | $ | 454 | $ | 257 | $ | 34,252 | ||||||||||||
|
Remaining Contractual Maturity of the Agreements |
||||||||||||||||||||||||
|
December 31, 2016 (In thousands) |
Overnight/ |
Less Than 30 Days |
30-89 |
90 Days to One Year |
Over One Year to Three Years |
Total |
||||||||||||||||||
|
Obligations of U.S. government-sponsored entities |
$ | 5,596 | $ | 301 | $ | - | $ | 258 | $ | 1,027 | $ | 7,182 | ||||||||||||
|
Mortgage-backed securities – residential |
28,086 | 902 | - | 200 | - | 29,188 | ||||||||||||||||||
|
Total |
$ | 33,682 | $ | 1,203 | $ | - | $ | 458 | $ | 1,027 | $ | 36,370 | ||||||||||||
The Company entered into a balance sheet leverage transaction in 2007 whereby it borrowed $200 million in multiple fixed rate term repurchase agreements with an initial weighted average cost of 3.95% and invested the proceeds in Government National Mortgage Association (“GNMA”) bonds, which were pledged as collateral. During September 2016, the Company prepaid the remaining balance of $100 million on the repurchase agreements, which were due to mature in November 2017.
9. Other Borrowings
Other borrowings consist of long-term FHLB advances and subordinated notes payable to the Company’s unconsolidated trusts. The table below displays a summary of the ending balance and average rate for such borrowed funds on the dates indicated.
|
Average |
Average |
|||||||||||||||
|
December 31, (Dollars in thousands) |
2017 |
Rate |
2016 |
Rate |
||||||||||||
|
Federal Home Loan Bank advances |
$ | 3,479 | 3.27 | % | $ | 18,646 | 3.97 | % | ||||||||
|
Subordinated notes payable |
33,506 | 2.85 | 33,506 | 2.30 | ||||||||||||
|
Total FHLB advances and subordinated notes payable |
$ | 36,985 | 2.89 | % | $ | 52,152 | 2.89 | % | ||||||||
At times the Company’s short-term borrowings include federal funds purchased and FHLB advances. At year-end 2017 and 2016, short-term borrowings consist entirely of securities sold under agreements to repurchase which are discussed further in Note 8.
FHLB advances are made pursuant to several different credit programs, which have their own interest rates and range of maturities. At December 31, 2017, interest rates on all FHLB advances are fixed and range between 2.99% and 5.81%, averaging 3.27% over a remaining weighted average maturity period of 0.9 years. At December 31, 2016, interest rates on FHLB advances ranged between 2.99% and 5.81%, averaging 3.97% over a remaining weighted average maturity period of 0.8 years. Long-term FHLB borrowings of $3.0 million and $18.0 million at year-end 2017 and 2016, respectively, were callable quarterly. None of the long-term FHLB advances are convertible to a floating interest rate.
For FHLB advances, the Company pledges FHLB stock and certain qualifying mortgage loans as collateral. Pledged loans consist primarily of fully disbursed, otherwise unencumbered, 1-4 family first mortgage loans. Based on this collateral and the Company’s holdings of FHLB stock, the Company is eligible to borrow up to an additional $135 million from the FHLB at year-end 2017.
Loans with a carrying value of $612 million and $416 million at December 31, 2017 and December 31, 2016, respectively, were pledged to secure borrowings and lines of credit. Such borrowings primarily include FHLB advances and short-term borrowing arrangements with the Federal Reserve.
During 2005, the Company completed two private offerings of trust preferred securities through two separate Delaware statutory trusts sponsored by the Company. Farmers Capital Bank Trust I (“Trust I”) sold $10.0 million of preferred securities and Farmers Capital Bank Trust II (“Trust II”) sold $15.0 million of preferred securities. The proceeds from the offerings were used to fund the cash portion of the acquisition of Citizens Bancorp, Inc., the former parent company of Citizens Northern. The preferred securities issued by Trust I mature September 30, 2035 and are redeemable at any time by the Trust at par.
In January 2016, the Company terminated Trust II as a result of the early extinguishment of debt issued to the trust and recorded a pretax gain of $4.1 million. The Company became aware that all $15 million of the trust preferred securities issued by Trust II would be auctioned off as part of the liquidation of a larger pooled collateralized debt obligation. The Company placed a bid of $11.0 million for the securities, which was accepted by the trustee. The Company then canceled the preferred and common securities issued by the trust and extinguished the debentures, which totaled $15.5 million.
Farmers Capital Bank Trust III (“Trust III”), a Delaware statutory trust sponsored by the Company, was formed during 2007. Trust III sold $22.5 million of preferred securities for the purpose of financing the cost of acquiring Company shares under a share repurchase program. The preferred securities mature on November 1, 2037 and are redeemable at any time by the Trust at par. Trust I and Trust III are hereafter collectively referred to as the “Trusts.”
The Trusts used the proceeds from the sale of preferred securities, plus capital contributed to establish the trusts, to purchase the Company’s subordinated notes in amounts and bearing terms that parallel the amounts and terms of the respective preferred securities. The subordinated notes to Trust I and Trust III mature in 2035 and 2037, respectively, and bear a floating interest rate (current three-month LIBOR plus 150 basis points in the case of the notes held by Trust I and current three-month LIBOR plus 132 basis points in the case of the notes held by Trust III). Interest on the notes is payable quarterly. Interest payments to the Trusts and distributions to preferred shareholders by the Trusts may be deferred for 20 consecutive quarterly periods. There have been no deferrals of interest payments during the life of the Trusts.
The subordinated notes are redeemable in whole or in part, without penalty, at the Company’s option. The notes are junior in right of payment of all present and future senior indebtedness. At December 31, 2017 and 2016 the balance of the subordinated notes payable to Trust I and Trust III was $10.3 million and $23.2 million, respectively. The interest rates in effect as of the last determination date for 2017 were 3.19% and 2.70% for Trust I and Trust III, respectively. For 2016 these rates were 2.50% and 2.21% for Trust I and Trust III, respectively.
The Company is not considered the primary beneficiary of the Trusts; therefore the Trusts are not consolidated into its financial statements. Accordingly, the Company does not report the securities issued by the Trusts as liabilities, but instead reports as liabilities the subordinated notes issued by the Company and held by the Trusts. The Company, which owns all of the common securities of the Trusts, accounts for its investment in each of the Trusts as other assets. The Company records interest expense on the corresponding notes issued to the Trusts on its statements of income.
The subordinated notes, net of the Company’s investment in the Trusts, may be included in Tier 1 capital (with certain limitations applicable) under current regulatory capital guidelines and interpretations. The net amount of subordinated notes in excess of the limit may be included in Tier 2 capital, subject to restrictions. At year-end 2017and 2016, the Company’s Tier 1 capital included $32.5 million, which represents the full amount of the subordinated notes net of the Company’s investment in the Trusts at those dates.
Maturities of FHLB advances and subordinated notes payable at December 31, 2017 are as follows:
|
(In thousands) |
Amount |
|||
|
2018 |
$ | 3,000 | ||
|
2019 |
5 | |||
|
2020 |
474 | |||
|
2021 |
- | |||
|
2022 |
- | |||
|
Thereafter |
33,506 | |||
|
Total |
$ | 36,985 | ||
10. Income Taxes
The components of income tax expense from operations are as follows:
|
December 31, (In thousands) |
2017 |
2016 |
2015 |
|||||||||
|
Currently payable |
$ | 6,502 | $ | 5,556 | $ | 3,662 | ||||||
|
Revaluation of deferred income taxes resulting from change in statutory tax rates |
5,869 | - | - | |||||||||
|
Deferred |
270 | 885 | 1,631 | |||||||||
|
Total income tax expense |
$ | 12,641 | $ | 6,441 | $ | 5,293 | ||||||
An analysis of the difference between the effective income tax rates and the statutory federal income tax rate follows.
|
December 31, |
2017 |
2016 |
2015 |
|||||||||
|
Federal statutory rate |
35.0 | % | 35.0 | % | 35.0 | % | ||||||
|
Changes from statutory rates resulting from: |
||||||||||||
|
Revaluation of deferred income taxes resulting from changes in statutory tax rates |
24.1 | - | - | |||||||||
|
Tax-exempt interest |
(4.1 | ) | (4.6 | ) | (5.8 | ) | ||||||
|
Nondeductible interest to carry tax-exempt obligations |
.1 | .2 | .2 | |||||||||
|
Premium income not subject to tax |
(1.4 | ) | (1.3 | ) | (1.5 | ) | ||||||
|
Company-owned life insurance |
(1.6 | ) | (1.5 | ) | (1.6 | ) | ||||||
|
Other, net |
(.1 | ) | .1 | (.2 | ) | |||||||
|
Effective tax rate on pretax income |
52.0 | % | 27.9 | % | 26.1 | % | ||||||
The tax effects of the significant temporary differences that comprise deferred tax assets and liabilities at December 31, 2017 and 2016 are as follows:
|
December 31, (In thousands) |
2017 |
2016 |
||||||
|
Assets |
||||||||
|
Allowance for loan losses |
$ | 2,058 | $ | 3,285 | ||||
|
Deferred compensation |
135 | 236 | ||||||
|
Postretirement benefit obligations |
3,605 | 5,825 | ||||||
|
Other real estate owned |
621 | 1,303 | ||||||
|
Self-funded insurance |
114 | 232 | ||||||
|
Paid time off |
472 | 815 | ||||||
|
Depreciation |
1,059 | 1,630 | ||||||
|
Intangibles |
806 | 1,878 | ||||||
|
Unrealized loss on available for sale investment securities, net |
933 | 1,811 | ||||||
|
Other |
147 | 239 | ||||||
|
Total deferred tax assets |
9,950 | 17,254 | ||||||
|
Liabilities |
||||||||
|
Prepaid expenses |
- | 153 | ||||||
|
Federal Home Loan Bank stock dividends |
621 | 1,035 | ||||||
|
Deferred loan fees |
523 | 846 | ||||||
|
Other |
31 | 52 | ||||||
|
Total deferred tax liabilities |
1,175 | 2,086 | ||||||
|
Net deferred tax asset |
$ | 8,775 | $ | 15,168 | ||||
The Tax Cuts and Jobs Act ("Tax Act") was enacted on December 22, 2017. Among other changes, the Tax Act reduces the US Federal corporate tax rate from 35% to 21%. At December 31, 2017, the Company has substantially completed its accounting for the tax effects of enactment of the Tax Act. For deferred tax assets and liabilities, amounts were remeasured based on the rates expected to reverse in the future, which is now 21%. The Company continues to analyze certain aspects of the Tax Act and further refinements are possible, which could potentially affect the measurement of these balances or potentially give rise to new deferred tax amounts, although management does not expect these adjustments to materially impact the financial statements.
In assessing the realizability of deferred tax assets, management considers whether it is more likely than not that some portion or all of the deferred tax assets will not be realized. The ultimate realization of deferred tax assets is dependent upon the generation of future taxable income during the periods in which those temporary differences become deductible. Management considers the scheduled reversal of deferred tax liabilities, projected future taxable income, and tax planning strategies in making this assessment. Based upon the level of historical taxable income and projections for future taxable income over the periods in which the deferred tax assets are deductible, management believes it is more likely than not the Company will realize the benefits of these deductible differences at December 31, 2017.
The Company had no unrecognized tax benefits at year-end 2017, 2016, and 2015 and did not recognize any increase in unrecognized benefits during 2017 relative to any tax position taken in 2017. The Company’s policy is to record the accrual of interest or penalties relative to unrecognized tax benefits, if any, in its income tax expense accounts. There was no amount accrued for interest at December 31, 2017 and 2016. No penalties were accrued or recorded during any year in the three years ended December 31, 2017.
The Company files U.S. federal and various state income tax returns. The Company is no longer subject to income tax examinations by taxing authorities for the years before 2014.
11. Retirement Plans
The Company maintains a salary savings plan that covers substantially all of its employees. In 2017, 2016, and 2015, the Company matched voluntary tax deferred employee contributions at 50% of eligible deferrals up to a maximum of 6% of the participants’ compensation. Effective January 1, 2018, the match will increase to 66.667% applied to eligible contributions that do not exceed 6% of the participants’ compensation with a maximum employer matching contribution of 4%. The Company may, at the discretion of its Board, contribute an additional amount based upon a percentage of covered employees’ salaries. The Company did not make a discretionary contribution during 2017, 2016, or 2015. Discretionary contributions are allocated among participants in the ratio that each participant’s compensation bears to all participants’ compensation.
Eligible employees are presented with numerous investment alternatives related to the salary savings plan. Those alternatives include various stock and bond mutual funds ranging from traditional growth funds to more stable income funds as well as an option to invest in bank certificates of deposits. Company shares are not an available investment alternative in the salary savings plan. Total retirement plan expense for 2017, 2016, and 2015 was $522 thousand, $563 thousand, and $531 thousand, respectively.
In connection with its acquisition of Citizens Bank of Northern Kentucky, Inc., the Company acquired nonqualified supplemental retirement plans for certain key employees. Benefits provided under these plans are unfunded, and payments to plan participants are made by the Company.
The following schedules set forth a reconciliation of the changes in the supplemental retirement plans’ benefit obligation and funded status for the years ended December 31, 2017 and 2016.
|
(In thousands) |
2017 |
2016 |
||||||
|
Change in Benefit Obligation |
||||||||
|
Obligation at beginning of year |
$ | 718 | $ | 600 | ||||
|
Service cost |
22 | 19 | ||||||
|
Interest cost |
23 | 24 | ||||||
|
Actuarial (gain) loss |
(180 | ) | 111 | |||||
|
Benefit payments |
(36 | ) | (36 | ) | ||||
|
Obligation at end of year |
$ | 547 | $ | 718 | ||||
The following table provides disclosure of the net periodic benefit cost as of December 31 for the years indicated.
|
(In thousands) |
2017 |
2016 |
||||||
|
Service cost |
$ | 22 | $ | 19 | ||||
|
Interest cost |
23 | 24 | ||||||
|
Recognized net actuarial loss |
5 | 5 | ||||||
|
Net periodic benefit cost |
$ | 50 | $ | 48 | ||||
|
Major assumptions: |
||||||||
|
Discount rate used to determine net period benefit cost |
3.31 | % | 3.39 | % | ||||
|
Discount rate used to determine benefit obligation at year end |
2.86 | 3.31 | ||||||
|
Rate of compensation increase |
4.00 | 4.00 | ||||||
The following table presents estimated future benefit payments in the period indicated.
|
(In thousands) |
Supplemental Retirement Plan |
|||
|
2018 |
$ | 58 | ||
|
2019 |
60 | |||
|
2020 |
60 | |||
|
2021 |
60 | |||
|
2022 |
56 | |||
| 2023-2027 | 219 | |||
|
Total |
$ | 513 | ||
Amounts recognized in accumulated other comprehensive income as of December 31, 2017 and 2016 are as follows:
|
(In thousands) |
2017 |
2016 |
||||||
|
Unrecognized net actuarial (gain) loss |
$ | (98 | ) | $ | 87 | |||
|
Total |
$ | (98 | ) | $ | 87 | |||
The estimated cost that will be amortized from accumulated other comprehensive income into net periodic benefit cost over the next fiscal year is as follows:
|
(In thousands) |
Supplemental Retirement Plan |
|||
|
Unrecognized net actuarial gain |
$ | (5 | ) | |
|
Total |
$ | (5 | ) | |
12. Common Stock Options
During 1997, the Company’s Board of Directors approved a nonqualified stock option plan (the “Plan”), subsequently approved by the Company’s shareholders, that provided for the granting of stock options to key employees and officers of the Company. The Plan provided for the granting of options to purchase up to 450,000 shares of the Company’s common stock at a price equal to the fair value of the Company’s common stock on the date the option was granted. The options expired after ten years from the grant date and had to be held for a minimum of one year before they could be exercised. Forfeited options were available for the granting of additional stock options under the Plan.
Options forfeited from the initial grant in 1997 were used to grant options during 2000 and 2004. Total options granted were 450,000, 54,000, and 40,049 in the years 1997, 2000, and 2004, respectively. All unexercised options granted under the Plan expired during 2014 and the Company no longer grants options under the Plan. There were no options exercised or granted in any year in the three-year periods ending December 31, 2017, nor were there any modifications or cash paid to settle stock option awards during those periods.
13. Postretirement Medical Benefits
The Company provides lifetime medical and dental benefits upon retirement for certain employees meeting the eligibility requirements as of December 31, 1989 (“Plan 1”). Additional participants are not eligible to be included in Plan 1 unless they met the requirements on this date. During 2003, the Company implemented an additional postretirement health insurance program (“Plan 2”). Under Plan 2, any employee meeting the service requirement of 20 years of full time service to the Company and is at least age 55 upon retirement is eligible to continue their health insurance coverage. Under both plans, retirees not yet eligible for Medicare have coverage identical to the coverage offered to active employees. Under both plans, Medicare-eligible retirees are provided with a Medicare Advantage plan. The Company pays 100% of the cost of Plan 1. The Company and the retirees each pay 50% of the cost under Plan 2. Both plans are unfunded. Employees hired on or after January 1, 2016 are not eligible for benefits under Plan 2. The following schedules set forth a reconciliation of the changes to the benefit obligation and funded status of the plans for the years ended December 31, 2017 and 2016.
In connection with the merger of certain of its subsidiaries in February 2017, the Company recognized a curtailment gain of $417 thousand and prior service costs of $66 thousand, for a net gain of $351 thousand at the time of curtailment. This gain is a result of revaluing its postretirement medical benefits plan liability due to a reduction in workforce during the first quarter of 2017.
|
(In thousands) |
2017 |
2016 |
||||||
|
Change in Benefit Obligation |
||||||||
|
Obligation at beginning of year |
$ | 16,555 | $ | 16,204 | ||||
|
Service cost |
557 | 637 | ||||||
|
Interest cost |
660 | 683 | ||||||
|
Curtailment gain recognized |
(417 | ) | - | |||||
|
Actuarial loss (gain) |
263 | (660 | ) | |||||
|
Participant contributions |
196 | 153 | ||||||
|
Benefit payments |
(550 | ) | (462 | ) | ||||
|
Obligation at end of year |
$ | 17,264 | $ | 16,555 | ||||
The Company’s contributions were $354 thousand and $309 thousand for 2017 and 2016, respectively. The Company expects benefit payments of $459 thousand for 2018. The following table provides disclosure of the net periodic benefit cost as of December 31 for the years indicated.
|
(In thousands) |
2017 |
2016 |
||||||
|
Service cost |
$ | 557 | $ | 637 | ||||
|
Interest cost |
660 | 683 | ||||||
|
Curtailment gain recognized |
(417 | ) | - | |||||
|
Recognized prior service cost |
75 | 50 | ||||||
|
Net periodic benefit cost |
$ | 875 | $ | 1,370 | ||||
|
Major assumptions: |
||||||||
|
Discount rate used to determine net periodic benefit cost |
4.12 | % | 4.34 | % | ||||
|
Discount rate used to determine benefit obligation as of year end |
3.58 | 4.12 | ||||||
|
Retiree participation rate (Plan 1) |
100.00 | 100.00 | ||||||
|
Retiree participation rate (Plan 2) |
72.00 | 72.00 | ||||||
Assumed health care cost trend rates have a significant effect on the amounts reported for the health care plans. For measurement purposes, the rate of increase in pre-Medicare medical care claims costs was 6.5%, 6.0%, and 5.5% for 2018, 2019, and 2020, respectively, then grading down by .25% annually to 4.75% for 2023 and thereafter. For dental claims cost, it was 5% for 2018 and thereafter. A 1% change in the assumed health care cost trend rates would have the following incremental effects:
|
(In thousands) |
1% Increase |
1% Decrease |
||||||
|
Effect on total of service and interest cost components of net periodic postretirement health care benefit cost |
$ | 295 | $ | (247 | ) | |||
|
Effect on accumulated postretirement benefit obligation |
3,530 | (2,733 | ) | |||||
The following table presents estimated future benefit payments in the period indicated.
|
(In thousands) |
Postretirement Medical Benefits |
|||
|
2018 |
$ | 459 | ||
|
2019 |
477 | |||
|
2020 |
508 | |||
|
2021 |
551 | |||
|
2022 |
592 | |||
|
2023-2027 |
3,439 | |||
|
Total |
$ | 6,026 | ||
Amounts recognized in accumulated other comprehensive income as of December 31, 2017 and 2016 are as follows:
|
(In thousands) |
2017 |
2016 |
||||||
|
Unrecognized net actuarial loss (gain) |
$ | 169 | $ | (93 | ) | |||
|
Unrecognized prior service cost |
- | 75 | ||||||
|
Total |
$ | 169 | $ | (18 | ) | |||
There are no estimated costs that will be amortized from accumulated other comprehensive income into net periodic benefit cost over the next fiscal year.
14. Leases
The Company leases certain branch sites and banking equipment under various operating leases. Branch site leases have renewal options of varying lengths and terms. The following table presents estimated future minimum rental commitments under these leases for the period indicated.
|
(In thousands) |
Operating Leases |
|||
|
2018 |
$ | 408 | ||
|
2019 |
343 | |||
|
2020 |
286 | |||
|
2021 |
218 | |||
|
2022 |
80 | |||
|
Thereafter |
498 | |||
|
Total |
$ | 1,833 | ||
Rent expense was $408 thousand, $434 thousand, and $419 thousand for 2017, 2016, and 2015, respectively.
|
15. |
Financial Instruments With Off-Balance Sheet Risk |
The Company is a party to financial instruments with off-balance sheet risk in the normal course of business to meet the financing needs of its customers. The financial instruments include commitments to extend credit in the form of unused lines of credit and standby letters of credit.
These financial instruments involve to varying degrees, elements of credit and interest rate risk in excess of the amount recognized in the consolidated balance sheets. The contract amounts of these instruments reflect the extent of involvement the Company has in particular classes of financial instruments.
Commitments to extend credit are agreements to lend to a customer as long as there is no violation of any condition established in the contract. Commitments generally have fixed expiration dates or other termination clauses and may require the payment of a fee. Since many of the commitments are expected to expire without being drawn upon, the total commitment amount does not necessarily represent future cash requirements. Total commitments to extend credit were $220 million and $188 million at December 31, 2017 and 2016, respectively. The Company evaluates each customer’s creditworthiness on a case-by-case basis. The amount of collateral obtained upon extension of credit, if deemed necessary by the Company, is based on management’s credit evaluation of the counter-party. Collateral held varies, but may include accounts receivable, marketable securities, inventory, premises and equipment, residential real estate, and income producing commercial properties.
Standby letters of credit are conditional commitments issued by the Company to guarantee the performance of a customer to a third party. Since many of the commitments are expected to expire without being drawn upon, the total commitment amount does not necessarily represent future cash requirements. The credit risk involved in issuing letters of credit is essentially the same as that received when extending credit to customers. The fair value of these instruments is not considered material for disclosure. The Company had $2.9 million and $4.1 million in irrevocable letters of credit outstanding at December 31, 2017 and 2016, respectively.
The contractual amount of financial instruments with off-balance sheet risk was as follows at year-end:
|
December 31, |
2017 |
2016 |
||||||||||||||
|
(In thousands) |
Fixed Rate |
Variable Rate |
Fixed Rate |
Variable Rate |
||||||||||||
|
Commitments to extend credit, including unused lines of credit |
$ | 108,269 | $ | 111,603 | $ | 71,369 | $ | 116,926 | ||||||||
|
Standby letters of credit |
1,722 | 1,154 | 2,284 | 1,769 | ||||||||||||
|
Total |
$ | 109,991 | $ | 112,757 | $ | 73,653 | $ | 118,695 | ||||||||
16. Concentration of Credit Risk
The Company’s subsidiary bank actively engages in lending, primarily in its home counties around Central and Northern Kentucky and adjacent areas. Collateral is received to support these loans as deemed necessary. The more significant categories of collateral include cash on deposit with the Company’s bank, marketable securities, income producing properties, commercial real estate, home mortgages, and consumer durables. Loans outstanding, commitments to make loans, and letters of credit range across a large number of industries and individuals. The obligations are significantly diverse and reflect no material concentration in one or more areas, other than most of the Company’s loans are in Kentucky and secured by real estate and thus significantly affected by changes in the Kentucky economy.
|
17. |
Loss Contingencies |
Loss contingencies, including claims and legal actions arising in the ordinary course of business, are recorded as liabilities when the likelihood of loss is probable and an amount or range of loss can be reasonably estimated. As of December 31, 2017, there were various pending legal actions and proceedings against the Company arising from the normal course of business and in which claims for damages are asserted. It is the opinion of management, after discussion with legal counsel, that the disposition or ultimate resolution of such claims and legal actions will not have a material effect upon the consolidated financial statements of the Company.
|
18. |
Regulatory Matters |
The Company and United Bank are subject to various regulatory capital requirements administered by the federal banking agencies. Failure to meet minimum capital requirements will initiate certain mandatory and possibly additional discretionary actions by regulators that, if undertaken, could have a direct material effect on the Company’s financial statements. Under capital adequacy guidelines and the regulatory framework for prompt corrective action, the Company and the Bank must meet specific capital guidelines that involve quantitative measures of the assets, liabilities, and certain off-balance sheet items as calculated under regulatory accounting practices. The Company and its subsidiary bank’s capital amounts and classification are also subject to qualitative judgments by the regulators about components, risk weightings, and other factors.
U.S. banking regulators adopted final rules related to standards on bank capital adequacy and liquidity (commonly referred to “Basel III”) that were effective for the Company beginning on January 1, 2015, subject to a phase-in period for certain provisions extending through January 1, 2019. To ensure capital adequacy, the Company and its subsidiary bank are required to maintain minimum capital amounts and risk-based capital ratios (set forth in the tables below) as well as a capital conservation buffer in excess of the required minimum. The capital conservation buffer is being phasing in from 0.0% in 2015 to 2.50% by 2019. For 2017, the capital conservation buffer is 1.25%. The Company and the Bank met the minimum capital ratios and a fully phased-in capital conservation buffer under the new rules at year-end 2017.
As of December 31, 2017, the most recent notification from the FDIC categorized the Bank as well-capitalized under the regulatory framework for prompt corrective action. To be categorized as well-capitalized, the Bank must maintain minimum Common Equity Tier 1 Risk-based, Tier 1 Risk-based, Total Risk-based, and Tier 1 Leverage ratios as set forth in the tables below. There are no conditions or events since that notification that management believes have changed the institutions’ category.
The regulatory capital amounts and ratios of the consolidated Company and its subsidiary bank are presented in the following tables for the dates indicated. The minimums presented below are before the capital conservation buffer which was 1.25% and 0.625% at December 31, 2017 and 2016, respectively.
|
To Be Well-Capitalized |
||||||||||||||||||||||||
|
For Capital |
Under Prompt Corrective |
|||||||||||||||||||||||
|
(Dollars in thousands) |
Actual |
Adequacy Purposes |
Action Provisions |
|||||||||||||||||||||
|
December 31, 2017 |
Amount |
Ratio |
Amount |
Ratio |
Amount |
Ratio |
||||||||||||||||||
|
Common Equity Tier 1 Risk-based Capital1 |
||||||||||||||||||||||||
|
Consolidated |
$ | 196,919 | 16.56 | % | $ | 53,500 | 4.50 | % | N/A | N/A | ||||||||||||||
|
United Bank* |
165,488 | 14.05 | 53,004 | 4.50 | $ | 76,561 | 6.50 | % | ||||||||||||||||
|
Tier 1 Risk-based Capital1 |
||||||||||||||||||||||||
|
Consolidated |
$ | 229,419 | 19.30 | % | $ | 71,334 | 6.00 | % | N/A | N/A | ||||||||||||||
|
United Bank* |
165,488 | 14.05 | 70,671 | 6.00 | $ | 94,229 | 8.00 | % | ||||||||||||||||
|
Total Risk-based Capital 1 |
||||||||||||||||||||||||
|
Consolidated |
$ | 239,234 | 20.12 | % | $ | 95,112 | 8.00 | % | N/A | N/A | ||||||||||||||
|
United Bank* |
175,271 | 14.88 | 94,229 | 8.00 | $ | 117,786 | 10.00 | % | ||||||||||||||||
|
Tier 1 Leverage Capital 2 |
||||||||||||||||||||||||
|
Consolidated |
$ | 229,419 | 13.75 | % | $ | 66,763 | 4.00 | % | N/A | N/A | ||||||||||||||
|
United Bank* |
165,488 | 10.13 | 65,365 | 4.00 | $ | 81,706 | 5.00 | % | ||||||||||||||||
|
To Be Well-Capitalized |
||||||||||||||||||||||||
|
For Capital |
Under Prompt Corrective |
|||||||||||||||||||||||
|
(Dollars in thousands) |
Actual |
Adequacy Purposes |
Action Provisions |
|||||||||||||||||||||
|
December 31, 2016 |
Amount |
Ratio |
Amount |
Ratio |
Amount |
Ratio |
||||||||||||||||||
|
Common Equity Tier 1 Risk-based Capital1 |
||||||||||||||||||||||||
|
Consolidated |
$ | 187,474 | 16.43 | % | $ | 51,349 | 4.50 | % | N/A | N/A | ||||||||||||||
|
Farmers Bank & Capital Trust Company* |
64,016 | 16.53 | 17,425 | 4.50 | $ | 25,170 | 6.50 | % | ||||||||||||||||
|
United Bank & Trust Company* |
58,180 | 15.54 | 16,848 | 4.50 | 24,337 | 6.50 | ||||||||||||||||||
|
First Citizens Bank* |
28,324 | 13.56 | 9,401 | 4.50 | 13,580 | 6.50 | ||||||||||||||||||
|
Citizens Bank of Northern Kentucky, Inc.* |
24,661 | 15.24 | 7,280 | 4.50 | 10,516 | 6.50 | ||||||||||||||||||
|
Tier 1 Risk-based Capital1 |
||||||||||||||||||||||||
|
Consolidated |
$ | 219,974 | 19.28 | % | $ | 68,466 | 6.00 | % | N/A | N/A | ||||||||||||||
|
Farmers Bank & Capital Trust Company* |
64,016 | 16.53 | 23,234 | 6.00 | $ | 30,978 | 8.00 | % | ||||||||||||||||
|
United Bank & Trust Company* |
58,180 | 15.54 | 22,465 | 6.00 | 29,953 | 8.00 | ||||||||||||||||||
|
First Citizens Bank* |
28,324 | 13.56 | 12,535 | 6.00 | 16,714 | 8.00 | ||||||||||||||||||
|
Citizens Bank of Northern Kentucky, Inc.* |
24,661 | 15.24 | 9,707 | 6.00 | 12,942 | 8.00 | ||||||||||||||||||
|
Total Risk-based Capital 1 |
||||||||||||||||||||||||
|
Consolidated |
$ | 229,318 | 20.10 | % | $ | 91,288 | 8.00 | % | N/A | N/A | ||||||||||||||
|
Farmers Bank & Capital Trust Company* |
66,720 | 17.23 | 30,978 | 8.00 | $ | 38,723 | 10.00 | % | ||||||||||||||||
|
United Bank & Trust Company* |
61,680 | 16.47 | 29,953 | 8.00 | 37,441 | 10.00 | ||||||||||||||||||
|
First Citizens Bank* |
29,590 | 14.16 | 16,714 | 8.00 | 20,892 | 10.00 | ||||||||||||||||||
|
Citizens Bank of Northern Kentucky, Inc.* |
26,534 | 16.40 | 12,942 | 8.00 | 16,178 | 10.00 | ||||||||||||||||||
|
Tier 1 Leverage Capital 2 |
||||||||||||||||||||||||
|
Consolidated |
$ | 219,974 | 13.20 | % | $ | 66,656 | 4.00 | % | N/A | N/A | ||||||||||||||
|
Farmers Bank & Capital Trust Company* |
64,016 | 9.80 | 26,121 | 4.00 | $ | 32,651 | 5.00 | % | ||||||||||||||||
|
United Bank & Trust Company* |
58,180 | 12.38 | 18,798 | 4.00 | 23,497 | 5.00 | ||||||||||||||||||
|
First Citizens Bank* |
28,324 | 9.76 | 11,606 | 4.00 | 14,507 | 5.00 | ||||||||||||||||||
|
Citizens Bank of Northern Kentucky, Inc.* |
24,661 | 10.68 | 9,234 | 4.00 | 11,543 | 5.00 | ||||||||||||||||||
1Common Equity Tier 1 Risk-based, Tier 1 Risk-based, and Total Risk-based Capital ratios are computed by dividing a bank’s Common Equity Tier 1, Tier 1, or Total Capital, as defined by regulation, by a risk-weighted sum of the bank’s assets, with the risk weighting determined by general standards established by regulation.
2Tier 1 Leverage ratio is computed by dividing a bank’s Tier 1 Capital by its total quarterly average assets, as defined by regulation.
*In February 2017, the Company merged United Bank & Trust Company, First Citizens Bank, Inc., and Citizens Bank of Northern Kentucky, Inc. into Farmers Bank & Capital Trust Company in Frankfort, KY, the name of which was immediately changed to United Bank & Capital Trust Company.
Payment of dividends by the Bank is subject to certain regulatory restrictions as set forth in national and state banking laws and regulations. Generally, capital distributions are limited to undistributed net income for the current and prior two years, subject to the capital requirements as summarized above.
19. Fair Value Measurements
ASC Topic 820, “Fair Value Measurements and Disclosures,” defines fair value, establishes a framework for measuring fair value, and sets forth disclosures about fair value measurements. ASC Topic 825, “Financial Instruments,” allows entities to choose to measure certain financial assets and liabilities at fair value. The Company has not elected the fair value option for any of its financial assets or liabilities.
ASC Topic 820 defines fair value as the price that would be received to sell an asset or paid to transfer a liability (exit price) in the principal or most advantageous market for the asset or liability in an orderly transaction between market participants at the measurement date. It also establishes a fair value hierarchy which requires an entity to maximize the use of observable inputs and minimize the use of unobservable inputs when measuring fair value. This Topic describes three levels of inputs that may be used to measure fair value:
|
Level 1: |
Quoted prices for identical assets or liabilities in active markets that the entity has the ability to access at the measurement date. |
|
Level 2: |
Significant other observable inputs other than Level 1 prices such as quoted prices for similar assets or liabilities; quoted prices in markets that are not active; or other inputs that are observable or can be corroborated by observable market data for substantially the full term of the assets or liabilities. |
|
Level 3: |
Significant unobservable inputs that reflect a reporting entity’s own assumptions supported by little or no market activity, about the assumptions that market participants would use in pricing the asset or liability. |
Following is a description of the valuation method used for instruments measured at fair value on a recurring basis. For this disclosure, the Company only has available for sale investment securities and money market mutual funds classified as cash equivalents that meet the requirement. The carrying value of the $36.7 and $18.6 million in money market mutual funds at December 31, 2017 and 2016, respectively, is equivalent to its fair value and based on Level 1 inputs.
Available for sale investment securities
Valued primarily by independent third party pricing services under the market valuation approach that include, but are not limited to, the following inputs:
|
● |
Mutual funds and equity securities are priced utilizing real-time data feeds from active market exchanges for identical securities and are considered Level 1 inputs. |
|
● |
Government-sponsored agency debt securities, obligations of states and political subdivisions, mortgage-backed securities, corporate bonds, and other similar investment securities are priced with available market information through processes using benchmark yields, matrix pricing, prepayment speeds, cash flows, live trading data, and market spreads sourced from new issues, dealer quotes, and trade prices, among others sources and are considered Level 2 inputs. |
Fair value disclosures for available for sale investment securities as of December 31, 2017 and 2016 are as follows:
|
Fair Value Measurements Using |
||||||||||||||||
|
(In thousands)
|
Fair Value |
Quoted Prices in Active Markets for Identical Assets |
Significant Other Observable Inputs |
Significant Unobservable Inputs |
||||||||||||
|
December 31, 2017 |
||||||||||||||||
|
Obligations of U.S. government-sponsored entities |
$ | 43,208 | $ | - | $ | 43,208 | $ | - | ||||||||
|
Obligations of states and political subdivisions |
114,249 | - | 114,249 | - | ||||||||||||
|
Mortgage-backed securities – residential |
193,393 | - | 193,393 | - | ||||||||||||
|
Mortgage-backed securities – commercial |
49,352 | - | 49,352 | - | ||||||||||||
|
Asset-backed securities |
15,574 | - | 15,574 | - | ||||||||||||
|
Corporate debt securities |
7,542 | - | 7,542 | - | ||||||||||||
|
Mutual funds and equity securities |
935 | 935 | - | - | ||||||||||||
|
Total |
$ | 424,253 | $ | 935 | $ | 423,318 | $ | - | ||||||||
|
December 31, 2016 |
||||||||||||||||
|
Obligations of U.S. government-sponsored entities |
$ | 71,694 | $ | - | $ | 71,694 | $ | - | ||||||||
|
Obligations of states and political subdivisions |
132,292 | - | 132,292 | - | ||||||||||||
|
Mortgage-backed securities – residential |
224,307 | - | 224,307 | - | ||||||||||||
|
Mortgage-backed securities – commercial |
45,613 | - | 45,613 | - | ||||||||||||
|
Corporate debt securities |
6,125 | - | 6,125 | - | ||||||||||||
|
Mutual funds and equity securities |
833 | 833 | - | - | ||||||||||||
|
Total |
$ | 480,864 | $ | 833 | $ | 480,031 | $ | - | ||||||||
The Company is required to measure and disclose certain other assets and liabilities at fair value on a nonrecurring basis in periods following their initial recognition. The Company’s disclosure about assets and liabilities measured at fair value on a nonrecurring basis consists of collateral-dependent impaired loans and OREO.
Adjustments to the fair value of collateral-dependent loans are recorded by either direct loan charge-offs through the allowance for loan losses or an adjustment to the specific reserve through an increase or decrease to the provision for loan losses. The fair value of collateral-dependent impaired loans with specific allocations of the allowance for loan losses is measured based on recent appraisals of the underlying collateral. These appraisals may utilize a single valuation approach or a combination of approaches including comparable sales and the income approach. Appraisers take absorption rates into consideration and adjustments are routinely made in the appraisal process to identify differences between the comparable sales and income data available. Such adjustments consist mainly of estimated costs to sell that are not included in certain appraisals or to update appraised collateral values as a result of market declines of similar properties for which a newer appraisal is available. These adjustments can be significant and typically result in a Level 3 classification of the inputs for determining fair value.
OREO includes properties acquired by the Company through, or in lieu of, actual loan foreclosures and is carried at fair value less estimated costs to sell. Fair value of OREO at acquisition is generally based on third party appraisals of the property that includes comparable sales data and is considered as Level 3 inputs. The carrying value of each OREO property is updated at least annually and more frequently when market conditions significantly impact the value of the property. If the carrying amount of the OREO exceeds fair value less estimated costs to sell, an impairment loss is recorded through noninterest expense.
The following table represents the carrying amount of assets measured at fair value on a nonrecurring basis and still held by the Company as of the dates indicated. The amounts in the table only represent assets whose carrying amount has been adjusted during the period in a manner as described above; therefore, these amounts will differ from the total amounts outstanding. With the exception of those calculated using the collateral valuation method, collateral-dependent impaired loan amounts in the tables below exclude restructured loans that are measured based on present value techniques, which are outside the scope of the fair value reporting framework.
|
Fair Value Measurements Using |
||||||||||||||||
|
(In thousands) |
Fair Value |
Quoted Prices in Active Markets for Identical Assets |
Significant Other Observable Inputs |
Significant Unobservable Inputs |
||||||||||||
|
December 31, 2017 |
||||||||||||||||
|
Collateral-dependent Impaired Loans |
||||||||||||||||
|
Real estate mortgage – construction and land development |
$ | 1,553 | $ | - | $ | - | $ | 1,553 | ||||||||
|
Real estate mortgage – residential |
4,687 | - | - | 4,687 | ||||||||||||
|
Real estate mortgage – farmland and other commercial enterprises |
2,645 | - | - | 2,645 | ||||||||||||
|
Total |
$ | 8,885 | $ | - | $ | - | $ | 8,885 | ||||||||
|
OREO |
||||||||||||||||
|
Construction and land development |
$ | 3,468 | $ | - | $ | - | $ | 3,468 | ||||||||
|
Residential real estate |
157 | - | - | 157 | ||||||||||||
|
Farmland and other commercial enterprises |
821 | - | - | 821 | ||||||||||||
|
Total |
$ | 4,446 | $ | - | $ | - | $ | 4,446 | ||||||||
|
Fair Value Measurements Using |
||||||||||||||||
|
(In thousands) |
Fair Value |
Quoted Prices in Active Markets for Identical Assets |
Significant Other Observable Inputs |
Significant Unobservable Inputs |
||||||||||||
|
December 31, 2016 |
||||||||||||||||
|
Collateral-dependent Impaired Loans |
||||||||||||||||
|
Real estate mortgage – construction and land development |
$ | 2,909 | $ | - | $ | - | $ | 2,909 | ||||||||
|
Real estate mortgage – residential |
3,137 | - | - | 3,137 | ||||||||||||
|
Real estate mortgage – farmland and other commercial enterprises |
351 | - | - | 351 | ||||||||||||
|
Total |
$ | 6,397 | $ | - | $ | - | $ | 6,397 | ||||||||
|
OREO |
||||||||||||||||
|
Construction and land development |
$ | 4,883 | $ | - | $ | - | $ | 4,883 | ||||||||
|
Residential real estate |
234 | - | - | 234 | ||||||||||||
|
Farmland and other commercial enterprises |
1,070 | - | - | 1,070 | ||||||||||||
|
Total |
$ | 6,187 | $ | - | $ | - | $ | 6,187 | ||||||||
The following table represents fair value adjustments recorded in earnings for the periods indicated on assets measured at fair value on a nonrecurring basis.
|
(In thousands) Years Ended December 31, |
2017 |
2016 |
||||||
|
Net decrease in fair value: |
||||||||
|
Collateral-dependent impaired loans |
$ | 386 | $ | 858 | ||||
|
OREO |
597 | 634 | ||||||
|
Total |
$ | 983 | $ | 1,492 | ||||
The following table presents quantitative information about unobservable inputs for assets measured on a nonrecurring basis using Level 3 measurements. As described above, the fair value of real estate securing collateral-dependent impaired loans and OREO are based on current third party appraisals. It is sometimes necessary, however, for the Company to discount the appraisal amounts supporting its impaired loans and OREO. These discounts relate primarily to marketing and other holding costs that are not included in certain appraisals or to update values as a result of market declines of similar properties for which newer appraisals are available. Discounts may also result from contracts to sell properties entered into during the period. The range of discounts is presented in the table below for 2017 and 2016. The upper end of the range identified in the table related to OREO for each year is the result of write-downs on relatively small properties. The weighted average column represents a better indicator of the discounts applied to the appraisals.
|
(In thousands) |
Fair Value |
Valuation Technique |
Unobservable Inputs |
Range |
Weighted Average |
||||||||||||
|
December 31, 2017 |
|||||||||||||||||
|
Collateral-dependent impaired loans |
$ | 8,885 |
Discounted appraisals |
Marketability discount |
0% | - | 22.8% | 3.1 | % | ||||||||
|
OREO |
$ | 4,446 |
Discounted appraisals |
Marketability discount |
0% | - | 71.7% | 4.05 | % | ||||||||
|
December 31, 2016 |
|||||||||||||||||
|
Collateral-dependent impaired loans |
$ | 6,397 |
Discounted appraisals |
Marketability discount |
0% | - | 67.8% | 3.5 | % | ||||||||
|
OREO |
$ | 6,187 |
Discounted appraisals |
Marketability discount |
0% | - | 50.0% | 11.2 | % | ||||||||
Fair Value of Financial Instruments
The table that follows represents the estimated fair values of the Company’s financial instruments made in accordance with the requirements of ASC Topic 825, “Financial Instruments.” ASC Topic 825 requires disclosure of fair value information about financial instruments, whether or not recognized in the balance sheet, for which it is practicable to estimate that value. The estimated fair value amounts have been determined by the Company using available market information and present value or other valuation techniques. These derived fair values are subjective in nature, involve uncertainties and matters of significant judgment and, therefore, cannot be determined with precision. ASC Topic 825 excludes certain financial instruments and all nonfinancial instruments from the disclosure requirements. Accordingly, the aggregate fair value amounts presented are not intended to represent the underlying value of the Company.
The following methods and assumptions were used to estimate the fair value of each class of financial instruments not presented elsewhere for which it is practicable to estimate that value.
Cash and Cash Equivalents, Accrued Interest Receivable, and Accrued Interest Payable
The carrying amount is a reasonable estimate of fair value due to the relatively short time between the origination of the instrument and its expected realization or settlement.
Investment Securities Held to Maturity
Fair value is based on quoted market price, if available. If a quoted market price is not available, fair value is estimated using quoted market prices for similar securities or with available market information through processes using benchmark yields, matrix pricing, prepayment speeds, cash flows, live trading data, and market spreads sourced from new issues, dealer quotes, and trade prices, among others sources.
Loans
The fair value of loans is estimated by discounting expected future cash flows using current discount rates at which similar loans would be made to borrowers with similar credit ratings and for the same remaining maturities. Expected future cash flows are projected based on contractual cash flows adjusted for estimated prepayments.
Federal Home Loan Bank and Federal Reserve Bank Stock
It is not practical to determine the fair value of Federal Home Loan Bank and Federal Reserve Bank stock due to restrictions placed on its transferability.
Deposit Liabilities
The fair value of demand deposits, savings accounts, and certain money market deposits is the amount payable on demand at the reporting date and fair value approximates carrying value. The fair value of fixed maturity certificates of deposit is estimated by discounting the expected future cash flows using the rates currently offered for certificates of deposit with similar remaining maturities.
Federal Funds Purchased and Short-term Securities Sold Under Agreements to Repurchase
The carrying amount is the estimated fair value for these borrowings which reprice frequently in the near term.
Securities Sold Under Agreements to Repurchase, Subordinated Notes Payable, and Other Long-term Borrowings
The fair value of these borrowings is estimated by discounting the expected future cash flows using rates currently available for debt with similar terms and remaining maturities. For subordinated notes payable, the Company uses its best estimate to determine an appropriate discount rate since active markets for similar debt transactions are limited.
Commitments to Extend Credit and Standby Letters of Credit
Pricing of these financial instruments is based on the credit quality and relationship, fees, interest rates, probability of funding, compensating balance, and other covenants or requirements. Loan commitments generally have fixed expiration dates, variable interest rates and contain termination and other clauses that provide for relief from funding in the event there is a significant deterioration in the credit quality of the customer. Many loan commitments are expected to, and typically do, expire without being drawn upon. The rates and terms of the Company’s commitments to lend and standby letters of credit are competitive with others in the various markets in which the Company operates. There are no unamortized fees relating to these financial instruments, as such the carrying value and fair value are both zero.
The following table presents the estimated fair values of the Company’s financial instruments and the level within the fair value hierarchy in which the fair value measurements fall at December 31, 2017 and 2016. Information for available for sale investment securities is presented within this footnote in greater detail above.
|
Fair Value Measurements Using |
||||||||||||||||||||
|
(In thousands) |
Carrying |
Fair |
Quoted Prices in Active Markets for Identical Assets |
Significant Other Observable Inputs |
Significant Unobservable Inputs |
|||||||||||||||
|
December 31, 2017 |
||||||||||||||||||||
|
Assets |
||||||||||||||||||||
|
Cash and cash equivalents |
$ | 120,408 | $ | 120,408 | $ | 120,408 | $ | - | $ | - | ||||||||||
|
Held to maturity investment securities |
3,364 | 3,478 | - | 3,478 | - | |||||||||||||||
|
Loans, net |
1,025,480 | 1,012,959 | - | - | 1,012,959 | |||||||||||||||
|
Accrued interest receivable |
4,935 | 4,935 | - | 4,935 | - | |||||||||||||||
|
Federal Home Loan Bank and Federal Reserve Bank Stock |
13,235 | 13,235 | - | - | 13,235 | |||||||||||||||
|
Liabilities |
||||||||||||||||||||
|
Deposits |
1,379,903 | 1,380,122 | 1,157,045 | - | 223,077 | |||||||||||||||
|
Securities sold under agreements to repurchase |
34,252 | 34,257 | - | 34,257 | - | |||||||||||||||
|
Federal Home Loan Bank advances |
3,479 | 3,546 | - | 3,546 | - | |||||||||||||||
|
Subordinated notes payable to unconsolidated trusts |
33,506 | 22,709 | - | - | 22,709 | |||||||||||||||
|
Accrued interest payable |
261 | 261 | - | 261 | - | |||||||||||||||
|
December 31, 2016 |
||||||||||||||||||||
|
Assets |
||||||||||||||||||||
|
Cash and cash equivalents |
$ | 113,534 | $ | 113,534 | $ | 113,534 | $ | - | $ | - | ||||||||||
|
Held to maturity investment securities |
3,488 | 3,597 | - | 3,597 | - | |||||||||||||||
|
Loans, net |
961,631 | 962,437 | - | - | 962,437 | |||||||||||||||
|
Accrued interest receivable |
5,019 | 5,019 | - | 5,019 | - | |||||||||||||||
|
Federal Home Loan Bank and Federal Reserve Bank Stock |
9,840 | 9,840 | - | - | 9,840 | |||||||||||||||
|
Liabilities |
||||||||||||||||||||
|
Deposits |
1,369,907 | 1,369,567 | 1,099,211 | - | 270,356 | |||||||||||||||
|
Securities sold under agreements to repurchase |
36,370 | 36,381 | - | 36,381 | - | |||||||||||||||
|
Federal Home Loan Bank advances |
18,646 | 19,114 | - | 19,114 | - | |||||||||||||||
|
Subordinated notes payable to unconsolidated trusts |
33,506 | 21,234 | - | - | 21,234 | |||||||||||||||
|
Accrued interest payable |
321 | 321 | - | 321 | - | |||||||||||||||
20. Parent Company Financial Statements
Condensed Balance Sheets
|
December 31, (In thousands) |
2017 |
2016 |
||||||
|
Assets |
||||||||
|
Cash and cash equivalents |
$ | 61,604 | $ | 44,286 | ||||
|
Investment in subsidiaries |
166,183 | 175,935 | ||||||
|
Other assets |
302 | 1,378 | ||||||
|
Total assets |
$ | 228,089 | $ | 221,599 | ||||
|
Liabilities |
||||||||
|
Dividends payable, common stock |
$ | 939 | $ | 751 | ||||
|
Subordinated notes payable to unconsolidated trusts |
33,506 | 33,506 | ||||||
|
Other liabilities |
291 | 3,276 | ||||||
|
Total liabilities |
34,736 | 37,533 | ||||||
|
Shareholders’ Equity |
||||||||
|
Common stock |
940 | 939 | ||||||
|
Capital surplus |
52,201 | 51,885 | ||||||
|
Retained earnings |
143,778 | 134,650 | ||||||
|
Accumulated other comprehensive loss |
(3,566 | ) | (3,408 | ) | ||||
|
Total shareholders’ equity |
193,353 | 184,066 | ||||||
|
Total liabilities and shareholders’ equity |
$ | 228,089 | $ | 221,599 | ||||
Condensed Statements of Income and Comprehensive Income
|
Years Ended December 31, (In thousands) |
2017 |
2016 |
2015 |
|||||||||
|
Income |
||||||||||||
|
Dividends from subsidiaries |
$ | 23,026 | $ | 24,820 | $ | 14,426 | ||||||
|
Interest |
191 | 39 | 12 | |||||||||
|
Gain on debt extinguishment |
- | 4,050 | - | |||||||||
|
Other noninterest income |
363 | 2,442 | 2,555 | |||||||||
|
Total income |
23,580 | 31,351 | 16,993 | |||||||||
|
Expense |
||||||||||||
|
Interest expense – subordinated notes payable to unconsolidated trusts |
870 | 723 | 866 | |||||||||
|
Noninterest expense |
1,751 | 5,050 | 4,938 | |||||||||
|
Total expense |
2,621 | 5,773 | 5,804 | |||||||||
|
Income before income tax benefit and equity in undistributed income of subsidiaries |
20,959 | 25,578 | 11,189 | |||||||||
|
Income tax (benefit) expense |
(747 | ) | 273 | (1,076 | ) | |||||||
|
Income before equity in undistributed income of subsidiaries |
21,706 | 25,305 | 12,265 | |||||||||
|
Equity in undistributed (loss) income of subsidiaries |
(10,018 | ) | (8,700 | ) | 2,727 | |||||||
|
Net income |
11,688 | 16,605 | 14,992 | |||||||||
|
Other comprehensive income (loss) |
475 | (6,190 | ) | (2,093 | ) | |||||||
|
Comprehensive income |
$ | 12,163 | $ | 10,415 | $ | 12,899 | ||||||
Condensed Statements of Cash Flows
|
Years Ended December 31, (In thousands) |
2017 |
2016 |
2015 |
|||||||||
|
Cash Flows From Operating Activities |
||||||||||||
|
Net income |
$ | 11,688 | $ | 16,605 | $ | 14,992 | ||||||
|
Adjustments to reconcile net income to net cash provided by operating activities: |
||||||||||||
|
Equity in undistributed loss (income) of subsidiaries |
10,018 | 8,700 | (2,727 | ) | ||||||||
|
Noncash employee stock purchase plan expense |
1 | 7 | 4 | |||||||||
|
Noncash director fee compensation |
105 | 92 | 104 | |||||||||
|
Change in other assets and liabilities, net |
(2,408 | ) | (1,116 | ) | 582 | |||||||
|
Deferred income tax expense (benefit) |
740 | (46 | ) | (54 | ) | |||||||
|
Gain on extinguishment of subordinated notes payable to unconsolidated trusts |
- | (4,050 | ) | - | ||||||||
|
Net cash provided by operating activities |
20,144 | 20,192 | 12,901 | |||||||||
|
Cash Flows From Investing Activities |
||||||||||||
|
Return of equity from nonbank subsidiary |
- | 500 | 1,355 | |||||||||
|
Net cash provided by investing activities |
- | 500 | 1,355 | |||||||||
|
Cash Flows From Financing Activities |
||||||||||||
|
Cash paid to extinguish subordinated notes payable to unconsolidated trusts |
- | (10,950 | ) | - | ||||||||
|
Dividends paid, common stock |
(3,005 | ) | (1,575 | ) | - | |||||||
|
Redemption of preferred stock |
- | - | (10,000 | ) | ||||||||
|
Dividends paid, preferred stock |
- | - | (508 | ) | ||||||||
|
Shares issued under employee stock purchase plan |
179 | 155 | 130 | |||||||||
|
Net cash used in financing activities |
(2,826 | ) | (12,370 | ) | (10,378 | ) | ||||||
|
Net increase in cash and cash equivalents |
17,318 | 8,322 | 3,878 | |||||||||
|
Cash and cash equivalents at beginning of year |
44,286 | 35,964 | 32,086 | |||||||||
|
Cash and cash equivalents at end of year |
$ | 61,604 | $ | 44,286 | $ | 35,964 | ||||||
|
21. |
Quarterly Financial Data (Unaudited) |
|
(In thousands, except per share data) |
||||||||||||||||
|
Quarters Ended 2017 |
March 31 |
June 30 |
Sept. 30 |
Dec. 31 |
||||||||||||
|
Interest income |
$ | 14,379 | $ | 14,830 | $ | 14,983 | $ | 15,094 | ||||||||
|
Interest expense |
916 | 881 | 893 | 820 | ||||||||||||
|
Net interest income |
13,463 | 13,949 | 14,090 | 14,274 | ||||||||||||
|
Provision for loan losses |
580 | (499 | ) | (379 | ) | 87 | ||||||||||
|
Net interest income after provision for loan losses |
12,883 | 14,448 | 14,469 | 14,187 | ||||||||||||
|
Noninterest income |
5,251 | 5,102 | 5,627 | 5,185 | ||||||||||||
|
Noninterest expense |
13,529 | 13,346 | 12,708 | 13,240 | ||||||||||||
|
Income before income taxes |
4,605 | 6,204 | 7,388 | 6,132 | ||||||||||||
|
Income tax expense |
1,276 | 1,722 | 2,076 | 7,567 | 1 | |||||||||||
|
Net income (loss) |
$ | 3,329 | $ | 4,482 | $ | 5,312 | $ | (1,435 | ) | |||||||
|
Net income (loss) per common share, basic and diluted |
$ | .44 | $ | .60 | $ | .71 | $ | (.19 | ) | |||||||
|
Weighted average common shares outstanding, basic and diluted |
7,510 | 7,512 | 7,514 | 7,516 | ||||||||||||
1Income tax expense includes $5.9 million related to the remeasurement of the Company’s net deferred tax assets due to the change in Federal tax rates.
|
(In thousands, except per share data) |
||||||||||||||||
|
Quarters Ended 2016 |
March 31 |
June 30 |
Sept. 30 |
Dec. 31 |
||||||||||||
|
Interest income |
$ | 15,330 | $ | 14,973 | $ | 14,619 | $ | 14,449 | ||||||||
|
Interest expense |
2,043 | 1,975 | 1,809 | 928 | ||||||||||||
|
Net interest income |
13,287 | 12,998 | 12,810 | 13,521 | ||||||||||||
|
Provision for loan losses |
(473 | ) | (156 | ) | (190 | ) | 175 | |||||||||
|
Net interest income after provision for loan losses |
13,760 | 13,154 | 13,000 | 13,346 | ||||||||||||
|
Noninterest income |
9,542 | 1 | 5,521 | 10,772 | 2 | 5,351 | ||||||||||
|
Noninterest expense |
14,407 | 13,884 | 17,888 | 2 | 15,221 | |||||||||||
|
Income before income taxes |
8,895 | 4,791 | 5,884 | 3,476 | ||||||||||||
|
Income tax expense |
2,715 | 1,235 | 1,560 | 931 | ||||||||||||
|
Net income |
$ | 6,180 | $ | 3,556 | $ | 4,324 | $ | 2,545 | ||||||||
|
Net income per common share, basic and diluted |
$ | .82 | $ | .47 | $ | .58 | $ | .34 | ||||||||
|
Weighted average common shares outstanding, basic and diluted |
7,500 | 7,502 | 7,505 | 7,508 | ||||||||||||
1Noninterest income includes $4.1 million related to the gain on the early extinguishment of subordinated notes payable.
2Noninterest income includes $3.8 million of gain on the sale of investment securities and noninterest expense includes $3.8 million of loss on the early extinguishment of debt, both related to a series of transactions to deleverage the balance sheet.
The quarterly financial information in the tables above reflects all adjustments which are necessary for a fair statement of results of the interim period.
22. Intangible Assets
Intangible assets were zero as of year-end 2017 and 2016. Customer relationship intangibles in the amount of $2.4 million recorded in connection with a prior business acquisition during 2004 were fully amortized at year-end 2014. Acquired core deposit intangibles in the amount of $4.5 million were fully amortized at year-end 2015. Aggregate amortization expense of core deposit and customer relationship intangible assets was zero for 2017 and 2016, and $449 thousand for 2015.
23. Preferred Stock
On January 9, 2009, as part of the U.S. Department of Treasury’s (“Treasury”) Capital Purchase Program (“CPP”), the Company issued 30,000 shares of Series A, no par value cumulative perpetual preferred stock to the Treasury for $30.0 million. The Company also issued a warrant to the Treasury as part of the CPP. In June 2012, the Treasury conducted an auction in which it sold all of its investment in the Company’s Series A preferred stock to private investors. The Company received no proceeds as part of the transaction. In July 2012, the Company repurchased the warrant it issued to the Treasury. Upon settlement of the warrant repurchase, the Treasury had no remaining equity stake in the Company.
The Company redeemed 20,000 shares of its outstanding preferred stock during 2014 at its stated liquidation value of $1 thousand per share, plus accrued dividends. The shares were approved and redeemed in two separate partial redemptions of 10,000 shares each, one of which occurred in second quarter and the other in the fourth quarter.
On June 8, 2015, the Company redeemed the final 10,000 shares of its Series A preferred stock. The shares were redeemed at the stated liquidation value of $1 thousand per share, plus accrued dividends. The redemption was the third and final partial redemption of the original shares issued. No additional debt or equity was issued in connection with any of the shares redeemed.
Item 9. Changes in and Disagreements with Accountants on Accounting and Financial Disclosure
None.
Item 9A. Controls and Procedures
Evaluation of Disclosure Controls and Procedures
As of the end of the period covered by this report, an evaluation was carried out under the supervision and with the participation of our management, including the Company’s Chief Executive Officer and Chief Financial Officer, of the effectiveness of our disclosure controls and procedures (as defined in Exchange Act Rules 13a-15(e) and 15d-15(e) under the Securities Exchange Act of 1934). Based on their evaluation, the Company’s Chief Executive Officer and Chief Financial Officer have concluded that the Company’s disclosure controls and procedures and internal control over financial reporting are, to the best of their knowledge, effective to ensure that information required to be disclosed by the Company in reports that the Company files or submits under the Exchange Act is recorded, processed, summarized and reported within the time periods specified in SEC rules and forms.
The Company’s Chief Executive Officer and Chief Financial Officer have also concluded that there were no changes in the Company’s internal control over financial reporting or in other factors that occurred during the Company’s most recent fiscal quarter that have materially affected, or are reasonably likely to materially affect, the Company’s internal control over financial reporting or any corrective actions with regard to significant deficiencies and material weaknesses in internal control over financial reporting.
Management’s Report on Internal Control Over Financial Reporting
Management Responsibility. Management of the Company is responsible for establishing and maintaining adequate internal control over financial reporting. The Company’s internal control system is designed to provide reasonable assurance to the Company’s management and Board of Directors regarding the reliability of financial reporting and the presentation of published financial statements. However, all internal control systems, no matter how well designed, have inherent limitations.
General Description of Internal Control over Financial Reporting. Internal control over financial reporting refers to a process designed by, or under the supervision of, the Company’s Chief Executive Officer and Chief Financial Officer and effected by the Company’s Board of Directors, management and other personnel, to provide reasonable assurance regarding the reliability of financial reporting and the preparation of financial statements for external purposes in accordance with generally accepted accounting principles and includes those policies and procedures that:
|
● |
Pertain to the maintenance of records that, in reasonable detail, accurately and fairly reflect the transactions and dispositions of Company assets; |
|
● |
Provide reasonable assurance that transactions are recorded as necessary to permit preparation of financial statements in accordance with generally accepted accounting principles, and that the Company’s receipts and expenditures are being made only in accordance with the authorization of the Company’s management and members of the Company’s Board of Directors; and |
|
● |
Provide reasonable assurance regarding prevention or timely detection of unauthorized acquisitions, uses or dispositions of Company assets that could have a material effect on the Company’s financial statements. |
Inherent Limitations in Internal Control over Financial Reporting. Internal control over financial reporting cannot provide absolute assurance of achieving financial reporting objectives because of its inherent limitations. Internal control over financial reporting is a process that involves human diligence and compliance and is subject to lapses in judgment and breakdowns resulting from human failures. Internal control over financial reporting also can be circumvented or overridden by collusion or other improper activities. Because of such limitations, there is a risk that material misstatements may not be prevented or detected on a timely basis by internal control over financial reporting. However, these inherent limitations are known features of the financial reporting process, and it is possible to design into the process safeguards to reduce, though not eliminate, this risk.
Management’s Assessment of the Company’s Internal Control over Financial Reporting. Management assessed the effectiveness of the Company’s internal control over financial reporting as of December 31, 2017. In making this assessment, the Company’s management used the criteria for effective internal control over financial reporting set forth by the Committee of Sponsoring Organizations of the Treadway Commission (COSO) in Internal Control-Integrated Framework (2013).
As a result of our assessment of the Company’s internal control over financial reporting, management concluded that the Company’s internal control over financial reporting was effective as of December 31, 2017 to ensure that information required to be disclosed by the Company in reports that it files or submits under the Exchange Act is recorded, processed, summarized and reported within the time periods specified in SEC rules and forms.
BKD, LLP, the independent registered public accounting firm that audited the Company’s consolidated financial statements included in this Annual Report on Form 10-K, has also audited the effectiveness of the Company’s internal control over financial reporting as of December 31, 2017. The audit report on the effectiveness of the Company’s internal control over financial reporting is included in this Annual Report on page 69.
Item 9B. Other Information
None.
PART III
Item 10. Directors, Executive Officers and Corporate Governance
|
Executive Officer1 |
Age |
Positions and Offices With the Registrant |
Years of Service With the Registrant |
|
Lloyd C. Hillard, Jr. |
71 |
President and Chief Executive Officer, Director2 |
253 |
1R. Terry Bennett, Chairman of the Company’s board of directors, and David Y. Phelps, Vice Chairman, are considered executive officers in name only for purposes of Regulation O.
2Also a director of United Bank, Farmers Insurance (Chairman), FFKT Insurance, EG Properties, and an administrative trustee of Farmers Capital Bank Trust I and Farmers Capital Bank Trust III.
3Includes years of service with the Parent Company and its subsidiaries.
The Company has adopted a Code of Ethics that applies to the Company’s directors, officers, and employees, including the Company’s chief executive officer and chief financial officer. The Company makes available its Code of Ethics on its Internet website at www.farmerscapital.com. Any amendments to the Code of Ethics and any waiver applicable to the Company’s chief executive officer and chief financial officer will also be posted on the website.
Additional information required by Item 10 is hereby incorporated by reference from the Company's definitive proxy statement in connection with its annual meeting of shareholders scheduled for May 8, 2018, which will be filed with the Commission on or about April 2, 2018, pursuant to Regulation 14A.
Item 11. Executive Compensation
Item 12. Security Ownership of Certain Beneficial Owners and Management and Related Stockholder Matters
Item 13. Certain Relationships and Related Transactions, and Director Independence
Item 14. Principal Accounting Fees and Services
The information required by Items 11 through 14 is hereby incorporated by reference from the Company's definitive proxy statement in connection with its annual meeting of shareholders scheduled for May 8, 2018, which will be filed with the Commission on or about April 2, 2018, pursuant to Regulation 14A.
PART IV
Item 15. Exhibits, Financial Statement Schedules
|
(a)1. |
Financial Statements |
The following consolidated financial statements and report of independent registered public accounting firm of the Company is included in Part II, Item 8 on pages 68 through 118:
Report of Independent Registered Public Accounting Firm
Consolidated Balance Sheets
Consolidated Statements of Income
Consolidated Statements of Comprehensive Income
Consolidated Statements of Changes in Shareholders’ Equity
Consolidated Statements of Cash Flows
Notes to Consolidated Financial Statements
|
(a)2. |
Financial Statement Schedules |
All schedules are omitted for the reason they are not required, or are not applicable, or the required information is disclosed elsewhere in the financial statements and related notes thereto.
|
(a)3. |
Exhibits: |
|
3.1 |
|
|
3.2 |
|
|
3.3 |
|
|
3.4 |
|
|
4.1* |
Junior Subordinated Indenture, dated as of July 21, 2005, between Farmers Capital Bank Corporation and Wilmington Trust Company, as Trustee, relating to unsecured junior subordinated deferrable interest notes that mature in 2035. |
|
4.2* |
Amended and Restated Trust Agreement, dated as of July 21, 2005, among Farmers Capital Bank Corporation, as Depositor, Wilmington Trust Company, as Property and Delaware Trustee, the Administrative Trustees (as named therein), and the Holders (as defined therein). |
|
4.3* |
Guarantee Agreement, dated as of July 21, 2005, between Farmers Capital Bank Corporation, as Guarantor, and Wilmington Trust Company, as Guarantee Trustee. |
|
4.4* |
Junior Subordinated Indenture, dated as of July 26, 2005, between Farmers Capital Bank Corporation and Wilmington Trust Company, as Trustee, relating to unsecured junior subordinated deferrable interest notes that mature in 2035. |
|
4.5* |
Amended and Restated Trust Agreement, dated as of July 26, 2005, among Farmers Capital Bank Corporation, as Depositor, Wilmington Trust Company, as Property and Delaware Trustee, the Administrative Trustees (as named therein), and the Holders (as defined therein). |
|
4.6* |
Guarantee Agreement, dated as of July 26, 2005, between Farmers Capital Bank Corporation, as Guarantor, and Wilmington Trust Company, as Guarantee Trustee. |
|
4.7* |
Indenture, dated as of August 14, 2007 between Farmers Capital Bank Corporation, as Issuer, and Wilmington Trust Company, as Trustee, relating to fixed/floating rate junior subordinated debt due 2037. |
|
4.8* |
Amended and Restated Declaration of Trust, dated as of August 14, 2007, by Farmers Capital Bank Corporation, as Sponsor, Wilmington Trust Company, as Delaware and Institutional Trustee, the Administrative Trustees (as named therein), and the Holders (as defined therein). |
|
4.9* |
Guarantee Agreement, dated as of August 14, 2007, between Farmers Capital Bank Corporation, as Guarantor, and Wilmington Trust Company, as Guarantee Trustee. |
|
4.10 |
Form of Certificate for Fixed Rate Cumulative Perpetual Preferred Stock, Series A (incorporated by reference to the Current Report on Form 8-K dated January 13, 2009 (File No. 000-14412)). |
|
4.11 |
|
|
10.1 |
|
|
10.2 |
|
|
10.3 |
|
|
10.4 |
|
|
10.5 |
|
|
10.6 |
|
|
10.7 |
|
|
10.8 |
|
|
21** |
|
|
23.1** |
|
|
31.1** |
CEO Certification Pursuant to Section 302 of the Sarbanes-Oxley Act of 2002 |
|
31.2** |
CFO Certification Pursuant to Section 302 of the Sarbanes-Oxley Act of 2002 |
|
32** |
|
|
101** |
Interactive Data Files |
* Exhibit not included pursuant to Item 601(b)(4)(iii) and (v) of Regulation S-K. The Company will provide a copy of such exhibit to the Securities and Exchange Commission upon request.
** Filed with this Annual Report on Form 10-K.
SIGNATURES
Pursuant to the requirements of Section 13 or 15(d) of the Securities Exchange Act of 1934, the Registrant has duly caused this report to be signed on its behalf by the undersigned, thereunto duly authorized.
|
FARMERS CAPITAL BANK CORPORATION |
|||
|
By: |
/s/ Lloyd C. Hillard, Jr. |
||
|
Lloyd C. Hillard, Jr. |
|||
|
President and Chief Executive Officer |
|||
|
Date: |
March 12, 2018 |
||
Pursuant to the requirements of the Securities Exchange Act of 1934, this report has been signed below by the following persons on behalf of the Registrant and in the capacities and on the dates indicated.
|
/s/ Lloyd C. Hillard, Jr. |
President, Chief Executive Officer |
March 12, 2018 |
|
Lloyd C. Hillard, Jr. |
and Director (principal executive |
|
|
officer of the Registrant) |
||
|
/s/ R. Terry Bennett |
Chairman |
February 26, 2018 |
|
R. Terry Bennett |
||
|
/s/ David Y. Phelps |
Vice Chairman |
March 7, 2018 |
|
David Y. Phelps |
||
|
/s/ J. Barry Banker |
Director |
March 7, 2018 |
|
J. Barry Banker |
||
|
/s/ Michael J. Crawford |
Director |
March 7, 2018 |
|
Michael J. Crawford |
||
|
/s/ William C. Nash |
Director |
March 2, 2018 |
|
Dr. William C. Nash |
||
|
/s/ David R. O’Bryan |
Director |
February 27, 2018 |
|
David R. O’Bryan |
||
|
/s/ Fred N. Parker |
Director |
February 25, 2018 |
|
Fred N. Parker |
||
|
/s/ John C. Roach |
Director |
February 28, 2018 |
|
John C. Roach |
||
|
/s/ Marvin E. Strong, Jr. |
Director |
February 27, 2018 |
|
Marvin E. Strong, Jr. |
||
|
/s/ Fred Sutterlin |
Director |
February 26, 2018 |
|
Fred Sutterlin |
||
|
/s/ Judy Worth |
Director |
March 1, 2018 |
|
Judy Worth |
||
|
/s/ Mark A. Hampton |
Executive Vice President, Chief |
March 12, 2018 |
|
Mark A. Hampton |
Financial Officer, and Secretary (principal financial and accounting officer) |
INDEX OF EXHIBITS
|
Exhibit |
Page |
|
|
21 |
Subsidiaries of the Registrant |
125 |
|
23.1 |
Consent of Independent Registered Public Accounting Firm |
126 |
|
31.1 |
CEO Certification Pursuant to Section 302 of the Sarbanes-Oxley Act of 2002 |
127 |
|
31.2 |
CFO Certification Pursuant to Section 302 of the Sarbanes-Oxley Act of 2002 |
128 |
|
32 |
CEO and CFO Certifications Pursuant to 18 U.S.C. Section 1350, as Adopted Pursuant to Section 906 of the Sarbanes-Oxley Act of 2002 |
129 |
124