Attached files
| file | filename |
|---|---|
| EX-32.2 - EXHIBIT 32.2 - CIM Commercial Trust Corp | exhibit322201710k.htm |
| EX-32.1 - EXHIBIT 32.1 - CIM Commercial Trust Corp | exhibit321201710k.htm |
| EX-31.2 - EXHIBIT 31.2 - CIM Commercial Trust Corp | exhibit312201710k.htm |
| EX-31.1 - EXHIBIT 31.1 - CIM Commercial Trust Corp | exhibit311201710-k.htm |
| EX-23.1 - EXHIBIT 23.1 - CIM Commercial Trust Corp | exhibit231201710-k.htm |
| EX-21.1 - EXHIBIT 21.1 - CIM Commercial Trust Corp | exhibit211201710-k.htm |
| EX-10.20 - EXHIBIT 10.20 - CIM Commercial Trust Corp | exhibit1014cimcommercial.htm |
| EX-10.14 - EXHIBIT 10.14 - CIM Commercial Trust Corp | exhibit1020cimcommercial.htm |
UNITED STATES
SECURITIES AND EXCHANGE COMMISSION
Washington, D.C. 20549
FORM 10-K |
x | ANNUAL REPORT PURSUANT TO SECTION 13 OR 15(d) OF THE SECURITIES EXCHANGE ACT OF 1934 |
For the fiscal year ended December 31, 2017 | |
OR | |
o | TRANSITION REPORT PURSUANT TO SECTION 13 OR 15(d) OF THE SECURITIES EXCHANGE ACT OF 1934 |
Commission file number 1-13610
CIM COMMERCIAL TRUST CORPORATION
(Exact Name of Registrant as Specified in Its Charter)
Maryland (State or Other Jurisdiction of Incorporation or Organization) | 75-6446078 (I.R.S. Employer Identification No.) |
17950 Preston Road, Suite 600, Dallas, Texas 75252 (Address of Principal Executive Offices) | (972) 349-3200 (Registrant's telephone number, including area code) |
Securities registered pursuant to Section 12(b) of the Act:
Title of Each Class | Name of Each Exchange on Which Registered | |
Common stock, $0.001 par value per share | The Nasdaq Stock Market LLC (Nasdaq Global Market) | |
Series L preferred stock, $0.001 par value per share | The Nasdaq Stock Market LLC (Nasdaq Global Market) | |
Securities registered pursuant to Section 12(g) of the Act: None
Indicate by check mark if the registrant is a well-known seasoned issuer, as defined in Rule 405 of the Securities Act. Yes o No x
Indicate by check mark if the registrant is not required to file reports pursuant to Section 13 or Section 15(d) of the Act. Yes o No x
Indicate by check mark whether the registrant (1) has filed all reports required to be filed by Section 13 or 15(d) of the Securities Exchange Act of 1934 during the preceding 12 months (or for such shorter period that the registrant was required to file such reports), and (2) has been subject to such filing requirements for the past 90 days. Yes x No o
Indicate by check mark whether the registrant has submitted electronically and posted on its corporate Web site, if any, every Interactive Data File required to be submitted and posted pursuant to Rule 405 of Regulation S-T (§232.405 of this chapter) during the preceding 12 months (or for such shorter period that the registrant was required to submit and post such files). Yes x No o
Indicate by check mark if disclosure of delinquent filers pursuant to Item 405 of Regulation S-K (§229.405 of this chapter) is not contained herein, and will not be contained, to the best of registrant's knowledge, in definitive proxy or
information statements incorporated by reference in Part III of this Annual Report on Form 10-K or any amendment to this Annual Report on Form 10-K. o
Indicate by check mark whether the registrant is a large accelerated filer, an accelerated filer, a non-accelerated filer, a smaller reporting company, or an emerging growth company. See definition of "large accelerated filer," "accelerated filer," "smaller reporting company," and "emerging growth company" in Rule 12b-2 of the Exchange Act. (Check one):
Large accelerated filer o | Accelerated filer o | Non-accelerated filer o |
Smaller reporting company ý | Emerging growth company o | (Do not check if a smaller reporting company) |
If an emerging growth company, indicate by check mark if the registrant has elected not to use the extended transition period for complying with any new or revised financial accounting standards provided pursuant to Section 13(a) of the Exchange Act. o
Indicate by check mark whether the registrant is a shell company (as defined by Rule 12b-2 of the Act.) Yes o No x
As of June 30, 2017, the aggregate market value of the voting common stock held by non-affiliates of the registrant, computed by reference to the average high and low sales prices on the Nasdaq Global Market as of the close of business on June 30, 2017, was approximately $26.0 million. The registrant does not have any nonvoting common equities.
As of March 2, 2018, the registrant had outstanding 43,784,939 shares of common stock, par value $0.001 per share.
CIM COMMERCIAL TRUST CORPORATION
2017 ANNUAL REPORT ON FORM 10-K
Page | |||
i
Forward-Looking Statements
This Annual Report on Form 10-K contains certain forward-looking statements within the meaning of Section 27A of the Securities Act of 1933 (the "Securities Act") and Section 21E of the Securities Exchange Act of 1934, which are intended to be covered by the safe harbors created thereby. These statements include the plans and objectives of management for future operations, including plans and objectives relating to future growth of our business and availability of funds. Such forward-looking statements can be identified by the use of forward-looking terminology such as "may," "will," "expect," "intend," "might," "believe," "anticipate," "estimate," "could," "would" "continue," "pursue," or "should" or the negative thereof or other variations or similar words or phrases. The forward-looking statements expressed or implied herein are based on current expectations that involve numerous risks and uncertainties identified in this Annual Report on Form 10-K, including, without limitation, the risks identified under the caption "Item 1A—Risk Factors." Assumptions relating to the foregoing involve judgments with respect to, among other things, future economic, competitive and market conditions and future business decisions, all of which are difficult or impossible to predict accurately and many of which are beyond our control. Although we believe that the assumptions underlying the forward-looking statements are reasonable, any of the assumptions could be inaccurate and, therefore, there can be no assurance that the forward-looking statements expressed or implied in this Annual Report on Form 10-K will prove to be accurate. In light of the significant uncertainties inherent in the forward-looking statements expressed or implied herein, the inclusion of such information should not be regarded as a representation by us or any other person that our objectives and plans will be achieved. Readers are cautioned not to place undue reliance on forward-looking statements. Forward-looking statements speak only as of the date they are made. We do not undertake to update them to reflect changes that occur after the date they are made, except to the extent required by applicable securities laws.
1
PART I
Item 1. Business
Business Overview
The principal business of CIM Commercial Trust Corporation and its subsidiaries (which may be referred to in this Annual Report on Form 10-K as "we," "us," "our," "our company", "CIM Commercial" or the "Company") is to acquire, own, and operate Class A and creative office assets in vibrant and improving urban communities throughout the United States. These communities are located in areas that include traditional downtown areas and suburban main streets, which have high barriers to entry, high population density, improving demographic trends and a propensity for growth. We believe that the critical mass of redevelopment in such areas creates positive externalities, which enhance the value of substantially stabilized assets in the area. We believe that these assets will provide greater returns than similar assets in other markets, as a result of the improving demographics, public commitment, and significant private investment that characterize these areas.
We are operated by affiliates of CIM Group, L.P. ("CIM Group" or "CIM"). CIM Group is a vertically-integrated owner and operator of real assets with multi-disciplinary expertise and in-house research, acquisition, credit analysis, development, finance, leasing, and asset management capabilities. CIM Group is headquartered in Los Angeles, California and has offices in Oakland, California; Bethesda, Maryland; Dallas, Texas; New York, New York, Chicago, Illinois, and Phoenix, Arizona. See the captions "Overview and History of CIM Group", "CIM Urban Partnership Agreement" and "Investment Management Agreement" in "Item 1—Business" of this Annual Report on Form 10-K.
We seek to utilize the CIM platform to acquire and improve assets within CIM's qualified communities ("Qualified Communities"). We believe assets in these markets provide greater returns as a result of improving demographics, public commitment, and significant private investment within the areas. Over time, we seek to expand our real estate assets in communities targeted by CIM Group, supported by CIM Group's broad real estate capabilities, as part of our plan to prudently grow market value and earnings.
We primarily make acquisitions in substantially stabilized real estate and real estate-related assets located in areas that CIM has targeted. These areas include traditional downtown areas and suburban main streets, which have high barriers to entry, high population density, improving demographic trends and a propensity for growth. CIM believes that the critical mass of redevelopment in such areas creates positive externalities, which enhance the value of substantially stabilized assets in the area. CIM targets acquisitions of diverse types of real estate assets, including office, retail, for-rent and for-sale multifamily residential, hotel, parking, and signage through CIM's extensive network and its current opportunistic activities.
As of December 31, 2017, our real estate portfolio consisted of 20 assets, all of which are fee-simple properties. As of December 31, 2017, our 18 office properties (including one parking garage and two development sites, one of which is being used as a parking lot), totaling approximately 3.3 million rentable square feet, were 94.2% occupied and one hotel with an ancillary parking garage, which has a total of 503 rooms, had revenue per available room ("RevPAR") of $128.43 for the year ended December 31, 2017. For the year ended December 31, 2017, our office portfolio contributed approximately 73.7% of revenue from continuing operations, while our hotel contributed approximately 16.3%, our multifamily portfolio, which included five multifamily properties that were sold in 2017, contributed approximately 5.7% and our lending segment contributed approximately 4.3%.
2
Our office, multifamily and hotel assets are located in six U.S. markets. The breakdown by segment, market and submarket, as of December 31, 2017, is as follows:
Overview of our Real Estate Portfolio as of December 31, 2017
Office | ||||||||||
and Retail | ||||||||||
Rentable | ||||||||||
Square | Hotel | |||||||||
Property | Market | Sub-Market | Feet | Rooms | ||||||
Office | ||||||||||
1 Kaiser Plaza | Oakland, CA | Lake Merritt | 534,284 | — | ||||||
2101 Webster Street | Oakland, CA | Lake Merritt | 471,337 | — | ||||||
999 N Capitol Street | District of Columbia | Capitol Hill | 323,076 | — | ||||||
899 N Capitol Street | District of Columbia | Capitol Hill | 314,667 | — | ||||||
1901 Harrison Street | Oakland, CA | Lake Merritt | 275,087 | — | ||||||
830 1st Street | District of Columbia | Capitol Hill | 247,337 | — | ||||||
1333 Broadway | Oakland, CA | City Center | 240,887 | — | ||||||
2100 Franklin Street | Oakland, CA | Lake Merritt | 216,828 | — | ||||||
11620 Wilshire Boulevard | Los Angeles, CA | West Los Angeles | 194,677 | — | ||||||
3601 S Congress Avenue (1) | Austin, TX | South | 184,418 | — | ||||||
4750 Wilshire Boulevard | Los Angeles, CA | Mid-Wilshire | 143,361 | — | ||||||
260 Townsend Street | San Francisco, CA | South of Market | 66,682 | — | ||||||
11600 Wilshire Boulevard | Los Angeles, CA | West Los Angeles | 55,793 | — | ||||||
Lindblade Media Center (2) | Los Angeles, CA | West Los Angeles | 32,428 | — | ||||||
1130 Howard Street | San Francisco, CA | South of Market | 21,194 | — | ||||||
Total Office (15 Properties) | 3,322,056 | — | ||||||||
Other Ancillary Properties within Office Portfolio | ||||||||||
901 N Capitol Street (3) | District of Columbia | Capitol Hill | — | — | ||||||
2353 Webster Street Parking Garage | Oakland, CA | Lake Merritt | — | — | ||||||
2 Kaiser Plaza Parking Lot (4) | Oakland, CA | Lake Merritt | — | — | ||||||
Total Ancillary Office (3 Properties) | — | — | ||||||||
Total Office including Other Ancillary (18 Properties) | 3,322,056 | — | ||||||||
Hotel Portfolio (1 Property) | ||||||||||
Sheraton Grand Hotel | Sacramento, CA | Downtown/Midtown | — | 503 | ||||||
Other Ancillary Properties within Hotel Portfolio (1 Property) | ||||||||||
Sheraton Grand Hotel Parking Garage & Retail | Sacramento, CA | Downtown/Midtown | 9,453 | — | ||||||
TOTAL PORTFOLIO (20 Properties) | 3,331,509 | 503 | ||||||||
(1) | 3601 S Congress Avenue consists of ten buildings. |
(2) | Lindblade Media Center consists of three buildings. |
3
(3) | 901 N Capitol Street is a 39,696 square foot parcel of land located between 899 and 999 N Capitol Street. We have designed and are entitled to develop a building having 271,233 rentable square feet. |
(4) | 2 Kaiser Plaza Parking Lot is a 44,642 square foot parcel of land currently being used as a surface parking lot. We are entitled to develop a building, which we are in the process of designing, having approximately 425,000 to 800,000 rentable square feet. |
Segments
Our reportable segments consist of three types of commercial real estate properties, namely office, hotel and multifamily, which consisted of five properties that were sold in 2017, as well as a segment for our lending business. Information related to our reportable segments for the years ended December 31, 2017, 2016 and 2015 is set forth in Note 20 to our consolidated financial statements included in this Annual Report on Form 10-K.
Business Objectives and Growth Strategies
Our two primary goals are (a) consistently growing our net asset value ("NAV") and cash flow per share of common stock, $0.001 par value per share ("Common Stock"), through our principal business described above in "Item 1—Business Overview," and (b) providing liquidity to our common stockholders at prices reflecting our NAV and cash flow prospects. In that regard, in June 2016 we completed a tender offer for 10,000,000 shares of Common Stock at a price of $21.00 per share of Common Stock; in September 2016, we repurchased in a privately negotiated transaction 3,628,116 shares of our Common Stock at a price of $22.00 per share from Urban Partners II, LLC ("Urban II"), an affiliate of CIM Group; in June 2017, we repurchased in a privately negotiated transaction 26,181,818 shares of our Common Stock at a price of $22.00 per share from Urban II; and in December 2017, we repurchased in a privately negotiated transaction, 14,090,909 shares of our Common Stock at a price of $22.00 per share from Urban II. Additionally, in April 2017, we declared and paid a special cash dividend of $0.28 per share of Common Stock, or $601,000, to the common stockholders that did not participate in the September 2016 private repurchase; in June 2017, we declared and paid a special cash dividend of $1.98 per share of Common Stock, or $4,271,000, to the common stockholders that did not participate in the June 2017 private repurchase; and in December 2017, we declared a special cash dividend of $0.73 per share of Common Stock, or $1,575,000, to the common stockholders that did not participate in the December 2017 private repurchase, which was paid in January 2018. These special cash dividends allowed common stockholders that did not participate in the September 2016, June 2017 and December 2017 private repurchases to receive the economic benefits of such repurchases.
We seek to utilize the CIM platform to acquire and improve assets within CIM's Qualified Communities. We believe assets in these markets provide greater returns as a result of improving demographics, public commitment, and significant private investment within the areas. Over time, we seek to expand our real estate assets in communities targeted by CIM Group, supported by CIM Group's broad real estate capabilities, as part of our plan to prudently grow market value and earnings. As a matter of prudent management, we also regularly evaluate each asset within our portfolio as well as our strategies. Such review may result in dispositions when an asset no longer fits our overall objectives or strategies or when our view of the market value of such asset is equal to or exceeds its intrinsic value. As a result of such review, from November 2015 to December 2017, we sold 15 properties including eight office properties (including one parking garage), two hotel properties, and five multifamily properties.
CIM seeks to maximize the value of its holdings through active asset management. CIM has extensive in-house research, acquisition, credit analysis, development, financing, leasing and asset management capabilities, which leverage its deep understanding of urban communities to position properties for multiple uses and to maximize operating income. As a fully integrated owner and operator, CIM's asset management capabilities are complemented by its in-house property management capabilities. Property managers prepare annual capital and operating budgets and monthly operating reports, monitor results and oversee vendor services, maintenance and capital improvement schedules. In addition, they ensure that revenue objectives are met, lease terms are followed, receivables are collected, preventative maintenance programs are implemented, vendors are evaluated and expenses are controlled. CIM's asset management committee (the "Asset Management Committee") reviews and approves strategic plans for each asset, including financial, leasing, marketing, property positioning and disposition plans. In addition, the Asset Management Committee reviews and approves the annual business plan for each property, including its capital and operating budget. CIM's organizational structure provides for continuity through multi-disciplinary teams responsible for an asset from the time of the original recommendation, through the implementation of the asset's business plan, and any disposition activities.
4
Competitive Advantages
We believe that CIM Group's experienced team and vertically-integrated and multi-disciplinary organization, coupled with its community-focused and disciplined urban real estate philosophy, results in a competitive advantage that benefits us. Additionally, CIM's strategy is complemented by a number of other competitive advantages including its prudent use of leverage, underwriting approach, disciplined capital deployment, and strong network of relationships. CIM's competitive advantages include:
• | Vertically-Integrated Organization and Team |
CIM is managed by its senior management team, which is comprised of its three founders, Shaul Kuba, Richard Ressler and Avi Shemesh, and includes 12 other principals. CIM Group is vertically-integrated and organized into 12 functional groups including Investments; Development; Asset Management; Finance & Accounting; Strategic Planning & Analysis; Legal; Compliance; Human Resources; IT, Operations & Risk Management; Partner & Co-Investor Relations and Product Management; Capital Markets; and Press Relations. CIM also has an internal audit team that sits outside these functional groups.
To support CIM's organic growth and related platforms, CIM has invested substantial time and resources in building a strong and integrated team of approximately 440 experienced professionals. Each of CIM Group's departments is managed by seasoned professionals and CIM continues to develop its management team, which represents the next generation of CIM's leaders. In addition to developing a core team of principals and senior level management, CIM has proactively managed its growth through career development and mentoring at both the mid and junior staffing levels, and has hired ahead of its needs, thus ensuring appropriate management and staffing.
CIM leverages the deep operating and industry experience of its principals and professionals, as well as their extensive relationships, to source and execute opportunistic, stabilized, and infrastructure acquisitions. Each opportunity is overseen by a dedicated team comprised of an "Oversight Principal" (one of Richard Ressler, Avi Shemesh, Shaul Kuba, Charles E. Garner II, our Chief Executive Officer, Kelly Eppich, Jennifer Gandin, John Bruno and Jason Schreiber), a team lead (vice president level and above), associate vice presidents and associates, as necessary, who are responsible for managing the asset from sourcing through underwriting, acquisition, development (if required), asset management, and disposition. As part of this process, the team draws upon CIM's extensive in-house expertise in legal matters, finance, development, leasing, and asset management. Each dedicated investment team is purposefully staffed with professionals from multiple CIM offices, regardless of the location of the asset being evaluated. As a result, all investment professionals work across a variety of Qualified Communities and CIM's knowledge base is shared across all of its offices.
• | Community Qualification |
Since inception, CIM's proven community qualification process has served as the foundation for its strategy. CIM targets high barrier to entry markets and submarkets with high population density and applies rigorous research to qualify for potential acquisitions. Since 1994, CIM has qualified 110 communities in high barrier to entry markets and has deployed capital in 67 of these Qualified Communities. CIM examines the characteristics of a market to determine whether the district justifies the extensive efforts its investment professionals undertake in reviewing and making potential acquisitions in its Qualified Communities. Qualified Communities generally fall into one of two categories: (i) transitional urban districts that have dedicated resources to become vibrant urban communities and (ii) well-established, thriving urban areas (typically major central business districts).
As more fully described in "Item 1—Business—Overview and History of CIM Group—Principles," once a community is qualified, CIM believes it continues to differentiate itself through the following business principles: (i) product non-specific—CIM has extensive experience owning and operating a diverse range of property types, including retail, residential, office, parking, hotel, signage, and mixed-use, which gives CIM the ability to execute and capitalize on its urban strategy effectively; (ii) community-based tenanting—CIM's strategy focuses on the entire community and the best use of assets in that community; owning a significant number of key properties in an area better enables CIM to meet the needs of national retailers and office tenants and thus optimize the value of these real estate properties; (iii) local market leadership with North American footprint—CIM maintains local market knowledge and relationships, along with a diversified North American presence, through its 110 Qualified Communities (thus, CIM has the flexibility to deploy capital in its Qualified Communities only when the market environment meets CIM's underwriting standards); and (iv) deploying capital across the capital stack—CIM has
5
extensive experience structuring transactions across the capital stack including equity, preferred equity, debt and mezzanine positions, giving it the flexibility to structure transactions in efficient and creative ways.
• | Discipline |
CIM's strategy relies on its sound business plan and value creation execution to produce returns, rather than financial engineering. CIM Group's underwriting of its potential acquisitions is performed generally both on a leveraged and unleveraged basis. Additionally, CIM has generally not utilized recourse or cross-collateralized debt due to its conservative underwriting standards.
CIM employs multiple underwriting scenarios when evaluating potential acquisition opportunities. CIM Group generally underwrites potential acquisitions utilizing long-term average exit capitalization rates for similar product types and long-term average interest rates. Where possible, these long-term averages cross multiple market cycles, thereby mitigating the risk of cyclical volatility. CIM's "long-term average" underwriting is based on its belief, reinforced by its experience through multiple market cycles, that over the life of any given fund that it manages, such fund should be able to exit its holdings at long-term historical averages. CIM also underwrites a "current market case" scenario, which generally utilizes current submarket specific exit assumptions and interest rates, in order to reflect anticipated results under current market conditions. CIM believes that utilizing multiple underwriting scenarios enables CIM to assess potential returns relative to risk within a range of potential outcomes.
Strategy
Our strategy is to continue to primarily acquire Class A and creative office assets in vibrant and improving urban communities throughout the United States in a manner that will allow us to increase our NAV and cash flow per share of Common Stock. Our strategy is centered around CIM's community qualification process. We believe this strategy provides us with a significant competitive advantage when making urban real estate acquisitions. The qualification process generally takes between six months and five years and is a critical component of CIM's evaluation. CIM examines the characteristics of a market to determine whether the district justifies the extensive efforts CIM undertakes in reviewing and making potential acquisitions in its Qualified Communities. Qualified Communities generally fall into one of two categories: (i) transitional urban districts that have dedicated resources to become vibrant urban communities and (ii) well-established, thriving urban areas (typically major central business districts). Qualified Communities are distinct districts which have dedicated resources to become or are currently vibrant communities where people can live, work, shop and be entertained—all within walking distance or close proximity to public transportation. These areas also generally have high barriers to entry, high population density, improving demographic trends and a propensity for growth. CIM believes that a vast majority of the risks associated with acquiring real estate are mitigated by accumulating local market knowledge of the community where the asset is located. CIM typically spends significant time and resources qualifying targeted communities prior to making any acquisitions. Since 1994, CIM Group has qualified 110 communities and has deployed capital in 67 of these Qualified Communities. Although we may not deploy capital exclusively in Qualified Communities, it is expected that most of our assets will be identified through this systematic process. Our strategy may also include side-by-side acquisitions with one or more funds of CIM including, without limitation, a side-by-side or direct deployment of capital in a perpetual-life real estate debt fund that principally originates loans secured directly or indirectly by commercial real estate properties. Further, as part of our strategy, we may deploy capital in or originate loans that are secured directly or indirectly by properties primarily located in Qualified Communities that meet our strategy. Such loans may include limited and/or non-recourse junior (mezzanine, B-note or 2nd lien) and senior acquisition, bridge or repositioning loans.
6
2017 Acquisitions
During 2017, we acquired a 100% fee-simple interest in an office property known as 1130 Howard Street from an unrelated third-party. The office property has approximately 21,194 square feet and is located in San Francisco, California. The acquisition was funded with proceeds from our series L preferred stock ("Series L Preferred Stock") offering, and the acquired property is reported as part of the office segment.
Asset | Date of | Purchase | ||||||||
Property | Type | Acquisition | Square Feet | Price (1) | ||||||
(in thousands) | ||||||||||
1130 Howard Street, San Francisco, CA | Office | December 29, 2017 | 21,194 | $ | 17,717 | |||||
(1) | Transaction costs that were capitalized and assumption of liabilities totaled $1,915,000, which are excluded from the purchase price above. |
Additionally, in December 2017, we entered into a purchase and sale agreement with an unrelated third-party for the acquisition of a 100% fee-simple interest in an office property located at 9460 Wilshire Boulevard in Beverly Hills, California. The acquisition subsequently closed in January 2018 for a purchase price of $132,000,000, which excludes transaction costs of $48,000 that were incurred and capitalized in connection with this acquisition. The property has approximately 68,866 square feet of office space and 22,884 square feet of retail space. The acquisition was funded with proceeds from our Series L Preferred Stock offering, and the acquired property will be reported as part of the office segment.
7
2017 Dispositions
The following is a schedule of our dispositions during the year ended December 31, 2017. We sold 100% fee-simple interests in the following properties, other than 800 N Capitol, in which we sold a 100% leasehold interest, to unrelated third-parties. The results of operations of the following dispositions have been included in the consolidated statements of operations through the date of disposition.
Property | Asset Type | Date of Sale | Square Feet or Units (1) | Sales Price | Transaction Costs | Gain on Sale | ||||||||||||
(in thousands) | ||||||||||||||||||
211 Main Street, San Francisco, CA | Office | March 28, 2017 | 417,266 | $ | 292,882 | $ | 2,943 | (2) | $ | 187,734 | ||||||||
3636 McKinney Avenue, Dallas, TX | Multifamily | May 30, 2017 | 103 | $ | 20,000 | $ | 1,320 | (2) | $ | 5,488 | ||||||||
3839 McKinney Avenue, Dallas, TX | Multifamily | May 30, 2017 | 75 | $ | 14,100 | $ | 938 | (2) | $ | 4,224 | ||||||||
200 S College Street, Charlotte, NC | Office | June 8, 2017 | 567,865 | $ | 148,500 | $ | 833 | $ | 45,906 | |||||||||
980 9th and 1010 8th Street, Sacramento, CA | Office & Parking Garage | June 20, 2017 | 485,926 | $ | 120,500 | $ | 1,119 | $ | 34,559 | |||||||||
4649 Cole Avenue, Dallas, TX | Multifamily | June 23, 2017 | 334 | $ | 64,000 | $ | 3,311 | (2) | $ | 25,836 | ||||||||
800 N Capitol Street, Washington, D.C. | Office | August 31, 2017 | 311,593 | $ | 119,750 | $ | 2,388 | $ | 34,456 | |||||||||
7083 Hollywood Boulevard, Los Angeles, CA (3) | Office | September 21, 2017 | 82,193 | $ | 42,300 | $ | 584 | $ | 23,670 | |||||||||
47 E 34th Street, New York, NY | Multifamily | September 26, 2017 | 110 | $ | 80,000 | $ | 3,157 | $ | 16,556 | |||||||||
370 L'Enfant Promenade, Washington, D.C. (4) | Office | October 17, 2017 | 409,897 | $ | 126,680 | $ | 2,451 | $ | 2,994 | |||||||||
4200 Scotland Street, Houston, TX (3) | Multifamily | December 15, 2017 | 308 | $ | 64,025 | $ | 597 | $ | 20,314 | |||||||||
(1) | Reflects the square footage of office properties and number of units of multifamily properties. |
(2) | Includes a prepayment penalty incurred in connection with the prepayment of the mortgage on the property in the amount of $1,508,000 at 211 Main Street, $1,143,000 at 3636 McKinney Avenue, $758,000 at 3839 McKinney Avenue, and $2,812,000 at 4649 Cole Avenue. |
(3) | A mortgage collateralized by this property was assumed by the buyer in connection with our sale of the property. |
(4) | In August 2017, we negotiated an agreement with an unrelated third-party for the sale of this property. We determined the book value of this property exceeded its estimated fair value less costs to sell, and as such, an impairment charge of $13,100,000 was recognized at such time for the year ended December 31, 2017. Our determination of fair value was based on the sales price negotiated with the third-party buyer. |
Financing Strategy
We currently have substantial borrowing capacity, and will likely finance our future activities through one or more of the following methods: (i) offerings of shares of Common Stock, preferred stock, senior unsecured securities, and/or other equity and debt securities; (ii) credit facilities and term loans; (iii) the addition of senior recourse or non-recourse debt using target acquisitions as well as existing assets as collateral; (iv) the sale of existing assets; and/or (v) cash flows from operations. During the prior three years, we have not offered our Common Stock or other securities in exchange for property, but may engage in such activities in the future. We expect to employ leverage levels that are comparable to those of other commercial real estate investment trusts ("REITs") engaged in business strategies similar to our own.
8
Risk Management
As part of its risk management strategy, CIM continually evaluates our assets and actively manages the risks involved in our business strategies. CIM's investment professionals provide asset management oversight by closely monitoring the performance of our assets relative to market and industry benchmarks and internal underwriting assumptions using direct knowledge of local markets provided by CIM's in-house asset management, property management, and leasing professionals. In-house property management capabilities include monthly and annual budgeting and reporting as well as vendor services management, property maintenance and capital expenditures management. Property management seeks to ensure that revenue objectives are met, lease terms are followed, receivables are collected, preventative maintenance programs are implemented, vendors are evaluated and expenses are controlled. The Asset Management Committee oversees asset management and consists of certain of the Oversight Principals, each of whom has extensive experience in acquisitions, development, asset and property management and leasing, who are ultimately responsible for the performance of the asset, and the chief compliance officer. The Oversight Principals work with each CIM department to ensure that every asset benefits from the full range of CIM's real estate expertise. CIM believes that empowering its most seasoned investment professionals to bring their breadth of experience to bear directly on assets will optimize returns.
The Oversight Principals meet informally on a frequent basis, generally weekly, to review and discuss the performance of assets, and meet formally at least annually to review and approve strategic plans for our assets based on their review of: financial and operational analyses, operating strategies and agreements, tenant composition and marketing, asset positioning, market conditions affecting our assets, hold/sell analyses and timing considerations, and the annual business plan for each asset, including its capital and operating budget.
The size, composition, and policies of the Asset Management Committee may change from time to time.
Regulatory Matters
Environmental Matters
Environmental laws regulate, and impose liability for, the release of hazardous or toxic substances into the environment. Under some of these laws, an owner or operator of real estate may be liable for costs related to soil or groundwater contamination on or migrating to or from its property. In addition, persons who arrange for the disposal or treatment of hazardous or toxic substances may be liable for the costs of cleaning up contamination at the disposal site.
These laws often impose liability regardless of whether the person knew of, or was responsible for, the presence of the hazardous or toxic substances that caused the contamination. The presence of, or contamination resulting from, any of these substances, or the failure to properly remediate them, may adversely affect our ability to sell or rent our property, to borrow using the property as collateral or create lender's liability for us. In addition, third parties exposed to hazardous or toxic substances may sue for personal injury damages and/or property damages. For example, some laws impose liability for release of or exposure to asbestos-containing materials. As a result, in connection with our former, current or future ownership, operation, and development of real properties, or our role as a lender for loans secured directly or indirectly by real estate properties, we may be potentially liable for investigation and cleanup costs, penalties and damages under environmental laws.
Although many of our properties have been subjected to preliminary environmental assessments, known as Phase I assessments, by independent environmental consultants that identify certain liabilities, Phase I assessments are limited in scope, and may not include or identify all potential environmental liabilities or risks associated with a property. Unless required by applicable law, we may decide not to further investigate, remedy or ameliorate the liabilities disclosed in the Phase I assessments.
Further, these or other environmental studies may not identify all potential environmental liabilities or accurately assess whether we will incur material environmental liabilities in the future. If we do incur material environmental liabilities in the future, our business, financial condition, results of operations, cash flow or our ability to satisfy our debt service obligations or to maintain our level of distributions on our Common Stock or Preferred Stock could be materially adversely affected.
Americans with Disabilities Act of 1990
Under the Americans with Disabilities Act of 1990 (the "ADA"), all public accommodations must meet federal requirements related to access and use by disabled persons. Although we believe that our properties substantially comply with present requirements of the ADA, we have not conducted an audit or investigation of all of our properties to determine our compliance. If one or more of our properties or future properties are not in compliance with the ADA, we might be required to
9
take remedial action which would require us to incur additional costs to bring the property into compliance. We cannot predict the ultimate amount, if any, of the cost of compliance with the ADA.
Competition
We compete with others engaged in the acquisition, origination, development, and operation of real estate and real estate-related assets. Our competitors include REITs, insurance companies, pension funds, private equity funds, sovereign wealth funds, hedge funds, mortgage banks, investment banks, commercial banks, savings and loan associations, specialty finance companies, and private and institutional investors and financial companies that pursue strategies similar to ours. Some of our competitors may be larger than us with greater access to capital and other resources and may have other advantages over us. In addition, some of our competitors may have higher risk tolerances or lower profitability targets than us, which could allow them to pursue new business more aggressively than us. We believe that our relationship with CIM Group gives us a competitive advantage that allows us to operate more effectively in the markets in which we conduct our business.
Overview and History of CIM Group
CIM Group was founded in 1994 by Shaul Kuba, Richard Ressler and Avi Shemesh and has owned and operated approximately $27.5 billion of assets across its vehicles as of December 31, 2017.1 CIM Group's successful track record is anchored by CIM's community-oriented approach to urban acquisitions as well as a number of other competitive advantages including its prudent use of leverage, underwriting approach, disciplined capital deployment, vertically-integrated capabilities and strong network of relationships.
CIM Group is headquartered in Los Angeles, California and has offices in Oakland, California; Bethesda, Maryland; Dallas, Texas; New York, New York; Chicago, Illinois, and Phoenix, Arizona. CIM has generated strong risk-adjusted returns across multiple market cycles by focusing on improved asset and community performance, and capitalizing on market inefficiencies and distressed situations.
1Assets Owned and Operated represents (i) (a) for real assets, the aggregate total gross assets (GAV) at fair value, including the shares of such assets owned by joint venture partners and co-investments, owned and operated by CIM on behalf of partners (including where CIM invests alongside for its own account) and co-investors, whether or not CIM has investment discretion or (b) for operating companies, the aggregate GAV less debt, including the shares of such assets owned by joint venture partners and co-investments, owned and operated by CIM on behalf of partners (including where CIM invests alongside for its own account) and co-investors, whether or not CIM has investment discretion (not in duplication of the assets described in (i)(a)), plus (ii) the aggregate unfunded commitments, as of December 31, 2017 (the “Report Date”). The GAV is calculated in accordance with U.S. generally accepted accounting principles on a fair value basis (the “Book Value”) and generally represents the investment’s third-party appraised value as reported within the applicable fund’s unaudited financial statements as of the Report Date, but in the case of CIM’s Cole Net-Lease Asset strategy described below GAV or Book Value generally represents undepreciated cost (as reflected in SEC-filed financial statements) as of September 30, 2017. The only investment currently held by CIM REIT (as defined below) consists of shares of our Common Stock; the Book Value of CIM REIT is determined by assuming the underlying assets of CMCT are liquidated based upon the third-party appraised value. CIM does not presently view the market price of our Common Stock to be a meaningful indication of the fair value of CIM REIT’s interest in CMCT due to the fact that the publicly-traded shares of our Common Stock represent less than 4% of the outstanding Common Stock of CMCT and are thinly-traded. Assets Owned and Operated also includes the assets owned/operated by CIM’s Cole Net-Lease Asset strategy (formerly Cole Capital), which was under contract to be acquired by a CIM affiliate as of the Report Date and subsequently closed on February 1, 2018. The assets owned/operated by CIM’s Cole Net-Lease Asset strategy represent approximately $7.6 billion of CIM's reported Assets Owned and Operated of $27.5 billion. Equity Owned and Operated, representing the NAV (as defined below) before incentive fee allocation, plus binding unfunded commitments, is $15.5 billion as of the Report Date. NAV is based upon the aggregate amounts that would be distributable assuming a “hypothetical liquidation” on the date of determination, assuming that: (x) investments are sold at their Book Value (as defined above); (y) debts are paid and other assets are collected; and (z) appropriate adjustments and/or allocations between equity investors are made in accordance with applicable documents, in each case as determined in accordance with applicable accounting guidance. Assets Owned and Operated for CMMT Partners, L.P. (which represents assets under management), a perpetual-life real estate debt fund, is $0.3 billion as of the Report Date and Equity Owned and Operated for CMMT Partners, L.P. (which represents equity under management), is $0.3 billion as of the Report Date.
10
Principles
As described under the captions "Business Objectives and Growth Strategies" and "Competitive Advantages" in "Item 1—Business" of this Annual Report on Form 10-K, the community qualification process is one of CIM Group's core competencies, which demonstrates a disciplined program and strategic outlook on urban communities. Once a community is qualified, CIM Group believes it continues to differentiate itself through the following business principles:
• | Product Non-Specific: CIM has extensive experience owning and operating a diverse range of property types, including retail, residential, office, parking, hotel, signage, and mixed-use, which gives CIM the ability to execute and capitalize on its urban strategy effectively. Successful acquisitions require selecting the right markets coupled with providing the right product. CIM's experience with multiple asset types does not predispose CIM Group to select certain asset types, but instead ensures that they deliver a product mix that is consistent with the market's requirements and needs. Additionally, there is a growing trend towards developing mixed-use real estate properties in urban markets which requires a diversified platform to successfully execute. |
• | Community-Based Tenanting: CIM's strategy focuses on the entire community and the best use of assets in that community. Owning a significant number of key properties in an area better enables CIM to meet the needs of national retailers and office tenants and thus optimize the value of these real estate properties. CIM believes that its community perspective gives it a significant competitive advantage in attracting tenants to its retail, office and mixed-use properties and creating synergies between the different tenant types. |
• | Local Market Leadership with North American Footprint: CIM maintains local market knowledge and relationships, along with a diversified North American presence, through its 110 Qualified Communities. Thus, CIM has the flexibility to deploy capital in its Qualified Communities only when the market environment meets CIM's underwriting standards. CIM does not need to acquire assets in a given community or product type at a specific time due to its broad proprietary pipeline of communities. |
• | Deploying Capital Across the Capital Stack: CIM has extensive experience structuring transactions across the capital stack including equity, preferred equity, debt and mezzanine positions, giving it the flexibility to structure transactions in efficient and creative ways. |
CIM Urban Partnership Agreement
Our subsidiary, CIM Urban Partners, L.P. ("CIM Urban"), is governed by CIM Urban's partnership agreement (the "CIM Urban Partnership Agreement"). The general partner of CIM Urban, Urban Partners GP, LLC ("CIM Urban GP"), is an affiliate of CIM Group and has the full, exclusive and complete right, power, authority, discretion and responsibility vested in or assumed by a general partner of a limited partnership under the Delaware Revised Uniform Limited Partnership Act and as otherwise provided by law and is vested with the full, exclusive and complete right, power and discretion to operate, manage and control the affairs of CIM Urban, subject to the terms of the CIM Urban Partnership Agreement.
Removal of General Partner
The class A members of CIM Urban REIT, LLC ("CIM REIT"), an affiliate of CIM Group, upon a two-thirds vote of the interests of such members, may remove and replace CIM Urban GP as the general partner of CIM Urban if (a) certain affiliates and related parties of CIM Urban GP cease to own at least 85% of the class A membership units of CIM REIT that they have acquired or (b) any two of Shaul Kuba, Richard Ressler or Avi Shemesh cease to be actively engaged in the management of the general partner.
Amendments
Subject to certain limited exceptions, amendments of the CIM Urban Partnership Agreement may be adopted only with the consent of the majority in interest of the class A members of CIM REIT who are not affiliates of CIM Urban GP.
Liability for Acts and Omissions
None of CIM Urban GP or any of its affiliates, members, stockholders, partners, managers, officers, directors, employees, agents and representatives will have any liability in damages or otherwise to any limited partner, any investors in CIM REIT or CIM Urban, and CIM Urban will indemnify such persons from and against any and all liabilities, obligations, losses, damages, penalties, actions, judgments, suits, proceedings, costs, expenses and disbursements of any kind which may be
11
imposed on, incurred by or asserted against such persons in any way relating to or arising out of any action or inaction on the part of such persons when acting on behalf of CIM Urban or any of its investments, except for those liabilities that result from such persons' fraud, gross negligence, willful misconduct or breach of the terms of the CIM Urban Partnership Agreement or any other agreement between such person and CIM Urban or its affiliates.
Investment Management Agreement
In May 2005, CIM Urban and CIM Urban REIT Management, L.P., each an affiliate of CIM REIT and CIM Group, entered into an investment management agreement, pursuant to which CIM Urban engaged CIM Urban REIT Management, L.P. to provide certain services to CIM Urban. CIM Investment Advisors, LLC, an affiliate of CIM REIT and CIM Group, registered with the Securities and Exchange Commission (the "SEC") as an investment adviser and, in connection with such registration, CIM Urban entered into a new investment management agreement with CIM Investment Advisors, LLC in December 2015 (the "Investment Management Agreement"), on terms and in scope substantially similar to those of the previous agreement, and the previous investment management agreement was terminated. The "Operator" refers to CIM Urban REIT Management, L.P. prior to December 10, 2015 and to CIM Investment Advisors, LLC on and after December 10, 2015.
CIM Urban pays asset management fees to the Operator on a quarterly basis in arrears. The fee is calculated as a percentage of the daily average adjusted fair value of CIM Urban's assets:
Daily Average Adjusted Fair | ||||||||
Value of CIM Urban's Assets | Quarterly Fee | |||||||
From Greater of | To and Including | Percentage | ||||||
(in thousands) | ||||||||
$ | — | $ | 500,000 | 0.2500% | ||||
500,000 | 1,000,000 | 0.2375% | ||||||
1,000,000 | 1,500,000 | 0.2250% | ||||||
1,500,000 | 4,000,000 | 0.2125% | ||||||
4,000,000 | 20,000,000 | 0.1000% | ||||||
For the years ended December 31, 2017, 2016 and 2015, the Operator earned asset management fees of $22,229,000, $25,753,000 and $24,882,000, respectively.
The Operator is responsible for the payment of all costs and expenses relating to the general operation of its business, including administrative expenses, employment expenses and office expenses. All costs and expenses incurred by the Operator on behalf of CIM Urban are borne by CIM Urban. In addition, CIM Urban will indemnify the Operator against losses, claims, damages or liabilities, and reimburse the Operator for its legal and other expenses, in each case incurred in connection with any action, proceeding or investigation arising out of or in connection with CIM Urban's business or affairs, except to the extent such losses or expenses result from fraud, gross negligence or willful misconduct of, or a breach of the terms of the Investment Management Agreement by the Operator or with respect to CIM Urban REIT Management L.P., any violation of securities law or any other intentional or criminal wrongdoing. Under the Investment Management Agreement between CIM Urban and CIM Urban REIT Management L.P., CIM Urban REIT Management L.P. is obligated to indemnify CIM Urban against any losses, claims, damages or liabilities to which CIM Urban becomes subject in connection with any matter arising out of or in connection with CIM Urban's business or affairs that results from CIM Urban REIT Management L.P.'s fraud, gross negligence, willful misconduct or breach of such Investment Management Agreement.
Nothing in the Investment Management Agreement limits or restricts the right of any partner, officer or employee of the Operator to engage in any other business or to devote his time and attention in part to any other business. Nothing in the Investment Management Agreement limits or restricts the right of the Operator to engage in any other business or to render services of any kind to any other person.
The Investment Management Agreement will remain in effect until CIM Urban is dissolved or CIM Urban and the Operator otherwise mutually agree.
12
Master Services Agreement
On March 11, 2014, we entered into a master services agreement (the "Master Services Agreement") with CIM Service Provider, LLC (the "Administrator"), an affiliate of CIM Group, pursuant to which the Administrator has agreed to provide, or arrange for other service providers to provide, management and administration services (the "Base Services") to CIM Commercial and its subsidiaries following the merger between CIM Urban and PMC Commercial Trust completed on March 11, 2014 (the "Merger"). Pursuant to the Master Services Agreement, we appointed an affiliate of CIM Group as the administrator of CIM Urban GP ("Urban GP Administrator"). Under the Master Services Agreement, CIM Commercial pays a base service fee (the "Base Service Fee") to the Administrator initially set at $1,000,000 per year (subject to an annual escalation by a specified inflation factor beginning on January 1, 2015), payable quarterly in arrears. For the years ended December 31, 2017, 2016 and 2015, the Administrator earned a Base Service Fee of $1,060,000, $1,043,000 and $1,010,000, respectively. In addition, pursuant to the terms of the Master Services Agreement, the Administrator may receive compensation and/or reimbursement for performing certain services for CIM Commercial and its subsidiaries that are not covered under the Base Service Fee. During the years ended December 31, 2017, 2016 and 2015, such services performed by the Administrator included accounting, tax, reporting, internal audit, legal, compliance, risk management, IT, human resources and corporate communications. The Administrator's compensation is based on the salaries and benefits of the employees of the Administrator and/or its affiliates who performed these services (allocated based on the percentage of time spent on the affairs of CIM Commercial and its subsidiaries). For the years ended December 31, 2017, 2016 and 2015, we expensed $3,065,000, $3,120,000 and $2,993,000, respectively, for such services which are included in asset management and other fees to related parties.
On January 1, 2015, we entered into a Staffing and Reimbursement Agreement with an affiliate of CIM Group, CIM SBA Staffing, LLC ("CIM SBA"), and our subsidiary, PMC Commercial Lending, LLC. The agreement provides that CIM SBA will provide personnel and resources to us and that we will reimburse CIM SBA for the costs and expenses of providing such personnel and resources. For the years ended December 31, 2017, 2016, and 2015, we incurred expenses related to services subject to reimbursement by us under this agreement of $3,464,000, $3,555,000, and $3,850,000, respectively, which are included in asset management and other fees to related parties for lending segment costs included in continuing operations, $433,000, $411,000, and $434,000, respectively, for corporate services, which are included in asset management and other fees to related parties, and $0, $550,000, and $777,000, respectively, which are included in discontinued operations. For the year ended December 31, 2015, we expensed $1,638,000 for transaction costs paid to CIM SBA for reimbursement of costs in connection with the sale of substantially all of our commercial mortgage loans to an unrelated third-party. In addition, for the years ended December 31, 2017, 2016 and 2015, we deferred personnel costs of $429,000, $249,000 and $282,000, respectively, associated with services provided for originating loans.
Other Services
CIM Management, Inc. and certain of its affiliates (collectively, the "CIM Management Entities"), all affiliates of CIM REIT and CIM Group, provide property management, leasing, and development services to CIM Urban. The CIM Management Entities earned property management fees, which are included in rental and other property operating expenses, totaling $5,034,000, $5,630,000 and $5,814,000 for the years ended December 31, 2017, 2016 and 2015, respectively. CIM Urban also reimbursed the CIM Management Entities $8,465,000, $8,630,000 and $8,319,000 during the years ended December 31, 2017, 2016 and 2015, respectively, for the cost of on-site personnel incurred on behalf of CIM Urban, which is included in rental and other property operating expenses. The CIM Management Entities earned leasing commissions of $982,000, $2,522,000 and $697,000 for the years ended December 31, 2017, 2016, and 2015, respectively, which were capitalized to deferred charges. In addition, the CIM Management Entities earned construction management fees of $1,654,000, $942,000 and $1,055,000 for the years ended December 31, 2017, 2016 and 2015, respectively, which were capitalized to investments in real estate.
On October 1, 2015, an affiliate of CIM Group entered into a 5-year lease renewal with respect to a property owned by the Company. For the years ended December 31, 2017, 2016 and 2015, we recorded rental and other property income related to this tenant of $108,000, $108,000 and $104,000, respectively.
Lending Segment
In order to allow CIM Commercial to increase its focus on Class A and creative office assets, our Board of Directors approved a plan in December 2014 for the lending segment that, when completed, would have resulted in the deconsolidation of the lending segment, which at that time was focused on small business lending in the hospitality industry. In July 2015, to maximize value, we modified our strategy from a strategy of selling the lending segment as a whole to a strategy of soliciting buyers for components of the business, including our commercial mortgage loans and our platform for lending under the 7(a) Guaranteed Loan Program (the "7(a) Program") of the Small Business Administration (the "SBA"). This change in the sale
13
methodology resulted in the need to extend the period to complete the sale of the remainder of the lending segment beyond one year. On December 17, 2015, pursuant to the modified plan, we sold substantially all of our commercial mortgage loans with a carrying value of $77,121,000 to an unrelated third-party and recognized a gain of $5,151,000. In September 2016, we discontinued our efforts to sell the SBA 7(a) lending platform, and the activities related to the SBA 7(a) lending platform have been reclassified to continuing operations for all periods presented. On December 29, 2016, we sold our commercial real estate lending subsidiary, which was classified as held for sale and had a carrying value of $27,587,000, which was equal to management's estimate of fair value, to a fund managed by an affiliate of CIM Group. We did not recognize any gain or loss in connection with the transaction. Management's estimate of fair value was determined with assistance from an independent third-party valuation firm.
Through our SBA 7(a) lending platform, we are a national lender that primarily originates loans to small businesses. We identify loan origination opportunities through personal contacts, internet referrals, attendance at trade shows and meetings, direct mailings, advertisements in trade publications and other marketing methods. We also generate loans through referrals from real estate and loan brokers, franchise representatives, existing borrowers, lawyers and accountants.
During 2017, 2016 and 2015, we funded an aggregate of $76,316,000, $104,235,000 and $59,467,000, respectively, of loans in our lending business and received principal payments (including prepayments) of $17,557,000, $37,336,000 and $44,261,000, respectively (included in the amounts funded during 2016 and 2015 was $53,256,000 and $20,409,000, respectively, for commercial real estate loans).
In addition to our retained SBA 7(a) portfolio described above, we service $144,083,000 of aggregate principal balance remaining on secondary market loan sales.
Employees
As of December 31, 2017, we had two employees.
Offices
We are headquartered in Dallas, Texas.
Available Information
The public can access free of charge through the "Shareholders" section of our corporate website, www.cimcommercial.com, our annual, quarterly and current reports, changes in the stock ownership of our directors and certain executive officers and other documents filed with the SEC as soon as reasonably practicable after the filing dates. The information on our corporate website is not part of this Annual Report on Form 10-K. The SEC also maintains a website at www.sec.gov that contains reports, proxy and information statements and other information regarding our filings.
Item 1A. Risk Factors
The following information should be read in conjunction with Part II, "Item 7-Management's Discussion and Analysis of Financial Condition and Results of Operations" and the Consolidated Financial Statements and related notes in Part II, "Item 8-Financial Statements and Supplementary Data" of this Annual Report on Form 10-K. A wide range of factors could materially affect our future developments and performance. In addition to the factors described elsewhere in this report, management has identified the following important factors that could cause actual results to differ materially from those reflected in forward-looking statements or from our historical results. These factors, which are not all-inclusive, could have a material adverse effect on our business, financial condition, results of operations, cash flow or our ability to satisfy our debt service obligations, to maintain our level of distributions on our Common Stock or series A preferred stock (the "Series A Preferred Stock") or to pay distributions on the series L Preferred Stock (the "Series L Preferred Stock" and, together with the Series A Preferred Stock, the "Preferred Stock"). This discussion of risk factors includes many forward-looking statements. For cautions about relying on forward-looking statements, please refer to the section entitled "Forward-Looking Statements" immediately prior to Item 1 of this Annual Report on Form 10-K.
14
Risks Related to Our Business
We may be unable to pay or maintain cash distributions or increase distributions to stockholders over time.
Several factors may affect the availability and timing of cash distributions to our stockholders. Distributions are based primarily on anticipated cash flow from operations over time. The amount of cash available for distributions is affected by many factors, including the performance of our existing assets, including the selection of tenants and the amount of rental income, our operating expense levels, opportunities for acquisition identified by our Operator, the availability of financing arrangements as well as many other variables. We may not always be in a position to pay distributions to our stockholders and the amount of any distributions we do make may not increase over time. In addition, our actual results may differ significantly from the assumptions used by our Board of Directors in establishing our distribution policy. There also is a risk that we may not have sufficient cash flow from operations to fund distributions required to qualify as a REIT or maintain our REIT status.
We have paid, and may continue to pay, some or all of our distributions to stockholders from sources other than cash flow from operations, including borrowings, proceeds from asset sales or the sale of our securities, which may reduce the amount of capital we ultimately deploy in our real estate operations and may negatively impact the value of our Common Stock.
To the extent that cash flow from operations has been or is insufficient to fully cover our distributions to our stockholders, we have paid, and may continue to pay, some or all of our distributions from sources other than cash flow from operations. Such sources may include borrowings, proceeds from asset sales or the sale of our securities. We have no limits on the amounts we may use to pay distributions from sources other than cash flow from operations. The payment of distributions from sources other than cash provided by operating activities may reduce the amount of proceeds available for acquisitions and operations or cause us to incur additional interest expense as a result of borrowed funds, and may cause subsequent holders of our Common Stock to experience dilution. This may negatively impact the price of our Common Stock.
Distributions at any point in time may not reflect the current performance of our properties or our current operating cash flow.
We may make distributions from any source, including the sources described in the risk factor above. Because the amount we pay in distributions may exceed our earnings and our cash flow from operations, distributions may not reflect the current performance of our properties or our current operating cash flow.
Our future success depends on the performance of the Administrator and the Operator, their respective key personnel and their access to the investment professionals of CIM Group. We may not find suitable replacements if such key personnel or investment professionals leave the employment of the Administrator, the Operator or other applicable affiliates of CIM Group or if such key personnel or investment professionals otherwise become unavailable to us.
We rely on the Administrator to provide management and administration services to us, and CIM Urban relies completely on the Operator to provide CIM Urban with certain services.
Our executive officers also serve as officers or employees of the Administrator and/or the Operator or other applicable affiliates of CIM Group. The Administrator and the Operator have significant discretion as to the implementation of acquisitions and operating policies and strategies on behalf of us and CIM Urban. Accordingly, we believe that our success depends to a significant extent upon the efforts, experience, diligence, skill and network of business contacts of the officers and key personnel of the Administrator, the Operator and the other applicable affiliates of CIM Group. The departure of any of these officers or key personnel could have a material adverse effect on our business, financial condition, results of operations, cash flow or our ability to satisfy our debt service obligations or to maintain our level of distributions on our Common Stock or Preferred Stock.
We also depend on access to, and the diligence, skill and network of, business contacts of the professionals within CIM Group and the information and deal flow generated by its investment professionals in the course of their acquisitions and asset management activities. The departure of any of these individuals, or of a significant number of the investment professionals or principals of CIM Group, could have a material adverse effect on our business, financial condition, results of operations, cash flow or our ability to satisfy our debt service obligations or to maintain our level of distributions on our Common Stock or Preferred Stock. We cannot guarantee that we will continue to have access to CIM Group's investment professionals or its information and deal flow.
15
If we seek to internalize the management functions provided pursuant to the Master Services Agreement and the Investment Management Agreement, we could incur substantial costs and lose certain key personnel.
The Board of Directors may determine that it is in our best interest to become self-managed by internalizing the functions performed by the Administrator and the Operator and to terminate the Master Services Agreement and the Investment Management Agreement. However, we do not have the unilateral right to terminate the Master Services Agreement and CIM Urban does not have the unilateral right to terminate the Investment Management Agreement, and neither the Administrator nor the Operator would be obligated to enter into an internalization transaction with us. There is no assurance that a mutually acceptable agreement with these entities as to the terms of the internalization could be reached.
The costs that would be incurred by us in any such internalization transaction are uncertain and could be substantial. Inadequate management of an internalization transaction could cause us to incur excess costs or suffer deficiencies in our disclosure controls and procedures or our internal control over financial reporting. An internalization transaction may divert management's attention from effectively managing our assets. Further, following any internalization of our management functions, certain key employees may remain employees of the Administrator and the Operator or their respective affiliates instead of becoming our employees, especially if the Administrator and the Operator are not acquired by us.
Uninsured losses or losses in excess of our insurance coverage could materially adversely affect our financial condition and cash flows, and there can be no assurance as to future costs and the scope of coverage that may be available under insurance policies.
We carry commercial liability, special form/all risk and business interruption insurance on all of the properties in our portfolio. In addition, we carry directors' and officers' insurance. While we select policy specifications and insured limits that we believe are appropriate and adequate given the relative risk of loss, the cost of the coverage, and industry practice, there can be no assurance that we will not experience a loss that is uninsured or that exceeds policy limits.
Our business operations in California, Texas and the District of Columbia are susceptible to, and could be significantly affected by, adverse weather conditions and natural disasters such as earthquakes, tsunamis, hurricanes, wind, blizzards, floods, landslides, drought and fires. These adverse weather conditions and natural disasters could cause significant damage to the properties in our portfolio, the risk of which is enhanced by the concentration of our properties, by aggregate net operating income and square feet, in California and the District of Columbia. Our insurance may not be adequate to cover business interruption or losses resulting from adverse weather or natural disasters. We carry earthquake insurance on our properties in California in an amount and with deductibles and limitations that we deem to be appropriate. However, the amount of our earthquake insurance coverage may not be sufficient to cover losses from earthquakes in California. Furthermore, we may not carry insurance for certain losses, such as those caused by war or certain environmental conditions, such as mold or asbestos.
As a result of the factors described above, we may not have sufficient coverage against all losses that we may experience for any reason.
If we experience a loss that is uninsured or that exceeds policy limits, we could incur significant costs and lose the capital deployed in the damaged properties as well as the anticipated future cash flows from those properties. Further, if the damaged properties are subject to recourse indebtedness, we would continue to be liable for the indebtedness, even if the properties were irreparable. In addition, our properties may not be able to be rebuilt to their existing height or size at their existing location under current land-use laws and policies. In the event that we experience a substantial or comprehensive loss of one of our properties, we may not be able to rebuild such property to its existing specifications and otherwise may have to upgrade such property to meet current code requirements. Any of the factors described above could have a material adverse effect on our business, financial condition, results of operations, cash flow or our ability to satisfy our debt service obligations or to maintain our level of distributions on our Common Stock or Preferred Stock.
Cybersecurity risks and cyber incidents may adversely affect our business by causing a disruption to our operations, a compromise or corruption of our confidential information, and/or damage to our business relationships, all of which could negatively impact our financial results.
A cyber incident is considered to be any adverse event that threatens the confidentiality, integrity or availability of our information resources. A cyber incident may be an intentional attack or an unintentional event and could involve a third-party gaining unauthorized access to our information systems for purposes of misappropriating assets, stealing confidential information, corrupting data or causing operational disruption. The occurrence of a cyber incident may result in disrupted operations, misstated or unreliable financial data, liability for stolen assets or information, increased cybersecurity protection and insurance costs, litigation, damage to our tenant and stockholder relationships or other adverse effects. Our Operator's and
16
Administrator's IT networks and related systems are essential to the operations of our business and our ability to perform day-to-day operations (including managing our building systems). Our Operator and Administrator have implemented processes, procedures and internal controls to help mitigate cyber incidents, but these measures do not guarantee that a cyber incident involving our Operator or Administrator will not occur or that attempted security breaches or disruptions would not be successful or damaging. A cyber incident involving our Advisor's or Manager's IT networks and related systems could materially adversely impact our business, financial condition, results of operations, cash flow or our ability to satisfy our debt service obligations or to maintain our level of distributions on our Common Stock or Preferred Stock.
Risks Related to Conflicts of Interest
Neither the Master Services Agreement nor the Investment Management Agreement may be terminated by us (except in limited circumstances for cause in the case of the Master Services Agreement) and the Master Services Agreement may be assigned by the Administrator in certain circumstances without our consent, either or both of which may have a material adverse effect on us.
We and our lending subsidiaries are parties to the Master Services Agreement pursuant to which the Administrator provides, or arranges for other service providers to provide, management and administrative services to us and all of our direct and indirect subsidiaries. We are obligated to pay the Administrator the Base Service Fee (see "Item 1—Business—Master Services Agreement") and market rate transaction fees for transactional and other services that the Administrator elects to provide to us. Pursuant to the terms of the Master Services Agreement, the Administrator has the right to provide any transactional services to us that we would otherwise engage a third-party to provide.
The Master Services Agreement continues in full force and effect until December 31, 2018, and thereafter will renew automatically each year. The Administrator may assign the Master Services Agreement without our consent to one of its affiliates or an entity that is a successor through merger or acquisition of the business of the Administrator. We generally may terminate the Master Services Agreement only in the event of material breach, fraud, gross negligence or willful misconduct by or, in certain limited circumstances, a change of control of the Administrator that our independent directors determine to be materially detrimental to us and our subsidiaries as a whole. We do not have the right to terminate the Master Services Agreement solely for the poor performance of our operations. In addition, CIM Urban does not have the right to terminate the Investment Management Agreement under any circumstances.
Moreover, any removal of Urban GP Administrator as manager of CIM Urban GP pursuant to the Master Services Agreement or the CIM Urban Partnership Agreement would not affect the rights of the Administrator under the Master Services Agreement or the Operator under the Investment Management Agreement. Accordingly, the Administrator would continue to provide the Base Services and receive the Base Service Fee, and the Administrator or the applicable service provider would continue to provide the transactional services and receive related transaction fees, under the Master Services Agreement, and the Operator would continue to receive the management fee under the Investment Management Agreement.
The Administrator and Operator are entitled to receive fees for the services they provide regardless of our performance, which may reduce their incentive to devote time and resources to our portfolio.
Pursuant to the Master Services Agreement, the Administrator is entitled to receive the Base Service Fee, regardless of our performance, and additional fees for the provision of transactional and other services at fair market rates approved by our independent directors. Additionally, the Operator is entitled to receive an asset management fee based upon the adjusted fair value of CIM Urban's assets, including any assets acquired by CIM Urban in the future. See "Item 1—Business—Investment Management Agreement." The Administrator's and the Operator's entitlement to substantial non-performance based compensation might reduce their incentive to devote time and effort to seeking profitable opportunities for our portfolio.
The Operator may undertake transactions that are motivated, in whole or in part, by a desire to increase its compensation.
The Operator's fees are based on the adjusted fair value of CIM Urban's assets, including any assets acquired by CIM Urban in the future, which may provide an incentive for the Operator to deploy our capital to assets that are riskier than we would otherwise acquire, regardless of the anticipated long-term performance of such assets. For instance, if CIM Urban, or we on its behalf, incurs debt or uses leverage to acquire an asset, the adjusted fair value of our assets will increase by an amount greater than the amount of cash used in such levered acquisition, which leads to greater compensation payable to the Operator. In this manner, the Operator may seek to maximize its compensation by recommending a deployment of capital to assets that are not necessarily in the best interest of our stockholders. The Operator may also recommend the disposition of assets that are beneficial to CIM Urban's operations in order to fund such acquisitions. For a discussion of the broad discretion that may be
17
exercised by the Operator in our business, see "—Each of the Administrator and Operator provides services to us under broad mandates, and our Board of Directors may not necessarily be involved in each acquisition, disposition or financing decision made by the Administrator or Operator" below.
Each of the Administrator and Operator provides services to us under broad mandates, and our Board of Directors may not necessarily be involved in each acquisition, disposition or financing decision made by the Administrator or Operator.
Each of the Administrator, under the Master Services Agreement, and the Operator, under the Investment Management Agreement, has broad discretion and authority over our day-to-day operations and deployment of our capital in assets. While our Board of Directors periodically reviews the performance of our businesses, our Board of Directors does not review all activities conducted by the Administrator and the Operator, and may not review certain proposed acquisitions, dispositions or the implementation of other strategic initiatives before they occur. In addition, in reviewing our business operations, our directors may rely on information provided to them by the Administrator or the Operator, as the case may be. The Administrator or the Operator may cause us to enter into significant transactions or undertake significant activities that may be difficult or impossible to unwind, exit or otherwise remediate. Each of the Administrator and the Operator has great latitude in the implementation of our strategies, including determining the types of assets that are appropriate for us. The decisions of the Administrator and the Operator could therefore result in losses or returns that are substantially below our expectations, which could have a material adverse effect on our business, financial condition, results of operations, cash flow or our ability to satisfy our debt service obligations or to maintain our level of distributions on our Common Stock or Preferred Stock.
The Operator, the Administrator and their respective affiliates engage in real estate activities that could compete with us and our subsidiaries, which could result in decisions that are not in the best interests of our stockholders.
The Investment Management Agreement with the Operator and the Master Services Agreement with the Administrator do not prevent the Operator and the Administrator, as applicable, and their respective affiliates from operating additional real estate assets or participating in other real estate opportunities, some of which could compete with us and our subsidiaries. The Operator, the Administrator and their respective affiliates operate real estate assets and participate in additional real estate activities having objectives that overlap with our own, and may thus face conflicts in the operation and allocation of real estate opportunities between us, on the one hand, and such other real estate operations and activities, on the other hand. Allocation of real estate opportunities is at the discretion of the Operator and/or the Administrator and there is no guarantee that this allocation will be made in the best interest of our stockholders.
There may be conflicts of interest in allocating real estate opportunities to CIM Urban and other funds, vehicles and ventures operated by the Operator. For example, the Operator serves as the operator of private funds formed to deploy capital in substantially stabilized real estate and real estate-related assets located in urban areas that CIM Group has already qualified. There may be a significant overlap in the assets and strategies between us and such funds, and many of the same investment personnel will provide services to both entities. Further, the Operator and its affiliates may in the future operate funds, vehicles and ventures that have overlapping objectives with CIM Urban and therefore may compete with CIM Urban for opportunities. The ability of the Operator, the Administrator and their officers and employees to engage in other business activities, including the operation of other vehicles operated by CIM Group or its affiliates, may reduce the time the Operator and the Administrator spend managing our activities.
Certain of our directors and executive officers may face conflicts of interest related to positions they hold with the Operator, the Administrator, CIM Group and their affiliates, which could result in decisions that are not in the best interest of our stockholders.
Some of our directors and executive officers are also part-owners, officers and/or directors of the Operator, the Administrator, CIM Group and/or their respective affiliates. As a result, such directors and executive officers may owe fiduciary duties to these various other entities and their equity owners that may from time to time conflict with the duties such persons owe to us. Further, these multiple responsibilities may create conflicts of interest for these individuals if they are presented with opportunities that may benefit us and our other affiliates. These individuals may be incentivized to allocate opportunities to other entities rather than to us. Their loyalties to other affiliated entities could result in actions or inactions that are detrimental to our business, strategy and opportunities.
18
The business of CIM Urban is managed by Urban GP Administrator and we agreed in the Master Services Agreement to appoint an affiliate of CIM Group as the manager of the general partner of CIM Urban; in addition, the general partner of CIM Urban can be removed from that position under certain circumstances as provided in the CIM Urban Partnership Agreement.
Pursuant to the Master Services Agreement, we agreed to appoint an affiliate of CIM Group as the manager of the general partner of CIM Urban. While currently that designated entity, Urban GP Administrator, is an affiliate of CIM Group, there can be no assurances that a different entity would not be appointed the manager of the general partner of CIM Urban in the future. Moreover, we may only remove the Urban GP Administrator as the manager of CIM Urban GP for "cause" (as defined in the Master Services Agreement). Removal for "cause" also requires the approval of the holders of at least 66 2/3% of our outstanding shares (excluding for this purpose any shares held by the Administrator and any affiliates of the Administrator, except to the extent set forth in the immediately following sentence). Notwithstanding the foregoing, CIM REIT has the right to vote any shares of our Common Stock that it owns with respect to any vote held to remove the Urban GP Administrator as the manager of the CIM Urban GP; provided, however, if any such removal vote is held after the second anniversary of the Master Services Agreement, CIM REIT must obtain voting instructions from certain of its non-affiliated members with respect to voting the shares beneficially owned by such non-affiliated members and CIM REIT must vote the number of shares beneficially owned by each such non-affiliated members as so instructed by such non-affiliated members. Upon removal, a replacement manager will be appointed by the independent directors. Finally, under the CIM Urban Partnership Agreement, the general partner of CIM Urban may be removed under certain circumstances with the consent of 66 2/3% of the class A members of CIM REIT.
Subject to the limitations set forth in the governing documents of CIM Urban and CIM Urban GP, Urban GP Administrator is given the power and authority under the Master Services Agreement to manage, to direct the management, business and affairs of and to make all decisions to be made by or on behalf of (1) CIM Urban GP and (2) CIM Urban. Subject to the other terms of the CIM Urban Partnership Agreement, CIM Urban GP has broad discretion over the operations of CIM Urban. Accordingly, while we own indirectly all of the partnership interests in CIM Urban, except as set forth in the Master Services Agreement and the rights specifically reserved to limited partners by the CIM Urban Partnership Agreement and applicable law, we will have no part in the management and control of CIM Urban.
The CIM Urban Partnership Agreement contains provisions that give rights to certain unaffiliated members of CIM REIT to influence the business and operations of CIM Urban; such members may have interests that are adverse to our stockholders and the exercise of such rights may negatively impact the rights of our stockholders, or our business.
The CIM Urban Partnership Agreement requires the consent of a majority in interest of certain members of CIM REIT in order to amend the CIM Urban Partnership Agreement; the Investment Management Agreement can be amended only with the consent of at least 66 2/3% of the class A members of CIM REIT who are not affiliates of CIM Urban GP. As noted above, in certain situations, upon a two-thirds vote of certain members of CIM REIT, the CIM Urban GP may be removed and replaced. The refusal to permit amendment of the CIM Urban Partnership Agreement or the removal of the general partner by the members of CIM REIT may adversely impact us.
If we fail to maintain an effective system of internal control over financial reporting, we may not be able to accurately report our financial results.
An effective system of internal control over financial reporting is necessary for us to provide reliable financial reports, prevent fraud and operate successfully as a public company. As part of our ongoing monitoring of internal controls, we may discover material weaknesses or significant deficiencies in our internal controls that we believe require remediation. If we discover such weaknesses, we will make efforts to improve our internal controls in a timely manner. Any system of internal controls, however well designed and operated, is based in part on certain assumptions and can only provide reasonable, not absolute, assurance that the objectives of the system are met. Any failure to maintain effective internal controls, or implement any necessary improvements in a timely manner, could have a material adverse effect on our business, financial condition, results of operations, cash flow or our ability to satisfy our debt service obligations or to maintain our level of distributions on our Common Stock or Preferred Stock, or cause us to not meet our reporting obligations, which could affect our ability to remain listed with Nasdaq Global Market ("Nasdaq") and the Tel Aviv Stock Exchange (the "TASE"). Ineffective internal controls could also cause holders of our securities to lose confidence in our reported financial information, which would likely have a negative effect on the trading price of our securities.
19
Risks Related to Our Corporate Structure
Certain provisions of Maryland law could inhibit changes in control.
Certain provisions of the Maryland General Corporation Law (the "MGCL"), if applied to us, would have the effect of inhibiting a third-party from making a proposal to acquire us or impeding a change of control under circumstances that otherwise could provide our stockholders with the opportunity to realize a premium over the then-prevailing market price of our Common Stock, including:
• | "business combination" provisions that, subject to limitations, prohibit certain business combinations between us and an "interested stockholder" (defined generally as any person who beneficially owns, directly or indirectly, 10% or more of the voting power of our shares or an affiliate thereof) for five years after the most recent date on which the stockholder becomes an interested stockholder, and thereafter impose special appraisal rights and special stockholder voting requirements on these combinations; and |
• | "control share" provisions that provide that "control shares" of our Company (defined as shares which, when aggregated with other shares controlled by the stockholder, entitle the stockholder to exercise one of three increasing ranges of voting power in electing directors) acquired in a "control share acquisition" (defined as the direct or indirect acquisition of ownership or control of "control shares") have no voting rights except to the extent approved by our stockholders by the affirmative vote of at least two-thirds of all the votes entitled to be cast on the matter, excluding all interested shares. |
We have elected to opt out of these provisions of the MGCL, in the case of the business combination provisions of the MGCL, by resolution of our Board of Directors and, in the case of the control share provisions of the MGCL, pursuant to a provision in our bylaws. However, our Board of Directors may by resolution elect to repeal the foregoing opt-outs from the business combination provisions of the MGCL and we may, by amendment to our bylaws, opt in to the control share provisions of the MGCL in the future.
Our charter, bylaws, the partnership agreement for CIM Urban and Maryland law also contain other provisions that may delay, defer or prevent a transaction or a change of control that might involve a premium price for our Common Stock or otherwise be in the best interest of our stockholders.
We are controlled by an affiliate of CIM Group.
Urban II, an affiliate of CIM Group, beneficially owns shares of our Common Stock that, together with shares held by other affiliates of CIM Group and our executive officers and directors, represents approximately 96.4% of the total voting power of the Company, as of March 2, 2018. For so long as affiliates of CIM Group continue to own a significant percentage of our stock, CIM Group will be able to significantly influence the composition of our Board of Directors and the approval of actions requiring stockholder approval. Accordingly, CIM Group will have significant influence with respect to our management, business plans and policies, including the appointment and removal of our officers. In particular, CIM Group will be able to cause or prevent a change of control of the Company or a change in the composition of our Board of Directors and could preclude any unsolicited acquisition of the Company. The concentration of ownership could deprive our stockholders of an opportunity to receive a premium for their shares of Common Stock as part of a sale of the Company and ultimately might affect the market price of our Common Stock.
We are a "controlled company" within the meaning of the rules of the Nasdaq and, as a result, qualify for, and currently rely on, exemptions from certain corporate governance requirements. Holders of our Common Stock do not have the same protections afforded to stockholders of companies that are subject to such requirements.
Affiliates of CIM Group control a majority of the total voting power in the election of our directors. As a result, we are a "controlled company" within the meaning of the rules of the Nasdaq. Under these rules, a company of which more than 50% of the voting power in the election of directors is held by an individual, group or another company is a "controlled company" and may elect not to comply with certain corporate governance requirements, including the requirements that (i) a board be comprised of a majority of "independent directors," as defined under the rules of the Nasdaq, (ii) a compensation committee be comprised entirely of independent directors and (iii) nomination decisions be made either by independent directors constituting a majority of the independent directors in a vote in which only independent directors participate, or a nomination committee comprised entirely of independent directors.
20
We have availed ourselves of these exemptions. As a result, our Board of Directors is not comprised of a majority of independent directors, we do not have a compensation committee, and our nomination decisions are made by our entire Board of Directors. Accordingly, holders of our Common Stock do not have the same protections afforded to stockholders of companies that are subject to all of the corporate governance requirements of the Nasdaq.
If we were deemed an investment company under the Investment Company Act of 1940, as amended (the "Investment Company Act"), applicable restrictions could make it impractical for us to continue our business as contemplated and could have an adverse effect on our business.
We are not an investment company under the Investment Company Act and intend to conduct our operations so that we will not be deemed an investment company. However, if we were to be deemed an investment company, restrictions imposed by the Investment Company Act, including limitations on the nature of assets and ability to transact with affiliates, could make it impractical for us to continue our business as contemplated. In addition, the Investment Company Act imposes certain requirements on companies deemed to be within its regulatory scope, including registration as an investment company, adoption of a specific form of corporate structure and compliance with certain burdensome reporting, record keeping, voting, proxy, disclosure and other rules and regulations. In the event of the characterization of us as an investment company, the failure by us to satisfy such regulatory requirements, whether on a timely basis or at all, would, under certain circumstances, also have a material adverse effect on us.
The Operator may change its acquisition process, or elect not to follow it, without stockholder consent at any time, which may adversely affect returns on our assets.
We may expand our operations into new real estate-related activities, including, without limitation, (i) originating and/or acquiring a variety of loan products, including, but not limited to, mezzanine loans, commercial real estate loans and other types of loans (see "Item 7—Management's Discussion and Analysis of Financial Condition and Results of Operations—Executive Summary—Strategy") and/or (ii) real estate development activities to create substantially stabilized properties. Stockholders will not have any approval rights with respect to any expansion or change in strategies or future composition of our assets. Our Operator determines our policies regarding deployment of capital into real estate assets, financing, growth and debt capitalization. Our Operator may change these and other policies without a vote of our stockholders. In addition, there can be no assurance that the Operator will follow its acquisition process in relation to the identification and acquisition or origination of prospective assets. As a result, the nature of the composition of our assets could change without the consent of our stockholders. Changes in the Operator's acquisition process and/or philosophy may result in, among other things, inferior due diligence and transaction standards, which may adversely affect the performance of our assets. If we are unsuccessful in expanding into new real estate activities or our changes in strategies or future deployment of our capital turn out to be unsuccessful, it could have a material adverse effect on our business, financial condition, results of operations, cash flow or our ability to satisfy our debt service obligations or to maintain our level of distributions on our Common Stock or Preferred Stock.
The power of the Board of Directors to revoke our REIT election without stockholder approval may cause adverse consequences to our stockholders.
Our organizational documents permit our Board of Directors to revoke or otherwise terminate our REIT election, without the approval of our stockholders, if the Board of Directors determines that it is no longer in our best interest to continue to qualify as a REIT. In such a case, we would become subject to U.S. federal, state and local income tax on our net taxable income and we would no longer be required to distribute most of our net taxable income to our stockholders, which could have adverse consequences on the total return to our holders of Common Stock.
MGCL or our Charter may limit the ability of our stockholders or us to recover on a claim against a director or officer who negligently causes us to incur losses.
The MGCL provides that a director has no liability in such capacity if he or she performs his or her duties in good faith, in a manner he or she reasonably believes to be in our best interests and with the care that an ordinarily prudent person in a like position would use under similar circumstances. A director who performs his or her duties in accordance with the foregoing standards should not be liable to us or any other person for failure to discharge his or her obligations as a director.
In addition, our charter provides that our directors and officers will not be liable to us or our stockholders for monetary damages unless the director or officer actually received an improper benefit or profit in money, property or services, or is adjudged to be liable to us or our stockholders based on a finding that his or her action, or failure to act, was the result of active and deliberate dishonesty and was material to the cause of action adjudicated in the proceeding. Our charter also requires us, to the maximum extent permitted by Maryland law, to indemnify and, without requiring a preliminary determination of the ultimate entitlement to
21
indemnification, pay or reimburse reasonable expenses in advance of final disposition of a proceeding to any individual who is a present or former director or officer and who is made or threatened to be made a party to the proceeding by reason of his or her service in that capacity or any individual who, while a director or officer and at our request, serves or has served as a director, officer, partner, trustee, member or manager of another corporation, real estate investment trust, limited liability company, partnership, joint venture, trust, employee benefit plan or other enterprise and who is made or threatened to be made a party to the proceeding by reason of his or her service in that capacity. With the approval of our board of directors, we may provide such indemnification and advance for expenses to any individual who served a predecessor of the Company in any of the capacities described above and any employee or agent of the Company or a predecessor of the Company, including our Administrator and its affiliates.
We also are permitted to purchase and we currently maintain insurance or provide similar protection on behalf of any directors, officers, employees and agents, including our Administrator and its affiliates, against any liability asserted which was incurred in any such capacity with us or arising out of such status. This may result in us having to expend significant funds, which would reduce the available cash for distribution to our stockholders.
The liability of the Administrator and the Operator to us under the Master Services Agreement and the Investment Management Agreement, respectively, is limited and we and CIM Urban have agreed to indemnify the Administrator and the Operator, respectively, against certain liabilities. As a result, we could experience poor performance or losses for which neither the Administrator nor the Operator would be liable.
Pursuant to the Master Services Agreement, the Administrator has no responsibility other than to provide its services in good faith and will not be responsible for any action of our Board of Directors that follows or declines to follow the Administrator's advice or recommendations. Under the terms of the Master Services Agreement, none of the Administrator or any of its affiliates providing services under the Master Services Agreement will be liable to us, any subsidiary of ours party to the Master Services Agreement, any governing body (including any director or officer), stockholder or partner of any such entity for acts or omissions made pursuant to or in accordance with the Master Services Agreement, other than acts or omissions constituting fraud, willful misconduct, gross negligence or violation of certain laws or any other intentional or criminal wrongdoing or breach of the Master Services Agreement. Moreover, the aggregate liability of any such entities and persons pursuant to the Master Services Agreement is capped at the aggregate amount of the Base Service Fee and any transaction fees previously paid to the Administrator in the two most recent calendar years. In addition, we have agreed to indemnify the Administrator and any of its affiliates providing services under the Master Services Agreement, any affiliates of the Administrator and any directors, officers, stockholders, agents, subcontractors, contractors, delegates, members, partners, shareholders, employees and other representatives of each of them from and against all actions, suits, investigations, proceedings or claims except to the extent resulting from such person's fraud, willful misconduct, gross negligence or violation of certain laws or any other intentional or criminal wrongdoing or breach of the Master Services Agreement.
Pursuant to the Investment Management Agreement, the Operator is not liable to CIM Urban, CIM Urban GP or any manager or director of CIM Urban GP for, and CIM Urban has agreed to indemnify the Operator against any losses, claims, damages or liabilities to which it may become subject in connection with, among other things, (1) any act or omission performed or omitted by it or for any costs, damages or liabilities arising therefrom, in the absence of fraud, gross negligence, willful misconduct or a breach of the Investment Management Agreement or (2) any losses due to the negligence of any employees, brokers, or other agents of CIM Urban.
General Risks Related to Real Estate Assets
Our operating performance is subject to risks associated with the real estate industry.
Real estate assets are subject to various risks and fluctuations and cycles in value and demand, many of which are beyond our control. Certain events may decrease cash available for distributions, as well as the value of our properties. These events include, but are not limited to:
• | adverse changes in economic and socioeconomic conditions; |
• | vacancies or our inability to rent space on favorable terms; |
• | adverse changes in financial conditions of buyers, sellers and tenants of properties; |
• | inability to collect rent from tenants; |
22
• | competition from real estate investors with significant capital, including but not limited to real estate operating companies, publicly-traded REITs and institutional investment funds; |
• | reductions in the level of demand for office and hotel space and changes in the relative popularity of properties; |
• | increases in the supply of office and hotel space; |
• | fluctuations in interest rates and the availability of credit, which could adversely affect our ability, or the ability of buyers and tenants of properties, to obtain financing on favorable terms or at all; |
• | dependence on third parties to provide leasing, brokerage, property management and other services with respect to certain of our assets; |
• | increases in expenses, including insurance costs, labor costs, utility prices, real estate assessments and other taxes and costs of compliance with laws, regulations and governmental policies, and our inability to pass on some or all of these increases to our tenants; and |
• | changes in, and changes in enforcement of, laws, regulations and governmental policies, including, without limitation, health, safety, environmental, zoning, real estate tax, federal and state laws, governmental fiscal policies and the ADA. |
In addition, periods of economic slowdown or recession, rising interest rates or declining demand for real estate, or the public perception that any of these events may occur, could result in a general decline in rents or an increased incidence of defaults under existing leases. If we cannot operate our properties so as to meet our financial expectations, our business, financial condition, results of operations, cash flow or our ability to satisfy our debt service obligations or to maintain our level of distributions on our Common Stock or Preferred Stock may be negatively impacted.
There can be no assurance that we will achieve our economic objectives.
A significant portion of our properties, by aggregate net operating income and square feet, are located in California and the District of Columbia. We are dependent on the California and the District of Columbia real estate markets and economies, and are therefore susceptible to risks of events in those markets that could adversely affect our business, such as adverse market conditions, changes in local laws or regulations and natural disasters.
Because our properties in California (and particularly in the San Francisco Bay area, including Oakland, California and San Francisco, California (the "San Francisco Bay Area")) and the District of Columbia represent a significant portion of our portfolio by aggregate net operating income and square feet, we are exposed to greater economic risks than if we owned a more geographically diverse portfolio. We are susceptible to adverse developments in the California (and particularly, in the San Francisco Bay Area) and the District of Columbia economic and regulatory environments (such as business layoffs or downsizing, industry slowdowns, relocations of businesses, increases in real estate and other taxes, costs of complying with governmental regulations or increased regulation and other factors) as well as natural disasters that occur in these areas (such as earthquakes, floods and other events). In addition, the State of California is regarded as more litigious and more highly regulated and taxed than many states, which may reduce demand for office and hotel space in California. Any adverse developments in the economy or real estate markets in California (and particularly, in the San Francisco Bay Area) or the District of Columbia, or any decrease in demand for office and hotel space resulting from the California (and particularly, in the San Francisco Bay Area) or the District of Columbia regulatory or business environments, could have a material adverse effect on our business, financial condition, results of operations, cash flow or our ability to satisfy our debt service obligations or to maintain our level of distributions on our Common Stock or Preferred Stock.
We may be adversely affected by any significant reductions in federal government spending, which could have a material adverse effect on our business, financial condition, results of operations, cash flow or our ability to satisfy our debt service obligations or to maintain our level of distributions on our Common Stock or Preferred Stock.
Some of our properties are occupied by tenants that are U.S. federal government agencies. A significant reduction in federal government spending could decrease the likelihood that they will renew their leases with us. Further, economic conditions in the District of Columbia are significantly dependent upon the level of federal government spending in the region as a whole. In the event of a significant reduction in federal government spending, there could be negative economic changes in the District of Columbia which could adversely impact the ability of our tenants to perform their financial obligations under our leases or the likelihood of their lease renewals. As a result, such a reduction in federal government spending could have a
23
material adverse effect on our business, financial condition, results of operations, cash flow or our ability to satisfy our debt service obligations or to maintain our level of distributions on our Common Stock or Preferred Stock.
Capital and credit market conditions may adversely affect demand for our properties and the overall availability and cost of credit.
In periods when the capital and credit markets experience significant volatility, demand for our properties and the overall availability and cost of credit may be adversely affected. No assurances can be given that the capital and credit market conditions will not have a material adverse effect on our business, financial condition, results of operations, cash flow or our ability to satisfy our debt service obligations or to maintain our level of distributions on our Common Stock or Preferred Stock.
In addition, we could be adversely affected by significant volatility in the capital and credit markets as follows:
• | the tenants in our office properties may experience a deterioration in their sales or other revenue, or experience a constraint on the availability of credit necessary to fund operations, which in turn may adversely impact those tenants' ability to pay contractual base rents and tenant recoveries. Some tenants may terminate their occupancy due to an inability to operate profitably for an extended period of time, impacting our ability to maintain occupancy levels; and |
• | constraints on the availability of credit to tenants, necessary to purchase and install improvements, fixtures and equipment and to fund business expenses, could impact our ability to procure new tenants for spaces currently vacant in existing office properties or properties under development. |
Office buildings that have government tenants are subject to the risks associated with conducting business with the U.S. federal government.
Office buildings that have government tenants are subject to risks associated with conducting business with the U.S. federal government. Congressional action to reduce budgetary spending by the United States could limit or reduce the funding of government agencies or other organizations. Adverse developments and/or conditions affecting government tenants could reduce demand for space or force such tenants to curtail operations, which could result in less rent to us and, accordingly, could have a material adverse effect on our results of operations. The risks of conducting business with the U.S. federal government also include the risk of civil and criminal fines and the risk of public scrutiny of our performance at high profile sites.
The U.S. Government's "green lease" policies may adversely affect us.
In recent years the U.S. Government has instituted "green lease" policies which allow a government tenant to require leadership in energy and environmental design for commercial interiors, or LEED®-CI, certification in selecting new premises or renewing leases at existing premises. In addition, the Energy Independence and Security Act of 2007 allows the General Services Administration to give preference to buildings for lease that have received an "Energy Star" label. Obtaining such certifications and labels may be costly and time consuming, but our failure to do so may result in our competitive disadvantage in acquiring new or retaining existing government tenants, which could result in less rent to us, and, accordingly, could have a material adverse effect on our business, financial condition, results of operations, cash flow or our ability to satisfy our debt service obligations or to maintain our level of distributions on our Common Stock or Preferred Stock.
Changes in the United States' and state governments' requirements for leased space may adversely affect us.
Some of our current rents come from government tenants. Government agencies have been seeking to increase their space utilization under their leases, including reducing the amount of square footage per employee at leased properties, which has reduced the demand for government leased space. If a significant number of such events occur, they could have a material adverse effect on our business, financial condition, results of operations, cash flow or our ability to satisfy our debt service obligations or to maintain our level of distributions on our Common Stock or Preferred Stock.
Tenant concentration increases the risk that cash flow could be interrupted.
We are, and expect that we will continue to be, subject to a degree of tenant concentration at certain of our properties and/or across multiple properties. In the event that a tenant occupying a significant portion of one or more of our properties or whose rental income represents a significant portion of the rental revenue at such property or properties were to experience financial weakness or file bankruptcy, it could have a material adverse effect on our business, financial condition, results of
24
operations, cash flow or our ability to satisfy our debt service obligations or to maintain our level of distributions on our Common Stock or Preferred Stock.
If a major tenant declares bankruptcy, we may be unable to collect balances due under relevant leases, which could have a material adverse effect on our financial condition and ability to pay distributions to our stockholders.
The bankruptcy or insolvency of our tenants may adversely affect the income produced by our properties. Under bankruptcy law, a tenant cannot be evicted solely because of its bankruptcy and has the option to assume or reject any unexpired lease. If the tenant rejects the lease, any resulting claim we have for breach of the lease (other than to the extent of any collateral securing the claim) will be treated as a general unsecured claim. Our claim against the bankrupt tenant for unpaid and future rent will be subject to a statutory cap that might be substantially less than the remaining rent actually owed under the lease, and it is unlikely that a bankrupt tenant that rejects its lease would pay in full amounts it owes us under the lease. Even if a lease is assumed and brought current, we still run the risk that a tenant could condition lease assumption on a restructuring of certain terms, including rent, that would have an adverse impact on us. Any shortfall resulting from the bankruptcy of one or more of our tenants could adversely affect our business, financial condition, results of operations, cash flow or our ability to satisfy our debt service obligations or to maintain our level of distributions on our Common Stock or Preferred Stock.
In addition, the financial failure of, or other default by, one or more of the tenants to whom we have exposure could have an adverse effect on the results of our operations. While we evaluate the creditworthiness of our tenants by reviewing available financial and other pertinent information, there can be no assurance that any tenant will be able to make timely rental payments or avoid defaulting under its lease. If any of our tenants' businesses experience significant adverse changes, they may fail to make rental payments when due, exercise early termination rights (to the extent such rights are available to the tenant) or declare bankruptcy. A default by a significant tenant or multiple tenants could cause a material reduction in our revenues and operating cash flows. In addition, if a tenant defaults, we may incur substantial costs in protecting our asset.
We have assumed, and in the future may assume, liabilities in connection with our property acquisitions, including unknown liabilities.
In connection with the acquisition of properties, we may assume existing liabilities, some of which may have been unknown or unquantifiable at the time of the acquisition of assets. Unknown liabilities might include liabilities for cleanup or remediation of undisclosed environmental conditions, claims of tenants or other persons dealing with the sellers prior to our acquisition of the properties, tax liabilities, and accrued but unpaid liabilities whether incurred in the ordinary course of business or otherwise. If the magnitude of such unknown liabilities is high, either singly or in the aggregate, it could adversely affect our business, financial condition, results of operations, cash flow or our ability to satisfy our debt service obligations or to maintain our level of distributions on our Common Stock or Preferred Stock.
We may be adversely affected by trends in the office real estate industry
Telecommuting, flexible work schedules, open workspaces and teleconferencing are becoming more common. These practices enable businesses to reduce their space requirements. There is also an increasing trend among some businesses to utilize shared office space and co-working spaces. A continuation of the movement towards these practices could over time erode the overall demand for office space and, in turn, place downward pressure on occupancy, rental rates and property valuations.
We may be unable to renew leases or lease vacant office space.
As of December 31, 2017, 4.7% of the rentable square footage of our office portfolio was available for lease. As of December 31, 2017, 9.1% of the occupied square footage in our office portfolio was scheduled to expire in 2018. Local economic environment may make the renewal of these leases more difficult, or renewal may occur at rental rates equal to or below existing rental rates. As a result, portions of our office properties may remain vacant for extended periods of time. In addition, we may have to offer substantial rent abatements, tenant improvements, concessions, early termination rights or below-market renewal options to attract new tenants or retain existing tenants. The factors described above could have a material adverse effect on our business, financial condition, results of operations, cash flow or our ability to satisfy our debt service obligations or to maintain our level of distributions on our Common Stock or Preferred Stock.
Our operating performance is subject to risks associated with the lodging industry.
The success of our hotel property depends largely on the property operator's ability to adapt to dominant trends in the lodging industry as well as disruptions such as greater competitive pressures, increased consolidation, industry overbuilding,
25
dependence on consumer spending patterns and changing demographics, the introduction of new concepts and products such as Airbnb®, Homeaway® and VRBO®, availability of labor, price levels and macroeconomic and microeconomic conditions. The success of a particular hotel brand, the ability of a hotel brand to fulfill any obligations to operators of our business, and trends in the lodging industry could have a material adverse effect on our business, financial condition, results of operations, cash flow or our ability to satisfy our debt service obligations or to maintain our level of distributions on our Common Stock or Preferred Stock.
The performance of the lodging industry has historically been closely linked to the performance of the general economy and, specifically, growth in U.S. gross domestic product. The lodging industry is also sensitive to business and personal discretionary spending levels. The lodging industry could experience a significant decline in occupancy and average daily rates due to a reduction in business and/or leisure travel. General economic conditions, increased fuel costs, natural disasters and terrorist attacks are a few factors that could affect an individual's willingness to travel.
We may be unable to deploy capital in a way that grows our business and, even if consummated, we may fail to successfully integrate and operate acquired properties.
We plan to deploy capital in additional real estate assets as opportunities arise. Our ability to do so on favorable terms and/or successfully integrate and operate them is subject to the following significant risks:
• | we may be unable to deploy capital in additional real estate assets because of competition from real estate investors with better access to less expensive capital, including real estate operating companies, publicly-traded REITs and investment funds; |
• | we may acquire properties that are not accretive to our results upon acquisition, and we may not successfully manage and lease those properties to meet our expectations; |
• | competition from other potential acquirers may significantly increase purchase prices; |
• | acquired properties may be located in new markets where we may face risks associated with a lack of market knowledge or understanding of the local economy, lack of business relationships in the area and unfamiliarity with local governmental and permitting procedures; |
• | we may be unable to generate sufficient cash from operations or obtain the necessary debt or equity financing to consummate a transaction on favorable terms or at all; |
• | we may need to spend more money than anticipated to make necessary improvements or renovations to acquired properties; |
• | we may spend significant time and money on potential transactions that we do not consummate; |
• | we may be unable to quickly and efficiently integrate new acquisitions into our existing operations; |
• | we may suffer higher than expected vacancy rates and/or lower than expected rental rates; and |
• | we may acquire properties without any recourse, or with only limited recourse, for liabilities against the former owners of the properties. |
If we cannot complete real estate transactions on favorable terms, or operate acquired assets to meet our goals or expectations, our business, financial condition, results of operations, cash flow or our ability to satisfy our debt service obligations or to maintain our level of distributions on our Common Stock or Preferred Stock could be materially adversely affected.
We may be unable to successfully expand our operations into new markets.
The risks described in the immediately preceding risk factor that are applicable to our ability to acquire and successfully integrate and operate properties in the markets in which our properties are located are also applicable to our ability to acquire and successfully integrate and operate properties in new markets. In addition to these risks, we may not possess the same level of familiarity with the dynamics and market conditions of certain new markets that we may enter, which could adversely affect our ability to expand into those markets. We may be unable to build a significant market share or achieve a
26
desired return on our assets in new markets. If we are unsuccessful in expanding into new markets, it could have a material adverse effect on our business, financial condition, results of operations, cash flow or our ability to satisfy our debt service obligations or to maintain our level of distributions on our Common Stock or Preferred Stock.
We may deploy capital outside of the United States, which would subject us to additional risks that may affect our operations unfavorably.
We may deploy some of our capital outside of the United States. Such deployment of capital in foreign countries could be affected unfavorably by changes in exchange rates due to political and economic factors, including inflation. Because non-U.S. companies are not subject to uniform accounting, auditing and financial reporting standards, practices and requirements comparable with those applicable to U.S. companies, there may be different types of, and lower quality, information available about non-U.S. companies and their assets. This may affect our ability to underwrite and evaluate proposed deployment of capital in foreign countries or to obtain appropriate financial reports relating to such deployment. In addition, with respect to certain countries, there may be an increased potential for corrupt business practices, or the possibility of expropriation or confiscatory taxation, political or social instability, or diplomatic developments that could affect our deployment of capital in those countries. Moreover, individual economies could differ unfavorably from the U.S. economy in such respects as growth of gross national product, rate of inflation, changes in currency rates and exchange control regulations and capital reinvestment. As a result of the factors described in this paragraph, any capital deployed outside of the United States may be subject to a higher degree of risk; there can also be no assurance that any such deployment will generate returns comparable to similar deployment of capital made in the United States.
We are subject to risks and liabilities unique to joint venture relationships.
We may contemplate acquisitions of properties through joint ventures and sales to institutions of partial ownership of properties that we wholly own. Joint venture involves certain risks, including for example:
• | disputes with joint venture partners might affect our ability to develop, operate or dispose of a property; |
• | the refinancing of unconsolidated joint venture debt may require additional equity commitments on our part; |
• | joint venture partners may control or share certain approval rights over major decisions or might have economic or other business interests or goals that are inconsistent with our business interests or goals that would affect our ability to operate the property; |
• | we may be forced to fulfill the obligations of a joint venture or of joint venture partners who default on their obligations including those related to debt or interest rate swaps; and |
• | there may be conflicts of interests because our joint venture partners may have varying interests such as different needs for liquidity, different assessments of the market, different tax objectives or ownership of competing interests in properties in our markets. |
The occurrence of one or more of the foregoing events could adversely affect our business, financial condition, results of operations, cash flow or our ability to satisfy our debt service obligations or to maintain our level of distributions on our Common Stock or Preferred Stock.
Our properties may be subject to impairment charges.
We routinely evaluate our assets for impairment indicators. The judgment regarding the existence and magnitude of impairment indicators is based on factors such as market conditions, tenant performance and lease structure. For example, the early termination of, or default under, a lease by a tenant may lead to an impairment charge. If we determine that an impairment has occurred, we will be required to make a downward adjustment to the net carrying value of the property, which could have a material adverse effect on our results of operations in the period in which the impairment charge is recorded. Negative developments in the real estate market may cause management to reevaluate the business and macro-economic assumptions used in its impairment analysis. Changes in management's assumptions based on actual results may have a material impact on the Company's financial statements.
27
We may obtain only limited warranties when we purchase a property and typically have only limited recourse in the event our due diligence did not identify any issues that lower the value of our property.
The seller of a property often sells such property in "as is" condition on a "where is" basis and "with all faults," without any warranties of merchantability or fitness for a particular use or purpose. In addition, purchase agreements may contain only limited warranties, representations and indemnifications that survive for only a limited period after the closing and with a cap on recoverable damages. In the event we purchase a property with a limited warranty, there will be an increased risk that we will lose some or all of our capital in the property.
We may be unable to sell a property if or when we decide to do so, including as a result of uncertain market conditions.
Real estate assets are, in general, relatively illiquid and may become even more illiquid during periods of economic downturn. As a result, we may not be able to sell our properties quickly or on favorable terms in response to changes in the economy or other conditions when it otherwise may be prudent to do so. In addition, certain significant expenditures generally do not change in response to economic or other conditions, including debt service obligations, real estate taxes, and operating and maintenance costs. This combination of variable revenue and relatively fixed expenditures may result, under certain market conditions, in reduced earnings. Therefore, we may be unable to adjust our portfolio promptly in response to economic, market or other conditions, which could adversely affect our business, financial condition, results of operations, cash flow or our ability to satisfy our debt service obligations or to maintain our level of distributions on our Common Stock or Preferred Stock.
Some of our leases may not include periodic rental increases, or the rental increases may be less than the fair market rate at a future point in time. In either case, the value of the leased property to a potential purchaser may not increase over time, which may restrict our ability to sell that property, or if we are able to sell that property, may result in a sale price less than the price that we paid to purchase the property or the price that could be obtained if the rental was at the then-current market rate.
We expect to hold our various real properties until such time as we decide that a sale or other disposition is appropriate given our business objectives. Our ability to dispose of properties on advantageous terms or at all depends on certain factors beyond our control, including competition from other sellers and the availability of attractive financing for potential buyers of our properties. We cannot predict the various market conditions affecting real estate assets which will exist at any particular time in the future. Due to the uncertainty of market conditions which may affect the disposition of our properties, we cannot assure our stockholders that we will be able to sell such properties at a profit or at all in the future. Accordingly, the extent to which our stockholders will receive cash distributions and realize potential appreciation on our real estate assets will depend upon fluctuating market conditions. Furthermore, we may be required to expend funds to correct defects or to make improvements before a property can be sold. We cannot assure our stockholders that we will have funds available to correct such defects or to make such improvements.
We may be unable to secure funds for our future long-term liquidity needs.
Our long-term liquidity needs will consist primarily of funds necessary for acquisitions of assets, development or repositioning of properties, capital expenditures, refinancing of indebtedness, paying distributions on our Preferred Stock or any other preferred stock we may issue and redemption of our Preferred Stock (if we choose to pay the redemption price in cash instead of in shares of our Common Stock) and distributions on our Common Stock. We may not have sufficient funds on hand or may not be able to obtain additional financing to cover all of these long-term cash requirements although, it should be noted that we do not currently have any significant property development or repositioning projects planned. The nature of our business, and the requirements imposed by REIT rules that we distribute a substantial majority of our REIT taxable income on an annual basis in the form of dividends, may cause us to have substantial liquidity needs over the long-term. We will seek to satisfy our long-term liquidity needs through one or more of the following methods: (i) offerings of shares of Common Stock, preferred stock, senior unsecured securities, and/or other equity and debt securities; (ii) credit facilities and term loans; (iii) the addition of senior recourse or non-recourse debt using target acquisitions as well as existing assets as collateral; (iv) the sale of existing assets; and/or (v) cash flows from operations. These sources of funding may not be available on attractive terms or at all. If we cannot obtain additional funding for our long-term liquidity needs, our assets may generate lower cash flow or decline in value, or both, which may cause us to sell assets at a time when we would not otherwise do so and could have a material adverse effect on our business, financial condition, results of operations, cash flow or our ability to satisfy our debt service obligations or to maintain our level of distributions on our Common Stock or Preferred Stock.
28
Income from our long-term leases is the primary source of our cash flow from operations and is subject to risks related to increases in expenses and inflation.
We are exposed to risks related to increases in market lease rates and inflation, as income from long-term leases is the primary source of our cash flow from operations. Leases of long-term duration or which include renewal options that specify a maximum rate increase may result in below-market lease rates over time if we do not accurately estimate inflation or market lease rates. Provisions of our leases designed to mitigate the risk of inflation and unexpected increases in market lease rates, such as periodic rental increases, may not adequately protect us from the impact of inflation or unexpected increases in market lease rates. If we are subject to below-market lease rates on a significant number of our properties pursuant to long-term leases and our operating and other expenses are increasing faster than anticipated, our business, financial condition, results of operations, cash flow or our ability to satisfy our debt service obligations or to maintain our level of distributions on our Common Stock or Preferred Stock could be materially adversely affected.
We may finance properties with lock-out provisions, which may prohibit us from selling a property or may require us to maintain specified debt levels for a period of years on some properties.
A lock-out provision is a provision that prohibits the prepayment of a loan during a specified period of time. Lock-out provisions may include terms that provide strong financial disincentives for borrowers to prepay their outstanding loan balance. If a property is subject to a lock-out provision, we may be materially restricted from or delayed in selling or otherwise disposing of or refinancing such property. Lock-out provisions may prohibit us from reducing the outstanding indebtedness with respect to any properties, refinancing such indebtedness at maturity, or increasing the amount of indebtedness with respect to such properties. Lock-out provisions could impair our ability to take other actions during the lock-out period that could be in the best interests of our stockholders and, therefore, may have an adverse impact on the value of our securities relative to the value that would result if the lock-out provisions did not exist. In particular, lock-out provisions could preclude us from participating in major transactions that could result in a disposition of our assets or a change of control even though that disposition or change of control might be in the best interests of our stockholders.
Increased operating expenses could reduce cash flow from operations and funds available to deploy capital or make distributions.
Our properties are subject to operating risks common to real estate in general, any or all of which may negatively affect us. If any property is not fully occupied or if rents are payable (or are being paid) in an amount that is insufficient to cover operating expenses that are our responsibility under the lease, we could be required to expend funds in excess of such rents with respect to that property for operating expenses. Our properties are subject to increases in tax rates, utility costs, insurance costs, repairs and maintenance costs, administrative costs and other operating and ownership expenses. Our property leases may not require the tenants to pay all or a portion of these expenses, in which event we may be responsible for these costs. If we are unable to lease properties on terms that require the tenants to pay all or some of the properties' operating expenses, if our tenants fail to pay these expenses as required or if expenses we are required to pay exceed our expectations, we could have less funds available for future acquisitions or cash available for distributions to our stockholders.
The market environment may adversely affect our operating results, financial condition and ability to pay distributions to our stockholders.
Any deterioration of domestic or international financial markets could impact the availability of credit or contribute to rising costs of obtaining credit and therefore, could have the potential to adversely affect the value of our assets, the availability or the terms of financing, our ability to make principal and interest payments on, or refinance, any indebtedness and/or, for our leased properties, the ability of our tenants to enter into new leasing transactions or satisfy their obligations, including the payment of rent, under existing leases. The market environment also could affect our operating results and financial condition as follows:
• | Debt Markets—The debt market is sensitive to the macro environment, such as Federal Reserve policy, market sentiment, or regulatory factors affecting the banking and commercial mortgage backed securities ("CMBS") industries. Should overall borrowing costs increase, due to either increases in index rates or increases in lender spreads, our operations may generate lower returns. |
• | Real Estate Markets—While incremental demand growth has helped to reduce vacancy rates and support modest rental growth in recent years, and while improving fundamentals have resulted in gains in property values, in many markets property values, occupancy and rental rates continue to be below those previously experienced before the most recent economic downturn. If recent improvements in the economy reverse course, the properties |
29
we acquire could substantially decrease in value after we purchase them. Consequently, we may not be able to recover the carrying amount of our properties, which may require us to recognize an impairment charge or record a loss on sale in our earnings.
Real estate-related taxes may increase, and if these increases are not passed on to tenants, our income will be reduced.
Local real property tax assessors may reassess our properties, which may result in increased taxes. Generally, property taxes increase as property values or assessment rates change, or for other reasons deemed relevant by property tax assessors. An increase in the assessed valuation of a property for real estate tax purposes will result in an increase in the related real estate taxes on that property. Although some tenant leases may permit us to pass through such tax increases to the tenants for payment, renewal leases or future leases may not be negotiated on the same basis. Tax increases not passed through to tenants could have a material adverse effect on our business, financial condition, results of operations, cash flow or our ability to satisfy our debt service obligations or to maintain our level of distributions on our Common Stock or Preferred Stock.
Our operating results may be negatively affected by development and construction delays and the resultant increased costs and risks.
If we engage in development or construction projects, we will be subject to uncertainties associated with re-zoning for development, environmental and land use concerns of governmental entities and/or community groups, and our builder's ability to build in conformity with plans, specifications, budgeted costs, and timetables. If a builder fails to perform, we may resort to legal action to rescind the breached agreement or to compel performance. A builder's performance may also be affected or delayed by conditions beyond the builder's control. Delays in completion of construction could also give tenants the right to terminate preconstruction leases. We may incur additional risks if we make periodic progress payments or other advances to builders before they complete construction. These and other such factors can result in increased costs of a project or loss of our asset. In addition, we will be subject to normal lease-up risks relating to newly constructed projects. We also must rely on rental income and expense projections and estimates of the fair market value of property upon completion of construction when agreeing upon a price at the time we acquire the property. If our projections are inaccurate, we may pay too much for a property, and our return on our assets could suffer.
We may deploy capital in unimproved real property. Returns from development of unimproved properties are also subject to risks associated with re-zoning the land for development and environmental and land use concerns of governmental entities and/or community groups.
We face significant competition.
Our office portfolio competes with a number of developers, owners and operators of office real estate, many of which own properties similar to ours in the same markets in which our properties are located. If our competitors offer space at rental rates below current market rates, or below the rental rates we currently charge our tenants, we may lose existing or potential tenants and may not be able to replace them, and we may be pressured to reduce our rental rates below those we currently charge or to offer more substantial rent abatements, tenant improvements, early termination rights or below-market renewal options in order to retain tenants when our tenants' leases expire. As a result of any of the foregoing factors, our business, financial condition, results of operations, cash flow or our ability to satisfy our debt service obligations or to maintain our level of distributions on our Common Stock or Preferred Stock may be materially adversely affected.
Our hotel property competes for guests primarily with other hotels in the immediate vicinity of our hotel and secondarily with other hotels in the geographic market of our hotel. An increase in the number of competitive hotels in these areas could have a material adverse effect on the occupancy, average daily rate and RevPAR of our hotel.
Terrorism and war could harm our operating results.
The strength and profitability of our business depends on demand for and the value of our properties. Future terrorist attacks in the United States, such as the attacks that occurred in New York and the District of Columbia on September 11, 2001 and in Boston on April 15, 2013, and other acts of terrorism or war may have a negative impact on our operations. Terrorist attacks in the United States and elsewhere may result in declining economic activity, which could harm the demand for and the value of our properties. In addition, the public perception that certain locations are at greater risk for attack, such as major airports, ports, and rail facilities, may decrease the demand for and the value of our properties near these sites. A decrease in demand could make it difficult for us to renew or re-lease our properties at these sites at lease rates equal to or above historical rates. Such terrorist attacks could have an adverse impact on our business even if they are not directed at our properties.
30
In addition, the terrorist attacks of September 11, 2001 have substantially affected the availability and price of insurance coverage for certain types of damages or occurrences, and our insurance policies for terrorism include large deductibles and co-payments. Although we maintain terrorism insurance coverage on our portfolio, the amount of our terrorism insurance coverage may not be sufficient to cover losses inflicted by terrorism and therefore could expose us to significant losses and have a negative impact on our operations.
In connection with the ownership and operation of real estate properties, we may be potentially liable for costs and damages related to environmental matters.
Environmental laws regulate, and impose liability for, releases of hazardous or toxic substances into the environment. Under some of these laws, an owner or operator of real estate may be liable for costs related to soil or groundwater contamination on or migrating to or from its property. In addition, persons who arrange for the disposal or treatment of hazardous or toxic substances may be liable for the costs of cleaning up contamination at the disposal site.
These laws often impose liability regardless of whether the person knew of, or was responsible for, the presence of the hazardous or toxic substances that caused the contamination. The presence of, or contamination resulting from, any of these substances, or the failure to properly remediate them, may adversely affect our ability to sell or rent our property, to borrow using the property as collateral or create lender's liability for us. In addition, third parties exposed to hazardous or toxic substances may sue for personal injury damages and/or property damages. For example, some laws impose liability for release of or exposure to asbestos-containing materials. As a result, in connection with our former, current or future ownership, operation, and development of real properties, or our role as a lender for loans secured directly or indirectly by real estate properties, we may be potentially liable for investigation and cleanup costs, penalties and damages under environmental laws.
Although many of our properties have been subjected to preliminary environmental assessments, known as Phase I assessments, by independent environmental consultants that identify certain liabilities, Phase I assessments are limited in scope, and may not include or identify all potential environmental liabilities or risks associated with a property. Unless required by applicable law, we may decide not to further investigate, remedy or ameliorate the liabilities disclosed in the Phase I assessments.
Further, these or other environmental studies may not identify all potential environmental liabilities or accurately assess whether we will incur material environmental liabilities in the future. If we do incur material environmental liabilities in the future, our business, financial condition, results of operations, cash flow or our ability to satisfy our debt service obligations or to maintain our level of distributions on our Common Stock or Preferred Stock could be materially adversely affected.
Changes in U.S. accounting standards regarding operating leases may make the leasing of our properties less attractive to our potential tenants, which could reduce overall demand for our leasing services.
Under current authoritative accounting guidance for leases, a lease is classified by a tenant as a capital lease if the significant risks and rewards of ownership are considered to reside with the tenant. Under capital lease accounting for a tenant, both the leased asset and liability are reflected on its balance sheet. If the lease does not meet the criteria for a capital lease, the lease is to be considered an operating lease by the tenant, and the obligation does not appear on the tenant's balance sheet; rather, the contractual future minimum payment obligations are only disclosed in the footnotes thereto. Thus, entering into an operating lease can appear to enhance a tenant's balance sheet in comparison to direct ownership. The Financial Accounting Standards Board (the "FASB") and the International Accounting Standards Board conducted a joint project to re-evaluate lease accounting. In February 2016, the FASB issued Accounting Standards Update ("ASU") 2016-02, Leases ("ASU 2016-02"), which will require that a tenant recognize assets and liabilities on the balance sheet for all leases with a lease term of more than 12 months, with the result being the recognition of a right of use asset and a lease liability and the disclosure of key information about the entity's leasing arrangements. These and other potential changes to the accounting guidance could affect both our accounting for leases as well as that of our current and potential tenants. These changes may affect how our real estate leasing business is conducted. For example, with the ASU 2016-02 revision, companies may be less willing to enter into leases in general or desire to enter into leases with shorter terms because the apparent benefits to their balance sheets under current practice could be reduced or eliminated. This impact in turn could make it more difficult for us to enter into leases on terms we find favorable. The amendments in ASU 2016-02 are effective for fiscal years beginning after December 15, 2018, including interim periods within those fiscal years. The Company is currently evaluating the impact ASU 2016-02 will have on its consolidated financial statements.
31
Changes in accounting standards may adversely impact our financial condition and/or results of operations.
We are subject to the rules and regulations of the U.S. Financial Accounting Standards Board related to generally accepted accounting principles in the United States ("GAAP"). Various changes to GAAP are constantly being considered, some of which could materially impact our reported financial condition and/or results of operations. Also, to the extent publicly traded companies in the United States would be required in the future to prepare financial statements in accordance with International Financial Reporting Standards instead of the current GAAP, this change in accounting standards could materially affect our financial condition or results of operations.
Compliance with the ADA and fire, safety and other regulations may require us to make unanticipated expenditures that could significantly reduce the cash available for distributions on our Common Stock or Preferred Stock.
Our properties are subject to regulation under federal laws, such as the ADA, pursuant to which all public accommodations must meet federal requirements related to access and use by disabled persons. Although we believe that our properties substantially comply with present requirements of the ADA, we have not conducted an audit or investigation of all of our properties to determine our compliance. If one or more of our properties or future properties are not in compliance with the ADA, we might be required to take remedial action, which would require us to incur additional costs to bring the property into compliance. Noncompliance with the ADA could also result in imposition of fines or an award of damages to private litigants.
Additional federal, state and local laws also may require modifications to our properties or restrict our ability to renovate our properties. We cannot predict the ultimate amount of the cost of compliance with the ADA or other legislation.
In addition, our properties are subject to various federal, state and local regulatory requirements, such as state and local earthquake, fire and life safety requirements. If we were to fail to comply with these various requirements, we might incur governmental fines or private damage awards. If we incur substantial costs to comply with the ADA or any other regulatory requirements, our business, financial condition, results of operations, cash flow or our ability to satisfy our debt service obligations or to maintain our level of distributions on our Common Stock or Preferred Stock could be materially adversely affected. Local regulations, including municipal or local ordinances, zoning restrictions and restrictive covenants imposed by community developers may restrict our use of our properties and may require us to obtain approval from local officials or community standards organizations at any time with respect to our properties, including prior to acquiring a property or when undertaking renovations of any of our existing properties.
Risks Associated with Debt Financing
We have incurred indebtedness and may incur significant additional indebtedness on a consolidated basis.
As of December 31, 2017, our total consolidated indebtedness was $630,852,000. We may incur significant additional indebtedness to fund future acquisitions, development activities and operational needs. The degree of leverage could make us more vulnerable to a downturn in business or the economy generally.
Payments of principal and interest on our borrowings may leave us with insufficient cash resources to operate our properties and/or pay distributions on our Common Stock or Preferred Stock. The incurrence of substantial outstanding indebtedness, and the limitations imposed by our debt agreements, could have significant other adverse consequences, including the following:
• | our cash flows may be insufficient to meet our required principal and interest payments; |
• | we may be unable to borrow additional funds as needed or on favorable terms, which could, among other things, adversely affect our liquidity for acquisitions or operations; |
• | we may be unable to refinance our indebtedness at maturity or the refinancing terms may be less favorable than the terms of our existing indebtedness; |
• | we may be forced to dispose of one or more of our properties, possibly on disadvantageous terms; |
• | we may violate restrictive covenants in our debt documents, which would entitle the lenders to accelerate our debt obligations; |
32
• | we may default on our obligations and the lenders or mortgagees may foreclose on our properties and take possession of any collateral that secures their loans; and |
• | our default under any of our indebtedness with cross-default provisions could result in a default on other indebtedness. |
If any one of these events occurs, our business, financial condition, results of operations, cash flow or our ability to satisfy our debt service obligations or to maintain our level of distributions on our Common Stock or Preferred Stock may be materially adversely affected. In addition, any foreclosure on our properties could create taxable income without the accompanying cash proceeds, which could adversely affect our ability to meet the REIT distribution requirements imposed by the Internal Revenue Code of 1986, as amended (the "Code").
We intend to rely in part on external sources of capital to fund future capital needs and, if we encounter difficulty in obtaining such capital, we may not be able to meet maturing obligations or make additional acquisitions.
In order to qualify and maintain our qualification as a REIT under the Code, we are required, among other things, to distribute annually to our stockholders at least 90% of our REIT taxable income (which does not equal net income as calculated in accordance with GAAP), determined without regard to the deduction for dividends paid and excluding any net capital gain. Because of this dividend requirement, we may not be able to fund from cash retained from operations all of our future capital needs, including capital needed to refinance maturing obligations or make new acquisitions.
The capital and credit markets have experienced extreme volatility and disruption in recent years. Market volatility and disruption could hinder our ability to obtain new debt financing or refinance our maturing debt on favorable terms or at all or to raise debt and equity capital. Our access to capital will depend upon a number of factors, including:
• | general market conditions; |
• | government action or regulation, including changes in tax law; |
• | the market's perception of our future growth potential; |
• | the extent of stockholder interest; |
• | analyst reports about us and the REIT industry; |
• | the general reputation of REITs and the attractiveness of their equity securities in comparison to other equity securities, including securities issued by other real estate-based companies; |
• | our financial performance and that of our tenants; |
• | our current debt levels; |
• | our current and expected future earnings; and |
• | our cash flow and cash distributions, including our ability to satisfy the dividend requirements applicable to REITs. |
If we are unable to obtain needed capital on satisfactory terms or at all, we may not be able to meet our obligations and commitments as they mature or make any new acquisitions.
High interest rates may make it difficult for us to finance or refinance assets, which could reduce the number of properties we can acquire and the amount of cash distributions we can make.
We run the risk of being unable to finance or refinance our assets on favorable terms or at all. If interest rates are high when we desire to mortgage our assets or when existing loans come due and the assets need to be refinanced, we may not be able to, or may choose not to, finance the assets and we would be required to use cash to purchase or repay outstanding obligations. Our inability to use debt to finance or refinance our assets could reduce the number of assets we can acquire, which could reduce our operating cash flow and the amount of cash distributions we can make to our stockholders. Higher costs of capital also could negatively impact our operating cash flow and returns on our assets.
33
Increases in interest rates could increase the amount of our debt payments and adversely affect our ability to pay distributions to our stockholders.
We have incurred indebtedness, and in the future may incur additional indebtedness, that bears interest at a variable rate. To the extent that we incur variable rate debt and do not hedge our exposure thereunder, increases in interest rates would increase the amounts payable under such indebtedness, which could reduce our operating cash flows and our ability to pay distributions to our stockholders. In addition, if our existing indebtedness matures or otherwise becomes payable during a period of rising interest rates, we could be required to liquidate one or more of our assets at times that may prevent realization of the maximum return on such assets.
We may not be able to generate sufficient cash flow to meet our debt service obligations.
Our ability to make payments on and to refinance our indebtedness, and to fund our operations, working capital and capital expenditures, depends on our ability to generate cash. To a certain extent, our cash flow is subject to general economic, industry, financial, competitive, operating, legislative, regulatory and other factors, many of which are beyond our control.
We cannot assure our stockholders that our business will generate sufficient cash flow from operations or that future sources of cash will be available to us in an amount sufficient to enable us to pay amounts due on our indebtedness or to fund our other liquidity needs.
Additionally, if we incur additional indebtedness in connection with any future deployment of capital or development projects or for any other purpose, our debt service obligations could increase. We may need to refinance all or a portion of our indebtedness before maturity. Our ability to refinance our indebtedness or obtain additional financing will depend on, among other things:
• | our financial condition and market conditions at the time; |
• | restrictions in the agreements governing our indebtedness; |
• | general economic and capital market conditions; |
• | the availability of credit from banks or other lenders; and |
• | our results of operations. |
As a result, we may not be able to refinance our indebtedness on commercially reasonable terms, or at all. If we do not generate sufficient cash flow from operations, and additional borrowings or refinancing or proceeds of asset sales or other sources of cash are not available to us, we may not have sufficient cash to enable us to meet all of our obligations. Accordingly, if we cannot service our indebtedness, we may have to take actions such as seeking additional equity, or delaying any strategic acquisitions and alliances or capital expenditures, any of which could have a material adverse effect on our business, financial condition, results of operations, cash flow or our ability to satisfy our debt service obligations or to maintain our level of distributions on our Common Stock or Preferred Stock.
Lenders may require us to enter into restrictive covenants relating to our operations, which could limit our ability to make distributions to our stockholders.
In connection with providing us financing, a lender could impose restrictions on us that affect our distribution and operating policies and our ability to incur additional debt. Loan documents we enter into may contain covenants that limit our ability to further mortgage the property or discontinue insurance coverage. These or other limitations imposed by a lender may adversely affect our flexibility and limit our ability to pay distributions on our Common Stock or Preferred Stock.
Interest-only indebtedness may increase our risk of default and ultimately may reduce our funds available for distribution to our stockholders.
We may finance some of our property acquisitions using interest-only mortgage indebtedness. During the interest-only period, the amount of each scheduled payment will be less than that of a traditional amortizing mortgage loan. The principal balance of the mortgage loan will not be reduced (except in the case of prepayments) because there are no scheduled monthly payments of principal during this period. After the interest-only period, we will be required either to make scheduled payments of amortized principal and interest or to make a lump-sum or "balloon" payment at maturity. These required principal or
34
balloon payments will increase the amount of our scheduled payments and may increase our risk of default under the related mortgage loan. If the mortgage loan has an adjustable interest rate, the amount of our scheduled payments also may increase at a time of rising interest rates. Increased payments and substantial principal or balloon maturity payments will reduce the funds available for distribution to our stockholders because cash otherwise available for distribution will be required to pay principal and interest associated with these mortgage loans.
Our ability to make a balloon payment at maturity is uncertain and may depend upon our ability to obtain additional financing or our ability to sell the property. At the time the balloon payment is due, we may or may not be able to refinance the loan on terms as favorable as the original loan or sell the property at a price sufficient to make the balloon payment. The effect of a refinancing or sale could affect the rate of return to stockholders and the projected time of disposition of our assets. In addition, payments of principal and interest made to service our debts may leave us with insufficient cash to pay the distributions that we are required to pay to maintain our qualification as a REIT. Any of these results would have a significant, negative impact on the value of our securities.
We have entered, or may in the future enter, into hedging transactions that could expose us to contingent liabilities in the future and materially adversely impact our financial condition and results of operations.
Subject to maintaining our qualification as a REIT, we have entered, or may in the future enter, into hedging transactions that could require us to fund cash payments in certain circumstances (e.g., the early termination of the hedging instrument caused by an event of default or other early termination event, or the decision by a counterparty to request margin securities it is contractually owed under the terms of the hedging instrument), which could in turn result in economic losses to us.
In addition, certain of the hedging instruments that we may enter into could involve additional risks if they are not traded on regulated exchanges, guaranteed by an exchange or our clearing house, or regulated by any U.S. or foreign governmental authorities. It cannot be assured that a liquid secondary market will exist for hedging instruments that we may enter into in the future, and we may be required to maintain a position until exercise or expiration, which could result in significant losses.
We intend to record any derivative and hedging transactions we enter into in accordance with GAAP. However, we may choose not to pursue, or fail to qualify for, hedge accounting treatment relating to such derivative instruments. As a result, our operating results may suffer because losses, if any, on these derivative instruments may not be offset by a change in the fair value of the related hedged transaction or item. Any losses sustained as a result of our hedging transactions would be reflected in our results of operations, and our ability to fund these obligations will depend on the liquidity of our assets and access to capital at the time, and the need to fund these obligations could have a material adverse effect on our business, financial condition, results of operations, cash flow or our ability to satisfy our debt service obligations or to maintain our level of distributions on our Common Stock or Preferred Stock.
Risks Related to Our Lending Operations
Our lending operations expose us to a high degree of risk associated with real estate.
The performance and value of our loans depends upon many factors beyond our control. The ultimate performance and value of our loans are subject to risks associated with the ownership and operation of the properties which collateralize our loans, including the property owner's ability to operate the property with sufficient cash flow to meet debt service requirements. The performance and value of the properties collateralizing our loans may be adversely affected by:
• | changes in national or regional economic conditions; |
• | changes in real estate market conditions due to changes in national, regional or local economic conditions or property market characteristics; |
• | competition from other properties; |
• | changes in interest rates and the condition of the debt and equity capital markets; |
• | the ongoing need for capital repairs and improvements; |
35
• | increases in real estate tax rates and other operating expenses (including utilities); |
• | adverse changes in governmental rules and fiscal policies; acts of God, including earthquakes, hurricanes and other natural disasters; acts of war or terrorism; or a decrease in the availability of or an increase in the cost of insurance; |
• | adverse changes in zoning laws; |
• | the impact of environmental legislation and compliance with environmental laws; and |
• | other factors that are beyond our control or the control of the commercial property owners. |
In the event that any of the properties underlying our loans experience any of the foregoing events or occurrences, the value of, and return on, such loans may be negatively impacted, which in turn could have a material adverse effect on our business, financial condition, results of operations, cash flow or our ability to satisfy our debt service obligations or to maintain our level of distributions on our Common Stock or Preferred Stock.
There are significant risks related to loans originated under the SBA 7(a) Program.
Many of the borrowers under our SBA 7(a) Program are privately-owned businesses. There is typically no publicly available information about these businesses; therefore, we must rely on our own due diligence to obtain information in connection with our decisions. Our borrowers may not meet net income, cash flow and other coverage tests typically imposed by banks. A borrower's ability to repay its loan may be adversely impacted by numerous factors, including a downturn in its industry or other negative local or macro-economic conditions. Deterioration in a borrower's financial condition and prospects may be accompanied by deterioration in the collateral for the loan. In addition, small businesses typically depend on the management talents and efforts of one person or a small group of people for their success. The loss of services of one or more of these persons could have an adverse impact on the operations of the small business. Small companies are typically more vulnerable to customer preferences, market conditions and economic downturns and often need additional capital to maintain the business, expand or compete. These factors may have an impact on the ultimate recovery of our loans receivable from such businesses. Loans to small businesses, therefore, involve a high degree of business and financial risk, which can result in substantial losses and accordingly should be considered speculative. The factors described above could have a material adverse effect on our business, financial condition, results of operations, cash flow or our ability to satisfy our debt service obligations or to maintain our level of distributions on our Common Stock or Preferred Stock.
Our loans secured by real estate and our real estate owned ("REO") properties are typically illiquid and their values may decrease.
Our loans secured by real estate and our real estate acquired through foreclosure are typically illiquid. Therefore, we may be unable to vary our portfolio promptly in response to changing economic, financial and investment conditions. As a result, the fair market value of these assets may decrease in the future and losses may result. The illiquid nature of our loans may adversely affect our ability to dispose of such loans at times when it may be advantageous or necessary for us to liquidate such assets, which in turn could have a material adverse effect on our business, financial condition, results of operations, cash flow or our ability to satisfy our debt service obligations or to maintain our level of distributions on our Common Stock or Preferred Stock.
Our lending operations have an industry concentration, which may negatively impact our financial condition and results of operations.
A majority of our revenue from the lending operations is generated from loans collateralized by hospitality properties. At December 31, 2017, our loans subject to credit risk were 97.3% concentrated in the hospitality industry. Any factors that negatively impact the hospitality industry, including recessions, severe weather events (such as hurricanes, blizzards, floods, etc.), depressed commercial real estate markets, travel restrictions, bankruptcies or other political or geopolitical events or the introduction of new concepts and products such as Airbnb®, Homeaway® and VRBO®, could have a material adverse effect on our business, financial condition, results of operations, cash flow or our ability to satisfy our debt service obligations or to maintain our level of distributions on our Common Stock or Preferred Stock.
36
Establishing loan loss reserves entails significant judgment and may negatively impact our results of operations.
We have a quarterly review process to identify and evaluate potential exposure to loan losses. The determination of whether significant doubt exists and whether a loan loss reserve is necessary requires judgment and consideration of the facts and circumstances existing at the evaluation date. Additionally, further changes to the facts and circumstances of the individual borrowers, the limited service hospitality industry and the economy may require the establishment of additional loan loss reserves and the effect to our results of operations would be adverse. If our judgments underlying the establishment of our loan loss reserves are not correct, our results of operations may be negatively impacted.
Whenever our borrowers experience significant operating difficulties and we are forced to liquidate the collateral underlying the loans, losses may be relatively substantial and could have a material adverse effect on our business, financial condition, results of operations, cash flow or our ability to satisfy our debt service obligations or to maintain our level of distributions on our Common Stock or Preferred Stock.
Our SBA 7(a) Program loans are subject to delinquency, foreclosure and loss, any or all of which could result in losses.
Our loans originated pursuant to the SBA 7(a) Program are collateralized by income-producing properties and typically have personal guarantees. These loans are predominantly to operators of limited service hospitality properties. As a result, these operators are subject to risks associated with the hospitality industry, including recessions, severe weather events, depressed commercial real estate markets, travel restrictions, bankruptcies or other political or geopolitical events.
Our SBA 7(a) loans that have real estate as collateral are subject to risks of delinquency and foreclosure. The ability of a borrower to repay a loan secured by an income-producing property typically is dependent primarily upon the successful operation of such property rather than upon the existence of independent income or assets of the borrower. If the net operating income of and/or cash flow from the property is reduced, the borrower's ability to repay the loan may be impaired. Net operating income of and/or cash flow from an income-producing property can be affected by, among other things, tenant mix, success of tenant businesses, property management decisions, property location and condition, competition from comparable types of properties, changes in laws that increase operating expenses or limit rents that may be charged, any need to address environmental contamination at the property, the occurrence of any uninsured casualty at the property, changes in national, regional or local economic conditions and/or specific industry segments, declines in regional or local real estate values, declines in regional or local rental or occupancy rates, increases in interest rates, real estate tax rates and other operating expenses, changes in governmental rules, regulations and fiscal policies, including environmental legislation, acts of God, terrorism, social unrest and civil disturbances.
In the event of a loan default, we will bear a risk of loss of principal to the extent of any deficiency between the value of the collateral multiplied by our percentage ownership and the unguaranteed portion of the principal and accrued interest on the loan. In the event of the bankruptcy of the borrower, the loan to such borrower will be deemed collateralized only to the extent of the value of the underlying property at the time of the bankruptcy (as determined by the bankruptcy court). In addition to losses related to collateral deficiencies, during the foreclosure process we may incur costs related to the protection of our collateral including unpaid real estate taxes, legal fees, franchise fees, insurance and operating shortfalls to the extent the property is being operated by a court-appointed receiver.
Foreclosure and bankruptcy are complex and sometimes lengthy processes that are subject to federal and state laws and regulations. An action to foreclose on a property is subject to many of the delays and expenses of other lawsuits if the defendant raises defenses or counterclaims. In the event of a default by a mortgagor, these restrictions, among other things, may impede our ability to foreclose on or sell the mortgaged property or to obtain proceeds sufficient to repay all amounts due under the note. Further, borrowers have the option of seeking federal bankruptcy protection which could delay the foreclosure process. In conjunction with the bankruptcy process, the terms of the loan agreements may be modified. Typically, delays in the foreclosure process will have a negative impact on our results of operations and/or financial condition due to direct and indirect costs incurred and possible deterioration of the value of the collateral. After foreclosure has been completed, a lack of funds or capital may force us to sell the underlying property resulting in a lower recovery even though developing the property prior to a sale could result in a higher recovery.
As a result of the factors described above, defaults on SBA 7(a) Program loans could have a material adverse effect on our business, financial condition, results of operations, cash flow or our ability to satisfy our debt service obligations or to maintain our level of distributions on our Common Stock or Preferred Stock.
37
Mezzanine loans are subject to delinquency, foreclosure and loss, any or all of which could result in losses.
We may originate mezzanine loans, which are loans made to entities that have subsidiaries which own real property and are secured by pledges of such entity's equity ownership in its property-owning subsidiary. Mezzanine loans are by their nature structurally and legally subordinated to more senior property-level financings. Accordingly, if a borrower defaults on our mezzanine loan or if there is a default by our borrower's subsidiary on debt senior to our loan, or in the event of a borrower bankruptcy, our mezzanine loan will be satisfied only after the property-level debt and other senior debt is paid in full.
We may also retain, from whole loans we originate, subordinate interests referred to as B-notes. B-notes are commercial real estate loans secured by a first mortgage on a single large commercial property or group of related properties and subordinated to a senior interest, referred to as an A-note. As a result, if a borrower defaults, there may not be sufficient funds remaining for B-note owners after payment to the A-note owners.
Moreover, under the terms of intercreditor arrangements governing mezzanine loans, B-notes and other similar subordinated loans originated by us, we may have to satisfy certain liquidity and capital requirements before we can step into a borrower's position after it has defaulted. There can be no assurance that we will be able to satisfy such requirements, resulting in potentially lower recovery. After a foreclosure on the pledged equity interest has been completed, a lack of funds may force us to sell the underlying property without developing it further (which sale may result in a lower recovery) instead of injecting funds into and developing the property prior to a sale (which may result in a higher recovery).
As a result of the factors described above, defaults on commercial real estate loans could have a material adverse effect on our business, financial condition, results of operations, cash flow or our ability to satisfy our debt service obligations or to maintain our level of distributions on our Common Stock or Preferred Stock.
We operate in a competitive market for real estate opportunities and future competition for commercial real estate collateralized loans may limit our ability to originate or dispose of our target loans and could also affect the yield of these loans.
We are in competition with a number of entities for the types of commercial real estate collateralized loans that we may originate. These entities include, among others, debt funds, specialty finance companies, savings and loan associations, banks and financial institutions. Some of these competitors may be substantially larger and have considerably greater financial, technical and marketing resources than we do. Some of these competitors may also have a lower cost of funds and access to funding sources that may not be available to us currently. In addition, many of our competitors may not be subject to operating constraints associated with REIT qualification or maintenance of exclusions from registration under the Investment Company Act. Furthermore, competition may further limit our ability to generate desired returns. Due to this competition, we may not be able to take advantage of attractive opportunities from time to time, and can offer no assurance that we will be able to identify and deploy our capital in a manner consistent with our objective. We cannot guarantee that the competitive pressures we face will not have a material adverse effect on our business, financial condition, results of operations, cash flow or our ability to satisfy our debt service obligations or to maintain our level of distributions on our Common Stock or Preferred Stock.
We may be subject to lender liability claims.
In recent years, a number of judicial decisions have upheld the right of borrowers to sue lending institutions on the basis of various evolving legal theories, collectively termed "lender liability." Generally, lender liability is founded on the premise that a lender has either violated a duty, whether implied or contractual, of good faith and fair dealing owed to the borrower or has assumed a degree of control over the borrower resulting in the creation of a fiduciary duty owed to the borrower or our other creditors or stockholders. There can be no assurance that that such claims will not arise or that we will not be subject to significant liability if a claim of this type did arise.
Curtailment of our ability to utilize the SBA 7(a) Program by the federal government could adversely affect our results of operations.
We are dependent upon the federal government to maintain the SBA 7(a) Program. There can be no assurance that the program will be maintained or that loans will continue to be guaranteed at current levels. In addition, there can be no assurance that our SBA lending subsidiary, First Western SBLC, Inc. ("First Western") will be able to maintain its status as a Preferred Lender or that we can maintain our SBA 7(a) license.
If we cannot continue originating and selling government guaranteed loans at current levels, we could experience a decrease in future servicing spreads and earned premiums. From time-to-time the SBA has reached its internal budgeted limits
38
and ceased to guarantee loans for a stated period of time. In addition, the SBA may change its rules regarding loans or Congress may adopt legislation or fail to approve a budget that would have the effect of discontinuing, reducing availability of funds for, or changing loan programs. Non-governmental programs could replace government programs for some borrowers, but the terms might not be equally acceptable. If these changes occur, the volume of loans to small businesses that now qualify for government guaranteed loans could decline, as could the profitability of these loans.
First Western has been granted national preferred lender program ("PLP") status and originates, sells and services small business loans and is authorized to place SBA guarantees on loans without seeking prior SBA review and approval. Being a national lender, PLP status allows First Western to expedite loans since First Western is not required to present applications to the SBA for concurrent review and approval. The loss of PLP status could have a material adverse effect on our business, financial condition, results of operations, cash flow or our ability to satisfy our debt service obligations or to maintain our level of distributions on our Common Stock or Preferred Stock.
U.S. Federal Income and Other Tax Risks
Failure to qualify and maintain our qualification as a REIT would have significant adverse consequences to us and the value of our securities.
If we fail to qualify as a REIT for federal income tax purposes, we would be taxed as a corporation. We believe that we are organized and qualify as a REIT and intend to operate in a manner that will allow us to continue to qualify as a REIT. However, we cannot guarantee that we are qualified as such, or that we will remain qualified as such in the future. This is because qualification as a REIT involves the application of highly technical and complex provisions of the Code as to which there are only limited judicial and administrative interpretations and involves the determination of facts and circumstances not entirely within our control. Future legislation, new regulations, administrative interpretations or court decisions may significantly change the tax laws or the application of the tax laws with respect to qualification as a REIT for federal income tax purposes or the federal income tax consequences of such qualification.
If we fail to qualify as a REIT, we could face serious tax consequences that could substantially reduce our funds available for payment of distributions to our stockholders for each of the years involved because:
• | we would not be allowed a deduction for dividends paid to stockholders in computing our taxable income and could be subject to federal income tax at regular corporate rates; |
• | we also could be subject to increased state and local taxes; |
• | unless we are entitled to relief under statutory provisions, we could not elect to be subject to be taxed as a REIT for four taxable years following the year during which we are disqualified; and |
• | all dividends would be subject to tax as ordinary income to the extent of our current and accumulated earnings and profits potentially eligible as "qualified dividends" subject to the applicable income tax rate. |
Any such corporate tax liability could be substantial and would reduce our cash available for, among other things, our operations and distributions to stockholders. In addition, if we fail to qualify as a REIT, we would no longer be required to pay dividends. As a result of these factors, our failure to qualify as a REIT could have a material adverse effect on our business, financial condition, results of operations, cash flow or our ability to satisfy our debt service obligations or to maintain our level of distributions on our Common Stock or Preferred Stock.
Dividends payable by REITs do not qualify for the reduced tax rates available for some dividends.
Income from "qualified dividends" payable to U.S. stockholders that are individuals, trusts and estates are generally subject to tax at preferential rates. Dividends payable by REITs, however, generally are not eligible for the preferential tax rates applicable to qualified dividend income. Although these rules do not adversely affect the taxation of REITs or dividends payable by REITs, to the extent that the preferential rates continue to apply to regular corporate qualified dividends, investors who are individuals, trusts and estates may perceive investments in REITs to be relatively less attractive than investments in the stocks of non-REIT corporations that pay dividends, which could materially and adversely affect the value of the shares of REITs, including the per share trading price of our securities. However, under the Tax Cuts and Jobs Act for taxable years prior to 2026, non-corporate U.S. stockholders of REITs are entitled to a deduction equal to 20% of any “qualified REIT dividends.” A qualified REIT dividend is defined as any dividend from a REIT that is not a capital gain dividend or a dividend attributable
39
to dividend income from U.S. corporations or certain non-U.S. corporations. A non-corporate U.S. stockholder’s ability to claim a deduction equal to 20% of qualified REIT dividends received may be limited by the stockholder’s particular circumstances.
Our ownership of and relationship with our taxable REIT subsidiaries will be limited, and a failure to comply with the limits would jeopardize our REIT status and may result in the application of a 100% excise tax.
Subject to certain restrictions, a REIT may own up to 100% of the stock of one or more taxable REIT subsidiaries (“TRSs”). A TRS may earn income that would not be qualifying income if earned directly by the parent REIT. Both the subsidiary and the REIT must jointly elect to treat the subsidiary as a TRS. A corporation of which a TRS directly or indirectly owns more than 35% of the voting power or value of the stock will automatically be treated as a TRS. Overall, no more than 20% of the value of a REIT's assets may consist of stock or securities of one or more TRSs. A TRS generally will pay income tax at regular corporate rates on any taxable income that it earns. In addition, the TRS rules limit the deductibility of interest paid or accrued by a TRS to its parent REIT to assure that the TRS is subject to an appropriate level of corporate taxation. The rules also impose a 100% excise tax on certain transactions between a TRS and its parent REIT that are not conducted on an arm's-length basis.
Our TRSs are subject to normal corporate income taxes. We continuously monitor the value of our investments in TRSs for the purpose of ensuring compliance with the rule that no more than 20% of the value of our assets may consist of TRS stock and securities (which is applied at the end of each calendar quarter). The aggregate value of our TRS stock and securities is less than 20% of the value of our total assets (including our TRS stock and securities) as of December 31, 2017. In addition, we will scrutinize all of our transactions with our TRSs for the purpose of ensuring that they are entered into on arm's-length terms in order to avoid incurring the 100% excise tax described above. There are no distribution requirements applicable to the TRSs and after-tax earnings may be retained. There can be no assurance, however, that we will be able to comply with the 20% limitation on ownership of TRS stock and securities on an ongoing basis so as to maintain REIT status or to avoid application of the 100% excise tax imposed on certain non-arm's-length transactions.
We may be subject to adverse legislative or regulatory tax changes that could increase our tax liability or reduce our operating flexibility, including the recently passed Tax Cuts and Jobs Act.
In recent years, numerous legislative, judicial and administrative changes have been made in the provisions of U.S. federal income tax laws applicable to investments similar to an investment in shares of our capital stock. Additional changes to the tax laws are likely to continue to occur, and we cannot assure our stockholders that any such changes will not adversely affect our taxation and our ability to continue to qualify as a REIT or the taxation of a stockholder. Any such changes could have an adverse effect on an investment in our shares or on the market value or the resale potential of our assets. Our stockholders are urged to consult with their tax advisor with respect to the impact of recent legislation on their investment in our shares and the status of legislative, regulatory or administrative developments and proposals and their potential effect on an investment in our shares. Although REITs generally receive better tax treatment than entities taxed as regular corporations, it is possible that future legislation would result in a REIT having fewer tax advantages, and it could become more advantageous for a company that invests in real estate to elect to be treated for U.S. federal income tax purposes as a regular corporation. As a result, our charter provides our board of directors with the power, under certain circumstances, to revoke or otherwise terminate our REIT election and cause us to be taxed as a regular corporation, without the vote of our stockholders. Our board of directors has fiduciary duties to us and our stockholders and could only cause such changes in our tax treatment if it determines in good faith that such changes are in the best interests of our stockholders.
In addition, the Tax Cuts and Jobs Act makes significant changes to the U.S. federal income tax rules for taxation of individuals and businesses, generally effective for taxable years beginning after December 31, 2017. In addition to reducing corporate and individual tax rates, the Tax Cuts and Jobs Act eliminates or restricts various deductions. Many of the changes applicable to individuals are temporary and apply only to taxable years beginning after December 31, 2017 and before January 1, 2026. The Tax Cuts and Jobs Act makes numerous large and small changes to the tax rules that do not affect the REIT qualification rules directly but may otherwise affect us or our stockholders and could impact the geographic markets in which we operate as well as our tenants in ways, both positive and negative, that are difficult to anticipate. For example, the limitation in the Tax Cuts and Jobs Act on the deductibility of certain state and local taxes may make operating in jurisdictions that impose such taxes at higher rates less desirable than operating in jurisdictions imposing such taxes at lower rates.
While the changes in the Tax Cuts and Jobs Act generally appear to be favorable with respect to REITs, the extensive changes to non-REIT provisions in the Code may have unanticipated effects on us or our stockholders. Moreover, Congressional leaders have recognized that the process of adopting extensive tax legislation in a short amount of time without hearings and substantial time for review is likely to have led to drafting errors, issues needing clarification and unintended
40
consequences that will have to be revisited in subsequent tax legislation. At this point, it is not clear if or when Congress will address these issues or when the Internal Revenue Service will issue administrative guidance on the changes made in the Tax Cuts and Jobs Act.
We urge our stockholders to consult with their own tax advisor with respect to the status of the Tax Cuts and Jobs Act and other legislative, regulatory or administrative developments and proposals and their potential effect on holding our securities.
In certain circumstances, we may be subject to certain federal, state and local taxes as a REIT, which would reduce our cash available for distribution to our stockholders.
Even if we qualify and maintain our status as a REIT, we may be subject to certain federal, state and local taxes. For example, net income from the sale of properties that are "dealer" properties sold by a REIT (a "prohibited transaction" under the Code) will be subject to a 100% excise tax. Additionally, if we are not able to make sufficient distributions to eliminate our REIT taxable income, we may be subject to tax as a corporation on our undistributed REIT taxable income. We may also decide to retain income we earn from the sale or other dispositions of our properties and pay income tax directly on such income. In that event, our stockholders would be treated as if they earned that income and paid the tax on it directly. However, stockholders that are tax-exempt, such as charities or qualified pension plans, would have no benefit from their deemed payment of such tax liability. We may also be subject to state and local taxes on our income or property, either directly or at the level of the other entities through which we indirectly own our assets. Any federal, state or local taxes we pay will reduce our cash available for distribution to our stockholders.
To maintain our qualification as a REIT we must meet annual distribution requirements, which may force us to forgo otherwise attractive opportunities or borrow funds during unfavorable market conditions. This could delay or hinder our ability to meet our objectives and reduce our stockholders' overall return.
In order to qualify as a REIT, we must distribute annually to our stockholders at least 90% of our REIT taxable income (which does not equal net income as calculated in accordance with GAAP), determined without regard to the deduction for dividends paid and excluding any net capital gain. We will be subject to U.S. federal income tax on our undistributed taxable income and net capital gain and to a 4% nondeductible excise tax on any amount by which dividends we pay with respect to any calendar year are less than the sum of (a) 85% of our ordinary income, (b) 95% of our capital gain net income and (c) 100% of our undistributed income from prior years.
Further, to maintain our qualification as a REIT, we must ensure that we meet the REIT gross income tests annually and that at the end of each calendar quarter, at least 75% of the value of our assets consists of cash, cash items, government securities and qualified REIT real estate assets, including certain mortgage loans and certain kinds of mortgage-related securities. The remainder of our investment in securities (other than government securities, qualified real estate assets and stock of a TRS) generally cannot include more than 10% of the outstanding voting securities of any one issuer or more than 10% of the total value of the outstanding securities of any one issuer. In addition, in general, no more than 5% of the value of our assets (other than government securities, qualified real estate assets and stock of a TRS) can consist of the securities of any one issuer, no more than 20% of the value of our total assets can be represented by securities of one or more TRSs and no more than 25% of the value of our total assets can be represented by certain debt securities of publicly offered REITs. If we fail to comply with these requirements at the end of any calendar quarter, we must correct the failure within 30 days after the end of the calendar quarter or qualify for certain statutory relief provisions to avoid losing our REIT qualification and suffering adverse tax consequences.
The foregoing requirements could cause us to distribute amounts that otherwise would be spent on deploying capital in real estate assets and it is possible that we might be required to borrow funds, possibly at unfavorable rates, or sell assets to fund these dividends or make taxable stock dividends. Although we intend to make distributions sufficient to meet the annual distribution requirements and to avoid U.S. federal income and excise taxes on our earnings, it is possible that we might not always be able to do so.
Non-U.S. stockholders may be subject to U.S. federal withholding tax and may be subject to U.S. federal income tax upon the disposition of our shares.
Gain recognized by a non-U.S. stockholder upon the sale or exchange of shares of our capital stock generally will not be subject to U.S. federal income taxation unless such stock constitutes a "U.S. real property interest" ("USRPI") under the Foreign Investment in Real Property Tax Act of 1980 ("FIRPTA"). Shares of our capital stock will not constitute a USRPI so long as we are a "domestically-controlled qualified investment entity." A domestically-controlled qualified investment entity
41
includes a REIT if at all times during a specified testing period, less than 50% in value of such REIT's stock is held directly or indirectly by non-U.S. stockholders. We believe that we are a domestically-controlled qualified investment entity. However, because our capital stock is and will be freely transferable (other than restrictions on ownership and transfer that are intended to assist us in maintaining our qualification as a REIT for federal income tax purposes as described in the risk factor "The share transfer and ownership restrictions applicable to REITs and contained in our charter may inhibit market activity in our shares of stock and restrict our business combination opportunities”), no assurance can be given that we are or will be a domestically-controlled qualified investment entity.
Even if we do not qualify as a domestically-controlled qualified investment entity at the time a non-U.S. stockholder sells or exchanges shares of our capital stock, gain arising from such a sale or exchange would not be subject to U.S. taxation under FIRPTA as a sale of a USRPI if: (a) the class of shares of capital stock sold or exchanged is "regularly traded," as defined by applicable U.S. Treasury regulations, on an established securities market, and (b) such non-U.S. stockholder owned, actually or constructively, 10% or less of the outstanding shares of such class of capital stock at all times during the shorter of the five-year period ending on the date of the sale and the period that such non-U.S. stockholder owned such shares. If the class of shares of capital stock sold or exchanged is not "regularly traded," gain arising from such sale or exchange would not be subject to U.S. taxation under FIRPTA as a sale of a USRPI if: (x) on the date the shares were acquired by the non-U.S. stockholder, such shares did not have a fair market value greater than the fair market value on that date of 5% of the “regularly traded” class of our outstanding shares of capital stock with the lowest fair market value, and (y) the test in clause (x) is also satisfied as of the date of any subsequent acquisition by such non-U.S. stockholder of additional shares of the same non-“regularly traded” class of our capital stock, including all such shares owned as of such date by such non-U.S. stockholder. Complex constructive ownership rules apply for purposes of determining the amount of shares held by a non-U.S. stockholder for these purposes.
Complying with REIT requirements may limit our ability to hedge our liabilities effectively and may cause us to incur tax liabilities.
The REIT provisions of the Code may limit our ability to hedge our liabilities. Any income from a hedging transaction we enter into to manage risk of interest rate changes, price changes or currency fluctuations with respect to borrowings made or to be made to acquire or carry real estate assets or to offset certain other positions, if properly identified under applicable U.S. Treasury regulations, does not constitute "gross income" for purposes of the 75% or 95% gross income tests. To the extent that we enter into other types of hedging transactions, the income from those transactions will likely be treated as non-qualifying income for purposes of one or both of the gross income tests. As a result of these rules, we may need to limit our use of advantageous hedging techniques or implement those hedges through a TRS. This could increase the cost of our hedging activities because our TRSs would be subject to tax on gains or expose us to greater risks associated with changes in interest rates than we would otherwise want to bear. In addition, losses in a TRS generally will not provide any tax benefit, except for being carried forward against future taxable income of such TRS.
Our property taxes could increase due to property tax rate changes or reassessment, which would impact our cash flows.
Even if we continue to qualify as a REIT for U.S. federal income tax purposes, we will be required to pay some state and local taxes on our properties. The real property taxes on our properties may increase as property tax rates change or as our properties are assessed or reassessed by taxing authorities. Therefore, the amount of property taxes we pay in the future may increase substantially. If the property taxes we pay increase and if any such increase is not reimbursable under the terms of our lease, then our cash flows will be impacted, which in turn could have a material adverse effect on our business, financial condition, results of operations, cash flow or our ability to satisfy our debt service obligations or to maintain our level of distributions on our Common Stock or Preferred Stock.
The share transfer and ownership restrictions applicable to REITs and contained in our charter may inhibit market activity in our shares of stock and restrict our business combination opportunities.
In order to continue to qualify as a REIT, five or fewer individuals, as defined in the Code, may not own, actually or constructively, more than 50% in value of our issued and outstanding shares of stock at any time during the last half of each taxable year, other than the first year for which a REIT election is made. Attribution rules in the Code determine if any individual or entity actually or constructively owns our shares of stock under this requirement. Additionally, at least 100 persons must beneficially own our shares of stock during at least 335 days of a taxable year for each taxable year, other than the first year for which a REIT election is made. To help ensure that we meet these tests, among other purposes, our charter restricts the acquisition and ownership of our shares of stock.
Our charter, with certain exceptions, authorizes our directors to take such actions as are necessary and desirable to preserve our qualification as a REIT. Unless exempted by the board of directors, for so long as we continue to qualify as a
42
REIT, our charter prohibits, among other limitations on ownership and transfer of shares of our stock, any person from beneficially or constructively owning (applying certain attribution rules under the Code) more than 9.8% (in value or in number of shares, whichever is more restrictive) of the aggregate of our outstanding shares of capital stock and more than 9.8% (in value or in number of shares, whichever is more restrictive) of our Common Stock. The board of directors, in its sole discretion and upon receipt of certain representations and undertakings, may exempt a person (prospectively or retrospectively) from the ownership limits. However, the board of directors may not, among other limitations, grant an exemption from these ownership restrictions to any proposed transferee whose ownership, direct or indirect, in excess of the 9.8% ownership limit would result in the termination of our qualification as a REIT. These restrictions on transferability and ownership will not apply, however, if the board of directors determines that it is no longer in our best interest to continue to qualify as a REIT or that compliance with the restrictions is no longer required in order for us to continue to so qualify as a REIT.
These ownership limits could delay or prevent a transaction or a change in control that might involve a premium price for our capital stock or otherwise be in the best interest of our stockholders.
Risks Related to Our Common Stock and Preferred Stock
Future sales of our shares of Common Stock may cause the market price of our Common Stock to drop significantly, even if our business is doing well.
Urban II is entitled to registration rights, subject to certain limitations, with respect to our securities pursuant to the Registration Rights and Lockup Agreement dated March 11, 2014 between us and Urban II (the "Registration Rights and Lockup Agreement"). Urban II is entitled to require us, on up to eight occasions, to register under the Securities Act, our shares of Common Stock it received in connection with the merger between PMC Commercial Trust and CIM REIT that was completed on March 11, 2014. We have registered 19,500,000 shares of our Common Stock on behalf of Urban II under the Registration Rights and Lockup Agreement.
While Urban II was initially subject to lockup restrictions in the Registration Rights and Lockup Agreement, the lockup restrictions have expired and, therefore, there may be significant pent-up demand by CIM REIT to sell shares of our Common Stock that it holds. A large volume of sales of shares of our Common Stock could decrease the prevailing market price of shares of our Common Stock and could impair our ability to raise additional capital through the sale of equity securities in the future. Even if a substantial number of sales of shares of our Common Stock do not occur, the mere perception of the possibility of these sales could depress the market price of shares of our Common Stock and have a negative effect on our ability to raise capital in the future.
Changes in market conditions could adversely affect the market prices of our Common Stock and Series L Preferred Stock.
The market value of our Common Stock and Series L Preferred Stock, as with other publicly traded equity securities, will depend on various market conditions, which may change from time to time. In addition to the economic environment and future volatility in the securities and credit markets in general, the market conditions described in the risk factor "We intend to rely in part on external sources of capital to fund future capital needs and, if we encounter difficulty in obtaining such capital, we may not be able to meet maturing obligations or make additional acquisitions." In addition, increases in market interest rates may lead investors to demand a higher annual yield from our distributions in relation to the price of our securities.
The market value of our Common Stock is based primarily upon the market's perception of our growth potential and our current and potential future earnings and cash dividends and our capital structure. Consequently, our Common Stock or our Series L Preferred Stock may trade at prices that are higher or lower than our NAV per share of Common Stock or the stated value of the Series L Preferred Stock of $28.37 (the "Series L Preferred Stock Stated Value"), subject to adjustment. If our future earnings or cash distributions are less than expected, the market prices of our Common Stock or Series L Preferred Stock could decline.
The limited trading market for our Common Stock subjects our share price to greater volatility and, as a result, a holder of our Common Stock may not be able to resell his or her shares at or above the price paid for them.
Although our Common Stock is listed for trading on Nasdaq and the TASE, the volume of trading in our Common Stock has been lower than many other companies listed on these exchanges because, as of March 2, 2018, approximately 96.4% of our Common Stock is presently owned by Urban II, other affiliates of CIM Group and our executive officers and directors. A public trading market with depth, liquidity and orderliness depends on the presence in the market of willing buyers and sellers of our Common Stock at any given time. This presence depends on the individual decisions of investors and general economic
43
and market conditions over which we have no control. Limited trading volume may subject our Common Stock to greater price volatility and may make it difficult for investors to sell shares at a price that is attractive to them.
Our Common Stock ranks junior to our Series A Preferred Stock with respect to dividends and upon liquidation.
The rights of the holders of shares of Series A Preferred Stock rank senior to the rights of the holders of shares of our Common Stock as to dividends and payments upon liquidation. Unless full cumulative dividends on shares of our Series A Preferred Stock for all past dividend periods have been declared and paid (or set apart for payment), we will not declare or pay dividends with respect to any shares of our Common Stock for any period. Upon liquidation, dissolution or winding up of our Company, the holders of shares of our Series A Preferred Stock are entitled to receive a liquidation preference of the stated value, initially $25.00 per share (the "Series A Preferred Stock Stated Value"), subject to adjustment, plus all accrued but unpaid dividends at the rate of 5.5% per annum, prior and in preference to any distribution to the holders of shares of our Common Stock or any other class of our equity securities.
Our Common Stock ranks junior to our Series L Preferred Stock, except to the extent of the Initial Dividend (as defined below), with respect to distributions.
The rights of the holders of shares of our Common Stock rank junior to the rights of the holders of shares of our Series L Preferred Stock as to distributions, except to the extent of the Initial Dividend. The Initial Dividend for a given fiscal year is a minimum annual amount, in U.S. Dollars ("USD"), that is announced by us at the end of the prior fiscal year; provided that we are under no obligation to pay any portion of the Initial Dividend unless and until our Board of Directors authorizes and we declare any such distribution. While there are no limitations on the maximum amount of the Initial Dividend that can be paid in a particular year, it is our intention that we will not announce an Initial Dividend for any given year that, based on the information then reasonably available to us at the time of announcement, we believe will cause us to be unable to make a future distribution on our Series L Preferred Stock or on any other outstanding share of preferred stock. Subject to certain exceptions, holders of our Series L Preferred Stock are entitled to receive cumulative cash distributions on each share of Series L Preferred Stock ("Series L Preferred Stock Distribution"), at an annual rate of 5.5%, which rate is subject to increase in certain circumstances, of the Series L Preferred Stock Stated Value.
On December 21, 2017, our Board of Directors announced an Initial Dividend on shares of our Common Stock for fiscal year 2018 in the aggregate amount of $21,892,469. We must declare and pay distributions on our Common Stock equal to the Initial Dividend prior to declaring and paying any portion of the Series L Preferred Stock Distribution. Other than to the extent of the Initial Dividend, the rights of the holders of shares of our Common Stock rank junior to the rights of holders of shares of our Series L Preferred Stock to the extent of the Series L Preferred Stock Distribution.
Our Common Stock ranks junior to the Series L Preferred Stock upon liquidation, except that our Common Stock ranks senior to any accrued and unpaid Series L Preferred Stock Distribution to the extent of the Initial Dividend.
Upon any voluntary or involuntary liquidation, dissolution or winding up of our Company, the holders of shares of our Series L Preferred Stock are entitled to receive a liquidation preference in the amount of the Series L Preferred Stock Stated Value prior and in preference to any dividend distribution to the holders of shares of our Common Stock or any other class or series of our equity securities. However, holders of our Common Stock are entitled to receive, prior to our payment to holders of our Series L Preferred Stock of any accrued and unpaid Series L Preferred Stock Distribution, an amount equal to the amount of any unpaid Initial Dividend.
If a Series A Preferred Warrant is exercised through a "cashless exercise," the holder of the Series A Preferred Warrant may recognize gain or loss.
The warrant agreement related to the Series A Preferred Warrants (the "Series A Preferred Warrant Agreement") provides that, in certain cases, a holder may be required to satisfy its obligation to pay the exercise price through a "cashless exercise." Upon such a cashless exercise, the holder may recognize taxable gain or loss.
The exercise price of our Series A Preferred Warrants is established based on the Applicable NAV (as defined below), and the Applicable NAV may not be indicative of the price at which the shares of Common Stock for which the Series A Preferred Warrants may be exercised would trade.
The exercise price of our Series A Preferred Warrants is based upon the Applicable NAV. As used herein, "Applicable NAV" means the fair market NAV of the Company per share of Common Stock as most recently published by the Company at the time of the issuance of the applicable Series A Preferred Warrant. The Company determines the Applicable NAV on an
44
annual basis or more frequently if, in the Company's discretion, significant developments warrant. The Company's determination of the Applicable NAV is final and binding. The valuation methodologies underlying our NAVs will involve subjective judgments. Valuations of real properties do not necessarily represent the price at which a willing buyer would purchase our properties; therefore, there can be no assurance that we would realize the values underlying our estimated NAVs if we were to sell our assets and distribute the net proceeds to our stockholders. The values of our assets and liabilities are likely to fluctuate over time. The exercise price for Series A Preferred Warrants may not be indicative of the price at which the shares of Common Stock for which the Series A Preferred Warrants may be exercised would trade or of the proceeds that a stockholder would receive if we were liquidated or dissolved or of the value of our portfolio at the time holders would be able to dispose of their shares.
Shares of Common Stock issuable upon exercise of a Series A Preferred Warrant have not been registered under the Securities Act.
If, upon any exercise of any Series A Preferred Warrant, a registration statement covering the sale of the Common Stock issuable upon exercise of a Series A Preferred Warrant is not effective and an exemption from such registration is not available, the holder of such Series A Preferred Warrant may only satisfy its obligation to pay the exercise price through a "cashless exercise." We have no obligation to file a registration statement to register the shares of Common Stock underlying any Series A Preferred Warrants.
Holders of our securities may be required to recognize taxable income in excess of any cash or other distributions received from us, and non-U.S. stockholders could be subject to withholding tax on such amounts.
The Series A Preferred Warrant Agreement provides that adjustments may be made to the exercise price or the number of shares of Common Stock issuable upon exercise of the Series A Preferred Warrant. In certain cases, such an adjustment could result in the recognition of a taxable dividend to those shares acquired upon exercise of the Series A Preferred Warrant even if there was no cash or other distribution from us.
Shares of Series A Preferred Stock may be redeemed for shares of Common Stock, which ranks junior to the Series A Preferred Stock with respect to dividends and upon liquidation.
From and after the second anniversary of the date of original issuance of any shares of Series A Preferred Stock, the holder of such shares may require us to redeem such shares, with the redemption price payable, in our sole discretion, in cash or in equal value through the issuance of shares of Common Stock, based on the volume weighted average price of our Common Stock for the 20 trading days prior to the redemption. The rights of the holders of shares of Series A Preferred Stock rank senior to the rights of the holders of shares of our Common Stock as to dividends and payments upon liquidation. Unless full cumulative dividends on our shares of Series A Preferred Stock for all past dividend periods have been declared and paid (or set apart for payment), we will not declare or pay dividends with respect to any shares of our Common Stock for any period. Upon liquidation, dissolution or winding up of our Company, the holders of shares of our Series A Preferred Stock are entitled to receive a liquidation preference of the Series A Preferred Stock Stated Value, plus all accrued but unpaid dividends at the rate of 5.5% per annum, prior and in preference to any distribution to the holders of shares of our Common Stock or any other class of our equity securities.
We may suffer from delays in deploying capital, which could adversely affect our ability to pay distributions to our stockholders and the value of our securities.
We could suffer from delays in deploying capital, particularly if the capital we raise in the offering of our Series A Preferred Stock outpaces our Operator's ability to identify acquisitions and/or close on them. Such delays, which may be caused by a number of factors, including competition in the market for the same real estate opportunities, may adversely affect our ability to pay distributions to our stockholders and/or the value of their overall returns on investment in our securities.
The cash distributions received by holders of Common Stock and Preferred Stock may be less frequent or lower in amount than expected by such holders.
Our Board of Directors will determine the amount and timing of distributions on our Common Stock and Preferred Stock. In making this determination, our Board of Directors will consider all relevant factors, including the amount of cash resources available for distributions, capital spending plans, cash flow, financial position, applicable requirements of the MGCL and any applicable contractual restrictions. We cannot assure that we will be able to consistently generate sufficient available cash flow to fund distributions on our Common Stock and/or Preferred Stock, nor can we assure that sufficient cash will be available to make distributions on our Common Stock and/or Preferred Stock (in each case, even to the extent of the Initial
45
Dividend). While holders of Common Stock are entitled to receive distributions if, as and when authorized by our Board of Directors and declared by us out of legally available funds, we cannot predict with certainty the amount of distributions holders of Common Stock may receive and we may be unable to pay, maintain or increase such distributions over time.
Our ability to redeem our Preferred Stock or to pay distributions on our Common Stock or Preferred Stock may be limited by Maryland law.
Under Maryland law, a corporation may redeem, or pay distributions on, stock as long as, after giving effect to the redemption or distribution, the corporation is able to pay its debts as they become due in the usual course (the equity solvency test) and its total assets exceed the sum of its total liabilities plus, unless its charter permits otherwise, the amount that would be needed, if the corporation were to be dissolved at the time of the redemption or distribution, to satisfy the preferential rights upon dissolution of stockholders when preferential rights on dissolution are superior to those whose stock is being redeemed or on which the distributions are being paid (the balance sheet solvency test). If the Company is insolvent at any time when a redemption of our Preferred Stock or distribution on our Common Stock or Preferred Stock is required to be made, the Company may not be able to effect such redemption or distribution.
Holders of our securities are subject to inflation risk.
Inflation is the reduction in the purchasing power of money resulting from the increase in the price of goods and services. Inflation risk is the risk that the inflation-adjusted, or "real," value of an investment in our Common Stock and Preferred Stock, or the income from that investment, will be worth less in the future. As inflation occurs, the real value of our Common Stock and Preferred Stock and distributions payable on such shares may decline because the rate of distribution will remain the same.
If market interest rates go up, prospective purchasers of shares of our Common Stock or Preferred Stock may expect a higher distribution rate on their investment. Higher market interest rates would not, however, result in more funds for us to pay distributions and, to the contrary, would likely increase our borrowing costs and potentially decrease funds available for distributions, and higher interest rates will not change the distribution rate on the Preferred Stock. Thus, higher market interest rates could cause the market price of our Common Stock and Preferred Stock to decline.
We have the option to redeem shares of Preferred Stock after the fifth anniversary of the date of initial issuance without the consent of the holder of such shares.
From and after the fifth anniversary of the date of original issuance of the shares of our Preferred Stock, we will have the right (but not the obligation) to redeem any or all shares of our Preferred Stock at a redemption price equal to, in the case of our Series A Preferred Stock, 100% of the Series A Preferred Stock Stated Value, plus any accrued and unpaid dividends and, in the case of our Series L Preferred Stock, 100% of the Series L Preferred Stock Stated Value plus any accrued and unpaid Series L Preferred Stock Distributions as of the effective date of the redemption. However, if for any given quarter the conditions specified in the Articles Supplementary defining the terms of the Series L Preferred Stock are not met, or we are in arrears on the Series L Preferred Stock Distributions, we will not be able to exercise our redemption right.
We have the right, at our option and in our sole discretion, to pay the redemption price (1) of our Series A Preferred Stock in cash or in equal value through the issuance of shares of Common Stock, based on the volume weighted average price of our Common Stock for the 20 trading days prior to the redemption and (2) of our Series L Preferred Stock (A) in cash, in Israeli new shekels ("ILS"), at the then-current exchange rate determined in accordance with the Articles Supplementary defining the terms of the Series L Preferred Stock, (B) in equal value through the issuance of shares of Common Stock, with such value of Common Stock to be deemed the lower of (i) our NAV per share of our Common Stock as most recently published by the Company as of the effective date of redemption and (ii) the volume-weighted average price of our Common Stock, determined in accordance with the Articles Supplementary defining the terms of the Series L Preferred Stock, or (C) in a combination of cash, in ILS, and our Common Stock, based on the conversion mechanisms set forth in (A) and (B), respectively.
The transfer and ownership restrictions applicable to our securities may impair the ability of stockholders to receive shares of our Common Stock upon exercise of the Warrants and, if the Company elects to pay the redemption price in shares of Common Stock, upon redemption of the Preferred Stock.
Our charter contains restrictions on ownership and transfer of the Preferred Stock and Common Stock that are intended to assist us in maintaining our qualification as a REIT for federal income tax purposes as described in the risk factor "The share transfer and ownership restrictions applicable to REITs and contained in our charter may inhibit market activity in
46
our shares of stock and restrict our business combination opportunities." Additionally, the Warrant Agreement provides that Warrants may not be exercised to the extent such exercise would result in the holder's beneficial or constructive ownership of more than 9.8%, in number or value, whichever is more restrictive, of our outstanding shares of capital stock. These restrictions may impair the ability of stockholders to receive shares of our Common Stock upon exercise of the Warrants and, if the Company elects to pay the redemption price in shares of Common Stock, upon redemption of the Preferred Stock.
The terms of our Preferred Stock do not contain any financial covenants, other than with respect to the Series L Preferred Stock, a limited restriction on our ability to issue shares of preferred stock.
Other than as described below, the terms of our Preferred Stock do not contain any financial covenants such as limitations on indebtedness and distributions. As of December 31, 2017, our total consolidated indebtedness was $630,852,000 and we may incur additional debt in the future. The Preferred Stock is subordinate to all of our existing and future debt and liabilities. Our future debt may include restrictions on our ability to pay distributions to preferred stockholders or make redemptions in the event of a default under such debt agreements or other circumstances. In addition, (i) while the Series A Preferred Stock ranks senior to our Common Stock with respect to payment of dividends and distributions upon liquidation, dissolution or winding up, we are allowed to pay dividends on our Common Stock so long as we are current in the payment of dividends on shares of our Series A Preferred Stock and (ii) while the Series L Preferred Stock ranks senior to our Common Stock with respect to payment of distributions, except to the extent of the Initial Dividend, and amounts payable upon our liquidation, dissolution or winding up, to the extent of the Series L Preferred Stock Stated Value, we are allowed to pay dividends on our Common Stock so long as we are current in the payment of the Series L Preferred Stock Distribution and dividends on shares of our Series A Preferred Stock. Further, the terms of our Preferred Stock do not restrict our ability to repurchase shares of our Common Stock. Such dividends on or repurchases of our Common Stock may reduce the amount of cash on hand to pay the redemption price of our Preferred Stock in cash (if we so choose).
Until the fifth anniversary of the date of original issuance of our Series L Preferred Stock, we are prohibited from issuing any shares of preferred stock ranking senior to or on parity with the Series L Preferred Stock with respect to the payment of dividends, other distributions, liquidation, and/or dissolution or winding up of the Company unless the Minimum Fixed Charge Coverage Ratio, calculated in accordance with the Articles Supplementary describing the Series L Preferred Stock, is equal to or greater than 1.25:1.00. Our good faith determination of an applicable Minimum Fixed Charge Coverage Ratio is binding absent manifest error for purposes of this restriction. At December 31, 2017, we were in compliance with the Series L Preferred Stock Minimum Fixed Charge Coverage Ratio.
Holders of our Preferred Stock have no voting rights with respect to such shares.
The terms of our Preferred Stock do not entitle holders to voting rights. Our Common Stock is currently the only class of our capital stock that carries any voting rights. Unless and until a holder of our Preferred Stock acquires shares of our Common Stock upon the redemption of such shares, such holder will have no rights with respect to the shares of our Common Stock issuable upon redemption of our Preferred Stock. If, at our discretion, a holder of our Preferred Stock is issued shares of our Common Stock upon redemption, such holder will be entitled to exercise the rights of holders of our Common Stock only as to matters for which the record date occurs after the effective date of redemption.
The listing of our Common Stock and Series L Preferred Stock on more than one stock exchange may result in price variations that could adversely affect liquidity of the market for our Common Stock and/or Series L Preferred Stock.
Our Common Stock and Series L Preferred Stock are listed on Nasdaq and the TASE. The dual‑listing of our Common Stock and Series L Preferred Stock may result in price variations of our securities between the two exchanges due to a number of factors. First, trading in our securities on these markets takes place in different currencies (USD on Nasdaq and ILS on the TASE). In addition, the exchanges are open for trade at different times of the day and on different days. For example, Nasdaq opens generally during U.S. business hours, Monday through Friday, while the TASE opens generally during Israeli business hours, Sunday through Thursday. The two exchanges also observe different public holidays. Differences in the trading schedules, as well as volatility in the exchange rate of the two currencies, among other factors, may result in different trading prices for our Common Stock and Series L Preferred Stock on the two exchanges. Any decrease in the trading price of our Common Stock and Series L Preferred Stock in one market could cause a decrease in the trading price of such security on the other market.
The dual-listing may adversely affect liquidity and trading prices for our Common Stock and Series L Preferred Stock on one or both of the exchanges as a result of circumstances that may be outside of our control. For example, transfers by holders of our securities from trading on one exchange to the other could result in increases or decreases in liquidity and/or trading prices on either or both of the exchanges. In addition, holders could seek to sell or buy our Series L Preferred Stock or
47
Common Stock to take advantage of any price differences between the two markets through a practice referred to as arbitrage. Any arbitrage activity could create unexpected volatility in both the prices of and volumes of our Series L Preferred Stock and Common Stock available for trading on either exchange.
The existing mechanism for the dual‑listing of securities on Nasdaq and the TASE may be eliminated or otherwise altered such that we may be subject to additional regulatory burden and additional costs.
The existing Israeli regulatory regime provides a mechanism for the dual‑listing of securities traded on Nasdaq and the TASE that does not impose any significant regulatory burden or significant costs on us. If this dual‑listing regime is eliminated or otherwise altered such that we are unable or unwilling to comply with the regulatory requirements, we may incur additional costs and we may consider delisting of our Series L Preferred Stock and/or Common Stock from the TASE.
Item 1B. Unresolved Staff Comments
None.
48
Item 2. Properties
As of December 31, 2017, our real estate portfolio consisted of 20 assets, all of which are fee-simple properties. As of December 31, 2017, our 18 office properties (including one parking garage and two development sites, one of which is being used as a parking lot), totaling approximately 3.3 million rentable square feet, were 94.2% occupied and one hotel with an ancillary parking garage, which has a total of 503 rooms, had RevPAR of $128.43 for the year ended December 31, 2017.
Office Portfolio Summary as of December 31, 2017
Office
Annualized | |||||||||||||||||||
Rent Per | |||||||||||||||||||
Rentable | Annualized | Occupied | |||||||||||||||||
Square | % | % | Rent (2) | Square | |||||||||||||||
Property | Market | Feet | Occupied | Leased (1) | (in thousands) | Foot | |||||||||||||
1 Kaiser Plaza | Oakland, CA | 534,284 | 93.4 | % | 94.0 | % | $ | 19,592 | $ | 39.26 | |||||||||
2101 Webster Street | Oakland, CA | 471,337 | 99.3 | % | 99.3 | % | 18,136 | 38.75 | |||||||||||
999 N Capitol Street | District of Columbia | 323,076 | 83.2 | % | 86.1 | % | 12,485 | 46.45 | |||||||||||
899 N Capitol Street | District of Columbia | 314,667 | 86.1 | % | 86.1 | % | 14,086 | 51.99 | |||||||||||
1901 Harrison Street | Oakland, CA | 275,087 | 91.8 | % | 99.5 | % | 9,342 | 36.99 | |||||||||||
830 1st Street | District of Columbia | 247,337 | 100.0 | % | 100.0 | % | 10,783 | 43.60 | |||||||||||
1333 Broadway | Oakland, CA | 240,887 | 96.7 | % | 96.7 | % | 8,329 | 35.76 | |||||||||||
2100 Franklin Street | Oakland, CA | 216,828 | 98.9 | % | 98.9 | % | 8,470 | 39.50 | |||||||||||
11620 Wilshire Boulevard | Los Angeles, CA | 194,677 | 98.6 | % | 98.6 | % | 7,539 | 39.28 | |||||||||||
3601 S Congress Avenue (3) | Austin, TX | 184,418 | 92.2 | % | 93.6 | % | 5,721 | 33.65 | |||||||||||
4750 Wilshire Boulevard | Los Angeles, CA | 143,361 | 100.0 | % | 100.0 | % | 3,752 | 26.17 | |||||||||||
260 Townsend Street | San Francisco, CA | 66,682 | 100.0 | % | 100.0 | % | 4,721 | 70.80 | |||||||||||
11600 Wilshire Boulevard | Los Angeles, CA | 55,793 | 87.6 | % | 87.6 | % | 2,486 | 50.86 | |||||||||||
Lindblade Media Center (4) | Los Angeles, CA | 32,428 | 100.0 | % | 100.0 | % | 1,403 | 43.27 | |||||||||||
1130 Howard Street (5) | San Francisco, CA | 21,194 | 100.0 | % | 100.0 | % | 1,439 | 67.90 | |||||||||||
Total Office (15 Properties) | 3,322,056 | 94.2 | % | 95.3 | % | $ | 128,284 | $ | 41.00 | ||||||||||
Other Ancillary Properties within Office Portfolio
Annualized | ||||||||||||
Rent Per | ||||||||||||
Rentable | Annualized | Occupied | ||||||||||
Square | % | % | Rent (2) | Square | ||||||||
Property | Market | Feet | Occupied | Leased | (in thousands) | Foot | ||||||
901 N Capitol Street | District of Columbia | N/A (6) | N/A | N/A | N/A | N/A | ||||||
2353 Webster Street Parking Garage | Oakland, CA | N/A | N/A | N/A | N/A | N/A | ||||||
2 Kaiser Plaza Parking Lot | Oakland, CA | N/A (7) | N/A | N/A | N/A | N/A | ||||||
Total Ancillary Office (3 Properties) | N/A | N/A | N/A | N/A | N/A | |||||||
49
Total Office including Other Ancillary
Annualized | |||||||||||||||||
Rent Per | |||||||||||||||||
Rentable | Annualized | Occupied | |||||||||||||||
Square | % | % | Rent (2) | Square | |||||||||||||
Feet | Occupied | Leased (1) | (in thousands) | Foot | |||||||||||||
Total Office incl. Other Ancillary (18 Properties) | 3,322,056 | 94.2 | % | 95.3 | % | $ | 128,284 | $ | 41.00 | ||||||||
(1) | Based on leases signed as of December 31, 2017. |
(2) | Other than as set forth in (5) below, represents gross monthly base rent, as of December 31, 2017, multiplied by twelve. This amount reflects total cash rent before abatements. Where applicable, annualized rent has been grossed up by adding annualized expense reimbursements to base rent. |
(3) | 3601 S Congress Avenue consists of ten buildings. |
(4) | Lindblade Media Center consists of three buildings. |
(5) | 1130 Howard Street was acquired in December 2017. The annualized rent as of December 31, 2017 for 12,944 rentable square feet of the building is presented using the actual rental income under a signed lease with a different tenant who is expected to take possession in April 2018, as the space is occupied by the prior owner and annualized rent under the short-term lease is de minimis. |
(6) | 901 N Capitol Street is a 39,696 square foot parcel of land located between 899 and 999 N Capitol Street. We have designed and are entitled to develop a building having 271,233 rentable square feet. |
(7) | 2 Kaiser Plaza Parking Lot is a 44,642 square foot parcel of land currently being used as a surface parking lot. We are entitled to develop a building, which we are in the process of designing, having approximately 425,000 to 800,000 rentable square feet. |
50
Office Portfolio Detail by Property, Market, and Submarket as of December 31, 2017
Annualized | |||||||||||||||||
Rentable | Annualized | Rent Per | |||||||||||||||
Square | % | % | Rent (2) | Occupied | |||||||||||||
Location | Feet | Occupied | Leased (1) | (in thousands) | Square Foot | ||||||||||||
NORTHERN CALIFORNIA | |||||||||||||||||
Oakland, CA | |||||||||||||||||
Lake Merritt | |||||||||||||||||
1 Kaiser Plaza | 534,284 | 93.4 | % | 94.0 | % | $ | 19,592 | $ | 39.26 | ||||||||
2101 Webster Street | 471,337 | 99.3 | % | 99.3 | % | 18,136 | 38.75 | ||||||||||
1901 Harrison Street | 275,087 | 91.8 | % | 99.5 | % | 9,342 | 36.99 | ||||||||||
2100 Franklin Street | 216,828 | 98.9 | % | 98.9 | % | 8,470 | 39.50 | ||||||||||
2353 Webster Street Parking Garage | N/A | N/A | N/A | N/A | N/A | ||||||||||||
2 Kaiser Plaza Parking Lot | N/A (3) | N/A | N/A | N/A | N/A | ||||||||||||
Total Lake Merritt | 1,497,536 | 95.8 | % | 97.4 | % | 55,540 | 38.71 | ||||||||||
City Center | |||||||||||||||||
1333 Broadway | 240,887 | 96.7 | % | 96.7 | % | 8,329 | 35.76 | ||||||||||
Total Oakland, CA | 1,738,423 | 95.9 | % | 97.3 | % | 63,869 | 38.31 | ||||||||||
San Francisco, CA | |||||||||||||||||
South of Market | |||||||||||||||||
260 Townsend Street | 66,682 | 100.0 | % | 100.0 | % | 4,721 | 70.80 | ||||||||||
1130 Howard Street (4) | 21,194 | 100.0 | % | 100.0 | % | 1,439 | 67.90 | ||||||||||
Total San Francisco, CA | 87,876 | 100.0 | % | 100.0 | % | 6,160 | 70.10 | ||||||||||
TOTAL NORTHERN CALIFORNIA | 1,826,299 | 96.1 | % | 97.4 | % | $ | 70,029 | $ | 39.90 | ||||||||
SOUTHERN CALIFORNIA | |||||||||||||||||
Los Angeles, CA | |||||||||||||||||
West Los Angeles | |||||||||||||||||
11620 Wilshire Boulevard | 194,677 | 98.6 | % | 98.6 | % | $ | 7,539 | $ | 39.28 | ||||||||
11600 Wilshire Boulevard | 55,793 | 87.6 | % | 87.6 | % | 2,486 | 50.86 | ||||||||||
Lindblade Media Center (5) | 32,428 | 100.0 | % | 100.0 | % | 1,403 | 43.27 | ||||||||||
Total West Los Angeles | 282,898 | 96.6 | % | 96.6 | % | 11,428 | 41.82 | ||||||||||
Mid-Wilshire | |||||||||||||||||
4750 Wilshire Boulevard | 143,361 | 100.0 | % | 100.0 | % | 3,752 | 26.17 | ||||||||||
Total Los Angeles, CA | 426,259 | 97.7 | % | 97.7 | % | 15,180 | 36.45 | ||||||||||
TOTAL SOUTHERN CALIFORNIA | 426,259 | 97.7 | % | 97.7 | % | $ | 15,180 | $ | 36.45 | ||||||||
(Continued)
51
Office Portfolio Detail by Property, Market, and Submarket as of December 31, 2017 (Continued)
Annualized | |||||||||||||||||
Rentable | Annualized | Rent Per | |||||||||||||||
Square | % | % | Rent (2) | Occupied | |||||||||||||
Location | Feet | Occupied | Leased (1) | (in thousands) | Square Foot | ||||||||||||
EAST | |||||||||||||||||
Washington, DC | |||||||||||||||||
Capitol Hill | |||||||||||||||||
999 N Capitol Street | 323,076 | 83.2 | % | 86.1 | % | $ | 12,485 | $ | 46.45 | ||||||||
899 N Capitol Street | 314,667 | 86.1 | % | 86.1 | % | 14,086 | 51.99 | ||||||||||
830 1st Street | 247,337 | 100.0 | % | 100.0 | % | 10,783 | 43.60 | ||||||||||
901 N Capitol Street | N/A (6) | N/A | N/A | N/A | N/A | ||||||||||||
Total Capitol Hill | 885,080 | 88.9 | % | 90.0 | % | 37,354 | 47.47 | ||||||||||
Total Washington, DC | 885,080 | 88.9 | % | 90.0 | % | 37,354 | 47.47 | ||||||||||
TOTAL EAST | 885,080 | 88.9 | % | 90.0 | % | $ | 37,354 | $ | 47.47 | ||||||||
SOUTHWEST | |||||||||||||||||
Austin, TX | |||||||||||||||||
South | |||||||||||||||||
3601 S Congress Avenue (7) | 184,418 | 92.2 | % | 93.6 | % | $ | 5,721 | $ | 33.65 | ||||||||
TOTAL SOUTHWEST | 184,418 | 92.2 | % | 93.6 | % | $ | 5,721 | $ | 33.65 | ||||||||
TOTAL PORTFOLIO | 3,322,056 | 94.2 | % | 95.3 | % | $ | 128,284 | $ | 41.00 | ||||||||
(1) | Based on leases signed as of December 31, 2017. |
(2) | Other than as set forth in (4) below, represents gross monthly base rent, as of December 31, 2017, multiplied by twelve. This amount reflects total cash rent before abatements. Where applicable, annualized rent has been grossed up by adding annualized expense reimbursements to base rent. |
(3) | 2 Kaiser Plaza Parking Lot is a 44,642 square foot parcel of land currently being used as a surface parking lot. We are entitled to develop a building, which we are in the process of designing, having approximately 425,000 to 800,000 rentable square feet. |
(4) | 1130 Howard Street was acquired in December 2017. The annualized rent as of December 31, 2017 for 12,944 rentable square feet of the building is presented using the actual rental income under a signed lease with a different tenant who is expected to take possession in April 2018, as the space is occupied by the prior owner and annualized rent under the short-term lease is de minimis. |
(5) | Lindblade Media Center consists of three buildings. |
(6) | 901 N Capitol Street is a 39,696 square foot parcel of land located between 899 and 999 N Capitol Street. We have designed and are entitled to develop a building having 271,233 rentable square feet. |
(7) | 3601 S Congress Avenue consists of ten buildings. |
52
Hotel Portfolio Summary as of December 31, 2017
Revenue Per | ||||||||||||
% | Available | |||||||||||
Property | Market | Rooms | Occupied (1) | Room (2) | ||||||||
Sheraton Grand Hotel (3) | Sacramento, CA | 503 | 81.5 | % | $ | 128.43 | ||||||
Total Hotel (1 Property) | 503 | 81.5 | % | $ | 128.43 | |||||||
Other Ancillary Properties within Hotel Portfolio
Rentable | Annualized | ||||||||||||||
Square | % | % | Rent (Parking | ||||||||||||
Feet | Occupied | Leased | and Retail) (5) | ||||||||||||
Property | Market | (Retail) | (Retail) | (Retail) (4) | (in thousands) | ||||||||||
Sheraton Grand Hotel Parking Garage and Retail | Sacramento, CA | 9,453 | 88.3 | % | 88.3 | % | $ | 2,908 | |||||||
Total Ancillary Hotel (1 Property) | 9,453 | 88.3 | % | 88.3 | % | $ | 2,908 | ||||||||
(1) | Represents trailing 12-month occupancy as of December 31, 2017, calculated as the number of occupied rooms divided by the number of available rooms. |
(2) | Represents trailing 12-month RevPAR as of December 31, 2017, calculated as room revenue divided by the number of available rooms. |
(3) | The Sheraton Grand Hotel is part of the Sheraton franchise and is managed by Starwood Hotels and Resorts Worldwide, Inc. |
(4) | Based on leases commenced as of December 31, 2017. |
(5) | Represents gross monthly contractual rent under parking and retail leases commenced as of December 31, 2017, multiplied by twelve. This amount reflects total cash rent before abatements. Where applicable, annualized rent has been grossed up by adding annualized expense reimbursements to base rent. |
53
Office Portfolio—Top 10 Tenants by Annualized Rental Revenue as of December 31, 2017
Credit | |||||||||||||||||||
Rating | % of | ||||||||||||||||||
(S&P / | Annualized | % of | Rentable | Rentable | |||||||||||||||
Moody's / | Lease | Rent (1) (2) | Annualized | Square | Square | ||||||||||||||
Tenant | Property | Fitch) | Expiration | (in thousands) | Rent | Feet | Feet | ||||||||||||
U.S. Federal Government Agencies (3) | Various | AA+ / Aaa / AAA | 2019 - 2026 | $ | 24,393 | 19.0 | % | 558,965 | 16.8 | % | |||||||||
Kaiser Foundation Health Plan, Inc. | 1 Kaiser Plaza / 2101 Webster | AA- / - / - | 2018 - 2027 | 18,077 | 14.1 | % | 468,857 | 14.1 | % | ||||||||||
The District of Columbia | 899 N Capitol Street | AA / Aa1 / AA | 2021 | 11,165 | 8.7 | % | 205,860 | 6.2 | % | ||||||||||
Pandora Media, Inc. | 2100 Franklin Street / 2101 Webster / Penn Field | - / - / - | 2018 - 2020 | 7,153 | 5.6 | % | 187,004 | 5.6 | % | ||||||||||
Wells Fargo Bank, N.A. | 1901 Harrison Street | AA- / Aa1 / - | 2018 - 2023 | 4,554 | 3.5 | % | 131,134 | 3.9 | % | ||||||||||
Farmers Group, Inc. | 4750 Wilshire Boulevard | A / A2 / - | 2019 | 3,752 | 2.9 | % | 143,361 | 4.3 | % | ||||||||||
Neighborhood Reinvestment Corporation | 999 N Capitol Street | - / - / - | 2023 | 3,363 | 2.6 | % | 67,611 | 2.0 | % | ||||||||||
Save the Children Federation, Inc. | 899 N Capitol Street | - / - / - | 2029 | 2,641 | 2.1 | % | 58,768 | 1.8 | % | ||||||||||
Swinerton, Inc. | 260 Townsend | - / - / - | 2018 - 2026 | 2,560 | 2.0 | % | 37,451 | 1.1 | % | ||||||||||
AECOM Global II, LLC (4) | 1333 Broadway | BB / Ba2 / - | 2018 | 2,430 | 1.9 | % | 73,061 | 2.2 | % | ||||||||||
Total for Top Ten Tenants | 80,088 | 62.4 | % | 1,932,072 | 58.0 | % | |||||||||||||
All Other Tenants | 48,196 | 37.6 | % | 1,196,621 | 36.2 | % | |||||||||||||
Vacant | — | — | % | 193,363 | 5.8 | % | |||||||||||||
Total for Portfolio | $ | 128,284 | 100.0 | % | 3,322,056 | 100.0 | % | ||||||||||||
(1) | Other than as set forth in (2) below, represents gross monthly base rent, as of December 31, 2017, multiplied by twelve. This amount reflects total cash rent before abatements. Where applicable, annualized rent has been grossed up by adding annualized expense reimbursements to base rent. |
(2) | 1130 Howard Street was acquired in December 2017. The annualized rent as of December 31, 2017 for 12,944 rentable square feet of the building is presented using the actual rental income under a signed lease with a different tenant who is expected to take possession in April 2018, as the space is occupied by the prior owner and annualized rent under the short-term lease is de minimis. |
(3) | Represents seven different leases at various properties. |
(4) | This tenant terminated its lease effective January 1, 2018, and CIM Commercial recognized a lease termination fee of $4,798,000 during the year ended December 31, 2017. CIM Commercial entered into a ten-year lease agreement with a different tenant for 81,977 rentable square feet, which was delivered to the tenant on January 1, 2018. Additionally, the new tenant has signed an expansion agreement for additional 16,816 rentable square feet, which is expected to be delivered to the tenant in June 2018. The annualized rent per occupied square foot from the prior tenant to the new tenant has increased from $33.26 to $45.00. |
54
Office Portfolio—Diversification by NAICS code as of December 31, 2017
Annualized | % of | Rentable | |||||||||||
Rent (1)(2) | Annualized | Square | % of Rentable | ||||||||||
NAICS Code (2) | (in thousands) | Rent | Feet | Square Feet | |||||||||
Public Administration | $ | 40,103 | 31.2 | % | 858,491 | 25.9 | % | ||||||
Health Care and Social Assistance | 23,646 | 18.4 | % | 588,773 | 17.7 | % | |||||||
Professional, Scientific, and Technical Services | 19,147 | 14.9 | % | 480,992 | 14.5 | % | |||||||
Finance and Insurance | 11,690 | 9.1 | % | 367,025 | 11.0 | % | |||||||
Information | 11,614 | 9.0 | % | 281,896 | 8.5 | % | |||||||
Other Services (except Public Administration) | 6,012 | 4.7 | % | 140,919 | 4.2 | % | |||||||
Manufacturing | 3,147 | 2.5 | % | 81,379 | 2.4 | % | |||||||
Real Estate and Rental and Leasing | 3,034 | 2.4 | % | 88,012 | 2.6 | % | |||||||
Construction | 2,781 | 2.2 | % | 43,110 | 1.3 | % | |||||||
Educational Services | 2,521 | 2.0 | % | 68,516 | 2.1 | % | |||||||
Accommodation and Food Services | 1,991 | 1.6 | % | 52,030 | 1.6 | % | |||||||
Retail Trade | 1,042 | 0.8 | % | 38,458 | 1.2 | % | |||||||
Arts, Entertainment, and Recreation | 787 | 0.6 | % | 19,835 | 0.6 | % | |||||||
Management of Companies and Enterprises | 352 | 0.3 | % | 9,651 | 0.3 | % | |||||||
Administrative and Support and Waste Management and Remediation Services | 262 | 0.2 | % | 5,453 | 0.2 | % | |||||||
Wholesale Trade | 155 | 0.1 | % | 4,153 | 0.1 | % | |||||||
Vacant | — | — | % | 193,363 | 5.8 | % | |||||||
TOTAL PORTFOLIO | $ | 128,284 | 100.0 | % | 3,322,056 | 100.0 | % | ||||||
(1) | Other than as set forth in (2) below, represents gross monthly base rent, as of December 31, 2017, multiplied by twelve. This amount reflects total cash rent before abatements. Where applicable, annualized rent has been grossed up by adding annualized expense reimbursements to base rent. |
(2) | 1130 Howard Street was acquired in December 2017. The NAICS code and annualized rent as of December 31, 2017 for 12,944 rentable square feet of the building are presented using the actual NAICS code and rental income under a signed lease with a different tenant who is expected to take possession in April 2018, as the space is occupied by the prior owner and annualized rent under the short-term lease is de minimis. |
55
Office Portfolio—Lease Expiration as of December 31, 2017
Square Feet | % of Square | Annualized | % of Annualized | Annualized Rent | |||||||||||||
Year of Lease | of Expiring | Feet | Rent (1) | Rent | Per Occupied | ||||||||||||
Expiration | Leases | Expiring | (in thousands) | Expiring | Square Foot | ||||||||||||
2018 (2)(3) | 285,723 | 9.1 | % | $ | 10,016 | 7.8 | % | $ | 35.05 | ||||||||
2019 | 413,511 | 13.2 | % | 14,469 | 11.3 | % | $ | 34.99 | |||||||||
2020 | 426,182 | 13.6 | % | 16,372 | 12.8 | % | $ | 38.42 | |||||||||
2021 | 566,872 | 18.1 | % | 26,477 | 20.6 | % | $ | 46.71 | |||||||||
2022 | 214,968 | 6.9 | % | 8,265 | 6.4 | % | $ | 38.45 | |||||||||
2023 | 265,089 | 8.5 | % | 10,859 | 8.5 | % | $ | 40.96 | |||||||||
2024 | 39,237 | 1.3 | % | 2,140 | 1.7 | % | $ | 54.54 | |||||||||
2025 | 418,793 | 13.4 | % | 17,168 | 13.4 | % | $ | 40.99 | |||||||||
2026 | 323,457 | 10.3 | % | 15,004 | 11.7 | % | $ | 46.39 | |||||||||
2027 | 88,440 | 2.8 | % | 3,702 | 2.9 | % | $ | 41.86 | |||||||||
Thereafter | 86,421 | 2.8 | % | 3,812 | 2.9 | % | $ | 44.11 | |||||||||
Total Occupied | 3,128,693 | 100.0 | % | $ | 128,284 | 100.0 | % | $ | 41.00 | ||||||||
Vacant | 193,363 | ||||||||||||||||
Total Portfolio | 3,322,056 | ||||||||||||||||
(1) | Other than as set forth in (3) below, represents gross monthly base rent, as of December 31, 2017, multiplied by twelve. This amount reflects total cash rent before abatements. Where applicable, annualized rent has been grossed up by adding annualized expense reimbursements to base rent. |
(2) | Includes 24,855 square feet of month-to-month leases. |
(3) | 1130 Howard Street was acquired in December 2017. The year of expiration and annualized rent as of December 31, 2017 for 12,944 rentable square feet of the building are presented using the actual year of expiration and rental income under a signed lease with a different tenant who is expected to take possession in April 2018, as the space is occupied by the prior owner and annualized rent under the short-term lease is de minimis. |
56
Office Portfolio—Historical Occupancy
December 31, | ||||||||||||||||||
2017 | ||||||||||||||||||
Rentable | Occupancy Rates (1) | |||||||||||||||||
Property | Square Feet | 2013 | 2014 | 2015 | 2016 | 2017 | ||||||||||||
1 Kaiser Plaza | 534,284 | 90.8 | % | 91.0 | % | 96.7 | % | 96.4 | % | 93.4 | % | |||||||
2101 Webster Street | 471,337 | 82.8 | % | 81.9 | % | 98.9 | % | 98.9 | % | 99.3 | % | |||||||
999 N Capitol Street | 323,076 | 83.1 | % | 84.0 | % | 84.0 | % | 84.0 | % | 83.2 | % | |||||||
899 N Capitol Street | 314,667 | 51.1 | % | 52.2 | % | 73.7 | % | 74.1 | % | 86.1 | % | |||||||
1901 Harrison Street | 275,087 | 87.0 | % | 99.4 | % | 98.2 | % | 97.5 | % | 91.8 | % | |||||||
830 1st Street | 247,337 | 100.0 | % | 100.0 | % | 100.0 | % | 100.0 | % | 100.0 | % | |||||||
1333 Broadway | 240,887 | 72.1 | % | 82.6 | % | 92.9 | % | 92.9 | % | 96.7 | % | |||||||
2100 Franklin Street | 216,828 | 73.1 | % | 83.5 | % | 96.7 | % | 98.5 | % | 98.9 | % | |||||||
11620 Wilshire Boulevard | 194,677 | 65.5 | % | 84.5 | % | 91.5 | % | 93.0 | % | 98.6 | % | |||||||
3601 S Congress Avenue (2) | 184,418 | 90.7 | % | 91.1 | % | 97.4 | % | 94.0 | % | 92.2 | % | |||||||
4750 Wilshire Boulevard (3) | 143,361 | N/A | 100.0 | % | 100.0 | % | 100.0 | % | 100.0 | % | ||||||||
260 Townsend Street | 66,682 | 100.0 | % | 89.5 | % | 89.7 | % | 78.8 | % | 100.0 | % | |||||||
11600 Wilshire Boulevard | 55,793 | 74.7 | % | 78.5 | % | 84.7 | % | 80.0 | % | 87.6 | % | |||||||
Lindblade Media Center (4) | 32,428 | N/A | 100.0 | % | 100.0 | % | 100.0 | % | 100.0 | % | ||||||||
1130 Howard Street | 21,194 | N/A | N/A | N/A | N/A | 100.0 | % | |||||||||||
901 N Capitol Street | N/A (5) | N/A | N/A | N/A | N/A | N/A | ||||||||||||
2353 Webster Street Parking Garage | N/A | N/A | N/A | N/A | N/A | N/A | ||||||||||||
2 Kaiser Plaza Parking Lot | N/A (6) | N/A | N/A | N/A | N/A | N/A | ||||||||||||
500 West Santa Ana Boulevard (7) | N/A | 100.0 | % | 100.0 | % | N/A | N/A | N/A | ||||||||||
211 Main Street (7) | N/A | 100.0 | % | 100.0 | % | 100.0 | % | 100.0 | % | N/A | ||||||||
200 S College Street (7) | N/A | 82.7 | % | 68.3 | % | 66.9 | % | 90.1 | % | N/A | ||||||||
980 9th Street (7) | N/A | 80.5 | % | 83.4 | % | 64.0 | % | 66.6 | % | N/A | ||||||||
1010 8th Street Parking Garage & Retail (7) | N/A | 16.3 | % | 9.9 | % | 9.6 | % | 10.7 | % | N/A | ||||||||
800 N Capitol Street (7) | N/A | 94.8 | % | 93.2 | % | 76.1 | % | 76.1 | % | N/A | ||||||||
7083 Hollywood Boulevard (7) | N/A | 96.3 | % | 96.3 | % | 97.3 | % | 97.3 | % | N/A | ||||||||
370 L'Enfant Promenade (7) | N/A | 88.7 | % | 89.0 | % | 87.7 | % | 39.1 | % | N/A | ||||||||
Total Weighted Average | 3,322,056 | 84.0 | % | 85.1 | % | 86.9 | % | 85.7 | % | 94.2 | % | |||||||
(1) | Historical occupancies for office properties are shown as a percentage of rentable square feet and are based on leases commenced as of December 31st of each historical year. |
(2) | 3601 S Congress Avenue consists of ten buildings. |
(3) | 4750 Wilshire Boulevard was acquired on April 18, 2014. |
(4) | Lindblade Media Center was acquired on October 21, 2014, and consists of three buildings. |
(5) | 901 N Capitol Street is a 39,696 square foot parcel of land located between 899 and 999 N Capitol Street. We have designed and are entitled to develop a building having 271,233 rentable square feet. |
(6) | 2 Kaiser Plaza Parking Lot is a 44,642 square foot parcel of land currently being used as a surface parking lot. We are entitled to develop a building, which we are in the process of designing, having approximately 425,000 to 800,000 rentable square feet. |
(7) | 500 West Santa Ana Boulevard, 211 Main Street, 200 S College Street, 980 9th Street, 1010 8th Street Parking Garage & Retail, 800 N Capitol Street, 7083 Hollywood Boulevard, and 370 L'Enfant Promenade were sold on November 19, 2015, March 28, 2017, June 8, 2017, June 20, 2017, June 20, 2017, August 31, 2017, September 21, 2017, and October 17, 2017, respectively. |
57
Office Portfolio—Historical Annualized Rents
December 31, | |||||||||||||||||||||||
2017 | |||||||||||||||||||||||
Rentable | Annualized Rent Per Occupied Square Foot (1) | ||||||||||||||||||||||
Property | Square Feet | 2013 | 2014 | 2015 | 2016 | 2017 | |||||||||||||||||
1 Kaiser Plaza | 534,284 | $ | 37.14 | $ | 36.50 | $ | 34.24 | $ | 37.13 | $ | 39.26 | ||||||||||||
2101 Webster Street | 471,337 | 38.10 | 38.84 | 36.76 | 37.64 | 38.75 | |||||||||||||||||
999 N Capitol Street | 323,076 | 42.26 | 44.18 | 44.82 | 45.19 | 46.45 | |||||||||||||||||
899 N Capitol Street | 314,667 | 50.22 | 52.36 | 50.44 | 49.49 | 51.99 | |||||||||||||||||
1901 Harrison Street | 275,087 | 33.20 | 33.74 | 34.02 | 35.49 | 36.99 | |||||||||||||||||
830 1st Street | 247,337 | 40.73 | 42.42 | 42.53 | 43.90 | 43.60 | |||||||||||||||||
1333 Broadway | 240,887 | 28.89 | 30.17 | 31.07 | 33.12 | 35.76 | |||||||||||||||||
2100 Franklin Street | 216,828 | 40.96 | 37.20 | 37.65 | 38.44 | 39.50 | |||||||||||||||||
11620 Wilshire Boulevard | 194,677 | 35.64 | 30.50 | 35.07 | 38.55 | 39.28 | |||||||||||||||||
3601 S Congress Avenue (2) | 184,418 | 25.29 | 27.28 | 30.21 | 31.84 | 33.65 | |||||||||||||||||
4750 Wilshire Boulevard (3) | 143,361 | N/A | 25.45 | 25.03 | 25.71 | 26.17 | |||||||||||||||||
260 Townsend Street | 66,682 | 32.48 | 58.02 | 64.92 | 68.97 | 70.80 | |||||||||||||||||
11600 Wilshire Boulevard | 55,793 | 43.97 | 45.89 | 49.23 | 50.62 | 50.86 | |||||||||||||||||
Lindblade Media Center (4) | 32,428 | N/A | 31.51 | 39.88 | 41.60 | 43.27 | |||||||||||||||||
1130 Howard Street (5) | 21,194 | N/A | N/A | N/A | N/A | 67.90 | |||||||||||||||||
901 N Capitol Street | N/A (6) | N/A | N/A | N/A | N/A | N/A | |||||||||||||||||
2353 Webster Street Parking Garage | N/A | N/A | N/A | N/A | N/A | N/A | |||||||||||||||||
2 Kaiser Plaza Parking Lot | N/A (7) | N/A | N/A | N/A | N/A | N/A | |||||||||||||||||
500 West Santa Ana Boulevard (8) | N/A | 20.17 | 20.40 | N/A | N/A | N/A | |||||||||||||||||
211 Main Street (8) | N/A | 28.78 | 28.69 | 28.81 | 28.80 | N/A | |||||||||||||||||
200 S College Street (8) | N/A | 22.20 | 22.61 | 23.33 | 23.60 | N/A | |||||||||||||||||
980 9th Street (8) | N/A | 31.36 | 30.47 | 29.69 | 30.23 | N/A | |||||||||||||||||
1010 8th Street Parking Garage & Retail (8) | N/A | 7.16 | 6.81 | 6.63 | 7.07 | N/A | |||||||||||||||||
800 N Capitol Street (8) | N/A | 46.01 | 45.19 | 45.36 | 45.02 | N/A | |||||||||||||||||
7083 Hollywood Boulevard (8) | N/A | 35.37 | 35.61 | 38.35 | 38.45 | N/A | |||||||||||||||||
370 L'Enfant Promenade (8) | N/A | 51.41 | 51.25 | 51.94 | 55.80 | N/A | |||||||||||||||||
Total Weighted Average | 3,322,056 | $ | 36.10 | $ | 36.25 | $ | 36.75 | $ | 36.79 | $ | 41.00 | ||||||||||||
(1) | Other than as set forth in (5) below, Annualized Rent Per Occupied Square Foot represents annualized gross rent divided by total occupied square feet as of December 31 of each historical year. This amount reflects total cash rent before abatements. Where applicable, annualized rent has been grossed up by adding annualized expense reimbursements to base rent. |
(2) | 3601 S Congress Avenue consists of ten buildings. |
(3) | 4750 Wilshire Boulevard was acquired on April 18, 2014. |
(4) | Lindblade Media Center was acquired on October 21, 2014, and consists of three buildings. |
(5) | 1130 Howard Street was acquired in December 2017. The annualized rent as of December 31, 2017 for 12,944 rentable square feet of the building is presented using the actual rental income under a signed lease with a different tenant who is expected to take possession in April 2018, as the space is occupied by the prior owner and annualized rent under the short-term lease is de minimis. |
(6) | 901 N Capitol Street is a 39,696 square foot parcel of land located between 899 and 999 N Capitol Street. We have designed and are entitled to develop a building having 271,233 rentable square feet. |
58
(7) | 2 Kaiser Plaza Parking Lot is a 44,642 square foot parcel of land currently being used as a surface parking lot. We are entitled to develop a building, which we are in the process of designing, having approximately 425,000 to 800,000 rentable square feet. |
(8) | 500 West Santa Ana Boulevard, 211 Main Street, 200 S College Street, 980 9th Street, 1010 8th Street Parking Garage & Retail, 800 N Capitol Street, 7083 Hollywood Boulevard, and 370 L'Enfant Promenade were sold on November 19, 2015, March 28, 2017, June 8, 2017, June 20, 2017, June 20, 2017, August 31, 2017, September 21, 2017, and October 17, 2017, respectively. |
Multifamily Portfolio—Historical Occupancy
Occupancy Rates (2) | |||||||||||||||||
Property (1) | Units | 2013 | 2014 | 2015 | 2016 | 2017 | |||||||||||
4649 Cole Avenue (3) | 334 | 93.1 | % | 88.9 | % | 93.1 | % | 94.3 | % | N/A | |||||||
4200 Scotland Street | 308 | 91.9 | % | 92.2 | % | 91.2 | % | 93.2 | % | N/A | |||||||
47 E 34th Street | 110 | 100.0 | % | 100.0 | % | 89.1 | % | 85.5 | % | N/A | |||||||
3636 McKinney Avenue | 103 | 97.1 | % | 98.1 | % | 94.2 | % | 92.2 | % | N/A | |||||||
3839 McKinney Avenue (4) | 75 | 94.7 | % | 94.7 | % | 96.0 | % | 86.7 | % | N/A | |||||||
Total Weighted Average | 930 | 94.1 | % | 92.8 | % | 92.4 | % | 92.0 | % | N/A | |||||||
(1) | 3636 McKinney Avenue, 3839 McKinney Avenue, 4649 Cole Avenue, 47 E 34th Street, and 4200 Scotland Street were sold on May 30, 2017, May 30, 2017, June 23, 2017, September 26, 2017, and December 15, 2017, respectively. |
(2) | Historical occupancies for multifamily properties are based on leases commenced as of December 31st of each historical year and were calculated using units and not square feet. |
(3) | 4649 Cole Avenue consisted of fifteen buildings. |
(4) | 3839 McKinney Avenue consisted of two buildings. |
Multifamily Portfolio—Historical Annualized Rents
Monthly Rent Per Occupied Unit (2) | |||||||||||||||||||||
Property (1) | Units | 2013 | 2014 | 2015 | 2016 | 2017 | |||||||||||||||
4649 Cole Avenue (3) | 334 | $ | 1,282 | $ | 1,366 | $ | 1,404 | $ | 1,439 | N/A | |||||||||||
4200 Scotland Street | 308 | 1,775 | 1,797 | 1,768 | 1,661 | N/A | |||||||||||||||
47 E 34th Street | 110 | 3,880 | 4,188 | 4,642 | 4,947 | N/A | |||||||||||||||
3636 McKinney Avenue | 103 | 1,529 | 1,647 | 1,696 | 1,735 | N/A | |||||||||||||||
3839 McKinney Avenue (4) | 75 | 1,526 | 1,590 | 1,597 | 1,661 | N/A | |||||||||||||||
Total Weighted Average | 930 | $ | 1,816 | $ | 1,919 | $ | 1,942 | $ | 1,948 | N/A | |||||||||||
(1) | 3636 McKinney Avenue, 3839 McKinney Avenue, 4649 Cole Avenue, 47 E 34th Street, and 4200 Scotland Street were sold on May 30, 2017, May 30, 2017, June 23, 2017, September 26, 2017, and December 15, 2017, respectively. |
(2) | Represents gross monthly base rent under leases commenced divided by occupied units as of December 31st of each historical year. This amount reflects total cash rent before concessions. |
(3) | 4649 Cole Avenue consisted of fifteen buildings. |
(4) | 3839 McKinney Avenue consisted of two buildings. |
59
Hotel Portfolio—Historical Occupancy Rates as of December 31, 2017
Occupancy (%) (1) | ||||||||||||||||||||
Hotel Location | Franchise | Rooms | 2013 | 2014 | 2015 | 2016 | 2017 | |||||||||||||
Sacramento, CA | Sheraton | 503 | 75.5 | % | 75.3 | % | 77.5 | % | 78.1 | % | 81.5 | % | ||||||||
Los Angeles, CA (2) (3) | Holiday Inn | 405 | 69.0 | % | 89.2 | % | 87.9 | % | 81.1 | % | N/A | |||||||||
Oakland, CA (4) | Courtyard | 162 | 79.0 | % | 80.2 | % | 81.9 | % | 74.3 | % | N/A | |||||||||
Weighted Average | 1,070 | 75.4 | % | 81.3 | % | 82.1 | % | 78.9 | % | 81.5 | % | |||||||||
(1) | Historical occupancies for hotel properties are shown as a percentage of rentable rooms and represent the trailing 12-months occupancy as of December 31st of each historical year. For sold properties, occupancy is presented for our period of ownership only. |
(2) | CIM Urban was the lender to the LAX Holiday Inn and held the first mortgage secured by the property until a subsidiary of CIM Urban submitted the highest bid at a foreclosure auction that took place on October 8, 2013 and subsequently took possession of the LAX Holiday Inn. The 2013 occupancy presented above is for a partial year and represents the occupancy for our period of ownership only. |
(3) | This property was sold in July 2016. |
(4) | This property was sold in February 2016. |
Hotel Portfolio—Historical Average Daily Rates as of December 31, 2017
Average Daily Rate (Price) Per Room/Suite ($) (1) | |||||||||||||||||||||||||
Hotel Location | Franchise | Rooms | 2013 | 2014 | 2015 | 2016 | 2017 | ||||||||||||||||||
Sacramento, CA | Sheraton | 503 | $ | 129.48 | $ | 140.75 | $ | 148.24 | $ | 152.89 | $ | 157.64 | |||||||||||||
Los Angeles, CA (2) (3) | Holiday Inn | 405 | 82.25 | 93.08 | 100.46 | 123.24 | N/A | ||||||||||||||||||
Oakland, CA (4) | Courtyard | 162 | 131.83 | 151.27 | 173.05 | 169.58 | N/A | ||||||||||||||||||
Weighted Average | 1,070 | $ | 124.70 | $ | 122.52 | $ | 132.61 | $ | 144.06 | $ | 157.64 | ||||||||||||||
(1) | Represents trailing 12-months average daily rate as of December 31st of each historical year, calculated by dividing the amount of room revenue by the number of occupied rooms. For sold properties, the average daily rate is presented for our period of ownership only. |
(2) | CIM Urban was the lender to the LAX Holiday Inn and held the first mortgage secured by the property until a subsidiary of CIM Urban submitted the highest bid at a foreclosure auction that took place on October 8, 2013 and subsequently took possession of the LAX Holiday Inn. The 2013 average daily rate presented above is for a partial year and represents the rate for our period of ownership only. |
(3) | This property was sold in July 2016. |
(4) | This property was sold in February 2016. |
60
Hotel Portfolio—Historical Revenue per Available Room/Suite as of December 31, 2017
Revenue Per Available Room/Suite ($) (1) | |||||||||||||||||||||||||
Hotel Location | Franchise | Rooms | 2013 | 2014 | 2015 | 2016 | 2017 | ||||||||||||||||||
Sacramento, CA | Sheraton | 503 | $ | 97.74 | $ | 105.95 | $ | 114.83 | $ | 119.44 | $ | 128.43 | |||||||||||||
Los Angeles, CA (2) (3) | Holiday Inn | 405 | 56.74 | 83.06 | 88.35 | 99.98 | N/A | ||||||||||||||||||
Oakland, CA (4) | Courtyard | 162 | 104.13 | 121.31 | 141.72 | 126.00 | N/A | ||||||||||||||||||
Weighted Average | 1,070 | $ | 94.06 | $ | 99.61 | $ | 108.88 | $ | 113.73 | $ | 128.43 | ||||||||||||||
(1) | Represents trailing 12-month RevPAR as of December 31st of each historical year, calculated by dividing the amount of room revenue by the number of available rooms. For sold properties, RevPAR is presented for our period of ownership only. |
(2) | CIM Urban was the lender to the LAX Holiday Inn and held the first mortgage secured by the property until a subsidiary of CIM Urban submitted the highest bid at a foreclosure auction that took place on October 8, 2013 and subsequently took possession of the LAX Holiday Inn. The 2013 revenue per available room presented above is for a partial year and represents the value for our period of ownership only. |
(3) | This property was sold in July 2016. |
(4) | This property was sold in February 2016. |
Property Indebtedness as of December 31, 2017
Outstanding | Balance Due | |||||||||||||
Principal | At Maturity | |||||||||||||
Balance | Interest | Maturity | Date | Prepayment/ | ||||||||||
Property | (in thousands) | Rate | Date | (in thousands) | Defeasance | |||||||||
1 Kaiser Plaza | $ | 97,100 | 4.14% | 7/1/2026 | $ | 97,100 | (1) | |||||||
2101 Webster Street | 83,000 | 4.14% | 7/1/2026 | 83,000 | (1) | |||||||||
2100 Franklin Street | 80,000 | 4.14% | 7/1/2026 | 80,000 | (1) | |||||||||
1901 Harrison Street | 42,500 | 4.14% | 7/1/2026 | 42,500 | (1) | |||||||||
1333 Broadway | 39,500 | 4.14% | 7/1/2026 | 39,500 | (1) | |||||||||
260 Townsend Street | 28,200 | 4.14% | 7/1/2026 | 28,200 | (1) | |||||||||
830 1st Street | 46,000 | 4.50% | 1/5/2027 | 42,008 | (2) | |||||||||
Total/Weighted Average | $ | 416,300 | 4.18% | $ | 412,308 | |||||||||
(1) | Loan is generally not prepayable prior to April 1, 2026. |
(2) | Loan is prepayable but is subject to a prepayment fee equal to the greater of (a) one percent (1%) of the principal amount being prepaid multiplied by the quotient of the number of months until maturity divided by the term of the note or (b) the present value of the loan less the principal and accrued interest being prepaid. |
Item 3. Legal Proceedings
We are not currently involved in any material pending or threatened legal proceeding nor, to our knowledge, is any material legal proceeding currently threatened against us, other than routine litigation arising in the ordinary course of business. In the normal course of business we are periodically party to certain legal actions and proceedings involving matters that are generally incidental to our business. While the outcome of these legal actions and proceedings cannot be predicted with certainty, in management's opinion, the resolution of these legal proceedings and actions will not have a material adverse effect on our consolidated financial position, results of operations or cash flow.
61
Item 4. Mine Safety Disclosures
Not applicable.
62
PART II
Item 5. Market For Registrant's Common Equity, Related Stockholder Matters and Issuer Purchases of Equity Securities
Marketplace Designation, Sales Price Information and Holders
Shares of our common stock trade on Nasdaq and the TASE in each case under the ticker symbol "CMCT." The following table sets forth the high and low sales prices by quarter for our Common Stock as reported on Nasdaq, as well as the regular and special dividends per share declared during 2017 and 2016.
Regular | ||||||||||||||||
Quarterly | Special | |||||||||||||||
Dividends | Dividends | |||||||||||||||
Quarter Ended | High | Low | Per Share | Per Share (1) | ||||||||||||
December 31, 2017 | $ | 20.40 | $ | 16.00 | $ | 0.12500 | $ | 0.73000 | ||||||||
September 30, 2017 | $ | 20.45 | $ | 15.20 | $ | 0.12500 | $ | — | ||||||||
June 30, 2017 | $ | 20.40 | $ | 15.10 | $ | 0.12500 | $ | 2.26000 | ||||||||
March 31, 2017 | $ | 16.65 | $ | 15.20 | $ | 0.21875 | $ | — | ||||||||
December 31, 2016 | $ | 16.15 | $ | 15.14 | $ | 0.21875 | $ | — | ||||||||
September 30, 2016 | $ | 16.97 | $ | 14.54 | $ | 0.21875 | $ | — | ||||||||
June 30, 2016 | $ | 20.27 | $ | 16.01 | $ | 0.21875 | $ | — | ||||||||
March 31, 2016 | $ | 18.99 | $ | 15.14 | $ | 0.21875 | $ | — | ||||||||
(1) | Urban II waived its right to receive these special dividends as to its shares of our Common Stock owned as of the applicable record dates. |
On March 2, 2018, there were approximately 497 holders of record of our Common Stock, excluding stockholders whose shares were held by brokerage firms, depositories and other institutional firms in "street name" for their customers. The last reported sales price of our Common Stock on March 2, 2018 was $15.50 as reported on Nasdaq.
3.6% of shares of our Common Stock as of March 2, 2018 were held by non-affiliated stockholders.
Holders of our Common Stock are entitled to receive dividends, if, as and when authorized by the Board of Directors and declared by us. In determining our dividend policy, the Board of Directors considers many factors including the amount of cash resources available for dividend distributions, capital spending plans, cash flow, financial position, applicable requirements of the MGCL, any applicable contractual restrictions, and future growth in NAV and cash flow per share prospects. Consequently, the dividend rate on a quarterly basis does not necessarily correlate directly to any individual factor. There can be no assurance that the future dividends declared by our Board of Directors will not differ materially from historical dividend levels. Risks inherent in our ability to pay dividends are further described in "Item 1A—Risk Factors" of this Annual Report on Form 10-K.
63
Securities Authorized for Issuance Under Equity Compensation Plans
The following table provides information at December 31, 2017 with respect to shares of our Common Stock, either under options or in respect of restricted stock awards that may be issued under existing equity compensation plans, all of which have been approved by our stockholders.
Number of shares of | ||||||||
Common Stock remaining | ||||||||
Number of shares of | available for future | |||||||
Common Stock to be | issuances under equity | |||||||
issued upon exercise | Weighted average | compensation plans | ||||||
of outstanding | exercise price of | (all in restricted shares | ||||||
Plan Category | options | outstanding options | of Common Stock) | |||||
Equity incentive plan | — | N/A | 297,816 | |||||
Performance Graph
The information below is not deemed to be "soliciting material" or to be "filed" with the SEC or subject to Regulation 14A or 14C under the Securities Exchange Act of 1934 ("Exchange Act") or to the liabilities of Section 18 of the Exchange Act, and will not be deemed to be incorporated by reference into any filing under the Securities Act or the Exchange Act, except to the extent the Company specifically incorporates it by reference into such a filing.
The line graph below compares the percentage change in the cumulative total stockholder return on our Common Stock with the cumulative total return of the S&P 500 and the FTSE NAREIT Equity REIT Index. The FTSE NAREIT Equity REIT Index is a free-float adjusted, market capitalization-weighted index of U.S. Equity REITs. The Index includes all tax-qualified REITs with more than 50 percent of total assets in qualifying real estate assets other than mortgages secured by real property. In 2014, we transitioned from a mortgage REIT to an equity REIT as a result of the Merger. Therefore, for years prior to 2014, the stock price shown below for CMCT is that of our predecessor, PMC Commercial Trust (ticker symbol "PCC"). All returns assume an investment of $100 on December 31, 2012 and the reinvestment of dividends. The stock price performance shown on the graph is not necessarily indicative of future price performance.
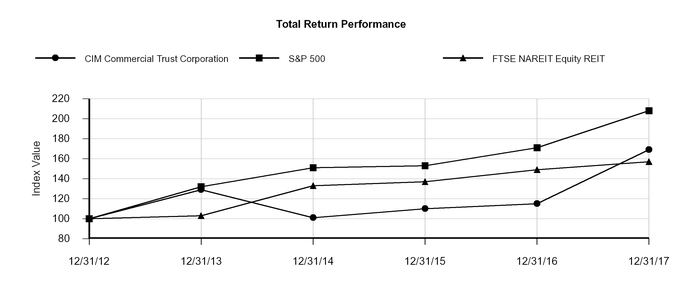
Period Ending December 31, | ||||||||||||||||||
Index | 2012 | 2013 | 2014 | 2015 | 2016 | 2017 | ||||||||||||
CIM Commercial Trust Corporation | 100.00 | 128.55 | 101.38 | 110.16 | 115.41 | 169.43 | ||||||||||||
S&P 500 | 100.00 | 132.39 | 150.51 | 152.59 | 170.84 | 208.14 | ||||||||||||
FTSE NAREIT Equity REIT | 100.00 | 102.59 | 132.97 | 137.04 | 148.97 | 156.61 | ||||||||||||
Source: SNL Financial LC
64
Recent Sales of Unregistered Securities and Use of Proceeds
None.
Repurchases of Equity Securities
On December 18, 2017, we repurchased, in a privately negotiated transaction, canceled and retired 14,090,909 shares of Common Stock from Urban II.
The following table summarizes the purchases of our Common Stock during the three months ended December 31, 2017:
Period | Total Number of Shares Purchased | Average Price Paid Per Share | Total Number of Shares Purchased as Part of Publicly Announced Plans or Programs | Maximum Dollar Value of Shares That May Yet Be Purchased Under the Plans or Programs | ||||||||||
October 1, 2017 to October 31, 2017 | — | $ | — | — | $ | — | ||||||||
November 1, 2017 to November 30, 2017 | — | — | — | — | ||||||||||
December 1, 2017 to December 31, 2017 | 14,090,909 | 22.00 | — | — | ||||||||||
Total | 14,090,909 | $ | 22.00 | — | ||||||||||
65
Item 6. Selected Financial Data
The following is a summary of our selected financial data as of and for each of the five years in the period ended December 31, 2017. The following data should be read in conjunction with our consolidated financial statements and the notes thereto and "Item 7—Management's Discussion and Analysis of Financial Condition and Results of Operations" appearing elsewhere in this Annual Report on Form 10-K. The selected financial data presented below has been derived from our audited consolidated financial statements.
Year Ended December 31, | |||||||||||||||||||
2017 | 2016 | 2015 | 2014 | 2013 | |||||||||||||||
(in thousands, except per share data) | |||||||||||||||||||
Total revenues | $ | 236,376 | $ | 265,931 | $ | 276,948 | $ | 262,827 | $ | 235,813 | |||||||||
Total expenses | 256,979 | 273,239 | 273,122 | 253,998 | 221,134 | ||||||||||||||
Bargain purchase gain | — | — | — | 4,918 | — | ||||||||||||||
Gain on sale of real estate | 401,737 | 39,666 | 3,092 | — | — | ||||||||||||||
Income from continuing operations before provision for income taxes | 381,134 | 32,358 | 6,918 | 13,747 | 14,679 | ||||||||||||||
Provision for income taxes | 1,376 | 1,646 | 806 | 604 | — | ||||||||||||||
Net income from continuing operations | 379,758 | 30,712 | 6,112 | 13,143 | 14,679 | ||||||||||||||
Net income from discontinued operations (1) | — | 3,853 | 18,291 | 11,455 | — | ||||||||||||||
Net income | 379,758 | 34,565 | 24,403 | 24,598 | 14,679 | ||||||||||||||
Net income attributable to noncontrolling interests | (21 | ) | (18 | ) | (11 | ) | (220 | ) | (213 | ) | |||||||||
Net income attributable to the Company | 379,737 | 34,547 | 24,392 | 24,378 | 14,466 | ||||||||||||||
Redeemable preferred stock dividends | (490 | ) | (9 | ) | — | — | — | ||||||||||||
Redeemable preferred stock redemptions | 2 | — | — | — | — | ||||||||||||||
Net income available to common stockholders | $ | 379,249 | $ | 34,538 | $ | 24,392 | $ | 24,378 | $ | 14,466 | |||||||||
Funds from operations (FFO) available to common stockholders | $ | 47,540 | $ | 66,840 | $ | 93,661 | $ | 93,425 | $ | 83,110 | |||||||||
Common dividends (2) | $ | 38,327 | $ | 77,316 | $ | 85,389 | $ | 85,048 | $ | 104,035 | |||||||||
Common dividends per share (3) | $ | 0.594 | $ | 0.875 | $ | 0.875 | $ | 0.875 | $ | 1.090 | |||||||||
Weighted average shares of common stock outstanding (3) | |||||||||||||||||||
Basic | 69,062 | 91,328 | 97,588 | 97,173 | 95,440 | ||||||||||||||
Diluted | 69,070 | 91,328 | 97,588 | 97,176 | 95,440 | ||||||||||||||
(1) | Net income from discontinued operations represents revenues and expenses from the parts of our lending segment acquired in March 2014 in connection with the Merger, which were discontinued during 2016 and 2015. On December 17, 2015, we sold substantially all of our commercial mortgage loans with a carrying value of $77,121,000 to an unrelated third-party and recognized a gain of $5,151,000. On December 29, 2016, we sold our commercial real estate lending subsidiary, which was classified as held for sale and had a carrying value of $27,587,000, which was equal to management's estimate of fair value, to a fund managed by an affiliate of CIM Group. We did not recognize any gain or loss in connection with the transaction. Management's estimate of fair value was determined with assistance from an independent third-party valuation firm. |
(2) | Dividends in 2017 do not include the special cash dividends that allowed the common stockholders that did not participate in the September 14, 2016, June 12, 2017 and December 18, 2017 private share repurchases to receive the economic benefit of such repurchases. Urban II, an affiliate of CIM REIT and CIM Urban, waived its right to receive these special dividends as to its shares of our Common Stock owned as of the applicable record dates. Dividends in 2014 do not include PMC Commercial's pre-Merger dividends or the special dividend paid to PMC Commercial's stockholders; however, these amounts do include the dividends paid on the shares of preferred stock issued to Urban II in connection with the Merger on an as converted basis. Dividends in 2013 through March 11, 2014 (the "Acquisition Date") represent distributions by CIM Urban in respect of its limited partnership interests. Dividends in the year ended December 31, 2013 include five distributions. |
(3) | Unaudited Pro Forma, as if the issuance of shares in connection with the Merger occurred on January 1, 2013. |
66
At December 31, | |||||||||||||||||||
2017 | 2016 | 2015 | 2014 | 2013 | |||||||||||||||
(in thousands) | |||||||||||||||||||
Total assets | $ | 1,336,388 | $ | 2,022,884 | $ | 2,092,060 | $ | 2,088,902 | $ | 1,832,349 | |||||||||
Debt | 630,852 | 967,886 | 693,956 | 644,835 | 392,977 | ||||||||||||||
Redeemable preferred stock | 27,924 | 1,426 | — | — | — | ||||||||||||||
Equity | 626,705 | 966,589 | 1,297,347 | 1,359,816 | 1,376,483 | ||||||||||||||
Item 7. Management's Discussion and Analysis of Financial Condition and Results of Operations
This section includes many forward-looking statements. For cautions about relying on such forward-looking statements, please see "Forward-Looking Statements" at the beginning of this report immediately prior to Item 1 in this Annual Report on Form 10-K.
Executive Summary
Business Overview
CIM Commercial is a Maryland corporation and REIT. Our principal business is to acquire, own, and operate Class A and creative office assets in vibrant and improving urban communities throughout the United States. These communities are located in areas that include traditional downtown areas and suburban main streets, which have high barriers to entry, high population density, improving demographic trends and a propensity for growth. We believe that the critical mass of redevelopment in such areas creates positive externalities, which enhance the value of substantially stabilized assets in the area. We believe that these assets will provide greater returns than similar assets in other markets, as a result of the improving demographics, public commitment, and significant private investment that characterize these areas.
We are operated by affiliates of CIM Group. CIM Group is a vertically-integrated owner and operator of real assets with multi-disciplinary expertise and in-house research, acquisition, credit analysis, development, finance, leasing, and asset management capabilities. CIM Group is headquartered in Los Angeles, California and has offices in Oakland, California; Bethesda, Maryland; Dallas, Texas; New York, New York; Chicago, Illinois; and Phoenix, Arizona.
Our wholly-owned subsidiary, CIM Urban, is party to an Investment Management Agreement with the Operator, an affiliate of CIM Group, pursuant to which the Operator provides certain services to CIM Urban. In addition, we are party to a Master Services Agreement with the Operator, an affiliate of CIM Group, pursuant to which the Operator provides or arranges for other service providers to provide management and administration services to us.
Our two primary goals are (a) consistently growing our NAV and cash flow per share of Common Stock through our principal business and (b) providing liquidity to our common stockholders at prices reflecting our NAV and cash flow prospects. In that regard, in June 2016 we completed a tender offer for 10,000,000 shares of Common Stock at a price of $21.00 per share of Common Stock; in September 2016, we repurchased in a privately negotiated transaction, 3,628,116 shares of our Common Stock at a price of $22.00 per share from Urban II; in June 2017, we repurchased in a privately negotiated transaction, 26,181,818 shares of our Common Stock at a price of $22.00 per share from Urban II; and in December 2017, we repurchased in a privately negotiated transaction, 14,090,909 shares of our Common Stock at a price of $22.00 per share from Urban II. Additionally, in April 2017, we declared and paid a special cash dividend of $0.28 per share of Common Stock, or $601,000, to the common stockholders that did not participate in the September 2016 private repurchase; in June 2017, we declared and paid a special cash dividend of $1.98 per share of Common Stock, or $4,271,000, to the common stockholders that did not participate in the June 2017 private repurchase; and in December 2017, we declared a special cash dividend of $0.73 per share of Common Stock, or $1,575,000, to the common stockholders that did not participate in the December 2017 private repurchase, which was paid in January 2018. These special cash dividends allowed such common stockholders that did not participate in the September 2016, June 2017 and December 2017 private repurchases to receive the economic benefits of such repurchases.
We seek to utilize the CIM platform to acquire and improve assets within CIM's Qualified Communities. We believe assets in these markets provide greater returns as a result of improving demographics, public commitment, and significant private investment within the areas. Over time, we seek to expand our real estate assets in communities targeted by CIM Group, supported by CIM Group's broad real estate capabilities, as part of our plan to prudently grow market value and earnings. As a matter of prudent management, we also regularly evaluate each asset within our portfolio as well as our strategies. Such review
67
may result in dispositions when an asset no longer fits our overall objectives or strategies or when our view of the market value of such asset is equal to or exceeds its intrinsic value. As a result of such review, we sold an office property in Santa Ana, California in November 2015; a hotel in Oakland, California in February 2016; a hotel in Los Angeles, California in July 2016; an office property in San Francisco, California in March 2017; two multifamily properties in Dallas, Texas in May 2017; an office property in Charlotte, North Carolina in June 2017; an office property and a parking garage in Sacramento, California in June 2017; a multifamily property in Dallas, Texas in June 2017; an office property in Washington, D.C. in August 2017; an office property in Los Angeles, California in September 2017; a multifamily property in New York, New York in September 2017; an office property in Washington, D.C. in October 2017; and a multifamily property in Houston, Texas in December 2017. Such review may result in additional dispositions from time to time. We used a substantial portion of the net proceeds of such dispositions to provide liquidity to our common stockholders in 2017 at prices reflecting our NAV and cash flow prospects.
Properties
As of December 31, 2017, our real estate portfolio consisted of 20 assets, all of which are fee-simple properties. As of December 31, 2017, our 18 office properties (including one parking garage and two development sites, one of which is being used as a parking lot), totaling approximately 3.3 million rentable square feet, were 94.2% occupied and one hotel with an ancillary parking garage, which has a total of 503 rooms, had RevPAR of $128.43 for the year ended December 31, 2017.
Strategy
Our strategy is to continue to primarily acquire Class A and creative office assets in vibrant and improving urban communities throughout the United States in a manner that will allow us to increase our NAV and cash flow per share of Common Stock. Our strategy is centered around CIM's community qualification process. We believe this strategy provides us with a significant competitive advantage when making urban real estate acquisitions. The qualification process generally takes between six months and five years and is a critical component of CIM's evaluation. CIM examines the characteristics of a market to determine whether the district justifies the extensive efforts CIM undertakes in reviewing and making potential acquisitions in its Qualified Communities. Qualified Communities generally fall into one of two categories: (i) transitional urban districts that have dedicated resources to become vibrant urban communities and (ii) well-established, thriving urban areas (typically major central business districts). Qualified Communities are distinct districts which have dedicated resources to become or are currently vibrant communities where people can live, work, shop and be entertained—all within walking distance or close proximity to public transportation. These areas also generally have high barriers to entry, high population density, improving demographic trends and a propensity for growth. CIM believes that a vast majority of the risks associated with acquiring real assets are mitigated by accumulating local market knowledge of the community where the asset is located. CIM typically spends significant time and resources qualifying targeted communities prior to making any acquisitions. Since 1994, CIM Group has qualified 110 communities and has deployed capital in 67 of these Qualified Communities. Although we may not deploy capital exclusively in Qualified Communities, it is expected that most of our assets will be identified through this systematic process. Our strategy may also include side-by-side acquisitions with one or more funds of CIM including, without limitation, a side-by-side or direct deployment of capital in a perpetual-life real estate debt fund that principally originates loans secured directly or indirectly by commercial real estate properties. Further, as part of our strategy, we may deploy capital in or originate loans that are secured directly or indirectly by properties primarily located in Qualified Communities that meet our strategy. Such loans may include limited and/or non-recourse junior (mezzanine, B-note or 2nd lien) and senior acquisition, bridge or repositioning loans.
CIM seeks to maximize the value of its holdings through active asset management. CIM has extensive in-house research, acquisition, credit analysis, development, financing, leasing and asset management capabilities, which leverage its deep understanding of urban communities to position properties for multiple uses and to maximize operating income. As a fully integrated owner and operator, CIM's asset management capabilities are complemented by its in-house property management capabilities. Property managers prepare annual capital and operating budgets and monthly operating reports, monitor results and oversee vendor services, maintenance and capital improvement schedules. In addition, they ensure that revenue objectives are met, lease terms are followed, receivables are collected, preventative maintenance programs are implemented, vendors are evaluated and expenses are controlled. The Asset Management Committee reviews and approves strategic plans for each asset, including financial, leasing, marketing, property positioning and disposition plans. In addition, the Asset Management Committee reviews and approves the annual business plan for each property, including its capital and operating budget. CIM's organizational structure provides for continuity through multi-disciplinary teams responsible for an asset from the time of the original recommendation, through the implementation of the asset's business plan, and any disposition activities.
68
Rental Rate Trends
Office Statistics: The following table sets forth occupancy rates and annualized rent per occupied square foot across our office portfolio as of the specified periods:
As of December 31, | |||||||||||
2017 | 2016 | 2015 | |||||||||
Occupancy (1) | 94.2 | % | 85.7 | % | 86.9 | % | |||||
Annualized rent per occupied square foot (1)(2) | $ | 41.00 | $ | 36.79 | $ | 36.75 | |||||
(1) | We acquired one office property and sold six office properties and a parking garage during the year ended December 31, 2017. Excluding these properties, the occupancy and annualized rent per occupied square foot were 94.1% and $40.82 as of December 31, 2017, 92.9% and $39.10 as of December 31, 2016 and 93.3% and $37.69 as of December 31, 2015. |
(2) | Other than as set forth in (3) below, represents gross monthly base rent under leases commenced as of the specified periods, multiplied by twelve. This amount reflects total cash rent before abatements. Total abatements for the years ended December 31, 2017, 2016 and 2015 were $3,128,000, $4,251,000 and $5,127,000, respectively. Where applicable, annualized rent has been grossed up by adding annualized expense reimbursements to base rent. Annualized rent for certain office properties includes rent attributable to retail. |
(3) | 1130 Howard Street was acquired in December 2017. The annualized rent as of December 31, 2017 for 12,944 rentable square feet of the building is presented using the actual rental income under a signed lease with a different tenant who is expected to take possession in April 2018, as the space is occupied by the prior owner and annualized rent under the short-term lease is de minimis. |
Over the next four quarters, we expect to see expiring cash rents as set forth in the table below:
For the Three Months Ended | |||||||||||||||
March 31, | June 30, | September 30, | December 31, | ||||||||||||
2018 | 2018 | 2018 | 2018 | ||||||||||||
Expiring Cash Rents: | |||||||||||||||
Expiring square feet (1)(3) | 157,942 | 28,440 | 36,007 | 63,334 | |||||||||||
Expiring rent per square foot (2)(3) | $ | 31.61 | $ | 45.11 | $ | 37.52 | $ | 37.72 | |||||||
(1) | All month-to-month tenants occupying a total of 24,855 square feet are included in the expiring leases in the first quarter listed. |
(2) | Other than as set forth in (3) below, represents gross monthly base rent, as of December 31, 2017, under leases expiring during the periods above, multiplied by twelve. This amount reflects total cash rent before abatements. Where applicable, annualized rent has been grossed up by adding annualized expense reimbursements to base rent. |
(3) | 1130 Howard Street was acquired in December 2017. The annualized rent as of December 31, 2017 for 12,944 rentable square feet of the building is presented using the actual rental income under a signed lease with a different tenant who is expected to take possession in April 2018, as the space is occupied by the prior owner and annualized rent under the short-term lease is de minimis. |
69
During the year ended December 31, 2017, we executed leases with terms longer than 12 months totaling 424,395 square feet. The table below sets forth information on certain of our executed leases during the year ended December 31, 2017, excluding space that was vacant for more than one year, month-to-month leases, leases with an original term of less than 12 months, related party leases, and space where the previous tenant was a related party:
New Cash | Expiring Cash | ||||||||||||
Number of | Rentable | Rents per Square | Rents per Square | ||||||||||
Leases (1) | Square Feet | Foot (2) | Foot (2) | ||||||||||
Twelve Months Ended December 31, 2017 | 45 | 281,075 | $ | 47.01 | $ | 38.87 | |||||||
(1) | Based on the number of tenants that signed leases. |
(2) | Cash rents represent gross monthly base rent, multiplied by twelve. This amount reflects total cash rent before abatements. Where applicable, annualized rent has been grossed up by adding annualized expense reimbursements to base rent. |
Fluctuations in submarkets, buildings and terms of the leases cause large variations in these numbers and make predicting the changes in rent in any specific period difficult. Our rental and occupancy rates are impacted by general economic conditions, including the pace of regional and economic growth, and access to capital. Therefore, we cannot give any assurance that leases will be renewed or that available space will be re-leased at rental rates equal to or above the current market rates. Additionally, decreased demand and other negative trends or unforeseeable events that impair our ability to timely renew or re-lease space could have further negative effects on our future financial condition, results of operations and cash flow.
Multifamily Statistics: The following table sets forth occupancy rates and the monthly rent per occupied unit across our multifamily portfolio for the specified periods:
As of December 31, | ||||||||||
2017 (1) | 2016 | 2015 | ||||||||
Occupancy | — | 92.0 | % | 92.4 | % | |||||
Monthly rent per occupied unit (2) | — | $ | 1,948 | $ | 1,942 | |||||
(1) | Occupancy and monthly rent per occupied unit are not applicable as of December 31, 2017 due to the sale of our five multifamily properties during the year ended December 31, 2017. |
(2) | Represents gross monthly base rent under leases commenced as of the specified period, divided by occupied units. This amount reflects total cash rent before concessions. |
Hotel Statistics: The following table sets forth the occupancy, average daily rate ("ADR") and RevPAR for the hotel portfolio for the specified periods:
For the Year Ended | |||||||||||
December 31, | |||||||||||
2017 | 2016 | 2015 | |||||||||
Occupancy(1) | 81.5 | % | 78.9 | % | 82.1 | % | |||||
ADR(1) | $ | 157.64 | $ | 144.06 | $ | 132.61 | |||||
RevPAR(1) | $ | 128.43 | $ | 113.73 | $ | 108.88 | |||||
(1) | The Courtyard Oakland and LAX Holiday Inn were sold in February and July 2016, respectively. The occupancy, ADR and RevPAR are presented for our period of ownership only. Excluding these hotel properties that were sold in 2016, occupancy, ADR, and RevPAR were 78.1%, $152.89 and $119.44 for the year ended December 31, 2016, respectively, and 77.5%, $148.24 and $114.83 for the year ended December 31, 2015, respectively. |
70
Lending Segment
In order to allow CIM Commercial to increase its focus on Class A and creative office assets, our Board of Directors approved a plan in December 2014 for the lending segment that, when completed, would have resulted in the deconsolidation of the lending segment, which at that time was focused on small business lending in the hospitality industry. In July 2015, to maximize value, we modified our strategy from a strategy of selling the lending segment as a whole to a strategy of soliciting buyers for components of the business, including our commercial mortgage loans and the SBA 7(a) lending platform. This change in the sale methodology resulted in the need to extend the period to complete the sale of the remainder of the lending segment beyond one year. On December 17, 2015, pursuant to the modified plan, we sold substantially all of our commercial mortgage loans with a carrying value of $77,121,000 to an unrelated third-party and recognized a gain of $5,151,000. In September 2016, we discontinued our efforts to sell the SBA 7(a) lending platform, and the activities related to the SBA 7(a) lending platform have been reclassified to continuing operations for all periods presented. On December 29, 2016, we sold our commercial real estate lending subsidiary, which was classified as held for sale and had a carrying value of $27,587,000, which was equal to management's estimate of fair value, to a fund managed by an affiliate of CIM Group. We did not recognize any gain or loss in connection with the transaction. Management's estimate of fair value was determined with assistance from an independent third-party valuation firm.
Through our SBA 7(a) lending platform, we are a national lender that primarily originates loans to small businesses. We identify loan origination opportunities through personal contacts, internet referrals, attendance at trade shows and meetings, direct mailings, advertisements in trade publications and other marketing methods. We also generate loans through referrals from real estate and loan brokers, franchise representatives, existing borrowers, lawyers and accountants.
Results of Operations
Comparison of the Year Ended December 31, 2017 to the Year Ended December 31, 2016
Net Income
Year Ended | ||||||||||||||
December 31, | Change | |||||||||||||
2017 | 2016 | $ | % | |||||||||||
(dollars in thousands) | ||||||||||||||
Total revenues | $ | 236,376 | $ | 265,931 | $ | (29,555 | ) | (11.1 | )% | |||||
Total expenses | 256,979 | 273,239 | (16,260 | ) | (6.0 | )% | ||||||||
Gain on sale of real estate | 401,737 | 39,666 | 362,071 | — | ||||||||||
Net income from discontinued operations | — | 3,853 | (3,853 | ) | — | |||||||||
Net income | 379,758 | 34,565 | 345,193 | — | ||||||||||
Net income increased to $379,758,000 for the year ended December 31, 2017, compared to $34,565,000 for the year ended December 31, 2016. The increase is primarily attributable to a gain on sale of real estate of $401,737,000 in 2017, as compared to $39,666,000 in 2016, a decrease of $13,604,000 in depreciation and amortization, a decrease of $3,540,000 in asset management and other fees to related parties, a decrease in corporate general and administrative expenses of $1,213,000, partially offset by an increase of $13,100,000 in impairment of real estate, an increase of $11,522,000 in transaction costs, a decrease of $4,954,000 in net operating income of our operating segments in continuing operations, a decrease of $3,853,000 in net income from discontinued operations, and an increase of $2,076,000 in interest expense.
Funds from Operations ("FFO")
We believe that FFO is a widely recognized and appropriate measure of the performance of a REIT and that it is frequently used by security analysts, investors and other interested parties in the evaluation of REITs, many of which present FFO when reporting their results. FFO represents net income (loss) available to common stockholders, computed in accordance with GAAP, excluding gains (or losses) from sales of real estate, impairment of real estate, and real estate depreciation and amortization, and deducting redeemable preferred stock dividends accumulated. We calculate FFO in accordance with the standards established by the National Association of Real Estate Investment Trusts ("NAREIT").
71
Like any metric, FFO should not be used as the only measure of our performance because it excludes depreciation and amortization and captures neither the changes in the value of our real estate properties that result from use or market conditions nor the level of capital expenditures and leasing commissions necessary to maintain the operating performance of our properties, all of which have real economic effect and could materially impact our operating results. Other REITs may not calculate FFO in accordance with the standards established by the NAREIT; accordingly, our FFO may not be comparable to the FFOs of other REITs. Therefore, FFO should be considered only as a supplement to net income as a measure of our performance and should not be used as a supplement to or substitute measure for cash flows from operating activities computed in accordance with GAAP. FFO should not be used as a measure of our liquidity, nor is it indicative of funds available to fund our cash needs, including our ability to pay dividends.
The following table sets forth a reconciliation of net income available to common stockholders to FFO available to common stockholders:
Year Ended December 31, | |||||||
2017 | 2016 | ||||||
(in thousands) | |||||||
Net income available to common stockholders | $ | 379,249 | $ | 34,538 | |||
Depreciation and amortization | 58,364 | 71,968 | |||||
Impairment of real estate | 13,100 | — | |||||
Gain on sale of depreciable assets | (401,737 | ) | (39,666 | ) | |||
Redeemable preferred stock dividends accumulated | (1,436 | ) | — | ||||
FFO available to common stockholders | $ | 47,540 | $ | 66,840 | |||
FFO available to common stockholders was $47,540,000 for the year ended December 31, 2017, a decrease of $19,300,000 compared to $66,840,000 for the year ended December 31, 2016. The decrease was primarily attributable to an increase of $11,522,000 in transaction costs, a decrease of $4,954,000 in net operating income of our operating segments in continuing operations, a decrease of $3,853,000 in net income from discontinued operations, an increase of $2,076,000 in interest expense, and $1,436,000 in redeemable preferred stock dividends accumulated, which were partially offset by a decrease of $3,540,000 in asset management and other fees to related parties and a decrease in corporate general and administrative expenses of $1,213,000.
Summary Segment Results
During the years ended December 31, 2017 and 2016, CIM Commercial operated in four segments: office, hotel and multifamily properties and lending. Set forth and described below are summary segment results for our four segments included in continuing operations.
Year Ended | ||||||||||||||
December 31, | Change | |||||||||||||
2017 | 2016 | $ | % | |||||||||||
(dollars in thousands) | ||||||||||||||
Revenues: | ||||||||||||||
Office | $ | 174,004 | $ | 187,435 | $ | (13,431 | ) | (7.2 | )% | |||||
Hotel | 38,585 | 48,379 | (9,794 | ) | (20.2 | )% | ||||||||
Multifamily | 13,566 | 20,303 | (6,737 | ) | (33.2 | )% | ||||||||
Lending | 10,221 | 9,814 | 407 | 4.1 | % | |||||||||
Expenses: | ||||||||||||||
Office | 69,782 | 82,451 | (12,669 | ) | (15.4 | )% | ||||||||
Hotel | 25,136 | 32,459 | (7,323 | ) | (22.6 | )% | ||||||||
Multifamily | 8,118 | 12,357 | (4,239 | ) | (34.3 | )% | ||||||||
Lending | 4,888 | 5,258 | (370 | ) | (7.0 | )% | ||||||||
72
Revenues
Office Revenue: Office revenue includes rental revenue from office properties, expense reimbursements and lease termination income. Office revenue decreased to $174,004,000, or by 7.2%, for the year ended December 31, 2017 compared to $187,435,000 for the year ended December 31, 2016. The decrease is primarily due to the sale of an office property in San Francisco, California in March 2017, the sale of an office property in Charlotte, North Carolina in June 2017, the sale of an office property and parking garage in Sacramento, California in June 2017, the sale of two office properties in Washington, D.C. in August and October 2017, and the sale of an office property in Los Angeles, California in September 2017, partially offset by an increase in expense reimbursements revenue at certain of our Washington, D.C. properties, one of which was sold in August 2017, an increase in lease termination income at one of our California properties due to recognition of fees in connection with the early termination of a large tenant effective in January 2018, which space has been subsequently leased and an increase at certain of our California and Washington, D.C. properties due to increases in both occupancy and rental rates. The aforementioned sales are expected to cause office revenue to decrease materially in 2018. However, such decrease is expected to be partially offset by revenue increases from the acquisitions of an office property in San Francisco, California in December 2017 and an office property in Beverly Hills, California in January 2018.
Hotel Revenue: Hotel revenue decreased to $38,585,000, or by 20.2%, for the year ended December 31, 2017 compared to $48,379,000 for the year ended December 31, 2016. The decrease is primarily due to the sale of two hotel properties in February and July 2016.
Multifamily Revenue: Multifamily revenue decreased to $13,566,000, or by 33.2%, for the year ended December 31, 2017 compared to $20,303,000 for the year ended December 31, 2016. The decrease is primarily due to the sale of the three multifamily properties in Dallas, Texas in May and June 2017, the sale of a multifamily property in New York, New York in September 2017, and a decrease at the Houston, Texas property sold in December 2017 as a result of decreased rents. The aforementioned sales of our multifamily properties will result in no multifamily revenue in 2018. Additionally, we have assessed the sale of our multifamily properties in accordance with Accounting Standards Codification ("ASC") 205-20, Discontinued Operations and we concluded the disposals do not represent a strategic shift that will have a major effect on our operations and financial results and they should not be classified as discontinued operations on our consolidated financial statements.
Lending Revenue: Lending revenue represents revenue from our lending subsidiaries included in continuing operations, including interest income on loans and other loan related fee income. Lending revenue increased to $10,221,000, or by 4.1%, for the year ended December 31, 2017 compared to $9,814,000 for the year ended December 31, 2016. The increase is primarily related to a break-up fee received during the year ended December 31, 2017.
Expenses
Office Expenses: Office expenses decreased to $69,782,000, or by 15.4%, for the year ended December 31, 2017 compared to $82,451,000 for the year ended December 31, 2016. The decrease is primarily due to reduced real estate taxes for the year ended December 31, 2017 as a result of our transfer of the right to collect supplemental real estate tax reimbursements related to an office property in San Francisco, California in March 2017, the sale of the same office property in San Francisco, California in March 2017, the sale of an office property and parking garage in Sacramento, California in June 2017, a decrease in real estate taxes for the year ended December 31, 2017 at our office property in Charlotte, North Carolina, the sale of the same office property in Charlotte, North Carolina in June 2017, the sale of two office properties in Washington, D.C. in August and October 2017, and the sale of an office property in Los Angeles, California in September 2017, a decrease in real estate taxes at certain of our California properties, due to supplemental tax assessments received during 2016, partially offset by an increase in other tenant reimbursable expenses at certain of our Washington, D.C. properties, one of which was sold in August 2017. The aforementioned sales are expected to cause office expenses to decrease materially in 2018. However, such decrease is expected to be partially offset by expense increases from the acquisitions of on office property in San Francisco, California in December 2017 and an office property in Beverly Hills, California in January 2018.
Hotel Expenses: Hotel expenses decreased to $25,136,000, or by 22.6%, for the year ended December 31, 2017 compared to $32,459,000 for the year ended December 31, 2016. The decrease is primarily due to the sale of two hotel properties in February and July 2016.
Multifamily Expenses: Multifamily expenses decreased to $8,118,000, or by 34.3%, for the year ended December 31, 2017 compared to $12,357,000 for the year ended December 31, 2016. The decrease is primarily due to the sale of the three multifamily properties in Dallas, Texas in May and June 2017, the sale of a multifamily property in New York, New York in September 2017, and a decrease in legal fees at the same New York property. The aforementioned sales of our multifamily
73
properties, and the sale of the multifamily property in Houston, Texas in December 2017, will result in no multifamily expenses in 2018. Additionally, we have assessed the sale of our multifamily properties in accordance with ASC 205-20, Discontinued Operations and we concluded the disposals do not represent a strategic shift that will have a major effect on our operations and financial results and they should not be classified as discontinued operations on our consolidated financial statements.
Lending Expenses: Lending expenses represent expenses from our lending subsidiaries included in continuing operations, including general and administrative expenses and fees to related party, related to the operation of the lending business. Lending expenses decreased to $4,888,000, or by 7.0%, for the year ended December 31, 2017 compared to $5,258,000 for the year ended December 31, 2016, primarily due to a decrease in fees to related party and reductions in general and administrative costs associated with assets acquired in liquidation, partially offset by the recognition of a provision for loan losses during the year ended December 31, 2017 compared to a recovery of loan losses during the year ended December 31, 2016.
Asset Management and Other Fees to Related Parties: Asset management fees totaled $22,229,000 for the year ended December 31, 2017 compared to $25,753,000 for the year ended December 31, 2016. Asset management fees are calculated based on a percentage of the daily average adjusted fair value of CIM Urban's assets, which are appraised in the fourth quarter of each year. The lower fees reflect a decrease in the adjusted fair value of CIM Urban's assets due to the sale of a hotel property in February 2016, the sale of a hotel property in July 2016, the sale of an office property in March 2017, the sale of two multifamily properties in May 2017, the sale of two office properties, a parking garage, and one multifamily property in June 2017, the sale of an office property in August 2017, the sale of an office property and a multifamily property in September 2017, the sale of an office property in October 2017, and the sale of a multifamily property in December 2017, partially offset by incremental capital expenditures during 2017 and the acquisition of an office property in December 2017. CIM Commercial also pays a Base Service Fee to the Administrator, a related party, which totaled $1,060,000 for the year ended December 31, 2017 compared to $1,043,000 for the year ended December 31, 2016. In addition, the Administrator received compensation and/or reimbursement for performing certain services for CIM Commercial and its subsidiaries that are not covered under the Base Service Fee. For the years ended December 31, 2017 and 2016, we expensed $3,065,000 and $3,120,000 for such services, respectively. For the years ended December 31, 2017 and 2016, we also expensed $433,000 and $411,000, respectively, related to corporate services subject to reimbursement by us under the CIM SBA Staffing and Reimbursement Agreement. Asset management fees are expected to decrease materially in 2018 as a result of our completed sales, partially offset by an increase resulting from the acquisitions of two office properties in December 2017 and January 2018.
Interest Expense: Interest expense, which is not allocated to our operating segments, was $35,924,000 for the year ended December 31, 2017, an increase of $2,076,000, compared to $33,848,000 for the year ended December 31, 2016. The increase is primarily due to interest expense on our $392,000,000 mortgage loans entered into in June 2016, partially offset by a decrease in interest expense due to the payoff of a $25,331,000 mortgage in March 2017 in connection with the sale of an office property in San Francisco, California, the payoff of mortgages with a combined balance of $38,781,000 in connection with the sale of our three multifamily properties in Dallas, Texas in May and June 2017, and a decrease in interest expense, including the impact of interest rate swaps, and loan amortization expense under the unsecured credit and term loan facilities, primarily due to lower average outstanding loan balances under the unsecured credit and term loan facilities. Our interest expense is expected to decrease in 2018 due to the payoffs and buyers' assumptions of loans in connection with our sales of real estate totaling $114,372,000 in 2017, and the repayment of $215,000,000 of outstanding borrowings on our unsecured term loan facility. However, the magnitude of any such decrease cannot be predicted as it will depend on a number of factors such as our outstanding borrowings and the terms of any new borrowings we may enter into.
General and Administrative Expenses: General and administrative expenses, which have not been allocated to our operating segments, were $3,018,000 for the year ended December 31, 2017, a decrease of $1,213,000, compared to $4,231,000 for the year ended December 31, 2016. The decrease is primarily due to a decrease in consulting fees, professional fees, and shareholder services expenses.
Transaction Costs: Transaction costs totaling $11,862,000 for the year ended December 31, 2017 represent a $11,522,000 increase from $340,000 for the year ended December 31, 2016, primarily due to the $11,845,000 payment made in August 2017 in connection with a suit filed by the City and County of San Francisco claiming past due real property transfer tax relating to a transaction in a prior year. The Company believes that it has defenses to, and intends to continue to vigorously contest, the asserted tax obligations. Towards that end, the Company filed claims for refund in January 2018 in an effort to recover the full amounts paid. The costs incurred in 2016 primarily represent abandoned project costs.
Depreciation and Amortization Expense: Depreciation and amortization expense was $58,364,000 for the year ended December 31, 2017, a decrease of $13,604,000, compared to $71,968,000 for the year ended December 31, 2016. The decrease
74
is primarily due to the sale of a hotel property in July 2016, the sale of an office property in San Francisco, California that was held for sale starting in mid-February 2017 and sold in March 2017, the sale of three multifamily properties in Dallas, Texas that were held for sale in May 2017 and sold in May and June 2017, the sale of two office properties and a parking garage in Sacramento, California and Charlotte, North Carolina that were held for sale in April 2017 and sold in June 2017, the sale of an office property in Los Angeles, California that was held for sale in May 2017 and sold in September 2017, the sale of two multifamily properties in New York, New York and Houston, Texas that were held for sale in July 2017 and sold in September and December 2017, respectively, the sale of two office properties in Washington, D.C. that were held for sale in August 2017 and sold in August and October 2017, partially offset by the acceleration of tenant improvement depreciation and lease commission amortization in connection with the early termination of a large tenant at one of our California properties effective in January 2018, and an increase in depreciation expense associated with additional capital expenditures. Depreciation expense is expected to decrease materially in 2018 as a result of our completed sales in 2017, partially offset by increases from the acquisitions of an office property in San Francisco, California in December 2017 and an office property in Beverly Hills, California in January 2018.
Impairment of Real Estate: Impairment of real estate was $13,100,000 for the year ended December 31, 2017 and $0 for the year ended December 31, 2016. In August 2017, we negotiated an agreement with an unrelated third-party for the sale of an office property, which was sold in October 2017. We determined the book value of this property exceeded its estimated fair value less costs to sell, and as such, an impairment charge of $13,100,000 was recognized for the year ended December 31, 2017. Our determination of fair value was based on the sale price negotiated with the third-party buyer.
Provision for Income Taxes: Provision for income taxes was $1,376,000 for the year ended December 31, 2017, a decrease of $270,000, compared to $1,646,000 for the year ended December 31, 2016, due to a decrease in taxable income at one of our taxable REIT subsidiaries, partially offset by an increase in taxable income at another of our taxable REIT subsidiaries.
Discontinued Operations
Net Income from Discontinued Operations: Net income from discontinued operations represents revenues and expenses from the part of our lending segment that is included in discontinued operations, including interest income on loans and other loan related fee income, offset by expenses, which include general and administrative expenses, fees to related party and direct interest expense. Net income from discontinued operations was $0 for the year ended December 31, 2017 compared to $3,853,000 for the year ended December 31, 2016. The decrease is due to the sale of our commercial real estate lending subsidiary in December 2016.
Comparison of the Year Ended December 31, 2016 to the Year Ended December 31, 2015
Net Income
Year Ended | ||||||||||||||
December 31, | Change | |||||||||||||
2016 | 2015 | $ | % | |||||||||||
(dollars in thousands) | ||||||||||||||
Total revenues | $ | 265,931 | $ | 276,948 | $ | (11,017 | ) | (4.0 | )% | |||||
Total expenses | 273,239 | 273,122 | 117 | — | ||||||||||
Gain on sale of real estate | 39,666 | 3,092 | 36,574 | — | ||||||||||
Net income from discontinued operations | 3,853 | 18,291 | (14,438 | ) | (78.9 | )% | ||||||||
Net income | 34,565 | 24,403 | 10,162 | 41.6 | % | |||||||||
Net income increased to $34,565,000, or by 41.6%, for the year ended December 31, 2016, compared to $24,403,000 for the year ended December 31, 2015. The increase was primarily attributable to a gain on sale of real estate of $39,666,000 in 2016, as compared to $3,092,000 in 2015, a decrease in corporate general and administrative expenses of $2,390,000 and a decrease of $1,042,000 in transaction costs, partially offset by a decrease of $14,438,000 in net income from discontinued operations, an increase of $11,063,000 in interest expense, a decrease of $2,888,000 in net operating income of our operating segments in continuing operations and an increase of $1,008,000 in asset management and other fees to related parties.
75
FFO
We believe that FFO is a widely recognized and appropriate measure of the performance of a REIT and that it is frequently used by security analysts, investors and other interested parties in the evaluation of REITs, many of which present FFO when reporting their results. FFO represents net income (loss) available to common stockholders, computed in accordance with GAAP, excluding gains (or losses) from sales of real estate, impairment of real estate, and real estate depreciation and amortization, and deducting redeemable preferred stock dividends accumulated. We calculate FFO in accordance with the standards established by the NAREIT.
Like any metric, FFO should not be used as the only measure of our performance because it excludes depreciation and amortization and captures neither the changes in the value of our real estate properties that result from use or market conditions nor the level of capital expenditures and leasing commissions necessary to maintain the operating performance of our properties, all of which have real economic effect and could materially impact our operating results. Other REITs may not calculate FFO in accordance with the standards established by the NAREIT; accordingly, our FFO may not be comparable to the FFOs of other REITs. Therefore, FFO should be considered only as a supplement to net income as a measure of our performance and should not be used as a supplement to or substitute measure for cash flows from operating activities computed in accordance with GAAP. FFO should not be used as a measure of our liquidity, nor is it indicative of funds available to fund our cash needs, including our ability to pay dividends.
The following table sets forth a reconciliation of net income available to common stockholders to FFO available to common stockholders:
Year Ended December 31, | |||||||
2016 | 2015 | ||||||
(in thousands) | |||||||
Net income available to common stockholders | $ | 34,538 | $ | 24,392 | |||
Depreciation and amortization | 71,968 | 72,361 | |||||
Gain on sale of depreciable assets | (39,666 | ) | (3,092 | ) | |||
FFO available to common stockholders | $ | 66,840 | $ | 93,661 | |||
FFO available to common stockholders was $66,840,000 for the year ended December 31, 2016, a decrease of $26,821,000, compared to $93,661,000 for the year ended December 31, 2015. The decrease was primarily attributable to a decrease of $14,438,000 in net income from discontinued operations, an increase of $11,063,000 in interest expense, a decrease of $2,888,000 in net operating income of our operating segments in continuing operations and an increase of $1,008,000 in asset management and other fees to related parties, which were partially offset by a decrease in corporate general and administrative expenses of $2,390,000 and a decrease of $1,042,000 in transaction costs.
76
Summary Segment Results
Set forth and described below are summary segment results for our four segments included in continuing operations.
Year Ended | ||||||||||||||
December 31, | Change | |||||||||||||
2016 | 2015 | $ | % | |||||||||||
(dollars in thousands) | ||||||||||||||
Revenues: | ||||||||||||||
Office | $ | 187,435 | $ | 188,270 | $ | (835 | ) | (0.4 | )% | |||||
Hotel | 48,379 | 61,436 | (13,057 | ) | (21.3 | )% | ||||||||
Multifamily | 20,303 | 18,721 | 1,582 | 8.5 | % | |||||||||
Lending | 9,814 | 8,521 | 1,293 | 15.2 | % | |||||||||
Expenses: | ||||||||||||||
Office | 82,451 | 80,785 | 1,666 | 2.1 | % | |||||||||
Hotel | 32,459 | 41,974 | (9,515 | ) | (22.7 | )% | ||||||||
Multifamily | 12,357 | 12,168 | 189 | 1.6 | % | |||||||||
Lending | 5,258 | 5,727 | (469 | ) | (8.2 | )% | ||||||||
Revenues
Office Revenue: Office revenue includes rental revenues from office properties, expense reimbursements and lease termination income. Office revenue decreased to $187,435,000, or by 0.4%, for the year ended December 31, 2016 compared to $188,270,000 for the year ended December 31, 2015. The decrease was primarily due to a decrease in revenue at certain of our Washington D.C. properties primarily due to the expiration of a lease with a large tenant in January 2016, a decrease in revenue at our Sacramento, California property due to the expiration of a lease with a large tenant in June 2015, and a decrease in expense reimbursements revenue at one of our Washington D.C. properties. These decreases were partially offset by revenue increases at certain properties in Washington D.C. and California primarily due to a full year of occupancy for certain tenants in 2016 and increased rental rates, as well as the renewal in 2016 of a large lease at market rents at one of our San Francisco properties.
Hotel Revenue: Hotel revenue decreased to $48,379,000, or by 21.3%, for the year ended December 31, 2016 compared to $61,436,000 for the year ended December 31, 2015. The decrease was primarily due to the sale of two hotel properties in February and July 2016, partially offset by revenue increases at the remaining hotel property due to RevPAR growth resulting from increases in rates and occupancy.
Multifamily Revenue: Multifamily revenue increased to $20,303,000, or by 8.5%, for the year ended December 31, 2016 compared to $18,721,000 for the year ended December 31, 2015. The increase was primarily due to higher revenue as a result of increased rates and a full year of increased occupancy at our New York property in 2016, which we began re-leasing as individual units starting in March 2015 following the termination of the lease by our corporate housing tenant.
Lending Revenue: Lending revenue represents revenue from our lending subsidiaries included in continuing operations, including interest income on loans and other loan related fee income. Lending revenue increased to $9,814,000, or by 15.2%, for the year ended December 31, 2016 compared to $8,521,000 for the year ended December 31, 2015. The increase was primarily due to higher revenue as a result of the recognition of accretion for discounts related to increased prepayments on our loans and an increase in premium income from the sale of the guaranteed portion of our SBA 7(a) loans.
Expenses
Office Expenses: Office expenses increased to $82,451,000, or by 2.1%, for the year ended December 31, 2016 compared to $80,785,000 for the year ended December 31, 2015. The increase was primarily due to an increase in real estate taxes at certain of our California properties, due to supplemental tax assessments received during 2016, and an increase in earthquake insurance premiums at our California properties. The increase at our California properties was partially offset by a decrease in electricity expense at our Washington D.C. properties, a decrease in other tenant reimbursable expenses at one of
77
our Washington D.C. properties, and a decrease in expenses associated with our Santa Ana, California property sold in November 2015.
Hotel Expenses: Hotel expenses decreased to $32,459,000, or by 22.7%, for the year ended December 31, 2016 compared to $41,974,000 for the year ended December 31, 2015. The decrease was primarily due to the sale of two hotel properties in February and July 2016, partially offset by an increase at our remaining hotel property in operating costs and an increase in real estate taxes due to a reduction in tax accruals during 2015 following the receipt of the actual tax assessment.
Multifamily Expenses: Multifamily expenses increased to $12,357,000, or by 1.6%, for the year ended December 31, 2016 compared to $12,168,000 for the year ended December 31, 2015. The increase was primarily due to an increase in legal fees in 2016 at our New York property, as well as increases in real estate taxes at our Dallas properties, partially offset by lower expenses associated with operating our New York property, which was in the process of being re-leased as individual units during 2015 following the termination of the lease by our corporate housing tenant.
Lending Expenses: Lending expenses represent expenses from our lending subsidiaries included in continuing operations, including general and administrative expenses and fees to related party, related to the operation of the lending business. Lending expenses decreased to $5,258,000, or by 8.2%, for the year ended December 31, 2016 compared to $5,727,000 for the year ended December 31, 2015, primarily due to a decrease in the amount of reimbursement of fees to related party as a result of decreased payroll and related expenses, and lower interest expense as a result of secured borrowing prepayments and amortization of related deferred premiums.
Asset Management Fees and Other Fees to Related Parties: Asset management fees totaled $25,753,000 for the year ended December 31, 2016 compared to $24,882,000 for the year ended December 31, 2015. Asset management fees are calculated based on a percentage of the daily average adjusted fair value of CIM Urban's assets, which are appraised in the fourth quarter of each year. The higher fees reflect a net increase in the fair value of CIM Urban's real estate assets based on the December 31, 2015 appraised values, as well as incremental capital expenditures during 2016, offset by decreases as a result of dispositions. CIM Commercial also pays a Base Service Fee to the Administrator, a related party, which totaled $1,043,000 for the year ended December 31, 2016 compared to $1,010,000 for the year ended December 31, 2015. In addition, the Administrator received compensation and/or reimbursement for performing certain services for CIM Commercial and its subsidiaries that are not covered under the Base Service Fee. For the years ended December 31, 2016 and 2015, we expensed $3,120,000 and $2,993,000 for such services, respectively. For the years ended December 31, 2016 and 2015, we also expensed $411,000 and $434,000, respectively, related to corporate services subject to reimbursement by us under the CIM SBA Staffing and Reimbursement Agreement.
Interest Expense: Interest expense, which is not allocated to our operating segments, was $33,848,000 for the year ended December 31, 2016, an increase of $11,063,000, compared to $22,785,000 for the year ended December 31, 2015. The increase was primarily due to higher average outstanding loan balances under the unsecured credit and term loan facilities during 2016 compared to 2015 combined with a higher overall interest rate including the impact of interest rate swaps, and interest expense on our $392,000,000 mortgage loans entered into in June 2016, partially offset by lower interest expense as a result of the repayment of $71,237,000 in fixed rate mortgages in April and September 2015.
General and Administrative Expenses: General and administrative expenses, which have not been allocated to our operating segments, were $4,231,000 for the year ended December 31, 2016, a decrease of $2,390,000, compared to $6,621,000 for the year ended December 31, 2015. The decrease was primarily due to a decrease in legal, consulting fees, professional services and stock-based compensation expenses.
Transaction Costs: Transaction costs totaling $340,000 for the year ended December 31, 2016 represent a $1,042,000 decrease from $1,382,000 for the year ended December 31, 2015. The costs incurred in 2016 primarily represent abandoned project costs, while the costs incurred in 2015 represent abandoned project costs, costs related to the planned disposition of the lending segment, costs associated with evaluating strategies for exiting certain of our non-office real estate portfolio, costs related to the acquisition of a parking lot, and due diligence costs related to potential acquisitions.
Depreciation and Amortization: Depreciation and amortization expense was $71,968,000 for the year ended December 31, 2016, a decrease of $393,000, compared to $72,361,000 for the year ended December 31, 2015. The decrease was primarily due to the sale of an office property in November 2015 and two hotel properties in February and July 2016, and decreased amortization expense resulting from certain acquisition-related assets that became fully depreciated, partially offset by an increase in the depreciation expense associated with additional capital expenditures.
78
Provision for Income Taxes: Provision for income taxes was $1,646,000 for the year ended December 31, 2016, an increase of $840,000 compared to $806,000 for the year ended December 31, 2015. The increase was primarily due to increases in taxable income at our taxable REIT subsidiaries.
Discontinued Operations
Net income from discontinued operations: Net income from discontinued operations represents revenues and expenses from the part of our lending segment that is included in discontinued operations, including interest income on loans and other loan related fee income, offset by expenses, which include general and administrative expenses, fees to related party and direct interest expense. Net income from discontinued operations was $3,853,000 for the year ended December 31, 2016, a decrease of $14,438,000, compared to $18,291,000 for the year ended December 31, 2015. The decrease was primarily due to a gain of $5,151,000 in 2015, decreased interest income related to the sale of substantially all of our commercial mortgage loans in December 2015 and an increase in interest expense resulting from secured borrowings, partially offset by an increase in interest income from the commercial real estate loans at our commercial real estate lending subsidiary sold in December 2016.
Liquidity and Capital Resources
Sources and Uses of Funds
In September 2014, CIM Commercial entered into an $850,000,000 unsecured credit facility with a bank syndicate consisting of a $450,000,000 revolver, a $325,000,000 term loan and a $75,000,000 delayed-draw term loan. CIM Commercial is subject to certain financial maintenance covenants and a minimum property ownership condition. Outstanding advances under the revolver bear interest at (i) the base rate plus 0.20% to 1.00% or (ii) London Inter-bank Offered Rate ("LIBOR") plus 1.20% to 2.00%, depending on the maximum consolidated leverage ratio. Outstanding advances under the term loans bore interest at (i) the base rate plus 0.15% to 0.95% or (ii) LIBOR plus 1.15% to 1.95%, depending on the maximum consolidated leverage ratio. The revolver is also subject to an unused commitment fee of 0.15% or 0.25% depending on the amount of aggregate unused commitments. The delayed-draw term loan was also subject to an unused line fee of 0.25%. Proceeds from the unsecured credit facility were used to repay mortgage loans and outstanding balances under our prior unsecured credit facilities, for acquisitions, short-term funding of a Common Stock tender offer in June 2016, short-term funding of a private repurchase of Common Stock in June 2017, and for general corporate purposes. In June 2016, we entered into six mortgage loan agreements with an aggregate principal amount of $392,000,000. A portion of the net proceeds from the loans was used to repay outstanding balances under our unsecured credit facility and the remaining portion was used to repurchase shares of our Common Stock in a private repurchase in September 2016. The June 2017 borrowing used to fund the private share repurchase was repaid using proceeds from subsequent asset sales. The credit facility was set to mature in September 2016 and, prior to maturity, we exercised the first of two one-year extension options through September 2017 and we permanently reduced the revolving credit commitment under the credit facility to $200,000,000. In August 2017, we exercised the second of two one-year extension options through September 2018 and, in connection with such exercise, we paid an extension fee of $300,000. At March 2, 2018, December 31, 2017 and 2016, $10,000,000, $0, and $0 was outstanding under the credit facility. The unused capacity on the unsecured credit facility, based on covenant restrictions at March 2, 2018 and December 31, 2017 and 2016, was approximately $87,000,000, $97,000,000 and $200,000,000, respectively.
In May 2015, CIM Commercial entered into an unsecured term loan facility with a bank syndicate pursuant to which CIM Commercial could borrow up to a maximum of $385,000,000. The term loan facility ranks pari passu with CIM Commercial's unsecured credit facility described above; covenants under the term loan facility are substantially the same as those in the unsecured credit facility. Outstanding advances under the term loan facility bear interest at (i) the base rate plus 0.60% to 1.25% or (ii) LIBOR plus 1.60% to 2.25%, depending on the maximum consolidated leverage ratio. The unused portion of the term loan facility was also subject to an unused fee of 0.20%. The term loan facility matures in May 2022. On November 2, 2015, $385,000,000 was drawn under the term loan facility. Proceeds from the term loan facility were used to repay balances outstanding under our unsecured credit facility. At December 31, 2017 and 2016, the variable interest rate on this unsecured term loan facility was 2.96% and 2.22%, respectively. The interest rate of the loan has been effectively converted to a fixed rate of 3.16% until May 8, 2020 through interest rate swaps. On August 3, 2017, we repaid $65,000,000 of outstanding borrowings on our unsecured term loan facility. In connection with such paydown, we wrote off deferred loan costs of $601,000 and related accumulated amortization of $193,000, a proportionate amount to the borrowings being repaid, and we terminated three interest rate swaps with an aggregate notional value of $65,000,000. Costs incurred to terminate such swaps totaled $38,000 and are included in interest expense on our consolidated statement of operations for the year ended December 31, 2017. Additionally, on November 29, 2017, we repaid $150,000,000 of outstanding borrowings on our unsecured term loan facility. In connection with such paydown, we wrote off deferred loan costs of $1,387,000 and related accumulated amortization of $512,000, a proportionate amount to the borrowings being repaid, and we terminated four interest rate swaps with an aggregate notional value of $150,000,000. Such swaps were in the money at the time of their termination and we
79
received total payments, net of fees, of $1,011,000, which are included in interest expense on our consolidated statement of operations for the year ended December 31, 2017. At March 2, 2018, December 31, 2017 and 2016, $170,000,000, $170,000,000 and $385,000,000, respectively, was outstanding under the term loan facility.
At December 31, 2017 and 2016, we were in compliance with all of our respective financial covenants under the unsecured credit and term loan facilities.
On April 1, 2015, we paid off a mortgage with an outstanding balance of $12,364,000 using the unsecured credit facility. In addition, on September 1, 2015, we paid off two mortgages with a combined outstanding balance of $58,873,000 using the unsecured credit facility.
On March 28, 2017, in connection with the sale of an office property in San Francisco, California, we paid off a mortgage with an outstanding balance of $25,331,000 using proceeds from the sale. Additionally, we paid a prepayment penalty of $1,508,000 in connection with the prepayment of this mortgage.
On May 30, 2017, in connection with the sale of two multifamily properties, both located in Dallas, Texas, we paid off two mortgages with an aggregate outstanding principal balance of $15,448,000 using proceeds from the sales. Additionally, we paid aggregate prepayment penalties of $1,901,000 in connection with the prepayment of these mortgages.
On June 23, 2017, in connection with the sale of a multifamily property in Dallas, Texas, we paid off a mortgage with an outstanding principal balance of $23,333,000 using proceeds from the sale. Additionally, we paid a prepayment penalty of $2,812,000 in connection with the prepayment of this mortgage.
On September 21, 2017, in connection with the sale of an office property in Los Angeles, California, a mortgage with an outstanding principal balance of $21,700,000, collateralized by such property, was assumed by the buyer.
On December 15, 2017, in connection with the sale of a multifamily property in Houston, Texas, a mortgage with an outstanding principal balance of $28,560,000, collateralized by such property, was assumed by the buyer.
We have an effective registration statement with the SEC with respect to the offer and sale of up to $900,000,000 of units (collectively, the "Series A Preferred Units"), with each unit consisting of (i) one share of Series A Preferred Stock, par value $0.001 per share, of the Company with an initial stated value of $25.00 per share, subject to adjustment, and (ii) one Series A Preferred Warrant to purchase 0.25 of a share of Common Stock. The registration statement allows us to sell up to a maximum of 36,000,000 Series A Preferred Units. Holders of Series A Preferred Stock are entitled to receive, if, as and when authorized by our Board of Directors, and declared by us out of legally available funds, cumulative cash dividends on each share of Series A Preferred Stock at an annual rate of 5.5% of the Series A Preferred Stock Stated Value (i.e., the equivalent of $0.34375 per share per quarter). The exercise price of each Series A Preferred Warrant is at a 15.0% premium to the per share estimated NAV of our Common Stock (as most recently published by us at the time of each issuance). As of December 31, 2017, we had issued 1,287,169 Series A Preferred Units and received net proceeds of $29,505,000 after commissions, fees and allocated costs. During the year ended December 31, 2017, 1,265 shares of Series A Preferred Stock were redeemed and, in December 2017, we received a request to redeem 600 shares of Series A Preferred Stock, which were redeemed in January 2018.
On November 21, 2017, in connection with our registration statement filed with the SEC and the Israel Securities Authority with respect to the offer and sale of up to 900,000 units (collectively, the "Series L Preferred Units"), we issued 808,074 Series L Preferred Units and received net proceeds of $207,845,000 after commissions, fees, allocated costs, and discount. Each Series L Preferred Unit consists of ten shares of Series L Preferred Stock and we issued 8,080,740 shares of Series L Preferred Stock in the offering having a Series L Preferred Stock Stated Value of $28.37 per share, subject to adjustment. Holders of Series L Preferred Stock are entitled to receive, if, as and when authorized by our Board of Directors, and declared by us out of legally available funds, cumulative cash dividends on each share of Series L Preferred Stock at an annual rate of 5.5% of the Series L Preferred Stock Stated Value (i.e., the equivalent of $1.56035 per share per year), with the first distribution expected to be payable in January 2019. If the Company fails to timely declare distributions or fails to timely pay distributions on the Series L Preferred Stock, the annual dividend rate of the Series L Preferred Stock will temporarily increase by 1.0% per year, up to a maximum rate of 8.5%.
We currently have substantial borrowing capacity, and will likely finance our future activities through one or more of the following methods: (i) offerings of shares of Common Stock, preferred stock, senior unsecured securities, and/or other equity and debt securities; (ii) credit facilities and term loans; (iii) the addition of senior recourse or non-recourse debt using target acquisitions as well as existing assets as collateral; (iv) the sale of existing assets; and/or (v) cash flows from operations.
80
We expect to employ leverage levels that are comparable to those of other commercial REITs engaged in business strategies similar to our own.
Our long-term liquidity needs will consist primarily of funds necessary for acquisitions of assets, development or repositioning of properties, capital expenditures, refinancing of indebtedness, paying distributions on our Preferred Stock or any other preferred stock we may issue and redemption of our Preferred Stock (if we choose to pay the redemption price in cash instead of in shares of our Common Stock) and distributions on our Common Stock. We may not have sufficient funds on hand or may not be able to obtain additional financing to cover all of these long-term cash requirements although, it should be noted that we do not currently have any significant property development or repositioning projects planned. The nature of our business, and the requirements imposed by REIT rules that we distribute a substantial majority of our REIT taxable income on an annual basis in the form of dividends, may cause us to have substantial liquidity needs over the long-term. We will seek to satisfy our long-term liquidity needs through one or more of the methods described in the immediately preceding paragraph. These sources of funding may not be available on attractive terms or at all. If we cannot obtain additional funding for our long-term liquidity needs, our assets may generate lower cash flows or decline in value, or both, which may cause us to sell assets at a time when we would not otherwise do so and could have a material adverse effect on our business, financial condition, results of operations, cash flow or our ability to satisfy our debt service obligations or to maintain our level of distributions on our Common Stock or Preferred Stock.
Cash Flow Analysis
Comparison of the Year Ended December 31, 2017 to the Year Ended December 31, 2016
Our cash and cash equivalents totaled $129,310,000 and $144,449,000 at December 31, 2017 and 2016, respectively. Our cash flows from operating activities are primarily dependent upon the real estate assets owned, occupancy level of our real estate assets, the rental rates achieved through our leases, and the collectability of rent and recoveries from our tenants. Our cash flows from operating activities are also impacted by fluctuations in operating expenses and other general and administrative costs. Net cash used in operating activities totaled $1,145,000 for the year ended December 31, 2017 compared to net cash provided by operating activities of $51,873,000 for the year ended December 31, 2016. The decrease is primarily due to a decrease of $31,562,000 resulting from a higher level of working capital used compared to the prior period, primarily due to a $20,000,000 deposit on an office property we acquired in January 2018, a $17,382,000 decrease in net income adjusted for the gain on real estate, depreciation and amortization expense, and impairment of real estate, a $19,003,000 increase in loans funded, partially offset by an increase of $12,776,000 in proceeds from the sale of guaranteed loans.
Our cash flows from investing activities are primarily related to property acquisitions and sales, expenditures for development and redevelopment projects, capital expenditures and cash flows associated with loans originated at our lending segment. Net cash provided by investing activities for the year ended December 31, 2017 was $968,656,000 compared to $29,526,000 in the corresponding period in 2016. The increase is primarily due to an increase of $917,547,000 in proceeds from the sale of real estate during the year ended December 31, 2017 compared to the prior period, a decrease of $46,922,000 in loans funded, an increase in the change in restricted cash of $30,302,000 primarily due to the release of reserves during the year ended December 31, 2017 in connection with the payoff of mortgages on three multifamily properties in Dallas, Texas sold in May and June 2017, and the release of reserves associated with our mortgage loans entered into in June 2016, as compared to funding of such reserves in 2016, a decrease in additions to investments in real estate of $14,313,000, partially offset by a decrease of $26,766,000 in proceeds from sale of assets held for sale, a decrease of $22,587,000 in principal collected on loans and an increase of $19,631,000 in funds used for the acquisition of an office property in December 2017.
Our cash flows from financing activities are generally impacted by borrowings and capital activities. Net cash used in financing activities for the year ended December 31, 2017 was $982,650,000 compared to $77,522,000 in the corresponding period in 2016. The primary reason for the increase in net cash used in financing activities is our repurchase of $886,010,000 of Common Stock during the year ended December 31, 2017 compared to $290,134,000 in the corresponding period in 2016. We funded the repurchases using available cash from asset sales as well as, in the case of the June 12, 2017 repurchase, from short-term borrowings on our unsecured credit facility. We had net debt payments, inclusive of secured borrowings of the lending business, of $287,551,000 for the year ended December 31, 2017, primarily due to the repayment of $215,000,000 of outstanding borrowings on our unsecured term loan facility in August and November 2017, and the prepayment of mortgages in connection with the sale of real estate, compared to net borrowings of $292,491,000 in the corresponding period in 2016, primarily due to the $392,000,000 mortgage loans we entered into in June 2016 partially offset by the repayment of $107,000,000 of outstanding borrowings on our unsecured term loan facility. Proceeds from the issuances of Series L Preferred Stock and Series A Preferred Units were $210,377,000 and $28,197,000, respectively, during the year ended December 31, 2017, compared to $0 and $1,434,000, respectively, in the corresponding period in 2016. Cash used for the payment of deferred offering costs totaled $3,832,000 during the year ended December 31, 2017 compared to $1,960,000 in the corresponding
81
period in 2016. Dividends of $43,449,000 for the year ended December 31, 2017 were sourced from cash on hand at the beginning of the period of $144,449,000, while dividends of $77,316,000 for the year ended December 31, 2016 were sourced from net cash provided by operating activities of $51,873,000 and net proceeds from the sale of real estate properties of $94,568,000. Cash used for the payment of deferred loan costs totaled $304,000 during the year ended December 31, 2017 and primarily related to the extension fee paid on our unsecured credit facility, while deferred loan costs of $1,994,000 paid in the corresponding period in 2016 were primarily related to the $392,000,000 mortgage loans we entered into in June 2016.
Comparison of the Year Ended December 31, 2016 to the Year Ended December 31, 2015
Our cash and cash equivalents, inclusive of cash associated with assets held for sale, totaled $144,449,000 and $140,572,000 at December 31, 2016 and 2015, respectively. Our cash flows from operating activities are primarily dependent upon the real estate assets owned, occupancy level of our real estate assets, the rental rates achieved through our leases, and the collectability of rent and recoveries from our tenants. Our cash flows from operating activities are also impacted by fluctuations in operating expenses and other general and administrative costs. Net cash provided by operating activities totaled $51,873,000 for the year ended December 31, 2016 compared to $77,035,000 for the year ended December 31, 2015. The decrease was primarily due to a decrease of $21,261,000 in net income adjusted for the gain on real estate and gain on disposition of assets held for sale, a decrease of $8,615,000 resulting from increased funding for loans, and a decrease of $9,444,000 resulting from a higher level of working capital used, partially offset by an increase of $10,562,000 in proceeds from sale of guaranteed loans.
Our cash flows from investing activities are primarily related to property acquisitions and sales, expenditures for development and redevelopment projects, capital expenditures and cash flows associated with loans originated at our lending segment. Net cash provided by investing activities for the year ended December 31, 2016 was $29,526,000 compared to $64,272,000 in the corresponding period in 2015. The decrease was primarily due to a $55,506,000 decrease in proceeds from the sale of assets held for sale, an increase in loans funded of $36,153,000, an increase in the change in restricted cash of $26,841,000 primarily related to reserves funded in connection with our six mortgage loan agreements entered into in June 2016, an increase of $8,800,000 in additions to investments in real estate, and a decrease of $6,480,000 in principal collected on loans. These decreases were partially offset by an increase of $86,782,000 in proceeds from the sale of two hotel properties in February and July 2016, compared to the sale of an office property in November 2015, an increase of $11,143,000 relating to an acquisition in 2015 compared to no use of proceeds in 2016 for acquisitions, and an increase of $1,109,000 in other investing activity.
Our cash flows from financing activities are generally impacted by borrowings and capital activities. Net cash used in financing activities for the year ended December 31, 2016 was $77,522,000 compared to $28,287,000 in the corresponding period in 2015. We had net borrowings, inclusive of secured borrowings of the lending business, of $292,491,000 for the year ended December 31, 2016, compared to $60,633,000 in the corresponding period in 2015. Deferred loan costs of $1,994,000 were paid during the year ended December 31, 2016 primarily related to the $392,000,000 mortgage loans compared to $3,596,000 paid during the corresponding period in 2015 primarily related to the unsecured term loan facility. In addition, the total cash used related to repurchase of our Common Stock during 2016 was $290,134,000. We funded the tender offer using available cash from asset sales and borrowings on our unsecured credit facility and we funded the repurchase using proceeds from the six mortgage loans obtained in June 2016. Proceeds from the issuance of our Series A Preferred Units consisting of Series A Preferred Stock and associated Series A Preferred Warrants were $1,434,000, while cash used for payment of deferred stock offering costs were $1,960,000 for the year ended December 31, 2016. During the year ended December 31, 2016, dividends of $77,316,000 were sourced from net cash provided by operating activities of $51,873,000 and net proceeds from sale of real estate properties of $94,568,000, while during the year ended December 31, 2015, dividends of $85,389,000 were sourced from net cash provided by operating activities of $77,035,000 and principal collected on loans, net of loans funded, of $10,102,000.
82
Summarized Contractual Obligations, Commitments and Contingencies
The following summarizes our contractual obligations at December 31, 2017:
Payments Due by Period | |||||||||||||||||||
Contractual Obligations | Total | 2018 | 2019 - 2020 | 2021 - 2022 | Thereafter | ||||||||||||||
(in thousands) | |||||||||||||||||||
Debt: | |||||||||||||||||||
Mortgages payable | $ | 416,300 | $ | — | $ | — | $ | 679 | $ | 415,621 | |||||||||
Other principal (1) | 197,070 | — | — | 170,000 | 27,070 | ||||||||||||||
Secured borrowings (2) | 20,691 | 536 | 1,511 | 1,647 | 16,997 | ||||||||||||||
Interest and fees: | |||||||||||||||||||
Debt (3) | 207,343 | 25,716 | 50,380 | 46,380 | 84,867 | ||||||||||||||
Other Contractual Obligations: | |||||||||||||||||||
Borrower advances | 4,091 | 4,091 | — | — | — | ||||||||||||||
Loan commitments | 16,054 | 16,054 | — | — | — | ||||||||||||||
Tenant improvements | 23,836 | 20,757 | 3,079 | — | — | ||||||||||||||
Operating leases (4) | 359 | 253 | 106 | — | — | ||||||||||||||
Total contractual obligations | $ | 885,744 | $ | 67,407 | $ | 55,076 | $ | 218,706 | $ | 544,555 | |||||||||
(1) | Represents the junior subordinated notes and unsecured term loan facility. |
(2) | Principal payments on secured borrowings are generally dependent upon cash flows received from the underlying loans. Our estimate of their repayment is based on scheduled principal payments on the underlying loans. Our estimate will differ from actual amounts to the extent we experience prepayments and/or loan liquidations or charge-offs. No payment is due unless payments are received from the borrowers on the underlying loans. Excludes deferred premiums which do not represent a future outlay of cash since they are amortized over the life of the loan as a reduction to interest expense. |
(3) | Excludes premiums and discounts. For the mortgages payable, the interest expense is calculated based on the effective interest rate on the related debt. For our unsecured credit facility, we use the balance outstanding and the applicable rates in effect at December 31, 2017 to calculate interest expense and unused commitment fees. For our unsecured term loan facility, the impact of the interest rate swap contracts is incorporated. For our secured borrowings related to our government guaranteed loans, we use the variable rate in effect at December 31, 2017. |
(4) | Represents future minimum lease payments under our operating leases for office space. |
Off Balance Sheet Arrangements
At December 31, 2017, we did not have any off-balance sheet arrangements.
Critical Accounting Policies and Estimates and Recently Issued Accounting Pronouncements
The discussion and analysis of our historical financial condition and results of operations is based upon our consolidated financial statements, which have been prepared in accordance with GAAP. The preparation of financial statements in accordance with GAAP requires us to make estimates and assumptions that affect the reported amounts of assets and liabilities and the disclosure of contingent assets and liabilities at the date of the financial statements and the reported amounts of revenues and expenses during the reporting period. While we believe that our estimates are based on reasonable assumptions and judgments at the time they are made, some of our assumptions, estimates and judgments will inevitably prove to be incorrect. As a result, actual results could differ from our estimates, and those differences could be material.
We believe the following critical accounting policies, among others, affect our more significant estimates and assumptions used in preparing our consolidated financial statements. For a discussion of recently issued accounting literature, see Note 2 to our consolidated financial statements included in this Annual Report on Form 10-K.
83
Investments in Real Estate
We apply the acquisition method to all acquired real estate investments. The purchase consideration of the real estate, which for real estate acquired on or after October 1, 2017 includes the transaction costs incurred in connection with such acquisitions, is recorded at fair value to the acquired tangible assets, consisting primarily of land, land improvements, building and improvements, tenant improvements, and furniture, fixtures, and equipment, and identified intangible assets and liabilities, consisting of the value of acquired above-market and below-market leases, in-place leases and ground leases, if any, based in each case on their respective fair values. Loan premiums, in the case of above-market rate loans, or loan discounts, in the case of below-market rate loans, are recorded based on the fair value of any loans assumed in connection with acquiring the real estate.
The fair value of the tangible assets of an acquired property is determined by valuing the property as if it were vacant, and the "as-if-vacant" value is then allocated to land (or acquired ground lease if the land is subject to a ground lease), land improvements, building and improvements, and tenant improvements based on management's determination of the relative fair values of these assets. Management determines the as-if-vacant fair value of a property using methods similar to those used by independent appraisers. Factors considered by management in performing these analyses include an estimate of carrying costs during the expected lease-up periods considering current market conditions and costs to execute similar leases. In estimating carrying costs, management includes real estate taxes, insurance and other operating expenses, and estimates of lost rental revenue during the expected lease-up periods based on current market demand. Management also estimates costs to execute similar leases, including leasing commissions, legal, and other related costs.
In allocating the purchase consideration of the identified intangible assets and liabilities of an acquired property, above-market, below-market, and in-place lease values are recorded based on the present value (using an interest rate that reflects the risks associated with the leases acquired) of the difference between (i) the contractual amounts to be paid pursuant to the in-place leases and (ii) management's estimate of fair market lease rates for the corresponding in-place leases measured over a period equal to the remaining non-cancelable term of the lease, and for below-market leases, over a period equal to the initial term plus any below-market fixed-rate renewal periods. Acquired above-market and below-market leases are amortized and recorded to rental and other property income over the initial terms of the respective leases.
The aggregate value of other acquired intangible assets, consisting of in-place leases and tenant relationships, is measured by the estimated cost of operations during a theoretical lease-up period to replace in-place leases, including lost revenues and any unreimbursed operating expenses, plus an estimate of deferred leasing commissions for in-place leases. The value of in-place leases is amortized to expense over the remaining non-cancelable periods of the respective leases. If a lease is terminated prior to its stated expiration, all unamortized amounts relating to that lease are written-off.
Real estate acquisitions are recorded at cost as of the acquisition date. Costs related to the acquisition of properties are expensed as incurred for acquisitions that occurred prior to October 1, 2017. For acquisitions occurring on or after October 1, 2017, we will conduct an analysis to determine if the acquisition constitutes a business combination or an asset purchase. If the acquisition constitutes a business combination, then transaction costs will be expensed as incurred, and if the acquisition constitutes an asset purchase, then transaction costs will be capitalized. Investments in real estate are stated at depreciated cost. Depreciation and amortization are recorded on a straight line basis over the estimated useful lives.
Improvements and replacements are capitalized when they extend the useful life, increase capacity, or improve the efficiency of the asset. Ordinary repairs and maintenance are expensed as incurred.
Investments in real estate are evaluated for impairment on a quarterly basis or whenever events or changes in circumstances indicate that the carrying amount of an asset may not be recoverable. Recoverability of assets to be held and used is measured by a comparison of the carrying amount to the future net cash flows, undiscounted and without interest, expected to be generated by the asset. If such assets are considered to be impaired, the impairment to be recognized is measured by the amount by which the carrying amount of the assets exceeds the estimated fair value of the assets. The estimated fair value of the asset group identified for step two of the impairment testing under GAAP is based on either the income approach with market discount rate, terminal capitalization rate and rental rate assumptions being most critical, or on the sales comparison approach to similar properties. Assets to be disposed of are reported at the lower of the carrying amount or fair value, less costs to sell. We recognized impairment of long-lived assets of $13,100,000, $0 and $0 during the years ended December 31, 2017, 2016 and 2015, respectively. For further information regarding this impairment, refer to Note 3 to our consolidated financial statements included in this Annual Report on Form 10-K.
Estimates regarding the allocation of purchase price and the evaluation of impairment require significant judgment, and some of these estimates involve complex calculations. These assessments have a direct impact on our results of operations
84
as the allocations and evaluations impact the amount and timing of depreciation and amortization expense we reflect in our consolidated financial statements.
Loans Receivable
Our loans receivable are carried at their unamortized principal balance less unamortized acquisition discounts and premiums, retained loan discounts and loan loss reserves. For loans originated under the SBA 7(a) Program, we sell the portion of the loan that is guaranteed by the SBA. Upon sale of the SBA guaranteed portion of the loans, which are accounted for as sales, the unguaranteed portion of the loan retained by us is valued on a fair value basis and a discount is recorded as a reduction in basis of the retained portion of the loan.
At the Acquisition Date, the carrying value of our loans was adjusted to estimated fair market value and acquisition discounts of $33,907,000 were recorded, which are being accreted to interest and other income using the effective interest method. We sold substantially all of our commercial mortgage loans with unamortized acquisition discounts of $15,951,000 to an unrelated third-party in December 2015. Acquisition discounts of $1,301,000 remained as of December 31, 2017 which have not yet been accreted to income.
A loan receivable is generally classified as non-accrual (a "Non-Accrual Loan") if (i) it is past due as to payment of principal or interest for a period of 60 days or more, (ii) any portion of the loan is classified as doubtful or is charged-off or (iii) the repayment in full of the principal and/or interest is in doubt. Generally, loans are charged-off when management determines that we will be unable to collect any remaining amounts due under the loan agreement, either through liquidation of collateral or other means. Interest income, included in interest and other income or discontinued operations, on a Non-Accrual Loan is recognized on either the cash basis or the cost recovery basis.
On a quarterly basis, and more frequently if indicators exist, we evaluate the collectability of our loans receivable. Our evaluation of collectability involves judgment, estimates, and a review of the ability of the borrower to make principal and interest payments, the underlying collateral and the borrowers' business models and future operations in accordance with ASC 450-20, Contingencies—Loss Contingencies, and ASC 310-10, Receivables. For the years ended December 31, 2017, 2016 and 2015, we recorded $97,000, $(206,000) and $328,000 impairment (recovery) on our loans receivable, respectively. We establish a general loan loss reserve when available information indicates that it is probable a loss has occurred based on the carrying value of the portfolio and the amount of the loss can be reasonably estimated. Significant judgment is required in determining the general loan loss reserve, including estimates of the likelihood of default and the estimated fair value of the collateral. The general loan loss reserve includes those loans, which may have negative characteristics which have not yet become known to us. In addition to the reserves established on loans not considered impaired that have been evaluated under a specific evaluation, we establish the general loan loss reserve using a consistent methodology to determine a loss percentage to be applied to loan balances. These loss percentages are based on many factors, primarily cumulative and recent loss history and general economic conditions.
The evaluation of the collectability of our loans receivable is highly subjective and is based in part on factors that could differ materially from actual results in future periods. If these factors change, we may recognize an impairment loss, which could be material.
Accounts Receivable
Accounts receivable are carried net of the allowances for uncollectible amounts. Management's determination of the adequacy of these allowances is based primarily upon evaluation of historical loss experience, individual receivables, current economic conditions, and other relevant factors. The allowances are increased or decreased through the provision for bad debts. If our estimates of collectability differ from the cash received, the timing and amount of our reported revenue could be impacted.
Revenue Recognition
All leases are classified as operating leases and minimum rents are recognized on a straight-line basis over the terms of the leases when collectability is reasonably assured and the tenant has taken possession or controls the physical use of the leased asset. The excess of rents recognized over amounts contractually due pursuant to the underlying leases is recorded as deferred rent. If the lease provides for tenant improvements, we determine whether the tenant improvements, for accounting purposes, are owned by the tenant or us. When we are the owner of the tenant improvements, the tenant is not considered to have taken physical possession or have control of the physical use of the leased asset until the tenant improvements are substantially completed. When the tenant is considered the owner of the improvements, any tenant improvement allowance
85
that is funded is treated as incentive. Lease incentives paid to tenants are included in other assets and amortized as a reduction to rental revenue on a straight-line basis over the term of the related lease.
Reimbursements from tenants, consisting of amounts due from tenants for common area maintenance, real estate taxes, insurance, and other recoverable costs, are recognized as revenue in the period the expenses are incurred. Tenant reimbursements are recognized and presented on a gross basis when we are the primary obligor with respect to incurring expenses and with respect to having the credit risk.
In addition to minimum rents, certain leases provide for additional rents based upon varying percentages of tenants' sales in excess of annual minimums. Percentage rent is recognized once lessees' specified sales targets have been met.
We derive parking revenues from leases with third-party operators. Our parking leases provide for additional rents based upon varying percentages of tenants' sales in excess of annual minimums. Parking percentage rent is recognized once lessees' specific sales targets have been met.
Hotel room sales are recognized upon daily occupancy. Other hotel revenues are recognized as earned upon facility use or food and beverage consumption.
Interest income included in interest and other income or discontinued operations is comprised of interest earned on loans and our short-term investments and the accretion of net loan origination fees and discounts. Interest income on loans is accrued as earned with the accrual of interest suspended when the related loan becomes a Non-Accrual Loan.
Derivative Financial Instruments
As part of risk management and operational strategies, from time to time, we may enter into derivative contracts with various counterparties. All derivatives are recognized on the balance sheet at their estimated fair value. On the date that we enter into a derivative contract, we designate the derivative as a fair value hedge, a cash flow hedge, a foreign currency fair value or cash flow hedge, a hedge of a net investment in a foreign operation, or a trading or non-hedging instrument.
Changes in the estimated fair value of a derivative that is highly effective and that is designated and qualifies as a cash flow hedge, to the extent that the hedge is effective, are initially recorded in other comprehensive income, and are subsequently reclassified into earnings as a component of interest expense when the variability of cash flows of the hedged transaction affects earnings (e.g., when periodic settlements of a variable-rate asset or liability are recorded in earnings). Any hedge ineffectiveness (which represents the amount by which the changes in the estimated fair value of the derivative differ from the variability in the cash flows of the forecasted transaction) is recognized in current-period earnings as a component of interest expense. When an interest rate swap designated as a cash flow hedge no longer qualifies for hedge accounting, we recognize changes in estimated fair value of the hedge previously deferred to accumulated other comprehensive income, along with any changes in estimated fair value occurring thereafter, through earnings. We classify cash flows from interest rate swap agreements as net cash provided from operating activities on the consolidated statements of cash flows as our accounting policy is to present the cash flows from the hedging instruments in the same category in the consolidated statements of cash flows as the category for the cash flows from the hedged items.
Income Taxes
We have elected to be taxed as a REIT under the provisions of the Code. To the extent we qualify for taxation as a REIT, we generally will not be subject to a federal corporate income tax on our taxable income that is distributed to our stockholders. We may, however, be subject to certain federal excise taxes and state and local taxes on our income and property. If we fail to qualify as a REIT in any taxable year, we will be subject to federal income taxes at regular corporate rates (including any applicable alternative minimum tax) and will not be able to qualify as a REIT for four subsequent taxable years. In order to remain qualified as a REIT under the Code, we must satisfy various requirements in each taxable year, including, among others, limitations on share ownership, asset diversification, sources of income, and the distribution of at least 90% of our taxable income within the specified time in accordance with the Code.
We have wholly-owned taxable REIT subsidiaries which are subject to federal income taxes. The income generated from the taxable REIT subsidiaries is taxed at normal corporate rates. Deferred tax assets and liabilities are recognized for the future tax consequences attributable to differences between the financial statement carrying amounts of existing assets and liabilities and their respective tax bases.
86
We have established a policy on classification of penalties and interest related to audits of our federal and state income tax returns. If incurred, our policy for recording interest and penalties associated with audits will be to record such items as a component of general and administrative expense. Penalties, if incurred, will be recorded in general and administrative expense and interest paid or received will be recorded in interest expense or interest income, respectively, in our consolidated statements of operations.
ASC 740, Income Taxes, provides guidance for how uncertain tax positions should be recognized, measured, presented, and disclosed in the financial statements. ASC 740 requires the evaluation of tax positions taken or expected to be taken in the course of preparing our tax returns to determine whether the tax positions are "more likely than not" of being sustained by the applicable tax authority. Tax positions not deemed to meet the more-likely-than-not threshold would be recorded as a tax benefit or expense in the current period. We have reviewed all open tax years and concluded that the application of ASC 740 resulted in no material effect to our consolidated financial position or results of operations.
Assets Held for Sale and Discontinued Operations
We classify assets as held for sale, if material, when they meet the necessary criteria, which include: a) management commits to and actively embarks upon a plan to sell the assets, b) the assets to be sold are available for immediate sale in their present condition, c) the sale is expected to be completed within one year under terms usual and customary for such sales and d) actions required to complete the plan indicate that it is unlikely that significant changes to the plan will be made or that the plan will be withdrawn. We generally believe that we meet these criteria when the plan for sale has been approved by our Board of Directors, there are no known significant contingencies related to the sale and management believes it is probable that the sale will be completed within one year.
Assets held for sale are recorded at the lower of cost or estimated fair value less cost to sell. In addition, if we were to determine that the asset disposal associated with assets held for sale or disposed of represents a strategic shift, the revenues, expenses and net gain (loss) on dispositions would be recorded in discontinued operations for all periods presented through the date of the applicable disposition.
Redeemable Preferred Stock
Beginning on the date of original issuance of any given shares of Series A Preferred Stock, the holder of such shares has the right to require the Company to redeem such shares at a redemption price of 100% of the Series A Preferred Stock Stated Value, plus accrued and unpaid dividends, subject to the payment of a redemption fee until the fifth anniversary of such issuance. From and after the fifth anniversary of the date of the original issuance, the holder will have the right to require the Company to redeem such shares at a redemption price of 100% of the Series A Preferred Stock Stated Value, plus accrued and unpaid dividends, without a redemption fee, and the Company will have the right (but not the obligation) to redeem such shares at 100% of the Series A Preferred Stock Stated Value, plus accrued and unpaid dividends. The applicable redemption price payable upon redemption of any Series A Preferred Stock will be in cash or, on or after the first anniversary of the issuance of such shares of Series A Preferred Stock to be redeemed, in the Company's sole discretion, in cash or in equal value through the issuance of shares of Common Stock, based on the volume weighted average price of our Common Stock for the 20 trading days prior to the redemption. Since a holder of Series A Preferred Stock has the right to request redemption of such shares and redemptions prior to the first anniversary are to be paid in cash, we have recorded the activity related to our Series A Preferred Stock in temporary equity. We recorded the activity related to our Series A Preferred Warrants in permanent equity. On the first anniversary of the date of original issuance of a particular share of Series A Preferred Stock, we intend to reclassify such share of Series A Preferred Stock from temporary equity to permanent equity because the feature giving rise to temporary equity classification, the requirement to satisfy redemption requests in cash, lapses on the first anniversary date. Proceeds and expenses from the sale of the Series A Preferred Units are allocated to the Series A Preferred Stock and Series A Preferred Warrants using their relative fair values on the date of issuance.
Our Series L Preferred Stock is redeemable at the option of the holder or CIM Commercial. From and after the fifth anniversary of the date of original issuance of the Series L Preferred Stock, each holder will have the right to require the Company to redeem, and the Company will also have the option to redeem (subject to certain conditions), such shares of Series L Preferred Stock at a redemption price equal to the Series L Preferred Stock Stated Value, plus, provided certain conditions are met, all accrued and unpaid distributions. Notwithstanding the foregoing, a holder of shares of our Series L Preferred Stock may require us to redeem such shares at any time prior to the fifth anniversary of the date of original issuance of the Series L Preferred Stock if (1) we do not declare and pay in full the distributions on the Series L Preferred Stock for any annual period prior to such fifth anniversary (provided that the first distribution on the Series L Preferred Stock is expected to be payable in January 2019) or (2) we do not declare and pay all accrued and unpaid distributions on the Series L Preferred Stock for all past dividend periods prior to the applicable holder redemption date. The applicable redemption price payable upon redemption of
87
any Series L Preferred Stock will be made, in the Company's sole discretion, in the form of (A) cash in ILS at the then-current currency exchange rate determined in accordance with the Articles Supplementary defining the terms of the Series L Preferred Stock, (B) in equal value through the issuance of shares of Common Stock, with the value of such Common Stock to be deemed the lower of (i) our NAV per share of our Common Stock as most recently published by the Company as of the effective date of redemption and (ii) the volume-weighted average price of our Common Stock, determined in accordance with the Articles Supplementary defining the terms of the Series L Preferred Stock, or (C) in a combination of cash in ILS and our Common Stock, based on the conversion mechanisms set forth in (A) and (B), respectively. We recorded the activity related to our Series L Preferred Stock in permanent equity.
We have prepared an estimate of the per share value of our Series A Preferred Stock as of December 31, 2017 in order to assist broker-dealers that are participating in our public offering of Series A Preferred Stock in meeting their obligations under applicable FINRA rules. This estimate utilizes the fair values of our investments in real estate and certain lending assets as well as the carrying amounts of our other assets and liabilities, in each case as of December 31, 2017 (the "Calculated Assets and Liabilities"). Specifically, we divided (i) the fair values of our investments in real estate and certain lending assets and the carrying amounts of our other assets less the carrying amounts of our liabilities, in each case as of December 31, 2017, by (ii) the number of shares of Series A Preferred Stock outstanding as of that date. The fair values of our investments in real estate and certain lending assets were determined with material assistance from third-party appraisal firms engaged to value our investments in real estate and certain lending assets, in each case in accordance with standards set forth by the American Institute of Certified Public Accountants. We believe our methodology of determining the Calculated Assets and Liabilities conforms to standard industry practices and is reasonably designed to ensure it is reliable. Because the calculation resulted in an amount greater than the Series A Preferred Stock Stated Value, we have determined that the estimated value of our Series A Preferred Stock, as of December 31, 2017, is $25.00 per share, plus accrued and unpaid dividends.
Dividends
Holders of Series A Preferred Stock are entitled to receive, if, as and when authorized by our Board of Directors, and declared by us out of legally available funds, cumulative cash dividends on each share of Series A Preferred Stock at an annual rate of 5.5% of the Series A Preferred Stock Stated Value (i.e., the equivalent of $0.34375 per share per quarter). Dividends on each share of Series A Preferred Stock begin accruing on, and are cumulative from, the date of issuance. Dividends are payable on the 15th day of the month, or if such day is not a business day, on the first business day thereafter, following the quarter for which the dividend was declared. We expect to pay dividends on our Series A Preferred Stock quarterly, unless our results of operations, our general financing conditions, general economic conditions, applicable provisions of MGCL or other factors make it imprudent to do so. The timing and amount of such dividends will be determined by our Board of Directors, in its sole discretion, and may vary from time to time. Cash dividends declared on our Series A Preferred Stock for the years ended December 31, 2017 and 2016 consist of the following:
Aggregate | ||||||||
Declaration Date | Payment Date | Number of Shares | Dividends Declared | |||||
(in thousands) | ||||||||
December 6, 2017 | January 16, 2018 | 1,285,304 | $ | 249 | ||||
September 7, 2017 | October 16, 2017 | 568,921 | $ | 138 | ||||
June 12, 2017 | July 17, 2017 | 308,775 | $ | 72 | ||||
March 8, 2017 | April 17, 2017 | 144,698 | $ | 31 | ||||
December 6, 2016 | January 17, 2017 | 61,435 | $ | 9 | ||||
On March 6, 2018, we declared a dividend of $0.34375 per share of our Series A Preferred Stock, or portion thereof for issuances during the period from January 1, 2017 to March 31, 2017, to be paid on April 16, 2018 to the holders of Series A Preferred Stock of record at the close of business on April 5, 2018.
Holders of Series L Preferred Stock are entitled to receive, if, as and when authorized by our Board of Directors, and declared by us out of legally available funds, cumulative cash dividends on each share of Series L Preferred Stock at an annual rate of 5.5% of the Series L Preferred Stock Stated Value (i.e., the equivalent of $1.56035 per share per year). Dividends on each share of Series L Preferred Stock are cumulative from the date of issuance. Cash dividends on shares of Series L Preferred Stock are paid annually, with the first distribution expected to be payable in January 2019 for the period from the date of issuance through December 31, 2018. If the Company fails to timely declare distributions or fails to timely pay distributions on
88
the Series L Preferred Stock, the annual dividend rate of the Series L Preferred Stock will temporarily increase by 1.0% per year, up to a maximum rate of 8.5%.
Holders of our Common Stock are entitled to receive dividends, if, as and when authorized by the Board of Directors and declared by us. In determining our dividend policy, the Board of Directors considers many factors including the amount of cash resources available for dividend distributions, capital spending plans, cash flow, financial position, applicable requirements of the MGCL, any applicable contractual restrictions, and future growth in net asset value and cash flow per share prospects. Consequently, the dividend rate on a quarterly basis does not necessarily correlate directly to any individual factor. There can be no assurance that the future dividends declared by our Board of Directors will not differ materially from historical dividend levels. Dividends per share of Common Stock declared during the years ended December 31, 2017 and 2016 consist of the following:
Declaration Date | Payment Date | Type (1) | Dividend Per Common Share | |||||
December 18, 2017 | January 11, 2018 | Special Cash | $ | 0.73000 | ||||
December 6, 2017 | December 28, 2017 | Regular Quarterly | $ | 0.12500 | ||||
September 7, 2017 | September 25, 2017 | Regular Quarterly | $ | 0.12500 | ||||
June 12, 2017 | June 27, 2017 | Special Cash | $ | 1.98000 | ||||
June 12, 2017 | June 27, 2017 | Regular Quarterly | $ | 0.12500 | ||||
April 5, 2017 | April 24, 2017 | Special Cash | $ | 0.28000 | ||||
March 8, 2017 | March 27, 2017 | Regular Quarterly | $ | 0.21875 | ||||
December 6, 2016 | December 23, 2016 | Regular Quarterly | $ | 0.21875 | ||||
September 12, 2016 | September 28, 2016 | Regular Quarterly | $ | 0.21875 | ||||
June 10, 2016 | June 28, 2016 | Regular Quarterly | $ | 0.21875 | ||||
March 8, 2016 | March 29, 2016 | Regular Quarterly | $ | 0.21875 | ||||
(1) | Urban II, an affiliate of CIM REIT and CIM Urban, waived its right to receive the April 24, 2017, June 27, 2017, and January 11, 2018 special cash dividends. |
On March 6, 2018, we declared a common share dividend of $0.12500 per share of Common Stock, to be paid on March 29, 2018 to stockholders of record at the close of business on March 16, 2018.
89
Item 7A. Quantitative and Qualitative Disclosures About Market Risk
The fair value of our mortgages payable is sensitive to fluctuations in interest rates. Discounted cash flow analysis is generally used to estimate the fair value of our mortgages payable, using rates ranging from 4.15% to 4.28% at December 31, 2017 and 4.60% to 4.72% at December 31, 2016. Mortgages payable with book values of $414,760,000 and $530,793,000 as of December 31, 2017 and 2016, respectively, have fair values of $413,819,000 and $516,892,000, respectively.
Our future income, cash flow and fair values relevant to financial instruments are dependent upon prevalent market interest rates. Market risk refers to the risk of loss from adverse changes in market prices and interest rates. We are exposed to market risk in the form of changes in interest rates and the potential impact such changes may have on the cash flows from our floating rate debt or the fair values of our fixed rate debt. At December 31, 2017 and 2016 (excluding premiums, discounts, debt issuance costs and any impact related to the interest rate swaps), $416,300,000 (or 65.7%) and $532,437,000 (or 54.8%) of our debt, respectively, was fixed rate mortgage loans, and $217,761,000 (or 34.3%) and $439,969,000 (or 45.2%), respectively, was floating rate borrowings. Based on the level of floating rate debt outstanding at December 31, 2017 and 2016, and before the impact of the interest rate swaps, a 12.5 basis point change in LIBOR would result in an annual impact to our earnings of $272,000 and $550,000, respectively. We calculate interest rate sensitivity by multiplying the amount of floating rate debt by the respective change in rate. The sensitivity analysis does not take into consideration possible changes in the balances or fair value of our floating rate debt or the impact of interest rate swaps.
In order to manage financing costs and interest rate exposure related to our unsecured term loan facility, on August 13, 2015, we entered into interest rate swap agreements with multiple counterparties. These swap agreements became effective on November 2, 2015. These interest rate swaps effectively convert the interest rate on the term loan facility into a fixed weighted average rate of 1.563% plus the credit spread, which was 1.60% at December 31, 2017 and 2016, or an all-in rate of 3.16% until May 8, 2020. On August 3, 2017, we repaid $65,000,000 of outstanding borrowings on our unsecured term loan facility. In connection with such paydown, we terminated three interest rate swaps with an aggregate notional value of $65,000,000. In addition, on November 29, 2017, we repaid $150,000,000 of outstanding borrowings on our unsecured term loan facility. In connection with such paydown, we terminated four interest rate swaps with an aggregate notional value of $150,000,000. Our use of these derivative instruments to hedge exposure to changes in interest rates exposes us to credit risk from the potential inability of our counterparties to perform under the terms of the agreements. We attempt to minimize this credit risk by contracting with what we believe to be high-quality financial counterparties. For a description of our derivative contracts, see Note 13 to our consolidated financial statements in Item 15 of this report.
Item 8. Financial Statements and Supplementary Data
The information required by this Item is incorporated herein by reference to the Financial Statements and Auditors' Report beginning on page F-1.
Item 9. Changes in and Disagreements with Accountants on Accounting and Financial Disclosure
None.
Item 9A. Controls and Procedures
Evaluation of Disclosure Controls and Procedures
As of December 31, 2017, we carried out an evaluation, under the supervision and with the participation of our management, including our Principal Executive Officer and Principal Financial Officer, regarding the effectiveness of the design and operation of our disclosure controls and procedures (as defined in Rules 13a-15(e) and 15d-15(e) under the Exchange Act) at the end of the period covered by this report. Based on that evaluation, the Chief Executive Officer and Chief Financial Officer concluded, as of that time, that our disclosure controls and procedures were effective in ensuring that information required to be disclosed by us in the reports that we file or submit to the SEC under the Exchange Act is recorded, processed, summarized and reported within the time periods specified by the SEC's rules and forms and include controls and procedures designed to ensure the information required to be disclosed by the Company in such reports is accumulated and communicated to management, including our Chief Executive Officer and our Chief Financial Officer, as appropriate, to allow timely decisions regarding required disclosure.
90
Management's Report on Internal Control Over Financial Reporting
Management is responsible for establishing and maintaining adequate internal control over financial reporting as defined in Rule 13a-15(f) under the Exchange Act. Our internal control over financial reporting is designed to provide reasonable assurance regarding the reliability of financial reporting and the preparation of financial statements for external purposes in accordance with generally accepted accounting principles. We reviewed the results of management's assessment with the Audit Committee of the Board of Directors.
Management assessed the effectiveness of the Company's internal control over financial reporting as of December 31, 2017. In making this assessment, management used the criteria set forth by the Committee of Sponsoring Organizations of the Treadway Commission in Internal Control—Integrated Framework (2013). Based on their assessment, management determined that as of December 31, 2017, the Company's internal control over financial reporting was effective based on those criteria.
The effectiveness of the Company's internal control over financial reporting as of December 31, 2017 has been audited by BDO USA, LLP, an independent registered public accounting firm as stated in their report which appears herein.
91
Report of Independent Registered Public Accounting Firm
Shareholders and Board of Directors
CIM Commercial Trust Corporation
Dallas, TX
Opinion on Internal Control over Financial Reporting
We have audited CIM Commercial Trust Corporation and its subsidiaries’ (the “Company’s”) internal control over financial reporting as of December 31, 2017, based on criteria established in Internal Control - Integrated Framework (2013) issued by the Committee of Sponsoring Organizations of the Treadway Commission (the “COSO criteria”). In our opinion, the Company maintained, in all material respects, effective internal control over financial reporting as of December 31, 2017, based on the COSO criteria.
We also have audited, in accordance with the standards of the Public Company Accounting Oversight Board (United States (“PCAOB”), the consolidated balance sheets of the Company and subsidiaries as of December 31, 2017 and 2016, the related consolidated statements of operations and comprehensive income, stockholders’ equity, and cash flows for each of the three years in the period ended December 31, 2017, and the related notes and schedules and our report dated March 12, 2018 expressed an unqualified opinion thereon.
Basis for Opinion
The Company’s management is responsible for maintaining effective internal control over financial reporting and for its assessment of the effectiveness of internal control over financial reporting, included in the accompanying Item 9A, Management’s Report on Internal Control over Financial Reporting. Our responsibility is to express an opinion on the Company’s internal control over financial reporting based on our audit. We are a public accounting firm registered with the PCAOB and are required to be independent with respect to the Company in accordance with U.S. federal securities laws and the applicable rules and regulations of the Securities and Exchange Commission and the PCAOB.
We conducted our audit of internal control over financial reporting in accordance with the standards of the PCAOB. Those standards require that we plan and perform the audit to obtain reasonable assurance about whether effective internal control over financial reporting was maintained in all material respects. Our audit included obtaining an understanding of internal control over financial reporting, assessing the risk that a material weakness exists, and testing and evaluating the design and operating effectiveness of internal control based on the assessed risk. Our audit also included performing such other procedures as we considered necessary in the circumstances. We believe that our audit provides a reasonable basis for our opinion.
Definition and Limitations of Internal Control over Financial Reporting
A company’s internal control over financial reporting is a process designed to provide reasonable assurance regarding the reliability of financial reporting and the preparation of financial statements for external purposes in accordance with generally accepted accounting principles. A company’s internal control over financial reporting includes those policies and procedures that (1) pertain to the maintenance of records that, in reasonable detail, accurately and fairly reflect the transactions and dispositions of the assets of the company; (2) provide reasonable assurance that transactions are recorded as necessary to permit preparation of financial statements in accordance with generally accepted accounting principles, and that receipts and expenditures of the company are being made only in accordance with authorizations of management and directors of the company; and (3) provide reasonable assurance regarding prevention or timely detection of unauthorized acquisition, use, or disposition of the company’s assets that could have a material effect on the financial statements.
Because of its inherent limitations, internal control over financial reporting may not prevent or detect misstatements. Also, projections of any evaluation of effectiveness to future periods are subject to the risk that controls may become inadequate because of changes in conditions, or that the degree of compliance with the policies or procedures may deteriorate.
/s/ BDO USA, LLP
Los Angeles, CA
March 12, 2018
92
Limitations on the Effectiveness of Controls
Our management, including our Chief Executive Officer and Chief Financial Officer, does not expect that our disclosure controls or our internal controls will prevent all errors and fraud. A control system, no matter how well designed and operated, can provide only reasonable, not absolute, assurance that the control system's objectives will be met. Further, the design of a control system must reflect the fact that there are resource constraints, and the benefits of controls must be considered relative to their costs. Because of the inherent limitations in all control systems, no evaluation of controls can provide absolute assurance that all control issues and instances of fraud, if any, have been detected. These inherent limitations include the realities that judgments in decision making can be faulty, and that breakdowns can occur because of simple error or mistake. Controls can also be circumvented by the individual acts of some persons, by collusion of two or more people, or by management override of the controls. The design of any system of controls is based in part upon certain assumptions about the likelihood of future events, and there can be no assurance that any design will succeed in achieving its stated goals under all potential future conditions. Over time, controls may become inadequate because of changes in conditions or deterioration in the degree of compliance with associated policies or procedures. Because of the inherent limitations in a cost effective control system, misstatements due to error or fraud may occur and not be detected.
Changes in Internal Control Over Financial Reporting
There have been no changes in our internal control over financial reporting that occurred during the quarter ended December 31, 2017 that have materially affected, or are reasonably likely to materially affect, our internal control over financial reporting.
Item 9B. Other Information
None.
93
PART III
Item 10. Directors, Executive Officers and Corporate Governance
Board of Directors
Our Board of Directors consists of seven directors who were each elected to serve for a one-year term and until their successors are elected and qualify.
Set forth below are the names of the persons nominated as directors, their ages, their offices in the Company, if any, their principal occupations or employment for at least the past five years, the length of their tenure as directors and the names of other public companies in which such persons hold or have held directorships during the past five years.
Name | Age | Position | ||
Douglas Bech | 72 | Director (independent) | ||
Robert Cresci | 74 | Director (independent) | ||
Kelly Eppich | 61 | Director | ||
Frank Golay, Jr. | 70 | Director (independent) | ||
Shaul Kuba | 55 | Director | ||
Richard Ressler | 59 | Director and Chairman of the Board of Directors | ||
Avi Shemesh | 56 | Director | ||
Douglas Bech has served as a director of the Company since March 2014 and as founder and Chief Executive Officer of Raintree Resorts International and its predecessors since August 1997. Raintree owns and operates upscale vacation ownership resorts in Mexico, the United States and Canada. Prior to founding Raintree, Mr. Bech practiced securities and corporate finance law from 1970 until 1997. Mr. Bech also has served as a director of j2 Global since November 2000. From August 1988 through November 2000, he served as a director of eFax.com, a company j2 Global acquired in November 2000. Mr. Bech also serves as lead director of HollyFrontier Corporation, which was the result of a merger of Frontier Oil Corporation and Holly Corporation in July 2011 and had previously served as a director of Frontier Oil Corporation since 1993. Mr. Bech also served, until February 1, 2016, as an independent trust manager of Moody National REIT II, Inc., a registered, non‑traded real estate investment trust that acquires only limited service hotels in the United States. Mr. Bech’s previous work as a securities and corporate finance lawyer, as a director of other diverse public companies, and his current experience as a chief executive officer of a private enterprise engaged in marketing, management and consumer finance in three different countries, provides expertise on corporate governance, legal matters and finance, as well as a general business management perspective to the Board of Directors.
Robert Cresci has served as a director of the Company since March 2014 and has been a Managing director of Pecks Management Partners Ltd., an investment management firm, since 1990. He currently serves on the boards of j2 Global, Luminex Corporation, OFS Capital Corporation, Hancock Park Corporate Income, Inc. and Presbia PLC. Mr. Cresci previously served on the board of Continucare Corporation until 2011 and the board of Sepracor, Inc. until 2009. Mr. Cresci’s extensive knowledge of investment management and accounting from his experience with Pecks Management Partners and his experience serving on other public company boards of directors provides expertise regarding investment strategies, accounting issues and public company matters.
Kelly Eppich has served as a director of the Company since March 2014 and is a Principal, Investments of CIM Group, L.P. As a Principal, he serves on CIM Group, L.P.’s Investment Committee and Credit Committee. Prior to joining CIM Group, L.P. in 2002, Mr. Eppich served as the Chief Financial Officer of Decurion Corporation/Pacific Theatres. In that capacity, he was responsible for all areas of finance, accounting, treasury, risk management and information systems development of Decurion Corporation/Pacific Theatres. From 1989 to 2000, he was Vice President Finance / Controller and then Vice President of Business Development, Finance and Administration for the International Recreation Enterprises Division of Warner Brothers. Prior to joining Warner Brothers, Mr. Eppich served as an Assistant Vice President and Assistant Corporate Controller for Maxicare Health Plans, Inc. (1986-1989) and worked for Ernst & Young (1979-1986). Mr. Eppich received a B.S. degree in Finance with an emphasis in Accounting from Weber State University. Mr. Eppich has in‑depth knowledge of CIM Urban’s business and operations and has significant experience in the preparation and analysis of financial statements, strategic planning and financial management.
94
Frank Golay, Jr. has served as a director of the Company since March 2014 and has been associated with Sullivan & Cromwell LLP since September 1977. From 1977 to 1985 he was an associate located in the firm’s New York and London offices. From 1985 to 1988 he was a partner in the firm’s New York office, and from 1988 to 2008 he served as partner in Sullivan & Cromwell LLP’s Los Angeles office. Mr. Golay retired at the end of 2008. Afterwards, he was of counsel to the firm. But in 2016, wishing more completely to retire from the practice of law, Mr. Golay became a senior counsel to Sullivan & Cromwell LLP, and changed his state bar memberships to retired/inactive. Prior to his retirement, Mr. Golay’s practice included numerous securities offerings, including real estate investment trust (“REIT”) offerings, merger and acquisition transactions and general corporate advice. He represented both issuers and underwriters, and companies and their financial advisors. Mr. Golay’s clients included Orchard Capital Corporation, j2 Global and CIM Group, L.P. Mr. Golay’s extensive legal experience in the securities, mergers and acquisitions, and general corporate fields provides the Board of Directors with a strong resource on a variety of important strategic matters.
Shaul Kuba has served as a director of the Company since March 2014. Mr. Kuba, Co‑Founder and a Principal of CIM Group, L.P., has been an active real asset owner and operator for over 26 years. Since co‑founding CIM Group, L.P. in 1994, Mr. Kuba has been an integral part of building CIM Group, L.P.’s platforms which own and operate $27.5 billion of assets.1 As a Principal and Head of CIM Group, L.P.’s Development Group, he is actively involved in the development, redevelopment and repositioning of CIM Group, L.P.’s real estate assets including notable projects such as 432 Park Avenue in New York City. Additionally, Mr. Kuba is instrumental in sourcing new transactions and establishing and maintaining relationships with national and regional retailers, hospitality brands and restaurateurs. He serves on CIM Group, L.P.’s Investment Committee and Asset Management Committee and provides guidance on the diverse ideas across CIM’s platforms. Prior to CIM Group, L.P., Mr. Kuba was involved in a number of successful entrepreneurial real estate activities including co‑founding Dekel Development, which developed a variety of commercial and residential properties in Los Angeles. Mr. Kuba has in‑depth knowledge of CIM Urban’s business and operations and has significant experience with the real estate development process and sourcing new transactions as a result of his experience with CIM Group, L.P., including as Co‑Founder thereof.
1Assets Owned and Operated represents (i) (a) for real assets, the aggregate total gross assets (GAV) at fair value, including the shares of such assets owned by joint venture partners and co-investments, owned and operated by CIM on behalf of partners (including where CIM invests alongside for its own account) and co-investors, whether or not CIM has investment discretion or (b) for operating companies, the aggregate GAV less debt, including the shares of such assets owned by joint venture partners and co-investments, owned and operated by CIM on behalf of partners (including where CIM invests alongside for its own account) and co-investors, whether or not CIM has investment discretion (not in duplication of the assets described in (i)(a)), plus (ii) the aggregate unfunded commitments, as of December 31, 2017 (the “Report Date”). The GAV is calculated in accordance with U.S. generally accepted accounting principles on a fair value basis (the “Book Value”) and generally represents the investment’s third-party appraised value as reported within the applicable fund’s unaudited financial statements as of the Report Date, but in the case of CIM’s Cole Net-Lease Asset strategy described below GAV or Book Value generally represents undepreciated cost (as reflected in SEC-filed financial statements) as of September 30, 2017. The only investment currently held by CIM REIT consists of shares of our Common Stock; the Book Value of CIM REIT is determined by assuming the underlying assets of CMCT are liquidated based upon the third-party appraised value. CIM does not presently view the price of our Common Stock to be a meaningful indication of the fair value of CIM REIT’s interest in CMCT due to the fact that the publicly-traded shares of our Common Stock represent less than 4% of the outstanding Common Stock of CMCT and are thinly-traded. Assets Owned and Operated also includes the assets owned/operated by CIM’s Cole Net-Lease Asset strategy (formerly Cole Capital), which was under contract to be acquired by a CIM affiliate as of the Report Date and subsequently closed on February 1, 2018. The assets owned/operated by CIM’s Cole Net-Lease Asset strategy represent approximately $7.6 billion of CIM's reported Assets Owned and Operated of $27.5 billion. Equity Owned and Operated, representing the NAV (as defined below) before incentive fee allocation, plus binding unfunded commitments, is $15.5 billion as of the Report Date. NAV is based upon the aggregate amounts that would be distributable assuming a “hypothetical liquidation” on the date of determination, assuming that: (x) investments are sold at their Book Value (as defined above); (y) debts are paid and other assets are collected; and (z) appropriate adjustments and/or allocations between equity investors are made in accordance with applicable documents, in each case as determined in accordance with applicable accounting guidance. Assets Owned and Operated for CMMT Partners, L.P. (which represents assets under management), a perpetual-life real estate debt fund, is $0.3 billion as of the Report Date and Equity Owned and Operated for CMMT Partners, L.P. (which represents equity under management), is $0.3 billion as of the Report Date.
95
Richard Ressler has served as a director of the Company since March 2014. Mr. Ressler is the founder and President of Orchard Capital Corporation (“Orchard Capital”), a firm through which Mr. Ressler oversees companies in which Orchard Capital or its affiliates invest. Through his affiliation with Orchard Capital, Mr. Ressler serves in various senior capacities with, among others, CIM Group, LLC (together with its controlled affiliates, “CIM”), a vertically-integrated owner and operator of real assets, Orchard First Source Asset Management, LLC (together with its controlled affiliates, “OFSAM”), a full-service provider of capital and leveraged finance solutions to U.S. corporations, and OCV Management, LLC (“OCV”), an investor, owner and operator of technology companies. Mr. Ressler also serves as a board member for various public and private companies in which Orchard Capital or its affiliates invest, including as chairman of j2 Global, Inc. (NASDAQ “JCOM”) and director of Presbia PLC (NASDAQ “LENS”). Mr. Ressler served as Chairman and CEO of JCOM from 1997 to 2000 and, through an agreement with Orchard Capital, currently serves as its non-executive Chairman. Mr. Ressler has served as a director of LENS since January 2015 and as chairman of CMCT since 2014. Further, since February, 2018, Mr. Ressler has served as the Chief Executive Officer and a director of each of Cole Office & Industrial REIT (CCIT III), Inc. (“CCIT III”), which invests primarily in single-tenant, mission-critical office and industrial properties that are essential to the day-to-day operations of a company, Cole Credit Property Trust IV, Inc. (“CCIT IV”), which invests primarily in income-producing, necessity single-tenant retail properties and anchored shopping centers subject to long-term net leases with national or regional creditworthy tenants, and Cole Real Estate Income Strategy (Daily NAV), Inc. (“INAV”), which primarily invests in income producing necessity commercial real estate across the retail, office and industrial sectors. Each of CCIT III, CCIT IV and INAV is a public, non-listed REIT that is operated by an affiliate of CIM. Mr. Ressler co-founded CIM in 1994 and, through an agreement with Orchard Capital, chairs its executive, investment, allocation and asset management committees and serves on its credit committee. CIM Investment Advisors, LLC, an affiliate of CIM, is registered with the United States Securities and Exchange Commission as a registered investment adviser. Mr. Ressler co-founded the predecessor of OFSAM in 2001 and, through an agreement with Orchard Capital, chairs its executive committee. OFS Capital Management, LLC, an affiliate of OFSAM, is registered with the United States Securities and Exchange Commission as a registered investment adviser. Mr. Ressler co-founded OCV in 2016 and, through an agreement with Orchard Capital, chairs its executive committee. OCV is a relying adviser of OFS Capital Management, LLC. Prior to founding Orchard Capital, from 1988 until 1994, Mr. Ressler served as Vice Chairman of Brooke Group Limited, the predecessor of Vector Group, Ltd. (NYSE “VGR”) and served in various executive capacities at VGR and its subsidiaries. Prior to VGR, Mr. Ressler was with Drexel Burnham Lambert, Inc., where he focused on merger and acquisition transactions and the financing needs of middle-market companies. Mr. Ressler began his career in 1983 with Cravath, Swaine and Moore, working on public offerings, private placements, and merger and acquisition transactions. Mr. Ressler holds a B.A. from Brown University, and J.D. and M.B.A. degrees from Columbia University. Mr. Ressler has in‑depth knowledge of CIM Urban’s business and operations and has extensive experience with, and knowledge of, business management and finance as a result of his experience with CIM, including as Co‑Founder thereof.
Avi Shemesh has served as a director of the Company since March 2014. Mr. Shemesh, Co‑Founder and a Principal of CIM Group, L.P., has been an active real asset owner and operator for over 26 years. Since co‑founding CIM Group, L.P. in 1994, Mr. Shemesh has been instrumental in building CIM Group, L.P.’s real estate and infrastructure platforms which own and operate $27.5 billion of assets2. As a Principal and Head of CIM Group, L.P.’s Investments Group, he is actively involved in the acquisition process and provides guidance on the diverse ideas across CIM Group, L.P.’s platforms. He serves on CIM Group, L.P.’s Investment Committee and Asset Management Committee. Additionally, Mr. Shemesh is responsible for the day‑to‑day operations of CIM Group, L.P., including strategic initiatives, asset management and leasing and partner & co-investor relations and product management. Since February 2018, Mr. Shemesh has served as the Chief Executive Officer and a director of Cole Office & Industrial REIT (CCIT II), Inc. (“CCIT II”), which invests primarily in single-tenant, income-producing, necessity office and industrial properties that are leased to creditworthy tenants under long term leases, and the Chief Executive Officer of Cole Credit Property Trust V, Inc. (“CCPT V”), which invests primarily in income-producing, single-tenant necessity retail and anchored shopping centers subject to long-term net leases with national or regional creditworthy tenants. In addition, Mr. Shemesh has been appointed to the board of directors of CCPT V effective March 12, 2018. Each of CCIT II and CCPT V is a public, non-listed REIT that is operated by an affiliate of CIM. Prior to CIM Group, L.P., Mr. Shemesh was involved in a number of successful entrepreneurial real estate activities, including co‑founding Dekel Development, which developed a variety of commercial and residential properties in Los Angeles. Mr. Shemesh has in‑depth knowledge of CIM Urban’s business and operations and has significant experience with the real estate operating process and strategic planning as a result of his experience with CIM Group, L.P., including as Co‑Founder thereof.
2 Please refer to footnote 1 on page 95.
96
Executive Officers
Set forth below are the names of the persons who are our executive officers as of the date of this Annual Report on Form 10-K, their ages and their positions with the Company.
Name | Age | Position | ||
Charles E. Garner II | 55 | Chief Executive Officer | ||
Jan F. Salit | 67 | President and Secretary | ||
David Thompson | 54 | Chief Financial Officer | ||
Charles E. Garner II has been Chief Executive Officer of the Company since August 20, 2014. Mr. Garner serves as a Principal, Investments of CIM Group, L.P. As a Principal, Investments, he is involved in the investment and asset management process across CIM Group, L.P.’s platforms, and serves on CIM Group, L.P.’s Investment and Asset Management Committees. Prior to joining CIM Group, L.P. in 2003, Mr. Garner worked closely with CIM Group, L.P. in various capacities since 1996, including originating Federal Realty Investment Trust’s partnership with CIM Group, L.P. and managing that relationship for Federal Realty Investment Trust. Mr. Garner has been involved in billions of dollars of real estate transactions including the acquisition, joint venture investment, disposition and equity and debt financing of more than 100 properties. He began his career as a C.P.A. in the Washington, D.C. office of PricewaterhouseCoopers and has held various transactional positions with Federal Realty, Walker & Dunlop and The Stout & Teague Companies. Mr. Garner received a B.S. degree in Management with a concentration in Accounting from Tulane University’s A.B. Freeman School of Business.
Jan F. Salit has been President and Secretary of the Company since March 2014. Mr. Salit serves on CIM Group, L.P.’s Credit Committee. Mr. Salit was Chief Executive Officer, Chairman of the Board of Directors and Secretary of PMC Commercial Trust from October 2012 to March 2014, Treasurer of PMC Commercial Trust from October 2008 to March 2014, Chief Operating Officer of PMC Commercial Trust from October 2008 to October 2012, Executive Vice President of PMC Commercial Trust from June 1993 to October 2012, and Chief Investment Officer and Assistant Secretary of PMC Commercial Trust from January 1994 to October 2012. He was also Executive Vice President of PMC Capital, Inc. (an affiliate of PMC Commercial Trust that merged into PMC Commercial Trust in February 2004) from May 1993 to February 2004 and Chief Investment Officer and Assistant Secretary of PMC Capital, Inc. from March 1994 to February 2004. From 1979 to 1992, Mr. Salit was employed by Glenfed Financial Corporation and its predecessor company Armco Financial Corporation, a commercial finance company, holding various positions, including Executive Vice President and Chief Financial Officer. Mr. Salit began his career in the Investment Department of Mutual Benefit Life from 1972 to 1979. In addition, he was an adjunct professor at Montclair State University and Fairleigh Dickenson University from 1976 to 1979. Mr. Salit received his B.A. degree from Michigan State University and his MBA degree from New York University.
David Thompson has been Chief Financial Officer of the Company since March 2014. Mr. Thompson is also a Principal, Chief Financial Officer of CIM Group, L.P. and serves on CIM Group, L.P.’s Investment Committee. He joined CIM Group, L.P. in 2009. Prior to joining CIM Group, L.P. in 2009, Mr. Thompson spent fifteen years with Hilton Hotels Corporation, most recently as Senior Vice President and Controller, where he was responsible for worldwide financial reporting, financial planning and analysis, internal control and technical accounting compliance. Mr. Thompson’s experience includes billions of dollars of real estate acquisitions and dispositions, as well as significant capital markets experience. He began his career as a C.P.A. in the Los Angeles office of Arthur Andersen & Co. Mr. Thompson received a B.S. degree in Accounting from the University of Southern California.
Section 16(a) Beneficial Ownership Reporting Compliance
Section 16(a) of the Exchange Act requires our directors and executive officers, and persons who own more than 10% of a registered class of our equity securities, to file reports of holdings and transactions in our securities with the SEC. Executive officers, directors and any person who beneficially owns 10% or more of the shares of any class of our equity securities are required by applicable regulations to furnish us with copies of all Section 16(a) forms they file with the SEC.
Based solely upon a review of these reports, we believe that all SEC filing requirements applicable to our directors, executive officers and beneficial owners of more than 10% of our Common Stock were satisfied on a timely basis during the fiscal year ended December 31, 2017.
97
Corporate Governance
Audit Committee
The Company has a standing Audit Committee that oversees the accounting and financial reporting processes as well as legal, compliance and risk management matters. The Audit Committee consists of Mr. Cresci (chairman), Mr. Bech and Mr. Golay. The Audit Committee is comprised entirely of directors who meet the independence and financial literacy requirements of The Nasdaq Stock Market LLC, as well as the standards established under the Sarbanes‑Oxley Act of 2002. In addition, the Board of Directors has determined that Mr. Cresci qualifies as an “audit committee financial expert” as defined in SEC rules.
Code of Ethics
The Board of Directors has adopted a Code of Business Conduct and Ethics that applies to all directors, officers and employees of the Company, the Operator and the Administrator, including the Company’s principal executive officer and principal financial and accounting officer (the “Code of Ethics”). If the Board of Directors amends any provisions of the Code of Ethics that applies to the Company’s principal executive officer or senior financial officers or grants a waiver in favor of any such persons, the Company intends to satisfy its disclosure requirements by disclosing the amendment or waiver on a Form 8‑K filed with the SEC within four business days following such amendment or waiver.
The Company’s Code of Ethics may be found on the Company’s website at http://shareholders.cimcommercial.com corporate-overview/corporate-governance under the “Corporate Overview/Corporate Governance” section.
Item 11. Executive Compensation
Compensation Committee Interlocks and Insider Participation
Following the Merger, the Board of Directors decided not to establish a separate compensation committee, but rather determined that the full Board of Directors would assume the responsibilities that were historically carried out by the compensation committee of the Board of Directors prior to the Merger. During the year ended December 31, 2017, no officer or employee of the Company participated in deliberations of the Board of Directors concerning executive officer compensation.
Compensation Committee Report
The Board of Directors has reviewed and discussed the Compensation Discussion and Analysis with management. Based upon that review and discussion, the Board of Directors determined that the Compensation Discussion and Analysis be included herein.
Board of Directors
Douglas Bech
Robert Cresci
Kelly Eppich
Frank Golay, Jr.
Shaul Kuba
Richard Ressler
Avi Shemesh
98
Compensation Discussion and Analysis
2017 Named Executive Officers
The following individuals were our named executive officers for 2017:
Name | Title | |
Charles E. Garner II | Chief Executive Officer | |
Jan F. Salit | President and Secretary | |
David Thompson | Chief Financial Officer | |
Role of Management in the Compensation Setting Process
The Chairman of the Board of Directors discussed historical compensation practices and the Company’s annual incentive compensation history with Mr. Salit. The Chairman considered Mr. Salit’s input and made recommendations to the Board of Directors with respect to the amounts of Mr. Salit’s 2017 annual incentive compensation and the Board of Directors made the final determination of those amounts.
Stockholder Advisory Vote
Because stockholders expressed support for the Company’s executive compensation programs in 2017 by approving, on an advisory basis, the Company’s 2016 executive compensation and because Mr. Salit’s terms of employment are governed by the terms of his existing employment agreement, the Board of Directors did not make any changes to the Company’s executive compensation programs in 2017.
Compensation Policies and Practices In Relation to Risk Management
As of December 31, 2017, the Company had two employees. One such employee, Mr. Salit, is jointly employed by the Company and CIM SBA, and the terms of his employment are governed by his existing employment agreement with the Company. The other employee is an officer. Accordingly, the Board of Directors does not believe that the Company’s compensation policies and practices are reasonably likely to have a material adverse effect on the Company.
Objectives of Our Executive Compensation Program
Our executive compensation system is designed to promote the Company’s financial and operational success by (i) attracting, motivating and assisting in the retention of highly qualified and talented executives, including our named executive officers, who will enable us to perform better than our competitors and drive long‑term stockholder value; and (ii) reinforcing desired financial business results to our executives, including our named executive officers, and motivating them to make decisions that produce such results. We believe that our executive compensation system appropriately links pay to both the Company’s and the executive’s performance and is well aligned with the long‑term interests of our stockholders. The Board of Directors does not allocate a fixed percentage to any specific component of compensation, but works with management to design an overall compensation structure that best serves its goals and appropriately motivates our executive officers to provide outstanding service to the Company. We believe that our executive compensation objectives have resulted in executive compensation decisions that have appropriately incentivized (without undue risk) the achievement of financial goals that have benefited our Company and our stockholders and are expected to drive long‑term stockholder value over time.
2017 Executive Compensation
Mr. Garner and Mr. Thompson are employed by an affiliate of the Operator and the Administrator and their compensation is determined by, and paid to them directly by, such affiliate. The Company did not pay Mr. Garner, our Chief Executive Officer, and Mr. Thompson, our Chief Financial Officer, any compensation in 2017. Therefore, their compensation is not discussed in this Annual Report on Form 10-K.
Mr. Salit, our President and Secretary was jointly employed by the Company and CIM SBA during the fiscal year ended December 31, 2017. His cash compensation was paid by CIM SBA, which in turn was partially reimbursed by the Company. Accordingly, the Board of Directors determined the amount of Mr. Salit's 2017 compensation from the Company, which was based on his employment agreement with the Company.
99
2017 Base Salary
The Board of Directors did not make any adjustments to Mr. Salit’s base salary of $450,000 for 2017.
2017 Annual Cash Incentive
The Board of Directors did not award any cash incentive to Mr. Salit for 2017. This determination did not reflect the Company’s performance or the performance of the lending division or Mr. Salit. Rather, in 2017 (as in 2016), Mr. Salit devoted part of his time to matters relating to CIM (from which the Company has received and will receive reimbursement). Based on an allocation of Mr. Salit’s time spent between matters for the Company and CIM, it was determined that Mr. Salit’s base salary adequately compensated him for his time and effort with respect to the Company. Mr. Salit’s aggregate salary in 2017 from the Company and CIM SBA Staffing was $650,000 (including a bonus from CIM SBA but excluding “All Other Compensation” as described in "—Summary Compensation Table" below); aggregate reimbursable costs due the Company was $227,362 for Mr. Salit’s time spent on matters relating to CIM during the year ended December 31, 2017.
Other Compensation Plans
A subsidiary of the Company maintained a defined contribution plan that included a defined contribution component and a discretionary contribution component (the “401(k) and Defined Contribution Plan”) that was intended to satisfy the tax qualification requirements of Section 401(a) of the Code. This plan was transferred to CIM SBA effective January 1, 2015. CIM SBA’s full time employees, including Mr. Salit, were eligible to participate in the 401(k) and Defined Contribution Plan and were permitted to contribute a portion of their eligible compensation (subject to the applicable statutory limits of $18,000, or $24,000 for eligible participants who are 50 or older, in calendar year 2017). While CIM SBA may (but is not required to) make “matching contributions” under the 401(k) and Defined Contribution Plan, none were made during fiscal 2017. In lieu of matching contributions, CIM SBA elected to make a discretionary contribution of $260,000 in the aggregate, during the year ended December 31, 2017, which amount was paid by the Company and of which approximately $46,000 was reimbursed and will be reimbursed by CIM Group on behalf of CIM SBA. Contributions to the 401(k) and Defined Contribution Plan are available to all full‑time employees of CIM SBA who meet the eligibility requirements of the plan. In general, vesting in the Defined Contribution Plan occurs ratably between the second and sixth year of employment.
Severance and Change in Control Agreements
Mr. Salit is party to an executive employment agreement (an “Executive Employment Agreement”) with the Company, which amended and restated his previous employment agreement and became effective upon the consummation of the Merger on March 11, 2014. The Executive Employment Agreement continues to govern the terms of employment for Mr. Salit following the Merger. Under the Executive Employment Agreement, Mr. Salit is entitled to a minimum annual salary of $425,000. The Company’s Board of Directors may, in its discretion, increase the annual base salary and may also consider bonus compensation. The Executive Employment Agreement also entitles Mr. Salit to health insurance coverage for himself, his wife and his dependent children, and a monthly automobile allowance of $550.
If Mr. Salit is unable to perform his services due to illness or total incapacity (to be determined based on standards similar to those utilized by the U.S. Social Security Administration), the Executive Employment Agreement entitles Mr. Salit to receive his full salary for up to one year of such incapacity, reduced by any amounts paid by any Company‑provided insurance. If Mr. Salit’s total incapacity continues beyond one year and he is not thereafter able to devote full time to his employment with the Company, then his employment and his Executive Employment Agreement will terminate.
If Mr. Salit dies during his employment with the Company before reaching the age of seventy, his estate will be entitled to a payment of two times his annual salary plus unused vacation pay. The Company‑paid amount of such death benefits will be made over the course of twelve months, offset by any amounts paid under any group life insurance issued by the Company.
In the event that Mr. Salit’s employment is terminated by the Company for Cause, or if Mr. Salit resigns his employment with the Company, he will be entitled to receive only his base salary then in effect, prorated to the date of termination, and all benefits accrued through the date of termination. If the Company terminates Mr. Salit’s employment without Cause, Mr. Salit will be entitled to receive a severance payment in an amount equal to his annual base salary then in effect, to be paid out in a lump sum on the 60th day following his termination date, conditioned upon the execution of a general release of claims.
100
For purposes of the Executive Employment Agreement, “Cause” means (1) the intentional, unapproved material misuse of corporate funds, (2) professional incompetence or (3) acts or omissions constituting gross negligence or willful misconduct of executive’s obligations or otherwise relating to the business of the Company. Assuming all vacation days are taken and all reasonable business expenses have been reimbursed, based on the Company’s best estimate, assuming the applicable scenario occurred on December 31, 2017, the Company would have owed Mr. Salit $900,000 (representing two times his annual base salary) if he died, $450,000 (representing his annual base salary) if he became disabled or if the Company terminated his employment without cause.
Tax Considerations
Section 162(m) of the Code places a limit of $1,000,000 on the amount of compensation that the Company may deduct for federal income tax purposes in any one year with respect to the Company’s Chief Executive Officer, and the next three highest paid executives (other than the Chief Financial Officer). However, in 2017 and prior years, performance‑based compensation that meets certain requirements is excluded from the $1,000,000 limitation. In 2017, the Board of Directors was aware of this tax law, but believed that our named executive officer did not receive compensation at or near the $1,000,000 maximum (as determined under the Internal Revenue Code). The Board of Directors is cognizant of and will continue to consider the impact of the Tax Cuts and Jobs Act of 2017, which was passed in December 2017 and which expanded the number of individuals covered by Internal Revenue Code Section 162(m) and eliminated the exception for performance-based compensation (generally effective for the 2018 tax year). As in the past, the Board of Directors reserves the right to make compensation payments that are nondeductible.
Anti—Pledging/Anti—Hedging Restrictions
The Company believes it is inappropriate for any director, officer or employee to enter into speculative transactions in the Company’s equity securities and, therefore, prohibits all hedging transactions. The Company’s Trading Policy prohibits all hedging transactions and only permits pledging of Company securities with the approval of the attorney designated under the insider trading policy as the legal representative for purposes of the policy.
101
Summary Compensation Table
The table below sets forth information concerning compensation earned for services rendered to the Company by each of our named executive officers for the years ended December 31, 2017, 2016 and 2015, respectively. As described in this Compensation Discussion and Analysis, Messrs. Garner and Thompson are employed by an affiliate of the Operator and the Administrator and their compensation is determined by, and paid to them directly by, such affiliate. The Company did not pay Messrs. Garner and Thompson any compensation in 2017. The Company has entered into an employment agreement with Mr. Salit, which is described above under “Severance and Change in Control Agreement.” As described in this Compensation Discussion and Analysis, Mr. Salit’s cash compensation was paid by CIM SBA in 2017, and the Company reimbursed CIM SBA for such compensation. As described above, of the compensation paid to CIM SBA, approximately $227,362, which relates to services that Mr. Salit performed for CIM, has been or will be reimbursed to the Company.
Name and Principal Position | Year | Salary (1) | Bonus (2) | Stock Awards (3)(4) | All Other Compensation (5) | Total (6) | ||||||||||||||||
Charles E. Garner II | 2017 | $ | — | $ | — | $ | — | $ | — | $ | — | |||||||||||
Chief Executive Officer | 2016 | $ | — | $ | — | $ | — | $ | — | $ | — | |||||||||||
2015 | $ | — | $ | — | $ | — | $ | — | $ | — | ||||||||||||
David Thompson | 2017 | $ | — | $ | — | $ | — | $ | — | $ | — | |||||||||||
Chief Financial Officer | 2016 | $ | — | $ | — | $ | — | $ | — | $ | — | |||||||||||
2015 | $ | — | $ | — | $ | — | $ | — | $ | — | ||||||||||||
Jan F. Salit | 2017 | $ | 450,000 | $ | 200,000 | $ | — | $ | 54,777 | $ | 704,777 | |||||||||||
President and Secretary | 2016 | $ | 450,000 | $ | 150,000 | $ | 679,626 | $ | 306,810 | $ | 1,586,436 | |||||||||||
2015 | $ | 450,000 | $ | 950,000 | $ | 16,980 | $ | 54,085 | $ | 1,471,065 | ||||||||||||
(1) | Mr. Salit performed services for CIM from time to time in 2017 and 2016. CIM SBA will reimburse or has reimbursed the Company in an amount of approximately $227,362 and $90,000, for the years ended December 31, 2017 and December 31, 2016, respectively, for the time that Mr. Salit spent on matters relating to CIM. |
(2) | Mr. Salit’s 2015 annual incentive included a special bonus equal to $800,000 in connection with his work on the sale of substantially all of our commercial mortgage loans. Mr. Salit did not receive any cash incentive for 2017 as described in “Compensation Discussion and Analysis—2017 Annual Cash Incentive.” The bonus of $200,000 for 2017 included in the table was paid by CIM SBA, but was not reimbursed by the Company. |
(3) | On January 4, 2016, pursuant to Mr. Salit’s employment agreement, which became effective on the closing date of the Merger, the Company issued Mr. Salit 43,734 shares of common stock under the 2015 Equity Incentive Plan as a retention bonus (as Mr. Salit was not entitled to any disability, death or severance payment on such date). The closing price of the common stock was $15.54 on the day prior to the issuance, and the shares vested immediately. With respect to annual equity awards, the Board has granted long-term incentive awards in the form of restricted stock awards to Mr. Salit on a discretionary basis, and did not grant any such awards to Mr. Salit in 2016 and 2017. The terms of the restricted share awards granted to Mr. Salit in 2015 provide for dividends on non‑vested restricted shares to be paid to the holder. |
(4) | Represents the grant date fair value of stock awards for the applicable fiscal year in accordance with ASC 718, Compensation—Stock Compensation ("ASC 718"). |
(5) | See table below for a breakdown of all other compensation. |
(6) | Mr. Salit’s total compensation for 2017 reflects a bonus in the amount of $200,000 that was paid by CIM SBA, but was not reimbursed by the Company. |
102
All other compensation paid to the Company’s named executive officers in the table above consisted of the following:
Name | Year | Unused Vacation Pay | Tax Qualified 401(k) Plan | Car Allowance | Other | Total | ||||||||||||||||
Jan F. Salit | 2017 | $ | 21,635 | $ | 26,542 | (1) | $ | 6,600 | $ | — | $ | 54,777 | ||||||||||
2016 | $ | 21,635 | $ | 25,801 | $ | 6,600 | $ | 252,774 | (2) | $ | 306,810 | |||||||||||
2015 | $ | 21,635 | $ | 25,850 | $ | 6,600 | $ | — | $ | 54,085 | ||||||||||||
(1) | CIM Group on behalf of CIM SBA has reimbursed and will reimburse the Company for a portion of the amounts for the years ended December 31, 2017 and 2016 for the time that Mr. Salit spent on matters relating to CIM. The reimbursable amount is included as part of the amounts identified in Note 1 to the Summary Compensation Table above. |
(2) | The Company paid $252,774 for payroll taxes on Mr. Salit’s behalf in January 2016. |
Grants of Plan‑Based Awards
There were no grants of equity awards to our named executive officers during 2017.
Outstanding Equity Awards at Fiscal Year End
There were no outstanding equity awards as of December 31, 2017.
Option Exercises and Shares Vested in 2017
The following table sets forth, for each of our named executive officers, information regarding the value of restricted share awards that vested during the fiscal year ended December 31, 2017.
Share Awards | ||||||
Name | Number of Shares Acquired on Vesting (1) | Value Realized on Vesting (2) | ||||
Jan F. Salit | 334 | $ | 5,210 | |||
(1) | Based on 334 restricted shares granted on March 6, 2015, which vested on March 6, 2017. |
(2) | Calculated as the aggregate market value on the date of vesting of the restricted stock with respect to which restrictions lapsed (or restricted shares became vested) during 2017 (calculated before payment of any applicable withholding or other income taxes). The per share market price of the restricted shares at the close of business on the last business day prior to vesting was $15.60 on March 3, 2017. |
Equity Incentive Plan Compensation and Awards
The equity awards that have been granted to Mr. Salit at the discretion of the Board were not governed by the employment agreements, but rather through our 2005 Equity Incentive Plan, which terminated during 2015.
Director Compensation
The Company uses a combination of cash and share‑based compensation to attract and retain qualified candidates to serve on the Board of Directors. In setting directors’ compensation, the Board of Directors considers, among other things, the substantial time commitment on the part of the Board of Directors in fulfilling their duties as well as the skill level it requires of directors. In addition, directors are reimbursed by the Company for their expenses related to attending board or committee meetings.
103
The independent directors are compensated according to the following schedule:
Annual board retainer | $ | 50,000 | |
Annual audit committee chairman retainer | $ | 20,000 | |
The annual board retainer and the annual audit committee chairman retainer are payable quarterly in advance.
The compensation arrangement for the independent directors in 2018 is expected to be substantially the same as the compensation arrangement for the independent directors in 2017, which is as set forth in the table below.
Name | Fees Earned or Paid in Cash | Share Awards (1) | Total | |||||||||
Robert Cresci | $ | 70,000 | $ | 50,002 | $ | 120,002 | ||||||
Douglas Bech | $ | 50,000 | $ | 50,002 | $ | 100,002 | ||||||
Frank Golay, Jr. | $ | 50,000 | $ | 50,002 | $ | 100,002 | ||||||
(1) | Represents the grant date fair value of the restricted shares or share options, as the case may be, for purposes of ASC 718. Each of the independent directors received a grant of 3,195 restricted shares of Common Stock on June 9, 2017, which shares will vest one year from the date of grant. The grant date fair value of the restricted shares is based on the per share closing price of our Common Stock on June 9, 2017, which was $15.65. |
104
Item 12. Security Ownership of Certain Beneficial Owners and Management and Related Stockholder Matters
Security Ownership of Our Directors and Executive Officers
The following table sets forth information regarding the beneficial ownership of our Common Stock, Series A Preferred Stock, and Series L Preferred Stock as of March 2, 2018 by (1) each named executive officer, (2) each current director and (3) all executive officers and directors as a group.
Common Stock | Series A Preferred Stock | Series L Preferred Stock | |||||||||||||||
Name of Beneficial Owner (1) | No. of Shares | Percent of Class | No. of Shares | Percent of Class | No. of Shares | Percent of Class | |||||||||||
Charles E. Garner II | 9,779 | * | 20,000 | 1.32 | % | — | — | ||||||||||
Jan F. Salit | 52,601 | (2) | * | — | — | — | — | ||||||||||
David Thompson | — | — | — | — | — | — | |||||||||||
Richard Ressler | 42,012,342 | (3) | 95.95 | % | — | — | — | — | |||||||||
Avi Shemesh | 41,997,296 | (3) | 95.92 | % | — | — | — | — | |||||||||
Shaul Kuba | 41,997,296 | (3) | 95.92 | % | — | — | — | — | |||||||||
Kelly Eppich | 5,163 | * | — | — | — | — | |||||||||||
Douglas Bech | 15,587 | * | — | — | — | — | |||||||||||
Robert Cresci | 10,828 | * | — | — | — | — | |||||||||||
Frank Golay, Jr. | 10,587 | * | — | — | — | — | |||||||||||
Directors and Executive Officers as a group (10 persons) | 42,116,887 | 96.19 | % | 20,000 | 1.32 | % | — | — | |||||||||
* | Less than 1%. |
(1) | The business address of Messrs. Garner, Salit, Bech, Cresci and Golay, for the purposes hereof, is c/o CIM Commercial Trust Corporation, 17950 Preston Road, Suite 600, Dallas, Texas 75252. The business address of Messrs. Thompson, Ressler, Shemesh, Kuba and Eppich, for the purposes hereof, is c/o CIM Group, LLC, 4700 Wilshire Boulevard, Los Angeles, California 90010. |
(2) | Mr. Salit has sole voting and investment power over these shares, which include 122 shares held in an IRA. |
(3) | CIM Group, LLC is the sole manager of CIM Urban Partners GP, LLC, which is the sole managing member of Urban Partners II, LLC, which has the power to vote and dispose of these shares. Shaul Kuba, Richard Ressler and Avi Shemesh may be deemed to beneficially own these shares by virtue of their positions with CIM Group, LLC. Messrs. Ressler, Shemesh and Kuba may also be deemed to beneficially own 353,944 shares owned by CIM Service Provider, LLC of which CIM Group, LLC is the sole managing member. Messrs. Ressler, Shemesh and Kuba have shared voting and investment power over all of these shares. Each of Messrs. Ressler, Shemesh and Kuba disclaims beneficial ownership of all of these shares except to the extent of his pecuniary interest therein. |
105
Beneficial Owners of More than 5% of our Common Stock
The following table sets forth certain information regarding the beneficial ownership of our Common Stock, Series A Preferred Stock and Series L Preferred Stock based on filings with the SEC as of March 2, 2018 by each person known by us to beneficially own more than 5% of our Common Stock.
Common Stock | Series A Preferred Stock | Series L Preferred Stock | ||||||||||||||
Name and Address of Beneficial Owner(1) | No. of Shares | Percent of Class | No. of Shares | Percent of Class | No. of Shares | Percent of Class | ||||||||||
Urban Partners II, LLC c/o CIM Group 4700 Wilshire Boulevard Los Angeles, California 90010 | 41,627,739 | 95.07 | % | — | — | — | — | |||||||||
Richard Ressler(1) | 42,012,342 | (2) | 95.95 | % | — | — | — | — | ||||||||
Avi Shemesh(1) | 41,997,296 | (2) | 95.92 | % | — | — | — | — | ||||||||
Shaul Kuba(1) | 41,997,296 | (2) | 95.92 | % | — | — | — | — | ||||||||
(1) | The business address of Messrs. Ressler, Shemesh and Kuba, for the purposes hereof, is c/o CIM Group, 4700 Wilshire Boulevard, Los Angeles, California 90010. |
(2) | CIM Group, LLC is the sole manager of CIM Urban Partners GP, LLC, which is the sole managing member of Urban Partners II, LLC, which has the power to vote and dispose of these shares. Shaul Kuba, Richard Ressler and Avi Shemesh may be deemed to beneficially own these shares by virtue of their positions with CIM Group, LLC. Messrs. Ressler, Shemesh and Kuba may also be deemed to beneficially own 353,944 shares owned by CIM Service Provider, LLC of which CIM Group, LLC is the sole managing member. Messrs. Ressler, Shemesh and Kuba have shared voting and investment power over all of these shares. Each of Messrs. Ressler, Shemesh and Kuba disclaims beneficial ownership of all of these shares except to the extent of his pecuniary interest therein. |
Securities Authorized for Issuance Under Equity Compensation Plans
Please refer to "Securities Authorized for Issuance Under Equity Compensation Plans" in Item 5 of this Annual Report on Form 10-K.
Item 13. Certain Relationships and Related Transactions, and Director Independence
Review, Approval, and Ratification of Transactions with Related Persons
The Board of Directors has adopted a written related person transaction policy. Under the policy, a “Related Person Transaction” includes certain transactions, arrangements or relationships (or any series of similar transactions, arrangements or relationships) in which the Company (including any of its subsidiaries) was, is or will be a participant, and in which a related person had, has or will have a direct or indirect material interest.
A “Related Person” is:
• | Any person who was in any of the following categories during the applicable period: |
• | a director or nominee for director; |
• | any executive officer; or |
• | any immediate family member of a director or executive officer, or of any nominee for director, which means any child, stepchild, parent, stepparent, spouse, sibling, mother‑in‑law, father‑in‑law, son‑in‑law, daughter‑in‑law, brother‑in‑law, or sister‑in‑law of the director, executive officer, or nominee for director and any person (other than a tenant or employee) sharing the household of such security holder. |
106
• | Any person who was in any of the following categories when a transaction in which such person had a direct or indirect material interest occurred or existed: |
• | any person who is known to the Company to be the beneficial owner of more than 5% of our shares; and |
• | any immediate family member of any such security holder, which means any child, stepchild, parent, stepparent, spouse, sibling, mother‑in‑law, father‑in‑law, son‑in‑law, daughter‑in‑law, brother‑in‑law, or sister‑in‑law of such security holder and any person (other than a tenant or employee) sharing the household of such security holder. |
A person who has a position or relationship within a firm, corporation or other entity that engages in a transaction with the Company will not be deemed to have an “indirect material interest” within the meaning of “Related Person Transaction” when the interest arises only:
• | from such person’s position as a director of another corporation or organization that is a party to the transaction; or |
• | from the direct or indirect ownership by such person and all other persons specified in the definition of “Related Person” in the aggregate of less than 10% equity interest in another person (other than a partnership) which is a party to the transaction; or |
• | from both such position and ownership; or |
• | from such person’s position as a limited partner in a partnership in which the person and all other persons specified in the definition of “Related Person” have an interest of less than 10%, and the person is not a general partner of and does not hold another position in the partnership. |
Each of the Company’s executive officers is encouraged to help identify any potential Related Person Transaction.
If a new Related Person Transaction is identified, it will initially be brought to the attention of the Chief Financial Officer, who will then prepare a recommendation to the Board of Directors and/or a committee thereof regarding whether the proposed transaction is reasonable and fair to the Company.
A committee comprised solely of independent directors, who are also independent of the Related Person Transaction in question, will determine whether to approve a Related Person Transaction. In general, the committee will only approve or ratify a Related Person Transaction if it determines, among other things, that the Related Person Transaction is reasonable and fair to the Company.
Transactions with Related Persons
The CIM Management Entities provide property management, leasing, and development services to CIM Urban. The CIM Management Entities earned property management fees, which are included in rental and other property operating expenses, totaling $5,034,000 and $5,630,000 for the years ended December 31, 2017 and 2016, respectively. CIM Urban also reimbursed the CIM Management Entities $8,465,000 and $8,630,000 during the years ended December 31, 2017 and 2016, respectively, for the cost of on‑site personnel incurred on behalf of CIM Urban, which is included in rental and other property operating expenses. The CIM Management Entities earned leasing commissions of $982,000 and $2,522,000 for the years ended December 31, 2017 and 2016, respectively, which were capitalized to deferred charges. In addition, the CIM Management Entities earned construction management fees of $1,654,000 and $942,000 for the years ended December 31, 2017 and 2016, respectively, which were capitalized to investments in real estate.
On March 11, 2014, CIM Commercial and its subsidiaries entered into the Master Services Agreement with the Administrator pursuant to which the Administrator agrees to provide, or arrange for other service providers to provide, management and administrative services to CIM Commercial and its subsidiaries. Pursuant to the Master Services Agreement, we appointed an affiliate of CIM Group as the administrator of CIM Urban GP. Under the Master Services Agreement, CIM Commercial pays a base service fee (the “Base Service Fee”) to the Administrator initially set at $1,000,000 per year (subject to an annual escalation by a specified inflation factor beginning on January 1, 2015), payable quarterly in arrears. For the years ended December 31, 2017 and 2016, the Administrator earned a Base Service Fee of $1,060,000 and $1,043,000, respectively. In addition, pursuant to the terms of the Master Services Agreement, the Administrator may receive compensation and/or
107
reimbursement for performing certain services for CIM Commercial and its subsidiaries that are not covered under the Base Service Fee. During the years ended December 31, 2017 and 2016, such services performed by the Administrator included accounting, tax, reporting, internal audit, legal, compliance, risk management, IT, human resources and corporate communications. The Administrator’s compensation is based on the salaries and benefits of the employees of the Administrator and/or its affiliates who performed these services (allocated based on the percentage of time spent on the affairs of CIM Commercial and its subsidiaries). For the years ended December 31, 2017 and 2016, we expensed $3,065,000 and $3,120,000, respectively, for such services, which are included in asset management and other fees to related parties.
In May 2005, CIM Urban and CIM Urban REIT Management, L.P., each an affiliate of CIM REIT and CIM Group, entered into an Investment Management Agreement, pursuant to which CIM Urban engaged CIM Urban REIT Management L.P. to provide certain services to CIM Urban. CIM Investment Advisors, LLC, an affiliate of CIM REIT and CIM Group, registered with the SEC as an investment adviser and, in connection with such registration, CIM Urban entered into a new Investment Management Agreement with CIM Investment Advisors, LLC, in December 2015, on terms and in scope substantially similar to those in the previous Investment Management Agreement, and the previous Investment Management Agreement was terminated. The Operator operates CIM Urban’s real estate and other assets and has the power and authority to determine, and with full discretion to purchase, retain and dispose of such assets and to execute agreements relating thereto in accordance with the objectives, policies and restrictions set forth in the CIM Urban’s partnership agreement. For the years ended December 31, 2017 and 2016, the Operator earned asset management fees of $22,229,000 and $25,753,000, respectively.
On March 11, 2014, CIM Commercial entered into a Registration Rights and Lockup Agreement with Urban II pursuant to which Urban II is entitled to registration rights, subject to certain limitations, with respect to Common Stock it received in the Merger and the Common Stock issued upon conversion of the Preferred Shares it received in the Merger. Specifically, Urban II has eight demand registration rights (rights to require CIM Commercial to file a registration statement with the SEC). It also has certain piggyback and incidental registration rights. In accordance with such registration rights agreement, CIM Commercial filed a registration statement that was declared effective in May 2015. CIM Commercial bore the expenses incurred in connection with the filing of such registration statement in accordance with such registration rights agreement.
On January 1, 2015, CIM Commercial entered into a Staffing and Reimbursement Agreement with CIM SBA and our subsidiary, PMC Commercial Lending, LLC. The agreement provides that CIM SBA will provide personnel and resources to the Company and the Company will reimburse CIM SBA for the costs and expenses of providing such personnel and resources. For the years ended December 31, 2017 and 2016, the Company incurred expenses related to services subject to reimbursement by the Company under the agreement of $3,464,000 and $3,555,000, respectively, included as asset management and other fees to related parties for lending segment costs included in continuing operations, $433,000 and $411,000, respectively, for corporate services, which are included in asset management and other fees to related parties, and $0 and $550,000, respectively, which are included in discontinued operations. In addition, for the years ended December 31, 2017 and 2016, the Company deferred personnel costs of $429,000 and $249,000, respectively, associated with services provided for originating loans.
On October 1, 2015, an affiliate of CIM Group entered into a 5-year lease renewal with respect to a property owned by the Company. For the years ended December 31, 2017 and 2016, the Company recorded rental and other property income related to this tenant of $108,000 and $108,000, respectively.
On May 16, 2016, the Company commenced a cash tender offer to purchase up to 10,000,000 shares of Common Stock at a price of $21.00 per share. In connection with the tender offer, the Company repurchased, canceled and retired 10,000,000 shares of Common Stock for an aggregate purchase price of $210,000,000, excluding fees and expenses related to the tender offer, which were $301,000. Based on the actual total number of shares tendered, Urban II received $208,140,000 of the aggregate purchase price paid.
On September 14, 2016, the Company repurchased, in a privately negotiated transaction, canceled and retired 3,628,116 shares of Common Stock from Urban II. The aggregate purchase price was $79,819,000, or $22.00 per share.
On June 12, 2017, the Company repurchased, in a privately negotiated transaction, canceled and retired 26,181,818 shares of Common Stock from Urban II. The aggregate purchase price was $576,000,000, or $22.00 per share.
On December 18, 2017, the Company repurchased, in a privately negotiated transaction, canceled and retired 14,090,909 shares of Common Stock from Urban II. The aggregate purchase price was $310,000,000, or $22.00 per share.
On November 21, 2016, Charles E. Garner II, the Company’s Chief Executive Officer, purchased 20,000 shares of Series A Preferred Stock at $25.00 per share.
108
On December 29, 2016, the Company sold its commercial real estate lending subsidiary, which was classified as held for sale and had a carrying value of $27,567,000, which was equal to management’s estimate of fair value, to a fund operated by an affiliate of CIM Group. The Company did not recognize any gain or loss in connection with the transaction. Management’s estimate of fair value was determined with assistance from an independent third party valuation firm.
Item 14. Principal Accountant Fees and Services
Principal Accounting Firm Fees
Aggregate fees for services rendered to the Company for the years ended December 31, 2017 and 2016 by the Company’s principal accounting firm for such years, BDO, were as follows:
2017 | 2016 | |||||||
(in thousands) | ||||||||
Audit Fees (1) | $ | 1,074 | $ | 917 | ||||
Audit-Related Fees | — | — | ||||||
Tax Fees | — | — | ||||||
All Other Fees | — | — | ||||||
Total | $ | 1,074 | $ | 917 | ||||
(1) | Audit fees consisted of professional services performed in connection with (i) the audit of the Company’s annual financial statements and internal control over financial reporting, (ii) the statutory audit of the financial statements of a subsidiary of the Company, (iii) the review of financial statements included in its quarterly reports on Form 10‑Q (iv) procedures related to consents and assistance with and review of documents filed with the SEC and (v) other services related to (and necessary for) the audit of the Company’s financial statements. |
Pre‑Approval Policies
The Audit Committee's charter requires review and pre-approval by the Audit Committee of all audit and permissible non-audit services provided by our outside auditors. The Audit Committee pre-approved all audit services provided by our outside auditors during fiscal years 2017 and 2016 and the fees paid for such services. The Audit Committee may, in its discretion, delegate to one or more of its members the authority to pre-approve any audit or non-audit services to be performed by the independent auditors, provided that any such approvals are presented to the Committee at its next scheduled meeting.
109
PART IV
Item 15. Exhibits and Financial Statement Schedules
(a) 1. Financial Statements
The list of the financial statements filed as part of this Annual Report on Form 10-K is set forth on page F-1 herein.
2. Financial Statement Schedules
The list of the financial statement schedules filed as part of this Annual Report on Form 10-K is set forth on page F-1 herein.
Note: Other schedules are omitted because of the absence of conditions under which they are required or because the required information is given in the financial statements or notes thereto.
3. Exhibits
The following documents are included or incorporated by reference in this Annual Report on Form 10-K:
Exhibit No. | Document | |
2.1 | ||
2.2 | ||
3.1 | ||
3.1(a) | ||
3.1(b) | ||
3.1(c) | ||
3.2 | ||
3.3 | ||
3.4 | ||
4.1 | ||
4.2 | ||
4.3 | ||
4.4 | ||
110
4.5 | ||
+10.1 | ||
+10.2 | ||
+10.3 | ||
+10.4 | ||
+10.5 | ||
10.6 | ||
10.7 | ||
10.8 | ||
10.9 | ||
10.10 | ||
10.11 | ||
10.12 | ||
10.13 | ||
*10.14 | ||
10.15 | ||
10.16 | ||
10.17 | ||
111
10.18 | ||
10.19 | ||
*10.20 | ||
10.21 | ||
10.22 | ||
10.23 | ||
*21.1 | ||
*23.1 | ||
*24.1 | ||
*31.1 | ||
*31.2 | ||
*32.1 | ||
*32.2 | ||
* | Filed herewith. |
+ | Management contract or compensatory plan |
(b) | Exhibits |
The exhibits listed in Item 15(a)3 are incorporated by reference or attached hereto.
(c) | Excluded Financial Statements |
None.
Item 16. Form 10-K Summary
None.
112
SIGNATURES
Pursuant to the requirements of Section 13 or 15(d) of the Securities Exchange Act of 1934, the registrant has duly caused this report to be signed on its behalf by the undersigned, thereunto duly authorized.
CIM Commercial Trust Corporation | |||
Dated: | March 12, 2018 | By: | /s/ CHARLES E. GARNER II |
Charles E. Garner II | |||
Chief Executive Officer | |||
Dated: | March 12, 2018 | By: | /s/ DAVID THOMPSON |
David Thompson | |||
Chief Financial Officer | |||
POWERS OF ATTORNEY
KNOW ALL PERSONS BY THESE PRESENTS, that each person whose signature appears below constitutes and appoints Charles E. Garner II and David Thompson and each of them severally, his true and lawful attorney-in-fact with power of substitution and resubstitution to sign in his name, place and stead, in any and all capacities, to do any and all things and execute any and all instruments that such attorney may deem necessary or advisable under the Securities Exchange Act of 1934 and any rules, regulations and requirements of the U.S. Securities and Exchange Commission in connection with this Annual Report on Form 10-K and any and all amendments hereto, as fully for all intents and purposes as he might or could do in person, and hereby ratifies and confirms all said attorneys-in-fact and agents, each acting alone, and his substitute or substitutes, may lawfully do or cause to be done by virtue hereof.
Pursuant to the requirements of the Securities Exchange Act of 1934, this report has been signed by the following persons on behalf of the registrant and in the capacities and on the dates indicated.
Signature | Title | Date | ||
/s/ Charles E. Garner II | Chief Executive Officer (Principal Executive | March 12, 2018 | ||
Charles E. Garner II | Officer) | |||
/s/ David Thompson | Chief Financial Officer (Principal Financial | March 12, 2018 | ||
David Thompson | Officer and Principal Accounting Officer) | |||
/s/ Douglas Bech | Director | March 12, 2018 | ||
Douglas Bech | ||||
/s/ Robert Cresci | Director | March 12, 2018 | ||
Robert Cresci | ||||
/s/ Kelly Eppich | Director | March 12, 2018 | ||
Kelly Eppich | ||||
/s/ Frank Golay | Director | March 12, 2018 | ||
Frank Golay | ||||
/s/ Shaul Kuba | Director | March 12, 2018 | ||
Shaul Kuba | ||||
/s/ Richard Ressler | Director | March 12, 2018 | ||
Richard Ressler | ||||
/s/ Avraham Shemesh | Director | March 12, 2018 | ||
Avraham Shemesh | ||||
113
CIM COMMERCIAL TRUST CORPORATION AND SUBSIDIARIES
CONSOLIDATED FINANCIAL STATEMENTS
TABLE OF CONTENTS
Financial Statements | Page Number | |
F-1
Report of Independent Registered Public Accounting Firm
Shareholders and Board of Directors
CIM Commercial Trust Corporation
Dallas, TX
Opinion on the Consolidated Financial Statements
We have audited the accompanying consolidated balance sheets of CIM Commercial Trust Corporation (the “Company”) and subsidiaries as of December 31, 2017 and 2016, the related consolidated statements of operations and comprehensive income, stockholders’ equity, and cash flows for each of the three years in the period ended December 31, 2017, and the related notes and schedules (collectively referred to as the “consolidated financial statements”). In our opinion, the consolidated financial statements present fairly, in all material respects, the financial position of the Company and subsidiaries at December 31, 2017 and 2016, and the results of their operations and their cash flows for each of the three years in the period ended December 31, 2017, in conformity with accounting principles generally accepted in the United States of America.
We also have audited, in accordance with the standards of the Public Company Accounting Oversight Board (United States) (“PCAOB”), the Company's internal control over financial reporting as of December 31, 2017, based on criteria established in Internal Control - Integrated Framework (2013) issued by the Committee of Sponsoring Organizations of the Treadway Commission (“COSO”) and our report dated March 12, 2018 expressed an unqualified opinion thereon.
Basis for Opinion
These consolidated financial statements are the responsibility of the Company’s management. Our responsibility is to express an opinion on the Company’s consolidated financial statements based on our audits. We are a public accounting firm registered with the Public Company Accounting Oversight Board (United States) (“PCAOB”) and are required to be independent with respect to the Company in accordance with the U.S. federal securities laws and the applicable rules and regulations of the Securities and Exchange Commission and the PCAOB.
We conducted our audits in accordance with the standards of the PCAOB. Those standards require that we plan and perform the audit to obtain reasonable assurance about whether the consolidated financial statements are free of material misstatement, whether due to error or fraud.
Our audits included performing procedures to assess the risks of material misstatement of the consolidated financial statements, whether due to error or fraud, and performing procedures that respond to those risks. Such procedures included examining, on a test basis, evidence regarding the amounts and disclosures in the consolidated financial statements. Our audits also included evaluating the accounting principles used and significant estimates made by management, as well as evaluating the overall presentation of the consolidated financial statements. We believe that our audits provide a reasonable basis for our opinion.
/s/ BDO USA, LLP
We have served as the Company's auditor since 2014.
Los Angeles, CA
March 12, 2018
F-2
CIM COMMERCIAL TRUST CORPORATION AND SUBSIDIARIES
Consolidated Balance Sheets
(In thousands, except share and per share data)
December 31, | |||||||
2017 | 2016 | ||||||
ASSETS | |||||||
Investments in real estate, net | $ | 957,725 | $ | 1,606,942 | |||
Cash and cash equivalents | 129,310 | 144,449 | |||||
Restricted cash | 27,008 | 32,160 | |||||
Loans receivable, net | 81,056 | 75,740 | |||||
Accounts receivable, net | 13,627 | 13,086 | |||||
Deferred rent receivable and charges, net | 84,748 | 116,354 | |||||
Other intangible assets, net | 6,381 | 17,623 | |||||
Other assets | 36,533 | 16,530 | |||||
TOTAL ASSETS | $ | 1,336,388 | $ | 2,022,884 | |||
LIABILITIES, REDEEMABLE PREFERRED STOCK, AND EQUITY | |||||||
LIABILITIES: | |||||||
Debt, net | $ | 630,852 | $ | 967,886 | |||
Accounts payable and accrued expenses | 26,394 | 39,155 | |||||
Intangible liabilities, net | 1,070 | 3,576 | |||||
Due to related parties | 8,814 | 10,196 | |||||
Other liabilities | 14,629 | 34,056 | |||||
Total liabilities | 681,759 | 1,054,869 | |||||
COMMITMENTS AND CONTINGENCIES (Note 16) | |||||||
REDEEMABLE PREFERRED STOCK: Series A, $0.001 par value; 36,000,000 shares authorized; 1,225,734 and 1,224,712 shares issued and outstanding, respectively, at December 31, 2017 and 61,435 shares issued and outstanding at December 31, 2016; liquidation preference of $25.00 per share, subject to adjustment | 27,924 | 1,426 | |||||
EQUITY: | |||||||
Series A cumulative redeemable preferred stock, $0.001 par value; 36,000,000 shares authorized; 61,435 and 60,592 shares issued and outstanding, respectively, at December 31, 2017 and 0 shares issued and outstanding at December 31, 2016; liquidation preference of $25.00 per share, subject to adjustment | 1,508 | — | |||||
Series L cumulative redeemable preferred stock, $0.001 par value; 9,000,000 and 0 shares authorized at December 31, 2017 and 2016, respectively; 8,080,740 and 0 shares issued and outstanding at December 31, 2017 and 2016, respectively; liquidation preference of $28.37 per share, subject to adjustment | 229,251 | — | |||||
Common stock, $0.001 par value; 900,000,000 shares authorized; 43,784,939 and 84,048,081 shares issued and outstanding at December 31, 2017 and 2016, respectively | 44 | 84 | |||||
Additional paid-in capital | 792,631 | 1,566,073 | |||||
Accumulated other comprehensive income (loss) | 1,631 | (509 | ) | ||||
Distributions in excess of earnings | (399,250 | ) | (599,971 | ) | |||
Total stockholders' equity | 625,815 | 965,677 | |||||
Noncontrolling interests | 890 | 912 | |||||
Total equity | 626,705 | 966,589 | |||||
TOTAL LIABILITIES, REDEEMABLE PREFERRED STOCK, AND EQUITY | $ | 1,336,388 | $ | 2,022,884 | |||
The accompanying notes are an integral part of these consolidated financial statements.
F-3
CIM COMMERCIAL TRUST CORPORATION AND SUBSIDIARIES
Consolidated Statements of Operations
(In thousands, except per share data)
Year Ended December 31, | |||||||||||
2017 | 2016 | 2015 | |||||||||
REVENUES: | |||||||||||
Rental and other property income | $ | 202,163 | $ | 241,413 | $ | 252,994 | |||||
Expense reimbursements | 16,646 | 12,502 | 13,394 | ||||||||
Interest and other income | 17,567 | 12,016 | 10,560 | ||||||||
236,376 | 265,931 | 276,948 | |||||||||
EXPENSES: | |||||||||||
Rental and other property operating | 101,585 | 124,703 | 133,178 | ||||||||
Asset management and other fees to related parties | 30,251 | 33,882 | 33,169 | ||||||||
Interest | 36,338 | 34,385 | 23,630 | ||||||||
General and administrative | 5,479 | 7,961 | 9,402 | ||||||||
Transaction costs (Note 16) | 11,862 | 340 | 1,382 | ||||||||
Depreciation and amortization | 58,364 | 71,968 | 72,361 | ||||||||
Impairment of real estate (Note 2) | 13,100 | — | — | ||||||||
256,979 | 273,239 | 273,122 | |||||||||
Gain on sale of real estate (Note 3) | 401,737 | 39,666 | 3,092 | ||||||||
INCOME FROM CONTINUING OPERATIONS BEFORE PROVISION FOR INCOME TAXES | 381,134 | 32,358 | 6,918 | ||||||||
Provision for income taxes | 1,376 | 1,646 | 806 | ||||||||
NET INCOME FROM CONTINUING OPERATIONS | 379,758 | 30,712 | 6,112 | ||||||||
DISCONTINUED OPERATIONS: | |||||||||||
Income from operations of assets held for sale (Note 7) | — | 3,853 | 13,140 | ||||||||
Gain on disposition of assets held for sale (Note 7) | — | — | 5,151 | ||||||||
NET INCOME FROM DISCONTINUED OPERATIONS | — | 3,853 | 18,291 | ||||||||
NET INCOME | 379,758 | 34,565 | 24,403 | ||||||||
Net income attributable to noncontrolling interests | (21 | ) | (18 | ) | (11 | ) | |||||
NET INCOME ATTRIBUTABLE TO THE COMPANY | 379,737 | 34,547 | 24,392 | ||||||||
Redeemable preferred stock dividends (Note 11) | (490 | ) | (9 | ) | — | ||||||
Redeemable preferred stock redemptions (Note 11) | 2 | — | — | ||||||||
NET INCOME AVAILABLE TO COMMON STOCKHOLDERS | $ | 379,249 | $ | 34,538 | $ | 24,392 | |||||
BASIC AND DILUTED NET INCOME AVAILABLE TO COMMON STOCKHOLDERS PER SHARE: | |||||||||||
Continuing operations | $ | 5.47 | $ | 0.34 | $ | 0.06 | |||||
Discontinued operations | $ | — | $ | 0.04 | $ | 0.19 | |||||
Net income | $ | 5.47 | $ | 0.38 | $ | 0.25 | |||||
WEIGHTED AVERAGE SHARES OF COMMON STOCK OUTSTANDING: | |||||||||||
Basic | 69,062 | 91,328 | 97,588 | ||||||||
Diluted | 69,070 | 91,328 | 97,588 | ||||||||
The accompanying notes are an integral part of these consolidated financial statements.
F-4
CIM COMMERCIAL TRUST CORPORATION AND SUBSIDIARIES
Consolidated Statements of Comprehensive Income
(In thousands)
Year Ended December 31, | |||||||||||
2017 | 2016 | 2015 | |||||||||
NET INCOME | $ | 379,758 | $ | 34,565 | $ | 24,403 | |||||
Other comprehensive income (loss): cash flow hedges | 2,140 | 2,010 | (2,519 | ) | |||||||
COMPREHENSIVE INCOME | 381,898 | 36,575 | 21,884 | ||||||||
Comprehensive income attributable to noncontrolling interests | (21 | ) | (18 | ) | (11 | ) | |||||
COMPREHENSIVE INCOME ATTRIBUTABLE TO THE COMPANY | $ | 381,877 | $ | 36,557 | $ | 21,873 | |||||
The accompanying notes are an integral part of these consolidated financial statements.
F-5
CIM COMMERCIAL TRUST CORPORATION AND SUBSIDIARIES
Consolidated Statements of Equity
(In thousands, except share and per share data)
Years Ended December 31, 2017, 2016 and 2015 | ||||||||||||||||||||||||||||||
Common Stock | Accumulated | |||||||||||||||||||||||||||||
Additional | Other | Distributions | ||||||||||||||||||||||||||||
Par | Paid - in | Comprehensive | in Excess | Treasury | Noncontrolling | Total | ||||||||||||||||||||||||
Outstanding | Value | Capital | Income (Loss) | of Earnings | Stock | Interests | Equity | |||||||||||||||||||||||
Balances, December 31, 2014 | 97,581,598 | $ | 98 | $ | 1,824,381 | $ | — | $ | (460,623 | ) | $ | (4,901 | ) | $ | 861 | $ | 1,359,816 | |||||||||||||
Contributions from noncontrolling interests | — | — | — | — | — | — | 110 | 110 | ||||||||||||||||||||||
Distributions to noncontrolling interests | — | — | — | — | — | — | (45 | ) | (45 | ) | ||||||||||||||||||||
Stock-based compensation expense | 8,000 | — | 971 | — | — | — | — | 971 | ||||||||||||||||||||||
Common dividends ($0.875 per share) | — | — | — | — | (85,389 | ) | — | — | (85,389 | ) | ||||||||||||||||||||
Treasury stock retirement (107,265 shares) | — | — | (4,901 | ) | — | — | 4,901 | — | — | |||||||||||||||||||||
Other comprehensive income (loss) | — | — | — | (2,519 | ) | — | — | — | (2,519 | ) | ||||||||||||||||||||
Net income | — | — | — | — | 24,392 | — | 11 | 24,403 | ||||||||||||||||||||||
Balances, December 31, 2015 | 97,589,598 | 98 | 1,820,451 | (2,519 | ) | (521,620 | ) | — | 937 | 1,297,347 | ||||||||||||||||||||
Distributions to noncontrolling interests | — | — | — | — | — | — | (43 | ) | (43 | ) | ||||||||||||||||||||
Stock-based compensation expense | 10,176 | — | 164 | — | — | — | — | 164 | ||||||||||||||||||||||
Issuance of shares pursuant to employment agreements | 76,423 | — | — | — | — | — | — | — | ||||||||||||||||||||||
Share repurchases | (13,628,116 | ) | (14 | ) | (254,547 | ) | — | (35,573 | ) | — | — | (290,134 | ) | |||||||||||||||||
Common dividends ($0.875 per share) | — | — | — | — | (77,316 | ) | — | — | (77,316 | ) | ||||||||||||||||||||
Issuance of Series A Preferred Warrants | — | — | 5 | — | — | — | — | 5 | ||||||||||||||||||||||
Dividends to holders of Series A Preferred Stock ($1.375 per share) | — | — | — | — | (9 | ) | — | — | (9 | ) | ||||||||||||||||||||
Other comprehensive income (loss) | — | — | — | 2,010 | — | — | — | 2,010 | ||||||||||||||||||||||
Net income | — | — | — | — | 34,547 | — | 18 | 34,565 | ||||||||||||||||||||||
Balances, December 31, 2016 | 84,048,081 | $ | 84 | $ | 1,566,073 | $ | (509 | ) | $ | (599,971 | ) | $ | — | $ | 912 | $ | 966,589 | |||||||||||||
(Continued)
F-6
CIM COMMERCIAL TRUST CORPORATION AND SUBSIDIARIES
Consolidated Statements of Equity (Continued)
(In thousands, except share and per share data)
Years Ended December 31, 2017, 2016 and 2015 | ||||||||||||||||||||||||||||||||||||||||
Common Stock | Preferred Stock | Accumulated | ||||||||||||||||||||||||||||||||||||||
Series A | Series L | Additional | Other | Distributions | Non- | |||||||||||||||||||||||||||||||||||
Par | Paid - in | Comprehensive | in Excess | controlling | Total | |||||||||||||||||||||||||||||||||||
Shares | Value | Shares | Amount | Shares | Amount | Capital | Income (Loss) | of Earnings | Interests | Equity | ||||||||||||||||||||||||||||||
Balances, December 31, 2016 | 84,048,081 | $ | 84 | — | $ | — | — | $ | — | $ | 1,566,073 | $ | (509 | ) | $ | (599,971 | ) | $ | 912 | $ | 966,589 | |||||||||||||||||||
Distributions to noncontrolling interests | — | — | — | — | — | — | — | — | — | (43 | ) | (43 | ) | |||||||||||||||||||||||||||
Stock-based compensation expense | 9,585 | — | — | — | — | — | 154 | — | — | — | 154 | |||||||||||||||||||||||||||||
Share repurchases | (40,272,727 | ) | (40 | ) | — | — | — | — | (752,218 | ) | — | (133,752 | ) | — | (886,010 | ) | ||||||||||||||||||||||||
Special cash dividends declared to certain common stockholders ($2.990 per share) | — | — | — | — | — | — | — | — | (6,447 | ) | — | (6,447 | ) | |||||||||||||||||||||||||||
Common dividends ($0.594 per share) | — | — | — | — | — | — | — | — | (38,327 | ) | — | (38,327 | ) | |||||||||||||||||||||||||||
Issuance of Series A Preferred Warrants | — | — | — | — | — | — | 126 | — | — | — | 126 | |||||||||||||||||||||||||||||
Issuance of Series L Preferred Stock | — | — | — | — | 8,080,740 | 229,251 | (21,406 | ) | — | — | — | 207,845 | ||||||||||||||||||||||||||||
Dividends to holders of Series A Preferred Stock ($1.375 per share) | — | — | — | — | — | — | — | — | (490 | ) | — | (490 | ) | |||||||||||||||||||||||||||
Reclassification of Series A to permanent equity | — | — | 61,013 | 1,518 | — | — | (101 | ) | — | — | — | 1,417 | ||||||||||||||||||||||||||||
Redemption of Series A Preferred Stock | — | — | (421 | ) | (10 | ) | — | — | 3 | — | — | — | (7 | ) | ||||||||||||||||||||||||||
Other comprehensive income (loss) | — | — | — | — | — | — | — | 2,140 | — | — | 2,140 | |||||||||||||||||||||||||||||
Net income | — | — | — | — | — | — | — | — | 379,737 | 21 | 379,758 | |||||||||||||||||||||||||||||
Balances, December 31, 2017 | 43,784,939 | $ | 44 | 60,592 | $ | 1,508 | 8,080,740 | $ | 229,251 | $ | 792,631 | $ | 1,631 | $ | (399,250 | ) | $ | 890 | $ | 626,705 | ||||||||||||||||||||
The accompanying notes are an integral part of these consolidated financial statements.
F-7
CIM COMMERCIAL TRUST CORPORATION AND SUBSIDIARIES
Consolidated Statements of Cash Flows
(In thousands)
Year Ended December 31, | |||||||||||
2017 | 2016 | 2015 | |||||||||
CASH FLOWS FROM OPERATING ACTIVITIES: | |||||||||||
Net income | $ | 379,758 | $ | 34,565 | $ | 24,403 | |||||
Adjustments to reconcile net income to net cash (used in) provided by operating activities: | |||||||||||
Deferred rent and amortization of intangible assets, liabilities and lease inducements | (2,172 | ) | (6,584 | ) | (6,835 | ) | |||||
Depreciation and amortization | 58,364 | 71,968 | 72,361 | ||||||||
Transfer of right to collect supplemental real estate tax reimbursements | (5,097 | ) | — | — | |||||||
Gain on sale of real estate | (401,737 | ) | (39,666 | ) | (3,092 | ) | |||||
Impairment of real estate | 13,100 | — | — | ||||||||
Gain on disposition of assets held for sale | — | — | (5,151 | ) | |||||||
Straight line rent, below-market ground lease and amortization of intangible assets | 1,069 | 1,766 | 1,899 | ||||||||
Straight line lease termination income | (362 | ) | — | — | |||||||
Amortization of deferred loan costs | 2,870 | 2,803 | 3,229 | ||||||||
Amortization of premiums and discounts on debt | (590 | ) | (870 | ) | (1,179 | ) | |||||
Unrealized premium adjustment | 2,447 | 1,599 | 1,168 | ||||||||
Amortization and accretion on loans receivable, net | 96 | (1,039 | ) | (6,451 | ) | ||||||
Bad debt expense | 677 | 161 | 1,428 | ||||||||
Deferred income taxes | 271 | 164 | 132 | ||||||||
Stock-based compensation | 154 | 164 | 971 | ||||||||
Loans funded, held for sale to secondary market | (57,237 | ) | (38,234 | ) | (29,619 | ) | |||||
Proceeds from sale of guaranteed loans | 51,312 | 38,536 | 27,974 | ||||||||
Principal collected on loans subject to secured borrowings | 6,674 | 3,866 | 4,311 | ||||||||
Other operating activity | (1,718 | ) | 136 | (496 | ) | ||||||
Changes in operating assets and liabilities: | |||||||||||
Accounts receivable and interest receivable | (977 | ) | (2,569 | ) | (350 | ) | |||||
Other assets | (19,762 | ) | 419 | (4,036 | ) | ||||||
Accounts payable and accrued expenses | (14,139 | ) | 630 | 3,678 | |||||||
Deferred leasing costs | (6,973 | ) | (19,885 | ) | (8,580 | ) | |||||
Other liabilities | (5,589 | ) | 3,219 | 984 | |||||||
Due to related parties | (1,584 | ) | 724 | 286 | |||||||
Net cash (used in) provided by operating activities | (1,145 | ) | 51,873 | 77,035 | |||||||
CASH FLOWS FROM INVESTING ACTIVITIES: | |||||||||||
Additions to investments in real estate | (21,101 | ) | (35,414 | ) | (26,614 | ) | |||||
Acquisition of real estate properties | (19,631 | ) | — | (11,143 | ) | ||||||
Proceeds from sale of real estate property, net | 1,012,115 | 94,568 | 7,786 | ||||||||
Proceeds from sale of assets held for sale, net | — | 26,766 | 82,272 | ||||||||
Loans funded | (19,079 | ) | (66,001 | ) | (29,848 | ) | |||||
Principal collected on loans | 10,883 | 33,470 | 39,950 | ||||||||
Restricted cash | 5,152 | (25,150 | ) | 1,691 | |||||||
Other investing activity | 317 | 1,287 | 178 | ||||||||
Net cash provided by investing activities | 968,656 | 29,526 | 64,272 | ||||||||
(Continued)
CIM COMMERCIAL TRUST CORPORATION AND SUBSIDIARIES
Consolidated Statements of Cash Flows (Continued)
(In thousands)
Year Ended December 31, | |||||||||||
2017 | 2016 | 2015 | |||||||||
CASH FLOWS FROM FINANCING ACTIVITIES: | |||||||||||
Proceeds from mortgages payable | — | 392,000 | — | ||||||||
Payment of mortgages payable | (65,877 | ) | (4,354 | ) | (77,056 | ) | |||||
Proceeds from unsecured revolving lines of credit, revolving credit facilities and term notes | 120,000 | 175,000 | 619,000 | ||||||||
Payment of unsecured revolving lines of credit, revolving credit facilities and term notes | (335,000 | ) | (282,000 | ) | (487,000 | ) | |||||
Payment of principal on secured borrowings | (6,674 | ) | (13,946 | ) | (4,311 | ) | |||||
Proceeds from secured borrowings | — | 25,791 | 10,000 | ||||||||
Payment of deferred preferred stock offering costs | (3,832 | ) | (1,960 | ) | — | ||||||
Payment of deferred loan costs | (304 | ) | (1,994 | ) | (3,596 | ) | |||||
Payment of common dividends | (38,327 | ) | (77,316 | ) | (85,389 | ) | |||||
Payment of special cash dividends | (4,872 | ) | — | — | |||||||
Repurchase of Common Stock | (886,010 | ) | (290,134 | ) | — | ||||||
Contributions from noncontrolling interests | — | — | 110 | ||||||||
Payment of borrowing costs | (8 | ) | — | — | |||||||
Net proceeds from issuance of Series A Preferred Warrants | 127 | 5 | — | ||||||||
Net proceeds from issuance of Series A Preferred Stock | 28,070 | 1,429 | — | ||||||||
Net proceeds from issuance of Series L Preferred Stock | 210,377 | — | — | ||||||||
Payment of preferred stock dividends | (250 | ) | — | — | |||||||
Redemption of Series A Preferred Stock | (27 | ) | — | — | |||||||
Noncontrolling interests' distributions | (43 | ) | (43 | ) | (45 | ) | |||||
Net cash used in financing activities | (982,650 | ) | (77,522 | ) | (28,287 | ) | |||||
Change in cash balances included in assets held for sale | — | 1,471 | 569 | ||||||||
NET (DECREASE) INCREASE IN CASH AND CASH EQUIVALENTS | (15,139 | ) | 5,348 | 113,589 | |||||||
CASH AND CASH EQUIVALENTS: | |||||||||||
Beginning of period | 144,449 | 139,101 | 25,512 | ||||||||
End of period | $ | 129,310 | $ | 144,449 | $ | 139,101 | |||||
SUPPLEMENTAL DISCLOSURE OF CASH FLOW INFORMATION: | |||||||||||
Cash paid during the period for interest | $ | 35,092 | $ | 33,060 | $ | 20,920 | |||||
Federal income taxes paid | $ | 1,595 | $ | 1,353 | $ | 805 | |||||
SUPPLEMENTAL DISCLOSURES OF NONCASH INVESTING AND FINANCING ACTIVITIES: | |||||||||||
Additions to investments in real estate included in accounts payable and accrued expenses | $ | 9,024 | $ | 4,527 | $ | 8,097 | |||||
Retirement of treasury stock | $ | — | $ | — | $ | 4,901 | |||||
Additions to investments in real estate included in other assets | $ | — | $ | — | $ | 4,244 | |||||
Net increase (decrease) in fair value of derivatives applied to other comprehensive income (loss) | $ | 2,140 | $ | 2,010 | $ | (2,519 | ) | ||||
Foreclosure on a loan receivable included in other assets | $ | — | $ | — | $ | 708 | |||||
Reduction of loans receivable and secured borrowings due to the SBA's repurchase of the guaranteed portion of loans | $ | 534 | $ | 2,663 | $ | — | |||||
Additions to preferred stock offering costs included in accounts payable and accrued expenses | $ | 388 | $ | 238 | $ | — | |||||
Accrual of dividends payable to preferred stockholders | $ | 249 | $ | 9 | $ | — | |||||
Preferred stock offering costs offset against redeemable preferred stock in temporary equity | $ | 122 | $ | 3 | $ | — | |||||
Preferred stock offering costs offset against redeemable preferred stock in permanent equity | $ | 2,532 | $ | — | $ | — | |||||
Reclassification of Series A Preferred Stock from temporary equity to permanent equity | $ | 1,417 | $ | — | $ | — | |||||
Reclassification of Series A Preferred Stock from temporary equity to accounts payable and accrued expenses | $ | 13 | $ | — | $ | — | |||||
Accrual of special cash dividends | $ | 1,575 | $ | — | $ | — | |||||
Accrual reversed to lease termination income | $ | 480 | $ | — | $ | — | |||||
Payable to related parties included in net proceeds from disposition of real estate | $ | 202 | $ | — | $ | — | |||||
The accompanying notes are an integral part of these consolidated financial statements.
F-8
CIM COMMERCIAL TRUST CORPORATION AND SUBSIDIARIES
Notes to Consolidated Financial Statements as of December 31, 2017 and 2016
and for the Years Ended December 31, 2017, 2016 and 2015
1. ORGANIZATION AND OPERATIONS
CIM Commercial Trust Corporation ("CIM Commercial" or the "Company"), a Maryland corporation and real estate investment trust ("REIT"), or together with its wholly-owned subsidiaries ("we," "us" or "our") primarily acquires, owns, and operates Class A and creative office assets in vibrant and improving urban communities throughout the United States. These communities are located in areas that include traditional downtown areas and suburban main streets, which have high barriers to entry, high population density, improving demographic trends and a propensity for growth. We were originally organized in 1993 as PMC Commercial Trust ("PMC Commercial"), a Texas real estate investment trust.
On July 8, 2013, PMC Commercial entered into a merger agreement (the "Merger Agreement") with CIM Urban REIT, LLC ("CIM REIT"), an affiliate of CIM Group, L.P. ("CIM Group" or "CIM"), and subsidiaries of the respective parties. CIM REIT was a private commercial REIT and was the owner of CIM Urban Partners, L.P. ("CIM Urban"). The transaction (the "Merger") was completed on March 11, 2014 (the "Acquisition Date"). As a result of the Merger and related transactions, CIM Urban became our wholly-owned subsidiary.
Our common stock, $0.001 par value per share ("Common Stock"), is currently traded on the Nasdaq Global Market ("Nasdaq") and on the Tel Aviv Stock Exchange ("TASE"), in each case under the ticker symbol "CMCT." Our Series L Preferred Stock (as defined in Note 11), $0.001 par value per share, is currently traded on Nasdaq and on the TASE, in each case under the ticker symbol "CMCTP." We have authorized for issuance 900,000,000 shares of common stock and 100,000,000 shares of preferred stock ("Preferred Stock").
CIM Commercial has qualified and intends to continue to qualify as a REIT, as defined in the Internal Revenue Code, as amended (the "Code").
2. BASIS OF PRESENTATION AND SUMMARY OF SIGNIFICANT ACCOUNTING POLICIES
Basis of Presentation—The accompanying consolidated financial statements have been prepared in accordance with accounting principles generally accepted in the United States ("GAAP").
Principles of Consolidation—The consolidated financial statements include the accounts of CIM Commercial and its subsidiaries. All intercompany transactions and balances have been eliminated in consolidation.
Investments in Real Estate—Real estate acquisitions are recorded at cost as of the acquisition date. Costs related to the acquisition of properties are expensed as incurred for acquisitions that occurred prior to October 1, 2017. For acquisitions occurring on or after October 1, 2017, we will conduct an analysis to determine if the acquisition constitutes a business combination or an asset purchase. If the acquisition constitutes a business combination, then transaction costs will be expensed as incurred, and if the acquisition constitutes an asset purchase, then transaction costs will be capitalized. Investments in real estate are stated at depreciated cost. Depreciation and amortization are recorded on a straight line basis over the estimated useful lives as follows:
Buildings and improvements | 15 - 40 years |
Furniture, fixtures, and equipment | 3 - 5 years |
Tenant improvements | Shorter of the useful lives or the terms of the related leases |
Improvements and replacements are capitalized when they extend the useful life, increase capacity, or improve the efficiency of the asset. Ordinary repairs and maintenance are expensed as incurred.
Investments in real estate are evaluated for impairment on a quarterly basis or whenever events or changes in circumstances indicate that the carrying amount of an asset may not be recoverable. Recoverability of assets to be held and used is measured by a comparison of the carrying amount to the future net cash flows, undiscounted and without interest, expected to be generated by the asset. If such assets are considered to be impaired, the impairment to be recognized is measured by the amount by which the carrying amount of the assets exceeds the estimated fair value of the assets. The estimated fair value of the
F-9
CIM COMMERCIAL TRUST CORPORATION AND SUBSIDIARIES
Notes to Consolidated Financial Statements as of December 31, 2017 and 2016
and for the Years Ended December 31, 2017, 2016 and 2015 (Continued)
asset group identified for step two of the impairment testing under GAAP is based on either the income approach with market discount rate, terminal capitalization rate and rental rate assumptions being most critical, or on the sales comparison approach to similar properties. Assets to be disposed of are reported at the lower of the carrying amount or fair value, less costs to sell. We recognized impairment of long-lived assets of $13,100,000, $0 and $0 during the years ended December 31, 2017, 2016 and 2015, respectively (Note 3).
Cash and Cash Equivalents—Cash and cash equivalents include short-term liquid investments with initial maturities of three months or less.
Restricted Cash—Our mortgage loan and hotel management agreements provide for depositing cash into restricted accounts reserved for capital expenditures, free rent, tenant improvement and leasing commission obligations. Restricted cash also includes cash required to be segregated in connection with certain of our loans receivable.
Loans Receivable—Our loans receivable are carried at their unamortized principal balance less unamortized acquisition discounts and premiums, retained loan discounts and loan loss reserves. For loans originated under the Small Business Administration's ("SBA") 7(a) Guaranteed Loan Program ("SBA 7(a) Program"), we sell the portion of the loan that is guaranteed by the SBA. Upon sale of the SBA guaranteed portion of the loans, which are accounted for as sales, the unguaranteed portion of the loan retained by us is valued on a fair value basis and a discount (the "Retained Loan Discount") is recorded as a reduction in basis of the retained portion of the loan.
At the Acquisition Date, the carrying value of our loans was adjusted to estimated fair market value and acquisition discounts of $33,907,000 were recorded, which are being accreted to interest and other income using the effective interest method. We sold substantially all of our commercial mortgage loans with unamortized acquisition discounts of $15,951,000 to an unrelated third-party in December 2015 (Note 7). Acquisition discounts of $1,301,000 remained as of December 31, 2017, which have not yet been accreted to income.
A loan receivable is generally classified as non-accrual (a "Non-Accrual Loan") if (i) it is past due as to payment of principal or interest for a period of 60 days or more, (ii) any portion of the loan is classified as doubtful or is charged-off or (iii) the repayment in full of the principal and/or interest is in doubt. Generally, loans are charged-off when management determines that we will be unable to collect any remaining amounts due under the loan agreement, either through liquidation of collateral or other means. Interest income, included in interest and other income or discontinued operations, on a Non-Accrual Loan is recognized on either the cash basis or the cost recovery basis.
On a quarterly basis, and more frequently if indicators exist, we evaluate the collectability of our loans receivable. Our evaluation of collectability involves judgment, estimates, and a review of the ability of the borrower to make principal and interest payments, the underlying collateral and the borrowers' business models and future operations in accordance with Accounting Standards Codification ("ASC") 450-20, Contingencies—Loss Contingencies, and ASC 310-10, Receivables. For the years ended December 31, 2017, 2016 and 2015, we recorded $97,000, $(206,000) and $328,000 impairment (recovery) on our loans receivable, respectively. We establish a general loan loss reserve when available information indicates that it is probable a loss has occurred based on the carrying value of the portfolio and the amount of the loss can be reasonably estimated. Significant judgment is required in determining the general loan loss reserve, including estimates of the likelihood of default and the estimated fair value of the collateral. The general loan loss reserve includes those loans, which may have negative characteristics which have not yet become known to us. In addition to the reserves established on loans not considered impaired that have been evaluated under a specific evaluation, we establish the general loan loss reserve using a consistent methodology to determine a loss percentage to be applied to loan balances. These loss percentages are based on many factors, primarily cumulative and recent loss history and general economic conditions.
Accounts Receivable—Accounts receivable are carried net of the allowances for uncollectible amounts. Management's determination of the adequacy of these allowances is based primarily upon evaluation of historical loss experience, individual receivables, current economic conditions, and other relevant factors. The allowances are increased or decreased through the provision for bad debts. The allowance for uncollectible accounts receivable was $181,000 and $876,000 as of December 31, 2017 and 2016, respectively.
Deferred Rent Receivable and Charges—Deferred rent receivable and charges consist of deferred rent, deferred leasing costs, deferred offering costs (Note 11) and other deferred costs. Deferred rent receivable is $52,619,000 and
F-10
CIM COMMERCIAL TRUST CORPORATION AND SUBSIDIARIES
Notes to Consolidated Financial Statements as of December 31, 2017 and 2016
and for the Years Ended December 31, 2017, 2016 and 2015 (Continued)
$64,010,000 at December 31, 2017 and 2016, respectively. Deferred leasing costs, which represent lease commissions and other direct costs associated with the acquisition of tenants, are capitalized and amortized on a straight-line basis over the terms of the related leases. Deferred leasing costs of $52,414,000 and $76,063,000 are presented net of accumulated amortization of $23,807,000 and $25,914,000 at December 31, 2017 and 2016, respectively. Deferred offering costs represent direct costs incurred in connection with our offering of Series A Preferred Units (as defined in Note 11), excluding costs specifically identifiable to a closing, such as commissions, dealer-manager fees, and other registration fees. For a specific issuance of Series A Preferred Units, associated offering costs are reclassified as a reduction of proceeds raised on the issuance date. Offering costs incurred but not directly related to a specifically identifiable closing are deferred. Deferred offering costs are first allocated to each issuance on a pro-rata basis equal to the ratio of Series A Preferred Units issued in an issuance to the maximum number of Series A Preferred Units that are expected to be issued. Then, the deferred offering costs allocated to such issuance are further allocated to the Series A Preferred Stock (as defined in Note 11) and Series A Preferred Warrants (as defined in Note 11) issued in such issuance based on the relative fair value of the instruments on the date of issuance. The deferred offering costs allocated to the Series A Preferred Stock and Series A Preferred Warrants are reductions to temporary equity and permanent equity, respectively. Deferred offering costs of $3,401,000 and $2,060,000 related to our offering of Series A Preferred Units are included in deferred rent receivable and charges at December 31, 2017 and 2016, respectively. Other deferred costs are $121,000 and $135,000 at December 31, 2017 and 2016, respectively.
Noncontrolling Interests—Noncontrolling interests represent the interests in various properties owned by third parties.
Redeemable Preferred Stock—Beginning on the date of original issuance of any given shares of Series A Preferred Stock (Note 11), the holder of such shares has the right to require the Company to redeem such shares at a redemption price of 100% of the Series A Preferred Stock Stated Value (as defined in Note 11), plus accrued and unpaid dividends, subject to the payment of a redemption fee until the fifth anniversary of such issuance. From and after the fifth anniversary of the date of the original issuance, the holder will have the right to require the Company to redeem such shares at a redemption price of 100% of the Series A Preferred Stock Stated Value, plus accrued and unpaid dividends, without a redemption fee, and the Company will have the right (but not the obligation) to redeem such shares at 100% of the Series A Preferred Stock Stated Value, plus accrued and unpaid dividends. The applicable redemption price payable upon redemption of any Series A Preferred Stock will be in cash or, on or after the first anniversary of the issuance of such shares of Series A Preferred Stock to be redeemed, in the Company's sole discretion, in cash or in equal value through the issuance of shares of Common Stock, based on the volume weighted average price of our Common Stock for the 20 trading days prior to the redemption. Since a holder of Series A Preferred Stock has the right to request redemption of such shares and redemptions prior to the first anniversary are to be paid in cash, we have recorded the activity related to our Series A Preferred Stock in temporary equity. We recorded the activity related to our Series A Preferred Warrants (Note 11) in permanent equity. On the first anniversary of the date of original issuance of a particular share of Series A Preferred Stock, we intend to reclassify such share of Series A Preferred Stock from temporary equity to permanent equity because the feature giving rise to temporary equity classification, the requirement to satisfy redemption requests in cash, lapses on the first anniversary date. Proceeds and expenses from the sale of the Series A Preferred Units are allocated to the Series A Preferred Stock and Series A Preferred Warrants using their relative fair values on the date of issuance.
Our Series L Preferred Stock (as defined in Note 11) is redeemable at the option of the holder or CIM Commercial. From and after the fifth anniversary of the date of original issuance of the Series L Preferred Stock, each holder will have the right to require the Company to redeem, and the Company will also have the option to redeem (subject to certain conditions), such shares of Series L Preferred Stock at a redemption price equal to the Series L Preferred Stock Stated Value (as defined in Note 11), plus, provided certain conditions are met, all accrued and unpaid distributions. Notwithstanding the foregoing, a holder of shares of our Series L Preferred Stock may require us to redeem such shares at any time prior to the fifth anniversary of the date of original issuance of the Series L Preferred Stock if (1) we do not declare and pay in full the distributions on the Series L Preferred Stock for any annual period prior to such fifth anniversary (provided that the first distribution on the Series L Preferred Stock is expected to be payable in January 2019) or (2) we do not declare and pay all accrued and unpaid distributions on the Series L Preferred Stock for all past dividend periods prior to the applicable holder redemption date. The applicable redemption price payable upon redemption of any Series L Preferred Stock will be made, in the Company's sole discretion, in the form of (A) cash in Israeli new shekels ("ILS") at the then-current currency exchange rate determined in accordance with the Articles Supplementary defining the terms of the Series L Preferred Stock, (B) in equal value through the issuance of shares of Common Stock, with the value of such Common Stock to be deemed the lower of (i) our NAV per share of our Common Stock as most recently published by the Company as of the effective date of redemption and (ii) the volume-weighted average
F-11
CIM COMMERCIAL TRUST CORPORATION AND SUBSIDIARIES
Notes to Consolidated Financial Statements as of December 31, 2017 and 2016
and for the Years Ended December 31, 2017, 2016 and 2015 (Continued)
price of our Common Stock, determined in accordance with the Articles Supplementary defining the terms of the Series L Preferred Stock, or (C) in a combination of cash in ILS and our Common Stock, based on the conversion mechanisms set forth in (A) and (B), respectively. We recorded the activity related to our Series L Preferred Stock in permanent equity.
Purchase Accounting for Acquisition of Investments in Real Estate—We apply the acquisition method to all acquired real estate assets. The purchase consideration of the real estate, which for real estate acquired on or after October 1, 2017 includes the transaction costs incurred in connection with such acquisitions, is recorded at fair value to the acquired tangible assets, consisting primarily of land, land improvements, building and improvements, tenant improvements, and furniture, fixtures, and equipment, and identified intangible assets and liabilities, consisting of the value of acquired above-market and below-market leases, in-place leases and ground leases, if any, based in each case on their respective fair values. Loan premiums, in the case of above-market rate loans, or loan discounts, in the case of below-market rate loans, are recorded based on the fair value of any loans assumed in connection with acquiring the real estate.
The fair value of the tangible assets of an acquired property is determined by valuing the property as if it were vacant, and the "as-if-vacant" value is then allocated to land (or acquired ground lease if the land is subject to a ground lease), land improvements, building and improvements, and tenant improvements based on management's determination of the relative fair values of these assets. Management determines the as-if-vacant fair value of a property using methods similar to those used by independent appraisers. Factors considered by management in performing these analyses include an estimate of carrying costs during the expected lease-up periods considering current market conditions and costs to execute similar leases. In estimating carrying costs, management includes real estate taxes, insurance and other operating expenses, and estimates of lost rental revenue during the expected lease-up periods based on current market demand. Management also estimates costs to execute similar leases, including leasing commissions, legal, and other related costs.
In allocating the purchase consideration of the identified intangible assets and liabilities of an acquired property, above-market, below-market, and in-place lease values are recorded based on the present value (using an interest rate that reflects the risks associated with the leases acquired) of the difference between (i) the contractual amounts to be paid pursuant to the in-place leases and (ii) management's estimate of fair market lease rates for the corresponding in-place leases measured over a period equal to the remaining non-cancelable term of the lease, and for below-market leases, over a period equal to the initial term plus any below-market fixed-rate renewal periods. Acquired above-market and below-market leases are amortized and recorded to rental and other property income over the initial terms of the respective leases.
The aggregate value of other acquired intangible assets, consisting of in-place leases and tenant relationships, is measured by the estimated cost of operations during a theoretical lease-up period to replace in-place leases, including lost revenues and any unreimbursed operating expenses, plus an estimate of deferred leasing commissions for in-place leases. The value of in-place leases is amortized to expense over the remaining non-cancelable periods of the respective leases. If a lease is terminated prior to its stated expiration, all unamortized amounts relating to that lease are written-off.
A tax abatement intangible asset was recorded for a property acquired in 2011 and sold in 2017, based on an approval for a property tax abatement, due to the location of the property. The tax abatement intangible asset was amortized over eight years and was written off in connection with the disposition. Tax abatement was $0 and $1,400,000 at December 31, 2017 and 2016, respectively.
Revenue Recognition—All leases are classified as operating leases and minimum rents are recognized on a straight-line basis over the terms of the leases when collectability is reasonably assured and the tenant has taken possession or controls the physical use of the leased asset. The excess of rents recognized over amounts contractually due pursuant to the underlying leases is recorded as deferred rent. If the lease provides for tenant improvements, we determine whether the tenant improvements, for accounting purposes, are owned by the tenant or us. When we are the owner of the tenant improvements, the tenant is not considered to have taken physical possession or have control of the physical use of the leased asset until the tenant improvements are substantially completed. When the tenant is considered the owner of the improvements, any tenant improvement allowance that is funded is treated as incentive. Lease incentives paid to tenants are included in other assets and amortized as a reduction to rental revenue on a straight-line basis over the term of the related lease. Lease incentives of $12,648,000 and $13,084,000 are presented net of accumulated amortization of $5,029,000 and $4,303,000 at December 31, 2017 and 2016, respectively.
F-12
CIM COMMERCIAL TRUST CORPORATION AND SUBSIDIARIES
Notes to Consolidated Financial Statements as of December 31, 2017 and 2016
and for the Years Ended December 31, 2017, 2016 and 2015 (Continued)
Reimbursements from tenants, consisting of amounts due from tenants for common area maintenance, real estate taxes, insurance, and other recoverable costs, are recognized as revenue in the period the expenses are incurred. Tenant reimbursements are recognized and presented on a gross basis when we are the primary obligor with respect to incurring expenses and with respect to having the credit risk.
In addition to minimum rents, certain leases provide for additional rents based upon varying percentages of tenants' sales in excess of annual minimums. Percentage rent is recognized once lessees' specified sales targets have been met. Included in rental and other property income for the years ended December 31, 2017, 2016 and 2015, is $304,000, $338,000 and $329,000, respectively, of percentage rent.
We derive parking revenues from leases with third-party operators. Our parking leases provide for additional rents based upon varying percentages of tenants' sales in excess of annual minimums. Parking percentage rent is recognized once lessees' specific sales targets have been met. Included in rental and other property income for the years ended December 31, 2017, 2016 and 2015, is $2,614,000, $3,156,000 and $2,290,000, respectively, of parking percentage rent.
Hotel room sales are recognized upon daily occupancy. Other hotel revenues are recognized as earned upon facility use or food and beverage consumption.
Interest income included in interest and other income or discontinued operations is comprised of interest earned on loans and our short-term investments and the accretion of net loan origination fees and discounts. Interest income on loans is accrued as earned with the accrual of interest suspended when the related loan becomes a Non-Accrual Loan.
Premiums and Discounts on Debt— Premiums and discounts on debt are accreted or amortized on the effective interest method or on a straight-line basis over the respective term of the loan to interest expense, which approximates the effective interest method.
Stock-Based Compensation Plans—We had options outstanding and have issued and continue to issue restricted shares under stock-based compensation plans described more fully in Note 9. We use fair value recognition provisions to account for all awards granted, modified or settled.
Earnings per Share ("EPS")—Basic EPS is computed by dividing net income available to common stockholders by the weighted-average number of shares of Common Stock outstanding for the period. Net income available to common stockholders includes a deduction for dividends due to preferred stockholders. Diluted EPS is computed by dividing net income available to common stockholders by the weighted average number of shares of Common Stock outstanding adjusted for the dilutive effect, if any, of securities such as stock-based compensation awards, warrants, including the Series A Preferred Warrants (Note 12) and preferred stock, including the Series A Preferred Stock (Note 11) and Series L Preferred Stock (Note 11), whose redemption is payable in shares of Common Stock or cash, at the discretion of the Company. The dilutive effect of stock-based compensation awards and warrants, including the Series A Preferred Warrants, is reflected in the weighted average diluted shares calculation by application of the treasury stock method. The dilutive effect of preferred stock, including the Series A Preferred Stock and Series L Preferred Stock, whose redemption is payable in shares of Common Stock or cash, at the discretion of the Company, is reflected in the weighted average diluted shares calculation by application of the if-converted method.
Distributions—Distributions are recorded on the ex-dividend date.
Assets Held for Sale and Discontinued Operations—In the ordinary course of business, we may periodically enter into agreements relating to dispositions of assets. Some of these agreements are non-binding because either they do not obligate either party to pursue any transactions until the execution of a definitive agreement or they provide the potential buyer with the ability to terminate without penalty or forfeiture of any material deposit, subject to certain specified contingencies, such as completion of due diligence at the discretion of such buyer. We do not classify assets that are subject to such non-binding agreements as held for sale.
We classify assets as held for sale, if material, when they meet the necessary criteria, which include: a) management commits to and actively embarks upon a plan to sell the assets, b) the assets to be sold are available for immediate sale in their present condition, c) the sale is expected to be completed within one year under terms usual and customary for such sales and
F-13
CIM COMMERCIAL TRUST CORPORATION AND SUBSIDIARIES
Notes to Consolidated Financial Statements as of December 31, 2017 and 2016
and for the Years Ended December 31, 2017, 2016 and 2015 (Continued)
d) actions required to complete the plan indicate that it is unlikely that significant changes to the plan will be made or that the plan will be withdrawn. We generally believe that we meet these criteria when the plan for sale has been approved by our Board of Directors, there are no known significant contingencies related to the sale and management believes it is probable that the sale will be completed within one year.
Assets held for sale are recorded at the lower of cost or estimated fair value less cost to sell. In addition, if we were to determine that the asset disposal associated with assets held for sale or disposed of represents a strategic shift, the revenues, expenses and net gain (loss) on dispositions would be recorded in discontinued operations for all periods presented through the date of the applicable disposition.
We have assessed the sale of our multifamily properties (Note 3) in accordance with ASC 205-20, Discontinued Operations. In our assessment, we considered, among other factors, the materiality of the revenue, net operating income, and total assets of our multifamily segment for the years ended December 31, 2017, 2016, and 2015. Based on our qualitative and quantitative assessment, we concluded the disposals do not represent a strategic shift that will have a major effect on our operations and financial results and they should not be classified as discontinued operations on our consolidated financial statements.
Derivative Financial Instruments—As part of risk management and operational strategies, from time to time, we may enter into derivative contracts with various counterparties. All derivatives are recognized on the balance sheet at their estimated fair value. On the date that we enter into a derivative contract, we designate the derivative as a fair value hedge, a cash flow hedge, a foreign currency fair value or cash flow hedge, a hedge of a net investment in a foreign operation, or a trading or non-hedging instrument.
Changes in the estimated fair value of a derivative that is highly effective and that is designated and qualifies as a cash flow hedge, to the extent that the hedge is effective, are initially recorded in other comprehensive income ("OCI"), and are subsequently reclassified into earnings as a component of interest expense when the variability of cash flows of the hedged transaction affects earnings (e.g., when periodic settlements of a variable-rate asset or liability are recorded in earnings). Any hedge ineffectiveness (which represents the amount by which the changes in the estimated fair value of the derivative differ from the variability in the cash flows of the forecasted transaction) is recognized in current-period earnings as a component of interest expense. When an interest rate swap designated as a cash flow hedge no longer qualifies for hedge accounting, we recognize changes in estimated fair value of the hedge previously deferred to accumulated other comprehensive income ("AOCI"), along with any changes in estimated fair value occurring thereafter, through earnings. We classify cash flows from interest rate swap agreements as net cash provided from operating activities on the consolidated statements of cash flows as our accounting policy is to present the cash flows from the hedging instruments in the same category in the consolidated statements of cash flows as the category for the cash flows from the hedged items. See Note 13 for disclosures about our derivative financial instruments and hedging activities.
Income Taxes—We have elected to be taxed as a REIT under the provisions of the Code. To the extent we qualify for taxation as a REIT, we generally will not be subject to a federal corporate income tax on our taxable income that is distributed to our stockholders. We may, however, be subject to certain federal excise taxes and state and local taxes on our income and property. If we fail to qualify as a REIT in any taxable year, we will be subject to federal income taxes at regular corporate rates (including any applicable alternative minimum tax) and will not be able to qualify as a REIT for four subsequent taxable years. In order to remain qualified as a REIT under the Code, we must satisfy various requirements in each taxable year, including, among others, limitations on share ownership, asset diversification, sources of income, and the distribution of at least 90% of our taxable income within the specified time in accordance with the Code.
We have wholly-owned taxable REIT subsidiaries ("TRS's") which are subject to federal income taxes. The income generated from the taxable REIT subsidiaries is taxed at normal corporate rates. Deferred tax assets and liabilities are recognized for the future tax consequences attributable to differences between the financial statement carrying amounts of existing assets and liabilities and their respective tax bases.
We have established a policy on classification of penalties and interest related to audits of our federal and state income tax returns. If incurred, our policy for recording interest and penalties associated with audits will be to record such items as a component of general and administrative expense. Penalties, if incurred, will be recorded in general and administrative expense
F-14
CIM COMMERCIAL TRUST CORPORATION AND SUBSIDIARIES
Notes to Consolidated Financial Statements as of December 31, 2017 and 2016
and for the Years Ended December 31, 2017, 2016 and 2015 (Continued)
and interest paid or received will be recorded in interest expense or interest income, respectively, in our consolidated statements of operations.
ASC 740, Income Taxes, provides guidance for how uncertain tax positions should be recognized, measured, presented, and disclosed in the financial statements. ASC 740 requires the evaluation of tax positions taken or expected to be taken in the course of preparing our tax returns to determine whether the tax positions are "more likely than not" of being sustained by the applicable tax authority. Tax positions not deemed to meet the more-likely-than-not threshold would be recorded as a tax benefit or expense in the current period. We have reviewed all open tax years and concluded that the application of ASC 740 resulted in no material effect to our consolidated financial position or results of operations.
Consolidation Considerations for Our Investments in Real Estate—ASC 810-10, Consolidation, addresses how a business enterprise should evaluate whether it has a controlling interest in an entity through means other than voting rights that would require the entity to be consolidated. We analyze our investments in real estate in accordance with this accounting standard to determine whether they are variable interest entities, and if so, whether we are the primary beneficiary. Our judgment with respect to our level of influence or control over an entity and whether we are the primary beneficiary of a variable interest entity involves consideration of various factors, including the form of our ownership interest, our voting interest, the size of our investment (including loans), and our ability to participate in major policy-making decisions. Our ability to correctly assess our influence or control over an entity affects the presentation of these investments in real estate on our consolidated financial statements.
Use of Estimates—The preparation of consolidated financial statements in conformity with GAAP requires management to make certain estimates and assumptions that affect the reported amounts of assets and liabilities, disclosure of contingent assets and liabilities at the date of the consolidated financial statements, and the reported amounts of revenues and expenses during the reporting period. Actual results could differ from those estimates.
Reclassifications—Certain prior period amounts have been reclassified to conform with the current period presentation. These reclassifications had no effect on previously reported net income or cash flows.
Concentration of Credit Risk—Financial instruments that subject us to credit risk consist primarily of cash and cash equivalents and interest rate swap agreements. We have our cash and cash equivalents on deposit with what we believe to be high-quality financial institutions. Accounts at each institution are insured by the Federal Deposit Insurance Corporation up to $250,000. We believe that the counterparties in our interest rate swap agreements are high-quality financial institutions. The credit quality of the counterparties is monitored on an ongoing basis. Management routinely assesses the financial strength of its tenants and, as a consequence, believes that its accounts receivable credit risk exposure is limited.
Our properties are located throughout the United States. The majority of our revenues are earned from properties located in the Washington, D.C. area and California. We are subject to risks incidental to the ownership and operation of commercial real estate. These include, among others, the risks normally associated with changes in the general economic climate in the communities in which we operate, trends in the real estate industry, change in tax laws, interest rate levels, availability of financing, and the potential liability under environmental and other laws.
Fair Value Measurements—The fair value of our financial assets and liabilities are disclosed in Note 14.
We determine the estimated fair value of financial assets and liabilities utilizing a hierarchy of valuation techniques based on whether the inputs to a fair value measurement are considered to be observable or unobservable in a marketplace. The hierarchy for inputs used in measuring fair value is as follows:
Level 1 Inputs—Quoted prices in active markets for identical assets or liabilities
Level 2 Inputs—Observable inputs other than quoted prices in active markets for identical assets and liabilities
Level 3 Inputs—Unobservable inputs
F-15
CIM COMMERCIAL TRUST CORPORATION AND SUBSIDIARIES
Notes to Consolidated Financial Statements as of December 31, 2017 and 2016
and for the Years Ended December 31, 2017, 2016 and 2015 (Continued)
In certain cases, the inputs used to measure fair value may fall into different levels of the fair value hierarchy. In such cases, for disclosure purposes, the level within which the fair value measurement is categorized is based on the lowest level input that is significant to the fair value measurement.
We disclose the fair value of our debt. We determine the fair value of mortgage notes payable and junior subordinated notes by performing discounted cash flow analyses using an appropriate market discount rate. We calculate the market discount rate for our mortgage notes payable by obtaining period-end treasury rates for maturities that correspond to the maturities of our debt and then adding an appropriate credit spread. These credit spreads take into account factors such as our credit standing, the maturity of the debt, whether the debt is secured or unsecured, and the loan-to-value ratios of the debt.
We disclose the fair value of our loans receivable. We determine the fair value of loans receivable by performing a present value analysis for the anticipated future cash flows using an appropriate market discount rate taking into consideration the credit risk and using an anticipated prepayment rate.
We estimate the fair value of our interest rate swaps by calculating the credit-adjusted present value of the expected future cash flows of each swap. The calculation incorporates the contractual terms of the derivatives, observable market interest rates, and credit risk adjustments, if any, to reflect the counterparty's as well as our own nonperformance risk.
The carrying amounts of our cash and cash equivalents, restricted cash, accounts receivable, accounts payable, and accrued expenses approximate their fair values due to their short-term maturities at December 31, 2017 and 2016. The carrying amounts of our secured borrowings and unsecured credit and term loan facilities approximate their fair values, as the interest rates on these securities are variable and approximate current market interest rates.
Segment Information—Segment information is prepared on the same basis that our management reviews information for operational decision-making purposes. Our reportable segments consist of three types of commercial real estate properties, namely, office, hotel and multifamily, as well as a segment for our lending business that is included in our continuing operations. The lending business that was held for sale at December 31, 2015 is not included in our reportable segments. The products for our office segment primarily include rental of office space and other tenant services, including tenant reimbursements, parking, and storage space rental. The products for our multifamily segment include rental of apartments and other tenant services. The products for our hotel segment include revenues generated from the operations of hotel properties and rental income generated from a garage located directly across the street from one of the hotels. The income from our lending segment includes income from the yield and other related fee income earned on our loans receivable.
Recently Issued Accounting Pronouncements—In January 2016, the Financial Accounting Standards Board ("FASB") issued Accounting Standards Update ("ASU") No. 2016-01, Financial Instruments-Overall (Subtopic 825-10): Recognition and Measurement of Financial Assets and Financial Liabilities, which is designed to improve the recognition and measurement of financial instruments through targeted changes to existing GAAP. The ASU requires an entity to: (i) measure equity investments at fair value through net income, with certain exceptions; (ii) present in OCI the changes in instrument-specific credit risk for financial liabilities measured using the fair value option; (iii) present financial assets and financial liabilities by measurement category and form of financial asset; (iv) calculate the fair value of financial instruments for disclosure purposes based on an exit price; and (v) assess a valuation allowance on deferred tax assets related to unrealized losses of available-for-sale debt securities in combination with other deferred tax assets. In addition, the ASU provides an election to subsequently measure certain nonmarketable equity investments at cost less any impairment and adjusted for certain observable price changes. The ASU also requires a qualitative impairment assessment of such equity investments and amends certain fair value disclosure requirements. For public business entities, the ASU is effective for annual reporting periods (including interim reporting periods within those periods) beginning after December 15, 2017. We currently do not anticipate the adoption of this ASU will have a material impact on our consolidated financial statements.
In February 2016, the FASB issued ASU No. 2016-02, Leases (Topic 842), which is intended to improve financial reporting about leasing transactions. Under the new guidance, a lessee will be required to recognize assets and liabilities for leases with lease terms of more than 12 months. Consistent with current GAAP, the recognition, measurement, and presentation of expenses and cash flows arising from a lease by a lessee primarily will depend on its classification as a finance or operating lease. However, unlike current GAAP, which requires a lessee to recognize only capital leases on the balance sheet, the new ASU will require a lessee to recognize both types of leases on the balance sheet. The lessor accounting will remain largely unchanged from current GAAP. However, the ASU contains some targeted improvements that are intended to align, where
F-16
CIM COMMERCIAL TRUST CORPORATION AND SUBSIDIARIES
Notes to Consolidated Financial Statements as of December 31, 2017 and 2016
and for the Years Ended December 31, 2017, 2016 and 2015 (Continued)
necessary, lessor accounting with the lessee accounting model and with the updated revenue recognition guidance issued in 2014. For public entities, the ASU is effective for annual reporting periods (including interim reporting periods within those periods) beginning after December 15, 2018.
We are currently conducting an evaluation of the impact of the guidance on our consolidated financial statements. We currently believe that the adoption of the standard will not significantly change the accounting for operating leases on our consolidated balance sheet where we are the lessor, and that such leases will be accounted for in a similar method to existing standards with the underlying leased asset being recognized and reported as a real estate asset. We currently expect that certain non-lease components may need to be accounted for separately from the lease components, with the lease components continuing to be recognized on a straight-line basis over the term of the lease and certain non-lease components (such as certain expense reimbursements) being accounted for under the new revenue recognition guidance in ASU 2014-09. We expect to adopt the guidance on a modified retrospective basis.
In March 2016, the FASB issued ASU No. 2016-09, Compensation-Stock Compensation (Topic 718): Improvements to Employee Share-Based Payment Accounting, which is intended to simplify several aspects of the accounting for share-based payment transactions, including accounting for income taxes, classification of excess tax benefits on the statement of cash flows, forfeitures, minimum statutory tax withholding requirements, and classification of employee taxes paid on the statement of cash flows when an employer withholds shares for tax-withholding purposes. In addition, the ASU eliminated certain guidance in ASC 718, which was indefinitely deferred shortly after the issuance of FASB Statement No. 123 (revised 2004), Share-Based Payment. For public entities, the ASU became effective for annual reporting periods (including interim reporting periods within those periods) beginning after December 15, 2016. The adoption of this guidance did not have a material impact on our consolidated financial statements.
In June 2016, the FASB issued ASU No. 2016-13, Financial Instruments-Credit Losses (Topic 326): Measurement of Credit Losses on Financial Instruments, which is intended to provide financial statement users with more decision-useful information about the expected credit losses on financial instruments and other commitments to extend credit held by a reporting entity. The amendments in the ASU replaces the incurred loss impairment methodology in current GAAP with a methodology that reflects expected credit losses and requires consideration of a broader range of reasonable and supportable information to inform credit loss estimates. For public entities, the ASU is effective for annual reporting periods (including interim reporting periods within those periods) beginning after December 15, 2019. Early adoption is permitted for annual reporting periods (including interim reporting periods within those periods) beginning after December 15, 2018. We are currently in the process of evaluating the impact of adoption of this new accounting guidance on our consolidated financial statements.
In August 2016, the FASB issued ASU No. 2016-15, Statement of Cash Flows (Topic 230): Classification of Certain Cash Receipts and Cash Payments, which provides guidance on how certain cash receipts and cash payments are to be presented and classified in the statement of cash flows. For public entities, the ASU is effective for annual reporting periods (including interim reporting periods within those periods) beginning after December 15, 2017. Early adoption is permitted. We currently do not anticipate the adoption of this ASU will have a material impact on our consolidated financial statements.
In November 2016, the FASB issued ASU No. 2016-18, Statement of Cash Flows (Topic 230): Restricted Cash, which requires that a statement of cash flows explain the change during the period in the total cash, cash equivalents, and amounts generally described as restricted cash or restricted cash equivalents. Therefore, amounts generally described as restricted cash and restricted cash equivalents should be included with cash and cash equivalents when reconciling the beginning-of-period and end-of-period total amounts shown on the statement of cash flows. The amendments in this update do not provide a definition of restricted cash or restricted cash equivalents. For public entities, the ASU is effective for annual reporting periods (including interim reporting periods within those periods) beginning after December 15, 2017. Early adoption is permitted. Upon adoption of this ASU, restricted cash balances will be included in beginning and ending balances of cash and cash equivalents for all periods presented in our consolidated statements of cash flows.
In December 2016, the FASB issued ASU No. 2016-20, Technical Corrections and Improvements to Topic 606, Revenue from Contracts with Customers, which makes certain technical corrections and improvements to ASU 2014-09, Revenue from Contracts with Customers (Topic 606). In February 2017, the FASB issued ASU No. 2017-05, Clarifying the Scope of Asset Derecognition Guidance and Accounting for Partial Sales of Nonfinancial Assets, which provided further clarification on the recognition of gains and losses from the transfer of nonfinancial assets in contracts with noncustomers
F-17
CIM COMMERCIAL TRUST CORPORATION AND SUBSIDIARIES
Notes to Consolidated Financial Statements as of December 31, 2017 and 2016
and for the Years Ended December 31, 2017, 2016 and 2015 (Continued)
provided for under ASU 2014-09. This revenue recognition standard became effective for the Company on January 1, 2018. The standard allows the use of a full retrospective or modified retrospective approach to adopt this ASU. The full retrospective approach requires entities to recast their revenues for all periods presented to conform with the new revenue recognition guidance. Revenues that are restated for periods before January 1, 2016 will be reflected as an adjustment to retained earnings as of January 1, 2016. Under the modified retrospective approach, an entity can apply the standard to all contracts existing as of January 1, 2018, or only to uncompleted contracts existing as of January 1, 2018. Any differences in current and new revenue recognition guidance would be reflected as an adjustment to retained earnings as of January 1, 2018 under this approach. Under both approaches, additional disclosures may be required depending on the significance of the revenues impacted. The Company has elected to use the modified retrospective approach for all uncompleted contracts as of January 1, 2018.
The core principle of this revenue recognition standard is that an entity recognizes revenue to depict the transfer of promised goods or services to customers in an amount that reflects the consideration to which the entity expects to be entitled in exchange for those goods or services, with an emphasis on the timing of the transfer of control of these goods or services to the customer. The guidance requires the use of a new five-step model, which includes (i) identifying the contract with a customer, (ii) identifying the performance obligations in the contract, (iii) determining the transaction price, (iv) allocating the transaction price to the performance obligations, and (v) recognizing revenue when (or as) the entities satisfies a performance obligation.
Our revenues and gains that were scoped into the revenue recognition standard were (i) hotel revenues, (ii) gains on sales of real estate, and (iii) certain tenant recoveries outside of the terms of the lease agreement.
For all contracts within the scope of this new revenue recognition standard, which include hotel revenues, sales of real estate, and tenant recoveries outside the lease agreements, the Company determined that there were no differences in the recognition of timing and amount under the current and new guidance. Therefore, the adoption of this standard effective January 1, 2018 will not result in an adjustment to our retained earnings on January 1, 2018. Additionally, a majority of the Company's revenues are primarily concentrated in rental income from leases which are outside of the scope of the new revenue recognition standard. We do not believe that hotel revenues or tenant recoveries outside of the lease agreements are material in relation to the core business, nor will they be material going forward.
In January 2017, the FASB issued ASU No. 2017-01, Business Combinations: Clarifying the Definition of a Business ("ASU No. 2017-01"), which narrows the definition of a business and provides a framework that gives entities a basis for making reasonable judgments about whether a transaction involves an asset or a business. For public entities, the ASU is effective for annual reporting periods (including interim periods within those periods) beginning after December 15, 2017. Early adoption is permitted under certain circumstances as outlined in the ASU. The Company early adopted ASU No. 2017-01 during the fourth quarter of 2017. As a result of such adoption, we capitalized the transaction costs incurred in connection with the acquisition of an office property in San Francisco, California in December 2017 (Note 3). In addition, we expect that transaction costs incurred in connection with future real estate property acquisitions that constitute an asset purchase will be capitalized as part of the purchase price instead of being expensed as incurred to transaction costs.
In May 2017, the FASB issued ASU No. 2017-09, Compensation - Stock Compensation (Topic 718): Scope of Modification Accounting, which clarifies the scope of modification accounting. Under the guidance, an entity will not apply modification accounting to a share-based payment award if the award's fair value, vesting conditions, and classification as an equity or liability instrument remain the same immediately before and after the change. For public entities, the ASU is effective for annual reporting periods (including interim periods within those periods) beginning after December 15, 2017. Early adoption is permitted. We currently do not anticipate the adoption of this new accounting guidance will have a material impact on our consolidated financial statements.
In August 2017, the FASB issued ASU 2017-12, Targeted Improvements to Accounting for Hedging Activities, which simplifies and expands the eligible hedging strategies for financial and nonfinancial risks by more closely aligning hedge accounting with a company's risk management activities, and also simplifies the application of Topic 815, Derivatives and Hedging, through targeted improvements in key practice areas. In addition, the ASU prescribes how hedging results should be presented and requires incremental disclosures. Further, the ASU provides partial relief on the timing of certain aspects of hedge documentation and eliminates the requirement to recognize hedge ineffectiveness separately in earnings in the current period. For public entities, the ASU is effective for annual reporting periods (including interim periods within those periods) beginning after December 15, 2018. Early adoption is permitted in any interim period after issuance of the ASU for existing
F-18
CIM COMMERCIAL TRUST CORPORATION AND SUBSIDIARIES
Notes to Consolidated Financial Statements as of December 31, 2017 and 2016
and for the Years Ended December 31, 2017, 2016 and 2015 (Continued)
hedging relationships on the date of adoption. We are currently in the process of evaluating the impact of adoption of this new accounting guidance on our consolidated financial statements.
3. ACQUISITIONS AND DISPOSITIONS
The fair value of real estate acquired is recorded to the acquired tangible assets, consisting primarily of land, land improvements, building and improvements, tenant improvements, and furniture, fixtures, and equipment, and identified intangible assets and liabilities, consisting of the value of acquired above-market and below-market leases, in-place leases and ground leases, if any, based in each case on their respective fair values. Loan premiums, in the case of above-market rate loans, or loan discounts, in the case of below-market rate loans, are recorded based on the fair value of any loans assumed in connection with acquiring the real estate.
2017 Transactions—On December 29, 2017, we acquired a 100% fee-simple interest in an office property known as 1130 Howard Street from an unrelated third-party. The office property has approximately 21,194 square feet and is located in San Francisco, California. The acquisition was funded with proceeds from our Series L Preferred Stock offering, and the acquired property is reported as part of the office segment (Note 20). During the fourth quarter of 2017, we early adopted ASU No. 2017-01 (Note 2) and, based on our analysis, the acquisition was an asset purchase and not a business combination. As such, transaction costs were capitalized as incurred in connection with this acquisition.
Asset | Date of | Purchase | ||||||||
Property | Type | Acquisition | Square Feet | Price (1) | ||||||
(in thousands) | ||||||||||
1130 Howard Street, San Francisco, CA | Office | December 29, 2017 | 21,194 | $ | 17,717 | |||||
(1) | Transaction costs that were capitalized and assumption of liabilities totaled $1,915,000, which are excluded from the purchase price above. |
F-19
CIM COMMERCIAL TRUST CORPORATION AND SUBSIDIARIES
Notes to Consolidated Financial Statements as of December 31, 2017 and 2016
and for the Years Ended December 31, 2017, 2016 and 2015 (Continued)
We sold 100% fee-simple interests in the following properties, other than 800 N Capitol, in which we sold a 100% leasehold interest, to unrelated third-parties. Transaction costs related to these sales were expensed as incurred.
Property | Asset Type | Date of Sale | Square Feet or Units (1) | Sales Price | Transaction Costs | Gain on Sale | ||||||||||||
(in thousands) | ||||||||||||||||||
211 Main Street, San Francisco, CA | Office | March 28, 2017 | 417,266 | $ | 292,882 | $ | 2,943 | (2) | $ | 187,734 | ||||||||
3636 McKinney Avenue, Dallas, TX | Multifamily | May 30, 2017 | 103 | $ | 20,000 | $ | 1,320 | (2) | $ | 5,488 | ||||||||
3839 McKinney Avenue, Dallas, TX | Multifamily | May 30, 2017 | 75 | $ | 14,100 | $ | 938 | (2) | $ | 4,224 | ||||||||
200 S College Street, Charlotte, NC | Office | June 8, 2017 | 567,865 | $ | 148,500 | $ | 833 | $ | 45,906 | |||||||||
980 9th and 1010 8th Street, Sacramento, CA | Office & Parking Garage | June 20, 2017 | 485,926 | $ | 120,500 | $ | 1,119 | $ | 34,559 | |||||||||
4649 Cole Avenue, Dallas, TX | Multifamily | June 23, 2017 | 334 | $ | 64,000 | $ | 3,311 | (2) | $ | 25,836 | ||||||||
800 N Capitol Street, Washington, D.C. | Office | August 31, 2017 | 311,593 | $ | 119,750 | $ | 2,388 | $ | 34,456 | |||||||||
7083 Hollywood Boulevard, Los Angeles, CA (3) | Office | September 21, 2017 | 82,193 | $ | 42,300 | $ | 584 | $ | 23,670 | |||||||||
47 E 34th Street, New York, NY | Multifamily | September 26, 2017 | 110 | $ | 80,000 | $ | 3,157 | $ | 16,556 | |||||||||
370 L'Enfant Promenade, Washington, D.C. (4) | Office | October 17, 2017 | 409,897 | $ | 126,680 | $ | 2,451 | $ | 2,994 | |||||||||
4200 Scotland Street, Houston, TX (3) | Multifamily | December 15, 2017 | 308 | $ | 64,025 | $ | 597 | $ | 20,314 | |||||||||
(1) | Reflects the square footage of office properties and number of units of multifamily properties. |
(2) | Includes a prepayment penalty incurred in connection with the prepayment of the mortgage on the property in the amount of $1,508,000 at 211 Main Street, $1,143,000 at 3636 McKinney Avenue, $758,000 at 3839 McKinney Avenue, and $2,812,000 at 4649 Cole Avenue (Note 8). |
(3) | A mortgage collateralized by this property was assumed by the buyer in connection with our sale of the property (Note 8). |
(4) | In August 2017, we negotiated an agreement with an unrelated third-party for the sale of this property. We determined the book value of this property exceeded its estimated fair value less costs to sell, and as such, an impairment charge of $13,100,000 was recognized at such time for the year ended December 31, 2017 (Note 2). Our determination of fair value was based on the sales price negotiated with the third-party buyer. |
In December 2017, we entered into a purchase and sale agreement with an unrelated third-party for the acquisition of a 100% fee-simple interest in an office property located at 9460 Wilshire Boulevard in Beverly Hills, California. At the time we entered into the purchase and sale agreement, we made a $20,000,000 non-refundable deposit to an escrow account and such deposit is included in other assets on our consolidated balance sheet at December 31, 2017. The acquisition subsequently closed in January 2018 for a purchase price of $132,000,000, which excludes transaction costs of $48,000 that were incurred and capitalized in connection with this acquisition. The property has approximately 68,866 square feet of office space and 22,884 square feet of retail space. The acquisition was funded with proceeds from our Series L Preferred Stock offering, and the acquired property will be reported as part of the office segment (Note 20).
F-20
CIM COMMERCIAL TRUST CORPORATION AND SUBSIDIARIES
Notes to Consolidated Financial Statements as of December 31, 2017 and 2016
and for the Years Ended December 31, 2017, 2016 and 2015 (Continued)
2016 Transactions—There were no acquisitions during the year ended December 31, 2016.
We sold 100% fee-simple interests in the following properties to unrelated third-parties. Transaction costs related to these sales were expensed as incurred.
Property | Asset Type | Date of Sale | Rooms | Sales Price | Transaction Costs | Gain on Sale | ||||||||||||
(in thousands) | ||||||||||||||||||
Courtyard Oakland, Oakland, CA | Hotel | February 2, 2016 | 162 | $ | 43,800 | $ | 1,026 | $ | 24,739 | |||||||||
LAX Holiday Inn, Los Angeles, CA | Hotel | July 19, 2016 | 405 | $ | 52,500 | $ | 706 | $ | 14,927 | |||||||||
2015 Transactions—On August 26, 2015, we acquired a 100% fee-simple interest in a surface parking lot known as 2 Kaiser Plaza Parking Lot from an unrelated third-party. The parking lot has approximately 44,642 square feet of land and is located in Oakland, California. The acquisition was funded with proceeds from our unsecured credit facility, and the acquired property is reported as part of the office segment (Note 20). Transaction costs were expensed as incurred during the year ended December 31, 2015 related to this acquisition.
Property | Asset Type | Date of Acquisition | Square Feet | Purchase Price | Transaction Costs | |||||||||
(in thousands) | ||||||||||||||
2 Kaiser Plaza Parking Lot, Oakland, CA | Surface Parking Lot | August 26, 2015 | 44,642 | $ | 11,143 | $ | 107 | |||||||
We sold a 100% fee-simple interest in the following property to an unrelated third-party. Transaction costs related to the sale were expensed as incurred.
Property | Asset Type | Date of Sale | Square Feet | Sales Price | Transaction Costs | Gain on Sale | ||||||||||||
(in thousands) | ||||||||||||||||||
500 West Santa Ana Boulevard, Santa Ana, CA | Office | November 19, 2015 | 37,116 | $ | 8,050 | $ | 264 | $ | 3,092 | |||||||||
F-21
CIM COMMERCIAL TRUST CORPORATION AND SUBSIDIARIES
Notes to Consolidated Financial Statements as of December 31, 2017 and 2016
and for the Years Ended December 31, 2017, 2016 and 2015 (Continued)
The results of operations of the properties we sold have been included in the consolidated statements of operations through each properties' respective disposition date. The following is the detail of the carrying amounts of assets and liabilities at the time of the sales of the properties that occurred during the years ended December 31, 2017, 2016 and 2015:
Year Ended December 31, | |||||||||||
2017 | 2016 | 2015 | |||||||||
(in thousands) | |||||||||||
Assets | |||||||||||
Investments in real estate, net | $ | 631,740 | $ | 54,374 | $ | 4,694 | |||||
Deferred rent receivable and charges, net | 34,071 | — | — | ||||||||
Other intangible assets, net | 11,283 | 528 | — | ||||||||
Other assets | 38 | — | — | ||||||||
Total assets | $ | 677,132 | $ | 54,902 | $ | 4,694 | |||||
Liabilities | |||||||||||
Debt, net (1) | $ | 115,037 | $ | — | $ | — | |||||
Other liabilities | 14,029 | — | — | ||||||||
Intangible liabilities, net | 1,800 | — | — | ||||||||
Total liabilities | $ | 130,866 | $ | — | $ | — | |||||
(1) | Net of $665,000 of premium on assumed mortgage. Debt of $50,260,000 was assumed by certain buyers in connection with sales of certain properties. |
The results of operations of the properties we acquired have been included in the consolidated statements of operations from the date of acquisition. The fair value of the net assets acquired for the aforementioned acquisitions during the years ended December 31, 2017, 2016 and 2015 are as follows:
Year Ended December 31, | |||||||||||
2017 (1) | 2016 | 2015 (1) | |||||||||
(in thousands) | |||||||||||
Land | $ | 8,290 | $ | — | $ | 10,931 | |||||
Land improvements | — | — | 110 | ||||||||
Buildings and improvements | 10,109 | — | — | ||||||||
Tenant improvements | 371 | — | — | ||||||||
Acquired in-place leases (2) | 1,184 | — | 102 | ||||||||
Acquired above-market leases (3) | 37 | — | — | ||||||||
Acquired below-market leases (3) | (360 | ) | — | — | |||||||
Net assets acquired | $ | 19,631 | $ | — | $ | 11,143 | |||||
(1) | The purchase price of the acquisitions completed during the years ended December 31, 2017 and 2015 were individually less than 5% and in aggregate less than 10% of our total assets as of December 31, 2017 and 2015, respectively. |
(2) | Acquired in-place leases have a weighted average amortization period of 5.0 years and 3.0 years for the 2017 and 2015 acquisitions, respectively. |
(3) | Acquired above and below-market leases have a weighted average amortization period of 7.0 years and 2.0 years, respectively, for the 2017 acquisition. |
F-22
CIM COMMERCIAL TRUST CORPORATION AND SUBSIDIARIES
Notes to Consolidated Financial Statements as of December 31, 2017 and 2016
and for the Years Ended December 31, 2017, 2016 and 2015 (Continued)
Abandoned project costs of $16,000, $328,000 and $486,000 were expensed as incurred during the years ended December 31, 2017, 2016 and 2015, respectively.
4. INVESTMENTS IN REAL ESTATE
Investments in real estate consist of the following:
December 31, | |||||||
2017 | 2016 | ||||||
(in thousands) | |||||||
Land | $ | 221,785 | $ | 343,564 | |||
Land improvements | 17,745 | 26,177 | |||||
Buildings and improvements | 847,849 | 1,475,415 | |||||
Furniture, fixtures, and equipment | 3,363 | 4,955 | |||||
Tenant improvements | 128,876 | 159,677 | |||||
Work in progress | 9,162 | 11,706 | |||||
Investments in real estate | 1,228,780 | 2,021,494 | |||||
Accumulated depreciation | (271,055 | ) | (414,552 | ) | |||
Net investments in real estate | $ | 957,725 | $ | 1,606,942 | |||
For the years ended December 31, 2017, 2016, and 2015, we recorded depreciation expense of $49,427,000, $62,239,000, and $61,915,000, respectively.
5. LOANS RECEIVABLE
Loans receivable consist of the following:
December 31, | ||||||||
2017 | 2016 | |||||||
(in thousands) | ||||||||
SBA 7(a) loans, subject to credit risk | $ | 58,298 | $ | 43,376 | ||||
SBA 7(a) loans, subject to secured borrowings | 21,664 | 29,456 | ||||||
Commercial mortgage loans | 424 | 2,597 | ||||||
Loans receivable | 80,386 | 75,429 | ||||||
Deferred capitalized costs | 1,132 | 582 | ||||||
Loan loss reserves | (462 | ) | (271 | ) | ||||
Loans receivable, net | $ | 81,056 | $ | 75,740 | ||||
SBA 7(a) Loans, Subject to Credit Risk—Represents the non-government guaranteed retained portion of loans originated under the SBA 7(a) Program and the government guaranteed portion of loans that have not yet been fully funded or sold.
SBA 7(a) Loans, Subject to Secured Borrowings—Represents the government guaranteed portion of loans which were sold with the proceeds received from the sale reflected as secured borrowings—government guaranteed loans. There is no credit risk associated with these loans since the SBA has guaranteed payment of the principal.
Commercial Mortgage Loans—Represents loans to small businesses primarily collateralized by first liens on the real estate of the related business.
F-23
CIM COMMERCIAL TRUST CORPORATION AND SUBSIDIARIES
Notes to Consolidated Financial Statements as of December 31, 2017 and 2016
and for the Years Ended December 31, 2017, 2016 and 2015 (Continued)
At December 31, 2017 and 2016, 100.0% and 99.7%, respectively, of our loans subject to credit risk were current with the remainder ($0 and $249,000, respectively) greater than 29 days delinquent. We classify loans with negative characteristics in substandard categories ranging from special mention to doubtful. At December 31, 2017 and 2016, $388,000 and $804,000, respectively, of loans subject to credit risk were classified in substandard categories.
At December 31, 2017 and 2016, our loans subject to credit risk were 97.3% and 93.6%, respectively, concentrated in the hospitality industry.
6. OTHER INTANGIBLE ASSETS
A schedule of our intangible assets and liabilities and related accumulated amortization and accretion as of December 31, 2017 and 2016, is as follows:
Assets | Liabilities | |||||||||||||||
December 31, 2017 | Acquired Above-Market Leases | Acquired In-Place Leases | Trade Name and License | Acquired Below-Market Leases | ||||||||||||
(in thousands) | ||||||||||||||||
Gross balance | $ | 37 | $ | 11,087 | $ | 2,957 | $ | (2,902 | ) | |||||||
Accumulated amortization | — | (7,700 | ) | — | 1,832 | |||||||||||
$ | 37 | $ | 3,387 | $ | 2,957 | $ | (1,070 | ) | ||||||||
Average useful life (in years) | 7 | 9 | Indefinite | 5 | ||||||||||||
Assets | Liabilities | |||||||||||||||||||||||
December 31, 2016 | Acquired Above-Market Leases | Acquired In-Place Leases | Tax Abatement (1) | Acquired Below-Market Ground Lease (2) | Trade Name and License | Acquired Below-Market Leases | ||||||||||||||||||
(in thousands) | ||||||||||||||||||||||||
Gross balance | $ | 215 | $ | 11,551 | $ | 4,273 | $ | 11,685 | $ | 2,957 | $ | (18,893 | ) | |||||||||||
Accumulated amortization | (180 | ) | (8,443 | ) | (2,873 | ) | (1,562 | ) | — | 15,317 | ||||||||||||||
$ | 35 | $ | 3,108 | $ | 1,400 | $ | 10,123 | $ | 2,957 | $ | (3,576 | ) | ||||||||||||
Average useful life (in years) | 8 | 10 | 8 | 84 | Indefinite | 8 | ||||||||||||||||||
(1) | Tax abatement is associated with 47 E 34th Street, which was sold in September 2017 (Note 3). |
(2) | Acquired below-market ground lease is associated with 800 N Capitol Street, which was sold in August 2017 (Note 3). |
The amortization of the acquired above-market leases which decreased rental and other property income was $3,000, $88,000 and $240,000 for the years ended December 31, 2017, 2016 and 2015, respectively. The amortization of the acquired in-place leases included in depreciation and amortization expense was $808,000, $1,347,000 and $1,857,000 for the years ended December 31, 2017, 2016 and 2015, respectively. Tax abatement amortization included in rental and other property operating expenses was $276,000, $551,000 and $551,000 for the years ended December 31, 2017, 2016 and 2015, respectively. Amortization of acquired below-market ground lease included in rental and other property operating expenses was $93,000, $140,000 and $140,000 for the years ended December 31, 2017, 2016 and 2015, respectively. Included in depreciation and amortization expense was franchise affiliation fee amortization of $0, $33,000 and $394,000 for the years ended December 31, 2017, 2016 and 2015, respectively. The amortization of the acquired below-market leases included in rental and
F-24
CIM COMMERCIAL TRUST CORPORATION AND SUBSIDIARIES
Notes to Consolidated Financial Statements as of December 31, 2017 and 2016
and for the Years Ended December 31, 2017, 2016 and 2015 (Continued)
other property income was $1,066,000, $2,510,000 and $2,571,000 for the years ended December 31, 2017, 2016 and 2015, respectively.
A schedule of future amortization and accretion of acquisition related intangible assets and liabilities as of December 31, 2017, is as follows:
Assets | Liabilities | |||||||||||
Acquired | Acquired | Acquired | ||||||||||
Above-Market | In-Place | Below-Market | ||||||||||
Years Ending December 31, | Leases | Leases | Leases | |||||||||
(in thousands) | ||||||||||||
2018 | $ | 4 | $ | 932 | $ | (734 | ) | |||||
2019 | 5 | 691 | (242 | ) | ||||||||
2020 | 5 | 434 | (42 | ) | ||||||||
2021 | 5 | 434 | (42 | ) | ||||||||
2022 | 5 | 314 | (10 | ) | ||||||||
Thereafter | 13 | 582 | — | |||||||||
$ | 37 | $ | 3,387 | $ | (1,070 | ) | ||||||
7. DISCONTINUED OPERATIONS
We had reflected the lending segment, which was acquired on the Acquisition Date as disclosed in Note 1, as held for sale commencing in 2014, based on a plan approved by the Board of Directors to sell the lending segment that, when completed, would have resulted in the deconsolidation of the lending segment, which at that time was focused on small business lending in the hospitality industry. In July 2015, to maximize value, we modified our strategy from a strategy of selling the lending segment as a whole to a strategy of soliciting buyers for components of the business, including our commercial mortgage loans and the SBA 7(a) lending platform. This change in the sale methodology resulted in the need to extend the period to complete the sale of the lending segment beyond one year. In connection with our plan, we have expensed transaction costs of $6,000 and $675,000 as incurred during the years ended December 31, 2016 and 2015, respectively.
On December 17, 2015, pursuant to the modified plan, we sold substantially all of our commercial mortgage loans with a carrying value of $77,121,000 to an unrelated third-party and recognized a gain of $5,151,000. In September 2016, we discontinued our efforts to sell the SBA 7(a) lending platform, and the activities related to the SBA 7(a) lending platform have been reclassified to continuing operations for all periods presented.
F-25
CIM COMMERCIAL TRUST CORPORATION AND SUBSIDIARIES
Notes to Consolidated Financial Statements as of December 31, 2017 and 2016
and for the Years Ended December 31, 2017, 2016 and 2015 (Continued)
On December 29, 2016, we sold our commercial real estate lending subsidiary, which was classified as held for sale and had a carrying value of $27,587,000, which was equal to management's estimate of fair value, to a fund managed by an affiliate of CIM Group (Note 15). We did not recognize any gain or loss in connection with the transaction. Management's estimate of fair value was determined with assistance from an independent third-party valuation firm. Our gain on sale of our commercial real estate lending subsidiary and our commercial mortgage loans was computed as follows for the years ended December 31, 2016 and 2015, respectively:
Year Ended December 31, | |||||||
2016 | 2015 | ||||||
(in thousands) | |||||||
Proceeds received | $ | 27,587 | $ | 84,928 | |||
Less: Carrying value (1) | (27,587 | ) | (77,121 | ) | |||
Gain on sale before transaction costs | — | 7,807 | |||||
Transaction costs (2) | — | (2,656 | ) | ||||
Gain on disposition of assets held for sale | $ | — | $ | 5,151 | |||
(1) | For commercial mortgage loans sold during the year ended December 31, 2015, includes unamortized acquisition discounts of $15,951,000 as of the date of sale. |
(2) | Transaction costs for the year ended December 31, 2015 include $1,638,000 paid to CIM SBA Staffing, LLC, an affiliate of CIM Group, for reimbursement of costs in connection with the sale of substantially all of our commercial mortgage loans to an unrelated third-party. |
The following is the detail of the carrying value of assets and liabilities at the time of sale of our commercial real estate lending subsidiary that was sold in December 2016:
(in thousands) | |||
Assets (1) | |||
Commercial real estate loans, net | $ | 52,822 | |
Cash and cash equivalents | 821 | ||
Restricted cash | 1,076 | ||
Accounts receivable, net | 684 | ||
Other assets | 23 | ||
Total assets held for sale, net | 55,426 | ||
Liabilities (1) | |||
Debt | 25,941 | ||
Accounts payable and accrued expenses | 503 | ||
Other liabilities | 1,395 | ||
Total liabilities associated with assets held for sale | 27,839 | ||
Carrying value | $ | 27,587 | |
(1) | Management estimated that the fair value of the assets held for sale and the liabilities associated with assets held for sale approximated their carrying value at the time of the sale. Management's estimate of the fair value of the commercial real estate loans was determined with assistance from an independent third-party valuation firm. |
F-26
CIM COMMERCIAL TRUST CORPORATION AND SUBSIDIARIES
Notes to Consolidated Financial Statements as of December 31, 2017 and 2016
and for the Years Ended December 31, 2017, 2016 and 2015 (Continued)
The following is the detail of income from operations of assets held for sale classified as discontinued operations on the consolidated statements of operations:
Year Ended December 31, | |||||||
2016 | 2015 | ||||||
(in thousands) | |||||||
Revenue - Interest and other income | $ | 6,389 | $ | 14,544 | |||
Expenses: | |||||||
Interest expense | 1,944 | 132 | |||||
Fees to related party | 550 | 777 | |||||
General and administrative | 42 | 495 | |||||
Total expenses | 2,536 | 1,404 | |||||
Income from operations of assets held for sale | 3,853 | 13,140 | |||||
Gain on disposition of assets held for sale | — | 5,151 | |||||
Net income from discontinued operations | $ | 3,853 | $ | 18,291 | |||
During the year ended December 31, 2017, we sold our five multifamily properties to unrelated third parties. We have assessed the sale of our multifamily properties (Note 3) in accordance with ASC 205-20, Discontinued Operations. In our assessment, we considered, among other factors, the materiality of the revenue, net operating income, and total assets of our multifamily segment for the years ended December 31, 2017, 2016, and 2015. Based on our qualitative and quantitative assessment, we concluded the disposals do not represent a strategic shift that will have a major effect on our operations and financial results and they should not be classified as discontinued operations on our consolidated financial statements.
F-27
CIM COMMERCIAL TRUST CORPORATION AND SUBSIDIARIES
Notes to Consolidated Financial Statements as of December 31, 2017 and 2016
and for the Years Ended December 31, 2017, 2016 and 2015 (Continued)
8. DEBT
Information on our debt is as follows:
December 31, | ||||||||
2017 | 2016 | |||||||
(in thousands) | ||||||||
Mortgage loans with a fixed interest rate of 4.14% per annum, with monthly payments of interest only, and balances totaling $370,300,000 due on July 1, 2026. The loans are nonrecourse. In September 2017, one loan with an outstanding principal balance of $21,700,000 was assumed by the buyer in connection with the sale of the property that was collateral for the loan (Note 3). | $ | 370,300 | $ | 392,000 | ||||
Mortgage loan with a fixed interest rate of 4.50% per annum, with monthly payments of interest only for 10 years, and payments of interest and principal starting in February 2022. The loan has a $42,008,000 balance due on January 5, 2027. The loan is nonrecourse. | 46,000 | 46,000 | ||||||
Mortgage loans with a fixed interest rate of 5.39% per annum, with monthly payments of principal and interest, and balances totaling $35,695,000 due on March 1, 2021. The loans were nonrecourse. The loans were repaid in May and June 2017 in connection with the sale of the properties that were collateral for the loans (Note 3). | — | 39,134 | ||||||
Mortgage loan with a fixed interest rate of 5.18% per annum, with monthly payments of principal and interest, and a balance of $26,232,000 due on June 5, 2021. The loan was nonrecourse. The loan was assumed by the buyer in December 2017 in connection with the sale of the property that was collateral for the loan (Note 3). | — | 29,167 | ||||||
Mortgage loan with a fixed interest rate of 6.65% per annum, with monthly payments of principal and interest. The loan had a 25-year amortization schedule with a $21,136,000 balance due on July 15, 2018. The loan was nonrecourse. The loan was repaid in March 2017 in connection with the sale of the property that was collateral for the loan (Note 3). | — | 26,136 | ||||||
416,300 | 532,437 | |||||||
Deferred loan costs related to mortgage loans | (1,540 | ) | (2,366 | ) | ||||
Premiums and discounts on assumed mortgages, net | — | 722 | ||||||
Total Mortgages Payable | 414,760 | 530,793 | ||||||
Secured borrowing principal on SBA 7(a) loans sold for a premium and excess spread—variable rate, reset quarterly, based on prime rate with weighted average coupon rate of 4.85% and 4.13% at December 31, 2017 and 2016, respectively. | 16,812 | 23,122 | ||||||
Secured borrowing principal on SBA 7(a) loans sold for excess spread—variable rate, reset quarterly, based on prime rate with weighted average coupon rate of 2.60% and 1.83% at December 31, 2017 and 2016, respectively. | 3,879 | 4,777 | ||||||
20,691 | 27,899 | |||||||
Unamortized premiums | 1,466 | 2,077 | ||||||
Total Secured Borrowings—Government Guaranteed Loans | 22,157 | 29,976 | ||||||
Unsecured term loan facility | 170,000 | 385,000 | ||||||
Junior subordinated notes with a variable interest rate which resets quarterly based on the 90-day LIBOR (as defined below) plus 3.25%, with quarterly interest only payments. Balance due at maturity on March 30, 2035. | 27,070 | 27,070 | ||||||
Unsecured credit facility | — | — | ||||||
197,070 | 412,070 | |||||||
Deferred loan costs related to unsecured term loan and credit facilities | (1,198 | ) | (2,938 | ) | ||||
Discount on junior subordinated notes | (1,937 | ) | (2,015 | ) | ||||
Total Other | 193,935 | 407,117 | ||||||
Total Debt | $ | 630,852 | $ | 967,886 | ||||
F-28
CIM COMMERCIAL TRUST CORPORATION AND SUBSIDIARIES
Notes to Consolidated Financial Statements as of December 31, 2017 and 2016
and for the Years Ended December 31, 2017, 2016 and 2015 (Continued)
The mortgages payable are secured by deeds of trust on certain of the properties and assignments of rents.
The junior subordinated notes may be redeemed at par at our option.
Secured borrowings—government guaranteed loans represent sold loans which are treated as secured borrowings because the loan sales did not meet the derecognition criteria provided for in ASC 860-30, Secured Borrowing and Collateral. These loans included cash premiums that are amortized as a reduction to interest expense over the life of the loan using the effective interest method and are fully amortized when the underlying loan is repaid in full.
Deferred loan costs, which represent legal and third-party fees incurred in connection with our borrowing activities, are capitalized and amortized to interest expense on a straight-line basis over the life of the related loan, approximating the effective interest method. Deferred loan costs of $3,843,000 and $7,122,000 are presented net of accumulated amortization of $1,105,000 and $1,818,000 at December 31, 2017 and 2016, respectively, and are a reduction to total debt.
In September 2014, CIM Commercial entered into an $850,000,000 unsecured credit facility with a bank syndicate consisting of a $450,000,000 revolver, a $325,000,000 term loan and a $75,000,000 delayed-draw term loan. CIM Commercial is subject to certain financial maintenance covenants and a minimum property ownership condition. Outstanding advances under the revolver bear interest at (i) the base rate plus 0.20% to 1.00% or (ii) the London Interbank Offered Rate ("LIBOR") plus 1.20% to 2.00%, depending on the maximum consolidated leverage ratio. Outstanding advances under the term loans bore interest at (i) the base rate plus 0.15% to 0.95% or (ii) LIBOR plus 1.15% to 1.95%, depending on the maximum consolidated leverage ratio. The revolver is also subject to an unused commitment fee of 0.15% or 0.25% depending on the amount of aggregate unused commitments. The delayed-draw term loan was also subject to an unused line fee of 0.25%. Proceeds from the unsecured credit facility were used to repay mortgage loans and outstanding balances under our prior unsecured credit facilities, for acquisitions, short-term funding of a Common Stock tender offer in June 2016, short-term funding of a private repurchase of Common Stock in June 2017, and general corporate purposes. In June 2016, we entered into six mortgage loan agreements with an aggregate principal amount of $392,000,000. A portion of the net proceeds from the loans was used to repay outstanding balances under our unsecured credit facility and the remaining portion was used to repurchase shares of our Common Stock in a private repurchase in September 2016. The June 2017 borrowing used to fund the private share repurchase was repaid using proceeds from subsequent asset sales. The credit facility was set to mature in September 2016 and, prior to maturity, we exercised the first of two-one year extension options through September 2017 and we permanently reduced the revolving credit commitment under the credit facility to $200,000,000. In August 2017, we exercised the second of two-one year extension options through September 2018 and, in connection with such exercise, we paid an extension fee of $300,000. At December 31, 2017 and 2016, $0 was outstanding under the credit facility. The unused capacity on the unsecured credit facility, based on covenant restrictions at December 31, 2017 and 2016, was approximately $97,000,000 and $200,000,000, respectively.
In May 2015, CIM Commercial entered into an unsecured term loan facility with a bank syndicate pursuant to which CIM Commercial could borrow up to a maximum of $385,000,000. The term loan facility ranks pari passu with CIM Commercial's unsecured credit facility described above; covenants under the term loan facility are substantially the same as those in the unsecured credit facility. Outstanding advances under the term loan facility bear interest at (i) the base rate plus 0.60% to 1.25% or (ii) LIBOR plus 1.60% to 2.25%, depending on the maximum consolidated leverage ratio. The unused portion of the term loan facility was also subject to an unused fee of 0.20%. The term loan facility matures in May 2022. On November 2, 2015, $385,000,000 was drawn under the term loan facility. Proceeds from the term loan facility were used to repay balances outstanding under our unsecured credit facility. At December 31, 2017 and 2016, the variable interest rate on this unsecured term loan facility was 2.96% and 2.22%, respectively. The interest rate of the loan has been effectively converted to a fixed rate of 3.16% until May 8, 2020 through interest rate swaps (Note 13). On August 3, 2017, we repaid $65,000,000 of outstanding borrowings on our unsecured term loan facility. In connection with such paydown, we wrote off deferred loan costs of $601,000 and related accumulated amortization of $193,000, a proportionate amount to the borrowings being repaid, and we terminated three interest rate swaps with an aggregate notional value of $65,000,000 (Note 13). Costs incurred to terminate such swaps totaled $38,000 and are included in interest expense on our consolidated statement of operations for the year ended December 31, 2017. Additionally, on November 29, 2017, we repaid $150,000,000 of outstanding borrowings on our unsecured term loan facility. In connection with such paydown, we wrote off deferred loan costs of $1,387,000 and related accumulated amortization of $512,000, a proportionate amount to the borrowings being repaid, and we terminated four interest rate swaps with an aggregate notional value of $150,000,000 (Note 13). Such swaps were in the money at the time of their termination and we received total payments, net of fees, of $1,011,000, which are included in interest expense on our consolidated statement of
F-29
CIM COMMERCIAL TRUST CORPORATION AND SUBSIDIARIES
Notes to Consolidated Financial Statements as of December 31, 2017 and 2016
and for the Years Ended December 31, 2017, 2016 and 2015 (Continued)
operations for the year ended December 31, 2017. At December 31, 2017 and 2016, $170,000,000 and $385,000,000, respectively, was outstanding under the term loan facility.
At December 31, 2017 and 2016, we were in compliance with all of our respective financial covenants under the unsecured credit and term loan facilities.
On April 1, 2015, we paid off a mortgage with an outstanding balance of $12,364,000 using the unsecured credit facility. In addition, on September 1, 2015, we paid off two mortgages with a combined outstanding balance of $58,873,000 using the unsecured credit facility.
On March 28, 2017, in connection with the sale of an office property in San Francisco, California, we paid off a mortgage with an outstanding balance of $25,331,000 using proceeds from the sale. Additionally, we paid a prepayment penalty of $1,508,000 in connection with the prepayment of this mortgage (Note 3).
On May 30, 2017, in connection with the sale of two multifamily properties, both located in Dallas, Texas, we paid off two mortgages with an aggregate outstanding principal balance of $15,448,000 using proceeds from the sales. Additionally, we paid aggregate prepayment penalties of $1,901,000 in connection with the prepayment of these mortgages (Note 3).
On June 23, 2017, in connection with the sale of a multifamily property in Dallas, Texas, we paid off a mortgage with an outstanding principal balance of $23,333,000 using proceeds from the sale. Additionally, we paid a prepayment penalty of $2,812,000 in connection with the prepayment of this mortgage (Note 3).
On September 21, 2017, in connection with the sale of an office property in Los Angeles, California, a mortgage with an outstanding principal balance of $21,700,000, collateralized by such property, was assumed by the buyer.
On December 15, 2017, in connection with the sale of a multifamily property in Houston, Texas, a mortgage with an outstanding principal balance of $28,560,000, collateralized by such property, was assumed by the buyer.
At December 31, 2017 and 2016, accrued interest and unused commitment fees payable of $2,098,000 and $3,133,000, respectively, are included in accounts payable and accrued expenses.
Future principal payments on our debt (face value) at December 31, 2017 are as follows:
Years Ending December 31, | Secured Borrowings Principal (1) | Mortgages Payable | Other (2) | Total | ||||||||||||
(in thousands) | ||||||||||||||||
2018 | $ | 536 | $ | — | $ | — | $ | 536 | ||||||||
2019 | 739 | — | — | 739 | ||||||||||||
2020 | 772 | — | — | 772 | ||||||||||||
2021 | 806 | — | — | 806 | ||||||||||||
2022 | 841 | 679 | 170,000 | 171,520 | ||||||||||||
Thereafter | 16,997 | 415,621 | 27,070 | 459,688 | ||||||||||||
$ | 20,691 | $ | 416,300 | $ | 197,070 | $ | 634,061 | |||||||||
(1) | Principal payments are generally dependent upon cash flows received from the underlying loans. Our estimate of their repayment is based on scheduled principal payments on the underlying loans. Our estimate will differ from actual amounts to the extent we experience prepayments and/or loan liquidations or charge-offs. No payment is due unless payments are received from the borrowers on the underlying loans. |
(2) | Represents the junior subordinated notes and unsecured term loan facility. |
F-30
CIM COMMERCIAL TRUST CORPORATION AND SUBSIDIARIES
Notes to Consolidated Financial Statements as of December 31, 2017 and 2016
and for the Years Ended December 31, 2017, 2016 and 2015 (Continued)
9. STOCK-BASED COMPENSATION PLANS
The 2005 Equity Incentive Plan, which expired in June 2015, permitted the grant of options to our employees, executive officers and Board of Directors and restricted stock to our executive officers and Board of Directors for up to 300,000 shares of Common Stock, as amended. The options outstanding under the plan were forfeited on January 31, 2015.
On May 6, 2015, our stockholders approved the 2015 Equity Incentive Plan which permits the grant of restricted shares to our non-employee Board of Directors, other than shares issued as set forth in Note 16, for an aggregate of up to 400,000 shares of Common Stock.
Options—No options were granted or outstanding during the years ended December 31, 2017 and 2016. As of January 1, 2015, 17,050 options with a weighted average exercise price of $20.46 were outstanding. On January 31, 2015, such options were forfeited in accordance with the plan and no compensation expense was recognized during the year ended December 31, 2015 related to these options.
Restricted Shares—A summary of our restricted shares as of December 31, 2017, 2016 and 2015 and the changes during the years ended is as follows:
2017 | ||||||
Weighted | ||||||
Average Grant | ||||||
Number of | Date Fair Value | |||||
Shares | Per Share | |||||
Balance, January 1 | 10,844 | $ | 18.75 | |||
Granted | 9,585 | $ | 15.65 | |||
Vested | (10,844 | ) | $ | 18.75 | ||
Balance, December 31 | 9,585 | $ | 15.65 | |||
2016 | ||||||
Weighted | ||||||
Average Grant | ||||||
Number of | Date Fair Value | |||||
Shares | Per Share | |||||
Balance, January 1 | 8,002 | $ | 18.27 | |||
Granted | 10,176 | $ | 18.87 | |||
Vested | (7,334 | ) | $ | 18.10 | ||
Balance, December 31 | 10,844 | $ | 18.75 | |||
2015 | ||||||
Weighted | ||||||
Average Grant | ||||||
Number of | Date Fair Value | |||||
Shares | Per Share | |||||
Balance, January 1 | 7,334 | $ | 21.32 | |||
Granted | 8,000 | $ | 17.81 | |||
Vested | (7,332 | ) | $ | 17.82 | ||
Balance, December 31 | 8,002 | $ | 18.27 | |||
F-31
CIM COMMERCIAL TRUST CORPORATION AND SUBSIDIARIES
Notes to Consolidated Financial Statements as of December 31, 2017 and 2016
and for the Years Ended December 31, 2017, 2016 and 2015 (Continued)
In April 2015, we granted awards of 2,000 restricted shares of Common Stock to each of the independent members of the Board of Directors (6,000 in aggregate) under the 2015 Equity Incentive Plan, which fully vested in April 2016 based on one year of continuous service. In May 2016, we granted awards of 3,392 restricted shares of Common Stock to each of the independent members of the Board of Directors (10,176 in aggregate) under the 2015 Equity Incentive Plan, which fully vested in May 2017 based on one year of continuous service. In June 2017, we granted awards of 3,195 restricted shares of Common Stock to each of the independent members of the Board of Directors (9,585 in aggregate) under the 2015 Equity Incentive Plan, which will vest over one year of continuous service. Compensation expense related to these restricted shares of Common Stock is recognized over the vesting period. We recorded compensation expense of $153,000, $155,000 and $113,000 for the years ended December 31, 2017, 2016 and 2015, respectively, related to these restricted shares of Common Stock.
We issued to two of our executive officers an aggregate of 2,000 restricted shares of Common Stock on May 6, 2014, which fully vested in May 2016, and an aggregate of 2,000 shares of Common Stock on March 6, 2015, which fully vested in March 2017. The restricted shares of Common Stock vested based on two years of continuous service with one-third of the shares of Common Stock vesting immediately upon issuance and one-third vesting at the end of each of the next two years from the date of issuance. Compensation expense related to these restricted shares of Common Stock was recognized over the vesting period. We recognized compensation expense of $1,000, $9,000 and $39,000 for the years ended December 31, 2017, 2016 and 2015, respectively, related to these restricted shares of Common Stock.
As of December 31, 2017, there was $61,000 of total unrecognized compensation expense related to shares of Common Stock which will be recognized over the next year. The estimated fair value of restricted shares vested during 2017, 2016 and 2015 was $203,000, $133,000 and $131,000, respectively.
10. EARNINGS PER SHARE ("EPS")
The computations of basic EPS are based on our weighted average shares outstanding. The basic weighted average shares of Common Stock outstanding were 69,062,000, 91,328,000 and 97,588,000 for the years ended December 31, 2017, 2016 and 2015, respectively. For the year ended December 31, 2017, the diluted weighted average shares of Common Stock outstanding were increased by 8,000 shares to reflect the dilutive effect of our Series A Preferred Stock. The computations of diluted EPS do not include outstanding Series A Preferred Warrants for the years ended December 31, 2017 and 2016, outstanding shares of Series A Preferred Stock for the year ended December 31, 2016, and outstanding stock options for the year ended December 31, 2015 because their impacts were deemed to be anti-dilutive. No stock options were outstanding during the years ended December 31, 2017 and 2016 and no shares of Series A Preferred Stock or Series A Preferred Warrants were outstanding during the year ended December 31, 2015.
EPS for the year-to-date period may differ from the sum of quarterly EPS amounts due to the required method for computing EPS in the respective periods. In addition, EPS is calculated independently for each component and may not be additive due to rounding.
F-32
CIM COMMERCIAL TRUST CORPORATION AND SUBSIDIARIES
Notes to Consolidated Financial Statements as of December 31, 2017 and 2016
and for the Years Ended December 31, 2017, 2016 and 2015 (Continued)
The following table reconciles the numerator and denominator used in computing our basic and diluted per-share amounts for net income available to common stockholders for the years ended December 31, 2017, 2016 and 2015:
Year Ended December 31, | |||||||||||
2017 | 2016 | 2015 | |||||||||
(in thousands, except per share amounts) | |||||||||||
Numerator: | |||||||||||
Net income from continuing operations | $ | 379,758 | $ | 30,712 | $ | 6,112 | |||||
Net income attributable to noncontrolling interests | (21 | ) | (18 | ) | (11 | ) | |||||
Redeemable preferred stock dividends accumulated | (1,436 | ) | — | — | |||||||
Redeemable preferred stock dividends declared | (490 | ) | (9 | ) | — | ||||||
Redeemable preferred stock redemptions | 2 | — | — | ||||||||
Numerator for basic net income from continuing operations available to common stockholders | 377,813 | 30,685 | 6,101 | ||||||||
Redeemable preferred stock dividends declared on dilutive shares | 9 | — | — | ||||||||
Numerator for dilutive net income from continuing operations available to common stockholders | 377,822 | 30,685 | 6,101 | ||||||||
Net income from discontinued operations | — | 3,853 | 18,291 | ||||||||
Numerator for basic net income available to common stockholders | $ | 377,813 | $ | 34,538 | $ | 24,392 | |||||
Numerator for diluted net income available to common stockholders | $ | 377,822 | $ | 34,538 | $ | 24,392 | |||||
Denominator: | |||||||||||
Basic weighted average shares outstanding | 69,062 | 91,328 | 97,588 | ||||||||
Effect of dilutive securities—contingently issuable shares | 8 | — | — | ||||||||
Diluted weighted average shares and common stock equivalents outstanding | 69,070 | 91,328 | 97,588 | ||||||||
Basic and diluted net income available to common stockholders per share: | |||||||||||
Continuing operations | $ | 5.47 | $ | 0.34 | $ | 0.06 | |||||
Discontinued operations | — | 0.04 | 0.19 | ||||||||
Net income | $ | 5.47 | $ | 0.38 | $ | 0.25 | |||||
11. REDEEMABLE PREFERRED STOCK
Series A Preferred Stock—We have an effective registration statement with the Securities and Exchange Commission ("SEC") with respect to the offer and sale of up to $900,000,000 of units (collectively, the "Series A Preferred Units"), with each unit consisting of (i) one share of Series A Preferred Stock, par value $0.001 per share, of the Company (collectively, the "Series A Preferred Stock") with an initial stated value of $25.00 per share ("Series A Preferred Stock Stated Value"), subject to adjustment, and (ii) one warrant (collectively, the "Series A Preferred Warrants") to purchase 0.25 of a share of Common Stock (Note 12). The registration statement allows us to sell up to a maximum of 36,000,000 Series A Preferred Units. Our Series A Preferred Stock ranks senior to our Common Stock with respect to payment of dividends and distributions of amounts upon liquidation, dissolution or winding up. Proceeds and expenses from the sale of the Series A Preferred Units are allocated to the Series A Preferred Stock and Series A Preferred Warrants using their relative fair values on the date of issuance.
Our Series A Preferred Stock is redeemable at the option of the holder (the "Series A Preferred Stock Holder") or CIM Commercial. The redemption schedule of the Series A Preferred Stock allows redemptions at the option of the Series A
F-33
CIM COMMERCIAL TRUST CORPORATION AND SUBSIDIARIES
Notes to Consolidated Financial Statements as of December 31, 2017 and 2016
and for the Years Ended December 31, 2017, 2016 and 2015 (Continued)
Preferred Stock Holder from the date of original issuance of any given shares of Series A Preferred Stock through the second year at Series A Preferred Stock Stated Value, plus accrued and unpaid dividends, subject to the payment of a 13.0% redemption fee. After year two, the redemption fee decreases to 10.0% and after year five there is no redemption fee. Also, CIM Commercial has the right to redeem the Series A Preferred Stock after year five at the Series A Preferred Stock Stated Value, plus accrued and unpaid dividends. At the Company's discretion, redemptions will be paid in cash or, on or after the first anniversary of the issuance of such shares of Series A Preferred Stock, an equal value of Common Stock based on the volume weighted average price of our Common Stock for the 20 trading days prior to the redemption.
As of December 31, 2017, we had issued 1,287,169 Series A Preferred Units and received gross proceeds of $32,179,000 ($31,998,000 of which were allocated to the Series A Preferred Stock and the remaining $181,000 were allocated to the Series A Preferred Warrants). In connection with such issuance, costs specifically identifiable to the offering of Series A Preferred Units, such as commissions, dealer manager fees and other registration fees, totaled $2,548,000 ($2,499,000 of which were allocated to the Series A Preferred Stock and the remaining $49,000 were allocated to the Series A Preferred Warrants). In addition, as of December 31, 2017, non issuance specific costs related to this offering totaled $3,527,000. As of December 31, 2017, we have reclassified and allocated $125,000 and $1,000 amount from deferred rent receivable and charges to Series A Preferred Stock and Series A Preferred Warrants, respectively, as a reduction to the gross proceeds received. Such reclassification was based on the number of Series A Preferred Units issued during the period relative to the maximum number of Series A Preferred Units expected to be issued under the offering. During the years ended December 31, 2017 and 2016, 1,265 and 0 shares of Series A Preferred Stock were redeemed. In December 2017, we received a request to redeem 600 shares of Series A Preferred Stock, which were redeemed on January 3, 2018. As of December 31, 2017, such shares are included in accounts payable and accrued expenses on our consolidated balance sheet.
On the first anniversary of the date of original issuance of a particular share of Series A Preferred Stock, we intend to reclassify such share of Series A Preferred Stock from temporary equity to permanent equity because the feature giving rise to temporary equity classification, the requirement to satisfy redemption requests in cash, lapses on the first anniversary date. As of December 31, 2017, we have reclassified $1,417,000 in net proceeds from temporary equity to permanent equity.
Holders of Series A Preferred Stock are entitled to receive, if, as and when authorized by our Board of Directors, and declared by us out of legally available funds, cumulative cash dividends on each share of Series A Preferred Stock at an annual rate of 5.5% of the Series A Preferred Stock Stated Value (i.e., the equivalent of $0.34375 per share per quarter). Dividends on each share of Series A Preferred Stock begin accruing on, and are cumulative from, the date of issuance. Cash dividends declared on our Series A Preferred Stock for the years ended December 31, 2017 and 2016 consist of the following:
Aggregate | ||||||||
Declaration Date | Payment Date | Number of Shares | Dividends Declared | |||||
(in thousands) | ||||||||
December 6, 2017 | January 16, 2018 | 1,285,304 | $ | 249 | ||||
September 7, 2017 | October 16, 2017 | 568,921 | $ | 138 | ||||
June 12, 2017 | July 17, 2017 | 308,775 | $ | 72 | ||||
March 8, 2017 | April 17, 2017 | 144,698 | $ | 31 | ||||
December 6, 2016 | January 17, 2017 | 61,435 | $ | 9 | ||||
On March 6, 2018, we declared a dividend of $0.34375 per share of our Series A Preferred Stock, or portion thereof for issuances during the period from January 1, 2018 to March 31, 2018, to be paid on April 16, 2018 to the holders of Series A Preferred Stock of record at the close of business on April 5, 2018.
Series L Preferred Stock—On November 21, 2017, in connection with our registration statement filed with the SEC and the Israel Securities Authority ("ISA") with respect to the offer and sale of up to 900,000 units (collectively, the "Series L Preferred Units"), we issued 808,074 Series L Preferred Units. Each Series L Preferred Unit consists of ten shares of Series L preferred stock, par value $0.001 per share, of the Company (collectively, the "Series L Preferred Stock") with an initial stated value, as converted to U.S. dollars ("USD"), of $28.37 per share ("Series L Preferred Stock Stated Value"), subject to
F-34
CIM COMMERCIAL TRUST CORPORATION AND SUBSIDIARIES
Notes to Consolidated Financial Statements as of December 31, 2017 and 2016
and for the Years Ended December 31, 2017, 2016 and 2015 (Continued)
adjustment. We issued 8,080,740 shares of Series L Preferred Stock in connection with the offering. We received gross proceeds of $229,251,000 from the sale of the Series L Preferred Stock, which was reduced by issuance specific offering costs, such as commissions, dealer manager fees, and other registration fees, totaling $15,928,000, a discount of $2,946,000, and non-issuance specific costs of $2,532,000. These fees have been recorded as a reduction to the gross proceeds in permanent equity.
Our Series L Preferred Stock ranks senior to our Common Stock with respect to distributions of amounts upon liquidation, dissolution or winding up and junior to our Series A Preferred Stock and Common Stock with respect to the payment of dividends.
Our Series L Preferred Stock is redeemable at the option of the holder (the "Series L Preferred Stock Holder") or CIM Commercial. From and after the fifth anniversary of the date of original issuance of the Series L Preferred Stock, each holder will have the right to require the Company to redeem, and the Company will also have the option to redeem (subject to certain conditions), such shares of Series L Preferred Stock at a redemption price equal to the Series L Preferred Stock Stated Value, plus, provided certain conditions are met, all accrued and unpaid distributions. Notwithstanding the foregoing, a holder of shares of our Series L Preferred Stock may require us to redeem such shares at any time prior to the fifth anniversary of the date of original issuance of the Series L Preferred Stock if (1) we do not declare and pay in full the distributions on the Series L Preferred Stock for any annual period prior to such fifth anniversary (provided that the first distribution on the Series L Preferred Stock is expected to be payable in January 2019) or (2) we do not declare and pay all accrued and unpaid distributions on the Series L Preferred Stock for all past dividend periods prior to the applicable holder redemption date. The applicable redemption price payable upon redemption of any Series L Preferred Stock will be made, in the Company's sole discretion, in the form of (A) cash in ILS at the then-current currency exchange rate determined in accordance with the Articles Supplementary defining the terms of the Series L Preferred Stock, (B) in equal value through the issuance of shares of Common Stock, with the value of such Common Stock to be deemed the lower of (i) our NAV per share of our Common Stock as most recently published by the Company as of the effective date of redemption and (ii) the volume-weighted average price of our Common Stock, determined in accordance with the Articles Supplementary defining the terms of the Series L Preferred Stock, or (C) in a combination of cash in ILS and our Common Stock, based on the conversion mechanisms set forth in (A) and (B), respectively. As of December 31, 2017, no shares of Series L Preferred Stock have been redeemed.
Holders of Series L Preferred Stock are entitled to receive, if, as and when authorized by our Board of Directors, and declared by us out of legally available funds, cumulative cash dividends on each share of Series L Preferred Stock at an annual rate of 5.5% of the Series L Preferred Stock Stated Value (i.e., the equivalent of $1.56035 per share per year). Dividends on each share of Series L Preferred Stock are cumulative from the date of issuance. Cash dividends on shares of Series L Preferred Stock are paid annually, with the first distribution expected to be payable in January 2019 for the period from the date of issuance through December 31, 2018. If the Company fails to timely declare distributions or fails to timely pay distributions on the Series L Preferred Stock, the annual dividend rate of the Series L Preferred Stock will temporarily increase by 1.0% per year, up to a maximum rate of 8.5%. As such, we have accumulated cash dividends of $1,436,000 on our Series L Preferred Stock as of December 31, 2017, which are included in the numerator for purposes of calculating basic and diluted net income available to common stockholders per share (Note 10).
Until the fifth anniversary of the date of original issuance of our Series L Preferred Stock, we are prohibited from issuing any shares of preferred stock ranking senior to or on parity with the Series L Preferred Stock with respect to the payment of dividends, other distributions, liquidation, and/or dissolution or winding up of the Company unless the Minimum Fixed Charge Coverage Ratio, calculated in accordance with the Articles Supplementary describing the Series L Preferred Stock, is equal to or greater than 1.25:1.00. At December 31, 2017, we were in compliance with the Series L Preferred Stock Minimum Fixed Charge Coverage Ratio.
F-35
CIM COMMERCIAL TRUST CORPORATION AND SUBSIDIARIES
Notes to Consolidated Financial Statements as of December 31, 2017 and 2016
and for the Years Ended December 31, 2017, 2016 and 2015 (Continued)
12. STOCKHOLDERS' EQUITY
Dividends
Dividends per share of Common Stock declared during the years ended December 31, 2017 and 2016 consist of the following:
Declaration Date | Payment Date | Type | Dividend Per Common Share | |||||
December 18, 2017 | January 11, 2018 | Special Cash | $ | 0.73000 | ||||
December 6, 2017 | December 28, 2017 | Regular Quarterly | $ | 0.12500 | ||||
September 7, 2017 | September 25, 2017 | Regular Quarterly | $ | 0.12500 | ||||
June 12, 2017 | June 27, 2017 | Special Cash | $ | 1.98000 | ||||
June 12, 2017 | June 27, 2017 | Regular Quarterly | $ | 0.12500 | ||||
April 5, 2017 | April 24, 2017 | Special Cash | $ | 0.28000 | ||||
March 8, 2017 | March 27, 2017 | Regular Quarterly | $ | 0.21875 | ||||
December 6, 2016 | December 23, 2016 | Regular Quarterly | $ | 0.21875 | ||||
September 12, 2016 | September 28, 2016 | Regular Quarterly | $ | 0.21875 | ||||
June 10, 2016 | June 28, 2016 | Regular Quarterly | $ | 0.21875 | ||||
March 8, 2016 | March 29, 2016 | Regular Quarterly | $ | 0.21875 | ||||
On March 6, 2018, we declared a common share dividend of $0.12500 per share of Common Stock, to be paid on March 29, 2018 to stockholders of record at the close of business on March 16, 2018.
We declared the special cash dividends detailed above to allow the common stockholders that did not participate in the share repurchases as described below to receive the economic benefit of such repurchases, Urban Partners II, LLC ("Urban II"), a fund managed by an affiliate of CIM Group, the Administrator and the Operator of CIM Commercial (each as defined in Note 15), and an affiliate of CIM REIT and CIM Urban, waived its right to receive these special cash dividends.
On December 18, 2017, we declared a special cash dividend of $0.73 per share of Common Stock, or $1,575,000 in the aggregate, that was paid on January 11, 2018 to stockholders of record on December 29, 2017.
On June 12, 2017, we declared a special cash dividend of $1.98 per share of Common Stock, or $4,271,000 in the aggregate, that was paid on June 27, 2017 to stockholders of record on June 20, 2017.
On April 5, 2017, we declared a special cash dividend of $0.28 per share of Common Stock, or $601,000 in the aggregate, that was paid on April 24, 2017 to stockholders of record on April 17, 2017.
Share Repurchases
On December 18, 2017, we repurchased, in a privately negotiated transaction, canceled and retired 14,090,909 shares of Common Stock from Urban II. The aggregate purchase price was $310,000,000, or $22.00 per share. We funded the repurchase using available cash from asset sales. As a result of the repurchase, our stockholders' equity was reduced by the amount we paid for the repurchased shares and the related expenses. The Company paid a special cash dividend, as described above, on January 11, 2018 that allowed stockholders that did not participate in the December 18, 2017 private repurchase to receive the economic benefit of such repurchase.
On June 12, 2017, we repurchased, in a privately negotiated transaction, canceled and retired 26,181,818 shares of Common Stock from Urban II. The aggregate purchase price was $576,000,000, or $22.00 per share. We funded the repurchase using available cash from asset sales and short-term borrowings on our unsecured credit facility. As a result of the repurchase, our stockholders' equity was reduced by the amount we paid for the repurchased shares and the related expenses. The Company paid a special cash dividend, as described above, on June 27, 2017 that allowed stockholders that did not participate in the June 12, 2017 private repurchase to receive the economic benefit of such repurchase.
F-36
CIM COMMERCIAL TRUST CORPORATION AND SUBSIDIARIES
Notes to Consolidated Financial Statements as of December 31, 2017 and 2016
and for the Years Ended December 31, 2017, 2016 and 2015 (Continued)
On September 14, 2016, we repurchased, in a privately negotiated transaction, canceled and retired 3,628,116 shares of Common Stock from Urban II. The aggregate purchase price was $79,819,000, or $22.00 per share. We funded the repurchase using proceeds from the six mortgage loans obtained in June 2016. As a result of the repurchase, our stockholders' equity was reduced by the amount we paid for the repurchased shares and the related expenses. The Company paid a special cash dividend, as described above, on April 24, 2017 that allowed stockholders that did not participate in the September 14, 2016 private repurchase to receive the economic benefit of such repurchase.
On May 16, 2016, we commenced a cash tender offer to purchase up to 10,000,000 shares of our Common Stock at a price of $21.00 per share. The tender offer expired on June 13, 2016. The tender offer was oversubscribed and, pursuant to the terms of the tender offer, shares of Common Stock were accepted on a pro rata basis. In connection with the tender offer, we repurchased, canceled and retired 10,000,000 shares of our Common Stock for an aggregate purchase price of $210,000,000, excluding fees and expenses related to the tender offer, which were $301,000. Based on the actual total number of shares tendered, Urban II received $208,140,000 of the aggregate purchase price paid. We funded the tender offer using available cash from asset sales and borrowings on our unsecured credit facility. As a result of the repurchase, our stockholders' equity was reduced by the amount we paid for the repurchased shares and the related expenses.
Series A Preferred Warrants
Each Series A Preferred Unit consists of (i) one share of Series A Preferred Stock (Note 11) and (ii) one Series A Preferred Warrant which allows the holder to purchase 0.25 of a share of Common Stock. The Series A Preferred Warrants are exercisable beginning on the first anniversary of the date of their original issuance until and including the fifth anniversary of the date of such issuance. The exercise price of each Series A Preferred Warrant is at a 15.0% premium to the per share estimated net asset value of our Common Stock (as most recently published by us at the time of each issuance).
Proceeds and expenses from the sale of the Series A Preferred Units are allocated to the Series A Preferred Stock and Series A Preferred Warrants using their relative fair values on the date of issuance. As of December 31, 2017, we had issued 1,287,169 Series A Preferred Warrants in connection with our offering of Series A Preferred Units and allocated net proceeds of $131,000, after specifically identifiable offering costs and allocated general offering costs, to the Series A Preferred Warrants in permanent equity.
13. DERIVATIVE FINANCIAL INSTRUMENTS AND HEDGING ACTIVITIES
Hedges of Interest Rate Risk
In order to manage financing costs and interest rate exposure related to our unsecured term loan facility (Note 8), on August 13, 2015, we entered into interest rate swap agreements with multiple counterparties. These swap agreements became effective on November 2, 2015. Each of our interest rate swap agreements meets the criteria for cash flow hedge accounting treatment and we have designated the interest rate swap agreements as cash flow hedges of the risk of variability attributable to changes in the one-month LIBOR on the term loan facility. Accordingly, the interest rate swaps are recorded on the consolidated balance sheets at fair value and the changes in the fair value of the swaps are recorded in OCI and reclassified to earnings as an adjustment to interest expense as interest becomes receivable or payable (Note 2). We do not expect any significant losses from counterparty defaults related to our swap agreements.
F-37
CIM COMMERCIAL TRUST CORPORATION AND SUBSIDIARIES
Notes to Consolidated Financial Statements as of December 31, 2017 and 2016
and for the Years Ended December 31, 2017, 2016 and 2015 (Continued)
Summary of Derivatives
The following table sets forth the key terms of our interest rate swap contracts:
Number of Interest Rate Swaps (1) (2) | Total Notional Amount | Fixed Rates | Floating Rate Index | Effective Date | Expiration Date | |||||||
(in thousands) | ||||||||||||
3 | $ | 170,000 | 1.562% - 1.565% | One-Month LIBOR | 11/2/2015 | 5/8/2020 | ||||||
(1) | See Note 14 for our fair value disclosures. |
(2) | Our interest rate swaps are not subject to master netting arrangements. |
These swaps hedge the future cash flows of interest payments on our unsecured term loan facility by fixing the rate until May 8, 2020 at a weighted average rate of 1.563% plus the credit spread, which was 1.60% at December 31, 2017 and 2016, or an all-in rate of 3.16%.
Credit-Risk-Related Contingent Features
Each of our interest rate swap agreements contains a provision under which we could also be declared in default under such agreements if we default on the term loan facility. As of December 31, 2017 and 2016, there have been no events of default under our interest rate swap agreements.
Impact of Hedges on AOCI and Consolidated Statements of Operations
The changes in the balance of each component of AOCI related to our interest rate swaps designated as cash flow hedges are as follows:
Year Ended December 31, | ||||||||||||
2017 | 2016 | 2015 | ||||||||||
(in thousands) | ||||||||||||
Accumulated other comprehensive income (loss), at beginning of period | $ | (509 | ) | $ | (2,519 | ) | $ | — | ||||
Other comprehensive income (loss) before reclassifications | 361 | (2,227 | ) | (3,381 | ) | |||||||
Amounts reclassified from accumulated other comprehensive income (loss) (1) | 1,779 | 4,237 | 862 | |||||||||
Net current period other comprehensive income (loss) | 2,140 | 2,010 | (2,519 | ) | ||||||||
Accumulated other comprehensive income (loss), at end of period | $ | 1,631 | $ | (509 | ) | $ | (2,519 | ) | ||||
(1) | The amounts from AOCI are reclassified as an increase to interest expense in the statements of operations. |
In July 2017, we determined that we would repay $65,000,000 of outstanding borrowings under our unsecured term loan facility in August 2017. On August 3, 2017, such repayment occurred and we terminated three interest rate swaps with an aggregate notional value of $65,000,000. In connection with such termination, we reclassified $8,000 related to the associated interest rate swaps from accumulated other comprehensive income to interest expense on our consolidated statement of operations for the year ended December 31, 2017. In addition, we incurred a termination fee of $38,000, which is included in interest expense on our consolidated statement of operations for the year ended December 31, 2017.
In November 2017, we determined that we would repay $150,000,000 of outstanding borrowings under our unsecured term loan facility and on November 29, 2017, such repayment occurred and we terminated four interest rate swaps with an aggregate notional value of $150,000,000. In connection with such termination, we reclassified $926,000 related to the associated interest rate swaps from accumulated other comprehensive income to interest expense on our consolidated statement
F-38
CIM COMMERCIAL TRUST CORPORATION AND SUBSIDIARIES
Notes to Consolidated Financial Statements as of December 31, 2017 and 2016
and for the Years Ended December 31, 2017, 2016 and 2015 (Continued)
of operations for the year ended December 31, 2017. Such swaps were in the money at the time of their termination and we received termination payments, net of fees, of $1,011,000, which are included in interest expense on our consolidated statement of operations for the year ended December 31, 2017.
We performed an analysis of the probability of the hedged forecasted transaction and whether, in light of the two swap terminations described above, it is still probable of occurring. Based on our analysis and the circumstances giving rise to the two swap terminations during 2017, we believe that the hedged forecasted transaction is still probable.
Future Reclassifications from AOCI
We estimate that $8,000 related to our derivatives designated as cash flow hedges will be reclassified out of AOCI as a decrease to interest expense during the next twelve months.
14. FAIR VALUE OF FINANCIAL INSTRUMENTS
Our derivative financial instruments (Note 13) are measured at fair value on a recurring basis and are presented on our consolidated balance sheets at fair value, on a gross basis, excluding accrued interest. The table below presents the fair value of our derivative financial instruments as well as their classification on our consolidated balance sheets:
December 31, | Balance Sheet | |||||||||||
2017 | 2016 | Level | Location | |||||||||
(in thousands) | ||||||||||||
Assets (Liabilities): | ||||||||||||
Interest rate swaps | $ | 1,631 | $ | (509 | ) | 2 | Other assets (Other liabilities) | |||||
Interest Rate Swaps—We estimate the fair value of our interest rate swaps by calculating the credit-adjusted present value of the expected future cash flows of each swap. The calculation incorporates the contractual terms of the derivatives, observable market interest rates which we consider to be Level 2 inputs, and credit risk adjustments, if any, to reflect the counterparty's as well as our own nonperformance risk.
The estimated fair values of those financial instruments which are not recorded at fair value on a recurring basis on our consolidated balance sheets are as follows:
December 31, 2017 | December 31, 2016 | |||||||||||||||||
Carrying | Estimated | Carrying | Estimated | |||||||||||||||
Amount | Fair Value | Amount | Fair Value | Level | ||||||||||||||
(in thousands) | ||||||||||||||||||
Assets: | ||||||||||||||||||
Loans receivable subject to credit risk | $ | 58,904 | $ | 61,277 | $ | 43,623 | $ | 43,621 | 3 | |||||||||
SBA 7(a) loans receivable, subject to secured borrowings | 21,728 | 22,157 | 29,524 | 29,976 | 3 | |||||||||||||
Commercial mortgage loans | 424 | 424 | 2,593 | 2,550 | 3 | |||||||||||||
Liabilities: | ||||||||||||||||||
Mortgages payable | 414,760 | 413,819 | 530,793 | 516,892 | 3 | |||||||||||||
Junior subordinated notes | 25,133 | 24,162 | 25,055 | 25,173 | 3 | |||||||||||||
Management's estimation of the fair value of our financial instruments other than our interest rate swaps is based on a Level 3 valuation in the fair value hierarchy established for disclosure of how a company values its financial instruments. In general, quoted market prices from active markets for the identical financial instrument (Level 1 inputs), if available, should be used to value a financial instrument. If quoted prices are not available for the identical financial instrument, then a
F-39
CIM COMMERCIAL TRUST CORPORATION AND SUBSIDIARIES
Notes to Consolidated Financial Statements as of December 31, 2017 and 2016
and for the Years Ended December 31, 2017, 2016 and 2015 (Continued)
determination should be made if Level 2 inputs are available. Level 2 inputs include quoted prices for similar financial instruments in active markets for identical or similar financial instruments in markets that are not active (i.e., markets in which there are few transactions for the financial instruments, the prices are not current, price quotations vary substantially, or in which little information is released publicly). There is limited reliable market information for our financial instruments other than our interest rate swaps and we utilize other methodologies based on unobservable inputs for valuation purposes since there are no Level 1 or Level 2 inputs available. Accordingly, Level 3 inputs are used to measure fair value.
In general, estimates of fair value may differ from the carrying amounts of the financial assets and liabilities primarily as a result of the effects of discounting future cash flows. Considerable judgment is required to interpret market data and develop estimates of fair value. Accordingly, the estimates presented are made at a point in time and may not be indicative of the amounts we could realize in a current market exchange.
The carrying amounts of our secured borrowings and unsecured credit and term loan facilities approximate their fair values, as the interest rates on these securities are variable and approximate current market interest rates.
Loans Receivable Subject to Credit Risk and Commercial Mortgage Loans—Loans receivable were initially recorded at estimated fair value at the Acquisition Date. Loans receivable originated subsequent to the Acquisition Date are recorded at cost upon origination and adjusted by net loan origination fees and discounts. In order to determine the estimated fair value of our loans receivable, we use a present value technique for the anticipated future cash flows using certain assumptions. At December 31, 2017, our assumptions included discount rates ranging from 6.25% to 9.00% and prepayment rates ranging from 7.30% to 17.50%. At December 31, 2016, our assumptions included discount rates ranging from 8.25% to 13.25% and prepayment rates ranging from 5.80% to 20.00%.
SBA 7(a) Loans Receivable, Subject to Secured Borrowings—These loans receivable represent the government guaranteed portion of loans which were sold with the proceeds received from the sale reflected as secured borrowings—government guaranteed loans. There is no credit risk associated with these loans since the SBA has guaranteed payment of the principal. In order to determine the estimated fair value of these loans receivable, we use a present value technique for the anticipated future cash flows taking into consideration the lack of credit risk and using a range of prepayment rates of 15.50% to 17.50% and 6.70% to 20.00% at December 31, 2017 and 2016, respectively.
Mortgages Payable—The fair values of mortgages payable are estimated based on current interest rates available for debt instruments with similar terms. The fair value of our mortgages payable is sensitive to fluctuations in interest rates. Discounted cash flow analysis is generally used to estimate the fair value of our mortgages payable, using rates ranging from 4.15% to 4.28% and 4.60% to 4.72% at December 31, 2017 and 2016, respectively.
Junior Subordinated Notes—The fair value of the junior subordinated notes is estimated based on current interest rates available for debt instruments with similar terms. Discounted cash flow analysis is generally used to estimate the fair value of our junior subordinated notes. The rate used was 5.94% and 4.83% at December 31, 2017 and 2016, respectively.
15. RELATED PARTY TRANSACTIONS
Asset Management and Other Fees to Related Parties
In May 2005, CIM Urban and CIM Urban REIT Management, L.P., each an affiliate of CIM REIT and CIM Group, entered into an investment management agreement, pursuant to which CIM Urban engaged CIM Urban REIT Management, L.P. to provide certain services to CIM Urban. CIM Investment Advisors, LLC, an affiliate of CIM REIT and CIM Group, registered with the SEC as an investment adviser and, in connection with such registration, CIM Urban entered into a new investment management agreement with CIM Investment Advisors, LLC, in December 2015, on terms and in scope substantially similar to those in the previous agreement, and the previous investment management agreement was terminated. The "Operator" refers to CIM Urban REIT Management, L.P. prior to December 10, 2015 and to CIM Investment Advisors, LLC on and after December 10, 2015.
F-40
CIM COMMERCIAL TRUST CORPORATION AND SUBSIDIARIES
Notes to Consolidated Financial Statements as of December 31, 2017 and 2016
and for the Years Ended December 31, 2017, 2016 and 2015 (Continued)
CIM Urban pays asset management fees to the Operator on a quarterly basis in arrears. The fee is calculated as a percentage of the daily average adjusted fair value of CIM Urban's assets:
Daily Average Adjusted Fair Value of CIM Urban's Assets | Quarterly Fee | |||||||
From Greater of | To and Including | Percentage | ||||||
(in thousands) | ||||||||
$ | — | $ | 500,000 | 0.2500% | ||||
500,000 | 1,000,000 | 0.2375% | ||||||
1,000,000 | 1,500,000 | 0.2250% | ||||||
1,500,000 | 4,000,000 | 0.2125% | ||||||
4,000,000 | 20,000,000 | 0.1000% | ||||||
The Operator earned asset management fees of $22,229,000, $25,753,000 and $24,882,000 for the years ended December 31, 2017, 2016 and 2015, respectively. At December 31, 2017 and 2016, asset management fees of $4,714,000 and $6,448,000, respectively, were due to the Operator.
CIM Management, Inc. and certain of its affiliates (collectively, the "CIM Management Entities"), all affiliates of CIM REIT and CIM Group, provide property management, leasing, and development services to CIM Urban. The CIM Management Entities earned property management fees, which are included in rental and other property operating expenses, totaling $5,034,000, $5,630,000 and $5,814,000 for the years ended December 31, 2017, 2016 and 2015, respectively. CIM Urban also reimbursed the CIM Management Entities $8,465,000, $8,630,000 and $8,319,000 during the years ended December 31, 2017, 2016 and 2015, respectively, for the cost of on-site personnel incurred on behalf of CIM Urban, which is included in rental and other property operating expenses. The CIM Management Entities earned leasing commissions of $982,000, $2,522,000 and $697,000 for the years ended December 31, 2017, 2016, and 2015, respectively, which were capitalized to deferred charges. In addition, the CIM Management Entities earned construction management fees of $1,654,000, $942,000 and $1,055,000 for the years ended December 31, 2017, 2016 and 2015, respectively, which were capitalized to investments in real estate.
At December 31, 2017 and 2016, fees payable and expense reimbursements due to the CIM Management Entities of $2,986,000 and $2,027,000, respectively, are included in due to related parties. Also included in due to related parties as of December 31, 2017 and 2016, was $849,000 and $214,000, respectively, due from the CIM Management Entities and related parties.
On the Acquisition Date, pursuant to the terms of the Merger Agreement, CIM Commercial and its subsidiaries entered into the Master Services Agreement (the "Master Services Agreement") with CIM Service Provider, LLC (the "Administrator"), an affiliate of CIM Group, pursuant to which the Administrator has agreed to provide, or arrange for other service providers to provide, management and administration services to CIM Commercial and its subsidiaries following the Merger. Pursuant to the Master Services Agreement, we appointed an affiliate of CIM Group as the administrator of Urban Partners GP, LLC. Under the Master Services Agreement, CIM Commercial pays a base service fee (the "Base Service Fee") to the Administrator initially set at $1,000,000 per year (subject to an annual escalation by a specified inflation factor beginning on January 1, 2015), payable quarterly in arrears. For the years ended December 31, 2017, 2016 and 2015, the Administrator earned a Base Service Fee of $1,060,000, $1,043,000 and $1,010,000, respectively. In addition, pursuant to the terms of the Master Services Agreement, the Administrator may receive compensation and/or reimbursement for performing certain services for CIM Commercial and its subsidiaries that are not covered under the Base Service Fee. During the years ended December 31, 2017, 2016 and 2015, such services performed by the Administrator included accounting, tax, reporting, internal audit, legal, compliance, risk management, IT, human resources and corporate communications. The Administrator's compensation is based on the salaries and benefits of the employees of the Administrator and/or its affiliates who performed these services (allocated based on the percentage of time spent on the affairs of CIM Commercial and its subsidiaries). For the years ended December 31, 2017, 2016 and 2015, we expensed $3,065,000, $3,120,000, and $2,993,000, respectively, for such services which are included in asset management and other fees to related parties. At December 31, 2017 and 2016, $1,963,000 and $1,935,000 was due to the Administrator, respectively, for such services.
F-41
CIM COMMERCIAL TRUST CORPORATION AND SUBSIDIARIES
Notes to Consolidated Financial Statements as of December 31, 2017 and 2016
and for the Years Ended December 31, 2017, 2016 and 2015 (Continued)
On January 1, 2015, we entered into a Staffing and Reimbursement Agreement with CIM SBA Staffing, LLC ("CIM SBA"), an affiliate of CIM Group, and our subsidiary, PMC Commercial Lending, LLC. The agreement provides that CIM SBA will provide personnel and resources to us and that we will reimburse CIM SBA for the costs and expenses of providing such personnel and resources. For the years ended December 31, 2017, 2016 and 2015, we incurred expenses related to services subject to reimbursement by us under this agreement of $3,464,000, $3,555,000 and $3,850,000, respectively, which are included in asset management and other fees to related parties for lending segment costs included in continuing operations, $433,000, $411,000 and $434,000, respectively, for corporate services, which are included in asset management and other fees to related parties, and $0, $550,000 and $777,000, respectively, which are included in discontinued operations. For the year ended December 31, 2015, we expensed $1,638,000 for transaction costs paid to CIM SBA for reimbursement of costs in connection with the sale of substantially all of our commercial mortgage loans to an unrelated third-party (Note 7). In addition, for the years ended December 31, 2017, 2016 and 2015, we deferred personnel costs of $429,000, $249,000 and $282,000, respectively, associated with services provided for originating loans.
Equity Transactions
On September 14, 2016, we repurchased, in a privately negotiated transaction, canceled and retired 3,628,116 shares of Common Stock from Urban II. The aggregate purchase price was $79,819,000, or $22.00 per share (Note 12).
On November 21, 2016, our Chief Executive Officer purchased 20,000 Series A Preferred Units (Note 11) at a price of $25.00 per Series A Preferred Unit.
On May 16, 2016, we commenced a cash tender offer to purchase up to 10,000,000 shares of our Common Stock at a price of $21.00 per share. In connection with the tender offer, we repurchased, canceled and retired 10,000,000 shares of our Common Stock for an aggregate purchase price of $210,000,000, excluding fees and expenses related to the tender offer, which were $301,000. Based on the actual total number of shares tendered, Urban II received $208,140,000 of the aggregate purchase price paid (Note 12).
On June 12, 2017, we repurchased, in a privately negotiated transaction, canceled and retired 26,181,818 shares of Common Stock from Urban II. The aggregate purchase price was $576,000,000, or $22.00 per share (Note 12).
On December 18, 2017, we repurchased, in a privately negotiated transaction, canceled and retired 14,090,909 shares of Common Stock from Urban II. The aggregate purchase price was $310,000,000, or $22.00 per share (Note 12).
Other
On October 1, 2015, an affiliate of CIM Group entered into a 5-year lease renewal with respect to a property owned by the Company. For the years ended December 31, 2017, 2016 and 2015, we recorded rental and other property income related to this tenant of $108,000, $108,000 and $104,000, respectively.
On December 29, 2016, we sold our commercial real estate lending subsidiary, which was classified as held for sale and had a carrying value of $27,587,000, which was equal to management's estimate of fair value, to a fund managed by an affiliate of CIM Group. We did not recognize any gain or loss in connection with the transaction (Note 7). Management's estimate of fair value was determined with assistance from an independent third-party valuation firm.
16. COMMITMENTS AND CONTINGENCIES
Loan Commitments—Commitments to extend credit are agreements to lend to a customer provided the terms established in the contract are met. Our outstanding loan commitments to fund loans were $16,054,000 at December 31, 2017 and are for prime-based loans to be originated by our subsidiary engaged in SBA 7(a) Program lending, the government guaranteed portion of which is intended to be sold. Commitments generally have fixed expiration dates. Since some commitments are expected to expire without being drawn upon, total commitment amounts do not necessarily represent future cash requirements.
General—In connection with the ownership and operation of real estate properties, we have certain obligations for the payment of tenant improvement allowances and lease commissions in connection with new leases and renewals. CIM
F-42
CIM COMMERCIAL TRUST CORPORATION AND SUBSIDIARIES
Notes to Consolidated Financial Statements as of December 31, 2017 and 2016
and for the Years Ended December 31, 2017, 2016 and 2015 (Continued)
Commercial had a total of $23,836,000 in future obligations under leases to fund tenant improvements and other future construction obligations at December 31, 2017. At December 31, 2017, $11,103,000 was funded to reserve accounts included in restricted cash on our consolidated balance sheet for these tenant improvement obligations in connection with the mortgage loan agreements entered into in June 2016.
Employment Agreements—We have employment agreements with two of our officers. Pursuant to these employment agreements, we issued an aggregate of 76,423 shares of Common Stock under the 2015 Equity Incentive Plan as retention bonuses to these officers in January 2016 (as each executive was not entitled to any disability, death or severance payments on such date). These shares vested immediately. We accrued associated payroll taxes of $444,000 at December 31, 2015, which were paid in January 2016, and recorded compensation expense of $0, $0 and $1,263,000 during the years ended December 31, 2017, 2016 and 2015, respectively, related to these retention bonuses. In addition, under certain circumstances, each of these employment agreements currently provides for (1) severance payment equal to the annual base salary paid to the officer and (2) death and disability payments in an amount equal to two times and one time, respectively, the annual base salary paid to the officers. At December 31, 2017, there was no unrecognized compensation expense related to these awards.
Litigation—We are not currently involved in any material pending or threatened legal proceedings nor, to our knowledge, are any material legal proceedings currently threatened against us, other than routine litigation arising in the ordinary course of business. In the normal course of business, we are periodically party to certain legal actions and proceedings involving matters that are generally incidental to our business. While the outcome of these legal actions and proceedings cannot be predicted with certainty, in management's opinion, the resolution of these legal proceedings and actions will not have a material adverse effect on our business, financial condition, results of operations, cash flow or our ability to satisfy our debt service obligations or to maintain our level of distributions on our Common Stock or Preferred Stock.
In April 2017, the City and County of San Francisco filed suit against certain of our subsidiaries and us claiming past due real property transfer tax relating to a transaction in a prior year. In June 2017, we filed a demurrer against the City and County of San Francisco. The demurrer was denied in July 2017. We filed a writ to appeal the denial of the demurrer in early August 2017. The writ was denied in August 2017 and, in order to continue to contest the asserted tax obligations, we paid the City and County of San Francisco $11,845,000 in penalties, interest and legal fees in late August 2017, which are reflected in transaction costs on our consolidated statement of operations for the year ended December 31, 2017. We filed claims for refund in January 2018 in an effort to recover the full amounts paid. At this time, we cannot determine the amount, if any, of the previously assessed and currently expensed tax obligations that will be recovered through the refund process. We believe that we have defenses to, and intend to continue to vigorously contest, the asserted tax obligations.
SBA Related—If the SBA establishes that a loss on an SBA guaranteed loan is attributable to significant technical deficiencies in the manner in which the loan was originated, funded or serviced under the SBA 7(a) Program, the SBA may seek recovery of the principal loss related to the deficiency from us. With respect to the guaranteed portion of SBA loans that have been sold, the SBA will first honor its guarantee and then seek compensation from us in the event that a loss is deemed to be attributable to technical deficiencies. Based on historical experience, we do not expect that this contingency is probable to be asserted. However, if asserted, it could have a material adverse effect on our business, financial condition, results of operations, cash flow or our ability to satisfy our debt service obligations or to maintain our level of distributions on our Common Stock or Preferred Stock.
Environmental Matters—In connection with the ownership and operation of real estate properties, we may be potentially liable for costs and damages related to environmental matters, including asbestos-containing materials. We have not been notified by any governmental authority of any noncompliance, liability, or other claim in connection with any of the properties, and we are not aware of any other environmental condition with respect to any of the properties that management believes will have a material adverse effect on our business, financial condition, results of operations, cash flow or our ability to satisfy our debt service obligations or to maintain our level of distributions on our Common Stock or Preferred Stock.
Rent Expense—Rent expense under a ground lease for a property that was sold in August 2017, which includes straight-line rent and amortization of acquired below-market ground lease, was $1,168,000, $1,752,000 and $1,752,000 the years ended December 31, 2017, 2016 and 2015, respectively. We record rent expense on a straight-line basis. Straight-line rent liability of $13,289,000 is included in other liabilities in the accompanying consolidated balance sheet as of December 31, 2016.
F-43
CIM COMMERCIAL TRUST CORPORATION AND SUBSIDIARIES
Notes to Consolidated Financial Statements as of December 31, 2017 and 2016
and for the Years Ended December 31, 2017, 2016 and 2015 (Continued)
We lease office space in Dallas, Texas under a lease which expires in May 2019. We recorded rent expense of $228,000, $226,000 and $235,000, for the years ended December 31, 2017, 2016 and 2015, respectively.
At December 31, 2017, our scheduled future noncancelable minimum lease payments were $253,000 and $106,000 for the years ending December 31, 2018 and 2019, respectively.
17. FUTURE MINIMUM LEASE RENTALS
Future minimum rental revenue under long-term operating leases at December 31, 2017, excluding tenant reimbursements of certain costs, are as follows:
Governmental | Other | |||||||||||
Years Ending December 31, | Tenants | Tenants | Total | |||||||||
(in thousands) | ||||||||||||
2018 | $ | 36,767 | $ | 84,468 | $ | 121,235 | ||||||
2019 | 35,170 | 84,723 | 119,893 | |||||||||
2020 | 32,975 | 76,238 | 109,213 | |||||||||
2021 | 22,451 | 63,119 | 85,570 | |||||||||
2022 | 11,221 | 59,365 | 70,586 | |||||||||
Thereafter | 40,318 | 144,323 | 184,641 | |||||||||
$ | 178,902 | $ | 512,236 | $ | 691,138 | |||||||
18. CONCENTRATIONS
Tenant Revenue Concentrations—Rental revenue, excluding tenant reimbursements of certain costs, from the U.S. General Services Administration and other government agencies (collectively, "Governmental Tenants"), which primarily occupy properties located in Washington, D.C., accounted for approximately 21.4%, 19.9% and 22.7% of our rental and other property income for the years ended December 31, 2017, 2016 and 2015, respectively. At December 31, 2017 and 2016, $5,130,000 and $8,339,000, respectively, was due from Governmental Tenants (Note 17).
Geographical Concentrations of Investments in Real Estate—As of December 31, 2017, 2016 and 2015, we owned 15, 20 and 20 office properties, respectively; zero, five and five multifamily properties, respectively; one, one and three hotel properties, respectively; two, three and three parking garages, respectively; and two development sites, one of which is being used as a parking lot. As of December 31, 2017, 2016 and 2015, these properties were located in two, four and four states, respectively, and Washington, D.C.
Our revenue concentrations from properties are as follows:
Year Ended December 31, | ||||||||
2017 | 2016 | 2015 | ||||||
California | 63.2 | % | 63.4 | % | 62.2 | % | ||
Washington, D.C. | 25.1 | 21.3 | 24.2 | |||||
Texas | 6.9 | 8.2 | 7.8 | |||||
North Carolina | 3.1 | 5.2 | 4.6 | |||||
New York | 1.7 | 1.9 | 1.2 | |||||
100.0 | % | 100.0 | % | 100.0 | % | |||
F-44
CIM COMMERCIAL TRUST CORPORATION AND SUBSIDIARIES
Notes to Consolidated Financial Statements as of December 31, 2017 and 2016
and for the Years Ended December 31, 2017, 2016 and 2015 (Continued)
Our real estate investments concentrations from properties are as follows:
December 31, | |||||
2017 | 2016 | ||||
California | 66.4 | % | 50.8 | % | |
Washington, D.C. | 31.2 | 32.3 | |||
Texas | 2.4 | 7.7 | |||
North Carolina | — | 5.5 | |||
New York | — | 3.7 | |||
100.0 | % | 100.0 | % | ||
19. INCOME TAXES
We have elected to be taxed as a REIT under the Code. To qualify as a REIT, we must meet a number of organizational and operational requirements, including a requirement that we distribute at least 90% of our taxable income to our stockholders. As a REIT, we generally will not be subject to corporate level federal income tax on net income that is currently distributed to stockholders.
We have wholly-owned TRS's which are subject to federal and state income taxes. The income generated from the TRS's is taxed at normal corporate rates.
The provision for income taxes results in effective tax rates that differ from federal and state statutory rates. A reconciliation of the provision for income tax attributable to the TRSs' income from continuing operations computed at federal statutory rates to the income tax provision reported in the financial statements is as follows:
Year Ended December 31, | |||||||||||
2017 | 2016 | 2015 | |||||||||
(in thousands) | |||||||||||
Income from continuing operations before income taxes for TRSs | $ | 4,878 | $ | 5,684 | $ | 3,010 | |||||
Expected federal income tax provision | $ | 1,658 | $ | 1,933 | $ | 1,023 | |||||
State income taxes | 27 | 21 | 42 | ||||||||
Change in valuation allowance | (37 | ) | (1,443 | ) | (302 | ) | |||||
Other | (272 | ) | 1,135 | 43 | |||||||
Income tax provision | $ | 1,376 | $ | 1,646 | $ | 806 | |||||
F-45
CIM COMMERCIAL TRUST CORPORATION AND SUBSIDIARIES
Notes to Consolidated Financial Statements as of December 31, 2017 and 2016
and for the Years Ended December 31, 2017, 2016 and 2015 (Continued)
The components of our net deferred tax asset, which are included in other assets, are as follows:
December 31, | |||||||
2017 | 2016 | ||||||
(in thousands) | |||||||
Deferred tax assets: | |||||||
Net operating losses | $ | 39 | $ | 59 | |||
Secured borrowings—government guaranteed loans | 308 | 706 | |||||
Other | 111 | 104 | |||||
Total gross deferred tax assets | 458 | 869 | |||||
Valuation allowance | (26 | ) | (64 | ) | |||
432 | 805 | ||||||
Deferred tax liabilities: | |||||||
Loans receivable | (333 | ) | (535 | ) | |||
Other | — | (10 | ) | ||||
(333 | ) | (545 | ) | ||||
Deferred tax asset, net | $ | 99 | $ | 260 | |||
The net operating loss carryforwards at December 31, 2017 and 2016 were generated by TRSs and are available to offset future taxable income of these TRSs. The net operating loss carryforwards expire from 2026 to 2033.
The periods subject to examination for our federal and state income tax returns are 2014 through 2017. As of December 31, 2017 and 2016, no reserves for uncertain tax positions have been established and we do not anticipate any material changes in the amount of unrecognized tax benefits recorded to occur within the next 12 months.
The Tax Cuts and Jobs Act of 2017, signed into law in late December 2017, made sweeping changes to provisions of the Code applicable to businesses. Management has reviewed these statutory changes and determined that the impact to our consolidated financial statements is not material.
20. SEGMENT DISCLOSURE
In accordance with ASC Topic 280, Segment Reporting, our reportable segments consist of three types of commercial real estate properties, namely, office, hotel and multifamily, as well as a segment for our lending business that is included in our continuing operations. The lending business that was sold during the year ended December 31, 2016, which was included in assets held for sale at December 31, 2015, is not included in our reportable segments. Management internally evaluates the operating performance and financial results of the segments based on net operating income. We also have certain general and administrative level activities, including public company expenses, legal, accounting, and tax preparation that are not considered separate operating segments. The reportable segments are accounted for on the same basis of accounting as described in Note 2.
We evaluate the performance of our real estate segments based on net operating income, which is defined as rental and other property income and expense reimbursements less property related expenses, and excludes non-property income and expenses, interest expense, depreciation and amortization, corporate related general and administrative expenses, gain (loss) on sale of real estate, impairment of real estate, transaction costs, and provision for income taxes. For the lending segment, we define net operating income as interest income net of interest expense and general overhead expenses.
F-46
CIM COMMERCIAL TRUST CORPORATION AND SUBSIDIARIES
Notes to Consolidated Financial Statements as of December 31, 2017 and 2016
and for the Years Ended December 31, 2017, 2016 and 2015 (Continued)
The net operating income of our segments included in continuing operations for the years ended December 31, 2017, 2016 and 2015 is as follows:
Year Ended December 31, | |||||||||||
2017 | 2016 | 2015 | |||||||||
(in thousands) | |||||||||||
Office: | |||||||||||
Revenues | $ | 174,004 | $ | 187,435 | $ | 188,270 | |||||
Property expenses: | |||||||||||
Operating | 68,801 | 81,217 | 80,014 | ||||||||
General and administrative | 981 | 1,234 | 771 | ||||||||
Total property expenses | 69,782 | 82,451 | 80,785 | ||||||||
Segment net operating income—office | 104,222 | 104,984 | 107,485 | ||||||||
Hotel: | |||||||||||
Revenues | 38,585 | 48,379 | 61,436 | ||||||||
Property expenses: | |||||||||||
Operating | 25,059 | 32,177 | 41,585 | ||||||||
General and administrative | 77 | 282 | 389 | ||||||||
Total property expenses | 25,136 | 32,459 | 41,974 | ||||||||
Segment net operating income—hotel | 13,449 | 15,920 | 19,462 | ||||||||
Multifamily: | |||||||||||
Revenues | 13,566 | 20,303 | 18,721 | ||||||||
Property expenses: | |||||||||||
Operating | 7,725 | 11,309 | 11,579 | ||||||||
General and administrative | 393 | 1,048 | 589 | ||||||||
Total property expenses | 8,118 | 12,357 | 12,168 | ||||||||
Segment net operating income—multifamily | 5,448 | 7,946 | 6,553 | ||||||||
Lending: | |||||||||||
Revenues | 10,221 | 9,814 | 8,521 | ||||||||
Lending expenses: | |||||||||||
Interest expense | 414 | 537 | 845 | ||||||||
Fees to related party | 3,464 | 3,555 | 3,850 | ||||||||
General and administrative | 1,010 | 1,166 | 1,032 | ||||||||
Total lending expenses | 4,888 | 5,258 | 5,727 | ||||||||
Segment net operating income—lending | 5,333 | 4,556 | 2,794 | ||||||||
Total segment net operating income | $ | 128,452 | $ | 133,406 | $ | 136,294 | |||||
F-47
CIM COMMERCIAL TRUST CORPORATION AND SUBSIDIARIES
Notes to Consolidated Financial Statements as of December 31, 2017 and 2016
and for the Years Ended December 31, 2017, 2016 and 2015 (Continued)
A reconciliation of our segment net operating income to net income attributable to the Company for the years ended December 31, 2017, 2016 and 2015 is as follows:
Year Ended December 31, | |||||||||||
2017 | 2016 | 2015 | |||||||||
(in thousands) | |||||||||||
Total segment net operating income | $ | 128,452 | $ | 133,406 | $ | 136,294 | |||||
Asset management and other fees to related parties | (26,787 | ) | (30,327 | ) | (29,319 | ) | |||||
Interest expense | (35,924 | ) | (33,848 | ) | (22,785 | ) | |||||
General and administrative | (3,018 | ) | (4,231 | ) | (6,621 | ) | |||||
Transaction costs | (11,862 | ) | (340 | ) | (1,382 | ) | |||||
Depreciation and amortization | (58,364 | ) | (71,968 | ) | (72,361 | ) | |||||
Impairment of real estate | (13,100 | ) | — | — | |||||||
Gain on sale of real estate | 401,737 | 39,666 | 3,092 | ||||||||
Income from continuing operations before provision for income taxes | 381,134 | 32,358 | 6,918 | ||||||||
Provision for income taxes | (1,376 | ) | (1,646 | ) | (806 | ) | |||||
Net income from continuing operations | 379,758 | 30,712 | 6,112 | ||||||||
Discontinued operations: | |||||||||||
Income from operations of assets held for sale | — | 3,853 | 13,140 | ||||||||
Gain on disposition of assets held for sale | — | — | 5,151 | ||||||||
Net income from discontinued operations | — | 3,853 | 18,291 | ||||||||
Net income | 379,758 | 34,565 | 24,403 | ||||||||
Net income attributable to noncontrolling interests | (21 | ) | (18 | ) | (11 | ) | |||||
Net income attributable to the Company | $ | 379,737 | $ | 34,547 | $ | 24,392 | |||||
The condensed assets for each of the segments as of December 31, 2017 and 2016, along with capital expenditures and loan originations for the years ended December 31, 2017, 2016, and 2015 are as follows:
December 31, | |||||||
2017 | 2016 | ||||||
(in thousands) | |||||||
Condensed assets: | |||||||
Office | $ | 997,808 | $ | 1,568,702 | |||
Hotel | 107,790 | 115,955 | |||||
Lending | 92,919 | 91,191 | |||||
Multifamily | 815 | 170,159 | |||||
Non-segment assets | 137,056 | 76,877 | |||||
Total assets | $ | 1,336,388 | $ | 2,022,884 | |||
F-48
CIM COMMERCIAL TRUST CORPORATION AND SUBSIDIARIES
Notes to Consolidated Financial Statements as of December 31, 2017 and 2016
and for the Years Ended December 31, 2017, 2016 and 2015 (Continued)
Year Ended December 31, | |||||||||||
2017 | 2016 | 2015 | |||||||||
(in thousands) | |||||||||||
Capital expenditures (1): | |||||||||||
Office | $ | 24,907 | $ | 30,563 | $ | 27,686 | |||||
Multifamily | 693 | 548 | 2,498 | ||||||||
Hotel | 478 | 733 | 1,158 | ||||||||
Total capital expenditures | 26,078 | 31,844 | 31,342 | ||||||||
Loan originations (2) | 76,316 | 105,201 | 59,467 | ||||||||
Total capital expenditures and loan originations (3) | $ | 102,394 | $ | 137,045 | $ | 90,809 | |||||
(1) | Represents additions and improvements to real estate investments, excluding acquisitions. |
(2) | For the year ended December 31, 2016, loan originations includes $966,000 of non-cash additions to commercial real estate loans for capitalized interest. |
(3) | Includes the activity for dispositions through their respective disposition dates. |
21. QUARTERLY FINANCIAL INFORMATION (UNAUDITED)
The following is a summary of quarterly financial information for the year ended December 31, 2017:
Three Months Ended | |||||||||||||||
March 31, | June 30, | September 30, | December 31, | ||||||||||||
(in thousands, except per share data) | |||||||||||||||
2017 | |||||||||||||||
Revenues from continuing operations | $ | 66,949 | $ | 61,299 | $ | 55,384 | $ | 52,744 | |||||||
Gain on sale of real estate | 187,734 | 116,283 | 74,715 | 23,005 | |||||||||||
Net income from continuing operations | 193,935 | 91,372 | 72,391 | 22,060 | |||||||||||
Net income | 193,935 | 91,372 | 72,391 | 22,060 | |||||||||||
Net income attributable to the Company | 193,930 | 91,363 | 72,395 | 22,049 | |||||||||||
Redeemable preferred stock dividends | (31 | ) | (72 | ) | (138 | ) | (249 | ) | |||||||
Redeemable preferred stock redemptions | — | — | — | 2 | |||||||||||
Net income available to common stockholders | 193,899 | 91,291 | 72,257 | 21,802 | |||||||||||
BASIC AND DILUTED NET INCOME AVAILABLE TO COMMON STOCKHOLDERS PER SHARE (1): | |||||||||||||||
Continuing operations | $ | 2.31 | $ | 1.16 | $ | 1.25 | $ | 0.36 | |||||||
Net income | $ | 2.31 | $ | 1.16 | $ | 1.25 | $ | 0.36 | |||||||
Weighted average shares of common stock outstanding - basic | 84,048 | 78,871 | 57,876 | 55,885 | |||||||||||
Weighted average shares of common stock outstanding - diluted | 84,048 | 78,871 | 57,876 | 55,917 | |||||||||||
(1) | EPS for the year-to-date period may differ from the sum of quarterly EPS amounts due to the required method for computing EPS in the respective periods. In addition, EPS is calculated independently for each component and may not be additive due to rounding. |
F-49
CIM COMMERCIAL TRUST CORPORATION AND SUBSIDIARIES
Notes to Consolidated Financial Statements as of December 31, 2017 and 2016
and for the Years Ended December 31, 2017, 2016 and 2015 (Continued)
The following is a summary of quarterly financial information for the year ended December 31, 2016:
Three Months Ended | |||||||||||||||
March 31, | June 30, | September 30, | December 31, | ||||||||||||
(in thousands except per share data) | |||||||||||||||
2016 | |||||||||||||||
Revenues from continuing operations | $ | 68,617 | $ | 68,360 | $ | 64,332 | $ | 64,622 | |||||||
Gain on sale of real estate | 24,739 | — | 14,927 | — | |||||||||||
Net income (loss) from continuing operations | 26,293 | (810 | ) | 8,382 | (3,153 | ) | |||||||||
Net income from discontinued operations | 690 | 1,668 | 703 | 792 | |||||||||||
Net income (loss) | 26,983 | 858 | 9,085 | (2,361 | ) | ||||||||||
Net income (loss) attributable to the Company | 26,980 | 849 | 9,088 | (2,370 | ) | ||||||||||
Redeemable preferred stock dividends | — | — | — | (9 | ) | ||||||||||
Net income (loss) available to common stockholders | 26,980 | 849 | 9,088 | (2,379 | ) | ||||||||||
BASIC AND DILUTED NET INCOME (LOSS) AVAILABLE TO COMMON STOCKHOLDERS PER SHARE (1): | |||||||||||||||
Continuing operations | $ | 0.27 | $ | (0.01 | ) | $ | 0.10 | $ | (0.04 | ) | |||||
Discontinued operations | $ | 0.01 | $ | 0.02 | $ | 0.01 | $ | 0.01 | |||||||
Net income | $ | 0.28 | $ | 0.01 | $ | 0.10 | $ | (0.03 | ) | ||||||
Weighted average shares of common stock outstanding - basic | 97,662 | 96,683 | 87,045 | 84,048 | |||||||||||
Weighted average shares of common stock outstanding - diluted | 97,662 | 96,683 | 87,045 | 84,048 | |||||||||||
(1) | EPS for the year-to-date period may differ from the sum of quarterly EPS amounts due to the required method for computing EPS in the respective periods. In addition, EPS is calculated independently for each component and may not be additive due to rounding. |
F-50
Schedule III—Real Estate and Accumulated Depreciation
December 31, 2017
(in thousands)
Initial Cost | Net Improvements (Write-Offs) Since Acquisition | Gross Amount at Which Carried | ||||||||||||||||||||||||||||||||||
Property Name, City and State | Encumbrances | Land | Building and Improvements | Land | Building and Improvements | Total | Acc. Deprec. | Year Built / Renovated | Year of Acquisition | |||||||||||||||||||||||||||
Office | ||||||||||||||||||||||||||||||||||||
260 Townsend Street | ||||||||||||||||||||||||||||||||||||
San Francisco, CA | $ | 28,200 | $ | 7,574 | $ | 13,843 | $ | 3,333 | $ | 7,574 | $ | 17,176 | $ | 24,750 | $ | 7,042 | 1986 | 2006 | ||||||||||||||||||
830 1st Street | ||||||||||||||||||||||||||||||||||||
Washington, D.C. | 46,000 | 18,095 | 62,017 | (1,104 | ) | 18,095 | 60,913 | 79,008 | 17,712 | 2002 | 2006 | |||||||||||||||||||||||||
3601 S Congress Avenue | ||||||||||||||||||||||||||||||||||||
Austin, TX | — | 9,569 | 18,593 | 2,281 | 9,569 | 20,874 | 30,443 | 7,060 | 1918/2001 | 2007 | ||||||||||||||||||||||||||
899 N Capitol Street | ||||||||||||||||||||||||||||||||||||
Washington, D.C. | — | 34,641 | 84,466 | 15,361 | 34,641 | 99,827 | 134,468 | 28,822 | 1969-1973/1999 & 2011 | 2007 | ||||||||||||||||||||||||||
999 N Capitol Street | ||||||||||||||||||||||||||||||||||||
Washington, D.C. | — | 32,221 | 86,526 | 13,615 | 32,221 | 100,141 | 132,362 | 29,563 | 1969-1973/1999 & 2011 | 2007 | ||||||||||||||||||||||||||
901 N Capitol Street | ||||||||||||||||||||||||||||||||||||
Washington, D.C. | — | 27,117 | — | 4,329 | 27,117 | 4,329 | 31,446 | 1,349 | N/A | 2007 | ||||||||||||||||||||||||||
1333 Broadway | ||||||||||||||||||||||||||||||||||||
Oakland, CA | 39,500 | 7,048 | 41,578 | 9,386 | 7,048 | 50,964 | 58,012 | 13,385 | 1972/1995 | 2008 | ||||||||||||||||||||||||||
1901 Harrison Street | ||||||||||||||||||||||||||||||||||||
Oakland, CA | 42,500 | 3,838 | 68,106 | 9,273 | 3,838 | 77,379 | 81,217 | 22,176 | 1985 | 2008 | ||||||||||||||||||||||||||
2100 Franklin Street | ||||||||||||||||||||||||||||||||||||
Oakland, CA | 80,000 | 4,277 | 34,033 | 10,506 | 4,277 | 44,539 | 48,816 | 14,489 | 2008 | 2008 | ||||||||||||||||||||||||||
2101 Webster Street | ||||||||||||||||||||||||||||||||||||
Oakland, CA | 83,000 | 4,752 | 109,812 | 32,394 | 4,752 | 142,206 | 146,958 | 41,100 | 1984 | 2008 | ||||||||||||||||||||||||||
2353 Webster Street Parking Garage | ||||||||||||||||||||||||||||||||||||
Oakland, CA | — | — | 9,138 | 29 | — | 9,167 | 9,167 | 2,125 | 1986 | 2008 | ||||||||||||||||||||||||||
1 Kaiser Plaza | ||||||||||||||||||||||||||||||||||||
Oakland, CA | 97,100 | 9,261 | 113,619 | 18,073 | 9,261 | 131,692 | 140,953 | 35,942 | 1970/2008 | 2008 | ||||||||||||||||||||||||||
2 Kaiser Plaza Parking Lot | ||||||||||||||||||||||||||||||||||||
Oakland, CA | — | 10,931 | 110 | 1,504 | 10,931 | 1,614 | 12,545 | 54 | N/A | 2015 | ||||||||||||||||||||||||||
11600 Wilshire Boulevard | ||||||||||||||||||||||||||||||||||||
Los Angeles, CA | — | 3,477 | 18,522 | 1,969 | 3,477 | 20,491 | 23,968 | 4,388 | 1955 | 2010 | ||||||||||||||||||||||||||
11620 Wilshire Boulevard | ||||||||||||||||||||||||||||||||||||
Los Angeles, CA | — | 7,672 | 51,999 | 7,949 | 7,672 | 59,948 | 67,620 | 13,291 | 1976 | 2010 | ||||||||||||||||||||||||||
4750 Wilshire Boulevard | ||||||||||||||||||||||||||||||||||||
Los Angeles, CA | — | 16,633 | 28,985 | 58 | 16,633 | 29,043 | 45,676 | 3,206 | 1984/2014 | 2014 | ||||||||||||||||||||||||||
Lindblade Media Center | ||||||||||||||||||||||||||||||||||||
Los Angeles, CA | — | 6,342 | 11,568 | — | 6,342 | 11,568 | 17,910 | 1,235 | 1930 & 1957 / 2010 | 2014 | ||||||||||||||||||||||||||
1130 Howard Street | ||||||||||||||||||||||||||||||||||||
San Francisco, CA | — | 8,290 | 10,480 | — | 8,290 | 10,480 | 18,770 | — | 1930/2016 & 2017 | 2017 | ||||||||||||||||||||||||||
Hotel | ||||||||||||||||||||||||||||||||||||
Sheraton Grand Hotel | ||||||||||||||||||||||||||||||||||||
Sacramento, CA | — | 3,497 | 107,447 | (3,688 | ) | 3,497 | 103,759 | 107,256 | 25,449 | 2001 | 2008 | |||||||||||||||||||||||||
Sheraton Grand Hotel Parking & Retail | ||||||||||||||||||||||||||||||||||||
Sacramento, CA | — | 6,550 | 10,996 | (111 | ) | 6,550 | 10,885 | 17,435 | 2,667 | 2001 | 2008 | |||||||||||||||||||||||||
$ | 416,300 | $ | 221,785 | $ | 881,838 | $ | 125,157 | $ | 221,785 | $ | 1,006,995 | $ | 1,228,780 | $ | 271,055 | |||||||||||||||||||||
The aggregate gross cost of property included above for federal income tax purposes approximates $1,233,414,000 (unaudited) as of December 31, 2017.
F-51
Schedule III—Real Estate and Accumulated Depreciation (Continued)
December 31, 2017
(in thousands)
The following table reconciles our investments in real estate from January 1, 2015 to December 31, 2017:
Year Ended December 31, | |||||||||||
2017 | 2016 | 2015 | |||||||||
(in thousands) | |||||||||||
Investments in Real Estate | |||||||||||
Balance, beginning of period | $ | 2,021,494 | $ | 2,061,372 | $ | 2,036,794 | |||||
Additions: | |||||||||||
Improvements | 26,078 | 31,844 | 31,342 | ||||||||
Property acquisitions | 18,770 | — | 11,041 | ||||||||
Deductions: | |||||||||||
Asset sales | (815,357 | ) | (61,801 | ) | (6,237 | ) | |||||
Impairment | (13,100 | ) | — | — | |||||||
Retirements | (9,105 | ) | (9,921 | ) | (11,568 | ) | |||||
Balance, end of period | $ | 1,228,780 | $ | 2,021,494 | $ | 2,061,372 | |||||
The following table reconciles the accumulated depreciation from January 1, 2015 to December 31, 2017:
Year Ended December 31, | |||||||||||
2017 | 2016 | 2015 | |||||||||
(in thousands) | |||||||||||
Accumulated Depreciation | |||||||||||
Balance, beginning of period | $ | (414,552 | ) | $ | (369,661 | ) | $ | (320,857 | ) | ||
Additions: depreciation | (49,427 | ) | (62,239 | ) | (61,915 | ) | |||||
Deductions: | |||||||||||
Asset sales | 183,819 | 7,427 | 1,543 | ||||||||
Retirements | 9,105 | 9,921 | 11,568 | ||||||||
Balance, end of period | $ | (271,055 | ) | $ | (414,552 | ) | $ | (369,661 | ) | ||
F-52
Schedule IV—Mortgage Loans on Real Estate
December 31, 2017
(dollars in thousands, except footnotes)
Principal | ||||||||||||||||||||||||||||||||
Amount of | ||||||||||||||||||||||||||||||||
Loans Subject | ||||||||||||||||||||||||||||||||
Geographic | Number | Final | Carrying | to Delinquent | ||||||||||||||||||||||||||||
Dispersion of | of | Size of Loans | Maturity | Amount of | Principal or | |||||||||||||||||||||||||||
Collateral | Loans | From | To | Interest Rate | Date Range | Mortgages (1) | "Interest" | |||||||||||||||||||||||||
SBA 7(a) Loans - States 2% or greater (2) (3): | ||||||||||||||||||||||||||||||||
Indiana | 25 | $ | 40 | $ | 1,230 | 5.75% | to | 7.00% | 01/12/36 | — | 01/27/42 | $ | 10,074 | $ | — | |||||||||||||||||
Ohio | 25 | $ | — | $ | 820 | 6.00% | to | 7.00% | 10/16/20 | — | 02/13/43 | 7,863 | — | |||||||||||||||||||
Michigan | 21 | $ | 10 | $ | 540 | 6.00% | to | 7.00% | 10/10/33 | — | 12/20/42 | 5,495 | — | |||||||||||||||||||
Texas | 25 | $ | — | $ | 650 | 5.13% | to | 7.00% | 12/12/18 | — | 01/03/43 | 4,703 | — | |||||||||||||||||||
Virginia | 8 | $ | 40 | $ | 790 | 5.75% | to | 7.00% | 03/28/27 | — | 06/29/42 | 2,806 | — | |||||||||||||||||||
South Carolina | 6 | $ | — | $ | 800 | 6.00% | to | 7.00% | 08/18/18 | — | 10/25/42 | 1,671 | — | |||||||||||||||||||
Illinois | 5 | $ | 60 | $ | 640 | 6.00% | to | 7.00% | 09/17/35 | — | 08/03/42 | 1,536 | — | |||||||||||||||||||
Florida | 8 | $ | — | $ | 350 | 6.25% | to | 7.00% | 06/19/19 | — | 06/14/41 | 1,499 | — | |||||||||||||||||||
Alabama | 6 | $ | 40 | $ | 450 | 6.00% | to | 7.00% | 07/27/25 | — | 12/28/42 | 1,455 | — | |||||||||||||||||||
Missouri | 5 | $ | 40 | $ | 600 | 6.00% | to | 7.00% | 03/29/22 | — | 10/17/42 | 1,429 | — | |||||||||||||||||||
Kentucky (4) | 6 | $ | 100 | $ | 390 | 6.25% | to | 7.00% | 04/09/35 | — | 08/17/41 | 1,270 | — | |||||||||||||||||||
Pennsylvania | 3 | $ | 320 | $ | 520 | 6.25% | to | 7.00% | 03/05/40 | — | 03/16/42 | 1,172 | — | |||||||||||||||||||
Wisconsin (5) | 8 | $ | — | $ | 290 | 6.00% | to | 7.00% | 04/23/20 | — | 06/16/42 | 1,142 | 130 | |||||||||||||||||||
North Carolina | 3 | $ | 80 | $ | 650 | 6.75% | to | 7.00% | 09/08/32 | — | 06/29/42 | 1,040 | — | |||||||||||||||||||
Georgia | 5 | $ | 80 | $ | 370 | 6.50% | to | 7.00% | 05/23/20 | — | 11/21/42 | 1,019 | — | |||||||||||||||||||
Other | 28 | $ | — | $ | 560 | 5.75% | to | 7.00% | 03/04/18 | — | 11/29/42 | 5,477 | — | |||||||||||||||||||
Government guaranteed portions (6) | 10,623 | — | ||||||||||||||||||||||||||||||
SBA 7(a) loans, subject to secured borrowings (7) | 20,691 | — | ||||||||||||||||||||||||||||||
General reserves | (333 | ) | — | |||||||||||||||||||||||||||||
187 | 80,632 | (1) | 130 | |||||||||||||||||||||||||||||
Commercial Mortgage Loan: | ||||||||||||||||||||||||||||||||
North Carolina (8) | 1 | $430 | 7.50% | 02/06/19 | 424 | — | ||||||||||||||||||||||||||
188 | $ | 81,056 | (9) | $ | 130 | |||||||||||||||||||||||||||
(1) | Excludes general reserves of $333,000. |
(2) | Includes $114,000 of loans not secured by real estate. Also includes $267,000 of loans with subordinate lien positions. |
(3) | Interest rates are variable at spreads over the prime rate unless otherwise noted. |
(4) | Includes a loan with a retained face value of $387,000 and a fixed interest rate of 6.50%. |
(5) | Includes a loan with a retained face value of $130,000, a valuation reserve of $129,000 and a fixed interest rate of 6.25%. |
(6) | Represents the government guaranteed portions of our SBA 7(a) loans detailed above retained by us. As there is no risk of loss to us related to these portions of the guaranteed loans, the geographic information is not presented as it is not meaningful. |
(7) | Represents the guaranteed portion of SBA 7(a) loans which were sold with the proceeds received from the sale reflected as secured borrowings. For Federal income tax purposes, these proceeds are treated as sales and reduce the carrying value of loans receivable. |
(8) | Loan has a fixed interest rate. |
(9) | For Federal income tax purposes, the aggregate cost basis of our loans was approximately $58,778,000 (unaudited). |
F-53
Schedule IV—Mortgage Loans on Real Estate (Continued)
December 31, 2017
(in thousands)
Balance at December 31, 2014 | $ | 189,052 | ||
Additions during period: | ||||
New mortgage loans | 59,467 | |||
Other - deferral for collection of commitment fees, net of costs | 385 | |||
Other - accretion of loan fees and discounts | 6,841 | |||
Deductions during period: | ||||
Collections of principal | (44,261 | ) | ||
Foreclosures | (708 | ) | ||
Cost of mortgages sold, net | (29,799 | ) | ||
Other - sale of mortgage loans | (77,121 | ) | ||
Other - bad debt expense, net of recoveries | (416 | ) | ||
Balance at December 31, 2015 | 103,440 | |||
Additions during period: | ||||
New mortgage loans (1) | 105,201 | |||
Other - recoveries of bad debts, net of bad debt expense | 199 | |||
Other - accretion of loan fees and discounts | 1,592 | |||
Deductions during period: | ||||
Collections of principal | (37,336 | ) | ||
Foreclosures | (92 | ) | ||
Cost of mortgages sold, net | (41,040 | ) | ||
Other - collection of commitment fees, net of costs | (739 | ) | ||
Other - reclassification from secured borrowings | (2,663 | ) | ||
Other - sale of commercial real estate loans (Note 7) | (52,822 | ) | ||
Balance at December 31, 2016 | 75,740 | |||
Additions during period: | ||||
New loans | 76,316 | |||
Other - deferral for collection of commitment fees, net of costs | 1,706 | |||
Other - accretion of loan fees and discounts | 676 | |||
Deductions during period: | ||||
Collections of principal | (17,557 | ) | ||
Foreclosures | (127 | ) | ||
Cost of mortgages sold, net | (54,973 | ) | ||
Other - reclassification from secured borrowings | (534 | ) | ||
Other - bad debt expense | (191 | ) | ||
Balance at December 31, 2017 | $ | 81,056 | ||
(1) | Includes $966,000 of non-cash additions to commercial real estate loans for interest. |
F-54