Attached files
| file | filename |
|---|---|
| EX-32.2 - EXHIBIT 32.2 - ORRSTOWN FINANCIAL SERVICES INC | ex3222017123110k.htm |
| EX-32.1 - EXHIBIT 32.1 - ORRSTOWN FINANCIAL SERVICES INC | ex3212017123110k.htm |
| EX-31.2 - EXHIBIT 31.2 - ORRSTOWN FINANCIAL SERVICES INC | ex3122017123110k.htm |
| EX-31.1 - EXHIBIT 31.1 - ORRSTOWN FINANCIAL SERVICES INC | ex3112017123110k.htm |
| EX-23.1 - EXHIBIT 23.1 - ORRSTOWN FINANCIAL SERVICES INC | ex2312017123110k.htm |
| EX-21 - EXHIBIT 21 - ORRSTOWN FINANCIAL SERVICES INC | ex212017123110k.htm |
UNITED STATES
SECURITIES AND EXCHANGE COMMISSION
Washington, D.C. 20549
FORM 10-K
ANNUAL REPORT PURSUANT TO SECTION 13 OR 15(d) OF THE SECURITIES EXCHANGE ACT OF 1934 |
For the fiscal year ended December 31, 2017
Commission file number: 001-34292
ORRSTOWN FINANCIAL SERVICES, INC.
(Exact Name of Registrant as Specified in its Charter)
Pennsylvania (State or Other Jurisdiction of Incorporation or Organization) | 23-2530374 (I.R.S. Employer Identification No.) |
77 East King Street, P. O. Box 250, Shippensburg, Pennsylvania (Address of Principal Executive Offices) | 17257 (Zip Code) |
Registrant’s Telephone Number, Including Area Code: (717) 532-6114
Securities registered pursuant to Section 12(b) of the Act:
Title of Each Class | Name of Each Exchange on Which Registered | |
Common Stock, No Par Value | The NASDAQ Capital Market | |
Securities registered pursuant to Section 12(g) of the Act: None
Indicate by check mark if the registrant is a well-known seasoned issuer, as defined in Rule 405 of the Securities Act. Yes ¨ No x
Indicate by check mark if the registrant is not required to file reports pursuant to Section 13 or Section 15(d) of the Act. Yes ¨ No x
Indicate by check mark whether the registrant (1) has filed all reports required to be filed by Section 13 or 15(d) of the Securities Exchange Act of 1934 during the preceding 12 months (or for such shorter period that the registrant was required to file such reports), and (2) has been subject to such filing requirements for the past 90 days. Yes x No ¨
Indicate by check mark whether the registrant has submitted electronically and posted on its corporate Web site, if any, every Interactive Data File required to be submitted and posted pursuant to Rule 405 of Regulation S-T (§232.405 of this chapter) during the preceding 12 months (or for such shorter period that the registrant was required to submit and post such files). Yes x No ¨
Indicate by check mark if disclosure of delinquent filers pursuant to Item 405 of Regulation S-K (§229.405 of this chapter) is not contained herein and will not be contained, to the best of registrant’s knowledge, in definitive proxy or information statements incorporated by reference in Part III of this Form 10-K or any amendment to this Form 10-K. x
Indicate by check mark whether the registrant is a large accelerated filer, an accelerated filer, a non-accelerated filer, or a smaller reporting company. See the definitions of “accelerated filer,” “large accelerated filer” and “smaller reporting company” in Rule 12b-2 of the Exchange Act.
Large accelerated filer | ¨ | Accelerated filer | x | |||
Non-accelerated filer | ¨ (Do not check if a smaller reporting company) | Smaller reporting company | ¨ | |||
Emerging growth company | ¨ | |||||
If an emerging growth company, indicate by check mark if the registrant has elected not to use the extended transition period for complying with any new or revised financial accounting standards provided pursuant to Section 13(a) of the Exchange Act. | ¨ | |||||
Indicate by check mark whether the registrant is a shell company (as defined in Rule 12b-2 of the Act.). Yes ¨ No x
The aggregate market value of the voting stock held by non-affiliates computed by reference to the price at which the common stock was last sold as of the last business day of the Registrant’s most recently completed second fiscal quarter, was approximately $180.9 million. For purposes of this calculation, the term “affiliate” refers to all directors and executive officers of the registrant, and all persons beneficially owning more than 5% of the registrant’s common stock.
Number of shares outstanding of the registrant’s common stock as of February 28, 2018: 8,412,247.
DOCUMENTS INCORPORATED BY REFERENCE
Portions of the Proxy Statement for the 2018 Annual Meeting of Shareholders are incorporated by reference in Part III of this Form 10-K.
ORRSTOWN FINANCIAL SERVICES, INC.
FORM 10-K
INDEX
Page | ||
1
Glossary of Defined Terms
The following terms may be used throughout this Report, including the consolidated financial statements and related notes.
Term | Definition |
ALL | Allowance for loan losses |
AFS | Available for sale |
AOCI | Accumulated other comprehensive income (loss) |
ASC | Accounting Standards Codification |
ASU | Accounting Standards Update |
Bank | Orrstown Bank, the commercial banking subsidiary of Orrstown Financial Services, Inc. |
CET1 | Common Equity Tier 1 |
CMO | Collateralized mortgage obligation |
Company | Orrstown Financial Services, Inc. and subsidiaries (interchangeable with "Orrstown” below) |
EPS | Earnings per common share |
ERM | Enterprise risk management |
Exchange Act | Securities Exchange Act of 1934, as amended |
FASB | Financial Accounting Standards Board |
FDIC | Federal Deposit Insurance Corporation |
FHLB | Federal Home Loan Bank |
FRB | Board of Governors of the Federal Reserve System |
GAAP | Accounting principles generally accepted in the United States of America |
GSE | United States government-sponsored enterprise |
IRC | Internal Revenue Code of 1986, as amended |
LHFS | Loans held for sale |
MBS | Mortgage-backed securities |
MPF Program | Mortgage Partnership Finance Program |
MSR | Mortgage servicing right |
NIM | Net interest margin |
OCI | Other comprehensive income (loss) |
OFA | Orrstown Financial Advisors, a division of the Bank that provides investment and brokerage services |
OREO | Other real estate owned (foreclosed real estate) |
Orrstown | Orrstown Financial Services, Inc. and subsidiaries |
OTTI | Other-than-temporary impairment |
Parent Company | Orrstown Financial Services, Inc., the parent company of Orrstown Bank and Wheatland Advisors, Inc. |
2011 Plan | 2011 Orrstown Financial Services, Inc. Incentive Stock Plan |
Repurchase Agreements | Securities sold under agreements to repurchase |
SEC | Securities and Exchange Commission |
Securities Act | Securities Act of 1933, as amended |
TDR | Troubled debt restructuring |
U.S. | United States of America |
Wheatland | Wheatland Advisors, Inc., the Registered Investment Advisor subsidiary of Orrstown Financial Services, Inc. |
Unless the context otherwise requires, the terms “Orrstown,” “we,” “us,” “our,” and “Company” refer to Orrstown Financial Services, Inc. and its subsidiaries. | |
2
PART I
Forward-Looking Statements:
From time to time, Orrstown has made and may continue to make written or oral forward-looking statements regarding our outlook for earnings, revenues, expenses, capital and liquidity levels and ratios, asset levels, asset quality, financial position and other matters regarding or affecting Orrstown and its future business and operations or the impact of legal, regulatory or supervisory matters on our business operations or performance. This Annual Report on Form 10-K also includes forward-looking statements. With respect to all such forward-looking statements, you should review our Risk Factors discussion in Item 1A, our Critical Accounting Policies and Cautionary Statement About Forward-Looking Statements sections included in Item 7, and Note 19, Contingencies, in the Notes To Consolidated Financial Statements included in Item 8 of this Annual Report on Form 10-K. We encourage readers of this report to understand forward-looking statements to be strategic objectives rather than absolute targets of future performance. Forward-looking statements speak only as of the date they are made. We do not intend to update publicly any forward-looking statements to reflect circumstances or events that occur after the date the forward-looking statements are made.
ITEM 1 – BUSINESS
Orrstown Financial Services, Inc., a Pennsylvania corporation, is the holding company for its wholly-owned subsidiaries Orrstown Bank and Wheatland Advisors, Inc. The Company’s principal executive offices are located at 77 East King Street, Shippensburg, Pennsylvania, 17257, with additional executive and administrative offices at 4750 Lindle Road, Harrisburg, Pennsylvania, 17111. The Parent Company was organized on November 17, 1987, for the purpose of acquiring the Bank and such other banks and bank-related activities as are permitted by law and desirable. The Company provides banking and bank-related services through branches located in south central Pennsylvania, principally in Berks, Cumberland, Dauphin, Franklin, Lancaster, and Perry Counties and in Washington County, Maryland. Wheatland was acquired in December 2016 and provides services as a registered investment advisor through its office in Lancaster County, Pennsylvania.
The Company files periodic reports with the SEC in the form of quarterly reports on Form 10-Q, annual reports on Form 10-K, annual proxy statements and current reports on Form 8-K for any significant events that may arise during the year. Copies of these reports, and any amendments to such reports filed or furnished pursuant to Section 13(a) or 15(d) of the Securities Exchange Act of 1934, as amended (the “Exchange Act”), may be obtained free of charge through the SEC’s Internet site at www.sec.gov or by accessing the Company’s website at www.orrstown.com as soon as reasonably practicable after such reports are electronically filed with, or furnished to, the SEC. Information on our website shall not be considered a part of this Annual Report on Form 10-K.
Business
The Bank was originally organized in 1919 as a state-chartered bank. On March 8, 1988, in a bank holding company reorganization transaction, the Parent Company acquired 100% ownership of the Bank.
The Parent Company’s primary activity consists of owning and supervising its subsidiaries, the Bank and Wheatland. Day-to-day management is conducted by its officers, who are also Bank officers. The Parent Company has historically derived most of its income through dividends from the Bank. At December 31, 2017, the Company had total assets of $1,558,849,000, total shareholders’ equity of $144,765,000 and total deposits of $1,219,515,000.
The Parent Company has no employees. Its nine officers are employees of the Bank. On December 31, 2017, the Bank and Wheatland combined had 321 full-time and 17 part-time employees.
The Bank is engaged in commercial banking and trust business as authorized by the Pennsylvania Banking Code of 1965. This involves accepting demand, time and savings deposits, and granting loans. The Bank holds commercial, residential, consumer and agribusiness loans primarily in its market areas of Cumberland, Dauphin, Franklin, Lancaster and Perry Counties in Pennsylvania; Washington County, Maryland; and in contiguous counties. The concentrations of credit by type of loan are included in Note 4, Loans and Allowance for Loan Losses, to the Consolidated Financial Statements under Part II, Item 8, "Financial Statements and Supplementary Data." The Bank maintains a diversified loan portfolio and evaluates each customer’s creditworthiness on a case-by-case basis. The amount of collateral obtained, if deemed necessary by the Bank upon the extension of credit, is based on management’s credit evaluation of the customer pursuant to collateral standards established in the Bank’s credit policies and procedures.
3
Wheatland was acquired to supplement the Bank's trust and wealth management group and to provide opportunities for future growth in these areas.
Lending
All secured loans are supported with appraisals or evaluations of collateral. Business equipment and machinery, inventories, accounts receivable, and farm equipment are considered appropriate security, provided they meet acceptable standards for liquidity and marketability. Loans secured by real estate generally do not exceed 90% of the appraised value of the property. Loan to collateral values are monitored as part of the loan review process, and appraisals are updated as deemed appropriate under the circumstances.
Commercial Lending
A majority of the Company’s loan assets are loans for business purposes. Approximately 63% of the loan portfolio is comprised of commercial loans. The Bank makes commercial real estate, equipment, working capital and other commercial purpose loans as required by the broad range of borrowers across the Bank’s various markets.
The Bank’s credit policy dictates the underwriting requirements for the various types of loans the Bank would extend to borrowers. The policy covers such requirements as debt coverage ratios, advance rate against different forms of collateral, loan-to-value ratios (“LTV”) and maximum term.
Consumer Lending
The Bank provides home equity loans, home equity lines of credit and other consumer loans primarily through its branch network and customer call center. A large majority of the consumer loans are secured by either a first or second lien position on the borrower’s primary residential real estate. The Bank requires a LTV of no greater than 90% of the value of the real estate being taken as collateral. We also, at times, purchase consumer loans to help diversify credit risk in our loan portfolio.
Residential Lending
The Bank provides residential mortgages throughout its various markets through a network of mortgage loan officers. A majority of the residential mortgages originated are sold to secondary market investors, primarily Wells Fargo, Fannie Mae and the FHLB of Pittsburgh. All mortgages, regardless of being sold or held in the Bank’s portfolio, are generally underwritten to secondary market industry standards for prime mortgages. The Bank generally requires an LTV of no greater than 80% of the value of the real estate being taken as collateral, without the borrower obtaining private mortgage insurance.
Loan Review
The Bank has a loan review policy and program which is designed to identify and monitor risk in the lending function. The ERM Committee, comprised of executive officers and loan department personnel, is charged with the oversight of overall credit quality and risk exposure of the Bank’s loan portfolio. This includes the monitoring of the lending activities of all Bank personnel with respect to underwriting and processing new loans and the timely follow-up and corrective action for loans showing signs of deterioration in quality. The loan review program provides the Bank with an independent review of the Bank’s loan portfolio on an ongoing basis. Generally, consumer and residential mortgage loans are included in Pass categories unless a specific action, such as extended delinquencies, bankruptcy, repossession, or death of the borrower occurs, which heightens awareness as to a possible credit event.
Internal loan reviews are completed annually on all commercial relationships with a committed loan balance in excess of $500,000, which includes confirmation of risk rating by an independent credit officer. In addition, all relationships greater than $250,000 rated Substandard, Doubtful or Loss are reviewed quarterly and corresponding risk ratings are reaffirmed by the Bank's Problem Loan Committee, with subsequent reporting to the ERM Committee.
The Bank outsources its independent loan review to a third-party provider, which monitors and evaluates loan customers on a quarterly basis utilizing risk-rating criteria established in the credit policy in order to identify deteriorating trends and detect conditions which might indicate potential problem loans. The third-party loan review firm reports the results of the loan reviews quarterly to the ERM Committee for approval. The loan ratings provide the basis for evaluating the adequacy of the ALL.
4
Investment Services
Through its trust department, the Bank renders services as trustee, executor, administrator, guardian, managing agent, custodian, investment advisor, and other fiduciary activities authorized by law under the trade name "Orrstown Financial Advisors." OFA offers retail brokerage services through a third-party broker/dealer arrangement with Cetera Advisor Networks LLC. Wheatland also offers investment advisor services as a registered investment advisor. At December 31, 2017, assets under management by OFA and Wheatland totaled $1,370,950,000.
Regulation and Supervision
The Parent Company is a bank holding company registered with the FRB and has elected status as a financial holding company ("FHC"). As a registered bank holding company and FHC, the Company is subject to regulation under the Bank Holding Company Act of 1956 (the “BHC Act”) and to inspection, examination, and supervision by the Federal Reserve Bank of Philadelphia (“Federal Reserve Bank”).
The Bank is a Pennsylvania-chartered commercial bank and a member of the FRB. The operations of the Bank are subject to federal and state statutes applicable to banks chartered under Pennsylvania law, to FRB member banks and to banks whose deposits are insured by the FDIC. The Bank’s operations are also subject to regulations of the Pennsylvania Department of Banking and Securities, the FRB and the FDIC.
Wheatland is subject to periodic examination by the SEC.
Several of the more significant regulatory provisions applicable to bank holding companies and banks to which the Company and the Bank are subject are discussed below, along with certain regulatory matters concerning the Company and the Bank. To the extent that the following information describes statutory or regulatory provisions, such information is qualified in its entirety by reference to the particular statutes or regulations. Any change in applicable law or regulation may have a material effect on the business and prospects of the Company and the Bank.
Financial and Bank Holding Company Activities
As an FHC, we are permitted to engage, directly or through subsidiaries, in a wide variety of activities that are financial in nature or are incidental or complementary to a financial activity, in addition to all of the activities otherwise allowed to us.
As an FHC, the Company is generally subject to the same regulation as other bank holding companies, including the reporting, examination, supervision and consolidated capital requirements of the FRB. To preserve our FHC status, we must remain well-capitalized and well-managed and ensure that the Bank remains well-capitalized and well-managed for regulatory purposes and earns “satisfactory” or better ratings on its periodic Community Reinvestment Act (“CRA”) examinations. An FHC ceasing to meet these standards is subject to a variety of restrictions, depending on the circumstances.
If the Parent Company or the Bank are either not well-capitalized or not well-managed, the Parent Company or the Bank must promptly notify the FRB. Until compliance is restored, the FRB has broad discretion to impose appropriate limitations on an FHC’s activities. If compliance is not restored within 180 days, the FRB may ultimately require the FHC to divest its depository institutions or in the alternative, to discontinue or divest any activities that are permitted only to non-FHC bank holding companies.
If the FRB determines that an FHC or its subsidiaries do not satisfy the CRA requirements, the potential restrictions are different. In that case, until all the subsidiary institutions are restored to at least “satisfactory” CRA rating status, the FHC may not engage, directly or through a subsidiary, in any of the additional activities permissible under the BHC Act nor make additional acquisitions of companies engaged in the additional activities. However, completed acquisitions and additional activities and affiliations previously begun are left undisturbed, as the BHC Act does not require divestiture for this type of situation.
Federal Financial Regulatory Reform
The Dodd-Frank Wall Street Reform and Consumer Protection Act (the “Dodd-Frank Act”), enacted in 2010, substantially increased regulatory oversight and enforcement and imposed additional costs and risks on the operations of financial holding companies and banks.
The Dodd-Frank Act materially changed the regulation of financial institutions and the financial services industry and created a framework for regulatory reform. The Dodd-Frank Act and the regulations thereunder, some of which are still being drafted and implemented,include provisions affecting large and small financial institutions alike, including several provisions that affect the regulation of community banks and bank holding companies.
5
The Dodd-Frank Act, among other things, imposed new capital requirements on bank holding companies; changed the base for FDIC insurance assessments to a bank’s average consolidated total assets minus average tangible equity, rather than upon its deposit base; permanently raised the current standard deposit insurance limit to $250,000; and expanded the FDIC’s authority to raise insurance premiums. The legislation also called for the FDIC to raise its ratio of reserves to deposits from 1.15% to 1.35% for deposit insurance purposes by September 30, 2020 and to “offset the effect” of increased assessments on insured depository institutions with assets of less than $10 billion.
The Dodd-Frank Act also included provisions that affect corporate governance and executive compensation at all publicly-traded companies and allows financial institutions to pay interest on business checking accounts. The legislation also restricts proprietary trading by banking organizations, places restrictions on the owning or sponsoring of hedge and private equity funds, and regulates the derivatives activities of banks and their affiliates. The Dodd-Frank Act established the Financial Stability Oversight Council to identify threats to the financial stability of the U.S., promote market discipline, and respond to emerging threats to the stability of the U.S. financial system.
The Dodd-Frank Act also established the Consumer Financial Protection Bureau (the "CFPB") as an independent entity funded by the FRB. The CFPB has broad rulemaking, supervisory and enforcement authority over consumer financial products and services, including deposit products, residential mortgages, home-equity loans and credit cards. The CFPB’s rules contain provisions on mortgage-related matters such as steering incentives, and determinations as to a borrower’s ability to repay, loan servicing, and prepayment penalties. The CFPB has primary examination and enforcement authority over banks with over $10 billion in assets as to consumer financial products.
One of the announced goals of the CFPB is to bring greater consumer protection to the mortgage servicing market. The CFPB has defined a “qualified mortgage” for purposes of the Dodd-Frank Act, and set standards for mortgage lenders to determine whether a consumer has the ability to repay the mortgage. It has also issued regulations affording safe harbor legal protections for lenders making qualified loans that are not “higher priced.” The CFPB's regulations contain new mortgage servicing rules applicable to the Bank, which took effect in 2014. Changes affect notices to be given to consumers as to delinquency, foreclosure alternatives, modification applications, interest rate adjustments and options for avoiding “force-placed” insurance. Servicers are prohibited from processing foreclosures when a loan modification is pending, and must wait until a loan is more than 120 days delinquent before initiating a foreclosure action.
The servicer must provide direct and ongoing access to its personnel, and provide prompt review of any loss mitigation application. Servicers must maintain accurate and accessible mortgage records for the life of a loan and until one year after the loan is paid off or transferred.
The Bank presently services 5,000 or fewer mortgage loans which it owns or originated, so it is considered a “Small Servicer” and is exempt from certain parts of the mortgage servicing rules. The mortgage servicing requirements applicable to the Bank’s servicing operations under the new mortgage servicing rules are: adjustable rate mortgage interest rate adjustment notices; prompt payment crediting and payoff statements; limits on force-placed insurance; responses to written information requests and complaints of errors; and loss mitigation with regard to the first notice or filing for a foreclosure and no foreclosure proceedings if a borrower is performing pursuant to the terms of a loss mitigation agreement.
Federal Deposit Insurance
The Bank’s deposits are insured to applicable limits by the FDIC. The maximum deposit insurance amount is $250,000 under the Dodd-Frank Act.
The FDIC is required by the Dodd-Frank Act to return its insurance reserve ratio to 1.35% no later than September 30, 2020. Once the fund reaches 1.15%, banks larger than $10 billion in assets will be required to assume the burden of bringing the fund to 1.35%.
On June 30, 2016, the Federal Deposit Insurance Fund reached the 1.15% ratio. As required by the Dodd-Frank Act, the FDIC changed its calculation of FDIC insurance premiums. Institutions are now assigned a base rate using their examination ratings, which is then adjusted based on their leverage ratio, net income before taxes to total assets ratio, nonperforming loans and leases to gross assets ratio, other real estate owned to gross assets ratio, loan mix index, and one-year asset growth rate. The result is then further adjusted to reflect its level of unsecured debt issued, the level of unsecured depository institution debt it owns, and the level of brokered deposits (excluding reciprocal deposits) it has issued above regulatory minimums.
If the FDIC is appointed conservator or receiver of a bank upon the bank’s insolvency or the occurrence of other events, the FDIC may sell some, part or all of a bank’s assets and liabilities to another bank or repudiate or disaffirm most types of contracts to which the bank was a party if the FDIC believes such contracts are burdensome. In resolving the estate of a failed bank, the FDIC as receiver will first satisfy its own administrative expenses, and the claims of holders of U.S. deposit liabilities also have priority over those of other general unsecured creditors.
6
Liability for Banking Subsidiaries
Under the Dodd-Frank Act and applicable FRB policy, a bank holding company is expected to act as a source of financial and managerial strength to each of its subsidiary banks and to commit resources to their support. This support may be required at times when the bank holding company may not have the resources to provide it. Similarly, under the cross-guarantee provisions of the Federal Deposit Insurance Act (the “FDIA”), the FDIC can hold any FDIC-insured depository institution liable for any loss suffered or anticipated by the FDIC in connection with the “default” of a commonly controlled FDIC-insured depository institution; or any assistance provided by the FDIC to a commonly controlled FDIC-insured depository institution “in danger of default.”
Pennsylvania Banking Law
The Pennsylvania Banking Code (“Banking Code”) contains detailed provisions governing the organization, location of offices, rights and responsibilities of directors, officers, and employees, as well as corporate powers, savings and investment operations and other aspects of the Bank and its affairs. The Banking Code delegates extensive rule-making power and administrative discretion to the PDB so that the supervision and regulation of state chartered banks may be flexible and readily responsive to changes in economic conditions and in savings and lending practices.
The FDIA, however, prohibits state chartered banks from making new investments, loans, or becoming involved in activities as principal and equity investments which are not permitted for national banks unless the FDIC determines the activity or investment does not pose a significant risk of loss to the Deposit Insurance Fund; and the bank meets all applicable capital requirements. Accordingly, the additional operating authority provided to the Bank by the Banking Code is significantly restricted by the FDIA.
Dividend Restrictions
The Parent Company’s funding for cash distributions to its shareholders is derived from a variety of sources, including cash and temporary investments. One of the principal sources of those funds has historically been dividends received from the Bank. Various federal and state laws limit the amount of dividends the Bank can pay to the Parent Company without regulatory approval. In addition, federal bank regulatory agencies have authority to prohibit the Bank from engaging in an unsafe or unsound practice in conducting its business. The payment of dividends, depending upon the financial condition of the bank in question, could be deemed to constitute an unsafe or unsound practice. The ability of the Bank to pay dividends in the future may be influenced by bank regulatory policies and capital guidelines.
Regulatory Capital Requirements
Compliance by the Company and the Bank with respect to capital requirements is incorporated by reference from Note 13, Shareholders' Equity and Regulatory Capital, to the Consolidated Financial Statements under Part II, Item 8, "Financial Statements and Supplementary Data," and from the Capital Adequacy and Regulatory Matters section of Item 7, “Management’s Discussion and Analysis of Consolidated Financial Condition and Results of Operations.”
Basel III Capital Rules
Effective January 1, 2015, the Company and the Bank became subject to the Basel III Capital Rules, which substantially revised risk-based capital requirements. The Basel III Capital Rules revised the definitions and components of regulatory capital, addressed other issues affecting the numerator in banking institutions’ regulatory capital ratios, asset risk weights and other matters affecting the denominator in banking institutions’ regulatory capital ratios and replaced the existing general risk-weighting approach.
The Basel III Capital Rules introduced a new capital measure called Common Equity Tier 1 and a related regulatory capital ratio of CET1 to risk-weighted assets; increased the minimum requirements for Tier 1 Capital ratio as well as the minimum levels to be considered well capitalized under prompt corrective action; and introduced the “capital conservation buffer,” designed to absorb losses during periods of economic stress. Institutions with a ratio of CET1 to risk-weighted assets above the minimum but below the capital conservation buffer are subject to constraints on dividends, equity repurchases and discretionary bonuses to executive officers based on the amount of the shortfall. When fully phased-in on January 1, 2019, the capital standards applicable to the Parent Company and the Bank will include an additional capital conservation buffer of 2.5% of CET1, effectively resulting in minimum ratios inclusive of the capital conservation buffer of (i) CET1 to risk-weighted assets of at least 7%, (ii) Tier 1 capital to risk-weighted assets of at least 8.5%, and (iii) Total capital to risk-weighted assets of at least 10.5%.
7
The Basel III Capital Rules provide for a number of deductions from and adjustments to CET1. These include, for example, the requirement that mortgage servicing rights, deferred tax assets arising from temporary differences that could not be realized from net operating loss carrybacks and significant investments in unconsolidated financial entities be deducted from CET1 to the extent that any one such category exceeds 10% of CET1 or all such categories, in the aggregate, exceed 15% of CET1.
Under the Basel III Capital Rules, the effects of certain accumulated other comprehensive income items are not excluded from regulatory capital, including unrealized gains or losses on certain securities available for sale; however, certain banking organizations were able to make a one-time permanent election with the first filing of reports under the Basel III Capital Rules to continue to exclude these items. The Parent Company and Bank made this one-time permanent election, with the result that most AOCI items will be excluded from regulatory capital.
Implementation of the deductions and other adjustments to CET1 were phased in and will be fully implemented beginning January 1, 2018.
The Basel III Capital Rules prescribe a standardized approach for risk weightings that expands the risk-weighting categories to a larger and more risk-sensitive number of categories than previously used, depending on the nature of the assets. These categories generally range from 0%, for U.S. government and agency securities, to 600%, for certain equity exposures, and result in higher risk weights for a variety of asset categories.
Other Federal Laws and Regulations
The Company’s operations are subject to additional federal laws and regulations applicable to financial institutions, including, without limitation:
• | Privacy provisions of the Gramm-Leach-Bliley Act (the "GLB Act") and related regulations, which require us to maintain privacy policies intended to safeguard customer financial information, to disclose the policies to our customers and to allow customers to “opt out” of having their financial service providers disclose their confidential financial information to non-affiliated third parties, subject to certain exceptions; |
• | Right to Financial Privacy Act, which imposes a duty to maintain confidentiality of consumer financial records and prescribes procedures for complying with administrative subpoenas of financial records; |
• | Consumer protection rules for the sale of insurance products by depository institutions, adopted pursuant to the requirements of the GLB Act; and |
• | the USA PATRIOT Act, which requires financial institutions to take certain actions to help prevent, detect and prosecute international money laundering and the financing of terrorism. |
Future Legislation and Regulation
Changes in federal laws and regulations, as well as laws and regulations in states where the Parent Company and the Bank do business, can affect the operating environment of the Company and the Bank in substantial ways. We cannot predict whether those changes in laws and regulations will occur, and, if they occur, the ultimate effect they would have upon the financial condition or results of operations of the Company.
NASDAQ Capital Market
The Company’s common stock is listed on The NASDAQ Capital Market under the trading symbol “ORRF” and is subject to NASDAQ’s rules for listed companies.
Competition
The Bank’s principal market area consists of Berks County, Cumberland County, Dauphin County, Franklin County, Lancaster County, and Perry County, Pennsylvania, and Washington County, Maryland. The Bank serves a substantial number of depositors in this market area and contiguous counties, with the greatest concentration in Chambersburg, Shippensburg, and Carlisle, Pennsylvania and the surrounding areas.
We are subject to robust competition in our market areas. Like other depository institutions, we compete with less heavily regulated entities such as credit unions, brokerage firms, money market funds, consumer finance and credit card companies, and with other commercial banks, many of which are larger than the Bank. The principal methods of competing effectively in the
8
financial services industry include improving customer service through the quality and range of services provided, improving efficiencies and pricing services competitively. The Bank is competitive with the financial institutions in its service areas with respect to interest rates paid on time and savings deposits, service charges on deposit accounts and interest rates charged on loans.
We continue to implement strategic initiatives focused on expanding our core businesses and to explore, on an ongoing basis, acquisition, divestiture, and joint venture opportunities to the extent permitted by our regulators. We analyze each of our products and businesses in the context of shareholder return, customer demands, competitive advantages, industry dynamics, and growth potential. We believe our market area will support growth in assets and deposits in the future, which we expect to contribute to our ability to maintain or grow profitability.
ITEM 1A – RISK FACTORS
An investment in our common stock is subject to risks inherent in our business. The material risks and uncertainties that management believes affect us are described below. Before making an investment decision, you should carefully consider the risks and uncertainties described below together with all of the other information included or incorporated by reference in this report. The risks and uncertainties described below are not the only ones facing us. Additional risks and uncertainties that management is not aware of or focused on or that management currently deems immaterial may also impair our business operations. This report is qualified in its entirety by these risk factors.
If any of the following risks actually occur, our business, financial condition and results of operations could be materially and adversely affected. If this were to happen, the market price of our common stock could decline significantly, and you could lose all or part of your investment.
Risks Related to Credit
If our allowance for loan losses is not sufficient to cover actual losses, our earnings would decrease.
There is no precise method of predicting loan losses. The required level of reserves, and the related provision for loan losses, can fluctuate from year to year, based on charge-offs and/or recoveries, loan volume, credit administration practices, and local and national economic conditions, among other factors. In 2017, we recorded a provision for loan losses of $1,000,000 compared with a provision expense totaling $250,000 in 2016. The Company recorded net charge-offs of $979,000 in 2017 compared with net charge-offs of $1,043,000 in 2016. Risk elements, including nonperforming loans, troubled debt restructurings still accruing, loans greater than 90 days past due still accruing, and other real estate owned totaled $11,987,000 at December 31, 2017 compared with $8,319,000 at December 31, 2016. The ALL, which is a reserve established through a provision for loan losses charged to expense, represents management’s best estimate of probable incurred losses within the existing portfolio of loans. The level of the allowance reflects management’s evaluation of, among other factors, the status of specific impaired loans, trends in historical loss experience, delinquency, credit concentrations and economic conditions within our market area. The determination of the appropriate level of the ALL inherently involves a high degree of subjectivity and judgment and requires us to make significant estimates of current credit risks and future trends, all of which may undergo material changes. Changes in economic conditions affecting borrowers, new information regarding existing loans, identification of additional problem loans and other factors, both within and outside of our control, may require us to increase our ALL.
In addition, bank regulatory agencies periodically review our ALL and may require us to increase the provision for loan losses or to recognize further loan charge-offs, based on judgments that differ from those of management. If loan charge-offs in future periods exceed the ALL, there would be a need to record additional provisions to increase our ALL. Furthermore, growth in the loan portfolio would generally lead to an increase in the provision for loan losses. Generally, increases in our ALL will result in a decrease in net income and stockholders’ equity, and may have a material adverse effect on the financial condition of the Company, results of operations and cash flows.
The ALL was 1.27% of total loans and 116% of nonaccrual and restructured loans still accruing at December 31, 2017, compared with 1.45% of total loans and 160% of nonaccrual and restructured loans still accruing at December 31, 2016. In addition, at December 31, 2017, the top 25 lending relationships individually had commitments of $86,506,000, and an aggregate total outstanding loan balance of $182,950,000, or 18% of the loan portfolio. The deterioration of one or more of these loan relationships could result in a significant increase in the nonperforming loans and the provisions for loan losses, which would negatively impact our results of operations.
9
Commercial real estate lending may expose us to a greater risk of loss and impact our earnings and profitability.
Our business strategy involves making loans secured by commercial real estate. These types of loans generally have higher risk-adjusted returns and shorter maturities than other loans. Loans secured by commercial real estate properties are generally for larger amounts and may involve a greater degree of risk than other loans. Payments on loans secured by these properties are often dependent on the income produced by the underlying properties which, in turn, depends on the successful operation and management of the properties. Accordingly, repayment of these loans is subject to conditions in the real estate market or the local economy. In challenging economic conditions, these loans represent higher risk and could result in an increase in our total net charge-offs, requiring us to increase our ALL, which could have a material adverse effect on our financial condition or results of operations. While we seek to minimize these risks in a variety of ways, there can be no assurance that these measures will protect against credit-related losses.
Commercial and industrial loans comprise 11% of our loan portfolio. The credit risk related to these types of loans is greater than the risk related to residential loans.
Our commercial and industrial loan portfolio grew by $27,198,000, or 31%, during the year ended December 31, 2017 to $115,663,000. Commercial and industrial loans generally carry larger loan balances and involve a greater degree of risk of nonpayment or late payment than home equity loans or residential mortgage loans.
Commercial and industrial loans include advances to local and regional businesses for general commercial purposes and include permanent and short-term working capital, machinery and equipment financing, and may be either in the form of lines of credit or term loans. Although commercial and industrial loans may be unsecured to our highest rated borrowers, the majority of these loans are secured by the borrower’s accounts receivable, inventory and machinery and equipment. In a significant number of these loans, the collateral also includes the business real estate or the business owner’s personal real estate or assets. Commercial and industrial loans are more susceptible to risk of loss during a downturn in the economy, as borrowers may have greater difficulty in meeting their debt service requirements and the value of the collateral may decline. We attempt to mitigate this risk through our underwriting standards, including evaluating the creditworthiness of the borrower and, to the extent available, credit ratings on the business. Additionally, monitoring of the loans through annual renewals and meetings with the borrowers are typical. However, these procedures cannot eliminate the risk of loss associated with commercial and industrial lending.
Our commercial and industrial lending operations are located primarily in south central Pennsylvania and in Washington County, Maryland. Our borrowers’ ability to repay these loans depends largely on economic conditions in these and surrounding areas. A deterioration in the economic conditions in these market areas could materially adversely affect our operations and increase loan delinquencies, increase problem assets and foreclosures, increase claims and lawsuits, decrease the demand for our products and services and decrease the value of collateral securing loans.
Risks Related to Interest Rates and Investments
Changes in interest rates could adversely impact the Company’s financial condition and results of operations.
Our operations are subject to risks and uncertainties surrounding our exposure to changes in the interest rate environment. Operating income, net income and liquidity depend to a great extent on our net interest margin, i.e., the difference between the interest yields we receive on interest-earning assets, such as loans and securities, and the interest rates we pay on interest-bearing liabilities, such as deposits and borrowings. These rates are highly sensitive to many factors beyond our control, including competition; general economic conditions; and monetary and fiscal policies of various governmental and regulatory authorities, including the FRB. If the rate of interest we pay on our interest-bearing liabilities increases more than the rate of interest we receive on our interest-earning assets, our net interest income, and therefore our earnings, and liquidity could be materially adversely affected. Our earnings and liquidity could also be materially adversely affected if the rates on interest-earning assets fall more quickly than those on our interest-bearing liabilities.
Changes in interest rates also can affect our ability to originate loans; the ability of borrowers to repay adjustable or variable rate loans; our ability to obtain and retain deposits in competition with other available investment alternatives; and the value of interest-earning assets, which would negatively impact stockholders’ equity, and the ability to realize gains from the sale of such assets. Based on our interest rate sensitivity analyses, an increase in the general level of interest rates will negatively affect the market value of the investment portfolio because of the relatively higher duration of certain securities included in the investment portfolio.
10
Risks Related to Competition and to Our Business Strategy
Difficult economic and market conditions have adversely affected the financial services industry and may materially and adversely affect the Company.
Our operations are sensitive to general business and economic conditions in the U.S. If the growth of the U.S. economy slows, or if the economy worsens or enters into a recession, our growth and profitability could be constrained. In addition, economic conditions in foreign countries can affect the stability of global financial markets, which could impact the U.S. economy and financial markets. Weak economic conditions are characterized by deflation, fluctuations in debt and equity capital markets, including a lack of liquidity and/or depressed prices in the secondary market for mortgage loans, increased delinquencies on mortgage, consumer and commercial loans, residential and commercial real estate price declines and lower home sales and commercial activity. All of these factors are detrimental to our business. Our business is significantly affected by monetary and related policies of the U.S. federal government, its agencies and government-sponsored entities. Changes in any of these policies could have a material adverse effect on our business, financial position, results of operations and cash flows.
In particular, we may face the following risks in connection with volatility in the economic environment:
• | Loan delinquencies could increase; |
• | Problem assets and foreclosures could increase; |
• | Demand for our products and services could decline; and |
• | Collateral for loans made by us, especially real estate, could decline in value, reducing customers' borrowing power, and reducing the value of assets and collateral associated with our loans. |
Because our business is concentrated in south central Pennsylvania and Washington County, Maryland, our financial performance could be materially adversely affected by economic conditions and real estate values in these market areas.
Our operations and the properties securing our loans are primarily located in south central Pennsylvania and in Washington County, Maryland. Our operating results depend largely on economic conditions and real estate valuations in these and surrounding areas. A deterioration in the economic conditions in these market areas could materially adversely affect our operations and increase loan delinquencies, increase problem assets and foreclosures, increase claims and lawsuits, decrease the demand for our products and services and decrease the value of collateral securing loans, especially real estate, in turn reducing customers’ borrowing power, the value of assets associated with nonperforming loans and collateral coverage.
Competition from other banks and financial institutions in originating loans, attracting deposits and providing other financial services may adversely affect our profitability and liquidity.
We experience substantial competition in originating loans, both commercial and consumer loans, in our market area. This competition comes principally from other banks, savings institutions, credit unions, mortgage banking companies and other lenders. Some of our competitors enjoy advantages, including greater financial resources, and higher lending limits, a wider geographic presence, more accessible branch office locations, the ability to offer a wider array of services or more favorable pricing alternatives, as well as lower origination and operating costs. This competition could reduce our net income and liquidity by decreasing the number and size of loans that we originate and the interest rates we are able to charge on these loans.
As we expand our on-line lending capabilities, we will face competition, particularly in residential mortgage lending, from non-bank lenders (financial institutions that only make loans and do not offer deposit accounts such as a savings account or checking account) and financial technology companies (that use new technology and innovation with available resources in order to compete in the marketplace of traditional financial institutions and intermediaries in the delivery of financial services). This competition could similarly reduce our net income and liquidity.
In attracting business and consumer deposits, we face substantial competition from other insured depository institutions such as banks, savings institutions and credit unions, as well as institutions offering uninsured investment alternatives, including money market funds. Some of our competitors enjoy advantages, including more aggressive marketing campaigns, better brand recognition and more branch locations. These competitors may offer higher interest rates than we do, which could decrease the deposits that we attract or require us to increase our rates to retain existing deposits or attract new deposits. Increased deposit competition could materially adversely affect our ability to generate the funds necessary for lending operations. As a result, we may need to seek other sources of funds that may be more expensive to obtain and could increase our cost of funds.
11
The Company’s business strategy includes the continuation of moderate growth plans, and our financial condition and results of operations could be negatively affected if we fail to grow or fail to manage our growth effectively.
Loans grew $126,621,000, or 14% from $883,391,000 at December 31, 2016, to $1,010,012,000 at December 31, 2017, due to organic growth through increases in consumer, commercial and commercial real estate loans. Over the long term, we expect to continue to experience growth in loans and total assets, the level of our deposits and the scale of our operations. Achieving our growth targets requires us to successfully execute our business strategies, which includes continuing to grow our loan portfolio. Our ability to successfully grow will also depend on the continued availability of loan opportunities that meet underwriting standards. In addition, our asset quality metrics have improved sufficiently that we may consider the acquisition of other financial institutions and branches within or outside of our market area to the extent permitted by our regulators. The success of any such acquisition will depend on a number of factors, including our ability to integrate the acquired institutions or branches into the current operations of the Company; our ability to limit the outflow of deposits held by customers of the acquired institution or branch locations; our ability to control the incremental increase in noninterest expense arising from any acquisition; and our ability to retain and integrate the appropriate personnel of the acquired institution or branches. We believe we have the resources and internal systems in place to successfully achieve and manage our future growth. If we do not manage our growth effectively, we may not be able to achieve our business plan and our business and prospects could be harmed.
The Company may be adversely affected by technological advances.
Technological advances impact our business. The banking industry undergoes technological change with frequent introductions of new technology-driven products and services. In addition to improving customer services, the effective use of technology increases efficiency and enables financial institutions to reduce costs. Our future success may depend, in part, on our ability to address the needs of our current and prospective customers by using technology to provide products and services that will satisfy demands for convenience as well as to create additional efficiencies in operations.
The Company may not be able to attract and retain skilled people.
The Company’s success depends, in large part, on our ability to attract and retain skilled people. We have, at times, experienced turnover among our senior officers. Competition for the best people in most activities engaged in by us can be intense, and we may not be able to attract and hire sufficiently skilled people to fill open and newly created positions or to retain current or future employees. An inability to attract and retain individuals with the necessary skills to fill open positions, or the unexpected loss of services of one or more of our key personnel, could have a material adverse impact on our business due to the loss of their skills, knowledge of our markets, years of industry experience or the difficulty of promptly finding qualified replacement personnel.
An interruption or breach in security with respect to our information systems, or our outsourced service providers, could adversely impact the Company’s reputation and have an adverse impact on our financial condition or results of operations.
Information systems are critical to our business. We use various technological systems to manage our customer relationships, general ledger, securities investments, deposits and loans. We rely on software, communication, and information exchange on a variety of computing platforms and networks and over the internet. We have established policies and procedures to prevent or limit the effect of system failures, business interruptions and security breaches, but we cannot be certain that all of our systems are entirely free from vulnerability to attack or other technological difficulties or failures. In addition, any compromise of our systems could deter customers from using our products and services. Although we rely on security systems to provide security and authentication necessary to effect the secure transmission of data, these precautions may not protect our systems from security breaches.
We rely on the services of a variety of vendors to meet our data processing and communication needs. If these third-party providers encounter difficulties, or if we have difficulty communicating with them, our ability to adequately process and account for transactions could be affected, and our business operations could be adversely affected. Threats to information security also exist in the processing of customer information through various other vendors and their personnel.
If information security is breached or other technology difficulties or failures occur, information may be lost or misappropriated, services and operations may be interrupted and we could be exposed to claims from customers. Any of these results could have a material adverse effect on our financial condition, results of operations or liquidity.
We could be adversely affected by failure in our internal controls.
A failure in our internal controls could have a significant negative impact not only on our earnings, but also on the perception that customers, regulators and investors may have of us. We continue to devote a significant amount of effort and resources to continually strengthening our controls and ensuring compliance with complex accounting standards and banking regulations. However, these efforts may not be effective in preventing a breach in our controls.
12
Negative public opinion could damage our reputation and adversely affect our earnings.
Reputational risk, or the risk to the Company's earnings and capital from negative public opinion, is inherent in our business. Negative public opinion can result from the actual or perceived manner in which we conduct our business activities, including banking operations and trust and investment operations, our management of actual or potential conflicts of interest and ethical issues, and our protection of confidential client information. Negative public opinion can adversely affect the Company's ability to keep and attract customers and can expose the Company to litigation and regulatory action. Although we take steps to minimize reputation risk in the way we conduct our business activities and deal with our customers, communities and vendors, these steps may not be effective.
Risks Related to Regulatory Compliance and Legal Matters
Governmental regulation and regulatory actions against us may impair our operations or restrict our growth.
The Company is subject to regulation and supervision under federal and state laws and regulations. The requirements and limitations imposed by such laws and regulations limit the manner in which we conduct our business, undertake new investments and activities and obtain financing. These regulations are designed primarily for the protection of the deposit insurance funds and consumers and not to benefit our shareholders. Financial institution regulation has been the subject of significant legislation in recent years and may be the subject of further significant legislation in the future, none of which is within our control. Federal and state regulatory agencies also frequently adopt changes to their regulations or change the manner in which existing regulations are applied or enforced. The Company cannot predict the substance or impact of pending or future legislation, regulation or the application thereof. Compliance with such current and potential regulation and scrutiny may significantly increase our costs, impede the efficiency of our internal business processes, require us to increase our regulatory capital and limit our ability to pursue business opportunities in an efficient manner. Bank regulations can hinder our ability to compete with financial services companies that are not regulated in the same manner or are subject to less regulation.
The Dodd-Frank Act may affect the Company’s financial condition, results of operations, liquidity and stock price.
The Dodd-Frank Act includes provisions affecting large and small financial institutions, including several provisions that affect how community banks and bank holding companies will be regulated in the future. Among other things, these provisions relax rules regarding interstate branching; allow financial institutions to pay interest on business checking accounts; change the scope of federal deposit insurance coverage; and impose new capital requirements on bank holding companies. Many of the requirements called for in the Dodd-Frank Act will be implemented over time and will be subject to implementation regulations developed over the course of several years. Given the uncertainty associated with the manner in which the provisions of the Dodd-Frank Act will be implemented by the various regulatory agencies and through regulations, the full extent of the impact such requirements will have on our operations is not certain.
The Dodd-Frank Act created the CFPB which has broad rule-making authority for a wide range of consumer protection laws that apply to all banks and savings institutions including the authority to prohibit “unfair, deceptive or abusive” acts and practices. The CFPB has examination and enforcement authority over all banks and savings institutions with more than $10 billion in assets. Banks and savings institutions with $10 billion or less in assets are examined by their applicable bank regulators.
The Company may be required to invest significant management attention and resources to evaluate and make any changes necessary to comply with new statutory and regulatory requirements under the Dodd-Frank Act. Failure to comply with the new requirements may negatively impact our results of operations and financial condition. While the Company cannot predict what effect any presently contemplated or future changes in the laws or regulations or their interpretations would have on us, these changes could be materially adverse to our investors.
Increases in FDIC insurance premiums may have a material adverse effect on our results of operations.
Market developments significantly depleted the insurance fund of the FDIC and reduced the ratio of reserves to insured deposits. As the fund continues to recover, the Company may be required to pay significantly higher premiums or additional special assessments or taxes that could adversely affect earnings. We are generally unable to control the amount of premiums that are required to be paid for FDIC insurance. If there are additional bank or financial institution failures, the Company may be required to pay even higher FDIC premiums than the levels currently imposed. Any future increases or required prepayments in FDIC insurance premiums may materially adversely affect the results of operations.
Legislative, regulatory and legal developments involving income and other taxes could materially adversely affect the Company’s results of operations and cash flows.
The Company is subject to U.S. federal and U.S. state income, payroll, property, sales and use, and other types of taxes including the Pennsylvania Bank Shares Tax. Significant judgment is required in determining the Company's provisions for
13
income taxes. Changes in tax rates, enactments of new tax laws, revisions of tax regulations, and claims or litigation with taxing authorities could result in substantially higher taxes, and therefore, could have a significant adverse effect on the Company's results of operations, financial condition and liquidity. Increases in the assessment rate for the Pennsylvania Bank Shares Tax, which is calculated on the outstanding equity of the Bank, may also materially adversely affect results of operations.
Any U.S. federal tax reform that lowers corporate tax rates could have a significant non-cash adverse effect on results of operations as the Company's net deferred tax asset would be impacted, resulting in an increase in tax expense. In December 2017, U.S. federal tax reform was enacted that, among other things, lowered our statutory tax rate to 21% effective January 1, 2018. As described more fully in Note 7, Income Taxes, to the Consolidated Financial Statements under Part II, Item 8, "Financial Statements and Supplementary Data," the Company was required to remeasure its net deferred tax asset at the date the tax reform was enacted and incurred a $2,635,000 expense, which is included in total tax expense for 2017. We are unable to predict if, or when, any additional changes or proposals could be enacted.
The Company is required to use judgment in applying accounting policies and different estimates and assumptions in the application of these policies could result in a decrease in capital and/or other material changes to the reports of financial condition and results of operations.
Material estimates that are particularly susceptible to significant change relate to the determination of the ALL, accounting for income taxes and the ability to recognize deferred tax assets, and the fair value of certain financial instruments, particularly securities. While we have identified those accounting policies that we consider critical and have procedures in place to facilitate the associated judgments, different assumptions in the application of these policies could have a material adverse effect on our financial condition and results of operations.
Changes in accounting standards could impact the Company's financial condition and results of operations.
The Financial Accounting Standards Board (the "FASB"), the SEC and other regulatory bodies periodically change financial accounting and reporting standards that govern the preparation of the Company’s consolidated financial statements. These changes, including the use of an expected loss impairment methodology in the determination of the ALL which will be effective for the Company beginning January 1, 2020, can be hard to predict and can materially impact how the Company records and reports its financial condition and results of operations. In some cases, the Company could be required to apply new or revised guidance retrospectively, which may result in the revision of prior financial statements by material amounts. The implementation of new or revised guidance could result in material adverse effects to our reported regulatory capital.
The short-term and long-term impact of the changing regulatory capital requirements and new capital rules is uncertain.
The Basel III Capital Rules which became effective for the Company and Bank on January 1, 2015, established a new comprehensive capital framework for U.S. banking organizations, including community banks. The Basel III Capital Rules substantially revised the risk-based capital requirements applicable to bank holding companies and depository institutions. The Basel III Capital Rules define the components of capital and address other issues affecting the numerator in banking institutions’ regulatory capital ratios, as well as address risk weights and other issues affecting the denominator in banking institutions’ regulatory capital ratios.
The application of more stringent capital requirements to the Company and the Bank could, among other things, result in lower returns on invested capital, result in the need for additional capital, and result in regulatory actions if we were to be unable to comply with such requirements. Furthermore, the imposition of liquidity requirements in connection with the implementation of Basel III could result in our having to lengthen the term of our funding, restructuring our business models, and/or increasing our holdings of liquid assets. Implementation of changes to asset risk weightings for risk-based capital calculations, items included or deducted in calculating regulatory capital and/or additional capital conservation buffers could result in management modifying its business strategy and could limit our ability to make distributions, including paying out dividends or buying back shares.
Pending litigation and legal proceedings and the impact of any finding of liability or damages could adversely impact the Company and its financial condition and results of operations.
As more fully described in Note 19, Contingencies, to the Consolidated Financial Statements under Part II, Item 8, "Financial Statement and Supplementary Data," of this Annual Report on Form 10-K, the allegations of Southeastern Pennsylvania Transportation Authority's ("SEPTA") proposed second amended complaint disclosed the existence of a confidential, non-public, fact-finding inquiry regarding the Company being conducted by the SEC. On September 27, 2016, the Company entered into a settlement agreement with the SEC resolving the investigation of accounting and related matters at the Company for the periods ended June 30, 2010 to December 31, 2011. As part of the settlement agreement, the Company agreed to pay a civil money penalty of $1 million. On January 31, 2017, the Court entered a Case Management Order establishing the schedule for the litigation. The Case Management Order, among other things, sets the deadlines for the completion of discovery, the filing of motions and various pre-trial conferences. The trial is scheduled to begin on January 7, 2019.
14
The Company believes that the allegations of SEPTA's second amended complaint are without merit and intends to vigorously defend itself against those claims. It is not possible at this time to estimate losses, if any, with the litigation. However, there can be no assurances that the Company will not incur any losses associated with this litigation or that any losses that are incurred will not be material.
Indemnification costs associated with litigation and legal proceedings could adversely impact the Company and its financial condition and results of operations.
We are generally required, to the extent permitted by Pennsylvania law, to indemnify our current and former directors and officers who are named as defendants in lawsuits. We also have certain contractual indemnification obligations to third parties regarding litigation. Generally, insurance coverage is not available for such indemnification costs we could incur to third parties. Current or future litigation could result in indemnification expenses that could have a materially adverse impact on our financial condition and results of operations.
Risks Related to Liquidity
The Parent Company is a holding company dependent for liquidity on payments from its bank subsidiary, which is subject to restrictions.
The Parent Company is a holding company and depends on dividends, distributions and other payments from the Bank to fund dividend payments and stock repurchases, if permitted, and to fund all payments on obligations. The Bank is subject to laws that restrict dividend payments or authorize regulatory bodies to block or reduce the flow of funds from it to us. In addition, our right to participate in a distribution of assets upon the Bank’s liquidation or reorganization is subject to the prior claims of the Bank’s creditors.
The soundness of other financial institutions could adversely affect the Company.
Our ability to engage in routine funding and other transactions could be adversely affected by the actions and commercial soundness of other financial institutions. Financial services institutions are interrelated as a result of trading, clearing, counterparty or other relationships. As a result, defaults by, or even rumors or questions about, one or more financial services institutions, or the financial services industry generally, have historically led to market-wide liquidity problems, losses of depositor, creditor and counterparty confidence and could lead to losses or defaults by us or by other institutions. We could experience increases in deposits and assets as a result of other banks’ difficulties or failure, which would increase the capital we need to support such growth.
Risks Related to Owning our Stock
If the Company wants to, or is compelled to, raise additional capital in the future, that capital may not be available when it is needed and on terms favorable to current shareholders.
Federal banking regulators require us and our banking subsidiary to maintain adequate levels of capital to support our operations. These capital levels are determined and dictated by law, regulation and banking regulatory agencies. In addition, capital levels are also determined by our management and board of directors based on capital levels that, they believe, are necessary to support our business operations. At December 31, 2017, all four capital ratios for us and our banking subsidiary were above regulatory minimum levels to be deemed “well capitalized” under current bank regulatory guidelines. To be “well capitalized,” banking companies generally must maintain a tier 1 leverage ratio of at least 5.0%, CET1 capital ratio of 6.5%, Tier 1 risk-based capital ratio of at least 8.0%, and a total risk-based capital ratio of at least 10.0%. The implementation of the capital conservation buffer began on January 1, 2016 at the 0.625% level and will be phased in over a four-year period (increasing by that amount on each subsequent January 1, until it reaches 2.5% on January 1, 2019).
The Company’s ability to raise additional capital will depend on conditions in the capital markets at that time, which are outside of our control, and on our financial performance. Accordingly, we cannot provide assurance of our ability to raise additional capital on terms and time frames acceptable to us or to raise additional capital at all. Additionally, the inability to raise capital in sufficient amounts may adversely affect our operations, financial condition and results of operations. Our ability to borrow could also be impaired by factors that are nonspecific to us, such as severe disruption of the financial markets or negative news and expectations about the prospects for the financial services industry as a whole. If we raise capital through the issuance of additional shares of our common stock or other securities, we would likely dilute the ownership interests of current investors and the price at which we issue additional shares of stock could be less than the current market price of our common stock and, thus, could dilute the per share book value and earnings per share of our common stock. Furthermore, a capital raise through the issuance of additional shares may have an adverse impact on our stock price.
15
The market price of our common stock has been subject to volatility.
The market price of the Company’s common stock has been subject to fluctuations in response to numerous factors, many of which are beyond our control. These factors include actual or anticipated variations in our operational results and cash flows, changes in financial estimates by securities analysts, trading volume, large purchases or sales of our common stock, market conditions within the banking industry, the general state of the securities markets and the market for stocks of financial institutions, as well as general economic conditions.
The Parent Company's primary source of income is dividends received from its bank subsidiary.
The Parent Company is a separate legal entity from the Bank and must provide for its own liquidity. In addition to its operating expenses, the Company is responsible for paying any dividends declared to its shareholders. The Company also has repurchased shares of its common stock. The Company’s primary source of income is dividends received from the Bank. Banking regulations limit the amount of dividends that may be paid from the Bank to the Company without prior approval of regulatory agencies. Restrictions on the Bank’s ability to dividend funds to the Company are included in Note 14, Restrictions on Dividends, Loans and Advances, to the Consolidated Financial Statements under Part II, Item 8, "Financial Statements and Supplementary Data."
ITEM 1B – UNRESOLVED STAFF COMMENTS
None.
ITEM 2 – PROPERTIES
Our principal executive offices are located at 77 East King Street, Shippensburg, Pennsylvania, with additional executive and administrative offices at 4750 Lindle Road, Harrisburg, Pennsylvania. These facilities are owned by the Bank, which also maintains its principal and additional executive and administrative offices at those locations.
We own or lease other premises for use in conducting our business activities, including bank branches, an operations center, and offices in Berks, Cumberland, Dauphin, Franklin, Lancaster, and Perry Counties, Pennsylvania and Washington County, Maryland. We believe that the properties currently owned and leased are adequate for present levels of operation. We are constantly evaluating the best and most efficient mix of branch locations to service our customers due to evolving trends in our industry and increased engagement through digital channels.
ITEM 3 – LEGAL PROCEEDINGS
Information regarding legal proceedings is included in Note 19, Contingencies, to the Consolidated Financial Statements under Part II, Item 8, "Financial Statement and Supplementary Data."
ITEM 4 – MINE SAFETY DISCLOSURES
Not applicable.
16
PART II
ITEM 5 – MARKET FOR REGISTRANT’S COMMON EQUITY, RELATED STOCKHOLDER MATTERS AND ISSUER PURCHASES OF EQUITY SECURITIES
Market Information
Our common stock is traded on the NASDAQ Capital Market under the symbol “ORRF.” At the close of business on February 28, 2018, there were approximately 2,700 shareholders of record.
The following table sets forth for each quarter of 2017 and 2016 the high and low sales prices per share of our common stock and the cash dividends declared. Trading prices are based on published financial sources.
2017 | 2016 | ||||||||||||||||||||||
Market Price | Quarterly Dividend | Market Price | Quarterly Dividend | ||||||||||||||||||||
High | Low | High | Low | ||||||||||||||||||||
First quarter | $ | 23.40 | $ | 20.00 | $ | 0.10 | $ | 18.11 | $ | 16.60 | $ | 0.08 | |||||||||||
Second quarter | 23.00 | 19.05 | 0.10 | 19.95 | 17.05 | 0.09 | |||||||||||||||||
Third quarter | 26.55 | 22.15 | 0.10 | 23.73 | 17.59 | 0.09 | |||||||||||||||||
Fourth quarter | 26.95 | 24.15 | 0.12 | 23.75 | 18.05 | 0.09 | |||||||||||||||||
$ | 0.42 | $ | 0.35 | ||||||||||||||||||||
Our management is currently committed to continuing to pay regular cash dividends; however, there can be no assurance as to future dividends because they are dependent on our future earnings, capital requirements and financial condition. Restrictions on the payment of dividends are discussed in Note 14, Restrictions on Dividends, Loans and Advances, to the Consolidated Financial Statements under Part II, Item 8, "Financial Statements and Supplementary Data." On January 24, 2018, the Board declared a cash dividend of $0.12 per common share, which was paid on February 9, 2018.
Issuer Purchases of Equity Securities
In September 2015, the Board of Directors of the Company authorized a share repurchase program under which the Company may repurchase up to 5% of the Company's outstanding shares of common stock, or approximately 416,000 shares, in accordance with all applicable securities laws and regulations, including Rule 10b-18 of the Securities Exchange Act of 1934, as amended. When and if appropriate, repurchases may be made in open market or privately negotiated transactions, depending on market conditions, regulatory requirements and other corporate considerations, as determined by management. Share repurchases may not occur and may be discontinued at any time.
No shares were repurchased from October 1, 2017 to December 31, 2017. At December 31, 2017, 82,725 shares had been repurchased under the program at a total cost of $1,438,000, or $17.38 per share. The maximum number of shares that may yet be purchased under the plan is 333,275 shares at December 31, 2017.
17
PERFORMANCE GRAPH
The performance graph below compares the cumulative total shareholder return on our common stock with other indexes: the SNL index of banks with assets between $1 billion and $5 billion, the S&P 500 Index, and the NASDAQ Composite index. The graph assumes an investment of $100 on December 31, 2012 and reinvestment of dividends on the date of payment without commissions. Shareholder returns on our common stock are based upon trades on the NASDAQ Stock Market. The performance graph represents past performance and should not be considered to be an indication of future performance.
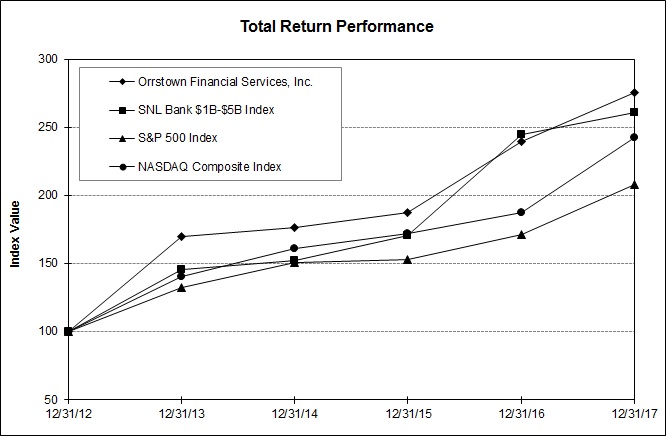
Period Ending | |||||||||||||||||
Index | 12/31/12 | 12/31/13 | 12/31/14 | 12/31/15 | 12/31/16 | 12/31/17 | |||||||||||
Orrstown Financial Services, Inc. | 100.00 | 169.61 | 176.35 | 187.42 | 239.80 | 275.16 | |||||||||||
SNL Bank $1B-$5B Index | 100.00 | 145.41 | 152.04 | 170.20 | 244.85 | 261.04 | |||||||||||
S&P 500 Index | 100.00 | 132.39 | 150.51 | 152.59 | 170.84 | 208.14 | |||||||||||
NASDAQ Composite Index | 100.00 | 140.12 | 160.78 | 171.97 | 187.22 | 242.71 | |||||||||||
Source : S&P Global Market Intelligence © 2017
In accordance with the rules of the SEC, this section captioned “Performance Graph” shall not be incorporated by reference into any of our future filings made under the Exchange Act or the Securities Act. The Performance Graph and its accompanying table are not deemed to be soliciting material or to be filed under the Exchange Act or the Securities Act.
Recent Sales of Unregistered Securities
The Company has not sold any securities within the past three years which were not registered under the Securities Act.
18
ITEM 6 – SELECTED FINANCIAL DATA
At or For The Year Ended December 31, | |||||||||||||||||||
(Dollars in thousands except per share information) | 2017 | 2016 | 2015 | 2014 | 2013 | ||||||||||||||
Summary of Operations | |||||||||||||||||||
Interest and dividend income | $ | 51,015 | $ | 41,962 | $ | 38,635 | $ | 38,183 | $ | 37,098 | |||||||||
Interest expense | 7,644 | 5,417 | 4,301 | 4,159 | 5,011 | ||||||||||||||
Net interest income | 43,371 | 36,545 | 34,334 | 34,024 | 32,087 | ||||||||||||||
Provision for loan losses | 1,000 | 250 | (603 | ) | (3,900 | ) | (3,150 | ) | |||||||||||
Net interest income after provision for loan losses | 42,371 | 36,295 | 34,937 | 37,924 | 35,237 | ||||||||||||||
Investment securities gains | 1,190 | 1,420 | 1,924 | 1,935 | 332 | ||||||||||||||
Noninterest income | 19,197 | 18,319 | 17,254 | 16,919 | 17,476 | ||||||||||||||
Noninterest expenses | 50,330 | 48,140 | 44,607 | 43,768 | 43,247 | ||||||||||||||
Income before income tax expense (benefit) | 12,428 | 7,894 | 9,508 | 13,010 | 9,798 | ||||||||||||||
Income tax expense (benefit) | 4,338 | 1,266 | 1,634 | (16,132 | ) | (206 | ) | ||||||||||||
Net income | $ | 8,090 | $ | 6,628 | $ | 7,874 | $ | 29,142 | $ | 10,004 | |||||||||
Per Share Information | |||||||||||||||||||
Basic earning per share | $ | 1.00 | $ | 0.82 | $ | 0.97 | $ | 3.59 | $ | 1.24 | |||||||||
Diluted earnings per share | 0.98 | 0.81 | 0.97 | 3.59 | 1.24 | ||||||||||||||
Dividends per share | 0.42 | 0.35 | 0.22 | 0.00 | 0.00 | ||||||||||||||
Book value at December 31 | 17.34 | 16.28 | 16.08 | 15.40 | 11.28 | ||||||||||||||
Weighted average shares outstanding – basic | 8,070,472 | 8,059,412 | 8,106,438 | 8,110,344 | 8,093,306 | ||||||||||||||
Weighted average shares outstanding – diluted | 8,226,261 | 8,145,456 | 8,141,600 | 8,116,054 | 8,093,306 | ||||||||||||||
Stock Price Statistics | |||||||||||||||||||
Close | $ | 25.25 | $ | 22.40 | $ | 17.84 | $ | 17.00 | $ | 16.35 | |||||||||
High | 26.95 | 23.75 | 18.45 | 17.50 | 18.00 | ||||||||||||||
Low | 19.05 | 16.60 | 15.10 | 15.33 | 9.49 | ||||||||||||||
Price earnings ratio at close | 25.3 | 27.3 | 18.4 | 4.7 | 13.2 | ||||||||||||||
Diluted price earnings ratio at close | 25.8 | 27.7 | 18.4 | 4.7 | 13.2 | ||||||||||||||
Price to book at close | 1.5 | 1.4 | 1.1 | 1.1 | 1.4 | ||||||||||||||
Year-End Information | |||||||||||||||||||
Total assets | $ | 1,558,849 | $ | 1,414,504 | $ | 1,292,816 | $ | 1,190,443 | $ | 1,177,812 | |||||||||
Loans | 1,010,012 | 883,391 | 781,713 | 704,946 | 671,037 | ||||||||||||||
Total investment securities | 425,305 | 408,124 | 402,844 | 384,549 | 416,864 | ||||||||||||||
Deposits – noninterest-bearing | 162,343 | 150,747 | 131,390 | 116,302 | 116,371 | ||||||||||||||
Deposits – interest-bearing | 1,057,172 | 1,001,705 | 900,777 | 833,402 | 884,019 | ||||||||||||||
Total deposits | 1,219,515 | 1,152,452 | 1,032,167 | 949,704 | 1,000,390 | ||||||||||||||
Repurchase agreements | 43,576 | 35,864 | 29,156 | 21,742 | 9,032 | ||||||||||||||
Borrowed money | 133,815 | 76,163 | 84,495 | 79,812 | 66,077 | ||||||||||||||
Total shareholders’ equity | 144,765 | 134,859 | 133,061 | 127,265 | 91,439 | ||||||||||||||
Assets under management – market value | 1,370,950 | 1,174,143 | 966,362 | 1,017,013 | 1,085,216 | ||||||||||||||
Financial Ratios | |||||||||||||||||||
Average equity / average assets | 9.49 | % | 10.41 | % | 10.66 | % | 8.63 | % | 7.45 | % | |||||||||
Return on average equity | 5.73 | % | 4.80 | % | 5.99 | % | 28.78 | % | 11.30 | % | |||||||||
Return on average assets | 0.54 | % | 0.50 | % | 0.64 | % | 2.48 | % | 0.84 | % | |||||||||
19
ITEM 7 – MANAGEMENT’S DISCUSSION AND ANALYSIS OF FINANCIAL CONDITION AND RESULTS OF OPERATIONS
The following discussion and analysis is intended to assist readers in understanding the consolidated financial condition and results of operations of Orrstown and should be read in conjunction with our Consolidated Financial Statements and notes thereto included in this Annual Report on Form 10-K. Certain prior period amounts presented in this discussion and analysis have been reclassified to conform to current period classifications.
Overview
The results of our operations are highly dependent on economic conditions and market interest rates. The Company's profitability for the years ended December 31, 2017, 2016 and 2015 was influenced by its continued organic growth and ongoing expansion into targeted markets, while it maintained improvement in asset quality from prior years. These and other matters are discussed more fully below.
Critical Accounting Policies
The Company's consolidated financial statements are prepared in accordance with GAAP and follow general practices within the financial services industry. Application of these principles involves complex judgments and estimates by management that have a material impact on the carrying value of certain assets and liabilities. The judgments and estimates that we used are based on historical experiences and other factors, which we believe are reasonable under the circumstances. Because of the nature of the judgments and estimates that we have made, actual results could differ from these judgments and estimates, which could have a material impact on the carrying values of assets and liabilities and the results of our operations.
The most significant accounting policies followed by the Company are presented in Note 1, Summary of Significant Accounting Policies, to the Consolidated Financial Statements under Part II, Item 8, "Financial Statements and Supplementary Data." These policies, along with the disclosures presented in the other consolidated financial statement notes, provide information on how significant assets and liabilities are valued in the financial statements and how those values are determined. Based on the valuation techniques used and the sensitivity of financial statement amounts to the methods, assumptions, and estimates underlying those amounts, the Company has identified the adequacy of the ALL and accounting for income taxes as critical accounting policies.
The ALL represents management’s estimate of probable incurred credit losses in the loan portfolio at the balance sheet date. Determining the amount of the ALL is considered a complex accounting estimate because it requires significant judgment and the use of estimates related to the amount and timing of expected future cash flows on impaired loans, estimated losses on pools of homogeneous loans based on historical loss experience, and consideration of current economic trends and conditions, all of which may be susceptible to significant change. The loan portfolio also represents the largest asset on the consolidated balance sheets.
The Company recognizes deferred tax assets and liabilities for the future effects of temporary differences and tax credits. Enacted tax rates are applied to cumulative temporary differences based on expected taxable income in the periods in which the deferred tax asset or liability is anticipated to be realized. Future tax rate changes could occur that would require the recognition of income or expense in the statement of income in the period in which they are enacted. The Company records deferred tax assets to the extent the Company believes these assets will more likely than not be realized, utilizing a valuation allowance if all or a portion of the deferred tax assets is not so considered to be realized. In making this determination, the Company considers all available evidence, including future reversals of existing deferred tax liabilities, projected future taxable income, feasible and prudent tax planning strategies and recent financial operating results. In the event the Company was to determine that it would be able to realize deferred tax assets in the future in excess of their net recorded amount, an adjustment to the valuation allowance would be made that would impact income tax expense. Management may need to modify its judgment in this regard, from one period to another, should a material change occur in the business environment, tax legislation, or in any other business factor that could impair the Company’s ability to benefit from the asset in the future.
On December 22, 2017, federal tax reform legislation, commonly referred to as the Tax Cuts and Jobs Act of 2017 (the "Tax Act"), was enacted. Among other things, the Tax Act reduced the Company's statutory federal tax rate from 34% to 21% effective January 1, 2018. As a result, we were required to remeasure, through income tax expense, certain deferred tax assets and liabilities using the enacted rate at which we expect them to be recovered or settled. The remeasurement of our net deferred tax asset resulted in additional federal deferred tax expense of $2,635,000, which is included in total tax expense for 2017. The Company's deferred tax assets related to low-income housing credit and alternative minimum tax credit carryforwards were not impacted by the change in statutory tax rate, as they are treated as payments on future federal income taxes due and are not subject to remeasurement. However, the Tax Act did change alternative minimum tax credit carryforwards to be refundable credits. To reflect this change, the Company reclassed its alternative minimum tax credit carryforwards, totaling $5,343,000 at December 31, 2017, from deferred tax assets to other assets in the consolidated balance sheets.
20
Readers of the consolidated financial statements should be aware that the estimates and assumptions used in the Company’s current financial statements may need to be updated in future financial presentations for changes in circumstances, business or economic conditions in order to fairly represent the condition of the Company at that time.
Economic Climate, Inflation and Interest Rates
The pace of U.S. economic growth has recently increased above the modest two percent average of the recent expansion. The passage of tax cuts, a federal budget with significantly increased government spending, and the possibility of an infrastructure bill all contribute to a more positive consensus outlook for 2018. This expansion is now within 14 months of becoming the longest expansion since World War II. There are signs that this expansion is reaching maturity: credit spreads are near their historical lows, the unemployment rate has approached four percent, and the yield curve is flatter.
The majority of the assets and liabilities of a financial institution are monetary in nature, and therefore, differ greatly from most commercial and industrial companies that have significant investments in fixed assets or inventories. However, inflation does have an impact on the growth of total assets and on noninterest expenses, which tend to rise during periods of general inflation. Inflationary pressures over the last several years have been modest, however, with the current unemployment rate and fiscal stimulus on the way, concerns that inflation may increase faster than the last several years are starting to make their way into economic forecasts and may pressure interest rates higher.
As the Company’s balance sheet consists primarily of financial instruments, interest income and interest expense are greatly influenced by the level of interest rates and the slope of the yield curve. During the first two of the three years presented in this financial statement review, interest rates were near all-time lows. The FRB began raising short term interest rates in December 2015 and raised the Fed Funds rate 25 basis points four more times between December of 2016 and December of 2017. The yield curve shifted upward with the increase in the Fed Funds rate with short term rates increasing further than long term rates resulting in a flatter yield curve. The Company has been able to grow its net interest income by $9,037,000 from 2015 to 2017, through the growth of loans and higher yielding securities in combination with slower increases in its funding costs. Competition for quality lending opportunities remains intense, which, together with a flattening yield curve, will continue to challenge our ability to grow our net interest margin and to leverage our overhead expenses.
Results of Operations
Summary
The Company recorded net income of $8,090,000, $6,628,000 and $7,874,000 for 2017, 2016 and 2015. Diluted earnings per share totaled $0.98, $0.81 and $0.97 for 2017, 2016 and 2015.
Net interest income totaled $43,371,000, $36,545,000 and $34,334,000 for 2017, 2016 and 2015, principally reflecting our organic growth in loans from an expanded sales force and efforts to expand our geographic footprint while taking advantage of market opportunities. A higher interest rate environment each year contributed to increased yields on loans and investments, and, to a lesser extent, costs of interest-bearing liabilities.
Favorable historical charge-off data and management's emphasis on loan quality have impacted our results, as the allowance for loan losses has remained stable as loans have increased. The provision for loan losses totaled $1,000,000 and $250,000 in 2017 and 2016. In 2015, a negative provision or recovery of amounts previously provided for or charged-off totaling $(603,000) was recognized.
Noninterest expenses totaled $50,330,000, $48,140,000 and $44,607,000 for 2017, 2016 and 2015. The changes in certain components of noninterest expenses between the years are reflective of the Company's focus on investing in additional talent and locations to better serve the needs of our customers and efforts to develop new relationships by taking advantage of market opportunities created by consolidation of other banks. Salaries and employee benefits increased $2,314,000 from 2015 to 2016 and $3,775,000 from 2016 to 2017. Occupancy and furniture and fixture costs increased $544,000 from 2015 to 2016 and $414,000 from 2016 to 2017.
Income tax expense totaled $4,338,000, $1,266,000 and $1,634,000 for 2017, 2016 and 2015, or an effective tax rate of 34.9%, 16.0% and 17.2% respectively. In 2017, we remeasured our net deferred tax asset due to the enactment of the Tax Act in December 2017. The Tax Act lowered our statutory tax rate from 34% to 21% effective January 1, 2018. Remeasurement of our net deferred tax asset at the lower rate resulted in an expense of $2,635,000, which is included in total tax expense for 2017.
21
Net Interest Income
Net interest income is the primary component of the Company's revenue. Interest-earning assets include loans, securities and federal funds sold. Interest-bearing liabilities include deposits and borrowed funds.
Net interest income is affected by changes in interest rates, volumes of interest-earning assets and interest-bearing liabilities and the composition of those assets and liabilities. “Net interest spread” and “net interest margin” are two common statistics related to changes in net interest income. The net interest spread represents the difference between the yields earned on interest-earning assets and the rates paid for interest-bearing liabilities. The net interest margin is defined as the ratio of net interest income to average earning asset balances. Through the use of noninterest-bearing demand deposits and shareholders' equity, the net interest margin exceeds the net interest spread, as these funding sources are noninterest-bearing.
The Federal Reserve influences the general market rates of interest, including the deposit and loan rates offered by many financial institutions. Our loan portfolio is affected by changes in the prime interest rate. The prime interest rate, which is the rate offered on loans to borrowers with strong credit, remained at 3.25% during most of 2015. In December 2015, the prime rate increased 25 basis points to 3.50% and remained at that level through most of 2016. In December 2016, the prime rate increased 25 basis points to end the year at 3.75%. During 2017, the prime rate increased 75 basis points (25 basis points in each of March, June and December) to end the year at 4.50%.
Core deposits are deposits that are stable, lower cost and generally reprice more slowly than other deposits when interest rates change. Core deposits are typically funds of local customers who also have a borrowing or other relationship with the Bank. We are primarily funded by core deposits, with noninterest-bearing demand deposits historically being a significant source of funds. This lower-cost funding base is expected to have a positive impact on our net interest income and net interest margin in a rising interest rate environment.
Net interest income totaled $43,371,000, $36,545,000 and $34,334,000 in 2017, 2016 and 2015. The following table presents net interest income, net interest spread and net interest margin on a taxable-equivalent basis for 2017, 2016 and 2015. Taxable-equivalent adjustments are the result of increasing income from tax-free loans and investments by an amount equal to the taxes that would be paid if the income were fully taxable based on a 34% federal corporate tax rate for 2017 and 2016 and 35% for 2015, reflecting our statutory tax rates for those years.
Effective January 1, 2018, the Tax Act changed our statutory tax rate to 21%. As a result of this lower tax rate, taxable-equivalent adjustments in future years will be less than if the 2017 tax rate had remained in effect.
22
2017 | 2016 | 2015 | ||||||||||||||||||||||||||||||
(Dollars in thousands) | Average Balance | Taxable- Equivalent Interest | Taxable- Equivalent Rate | Average Balance | Taxable- Equivalent Interest | Taxable- Equivalent Rate | Average Balance | Taxable- Equivalent Interest | Taxable- Equivalent Rate | |||||||||||||||||||||||
Assets | ||||||||||||||||||||||||||||||||
Federal funds sold and interest-bearing bank balances | $ | 15,487 | $ | 218 | 1.41 | % | $ | 31,452 | $ | 208 | 0.66 | % | $ | 18,901 | $ | 81 | 0.43 | % | ||||||||||||||
Taxable securities | 326,900 | 7,478 | 2.29 | 303,124 | 6,012 | 1.98 | 348,613 | 6,697 | 1.92 | |||||||||||||||||||||||
Tax-exempt securities | 93,683 | 4,748 | 5.07 | 57,231 | 2,767 | 4.83 | 33,055 | 1,629 | 4.93 | |||||||||||||||||||||||
Total securities | 420,583 | 12,226 | 2.91 | 360,355 | 8,779 | 2.44 | 381,668 | 8,326 | 2.18 | |||||||||||||||||||||||
Taxable loans | 893,555 | 38,568 | 4.32 | 774,984 | 32,036 | 4.13 | 687,079 | 28,787 | 4.19 | % | ||||||||||||||||||||||
Tax-exempt loans | 50,797 | 2,450 | 4.82 | 58,281 | 2,848 | 4.89 | 59,600 | 3,094 | 5.19 | |||||||||||||||||||||||
Total loans | 944,352 | 41,018 | 4.34 | 833,265 | 34,884 | 4.19 | 746,679 | 31,881 | 4.27 | |||||||||||||||||||||||
Total interest-earning assets | 1,380,422 | 53,462 | 3.87 | 1,225,072 | 43,871 | 3.58 | 1,147,248 | 40,288 | 3.51 | |||||||||||||||||||||||
Cash and due from banks | 20,391 | 20,803 | 19,155 | |||||||||||||||||||||||||||||
Bank premises and equipment | 35,055 | 31,413 | 24,386 | |||||||||||||||||||||||||||||
Other assets | 65,293 | 61,391 | 56,894 | |||||||||||||||||||||||||||||
Allowance for loan losses | (12,738 | ) | (13,529 | ) | (14,134 | ) | ||||||||||||||||||||||||||
Total | $ | 1,488,423 | $ | 1,325,150 | $ | 1,233,549 | ||||||||||||||||||||||||||
Liabilities and Shareholders’ Equity | ||||||||||||||||||||||||||||||||
Interest-bearing demand deposits | $ | 648,174 | 2,148 | 0.33 | $ | 565,524 | 1,195 | 0.21 | $ | 500,474 | 908 | 0.18 | ||||||||||||||||||||
Savings deposits | 94,815 | 150 | 0.16 | 90,272 | 144 | 0.16 | 85,068 | 136 | 0.16 | |||||||||||||||||||||||
Time deposits | 292,616 | 3,836 | 1.31 | 289,574 | 3,472 | 1.20 | 263,414 | 2,562 | 0.97 | |||||||||||||||||||||||
Short-term borrowings | 97,814 | 784 | 0.80 | 56,387 | 187 | 0.33 | 85,262 | 295 | 0.35 | |||||||||||||||||||||||
Long-term debt | 36,336 | 726 | 2.00 | 24,335 | 419 | 1.72 | 22,522 | 400 | 1.78 | |||||||||||||||||||||||
Total interest-bearing liabilities | 1,169,755 | 7,644 | 0.65 | 1,026,092 | 5,417 | 0.53 | 956,740 | 4,301 | 0.45 | |||||||||||||||||||||||
Noninterest-bearing demand deposits | 161,917 | 147,473 | 134,040 | |||||||||||||||||||||||||||||
Other | 15,450 | 13,612 | 11,316 | |||||||||||||||||||||||||||||
Total Liabilities | 1,347,122 | 1,187,177 | 1,102,096 | |||||||||||||||||||||||||||||
Shareholders’ Equity | 141,301 | 137,973 | 131,453 | |||||||||||||||||||||||||||||
Total | $ | 1,488,423 | $ | 1,325,150 | $ | 1,233,549 | ||||||||||||||||||||||||||
Taxable-equivalent net interest income / net interest spread | 45,818 | 3.22 | % | 38,454 | 3.05 | % | 35,987 | 3.06 | % | |||||||||||||||||||||||
Taxable-equivalent net interest margin | 3.32 | % | 3.14 | % | 3.14 | % | ||||||||||||||||||||||||||
Taxable-equivalent adjustment | (2,447 | ) | (1,909 | ) | (1,653 | ) | ||||||||||||||||||||||||||
Net interest income | $ | 43,371 | $ | 36,545 | $ | 34,334 | ||||||||||||||||||||||||||
Note: | Yields and interest income on tax-exempt assets have been computed on a taxable-equivalent basis assuming a 34% tax rate in 2017 and 2016, and 35% in 2015. For yield calculation purposes, nonaccruing loans are included in the average loan balance. |
23
The following table presents changes in net interest income on a taxable-equivalent basis for 2017, 2016 and 2015 by rate and volume components.
2017 Versus 2016 Increase (Decrease) Due to Change in | 2016 Versus 2015 Increase (Decrease) Due to Change in | ||||||||||||||||||||||
(Dollars in thousands) | Average Volume | Average Rate | Total | Average Volume | Average Rate | Total | |||||||||||||||||
Interest Income | |||||||||||||||||||||||
Federal funds sold and interest-bearing bank balances | $ | (106 | ) | $ | 116 | $ | 10 | $ | 54 | $ | 73 | $ | 127 | ||||||||||
Taxable securities | 472 | 994 | 1,466 | (874 | ) | 189 | (685 | ) | |||||||||||||||
Tax-exempt securities | 1,762 | 219 | 1,981 | 1,191 | (53 | ) | 1,138 | ||||||||||||||||
Taxable loans | 4,901 | 1,631 | 6,532 | 3,683 | (434 | ) | 3,249 | ||||||||||||||||
Tax-exempt loans | (366 | ) | (32 | ) | (398 | ) | (68 | ) | (178 | ) | (246 | ) | |||||||||||
Total interest income | 6,663 | 2,928 | 9,591 | 3,986 | (403 | ) | 3,583 | ||||||||||||||||
Interest Expense | |||||||||||||||||||||||
Interest-bearing demand deposits | 175 | 778 | 953 | 118 | 169 | 287 | |||||||||||||||||
Savings deposits | 7 | (1 | ) | 6 | 8 | 0 | 8 | ||||||||||||||||
Time deposits | 36 | 328 | 364 | 254 | 656 | 910 | |||||||||||||||||
Short-term borrowings | 137 | 460 | 597 | (100 | ) | (8 | ) | (108 | ) | ||||||||||||||
Long-term debt | 207 | 100 | 307 | 32 | (13 | ) | 19 | ||||||||||||||||
Total interest expense | 562 | 1,665 | 2,227 | 312 | 804 | 1,116 | |||||||||||||||||
Net Interest Income | $ | 6,101 | $ | 1,263 | $ | 7,364 | $ | 3,674 | $ | (1,207 | ) | $ | 2,467 | ||||||||||
Note: | The change attributed to volume is calculated by taking the average change in average balance times the prior year's |
average rate and the remainder is attributable to rate. | |
2017 versus 2016
In 2017, net interest income, on a taxable-equivalent basis, increased $7,364,000, or 19.2%, compared with 2016. The Company’s net interest spread increased 17 basis point to 3.22% for 2017 compared with 2016.
Interest income on a taxable-equivalent basis on loans increased $6,134,000, or 17.6%, from 2016 to 2017. The increase resulted from an increase in both average loan volume and yield, with average loans increasing $111,087,000, or 13.3%, and yield increasing 15 basis points from 4.19% in 2016 to 4.34% in 2017. The Company's geographic expansion and sales efforts with additional loan officers continued to drive loan growth in 2017 across most loan classes. Increases in prime lending rates during the year contributed to the increased yield, but a flattening yield curve partially offset the benefit of the rate increases.
Interest income earned on a taxable-equivalent basis on securities increased $3,447,000, or 39.3%, from 2016 to 2017, with both average volume and yield increasing. Average securities increased $60,228,000, or 16.7%, and yield increased from 2.44% in 2016 to 2.91% in 2017. Contributing to the increase in interest income on securities was the higher rate environment in 2017, a higher composition of tax free securities with accompanying higher taxable-equivalent yields and strategic moves within the portfolio as the interest rate environment changed.
Interest expense on deposits and borrowings increased $2,227,000 from 2016 to 2017, as the average balance of interest-bearing liabilities increased $143,663,000, or 14.00%. Generally, the cost of interest-bearing liabilities has increased at a slower pace than yields earned on interest-earning assets in 2017, as the market for interest-bearing liabilities was initially slower to respond to interest rate changes.
Our ability to attract new deposits in all categories, but in particular interest-bearing demand deposits, resulted in an increase in average interest-bearing deposits totaling $82,650,000, or 14.6%, in 2017. Interest expense for these deposits increased $953,000, with the cost of funds increasing from 0.21% in 2016 to 0.33% in 2017.
We also increased our short-term and long-term borrowings in 2017 to partially fund loan and investment portfolio growth. Borrowings generally have higher interest rates associated with them. Interest expense on borrowings increased $904,000 in 2017, with average balances increasing $41,427,000 for short-term borrowings and $12,001,000 for long-term
24
borrowings. The average rate paid on short-term borrowings increased from 0.33% in 2016 to 0.80% in 2017 and the average rate paid on long-term borrowings increased from 1.72% in 2016 to 2.00% in 2017.
2016 versus 2015
Net interest income, on a taxable-equivalent basis, increased $2,467,000, or 6.9%, from 2015 to 2016. The Company’s net interest spread decreased 1 basis point to 3.05% for 2016 compared with 2015. Despite higher average balances in loans during 2016 compared with 2015 and a 25 basis point increase in the prime lending rate between the years, a flattening yield curve as the market reacted to slowing economic growth negatively impacted the yields on loans and caused funding costs to increase. Payments on and maturities of existing loans were reinvested at lower rates due to competitive market conditions. An increase in securities yields helped increase the average yield earned on interest-earning assets for 2016 compared with 2015 and helped maintain the net interest margin at the same 3.14% as in 2015. The average interest rate increased as the Company was able to invest a large portion of the additional funds at rates above the FRB's target for the Fed Funds rate.
Interest income on a taxable-equivalent basis on loans increased $3,003,000, or 9.4%, from 2015 to 2016. The increase in interest income on loans was primarily a result of an increase in average loan volume, offset partially by a decrease in yield, which decreased eight basis points from 4.27% for 2015 to 4.19% for 2016. Average loans increased $86,586,000 from 2015 to 2016 and reflected successful sales efforts across most loan classes. Favorable market conditions and the addition of several seasoned loan officers contributed to loan growth. However, new loans added were generally at lower rates than the existing portfolio.
Interest income earned on a taxable-equivalent basis on securities increased $453,000, or 5.4%, from 2015 to 2016. The average balance of securities decreased $21,313 from 2015 to 2016, with funds obtained from maturing and prepaying securities used to fund a portion of the Company's loan growth. Contributing to the increase in interest income on securities was a higher composition of tax free securities, and the higher tax-equivalent yields associated with them. The Company sold its portfolio of GSE CMOs in February 2016 and it took longer to deploy the funds into new loans than originally anticipated.
Interest expense on deposits and borrowings increased $1,116,000 from 2015 to 2016, as the average balance of interest-bearing liabilities increased $69,352,000, or 7.25%. Our cost of funds on interest-bearing liabilities also increased, from 0.45% for 2015 to 0.53% for 2016. The $910,000 increase, or 23 basis points, in interest expense on time deposits from 2015 to 2016 was the primary contributor to the overall increase.
Our ability to attract new deposits in all categories, but in particular interest-bearing demand deposits, resulted in an increase in average interest-bearing deposits. The Company has been able to gather both noninterest-bearing and interest-bearing deposit relationships from enhanced cash management offerings as it increases its commercial relationships. The cost of interest-bearing liabilities is influenced by changes in short-term interest rates. We also paid a higher rate on certain intermediate-term brokered deposits to help protect earnings from a rising rate environment and incurred $108,000 of accelerated interest expense on the call of brokered certificates of deposits in 2016.
The increase in deposits enabled us to decrease our use of short-term borrowings, which generally have higher interest rates associated with them. The average balance of short-term borrowings decreased $28,875,000 from 2015 to 2016. The average rate paid on short-term borrowings decreased 2 basis points from 2015 to 2016. We added to our long-term borrowings during 2016, with an average balance increase of $1,813,000 from 2015 to 2016, with an associated increase in expense of $19,000.
Provision for Loan Losses
The Company recorded a provision for loan losses of $1,000,000 and $250,000 in 2017 and 2016, and a negative provision for loan losses, or a reversal of amounts previously provided, of $(603,000) in 2015. In calculating the provision for loan losses, both quantitative and qualitative factors, including favorable historical charge-off data and stable economic and market conditions,were considered in the determination of the adequacy of the ALL. Net charge-offs and loan growth resulted in the determination that a provision expense was required in 2017 and 2016. The provision expense in 2017 principally reflected a charge-off on one commercial loan that was downgraded to nonaccrual status in the fourth quarter. The negative provision in 2015 was the result of a recovery on a loan with prior charge-offs totaling this amount, as well as significant improvement in asset quality metrics from prior years. Favorable charge-off data, combined with relatively stable economic and market conditions, resulted in the determination that a negative provision could be recorded in 2015 despite net charge-offs for the periods, as ALL coverage metrics remained strong.
See further discussion in the “Asset Quality” and “Credit Risk Management” sections of this Management’s Discussion and Analysis of Financial Condition and Results of Operations.
25
Noninterest Income
The following table compares noninterest income for 2017, 2016 and 2015.
(Dollars in thousands) | 2017 | 2016 | 2015 | $ Change | % Change | ||||||||||||||||||||
2017-2016 | 2016-2015 | 2017-2016 | 2016-2015 | ||||||||||||||||||||||
Service charges on deposit accounts | $ | 5,675 | $ | 5,445 | $ | 5,226 | $ | 230 | $ | 219 | 4.2 | % | 4.2 | % | |||||||||||
Other service charges, commissions and fees | 1,008 | 994 | 1,223 | 14 | (229 | ) | 1.4 | % | (18.7 | )% | |||||||||||||||
Trust and investment management income | 6,400 | 5,091 | 4,598 | 1,309 | 493 | 25.7 | % | 10.7 | % | ||||||||||||||||
Brokerage income | 1,896 | 1,933 | 2,025 | (37 | ) | (92 | ) | (1.9 | )% | (4.5 | )% | ||||||||||||||
Mortgage banking activities | 2,919 | 3,412 | 2,747 | (493 | ) | 665 | (14.4 | )% | 24.2 | % | |||||||||||||||
Earnings on life insurance | 1,109 | 1,099 | 1,025 | 10 | 74 | 0.9 | % | 7.2 | % | ||||||||||||||||
Other income | 190 | 345 | 410 | (155 | ) | (65 | ) | (44.9 | )% | (15.9 | )% | ||||||||||||||
Subtotal before securities gains | 19,197 | 18,319 | 17,254 | 878 | 1,065 | 4.8 | % | 6.2 | % | ||||||||||||||||
Investment securities gains | 1,190 | 1,420 | 1,924 | (230 | ) | (504 | ) | (16.2 | )% | (26.2 | )% | ||||||||||||||
Total noninterest income | $ | 20,387 | $ | 19,739 | $ | 19,178 | $ | 648 | $ | 561 | 3.3 | % | 2.9 | % | |||||||||||
2017 versus 2016
Noninterest income increased $648,000 from 2016 to 2017. The following factors contributed to that net increase.
• | Service charges on deposit accounts continued to increase in 2017 as a result of new product offerings and increased activity associated with deposit growth. |
• | Increased trust department income was realized throughout 2017 from favorable market conditions and the addition of an office in Berks County, Pennsylvania. Wheatland, which was acquired in December 2016, contributed approximately 39% of this increased revenue category in 2017. |
• | The decrease in mortgage banking activities reflects a combination of overall decreased refinance activity as interest rates have increased, some slight compression in sales profit margins that the Company has experienced and the portion of mortgage production retained for the Company's loan portfolio. |
• | Other income decreased in 2017 principally due to lower gains on sales of other real estate owned. |
• | In both 2017 and 2016, asset/liability management strategies resulted in net gains on sales of securities, as market and interest rate conditions presented opportunities to accelerate earnings on securities, while meeting funding requirements of the Company. In 2017, the Company repositioned a part of its investment portfolio at a gain to improve responsiveness of the portfolio to increases in short-term interest rates. |
2016 versus 2015
Noninterest income increased $561,000 from 2015 to 2016. The following factors contributed to that net increase.
• | Service charges on deposit accounts increased due principally to revenues generated from new cash management product offerings and higher interchange fees associated with increased usage by our customers |
• | Other service charges, commissions and fees decreased in comparing 2016 with 2015. In 2015, these revenues were favorably impacted by gains on sale of Small Business Administration and U.S. Department of Agriculture loans. |
• | Trust, investment management and brokerage income increased $401,000 for 2016 compared with 2015. Trust and brokerage income in 2016 included increased estate fees partially offset by lower brokerage income. The addition of Wheatland as an investment manager had a modest impact on 2016 revenues as that acquisition occurred in December 2016. |
• | Favorable interest rate conditions supported increased new home purchases and refinancing activity resulting in the increase in mortgage banking revenue. |
26
• | Other income reflected, in part, decreased gains on sales of other real estate owned as well as changes due to customary business activities. |
• | For both years, asset/liability management strategies and interest rate conditions resulted in gains on sales of securities, as market conditions presented opportunities to accelerate earnings on securities through gains, while also meeting the funding requirements of current and anticipated lending activity. |
Noninterest Expenses
The following table compares noninterest expenses for 2017, 2016 and 2015.
$ Change | % Change | ||||||||||||||||||||||||
(Dollars in thousands) | 2017 | 2016 | 2015 | 2017-2016 | 2016-2015 | 2017-2016 | 2016-2015 | ||||||||||||||||||
Salaries and employee benefits | $ | 30,145 | $ | 26,370 | $ | 24,056 | $ | 3,775 | $ | 2,314 | 14.3 | % | 9.6 | % | |||||||||||
Occupancy | 2,806 | 2,491 | 2,221 | 315 | 270 | 12.6 | % | 12.2 | % | ||||||||||||||||
Furniture and equipment | 3,434 | 3,335 | 3,061 | 99 | 274 | 3.0 | % | 9.0 | % | ||||||||||||||||
Data processing | 2,271 | 2,378 | 2,026 | (107 | ) | 352 | (4.5 | )% | 17.4 | % | |||||||||||||||
Telephone and communication | 647 | 740 | 692 | (93 | ) | 48 | (12.6 | )% | 6.9 | % | |||||||||||||||
Automated teller machine and interchange fees | 767 | 748 | 798 | 19 | (50 | ) | 2.5 | % | (6.3 | )% | |||||||||||||||
Advertising and bank promotions | 1,600 | 1,717 | 1,564 | (117 | ) | 153 | (6.8 | )% | 9.8 | % | |||||||||||||||
FDIC insurance | 606 | 775 | 859 | (169 | ) | (84 | ) | (21.8 | )% | (9.8 | )% | ||||||||||||||
Legal | 802 | 850 | 1,440 | (48 | ) | (590 | ) | (5.6 | )% | (41.0 | )% | ||||||||||||||
Other professional services | 1,571 | 1,332 | 1,262 | 239 | 70 | 17.9 | % | 5.5 | % | ||||||||||||||||
Directors' compensation | 996 | 969 | 737 | 27 | 232 | 2.8 | % | 31.5 | % | ||||||||||||||||
Collection and problem loan | 186 | 238 | 447 | (52 | ) | (209 | ) | (21.8 | )% | (46.8 | )% | ||||||||||||||
Real estate owned | 69 | 239 | 162 | (170 | ) | 77 | (71.1 | )% | 47.5 | % | |||||||||||||||
Taxes other than income | 866 | 767 | 916 | 99 | (149 | ) | 12.9 | % | (16.3 | )% | |||||||||||||||
Regulatory settlement | 0 | 1,000 | 0 | (1,000 | ) | 1,000 | (100.0 | )% | 100.0 | % | |||||||||||||||
Other operating expenses | 3,564 | 4,191 | 4,366 | (627 | ) | (175 | ) | (15.0 | )% | (4.0 | )% | ||||||||||||||
Total noninterest expenses | $ | 50,330 | $ | 48,140 | $ | 44,607 | $ | 2,190 | $ | 3,533 | 4.5 | % | 7.9 | % | |||||||||||
2017 versus 2016
Noninterest expenses increased $2,190,000 from 2016 to 2017. The following factors contributed to that net increase.
• | The salaries and employee benefits increase includes the impact in 2017 of additional employees, including new customer-facing employees in targeted expansion markets, throughout 2016 and 2017. Higher costs in 2017 also include annual merit increases awarded in 2017, increased medical benefit costs for the expanded workforce and increased claim activity, incentive compensation increases and additional share-based awards granted in 2017. |
• | Occupancy and furniture and equipment expenses reflect a full period of expense for new facilities acquired in 2016 in Berks, Cumberland, Dauphin and Lancaster counties, Pennsylvania, as well as increases attributable to new facilities acquired in 2017 in Lancaster County, Pennsylvania. |
• | Advertising and bank promotion expense in 2016 included higher expenses related to expansion activities. |
• | The FDIC reached its 1.15% of insured funds target in June 2016, resulting in lower assessments. FDIC insurance expense in 2017 benefited from that lower assessment applied to our increased deposit base. |
• | Resolution of the SEC administrative proceedings in 2016 generally resulted in lower legal fees incurred in 2017. However, the Company incurred certain indemnification costs totaling $645,000, which is included in legal fees, with several professional service providers in 2017 in connection with previously disclosed outstanding litigation. Additional costs may be incurred as the litigation progresses. |
27
• | In 2016, the Company agreed to pay a $1,000,000 civil money penalty to the Securities and Exchange Commission to settle administrative proceedings. |
• | Principal contributors to lower other operating expenses in 2017 were decreases in provision expense for off-balance sheet reserves on loans that have been committed to borrowers, but not funded, resulting from changes in qualitative factors similar to those used in the determination of the provision for loan losses, and reduced consumer fraud expenses. |
• | Other line items within noninterest expenses reflect are generally attributable to normal fluctuations in the conduct of business. |
2016 versus 2015
Noninterest expenses increased $3,533,000 from 2015 to 2016. The following factors contributed to that net increase.
• | The increase in salaries and employee benefits reflects the impact of adding new customer-facing employees in markets targeted for expansion as well as merit increases. Other drivers were additional medical expense incurred for new employees and increased claim activity, increased expense associated with supplemental executive compensation and compensation related to share-based awards granted in 2016. |
• | Consistent with our growth strategy in which new facilities were acquired in Berks, Cumberland, Dauphin and Lancaster counties, we experienced increases in occupancy, furniture and equipment expenses. |
• | Increases in data processing and telephone and communication expenses reflect our volume and physical growth and costs associated with more sophisticated product and service offerings. |
• | Advertising and bank promotion increased principally due to $100,000 of incremental Educational Improvement Tax Credit contributions (a component of Pennsylvania tax credits) made in 2016 and increased expenditures related to brand marketing and expansion in new markets. |
• | The Company benefited from a lower assessment rate as the FDIC reached its 1.15% of insured funds target on June 20, 2016. |
• | Legal fees decreased as the Company had higher than normal legal expenses in 2015 as it attended to legal matters, including outstanding litigation against the Company and an investigation with the SEC which began in the second quarter of 2015 and concluded in the third quarter of 2016. Although certain legal matters were ongoing, the legal expenses associated with them in 2016 were less than the levels in 2015. |
• | The increase in directors' compensation includes fees associated with two new directors added to the Board of Directors in 2016 and increased expense in 2016 for share-based compensation. In 2015, share-based compensation was only in effect for seven months of the year. |
• | Collection and problem loan expense decreased as a result of a lower level of classified loans that were being worked out by the Company. Partially offsetting this expense benefit was an increase in real estate owned expense of $77,000 from 2015 to 2016. |
• | A significant portion of the decrease in taxes, other than income, relates to incremental Educational Improvement Tax Credit contribution credits for qualifying contributions made in 2016 versus 2015, and which largely offset the related increase in advertising and bank promotions noted above. |
• | The Company incurred and paid a civil money penalty of $1,000,000 to the SEC in 2016 to settle administrative proceedings against the Company. |
• | Other line items within noninterest expenses reflect modest changes from 2015 to 2016 and are generally attributable to normal fluctuations in the conduct of business. |
28
Income Taxes
Income tax expense totaled $4,338,000, $1,266,000 and $1,634,000 for 2017, 2016 and 2015. As described more fully in Note 7, Income Taxes, to the Consolidated Financial Statements under Part II, Item 8, "Financial Statements and Supplementary Data," due to tax reform enacted in 2017 the Company was required to remeasure its net deferred tax asset and incurred a tax expense of $2,635,000, which is included in total tax expense for 2017.
Note 7 also includes a reconciliation of our federal statutory tax rate to our effective tax rate, which is a meaningful comparison between years and measures income tax expense as a percentage of pretax income. The effective tax rate for 2017 was 34.9% compared with 16.0% for 2016 and 17.2% for 2015. Generally, our effective tax rate is lower than the federal statutory tax rate principally due to nontaxable interest earned on tax-free loans and securities and earnings on the cash surrender value of life insurance policies, offset partially by nondeductible expenses. In 2017, our higher effective tax rate was principally impacted by the tax expense incurred due to enacted tax reform. Effective January 1, 2016, the Company changed its statutory federal tax rate from 35% to 34% to reflect its assessment that it will not be in the higher tax bracket. As a result, income tax expense for 2016 increased $185,000 due to the application of the new rate to existing deferred balances.
Financial Condition
Management devotes substantial time to overseeing the investment of funds in loans and securities and the formulation of policies directed toward the profitability and management of the risks associated with these investments.
Securities Available for Sale
The Company utilizes securities available for sale to manage interest rate risk, to enhance income through interest and dividend income, to provide liquidity and to provide collateral for certain deposits and borrowings.
The Company has established investment policies and an asset management policy to assist in administering its investment portfolio. Decisions to purchase or sell these securities are based on economic conditions and management’s strategy to respond to changes in interest rates, liquidity, pledges to secure deposits and Repurchase Agreements and other factors while trying to maximize return on the investments. The Company may segregate its investment portfolio into three categories: “securities held to maturity,” “trading securities” and “securities available for sale.” Management has classified the entire securities portfolio as available for sale, which are accounted for at current market value with unrealized gains and losses excluded from earnings and reported in other comprehensive income, net of income taxes.
The Company’s securities available for sale portfolio includes debt and equity investments that are subject to varying degrees of credit and market risks, which arise from general market conditions, factors impacting specific industries, as well as news that may impact specific issues. Management monitors its debt securities, using various indicators in determining whether a debt security is other-than-temporarily impaired, including the extent of time the security has been in an unrealized loss position, and the extent of the unrealized loss. In addition, management assesses whether it is likely the Company will have to sell the security prior to recovery, or if it is able to hold the security until the price recovers. For those debt securities in which management concludes the security is other-than-temporarily impaired, it recognizes the credit component of an other-than-temporary impairment in earnings and the remaining portion in other comprehensive income. Given the strong asset quality of the debt security portfolio, the Company did not record any other-than-temporary impairment expense in 2017, 2016 or 2015.
For equity securities, when the Company has decided to sell an impaired available for sale security and does not expect the fair value of the security to fully recover before the expected time of sale, the security is deemed other-than-temporarily impaired in the period in which the decision to sell is made. The Company recognizes an impairment loss when the impairment is deemed other-than-temporary even if a decision to sell has not been made. The Company recorded no other-than-temporary impairment expense on equity securities for the years ended December 31, 2017, 2016 and 2015.
29
The following table summarizes fair value of securities available for sale at December 31.
(Dollars in thousands) | 2017 | 2016 | 2015 | ||||||||
U.S. Government Agencies | $ | 0 | $ | 39,592 | $ | 47,227 | |||||
States and political subdivisions | 159,458 | 164,282 | 125,961 | ||||||||
GSE residential mortgage-backed securities | 49,530 | 116,944 | 132,349 | ||||||||
GSE residential CMOs | 111,119 | 69,383 | 15,843 | ||||||||
GSE commercial CMOs | 0 | 4,856 | 63,770 | ||||||||
Private label residential CMOs | 1,003 | 5,006 | 8,901 | ||||||||
Private label commercial CMOs | 7,653 | 0 | 0 | ||||||||
Asset-backed | 86,431 | 0 | 0 | ||||||||
Total debt securities | 415,194 | 400,063 | 394,051 | ||||||||
Equity securities | 114 | 91 | 73 | ||||||||
Totals | $ | 415,308 | $ | 400,154 | $ | 394,124 | |||||
The Company increased its investment portfolio in 2017 to generate additional interest income, with the average balance of securities increasing from $360,355,000 for the year ended December 31, 2016 to $420,583,000 for the year ended December 31, 2017.
In early 2017, the Company liquidated its U.S. Government Agencies investments in anticipation of a flattening yield curve, with funds reinvested in fixed rate CMOs. The Company also took advantage of historically wide spreads and higher interest rates to add modestly to its holdings of longer-term fixed rate securities issued by states and political subdivisions. In the second half of 2017, the Company reduced its holdings of seasoned GSE residential mortgage-backed securities and intermediate maturity taxable securities issued by states and political subdivisions and reinvested the proceeds in floating rate asset-backed securities in anticipation of further increases in short-term interest rates.
In 2016, as a result of interest rate market conditions, the Company liquidated its GSE commercial CMOs portfolio during the first quarter of 2016 at a net gain of $1,420,000. The proceeds from the sale were used to fund loan growth, reduce short-term borrowings and maintain liquidity for the first half of 2016. In the third quarter of 2016, the Company elected to reduce liquidity and enhance interest income through the purchase of securities, primarily GSE residential CMOs.
Management anticipates the loan portfolio will continue to grow in 2018. Asset backed securities, MBSs and CMOs provide monthly cash flows that may be used, in part, to meet this anticipated loan demand.
30
The following table shows the maturities of investment securities at book value at December 31, 2017, and weighted average yields of such securities. Yields are shown on a tax equivalent basis, assuming a 34% federal income tax rate.
(Dollars in thousands) | Within 1 year | After 1 year but within 5 years | After 5 years but within 10 years | After 10 years | Total | ||||||||||||||
States and political subdivisions | |||||||||||||||||||
Book value | $ | 0 | $ | 8,712 | $ | 49,958 | $ | 95,133 | $ | 153,803 | |||||||||
Yield | 0.00 | % | 3.29 | % | 3.82 | % | 4.56 | % | 4.25 | % | |||||||||
Average maturity (years) | 0.0 | 3.9 | 8.0 | 16.4 | 12.9 | ||||||||||||||
GSE residential mortgage-backed securities | |||||||||||||||||||
Book value | 0 | 0 | 0 | 48,600 | 48,600 | ||||||||||||||
Yield | 0.00 | % | 0.00 | % | 0.00 | % | 2.57 | % | 2.57 | % | |||||||||
Average maturity (years) | 0.0 | 0.0 | 0.0 | 46.0 | 46.0 | ||||||||||||||
GSE residential CMOs | |||||||||||||||||||
Book value | 0 | 0 | 0 | 113,658 | 113,658 | ||||||||||||||
Yield | 0.00 | % | 0.00 | % | 0.00 | % | 2.07 | % | 2.07 | % | |||||||||
Average maturity (years) | 0.0 | 0.0 | 0.0 | 28.6 | 28.6 | ||||||||||||||
Private label residential CMOs | |||||||||||||||||||
Book value | 0 | 0 | 0 | 999 | 999 | ||||||||||||||
Yield | 0.00 | % | 0.00 | % | 0.00 | % | 2.34 | % | 2.34 | % | |||||||||
Average maturity (years) | 0.0 | 0.0 | 0.0 | 18.1 | 18.1 | ||||||||||||||
Private label commercial CMOs | |||||||||||||||||||
Book value | 0 | 0 | 0 | 7,809 | 7,809 | ||||||||||||||
Yield | 0.00 | % | 0.00 | % | 0.00 | % | 2.75 | % | 2.75 | % | |||||||||
Average maturity (years) | 0.0 | 0.0 | 0.0 | 17.4 | 17.4 | ||||||||||||||
Asset-backed | |||||||||||||||||||
Book value | 0 | 0 | 3,808 | 82,979 | 86,787 | ||||||||||||||
Yield | 0.00 | % | 0.00 | % | 2.30 | % | 2.31 | % | 2.31 | % | |||||||||
Average maturity (years) | 0.0 | 0.0 | 8.4 | 23.1 | 16.9 | ||||||||||||||
Total | |||||||||||||||||||
Book value | $ | 0 | $ | 8,712 | $ | 53,766 | $ | 349,178 | $ | 411,656 | |||||||||
Yield | 0.00 | % | 3.29 | % | 3.72 | % | 2.89 | % | 3.01 | % | |||||||||
Average maturity (years) | 0.0 | 3.9 | 8.0 | 26.1 | 23.3 | ||||||||||||||
The average maturity is based on the contractual terms of the debt or mortgage-backed securities, and does not factor in required repayments or anticipated prepayments. At December 31, 2017, the weighted average estimated life is 5.1 years for mortgage-backed and CMO securities, and 8.3 years for asset-backed securities, based on current interest rates and anticipated prepayment speeds.
Loan Portfolio
The Company offers a variety of products to meet the credit needs of our borrowers, principally commercial real estate loans, commercial and industrial loans, and retail loans consisting of loans secured by residential properties, and to a lesser extent, installment loans. No loans are extended to non-domestic borrowers or governments.
Generally, we are permitted under applicable law to make loans to single borrowers (including certain related persons and entities) in aggregate amounts of up to 15% of the sum of total capital and the ALL. The Company’s legal lending limit to one borrower was $22,100,000 at December 31, 2017. No borrower had an outstanding exposure exceeding the limit at year-end.
The risks associated with lending activities differ among loan classes and are subject to the impact of changes in interest rates, market conditions of collateral securing the loans and general economic conditions. Any of these factors may adversely impact a borrower’s ability to repay loans, and also impact the associated collateral. A further discussion on the classes of loans
31
the Company makes and related risks is included in Note 1, Summary of Significant Accounting Policies, and Note 4, Loans and Allowance for Loan Losses, to the Consolidated Financial Statements under Part II, Item 8, "Financial Statements and Supplementary Data."
The following table presents the loan portfolio, excluding residential LHFS, by segments and classes at December 31.
(Dollars in thousands) | December 31, 2017 | December 31, 2016 | December 31, 2015 | December 31, 2014 | December 31, 2013 | ||||||||||||||
Commercial real estate: | |||||||||||||||||||
Owner-occupied | $ | 116,811 | $ | 112,295 | $ | 103,578 | $ | 100,859 | $ | 111,290 | |||||||||
Non-owner occupied | 244,491 | 206,358 | 145,401 | 144,301 | 135,953 | ||||||||||||||
Multi-family | 53,634 | 47,681 | 35,109 | 27,531 | 22,882 | ||||||||||||||
Non-owner occupied residential | 77,980 | 62,533 | 54,175 | 49,315 | 55,272 | ||||||||||||||
Acquisition and development: | |||||||||||||||||||
1-4 family residential construction | 11,730 | 4,663 | 9,364 | 5,924 | 3,338 | ||||||||||||||
Commercial and land development | 19,251 | 26,085 | 41,339 | 24,237 | 19,440 | ||||||||||||||
Commercial and industrial | 115,663 | 88,465 | 73,625 | 48,995 | 33,446 | ||||||||||||||
Municipal | 42,065 | 53,741 | 57,511 | 61,191 | 60,996 | ||||||||||||||
Residential mortgage: | |||||||||||||||||||
First lien | 162,509 | 139,851 | 126,022 | 126,491 | 124,728 | ||||||||||||||
Home equity – term | 11,784 | 14,248 | 17,337 | 20,845 | 20,131 | ||||||||||||||
Home equity – lines of credit | 132,192 | 120,353 | 110,731 | 89,366 | 77,377 | ||||||||||||||
Installment and other loans | 21,902 | 7,118 | 7,521 | 5,891 | 6,184 | ||||||||||||||
$ | 1,010,012 | $ | 883,391 | $ | 781,713 | $ | 704,946 | $ | 671,037 | ||||||||||
The loan portfolio at December 31, 2017 increased $126,621,000, or 14.3%, from December 31, 2016. Loan growth was experienced in most loan classes. We have hired and anticipate hiring additional lenders as we continue to grow in both core markets and in new markets, such as Lancaster and Dauphin counties, Pennsylvania, through expansion of our sales force and by capitalizing on continued disruption caused by the acquisition of some of our competitors by larger institutions. Commercial real estate experienced the largest dollar increase and grew by $64,049,000, or 14.9%. The residential mortgage loan segment grew $32,033,000, or 11.7%. Commercial and industrial loans grew $27,198,000, or 30.7%, and reflected management's additional emphasis in 2017 on growing this segment to increase portfolio diversification. In 2017, we also purchased approximately $15,000,000 of automobile financing loans, which are included in installment and other loans, at returns higher than comparable cash flows in the investment portfolio.
Competition for new business opportunities remains strong, which may temper loan growth in future quarters.
In addition to monitoring our loan portfolio by loan class as noted above, we also monitor concentrations by industry. The Bank’s lending policy defines an industry concentration as one that exceeds 25% of the Bank’s total risk-based capital ("RBC"). The following industries met this criteria at December 31, 2017:
(Dollars in thousands) | Balance | % of Total Loans | % of Total RBC | ||
Office space | $88,159 | 8.7% | 59.2% | ||
Strip retail shopping centers | 41,929 | 4.2% | 28.1% | ||
32
The following table presents expected maturities of certain loan classes by fixed rate or adjustable rate categories at December 31, 2017.
Due In | |||||||||||||||
(Dollars in thousands) | One Year or Less | One Year Through Five Years | After Five Years | Total | |||||||||||
Acquisition and development: | |||||||||||||||
1-4 family residential construction | |||||||||||||||
Fixed rate | $ | 0 | $ | 0 | $ | 6,138 | $ | 6,138 | |||||||
Adjustable and floating rate | 4,734 | 0 | 858 | 5,592 | |||||||||||
4,734 | 0 | 6,996 | 11,730 | ||||||||||||
Commercial and land development | |||||||||||||||
Fixed rate | 574 | 713 | 3,360 | 4,647 | |||||||||||
Adjustable and floating rate | 1,639 | 374 | 12,591 | 14,604 | |||||||||||
2,213 | 1,087 | 15,951 | 19,251 | ||||||||||||
Commercial and industrial | |||||||||||||||
Fixed rate | 757 | 36,428 | 16,064 | 53,249 | |||||||||||
Adjustable and floating rate | 40,053 | 8,174 | 14,187 | 62,414 | |||||||||||
40,810 | 44,602 | 30,251 | 115,663 | ||||||||||||
$ | 47,757 | $ | 45,689 | $ | 53,198 | $ | 146,644 | ||||||||
The final maturity is used in the determination of maturity of acquisition and development loans that convert from construction to permanent status. Variable rate loans shown above include semi-fixed loans that contractually will adjust with prime or LIBOR after the interest lock period, which may be up to 10 years. At December 31, 2017, these semi-fixed loans totaled $17,479,000.
Asset Quality
Risk Elements
The Company’s loan portfolio is subject to varying degrees of credit risk. Credit risk is mitigated through our underwriting standards, on-going credit reviews, and monitoring of asset quality measures. Additionally, loan portfolio diversification, which limits exposure to a single industry or borrower, and collateral requirements also mitigate our risk of credit loss.
33
The following table presents the Company’s risk elements and relevant asset quality ratios at December 31.
(Dollars in thousands) | 2017 | 2016 | 2015 | 2014 | 2013 | ||||||||||||||
Nonaccrual loans (cash basis) | $ | 9,843 | $ | 7,043 | $ | 16,557 | $ | 14,432 | $ | 19,347 | |||||||||
Other real estate owned (OREO) | 961 | 346 | 710 | 932 | 987 | ||||||||||||||
Total nonperforming assets | 10,804 | 7,389 | 17,267 | 15,364 | 20,334 | ||||||||||||||
Restructured loans still accruing | 1,183 | 930 | 793 | 1,100 | 5,988 | ||||||||||||||
Loans past due 90 days or more and still accruing | 0 | 0 | 24 | 0 | 0 | ||||||||||||||
Total nonperforming and other risk assets | $ | 11,987 | $ | 8,319 | $ | 18,084 | $ | 16,464 | $ | 26,322 | |||||||||
Loans 30-89 days past due | $ | 5,277 | $ | 1,218 | $ | 2,532 | $ | 1,612 | $ | 3,963 | |||||||||
Ratio of: | |||||||||||||||||||
Total nonperforming loans to loans | 0.97 | % | 0.80 | % | 2.12 | % | 2.05 | % | 2.88 | % | |||||||||
Total nonperforming assets to assets | 0.69 | % | 0.52 | % | 1.34 | % | 1.29 | % | 1.73 | % | |||||||||
Total nonperforming assets to total loans and OREO | 1.07 | % | 0.84 | % | 2.21 | % | 2.18 | % | 3.03 | % | |||||||||
Total risk assets to total loans and OREO | 1.19 | % | 0.94 | % | 2.31 | % | 2.33 | % | 3.92 | % | |||||||||
Total risk assets to total assets | 0.77 | % | 0.59 | % | 1.40 | % | 1.38 | % | 2.23 | % | |||||||||
Allowance for loan losses to total loans | 1.27 | % | 1.45 | % | 1.74 | % | 2.09 | % | 3.12 | % | |||||||||
Allowance for loan losses to nonperforming loans | 130.00 | % | 181.39 | % | 81.95 | % | 102.18 | % | 108.36 | % | |||||||||
Allowance for loan losses to nonperforming loans and restructured loans still accruing | 116.05 | % | 160.23 | % | 78.20 | % | 94.95 | % | 82.75 | % | |||||||||
The following table provides detail of impaired loans at December 31, 2017 and 2016.
2017 | 2016 | ||||||||||||||||||||||
(Dollars in thousands) | Nonaccrual Loans | Restructured Loans Still Accruing | Total | Nonaccrual Loans | Restructured Loans Still Accruing | Total | |||||||||||||||||
Commercial real estate: | |||||||||||||||||||||||
Owner occupied | $ | 1,185 | $ | 52 | $ | 1,237 | $ | 1,070 | $ | 0 | $ | 1,070 | |||||||||||
Non-owner occupied | 4,065 | 0 | 4,065 | 736 | 0 | 736 | |||||||||||||||||
Multi-family | 165 | 0 | 165 | 199 | 0 | 199 | |||||||||||||||||
Non-owner occupied residential | 381 | 0 | 381 | 452 | 0 | 452 | |||||||||||||||||
Acquisition and development | |||||||||||||||||||||||
1-4 family residential construction | 492 | 0 | 492 | 0 | 0 | 0 | |||||||||||||||||
Commercial and land development | 0 | 0 | 0 | 1 | 0 | 1 | |||||||||||||||||
Commercial and industrial | 350 | 0 | 350 | 595 | 0 | 595 | |||||||||||||||||
Residential mortgage: | |||||||||||||||||||||||
First lien | 2,734 | 1,102 | 3,836 | 3,396 | 896 | 4,292 | |||||||||||||||||
Home equity – term | 22 | 0 | 22 | 93 | 34 | 127 | |||||||||||||||||
Home equity – lines of credit | 438 | 29 | 467 | 495 | 0 | 495 | |||||||||||||||||
Installment and other loans | 11 | 0 | 11 | 6 | 0 | 6 | |||||||||||||||||
$ | 9,843 | $ | 1,183 | $ | 11,026 | $ | 7,043 | $ | 930 | $ | 7,973 | ||||||||||||
Nonperforming assets include nonaccrual loans and foreclosed real estate. Risk assets, which incorporate nonperforming assets and restructured and loans past due 90 days or more and still accruing, totaled $11,987,000 at December 31, 2017, an increase of $3,668,000, or 44.1%, from $8,319,000 at December 31, 2016. Nonaccrual loans totaled $9,843,000 at December 31, 2017, an increase of $2,800,000 from December 31, 2016. Both measures principally reflect the addition of one commercial loan downgraded to nonaccrual status in the fourth quarter of 2017. The overall reduction of risk assets and
34
nonaccrual loans from December 31, 2015 to December 31, 2016 was due principally to the sale of a loan with a carrying balance of $5,946,000 to a third party. Cash proceeds totaled $5,100,000 with the $846,000 difference recorded as a charge-off to the ALL in 2016.
The ALL totaled $12,796,000 at December 31, 2017, a $21,000 increase from $12,775,000 at December 31, 2016, resulting from net charge-offs of $979,000 and a provision for loan losses of $1,000,000 for 2017. While the ALL is lower as a percentage of the total loan portfolio at December 31, 2017 than in prior years, management believes its coverage ratios are adequate for the risk profile of the loan portfolio given ongoing monitoring of the portfolio and its analysis performed at December 31, 2017. As new information is learned about borrowers or updated appraisals on real estate with lower fair values are obtained, the Company may continue to experience additional impaired loans.
For the years ended December 31, 2017, 2016, and 2015 recoveries of $287,000, $679,000 and $926,000 were credited to the ALL. These recoveries on previously charged-off relationships are the result of successful loan monitoring and workout solutions. Recoveries are difficult to predict, and any additional recoveries that the Company receives will be used to replenish the ALL. Recoveries favorably impact historical charge-off factors, and contribute to changes in quantitative as well as qualitative factors used in our allowance adequacy analysis. In 2015, a negative provision for loan losses was recorded. However, as the loan portfolio continues to grow, future provisions for loan losses may result.
The Company takes partial charge-offs on collateral-dependent loans when carrying value exceeds estimated fair value, as determined by the most recent appraisal adjusted for current (within the quarter) conditions, less costs to dispose. Impairment reserves remain in place if updated appraisals are pending, and represent management’s estimate of potential loss.
The following table presents exposure to relationships with an impaired loan balance, partial charge-offs taken to date and specific reserves established on the relationships at December 31, 2017 and 2016. Of the relationships deemed to be impaired at December 31, 2017, one had a recorded balance in excess of $1,000,000 and 62, or 91.2%, had recorded balances less than $250,000.
(Dollars in thousands) | # of Relationships | Recorded Investment | Partial Charge-offs to Date | Specific Reserves | ||||||||||
December 31, 2017 | ||||||||||||||
Relationships greater than $1,000,000 | 1 | $ | 4,065 | $ | 791 | $ | 0 | |||||||
Relationships greater than $500,000 but less than $1,000,000 | 1 | 518 | 145 | 0 | ||||||||||
Relationships greater than $250,000 but less than $500,000 | 4 | 1,501 | 120 | 0 | ||||||||||
Relationships less than $250,000 | 62 | 4,942 | 1,160 | 51 | ||||||||||
68 | $ | 11,026 | $ | 2,216 | $ | 51 | ||||||||
December 31, 2016 | ||||||||||||||
Relationships greater than $1,000,000 | 0 | $ | 0 | $ | 0 | $ | 0 | |||||||
Relationships greater than $500,000 but less than $1,000,000 | 2 | 1,327 | 620 | 0 | ||||||||||
Relationships greater than $250,000 but less than $500,000 | 2 | 640 | 120 | 0 | ||||||||||
Relationships less than $250,000 | 75 | 6,006 | 1,184 | 43 | ||||||||||
79 | $ | 7,973 | $ | 1,924 | $ | 43 | ||||||||
Internal loan reviews are completed annually on all commercial relationships with a committed loan balance in excess of $500,000, which includes confirmation of risk rating by an independent credit officer. Credit Administration also reviews loans in excess of $1,000,000. In addition, all relationships greater than $250,000 rated Substandard, Doubtful or Loss are reviewed and corresponding risk ratings are reaffirmed by the Bank's Problem Loan Committee, with subsequent reporting to the ERM Committee.
In its individual loan impairment analysis, the Company determines the extent of any full or partial charge-offs that may be required, or any reserves that may be needed. The determination of the Company’s charge-offs or impairment reserve include an evaluation of the outstanding loan balance and the related collateral securing the credit. Through a combination of collateral securing the loans and partial charge-offs taken to date, the Company believes that it has adequately provided for the potential losses that it may incur on these relationships at December 31, 2017. However, over time, additional information may
35
result in increased reserve allocations or, alternatively, it may be deemed that the reserve allocations exceed those that are needed.
The Company’s foreclosed real estate balance consisted of two commercial properties totaling $961,000 at December 31, 2017. The Company believes the value of foreclosed real estate represents its fair value, but if the real estate values decline, additional charges may be needed. During 2017, no expense was recorded for writedown of other real estate owned properties.
Credit Risk Management
Allowance for Loan Losses
The Company maintains the ALL at a level deemed adequate by management for probable incurred credit losses. The ALL is established and maintained through a provision for loan losses charged to earnings. Quarterly, management assesses the adequacy of the ALL utilizing a defined methodology which considers specific credit evaluation of impaired loans, past loan loss historical experience and qualitative factors. Management addresses the requirements for loans individually identified as impaired, loans collectively evaluated for impairment, and other bank regulatory guidance in its assessment.
The ALL is evaluated based on review of the collectability of loans in light of historical experience; the nature and volume of the loan portfolio; adverse situations that may affect a borrower’s ability to repay; estimated value of any underlying collateral; and prevailing economic conditions. This evaluation is inherently subjective as it requires estimates that are susceptible to significant revision as more information becomes available. A description of the methodology for establishing the allowance and provision for loan losses and related procedures in establishing the appropriate level of reserve is included in Note 4, Loans and Allowance for Loan Losses, to the Consolidated Financial Statements under Part II, Item 8, "Financial Statements and Supplementary Data."
36
The following table summarizes the Company’s internal risk ratings at December 31.
(Dollars in thousands) | Pass | Special Mention | Non-Impaired Substandard | Impaired - Substandard | Doubtful | Total | |||||||||||||||||
December 31, 2017 | |||||||||||||||||||||||
Commercial real estate: | |||||||||||||||||||||||
Owner-occupied | $ | 113,240 | $ | 413 | $ | 1,921 | $ | 1,237 | $ | 0 | $ | 116,811 | |||||||||||
Non-owner occupied | 235,919 | 0 | 4,507 | 4,065 | 0 | 244,491 | |||||||||||||||||
Multi-family | 48,603 | 4,113 | 753 | 165 | 0 | 53,634 | |||||||||||||||||
Non-owner occupied residential | 76,373 | 142 | 1,084 | 381 | 0 | 77,980 | |||||||||||||||||
Acquisition and development: | |||||||||||||||||||||||
1-4 family residential construction | 11,238 | 0 | 0 | 492 | 0 | 11,730 | |||||||||||||||||
Commercial and land development | 18,635 | 5 | 611 | 0 | 0 | 19,251 | |||||||||||||||||
Commercial and industrial | 113,162 | 2,151 | 0 | 350 | 0 | 115,663 | |||||||||||||||||
Municipal | 42,065 | 0 | 0 | 0 | 0 | 42,065 | |||||||||||||||||
Residential mortgage: | |||||||||||||||||||||||
First lien | 158,673 | 0 | 0 | 3,836 | 0 | 162,509 | |||||||||||||||||
Home equity – term | 11,762 | 0 | 0 | 22 | 0 | 11,784 | |||||||||||||||||
Home equity – lines of credit | 131,585 | 80 | 60 | 467 | 0 | 132,192 | |||||||||||||||||
Installment and other loans | 21,891 | 0 | 0 | 11 | 0 | 21,902 | |||||||||||||||||
$ | 983,146 | $ | 6,904 | $ | 8,936 | $ | 11,026 | $ | 0 | $ | 1,010,012 | ||||||||||||
December 31, 2016 | |||||||||||||||||||||||
Commercial real estate: | |||||||||||||||||||||||
Owner-occupied | $ | 103,652 | $ | 5,422 | $ | 2,151 | $ | 1,070 | $ | 0 | $ | 112,295 | |||||||||||
Non-owner occupied | 190,726 | 4,791 | 10,105 | 736 | 0 | 206,358 | |||||||||||||||||
Multi-family | 42,473 | 4,222 | 787 | 199 | 0 | 47,681 | |||||||||||||||||
Non-owner occupied residential | 59,982 | 949 | 1,150 | 452 | 0 | 62,533 | |||||||||||||||||
Acquisition and development: | |||||||||||||||||||||||
1-4 family residential construction | 4,560 | 103 | 0 | 0 | 0 | 4,663 | |||||||||||||||||
Commercial and land development | 25,435 | 10 | 639 | 1 | 0 | 26,085 | |||||||||||||||||
Commercial and industrial | 87,588 | 251 | 32 | 594 | 0 | 88,465 | |||||||||||||||||
Municipal | 53,741 | 0 | 0 | 0 | 0 | 53,741 | |||||||||||||||||
Residential mortgage: | |||||||||||||||||||||||
First lien | 135,558 | 0 | 0 | 4,293 | 0 | 139,851 | |||||||||||||||||
Home equity – term | 14,155 | 0 | 0 | 93 | 0 | 14,248 | |||||||||||||||||
Home equity – lines of credit | 119,681 | 82 | 61 | 529 | 0 | 120,353 | |||||||||||||||||
Installment and other loans | 7,112 | 0 | 0 | 6 | 0 | 7,118 | |||||||||||||||||
$ | 844,663 | $ | 15,830 | $ | 14,925 | $ | 7,973 | $ | 0 | $ | 883,391 | ||||||||||||
Potential problem loans are defined as performing loans which have characteristics that cause management concern over the ability of the borrower to perform under present loan repayment terms and which may result in the reporting of these loans as nonperforming loans in the future. Generally, management feels that Substandard loans that are currently performing and not considered impaired result in some doubt as to the borrower’s ability to continue to perform under the terms of the loan, and represent potential problem loans. Additionally, the Special Mention classification is intended to be a temporary classification reflective of loans that have potential weaknesses that may, if not monitored or corrected, weaken the asset or inadequately protect the Company’s position at some future date. Special Mention loans represent an elevated risk, but their weakness does not yet justify a more severe, or classified, rating. These loans require inquiry by lenders on the cause of the potential weakness and, once analyzed, the loan classification may be downgraded to Substandard or, alternatively, could be upgraded to Pass.
37
The following tables summarize the average recorded investment in impaired loans and interest income recognized, on a cash basis, and interest income earned but not recognized for years ended December 31.
(Dollars in thousands) | Average Impaired Balance | Interest Income Recognized | Interest Earned But Not Recognized | ||||||||
December 31, 2017 | |||||||||||
Commercial real estate: | |||||||||||
Owner-occupied | $ | 1,000 | $ | 6 | $ | 114 | |||||
Non-owner occupied | 392 | 0 | 10 | ||||||||
Multi-family | 182 | 0 | 19 | ||||||||
Non-owner occupied residential | 418 | 0 | 35 | ||||||||
Acquisition and development: | |||||||||||
1-4 family residential construction | 154 | 0 | 7 | ||||||||
Commercial and industrial | 413 | 0 | 25 | ||||||||
Residential mortgage: | |||||||||||
First lien | 4,012 | 58 | 136 | ||||||||
Home equity – term | 61 | 0 | 1 | ||||||||
Home equity – lines of credit | 488 | 2 | 26 | ||||||||
Installment and other loans | 10 | 0 | 3 | ||||||||
$ | 7,130 | $ | 66 | $ | 376 | ||||||
December 31, 2016 | |||||||||||
Commercial real estate: | |||||||||||
Owner-occupied | $ | 1,758 | $ | 0 | $ | 124 | |||||
Non-owner occupied | 6,831 | 0 | 326 | ||||||||
Multi-family | 216 | 0 | 17 | ||||||||
Non-owner occupied residential | 645 | 0 | 35 | ||||||||
Acquisition and development: | |||||||||||
Commercial and land development | 3 | 0 | 1 | ||||||||
Commercial and industrial | 575 | 0 | 25 | ||||||||
Residential mortgage: | |||||||||||
First lien | 4,525 | 33 | 175 | ||||||||
Home equity – term | 98 | 0 | 6 | ||||||||
Home equity – lines of credit | 455 | 0 | 19 | ||||||||
Installment and other loans | 12 | 0 | 3 | ||||||||
$ | 15,118 | $ | 33 | $ | 731 | ||||||
December 31, 2015 | |||||||||||
Commercial real estate: | |||||||||||
Owner-occupied | $ | 2,613 | $ | 0 | $ | 177 | |||||
Non-owner occupied | 3,470 | 0 | 256 | ||||||||
Multi-family | 402 | 0 | 15 | ||||||||
Non-owner occupied residential | 1,020 | 0 | 56 | ||||||||
Acquisition and development: | |||||||||||
Commercial and land development | 266 | 137 | 2 | ||||||||
Commercial and industrial | 1,208 | 0 | 28 | ||||||||
Residential mortgage: | |||||||||||
First lien | 4,644 | 37 | 167 | ||||||||
Home equity – term | 130 | 0 | 3 | ||||||||
Home equity – lines of credit | 571 | 0 | 29 | ||||||||
Installment and other loans | 22 | 0 | 3 | ||||||||
$ | 14,346 | $ | 174 | $ | 736 | ||||||
38
(Dollars in thousands) | Average Impaired Balance | Interest Income Recognized | Interest Earned But Not Recognized | ||||||||
December 31, 2014 | |||||||||||
Commercial real estate: | |||||||||||
Owner-occupied | $ | 3,740 | $ | 20 | $ | 179 | |||||
Non-owner occupied | 6,711 | 143 | 156 | ||||||||
Multi-family | 274 | 2 | 6 | ||||||||
Non-owner occupied residential | 2,095 | 13 | 62 | ||||||||
Acquisition and development: | |||||||||||
Commercial and land development | 1,250 | 34 | 59 | ||||||||
Commercial and industrial | 1,700 | 5 | 19 | ||||||||
Residential mortgage: | |||||||||||
First lien | 4,226 | 53 | 196 | ||||||||
Home equity – term | 85 | 0 | 5 | ||||||||
Home equity – lines of credit | 111 | 3 | 25 | ||||||||
Installment and other loans | 9 | 1 | 1 | ||||||||
$ | 20,201 | $ | 274 | $ | 708 | ||||||
December 31, 2013 | |||||||||||
Commercial real estate: | |||||||||||
Owner-occupied | $ | 3,528 | $ | 147 | $ | 192 | |||||
Non-owner occupied | 4,307 | 145 | 44 | ||||||||
Multi-family | 135 | 16 | 6 | ||||||||
Non-owner occupied residential | 4,799 | 77 | 180 | ||||||||
Acquisition and development: | |||||||||||
1-4 family residential construction | 481 | 0 | 0 | ||||||||
Commercial and land development | 3,009 | 49 | 127 | ||||||||
Commercial and industrial | 1,780 | 45 | 46 | ||||||||
Residential mortgage: | |||||||||||
First lien | 2,697 | 140 | 103 | ||||||||
Home equity – term | 59 | 8 | 2 | ||||||||
Home equity – lines of credit | 305 | 6 | 2 | ||||||||
Installment and other loans | 1 | 0 | 0 | ||||||||
$ | 21,101 | $ | 633 | $ | 702 | ||||||
39
The following table summarizes activity in the ALL for years ended December 31.
Commercial | Consumer | ||||||||||||||||||||||||||||||||||||||
(Dollars in thousands) | Commercial Real Estate | Acquisition and Development | Commercial and Industrial | Municipal | Total | Residential Mortgage | Installment and Other | Total | Unallocated | Total | |||||||||||||||||||||||||||||
December 31, 2017 | |||||||||||||||||||||||||||||||||||||||
Balance, beginning of year | $ | 7,530 | $ | 580 | $ | 1,074 | $ | 54 | $ | 9,238 | $ | 2,979 | $ | 144 | $ | 3,123 | $ | 414 | $ | 12,775 | |||||||||||||||||||
Provision for loan losses | 38 | (167 | ) | 333 | 30 | 234 | 531 | 174 | 705 | 61 | 1,000 | ||||||||||||||||||||||||||||
Charge-offs | (835 | ) | 0 | (85 | ) | 0 | (920 | ) | (180 | ) | (166 | ) | (346 | ) | 0 | (1,266 | ) | ||||||||||||||||||||||
Recoveries | 30 | 4 | 124 | 0 | 158 | 70 | 59 | 129 | 0 | 287 | |||||||||||||||||||||||||||||
Balance, end of year | $ | 6,763 | $ | 417 | $ | 1,446 | $ | 84 | $ | 8,710 | $ | 3,400 | $ | 211 | $ | 3,611 | $ | 475 | $ | 12,796 | |||||||||||||||||||
December 31, 2016 | |||||||||||||||||||||||||||||||||||||||
Balance, beginning of year | $ | 7,883 | $ | 850 | $ | 1,012 | $ | 58 | $ | 9,803 | $ | 2,870 | $ | 121 | $ | 2,991 | $ | 774 | $ | 13,568 | |||||||||||||||||||
Provision for loan losses | 107 | (270 | ) | 129 | (4 | ) | (38 | ) | 532 | 116 | 648 | (360 | ) | 250 | |||||||||||||||||||||||||
Charge-offs | (872 | ) | 0 | (79 | ) | 0 | (951 | ) | (577 | ) | (194 | ) | (771 | ) | 0 | (1,722 | ) | ||||||||||||||||||||||
Recoveries | 412 | 0 | 12 | 0 | 424 | 154 | 101 | 255 | 0 | 679 | |||||||||||||||||||||||||||||
Balance, end of year | $ | 7,530 | $ | 580 | $ | 1,074 | $ | 54 | $ | 9,238 | $ | 2,979 | $ | 144 | $ | 3,123 | $ | 414 | $ | 12,775 | |||||||||||||||||||
December 31, 2015 | |||||||||||||||||||||||||||||||||||||||
Balance, beginning of year | $ | 9,462 | $ | 697 | $ | 806 | $ | 183 | $ | 11,148 | $ | 2,262 | $ | 119 | $ | 2,381 | $ | 1,218 | $ | 14,747 | |||||||||||||||||||
Provision for loan losses | (1,020 | ) | (440 | ) | 249 | (125 | ) | (1,336 | ) | 1,122 | 55 | 1,177 | (444 | ) | (603 | ) | |||||||||||||||||||||||
Charge-offs | (711 | ) | (22 | ) | (115 | ) | 0 | (848 | ) | (592 | ) | (62 | ) | (654 | ) | 0 | (1,502 | ) | |||||||||||||||||||||
Recoveries | 152 | 615 | 72 | 0 | 839 | 78 | 9 | 87 | 0 | 926 | |||||||||||||||||||||||||||||
Balance, end of year | $ | 7,883 | $ | 850 | $ | 1,012 | $ | 58 | $ | 9,803 | $ | 2,870 | $ | 121 | $ | 2,991 | $ | 774 | $ | 13,568 | |||||||||||||||||||
December 31, 2014 | |||||||||||||||||||||||||||||||||||||||
Balance, beginning of year | $ | 13,215 | $ | 670 | $ | 864 | $ | 244 | $ | 14,993 | $ | 3,780 | $ | 124 | $ | 3,904 | $ | 2,068 | $ | 20,965 | |||||||||||||||||||
Provision for loan losses | (1,674 | ) | 92 | (554 | ) | (61 | ) | (2,197 | ) | (960 | ) | 107 | (853 | ) | (850 | ) | (3,900 | ) | |||||||||||||||||||||
Charge-offs | (2,637 | ) | (70 | ) | (270 | ) | 0 | (2,977 | ) | (587 | ) | (177 | ) | (764 | ) | 0 | (3,741 | ) | |||||||||||||||||||||
Recoveries | 558 | 5 | 766 | 0 | 1,329 | 29 | 65 | 94 | 0 | 1,423 | |||||||||||||||||||||||||||||
Balance, end of year | $ | 9,462 | $ | 697 | $ | 806 | $ | 183 | $ | 11,148 | $ | 2,262 | $ | 119 | $ | 2,381 | $ | 1,218 | $ | 14,747 | |||||||||||||||||||
December 31, 2013 | |||||||||||||||||||||||||||||||||||||||
Balance, beginning of year | $ | 13,719 | $ | 3,502 | $ | 1,635 | $ | 223 | $ | 19,079 | $ | 2,275 | $ | 85 | $ | 2,360 | $ | 1,727 | $ | 23,166 | |||||||||||||||||||
Provision for loan losses | 4,109 | (6,087 | ) | (3,478 | ) | 21 | (5,435 | ) | 1,845 | 99 | 1,944 | 341 | (3,150 | ) | |||||||||||||||||||||||||
Charge-offs | (4,767 | ) | (193 | ) | (132 | ) | 0 | (5,092 | ) | (491 | ) | (144 | ) | (635 | ) | 0 | (5,727 | ) | |||||||||||||||||||||
Recoveries | 154 | 3,448 | 2,839 | 0 | 6,441 | 151 | 84 | 235 | 0 | 6,676 | |||||||||||||||||||||||||||||
Balance, end of year | $ | 13,215 | $ | 670 | $ | 864 | $ | 244 | $ | 14,993 | $ | 3,780 | $ | 124 | $ | 3,904 | $ | 2,068 | $ | 20,965 | |||||||||||||||||||
40
The following table summarizes asset quality ratios for years ended December 31.
2017 | 2016 | 2015 | 2014 | 2013 | ||||||||||
Ratio of net charge-offs (recoveries) to average loans outstanding | 0.10 | % | 0.13 | % | 0.08 | % | 0.34 | % | (0.14 | )% | ||||
Provision for loan losses to net charge-offs (recoveries) | 102.15 | % | 23.97 | % | (104.69 | )% | (168.25 | )% | 331.93 | % | ||||
Ratio of ALL to total loans outstanding at December 31 | 1.27 | % | 1.45 | % | 1.74 | % | 2.09 | % | 3.12 | % | ||||
In 2011, the Company experienced significant deterioration in asset quality due to trends in the national and local economies, as well as declines in real estate values in the Company’s market area. In 2012, subsequent to high levels of nonperforming assets and restructured loans recorded in 2011, the Company continued to actively identify and monitor nonperforming assets. The Company continued to focus on working through its risk assets and, based on favorable trends in net charge-offs and improving asset quality ratios, was able to reduce the ALL over the following years to its current level.
The Company recorded a provision for loan losses expense of $1,000,000 and $250,000 for 2017 and 2016, and negative provisions, or reversals of amounts previously provided, of $603,000, $3,900,000 and $3,150,000 for 2015, 2014 and 2013. For each of the years in which a negative provision for loan losses was recorded, it was due to recovery of loans with prior charge-offs, allowing for the recovery. In addition, in certain cases loans were successfully worked out with smaller charge-offs than the reserve established on them. For 2013 through 2016, favorable historical charge-off data combined with relatively stable economic and market conditions resulted in the conclusion that a negative or modest provision could be recorded despite net charge-offs recorded. In 2017, management determined that a provision expense that offset net charge-offs for the year would maintain an adequate ALL, principally due to a charge-off in connection with one commercial credit downgraded to nonaccrual status during the year. The significant variations in net charge-offs (recoveries) and provision expense resulted in the fluctuations in the ratios as presented in the tables above.
See further discussion in the “Provision for Loan Losses” section of this Management’s Discussion and Analysis of Financial Condition and Results of Operations.
The following table shows the allocation of the ALL by loan class, as well as the percent of each loan class in relation to the total loan balance at December 31.
2017 | 2016 | 2015 | 2014 | 2013 | ||||||||||||||||||||||||||||||
Amount | % of Loan Type to Total Loans | Amount | % of Loan Type to Total Loans | Amount | % of Loan Type to Total Loans | Amount | % of Loan Type to Total Loans | Amount | % of Loan Type to Total Loans | |||||||||||||||||||||||||
Commercial real estate: | ||||||||||||||||||||||||||||||||||
Owner-occupied | $ | 1,488 | 12 | % | $ | 1,591 | 13 | % | $ | 1,998 | 13 | % | $ | 2,059 | 14 | % | $ | 3,583 | 17 | % | ||||||||||||||
Non-owner occupied | 4,059 | 24 | % | 4,380 | 23 | % | 4,033 | 19 | % | 4,887 | 20 | % | 6,024 | 20 | % | |||||||||||||||||||
Multi-family | 444 | 5 | % | 604 | 5 | % | 709 | 5 | % | 1,231 | 4 | % | 1,699 | 3 | % | |||||||||||||||||||
Non-owner occupied residential | 772 | 8 | % | 955 | 7 | % | 1,143 | 7 | % | 1,285 | 7 | % | 1,909 | 8 | % | |||||||||||||||||||
Acquisition and development: | ||||||||||||||||||||||||||||||||||
1-4 family residential construction | 169 | 1 | % | 102 | 1 | % | 236 | 1 | % | 222 | 1 | % | 196 | 0 | % | |||||||||||||||||||
Commercial and land development | 248 | 2 | % | 478 | 3 | % | 614 | 5 | % | 475 | 3 | % | 474 | 3 | % | |||||||||||||||||||
Commercial and industrial | 1,446 | 12 | % | 1,074 | 10 | % | 1,012 | 10 | % | 806 | 7 | % | 864 | 5 | % | |||||||||||||||||||
Municipal | 84 | 4 | % | 54 | 6 | % | 58 | 7 | % | 183 | 9 | % | 244 | 9 | % | |||||||||||||||||||
Residential mortgage: | ||||||||||||||||||||||||||||||||||
First lien | 1,855 | 16 | % | 1,624 | 16 | % | 1,667 | 16 | % | 1,295 | 18 | % | 1,682 | 19 | % | |||||||||||||||||||
Home equity - term | 119 | 1 | % | 151 | 1 | % | 184 | 2 | % | 206 | 3 | % | 465 | 3 | % | |||||||||||||||||||
Home equity - lines of credit | 1,426 | 13 | % | 1,204 | 14 | % | 1,019 | 14 | % | 761 | 13 | % | 1,633 | 12 | % | |||||||||||||||||||
Installment and other loans | 211 | 2 | % | 144 | 1 | % | 121 | 1 | % | 119 | 1 | % | 124 | 1 | % | |||||||||||||||||||
Unallocated | 475 | 414 | 774 | 1,218 | 2,068 | |||||||||||||||||||||||||||||
$ | 12,796 | 100 | % | $ | 12,775 | 100 | % | $ | 13,568 | 100 | % | $ | 14,747 | 100 | % | $ | 20,965 | 100 | % | |||||||||||||||
41
The following table summarizes the ending loan balance individually or collectively evaluated for impairment by loan class and the ALL allocation for each at December 31.
Commercial | Consumer | ||||||||||||||||||||||||||||||||||||||
(Dollars in thousands) | Commercial Real Estate | Acquisition and Development | Commercial and Industrial | Municipal | Total | Residential Mortgage | Installment and Other | Total | Unallocated | Total | |||||||||||||||||||||||||||||
December 31, 2017 | |||||||||||||||||||||||||||||||||||||||
Loans allocated by: | |||||||||||||||||||||||||||||||||||||||
Individually evaluated for impairment | $ | 5,848 | $ | 492 | $ | 350 | $ | 0 | $ | 6,690 | $ | 4,325 | $ | 11 | $ | 4,336 | $ | 0 | $ | 11,026 | |||||||||||||||||||
Collectively evaluated for impairment | 487,068 | 30,489 | 115,313 | 42,065 | 674,935 | 302,160 | 21,891 | 324,051 | 0 | 998,986 | |||||||||||||||||||||||||||||
$ | 492,916 | $ | 30,981 | $ | 115,663 | $ | 42,065 | $ | 681,625 | $ | 306,485 | $ | 21,902 | $ | 328,387 | $ | 0 | $ | 1,010,012 | ||||||||||||||||||||
Allowance for loan losses allocated by: | |||||||||||||||||||||||||||||||||||||||
Individually evaluated for impairment | $ | 0 | $ | 0 | $ | 0 | $ | 0 | $ | 0 | $ | 42 | $ | 9 | $ | 51 | $ | 0 | $ | 51 | |||||||||||||||||||
Collectively evaluated for impairment | 6,763 | 417 | 1,446 | 84 | 8,710 | 3,358 | 202 | 3,560 | 475 | 12,745 | |||||||||||||||||||||||||||||
$ | 6,763 | $ | 417 | $ | 1,446 | $ | 84 | $ | 8,710 | $ | 3,400 | $ | 211 | $ | 3,611 | $ | 475 | $ | 12,796 | ||||||||||||||||||||
December 31, 2016 | |||||||||||||||||||||||||||||||||||||||
Loans allocated by: | |||||||||||||||||||||||||||||||||||||||
Individually evaluated for impairment | $ | 2,457 | $ | 1 | $ | 594 | $ | 0 | $ | 3,052 | $ | 4,915 | $ | 6 | $ | 4,921 | $ | 0 | $ | 7,973 | |||||||||||||||||||
Collectively evaluated for impairment | 426,410 | 30,747 | 87,871 | 53,741 | 598,769 | 269,537 | 7,112 | 276,649 | 0 | 875,418 | |||||||||||||||||||||||||||||
$ | 428,867 | $ | 30,748 | $ | 88,465 | $ | 53,741 | $ | 601,821 | $ | 274,452 | $ | 7,118 | $ | 281,570 | $ | 0 | $ | 883,391 | ||||||||||||||||||||
Allowance for loan losses allocated by: | |||||||||||||||||||||||||||||||||||||||
Individually evaluated for impairment | $ | 0 | $ | 0 | $ | 0 | $ | 0 | $ | 0 | $ | 43 | $ | 0 | $ | 43 | $ | 0 | $ | 43 | |||||||||||||||||||
Collectively evaluated for impairment | 7,530 | 580 | 1,074 | 54 | 9,238 | 2,936 | 144 | 3,080 | 414 | 12,732 | |||||||||||||||||||||||||||||
$ | 7,530 | $ | 580 | $ | 1,074 | $ | 54 | $ | 9,238 | $ | 2,979 | $ | 144 | $ | 3,123 | $ | 414 | $ | 12,775 | ||||||||||||||||||||
In addition to the reserve allocations on impaired loans noted above, 19 loans, with outstanding principal balances of $6,342,000, have had cumulative partial charge-offs to the ALL totaling $2,215,000. As updated appraisals were received on collateral-dependent loans, partial charge-offs were taken to the extent the loans’ principal balance exceeded their fair value.
Management believes the allocation of the ALL between the various loan classes adequately reflects the probable incurred credit losses in each portfolio and is based on the methodology outlined in Note 4, Loans and Allowance for Loan Losses, to the Consolidated Financial Statements under Part II, Item 8, "Financial Statements and Supplementary Data." Management re-evaluates and makes certain enhancements to its methodology used to establish a reserve to better reflect the risks inherent in the different segments of the portfolio, particularly in light of increased charge-offs, with noticeable differences between the different loan classes. Management believes these enhancements to the ALL methodology improve the accuracy of quantifying probable incurred credit losses inherent in the portfolio. Management charges actual loan losses to the reserve and bases the provision for loan losses on its overall analysis.
The largest component of the ALL for the years presented has been allocated to the commercial real estate segment, particularly the non-owner occupied loan classes. The higher allocations in these classes as compared with the other classes is consistent with the inherent risk associated with these loans, as well as generally higher levels of impaired and criticized loans for the periods presented. There has generally been a decrease in the ALL allocated to the commercial real estate portfolio, as the level of classified assets has declined, and historical loss rates have improved as a result of improving economic and market conditions.
The unallocated portion of the ALL reflects estimated inherent losses within the portfolio that have not been detected, as well as the risk of error in the specific and general reserve allocation, other potential exposure in the loan portfolio, variances in management’s assessment of national and local economic conditions and other factors management believes appropriate at the time. The unallocated portion of the allowance increased from $414,000 at December 31, 2016 to $475,000 at December 31, 2017 and represents 3.7% of the ALL at December 31, 2017, compared with 3.2% at December 31, 2016. The Company monitors the unallocated portion of the ALL, and by policy, has determined it should not exceed 6% of the total reserve. Future negative provisions for loan losses may result if the unallocated portion was to increase, and management determined the
42
reserves were not required for the anticipated risk in the portfolio. As asset quality has improved the last several years, management has determined a reduced risk of loss associated with the portfolio, as evidenced by lower classified loans and sustainable improvements in delinquencies.
Management believes the Company’s ALL is adequate based on information currently available. Future adjustments to the ALL and enhancements to the methodology may be necessary due to changes in economic conditions, regulatory guidance, or management’s assumptions as to future delinquencies or loss rates.
Deposits
The following table presents average deposits for years ended December 31.
(Dollars in thousands) | 2017 | 2016 | 2015 | ||||||||
Demand deposits | $ | 161,917 | $ | 147,473 | $ | 134,040 | |||||
Interest-bearing demand deposits | 648,174 | 565,524 | 500,474 | ||||||||
Savings deposits | 94,815 | 90,272 | 85,068 | ||||||||
Time deposits | 292,616 | 289,574 | 263,414 | ||||||||
Total deposits | $ | 1,197,522 | $ | 1,092,843 | $ | 982,996 | |||||
Average total deposits increased $104,679,000, or 9.6% from 2016 to 2017. Interest-bearing demand deposit account balances were the principal driver, increasing $82,650,000, or 14.6%. The Company has been able to gather both interest-bearing and noninterest-bearing deposit relationships from enhanced cash management offerings as we developed commercial relationships. We also grew core funding deposits through marketing campaigns and improvement in our product delivery with investments in technology and increased sales efforts. We have also been able to increase interest-free funds as we expanded our commercial and industrial loan portfolio.
In 2017, the Company used deposit growth principally to fund loan growth. Average retail time deposits less than $100,000 remained relatively steady at approximately $83,000,000 from 2016 to 2017 and average institutional time deposits in excess of $100,000 decreased from $80,462,000 for 2016 to $60,450,000 for 2017. The Company chose to continue not to pay increased interest rates on these deposit types, but rather use alternate funding sources to meet funding needs. One funding source the Company used was brokered deposits, which totaled $96,368,000 at December 31, 2017 compared with $85,994,000 at December 31, 2016, and averaged $94,165,000 for 2017 compared with $72,282,000 for 2016. Given interest rate conditions and asset/liability strategies, we issued issued additional brokered time deposits, which have options that enable the Company to pay them off early.
Management evaluates its utilization of brokered deposits, taking into consideration the interest rate curve and regulatory views on non-core funding sources, and balances this funding source with its funding needs based on growth initiatives. The Company anticipates that as loan growth increases, it will be able to generate core deposit funding by offering competitive rates.
The following table presents maturities of time deposits of $250,000 or more at December 31, 2017.
(Dollars in thousands) | Total | ||
Three months or less | $ | 8,066 | |
Over three months through six months | 3,255 | ||
Over six months through one year | 5,260 | ||
Over one year | 5,307 | ||
Total | $ | 21,888 | |
43
Borrowings
In addition to deposit products, the Company uses short-term borrowing sources to meet liquidity needs and for temporary funding. Sources of short-term borrowings include the FHLB of Pittsburgh, federal funds purchased, and to a lesser extent, the FRB discount window. Short-term borrowings also include securities sold under agreements to repurchase with deposit customers, in which a customer sweeps a portion of a deposit balance into a Repurchase Agreement, which is a secured borrowing with a pool of securities pledged against the balance.
The Company also utilizes long-term debt, consisting principally of FHLB fixed and amortizing advances to fund its balance sheet with original maturities greater than one year. The Company continues to evaluate its funding needs, interest rate movements, the cost of options, and the availability of attractive structures in its evaluation as to the timing and extent of when it enters into long-term borrowings.
For additional information about borrowings, refer to Note 11, Short-Term Borrowings, and Note 12, Long-Term Debt to the Consolidated Financial Statements appearing in Part II, Item 8, "Financial Statements and Supplementary Data."
Shareholders' Equity
Total shareholders’ equity increased $9,906,000, or 7.3%, during 2017. Increases in equity included net income of $8,090,000, $1,523,000 from the issuance of common stock related to share-based compensation and an increase in the fair value of available for sale securities, net of taxes, of $3,781,000. Dividends paid to shareholders decreased equity by$3,488,000.
In February 2018, the FASB issued changes related to the accounting for the effects of the Tax Act on items in AOCI. The impact of tax rate changes is recorded in income and items accounted for in AOCI could be left with a 'stranded' tax effect that could have those items appear to not reflect the appropriate tax rate. The FASB's changes allow a reclassification from AOCI to retained earnings for stranded tax effects from the Tax Act to improve the usefulness of information reported to financial statement users. The changes are effective for years beginning after December 31, 2018, with early adoption permitted. We elected to adopt the changes in December 2017. The amount transferred from AOCI to retained earnings totaled $229,000 and represented the impact of the Tax Law rate change to 21% at the date of enactment for unrealized gains and losses accounted for in AOCI.
On January 19, 2016, the Company filed a shelf registration statement on Form S-3 with the SEC, covering up to an aggregate of $100,000,000 of securities, through the sale of common stock, preferred stock, warrants, debt securities, and units. To date, the Company has not issued any securities under this shelf registration statement.
On September 14, 2015, the Board of Directors of the Company authorized a stock repurchase program which is more fully described in Item 5 under Issuer Purchases of Equity Securities. The maximum number of shares that may yet be purchased under the plan is 333,275 shares at December 31, 2017.
The following table includes additional information for shareholders’ equity for the years ended December 31.
(Dollars in thousands) | 2017 | 2016 | 2015 | ||||||||
Average shareholders’ equity | $ | 141,301 | $ | 137,973 | $ | 131,453 | |||||
Net income | 8,090 | 6,628 | 7,874 | ||||||||
Cash dividends paid | 3,488 | 2,898 | 1,822 | ||||||||
Equity to asset ratio | 9.29 | % | 9.53 | % | 10.29 | % | |||||
Dividend payout ratio | 42.00 | % | 42.68 | % | 22.68 | % | |||||
Return on average equity | 5.73 | % | 4.80 | % | 5.99 | % | |||||
44
Capital Adequacy and Regulatory Matters
Capital management in a regulated financial services industry must properly balance return on equity to its shareholders while maintaining sufficient levels of capital and related risk-based regulatory capital ratios to satisfy statutory regulatory requirements. The Company’s capital management strategies have been developed to provide attractive rates of returns to its shareholders, while maintaining a “well capitalized” position of regulatory strength.
Under requirements of the Dodd-Frank Act and Basel III Capital Rules as described in Item 1 - Business, the Company and the Bank have been subject to increasingly stringent regulatory capital requirements. Significant provisions of the Basel III Capital Rules that have impacted the Company's and the Bank's capital calculations include:
• | Restricting the amount of deferred tax assets that can be included in CET1 capital with assets relating to net operating loss and credit carry forwards being excluded, and a 10% - 15% limitation on deferred tax assets arising from temporary differences that cannot be realized through net operating loss carry backs. At December 31, 2017 and 2016, $2,151,000 and $7,976,000 of the Company's deferred tax asset related to operating loss and tax credit carryforwards was deducted from our calculation of CET1; |
• | Applying a 150% risk weight for certain high volatility commercial real estate acquisition, development and construction loans; |
• | Assigning a 150% risk weight to exposures (other than residential mortgage exposures) that are 90 days past due or in nonaccrual status; |
• | Providing for a 20% credit conversion factor for the unused portion of a commitment with an original maturity of one year or less that is not unconditionally cancellable; and |
• | The allowance for credit losses, including the ALL and reserve for off-balance sheet credit commitments, is included as Tier 2 capital to the extent it does not exceed 1.25% of risk weighted assets. The amount that exceeds 1.25% of risk weighted assets, is disallowed as Tier 2 capital, but also reduces the Company’s risk weighted assets. At December 31, 2017 and 2016, $0 and $1,559,000 of the allowance for credit losses was excluded from our calculation of Tier 2 capital. The lower disallowed amount in 2017 was the result of the higher balance of risk-weighted assets. |
Management believes the Company and the Bank met all capital adequacy requirements to which they are subject at December 31, 2017 and December 31, 2016. At December 31, 2017, the Bank was considered well capitalized under applicable banking regulations. Under capital adequacy guidelines and the regulatory framework for prompt corrective action, the Company and the Bank must meet specific guidelines that involve quantitative measures of assets, liabilities and certain off-balance sheet items as calculated under regulatory accounting practices. Although applicable to the Bank, prompt corrective action provisions are not applicable to bank holding companies, including financial holding companies.
Tables presenting the Company’s and the Bank’s capital amounts and ratios at December 31, 2017 and 2016 are included in Note 13, Shareholders' Equity and Regulatory Capital, to the Consolidated Financial Statements appearing in Part II, Item 8, "Financial Statements and Supplementary Data."
The Company and Bank's capital ratios at December 31, 2017 have declined since December 31, 2016, despite an increase in consolidated capital, due primarily to consolidated risk-weighted assets increasing from $955,253,000 at December 31, 2016 to $1,146,378,000 at December 31, 2017 for the Company and from $954,533,000 at December 31, 2016 to $1,143,207,000 at December 31, 2017 for the Bank. The increase in risk-weighted assets is principally due to the growth experienced in the loan portfolio.
The Company routinely evaluates its capital levels in light of its risk profile to assess its capital needs. In addition to the minimum capital ratio requirement and minimum capital ratio to be well capitalized presented in the tables in Note 13, the Company and the Bank must maintain a capital conservation buffer as noted in Item 1 - Business under the topic Basel III Capital Rules. At December 31, 2017, the Company's and the Bank's capital conservation buffer, based on the most restrictive capital ratio, was 5.3% and 5.0%, which is above the phase in requirement of 1.25% at December 31, 2017.
Liquidity and Rate Sensitivity
Liquidity. The primary function of asset/liability management is to ensure adequate liquidity and manage the Company’s sensitivity to changing interest rates. Liquidity management involves the ability to meet the cash flow requirements of customers who may be either depositors wanting to withdraw funds or borrowers needing assurance that sufficient funds will be available to meet their credit needs. Our primary sources of funds consist of deposit inflows, loan repayments, maturities and
45
sales of investment securities, the sale of mortgage loans and borrowings from the FHLB of Pittsburgh. While maturities and scheduled amortization of loans and securities are predictable sources of funds, deposit flows and mortgage prepayments are greatly influenced by general interest rates, economic conditions and competition.
We regularly adjust our investments in liquid assets based upon our assessment of expected loan demand, expected deposit flows, yields available on interest-earning deposits and securities and the objectives of our asset/liability management policy.
At December 31, 2017, we had $352,960,000 in loan commitments outstanding, which included $56,012,000 in undisbursed loans, $139,281,000 in unused home equity lines of credit, $145,394,000 in commercial lines of credit, and $12,273,000 in standby letters of credit. Time deposits due within one year of December 31, 2017 totaled $107,765,000, or 39% of time deposits. The large percentage of time deposits that mature within one year reflects customers’ preference not to invest funds for long periods in the current interest rate environment. If these maturing deposits do not remain with us, we will be required to seek other sources of funds, including other time deposits and lines of credit. Depending on market conditions, we may be required to pay higher rates on such deposits or other borrowings than we currently pay on time deposits outstanding at December 31, 2017. We believe, however, based on past experience that a significant portion of our time deposits will remain with us. We have the ability to attract and retain deposits by adjusting the interest rates we offer.
Our most liquid assets are cash and cash equivalents. The levels of these assets depend on our operating, financing, lending and investing activities during any given period. At December 31, 2017, cash and cash equivalents totaled $29,807,000, which approximated the total of $30,273,000 at December 31, 2016. Securities classified as available for sale, net of pledging requirements, which provide additional sources of liquidity, totaled $95,401,000 at December 31, 2017. In addition, at December 31, 2017, we had the ability to borrow a total of approximately $517,257,000 from the FHLB of Pittsburgh, of which we had $135,365,000 in advances and letters of credit outstanding. The Company’s ability to borrow from the FHLB is dependent on having sufficient qualifying collateral, generally consisting of mortgage loans. In addition, the Company has up to $35,000,000 in available unsecured lines of credit with other banks.
The Company is a separate legal entity from the Bank and must provide for its own liquidity. In addition to its operating expenses, the Company is responsible for paying any dividends declared to its shareholders. The Company also has repurchased shares of its common stock. The Company’s primary source of income is dividends received from the Bank. Restrictions on the Bank’s ability to dividend funds to the Company are included in Note 14, Restrictions on Dividends, Loans and Advances, to the Consolidated Financial Statements under Part II, Item 8, "Financial Statements and Supplementary Data."
Interest Rate Sensitivity. Interest rate sensitivity management requires the maintenance of an appropriate balance between interest sensitive assets and liabilities. Management, through its asset/liability management process, attempts to manage the level of repricing and maturity mismatch so that fluctuations in net interest income are maintained within policy limits in current and expected market conditions. For further discussion, see Part II, Item 7A, "Quantitative and Qualitative Disclosures About Market Risk."
Contractual Obligations
The Company enters into contractual obligations in the normal course of business to fund loan growth, for asset/liability management purposes, to meet required capital needs and for other corporate purposes. The following table presents significant fixed and determinable contractual obligations of principal by payment date at December 31, 2017. Further discussion of the nature of each obligation is included in the referenced Note to the Consolidated Financial Statements under Part II, Item 8, "Financial Statements and Supplementary Data" referenced in the following table.
Payments Due | |||||||||||||||||||||
(Dollars in thousands) | Note Reference | Less than 1 year | 2-3 years | 4-5 years | More than 5 years | Total | |||||||||||||||
Time deposits | 10 | $ | 107,765 | $ | 159,177 | $ | 6,269 | $ | 877 | $ | 274,088 | ||||||||||
Short-term borrowings | 11 | 93,576 | 0 | 0 | 0 | 93,576 | |||||||||||||||
Long-term debt | 12 | 365 | 81,133 | 862 | 1,455 | 83,815 | |||||||||||||||
Operating lease obligations | 6 | 574 | 1,024 | 564 | 474 | 2,636 | |||||||||||||||
Total | $ | 202,280 | $ | 241,334 | $ | 7,695 | $ | 2,806 | $ | 454,115 | |||||||||||
46
The contractual obligations table above does not include off-balance sheet commitments to extend credit that are detailed in the following section. These commitments generally have fixed expiration dates and many will expire without being drawn upon, therefore the total commitment does not necessarily represent future cash requirements and is excluded from the contractual obligations table.
Off-Balance Sheet Arrangements
The Company is party to financial instruments with off-balance sheet risk in the normal course of business to meet the financing needs of its customers. These financial instruments include commitments to extend credit and standby letters of credit.
The following table details significant commitments at December 31, 2017.
(Dollars in thousands) | Contract or Notional Amount | ||
Commitments to fund: | |||
Revolving, open-ended home equity loans | $ | 139,281 | |
1-4 family residential construction loans | 11,420 | ||
Commercial real estate, construction and land development loans | 44,592 | ||
Commercial, industrial and other loans | 145,394 | ||
Standby letters of credit | 12,273 | ||
A discussion of the nature, business purpose, and guarantees that result from the Company’s off-balance sheet arrangements is included in Note 16, Financial Instruments with Off-Balance Sheet Risk, to the Consolidated Financial Statements under Part II, Item 8, "Financial Statements and Supplementary Data."
Recently Adopted and Recently Issued Accounting Standards
Recently adopted and recently issued accounting standards are included in Note 1, Summary of Significant Accounting Policies, to the Consolidated Financial Statements under Part II, Item 8, "Financial Statements and Supplementary Data."
Caution About Forward-Looking Statements
This report contains statements that are considered “forward-looking statements” as defined in the Private Securities Litigation Reform Act of 1995. In addition, the Company may make other written and oral communications, from time to time, that contain such statements. Forward-looking statements, including statements that include projections, predictions, expectations or beliefs as to industry trends, future expectations and other matters that do not relate strictly to historical facts, are based on certain assumptions by management, and are often identified by words or phrases such as "may," "anticipate," "believe," "expect," "estimate," "intend," "seek," "plan," "objective," "trend," "goal." and other similar terms. Forward-looking statements are subject to various assumptions, risks, and uncertainties, which change over time, and speak only at the date they are made.
In addition to factors mentioned elsewhere in this Annual Report on Form 10-K or previously disclosed in our SEC reports (accessible on the SEC’s website at www.sec.gov or on our website at www.orrstown.com), the following factors, among others, could cause actual results to differ materially from forward-looking statements and future results could differ materially from historical performance:
• | If our ALL is not sufficient to cover actual losses, our earnings would decrease. |
• | Commercial real estate lending may expose us to a greater risk of loss and impact our earnings and profitability. |
• | Commercial and industrial loans comprise 10% of our loan portfolio. The credit risk related to these types of loans is greater than the risk related to residential loans. |
• | Changes in interest rates could adversely impact the Company’s financial condition and results of operations. |
• | Difficult economic and market conditions have adversely affected the financial services industry and may continue to materially and adversely affect the Company. |
• | Because our business is concentrated in south central Pennsylvania and Washington County, Maryland, our financial performance could be materially adversely affected by economic conditions and real estate values in these market areas. |
47
• | Competition from other banks and financial institutions in originating loans, attracting deposits and providing other financial services may adversely affect our profitability and liquidity. |
• | The Company’s business strategy includes the continuation of moderate growth plans, and our financial condition and results of operations could be negatively affected if we fail to grow or fail to manage our growth effectively. |
• | The Company may be adversely affected by technological advances. |
• | The Company may not be able to attract and retain skilled people. |
• | An interruption or breach in security with respect to our information systems, or our outsourced service providers, could adversely impact the Company’s reputation and have an adverse impact on our financial condition or results of operations. |
• | We could be adversely affected by failure in our internal controls. |
• | Negative public opinion could damage our reputation and adversely affect our earnings. |
• | Governmental regulation and regulatory actions against us may impair our operations or restrict our growth. |
• | The Dodd-Frank Act may affect the Company’s financial condition, results of operations, liquidity and stock price. |
• | Increases in FDIC insurance premiums may have a material adverse effect on our results of operations. |
• | Legislative, regulatory and legal developments involving income and other taxes could materially adversely affect the Company’s results of operations and cash flows. |
• | The Company is required to use judgment in applying accounting policies and different estimates and assumptions in the application of these policies could result in a decrease in capital and/or other material changes to the reports of financial condition and results of operations. |
• | Changes in accounting standards could impact the Company's financial condition and results of operations. |
• | The short-term and long-term impact of the changing regulatory capital requirements and new capital rules is uncertain. |
• | Pending litigation and legal proceedings and the impact of any finding of liability or damages could adversely impact the Company and its financial condition and results of operations. |
• | Indemnification costs associated with litigation and legal proceedings could adversely impact the Company and its financial condition and results of operations. |
• | The Parent Company is a holding company dependent for liquidity on payments from its bank subsidiary, which is subject to restrictions. |
• | The soundness of other financial institutions could adversely affect the Company. |
• | If the Company wants to, or is compelled to, raise additional capital in the future, that capital may not be available when it is needed and on terms favorable to current shareholders. |
• | The market price of our common stock has been subject to volatility. |
• | The Parent Company's primary source of income is dividends received from its bank subsidiary. |
• | Other risks and uncertainties. |
ITEM 7A – QUANTITATIVE AND QUALITATIVE DISCLOSURES ABOUT MARKET RISK
Market risk comprises exposure to interest rate risk, foreign currency exchange rate risk, commodity price risk, and other relevant market rate or price risks. For domestic banks, including the Company, the majority of market risk is related to interest rate risk. Interest rate sensitivity management requires the maintenance of an appropriate balance between reward, in the form of net interest margin, and risk as measured by the amount of earnings and value at risk.
Interest Rate Risk
Interest rate risk is the exposure to fluctuations in the Company’s future earnings (earnings at risk) and value (value at risk) resulting from changes in interest rates. This exposure results from differences between the amounts of interest-earning assets and interest-bearing liabilities that reprice within a specified time period as a result of scheduled maturities, scheduled and unscheduled repayments, the propensity of borrowers and depositors to react to changes in their economic interests, and security and contractual interest rate changes.
Management attempts to manage the level of repricing and maturity mismatch through its asset/liability management process so that fluctuations in net interest income are maintained within policy limits across a range of market conditions while satisfying liquidity and capital requirements. Management recognizes that a certain amount of interest rate risk is inherent,
48
appropriate and necessary to ensure the Company’s profitability. Thus, the goal of interest rate risk management is to evaluate the amount of reward for taking risk and adjusting both the size and composition of the balance sheet relative to the level of reward available for taking risk.
Management endeavors to control the exposure to changes in interest rates by understanding, reviewing and making decisions based on its risk position. The Company primarily uses its securities portfolio, FHLB advances and brokered deposits to manage its interest rate risk position. Additionally, pricing, promotion and product development activities are directed in an effort to emphasize the loan and deposit term or repricing characteristics that best meet current interest rate risk objectives. At present, we do not use hedging instruments for risk management, but we do evaluate them and may use them in the future.
The asset/liability committee operates under management policies, approved by the Board of Directors, which define guidelines and limits on the level of risk.
The Company uses simulation analysis to assess earnings at risk and net present value analysis to assess value at risk. These methods allow management to regularly monitor both the direction and magnitude of the Company’s interest rate risk exposure. These modeling techniques involve assumptions and estimates that inherently cannot be measured with complete precision. Key assumptions in the analyses include maturity and repricing characteristics of assets and liabilities, prepayments on amortizing assets, non-maturity deposit sensitivity, and loan and deposit pricing. These assumptions are inherently uncertain due to the timing, magnitude and frequency of rate changes and changes in market conditions and management strategies, among other factors. However, the analyses are useful in quantifying risk and providing a relative gauge of the Company’s interest rate risk position over time.
Earnings at Risk
Simulation analysis evaluates the effect of upward and downward changes in market interest rates on future net interest income. The analysis involves changing the interest rates used in determining net interest income over the next twelve months. The resulting percentage change in net interest income in various rate scenarios is an indication of the Company’s short-term interest rate risk. The analysis assumes recent trends in new loan and deposit volumes will continue while the amount of investment securities remains constant. Additional assumptions are applied to modify volumes and pricing under the various rate scenarios. These include prepayment assumptions on mortgage assets, sensitivity of non-maturity deposit rates, and other factors deemed significant.
The simulation analysis results are presented in the Earnings at Risk table below. At December 31, 2017, these results indicate the Company would expect net interest income to decrease over the next twelve months by 6.5%, assuming a downward shock in market interest rates of 1.00%, and to decrease by 4.9% assuming an upward shock of 2.00%. A decrease in interest rates of 1.00% would create an environment in which deposit rates could not practically decline further.
The simulation analysis results at December 31, 2016 exhibited slightly greater sensitivity to both rising interest rates and a declining rate environment.
Value at Risk
Net present value analysis provides information on the risk inherent in the balance sheet that might not be taken into account in the simulation analysis due to the short time horizon used in that analysis. The net present value of the balance sheet is defined as the discounted present value of expected asset cash flows minus the discounted present value of the expected liability cash flows. The analysis involves changing the interest rates used in determining the expected cash flows and in discounting the cash flows. The resulting percentage change in net present value in various rate scenarios is an indication of the longer term repricing risk and options embedded in the balance sheet.
The net present value analysis results are presented in the Value at Risk table below. At December 31, 2017, these results indicate that the net present value would decrease 7.2% assuming a downward shock in market interest rates of 1.00% and decrease 5.4% assuming an upward shock of 2.00%.
49
Earnings at Risk | Value at Risk | |||||||||||||||
% Change in Net Interest Income | % Change in Market Value | |||||||||||||||
Change in Market Interest Rates | December 31, 2017 | December 31, 2016 | Change in Market Interest Rates | December 31, 2017 | December 31, 2016 | |||||||||||
(100 | ) | (6.5 | %) | (3.3 | %) | (100 | ) | (7.2 | %) | (1.0 | %) | |||||
100 | (1.3 | %) | (1.5 | %) | 100 | (1.8 | %) | (1.5 | %) | |||||||
200 | (4.9 | %) | (2.5 | %) | 200 | (5.4 | %) | (2.9 | %) | |||||||
Further discussion related to the quantitative and qualitative disclosures about market risk is included under the heading of Liquidity and Rate Sensitivity in Item 7 of Management's Discussion and Analysis of Financial Condition and Results of Operations.
50
ITEM 8 – FINANCIAL STATEMENTS AND SUPPLEMENTARY DATA
SUMMARY OF QUARTERLY FINANCIAL DATA
The unaudited quarterly results of operations for the years ended December 31, are as follows:
2017 Quarter Ended | 2016 Quarter Ended | ||||||||||||||||||||||||||||||
(Dollars in thousands, except per share information) | December | September | June | March | December | September | June | March | |||||||||||||||||||||||
Interest and dividend income | $ | 13,619 | $ | 13,098 | $ | 12,468 | $ | 11,830 | $ | 11,075 | $ | 10,654 | $ | 10,272 | $ | 9,961 | |||||||||||||||
Interest expense | 2,284 | 2,017 | 1,750 | 1,593 | 1,365 | 1,420 | 1,321 | 1,311 | |||||||||||||||||||||||
Net interest income | 11,335 | 11,081 | 10,718 | 10,237 | 9,710 | 9,234 | 8,951 | 8,650 | |||||||||||||||||||||||
Provision for loan losses | 800 | 100 | 100 | 0 | 0 | 250 | 0 | 0 | |||||||||||||||||||||||
Net interest income after provision for loan losses | 10,535 | 10,981 | 10,618 | 10,237 | 9,710 | 8,984 | 8,951 | 8,650 | |||||||||||||||||||||||
Investment securities gains | 0 | 533 | 654 | 3 | 0 | 0 | 0 | 1,420 | |||||||||||||||||||||||
Noninterest income | 5,173 | 4,723 | 4,969 | 4,332 | 4,969 | 4,568 | 4,537 | 4,245 | |||||||||||||||||||||||
Noninterest expenses | 12,680 | 13,087 | 12,417 | 12,146 | 12,476 | 11,985 | 12,558 | 11,121 | |||||||||||||||||||||||
Income before income tax expense | 3,028 | 3,150 | 3,824 | 2,426 | 2,203 | 1,567 | 930 | 3,194 | |||||||||||||||||||||||
Income tax expense | 3,022 | 376 | 516 | 424 | 275 | 125 | 252 | 614 | |||||||||||||||||||||||
Net income | $ | 6 | $ | 2,774 | $ | 3,308 | $ | 2,002 | $ | 1,928 | $ | 1,442 | $ | 678 | $ | 2,580 | |||||||||||||||
Per share information: | |||||||||||||||||||||||||||||||
Basic earnings per share | $ | 0.00 | $ | 0.34 | $ | 0.41 | $ | 0.25 | $ | 0.24 | $ | 0.18 | $ | 0.08 | $ | 0.32 | |||||||||||||||
Diluted earnings per share (a) | 0.00 | 0.34 | 0.40 | 0.24 | 0.24 | 0.18 | 0.08 | 0.32 | |||||||||||||||||||||||
Dividends per share | 0.12 | 0.10 | 0.10 | 0.10 | 0.09 | 0.09 | 0.09 | 0.08 | |||||||||||||||||||||||
(a) Sum of the quarters may not equal the total year due to rounding. | |||||||||||||||||||||||||||||||
51
Index to Financial Statements and Supplementary Data
Page | |
52
Management’s Report on Internal Control Over Financial Reporting
The management of Orrstown Financial Services, Inc., together with its consolidated subsidiaries (the "Company"), has the responsibility for establishing and maintaining an adequate internal control structure and procedures for financial reporting. Management maintains a comprehensive system of internal control to provide reasonable assurance of the proper authorization of transactions, the safeguarding of assets and the reliability of the financial records. The system of internal control provides for appropriate division of responsibility and is documented by written policies and procedures that are communicated to employees. The Company maintains an internal auditing program, under the supervision of the Audit Committee of the Board of Directors, which independently assesses the effectiveness of the system of internal control and recommends possible improvements.
Under the supervision and with the participation of the Company’s management, including its Chief Executive Officer and Chief Financial Officer, the Company has evaluated the effectiveness of its internal control over financial reporting at December 31, 2017, using the Internal Control – Integrated Framework (2013) issued by the Committee of Sponsoring Organizations of the Treadway Commission. Based upon this evaluation, management has concluded that, at December 31, 2017, the Company’s internal control over financial reporting is effective based on the criteria established in Internal Control-Integrated Framework (2013).
Crowe Horwath LLP has audited the effectiveness of the Company’s internal control over financial reporting as of December 31, 2017, as stated in their report dated March 9, 2018.
/s/ Thomas R. Quinn, Jr. | /s/ David P. Boyle | |
Thomas R. Quinn, Jr. | David P. Boyle | |
President and Chief Executive Officer | Executive Vice President and Chief Financial Officer | |
March 9, 2018 | ||
53
 | |
Crowe Horwath LLP Independent Member Crowe Horwath International | |
Report of Independent Registered Public Accounting Firm
Shareholders and the Board of Directors of Orrstown Financial Services, Inc.
Shippensburg, Pennsylvania
Opinions on the Financial Statements and Internal Control over Financial Reporting
We have audited the accompanying consolidated balance sheets of Orrstown Financial Services, Inc. (the "Company") as of December 31, 2017 and 2016, the related consolidated statements of income, comprehensive income, changes in shareholders’ equity, and cash flows for each of the years in the three-year period ended December 31, 2017, and the related notes (collectively referred to as the "financial statements"). We also have audited the Company’s internal control over financial reporting as of December 31, 2017, based on criteria established in Internal Control - Integrated Framework: (2013) issued by the Committee of Sponsoring Organizations of the Treadway Commission (COSO).
In our opinion, the financial statements referred to above present fairly, in all material respects, the financial position of the Company as of December 31, 2017 and 2016, and the results of its operations and its cash flows for each of the years in the three-year period ended December 31, 2017 in conformity with accounting principles generally accepted in the United States of America. Also in our opinion, the Company maintained, in all material respects, effective internal control over financial reporting as of December 31, 2017, based on criteria established in Internal Control - Integrated Framework: (2013) issued by COSO.
Basis for Opinions
The Company’s management is responsible for these financial statements, for maintaining effective internal control over financial reporting, and for its assessment of the effectiveness of internal control over financial reporting, included in the accompanying Management’s Report on Internal Control Over Financial Reporting. Our responsibility is to express an opinion on the Company’s financial statements and an opinion on the Company’s internal control over financial reporting based on our audits. We are a public accounting firm registered with the Public Company Accounting Oversight Board (United States) ("PCAOB") and are required to be independent with respect to the Company in accordance with the U.S. federal securities laws and the applicable rules and regulations of the Securities and Exchange Commission and the PCAOB.
We conducted our audits in accordance with the standards of the PCAOB. Those standards require that we plan and perform the audits to obtain reasonable assurance about whether the financial statements are free of material misstatement, whether due to error or fraud, and whether effective internal control over financial reporting was maintained in all material respects.
Our audits of the financial statements included performing procedures to assess the risks of material misstatement of the financial statements, whether due to error or fraud, and performing procedures that respond to those risks. Such procedures included examining, on a test basis, evidence regarding the amounts and disclosures in the financial statements. Our audits also included evaluating the accounting principles used and significant estimates made by management, as well as evaluating the overall presentation of the financial statements. Our audit of internal control over financial reporting included obtaining an understanding of internal control over financial reporting, assessing the risk that a material weakness exists, and testing and evaluating the design and operating effectiveness of internal control based on the assessed risk. Our audits also included performing such other procedures as we considered necessary in the circumstances. We believe that our audits provide a reasonable basis for our opinions.
54
Definition and Limitations of Internal Control Over Financial Reporting
A company’s internal control over financial reporting is a process designed to provide reasonable assurance regarding the reliability of financial reporting and the preparation of financial statements for external purposes in accordance with generally accepted accounting principles. A company’s internal control over financial reporting includes those policies and procedures that (1) pertain to the maintenance of records that, in reasonable detail, accurately and fairly reflect the transactions and dispositions of the assets of the company; (2) provide reasonable assurance that transactions are recorded as necessary to permit preparation of financial statements in accordance with generally accepted accounting principles, and that receipts and expenditures of the company are being made only in accordance with authorizations of management and directors of the company; and (3) provide reasonable assurance regarding prevention or timely detection of unauthorized acquisition, use, or disposition of the company’s assets that could have a material effect on the financial statements.
Because of its inherent limitations, internal control over financial reporting may not prevent or detect misstatements. Also, projections of any evaluation of effectiveness to future periods are subject to the risk that controls may become inadequate because of changes in conditions, or that the degree of compliance with the policies or procedures may deteriorate.
/s/ Crowe Horwath LLP
We have served as the Company's auditor since 2014.
Cleveland, Ohio
March 9, 2018
55
Consolidated Balance Sheets
ORRSTOWN FINANCIAL SERVICES, INC.
December 31, | |||||||
(Dollars in thousands, except per share data) | 2017 | 2016 | |||||
Assets | |||||||
Cash and due from banks | $ | 21,734 | $ | 16,072 | |||
Interest-bearing deposits with banks | 8,073 | 14,201 | |||||
Cash and cash equivalents | 29,807 | 30,273 | |||||
Restricted investments in bank stocks | 9,997 | 7,970 | |||||
Securities available for sale | 415,308 | 400,154 | |||||
Loans held for sale | 6,089 | 2,768 | |||||
Loans | 1,010,012 | 883,391 | |||||
Less: Allowance for loan losses | (12,796 | ) | (12,775 | ) | |||
Net loans | 997,216 | 870,616 | |||||
Premises and equipment, net | 34,809 | 34,871 | |||||
Cash surrender value of life insurance | 33,570 | 32,102 | |||||
Accrued interest receivable | 5,048 | 4,672 | |||||
Other assets | 27,005 | 31,078 | |||||
Total assets | $ | 1,558,849 | $ | 1,414,504 | |||
Liabilities | |||||||
Deposits: | |||||||
Noninterest-bearing | $ | 162,343 | $ | 150,747 | |||
Interest-bearing | 1,057,172 | 1,001,705 | |||||
Total deposits | 1,219,515 | 1,152,452 | |||||
Short-term borrowings | 93,576 | 87,864 | |||||
Long-term debt | 83,815 | 24,163 | |||||
Accrued interest and other liabilities | 17,178 | 15,166 | |||||
Total liabilities | 1,414,084 | 1,279,645 | |||||
Shareholders’ Equity | |||||||
Preferred stock, $1.25 par value per share; 500,000 shares authorized; no shares issued or outstanding | 0 | 0 | |||||
Common stock, no par value—$0.05205 stated value per share 50,000,000 shares authorized; 8,347,856 and 8,343,435 shares issued; 8,347,039 and 8,285,733 shares outstanding | 435 | 437 | |||||
Additional paid—in capital | 125,458 | 124,935 | |||||
Retained earnings | 16,042 | 11,669 | |||||
Accumulated other comprehensive income (loss) | 2,845 | (1,165 | ) | ||||
Treasury stock—common, 817 and 57,702 shares, at cost | (15 | ) | (1,017 | ) | |||
Total shareholders’ equity | 144,765 | 134,859 | |||||
Total liabilities and shareholders’ equity | $ | 1,558,849 | $ | 1,414,504 | |||
The Notes to Consolidated Financial Statements are an integral part of these statements.
56
Consolidated Statements of Income
ORRSTOWN FINANCIAL SERVICES, INC.
Years Ended December 31, | |||||||||||
(Dollars in thousands, except per share information) | 2017 | 2016 | 2015 | ||||||||
Interest and dividend income | |||||||||||
Interest and fees on loans | $ | 40,185 | $ | 33,916 | $ | 30,798 | |||||
Interest and dividends on investment securities | |||||||||||
Taxable | 7,478 | 6,012 | 6,697 | ||||||||
Tax-exempt | 3,134 | 1,826 | 1,059 | ||||||||
Short term investments | 218 | 208 | 81 | ||||||||
Total interest and dividend income | 51,015 | 41,962 | 38,635 | ||||||||
Interest expense | |||||||||||
Interest on deposits | 6,134 | 4,811 | 3,606 | ||||||||
Interest on short-term borrowings | 784 | 187 | 295 | ||||||||
Interest on long-term debt | 726 | 419 | 400 | ||||||||
Total interest expense | 7,644 | 5,417 | 4,301 | ||||||||
Net interest income | 43,371 | 36,545 | 34,334 | ||||||||
Provision for loan losses | 1,000 | 250 | (603 | ) | |||||||
Net interest income after provision for loan losses | 42,371 | 36,295 | 34,937 | ||||||||
Noninterest income | |||||||||||
Service charges on deposit accounts | 5,675 | 5,445 | 5,226 | ||||||||
Other service charges, commissions and fees | 1,008 | 994 | 1,223 | ||||||||
Trust and investment management income | 6,400 | 5,091 | 4,598 | ||||||||
Brokerage income | 1,896 | 1,933 | 2,025 | ||||||||
Mortgage banking activities | 2,919 | 3,412 | 2,747 | ||||||||
Earnings on life insurance | 1,109 | 1,099 | 1,025 | ||||||||
Other income | 190 | 345 | 410 | ||||||||
Investment securities gains | 1,190 | 1,420 | 1,924 | ||||||||
Total noninterest income | 20,387 | 19,739 | 19,178 | ||||||||
Noninterest expenses | |||||||||||
Salaries and employee benefits | 30,145 | 26,370 | 24,056 | ||||||||
Occupancy | 2,806 | 2,491 | 2,221 | ||||||||
Furniture and equipment | 3,434 | 3,335 | 3,061 | ||||||||
Data processing | 2,271 | 2,378 | 2,026 | ||||||||
Telephone and communication | 647 | 740 | 692 | ||||||||
Automated teller and interchange fees | 767 | 748 | 798 | ||||||||
Advertising and bank promotions | 1,600 | 1,717 | 1,564 | ||||||||
FDIC insurance | 606 | 775 | 859 | ||||||||
Legal fees | 802 | 850 | 1,440 | ||||||||
Other professional services | 1,571 | 1,332 | 1,262 | ||||||||
Directors' compensation | 996 | 969 | 737 | ||||||||
Collection and problem loan | 186 | 238 | 447 | ||||||||
Real estate owned | 69 | 239 | 162 | ||||||||
Taxes other than income | 866 | 767 | 916 | ||||||||
Regulatory settlement | 0 | 1,000 | 0 | ||||||||
Other operating expenses | 3,564 | 4,191 | 4,366 | ||||||||
Total noninterest expenses | 50,330 | 48,140 | 44,607 | ||||||||
Income before income tax expense | 12,428 | 7,894 | 9,508 | ||||||||
Income tax expense | 4,338 | 1,266 | 1,634 | ||||||||
Net income | $ | 8,090 | $ | 6,628 | $ | 7,874 | |||||
Per share information: | |||||||||||
Basic earnings per share | $ | 1.00 | $ | 0.82 | $ | 0.97 | |||||
Diluted earnings per share | 0.98 | 0.81 | 0.97 | ||||||||
Dividends per share | 0.42 | 0.35 | 0.22 | ||||||||
The Notes to Consolidated Financial Statements are an integral part of these statements.
57
Consolidated Statements of Comprehensive Income
ORRSTOWN FINANCIAL SERVICES, INC.
Years Ended December 31, | |||||||||||
(Dollars in thousands) | 2017 | 2016 | 2015 | ||||||||
Net income | $ | 8,090 | $ | 6,628 | $ | 7,874 | |||||
Other comprehensive income (loss), net of tax: | |||||||||||
Unrealized holding gains (losses) on securities available for sale arising during the period | 6,557 | (2,190 | ) | 1,345 | |||||||
Reclassification adjustment for gains realized in net income | (1,190 | ) | (1,420 | ) | (1,924 | ) | |||||
Net unrealized gains (losses) | 5,367 | (3,610 | ) | (579 | ) | ||||||
Tax effect | (1,586 | ) | 1,246 | 202 | |||||||
Total other comprehensive income (loss), net of tax and reclassification adjustments | 3,781 | (2,364 | ) | (377 | ) | ||||||
Total comprehensive income | $ | 11,871 | $ | 4,264 | $ | 7,497 | |||||
The Notes to Consolidated Financial Statements are an integral part of these statements.
58
Consolidated Statements of Changes in Shareholders’ Equity
ORRSTOWN FINANCIAL SERVICES, INC.
Years Ended December 31, 2017, 2016, and 2015 | |||||||||||||||||||||||
(Dollars in thousands, except per share data) | Common Stock | Additional Paid-In Capital | Retained Earnings | Accumulated Other Comprehensive Income (Loss) | Treasury Stock | Total Shareholders’ Equity | |||||||||||||||||
Balance, January 1, 2015 | $ | 430 | $ | 123,392 | $ | 1,887 | $ | 1,576 | $ | (20 | ) | $ | 127,265 | ||||||||||
Net income | 0 | 0 | 7,874 | 0 | 0 | 7,874 | |||||||||||||||||
Total other comprehensive loss, net of taxes | 0 | 0 | 0 | (377 | ) | 0 | (377 | ) | |||||||||||||||
Cash dividends ($0.22 per share) | 0 | 0 | (1,822 | ) | 0 | 0 | (1,822 | ) | |||||||||||||||
Share-based compensation plans: | |||||||||||||||||||||||
Issuance of stock (50,686 shares), including compensation expense of $740 | 5 | 835 | 0 | 0 | 0 | 840 | |||||||||||||||||
Issuance of stock through dividend reinvestment plan (5,239 shares) | 0 | 90 | 0 | 0 | 0 | 90 | |||||||||||||||||
Acquisition of treasury stock (47,077 shares) | 0 | 0 | 0 | 0 | (809 | ) | (809 | ) | |||||||||||||||
Balance, December 31, 2015 | 435 | 124,317 | 7,939 | 1,199 | (829 | ) | 133,061 | ||||||||||||||||
Net income | 0 | 0 | 6,628 | 0 | 0 | 6,628 | |||||||||||||||||
Total other comprehensive loss, net of taxes | 0 | 0 | 0 | (2,364 | ) | 0 | (2,364 | ) | |||||||||||||||
Cash dividends ($0.35 per share) | 0 | 0 | (2,898 | ) | 0 | 0 | (2,898 | ) | |||||||||||||||
Share-based compensation plans: | |||||||||||||||||||||||
Issuance of stock (22,956 common shares and 25,834 treasury shares), including compensation expense of $958 | 2 | 618 | 0 | 0 | 443 | 1,063 | |||||||||||||||||
Acquisition of treasury stock (35,648 shares) | 0 | 0 | 0 | 0 | (631 | ) | (631 | ) | |||||||||||||||
Balance, December 31, 2016 | 437 | 124,935 | 11,669 | (1,165 | ) | (1,017 | ) | 134,859 | |||||||||||||||
Net income | 0 | 0 | 8,090 | 0 | 0 | 8,090 | |||||||||||||||||
Reclassification of disproportionate tax effects from accumulated other comprehensive income (loss) to retained earnings | 0 | 0 | (229 | ) | 229 | 0 | 0 | ||||||||||||||||
Total other comprehensive income, net of taxes | 0 | 0 | 0 | 3,781 | 0 | 3,781 | |||||||||||||||||
Cash dividends ($0.42 per share) | 0 | 0 | (3,488 | ) | 0 | (3,488 | ) | ||||||||||||||||
Share-based compensation plans: | |||||||||||||||||||||||
Issuance of stock (4,421 net common shares and 56,885 treasury shares issued), including compensation expense of $1,386 | (2 | ) | 523 | 0 | 0 | 1,002 | 1,523 | ||||||||||||||||
Balance, December 31, 2017 | $ | 435 | $ | 125,458 | $ | 16,042 | $ | 2,845 | $ | (15 | ) | $ | 144,765 | ||||||||||
The Notes to Consolidated Financial Statements are an integral part of these statements.
59
Consolidated Statements of Cash Flows
ORRSTOWN FINANCIAL SERVICES, INC.
Years Ended December 31, | |||||||||||
(Dollars in thousands) | 2017 | 2016 | 2015 | ||||||||
Cash flows from operating activities | |||||||||||
Net income | $ | 8,090 | $ | 6,628 | $ | 7,874 | |||||
Adjustments to reconcile net income to net cash provided by operating activities: | |||||||||||
Amortization of premiums on securities available for sale | 4,034 | 5,295 | 6,033 | ||||||||
Depreciation and amortization | 3,265 | 2,951 | 2,907 | ||||||||
Provision for loan losses | 1,000 | 250 | (603 | ) | |||||||
Share-based compensation | 1,386 | 958 | 740 | ||||||||
Gain on sales of loans originated for sale | (2,447 | ) | (2,998 | ) | (2,344 | ) | |||||
Mortgage loans originated for sale | (104,512 | ) | (108,632 | ) | (85,995 | ) | |||||
Proceeds from sales of loans originated for sale | 103,131 | 114,139 | 85,116 | ||||||||
Gain on sale of portfolio loans | (32 | ) | 0 | 0 | |||||||
Net gain on disposal of other real estate owned | (18 | ) | (182 | ) | (234 | ) | |||||
Writedown of other real estate owned | 4 | 183 | 45 | ||||||||
Net (gain) loss on disposal of premises and equipment | (18 | ) | 147 | 0 | |||||||
Deferred income taxes | 3,078 | (232 | ) | 797 | |||||||
Investment securities gains | (1,190 | ) | (1,420 | ) | (1,924 | ) | |||||
Earnings on cash surrender value of life insurance | (1,109 | ) | (1,099 | ) | (1,025 | ) | |||||
Increase in accrued interest receivable | (376 | ) | (827 | ) | (748 | ) | |||||
Increase in accrued interest payable and other liabilities | 2,012 | 561 | 2,017 | ||||||||
Other, net | 52 | (135 | ) | (498 | ) | ||||||
Net cash provided by operating activities | 16,350 | 15,587 | 12,158 | ||||||||
Cash flows from investing activities | |||||||||||
Proceeds from sales of available for sale securities | 162,320 | 64,742 | 65,611 | ||||||||
Maturities, repayments and calls of available for sale securities | 28,768 | 30,192 | 32,251 | ||||||||
Purchases of available for sale securities | (203,719 | ) | (108,448 | ) | (120,475 | ) | |||||
Net (purchases) redemptions of restricted investments in bank stocks | (2,027 | ) | 750 | (370 | ) | ||||||
Net increase in loans | (130,791 | ) | (108,509 | ) | (78,776 | ) | |||||
Proceeds from sales of portfolio loans | 2,195 | 5,100 | 0 | ||||||||
Investment in affordable housing limited partnerships | 0 | 0 | (2,205 | ) | |||||||
Purchases of bank premises and equipment | (2,653 | ) | (13,369 | ) | (1,471 | ) | |||||
Improvements to other real estate owned | (9 | ) | 0 | 0 | |||||||
Proceeds from disposal of other real estate owned | 541 | 1,090 | 1,839 | ||||||||
Proceeds from disposal of bank premises and equipment | 83 | 0 | 0 | ||||||||
Purchases of bank owned life insurance | (600 | ) | 0 | (3,750 | ) | ||||||
Other | 0 | (439 | ) | 0 | |||||||
Net cash used in investing activities | (145,892 | ) | (128,891 | ) | (107,346 | ) | |||||
Cash flows from financing activities | |||||||||||
Net increase in deposits | 67,063 | 120,285 | 82,463 | ||||||||
Net increase (decrease) in short-term borrowings | 5,712 | (1,292 | ) | 2,414 | |||||||
Proceeds from long-term debt | 80,000 | 0 | 20,000 | ||||||||
Payments on long-term debt | (20,348 | ) | (332 | ) | (10,317 | ) | |||||
Dividends paid | (3,488 | ) | (2,898 | ) | (1,822 | ) | |||||
Net proceeds from issuance of common stock | 0 | 105 | 190 | ||||||||
Acquisition of treasury stock | 0 | (631 | ) | (809 | ) | ||||||
Net proceeds from issuance of treasury stock | 137 | 0 | 0 | ||||||||
Net cash provided by financing activities | 129,076 | 115,237 | 92,119 | ||||||||
Net increase (decrease) in cash and cash equivalents | (466 | ) | 1,933 | (3,069 | ) | ||||||
Cash and cash equivalents at beginning of year | 30,273 | 28,340 | 31,409 | ||||||||
Cash and cash equivalents at end of year | $ | 29,807 | $ | 30,273 | $ | 28,340 | |||||
Supplemental disclosure of cash flow information: | |||||||||||
Cash paid during the year for: | |||||||||||
Interest | $ | 7,586 | $ | 5,346 | $ | 4,208 | |||||
Income taxes | 1,638 | 1,300 | 800 | ||||||||
Supplemental schedule of noncash investing and financing activities: | |||||||||||
Other real estate acquired in settlement of loans | 1,007 | 688 | 1,428 | ||||||||
The Notes to Consolidated Financial Statements are an integral part of these statements.
60
Notes to Consolidated Financial Statements
NOTE 1. SUMMARY OF SIGNIFICANT ACCOUNTING POLICIES
See the Glossary of Defined Terms at the beginning of this Report for terms used throughout the consolidated financial statements and related notes of this Form 10-K.
Nature of Operations – Orrstown Financial Services, Inc. and subsidiaries is a financial holding company that operates Orrstown Bank, a commercial bank with banking and financial advisory offices in Berks, Cumberland, Dauphin, Franklin, Lancaster and Perry Counties of Pennsylvania and in Washington County, Maryland and Wheatland Advisors, Inc., a registered investment advisor non-bank subsidiary, headquartered in Lancaster, Pennsylvania, and which was acquired in December 2016. The Bank engages in lending activities including commercial, residential, commercial mortgages, construction, municipal, and various forms of consumer lending. Deposit services include checking, savings, time, and money market deposits. The Bank also provides investment and brokerage services through its OFA division. The Company and the Bank are subject to regulation by certain federal and state agencies and undergo periodic examinations by such regulatory authorities.
Basis of Presentation – The accompanying consolidated financial statements include the accounts of Orrstown Financial Services, Inc. and its wholly owned subsidiaries, the Bank and Wheatland. The accounting and reporting policies of the Company conform to GAAP and, where applicable, to accounting and reporting guidelines prescribed by bank regulatory authorities. All significant intercompany transactions and accounts have been eliminated. Certain reclassifications have been made to prior year amounts to conform with current year classifications. In December 2016, the Company acquired Wheatland. The results of operations or assets acquired and liabilities assumed are included only from the date of acquisition. Pro forma financial information for the acquisition has not been included because the acquisition was not material.
The Company's management has evaluated all activity of the Company and concluded that subsequent events are properly reflected in the Company's consolidated financial statements and notes as required by GAAP.
The preparation of financial statements in conformity with GAAP requires management to make estimates and assumptions that affect the reported amounts of assets and liabilities and disclosure of contingent assets and liabilities as of the date of the financial statements and the reported amounts of revenues and expenses during the reporting periods. Actual results could differ from those estimates. Material estimates that are particularly susceptible to significant change include the determination of the ALL and income taxes.
Concentration of Credit Risk – The Company grants commercial, residential, construction, municipal, and various forms of consumer lending to customers primarily in its market area of Berks, Cumberland, Dauphin, Franklin, Lancaster, and Perry Counties of Pennsylvania and in Washington County, Maryland. Therefore the Company's exposure to credit risk is significantly affected by changes in the economy in those areas. Although the Company maintains a diversified loan portfolio, a significant portion of its customers’ ability to honor their contracts is dependent upon economic sectors for commercial real estate, including office space, retail strip centers, sales finance, sub-dividers and developers, and multi-family, hospitality, and residential building operators. Management evaluates each customer’s creditworthiness on a case-by-case basis. The amount of collateral obtained, if collateral is deemed necessary by the Company upon the extension of credit, is based on management’s credit evaluation of the customer. Collateral held varies, but generally includes real estate and equipment.
The types of securities the Company invests in are included in Note 3, Securities Available for Sale, and the type of lending the Company engages in are included in Note 4, Loans and Allowance for Loan Losses.
Cash and Cash Equivalents – Cash and cash equivalents include cash, balances due from banks, federal funds sold and interest bearing deposits due on demand, all of which have original maturities of 90 days or less. Net cash flows are reported for customer loan and deposit transactions, loans held for sale, redemption (purchases) of restricted investments in bank stocks, and short-term borrowings.
Restricted Investments in Bank Stocks – Restricted investments in bank stocks consist of Federal Reserve Bank of Philadelphia stock, FHLB of Pittsburgh stock and Atlantic Community Bankers Bank stock. Federal law requires a member institution of the district Federal Reserve Bank and FHLB to hold stock according to predetermined formulas. Atlantic Community Bankers Bank requires its correspondent banking institutions to hold stock as a condition of membership. The restricted investment in bank stocks is carried at cost. Quarterly, management evaluates the bank stocks for impairment based on assessment of the ultimate recoverability of cost rather than by recognizing temporary declines in value. The determination of whether a decline affects the ultimate recoverability of cost is influenced by criteria such as operating performance, liquidity, funding and capital positions, stock repurchase history, dividend history and impact of legislative and regulatory changes.
61
Securities – The Company classifies debt and marketable equity securities as available for sale on the date of purchase. At December 31, 2017 and 2016 the Company had no held to maturity or trading securities. AFS securities are reported at fair value. Interest income and dividends are recognized in interest income on an accrual basis. Purchase premiums and discounts on debt securities are amortized to interest income using the interest method over the terms of the securities and approximate the level yield method.
Changes in unrealized gains and losses, net of related deferred taxes, for AFS securities are recorded in AOCI. Realized gains and losses on securities are recorded on the trade date using the specific identification method and are included in noninterest income.
AFS securities include investments that management intends to use as part of its asset/liability management strategy. Securities may be sold in response to changes in interest rates, changes in prepayment rates and other factors. The Company does not have the intent to sell any of its AFS securities that are in an unrealized loss position and it is more likely than not that the Company will not be required to sell these securities before recovery of their amortized cost.
Management evaluates securities for OTTI on at least a quarterly basis, and more frequently when economic or market conditions warrant such an evaluation. For securities in an unrealized loss position, management considers the extent and duration of the unrealized loss, and the financial condition and near-term prospects of the issuer. Management also assesses whether it intends to sell, or it is more likely than not that it will be required to sell, a security in an unrealized loss position before recovery of its amortized cost basis. If either of the criteria regarding intent or requirement to sell is met, the entire difference between amortized cost and fair value is recognized as impairment through earnings. For debt securities that do not meet the aforementioned criteria, the amount of impairment is split into two components: OTTI related to other factors, which is recognized in OCI, and the remaining OTTI, which is recognized in earnings. The credit loss is defined as the difference between the present value of the cash flows expected to be collected and the amortized cost basis. For equity securities, the entire amount of impairment is recognized through earnings.
The Company’s securities are exposed to various risks, such as interest rate risk, market risk, and credit risk. Due to the level of risk associated with certain investments and the level of uncertainty related to changes in the value of investments, it is at least reasonably possible that changes in risks in the near term would materially affect investment assets reported in the consolidated financial statements.
Loans Held for Sale – Loans originated and intended for sale in the secondary market are carried at the lower of aggregate cost or fair value. Gains and losses on loan sales (sales proceeds minus carrying value) are recorded in noninterest income.
Loans – The Company grants commercial loans; residential, commercial and construction mortgage loans; and various forms of consumer loans to its customers located principally in south central Pennsylvania and northern Maryland. The ability of the Company’s debtors to honor their contracts is dependent largely upon the real estate and general economic conditions in this area.
Loans that management has the intent and ability to hold for the foreseeable future or until maturity or pay-off generally are reported at their outstanding unpaid principal balances adjusted for charge-offs, the ALL, and any deferred fees or costs on originated loans. Interest income is accrued on the unpaid principal balance. Loan origination fees, net of certain direct origination costs, are deferred and amortized as a yield adjustment over the respective term of the loan. For purchased loans that are not deemed impaired at the acquisition date, premiums and discounts are amortized or accreted as adjustments to interest income using the effective yield method.
For all classes of loans, the accrual of interest income on loans, including impaired loans, ceases when principal or interest is past due 90 days or more or immediately if, in the opinion of management, full collection is unlikely. Interest will continue to accrue on loans past due 90 days or more if the collateral is adequate to cover principal and interest, and the loan is in the process of collection. Interest accrued, but not collected, at the date of placement on nonaccrual status, is reversed and charged against current interest income, unless fully collateralized. Subsequent payments received are either applied to the outstanding principal balance or recorded as interest income, depending upon management’s assessment of the ultimate collectability of principal. Loans are returned to accrual status, for all loan classes, when all the principal and interest amounts contractually due are brought current, the loan has performed in accordance with the contractual terms of the note for a reasonable period of time, generally six months, and the ultimate collectability of the total contractual principal and interest is reasonably assured. Past due status is based on contractual terms of the loan.
Loans, the terms of which are modified, are classified as TDRs if a concession was granted in connection with the modification, for legal or economic reasons, related to the debtor’s financial difficulties. Concessions granted under a TDR typically involve a temporary deferral of scheduled loan payments, an extension of a loan’s stated maturity date, a temporary reduction in interest rates, or granting of an interest rate below market rates given the risk of the transaction. If a modification occurs while the loan is on accruing status, it will continue to accrue interest under the modified terms. Nonaccrual TDRs may
62
be restored to accrual status if scheduled principal and interest payments, under the modified terms, are current for six months after modification, and the borrower continues to demonstrate its ability to meet the modified terms. TDRs are evaluated individually for impairment on a quarterly basis including monitoring of performance according to their modified terms.
Allowance for Loan Losses – The ALL is evaluated on a quarterly basis, as losses are estimated to be probable and incurred, and, if deemed necessary, is increased through a provision for loan losses charged to earnings. Loan losses are charged against the ALL when management determines that all or a portion of the loan is uncollectible. Recoveries on previously charged-off loans are credited to the ALL when received. The ALL is allocated to loan portfolio classes on a quarterly basis, but the entire balance is available to cover losses from any of the portfolio classes when those losses are confirmed.
Management uses internal policies and bank regulatory guidance in periodically evaluating loans for collectability and incorporates historical experience, the nature and volume of the loan portfolio, adverse situations that may affect the borrower’s ability to repay, estimated value of any underlying collateral and prevailing economic conditions. This evaluation is inherently subjective as it requires estimates that are susceptible to significant revision as more information becomes available.
See Note 4, Loans and Allowance for Loan Losses, for additional information.
Loan Commitments and Related Financial Instruments – Financial instruments include off-balance sheet credit commitments issued to meet customer financing needs, such as commitments to make loans and commercial letters of credit. These financial instruments are recorded when they are funded. The face amount represents the exposure to loss, before considering customer collateral or ability to repay. The Company maintains a reserve for probable losses on off-balance sheet commitments which is included in Other Liabilities.
Loans Serviced – The Bank administers secondary market mortgage programs available through the FHLB and the Federal National Mortgage Association and offers residential mortgage products and services to customers. The Bank originates single-family residential mortgage loans for immediate sale in the secondary market and retains the servicing of those loans. At December 31, 2017 and 2016, the balance of loans serviced for others totaled $334,802,000 and $328,701,000.
Transfers of Financial Assets – Transfers of financial assets are accounted for as sales when control over the assets has been surrendered. Control over transferred assets is deemed to be surrendered when (1) the assets have been isolated from the Company, (2) the transferee obtains the right (free of conditions that constrain it from taking advantage of that right) to pledge or exchange the transferred assets, and (3) the Company does not maintain effective control over the transferred assets through an agreement to repurchase them before their maturity.
Cash Surrender Value of Life Insurance – The Company has purchased life insurance policies on certain employees. Life insurance is recorded at the cash surrender value adjusted for other charges or other amounts due that are probable at settlement.
Premises and Equipment – Buildings, improvements, equipment, furniture and fixtures are carried at cost less accumulated depreciation and amortization. Land is carried at cost. Depreciation and amortization has been provided generally on the straight-line method and is computed over the estimated useful lives of the various assets as follows: buildings and improvements, including leasehold improvements – 10 to 40 years; and furniture and equipment – 3 to 15 years. Leasehold improvements are amortized over the shorter of the lease term or the indicated life. Repairs and maintenance are charged to operations as incurred, while major additions and improvements are capitalized. Gain or loss on retirement or disposal of individual assets is recorded as income or expense in the period of retirement or disposal.
Goodwill and Other Intangible Assets – Goodwill is calculated as the purchase premium, if any, after adjusting for the fair value of net assets acquired in purchase transactions. Goodwill is not amortized but is reviewed for potential impairment on at least an annual basis, with testing between annual tests if an event occurs or circumstances change that would more likely than not reduce the fair value of a reporting unit. Other intangible assets represent purchased assets that can be distinguished from goodwill because of contractual or other legal rights. The Company’s other intangible assets have finite lives and are amortized on either the sum of the years digits or straight line bases over their estimated lives, generally 10 years for deposit premiums and 10 to 15 years for customer lists.
Mortgage Servicing Rights – The estimated fair value of MSRs related to loans sold and serviced by the Company is recorded as an asset upon the sale of such loans. MSRs are amortized as a reduction to servicing income over the estimated lives of the underlying loans. MSRs are evaluated periodically for impairment by comparing the carrying amount to estimated fair value. Fair value is determined periodically through a discounted cash flows valuation performed by a third party. Significant inputs to the valuation include expected servicing income, net of expense, the discount rate and the expected life of the underlying loans. To the extent the amortized cost of the MSRs exceeds their estimated fair values, a valuation allowance is established for such impairment through a charge against servicing income on the consolidated statements of income. If the Company determines, based on subsequent valuations, that the impairment no longer exists or is reduced, the valuation
63
allowance is reduced through a credit to earnings. MSRs totaled $2,897,000 and $2,835,000 at December 31, 2017 and December 31, 2016, and are included in Other Assets.
Foreclosed Real Estate – Real estate property acquired through foreclosure or other means is initially recorded at the fair value of the related real estate collateral at the transfer date less estimated selling costs, and subsequently at the lower of its carrying value or fair value less estimated costs to sell. Fair value is usually determined based on an independent third party appraisal of the property or occasionally on a recent sales offer. Costs to maintain foreclosed real estate are expensed as incurred. Costs that significantly improve the value of the properties are capitalized. Foreclosed real estate totaled $961,000 and $346,000 at December 31, 2017 and 2016 and is included in Other Assets.
Investments in Real Estate Partnerships – The Company has a 99% limited partner interest in several real estate partnerships in central Pennsylvania. These investments are affordable housing projects which entitle the Company to tax deductions and credits that expire through 2025. The Company accounts for its investments in affordable housing projects under the proportional amortization method when criteria are met, which is limited to one investment entered into in 2015. Other investments are accounted for under the equity method of accounting. The investment in these real estate partnerships, included in Other Assets, totaled $4,416,000 and $4,909,000 at December 31, 2017 and 2016, of which $1,776,000 and $1,993,000 are accounted for under the proportional amortization method.
Equity method losses totaled $277,000, $350,000 and $384,000 for the years ended December 31, 2017, 2016 and 2015 and are included in other noninterest income. Proportional amortization method losses totaled of $217,000, $191,000 and $22,000 for the years ended December 31, 2017, 2016 and 2015 and are included in income tax expense. During 2017, 2016 and 2015, the Company recognized federal tax credits from these projects totaling $1,010,000, $736,000 and $475,000, which are included in income tax expense.
Advertising – The Company expenses advertising as incurred. Advertising expense totaled $631,000, $763,000 and $723,000 for the years ended December 31, 2017, 2016 and 2015.
Repurchase Agreements – The Company enters into agreements under which it sells securities subject to an obligation to repurchase the same or similar securities which are included in short-term borrowings. Under these agreements, the Company may transfer legal control over the assets but still retain effective control through an agreement that both entitles and obligates the Company to repurchase the assets. As a result, these Repurchase Agreements are accounted for as collateralized financing arrangements (i.e., secured borrowings) and not as a sale and subsequent repurchase of securities. The obligation to repurchase the securities is reflected as a liability in the Company’s consolidated balance sheets, while the securities underlying the Repurchase Agreements remaining are reflected in AFS securities. The repurchase obligation and underlying securities are not offset or netted. The Company does not enter into reverse Repurchase Agreements, so there is no offsetting to be performed with Repurchase Agreements.
The right of setoff for a Repurchase Agreement resembles a secured borrowing, whereby the collateral would be used to settle the fair value of the Repurchase Agreement should the Company be in default (e.g., fail to make an interest payment to the counterparty). For the Repurchase Agreements, the collateral is held by the Company in a segregated custodial account under a third party agreement. Repurchase agreements are secured by GSE MBSs and mature overnight.
Share Compensation Plans – The Company has share compensation plans that cover employees and non-employee directors. Compensation expense relating to share-based payment transactions is measured based on the grant date fair value of the share award, including a Black-Scholes model for stock options. Compensation expense for all share awards is calculated and recognized over the employees’ or non-employee directors' service period, generally defined as the vesting period.
Income Taxes – Income tax accounting guidance results in two components of income tax expense: current and deferred. Current income tax expense reflects taxes to be paid or refunded for the current period by applying the provisions of enacted tax law to taxable income or excess of deductions over revenues. The Company determines deferred income taxes using the liability (or balance sheet) method. Under this method, the net deferred tax asset or liability is based on the tax effects of the differences between the book and tax bases of assets and liabilities, and enacted changes in tax rates and laws are recognized in the period in which they occur.
Deferred income tax expense results from changes in deferred tax assets and liabilities between periods. Deferred tax assets are recognized if it is more likely than not, based on the technical merits, that the tax position will be realized or sustained upon examination. The term more likely than not means a likelihood of more than 50 percent; the terms examined and upon examination also include resolution of the related appeals or litigation processes, if any. A tax position that meets the more likely than not recognition threshold is initially and subsequently measured as the largest amount of tax benefit that has a greater than 50 percent likelihood of being realized upon settlement with a taxing authority that has full knowledge of all relevant information. The determination of whether or not a tax position has met the more likely than not recognition threshold considers the facts, circumstances, and information available at the reporting date and is subject to management’s judgment.
64
Deferred tax assets are reduced by a valuation allowance when, based on the weight of available evidence, it is more likely than not that some portion or all of a deferred tax asset will not be realized. The Company recognizes interest and penalties, if any, on income taxes as a component of income tax expense.
Loss Contingencies – Loss contingencies, including claims and legal actions arising in the ordinary course of business, are recorded as liabilities when the likelihood of loss is probable and an amount or range of loss can be reasonably estimated.
Treasury Stock – Common stock shares repurchased are recorded as treasury stock at cost.
Earnings Per Share – Basic earnings per share represents income available to common stockholders divided by the weighted average number of common shares outstanding during the period. Restricted stock awards are included in weighted average common shares outstanding as they are earned. Diluted earnings per share includes additional common shares that would have been outstanding if dilutive potential common shares had been issued. Potential common shares that may be issued by the Company relate solely to outstanding stock options and restricted stock awards and are determined using the treasury stock method.
Treasury shares are not deemed outstanding for earnings per share calculations.
Comprehensive Income – Comprehensive income consists of net income and OCI. OCI is limited to unrealized gains (losses) on securities available for sale for all years presented. Unrealized gains (losses) on securities available for sale, net of tax, was the sole component of AOCI at December 31, 2017 and 2016 and totaled $2,845,000 and $(1,165,000).
Fair Value – Fair values of financial instruments are estimated using relevant market information and other assumptions, as more fully disclosed in Note 17, Fair Value. Fair value estimates involve uncertainties and matters of significant judgment. Changes in assumptions or in market conditions could significantly affect the estimates.
Segment Reporting – The Company operates in one significant segment – Community Banking. The Company’s non-banking activities are insignificant to the consolidated financial statements.
Recent Accounting Pronouncements - ASU 2014-09, Revenue from Contracts with Customers (Topic 606). ASU 2014-09 implements a common revenue standard that clarifies the principles for recognizing revenue. The core principle of ASU 2014-09 is that an entity should recognize revenue to depict the transfer of promised goods or services to customers in an amount that reflects the consideration to which the entity expects to be entitled in exchange for those goods or services. Additional disclosures are required to provide quantitative and qualitative information regarding the nature, amount, timing, and uncertainty of revenue and cash flows arising from contracts with customers. A substantial portion of the Company's revenue is generated from interest income related to loans and investment securities, which are not within the scope of ASU 2014-09. The Company's evaluation of the impact of changes for in-scope items within noninterest income, including service charges on deposit accounts and trust and investment management income, has not identified any significant impact on our consolidated financial statements. ASU 2014-09 was effective for the Company on January 1, 2018 and did not have a significant impact on our consolidated financial statements.
ASU 2016-01, Financial Instruments – Overall (Subtopic 825-10): Recognition and Measurement of Financial Assets and Financial Liabilities. ASU 2016-01, among other things, (i) requires equity investments, with certain exceptions, to be measured at fair value with changes in fair value recognized in net income, (ii) simplifies the impairment assessment of equity investments without readily determinable fair values by requiring a qualitative assessment to identify impairment, (iii) eliminates the requirement for public business entities to disclose the methods and significant assumptions used to estimate the fair value that is required to be disclosed for financial instruments measured at amortized cost on the balance sheet, (iv) requires public business entities to use the exit price notion when measuring the fair value of financial instruments for disclosure purposes, (v) requires an entity to present separately in other comprehensive income the portion of the total change in the fair value of a liability resulting from a change in the instrument-specific credit risk when the entity has elected to measure the liability at fair value in accordance with the fair value option for financial instruments, (vi) requires separate presentation of financial assets and financial liabilities by measurement category and form of financial asset on the balance sheet or the accompanying notes to the financial statements and (viii) clarifies that an entity should evaluate the need for a valuation allowance on a deferred tax asset related to available-for-sale securities. ASU 2016-01 was effective for the Company on January 1, 2018 and did not have a significant impact on our consolidated financial statements.
ASU 2016-02, Leases (Topic 842). ASU 2016-02 will, among other things, require lessees to recognize a lease liability, which is a lessee's obligation to make lease payments arising from a lease, measured on a discounted basis; and a right-of-use asset, which is an asset that represents the lessee’s right to use, or control the use of, a specified asset for the lease term. ASU 2016-02 will be effective for the Company on January 1, 2019 and will require transition using a modified retrospective approach for leases existing at, or entered into after, the beginning of the earliest comparative period presented in the financial statements. Notwithstanding the foregoing, in January 2018, the FASB issued a proposal to provide an additional transition
65
method that would allow entities to not apply the guidance in ASU 2016-02 in the comparative periods presented in the financial statements and instead recognize a cumulative-effect adjustment to the opening balance of retained earnings in the period of adoption. The Company anticipates that the impact on its consolidated balance sheet will result in an increase in assets and liabilities for its right of use assets and related lease liabilities for those leases that are outstanding at the date of adoption, however, it does not anticipate it will have a material impact on its results of operations. Management is evaluating other effects of this standard on the Company's consolidated financial position and regulatory capital.
ASU 2016-09, Compensation - Stock Compensation: Improvements to Employee Share-Based Payment Accounting (Topic 718). ASU 2016-09 requires recognition of the income tax effects of share-based awards in the income statement when the awards vest or are settled, eliminating additional paid-in capital pools. The adoption of these changes by the Company on January 1, 2017 did not have a material impact on our financial position or results of operations.
ASU No. 2016-13, Financial Instruments - Credit Losses (Topic 326): Measurement of Credit Losses on Financial Instruments. ASU 2016-13 requires the measurement of all expected credit losses for financial assets held at the reporting date based on historical experience, current conditions, and reasonable and supportable forecasts and requires enhanced disclosures related to the significant estimates and judgments used in estimating credit losses, as well as the credit quality and underwriting standards of an organization’s portfolio. In addition, ASU 2016-13 amends the accounting for credit losses on available for sale debt securities and purchased financial assets with credit deterioration. ASU 2016-13 will be effective on January 1, 2020. The Company is currently evaluating the potential impact of ASU 2016-13 on our consolidated financial statements. In that regard, the Company has formed a cross-functional working group, under the direction of the Chief Financial Officer and the Chief Risk Officer. The working group is comprised of individuals from various functional areas including credit, risk management, finance and information technology. We are currently developing an implementation plan to include, but not limited to, an assessment of processes, portfolio segmentation, model development, system requirements and the identification of data and resource needs. We have selected a third-party vendor solution to assist us in the application of ASU 2016-13. While the Company is currently unable to reasonably estimate the impact of adopting ASU 2016-13, we expect that the impact of adoption will be significantly influenced by the composition, characteristics and quality of the Company's loan and securities portfolios as well as the prevailing economic conditions and forecasts at the adoption date.
ASU 2016-15, Statement of Cash Flows (Topic 230) - Restricted Cash. ASU 2016-18 requires that a statement of cash flows explain the change during the period in the total of cash, cash equivalents, and amounts generally described as restricted cash or restricted cash equivalents. Therefore, amounts generally described as restricted cash and restricted cash equivalents should be included with cash and cash equivalents when reconciling the beginning-of-period and end-of-period total amounts shown on the statement of cash flows. ASU 2016-18 was effective for the Company on January 1, 2018 and did have a significant impact on our consolidated financial statements.
ASU 2017-04, Intangibles - Goodwill and Other (Topic 350): Simplifying the Test for Goodwill Impairment. ASU 2017-04 simplifies how all entities assess goodwill for impairment by eliminating Step 2 from the goodwill impairment test. As amended, the goodwill impairment test will consist of one step comparing the fair value of a reporting unit with its carrying amount. An entity should recognize a goodwill impairment charge for the amount by which the carrying amount exceeds the reporting unit’s fair value. ASU 2017-04 will be effective for the Company on January 1, 2020, with earlier adoption permitted, and is not expected to have a material impact on the Company's consolidated financial statements.
ASU 2017-08, Receivables - Nonrefundable Fees and Other Costs (Subtopic 310-20). ASU 2017-08 shortens the amortization period of certain callable debt securities held at a premium to the earliest call date unless applicable guidance related to certain pools of securities is applied to consider estimated prepayments. Under prior guidance, entities were generally required to amortize premiums on individual, non-pooled callable debt securities as a yield adjustment over the contractual life of the security. ASU 2017-08 does not change the accounting for callable debt securities held at a discount. ASU 2017-08 will be effective for the Company on January 1, 2019, with early adoption permitted. Management does not anticipate ASU 2017-08 will have a material impact on the Company's consolidated financial statements.
ASU 2017-09, Compensation - Stock Compensation (Topic 718). ASU 2017-09 clarifies when changes to the terms or conditions of a share-based payment award must be accounted for as modifications. Under ASU 2017-09, an entity will not apply modification accounting to a share-based payment award if all of the following are the same immediately before and after the change: (i) the award's fair value, (ii) the award's vesting conditions and (iii) the award's classification as an equity or liability instrument. ASU 2017-09 was effective for the Company on January 1, 2018 and did not have a significant impact on our consolidated financial statements.
ASU 2018-02, Income Statement - Reporting Comprehensive Income (Topic 220): Reclassification of Certain Tax Effects from Accumulated Other Comprehensive Income. ASU 2018-02 allows entities to reclassify from AOCI to retained earnings the 'stranded' tax effects of accounting for income tax rate changes on items accounted for in AOCI which were impacted by tax reform enacted in December 2017. The impact of tax rate changes is recorded in income and items accounted for in AOCI could
66
be left with such a stranded tax effect that could have those items appear to not reflect the appropriate tax rate. The FASB's changes are intended to improve the usefulness of information reported to financial statement users. The changes are effective for years beginning after December 31, 2018, with early adoption permitted. We elected to adopt the changes in December 2017. The amount transferred from AOCI to retained earnings totaled $229,000 and represented the impact of the Tax Law rate change to 21% at the date of enactment for the unrealized gains and losses on securities accounted for in AOCI.
NOTE 2. RESTRICTIONS ON CASH AND DUE FROM BANKS
Cash on hand or on deposit with the Federal Reserve Bank or other correspondent banks, totaling $1,395,000 and $4,371,000 at December 31, 2017 and 2016, was required to meet regulatory reserve and clearing requirements.
Balances with correspondent banks may, at times, exceed federally insured limits; however the Company considers this to be a normal business risk. The Company reviews correspondent banks' financial condition on a quarterly basis.
NOTE 3. SECURITIES AVAILABLE FOR SALE
The following table summarizes amortized cost and fair value of AFS securities at December 31, 2017 and 2016 and the corresponding amounts of gross unrealized gains and losses recognized in AOCI. At December 31, 2017 and 2016 all investment securities were classified as AFS.
(Dollars in thousands) | Amortized Cost | Gross Unrealized Gains | Gross Unrealized Losses | Fair Value | |||||||||||
December 31, 2017 | |||||||||||||||
States and political subdivisions | $ | 153,803 | $ | 6,133 | $ | 478 | $ | 159,458 | |||||||
GSE residential MBSs | 48,600 | 930 | 0 | 49,530 | |||||||||||
GSE residential CMOs | 113,658 | 296 | 2,835 | 111,119 | |||||||||||
Private label residential CMOs | 999 | 4 | 0 | 1,003 | |||||||||||
Private label commercial CMOs | 7,809 | 0 | 156 | 7,653 | |||||||||||
Asset-backed | 86,787 | 69 | 425 | 86,431 | |||||||||||
Total debt securities | 411,656 | 7,432 | 3,894 | 415,194 | |||||||||||
Equity securities | 50 | 64 | 0 | 114 | |||||||||||
Totals | $ | 411,706 | $ | 7,496 | $ | 3,894 | $ | 415,308 | |||||||
December 31, 2016 | |||||||||||||||
U.S. Government Agencies | $ | 39,569 | $ | 147 | $ | 124 | $ | 39,592 | |||||||
States and political subdivisions | 163,677 | 1,782 | 1,177 | 164,282 | |||||||||||
GSE residential MBSs | 116,022 | 928 | 6 | 116,944 | |||||||||||
GSE residential CMOs | 72,411 | 240 | 3,268 | 69,383 | |||||||||||
GSE commercial CMOs | 5,148 | 0 | 292 | 4,856 | |||||||||||
Private label residential CMOs | 5,042 | 0 | 36 | 5,006 | |||||||||||
Total debt securities | 401,869 | 3,097 | 4,903 | 400,063 | |||||||||||
Equity securities | 50 | 41 | 0 | 91 | |||||||||||
Totals | $ | 401,919 | $ | 3,138 | $ | 4,903 | $ | 400,154 | |||||||
67
The following table summarizes AFS securities with unrealized losses at December 31, 2017 and 2016, aggregated by major security type and length of time in a continuous unrealized loss position.
Less Than 12 Months | 12 Months or More | Total | ||||||||||||||||||||||||||||||
(Dollars in thousands) | # of Securities | Fair Value | Unrealized Losses | # of Securities | Fair Value | Unrealized Losses | # of Securities | Fair Value | Unrealized Losses | |||||||||||||||||||||||
December 31, 2017 | ||||||||||||||||||||||||||||||||
States and political subdivisions | 7 | $ | 24,577 | $ | 473 | 1 | $ | 5,585 | $ | 5 | 8 | $ | 30,162 | $ | 478 | |||||||||||||||||
GSE residential CMOs | 4 | 25,155 | 914 | 5 | 37,459 | 1,921 | 9 | 62,614 | 2,835 | |||||||||||||||||||||||
Private label commercial CMOs | 2 | 7,653 | 156 | 0 | 0 | 0 | 2 | 7,653 | 156 | |||||||||||||||||||||||
Asset-backed | 6 | 60,006 | 425 | 0 | 0 | 0 | 6 | 60,006 | 425 | |||||||||||||||||||||||
Totals | 19 | $ | 117,391 | $ | 1,968 | 6 | $ | 43,044 | $ | 1,926 | 25 | $ | 160,435 | $ | 3,894 | |||||||||||||||||
December 31, 2016 | ||||||||||||||||||||||||||||||||
U.S. Government Agencies | 6 | $ | 10,710 | $ | 23 | 2 | $ | 13,531 | $ | 101 | 8 | $ | 24,241 | $ | 124 | |||||||||||||||||
States and political subdivisions | 25 | 58,924 | 610 | 1 | 5,075 | 567 | 26 | 63,999 | 1,177 | |||||||||||||||||||||||
GSE residential MBSs | 1 | 5,034 | 6 | 0 | 0 | 0 | 1 | 5,034 | 6 | |||||||||||||||||||||||
GSE residential CMOs | 6 | 59,534 | 3,264 | 1 | 634 | 4 | 7 | 60,168 | 3,268 | |||||||||||||||||||||||
GSE commercial CMOs | 1 | 4,856 | 292 | 0 | 0 | 0 | 1 | 4,856 | 292 | |||||||||||||||||||||||
Private label residential CMOs | 0 | 0 | 0 | 3 | 5,005 | 36 | 3 | 5,005 | 36 | |||||||||||||||||||||||
Totals | 39 | $ | 139,058 | $ | 4,195 | 7 | $ | 24,245 | $ | 708 | 46 | $ | 163,303 | $ | 4,903 | |||||||||||||||||
U.S. Government Agencies and GSE Securities. The unrealized losses presented in the table above have been caused by a widening of spreads and/or a rise in interest rates from the time these securities were purchased. The contractual terms of these securities do not permit the issuer to settle the securities at a price less than its par value basis. Because the Company does not intend to sell these securities and it is not more likely than not that the Company will be required to sell them before recovery of their amortized cost basis, which may be maturity, the Company does not consider these securities to be OTTI at December 31, 2017 or at December 31, 2016.
State and Political Subdivisions. The unrealized losses presented in the table above have been caused by a widening of spreads and/or a rise in interest rates from the time these securities were purchased. Management considers the investment rating, the state of the issuer of the security and other credit support in determining whether the security is OTTI. Because the Company does not intend to sell these securities and it is not more likely than not that the Company will be required to sell them before recovery of their amortized cost basis, which may be maturity, the Company does not consider these securities to be OTTI at December 31, 2017 or at December 31, 2016.
Private Label Residential CMOs. The unrealized losses presented in the table above have been caused by a widening of spreads and/or a rise in interest rates from the time the securities were purchased. Because the Company does not intend to sell these securities and it is not more likely than not that the Company will be required to sell them before recovery of their amortized cost basis, which may be maturity, the Company does not consider these securities to be OTTI at December 31, 2017 or at December 31, 2016.
Private Label Commercial CMOs and Asset-backed. The unrealized losses presented in the table above have been caused by the bid ask spread, widening of spreads and/or a rise in interest rates from the time the securities were purchased. Because the Company does not intend to sell these securities and it is not more likely than not that the Company will be required to sell them before recovery of their amortized cost basis, which may be maturity, the Company does not consider these securities to be OTTI at December 31, 2017 or at December 31, 2016.
68
The following table summarizes amortized cost and fair value of AFS securities at December 31, 2017 by contractual maturity. Expected maturities may differ from contractual maturities if borrowers have the right to call or prepay obligations with or without call or prepayment penalties. Securities not due at a single maturity date are shown separately.
Available for Sale | |||||||
(Dollars in thousands) | Amortized Cost | Fair Value | |||||
Due in one year or less | $ | 0 | $ | 0 | |||
Due after one year through five years | 8,712 | 8,929 | |||||
Due after five years through ten years | 49,958 | 51,188 | |||||
Due after ten years | 95,133 | 99,341 | |||||
MBSs and CMOs | 171,066 | 169,305 | |||||
Asset-backed | 86,787 | 86,431 | |||||
Total debt securities | 411,656 | 415,194 | |||||
Equity securities | 50 | 114 | |||||
Totals | $ | 411,706 | $ | 415,308 | |||
The following table summarizes proceeds from sales of AFS securities and gross gains and gross losses for the years ended December 31, 2017, 2016, and 2015.
Years Ended December 31, | |||||||||||
(Dollars in thousands) | 2017 | 2016 | 2015 | ||||||||
Proceeds from sale of AFS securities | $ | 162,320 | $ | 64,742 | $ | 65,611 | |||||
Gross gains | 1,477 | 1,468 | 1,948 | ||||||||
Gross losses | 287 | 48 | 24 | ||||||||
AFS securities with a fair value of $319,907,000 and $317,282,000 at December 31, 2017 and December 31, 2016 were pledged to secure public funds and for other purposes as required or permitted by law.
NOTE 4. LOANS AND ALLOWANCE FOR LOAN LOSSES
The Company’s loan portfolio is grouped into classes to allow management to monitor the performance by the borrower and to monitor the yield on the portfolio. Consistent with ASU 2010-20, Disclosures about the Credit Quality of Financing Receivables and the Allowance for Loan Losses, the segments are further broken down into classes to allow for differing risk characteristics within a segment.
The risks associated with lending activities differ among the various loan classes and are subject to the impact of changes in interest rates, market conditions of collateral securing the loans, and general economic conditions. All of these factors may adversely impact both the borrower’s ability to repay its loans and associated collateral.
The Company has various types of commercial real estate loans which have differing levels of credit risk. Owner-occupied commercial real estate loans are generally dependent upon the successful operation of the borrower’s business, with the cash flows generated from the business being the primary source of repayment of the loan. If the business suffers a downturn in sales or profitability, the borrower’s ability to repay the loan could be in jeopardy.
Non-owner occupied and multi-family commercial real estate loans and non-owner occupied residential loans present a different credit risk to the Company than owner-occupied commercial real estate loans, as the repayment of the loan is dependent upon the borrower’s ability to generate a sufficient level of occupancy to produce rental income that exceeds debt service requirements and operating expenses. Lower occupancy or lease rates may result in a reduction in cash flows, which hinders the ability of the borrower to meet debt service requirements, and may result in lower collateral values. The Company generally recognizes that greater risk is inherent in these credit relationships as compared to owner-occupied loans mentioned above.
Acquisition and development loans consist of 1-4 family residential construction and commercial and land development loans. The risk of loss on these loans is largely dependent on the Company’s ability to assess the property’s value at the completion of the project, which should exceed the property’s construction costs. During the construction phase, a number of
69
factors could potentially negatively impact the collateral value, including cost overruns, delays in completing the project, competition, and real estate market conditions which may change based on the supply of similar properties in the area. In the event the collateral value at the completion of the project is not sufficient to cover the outstanding loan balance, the Company must rely upon other repayment sources, including the guarantors of the project or other collateral securing the loan.
Commercial and industrial loans include advances to local and regional businesses for general commercial purposes and include permanent and short-term working capital, machinery and equipment financing, and may be either in the form of lines of credit or term loans. Although commercial and industrial loans may be unsecured to our highest rated borrowers, the majority of these loans are secured by the borrower’s accounts receivable, inventory and machinery and equipment. In a significant number of these loans, the collateral also includes the business real estate or the business owner’s personal real estate or assets. Commercial and industrial loans present credit exposure to the Company, as they are more susceptible to risk of loss during a downturn in the economy as borrowers may have greater difficulty in meeting their debt service requirements and the value of the collateral may decline. The Company attempts to mitigate this risk through its underwriting standards, including evaluating the creditworthiness of the borrower and, to the extent available, credit ratings on the business. Additionally, monitoring of the loans through annual renewals and meetings with the borrowers are typical. However, these procedures cannot eliminate the risk of loss associated with commercial and industrial lending.
Municipal loans consist of extensions of credit to municipalities and school districts within the Company’s market area. These loans generally present a lower risk than commercial and industrial loans, as they are generally secured by the municipality’s full taxing authority, by revenue obligations, or by its ability to raise assessments on its customers for a specific utility.
The Company originates loans to its retail customers, including fixed-rate and adjustable first lien mortgage loans with the underlying 1-4 family owner-occupied residential property securing the loan. The Company’s risk exposure is minimized in these types of loans through the evaluation of the creditworthiness of the borrower, including credit scores and debt-to-income ratios, and underwriting standards which limit the loan-to-value ratio to generally no more than 80% upon loan origination, unless the borrower obtains private mortgage insurance.
Home equity loans, including term loans and lines of credit, present a slightly higher risk to the Company than 1-4 family first liens, as these loans can be first or second liens on 1-4 family owner occupied residential property, but can have loan-to-value ratios of no greater than 90% of the value of the real estate taken as collateral. The creditworthiness of the borrower is considered including credit scores and debt-to-income ratios.
Installment and other loans’ credit risk are mitigated through prudent underwriting standards, including evaluation of the creditworthiness of the borrower through credit scores and debt-to-income ratios and, if secured, the collateral value of the assets. These loans can be unsecured or secured by assets the value of which may depreciate quickly or may fluctuate, and may present a greater risk to the Company than 1-4 family residential loans.
70
The following table presents the loan portfolio, excluding residential LHFS, broken out by classes at December 31, 2017 and December 31, 2016.
(Dollars in thousands) | 2017 | 2016 | |||||
Commercial real estate: | |||||||
Owner-occupied | $ | 116,811 | $ | 112,295 | |||
Non-owner occupied | 244,491 | 206,358 | |||||
Multi-family | 53,634 | 47,681 | |||||
Non-owner occupied residential | 77,980 | 62,533 | |||||
Acquisition and development: | |||||||
1-4 family residential construction | 11,730 | 4,663 | |||||
Commercial and land development | 19,251 | 26,085 | |||||
Commercial and industrial | 115,663 | 88,465 | |||||
Municipal | 42,065 | 53,741 | |||||
Residential mortgage: | |||||||
First lien | 162,509 | 139,851 | |||||
Home equity – term | 11,784 | 14,248 | |||||
Home equity – lines of credit | 132,192 | 120,353 | |||||
Installment and other loans | 21,902 | 7,118 | |||||
$ | 1,010,012 | $ | 883,391 | ||||
In order to monitor ongoing risk associated with its loan portfolio and specific loans within the segments, management uses an internal grading system. The first several rating categories, representing the lowest risk to the Bank, are combined and given a “Pass” rating. Management generally follows regulatory definitions in assigning criticized ratings to loans, including "Special Mention," "Substandard," "Doubtful" or "Loss." The Special Mention category includes loans that have potential weaknesses that may, if not monitored or corrected, weaken the asset or inadequately protect the Bank's position at some future date. These assets pose elevated risk, but their weakness does not yet justify a more severe, or classified rating. Substandard loans are classified as they have a well-defined weakness, or weaknesses that jeopardize liquidation of the debt. These loans are characterized by the distinct possibility that the Bank will sustain some loss if the deficiencies are not corrected. Substandard loans include loans that management has determined not to be impaired, as well as loans considered to be impaired. A Doubtful loan has a high probability of total or substantial loss, but because of specific pending events that may strengthen the asset, its classification as Loss is deferred. Loss loans are considered uncollectible, as the borrowers are often in bankruptcy, have suspended debt repayments, or have ceased business operations. Once a loan is classified as Loss, there is little prospect of collecting the loan’s principal or interest and it is charged-off.
The Company has a loan review policy and program which is designed to identify and monitor risk in the lending function. The ERM Committee, comprised of executive officers and loan department personnel, is charged with the oversight of overall credit quality and risk exposure of the Company's loan portfolio. This includes the monitoring of the lending activities of all Company personnel with respect to underwriting and processing new loans and the timely follow-up and corrective action for loans showing signs of deterioration in quality. A loan review program provides the Company with an independent review of the loan portfolio on an ongoing basis. Generally, consumer and residential mortgage loans are included in the Pass categories unless a specific action, such as extended delinquencies, bankruptcy, repossession or death of the borrower occurs, which heightens awareness as to a possible credit event.
Internal loan reviews are completed annually on all commercial relationships with a committed loan balance in excess of $500,000, which includes confirmation of risk rating by an independent credit officer. In addition, all relationships greater than $250,000 rated Substandard, Doubtful or Loss are reviewed quarterly and corresponding risk ratings are reaffirmed by the Company's Problem Loan Committee, with subsequent reporting to the ERM Committee.
71
The following summarizes the Company’s loan portfolio ratings based on its internal risk rating system at December 31, 2017 and 2016:
(Dollars in thousands) | Pass | Special Mention | Non-Impaired Substandard | Impaired - Substandard | Doubtful | Total | |||||||||||||||||
December 31, 2017 | |||||||||||||||||||||||
Commercial real estate: | |||||||||||||||||||||||
Owner-occupied | $ | 113,240 | $ | 413 | $ | 1,921 | $ | 1,237 | $ | 0 | $ | 116,811 | |||||||||||
Non-owner occupied | 235,919 | 0 | 4,507 | 4,065 | 0 | 244,491 | |||||||||||||||||
Multi-family | 48,603 | 4,113 | 753 | 165 | 0 | 53,634 | |||||||||||||||||
Non-owner occupied residential | 76,373 | 142 | 1,084 | 381 | 0 | 77,980 | |||||||||||||||||
Acquisition and development: | |||||||||||||||||||||||
1-4 family residential construction | 11,238 | 0 | 0 | 492 | 0 | 11,730 | |||||||||||||||||
Commercial and land development | 18,635 | 5 | 611 | 0 | 0 | 19,251 | |||||||||||||||||
Commercial and industrial | 113,162 | 2,151 | 0 | 350 | 0 | 115,663 | |||||||||||||||||
Municipal | 42,065 | 0 | 0 | 0 | 0 | 42,065 | |||||||||||||||||
Residential mortgage: | |||||||||||||||||||||||
First lien | 158,673 | 0 | 0 | 3,836 | 0 | 162,509 | |||||||||||||||||
Home equity – term | 11,762 | 0 | 0 | 22 | 0 | 11,784 | |||||||||||||||||
Home equity – lines of credit | 131,585 | 80 | 60 | 467 | 0 | 132,192 | |||||||||||||||||
Installment and other loans | 21,891 | 0 | 0 | 11 | 0 | 21,902 | |||||||||||||||||
$ | 983,146 | $ | 6,904 | $ | 8,936 | $ | 11,026 | $ | 0 | $ | 1,010,012 | ||||||||||||
December 31, 2016 | |||||||||||||||||||||||
Commercial real estate: | |||||||||||||||||||||||
Owner-occupied | $ | 103,652 | $ | 5,422 | $ | 2,151 | $ | 1,070 | $ | 0 | $ | 112,295 | |||||||||||
Non-owner occupied | 190,726 | 4,791 | 10,105 | 736 | 0 | 206,358 | |||||||||||||||||
Multi-family | 42,473 | 4,222 | 787 | 199 | 0 | 47,681 | |||||||||||||||||
Non-owner occupied residential | 59,982 | 949 | 1,150 | 452 | 0 | 62,533 | |||||||||||||||||
Acquisition and development: | |||||||||||||||||||||||
1-4 family residential construction | 4,560 | 103 | 0 | 0 | 0 | 4,663 | |||||||||||||||||
Commercial and land development | 25,435 | 10 | 639 | 1 | 0 | 26,085 | |||||||||||||||||
Commercial and industrial | 87,588 | 251 | 32 | 594 | 0 | 88,465 | |||||||||||||||||
Municipal | 53,741 | 0 | 0 | 0 | 0 | 53,741 | |||||||||||||||||
Residential mortgage: | |||||||||||||||||||||||
First lien | 135,558 | 0 | 0 | 4,293 | 0 | 139,851 | |||||||||||||||||
Home equity – term | 14,155 | 0 | 0 | 93 | 0 | 14,248 | |||||||||||||||||
Home equity – lines of credit | 119,681 | 82 | 61 | 529 | 0 | 120,353 | |||||||||||||||||
Installment and other loans | 7,112 | 0 | 0 | 6 | 0 | 7,118 | |||||||||||||||||
$ | 844,663 | $ | 15,830 | $ | 14,925 | $ | 7,973 | $ | 0 | $ | 883,391 | ||||||||||||
For commercial real estate, acquisition and development and commercial and industrial loans, a loan is considered impaired when, based on current information and events, it is probable that the Company will be unable to collect the scheduled payments of principal or interest when due according to the contractual terms of the loan agreement. Factors considered by management in determining impairment include payment status, collateral value, and the probability of collecting scheduled principal and interest payments when due. Loans that experience insignificant payment delays and payment shortfalls generally are not classified as impaired. Generally, loans that are more than 90 days past due are deemed impaired. Management determines the significance of payment delays and payment shortfalls on a case-by-case basis, taking into consideration all of the circumstances surrounding the loan and the borrower, including the length of the delay, the reasons for the delay, the borrower’s prior payment record, and the amount of the shortfall in relation to the principal and interest owed to determine if
72
the loan should be placed on nonaccrual status. Nonaccrual loans in the commercial and commercial real estate portfolios and any TDRs are, by definition, deemed to be impaired. Impairment is measured on a loan-by-loan basis for commercial, construction and restructured loans by either the present value of the expected future cash flows discounted at the loan’s effective interest rate, the loan’s obtainable market price, or the fair value of the collateral if the loan is collateral dependent. A loan is collateral dependent if the repayment of the loan is expected to be provided solely by the underlying collateral. For loans that are deemed to be impaired for extended periods of time, periodic updates on fair values are obtained, which may include updated appraisals. Updated fair values are incorporated into the impairment analysis in the next reporting period.
Loan charge-offs, which may include partial charge-offs, are taken on an impaired loan that is collateral dependent if the loan’s carrying balance exceeds its collateral’s appraised value; the loan has been identified as uncollectible; and it is deemed to be a confirmed loss. Typically, impaired loans with a charge-off or partial charge-off will continue to be considered impaired, unless the note is split into two, and management expects the performing note to continue to perform and is adequately secured. The second, or non-performing note, would be charged-off. Generally, an impaired loan with a partial charge-off may continue to have an impairment reserve on it after the partial charge-off, if factors warrant.
At December 31, 2017 and 2016, nearly all of the Company’s impaired loans’ extent of impairment were measured based on the estimated fair value of the collateral securing the loan, except for TDRs. By definition, TDRs are considered impaired. All restructured loans’ impairment were determined based on discounted cash flows for those loans classified as TDRs and still accruing interest. For real estate loans, collateral generally consists of commercial real estate, but in the case of commercial and industrial loans, it could also consist of accounts receivable, inventory, equipment or other business assets. Commercial and industrial loans may also have real estate collateral.
Updated appraisals are generally required every 18 months for classified commercial loans in excess of $250,000. The “as is" value provided in the appraisal is often used as the fair value of the collateral in determining impairment, unless circumstances, such as subsequent improvements, approvals, or other circumstances dictate that another value provided by the appraiser is more appropriate.
Generally, impaired commercial loans secured by real estate, other than performing TDRs, are measured at fair value using certified real estate appraisals that had been completed within the last 18 months. Appraised values are discounted for estimated costs to sell the property and other selling considerations to arrive at the property’s fair value. In those situations in which it is determined an updated appraisal is not required for loans individually evaluated for impairment, fair values are based on one or a combination of approaches. In those situations in which a combination of approaches is considered, the factor that carries the most consideration will be the one management believes is warranted. The approaches are:
• | Original appraisal – if the original appraisal provides a strong loan-to-value ratio (generally 70% or lower) and, after consideration of market conditions and knowledge of the property and area, it is determined by the Credit Administration staff that there has not been a significant deterioration in the collateral value, the original certified appraised value may be used. Discounts as deemed appropriate for selling costs are factored into the appraised value in arriving at fair value. |
• | Discounted cash flows – in limited cases, discounted cash flows may be used on projects in which the collateral is liquidated to reduce the borrowings outstanding, and is used to validate collateral values derived from other approaches. |
Collateral on certain impaired loans is not limited to real estate, and may consist of accounts receivable, inventory, equipment or other business assets. Estimated fair values are determined based on borrowers’ financial statements, inventory ledgers, accounts receivable agings or appraisals from individuals with knowledge in the business. Stated balances are generally discounted for the age of the financial information or the quality of the assets. In determining fair value, liquidation discounts are applied to this collateral based on existing loan evaluation policies.
The Company distinguishes Substandard loans on both an impaired and nonimpaired basis, as it places less emphasis on a loan’s classification, and increased reliance on whether the loan was performing in accordance with the contractual terms. A Substandard classification does not automatically meet the definition of impaired. Loss potential, while existing in the aggregate amount of Substandard loans, does not have to exist in individual extensions of credit classified Substandard. As a result, the Company’s methodology includes an evaluation of certain accruing commercial real estate, acquisition and development and commercial and industrial loans rated Substandard to be collectively, as opposed to individually, evaluated for impairment. Although the Company believes these loans meet the definition of Substandard, they are generally performing and management has concluded that it is likely we will be able to collect the scheduled payments of principal and interest when due according to the contractual terms of the loan agreement.
73
Larger groups of smaller balance homogeneous loans are collectively evaluated for impairment. Generally, the Company does not separately identify individual consumer and residential loans for impairment disclosures, unless such loans are the subject of a restructuring agreement due to financial difficulties of the borrower.
The following table summarizes impaired loans by class, segregated by those for which a specific allowance was required and those for which a specific allowance was not required at December 31, 2017 and 2016. The recorded investment in loans excludes accrued interest receivable due to insignificance. Related allowances established generally pertain to those loans in which loan forbearance agreements were in the process of being negotiated or updated appraisals were pending, and a partial charge-off will be recorded when final information is received.
Impaired Loans with a Specific Allowance | Impaired Loans with No Specific Allowance | ||||||||||||||||||
(Dollars in thousands) | Recorded Investment (Book Balance) | Unpaid Principal Balance (Legal Balance) | Related Allowance | Recorded Investment (Book Balance) | Unpaid Principal Balance (Legal Balance) | ||||||||||||||
December 31, 2017 | |||||||||||||||||||
Commercial real estate: | |||||||||||||||||||
Owner-occupied | $ | 0 | $ | 0 | $ | 0 | $ | 1,237 | $ | 2,479 | |||||||||
Non-owner occupied | 0 | 0 | 0 | 4,065 | 4,856 | ||||||||||||||
Multi-family | 0 | 0 | 0 | 165 | 352 | ||||||||||||||
Non-owner occupied residential | 0 | 0 | 0 | 381 | 669 | ||||||||||||||
Acquisition and development: | |||||||||||||||||||
1-4 family residential construction | 0 | 0 | 0 | 492 | 492 | ||||||||||||||
Commercial and industrial | 0 | 0 | 0 | 350 | 495 | ||||||||||||||
Residential mortgage: | |||||||||||||||||||
First lien | 872 | 872 | 42 | 2,964 | 3,706 | ||||||||||||||
Home equity—term | 0 | 0 | 0 | 22 | 27 | ||||||||||||||
Home equity—lines of credit | 0 | 0 | 0 | 467 | 628 | ||||||||||||||
Installment and other loans | 9 | 9 | 9 | 2 | 33 | ||||||||||||||
$ | 881 | $ | 881 | $ | 51 | $ | 10,145 | $ | 13,737 | ||||||||||
December 31, 2016 | |||||||||||||||||||
Commercial real estate: | |||||||||||||||||||
Owner-occupied | $ | 0 | $ | 0 | $ | 0 | $ | 1,070 | $ | 2,236 | |||||||||
Non-owner occupied | 0 | 0 | 0 | 736 | 1,323 | ||||||||||||||
Multi-family | 0 | 0 | 0 | 199 | 368 | ||||||||||||||
Non-owner occupied residential | 0 | 0 | 0 | 452 | 706 | ||||||||||||||
Acquisition and development: | |||||||||||||||||||
Commercial and land development | 0 | 0 | 0 | 1 | 16 | ||||||||||||||
Commercial and industrial | 0 | 0 | 0 | 594 | 715 | ||||||||||||||
Residential mortgage: | |||||||||||||||||||
First lien | 643 | 643 | 43 | 3,650 | 4,399 | ||||||||||||||
Home equity—term | 0 | 0 | 0 | 93 | 103 | ||||||||||||||
Home equity—lines of credit | 0 | 0 | 0 | 529 | 659 | ||||||||||||||
Installment and other loans | 0 | 0 | 0 | 6 | 34 | ||||||||||||||
$ | 643 | $ | 643 | $ | 43 | $ | 7,330 | $ | 10,559 | ||||||||||
74
The following table summarizes the average recorded investment in impaired loans and related recognized interest income for the years ended December 31, 2017, 2016 and 2015:
2017 | 2016 | 2015 | |||||||||||||||||||||
(Dollars in thousands) | Average Impaired Balance | Interest Income Recognized | Average Impaired Balance | Interest Income Recognized | Average Impaired Balance | Interest Income Recognized | |||||||||||||||||
Commercial real estate: | |||||||||||||||||||||||
Owner-occupied | $ | 1,000 | $ | 6 | $ | 1,758 | $ | 0 | $ | 2,613 | $ | 0 | |||||||||||
Non-owner occupied | 392 | 0 | 6,831 | 0 | 3,470 | 0 | |||||||||||||||||
Multi-family | 182 | 0 | 216 | 0 | 402 | 0 | |||||||||||||||||
Non-owner occupied residential | 418 | 0 | 645 | 0 | 1,020 | 0 | |||||||||||||||||
Acquisition and development: | |||||||||||||||||||||||
1-4 family residential construction | 154 | 0 | 0 | 0 | 0 | 0 | |||||||||||||||||
Commercial and land development | 0 | 0 | 3 | 0 | 266 | 137 | |||||||||||||||||
Commercial and industrial | 413 | 0 | 575 | 0 | 1,208 | 0 | |||||||||||||||||
Residential mortgage: | |||||||||||||||||||||||
First lien | 4,012 | 58 | 4,525 | 33 | 4,644 | 37 | |||||||||||||||||
Home equity – term | 61 | 0 | 98 | 0 | 130 | 0 | |||||||||||||||||
Home equity – lines of credit | 488 | 2 | 455 | 0 | 571 | 0 | |||||||||||||||||
Installment and other loans | 10 | 0 | 12 | 0 | 22 | 0 | |||||||||||||||||
$ | 7,130 | $ | 66 | $ | 15,118 | $ | 33 | $ | 14,346 | $ | 174 | ||||||||||||
The following table presents impaired loans that are TDRs, with the recorded investment at December 31, 2017 and December 31, 2016.
2017 | 2016 | ||||||||||||
(Dollars in thousands) | Number of Contracts | Recorded Investment | Number of Contracts | Recorded Investment | |||||||||
Accruing: | |||||||||||||
Commercial real estate: | |||||||||||||
Owner-occupied | 1 | $ | 52 | 0 | $ | 0 | |||||||
Residential mortgage: | |||||||||||||
First lien | 11 | 1,102 | 8 | 896 | |||||||||
Home equity - lines of credit | 1 | 29 | 1 | 34 | |||||||||
13 | 1,183 | 9 | 930 | ||||||||||
Nonaccruing: | |||||||||||||
Commercial real estate: | |||||||||||||
Owner-occupied | 1 | 57 | 0 | 0 | |||||||||
Residential mortgage: | |||||||||||||
First lien | 8 | 715 | 12 | 1,035 | |||||||||
Installment and other loans | 1 | 3 | 1 | 6 | |||||||||
10 | 775 | 13 | 1,041 | ||||||||||
23 | $ | 1,958 | 22 | $ | 1,971 | ||||||||
There were no restructured loans for the years ended December 31, 2017, 2016, and 2015 that were modified as TDRs within the previous 12 months which were in payment default.
75
The following table presents the number of loans modified, and their pre-modification and post-modification investment balances for the years ended December 31, 2017, 2016, and 2015:
(Dollars in thousands) | Number of Contracts | Pre- Modification Investment Balance | Post- Modification Investment Balance | |||||||
December 31, 2017 | ||||||||||
Commercial real estate: | ||||||||||
Owner occupied | 2 | $ | 119 | $ | 119 | |||||
December 31, 2016 | ||||||||||
Commercial real estate: | ||||||||||
Non-owner occupied | 1 | $ | 6,095 | $ | 6,095 | |||||
Residential mortgage: | ||||||||||
First lien | 2 | 265 | 265 | |||||||
Home equity - lines of credit | 1 | 34 | 34 | |||||||
4 | $ | 6,394 | $ | 6,394 | ||||||
December 31, 2015 | ||||||||||
Residential mortgage: | ||||||||||
First lien | 1 | $ | 59 | $ | 59 | |||||
The loans presented in the table above were considered TDRs a result of the Company agreeing to below market interest rates given the risk of the transaction; allowing the loan to remain on interest only status; or a reduction in interest rates, in order to give the borrowers an opportunity to improve their cash flows. For TDRs in default of their modified terms, impairment is generally determined on a collateral dependent approach, except for accruing residential mortgage TDRs, which are generally on the discounted cash flow approach. Certain loans modified during a period may no longer be outstanding at the end of the period if the loan was paid off.
No additional commitments have been made to borrowers whose loans are considered TDRs.
76
Management further monitors the performance and credit quality of the loan portfolio by analyzing the length of time a portfolio is past due, by aggregating loans based on its delinquencies. The following table presents the classes of loan portfolio summarized by aging categories of performing loans and nonaccrual loans at December 31, 2017 and 2016:
Days Past Due | |||||||||||||||||||||||||||
Current | 30-59 | 60-89 | 90+ (still accruing) | Total Past Due | Non- Accrual | Total Loans | |||||||||||||||||||||
December 31, 2017 | |||||||||||||||||||||||||||
Commercial real estate: | |||||||||||||||||||||||||||
Owner-occupied | $ | 115,605 | $ | 4 | $ | 17 | $ | 0 | $ | 21 | $ | 1,185 | $ | 116,811 | |||||||||||||
Non-owner occupied | 240,426 | 0 | 0 | 0 | 0 | 4,065 | 244,491 | ||||||||||||||||||||
Multi-family | 53,469 | 0 | 0 | 0 | 0 | 165 | 53,634 | ||||||||||||||||||||
Non-owner occupied residential | 77,454 | 145 | 0 | 0 | 145 | 381 | 77,980 | ||||||||||||||||||||
Acquisition and development: | |||||||||||||||||||||||||||
1-4 family residential construction | 11,238 | 0 | 0 | 0 | 0 | 492 | 11,730 | ||||||||||||||||||||
Commercial and land development | 19,226 | 25 | 0 | 0 | 25 | 0 | 19,251 | ||||||||||||||||||||
Commercial and industrial | 115,312 | 1 | 0 | 0 | 1 | 350 | 115,663 | ||||||||||||||||||||
Municipal | 42,065 | 0 | 0 | 0 | 0 | 0 | 42,065 | ||||||||||||||||||||
Residential mortgage: | |||||||||||||||||||||||||||
First lien | 155,387 | 3,333 | 1,055 | 0 | 4,388 | 2,734 | 162,509 | ||||||||||||||||||||
Home equity – term | 11,753 | 9 | 0 | 0 | 9 | 22 | 11,784 | ||||||||||||||||||||
Home equity – lines of credit | 131,208 | 474 | 72 | 0 | 546 | 438 | 132,192 | ||||||||||||||||||||
Installment and other loans | 21,749 | 141 | 1 | 0 | 142 | 11 | 21,902 | ||||||||||||||||||||
$ | 994,892 | $ | 4,132 | $ | 1,145 | $ | 0 | $ | 5,277 | $ | 9,843 | $ | 1,010,012 | ||||||||||||||
December 31, 2016 | |||||||||||||||||||||||||||
Commercial real estate: | |||||||||||||||||||||||||||
Owner-occupied | $ | 111,225 | $ | 0 | $ | 0 | $ | 0 | $ | 0 | $ | 1,070 | $ | 112,295 | |||||||||||||
Non-owner occupied | 205,622 | 0 | 0 | 0 | 0 | 736 | 206,358 | ||||||||||||||||||||
Multi-family | 47,482 | 0 | 0 | 0 | 0 | 199 | 47,681 | ||||||||||||||||||||
Non-owner occupied residential | 62,081 | 0 | 0 | 0 | 0 | 452 | 62,533 | ||||||||||||||||||||
Acquisition and development: | |||||||||||||||||||||||||||
1-4 family residential construction | 4,548 | 115 | 0 | 0 | 115 | 0 | 4,663 | ||||||||||||||||||||
Commercial and land development | 26,084 | 0 | 0 | 0 | 0 | 1 | 26,085 | ||||||||||||||||||||
Commercial and industrial | 87,871 | 0 | 0 | 0 | 0 | 594 | 88,465 | ||||||||||||||||||||
Municipal | 53,741 | 0 | 0 | 0 | 0 | 0 | 53,741 | ||||||||||||||||||||
Residential mortgage: | |||||||||||||||||||||||||||
First lien | 135,499 | 628 | 328 | 0 | 956 | 3,396 | 139,851 | ||||||||||||||||||||
Home equity – term | 14,155 | 0 | 0 | 0 | 0 | 93 | 14,248 | ||||||||||||||||||||
Home equity – lines of credit | 119,733 | 125 | 0 | 0 | 125 | 495 | 120,353 | ||||||||||||||||||||
Installment and other loans | 7,090 | 20 | 2 | 0 | 22 | 6 | 7,118 | ||||||||||||||||||||
$ | 875,131 | $ | 888 | $ | 330 | $ | 0 | $ | 1,218 | $ | 7,042 | $ | 883,391 | ||||||||||||||
77
The Company maintains its ALL at a level management believes adequate for probable incurred credit losses. The ALL is established and maintained through a provision for loan losses charged to earnings. Quarterly, management assesses the adequacy of the ALL utilizing a defined methodology which considers specific credit evaluation of impaired loans as discussed above, past loan loss historical experience, and qualitative factors. Management believes its approach properly addresses relevant accounting guidance for loans individually identified as impaired and for loans collectively evaluated for impairment, and other bank regulatory guidance.
In connection with its quarterly evaluation of the adequacy of the ALL, management reviews its methodology to determine if it properly addresses the current risk in the loan portfolio. For each loan class, general allowances based on quantitative factors, principally historical loss trends, are provided for loans that are collectively evaluated for impairment. An adjustment to historical loss factors may be incorporated for delinquency and other potential risk not elsewhere defined within the ALL methodology.
In addition to this quantitative analysis, adjustments to the ALL requirements are allocated on loans collectively evaluated for impairment based on additional qualitative factors, including:
Nature and Volume of Loans – including loan growth in the current and subsequent quarters based on the Company’s targeted growth and strategic plan, coupled with the types of loans booked based on risk management and credit culture; the number of exceptions to loan policy; and supervisory loan to value exceptions.
Concentrations of Credit and Changes within Credit Concentrations – including the composition of the Company’s overall portfolio makeup and management's evaluation related to concentration risk management and the inherent risk associated with the concentrations identified.
Underwriting Standards and Recovery Practices – including changes to underwriting standards and perceived impact on anticipated losses; trends in the number of exceptions to loan policy; supervisory loan to value exceptions; and administration of loan recovery practices.
Delinquency Trends – including delinquency percentages noted in the portfolio relative to economic conditions; severity of the delinquencies; and whether the ratios are trending upwards or downwards.
Classified Loans Trends – including internal loan ratings of the portfolio; severity of the ratings; whether the loan segment’s ratings show a more favorable or less favorable trend; and underlying market conditions and impact on the collateral values securing the loans.
Experience, Ability and Depth of Management/Lending staff – including the years’ experience of senior and middle management and the lending staff; turnover of the staff; and instances of repeat criticisms of ratings.
Quality of Loan Review – including the years of experience of the loan review staff; in-house versus outsourced provider of review; turnover of staff and the perceived quality of their work in relation to other external information.
National and Local Economic Conditions – including trends in the consumer price index, unemployment rates, the housing price index, housing statistics compared to the prior year, bankruptcy rates, regulatory and legal environment risks and competition.
78
The following table presents activity in the ALL for the years ended December 31, 2017, 2016 and 2015.
Commercial | Consumer | ||||||||||||||||||||||||||||||||||||||
(Dollars in thousands) | Commercial Real Estate | Acquisition and Development | Commercial and Industrial | Municipal | Total | Residential Mortgage | Installment and Other | Total | Unallocated | Total | |||||||||||||||||||||||||||||
December 31, 2017 | |||||||||||||||||||||||||||||||||||||||
Balance, beginning of year | $ | 7,530 | $ | 580 | $ | 1,074 | $ | 54 | $ | 9,238 | $ | 2,979 | $ | 144 | $ | 3,123 | $ | 414 | $ | 12,775 | |||||||||||||||||||
Provision for loan losses | 38 | (167 | ) | 333 | 30 | 234 | 531 | 174 | 705 | 61 | 1,000 | ||||||||||||||||||||||||||||
Charge-offs | (835 | ) | 0 | (85 | ) | 0 | (920 | ) | (180 | ) | (166 | ) | (346 | ) | 0 | (1,266 | ) | ||||||||||||||||||||||
Recoveries | 30 | 4 | 124 | 0 | 158 | 70 | 59 | 129 | 0 | 287 | |||||||||||||||||||||||||||||
Balance, end of year | $ | 6,763 | $ | 417 | $ | 1,446 | $ | 84 | $ | 8,710 | $ | 3,400 | $ | 211 | $ | 3,611 | $ | 475 | $ | 12,796 | |||||||||||||||||||
December 31, 2016 | |||||||||||||||||||||||||||||||||||||||
Balance, beginning of year | $ | 7,883 | $ | 850 | $ | 1,012 | $ | 58 | $ | 9,803 | $ | 2,870 | $ | 121 | $ | 2,991 | $ | 774 | $ | 13,568 | |||||||||||||||||||
Provision for loan losses | 107 | (270 | ) | 129 | (4 | ) | (38 | ) | 532 | 116 | 648 | (360 | ) | 250 | |||||||||||||||||||||||||
Charge-offs | (872 | ) | 0 | (79 | ) | 0 | (951 | ) | (577 | ) | (194 | ) | (771 | ) | 0 | (1,722 | ) | ||||||||||||||||||||||
Recoveries | 412 | 0 | 12 | 0 | 424 | 154 | 101 | 255 | 0 | 679 | |||||||||||||||||||||||||||||
Balance, end of year | $ | 7,530 | $ | 580 | $ | 1,074 | $ | 54 | $ | 9,238 | $ | 2,979 | $ | 144 | $ | 3,123 | $ | 414 | $ | 12,775 | |||||||||||||||||||
December 31, 2015 | |||||||||||||||||||||||||||||||||||||||
Balance, beginning of year | $ | 9,462 | $ | 697 | $ | 806 | $ | 183 | $ | 11,148 | $ | 2,262 | $ | 119 | $ | 2,381 | $ | 1,218 | $ | 14,747 | |||||||||||||||||||
Provision for loan losses | (1,020 | ) | (440 | ) | 249 | (125 | ) | (1,336 | ) | 1,122 | 55 | 1,177 | (444 | ) | (603 | ) | |||||||||||||||||||||||
Charge-offs | (711 | ) | (22 | ) | (115 | ) | 0 | (848 | ) | (592 | ) | (62 | ) | (654 | ) | 0 | (1,502 | ) | |||||||||||||||||||||
Recoveries | 152 | 615 | 72 | 0 | 839 | 78 | 9 | 87 | 0 | 926 | |||||||||||||||||||||||||||||
Balance, end of year | $ | 7,883 | $ | 850 | $ | 1,012 | $ | 58 | $ | 9,803 | $ | 2,870 | $ | 121 | $ | 2,991 | $ | 774 | $ | 13,568 | |||||||||||||||||||
79
The following table summarizes the ending loan balances individually evaluated for impairment based upon loan segment, as well as the related ALL loss allocation for each at December 31, 2017 and 2016:
Commercial | Consumer | ||||||||||||||||||||||||||||||||||||||
(Dollars in thousands) | Commercial Real Estate | Acquisition and Development | Commercial and Industrial | Municipal | Total | Residential Mortgage | Installment and Other | Total | Unallocated | Total | |||||||||||||||||||||||||||||
December 31, 2017 | |||||||||||||||||||||||||||||||||||||||
Loans allocated by: | |||||||||||||||||||||||||||||||||||||||
Individually evaluated for impairment | $ | 5,848 | $ | 492 | $ | 350 | $ | 0 | $ | 6,690 | $ | 4,325 | $ | 11 | $ | 4,336 | $ | 0 | $ | 11,026 | |||||||||||||||||||
Collectively evaluated for impairment | 487,068 | 30,489 | 115,313 | 42,065 | 674,935 | 302,160 | 21,891 | 324,051 | 0 | 998,986 | |||||||||||||||||||||||||||||
$ | 492,916 | $ | 30,981 | $ | 115,663 | $ | 42,065 | $ | 681,625 | $ | 306,485 | $ | 21,902 | $ | 328,387 | $ | 0 | $ | 1,010,012 | ||||||||||||||||||||
Allowance for loan losses allocated by: | |||||||||||||||||||||||||||||||||||||||
Individually evaluated for impairment | $ | 0 | $ | 0 | $ | 0 | $ | 0 | $ | 0 | $ | 42 | $ | 9 | $ | 51 | $ | 0 | $ | 51 | |||||||||||||||||||
Collectively evaluated for impairment | 6,763 | 417 | 1,446 | 84 | 8,710 | 3,358 | 202 | 3,560 | 475 | 12,745 | |||||||||||||||||||||||||||||
$ | 6,763 | $ | 417 | $ | 1,446 | $ | 84 | $ | 8,710 | $ | 3,400 | $ | 211 | $ | 3,611 | $ | 475 | $ | 12,796 | ||||||||||||||||||||
December 31, 2016 | |||||||||||||||||||||||||||||||||||||||
Loans allocated by: | |||||||||||||||||||||||||||||||||||||||
Individually evaluated for impairment | $ | 2,457 | $ | 1 | $ | 594 | $ | 0 | $ | 3,052 | $ | 4,915 | $ | 6 | $ | 4,921 | $ | 0 | $ | 7,973 | |||||||||||||||||||
Collectively evaluated for impairment | 426,410 | 30,747 | 87,871 | 53,741 | 598,769 | 269,537 | 7,112 | 276,649 | 0 | 875,418 | |||||||||||||||||||||||||||||
$ | 428,867 | $ | 30,748 | $ | 88,465 | $ | 53,741 | $ | 601,821 | $ | 274,452 | $ | 7,118 | $ | 281,570 | $ | 0 | $ | 883,391 | ||||||||||||||||||||
Allowance for loan losses allocated by: | |||||||||||||||||||||||||||||||||||||||
Individually evaluated for impairment | $ | 0 | $ | 0 | $ | 0 | $ | 0 | $ | 0 | $ | 43 | $ | 0 | $ | 43 | $ | 0 | $ | 43 | |||||||||||||||||||
Collectively evaluated for impairment | 7,530 | 580 | 1,074 | 54 | 9,238 | 2,936 | 144 | 3,080 | 414 | 12,732 | |||||||||||||||||||||||||||||
$ | 7,530 | $ | 580 | $ | 1,074 | $ | 54 | $ | 9,238 | $ | 2,979 | $ | 144 | $ | 3,123 | $ | 414 | $ | 12,775 | ||||||||||||||||||||
During the year ended December 31, 2016, the Company sold one note of classified loan relationships with an aggregate carrying balance of $5,946,000 to a third party. Cash proceeds totaled $5,100,000. The $846,000 difference between the carrying balances of the note sold and the cash received was recorded as a charge-off to the ALL.
NOTE 5. LOANS TO RELATED PARTIES
Certain directors and executive officers of the Company, including their immediate families and companies in which they have a direct or indirect material interest, were indebted to the Bank. The Company considers these loans to be within the normal course of business. The Company relies on the directors and executive officers for the identification of their associates.
The following table presents activity in loans to related parties during 2017.
(Dollars in thousands) | |||
Balance, beginning of year | $ | 677 | |
New loans | 311 | ||
Repayments | (315 | ) | |
Balance, end of year | $ | 673 | |
80
NOTE 6. PREMISES AND EQUIPMENT
The following table summarizes premises and equipment at December 31.
(Dollars in thousands) | 2017 | 2016 | |||||
Land | $ | 7,664 | $ | 7,717 | |||
Buildings and improvements | 31,154 | 30,626 | |||||
Leasehold improvements | 2,482 | 1,719 | |||||
Furniture and equipment | 22,023 | 21,032 | |||||
Construction in progress | 89 | 68 | |||||
63,412 | 61,162 | ||||||
Less accumulated depreciation and amortization | 28,603 | 26,291 | |||||
$ | 34,809 | $ | 34,871 | ||||
Depreciation expense totaled $2,650,000, $2,311,000, and $2,310,000 for the years ended December 31, 2017, 2016 and 2015.
During 2016, $5,600,000 of premises and equipment, predominantly furniture and equipment, was identified as retired from active use. The Company recorded a loss of $147,000 in connection with this retirement.
The Company leases land and building space associated with certain branch offices, remote automated teller machines, and certain equipment under operating lease agreements which expire at various times through 2027. Rent expense charged to operations in connection with these leases totaled $639,000, $601,000 and $435,000 for the years ended December 31, 2017, 2016 and 2015.
The following table summarizes minimum rental commitments under operating leases with maturities in excess of one year at December 31, 2017.
Due in Years Ending December 31 | |||
(Dollars in thousands) | |||
2018 | $ | 574 | |
2019 | 528 | ||
2020 | 496 | ||
2021 | 334 | ||
2022 | 230 | ||
Thereafter | 474 | ||
$ | 2,636 | ||
NOTE 7. INCOME TAXES
The Company files income tax returns in the U.S. federal jurisdiction, the Commonwealth of Pennsylvania and the State of Maryland. The Company is no longer subject to tax examination by tax authorities for years before 2014.
The following table summarizes income tax expense for years ended December 31.
(Dollars in thousands) | 2017 | 2016 | 2015 | ||||||||
Current expense | $ | 1,260 | $ | 1,498 | $ | 837 | |||||
Deferred expense (benefit) | 443 | (232 | ) | 797 | |||||||
Expense due to enactment of federal tax reform legislation | 2,635 | 0 | 0 | ||||||||
Income tax expense | $ | 4,338 | $ | 1,266 | $ | 1,634 | |||||
81
The following table reconciles the effective income tax rate to the statutory federal rate for years ended December 31.
2017 | 2016 | 2015 | ||||||
Statutory federal tax rate | 34.0 | % | 34.0 | % | 35.0 | % | ||
Increase (decrease) resulting from: | ||||||||
Tax exempt interest income | (13.0 | )% | (16.0 | )% | (11.3 | )% | ||
Earnings from life insurance | (2.4 | )% | (4.7 | )% | (3.8 | )% | ||
Disallowed interest expense | 1.0 | % | 1.0 | % | 0.4 | % | ||
Low-income housing credits and related expense | (4.6 | )% | (7.2 | )% | (5.0 | )% | ||
Regulatory settlement | 0.0 | % | 4.3 | % | 0.0 | % | ||
Change in statutory federal tax rate | 0.0 | % | 2.3 | % | 0.0 | % | ||
Expense due to enactment of federal tax reform legislation | 21.2 | % | 0.0 | % | 0.0 | % | ||
Other | (1.3 | )% | 2.3 | % | 1.9 | % | ||
Effective income tax rate | 34.9 | % | 16.0 | % | 17.2 | % | ||
Income tax expense includes $405,000, $483,000 and $673,000 related to net security gains for the years ended December 31, 2017, 2016, and 2015.
Effective January 1, 2016, the Company changed its statutory federal tax rate from 35% to 34% to reflect its assessment that it will not be in the higher tax bracket. As a result, income tax expense for 2016 increased $185,000 due to the application of the new rate to existing deferred balances.
On December 22, 2017, federal tax reform legislation, commonly referred to as the Tax Cuts and Jobs Act of 2017 (the "Tax Act"), was enacted. Among other things, the Tax Act reduced the Company's statutory federal tax rate from 34% to 21% effective January 1, 2018. As a result, we were required to remeasure, through income tax expense, certain deferred tax assets and liabilities using the enacted rate at which we expect them to be recovered or settled. The remeasurement of our net deferred tax asset resulted in additional federal deferred tax expense of $2,635,000, which is included in total tax expense for 2017. Also on December 22, 2017, the SEC staff issued Staff Accounting Bulletin No. 118 ("SAB 118"), which provided guidance on accounting for the tax effects of the Tax Act. SAB 118 provided for a measurement period that should not extend beyond one year from the Tax Act's enactment date for companies to complete the accounting under ASC 740, Income Taxes. In remeasuring our net deferred tax asset, we estimated the income in 2017 for our limited partnership investments in affordable housing real estate partnerships and interest income on nonperforming loans. Any adjustment between our estimates and the actual amounts determined during the measurement period are not expected to have a material impact to the consolidated financial statements.
The Company's deferred tax assets related to low-income housing credit and alternative minimum tax credit carryforwards were not impacted by the change in statutory tax rate, as they are treated as payments on future federal income taxes due and are not subject to remeasurement. However, the Tax Act did change alternative minimum tax credit carryforwards to be refundable credits. To reflect this change, the Company reclassed its alternative minimum tax credit carryforwards, totaling $5,343,000 at December 31, 2017, from deferred tax assets to other assets in the consolidated balance sheets.
There were no penalties or interest related to income taxes recorded in the income statement for the years ended December 31, 2017, 2016 and 2015 and no amounts accrued for penalties as of December 31, 2017 and 2016.
82
The following table summarizes deferred tax assets and liabilities at December 31.
(Dollars in thousands) | 2017 | 2016 | |||||
Deferred tax assets: | |||||||
Allowance for loan losses | $ | 2,919 | $ | 4,725 | |||
Deferred compensation | 355 | 545 | |||||
Retirement plans and salary continuation | 1,301 | 1,942 | |||||
Share-based compensation | 597 | 583 | |||||
Off-balance sheet reserves | 207 | 313 | |||||
Nonaccrual loan interest | 258 | 370 | |||||
Net unrealized losses on securities available for sale | 0 | 600 | |||||
Goodwill | 39 | 92 | |||||
Bonus accrual | 25 | 236 | |||||
Low-income housing credit carryforward | 2,313 | 1,983 | |||||
Alternative minimum tax credit carryforward | 0 | 4,048 | |||||
Net operating loss carryforward | 0 | 2,520 | |||||
Other | 390 | 479 | |||||
Total deferred tax assets | 8,404 | 18,436 | |||||
Deferred tax liabilities: | |||||||
Depreciation | 488 | 771 | |||||
Net unrealized gains on securities available for sale | 757 | 0 | |||||
Mortgage servicing rights | 536 | 777 | |||||
Purchase accounting adjustments | 251 | 435 | |||||
Other | 122 | 195 | |||||
Total deferred tax liabilities | 2,154 | 2,178 | |||||
Net deferred tax asset, included in Other Assets | $ | 6,250 | $ | 16,258 | |||
At December 31, 2017, the Company has low-income housing credit carryforwards that expire through 2037. Deferred tax assets are recognized for these carryforwards because the benefit is more likely than not to be realized.
NOTE 8. RETIREMENT PLANS
The Company maintains a 401(k) profit-sharing plan for employees who meet the plan's eligibility requirements. Substantially all of the Company’s employees are covered by the plan, which contains limited match or safe harbor provisions. Employer contributions to the plan are based on the performance of the Company and are at the discretion of the Board of Directors. Employer contribution expense totaled $432,000, $334,000 and $361,000 for the years ended December 31, 2017, 2016, and 2015.
The Company has deferred compensation agreements with certain present and former directors, whereby a director or his beneficiaries will receive a monthly retirement benefit beginning at age 65. The arrangement is funded by an amount of life insurance on the participating director, which is calculated to meet the Company’s obligations under the compensation agreement. The cash value of the life insurance policies is an unrestricted asset of the Company. The estimated present value of future benefits to be paid totaled $94,000 and $105,000 at December 31, 2017 and 2016. Expense for this plan totaled $11,000, $12,000 and $12,000 for the years ended December 31, 2017, 2016, and 2015.
The Company also has supplemental discretionary deferred compensation plans for directors and executive officers. The plans are funded annually with director fees and salary reductions which are either placed in a trust account invested by the Bank’s OFA division or recognized as a liability. The trust account balance totaled $1,571,000 and $1,483,000 at December 31, 2017 and 2016 and is offset by other liabilities in the same amount. Expense for these plans totaled $10,000, $15,000 and $30,000, for the years ended December 31, 2017, 2016, and 2015.
In addition, the Company has two supplemental retirement and salary continuation plans for directors and executive officers. These plans are funded with single premium life insurance on the plan participants. The cash value of the life insurance
83
policies is an unrestricted asset of the Company. The estimated present value of future benefits to be paid totaled $6,109,000 and $5,662,000 at December 31, 2017 and 2016. Expense for these plans totaled $739,000, $727,000 and $626,000, for the years ended December 31, 2017, 2016, and 2015.
The Company has promised a continuation of life insurance coverage to certain persons post-retirement. The estimated present value of future benefits to be paid totaled $937,000 and $860,000 at December 31, 2017 and 2016. Expense for this plan totaled $77,000, $61,000 and $129,000 for the years ended December 31, 2017, 2016, and 2015.
Life insurance policy cash values and trust account balances, and estimated present values of future benefits and deferred compensation liabilities, noted above are included in other assets and other liabilities, respectively, on the consolidated balance sheets.
NOTE 9. SHARE-BASED COMPENSATION PLANS
The Company maintains share-based compensation plans under its shareholder-approved 2011 Plan. The purpose of the share-based compensation plans is to provide officers, employees, and non-employee members of the Board of Directors of the Company with additional incentive to further the success of the Company. Under the Plan, 381,920 shares of the common stock of the Company were reserved to be issued. At December 31, 2017, 82,277 shares were available to be issued.
The 2011 Plan incentive awards may consist of grants of incentive stock options, nonqualified stock options, stock appreciation rights, restricted stock, deferred stock units and performance shares. All employees of the Company and its present or future subsidiaries, and members of the Board of Directors of the Company or any subsidiary of the Company, are eligible to participate in the 2011 Plan. The 2011 Plan allows for the Compensation Committee of the Board of Directors to determine the type of incentive to be awarded, its term, manner of exercise, vesting of awards and restrictions on shares. Generally, awards are nonqualified under the IRC, unless the awards are deemed to be incentive awards to employees at the Compensation Committee’s discretion.
The following table presents a summary of nonvested restricted shares activity for 2017.
Shares | Weighted Average Grant Date Fair Value | |||||
Nonvested shares, beginning of year | 227,337 | $ | 16.88 | |||
Granted | 67,753 | 22.52 | ||||
Forfeited | (13,079 | ) | 18.36 | |||
Vested | (13,600 | ) | 17.95 | |||
Nonvested shares, end of year | 268,411 | $ | 18.18 | |||
The following table presents restricted shares compensation expense, with tax benefit information, and fair value of shares vested for the years ended December 31, 2017, 2016, and 2015.
Years Ended December 31, | |||||||||||
(Dollars in thousands) | 2017 | 2016 | 2015 | ||||||||
Restricted share award expense | $ | 1,369 | $ | 941 | $ | 732 | |||||
Restricted share award tax benefit | 465 | 320 | 256 | ||||||||
Fair value of shares vested | 303 | 237 | 43 | ||||||||
At December 31, 2017 and 2016, unrecognized compensation expense related to the share awards totaled $2,035,000, and $2,169,000. The unrecognized compensation expense at December 31, 2017 is expected to be recognized over a weighted-average period of 1.8 years.
84
The following table presents a summary of outstanding stock options activity for 2017.
Shares | Weighted Average Exercise Price | |||||
Outstanding, beginning of year | 80,370 | $ | 27.37 | |||
Forfeited | (1,300 | ) | 21.14 | |||
Expired | (19,487 | ) | 32.33 | |||
Options outstanding and exercisable, end of year | 59,583 | $ | 25.89 | |||
The exercise price of each option equals the market price of the Company’s stock on the grant date. An option’s maximum term is ten years. All options are fully vested upon issuance. The following table presents information pertaining to options outstanding and exercisable at December 31, 2017.
Range of Exercise Prices | Number Outstanding and Exercisable | Weighted Average Remaining Contractual Life (Years) | Weighted Average Exercise Price | ||||||
$21.14 - $24.99 | 33,699 | 2.36 | $ | 21.49 | |||||
$25.00 - $29.99 | 2,792 | 2.25 | 25.76 | ||||||
$30.00 - $34.99 | 15,744 | 0.47 | 30.10 | ||||||
$35.00 - $37.59 | 7,348 | 1.52 | 37.08 | ||||||
$21.14 - $37.59 | 59,583 | 1.75 | $ | 25.89 | |||||
Outstanding and exercisable options had an intrinsic value of $127,000 at December 31, 2017 and $39,000 at December 31, 2016.
The Company maintains an employee stock purchase plan to provide employees of the Company an opportunity to purchase Company common stock. Eligible employees may purchase shares in an amount that does not exceed 10% of their annual salary at the lower of 95% of the fair market value of the shares on the semi-annual offering date, or related purchase date. The Company reserved 350,000 shares of its common stock to be issued under the employee stock purchase plan. At December 31, 2017, 179,372 shares were available to be issued.
The following table presents information for the employee stock purchase plan for the years ended December 31, 2017, 2016 and 2015.
Years Ended December 31, | |||||||||||
(Dollars in thousands except share information) | 2017 | 2016 | 2015 | ||||||||
Shares purchased | 6,632 | 6,334 | 6,305 | ||||||||
Weighted average price of shares purchased | $ | 20.57 | $ | 16.64 | $ | 15.83 | |||||
Compensation expense recognized | 17 | 17 | 8 | ||||||||
Tax benefits | 6 | 6 | 3 | ||||||||
The Company issues new shares or treasury shares, depending on market conditions, in its share-based compensation plans.
85
NOTE 10. DEPOSITS
The following table summarizes deposits by type at December 31.
2017 | 2016 | ||||||
(Dollars in thousands) | |||||||
Noninterest-bearing | $ | 162,343 | $ | 150,747 | |||
NOW and money market | 687,936 | 613,232 | |||||
Savings | 95,148 | 91,706 | |||||
Time (less than $250,000) | 252,200 | 277,899 | |||||
Time ($250,000 or more) | 21,888 | 18,868 | |||||
Total | $ | 1,219,515 | $ | 1,152,452 | |||
The following table summarizes scheduled maturities of time deposits for years ending December 31.
(Dollars in thousands) | |||
2018 | $ | 107,765 | |
2019 | 88,028 | ||
2020 | 71,149 | ||
2021 | 4,547 | ||
2022 | 1,722 | ||
Thereafter | 877 | ||
$ | 274,088 | ||
Brokered time deposits totaled $96,368,000 and $85,994,000 at December 31, 2017 and 2016. Management evaluates brokered deposits as a funding option, taking into consideration regulatory views on such deposits as non-core funding sources. Time deposits that meet or exceed the FDIC limit of $250,000 at December 31, 2017 totaled $21,888,000.
The Company accepts deposits of officers and directors of the Company on the same terms, including interest rates, as those prevailing at the time for comparable transactions with unrelated persons. Deposits of officers and directors and their related interests totaled $3,723,000 and $2,826,000 at December 31, 2017 and 2016.
NOTE 11. SHORT-TERM BORROWINGS
The Company has short-term borrowing capability, including short-term borrowings from the FHLB, federal funds purchased and the FRB discount window.
The following table summarizes the use of these short-term borrowings at and for the years ended December 31.
(Dollars in thousands) | 2017 | 2016 | 2015 | ||||||||
Balance at year-end | $ | 50,000 | $ | 52,000 | $ | 60,000 | |||||
Weighted average interest rate at year-end | 1.21 | % | 0.76 | % | 0.53 | % | |||||
Average balance during the year | $ | 54,610 | $ | 17,841 | $ | 55,106 | |||||
Average interest rate during the year | 1.08 | % | 0.61 | % | 0.43 | % | |||||
Maximum month-end balance during the year | $ | 72,000 | $ | 52,000 | $ | 83,500 | |||||
86
In addition, the Company has repurchase agreements with certain of its deposit customers. The Company is required to hold U.S. Treasury, U.S. Agency or U.S. GSE securities as underlying securities for Repurchase Agreements. The following table summarizes the use of securities sold under agreements to repurchase at and for the years ended December 31.
(Dollars in thousands) | 2017 | 2016 | 2015 | ||||||||
Balance at year-end | $ | 43,576 | $ | 35,864 | $ | 29,156 | |||||
Weighted average interest rate at year-end | 0.56 | % | 0.20 | % | 0.20 | % | |||||
Average balance during the year | $ | 43,205 | $ | 38,546 | $ | 30,156 | |||||
Average interest rate during the year | 0.45 | % | 0.20 | % | 0.20 | % | |||||
Maximum month-end balance during the year | $ | 55,270 | $ | 52,693 | $ | 37,558 | |||||
Fair value of securities underlying the agreements at year-end | 53,485 | 56,201 | 35,470 | ||||||||
Federal funds purchased and securities sold under agreements to repurchase generally mature within one day from the transaction date.
NOTE 12. LONG-TERM DEBT
At December 31, the Company’s long-term debt consisted of the following:
Amount | Weighted Average rate | ||||||||||||
(Dollars in thousands) | 2017 | 2016 | 2017 | 2016 | |||||||||
FHLB fixed rate advances maturing: | |||||||||||||
2017 | $ | 0 | $ | 20,000 | 0.00 | % | 1.00 | % | |||||
2019 | 40,000 | 0 | 1.86 | % | 0.00 | % | |||||||
2020 | 40,350 | 350 | 1.76 | % | 7.40 | % | |||||||
80,350 | 20,350 | 1.81 | % | 1.11 | % | ||||||||
FHLB amortizing advance requiring monthly principal and interest payments, maturing: | |||||||||||||
2025 | 3,465 | 3,813 | 4.74 | % | 4.74 | % | |||||||
Total FHLB Advances | $ | 83,815 | $ | 24,163 | 1.93 | % | 1.68 | % | |||||
Except for amortizing advances, interest only is paid on a quarterly basis.
The following table summarizes the aggregate amount of future principal payments required on these borrowings at December 31, 2017:
Years Ending December 31, | |||
(Dollars in thousands) | |||
2018 | $ | 365 | |
2019 | 40,382 | ||
2020 | 40,751 | ||
2021 | 421 | ||
2022 | 441 | ||
Thereafter | 1,455 | ||
$ | 83,815 | ||
The Bank is a member of the FHLB of Pittsburgh and has available the FHLB program of overnight and term advances. Under terms of a blanket collateral agreement for advances, lines and letters of credit from the FHLB, collateral for all outstanding advances, lines and letters of credit consisted of 1-4 family mortgage loans and other real estate secured loans totaling $517,257,000 at December 31, 2017. The Bank had additional availability of $381,892,000 at the FHLB on
87
December 31, 2017 based on its qualifying collateral, net of short-term borrowings and long-term debt detailed above, and non-deposit letters of credit totaling $1,550,000 at December 31, 2017.
The Bank has available unsecured lines of credit, with interest based on the daily Federal Funds rate, with two correspondent banks totaling $30,000,000, at December 31, 2017. The Company also has a $5,000,000 unsecured line of credit, with a bank, at the prime rate of interest, at December 31, 2017. There were no borrowings under these lines of credit at December 31, 2017 and 2016.
NOTE 13. SHAREHOLDERS’ EQUITY AND REGULATORY CAPITAL
The Company maintains a stockholder dividend reinvestment and stock purchase plan. Under the plan, shareholders may purchase additional shares of the Company’s common stock at the prevailing market prices with reinvestment dividends and voluntary cash payments. The Company reserved 1,045,000 shares of its common stock to be issued under the dividend reinvestment and stock purchase plan. At December 31, 2017, approximately 665,000 shares were available to be issued under the plan.
On January 19, 2016, the Company filed a shelf registration statement on Form S-3 with the SEC that provides for up to an aggregate of $100,000,000, through the sale of common stock, preferred stock, warrants, debt securities, and units. To date, the Company has not issued any securities under this shelf registration statement.
Banks and bank holding companies are subject to regulatory capital requirements administered by federal banking agencies. Capital adequacy guidelines and, additionally for banks, prompt corrective action regulations, involve quantitative measures of assets, liabilities and certain off-balance sheet items calculated under regulatory accounting practices. Capital amounts and classifications are also subject to qualitative judgments by regulators. Failure to meet capital requirements can initiate regulatory action. Under the Basel Committee on Banking Supervision's capital guidelines for U.S. Banks ("Basel III rules"), the Company must hold a capital conservation buffer above the adequately capitalized risk-based capital ratios. The required capital conservation buffer for the Company was 0.625% for 2016 and 1.25% for 2017, and will be 1.875% for 2018 and 2.50% for 2019 under phase-in rules. The net unrealized gain or loss on available for sale securities is not included in computing regulatory capital. Management believes the Company and the Bank met all applicable capital adequacy requirements at December 31, 2017 .
Prompt corrective action regulations provide five classifications: well capitalized, adequately capitalized, undercapitalized, significantly undercapitalized and critically undercapitalized, although these terms are not used to represent overall financial condition. If adequately capitalized, regulatory approval is required to accept brokered deposits. If undercapitalized, capital distributions are limited, as is asset growth and expansion, and capital restoration plans are required. At December 31, 2017 and 2016, the most recent regulatory notifications categorized the Bank as well capitalized under the regulatory framework for prompt corrective action. There are no conditions or events since that notification that management believes have changed the Bank's category.
88
The following table presents capital amounts and ratios at December 31, 2017 and December 31, 2016.
Actual | For Capital Adequacy Purposes (includes applicable capital conservation buffer) | To Be Well Capitalized Under Prompt Corrective Action Regulations | ||||||||||||||||||
(Dollars in thousands) | Amount | Ratio | Amount | Ratio | Amount | Ratio | ||||||||||||||
December 31, 2017 | ||||||||||||||||||||
Total Capital to risk weighted assets | ||||||||||||||||||||
Consolidated | $ | 152,386 | 13.3 | % | $ | 106,040 | 9.250 | % | n/a | n/a | ||||||||||
Bank | 148,997 | 13.0 | % | 105,747 | 9.250 | % | $ | 114,321 | 10.0 | % | ||||||||||
Tier 1 Capital to risk weighted assets | ||||||||||||||||||||
Consolidated | 138,774 | 12.1 | % | 83,112 | 7.250 | % | n/a | n/a | ||||||||||||
Bank | 135,385 | 11.8 | % | 82,883 | 7.250 | % | 91,457 | 8.0 | % | |||||||||||
Common Tier 1 (CET1) to risk weighted assets | ||||||||||||||||||||
Consolidated | 138,774 | 12.1 | % | 65,917 | 5.750 | % | n/a | n/a | ||||||||||||
Bank | 135,385 | 11.8 | % | 65,734 | 5.750 | % | 74,308 | 6.5 | % | |||||||||||
Tier 1 Capital to average assets | ||||||||||||||||||||
Consolidated | 138,774 | 8.9 | % | 62,042 | 4.0 | % | n/a | n/a | ||||||||||||
Bank | 135,385 | 8.7 | % | 62,066 | 4.0 | % | 77,582 | 5.0 | % | |||||||||||
December 31, 2016 | ||||||||||||||||||||
Total Capital to risk weighted assets | ||||||||||||||||||||
Consolidated | $ | 139,033 | 14.6 | % | $ | 82,391 | 8.625 | % | n/a | n/a | ||||||||||
Bank | 126,408 | 13.2 | % | 82,328 | 8.625 | % | $ | 95,453 | 10.0 | % | ||||||||||
Tier 1 Capital to risk weighted assets | ||||||||||||||||||||
Consolidated | 127,033 | 13.3 | % | 63,286 | 6.625 | % | n/a | n/a | ||||||||||||
Bank | 114,417 | 12.0 | % | 63,238 | 6.625 | % | 76,363 | 8.0 | % | |||||||||||
Common Tier 1 (CET1) to risk weighted assets | ||||||||||||||||||||
Consolidated | 127,033 | 13.3 | % | 48,957 | 5.125 | % | n/a | n/a | ||||||||||||
Bank | 114,417 | 12.0 | % | 48,920 | 5.125 | % | 62,045 | 6.5 | % | |||||||||||
Tier 1 Capital to average assets | ||||||||||||||||||||
Consolidated | 127,033 | 9.3 | % | 54,453 | 4.0 | % | n/a | n/a | ||||||||||||
Bank | 114,417 | 8.4 | % | 54,500 | 4.0 | % | 68,126 | 5.0 | % | |||||||||||
In September 2015, the Board of Directors of the Company authorized a share repurchase program under which the Company may repurchase up to 5% of the Company's outstanding shares of common stock, or approximately 416,000 shares, in accordance with all applicable securities laws and regulations, including Rule 10b-18 of the Securities Exchange Act of 1934, as amended. When and if appropriate, repurchases may be made in open market or privately negotiated transactions, depending on market conditions, regulatory requirements and other corporate considerations, as determined by management. Share repurchases may not occur and may be discontinued at any time. At December 31, 2017, 82,725 shares had been repurchased under the program at a total cost of $1,438,000, or $17.38 per share.
On January 24, 2018, the Board declared a cash dividend of $0.12 per common share, which was paid on February 9, 2018.
NOTE 14. RESTRICTIONS ON DIVIDENDS, LOANS AND ADVANCES
The Parent Company's principal source of funds for dividend payments is dividends received from the Bank. Banking regulations limit the amount of dividends that may be paid from the Bank to the Parent Company without prior approval of regulatory agencies. Accordingly, at December 31, 2017, $15,875,000 was available for dividend distribution from the Bank to the Parent Company in 2018.
89
Under current Federal Reserve regulations, the Bank is limited in the amount it may lend to the Parent Company and its nonbank subsidiary. Loans to a single affiliate may not exceed 10%, and loans to all affiliates may not exceed 20% of the bank’s capital stock, surplus, and undivided profits, plus the ALL (as defined by regulation). Loans from the Bank to nonbank affiliates, including the Parent Company, are also required to be collateralized according to regulatory guidelines. At December 31, 2017, the maximum amount the Bank has available to loan nonbank affiliates was $14,900,000. At December 31, 2017, there were no loans from the Bank to any nonbank affiliate, including the Parent Company.
NOTE 15. EARNINGS PER SHARE
Earnings per share for the years ended December 31, were as follows:
(In thousands, except per share data) | 2017 | 2016 | 2015 | ||||||||
Net income | $ | 8,090 | $ | 6,628 | $ | 7,874 | |||||
Weighted average shares outstanding - basic | 8,070 | 8,059 | 8,107 | ||||||||
Dilutive effect of share-based compensation | 156 | 86 | 35 | ||||||||
Weighted average shares outstanding - diluted | 8,226 | 8,145 | 8,142 | ||||||||
Per share information: | |||||||||||
Basic earnings per share | $ | 1.00 | $ | 0.82 | $ | 0.97 | |||||
Diluted earnings per share | 0.98 | 0.81 | 0.97 | ||||||||
Average outstanding stock options of 42,000, 90,000 and 109,000 for the years ended December 31, 2017, 2016 and 2015 were not included in the computation of earnings per share because the effect was antidilutive, due to the exercise price exceeding the average market price. The dilutive effect of share-based compensation in each year above relates principally to restricted stock awards.
NOTE 16. FINANCIAL INSTRUMENTS WITH OFF-BALANCE SHEET RISK
The Company is a party to financial instruments with off-balance sheet risk in the normal course of business to meet the financing needs of its customers and to reduce its own exposure to fluctuations in interest rates. These financial instruments include commitments to extend credit and standby letters of credit. Those instruments involve, to varying degrees, elements of credit and interest rate risk in excess of the amount recognized in the consolidated balance sheets. The contract amounts of those instruments reflect the extent of involvement the Company has in particular classes of financial instruments.
The Company’s exposure to credit loss in the event of nonperformance by the other party to the financial instrument for commitments to extend credit and standby letters of credit and financial guarantees written is represented by the contractual amount of those instruments. The Company uses the same credit policies in making commitments and conditional obligations as it does for on-balance sheet instruments. The following table presents these contract, or notional, amounts.
December 31, | |||||||
(Dollars in thousands) | 2017 | 2016 | |||||
Commitments to fund: | |||||||
Home equity lines of credit | $ | 139,281 | $ | 126,811 | |||
1-4 family residential construction loans | 11,420 | 7,820 | |||||
Commercial real estate, construction and land development loans | 44,592 | 43,830 | |||||
Commercial, industrial and other loans | 145,394 | 111,884 | |||||
Standby letters of credit | 12,273 | 7,097 | |||||
Commitments to extend credit are agreements to lend to a customer as long as there is no violation of any condition established in the contract. Commitments generally have fixed expiration dates or other termination clauses and may require payment of a fee. Since many of the commitments are expected to expire without being drawn upon, the total commitment amounts do not necessarily represent future cash requirements. The Company evaluates each customer’s credit-worthiness on a case-by-case basis. The amount of collateral obtained, if deemed necessary by the Company upon extension of credit, is based
90
on management’s credit evaluation of the customer. Collateral varies but may include accounts receivable, inventory, equipment, residential real estate, and income-producing commercial properties.
Standby letters of credit and financial guarantees written are conditional commitments issued by the Company to guarantee the performance of a customer to a third party. Those guarantees are primarily issued to support public and private borrowing arrangements. The credit risk involved in issuing letters of credit is essentially the same as that involved in extending loans to customers. The Company holds collateral supporting those commitments when deemed necessary by management. The liability, at December 31, 2017 and 2016, for guarantees under standby letters of credit issued was not material.
The Company currently maintains a reserve, based on historical loss experience of the related loan class, for off-balance sheet credit exposures that currently are not funded, in other liabilities. This reserve totaled $816,000 and $784,000 at December 31, 2017 and 2016. The following table presents the net amount expensed (recovered) for this off-balance sheet credit exposures reserve.
For the Years Ended December 31, | |||||||||||
(Dollars in thousands) | 2017 | 2016 | 2015 | ||||||||
Off-balance sheet credit exposures expense (recovery) | $ | 32 | $ | 312 | $ | (13 | ) | ||||
The Company sells loans to the FHLB of Chicago as part of its MPF Program. Under the terms of the MPF Program, there is limited recourse back to the Company for loans that do not perform in accordance with the terms of the loan agreement. Each loan that is sold under the program is “credit enhanced” such that the individual loan’s rating is raised to a minimum “BBB,” as determined by the FHLB of Chicago. Outstanding loans sold under the MPF Program totaled $31,977,000 and $35,678,000 at December 31, 2017 and 2016, with limited recourse back to the Company on these loans of $1,135,000 and $1,029,000, respectively. Many of the loans sold under the MPF Program have primary mortgage insurance, which reduces the Company’s overall exposure. The net amount expensed or recovered for the Company's estimate of losses under its recourse exposure for loans foreclosed, or in the process of foreclosure, is recorded in other expenses. The following table presents the net amounts expensed.
For the Years Ended December 31, | |||||||||||
(Dollars in thousands) | 2017 | 2016 | 2015 | ||||||||
MPF program recourse loss expense | $ | 25 | $ | 18 | $ | 127 | |||||
NOTE 17. FAIR VALUE
Fair value is the exchange price that would be received for an asset or paid to transfer a liability (exit price) in the principal or most advantageous market for the asset or liability in an orderly transaction between market participants on the measurement date. Certain financial instruments and all non-financial instruments are excluded from disclosure requirements. Accordingly, the aggregate fair value amounts presented do not represent the underlying value of the Company.
The fair value hierarchy distinguishes between (1) market participant assumptions developed based on market data obtained from independent sources (observable inputs) and (2) an entity's own assumptions about market participant assumptions based on the best information available in the circumstances (unobservable inputs). The fair value hierarchy consists of three broad levels, which gives the highest priority to unadjusted quoted prices in active markets for identical assets or liabilities (Level 1) and the lowest priority to unobservable inputs (Level 3). The three levels of the fair value hierarchy are :
Level 1 – quoted prices (unadjusted) for identical assets or liabilities in active markets that the entity has the ability to access at the measurement date.
Level 2 – significant other observable inputs other than Level 1 prices such as prices for similar assets and liabilities in active markets; quoted prices for identical or similar instruments in markets that are not active; or other inputs that are observable or can be corroborated by observable market data.
Level 3 – at least one significant unobservable input that reflects a company's own assumptions about the assumptions that market participants would use in pricing an asset or liability.
91
In instances in which multiple levels of inputs are used to measure fair value, hierarchy classification is based on the lowest level input that is significant to the fair value measurement in its entirety. The Company's assessment of the significance of a particular input to the fair value measurement in its entirety requires judgment, and considers factors specific to the asset or liability.
The Company used the following methods and significant assumptions to estimate fair value for instruments measured on a recurring basis:
Securities
Where quoted prices are available in an active market, securities are classified within Level 1 of the valuation hierarchy. Level 1 securities include highly liquid government bonds, mortgage products and exchange traded equities. If quoted market prices are not available, securities are classified within Level 2 and fair values are estimated by using pricing models, quoted prices of securities with similar characteristics or discounted cash flow. Level 2 securities include U.S. agency securities, mortgage-backed securities, obligations of states and political subdivisions and certain corporate, asset backed and other securities. In certain cases where there is limited activity or less transparency around inputs to the valuation, securities are classified within Level 3 of the valuation hierarchy. All of the Company’s securities are classified as available for sale.
The Company had no fair value liabilities measured on a recurring basis at December 31, 2017 or 2016. The following table summarizes assets measured at fair value on a recurring basis at December 31, 2017 and December 31, 2016.
(Dollars in Thousands) | Level 1 | Level 2 | Level 3 | Total Fair Value Measurements | |||||||||||
December 31, 2017 | |||||||||||||||
AFS Securities: | |||||||||||||||
States and political subdivisions | $ | 0 | $ | 159,458 | $ | 0 | $ | 159,458 | |||||||
GSE residential MBSs | 0 | 49,530 | 0 | 49,530 | |||||||||||
GSE residential CMOs | 0 | 111,119 | 0 | 111,119 | |||||||||||
Private label residential CMOs | 0 | 1,003 | 0 | 1,003 | |||||||||||
Private label commercial CMOs | 0 | 7,653 | 0 | 7,653 | |||||||||||
Asset-backed | 0 | 86,431 | 0 | 86,431 | |||||||||||
Total debt securities | 0 | 415,194 | 0 | 415,194 | |||||||||||
Equity securities | 0 | 114 | 0 | 114 | |||||||||||
Totals | $ | 0 | $ | 415,308 | $ | 0 | $ | 415,308 | |||||||
December 31, 2016 | |||||||||||||||
AFS Securities: | |||||||||||||||
U.S. Government Agencies | $ | 0 | $ | 39,592 | $ | 0 | $ | 39,592 | |||||||
States and political subdivisions | 0 | 164,282 | 0 | 164,282 | |||||||||||
GSE residential MBSs | 0 | 116,944 | 0 | 116,944 | |||||||||||
GSE residential CMOs | 0 | 69,383 | 0 | 69,383 | |||||||||||
GSE commercial CMOs | 0 | 4,856 | 0 | 4,856 | |||||||||||
Private label residential CMOs | 0 | 5,006 | 0 | 5,006 | |||||||||||
Total debt securities | 0 | 400,063 | 0 | 400,063 | |||||||||||
Equity securities | 0 | 91 | 0 | 91 | |||||||||||
Totals | $ | 0 | $ | 400,154 | $ | 0 | $ | 400,154 | |||||||
Certain financial assets are measured at fair value on a nonrecurring basis. Adjustments to the fair value of these assets usually result from the application of lower-of-cost-or-market accounting or write-downs of individual assets. The Company used the following methods and significant assumptions to estimate fair value for these financial assets.
Impaired Loans
Loans are designated as impaired when, in the judgment of management and based on current information and events, it is probable that all amounts due, according to the contractual terms of the loan agreement, will not be collected. The measurement of loss associated with impaired loans for all loan classes can be based on either the observable market price of the loan, the fair value of the collateral, or discounted cash flows based on a market rate of interest for performing TDRs. For collateral-
92
dependent loans, fair value is measured based on the value of the collateral securing the loan, less estimated costs to sell. Collateral may be in the form of real estate or business assets including equipment, inventory, and accounts receivable. The value of the real estate collateral is determined utilizing an income or market valuation approach based on an appraisal conducted by an independent, licensed appraiser outside of the Company using observable market data (Level 2). However, if the collateral is a house or building in the process of construction, or if management adjusts the appraisal value, then the fair value is considered Level 3. The value of business equipment is based upon an outside appraisal, if deemed significant, or the net book value on the applicable business’ financial statements if not considered significant using observable market data. Likewise, values for inventory and accounts receivable collateral are based on financial statement balances or aging reports (Level 3). Impaired loans with an allocation to the ALL are measured at fair value on a nonrecurring basis. Any fair value adjustments are recorded in the period incurred as provision for loan losses on the consolidated statements of income. Specific allocations to the ALL or partial charge-offs totaled $2,266,000 and $1,967,000 at December 31, 2017 and 2016. Changes in the fair value of impaired loans for those still held at December 31 considered in the determination as to the provision for loan losses, totaled $867,000, $268,000 and $888,000 for the years ended December 31, 2017, 2016, and 2015.
Foreclosed Real Estate
OREO property acquired through foreclosure is initially recorded at the fair value of the property at the transfer date less estimated selling cost. Subsequently, OREO is carried at the lower of its carrying value or the fair value less estimated selling cost. Fair value is usually determined based upon an independent third-party appraisal of the property or occasionally upon a recent sales offer. Specific charges to value OREO at the lower of cost or fair value on properties held at December 31, 2017 and 2016 were $0 and $43,000. Changes in the fair value of foreclosed real estate for those still held at December 31 charged to OREO totaled $0, $43,000, and $32,000 for the years ending December 31, 2017, 2016, and 2015.
The following table summarizes assets measured at fair value on a nonrecurring basis at December 31, 2017 and December 31, 2016.
(Dollars in thousands) | Level 1 | Level 2 | Level 3 | Total Fair Value Measurements | |||||||||||
December 31, 2017 | |||||||||||||||
Impaired Loans | |||||||||||||||
Commercial real estate: | |||||||||||||||
Owner-occupied | $ | 0 | $ | 0 | $ | 430 | $ | 430 | |||||||
Non-owner occupied | 0 | 0 | 4,066 | 4,066 | |||||||||||
Multi-family | 0 | 0 | 165 | 165 | |||||||||||
Non-owner occupied residential | 0 | 0 | 344 | 344 | |||||||||||
Commercial and industrial | 0 | 0 | 53 | 53 | |||||||||||
Residential mortgage: | |||||||||||||||
First lien | 0 | 0 | 1,951 | 1,951 | |||||||||||
Home equity - lines of credit | 0 | 0 | 161 | 161 | |||||||||||
Installment and other loans | 0 | 0 | 3 | 3 | |||||||||||
Total impaired loans | $ | 0 | $ | 0 | $ | 7,173 | $ | 7,173 | |||||||
December 31, 2016 | |||||||||||||||
Impaired loans | |||||||||||||||
Commercial real estate: | |||||||||||||||
Owner-occupied | $ | 0 | $ | 0 | $ | 777 | $ | 777 | |||||||
Non-owner occupied | 0 | 0 | 736 | 736 | |||||||||||
Multi-family | 0 | 0 | 199 | 199 | |||||||||||
Non-owner occupied residential | 0 | 0 | 409 | 409 | |||||||||||
Acquisition and development: | |||||||||||||||
Commercial and land development | 0 | 0 | 1 | 1 | |||||||||||
Commercial and industrial | 0 | 0 | 66 | 66 | |||||||||||
Residential mortgage: | |||||||||||||||
First lien | 0 | 0 | 1,994 | 1,994 | |||||||||||
Home equity - lines of credit | 0 | 0 | 162 | 162 | |||||||||||
Installment and other loans | 0 | 0 | 6 | 6 | |||||||||||
Total impaired loans | $ | 0 | $ | 0 | $ | 4,350 | $ | 4,350 | |||||||
Foreclosed real estate | |||||||||||||||
Residential | $ | 0 | $ | 0 | $ | 88 | $ | 88 | |||||||
93
The following table presents additional qualitative information about assets measured on a nonrecurring basis and for which the Company has utilized Level 3 inputs to determine fair value.
Fair Value Estimate | Valuation Techniques | Unobservable Input | Range | ||||||
December 31, 2017 | |||||||||
Impaired loans | $ | 7,173 | Appraisal of collateral | Management adjustments on appraisals for property type and recent activity | 7% - 75% discount | ||||
- Management adjustments for liquidation expenses | 0% - 20% discount | ||||||||
December 31, 2016 | |||||||||
Impaired loans | $ | 4,350 | Appraisal of collateral | Management adjustments on appraisals for property type and recent activity | 10% - 75% discount | ||||
- Management adjustments for liquidation expenses | 0% - 41% discount | ||||||||
Foreclosed real estate | 88 | Appraisal of collateral | Management adjustments on appraisals for property type and recent activity | 13% - 17% discount | |||||
- Management adjustments for liquidation expenses | 10% - 18% discount | ||||||||
Fair values of financial instruments
In addition to those disclosed above, the Company used the following methods and significant assumptions to estimate fair value for the indicated instruments:
Cash and Due from Banks and Interest-Bearing Deposits with Banks
The carrying amounts of cash and due from banks and interest-bearing deposits with banks approximate fair value.
Loans Held for Sale
LHFS are carried at the lower of cost or fair value. These loans typically consist of one-to-four family residential loans originated for sale into the secondary market. Fair value is based on the price secondary markets are currently offering for similar loans using observable market data which is not materially different than cost due to the short duration between origination and sale.
Loans
For variable rate loans that reprice frequently and have no significant change in credit risk, fair value is based on carrying value. Fair value for fixed rate loans is estimated using discounted cash flow analyses, using interest rates currently being offered in the market for loans with similar terms to borrowers of similar credit quality.
Restricted Investments in Bank Stocks
These investments are carried at cost. The Company is required to maintain minimum investment balances in these stocks, which are not actively traded and therefore have no readily determinable market value.
Deposits
The fair value disclosed for demand deposits is, by definition, equal to the amount payable on demand at the reporting date (that is, the carrying amount). The carrying amount of variable rate, fixed-term money market accounts and certificates of deposit approximates fair value at the reporting date. Fair value for fixed rate certificates of deposits and IRAs are estimated using a discounted cash flow calculation that applies interest rates currently being offered in the market to a schedule of aggregated expected maturities on time deposits.
94
Short-Term Borrowings
The carrying amounts of federal funds purchased; borrowings under Repurchase Agreements; and other short-term borrowings maturing within 90 days approximates fair value. Fair value of other short-term borrowings is estimated using discounted cash flow analysis based on the Company’s current borrowing rates for similar types of borrowing arrangements.
Long-Term Debt
Fair value of the Company’s fixed rate long-term borrowings is estimated using a discounted cash flow analysis based on the Company’s current incremental borrowing rate for similar types of borrowing arrangements. The carrying amounts of variable rate long-term borrowings approximates fair value at the reporting date.
Accrued Interest
The carrying amounts of accrued interest receivable and payable approximate their fair value.
Off-Balance Sheet Instruments
The Company generally does not charge commitment fees. Fees for standby letters of credit and other off-balance sheet instruments are not significant.
95
The following table presents estimated fair values of the Company’s financial instruments at December 31.
(Dollars in thousands) | Carrying Amount | Fair Value | Level 1 | Level 2 | Level 3 | ||||||||||||||
December 31, 2017 | |||||||||||||||||||
Financial Assets | |||||||||||||||||||
Cash and due from banks | $ | 21,734 | $ | 21,734 | $ | 21,734 | $ | 0 | $ | 0 | |||||||||
Interest-bearing deposits with banks | 8,073 | 8,073 | 8,073 | 0 | 0 | ||||||||||||||
Restricted investments in bank stock | 9,997 | n/a | n/a | n/a | n/a | ||||||||||||||
Securities available for sale | 415,308 | 415,308 | 0 | 415,308 | 0 | ||||||||||||||
Loans held for sale | 6,089 | 6,272 | 0 | 6,272 | 0 | ||||||||||||||
Loans, net of allowance for loan losses | 997,216 | 994,617 | 0 | 0 | 994,617 | ||||||||||||||
Accrued interest receivable | 5,048 | 5,048 | 0 | 2,580 | 2,468 | ||||||||||||||
Financial Liabilities | |||||||||||||||||||
Deposits | 1,219,515 | 1,213,288 | 0 | 1,213,288 | 0 | ||||||||||||||
Short-term borrowings | 93,576 | 93,576 | 0 | 93,576 | 0 | ||||||||||||||
Long-term debt | 83,815 | 83,949 | 0 | 83,949 | 0 | ||||||||||||||
Accrued interest payable | 495 | 495 | 0 | 495 | 0 | ||||||||||||||
Off-balance sheet instruments | 0 | 0 | 0 | 0 | 0 | ||||||||||||||
December 31, 2016 | |||||||||||||||||||
Financial Assets | |||||||||||||||||||
Cash and due from banks | $ | 16,072 | $ | 16,072 | $ | 16,072 | $ | 0 | $ | 0 | |||||||||
Interest-bearing deposits with banks | 14,201 | 14,201 | 14,201 | 0 | 0 | ||||||||||||||
Restricted investments in bank stock | 7,970 | n/a | n/a | n/a | n/a | ||||||||||||||
Securities available for sale | 400,154 | 400,154 | 0 | 400,154 | 0 | ||||||||||||||
Loans held for sale | 2,768 | 2,843 | 0 | 2,843 | 0 | ||||||||||||||
Loans, net of allowance for loan losses | 870,616 | 870,470 | 0 | 0 | 870,470 | ||||||||||||||
Accrued interest receivable | 4,672 | 4,672 | 0 | 2,643 | 2,029 | ||||||||||||||
Financial Liabilities | |||||||||||||||||||
Deposits | 1,152,452 | 1,149,727 | 0 | 1,149,727 | 0 | ||||||||||||||
Short-term borrowings | 87,864 | 87,864 | 0 | 87,864 | 0 | ||||||||||||||
Long-term debt | 24,163 | 24,966 | 0 | 24,966 | 0 | ||||||||||||||
Accrued interest payable | 437 | 437 | 0 | 437 | 0 | ||||||||||||||
Off-balance sheet instruments | 0 | 0 | 0 | 0 | 0 | ||||||||||||||
96
NOTE 18. ORRSTOWN FINANCIAL SERVICES, INC. (PARENT COMPANY ONLY) CONDENSED FINANCIAL INFORMATION
Condensed Balance Sheets
December 31, | |||||||
(Dollars in thousands) | 2017 | 2016 | |||||
Assets | |||||||
Cash in Orrstown Bank | $ | 703 | $ | 10,263 | |||
Deposits with other banks | 214 | 307 | |||||
Total cash | 917 | 10,570 | |||||
Securities available for sale | 114 | 91 | |||||
Investment in Orrstown Bank | 140,429 | 121,362 | |||||
Other assets | 3,953 | 3,519 | |||||
Total assets | $ | 145,413 | $ | 135,542 | |||
Liabilities | $ | 648 | $ | 683 | |||
Shareholders’ Equity | |||||||
Common stock | 435 | 437 | |||||
Additional paid-in capital | 125,458 | 124,935 | |||||
Retained earnings | 16,042 | 11,669 | |||||
Accumulated other comprehensive income (loss) | 2,845 | (1,165 | ) | ||||
Treasury stock | (15 | ) | (1,017 | ) | |||
Total shareholders’ equity | 144,765 | 134,859 | |||||
Total liabilities and shareholders’ equity | $ | 145,413 | $ | 135,542 | |||
Condensed Statements of Income
For the Years Ended December 31, | |||||||||||
(Dollars in thousands) | 2017 | 2016 | 2015 | ||||||||
Income | |||||||||||
Dividends from subsidiaries | $ | 0 | $ | 2,200 | $ | 17,900 | |||||
Other interest and dividend income | 15 | 38 | 3 | ||||||||
Other income | 61 | 62 | 35 | ||||||||
Total income | 76 | 2,300 | 17,938 | ||||||||
Expenses | |||||||||||
Share-based compensation | 247 | 216 | 135 | ||||||||
Management fee to Bank | 501 | 504 | 500 | ||||||||
Other expenses | 1,116 | 2,152 | 1,720 | ||||||||
Total expenses | 1,864 | 2,872 | 2,355 | ||||||||
Income (loss) before income tax benefit and equity in undistributed income (distributions in excess of income) of subsidiaries | (1,788 | ) | (572 | ) | 15,583 | ||||||
Income tax benefit | (596 | ) | (606 | ) | (831 | ) | |||||
Income (loss) before equity in undistributed income (distributions in excess of income) of subsidiaries | (1,192 | ) | 34 | 16,414 | |||||||
Equity in undistributed income (distributions in excess of income) of subsidiaries | 9,282 | 6,594 | (8,540 | ) | |||||||
Net income | $ | 8,090 | $ | 6,628 | $ | 7,874 | |||||
97
Condensed Statements of Cash Flows
For the Years Ended December 31, | |||||||||||
(Dollars in thousands) | 2017 | 2016 | 2015 | ||||||||
Cash flows from operating activities: | |||||||||||
Net income | $ | 8,090 | $ | 6,628 | $ | 7,874 | |||||
Adjustments to reconcile net income to cash provided by (used in) operating activities: | |||||||||||
Deferred income taxes | 16 | 4 | (53 | ) | |||||||
Equity in (undistributed income) distributions in excess of income of subsidiaries | (9,282 | ) | (6,594 | ) | 8,540 | ||||||
Share-based compensation | 247 | 216 | 135 | ||||||||
Net change in other liabilities | (35 | ) | (6 | ) | 17 | ||||||
Other, net | (377 | ) | (849 | ) | (712 | ) | |||||
Net cash provided by (used in) operating activities | (1,341 | ) | (601 | ) | 15,801 | ||||||
Cash flows from investing activities: | |||||||||||
Capital contributed to subsidiaries | (6,100 | ) | 0 | 0 | |||||||
Other, net | 0 | (500 | ) | 0 | |||||||
Net cash used in investing activities | (6,100 | ) | (500 | ) | 0 | ||||||
Cash flows from financing activities: | |||||||||||
Dividends paid | (3,488 | ) | (2,898 | ) | (1,822 | ) | |||||
Proceeds from issuance of common stock | 1,276 | 847 | 794 | ||||||||
Payments to repurchase common stock | 0 | (631 | ) | (809 | ) | ||||||
Net cash used in financing activities | (2,212 | ) | (2,682 | ) | (1,837 | ) | |||||
Net increase (decrease) in cash | (9,653 | ) | (3,783 | ) | 13,964 | ||||||
Cash, beginning | 10,570 | 14,353 | 389 | ||||||||
Cash, ending | $ | 917 | $ | 10,570 | $ | 14,353 | |||||
NOTE 19. CONTINGENCIES
The nature of the Company’s business generates a certain amount of litigation involving matters arising out of the ordinary course of business. Except as described below, in the opinion of management, there are no legal proceedings that might have a material effect on the results of operations, liquidity, or the financial position of the Company at this time.
On May 25, 2012, SEPTA filed a putative class action complaint in the U.S. District Court for the Middle District of Pennsylvania against the Company, the Bank and certain current and former directors and executive officers (collectively, the “Defendants”). The complaint alleges, among other things, that (i) in connection with the Company’s Registration Statement on Form S-3 dated February 23, 2010 and its Prospectus Supplement dated March 23, 2010, and (ii) during the purported class period of March 24, 2010 through October 27, 2011, the Company issued materially false and misleading statements regarding the Company’s lending practices and financial results, including misleading statements concerning the stringent nature of the Bank’s credit practices and underwriting standards, the quality of its loan portfolio, and the intended use of the proceeds from the Company’s March 2010 public offering of common stock. The complaint asserts claims under Sections 11, 12(a) and 15 of the Securities Act of 1933, Sections 10(b) and 20(a) of the Securities Exchange Act of 1934 and Rule 10b-5 promulgated thereunder, and seeks class certification, unspecified money damages, interest, costs, fees and equitable or injunctive relief. Under the Private Securities Litigation Reform Act of 1995 (“PSLRA”), motions for appointment of Lead Plaintiff in this case were due by July 24, 2012. SEPTA was the sole movant and the Court appointed SEPTA Lead Plaintiff on August 20, 2012.
Pursuant to the PSLRA and the Court’s September 27, 2012 Order, SEPTA was given until October 26, 2012 to file an amended complaint and the Defendants until December 7, 2012 to file a motion to dismiss the amended complaint. SEPTA’s opposition to the Defendant’s motion to dismiss was originally due January 11, 2013. Under the PSLRA, discovery and all other proceedings in the case were stayed pending the Court’s ruling on the motion to dismiss. The September 27, 2012 Order specified that if the motion to dismiss were denied, the Court would schedule a conference to address discovery and the filing of a motion for class certification. On October 26, 2012, SEPTA filed an unopposed motion for enlargement of time to file its amended complaint in order to permit the parties and new defendants to be named in the amended complaint time to discuss plaintiff’s claims and defendants’ defenses. On October 26, 2012, the Court granted SEPTA’s motion, mooting its September
98
27, 2012 scheduling Order, and requiring SEPTA to file its amended complaint on or before January 16, 2013 or otherwise advise the Court of circumstances that require a further enlargement of time. On January 14, 2013, the Court granted SEPTA’s second unopposed motion for enlargement of time to file an amended complaint on or before March 22, 2013.
On March 4, 2013, SEPTA filed an amended complaint. The amended complaint expands the list of defendants in the action to include the Company’s independent registered public accounting firm and the underwriters of the Company’s March 2010 public offering of common stock. In addition, among other things, the amended complaint extends the purported 1934 Exchange Act class period from March 15, 2010 through April 5, 2012. Pursuant to the Court’s March 28, 2013 Second Scheduling Order, on May 28, 2013 all defendants filed their motions to dismiss the amended complaint, and on July 22, 2013 SEPTA filed its “omnibus” opposition to all of the defendants’ motions to dismiss. On August 23, 2013, all defendants filed reply briefs in further support of their motions to dismiss. On December 5, 2013, the Court ordered oral argument on the Orrstown Defendants’ motion to dismiss the amended complaint to be heard on February 7, 2014. Oral argument on the pending motions to dismiss SEPTA’s amended complaint was held on April 29, 2014.
The Second Scheduling Order stayed all discovery in the case pending the outcome of the motions to dismiss, and informed the parties that, if required, a telephonic conference to address discovery and the filing of SEPTA’s motion for class certification would be scheduled after the Court’s ruling on the motions to dismiss.
On April 10, 2015, pursuant to Court order, all parties filed supplemental briefs addressing the impact of the U.S. Supreme Court’s March 24, 2015 decision in Omnicare, Inc. v. Laborers District Council Construction Industry Pension Fund on defendants’ motions to dismiss the amended complaint.
On June 22, 2015, in a 96-page Memorandum, the Court dismissed without prejudice SEPTA’s amended complaint against all defendants, finding that SEPTA failed to state a claim under either the Securities Act of 1933, as amended, or the Securities Exchange Act of 1934, as amended. The Court ordered that, within 30 days, SEPTA either seek leave to amend its amended complaint, accompanied by the proposed amendment, or file a notice of its intention to stand on the amended complaint.
On July 22, 2015, SEPTA filed a motion for leave to amend under Local Rule 15.1, and attached a copy of its proposed second amended complaint to its motion. Many of the allegations of the proposed second amended complaint are essentially the same or similar to the allegations of the dismissed amended complaint. The proposed second amended complaint also alleges that the Orrstown Defendants did not publicly disclose certain alleged failures of internal controls over loan underwriting, risk management, and financial reporting during the period 2009 to 2012, in violation of the federal securities laws. On February 8, 2016, the Court granted SEPTA’s motion for leave to amend and SEPTA filed its second amended complaint that same day.
On February 25, 2016, the Court issued a scheduling Order directing: all defendants to file any motions to dismiss by March 18, 2016; SEPTA to file an omnibus opposition to defendants’ motions to dismiss by April 8, 2016; and all defendants to file reply briefs in support of their motions to dismiss by April 22, 2016. Defendants timely filed their motions to dismiss the second amended complaint and the parties filed their briefs in accordance with the Court-ordered schedule, above. The February 25, 2016 Order stays all discovery and other deadlines in the case (including the filing of SEPTA’s motion for class certification) pending the outcome of the motions to dismiss.
The allegations of SEPTA’s proposed second amended complaint disclosed the existence of a confidential, non-public, fact-finding inquiry regarding the Company being conducted by the Commission. As disclosed in the Company’s Form 8-K filed on September 27, 2016, on that date the Company entered into a settlement agreement with the Commission resolving the investigation of accounting and related matters at the Company for the periods ended June 30, 2010, to December 31, 2011. As part of the settlement of the Commission’s administrative proceedings and pursuant to the cease-and-desist order, without admitting or denying the Commission’s findings, the Company, its Chief Executive Officer, its former Chief Financial Officer, its former Executive Vice President and Chief Credit Officer, and its Chief Accounting Officer, agreed to pay civil money penalties to the Commission. The Company agreed to pay a civil money penalty of $1,000,000. The Company had previously established a reserve for that amount which was expensed in the second fiscal quarter of 2016. In the settlement agreement with the Commission, the Company also agreed to cease and desist from committing or causing any violations and any future violations of Securities Act Sections 17(a)(2) and 17(a)(3) and Exchange Act Sections 13(a), 13(b)(2)(A) and 13(b)(2)(B), and Rules 12b-20, 13a-1 and 13a-13 promulgated thereunder.
On September 27, 2016, the Orrstown Defendants filed with the Court a Notice of Subsequent Event in Further Support of their Motion to Dismiss the Second Amended Complaint, regarding the settlement with the SEC. The Notice attached a copy of the SEC’s cease-and-desist order and briefly described what the Company believed were the most salient terms of the neither-admit-nor-deny settlement. On September 29, 2016, SEPTA filed a Response to the Notice, in which SEPTA argued that the settlement with the SEC did not support dismissal of the second amended complaint.
99
On December 7, 2016, the Court issued an Order and Memorandum granting in part and denying in part defendants’ motions to dismiss SEPTA’s second amended complaint. The Court granted the motions to dismiss the Securities Act claims against all defendants, and granted the motions to dismiss the Exchange Act section 10(b) and Rule 10b-5 claims against all defendants except Orrstown Financial Services, Inc., Orrstown Bank, Thomas R. Quinn, Jr., Bradley S. Everly, and Jeffrey W. Embly. The Court also denied the motions to dismiss the Exchange Act section 20(a) claims against Quinn, Everly, and Embly.
On January 31, 2017, the Court entered a Case Management Order establishing the schedule for the litigation and, on August 15, 2017, it entered a revised Order that, among other things, set the following deadlines: all fact discovery closes on March 1, 2018, and SEPTA’s motion for class certification is due the same day; expert merits discovery closes May 30, 2018; summary judgment motions are due by June 26, 2018; the mandatory pretrial and settlement conference is set for December 11, 2018; and trial is scheduled to begin on January 7, 2019.
Document discovery has begun in the case and is ongoing. To date, one deposition, of a non-party, has been concluded.
On December 15, 2017, the Orrstown Defendants and SEPTA exchanged expert reports in opposition to and in support of class certification, respectively. On January 15, 2018, the parties exchanged expert rebuttal reports. SEPTA’s motion for class certification was due March 1, 2018, with the Orrstown Defendants’ opposition due April 2, 2018, and SEPTA’s reply due April 23, 2018.
On February 9, 2018, SEPTA filed a Status Report and Request for a Telephonic Status Conference asking the Court to convene a conference to discuss the status of discovery in the case and possible revisions to the case schedule. On February 12, 2018, the Orrstown Defendants filed their status report to provide the Court with a summary of document discovery in the case to date. On February 27, 2018, SEPTA filed an unopposed motion for a continuance of the existing case deadlines pending a status conference with the Court or the issuance of a revised case schedule. On February 28, 2018, the Court issued an Order continuing all case management deadlines until further order of the Court.
The Company believes that the allegations of SEPTA’s second amended complaint are without merit and intends to vigorously defend itself against those claims. It is not possible at this time to estimate reasonably possible losses, or even a range of reasonably possible losses, in connection with the litigation. The Company incurred indemnification costs totaling $645,000 for the year ended December 31, 2017, with several professional service providers in connection with the SEPTA litigation. These costs are included in legal fees in the consolidated statements of income.
100
ITEM 9 – CHANGES IN AND DISAGREEMENTS WITH ACCOUNTANTS ON ACCOUNTING AND FINANCIAL DISCLOSURE
None.
ITEM 9A – CONTROLS AND PROCEDURES
Based on the evaluation required by Securities Exchange Act Rules 13a-15(b) and 15d-15(b), the Company's management, including the Chief Executive Officer and Chief Financial Officer, conducted an evaluation of the effectiveness of disclosure controls and procedures, as defined in Securities Exchange Act Rules 13a-15(e) and 15d-15(e), at December 31, 2017. Based on that evaluation, the Chief Executive Officer and Chief Financial Officer concluded that the disclosure controls and procedures were effective at December 31, 2017. There have been no changes in internal control over financial reporting that have materially affected, or are reasonably likely to materially affect, internal control over financial reporting during the fourth quarter of 2017.
Management's Report on Internal Controls Over Financial Reporting is included in Part II, Item 8, "Financial Statements and Supplementary Data." The effectiveness of the Company's internal control over financial reporting at December 31, 2017 has been audited by Crowe Horwath LLP, an independent registered public accounting firm, as stated in the Report of Independent Registered Public Accounting Firm appearing in Part II, Item 8, "Financial Statements and Supplementary Data."
ITEM 9B – OTHER INFORMATION
None.
PART III
ITEM 10 – DIRECTORS, EXECUTIVE OFFICERS AND CORPORATE GOVERNANCE
The Company has adopted a code of ethics that applies to all senior financial officers (including its chief executive officer, chief financial officer, chief accounting officer, and any person performing similar functions). You can find a copy of the Code of Ethics for Senior Financial Officers by visiting our website at www.orrstown.com and following the links to “Investor Relations” and “Governance Documents.” A copy of the Code of Ethics for Senior Financial Officers may also be obtained, free of charge, by written request to Orrstown Financial Services, Inc., 77 East King Street, PO Box 250, Shippensburg, Pennsylvania 17257, Attention: Secretary. The Company intends to disclose any amendments to or waivers from a provision of the Company’s Code of Ethics for Senior Financial Officers in a timely manner.
All other information required by Item 10 is incorporated by reference from the Company’s definitive proxy statement for the 2018 Annual Meeting of Shareholders filed pursuant to Regulation 14A, under Section 16(a) Beneficial Ownership Reporting Compliance and Proposal 1 – Election of Directors – Biographical Summaries of Nominees and Directors; Information About Executive Officers; Involvement in Certain Legal Proceedings; and Proposal 1 – Election of Directors – Nomination of Directors, and Board Structure, Committees and Meeting Attendance.
ITEM 11 – EXECUTIVE COMPENSATION
The information required by Item 11 is incorporated by reference from the Company’s definitive proxy statement for the 2018 Annual Meeting of Shareholders filed pursuant to Regulation 14A, under Proposal 1 – Election of Directors – Compensation of Directors, Compensation Discussion and Analysis, Compensation Committee Report, Executive Compensation Tables, Potential Payments Upon Termination or Change in Control and Compensation Committee Interlocks and Insider Participation.
101
ITEM 12 – SECURITY OWNERSHIP OF CERTAIN BENEFICIAL OWNERS AND MANAGEMENT AND RELATED STOCKHOLDER MATTERS
The following table presents equity compensation plan information at December 31, 2017.
Plan Category | Number of securities to be issued upon exercise of outstanding options, warrants and rights | Weighted average exercise price of outstanding options, warrants and rights | Number of securities remaining available for future issuance under equity compensation plans (excluding securities reflected in column (a)) | ||||||
(a) | (b) | (c) | |||||||
Equity compensation plan approved by security holders | 49,595 | $ | 25.70 | 82,277 | |||||
Equity compensation plan not approved by security holders (1) | 9,988 | 26.81 | 0 | ||||||
Total | 59,583 | $ | 25.89 | 82,277 | |||||
(1) | Awards from the Non-Employee Director Stock Option Plan of 2000. Certain options granted remain outstanding from this plan, however no additional options will be granted under this plan. |
All other information required by Item 12 is incorporated, by reference, from the Company’s definitive proxy statement for the 2018 Annual Meeting of Shareholders filed pursuant to Regulation 14A, under Share Ownership of Certain Beneficial Owners and Management.
ITEM 13 – CERTAIN RELATIONSHIPS AND RELATED TRANSACTIONS, AND DIRECTOR INDEPENDENCE
The information required by Item 13 is incorporated by reference from the Company’s definitive proxy statement for the 2018 Annual Meeting of Shareholders filed pursuant to Regulation 14A, under Proposal 1 – Election of Directors – Director Independence, and Transactions with Related Persons, Promoters and Certain Control Persons.
ITEM 14 – PRINCIPAL ACCOUNTING FEES AND SERVICES
The information required by Item 14 is incorporated by reference from the Company’s definitive proxy statement for the 2018 Annual Meeting of Shareholders filed pursuant to Regulation 14A, under Proposal 3 – Ratification of the Audit Committee’s Selection of Crowe Horwath LLP as the Company’s Independent Registered Public Accounting Firm for the Fiscal Year Ending December 31, 2018 – Relationship with Independent Registered Public Accounting Firm.
102
PART IV
ITEM 15 – EXHIBITS, FINANCIAL STATEMENT SCHEDULES
(a) | The following documents are filed as part of this report: |
(1) – Financial Statements
Consolidated financial statements of the Company and subsidiaries required in response to this Item are incorporated by reference from Item 8 of this report.
(2) – Financial Statement Schedules
All financial statement schedules for which provision is made in the applicable accounting regulations of the Securities and Exchange Commission are not required under the related instructions or are inapplicable and therefore have been omitted.
(3) – Exhibits
3.1 | ||
3.2 | ||
4.1 | ||
10.1(a) | ||
10.1(b) | ||
10.1(c) | ||
10.1(d) | ||
10.1(e) | ||
10.1(f) | ||
10.1(g) | ||
10.1(h) | ||
10.2(a) | ||
10.2(b) | ||
10.2(c) | ||
10.2(d) | ||
10.3 | ||
10.4(a) | ||
10.4(b) | ||
103
10.4(c) | ||
10.4(d) | ||
10.4(e) | ||
10.4(f) | ||
10.4(g) | ||
10.4(h) | ||
10.5 | ||
10.6 | ||
10.7 | ||
10.8 | ||
10.9(a) | ||
10.9(b) | ||
10.9(c) | ||
10.9(d) | ||
10.9(e) | ||
10.9(f) | ||
10.9(g) | ||
10.10 | ||
10.11 | ||
10.12(a) | ||
10.12(b) | ||
10.14 | ||
14 | Code of Ethics Policy for Senior Financial Officers posted on Registrant’s website. | |
21 | ||
23.1 | ||
31.1 | ||
31.2 | ||
104
101.LAB | XBRL Taxonomy Extension Label Linkbase | |
101.PRE | XBRL Taxonomy Extension Presentation Linkbase | |
101.INS | XBRL Instance Document | |
101.SCH | XBRL Taxonomy Extension Schema | |
101.CAL | XBRL Taxonomy Extension Calculation Linkbase | |
101.DEF | XBRL Taxonomy Extension Definition Linkbase | |
All other exhibits for which provision is made in the applicable accounting regulations of the Securities and Exchange Commission are not required under the related instructions or are inapplicable and therefore have been omitted.
(b) | Exhibits – The exhibits to this Form 10-K begin after the signature page. |
(c) | Financial statement schedules – None required. |
ITEM 16 – FORM 10-K SUMMARY
Not applicable.
105
SIGNATURES
Pursuant to the requirements of Section 13 or 15(d) of the Securities Exchange Act of 1934, the registrant has duly caused this report to be signed on its behalf by the undersigned, thereunto duly authorized.
ORRSTOWN FINANCIAL SERVICES, INC. (Registrant) | |||
Dated: March 9, 2018 | By: | /s/ Thomas R. Quinn, Jr. | |
Thomas R. Quinn, Jr., President and Chief Executive Officer | |||
106
Pursuant to the requirements of Section 13 or 15(d) of the Securities Exchange Act of 1934, this report has been signed below by the following persons on behalf of the registrant and in the capacities and on the dates indicated.
Signature | Title | Date | ||
/s/ Thomas R. Quinn, Jr. | President and Chief Executive Officer (Principal Executive Officer) and Director | March 9, 2018 | ||
Thomas R. Quinn, Jr. | ||||
/s/ David P. Boyle | Executive Vice President and Chief Financial Officer (Principal Financial and Accounting Officer) | March 9, 2018 | ||
David P. Boyle | ||||
/s/ Joel R. Zullinger | Chairman of the Board and Director | March 9, 2018 | ||
Joel R. Zullinger | ||||
/s/ Jeffrey W. Coy | Vice Chairman of the Board and Director | March 9, 2018 | ||
Jeffrey W. Coy | ||||
/s/ Dr. Anthony F. Ceddia | Secretary of the Board and Director | March 9, 2018 | ||
Dr. Anthony F. Ceddia | ||||
/s/ Cindy J. Joiner | Director | March 9, 2018 | ||
Cindy J. Joiner | ||||
/s/ Mark K. Keller | Director | March 9, 2018 | ||
Mark K. Keller | ||||
/s/ Thomas D. Longenecker | Director | March 9, 2018 | ||
Thomas D. Longenecker | ||||
/s/ Andrea Pugh | Director | March 9, 2018 | ||
Andrea Pugh | ||||
/s/ Gregory A. Rosenberry | Director | March 9, 2018 | ||
Gregory A. Rosenberry | ||||
/s/ Eric A. Segal | Director | March 9, 2018 | ||
Eric A. Segal | ||||
/s/ Glenn W. Snoke | Director | March 9, 2018 | ||
Glenn W. Snoke | ||||
/s/ Floyd E. Stoner | Director | March 9, 2018 | ||
Floyd E. Stoner | ||||
107