Attached files
| file | filename |
|---|---|
| EX-10.14 - EXHIBIT 10.14 - GULF ISLAND FABRICATION INC | ex1014firstamendmenttocred.htm |
| EX-32 - EXHIBIT 32 - GULF ISLAND FABRICATION INC | q42017exhibit32.htm |
| EX-31.2 - EXHIBIT 31.2 - GULF ISLAND FABRICATION INC | q42017exhibit312.htm |
| EX-31.1 - EXHIBIT 31.1 - GULF ISLAND FABRICATION INC | q42017exhibit311.htm |
| EX-23.1 - EXHIBIT 23.1 - GULF ISLAND FABRICATION INC | q42017exhibit231.htm |
| EX-10.16 - EXHIBIT 10.16 - GULF ISLAND FABRICATION INC | a1016southtexasoptionagree.htm |
| EX-10.15 - EXHIBIT 10.15 - GULF ISLAND FABRICATION INC | ex1015secondamendmenttocre.htm |
UNITED STATES
SECURITIES AND EXCHANGE COMMISSION
Washington, D.C. 20549
FORM 10-K
(Mark One)
x | Annual Report Pursuant to Section 13 or 15(d) of the Securities Exchange Act of 1934 |
For the fiscal year ended December 31, 2017
or
¨ | Transition Report Pursuant to Section 13 or 15(d) of the Securities Exchange Act of 1934 |
For the transition period from to Commission File Number 001-34279
GULF ISLAND FABRICATION, INC.
(Exact name of registrant as specified in its charter)
Louisiana | 72-1147390 | |
(State or other jurisdiction of incorporation or organization) | (I.R.S. Employer Identification Number) | |
16225 Park Ten Place, Suite 280 Houston, Texas | 77084 | |
(Address of principal executive offices) | (Zip code) | |
(713) 714-6100
(Registrant’s telephone number, including area code)
Securities registered pursuant to Section 12(b) of the Act:
Title of each class | Name of each exchange on which registered | |
Common Stock, no par value | The Nasdaq Stock Market LLC (Nasdaq Global Select Market) | |
Securities registered pursuant to Section 12(g) of the Act:
None
Indicate by check mark if the registrant is a well-known seasoned issuer, as defined in Rule 405 of the Securities Act. Yes ¨ No x
Indicate by check mark if the registrant is not required to file reports pursuant to Section 13 or Section 15(d) of the Act. Yes ¨ No x
Indicate by check mark whether the registrant (1) has filed all reports required to be filed by Section 13 or 15(d) of the Securities Exchange Act of 1934 during the preceding 12 months (or for such shorter period that the registrant was required to file such reports), and (2) has been subject to such filing requirements for the past 90 days. Yes x No ¨
Indicate by check mark whether the registrant has submitted electronically and posted on its corporate website, if any, every Interactive Data File required to be submitted and posted pursuant to Rule 405 of Regulation S-T during the preceding twelve months (or for such shorter period that the registrant was required to submit and post such files). Yes x No ¨
Indicate by check mark if disclosure of delinquent filers pursuant to Item 405 of Regulation S-K is not contained herein, and will not be contained, to the best of registrant’s knowledge, in definitive proxy or information statements incorporated by reference in Part III of this Form 10-K or any amendment to this Form 10-K. ¨
Indicate by check mark whether the registrant is a large accelerated filer, an accelerated filer, a non-accelerated filer, or a smaller reporting company. See definitions of “large accelerated filer,” “accelerated filer” and “smaller reporting company” in Rule 12b-2 of the Exchange Act.
Large accelerated filer ¨ | Accelerated filer x | |
Non-accelerated filer ¨ (Do not check if a smaller reporting company) | Smaller reporting company ¨ | |
Indicate by check mark whether the registrant is a shell company (as defined in Rule 12b-2 of the Act). Yes ¨ No x
The aggregate market value of the voting and non-voting common equity held by non-affiliates of the registrant at June 30, 2017, was approximately $166,411,000.
The number of shares of the registrant’s common stock, no par value per share, outstanding as of March 9, 2018, was 15,043,068.
DOCUMENTS INCORPORATED BY REFERENCE
Portions of the registrant’s definitive Proxy Statement prepared for use in connection with the registrant’s 2018 Annual Meeting of Shareholders have been incorporated by reference into Part III of this Form 10-K.
GULF ISLAND FABRICATION, INC.
ANNUAL REPORT ON FORM 10-K FOR
THE FISCAL YEAR ENDED DECEMBER 31, 2017
TABLE OF CONTENTS
Page | |
i
Cautionary Statement on Forward-Looking Information
This Report on Form 10-K contains forward-looking statements in which we discuss our potential future performance, primarily in the sections entitled “Business and Properties,” “Legal Proceedings,” and “Management’s Discussion and Analysis of Financial Condition and Results of Operations.” Forward-looking statements are all statements other than statements of historical facts, such as projections or expectations relating to oil and gas prices, operating cash flows, capital expenditures, liquidity and tax rates. The words “anticipates,” “may,” “can,” “plans,” “believes,” “estimates,” “expects,” “projects,” “targets,” “intends,” “likely,” “will,” “should,” “to be,” “potential” and any similar expressions are intended to identify those assertions as forward-looking statements.
We caution readers that forward-looking statements are not guarantees of future performance and actual results may differ materially from those anticipated, projected or assumed in the forward-looking statements. Important factors that can cause our actual results to differ materially from those anticipated in the forward-looking statements include the cyclical nature of the oil and gas industry, changes in backlog estimates, suspension or termination of projects, timing and award of new contracts, financial ability of our customers and consolidation of our customers, competitive pricing and cost overruns, entry into new line of business, ability to raise additional capital, ability to sell our South Texas Properties, advancement on the SeaOne Project, ability to negotiate an amendment to the contracts to build two multi-purpose service vessels, ability to remain in compliance with our covenants contained in our credit agreement, credit worthiness of our customers, ability to employ skilled workers, operating dangers and limits on insurance coverage, weather conditions, competition, customer disputes, adjustment to previously reported profits under percentage-of-completion method, loss of key personnel, compliance with regulatory and environmental laws, ability to utilize navigation canals, performance of subcontractors, systems and information technology interruption or failure and data security breaches and other factors described in more detail in “Risk Factors” in Item 1A of this Report on Form 10-K for the year ended December 31, 2017.
Investors are cautioned that many of the assumptions upon which our forward-looking statements are based are likely to change after the forward-looking statements are made, which we cannot control. Further, we may make changes to our business plans that could affect our results. We caution investors that we do not intend to update forward-looking statements more frequently than quarterly notwithstanding any changes in our assumptions, changes in business plans, actual experience or other changes, and we undertake no obligation to update any forward-looking statements.
1
PART I
Items 1 and 2. Business and Properties
Certain technical terms are defined in the “Glossary of Certain Technical Terms” beginning on page G-1.
General
Gulf Island Fabrication, Inc. ("Gulf Island"), a Louisiana corporation incorporated in 1985, and together with its subsidiaries (the "Company," "we" or "our"), is a leading fabricator of complex steel structures and marine vessels used in energy extraction and production, petrochemical and industrial facilities, power generation and alternative energy projects and shipping and marine transportation operations. We also provide related installation, hookup, commissioning, repair and maintenance services with specialized crews and integrated project management capabilities. We are currently fabricating complex modules for the construction of a new petrochemical plant and completing newbuild construction of one technologically-advanced offshore support and two multi-purpose service vessels. During 2015, we fabricated wind turbine pedestals for the first offshore wind power project in the United States. We have also constructed one of the largest liftboats servicing the Gulf of Mexico ("GOM"), one of the deepest production jackets in the GOM and the first SPAR fabricated in the United States. Our customers include U.S. and, to a lesser extent, international energy producers, petrochemical, industrial, power and marine operators. Our corporate headquarters is located in Houston, Texas, with fabrication facilities located in Houma, Jennings and Lake Charles, Louisiana, and Aransas Pass and Ingleside, Texas, each of which are marketed for sale.
Website and Electronic Posting Disclosures
Our website address is www.gulfisland.com. We make available on or through our website, without charge, as soon as reasonably practicable after such materials are electronically filed with or furnished to the Securities and Exchange Commission (“SEC”), our annual reports on Form 10-K, quarterly reports on Form 10-Q, current reports on Form 8-K and amendments to those reports. The SEC also maintains an Internet site that contains periodic reports, proxy and information statements, and other information regarding issuers that file electronically with the SEC. The SEC’s website address is www.sec.gov. Our website and the information contained therein or connected thereto are not intended to be incorporated into this annual report on Form 10-K.
Description of Our Operations
We have structured our operations with three operating divisions and one corporate non-operating division which we believe meet the criteria of reportable segments under generally accepted accounting principles in the United States ("GAAP"). Beginning in December 2017, we created one newly formed operating division which we have named our EPC Division. EPC's operating revenues and expenses for 2017 were immaterial and it held no assets. A description of each of our divisions' operations is discussed below. See Note 13 of the Notes to Consolidated Financial Statements for the operating results and assets for each of our divisions.
Fabrication Division
Our Fabrication Division primarily fabricates structures such as offshore drilling and production platforms and other steel structures for customers in the oil and gas industry including jackets and deck sections of fixed production platforms, hull, tendon, and/or deck sections of floating production platforms (such as TLPs, SPARs, FPSOs and MinDOCs), piles, wellhead protectors, subsea templates, and various production, compressor, and utility modules along with pressure vessels. Our Fabrication Division also fabricates structures for alternative energy customers (such as the five jackets and piles we constructed for the first offshore wind power project in the United States during 2015) as well as modules for petrochemical facilities. We perform these activities out of our fabrication yards in Houma, Louisiana, and formerly out of our fabrication yards in Aransas Pass and Ingleside, Texas, each of which we are marketing for sale.
Shipyard Division
Our Shipyard Division primarily manufactures newbuild and repairs various steel marine vessels in the United States including offshore supply vessels, anchor handling vessels and liftboats to support the construction and ongoing operation of offshore oil and gas production platforms, tug boats, towboats, barges and other marine vessels. We also construct drydocks to lift marine vessels out of the water. Our marine repair activities include steel repair, blasting and painting services, electrical systems repair, machinery and piping system repairs, and propeller, shaft, and rudder reconditioning. In addition, we perform conversion projects that consist of lengthening vessels, modifying vessels to permit their use for a different type of activity, and other modifications to enhance the capacity or functionality of a vessel. We perform these activities out of our shipyards in Houma, Jennings and Lake Charles, Louisiana.
2
Services Division
Our Services Division primarily provides interconnect piping services on offshore platforms and inshore structures along with onshore and offshore scaffolding and piping insulation services. Interconnect piping services involve sending employee crews to offshore platforms in the GOM to perform welding and other activities required to connect production equipment, service modules and other equipment on a platform. We also contract with oil and gas companies that have platforms and other structures located in the inland lakes and bays throughout the southeastern United States for various on-site construction and maintenance activities. In addition, our Services Division fabricates packaged skid units and performs various municipal and drainage projects, such as pump stations, levee reinforcement, bulkheads and other public works projects for state and local governments. We perform these activities at the customer's location or in our yard in Houma, Louisiana.
Corporate Division
Beginning in 2017, management reduced its allocation of corporate administrative costs and overhead expenses to its operating divisions in order to individually evaluate corporate administrative costs and overhead as well as to not overly burden our operating divisions with costs that do not directly relate to their operations. Accordingly, a significant portion of our corporate administrative costs and overhead expenses are retained within the results of our Corporate Division.
EPC Division
Late in the fourth quarter of 2017, SeaOne Caribbean, LLC (“SeaOne”) selected us as the prime contractor for the engineering, procurement, construction, installation, commissioning and start-up, also known as EPCIC/S, for their Compressed Gas Liquids ("CGL") Caribbean Fuels Supply Project (the "SeaOne Project”). This project will include execution of engineering, construction and installation of modules for an export facility in Gulfport, Mississippi, and import facilities in the Caribbean and South America. SeaOne’s selection of our company is non-binding and commencement of the project remains subject to a number of conditions, including agreement on the terms of the engagement with SeaOne. We have created our EPC Division to manage this project and future projects similar to it. We are working to strengthen our internal project management capabilities through the hiring of additional personnel to service this potential project. The SeaOne Project is expected to start during mid-2018 with construction expected to start later in 2018 or early 2019. As of December 31, 2017, this division's revenue and expenses were immaterial and it held no assets.
Facilities and Equipment
We perform all projects at our facilities based on availability of space and equipment. Although our division operations are generally segregated, we move labor and resources among our divisions from time to time to maximize our consolidated profitability.
Fabrication Division Facilities
Houma Fabrication Yard - In Louisiana, our main fabrication yard is located on the Houma Navigation Canal in Houma, Louisiana, approximately 30 miles from the GOM. Our Houma Fabrication Yard includes:
• | 163 acres located on the east bank of the Houma Navigation Canal, of which 100 acres are developed for fabrication, including several buildings totaling 54,000 square feet of administrative offices, 267,000 square feet of covered fabrication area, over 52,300 square feet of warehouse storage area and 8,000 square feet of training and medical facilities. It also has approximately 4,650 linear feet of water frontage, which includes 1,880 feet of steel bulkheads that permit docking of vessels and the load out of heavy structures; and |
• | 437 acres, located on the west bank of the Houma Navigation Canal,130 acres of which are developed for fabrication and over 300 acres of which are unimproved land that could be used for expansion. It includes 6,750 linear feet of water frontage, including 2,350 feet of steel bulkhead, and has approximately 151,600 square feet of covered fabrication area, 21,000 square feet of warehouse storage area, and two buildings providing 8,000 square feet for administrative offices. |
Some of our significant Houma Fabrication Yard equipment that we own and operate includes:
• | three plate bending rolls that have the capability to roll and weld steel into approximately 50,000 tons of tubular pipe sections per year; |
• | computerized Vernon brace coping machines that can handle pipe up to 1,500 pounds per foot and 54-inch outer diameter, and 1,000 pounds per foot and 48-inch outer diameter; |
3
• | a computerized numeric controlled plasma-arc cutting system that cuts and bevels steel up to one inch thick at a rate of 200 inches per minute and can also etch into steel for piece markings and layout markings at a rate of 300 inches per minute; |
• | a state of the art, fully enclosed, and environmentally friendly blast and coating facility that allows us to provide blast and paint services; |
• | 12 crawler cranes, which range in tonnage capacity from 230 to 500 tons each; |
• | 18 rubber-tired, hydraulic modular transporters (KAMAG – Type 2406) that allow fabricated deck sections that weigh as much as 3,600 tons to be transported around our Houma Fabrication Yard when used in tandem. The transporters allow easier load-out of smaller decks and provide more agility for the movement of deck sections. Each of these transporters have a 200-ton weight capacity, are easily relocated, and can be used in tandem; and |
• | two grit blast systems, a hydraulic plate shear, a hydraulic press brake, and various other equipment needed to build offshore structures and fabricate steel components. |
Our Fabrication Facilities in Aransas Pass and Ingleside, Texas:
We have placed our properties and equipment located in Aransas Pass and Ingleside, Texas (collectively, our "South Texas Properties"), up for sale. These properties are underutilized and represent excess capacity within our Fabrication Division. All fabrication activities at our South Texas Properties have ceased and we have re-allocated all remaining backlog from these properties to our Houma Fabrication facilities. We have also reduced our workforce at our South Texas Properties to only those needed for its upkeep as we market them for sale. We do not expect the sale of these properties to impact our ability to service our deepwater customers or operate our Fabrication Division. For additional information, see also "Potential Sale of Our South Texas Properties" in Item 7. Management's Discussion and Analysis and our Risk Factors listed in Item 1A of this Report on Form 10-K. A description of our North Yard in Aransas Pass and our South Yard in Ingleside follows.
North Yard - Our North Yard (the "North Yard") in Aransas Pass, Texas, is located along the U.S. Intracoastal Waterway and is approximately three miles north of the Corpus Christi Ship Channel. This facility is situated on approximately 160 acres, of which 85 acres are dedicated to fabrication activities and 55 acres are used for the storage of steel, prefabricated elements, equipment, and spare parts. Several buildings are located on the North Yard with 328,000 square feet of covered fabrication area, 22,000 square feet of administrative office space, 61,750 square feet of warehouse storage area, 20,000 square feet of climate controlled staging area, a paint booth 16 feet by 14 feet by 125 feet and 16,000 square feet of training and medical facilities. The North Yard also has approximately 3,000 linear feet of water frontage, including approximately 1,000 feet of steel bulkhead. Some of the significant fabrication equipment that we own at the North Yard includes:
• | a pipe mill equipped with a quad roll for diameters ranging from one foot six inches to ten feet, and one large diameter plate bending roll machine; |
• | a quad roll, for diameters ranging from three feet to 23 feet; and |
• | two Romar CNC-controlled flame planers which are used to cut steel plate up to 12 feet wide and 65 feet long. |
South Yard - Our South Yard (the "South Yard") in Ingleside, Texas, consists of approximately 212 acres and includes a fabrication shop with 5,000 square feet of covered fabrication area and 2,700 square feet of training facilities. The South Yard also includes approximately 2,650 linear feet of water frontage, all of which is reinforced by steel bulkhead. In addition, the South Yard contains a graving dock which measures 700 feet long by 250 feet wide and 40 feet deep. The south end of the graving dock, which opens to the Corpus Christi Ship Channel, can use either a removable sheet piled wall supported by steel struts or a portable gate that can be removed and attached to seal the dock from the water in the channel, depending upon the nature of the project. The graving dock gate is a steel barge-like structure consisting of a steel reinforced wall and a buoyancy tank. The floating structure is 240 feet long x 35 feet wide x 40 feet deep.
On December 20, 2017, we granted an exclusive option to a third party for the purchase of our South Yard for a purchase price of $55 million. This option runs through April 25, 2018, which may be extended through May 25, 2018, if proper written notice and additional earnest monies are provided in accordance with the agreement. The terms of the agreement are subject to normal and customary conditions, including the third party's right to conduct inspections of the property related to confirmation of title, surveys, environmental conditions, easements and access rights.
Some of the significant fabrication equipment that we own and have moved from the South Yard to our North Yard or our Houma Fabrication Yard includes:
4
• | a panel line system; and |
• | 10 crawler cranes, which range in tonnage capacity from 230 to 1055 tons. |
Shipyard Division Facilities
Owned Facilities and Equipment:
Houma Shipyard - Our Houma Shipyard shares space with our Houma Fabrication Yard located on the west bank of the Houma Navigation Canal which is described above. We recently increased the lift capacity and length of our Houma drydock used to maintain and repair third party marine vessels as well as to launch vessels from 9,000 tons to 15,000 tons and from 240 feet long to 400 feet long. The drydock is 160 feet wide and 140 feet wide between the wing walls. The bottom is ten feet deep with 30 foot walls.
We own and operate a panel line system at our Houma Shipyard that consists of a fully automated system utilized to cut, weld, and assemble panels to be used in marine vessel construction.
Leased Facilities:
Jennings Shipyard - Our Jennings Shipyard is an 180-acre complex five miles east of Jennings, Louisiana, on the west bank of the Mermentau River approximately 25 miles north of the Intracoastal waterway that we lease from a third party. The Jennings Shipyard includes over 100,000 square feet of covered fabrication area including a panel line, pipe shop and 3,000 feet of water frontage with two launch ways and four covered construction bays. The lease, including exercisable renewal options, extends through January 2045.
Lake Charles Shipyard - Our Lake Charles Shipyard is a ten-acre complex 17 miles from the GOM on the Calcasieu River near Lake Charles, Louisiana, that we sublease from a third party. The Lake Charles Shipyard includes 1,100 feet of bulkhead water frontage with a water depth of 40 feet located one mile from the main ship channel and the Gulf Intracoastal Waterway. The sublease, including exercisable renewal options (subject to sublessor renewals), extends through July 2038.
Former Prospect Shipyard - We formerly leased a 35-acre complex 26 miles from the GOM near Houma, Louisiana, from the former owner of LEEVAC Shipyards, currently one of our Senior Vice Presidents of Business Development. We terminated this lease on December 31, 2017, in accordance with its terms, and we are marketing the remaining assets located at such property for sale. See also Note 4 of the Notes to Consolidated Financial Statements.
We own the machinery and equipment at our leased facilities. These include a plasma cutter installed in 2013, nine track cranes ranging from 65 to 230 tons, four drydocks ranging from 1,500 to 3,500 tons, and a 200-ton module transporter.
Services Division Facilities
Houma Services Yard - Our Houma Services Yard is a 63-acre facility that includes buildings totaling 14,500 square feet of administrative offices, 40,800 square feet of covered fabrication area, 29,600 square feet of warehouse storage area, a 10,000 square foot blasting and coating facility and approximately 1,320 linear feet of water frontage, including 660 feet of steel bulkhead. It is located approximately a quarter of a mile from our Houma Fabrication Yard on a channel adjacent to the Houma Navigation Canal. We own three spud barges for use in connection with our inshore construction activities. Each barge is equipped with a crane with a lifting capacity of 60 to 100 tons. In addition, we own a 26 foot long by 16 foot wide tug boat with two 300 horsepower engines reducing costs on tug boat rentals. We also own nine cranes, which range in tonnage capacity from 60 to 230 tons each.
Materials and Supplies
The principal materials and supplies used in our operations by all of our divisions include standard steel shapes, steel plate, steel pipe, welding gases, fuel, oil, gasoline and paint, all of which are currently available from many sources. We do not depend upon any single supplier or source. Our Shipyard Division uses third parties for the purchase and installation of propulsion systems as well as electrical and communications systems and other equipment. Most of the steel used in our operations arrives at our fabrication yards as steel plate. The plate is cut and rolled into the form needed or into tubular sections at rolling mills in our fabrication yards. Tubular sections (which vary in diameter up to 23 feet) can be welded together in long straight tubes to become legs or into shorter tubes to become part of the network of bracing that support the legs. Various cuts and welds in the fabrication process are performed by computer-controlled equipment that operates from data developed during the design of the structure. We use modern welding and fabrication technology, and all of our projects are manufactured in accordance with industry standards, specifications and regulations, including those published by the American Petroleum Institute, the American Welding Society, the American Society of Mechanical Engineers, the American Bureau of Shipping and the United States Coast Guard. The quality
5
management systems of our operating subsidiaries are certified as ISO 9001-2015 quality assurance programs. For additional information, see “Safety and Quality Assurance” below.
Standard delivery from domestic steel mills takes about about five to six weeks for as-rolled steels versus eight to 12 weeks for heat treated steels. Due to the inability of domestic mills to produce our customers’ required steel grades, we are often forced to procure material from foreign steel mills. The delivery from these foreign mills, including transit time, is currently running approximately sixteen to twenty weeks. To mitigate our risk of increasing cost of materials, we often negotiate escalation clauses in our customer contracts to increase the contract price to offset increases in cost of materials purchased during the life of the contract.
We use third-party manufacturers for propulsion, electrical and communications systems for the vessels constructed by our Shipyard Division. To mitigate our risk of increasing costs, we negotiate and purchase the equipment from the manufacturer at a fixed price.
Safety and Quality Assurance
Management is committed to the safety and health of our employees. We believe that a strong safety culture is a critical element of our success. We continue to improve and maintain a stringent safety assurance program designed to ensure the safety of our employees and allow us to remain in compliance with all applicable federal and state mandated safety regulations. We are committed to maintaining a well trained workforce and providing timely instruction to our workforce to ensure our workers have the knowledge and skills to perform their work safely while maintaining the highest standards of quality possible. We provide continuous quality safety education and training to both employees and subcontractors to ensure our people are ready for the challenges inherent in all fabrication projects. Our employees and subcontractors begin their training on their first day of employment with a comprehensive orientation class that addresses Company policies and procedures and provides clear expectations for working safely. The Company maintains a zero tolerance approach to drugs and alcohol in the workplace. We support this policy through the use of a comprehensive drug and alcohol screening program that includes initial screenings for all employees and periodic random screenings throughout employment. Our employees are given opportunities to be a part of a dedicated safety committee which is comprised of peer-elected craft employees and members of management to assist in supporting our efforts to continuously improve safety performance. Since 2012, a safety component has been included in our annual incentive program guidelines for our executive officers and other key employees.
We fabricate to the standards and regulations of the American Petroleum Institute, the American Welding Society, the American Society of Mechanical Engineers, the American Bureau of Shipping, the United States Coast Guard, the United States Navy and customer specifications. We use welding and fabrication procedures in accordance with the latest technology and industry requirements. We have in place training programs for technical fitting and welding instruction in order to upgrade our skilled labor workforce and maintain high standards of quality. In addition, we maintain on-site facilities for the non-destructive testing of all welds, a process performed by an independent contractor.
Our quality management systems are certified as ISO 9001-2015 programs. ISO 9001-2015 is an internationally recognized verification system for quality management overseen by the International Standard Organization based in Geneva, Switzerland. The certification is based on a review of our programs and procedures designed to maintain and enhance quality production and is subject to semi-annual review and full recertification every three years.
Customers and Contracting
Our principal customers for all of our divisions include large independent oil and gas companies and their contractors, petrochemical companies and marine service companies, offshore support companies, offshore and inland barge and support vessel operators, offshore construction contractors, alternative energy companies (including offshore wind), diving companies, the U.S. Army Corps of Engineers, the U.S. Coast Guard, the U.S. Navy and state and local governmental agencies and their contractors. Our international sales fluctuate from year to year depending on whether and to what extent our customers require installation of fabricated structures outside of the United States. Sales of fabricated structures installed outside the United States comprised between 0.0% and 14.0% of revenue during each of the last five years, and accounted for 0.0%, 14.0%, and 6.0% of revenue for the years ended December 31, 2017, 2016 and 2015, respectively.
A large portion of our revenue has historically been generated by only a few customers, although not necessarily the same customers from year to year. The loss of a significant customer in any given year for any reason, including a sustained decline in that customer’s capital expenditure budget or competitive factors, can result in a substantial loss of revenue and could have a material adverse effect on our operating performance.
We define significant customers as those that individually comprise 10% or more of our revenues. For the year ended December 31, 2017, we had two customers who accounted for 26.9% and 12.7%, of our revenue and related to the fabrication of
6
four modules for one customer associated with an ethane cracker project within our Fabrication Division, and offshore hook-up and installation work for an offshore oil and gas company in our Services Division. For the year ended December 31, 2016 we had one significant customer who accounted for 23.0% and for 2015, we had two significant customers who accounted for 18.0% and 12.0% of our revenue. The shift in the mix of our largest customers from deepwater oil and gas customers to customers within the marine industry is the result of a combination of the reduced capital spending by our offshore oil and gas exploration and production customers and our diversification efforts to capitalize on the expansion of our shipbuilding capabilities following the LEEVAC transaction. See Note 11 of the Notes to Consolidated Financial Statements for a discussion of our LEEVAC transaction.
At December 31, 2017, 73.0% of our remaining backlog consists of work for four customers all within our Shipyard Division and included:
(i) | Two large multi-purpose service vessels for one customer, which commenced in the first quarter of 2014 and will be completed during 2019; |
(ii) | Newbuild construction of four harbor tugs and will be completed in 2018 and 2019; |
(iii) | Newbuild construction of four harbor tugs (separate from above) and will be completed in 2018 and 2019; and |
(iv) | Newbuild construction of an offshore research vessel and will be completed in 2020. |
See further discussion in "Backlog" in "Management's Discussion and Analysis of Financial Condition and Results of Operations" in Item 7 of this Report on Form 10-K. While customers may consider other factors, including the availability, capability, reputation and safety record of a contractor, we believe price and the ability to meet a customer’s delivery schedule are the principal factors weighed by customers in awarding contracts. Our contracts generally vary in length from one to twenty-four months depending on the size and complexity of the project. Generally, our contracts and projects are subject to termination or reduction in scope at any time prior to completion, at the option of the customer. Upon termination or reduction in scope, however, the customer is generally required to pay us for work performed and materials purchased through the date of termination.
Our projects are subject to the same bid procedures and are accounted for using the percentage-of-completion accounting method. Projects are typically awarded on a fixed-price, unit rate, alliance/partnering or cost-plus basis. Under fixed-price contracts, we are entitled to be paid for our work at the price fixed in the contract, subject to adjustment only for change-orders approved by the customer. As a result, we retain all cost savings but are also responsible for all cost overruns. Under a unit rate contract, material items or labor tasks are assigned unit rates of measure. The unit rates of measure will generally be an amount of dollars per ton, per foot, per square foot or per item installed. A typical unit rate contract may contain hundreds to thousands of unit rates of measure. Profit margins are built into the unit rates and, similar to a fixed price contract, we retain all cost savings but are also responsible for all cost overruns. Under typical alliance/partnering arrangements, the parties agree in advance to a target price that includes specified levels of labor and material costs and profit margins. If the project is completed at less cost than that targeted in the contract, the contract price is reduced by a portion of the savings. If the cost of completion is greater than that targeted in the contract, the contract price is increased, but generally to the target price plus the actual incremental cost of materials and direct labor costs. Accordingly, under alliance/partnering arrangements, we have some protection from cost overruns but also share a portion of any cost savings with the customer. Under cost-plus arrangements, pursuant to which we receive a specified fee in excess of our direct labor and material costs, we are protected against cost overruns but do not benefit directly from cost savings. Because we generally price materials as pass-through items on our contracts, the cost of our labor force is the primary factor affecting our operating costs. Consequently, it is essential that we control the cost and productivity of the direct labor hours worked on our projects.
Seasonality
Operations of all of our divisions have historically been subject to seasonal variations in weather conditions and daylight hours. Since most of our construction activities take place outdoors, the number of direct labor hours worked generally declines during the winter months due to an increase in rain, cold temperatures and a decrease in daylight hours. In addition, our oil and gas customers often schedule the completion of their projects during the summer months in order to take advantage of more favorable weather during such months for the installation of their platforms. In recent years, seasonality has had less of an impact on productivity given our covered fabrication areas.
Competition
Our three significant operating divisions are highly competitive and largely influenced by oil and gas prices, which are outside of the control of our customers. We compete intensely for available projects, which are generally awarded on a competitive bid basis with customers usually requesting bids on projects one to three months prior to commencement. Although we believe price and the contractor’s ability to meet a customer’s delivery schedule are the principal factors in determining which fabricator
7
is awarded a project, customers also consider, among other things, the availability of technically capable personnel and facility space, a fabricator’s efficiency, condition of equipment, reputation, safety record and customer relations.
Our competitors are both domestic and abroad. Our Fabrication Division currently has one domestic competitor, Kiewit Offshore Services, Ltd., for the fabrication of deepwater projects such as large topsides and tendons, and our Shipyard Division competes with a number of domestic shipyards along the Gulf Coast including Eastern Group, Inc., Conrad Shipyard, LLC and Thoma-Sea Marine Constructors, LLC. Numerous service companies compete with our Services Divisions for projects. We expect our new EPC Division will face competition with other domestic engineering, procurement and construction companies such as State Services Co., Inc. We also face increasing competition from abroad across all of our divisions. An increasing number of foreign yards, many of which have lower fixed costs than us and our United States competitors, also compete for larger deepwater projects destined for both the GOM and international waters in addition to shipbuilding and other fabrication projects.
We believe that our competitive pricing, expertise in fabricating offshore structures and the certification of our facilities as ISO 9001-2015 fabricators will enable us to continue to compete effectively for projects destined for the GOM and international waters. We recognize, however, that foreign governments often use subsidies and incentives to create local jobs where oil and gas production is being developed. In addition, as a result of recent technological innovations, decreased transportation costs incurred by our customers when exporting structures from foreign locations to the GOM may hinder our ability to successfully bid against foreign competitors for projects. Because of subsidies, import duties and fees, taxes on foreign operators, lower wage rates in foreign countries, fluctuations in the value of the U.S. dollar, the possible imposition of tariffs on raw materials imported into the United States, and other factors, we may not be able to remain competitive with foreign contractors for large deepwater projects.
Government and Environmental Regulation
Many aspects of our operations and properties are materially affected by federal, state and local regulations, as well as certain international conventions and private industry organizations. The exploration and development of oil and gas properties located on the outer continental shelf of the United States is regulated primarily by the Bureau of Ocean Energy, Management and Enforcement (“BOEM”) of the Department of Interior (“DOI”). The Secretary of the Interior, through the BOEM, is responsible for the administration of federal regulations under the Outer Continental Shelf Lands Act requiring the construction of offshore platforms located on the outer continental shelf to meet stringent engineering and construction specifications. Violations of these regulations and related laws can result in substantial civil and criminal penalties as well as injunctions curtailing operations. We believe that our operations are in compliance with these and all other regulations affecting the fabrication of platforms for delivery to the outer continental shelf of the United States. In addition, we depend on the demand for our services from the oil and gas and marine industries and, therefore, can be affected by changes in taxes, price controls and other laws and regulations affecting these industries. Offshore construction and drilling in certain areas has also been opposed by environmental groups and, in certain areas, has been restricted. To the extent laws are enacted or other governmental actions are taken that prohibit or restrict offshore construction and drilling or impose environmental protection requirements that result in increased costs to the oil and gas industry in general and the offshore construction industry in particular, our business and prospects could be adversely affected. We cannot determine to what extent future operations and earnings may be affected by new legislation, new regulations or changes in existing regulations.
The Houma Navigation Canal provides the shortest means of access from our Houma facilities to open waters. With respect to our North and South yards, the U.S. Intracoastal Waterway provides access between our yards. From our South Yard, the Corpus Christi Ship Channel provides access to the GOM. These waterways are considered to be navigable waterways of the United States and, as such, are protected by federal law from unauthorized obstructions that would hinder water-borne traffic. Federal law also authorizes maintenance of these waterways by the U.S. Army Corps of Engineers. These waterways are dredged from time to time to maintain water depth and, while federal funding for dredging has historically been provided, there is no assurance that Congressional appropriations sufficient for adequate dredging and other maintenance of these waterways will be continued indefinitely. See also "Our business is highly dependent on our ability to utilize the navigation canals adjacent to our facilities." in "Risk Factors" in Item 1A of this Report on Form 10-K.
Our operations and properties are subject to a wide variety of increasingly complex and stringent foreign, federal, state and local environmental laws and regulations, including those governing discharges into the air and water, the handling and disposal of solid and hazardous wastes, the remediation of soil and groundwater contaminated by hazardous substances and the health and safety of employees. These laws may provide for “strict liability” for damages to natural resources and threats to public health and safety, rendering a party liable for the environmental damage without regard to negligence or fault on the part of such party. See also "The nature of our industry subjects us to compliance with regulatory and environmental laws." within our Risk Factors listed in Item 1A of this Report on Form 10-K.
The Comprehensive Environmental Response, Compensation, and Liability Act of 1980, as amended and similar laws provide for responses to and liability for releases of hazardous substances into the environment. Additionally, the Clean Air Act, the Clean
8
Water Act, the Resource Conservation and Recovery Act, the Safe Drinking Water Act, the Emergency Planning and Community Right to Know Act, each as amended, and similar foreign, state or local counterparts to these federal laws, regulate air emissions, water discharges, hazardous substances and wastes, and require public disclosure related to the use of various hazardous substances. Compliance with such environmental laws and regulations may require the acquisition of permits or other authorizations for certain activities and compliance with various standards or procedural requirements. We believe that our facilities are in substantial compliance with current regulatory standards.
Our operations are also governed by laws and regulations relating to workplace safety and worker health, primarily the Occupational Safety and Health Act and regulations promulgated thereunder. In addition, various other governmental and quasi-governmental agencies require us to obtain certain permits, licenses and certificates with respect to our operations. The kinds of permits, licenses and certificates required by our operations depend upon a number of factors. We believe that we have all material permits, licenses and certificates necessary for the conduct of our existing business.
Our employees may engage in certain activities, including interconnect piping and other service activities conducted on offshore platforms, activities performed on the spud barges owned or chartered by us, marine vessel fabrication and repair activities performed at our facilities, and operating vessels owned by us, that are covered in either the provisions of the Jones Act or U.S. Longshoreman and Harbor Workers Act (“USL&H”). These laws operate to make the liability limits established under state workers’ compensation laws inapplicable to these employees and, instead, permit them or their representatives to pursue actions against us for damages or job related injuries, with generally no limitations on our potential liability. Our ownership and operation of vessels and our fabrication and repair of customer vessels can give rise to large and varied liability risks, such as risks of collisions with other vessels or structures, sinkings, fires and other marine casualties, which can result in significant claims for damages against us for, among other things, personal injury, death, property damage, pollution and loss of business.
In addition, our operations are subject to extensive government regulation by the United States Coast Guard, as well as various private industry organizations such as the American Petroleum Institute, American Society of Mechanical Engineers, American Welding Society and the American Bureau of Shipping.
Our compliance with these laws and regulations has entailed certain additional expenses and changes in operating procedures; however, we believe that compliance efforts have not resulted in a material adverse effect on our business or financial condition. However, future events, such as changes in existing laws and regulations or their interpretation, more vigorous enforcement policies of regulatory agencies, or stricter or different interpretations of existing laws and regulations, may require additional expenditures by us, which could potentially adversely impact our future results of operations and financial position.
Insurance
We maintain insurance against property damage caused by fire, flood, explosion and similar catastrophic events that may result in physical damage or destruction to our facilities. All policies are subject to deductibles and other coverage limitations. We also maintain a builder’s risk policy for construction projects, general liability insurance and maritime employer’s liability insurance, which are also subject to deductibles and coverage limitations. The Company is self-insured for workers’ compensation and USL&H claims except for losses in excess of a per occurrence threshold amount. Although management believes that our insurance is adequate, there can be no assurance that we will be able to maintain adequate insurance at rates which management considers commercially reasonable, nor can there be any assurance that such coverage will be adequate to cover all claims that may arise.
Employees
Our workforce varies based on the level of ongoing fabrication activity at any particular time. As of December 31, 2017 and 2016, we had approximately 977 and 1,178 employees, respectively. None of our employees are employed pursuant to a collective bargaining agreement, and we believe our relationship with our employees is good. We have reduced our skilled workforce during 2017 in response to decreases in utilization of our facilities. Our productivity and profitability depends substantially on our ability to attract and retain skilled construction workers, primarily welders, fitters and equipment operators. Reductions made in our labor force may make it more difficult for us to increase our labor force to desirable levels during periods of rapid expanding customer demand. Also, when demand for these workers is high, the supply becomes increasingly limited resulting in increased market rates for these workers. During periods of high activity in past years, we have enhanced several incentive programs and expanded our training facility in an effort to maintain our current workforce and attract new employees. See also "We might be unable to employ a sufficient number of skilled workers." in "Risk Factors" in Item 1A of this Report on Form 10-K.
9
Item 1A. Risk Factors
The following discussion of risk factors contains forward-looking statements see "Cautionary Statement on Forward-Looking Information". These risk factors may be important to understanding other statements in this Report on Form 10-K. The following information should be read in conjunction with “Management’s Discussion and Analysis of Financial Condition and Results of Operations” and the consolidated financial statements and related notes found elsewhere in this Report on Form 10-K.
Our business, financial condition and operating results can be affected by a number of factors, whether currently known or unknown, including but not limited to those described below, any one or more of which could, directly or indirectly, cause our actual financial condition and operating results to vary materially those anticipated, projected or assumed in the forward-looking statements. Any of these factors, in whole or in part, could materially and adversely affect our business, prospects, financial condition, results of operations, stock price and cash flows. These could also be affected by additional factors that apply to all companies generally which are not specifically mentioned below.
We are subject to the cyclical nature of the oil and gas industry.
Historically, our business has depended significantly on the level of capital expenditures by offshore oil and gas and marine companies in the GOM and along the Gulf Coast. This level of activity has traditionally been volatile, primarily as a result of fluctuations in oil and gas prices. Oil and gas prices declined significantly beginning in the latter half of 2014 and since then, have not increased to a level that supports a recovery in offshore exploration and production spending. In addition to the price of oil and gas, the levels of our customers’ capital expenditures are influenced by, among other things:
• | the cost of exploring for, producing and delivering oil and gas; |
• | the ability of oil and gas companies to generate capital; |
• | the sale and expiration dates of offshore leases in the United States and overseas; |
• | the discovery rate of new oil and gas reserves in offshore areas; |
• | local, federal and international political and economic conditions; |
• | technological advances; and |
• | uncertainty regarding the United States energy policy, particularly any revision, reinterpretation or creation of environmental and tax laws and regulations that would negatively impact the industry. |
The above factors have not favored increased capital spending by offshore oil and gas companies in recent years. This has created challenges with respect to our ability to operate our fabrication facilities at desired utilization levels throughout 2016 and 2017, resulting in decreased revenue and lower margins. As a result, there are fewer project awards to replace completed projects, and pricing of newer contracts remains increasingly competitive. In addition, we believe that the downturn in the oil and gas industry has also adversely impacted many of our customers' businesses. See also "We depend on significant customers, and we are exposed to the credit risks of our customers, including the nonpayment and nonperformance by our customers."
We are unable to predict future oil and gas prices or the level of oil and gas industry activity in the GOM region. Higher oil and natural gas prices in the future may not necessarily translate into increased activity, and even during periods of relatively high oil prices, our customers may cancel or curtail programs, or reduce their levels of capital expenditures for offshore exploration and production. Advances in onshore exploration and development technologies, particularly with respect to large, onshore shale production areas, could result in our customers allocating a higher percentage of their capital expenditure budgets to onshore exploration and production activities and less to offshore activities. These factors could cause our revenue and margins to remain depressed and limit our future growth prospects and, therefore, could have a material adverse effect on our financial position, results of operations and cash flows.
We may not be able to sell our South Texas Properties and / or any sales we consummate may not produce the desired results.
On December 20, 2017, we granted an exclusive option to a third party for the purchase of our South Yard for a purchase price of $55 million. This option runs through April 25, 2018, which may be extended through May 25, 2018, if proper written notice and additional earnest monies are provided in accordance with the agreement. The terms of the agreement are subject to normal and customary conditions, including the third party's right to conduct inspections of the property related to confirmation of title, surveys, environmental conditions, easements and access rights. See also Note 4 of the Notes to Consolidated Financial Statements. We can provide no assurance that the sale of the South Yard will close as expected or at all. Additionally, we cannot assure you that we will be able to find a buyer for our North Yard and remaining equipment, or that we will realize any anticipated
10
benefits from such sales. Even if we are able to find purchasers, we may not be able to obtain attractive terms and conditions for such sales, including attractive pricing.
The uncertainty associated with the timing of a sale or sales of these assets could negatively affect our short-term liquidity and operating results for the period in which such sales occur if such sales are at a loss. Additionally, any decisions we may make regarding our deployment or use of any sales proceeds we receive in any sale involves risks and uncertainties. As a result, our decisions with respect to such proceeds may not lead to increased long-term stockholder value.
Additionally, our efforts to sell the South Texas Properties expose us to a number of risks, including the diversion of management and employee attention from operation of the business, significant costs and expenses, the loss of customer relationships, the loss of key employees, a decrease in revenue and earnings associated with holding these assets for sale, effects on our reported results of operations from disposition-related charges, and charges for impairment of long-term assets and the disruption of operations.
We may not be able to amend our credit agreement or obtain new debt financing if and when needed with favorable terms, if at all.
Our immediate liquidity remains dependent on our cash on hand, availability of future drawings from our credit agreement and collections of accounts receivable. In the first quarter of 2018, we drew $10 million under our credit agreement and as of March 9, 2018, we had approximately $10 million in cash with approximately $27.5 million in availability under our credit agreement.
On February 26, 2018, the Company entered into a Second Amendment (the "Second Amendment") to our credit agreement with our lending institution, dated June 9, 2017. The Second Amendment lowers the base tangible net worth requirement from $200 million to $185 million in the minimum tangible net worth covenant. In addition, the Second Amendment revises the calculation for the minimum tangible net worth covenant to include 50% of any gain attributable to the sale of our South Texas Properties.
There are a number of potential negative consequences for the energy and energy services sectors that may result if commodity prices remain depressed or decline or if oil and gas companies continue to de-prioritize investments in offshore exploration, development and production, including a general outflow of credit and capital from the energy and energy services sectors and/or offshore focused energy and energy service companies, further efforts by lenders to reduce their loan exposure to the energy sector, the imposition of increased lending standards for the energy and energy services sectors, higher borrowing costs and collateral requirements or a refusal to extend new credit or amend existing credit facilities in the energy and energy services sectors. These potential negative consequences may be exacerbated by the pressure exerted on financial institutions by bank regulatory agencies to respond quickly and decisively to credit risk that develops in distressed industries. All of these factors may complicate our ability to achieve a favorable outcome in negotiating favorable credit solutions.
We may be required to provide collateral, pay higher interest rates and otherwise agree to more restrictive terms in order to secure future amendments to our credit agreement. Future debt financing arrangements, if available at all, may also require collateral, higher interest rates and more restrictive terms. Collateral requirements and higher borrowing costs may limit our long- and short-term financial flexibility, and any failure to obtain amendments to existing debt arrangements or to secure future financing on terms that are acceptable to the Company could jeopardize our ability to (i) fund, among other things, capital expenditures and general working capital needs or (ii) meet our other financial commitments as they come due.
Our credit agreement contains operating and financial restrictions that may restrict our financial and operating flexibility.
The operating and financial restrictions and covenants in our credit agreement and any future financing agreements could restrict our ability to finance future operations or capital needs or to engage, expand or pursue our business activities. For example, our credit agreement restricts our ability to:
• | grant liens; |
• | make certain loans or investments; |
• | incur additional indebtedness or guarantee other indebtedness in excess of specified levels; |
• | make any material change to the nature of our business or undergo a fundamental change; |
• | make any material dispositions; |
• | acquire another company or all or substantially all of its assets; |
• | enter into a merger, consolidation, or sale leaseback transaction; or |
• | declare and pay dividends if any potential default or event of default occurs. |
11
Our ability to comply with the covenants and restrictions contained in our credit agreement may be affected by events beyond our control, including prevailing economic, financial and industry conditions. If market or other economic conditions deteriorate, our ability to comply with these covenants may be impaired. If we breach any of our covenants under our credit agreement, repayment of any amounts borrowed could be accelerated when we potentially would not have the liquidity to do so. If this were to happen, we would be required to seek additional financing at higher capital costs, significantly curtail our operations, defer execution of our strategy, sell assets at discounted prices, or a combination of the above. In addition, our obligations under our credit agreement are secured by substantially all of our assets (other than real estate), and if we are unable to repay our indebtedness under our credit agreement, the lender could seek to foreclose on such assets. See also "Liquidity and Capital Resources" in Item 7 of this Report on Form 10-K.
We may need to raise additional capital in the future for working capital, capital expenditures and/or acquisitions, and we may not be able to do so on favorable terms or at all, which would impair our ability to operate our business or achieve our strategic plan.
If our cash flows from operating activities are not sufficient to fund capital expenditures, we would be required to further reduce these expenditures or to fund capital expenditures through debt or equity issuances or through alternative financing plans or selling assets.
We incurred significant losses during 2017 and cash on hand, as of March 9, 2018, was approximately $10 million. Additionally, we were recently named by SeaOne, as the prime contractor for the SeaOne Project. We have created our EPC Division to manage this project and any future projects that are similar to it. We are working to strengthen our internal project management capabilities through the hiring of additional personnel to service this potential project. Additionally, we may be required to invest capital expenditures related to facility upgrades where we expect to perform a portion of the fabrication of the modules for the SeaOne Project. The timing of capital outlays required by us to execute the anticipated project with SeaOne could exceed the availability under our credit agreement with our lending institution and cash proceeds we expect to receive from the sale of our South Texas Properties. Additionally, we may be awarded other contracts as business activities improve that may require capital above current capacity levels. See also "Executive Overview and Summary" in Item 7 of this Report on Form 10-K.
Accordingly, we may be required to obtain additional financing or conduct equity or debt offerings. Our ability to successfully obtain such additional financing or raise equity or debt capital in the future will depend in part upon prevailing capital market conditions, as well as conditions in our business and our operating results, and those factors may affect our efforts to successfully obtain additional capital on terms that are satisfactory to us. If adequate funds are not available, or are not available on beneficial terms, we may not be able to make future investments, take advantage of acquisitions or other investment opportunities, or respond to competitive challenges. This could limit our ability to bid on new project opportunities, thereby limiting potential growth and profitability within our operating divisions.
We depend on significant customers and we are exposed to the credit risks of our customers, including the nonpayment and nonperformance by our customers.
We derive a significant amount of our revenue from a small number of major and independent oil and gas and marine companies. Because the level of fabrication that we may provide to any particular customer depends, among other things, on the size of that customer’s capital expenditure budget and our ability to meet the customer’s delivery schedule, customers that account for a significant portion of our revenue in one fiscal year may represent an immaterial portion of revenue in subsequent years. We define significant customers as those that individually comprise 10% or more of our revenues. For the year ended December 31, 2017, we had two customers which accounted for 39.6% of our revenue and related to the fabrication of four modules for one customer associated with an ethane cracker project within our Fabrication Division, and offshore hook-up and installation work for an offshore oil and gas company within our Services Division. For the year ended December 31, 2016, we had one significant customer which accounted for 23.0% and for 2015, we had two significant customers which accounted for 18% and 12% of revenue. The loss of a significant customer in any given year for any reason, including a sustained decline in that customer’s capital expenditure budget or competitive factors, can result in a substantial loss of revenue and could have a material adverse effect on our operating performance.
Additionally, our business is subject to risks of loss resulting from nonpayment or nonperformance by our customers. We believe certain of our customers finance their activities through cash flow from operations, the incurrence of debt or the issuance of equity. Many of our customers are facing significant challenges within the current oil and gas market. As a result, many of our customers are facing decreased cash flow, a reduction in borrowing bases and a reduction in their liquidity and ability to pay or otherwise perform on their obligations to us. Furthermore, some of our customers may be highly leveraged and subject to their
12
own operating and regulatory risks, which increases the risk that they may default on their obligations to us. Any increase in the nonpayment and nonperformance by our customers could have an adverse impact on our operating results and could adversely affect our liquidity.
Our customers are facing significant challenges and a period of consolidation within their industry.
The oil and gas industry is facing significant challenges due to the prolonged period of depressed oil and gas prices resulting in significantly decreased revenue, lower margins and decreased cash flows. This has also negatively impacted the marine industry that supports offshore exploration and production. The result is that many companies are unable to compete and, in some cases, unable to pay their liabilities as they become due. This has resulted in many companies within both industries seeking bankruptcy protection and / or seeking consolidation via acquisition by other companies. We expect this trend to continue.
Customers that acquire other companies may reduce capital spending and decrease demand for our products and services, especially if they acquire a company that provides similar services as us. We cannot assure you that we will be able to maintain our level of sales to a customer that has consolidated or replace that revenue with increased business activity with other customers. Acquisition of one or more of our primary customers by a company that is not a customer may also have a significant negative impact on our results of operations, financial position or cash flows. We are unable to predict what effect consolidations in the industry may have on price, capital spending by our customers, our selling strategies, our competitive position, our ability to retain customers or our ability to negotiate favorable agreements with our customers.
Our future results of operations depends upon the award of new contracts and the timing of those awards.
Our revenue is derived primarily from contracts awarded on a project-by-project basis. It is difficult to predict whether or when we will be awarded a new contract due to the complex bidding and selection processes, changes in existing or forecast market conditions, governmental regulations, permitting and environmental matters. Because our revenue is derived from contract awards, our results of operations and cash flows can fluctuate materially from period to period.
The uncertainty associated with the timing of contract awards may reduce our short-term profitability as we balance our current capacity with expectations of future contract awards. If an expected contract award is delayed or not received, we could incur costs to maintain an idle workforce that may have a material adverse effect on our results of operations. Alternatively, we may decide that our long-term interests are best served by reducing our workforce and incurring increased costs associated with termination benefits, which also could have a material adverse effect on our results of operations in the period incurred. Reducing our workforce could also impact our results of operations if customers are hesitant to award new contracts to us based upon our staffing levels or if we are unable to adequately increase our labor force and staff projects that are awarded subsequent to a workforce reduction.
Our backlog is subject to change as a result of changes in management’s estimates, suspension or termination of projects currently in our backlog or our failure to secure additional projects.
Our backlog is based on management’s estimate of the direct labor hours required to complete, and the remaining revenue to be recognized with respect to, customer projects either already in progress or for projects where the customer has authorized us to begin work or purchase materials or services pursuant to written contracts, letters of intent or other forms of authorization. However, as engineering and design plans are finalized or changes to existing plans are made, management’s estimate of the direct labor hours required to complete and the price at completion is likely to change.
All projects currently included in our backlog generally are subject to suspension, termination, or a reduction in scope at the option of the customer, although the customer is typically required to pay us for work performed and materials purchased through the date of termination. In addition, customers have the ability to delay the execution of projects. Depending on the size of the project, the termination, postponement, or change in scope of any project could significantly change the expected timing of revenue to be recognized, reduce backlog, and could have a material adverse effect on revenue, results of operations and cash flow. Accordingly, our backlog as of any particular date is an uncertain indicator of future results of operations.
Our entry into a new line of business may not result in increased shareholder value.
Our operations historically focused primarily on offshore fabrication services for the oil and gas industry. We have recently diversified our shipyard capability through the acquisition of assets from LEEVAC and expanded our EPC capability through the creation of our EPC Division to manage the SeaOne Project and future projects that are similar to it. The Company may expand its capabilities further and enter into additional lines of business. Entry into, or further development of, lines of business in which the Company has not historically operated may expose us to business and operational risks that are different from those
13
we have experienced historically. Our management may not be able to effectively manage these additional risks or implement successful business strategies in new lines of business. Additionally, our competitors in these lines of business may possess substantially greater operational knowledge, resources and experience than the Company. These diversification initiatives may not result in an increase in shareholder value.
We may not be able to generate sufficient cash flow to meet our obligations.
Lower levels of offshore exploration and development activity and spending by our customers globally has had a direct and significant impact on our financial performance, financial condition and financial outlook. Our ability to fund our operations depends on our ability to generate cash in the future. For more information on our business outlook and "Liquidity and Capital Resources" in Item 7 of this Annual Report on Form 10-K. See also Note 1 of the Notes to Consolidated Financial Statements. This, to a large extent, is subject to conditions in the oil and gas industry, including commodity prices, demand for our services and the prices we are able to charge for our services, general economic and financial conditions, competition in the markets in which we operate, the impact of legislative and regulatory actions on how we conduct our business and other factors, all of which are beyond our control.
Competitive pricing common in the fabrication industry may not provide sufficient protection from cost overruns.
As is common in the fabrication industry, a substantial number of our projects are performed on a fixed-price or unit-rate basis. Under fixed-price or unit-rate contracts, we receive the price fixed in the contract, subject to adjustment only for change-orders placed by the customer. Under a unit rate contract, material items or labor tasks are assigned unit rates of measure. The unit rates of measure will generally be an amount of dollars per ton, per foot, per square foot or per item installed. A typical unit rate contract can contain hundreds to thousands of unit rates of measure. Profit margins are built into the unit rates and, similar to a fixed price contract, we retain all cost savings but are also responsible for all cost overruns. In many cases, these project awards involve complex design and engineering, significant procurement of equipment and supplies and extensive construction management. Management uses its best efforts to properly estimate the costs to complete our project awards; however, our actual costs incurred to complete these projects could exceed our estimates.
The revenue, costs and gross profit realized on a contract will often vary from the estimated amounts on which such contracts were originally estimated due to the following:
• | Failure to properly estimate costs of engineering, materials, components, equipment, labor or subcontractors. |
• | Changes in the costs of engineering, materials, components, equipment, labor or subcontractors. |
• | Difficulties in engaging third-party subcontractors, equipment manufacturers or materials suppliers or failures by third-party subcontractors, equipment manufacturers or materials suppliers to perform could result in project delays and cause us to incur additional costs. |
• | We rely heavily on steel purchased from domestic and foreign steel mills as well as outside services for the installation of electrical and mechanical equipment. We generally mitigate this risk with typical alliance/partnering arrangements to provide some protection against cost overruns. While such mechanisms are in place to reduce this risk, we may not be able to adequately cover increases in costs and our margins could be negatively impacted. Despite these attempts, however, the cost and gross profit we realize on a fixed-price contract could vary materially from the estimated amounts. |
• | Our vendors may be unable to deliver materials or contracted services on schedule or at the agreed upon price. We generally have mechanisms in place to indemnify us with respect to damages that we may incur; however, we may be unable to enforce such indemnification or obtain the materials / services from an alternate vendor on a timely basis or at a comparable price which could result in delays and/or increased costs. |
• | Our execution and productivity could deteriorate from the original estimates as a a result of poor execution and / or weather conditions. |
• | We may be unable to obtain compensation for additional work we perform or expenses we incur from our customers. |
• | We may incur payment of liquidated damages upon a failure to meet scheduled delivery requirements. |
• | Our projects may be terminated, temporarily suspended or significantly reduced in scope by our customers. Our contracts generally provide for reimbursement of all costs plus the portion of the contract earned to date; however, they do not replace future overhead or labor costs when such terminations, delays or reductions in scope result in decreased utilization of the yard and an idle labor force. |
These variations and risks are inherent within our industry and may result in revenue and gross profits different from those originally estimated and reduce profitability or create losses on projects. Depending on the size of a project, variations from estimated contract performance can have a significant impact on our operating results for any particular fiscal quarter or year. In addition, substantially all of our customer contracts require us to continue work in accordance with the contractually agreed
14
schedule (and thus, continue to incur expenses for labor and materials) notwithstanding the occurrence of a disagreement with customers over increased pricing and/or unresolved change orders.
For example, during 2017, we recorded contract losses of $34.5 million, including $11.2 million in liquidated damages related to cost overruns and delays that we encountered in the newbuild construction of two multi-purpose offshore vessels that we are building for a customer. The cost overruns relate to engineering and electrical complexities encountered while installing electrical raceways for power and communications systems. These complexities also created delays in completing the vessels on schedule which resulted in liquidated damage penalties further reducing the fixed contract price for this contract. See also further discussion in "Executive Overview and Summary - Current Year Losses, Industry Trends, Continued Diversification and Creation of Our EPC Division" in Item 7 of this Report on Form 10-K.
We might be unable to employ a sufficient number of skilled workers.
We have reduced our skilled workforce during 2017 in response of decreases in utilization of our facilities. Our productivity and profitability depends substantially on our ability to attract and retain skilled construction workers, primarily welders, fitters and equipment operators. Reductions made in our labor force may make it more difficult for us to increase our labor force to desirable levels during periods of rapid expanding customer demand. Our ability to expand our operations in tandem with customer demand depends on our ability to increase our labor force when necessary with the appropriate skilled construction workers. Also, when demand for these workers is high, the supply becomes increasingly limited resulting in increased market rates for these workers. During periods of high activity in past years, we have enhanced several incentive programs and expanded our training facility in an effort to maintain our current workforce and attract new employees.
Even if we are able to increase our workforce in times of higher demand, significant increase in the wages paid by a wide range of other employers seeking similar skill sets could result in a reduction in our skilled labor force, increases in the wage rates we pay, increase in our use of contract labor or all of these. While we believe our relationship with our skilled labor force is good, the profits expected from work in progress and future projects could be reduced or eliminated to the extent we are unable to properly increase our workforce or if potential wage increases could not be passed on to our customers, our production capacity could be diminished and our growth potential could be limited if we were to experience a rapid expansion of demand.
The dangers inherent in our operations and the limits on our insurance coverage could expose us to potentially significant liability costs and materially interfere with the performance of our operations.
The fabrication of our structures involves operating hazards that can cause personal injury or loss of life, severe damage to and destruction of property and equipment and suspension of operations. The failure of such structures during and after installation can result in similar injuries and damages. In addition, our employees may engage in certain activities, including interconnect piping and other service activities conducted on offshore platforms, activities performed on the spud barges owned or chartered by us, marine vessel fabrication and repair activities performed at our facilities and operating vessels owned by us, that are covered in either the provisions of the Jones Act or USL&H. These laws operate to make the liability limits established under state workers’ compensation laws inapplicable to these employees and, instead, permit them or their representatives to pursue actions against us for damages or job related injuries, with generally no limitations on our potential liability.
Our ownership and operation of vessels can give rise to large and varied liability risks, which can result in significant claims for damages against both us and third parties. Litigation arising from any such occurrences may result in our being named as a defendant in lawsuits asserting large claims. In addition, due to the proximity to the GOM, our facilities are subject to the possibility of physical damage caused by hurricanes or flooding.
Although we believe that our insurance coverage is adequate, there can be no assurance that we will be able to maintain adequate insurance in the future at rates we consider reasonable or that our insurance coverage will be adequate to cover future claims that may arise. Claims for which we are not fully insured may adversely affect our working capital and results of operations. In addition, changes in the insurance industry have generally led to higher insurance costs and decreased availability of coverage. The availability of insurance that covers risks we typically insure against may decrease, and the insurance that we are able to obtain may have higher deductibles, higher premiums and more restrictive policy terms.
Our industry is highly competitive.
The offshore and marine fabrication industries are highly competitive and influenced by events largely outside of our control. Contracts for our services are generally awarded on a competitive bid basis, and our customers consider many factors when awarding a job. These factors include price, the contractor’s ability to meet the customer’s delivery schedule, the availability and capability of equipment, and the reputation, experience, and safety record of the contractor. Although we believe that our reputation
15
for safety and quality service is good, we cannot guarantee that we will be able to maintain our competitive position. We compete with both large and small companies for available jobs, and certain of our competitors, particularly our domestic competitor for major deepwater projects, have greater financial and other resources than we do.
Foreign governments often use subsidies and incentives to create local jobs where oil and gas production is being developed. In addition, decreased transportation costs incurred by our customers when exporting structures from foreign locations to the GOM may hinder our ability to successfully bid for projects in the GOM against foreign competitors. Because of subsidies, import duties and fees, taxes on foreign operators, lower wage rates in foreign countries, fluctuations in the value of the U.S. dollar, the possible imposition of tariffs on raw materials imported into the United States, and other factors, we may not be able to remain competitive with respect to pricing compared to foreign contractors. For additional information also see, “Business and Properties - Competition” in Item 1 of this Report on Form 10-K for more information regarding the competitive nature of our industry.
We may not be able to successfully defend against claims made against us by customers or subcontractors, or recover on claims made by us against customers or subcontractors.
Our projects are generally highly complex and we may encounter difficulties in design or engineering, schedule changes and other factors, some of which may be beyond our control, that affect our ability to complete projects in accordance with original delivery schedules or to otherwise meet contractual performance obligations. We may bring claims against customers for additional costs exceeding contract prices or for amounts not included in original contract prices as a result of customer-caused delays or changes from initial project scope. In addition, claims may be brought against us by customers relating to, among other things, alleged defective or incomplete work, breaches of warranty and/or late completion of work. Claims among us and our subcontractors may include claims similar to those described above. These claims may be subject to lengthy and/or expensive litigation or arbitration proceedings, and we may invest significant working capital in projects to cover cost overruns pending resolution of these claims. These claims could have a material adverse affect on our business, financial condition, results of operations and cash flows.
Our method of accounting for revenue using the percentage-of-completion method could have a negative impact on our results of operations.
Most of our revenue is recognized on a percentage-of-completion basis based on the ratio of direct labor hours worked to the total estimated direct labor hours required for completion. Accordingly, contract price and cost estimates are reviewed monthly as the work progresses, and adjustments proportionate to the percentage-of-completion are reflected in revenue for the period when such estimates are revised. To the extent that these adjustments result in a reduction or elimination of previously reported profits, we are required to recognize a charge against current earnings, which may be significant depending on the size of the project or the adjustment. For example, during 2017, we recorded contract losses of $34.5 million, including $11.2 million in liquidated damages related to cost overruns and delays that we encountered in the newbuild construction of two multi-purpose offshore vessels that we are building for a customer. The cost overruns relate to engineering and electrical complexities encountered while installing electrical raceways for power and communications systems. These complexities also created delays in completing the vessels on schedule which resulted in liquidated damage penalties further reducing the fixed contract price for this contract. See also further discussion in "Executive Overview and Summary - Current Year Losses, Industry Trends, Continued Diversification and Creation of Our EPC Division" in Item 7 of this Report on Form 10-K
We depend on key personnel.
Our success depends to a great degree on the abilities of our key management personnel, particularly our executives and other key employees who have significant experience within our industry. The loss of the services of one or more of these individuals could adversely affect us.
The nature of our industry subjects us to compliance with regulatory and environmental laws.
Our operations and properties are materially affected by state and federal laws and other regulations relating to the oil and gas industry in general, as well as a wide variety of federal, state and local environmental laws and regulations, including those governing discharges into the air and water, the handling and disposal of solid and hazardous wastes, the remediation of soil and groundwater contaminated by hazardous substances and the health and safety of employees. Compliance with many of these laws is becoming increasingly complex, stringent and expensive. Many of these laws impose “strict liability” for damages to natural resources or threats to public health and safety, rendering a party liable for the environmental damage without regard to its negligence or fault. Certain environmental laws provide for strict, joint and several liability for remediation of spills and other releases of hazardous substances, as well as damage to natural resources. In addition, we could be subject to claims alleging personal injury or property damage as a result of alleged exposure to hazardous substances. Such laws and regulations may also
16
expose us to liability for the conduct of or conditions caused by others, or for acts that were in compliance with all applicable laws at the time such acts were performed. We believe that our present operations substantially comply with applicable federal and state pollution control and environmental protection laws and regulations. We also believe that compliance with such laws has not resulted in a material adverse effect on our operations. However, such environmental laws are changed frequently. Sanctions for noncompliance may include revocation of permits, corrective action orders, administrative or civil penalties and criminal prosecution. We are unable to predict whether environmental laws will have a material adverse effect on our future operations and financial results. See “Business and Properties - Government and Environmental Regulation” in Item 1 of this Report on Form 10-K
The demand for our services is also affected by changing taxes, price controls and other laws and regulations relating to the oil and gas and marine industries. The current environment has federal, state and local governments faced with spending deficits. We may not be able to pass any potential increases in taxes on to our customers.
Offshore construction and drilling in certain areas is opposed by many environmental groups and, in certain areas, has been restricted. To the extent laws are enacted or other governmental actions are taken that prohibit or restrict offshore construction and drilling or impose environmental protection requirements that result in increased costs to the oil and gas industry in general and the offshore construction industry in particular, our business and prospects could be adversely affected. We cannot determine to what extent future operations and results of operations may be affected by new legislation, new regulations or changes in existing regulations.
Our business is highly dependent on our ability to utilize the navigation canals adjacent to our facilities.
The Houma Navigation Canal provides the shortest means of access from our facilities in Houma, Louisiana, to open waters. With respect to our South Texas Properties, the U.S. Intracoastal Waterway provides access between our North and South yards. From our South Yard, the Corpus Christi Ship Channel provides access to the GOM. Our Jennings Shipyard in Jennings, Louisiana, is located on the west bank of the Mermentau River approximately 25 miles north of the U.S. Intracoastal Waterway and our Lake Charles Shipyard is 17 miles from the GOM on the Calcasieu River near Lake Charles, Louisiana. These waterways are considered to be navigable waterways of the United States and, as such, are protected by federal law from unauthorized obstructions that would hinder water-borne traffic. Federal law also authorizes maintenance of these waterways by the U.S. Army Corps of Engineers. These waterways are dredged from time to time to maintain water depth and, while federal funding for dredging has historically been provided, there is no assurance that Congressional appropriations sufficient for adequate dredging and other maintenance of these waterways will be continued indefinitely. If sufficient funding were not appropriated for that purpose, some or all of these waterways could become impassable by barges or other vessels required to transport many of our products and could have a material adverse effect on our operations and financial position.
We depend on subcontractor services to perform our contractual obligations.
Our ability to perform under our contracts depends to some degree on the performance of third parties we subcontract. We depend upon subcontractors for a variety of reasons, including:
• | to perform work as a result of scheduling demands we would otherwise perform with our employees; |
• | to supervise and/or perform certain aspects of the contract more efficiently considering the conditions of the contract; and |
• | to perform certain types of skilled work. |
We work closely with these subcontractors to monitor progress and address our customer requirements. We generally have the ability to pursue back charges for costs we incur or liabilities we assume as a result of a subcontractor’s lack of performance. However, the inability of our subcontractors to perform under the terms of their contracts could cause us to incur additional costs that reduce profitability or create losses on projects.
We are susceptible to adverse weather conditions in our market areas.
Our operations are directly affected by the seasonal differences in weather patterns in the GOM, as well as daylight hours. Since most of our construction activities take place outdoors, the number of direct labor hours worked generally declines in the winter months due to an increase in rain, colder temperatures and a decrease in daylight hours. The seasonality of oil and gas industry activity as a whole in the Gulf Coast region also affects our operations. Our oil and gas customers often schedule the completion of their projects during the summer months in order to take advantage of milder weather for the installation of their platforms. The rainy weather, tropical storms, hurricanes and other storms prevalent in the GOM and along the Gulf Coast throughout the year may also affect our operations. Accordingly, our operating results may vary from quarter to quarter, depending
17
on factors outside of our control. As a result, full year results are not likely to be a direct multiple of any particular quarter or combination of quarters. We believe that we maintain adequate insurance coverage related to potential damage from weather. For example, we incurred hurricane damage at our South Texas Properties during 2017. See also "Executive Overview and Summary" in Item 7 of this Report on Form 10-K. There can be no assurance that we will be able to maintain adequate insurance in the future at rates we consider reasonable or that our insurance coverage will be adequate to cover future claims that may arise. In addition, changes in the insurance industry have generally led to higher insurance costs and decreased availability of coverage. The availability of insurance for our facilities may decrease, and the insurance that we are able to obtain may have higher deductibles, higher premiums and more restrictive policy terms.
Systems and information technology interruption or failure and data security breaches could adversely impact our ability to operate or expose us to significant financial losses and reputational harm.
We rely heavily on computer information and communications technology and related systems in order to properly operate our business. From time to time, we experience occasional system interruptions and delays. In the event we are unable to regularly deploy software and hardware, effectively upgrade our systems and network infrastructure, and take other steps to maintain or improve the efficiency and efficacy of our systems, the operation of such systems could be interrupted or result in the loss, corruption or release of data. In addition, our computer and communications systems and operations could be damaged or interrupted by natural disasters, force majeure events, telecommunications failures, power loss, acts of war or terrorism, computer viruses, malicious code, physical or electronic security breaches, intentional or inadvertent user misuse or error, or similar events or disruptions. Any of these or other events could cause interruptions, delays, loss of critical and/or sensitive data or similar effects, which could have a material adverse impact on our business, financial condition, protection of intellectual property, and results of operations, as well as those of our clients.
In addition, we face the threat to our computer systems of unauthorized access, computer hackers, computer viruses, malicious code, organized cyber-attacks and other security problems and system disruptions, including possible unauthorized access to and disclosure of our and our clients’ proprietary or classified information. We rely on industry accepted security measures and technology to securely maintain all confidential and proprietary information on our computer systems, but they may still be vulnerable to these threats. As a result, we may be required to expend significant resources to protect against the threat of these system disruptions and security breaches or to alleviate problems caused by these disruptions and breaches. Any of these events could damage our reputation and have a material adverse effect on our business, financial condition, results of operations and cash flows.
Item 1B. Unresolved Staff Comments
None.
Item 3. Legal Proceedings
We are subject to various routine legal proceedings in the normal conduct of our business primarily involving commercial claims, workers’ compensation claims, and claims for personal injury under the general maritime laws of the United States and the Jones Act. While the outcome of these lawsuits, legal proceedings and claims cannot be predicted with certainty, management believes that the outcome of any such proceedings, even if determined adversely, would not have a material adverse effect on our financial position, results of operations or cash flows.
Item 4. Mine Safety Disclosures
None.
Item 4A. Executive Officers of the Registrant
Listed below are the names, ages and offices held by each of our executive officers as of March 9, 2018. All officers serve at the pleasure of our Board of Directors.
Name | Age | Position | ||
Kirk J. Meche | 55 | President, Chief Executive Officer and Director | ||
David S. Schorlemer | 51 | Executive Vice President, Chief Financial Officer, Treasurer, and Secretary | ||
Todd F. Ladd | 51 | Executive Vice President and Chief Operating Officer | ||
Kirk J. Meche became Chief Executive Officer in January 2013. Mr. Meche has served as President since January 2009. He served as Chief Operating Officer from January 2009 to December 2012. Mr. Meche served as the Executive Vice President –
18
Operations from 2001 to 2009. Mr. Meche was President and Chief Executive Officer of Gulf Marine from February 2006 to October 2006. Mr. Meche served as President and Chief Executive Officer of Gulf Island, L.L.C. from February 2001 until January 2006. Prior to that, Mr. Meche served as President and Chief Executive Officer of Southport, Inc., a wholly-owned fabrication subsidiary of the Company, from 1999 to 2001. Mr. Meche was a project manager of the Company from 1996 to 1999. Mr. Meche held various engineering positions for J. Ray McDermott, Inc. from 1985 to 1996.
David S. Schorlemer became Executive Vice President of Finance, Chief Financial Officer and Treasurer on January 3, 2017, and later was named Secretary on February 22, 2018. Mr. Schorlemer has over 20 years experience as a financial or other senior officer in the energy services industry. From 2015 to 2016, Mr. Schorlemer served as Chief Financial Officer of GR Energy Services Management, L.P., an energy service company delivering completion and production solutions to the United States and Latin American markets. From 2004 to 2015, Mr. Schorlemer served as Executive Vice President and Chief Financial Officer of Stallion Oilfield Holdings, Inc., an energy service company providing upstream, midstream and industrial services to its customers. Mr. Schorlemer served as Vice President - Finance and Chief Financial Officer of Q Services, Inc. from 1997 until Q Services merged with Key Energy Services, Inc. in 2002. Following the merger, Mr. Schorlemer served as Vice President - Marketing & Strategic Planning of Key Energy Services, Inc. until 2004. Mr. Schorlemer also served as Consulting Project Manager with Accenture PLC's Technology Practice from 1991 to 1997.
Todd F. Ladd became Chief Operating Officer in February 2014 and was appointed Executive Vice President in February 2015. Mr. Ladd previously served as Vice President and General Manager of the Company from July 2013 to February 2014. Mr. Ladd has over 25 years industry experience in the offshore fabrication sector. From 2001 to 2013, Mr. Ladd served as a partner and Senior Project Manager with Paloma Energy Consultants, an offshore construction project management firm. From April 1996 to August 2001, Mr. Ladd served as a Project Manager for Gulf Island, L.L.C. Mr. Ladd also served as Production Engineer and Facility Engineer at McDermott Marine Construction from January 1988 through March 1996.
19
PART II
Item 5. Market for Registrant's Common Equity, Related Stockholder Matters and Issuer Purchases of Equity Securities
Our common stock is traded on the Nasdaq Global Select Market, under the symbol “GIFI.” As of March 7, 2018, we had approximately 2,820 holders of record of our common stock.
The following table sets forth the high and low sale prices per share of the common stock, as reported by The Nasdaq Stock Market LLC, and the amount of cash dividends declared per share of our common stock, for each fiscal quarter of the two most recent fiscal years.
High | Low | Dividend | |||||||||
Fiscal Year 2017 | |||||||||||
First Quarter | $ | 13.90 | $ | 10.20 | $ | 0.01 | |||||
Second Quarter | 11.60 | 9.05 | 0.01 | ||||||||
Third Quarter | 12.70 | 10.60 | 0.01 | ||||||||
Fourth Quarter | $ | 13.50 | $ | 12.15 | $ | 0.01 | |||||
Fiscal Year 2016 | |||||||||||
First Quarter | $ | 10.21 | $ | 7.78 | $ | 0.01 | |||||
Second Quarter | 7.93 | 6.37 | 0.01 | ||||||||
Third Quarter | 9.47 | 6.80 | 0.01 | ||||||||
Fourth Quarter | $ | 12.75 | $ | 9.25 | $ | 0.01 | |||||
In each quarter of 2017, our Board of Directors declared a dividend of $0.01 per share on the shares of our common stock outstanding, totaling $598,000. On February 22, 2018, our Board of Directors elected to suspend our quarterly dividend of $0.01 per share consistent with our effort to conserve cash. Future declaration and payment of dividends, if any, is at the discretion of our Board of Directors and will depend on our liquidity position, future working capital requirements and other factors deemed relevant by the Board of Directors.
Issuer Purchases of Equity Securities
The following table sets forth shares of our common stock we repurchased during the three-month period ended December 31, 2017.
Current Program | |||||||||||||
Period | Total Number of Shares Purchased | Average Price Paid per Share | Total Number of Shares Purchased as Part of Publicly Announced Plans or Programs | Maximum Number of Shares that May Yet Be Purchased Under the Plans or Programs | |||||||||
October 1 to 31, 2017 | — | — | — | — | |||||||||
November 1 to 30, 2017 | — | $ | — | — | — | ||||||||
December 1 to 31, 2017 | 4,213 | $ | 12.41 | — | — | ||||||||
Total | 4,213 | (a) | $ | 12.41 | — | — | |||||||
_______________
(a) | Represents shares withheld by the Company in order to satisfy employee tax obligations for vesting of restricted stock awards. |
Information as to the securities authorized for issuance under our equity compensation plans is incorporated herein by reference to Item 12 of this Report on Form 10-K.
Stock Performance Graph
The following graph compares the cumulative total shareholder return on our common stock from December 31, 2012, to December 31, 2017, with the cumulative total return of the Standard & Poor’s 500 Index and the Standard & Poor’s 500 Oil & Gas Equipment & Services Index for the same period. The returns are based on an assumed investment of $100 on January 1, 2013, at closing prices on December 31, 2012, in our common stock and in each of the indexes and on the assumption that dividends were reinvested.
20
Total Return To Shareholders
(Includes reinvestment of dividends)
ANNUAL RETURN PERCENTAGE Years Ending | |||||||||||
Company / Index | Dec 13 | Dec 14 | Dec 15 | Dec 16 | Dec 17 | ||||||
Gulf Island Fabrication, Inc. | (1.66) | (14.85) | (44.22) | 14.30 | 13.22 | ||||||
S&P 500 Index | 32.39 | 13.69 | 1.38 | 11.96 | 21.83 | ||||||
S&P 500 Oil & Gas Equipment & Services | 30.65 | (7.80) | (18.75) | 31.93 | (14.68) | ||||||
Base Period Dec 12 | INDEXED RETURNS Years Ending | ||||||||||
Company / Index | Dec 13 | Dec 14 | Dec 15 | Dec 16 | Dec 17 | ||||||
Gulf Island Fabrication, Inc. | 100 | 98.34 | 83.74 | 46.71 | 53.39 | 60.46 | |||||
S&P 500 Index | 100 | 132.39 | 150.51 | 152.59 | 170.84 | 208.14 | |||||
S&P 500 Oil & Gas Equipment & Services | 100 | 130.65 | 120.46 | 97.87 | 129.13 | 110.16 | |||||
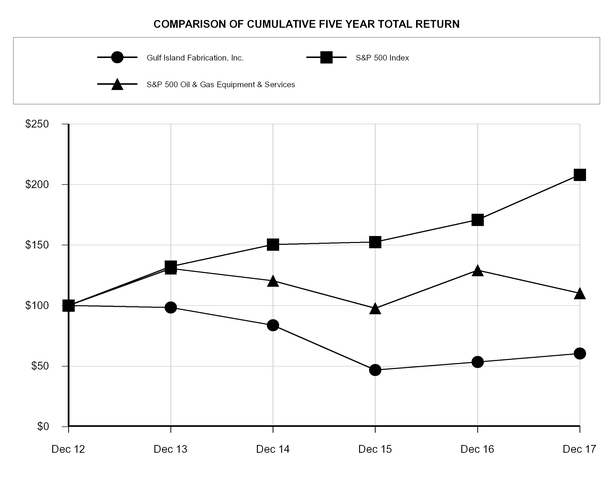
21
Item 6. Selected Financial Data
The following table sets forth selected historical financial data as of the dates and for the periods indicated. The historical financial data for each year in the five-year period ended December 31, 2017, is derived from our audited financial statements. The following information should be read in conjunction with “Management’s Discussion and Analysis of Financial Condition and Results of Operations” and our financial statements and notes thereto included elsewhere in this Report on Form 10-K.
Years Ended December 31, | |||||||||||||||||||
2017 | 2016 | 2015 | 2014 | 2013 | |||||||||||||||
(in thousands, except per share data) | |||||||||||||||||||
Statement of Operations Data: | |||||||||||||||||||
Revenue | $ | 171,022 | $ | 286,326 | $ | 306,120 | $ | 506,639 | $ | 608,326 | |||||||||
Cost of revenue | 213,947 | 261,473 | 321,276 | 462,083 | 584,665 | ||||||||||||||
Gross profit (loss) | (42,925 | ) | 24,853 | (15,156 | ) | 44,556 | 23,661 | ||||||||||||
General and administrative expenses | 17,800 | 19,670 | 16,256 | 17,409 | 11,555 | ||||||||||||||
Asset impairment | 7,672 | — | 7,202 | 3,200 | — | ||||||||||||||
Operating income (loss) | (68,397 | ) | 5,183 | (38,614 | ) | 23,947 | 12,106 | ||||||||||||
Net interest (expense) income | (349 | ) | (308 | ) | (139 | ) | (24 | ) | (234 | ) | |||||||||
Other, income (expense) | (213 | ) | 681 | 20 | (99 | ) | (337 | ) | |||||||||||
Income (loss) before income taxes | (68,959 | ) | 5,556 | (38,733 | ) | 23,824 | 11,535 | ||||||||||||
Income tax expense (benefit) | (24,193 | ) | 2,041 | (13,369 | ) | 8,504 | 4,303 | ||||||||||||
Net income (loss) | $ | (44,766 | ) | $ | 3,515 | $ | (25,364 | ) | $ | 15,320 | $ | 7,232 | |||||||
Income Summary Data: | |||||||||||||||||||
Basic and fully diluted earnings (loss) per share—common shareholders | $ | (3.02 | ) | $ | 0.24 | $ | (1.75 | ) | $ | 1.05 | $ | 0.50 | |||||||
Basic and fully diluted weighted-average common shares | 14,838 | 14,631 | 14,546 | 14,505 | 14,463 | ||||||||||||||
Cash dividends declared per common share | $ | 0.04 | $ | 0.04 | $ | 0.40 | $ | 0.40 | $ | 0.40 | |||||||||
22
As of December 31, | |||||||||||||||||||
2017 | 2016 | 2015 | 2014 | 2013 | |||||||||||||||
(in thousands) | |||||||||||||||||||
Balance Sheet Data: | |||||||||||||||||||
Working capital | $ | 130,499 | $ | 78,012 | $ | 77,968 | $ | 97,084 | $ | 89,721 | |||||||||
Property, plant and equipment, net | 88,899 | 206,222 | 200,384 | 224,777 | 223,555 | ||||||||||||||
Total assets | 270,840 | 322,408 | 316,923 | 395,297 | 426,234 | ||||||||||||||
Debt | — | — | — | — | — | ||||||||||||||
Cash Flow Data: | |||||||||||||||||||
Net cash provided by (used in) operating activities | (39,385 | ) | 14,568 | 10,694 | 32,110 | 38,003 | |||||||||||||
Net cash provided by (used in) investing activities | (1,135 | ) | 2,698 | (6,007 | ) | (26,729 | ) | (20,802 | ) | ||||||||||
Net cash (used in) financing activities | (1,664 | ) | (927 | ) | (5,944 | ) | (5,865 | ) | (5,520 | ) | |||||||||
Operating Data: | |||||||||||||||||||
Direct labor hours worked for the year ended December 31, (1) | 1,926 | 2,784 | 2,655 | 3,646 | 4,060 | ||||||||||||||
Backlog as of December 31, (2) | |||||||||||||||||||
Direct labor hours | 1,544 | 1,265 | 1,914 | 1,654 | 3,256 | ||||||||||||||
Dollars | $ | 222,617 | $ | 132,972 | $ | 232,411 | $ | 184,667 | $ | 358,732 | |||||||||
_______________
(1) | Direct labor hours are hours worked by employees directly involved in the production of our products. |
(2) | Our backlog is based on management’s estimate of the number of direct labor hours required to complete and the remaining revenue to be recognized with respect to those projects for which a customer has authorized us to begin work or purchase materials or services pursuant to written contracts, letters of intent or other forms of authorization. The backlog as of each year end also includes commitments received subsequent to December 31, of each year as described in Item 7 of this Report on Form 10-K. |
23
Item 7. Management’s Discussion and Analysis of Financial Condition and Results of Operations
Executive Overview and Summary
Current Year Losses, Liquidity, Industry Trends, Continued Diversification and Creation of Our EPC Division
Beginning in late 2014, a severe decline in oil and natural gas prices led to a significant decline in oil and gas industry drilling activities and capital spending from our traditional customer base. In 2015 and through 2017, the Company implemented a number of initiatives to strategically reposition the Company to attract new customers, participate in the buildup of petrochemical facilities, pursue offshore wind markets and diversify our customers within our shipyard business. Additionally, the Company initiated efforts to preserve cash and lower costs including: reducing our workforce in certain divisions, developing a plan to sell certain underutilized assets, and diversifying our service offerings and fabrication capabilities.
During the year ended December 31, 2017, we incurred operating losses of $68.4 million. Operating losses totaling $34.5 million related to cost overruns and delays that we encountered in the newbuild construction of two multi-purpose service vessels that we are building for a customer within our Shipyard Division. These vessels are some of the most technologically-advanced vessels in their class. The cost overruns relate primarily to complexities with the installation of the power and communications systems. We believe the best course of action for the Company is to perform additional engineering and construction planning to ensure we are meeting the contractual performance requirements for these vessels and mitigating any further construction risk. With the additional electrical engineering, planning and construction estimates, the estimated delivery dates of the vessels will be extended beyond the contractual delivery dates, and we estimate that the maximum amount of liquidated damages of $11.2 million will be incurred in the absence of a signed amendment with the customer. We have included the maximum liquidated damages in our 2017 loss provision above and reduced our estimate of the contract price. We continue to work with the customer to complete the contract in a manner that is acceptable to both parties; however, resolution with this customer could take several months. We can provide no assurance that we will be successful in signing an amendment to the contract, or that in the event we are successful in negotiating an amendment, as to when such an amendment will be signed or if such amendment will result in recovery of any cost overruns or liquidated damages that we have recognized to date. We believe that our estimates to complete the vessels are reasonable; however, we cannot guarantee that we will not incur additional costs as we negotiate with our customer.
Additional operating losses during the year related to (i) non-cash impairments totaling $7.7 million and (ii) costs related to holding our South Texas Properties while they are held for sale were $5.5 million. The remaining $20 million losses primarily relate to the competitive environment of our industry and the challenged oil and gas industry.
Our immediate liquidity remains dependent on our cash on hand, availability of future drawings from our $40 million credit agreement and collections of accounts receivable. In the first quarter of 2018, we drew $10 million under our credit agreement and as of March 9, 2018, we had approximately $10 million in cash with approximately $27.5 million in availability under our credit agreement. We are implementing several strategies to diversify the business, increase backlog, reduce operating expenses and monetize assets. Our South Texas Properties, with a combined net book value of $102.7 million, are held for sale.
Oil and gas prices have seen improvements; however, our industry conditions remain challenged. Our customers in the global oil and gas industry continue to limit their capital spending, which has also negatively impacted the marine and offshore service industries that support offshore exploration and production and adversely affected our ability to operate our facilities at desired utilization levels. As a result, we have experienced significant decreases in revenue and tighter margins on awarded new work. Offshore oil and gas producers are not expected to increase drilling activity in the near term and we do not anticipate any significant near term movement as it relates to offshore investment and related project activity as producers focus on land-based oil and gas production through newly discovered shale plays. Accordingly, we are focused on projects outside of the upstream oil and gas sector.
• | Within our Fabrication Division, we have increased our business development focus on petrochemical plant module work, alternative energy fabrication projects and other projects that are less susceptible to fluctuations in oil and gas prices and may actually benefit in the longer-term from reliable, lower cost commodity prices. We are currently fabricating complex modules for the construction of a new ethane cracker petrochemical plant and we expect to perform a portion of the significant fabrication work under the SeaOne Project if it proceeds. |
• | Opportunities for our Shipyard Division remain largely outside of the oil and gas sector including some government contracts. Our Shipyard Division has recently been awarded contracts for the construction of eight harbor tugs, one research vessel for a research university in the Pacific northwest (with the option for two more research vessels) and an ice-breaker, z-drive tug for a customer in the northeast. |
24
• | Opportunities for our Services Division have seen some recent improvement. For example, we have secured some offshore platform facility expansion work which entails the onshore fabrication of structural and production components as well as offshore installation and hook-up scopes of work and some to onshore plant expansions and maintenance programs. |
• | We were recently notified by SeaOne, that we have been selected as the prime contractor for the SeaOne Project. This project will include execution of engineering, construction and installation of modules for an export facility in Gulfport, Mississippi, and import facilities in the Caribbean and South America. SeaOne’s selection of our Company is non-binding and commencement of the project remains subject to a number of conditions, including agreement on terms of the engagement with SeaOne. We are working to strengthen our internal project management capabilities through the hiring of additional personnel to service this potential project. The SeaOne Project is expected to start during mid-2018 with construction expected to start later in 2018 or early 2019. |
We continue to actively compete for additional bidding opportunities and believe we will be successful in obtaining new, additional backlog awards in 2018 and 2019; however, management believes that even if we are successful in obtaining these awards there is an expected lag of several months before these awards will materialize. While we have been successful in obtaining new backlog in recent months, primarily in our Shipyard and Services Divisions, these backlog awards were received during a period of competitive pricing with low margins. Revenue from these awards will not be realized until later in 2018.
Looking forward, our results of operations will be affected primarily by:
• | Our ability to execute on projects in accordance with our cost estimates and manage them to successful completion. |
• | Our ability to win contracts through competitive bidding or alliance/partnering arrangements. |
• | Demand for our services and the overall number of projects in the market place. As discussed above, a significant portion of our historical customer base has been impacted by the level of exploration and development activity maintained by oil and gas exploration and production companies in the GOM, and to a lesser extent, overseas locations which is dependent upon the price of oil and gas. |
• | The level of petrochemical facility construction and improvements. |
We continue to respond to the competitive forces within our industry by limiting our own discretionary spending. Since the beginning of 2016, we have implemented wage adjustments along with employee benefit and overall cost reductions within all of our divisions. We have reduced the level of our workforce based on booked work in all of our facilities, we have reduced our capital expenditures and placed assets that are either underutilized, under-performing or not expected to provide sufficient long-term value up for sale, which include our South Texas Properties.
We will continue to monitor our cash as we expect to incur cost related to the completion of the two multi-purpose service vessels within our Shipyard Division, initial startup costs related to recent backlog awards, buildup of our EPC Division and the uncertainty of the current offshore oil and gas market. We have limited cash on hand and proceeds expected from the sales of our South Texas Properties (if and when such sales close) may not be sufficient or may not occur at times needed for our required capital outlays such as our anticipated project with SeaOne or to fulfill the working capital requirements required to complete our current backlog, for example. See also Note 1 of the Notes to Consolidated Financial Statements for more information on our business outlook. Accordingly, we may be required to obtain additional financing or conduct equity or debt offerings at a time when it is not beneficial to do so.
Achievements During 2017
• | We successfully resolved our dispute with a customer within our Shipyard Division during the fourth quarter of 2017. The customer accepted delivery of the first of two vessels less a reduction in the amounts owed under each contract of $233,000 related to discrepancies of dead weight tonnage. We also recommenced construction of the second vessel to be delivered in 2018. |
• | On December 20, 2017, we granted an exclusive option to a third party for the purchase our South Yard for a purchase price of $55 million. This option runs through April 25, 2018, which may be extended through May 25, 2018, if proper written notice and additional earnest monies are provided. |
25
The Potential Sale of Our South Texas Properties
We have placed our South Texas Properties located in Aransas Pass and Ingleside, Texas, up for sale. Our South Yard in Ingleside, Texas, is located on the northwest corner of the U.S. Intracoastal Waterway and the Corpus Christi Ship Channel. The 45-foot deep Corpus Christi Ship Channel provides direct and unrestricted access to the GOM. Our North Yard in Aransas Pass, Texas, is located along the U.S. Intracoastal Waterway and is approximately three miles north of the Corpus Christi Ship Channel. See also "Our Fabrication Facilities in Ingleside and Aransas Pass, Texas" in Item 1 of this Report on Form 10-K. The net book value of property, plant and equipment for these assets was $102.7 million at December 31, 2017. These properties and related equipment are currently underutilized and represent excess capacity within our Fabrication Division. We have ceased all fabrication activities at these locations and re-allocated any remaining backlog and workforce to our Houma fabrication operations as necessary. As a result of the decision to place our South Texas Properties for sale and the underutilization currently being experienced, we expect to incur costs associated with the maintaining of the facility through its sale that will not be recoverable. These costs during 2017 were $5.5 million and included insurance, general maintenance of the property in its current state and property taxes.
On August 25, 2017, our South Texas Properties were impacted by Hurricane Harvey, which made landfall as a category 4 hurricane. As a result, we suffered damages to our buildings and equipment at our South Texas Properties. Our initial estimate of the total claim due to the Company approximates $21.5 million; however, our insurance carrier has not approved these amounts. We maintain coverage on these assets up to a maximum of $25.0 million, subject to a 3.0% deductible with a minimum deductible of $500,000. Through December 31, 2017, we have incurred approximately $1.3 million in clean-up, inspection and repair related costs. One building at our South Yard and one building at our North Yard were determined to be total losses. As a result we expensed the remaining net book value of $1.5 million related to these buildings and recorded a corresponding insurance recovery of $1.5 million fully offsetting the loss. We are working diligently with our insurance agents and adjusters to finalize our estimate of the damage; however, it may be several months, or even longer, before we can finalize our assessment and receive final payment from our insurance underwriters. Our insurance underwriters have made an initial payment of $6.0 million, and we have recorded a liability for future repairs of $3.3 million which is included in accrued expenses and other liabilities on our balance sheet at December 31, 2017. Based upon our initial assessment of the damages and insurance coverage, management believes that there is no basis to record a net loss at this time and that insurance proceeds will at a minimum be sufficient to reimburse us for all damages and repair costs. Our final assessment of the loss incurred to our South Texas Properties as well as the amount of insurance proceeds we will receive could be more or less than this amount when the claim is ultimately settled and such differences could be material.
On December 20, 2017, we granted an exclusive option to a third party for the purchase of our South Yard for a purchase price of $55 million. This option runs through April 25, 2018, which may be extended through May 25, 2018, if proper written notice and additional earnest monies are provided in accordance with the agreement. The terms of the agreement are subject to normal and customary conditions, including the third party's right to conduct inspections of the property related to confirmation of title, surveys, environmental conditions, easements and access rights. In consideration for the option to purchase the South Yard, the third party deposited $750,000 of earnest money on January 3, 2018, which is nonrefundable in the event the third party cancels the agreement.
We expect to use all or a portion of the sales proceeds to invest in our operating liquidity in order to facilitate anticipated future projects including the SeaOne Project, selected capital improvements to enhance and/or expand our existing facilities, and to expand our product and service capabilities. We are continuing this effort to identify and analyze specific investment opportunities we believe will enhance the long-term value of the Company that are consistent with our strategy.
Recent Developments
During January 2018, we drew $10 million under our credit agreement. On February 26, 2018, the Company entered into a Second Amendment (the "Second Amendment") to the credit agreement with a lending institution as sole lender, dated June 9, 2017. The Second Amendment lowers the base tangible net worth covenant requirement from $200 million to $185 million. In addition, the Second Amendment revises the calculation for the minimum tangible net worth covenant to include 50% of any gain attributable to the sale of our South Texas Properties.
Backlog
Our backlog is based on management’s estimate of the direct labor hours required to complete, and the remaining revenue to be recognized with respect to those projects a customer has authorized us to begin work or purchase materials or services pursuant to written contracts, letters of intent or other forms of authorization. As engineering and design plans are finalized or changes to existing plans are made, management’s estimate of the direct labor hours required to complete a project and the price of a project at completion is likely to change.
26
All projects currently included in our backlog generally are subject to suspension, termination, or a reduction in scope at the option of the customer, although the customer is typically required to pay us for work performed and materials purchased through the date of termination, suspension, or reduction in scope. In addition, customers have the ability to delay the execution of projects.
A comparison of our backlog as of December 31, 2017, September 30, 2017, and as of December 31, 2016, is as follows (amounts in thousands, except for percentages):
As of December 31, 2017 (1) | As of September 30, 2017 | As of December 31, 2016 | ||||||||||||
$'s | Labor hours | $'s | Labor hours | $'s | Labor hours | |||||||||
Fabrication | $ | 15,771 | 150 | $ | 29,554 | 254 | $ | 65,444 | 707 | |||||
Shipyard | 184,035 | 1,104 | 200,909 | 1,045 | 59,771 | 457 | ||||||||
Services | 23,181 | 290 | 21,918 | 265 | 7,757 | 101 | ||||||||
Intersegment eliminations | (370 | ) | — | (649 | ) | — | — | — | ||||||
Total Backlog | $ | 222,617 | 1,544 | $ | 251,732 | 1,564 | $ | 132,972 | 1,265 | |||||
Number | Percentage | Number | Percentage | Number | Percentage | |||||||||
Major customers | four | 73.0% | (2) | five | 82.7% | two | 80.5% | |||||||
$'s | Percentage | $'s | Percentage | $'s | Percentage | |||||||||
Deepwater locations | $ | — | —% | $ | — | —% | 2,743 | 2.1% | ||||||
Foreign locations | — | —% | — | —% | 4,774 | 3.6% | ||||||||
Backlog that is expected to be recognized in revenue during: | ||||||||||||||
$'s | Percentage | |||||||||||||
2018 | $ | 158,065 | 71.0% | (3) | ||||||||||
2019 | 56,578 | 25.4% | (3) | |||||||||||
2020 | 7,974 | 3.6% | (3) | |||||||||||
Total Backlog | $ | 222,617 | 100% | |||||||||||
1) | Backlog as of December 31, 2017, includes commitments received through February 22, 2018. We excluded suspended projects from contract backlog that are expected to be suspended more than 12 months because resumption of work and timing of revenue recognition for these projects are difficult to predict. No amounts have been included in our backlog that relate to our recent naming as the prime contractor by SeaOne for the engineering, procurement, construction, installation, commissioning and start-up of the SeaOne Project. SeaOne’s selection of our Company is non-binding and commencement of the project remains subject to a number of conditions. See "Executive Overview and Summary" above. |
2) | Projects for our four largest customers consist of the following all within our Shipyard Division: |
(i) | Two large multi-purpose service vessels for one customer, which commenced in the first quarter of 2014 and will be completed during 2019; |
(ii) | Newbuild construction of four harbor tugs and will be completed in 2018 and 2019; |
(iii) | Newbuild construction of four harbor tugs (separate from above) and will be completed in 2018 and 2019; and |
(iv) | Newbuild construction of an offshore research vessel and will be completed in 2020. |
(3) | The timing of recognition of the revenue represented in our backlog is based on management’s current estimates to complete the projects. Certain factors and circumstances could cause changes in the amounts ultimately recognized and the timing of the recognition of revenue from our backlog. |
Depending on the size of the project, the termination, postponement, or reduction in scope of any one project could significantly reduce our backlog and could have a material adverse effect on revenue, results of operations and cash flow. For
27
additional information, see Item 1A. Risk Factors – “Our backlog is subject to change as a result of changes to management’s estimates, suspension or termination of projects currently in our backlog or our failure to secure additional projects.”
Workforce
Our workforce varies based on the level of ongoing fabrication activity at any particular time. During 2017, we made reductions in our workforce (primarily at our fabrication and shipyard facilities) in response to decreases in the amount of work. As of December 31, 2017 and 2016, we had approximately 977 and 1,178 employees, respectively. We use contract labor when required to meet customer demand. None of our employees are employed pursuant to a collective bargaining agreement, and we believe our relationship with our employees is good.
Labor hours worked were 1.9 million, 2.8 million, and 2.7 million for the years ending December 31, 2017, 2016 and 2015 respectively. The decrease in labor hours worked in 2017 relative to 2016 was attributable to the decreases in overall levels of activity as a result of a decline in our oil and gas fabrication activity.
Critical Accounting Policies
Our consolidated financial statements are prepared in accordance with generally accepted accounting principles within the United States ("GAAP") which require us to make estimates and assumptions. We believe that the following significant accounting policies (see Note 1 in the Notes to Consolidated Financial Statements), involve a higher degree of judgment and complexity:
Revenue Recognition
The majority of our revenue is recognized on a percentage-of-completion basis based on the ratio of direct labor hours actually performed to date compared to the total estimated direct labor hours required for completion. Accordingly, contract price and cost estimates are reviewed monthly as the work progresses, and adjustments proportionate to the percentage-of-completion are reflected in revenue for the period when such estimates are revised. If these adjustments were to result in a reduction of previously reported profits, we would recognize a charge against current earnings, which may be significant depending on the size of the project or the adjustment.
Profit incentives are included in revenue when their realization is probable. Claims for extra work or changes in scope of work are included in revenue when the amount can be reliably estimated and collection is probable. To the extent work from changes in scope have been approved for scope, but not as to price, revenue is recognized up to cost incurred. Changes in job performance, job conditions, and estimated profitability, including those arising from contract penalty provisions, and final contract settlements may result in revisions to costs and income and are recognized in the period in which the revisions are determined. For the years ended December 31, 2017, 2016 and 2015, there was no significant revenue related to unapproved change orders or claims.
Contract costs include all direct material, labor and subcontract costs and those indirect costs related to contract performance, such as indirect labor, supplies and tools. Also included in contract costs are a portion of those indirect contract costs related to plant capacity, such as depreciation, insurance and repairs and maintenance. These indirect costs are allocated to jobs based on actual direct labor hours worked.
Some contracts include a total or partial reimbursement to us of any costs associated with specific capital projects required by the fabrication process. If a particular capital project provides future benefits to us, the cost to build the capital project will be capitalized, and the revenue for the capital project will increase the estimated profit in the contract.
Provisions for estimated losses on uncompleted contracts are made in the period in which such losses are determined. We recognized contract losses of $36.5 million, $1.8 million, and $33.9 million, for the years ended December 31, 2017, 2016 and 2015. Contract losses for the year ended December 31, 2017, were primarily due to $34.5 million of contract losses incurred by our Shipyard Division related to the construction of two multi-purpose service vessels.
Contract losses for the year ended December 31, 2016, were primarily attributable to our inability to absorb fixed costs due to decreases in expected oil and gas fabrication activity and competitive pricing.
Contract losses for the year ended December 31, 2015, were primarily related to a $24.5 million decrease in contract price due to final weight re-measurements and our inability to recover certain costs on disputed change orders related to a large deepwater project delivered during the fourth quarter of 2015. In addition, we accrued contract losses of approximately $9.4 million resulting from increases in our projected unit labor rates of our fabrication facilities which were driven by our inability to absorb fixed costs due to decreases in expected oil and gas fabrication activity.
28
Allowance for Doubtful Accounts
We routinely review individual contracts receivable balances and make provisions for probable doubtful accounts as we deem appropriate. Among the factors considered during the review are the financial condition of our customers and their access to financing, underlying disputes on the account, age and amount of the account and overall economic conditions. Accounts are written off only when all reasonable collection efforts are exhausted.
Our principal customers include major and large independent oil and gas companies and their contractors, and marine vessel operators and their contractors. This concentration of customers may impact our overall exposure to credit risk, either positively or negatively, in that customers may be similarly affected by changes in economic or other conditions. Receivables are generally not collateralized; however, in certain instances we obtain collateral to reduce our credit exposure. In the normal course of business, we extend credit to our customers on a short-term basis.
During 2017, the provision for bad debts was approximately $21,000 which is primarily related to customers who defaulted on payment. During 2016, the provision for bad debts was approximately $493,000 which was primarily related to uncollected storage rentals from customers within our Fabrication Division. During 2015, the provision for bad debts was approximately $448,000 in connection with a receivable balance from a deepwater customer.
Fair Value Measurements:
The determination of fair value can require the use of significant judgment and can vary based on the facts and circumstances. See also Note 6 of the Notes to Consolidated Financial Statements.
We evaluate long-lived assets or asset groups used in operations for impairment losses when events and circumstances indicate that the assets or asset groups might not be recoverable. If events and circumstance indicate that the assets or asset groups might not be recoverable, the expected future undiscounted cash flows from the assets or asset groups are estimated and compared with the carrying amount of the assets or asset groups. If the sum of the estimated undiscounted cash flows is less than the carrying amount of the assets or asset groups, an impairment loss is recorded.
An impairment loss is measured by comparing the fair value of the asset or asset group to its carrying amount and recording the excess of the carrying amount of the asset or asset group over its fair value as an impairment charge. An asset group constitutes the minimum level for which identifiable cash flows are principally independent of the cash flows of other asset or liability groups. Fair value is determined based on discounted cash flows or appraised values, as appropriate.
Our South Texas Properties and our Prospect Shipyard assets meet the criteria for assets held for sale at December 31, 2017. See Note 4 of the Notes to Consolidated Financial Statements. We measure and record assets held for sale at the lower of their carrying amount or fair value less cost to sell. Our net book value of property, plant and equipment for these assets was $104.6 million at December 31, 2017. On December 20, 2017, we granted an exclusive option to a third party for the purchase of our South Yard for a purchase price of $55 million. We compared our carrying value of our South Yard to the the purchase price less costs to sell and determined that there was no impairment. For our North Yard, we have obtained third party appraisals, level 3 inputs, to determine the fair value of the asset group due to the uncertainty with respect to the future cash flows and compared them to the carrying value which did not result in impairment. For the remaining South Texas equipment and the Prospect Shipyard assets we compared the carrying value of the assets to management's estimates of fair value less costs to sell, and we recorded impairments totaling $989,000 related to our Prospect Shipyard assets. We had no assets held for sale at December 31, 2016, and had no impairments charges during 2016.
During 2017, we recorded impairments totaling $6.7 million primarily related to inventory held within our Fabrication Division based upon their net realizable value. See Note 6 of the Notes to Consolidated Financial Statements. During 2015, we also recorded an impairment of $6.6 million within our Fabrication Division related to a partially constructed topside, related valves, piping and equipment that we acquired from a customer following its default under a contract for a deepwater project in 2012 based on the estimated scrap value of these materials and reclassified the asset’s net realizable value of $3.7 million to inventory.
Income Taxes
Income taxes have been provided using the liability method. Deferred income taxes reflect the net tax effects of temporary differences between the carrying amounts of assets and liabilities for financial reporting purposes and the amounts used for income tax purposes using enacted rates expected to be in effect during the year in which the basis differences reverse. Due to changing tax laws, significant judgment is required to estimate the effective tax rate expected to apply to tax differences that are expected to reverse in the future.
29
In December 2017, the Tax Cuts and Jobs Act was enacted which significantly changes U.S. tax law. In accordance with Accounting Standards Codification ASC 740, Income Taxes, the Company is required to account for the new requirements in the period that includes the date of enactment. The Tax Cuts and Jobs Act reduces the overall corporate income tax rate to 21%, creates a new territorial tax system, broadens the tax base, and allows for the immediate capital expensing of certain qualified property. Due to the complexities presented by the Tax Cuts and Jobs Act, the SEC issued Staff Accounting Bulletin 118 to provide guidance to companies who are not able to complete their accounting in the period of enactment prior to the reporting deadlines. Under the guidance in SAB 118, companies that have not completed their accounting for the Tax Cuts and Jobs Act, but can determine a reasonable estimate of those effects should include a provisional amount based on their reasonable estimate in their financial statements. As of December 31, 2017, we have not completed our accounting for the tax effects of the Tax Cuts and Jobs Act. For additional discussion of the effects on the Tax Cuts and Jobs Act including the impact of current tax reform in our consolidated financial statements, see Note 9 of the Notes to Consolidated Financial Statements.
A valuation allowance is provided to reserve for deferred tax assets if, based upon the available evidence, it is more likely than not that some or all of the deferred tax assets will not be realized. As of December 31, 2017, we had a valuation allowance of $392,000 offsetting our deferred tax assets.
Reserves for uncertain tax positions are recognized when the positions are more likely than not to not be sustained upon audit. Interest and penalties on uncertain tax positions are recorded in income tax expense. Our federal tax returns have been examined and settled through the 2012 tax year. There were no material uncertain tax positions recorded for the years presented in these statements.
Depreciation
Depreciation is computed using the straight-line method over an estimated useful life of three to 25 years for machinery and equipment. See Note 5 of the Notes to Consolidated Financial Statements. The determination of useful life requires judgment and includes significant estimates that management reassesses as circumstances warrant. Depreciation expense for the years ended December 31, 2017, 2016 and 2015 was $12.9 million, $25.4 million and $26.2 million, respectively. The reduction in depreciation expense during 2017 is the result of classifying our South Texas Properties and our Prospect Shipyard assets as assets held for sale during the first quarter of 2017, and suspending the recognition of depreciation expense for those assets.
Results of Operations
2017 Loss Provision - During 2017, we recorded contract losses totaling $34.5 million related to cost overruns and delays that we encountered in the newbuild construction of two multi-purpose service vessels that we are building for a customer within our Shipyard Division. The cost overruns were due to engineering and electrical complexities with the power and communications systems. We believe the best course of action for the Company is to perform additional engineering and construction planning to ensure we are meeting the contractual performance requirements for these vessels and mitigating any further construction risk. With the additional electrical engineering, planning and construction estimates, the estimated delivery dates of the vessels will be extended beyond the contractual delivery dates, and we estimate that the maximum amount of liquidated damages of $11.2 million will be incurred in the absence of a signed amendment with the customer. We have included the maximum liquidated damages in our 2017 loss provision above and reduced our estimate of the contract price. We continue to work with the customer to complete the contract in a manner that is acceptable to both parties; however, resolution with this customer could take several months. We can provide no assurance that we will be successful in signing an amendment to the contract, or that in the event we are successful in negotiating an amendment, as to when such an amendment will be signed or if such amendment will result in recovery of any cost overruns or liquidated damages that we have recognized to date.
30
Comparison of the years ended December 31, 2017 and 2016 (in thousands, except for percentages):
Consolidated
Twelve Months Ended December 31, | Increase or (Decrease) | ||||||||||||
2017 | 2016 | Amount | Percent | ||||||||||
Revenue | $ | 171,022 | $ | 286,326 | $ | (115,304 | ) | (40.3 | )% | ||||
Cost of revenue | 213,947 | 261,473 | (47,526 | ) | (18.2 | )% | |||||||
Gross profit (loss) | (42,925 | ) | 24,853 | (67,778 | ) | 272.7 | % | ||||||
Gross profit (loss) percentage | (25.1 | )% | 8.7 | % | |||||||||
General and administrative expenses | 17,800 | 19,670 | (1,870 | ) | (9.5 | )% | |||||||
Asset impairment | 7,672 | — | 7,672 | 100.0 | % | ||||||||
Operating income (loss) | (68,397 | ) | 5,183 | (73,580 | ) | (1,419.6 | )% | ||||||
Other income (expense): | |||||||||||||
Interest expense | (349 | ) | (332 | ) | (17 | ) | |||||||
Interest income | — | 24 | (24 | ) | |||||||||
Other income (expense) | (213 | ) | 681 | (894 | ) | ||||||||
Total Other income (expense) | (562 | ) | 373 | (935 | ) | (250.7 | )% | ||||||
Net income (loss) before income taxes | (68,959 | ) | 5,556 | (74,515 | ) | (1,341.2 | )% | ||||||
Income taxes | (24,193 | ) | 2,041 | (26,234 | ) | (1,285.4 | )% | ||||||
Net income (loss) | $ | (44,766 | ) | $ | 3,515 | $ | (48,281 | ) | (1,373.6 | )% | |||
Revenue - Our revenue for years ended December 31, 2017 and 2016 were $171.0 million and $286.3 million, respectively, representing a decrease of 40.3%. The decrease is primarily attributable to an overall decrease in work experienced in our facilities as a result of depressed oil and gas prices and the corresponding reduction in customer demand within all of our operating divisions. Additionally, we recorded contract losses totaling $34.5 million related to cost overruns and delays that we encountered in the newbuild construction of two multi-purpose service vessels that we are building for a customer as described above which includes the maximum amount of liquidated damages of $11.2 million as a reduction in contract price and included in our estimate of revenue for the year ended December 31, 2017. Pass-through costs as a percentage of revenue were 53.1% and 36.5% for the years ended December 31, 2017 and 2016, respectively. Pass-through costs, as described in Note 2 of the Notes to Consolidated Financial Statements, are included in revenue but have no impact on the gross profit recognized on a project for a particular period.
Gross profit (loss) - Our gross loss for the year ended December 31, 2017, was $42.9 million (25.1% of revenue) compared to a gross profit of $24.9 million (8.7% of revenue) for the year ended December 31, 2016. The decrease was primarily due to $34.5 million of contract losses incurred by our Shipyard Division related to the construction of two multi-purpose service vessels, $5.5 million of costs related to our South Texas Properties which are held for sale and lower margins on current work due to competitive pressures. This was partially offset by decreases in costs resulting from:
• | Reductions in workforce as we wrapped up and completed projects at our South Texas fabrication yards and Prospect shipyard, |
• | Reduced depreciation being recorded for our South Texas Properties and Prospect shipyard as these assets are classified as assets held for sale, and |
• | Continued cost reduction efforts implemented by management during the period. |
General and administrative expenses - Our general and administrative expenses were $17.8 million for the year ended December 31, 2017, compared to $19.7 million for the year ended December 31, 2016. The decrease in general and administrative expenses for the year ended December 31, 2017, was primarily attributable to lower bonuses accrued during 2017, employee reductions and continued cost reduction efforts implemented by management for the period.
Asset impairment - We recorded asset impairment charges of $7.7 million during the year ended December 31, 2017, primarily related to inventory in our Fabrication Division and related to our assets held for sale at our Prospect Shipyard as further discussed in Note 4 of the Notes to Consolidated Financial Statements. We had no asset impairment charges for the year ended December 31, 2016.
31
Other income (expense)- Other expense was $213,000 the year ended December 31, 2017, compared to other income of $681,000 for the year ended December 31, 2016. Other expense for the year ended December 31, 2017, was primarily due to losses on sales of two drydocks from our Shipyard Division. Other income for the prior period was primarily due to gains on sales of assets from our Fabrication Division recorded during 2016.
Income taxes - Our effective tax rate decreased to 35.1% for the year ended December 31, 2017, as compared to 36.7% for the year ended December 31, 2016. The decrease in our effective rate is primarily due to increases in executive compensation in excess of amounts that are tax deductible and $253,000 related to the recognition of the excess tax deficiency resulting from the difference between the deduction for tax purposes and the compensation cost recognized for financial reporting purposes created when common stock vests as required under ASU 2016-09, “Improvements to Employee Share-Based Payment Accounting,.” See also Note 9 of the Notes to Consolidated Financial Statements.
Operating Segments
Fabrication Division
Twelve Months Ended December 31, | Increase or (Decrease) | ||||||||||||
2017 | 2016 | Amount | Percent | ||||||||||
Revenue | $ | 57,880 | $ | 88,683 | $ | (30,803 | ) | (34.7 | )% | ||||
Gross profit (loss) | (1,941 | ) | 5,276 | (7,217 | ) | (136.8 | )% | ||||||
Gross profit (loss) percentage | (3.4 | )% | 5.9 | % | |||||||||
General and administrative expenses | 3,416 | 3,776 | (360 | ) | (9.5 | )% | |||||||
Asset impairment | 6,683 | — | 6,683 | 100.0 | % | ||||||||
Operating loss | $ | (12,040 | ) | $ | 1,500 | $ | (13,540 | ) | 902.7 | % | |||
Revenue - Revenue decreased $30.8 million for the year ended December 31, 2017, compared to 2016. The decrease is attributable to an overall decrease in work experienced in our fabrication yards as a result of depressed oil and gas prices and the corresponding reduction in customer demand for offshore fabrication projects. As discussed above, management classified our South Texas Properties as assets held for sale on February 23, 2017, in response to the underutilization of our Fabrication assets. As of December 31, 2017, all of our projects at our South Texas Properties have been completed or transferred to our Houma fabrication yard.
Gross profit (loss) - Gross loss from our Fabrication Division for the year ended December 31, 2017, was $1.9 million compared to a gross profit of $5.3 million for the year ended December 31, 2016. The decrease was due to lower revenue from decreased fabrication work related to decreases in fabrication demand and approximately $5.5 million of costs for our South Texas Properties which are held for sale. This was partially offset by decreases in costs resulting from reductions in workforce, gains on scrap sales as we wrapped up and completed projects at our South Texas fabrication yards, reduced depreciation being recorded for our South Texas Properties for the the year ended December 31, 2017, as these assets were classified as assets held for sale on February 23, 2017, and additional cost minimization efforts implemented by management for the period.
General and administrative expense - General and administrative expenses decreased $360,000 for the year ended December 31, 2017, compared to 2016. The decrease is primarily due to decreases in costs resulting from reductions in workforce as we wrapped up and completed projects at our South Texas fabrication yards and lower bonuses accrued during 2017, as a result of a combination of a smaller workforce and our consolidated operating loss. This was partially offset by expenses incurred to market our South Texas Properties for sale and payment of termination benefits during the first quarter of 2017 as we reduced the workforce and completed operations at our South Texas Properties.
Asset impairment - We had $6.7 million of asset impairment charges for the year ended December 31, 2017, compared to no asset impairment charges during the year ended December 31, 2016. Our asset impairment charges during 2017, related to impairments of inventory. See also Note 6 of the Notes to Consolidated Financial Statements.
32
Shipyard Division
Twelve Months Ended December 31, | Increase or (Decrease) | ||||||||||||
2017 | 2016 | Amount | Percent | ||||||||||
Revenue | $ | 52,699 | $ | 109,502 | $ | (56,803 | ) | (51.9 | )% | ||||
Gross profit (loss) | (44,870 | ) | 7,801 | (52,671 | ) | (675.2 | )% | ||||||
Gross profit (loss) percentage | (85.1 | )% | 7.1 | % | |||||||||
General and administrative expenses | 3,926 | 5,426 | (1,500 | ) | (27.6 | )% | |||||||
Asset impairment | $ | 989 | — | 989 | 100.0 | % | |||||||
Operating (loss) income | $ | (49,785 | ) | $ | 2,375 | $ | (52,160 | ) | (2,196.2 | )% | |||
Revenue - Revenue decreased $56.8 million for the year ended December 31, 2017, compared to 2016 due to the corresponding reduction in customer demand for shipbuilding and repair services supporting the oil and gas industry due to:
• | We reduced our estimate of the final contract price for the construction of two multi-purpose service vessels within or Shipyard Division by $11.2 million representing the maximum liquidated damages under a contract as described above. |
• | Depressed oil and gas prices that have caused a decrease in customer demand for newbuild vessel construction and vessel repair activity as well as the completion of a vessel that we tendered for delivery on February 6, 2017, that was rejected by the customer alleging certain technical deficiencies. We subsequently suspended work on the second vessel under contract with this customer. We successfully resolved our dispute with this customer and the customer accepted delivery of the first vessel less a reduction in the amounts owed under the contract of $233,000 in November 2017. We have also recommenced construction of the second vessel to be delivered in 2018 for the remaining contract price less $233,000. |
Gross profit (loss) - Gross loss was $52.7 million for the year ended December 31, 2017, compared to gross profit of $7.8 million for the year ended December 31, 2016. The decrease in profitability was primarily due to $34.5 million of contract losses related to the construction of two multi-purpose service vessels for which construction is currently continuing as described above.
General and administrative expense - General and administrative expenses decreased $1.5 million for the year ended December 31, 2017, compared to 2016 primarily due to reductions of administrative personnel related to consolidation of personnel duties from the LEEVAC transaction. See Note 11 of the Notes to Consolidated Financial Statements. Additionally, our Shipyard Division incurred lower bonuses accrued during 2017, as a result of a combination of a smaller workforce and our consolidated operating loss and cost reduction efforts implemented by management during the first part of 2016.
Asset Impairment - During the year ended December 31, 2017, we recorded an impairment of $989,000 related to our assets held for sale at our Prospect shipyard. See Note 4 of the Notes to Consolidated Financial Statements for additional information regarding the sale of assets at the Prospect Shipyard.
Services Division
Twelve Months Ended December 31, | Increase or (Decrease) | ||||||||||||
2017 | 2016 | Amount | Percent | ||||||||||
Revenue | $ | 65,445 | $ | 91,414 | $ | (25,969 | ) | (28.4 | )% | ||||
Gross profit | 4,575 | 12,420 | (7,845 | ) | (63.2 | )% | |||||||
Gross profit percentage | 7.0 | % | 13.6 | % | |||||||||
General and administrative expenses | 2,701 | 3,314 | (613 | ) | (18.5 | )% | |||||||
Operating income | $ | 1,874 | $ | 9,106 | $ | (7,232 | ) | (79.4 | )% | ||||
Revenue - Revenue decreased $26.0 million for the year ended December 31, 2017, compared to 2016 due to an overall decrease in work experienced as a result of oil and gas prices and the corresponding reduction in customer demand for oil and gas related service projects.
Gross profit - Gross profit decreased $7.8 million for the year ended 2017, compared to 2016 due to decreased revenue discussed above and lower margins on new work performed during 2017.
33
General and administrative expense - General and administrative expenses decreased $613,000 for the year ended December 31, 2017, compared to 2016 due to lower bonuses accrued during 2017, as a result of a combination of a smaller workforce and our consolidated operating loss.
Corporate Division
Twelve Months Ended December 31, | Increase or (Decrease) | ||||||||||||
2017 | 2016 | Amount | Percent | ||||||||||
Revenue | $ | — | $ | — | $ | — | — | % | |||||
Gross profit (loss) | (689 | ) | (644 | ) | (45 | ) | (7.0 | )% | |||||
Gross profit (loss) percentage | n/a | n/a | |||||||||||
General and administrative expenses | 7,757 | 7,154 | 603 | 8.4 | % | ||||||||
Operating income (loss) | $ | (8,446 | ) | $ | (7,798 | ) | $ | (648 | ) | 8.3 | % | ||
General and administrative expenses - General and administrative expenses for our Corporate Division increased primarily due to a restructuring of our Corporate Division with allocation of personnel that were previously included in our operating divisions related to shared services that are now included within our Corporate Division during 2017 as well as expenses incurred for advisors to assist in a strategic financial analysis project in anticipation of the proceeds to be received from the sale of our South Texas Properties. Additionally, we have incurred increased legal fees as we pursue collection of claims against two customers. This has been partially offset by lower bonuses accrued during 2017 as a result of our consolidated operating loss.
Comparison of the years ended December 31, 2016 and 2015 (in thousands, except for percentages):
2015 Loss Provision - During the year ended December 31, 2015, we incurred contract losses of $24.5 million related to a decrease in the contract price due to final weight re-measurements and our inability to recover certain costs on disputed change orders related to a large deepwater project which was delivered in 2015. In the second quarter of 2016, we initiated legal action to recover our costs from these disputed change orders. No recoveries from our legal action were included in the preparation of our Consolidated Financial Statements for the years ended December 31, 2016 or 2015.
In addition, we accrued contract losses of approximately $9.4 million during the year ended December 31, 2015, resulting from increases in our projected unit labor rates of our fabrication facilities. Our increases in unit labor rates were driven by our inability to absorb fixed costs due to decreases in expected oil and gas fabrication activity.
34
Consolidated
Twelve Months Ended December 31, | Increase or (Decrease) | ||||||||||||
2016 | 2015 | Amount | Percent | ||||||||||
Revenue | $ | 286,326 | $ | 306,120 | $ | (19,794 | ) | (6.5 | )% | ||||
Cost of revenue | 261,473 | 321,276 | (59,803 | ) | (18.6 | )% | |||||||
Gross profit (loss) | 24,853 | (15,156 | ) | 40,009 | 264.0 | % | |||||||
Gross profit percentage | 8.7 | % | (5.0 | )% | |||||||||
General and administrative expenses | 19,670 | 16,256 | 3,414 | 21.0 | % | ||||||||
Asset impairment | — | 7,202 | (7,202 | ) | (100.0 | )% | |||||||
Operating (loss) income | 5,183 | (38,614 | ) | 43,797 | (113.4 | )% | |||||||
Other income (expense): | |||||||||||||
Interest expense | (332 | ) | (165 | ) | (167 | ) | |||||||
Interest income | 24 | 26 | (2 | ) | |||||||||
Other income (expense) | 681 | 20 | 661 | ||||||||||
Total Other income (expense) | 373 | (119 | ) | 492 | 413.4 | % | |||||||
(Loss) income before income taxes | 5,556 | (38,733 | ) | 44,289 | 114.3 | % | |||||||
Income taxes | 2,041 | (13,369 | ) | 15,410 | 115.3 | % | |||||||
Net (loss) income | $ | 3,515 | $ | (25,364 | ) | $ | 28,879 | 113.9 | % | ||||
Revenue - Our revenue for years ended December 31, 2016 and 2015 were $286.3 million and $306.1 million, respectively, representing a decrease of 6.5%. The decrease is primarily attributable to an overall decrease in work experienced in our fabrication yards as a result of depressed oil and gas prices and the corresponding reduction in activity in the GOM. Additionally, our Fabrication Division completed a 1,200 foot jacket, piles and an approximate 450 short ton topside during 2015 with no similar project in 2016. Our decrease in revenue earned from offshore fabrication work was partially offset by the contracts acquired in the LEEVAC transaction, which contributed $75.6 million in revenue for the year ended December 31, 2016, and, to a lesser extent, experienced a decrease of pass through costs in 2016 as compared to 2015. Pass-through costs, as described in Note 2 in the Notes to Consolidated Financial Statements, are included in revenue but have no impact on the gross profit recognized on a project for a particular period. Pass-through costs as a percentage of revenue were 36.5% and 44.4% for the years ended December 31, 2016 and 2015, respectively.
Gross profit (loss) - Our gross profit (loss) for the years ended December 31, 2016 and 2015 was $24.9 million (8.7% of revenue) and $(15.2) million (5.0% of revenue), respectively. The increase in gross profit was primarily due to:
• | $24.5 million of contract losses related to a decrease in the contract price due to final weight re-measurements and our inability to recover certain costs on disputed change orders related to a large deepwater project delivered in 2015 as referred to above; |
• | $9.4 million of contract losses due to projected increases in our unit labor rates during the fourth quarter of 2015 as referred to above; |
• | significant cost cutting measures implemented in 2016 in order to right-size our operations in response to the decreases in work at our fabrication facilities which include wage adjustments, employee benefit reductions and workforce reductions; and |
• | amortization of $5.2 million of non-cash deferred revenue related to the purchase price fair value of the contracts acquired in the LEEVAC transaction for 2016. |
General and administrative expenses - Our general and administrative expenses were $19.7 million for the year ended December 31, 2016, compared to $16.3 million for the year ended December 31, 2015. The increase in general and administrative expenses was primarily attributable to the LEEVAC transaction which added $2.9 million in general and administrative expenses and an increase in stock-based compensation expense of $418,000 during the year ended December 31, 2016 as compared to December 31, 2015, partially offset by cost cutting efforts implemented as a result of the downturn in the oil and gas industry.
Asset impairment - We recorded asset impairment charges of $7.2 million during the year ended December 31, 2015, related to our assets held for sale. We had no asset impairment charges for the year ended December 31, 2016.
35
Interest expense - The Company had net interest expense of $308,000 for the year ended December 31, 2016, compared to net interest expense of $139,000 for 2015. The increase in net interest expense was primarily driven by interest expense associated with the unused commitment fee on our credit agreement increasing from 0.25% to 0.50%.
Other income - Other income for the year ended December 31, 2016, was $681,000 compared to $20,000 for 2015. Other income for the year ended December 31, 2016, primarily represents gains on sales of cranes at our South Texas facility.
Income taxes - Our effective income tax rate for the year ended December 31, 2016, was 36.7% compared to an effective tax rate of 34.5% for 2015. The increase in the effective tax rate is primarily due to the impact of alternative minimum taxes and state income taxes for our operations in Louisiana.
Operating Segments
Fabrication Division
Twelve Months Ended December 31, | Increase or (Decrease) | ||||||||||||
2016 | 2015 | Amount | Percent | ||||||||||
Revenue | $ | 88,683 | $ | 151,576 | $ | (62,893 | ) | (41.5 | )% | ||||
Gross (loss) profit | 5,276 | (36,990 | ) | 42,266 | 114.3 | % | |||||||
Gross profit percentage | 5.9 | % | (24.4 | )% | |||||||||
General and administrative expenses | 3,776 | 5,103 | (1,327 | ) | (26.0 | )% | |||||||
Asset impairment | — | 7,202 | (7,202 | ) | (100.0 | )% | |||||||
Operating (loss) income | $ | 1,500 | $ | (49,295 | ) | $ | 50,795 | 103.0 | % | ||||
Revenue - Revenue decreased $62.9 million for the year ended December 31, 2016, compared to 2015. The decrease is attributable to an overall decrease in work experienced in our fabrication yards as a result of depressed oil and gas prices and the corresponding reduction in customer demand for offshore fabrication projects. During 2015, we completed the fabrication of a 1,200 foot jacket, piles and an approximate 450 short ton topside with no similar project in 2016.
Gross (loss) profit - Gross profit increased $42.3 million for the year ended December 31, 2016, compared to 2015. The increase is due to:
• | $24.5 million of contract losses related to a decrease in the contract price due to final weight re-measurements and our inability to recover certain costs on disputed change orders related to a large deepwater project delivered in 2015 as referred to above; |
• | $9.4 million of contract losses due to projected increases in our unit labor rates during the fourth quarter of 2015 as referred to above; and |
• | Significant cost cutting measures implemented in 2016 in order to right-size our operations in response to the decreases in work at our fabrication facilities. |
General and administrative expenses - General and administrative expenses decreased $1.3 million for the year ended December 31, 2016, compared to 2015 due to cost cutting measures implemented during 2016 in response to decreases in work at our fabrication facilities and a decrease in the percentage of allocation of administrative expenses from our corporate office.
Asset impairment - We had no asset impairment charges for the year ended December 31, 2016. We recorded asset impairment charges of $7.2 million during the year ended December 31, 2015, related to our assets held for sale.
36
Shipyard Division
Twelve Months Ended December 31, | Increase or (Decrease) | ||||||||||||
2016 | 2015 | Amount | Percent | ||||||||||
Revenue | $ | 109,502 | $ | 59,601 | $ | 49,901 | 83.7 | % | |||||
Gross profit | 7,801 | 8,750 | (949 | ) | (10.8 | )% | |||||||
Gross profit percentage | 7.1 | % | 14.7 | % | |||||||||
General and administrative expenses | 5,426 | 1,055 | 4,371 | 414.3 | % | ||||||||
Operating (loss) income | $ | 2,375 | $ | 7,695 | $ | (5,320 | ) | (69.1 | )% | ||||
Revenue - Revenue increased $49.9 million for the year ended December 31, 2016, compared to 2015 due to the contracts acquired in the LEEVAC transaction, which contributed $75.6 million in revenue for the year ended December 31, 2016. Included in revenue for 2016 is amortization of $5.2 million of non-cash deferred revenue related to the purchase price fair value of the contracts acquired in the LEEVAC transaction for 2016. The increase was partially offset by decreases in marine work due to the downturn in the oil and gas industry.
Gross profit - Gross profit decreased $0.9 million for the year ended December 31, 2016, compared to 2015 due to consolidation of jobs at our shipyard in Houma, Louisiana, and tighter margins for other jobs in progress due to the downturn in the oil and gas industry
General and administrative expense - General and administrative expenses increased $4.4 million for the year ended December 31, 2016, compared to 2015 due to the expenses associated with the operations acquired in the LEEVAC transaction which added $2.9 million in general and administrative expenses and an increase in the percentage allocation of administrative expenses from our corporate office.
Services Division
Twelve Months Ended December 31, | Increase or (Decrease) | ||||||||||||
2016 | 2015 | Amount | Percent | ||||||||||
Revenue | $ | 91,414 | $ | 100,431 | $ | (9,017 | ) | (9.0 | )% | ||||
Gross profit | 12,420 | 13,937 | (1,517 | ) | (10.9 | )% | |||||||
Gross profit percentage | 13.6 | % | 13.9 | % | |||||||||
General and administrative expenses | 3,314 | 2,584 | 730 | 28.3 | % | ||||||||
Operating (loss) income | $ | 9,106 | $ | 11,353 | $ | (2,247 | ) | (19.8 | )% | ||||
Revenue - Revenue decreased $9.0 million for the year ended December 31, 2016, compared to 2015 due to decreases in work and tighter margins due to the downturn in the oil and gas industry, particularly in the latter half of 2016.
Gross profit - Gross profit decreased $1.5 million for the year ended December 31, 2016, compared to 2015 due to decreases in work and tighter margins for other jobs in progress due to the downturn in the oil and gas industry, particularly in the latter half of 2016.
General and administrative expenses - General and administrative expenses increased $0.7 million for the year ended December 31, 2016, compared to 2015 due to increased bonus expense and an increase in the allocation percentage of administrative expenses from our corporate office.
37
Corporate Division
Twelve Months Ended December 31, | Increase or (Decrease) | ||||||||||||
2016 | 2015 | Amount | Percent | ||||||||||
Revenue | $ | — | $ | — | $ | — | n/a | ||||||
Gross profit | (644 | ) | (853 | ) | 209 | 24.5 | % | ||||||
Gross profit percentage | n/a | n/a | |||||||||||
General and administrative expenses | 7,154 | 7,514 | (360 | ) | (4.8 | )% | |||||||
Operating (loss) income | $ | (7,798 | ) | $ | (8,367 | ) | $ | 569 | 6.8 | % | |||
38
Liquidity and Capital Resources
Our immediate liquidity remains our cash on hand, availability of future drawings from our credit agreement and collections of accounts receivable. In the first quarter of 2018, we drew $10 million under our credit agreement, and as of March 9, 2018, we had approximately $10 million in cash with approximately $27.5 million in availability under our credit agreement. We are implementing several strategies to diversify the business, increase backlog, reduce operating expenses and monetize assets. See also Note 1 of the Notes to Consolidated Financial Statements for more information on our business outlook.
Historically, we have funded our business activities through cash generated from operations. During the year ended December 31, 2017, we incurred operating losses of $68.4 million as discussed above in our "Executive Overview and Summary" which has significantly reduced our cash on hand. At December 31, 2017, cash and cash equivalents totaled $9.0 million compared to $51.2 million at December 31, 2016, with no borrowings outstanding under our credit agreement. Working capital was $130.5 million and our ratio of current assets to current liabilities was 3.7 to 1 at December 31, 2017. Our primary source of cash for the year ended December 31, 2017, was the collection of accounts receivable under various customer contracts. At December 31, 2017, our contracts receivable balance was $28.5 million. We have subsequently collected $20.7 million of the contracts receivable balance through March 2, 2018.
Anticipated Proceeds from Asset Sales
Our South Texas Properties, with a combined net book value of $102.7 million, are held for sale. We expect to sell equipment throughout the year and the South Yard, which is currently subject to a purchase option agreement during the first half of 2018. The North Yard is also currently held for sale. We can provide no assurances that we will be successful in selling these assets. If we are unsuccessful in selling these assets, we could be forced to rely on our line of credit as our primary source of liquidity, or make significant cuts in operating expenses.
On December 20, 2017, we granted an exclusive option to a third party for the purchase of our South Yard for a purchase price of $55 million. This option runs through April 25, 2018, which may be extended through May 25, 2018, if proper written notice and additional earnest monies are provided in accordance with the agreement. The terms of the agreement are subject to normal and customary conditions, including the third party's right to conduct inspections of the property related to confirmation of title, surveys, environmental conditions, easements and access rights. In consideration for the option to purchase the South Yard, the third party deposited $750,000 of earnest money on January 3, 2018, which is nonrefundable in the event the third party cancels the agreement.
Our Credit Agreement
On June 9, 2017, we entered into a $40 million credit agreement with a lending institution, as sole lender. The credit agreement matures June 9, 2019, and may be used for issuing letters of credit and/or general corporate and working capital purposes. Additionally, we amended our credit agreement with our lending institution on December 29, 2017, and then again on February 26, 2018, lowering the base tangible net worth requirement from the initial $230 million to $185 million in the minimum tangible net worth covenant. In addition, the Second Amendment to our credit agreement revises the calculation for the minimum tangible net worth covenant to include 50% of any gain attributable to the sale of our South Texas Properties. This action was necessary to avoid a potential breach of the covenant at the end of 2018. We believe that the new credit agreement, as amended will provide us with sufficient additional working capital flexibility to support our ongoing operations, respond to market opportunities and expand operations as backlog improves.
Interest on drawings under the credit agreement may be designated, at our option, as either Base Rate (as defined in the credit agreement) or LIBOR plus 2.0% per annum. Unused commitment fees on the undrawn portion of the facility are 0.4% per annum, and interest on undrawn stated amounts under letters of credit issued by the lenders is 2.0% per annum. The credit agreement is secured by substantially all of our assets (other than the South Texas Properties).
We must comply with the following financial covenants each quarter during the term of the facility:
i. | Ratio of current assets to current liabilities of not less than 1.25:1.00; |
ii. | Minimum tangible net worth requirement of at least the sum of: |
a) | $185 million; plus |
b) | An amount equal to 50% of consolidated net income for each fiscal quarter ending after June 30, 2017, including 50% of any gain attributable to the sale of our South Texas Properties (with no deduction for a net loss in any such fiscal quarter); plus |
39
c) | 100% of all net proceeds of any issuance of any stock or other equity after deducting of any fees, commissions, expenses and other costs incurred in such offering; and |
iii. | Ratio of funded debt to tangible net worth of not more than 0.5:1.00. |
Concurrent with our execution of the credit agreement, we terminated our prior credit agreement with another lending institution. At the time of the termination, there was approximately $4.6 million of letters of credit outstanding. All were reissued as new letters of credit under the credit agreement and accepted by the beneficiaries.
Availability under our credit agreement for future, additional letters of credit and borrowings was $34.5 million as of December 31, 2017. As of December 31, 2017, we were in compliance with all of our covenants. During January 2018, we drew $10 million under our credit agreement and such amount remains outstanding under the credit agreement as of March 9, 2018.
Anticipated Insurance Recoveries
On August 25, 2017, our South Texas Properties were impacted by Hurricane Harvey, which made landfall as a category 4 hurricane as discussed in "Executive Overview and Summary" above. Our initial estimate of the claim due to the Company (which is based primarily on third party quotes) approximates $21.5 million; however, our insurance adjuster has not approved these amounts. Our insurance underwriters have made an initial advance payment of $6.0 million, and we have recorded a liability for future repairs of $3.3 million which is included in accrued expenses and other liabilities on our balance sheet at December 31, 2017. Our final assessment of the loss incurred to our South Texas Properties as well as the amount of insurance proceeds we will receive could be more or less than this amount when the claim is ultimately settled and such differences could be material.
Registration Statement
On November 17, 2017, we filed a S-3 Registration Statement. The registration statement was declared effective on November 27, 2017, and will allow us to issue up to $200 million in either debt or equity securities or a combination of both. This registration statement will allow us the flexibility to raise capital quickly to fund working capital requirements for upcoming projects such as the SeaOne Project discussed previously.
Primary Liquidity Requirements
Our primary liquidity requirements for 2018 and beyond are for the costs associated with fabrication and shipyard projects and capital expenditures related to the creation of our EPC Division and enhancements to our shipyards. Future capital expenditures will be highly dependent upon the amount and timing of future projects. We anticipate capital expenditures for 2018 to range between $2.0 million to $8.0 million primarily for the following:
i. | capital improvements to our Houma Shipyard which include a United States Maritime Administration ("MARAD") grant of approximately $0.8 million, |
ii. | capital improvements to our Houma Fabrication Yard to service the SeaOne Project, and |
iii. | expansion of our Corporate Office and investment in information technology systems in support of the SeaOne Project. |
Despite current year losses, we remain optimistic with respect to the future for the Company. We believe that recent losses are due to complexities that are specific to the vessels we are constructing. We have seen improvements in bidding opportunities and we have been successful in obtaining new project awards which we believe will be profitable to us. Additionally, SeaOne selected us as the prime contractor for the engineering, procurement, construction, installation, commissioning and start-up, also known as EPCIC/S, for their SeaOne Project. This project will include overseeing the engineering, construction and installation of modules for an export facility in Gulfport, Mississippi, and import facilities in South America. We are working to strengthen our internal project management capabilities through the hiring of additional personnel to service this potential project. The SeaOne Project is expected to start during mid-2018 with construction expected to start later in 2018 or early 2019.
Additionally, we successfully resolved our prior dispute with a customer within our Shipyard Division. On February 6, 2017, this customer rejected delivery of the first of two offshore service vessels that we completed and tendered for delivery, alleging certain technical deficiencies existed with respect to the vessel. During the fourth quarter of 2017, we settled our disputes, and the customer accepted delivery of the first of two vessels less a reduction in the amounts owed under each contract of $233,000 related to discrepancies of dead weight tonnage. We also recommenced construction of the second vessel to be delivered in 2018.
Additionally, our Board of Directors has elected to suspend our quarterly dividend of $0.01 per share consistent with our effort to conserve cash. Future declaration and payment of dividends, if any, is at the discretion of our Board and will depend on our liquidity position, future working capital requirements and other factors deemed relevant by the Board.
40
We believe that the cash we expect to generate from future operating activities, funds available under our credit agreement, anticipated insurance recoveries, anticipated proceeds from the sales of our South Texas Properties and our ability to raise additional capital through debt or equity offerings will be sufficient to fund our capital expenditures, issue future letters of credit and meet our working capital needs through the next year to continue our operations, successfully execute our strategy and satisfy our contractual obligations.
Cash Flows for the Years Ended December 31, 2017, 2016 and 2015 (in thousands):
2017 | 2016 | 2015 | ||||||||
Operating activities | $ | (39,385 | ) | $ | 14,568 | $ | 10,694 | |||
Investing activities | (1,135 | ) | 2,698 | (6,007 | ) | |||||
Financing activities | $ | (1,664 | ) | $ | (927 | ) | $ | (5,944 | ) | |
Operating activities:
• | Negative cash flows from operations for the year ended December 31, 2017, compared to positive cash flows from operations for the year ended December 31, 2016, was primarily due to: |
i. | $34.5 million in operating losses relate to cost overruns and delays that we encountered in the newbuild construction of two multi-purpose service vessels construction which is continuing as described above. |
ii. | Progress on liabilities from assumed contracts in the LEEVAC transaction. While our purchase price for the acquisition of the LEEVAC assets during 2016 was $20 million, we received a net $3.0 million in cash from the seller for the assumption of certain net liabilities and settlement payments on ongoing shipbuilding projects of $23 million that were assigned to us in the transaction. We have significantly progressed these contracts, which in turn has resulted in utilization of the working capital and settlement payments received during 2016. |
iii. | Build-up of costs for contracts in progress related to a customer in our Shipyard Division with significant milestone payments occurring in the later stages of the projects which are expected to occur in the first half of 2019. |
• | The increase in cash provided by operations for the year ended December 31, 2016, compared to 2015 was primarily due to increased gross profit. |
Investing activities:
• | The decrease in cash provided by investing activities for the year ended December 31, 2017, compared to 2016 was primarily due to reduced proceeds from the sale of assets during 2017 and $3.0 million in cash received in the LEEVAC transaction during 2016. This was partially offset by reduced capital expenditures during 2017. |
• | The increase in cash provided by investing activities for the year ended December 31, 2016, compared to 2015 was primarily due to proceeds received from the sale of assets (primarily three cranes at our South Texas facility) of $6.5 million and $3.0 million in cash received in the LEEVAC transaction. |
Financing activities:
• | The increase in cash used in financing activities for the year ended December 31, 2017, compared to 2016 was due to the cash payments made to taxing authorities on behalf of employees for their vesting of common stock. During the year ended December 31, 2017, we received $2.0 million from borrowings under our new line of credit which were immediately repaid. |
• | The decrease in cash used in financing activities for the year ended December 31, 2016, compared to 2015 was due to the reduction in the cash dividend in 2016. |
Contractual Obligations and Commitments
The following table sets forth an aggregation of our contractual obligations and commitments as of December 31, 2017 (in thousands).
41
Total | Payments Due by Period | ||||||||||||||||||
Less Than 1 Year | 1 to 3 Years | 3 to 5 Years | Thereafter | ||||||||||||||||
Purchase commitment – equipment (1) | $ | 9 | $ | 9 | $ | — | $ | — | $ | — | |||||||||
Purchase commitment – material and services (2) | 85,445 | 59,560 | 25,885 | — | — | ||||||||||||||
Operating leases (3) | 3,009 | 572 | 1,163 | 1,266 | 8 | ||||||||||||||
Total | $ | 88,463 | $ | 60,141 | $ | 27,048 | $ | 1,266 | $ | 8 | |||||||||
(1) | “Purchase commitment – equipment” are commitments related to purchase order agreements for equipment. |
(2) | “Purchase commitment – material and services” are commitments related to purchase order agreements for contracts in progress. |
(3) | "Operating leases" are commitments for office space and facilities. |
Off-Balance Sheet Arrangements
We are not a party to any contract or other obligation not included on our balance sheet that has, or is reasonably likely to have a current or future effect on our financial condition, changes in financial condition, revenues or expenses, results of operations, liquidity, capital expenditures or capital resources.
Other Matters
Not applicable.
Item 7A. Quantitative and Qualitative Disclosures About Market Risk
We do not have operations subject to material risk of foreign currency fluctuations, nor do we use derivative financial instruments in our operations or investment portfolio. We have a credit agreement with a lending institution that provides for a $40 million credit agreement that allows us to use up to the full amount of the available borrowing base for letters of credit and for general corporate purposes. The annual interest rates applicable to amounts outstanding under the credit agreement are either (i) a base rate established by the lending institution, or (ii) a LIBOR rate (defined in the credit agreement) plus 2.0% per annum (as selected at our option). The commitment fee on the undrawn portion of the facility and the letter of credit fee on undrawn stated amounts under letters of credit issued by the lenders is 0.40% per annum and 2.0% per annum, respectively. At December 31, 2017, we had no outstanding borrowings under the credit agreement, and we had outstanding letters of credit totaling $5.5 million. After consideration of outstanding letters of credit, the availability of the unused portion of the credit agreement was $34.5 million. As of March 9, 2018, we had approximately $10 million in cash with approximately $27.5 million in availability under our credit agreement.
Item 8. Financial Statements and Supplementary Data
In this report our consolidated financial statements of and the accompanying notes appear on pages F-1 through F-21 and are incorporated herein by reference. See Index to Consolidated Financial Statements on Page 46.
Item 9. Changes in and Disagreements With Accountants on Accounting and Financial Disclosure
None.
Item 9A. Controls and Procedures
The Company maintains disclosure controls and procedures that are designed to ensure that information required to be disclosed by the Company in the reports that it files or submits under the Securities Exchange Act of 1934 is recorded, processed, summarized and reported within the time periods specified in the SEC rules and forms, and that such information is communicated to the Company’s management, including its Chief Executive Officer and Chief Financial Officer, as appropriate, to allow timely decisions regarding required disclosure. The Company’s management, with the participation of the Company’s Chief Executive Officer and Chief Financial Officer, has evaluated the effectiveness of our disclosure controls and procedures (as defined in Rule 13a-15(e) under the Securities Exchange Act of 1934) as of the end of the period covered by this report. Based on this evaluation, our Chief Executive Officer and Chief Financial Officer have concluded that the design and operation of our disclosure controls and procedures were effective as of the end of the period covered by this report.
Management’s Report on Internal Control Over Financial Reporting
Our management is responsible for establishing and maintaining adequate internal control over financial reporting, as such term is defined in Exchange Act Rule 13a-15(f). Under the supervision and with the participation of our management, including
42
our principal executive officer and principal financial officer, we conducted an evaluation of the effectiveness of our internal control over financial reporting based on the framework in Internal Control – Integrated Framework issued by the Committee of Sponsoring Organizations of the Treadway Commission (2013 framework). Based on our evaluation under the framework in Internal Control – Integrated Framework, our management concluded that our internal control over financial reporting was effective as of December 31, 2017.
The effectiveness of our internal control over financial reporting as of December 31, 2017, has been audited by Ernst & Young LLP, an independent registered public accounting firm, as stated in their report dated March 9, 2018, which is included herein.
43
Report of Independent Registered Public Accounting Firm
To the Shareholders and the Board of Directors of Gulf Island Fabrication, Inc.
Opinion on Internal Control over Financial Reporting
We have audited Gulf Island Fabrication, Inc.’s internal control over financial reporting as of December 31, 2017, based on criteria established in Internal Control-Integrated Framework issued by the Committee of Sponsoring Organizations of the Treadway Commission (2013 Framework) (the COSO criteria). In our opinion, Gulf Island Fabrication, Inc. (the Company) maintained, in all material respects, effective internal control over financial reporting as of December 31, 2017, based on the COSO criteria.
We also have audited, in accordance with the standards of the Public Company Accounting Oversight Board (United States) (PCAOB), the consolidated balance sheets of the Company as of December 31, 2017 and 2016, the related consolidated statements of operations, shareholders’ equity and cash flows for each of the three years in the period ended December 31, 2017, and the related notes and our report dated March 9, 2018, expressed an unqualified opinion thereon.
Basis for Opinion
The Company’s management is responsible for maintaining effective internal control over financial reporting and for its assessment of the effectiveness of internal control over financial reporting included in the accompanying Management’s Report on Internal Control Over Financial Reporting. Our responsibility is to express an opinion on the Company’s internal control over financial reporting based on our audit. We are a public accounting firm registered with the PCAOB and are required to be independent with respect to the Company in accordance with the U.S. federal securities laws and the applicable rules and regulations of the Securities and Exchange Commission and the PCAOB.
We conducted our audit in accordance with the standards of the PCAOB. Those standards require that we plan and perform the audit to obtain reasonable assurance about whether effective internal control over financial reporting was maintained in all material respects.
Our audit included obtaining an understanding of internal control over financial reporting, assessing the risk that a material weakness exists, testing and evaluating the design and operating effectiveness of internal control based on the assessed risk, and performing such other procedures as we considered necessary in the circumstances. We believe that our audit provides a reasonable basis for our opinion.
Definitions and Limitations of Internal Control over Financial Reporting
A company’s internal control over financial reporting is a process designed to provide reasonable assurance regarding the reliability of financial reporting and the preparation of financial statements for external purposes in accordance with generally accepted accounting principles. A company’s internal control over financial reporting includes those policies and procedures that (1) pertain to the maintenance of records that, in reasonable detail, accurately and fairly reflect the transactions and dispositions of the assets of the company; (2) provide reasonable assurance that transactions are recorded as necessary to permit preparation of financial statements in accordance with generally accepted accounting principles, and that receipts and expenditures of the company are being made only in accordance with authorizations of management and directors of the company; and (3) provide reasonable assurance regarding prevention or timely detection of unauthorized acquisition, use, or disposition of the company’s assets that could have a material effect on the financial statements.
Because of its inherent limitations, internal control over financial reporting may not prevent or detect misstatements. Also, projections of any evaluation of effectiveness to future periods are subject to the risk that controls may become inadequate because of changes in conditions, or that the degree of compliance with the policies or procedures may deteriorate.
/s/ Ernst & Young LLP
New Orleans, Louisiana
March 9, 2018
44
Item 9B. Other Information
Not applicable.
45
PART III
Item 10. Directors, Executive Officers and Corporate Governance
The information regarding executive officers called for by this item may be found following Item 4 of this report on Form 10-K under the caption “Executive Officers of the Registrant” and is incorporated herein by reference.
We have adopted a Code of Ethics for the Chief Executive Officer, the Chief Financial Officer (the principal financial officer), and the Chief Accounting Officer (the principal accounting officer) and persons performing similar functions (the “Code of Ethics”) and a Code of Business Conduct and Ethics, which applies to all employees and directors, including the Chief Executive Officer, the Chief Financial Officer (the principal financial officer), the Chief Accounting Officer (the principal accounting officer) and persons performing similar functions. These codes are available to the public on our website at www.gulfisland.com. Any substantive amendments to the Code of Ethics or any waivers granted under the Code of Ethics will be disclosed within four business days of such event on our website. Such information will remain available on our website for at least 12 months.
The remaining information called for by this item may be found in our definitive Proxy Statement prepared in connection with the 2018 Annual Meeting of Shareholders and is incorporated herein by reference.
Item 11. Executive Compensation
Information called for by this item may be found in our definitive Proxy Statement prepared in connection with the 2018 Annual Meeting of Shareholders and is incorporated herein by reference.
Item 12. Security Ownership of Certain Beneficial Owners and Management and Related Stockholders Matters
Information regarding security ownership of certain beneficial owners and management called for by this item may be found in our definitive Proxy Statement prepared in connection with the 2018 Annual Meeting of Shareholders and is incorporated herein by reference.
Equity Compensation Plan Information
The following table provides information about our shares of common stock that may be issued upon the exercise of options, warrants and rights under all of our existing equity compensation plans as of December 31, 2017.
Plan Category | Number of securities to be issued upon exercise of outstanding options, warrants and rights | Weighted-average exercise price of outstanding options, warrants and rights | Number of securities remaining available for future issuance under equity compensation plans (excluding securities reflected in column 1) | ||||||
Equity compensation plans approved by security holders | 445,126 | N/A | 833,443 | ||||||
Equity compensation plans not approved by security holders | — | — | |||||||
Total | 445,126 | (1) | 833,443 | (2) | |||||
(1) | Represents shares issuable pursuant to the terms of outstanding restricted stock awards. These awards are not reflected in the next column as they do not have an exercise price. |
(2) | There are 620,682 shares remaining available for issuance under the 2015 Stock Incentive Plan, 141,185 shares remaining available under the 2011 Stock Incentive Plan, and 71,576 shares remaining available under the Long-Term Incentive Plan. |
Item 13. Certain Relationships and Related Transactions, and Director Independence
Information called for by this item may be found in our definitive Proxy Statement prepared in connection with the 2018 Annual Meeting of Shareholders and is incorporated herein by reference.
46
Item 14. Principal Accounting Fees and Services
Information called for by this item may be found in our definitive Proxy Statement prepared in connection with the 2018 Annual Meeting of Shareholders and is incorporated herein by reference.
47
PART IV
Item 15. Exhibits, Financial Statement Schedules
The following financial statements, schedules and exhibits are filed as part of this Report:
(i) Financial Statements
Page | |
Report of Independent Registered Public Accounting Firm | F-1 |
Consolidated Balance Sheets at December 31, 2017 and December 31, 2016 | F-2 |
Consolidated Statements of Operations for the Years Ended December 31, 2017, 2016, and 2015 | F-3 |
Consolidated Statements of Changes in Shareholders’ Equity for the Years Ended December 31, 2017, 2016, and 2015 | F-4 |
Consolidated Statements of Cash Flows for the Years Ended December 31, 2017, 2016, and 2015 | F-5 |
Notes to Consolidated Financial Statements | F-6 |
(ii) Schedules
Other schedules have not been included because they are not required, not applicable, immaterial, or the information required has been included elsewhere herein.
(iii) Exhibits
See Exhibit Index on page E-1. The Company will furnish to any eligible shareholder, upon written request, a copy of any exhibit listed upon payment of a reasonable fee equal to the Company’s expenses in furnishing such exhibit. Such requests should be addressed to:
Investor Relations
Gulf Island Fabrication, Inc.
16225 Park Ten Place, Suite 280
Houston, Texas 77084
48
GLOSSARY OF CERTAIN TECHNICAL TERMS
blasting and coating facility: | Building and equipment used to clean steel products and prepare them for coating with marine paints and other coatings. | |
compressed gas liquids | Compressed gas liquids ("CGL") refers to natural gas products that have been processed using compression and cooling to prepare the products for transportation and use in an end market. | |
coping machine: | A computerized machine that cuts ends of tubular pipe sections to allow for changes in weld bevel angles and fits onto other tubular pipe sections. | |
deck: | The component of a platform on which development drilling, production, separating, gathering, piping, compression, well support, crew quartering and other functions related to offshore oil and gas development are conducted. | |
direct labor hours: | Hours worked by employees directly involved in the production of the Company’s products. These hours do not include support personnel hours such as maintenance, warehousing and drafting. | |
EPC: | Engineering, procurement and construction phases of a complex project; EPC typically refers to a contract that requires the project management and coordination of these significant activities related to an EPC project. | |
floating production platform: | Floating structure that supports offshore oil and gas production equipment (MinDOC, TLP, FPSO, SPAR). | |
FPSO: | Floating Production Storage and Offloading vessel. A floating vessel used by the offshore oil and gas industry for the production and processing of hydrocarbons, and for the storage of oil. | |
graving dock: | A box shaped basin made of steel sheet pile walls and concrete floor into which a vessel may be floated into or out of by pumping out or in water. The end will be closed by earthen berms and a sheet pile wall that will be removed to float out vessels. | |
grit blast system: | System of preparing steel for coating by using steel grit rather than sand as a blasting medium. | |
hydraulic plate shear: | Machine that cuts steel by a mechanical system similar to scissors. | |
inshore: | Inside coastlines, typically in bays, lakes and marshy areas. | |
ISO 9001-2015: | International Standards of Operations 9001-2015 – Defines quality management system of procedures and goals for certified companies. | |
jacket: | A component of a fixed platform consisting of a tubular steel, braced structure extending from the mudline of the seabed to a point above the water surface. The jacket is supported on tubular steel pilings driven into the seabed and supports the deck structure located above the level of storm waves. | |
MinDOC: | Minimum Deepwater Operating Concept. Floating production platform designed for stability and dynamic response to waves consisting of three vertical columns arranged in a triangular shape connected to upper and lower pontoon sections. | |
G-1
modules: | Packaged equipment usually consisting of major production, utility or compression equipment with associated piping and control system. | |
offshore: | In unprotected waters outside coastlines. | |
piles: | Rigid tubular pipes that are driven into the seabed to support platforms. | |
plasma-arc cutting system: | Steel cutting system that uses an ionized gas cutting rather than oxy-fuel system. | |
platform: | A structure from which offshore oil and gas development drilling and production are conducted. | |
pressure vessel: | A metal container generally cylindrical or spheroid, capable of withstanding various internal pressure loadings. | |
skid unit: | Packaged equipment usually consisting of major production, utility or compression equipment with associated piping and control system. | |
SPAR: | Single Point Anchor Reservoir. A floating vessel with a circular cross-section that sits vertically in the water and is used for infield flow lines and associated subsea infrastructure. The SPAR connects subsea production and injection wells for oil and gas production in deepwater environments. | |
spud barge: | Construction barge rigged with vertical tubular or square lengths of steel pipes that are lowered to anchor the vessel. | |
subsea templates: | Tubular frames which are placed on the seabed and anchored with piles. Usually a series of oil and gas wells are drilled through these underwater structures. | |
tension leg platform (TLP): | A platform consisting of a floating hull and deck anchored by vertical tensioned cables or pipes connected to pilings driven into the seabed. A tension leg platform is typically used in water depths exceeding 1,000 feet. | |
G-2
Report of Independent Registered Public Accounting Firm
To The Shareholders and Board of Directors of
Gulf Island Fabrication, Inc.
Opinion on the Financial Statements
We have audited the accompanying consolidated balance sheets of Gulf Island Fabrication, Inc. (the Company) as of December 31, 2017 and 2016, the related consolidated statements of operations, changes in shareholders’ equity, and cash flows for each of the three years in the period ended December 31, 2017, and the related notes (collectively referred to as the “consolidated financial statements”). In our opinion, the consolidated financial statements present fairly, in all material respects, the financial position of the Company at December 31, 2017 and 2016, and the results of its operations and its cash flows for each of the three years in the period ended December 31, 2017, in conformity with U.S. generally accepted accounting principles.
We have also audited, in accordance with the standards of the Public Company Accounting Oversight Board (United States) (PCAOB), the Company’s internal control over financial reporting as of December 31, 2017, based on criteria established in Internal Control-Integrated Framework issued by the Committee of Sponsoring Organizations of the Treadway Commission (2013 framework), and our report dated March 9, 2018, expressed an unqualified opinion thereon.
Basis for Opinion
These financial statements are the responsibility of the Company‘s management. Our responsibility is to express an opinion on the Company‘s financial statements based on our audits. We are a public accounting firm registered with the PCAOB and are required to be independent with respect to the Company in accordance with the US federal securities laws and the applicable rules and regulations of the Securities and Exchange Commission and the PCAOB.
We conducted our audits in accordance with the standards of the PCAOB. Those standards require that we plan and perform the audit to obtain reasonable assurance about whether the financial statements are free of material misstatement, whether due to error or fraud. Our audits included performing procedures to assess the risks of material misstatement of the financial statements, whether due to error or fraud, and performing procedures that respond to those risks. Such procedures included examining, on a test basis, evidence regarding the amounts and disclosures in the financial statements. Our audits also included evaluating the accounting principles used and significant estimates made by management, as well as evaluating the overall presentation of the financial statements. We believe that our audits provide a reasonable basis for our opinion.
/s/ Ernst & Young LLP
We have served as the Company‘s auditor since 1997.
New Orleans, Louisiana
March 9, 2018
F-1
GULF ISLAND FABRICATION, INC.
CONSOLIDATED BALANCE SHEETS
December 31, 2017 | December 31, 2016 | ||||||
(in thousands) | |||||||
ASSETS | |||||||
Current assets: | |||||||
Cash and cash equivalents | $ | 8,983 | $ | 51,167 | |||
Contracts receivable, net | 28,466 | 20,169 | |||||
Contracts in progress | 28,373 | 26,829 | |||||
Prepaid expenses and other | 3,833 | 3,222 | |||||
Inventory | 4,933 | 11,973 | |||||
Assets held for sale | 104,576 | — | |||||
Total current assets | 179,164 | 113,360 | |||||
Property, plant and equipment, net | 88,899 | 206,222 | |||||
Other assets | 2,777 | 2,826 | |||||
Total assets | $ | 270,840 | $ | 322,408 | |||
LIABILITIES AND SHAREHOLDERS’ EQUITY | |||||||
Current liabilities: | |||||||
Accounts payable | $ | 18,375 | $ | 9,021 | |||
Advance billings on contracts | 5,136 | 3,977 | |||||
Deferred revenue, current | 4,676 | 11,881 | |||||
Accrued contract losses | 7,618 | 387 | |||||
Accrued expenses and other liabilities | 12,741 | 10,032 | |||||
Income taxes payable | 119 | 50 | |||||
Total current liabilities | 48,665 | 35,348 | |||||
Net deferred tax liabilities | — | 23,234 | |||||
Deferred revenue, noncurrent | 769 | 489 | |||||
Other liabilities | 1,913 | 305 | |||||
Total liabilities | 51,347 | 59,376 | |||||
Shareholders’ equity: | |||||||
Preferred stock, no par value, 5,000,000 shares authorized, no shares issued and outstanding | |||||||
Common stock, no par value, 20,000,000 shares authorized, 14,910,498 issued and outstanding at December 31, 2017 and 14,695,020 at December 31, 2016, respectively | 10,823 | 10,641 | |||||
Additional paid-in capital | 100,456 | 98,813 | |||||
Retained earnings | 108,214 | 153,578 | |||||
Total shareholders’ equity | 219,493 | 263,032 | |||||
Total liabilities and shareholders’ equity | $ | 270,840 | $ | 322,408 | |||
The accompanying notes are an integral part of these financial statements.
F-2
GULF ISLAND FABRICATION, INC.
CONSOLIDATED STATEMENTS OF OPERATIONS
(in thousands, except per share data)
Years Ended December 31, | |||||||||||
2017 | 2016 | 2015 | |||||||||
Revenue | $ | 171,022 | $ | 286,326 | $ | 306,120 | |||||
Cost of revenue: | |||||||||||
Contract costs | 213,947 | 261,473 | 321,276 | ||||||||
Gross profit (loss) | (42,925 | ) | 24,853 | (15,156 | ) | ||||||
General and administrative expenses | 17,800 | 19,670 | 16,256 | ||||||||
Asset impairment | 7,672 | — | 7,202 | ||||||||
Operating income (loss) | (68,397 | ) | 5,183 | (38,614 | ) | ||||||
Other income (expense): | |||||||||||
Interest expense | (349 | ) | (332 | ) | (165 | ) | |||||
Interest income | — | 24 | 26 | ||||||||
Other income (expense), net | (213 | ) | 681 | 20 | |||||||
Total Other income (expense) | (562 | ) | 373 | (119 | ) | ||||||
Net income (loss) before income taxes | (68,959 | ) | 5,556 | (38,733 | ) | ||||||
Income tax expense (benefit) | (24,193 | ) | 2,041 | (13,369 | ) | ||||||
Net income (loss) | $ | (44,766 | ) | $ | 3,515 | $ | (25,364 | ) | |||
Per share data: | |||||||||||
Basic and fully diluted earnings (loss) per share—common shareholders | $ | (3.02 | ) | $ | 0.24 | $ | (1.75 | ) | |||
The accompanying notes are an integral part of these financial statements.
F-3
GULF ISLAND FABRICATION, INC.
CONSOLIDATED STATEMENTS OF CHANGES IN SHAREHOLDERS’ EQUITY
(in thousands, except share data)
Common Stock | Additional Paid-In Capital | Retained Earnings | Total Shareholders’ Equity | |||||||||||||||
Shares | Amount | |||||||||||||||||
Balance at January 1, 2015 | 14,539,104 | $ | 10,090 | $ | 93,828 | $ | 181,880 | $ | 285,798 | |||||||||
Net loss | — | — | — | (25,364 | ) | (25,364 | ) | |||||||||||
Vesting of restricted stock | 41,112 | (9 | ) | (70 | ) | — | (79 | ) | ||||||||||
Compensation expense restricted stock | — | 271 | 2,436 | — | 2,707 | |||||||||||||
Dividends on common stock | — | — | — | (5,865 | ) | (5,865 | ) | |||||||||||
Balance at December 31, 2015 | 14,580,216 | $ | 10,352 | $ | 96,194 | $ | 150,651 | $ | 257,197 | |||||||||
Net income | — | — | — | 3,515 | 3,515 | |||||||||||||
Vesting of restricted stock | 114,804 | (23 | ) | (194 | ) | — | (217 | ) | ||||||||||
Compensation expense restricted stock | — | 312 | 2,813 | — | 3,125 | |||||||||||||
Dividends on common stock | — | — | — | (588 | ) | (588 | ) | |||||||||||
Balance at December 31, 2016 | 14,695,020 | $ | 10,641 | $ | 98,813 | $ | 153,578 | $ | 263,032 | |||||||||
Net loss | — | — | — | (44,766 | ) | (44,766 | ) | |||||||||||
Vesting of restricted stock | 215,478 | (92 | ) | (824 | ) | — | (916 | ) | ||||||||||
Compensation expense restricted stock | — | 274 | 2,467 | — | 2,741 | |||||||||||||
Dividends on common stock | — | — | — | (598 | ) | (598 | ) | |||||||||||
Balance at December 31, 2017 | 14,910,498 | $ | 10,823 | $ | 100,456 | $ | 108,214 | $ | 219,493 | |||||||||
The accompanying notes are an integral part of these financial statements.
F-4
GULF ISLAND FABRICATION, INC.
CONSOLIDATED STATEMENTS OF CASH FLOWS
(in thousands)
Years Ended December 31, | |||||||||||
2017 | 2016 | 2015 | |||||||||
Operating activities: | |||||||||||
Net income (loss) | $ | (44,766 | ) | $ | 3,515 | $ | (25,364 | ) | |||
Adjustments to reconcile net (loss) income to net cash provided by (used in) operating activities: | |||||||||||
Depreciation | 12,909 | 25,448 | 26,204 | ||||||||
Amortization of deferred revenue | (2,008 | ) | (5,223 | ) | — | ||||||
Asset impairment | 7,672 | — | 7,202 | ||||||||
Provision for bad debts | 21 | 493 | 448 | ||||||||
Loss (gain) on the sale of assets | 224 | (757 | ) | (10 | ) | ||||||
Deferred income taxes | (23,234 | ) | 1,409 | (14,061 | ) | ||||||
Stock-based compensation expense | 2,741 | 3,125 | 2,707 | ||||||||
Changes in operating assets and liabilities: | |||||||||||
Contracts receivable, net | (8,319 | ) | 28,067 | 31,740 | |||||||
Contracts in progress | (1,544 | ) | (13,984 | ) | 14,167 | ||||||
Advance billings on contracts | 1,159 | (3,197 | ) | (11,685 | ) | ||||||
Accounts payable | 9,354 | (12,757 | ) | (26,668 | ) | ||||||
Prepaid expenses and other assets | 388 | 230 | 1,092 | ||||||||
Inventory | 356 | 6,501 | 931 | ||||||||
Accrued contract losses | 7,231 | (9,108 | ) | 8,678 | |||||||
Deferred revenue | (4,917 | ) | (11,656 | ) | — | ||||||
Deferred compensation | 1,608 | 305 | — | ||||||||
Accrued expenses | 2,709 | 2,220 | (5,302 | ) | |||||||
Current income taxes | (969 | ) | (63 | ) | 615 | ||||||
Net cash provided by (used in) operating activities | (39,385 | ) | 14,568 | 10,694 | |||||||
Cash flows from investing activities: | |||||||||||
Cash received in acquisition | — | 3,035 | — | ||||||||
Capital expenditures, net | (4,834 | ) | (6,795 | ) | (6,018 | ) | |||||
Proceeds from the sale of equipment | 2,155 | 6,458 | 11 | ||||||||
Proceeds from insurance recoveries | 1,544 | — | — | ||||||||
Net cash provided by (used in) investing activities | (1,135 | ) | 2,698 | (6,007 | ) | ||||||
Cash flows from financing activities: | |||||||||||
Borrowings against credit agreement | 2,000 | — | — | ||||||||
Payments on credit agreement | (2,000 | ) | — | — | |||||||
Payment of financing costs | (150 | ) | (122 | ) | — | ||||||
Tax payments made on behalf of employees from withheld, vested shares of common stock | (916 | ) | (217 | ) | (79 | ) | |||||
Payments of dividends on common stock | (598 | ) | (588 | ) | (5,865 | ) | |||||
Net cash used in financing activities | (1,664 | ) | (927 | ) | (5,944 | ) | |||||
Net increase (decrease) in cash and cash equivalents | (42,184 | ) | 16,339 | (1,257 | ) | ||||||
Cash and cash equivalents at beginning of period | 51,167 | 34,828 | 36,085 | ||||||||
Cash and cash equivalents at end of period | $ | 8,983 | $ | 51,167 | $ | 34,828 | |||||
Supplemental cash flow information: | |||||||||||
Interest paid | $ | 349 | $ | 332 | $ | 165 | |||||
Income taxes paid (refunds received), net | $ | 189 | $ | 377 | $ | (152 | ) | ||||
Schedule of noncash financing activities | |||||||||||
Reclassification of property, plant and equipment to assets held for sale | $ | 109,488 | $ | — | $ | 4,805 | |||||
Reclassification of assets held for sale to inventory | $ | — | $ | — | $ | 3,727 | |||||
The accompanying notes are an integral part of these financial statements.
F-5
GULF ISLAND FABRICATION, INC.
NOTES TO CONSOLIDATED FINANCIAL STATEMENTS
DECEMBER 31, 2017
1. ORGANIZATION AND SUMMARY OF SIGNIFICANT ACCOUNTING POLICIES
Basis of Presentation
Gulf Island Fabrication, Inc. ("Gulf Island"), and together with its subsidiaries ("the Company," "we" or "our"), is a leading fabricator of complex steel structures and marine vessels used in energy extraction and production, petrochemical and industrial facilities, power generation and alternative energy projects and shipping and marine transportation operations. We also provide related installation, hookup, commissioning, repair and maintenance services with specialized crews and integrated project management capabilities. We are currently fabricating complex modules for the construction of a new petrochemical plant, completing newbuild construction of one technologically-advanced offshore support and two multi-purpose service vessels. During 2015, we fabricated wind turbine pedestals for the first offshore wind power project in the United States. We have also constructed one of the largest liftboats servicing the Gulf of Mexico ("GOM"), one of the deepest production jackets in the GOM and the first SPAR fabricated in the United States. Our customers include U.S. and, to a lesser extent, international energy producers, petrochemical, industrial, power and marine operators. Our corporate headquarters is located in Houston, Texas, with fabrication facilities located in Houma, Jennings and Lake Charles, Louisiana, and formerly in Aransas Pass and Ingleside, Texas, each of which are marketed for sale.
The consolidated financial statements include the accounts of Gulf Island and its majority owned subsidiaries. All significant intercompany balances and transactions have been eliminated in consolidation.
Business Outlook
Beginning in late 2014, a severe decline in oil and natural gas prices led to a significant decline in oil and gas industry drilling activities and capital spending from our traditional customer base. In 2015 and through 2017, the Company implemented a number of initiatives to strategically reposition the Company to attract new customers, participate in the buildup of petrochemical facilities, pursue offshore wind markets and diversify our customers within our shipyard business. Additionally, the Company initiated efforts to preserve cash and lower costs including: reducing our workforce in certain divisions, developing a plan to sell certain underutilized assets, and diversifying our service offerings and fabrication capabilities.
The Company continues to assess liquidity needs and manage cash flows, given the challenging industry conditions our traditional customer base continues to experience. If industry conditions do not improve, our plan to sell the assets held for sale does not occur or is delayed, or we are unable to increase our backlog, the Company would expect to take additional measures to preserve its cash flows. As a result of the steps the Company has taken to preserve its liquidity, the Company currently believes that cash on hand and funds available under the Company’s credit agreement will enable the Company to meet its working capital, capital expenditures, any future debt service and other funding requirements for at least one year from the date this Form 10-K is issued. The Company’s view regarding sufficiency of cash and liquidity is primarily based on our financial forecast for 2018 and early 2019, which is impacted by various assumptions regarding our existing backlog and a reasonable amount of forecasted non-contractual backlog. Generally, we expect demand for our Services Division to increase in 2018 beyond the contractual backlog amount in place as of December 31, 2017. We have included an insignificant amount of backlog in our financial forecast for our newly formed EPC Division related to continuing support of the SeaOne Project.
Although we have observed certain factors in 2017 that support improving industry conditions and have taken measures to diversify our business offerings, our financial forecasts in recent periods have proven less reliable given cost overruns incurred on projects and volatile market conditions in our current operating environment. In addition, the Company’s continued access to funds available through its credit agreement is dependent upon compliance with certain financial covenants. As a result, there is no guarantee that our financial forecast, which projects sufficient cash, including funds available through our credit agreement, will be available to meet planned operating expenses and other cash needs and will be accurate.
Operating Cycle
The lengths of our contracts vary, but are typically longer than one year in duration. Consistent with industry practice, assets and liabilities have been classified as current under the operating cycle concept whereby all contract-related items
F-6
GULF ISLAND FABRICATION, INC.
NOTES TO CONSOLIDATED FINANCIAL STATEMENTS-(Continued)
are regarded as current regardless of whether cash will be received or paid within a twelve month period. Assets and liabilities classified as current which may not be paid or received within the next twelve months include contract retainage, contracts in progress, deferred revenue and advanced billings on contracts. However, any variation from normal contract terms would cause classification of assets and liabilities as long-term.
Use of Estimates
The preparation of financial statements in conformity with accounting principles generally accepted in the United States ("GAAP") requires management to make estimates and assumptions that affect the reported amounts of assets and liabilities and disclosure of contingent liabilities at the date of the financial statements and the reported amounts of revenue and expense during the reporting period. Areas requiring significant estimates by our management include asset impairments, value of assets held for sale, provisions for contract losses, contract revenues, costs and profits, the application of the percentage-of-completion method of accounting, income taxes and the determination of the allowance of doubtful accounts. Actual results could differ from those estimates.
Cash Equivalents
The Company considers all highly liquid investments with maturities of three months or less when purchased to be cash equivalents.
Allowance for Doubtful Accounts
We routinely review individual contract receivable balances and make provisions for probable doubtful accounts as we deem appropriate. Among the factors considered during the review are the financial condition of our customer and their access to financing, underlying disputes on the account, age and amount of the account and overall economic conditions. Accounts are written off only when all reasonable collection efforts are exhausted.
Our principal customers include major and large independent oil and gas companies and their contractors and marine vessel operators and their contractors. This concentration of customers may impact our overall exposure to credit risk, either positively or negatively, in that customers may be similarly affected by changes in economic or other conditions. Receivables are generally not collateralized. In the normal course of business, we extend credit to our customers on a short-term basis. See Note 3 - "Contracts Receivable and Retainage" for a detail of our allowance for doubtful accounts.
Stock-Based Compensation
Awards under the Company’s stock-based compensation plans are calculated using a fair value based measurement method. Share-based compensation expense for share based awards is recognized only for those awards that are expected to vest. We use the straight-line method to recognize share-based compensation expense over the requisite service period of the award.
Inventory
Inventory consists of materials and production supplies and is stated at the lower of cost or net realizable value determined on the first-in, first-out basis.
Assets Held for Sale
Assets held for sale are required to be measured at the lower of their carrying amount or fair value less cost to sell. See Note 4 - “Assets Held For Sale” for additional information regarding our assets held for sale.
Workers Compensation Liability
The Company and its subsidiaries are self-insured for workers’ compensation liability except for losses in excess of varying threshold amounts. Our workers compensation liability balance was $4.1 million as of December 31, 2017, and $3.4 million as of December 31, 2016, respectively.
Property, Plant and Equipment
Property, plant and equipment is stated at cost less accumulated depreciation. Depreciation is computed on the straight-line basis over the estimated useful lives of the assets, which range from three to 25 years. Ordinary maintenance and repairs, which do not extend the physical or economic lives of the plant or equipment, are charged to expense as incurred.
F-7
GULF ISLAND FABRICATION, INC.
NOTES TO CONSOLIDATED FINANCIAL STATEMENTS-(Continued)
Long-Lived Assets
We evaluate impairment losses on long-lived assets or asset groups used in operations when events and circumstances indicate that the assets or asset groups might not be recoverable. If events and circumstance indicate that the assets or asset groups might not be recoverable, the expected future undiscounted cash flows from the assets or asset groups are estimated and compared with the carrying amount of the assets or asset groups. If the sum of the estimated undiscounted cash flows is less than the carrying amount of the assets or asset groups, an impairment loss is recorded.
An impairment loss is measured by comparing the fair value of the asset or asset group to its carrying amount and recording the excess of the carrying amount of the asset or asset group over its fair value as an impairment charge. An asset group constitutes the minimum level for which identifiable cash flows are principally independent of the cash flows of other asset or liability groups. Fair value is determined based on discounted cash flows or appraised values, as appropriate.
Fair Value Measurements
The Company bases its fair value determinations of the carrying value of other financial assets and liabilities on an evaluation of their particular facts and circumstances and valuation techniques that require judgments and estimates. We base our fair value determinations by applying the following hierarchy, which prioritizes the inputs used to measure fair value into three levels and bases the categorization within the hierarchy upon the lowest level of input that is available and significant to the fair value measurement:
• | Level 1-inputs are based upon quoted prices for identical instruments traded in active markets. |
• | Level 2-inputs are based upon quoted prices for similar instruments in active markets and model-based valuation techniques for which all significant assumptions are observable in the market. |
• | Level 3-inputs are generally unobservable and typically reflect management’s estimates of assumptions that market participants would use in pricing the asset or liability. These include discounted cash flow models and similar valuation techniques. |
See Note 6 -“Fair Value Measurements” for additional information regarding fair value measurements.
Revenue Recognition
We use the percentage-of-completion accounting method for fabrication contracts. Revenue from fixed-price or unit rate contracts is recognized on the percentage-of-completion method, computed by the efforts-expended method which measures the percentage of labor hours incurred to date as compared to estimated total labor hours for each contract. This progress percentage is applied to our estimate of total anticipated gross profit for each contract to determine gross profit earned to date. Revenue recognized in a period for a contract is the amount of gross profit earned for that period plus the costs incurred on the contract during the period. Under a unit rate contract, material items or labor tasks are assigned unit rates of measure. The unit rates of measure will generally be an amount of dollars per ton, per foot, per square foot or per item installed. A typical unit rate contract can contain hundreds to thousands of unit rates of measure. Profit margins are built into the unit rates.
Profit incentives are included in revenue when their realization is probable. Claims for extra work or changes in scope of work are included in revenue when the amount can be reliably estimated and collection is probable. To the extent work from changes in scope have been approved for scope, but not as to price, revenue is recognized up to cost incurred. Changes in job performance, job conditions, and estimated profitability, including those arising from contract penalty provisions, and final contract settlements may result in revisions to costs and income and are recognized in the period in which the revisions are determined. For the years ended December 31, 2017, 2016, and 2015, there was no significant revenue related to unapproved change orders or claims.
Some contracts include a total or partial reimbursement to us of any costs associated with specific capital projects required by the fabrication process. If a particular capital project provides future benefits to us, the cost to build the capital project will be capitalized, and the revenue for the capital project will increase the estimated profit in the contract.
See Note 2 - “Contract Revenue and Percentage-of-Completion Method” for additional information regarding our percentage-of-completion accounting and revenue recognition.
F-8
GULF ISLAND FABRICATION, INC.
NOTES TO CONSOLIDATED FINANCIAL STATEMENTS-(Continued)
Income Taxes
Income taxes have been provided using the liability method. Deferred income taxes reflect the net tax effects of temporary differences between the carrying amounts of assets and liabilities for financial reporting purposes and the amounts used for income tax purposes using enacted rates expected to be in effect during the year in which the basis differences reverse. Due to changing tax laws, significant judgment is required to estimate the effective tax rate expected to apply to tax differences that are expected to reverse in the future.
In December 2017, the Tax Cuts and Jobs Act was enacted which significantly changes U.S. tax law. In accordance with Accounting Standards Codification ("ASC") 740, Income Taxes, the Company is required to account for the new requirements in the period that includes the date of enactment. The Tax Cuts and Jobs Act reduces the overall corporate income tax rate to 21%, creates a new territorial tax system, broadens the tax base, and allows for the immediate expensing of qualified property. Due to the complexities presented by the Tax Cuts and Jobs Act, the SEC issued Staff Accounting Bulletin ("SAB") 118 to provide guidance to companies who are not able to complete their accounting in the period of enactment prior to the reporting deadlines. Under the guidance in SAB 118, companies that have not completed their accounting for the Tax Cuts and Jobs Act but can determine a reasonable estimate of those effects should include a provisional amount based on their reasonable estimate in their financial statements. As of December 31, 2017, we have not completed our accounting for the tax effects of the Tax Cuts and Jobs Act. For additional discussion of the effects on the Tax Cuts and Jobs Act including the impact of current tax reform in our consolidated financial statements, see Note 9 - "Income Taxes."
A valuation allowance is provided to reserve for deferred tax assets if, based upon the available evidence, it is more likely than not that some or all of the deferred tax assets will not be realized. During 2017, we recorded a valuation allowance against our deferred tax assets of $0.4 million. See Note 9 - "Income Taxes."
Reserves for uncertain tax positions are recognized when the positions are more likely than not to not be sustained upon audit. Interest and penalties on uncertain tax positions are recorded in income tax expense. Our federal tax returns have been examined and settled through the 2012 tax year. There were no material uncertain tax positions recorded for the years presented in these statements.
Reclassifications
We made the following reclassifications to our financial statements for the years ended December 31, 2016 and 2015, to conform to current period presentation:
• | We reclassified $217,000 and $79,000 from operating activities to financing activities in the Company’s consolidated statement of cash flows for the years ended December 31, 2016 and 2015, respectively related to tax payments made by the Company to satisfy employee income tax withholding obligations arising from vesting shares as a result of the adoption of Accounting Standards Update 2016-09 as discussed in "New Accounting Standards" below. This reclassification had no impact to our financial position or results of operations. |
• | We reclassified corporate administrative costs and overhead expenses previously allocated to the results of operations of our three operating divisions to our Corporate Division for the years ended December 31, 2016 and 2015, to conform to current period presentation as discussed in Note 13. These reclassifications had no impact to our consolidated financial statements. |
New Accounting Standards
On May 28, 2014, the Financial Accounting Standards Board ("FASB") issued Accounting Standards Update ("ASU") No. 2014-09, “Revenue from Contracts with Customers” (Topic 606), which supersedes the revenue recognition requirements in FASB Accounting Standard Codification ("ASC") Topic 605, “Revenue Recognition.” ASU No. 2014-09 requires entities to recognize revenue in a way that depicts the transfer of promised goods or services to customers in an amount that reflects the consideration to which the entity expects to be entitled in exchange for those goods or services. ASU 2014-09 will be effective for financial statements issued for fiscal years beginning after December 15, 2017, and interim periods within those fiscal years. Early application is permitted. We use the percentage-of-completion accounting method to account for our fixed-price or unit rate contracts, computed by the efforts-expended method which measures the percentage of labor hours incurred to date as compared to estimated total labor hours for each contract. We have concluded that this method will still be allowed under this ASU. We intend to use the modified retrospective model in adopting this
F-9
GULF ISLAND FABRICATION, INC.
NOTES TO CONSOLIDATED FINANCIAL STATEMENTS-(Continued)
standard, which will require a cumulative catch up adjustment, if any, on January 1, 2018. See Note 2 -“Contract Revenue and Percentage-of-Completion Method” for additional information regarding our expected impact of this ASU upon our consolidated financial statements.
In February 2016, the FASB issued ASU 2016-02, “Leases,” which requires lessees to record most leases on their balance sheets but recognize expenses in a manner similar to current guidance. ASU 2016-02 will be effective for annual periods beginning after December 15, 2018. The guidance is required to be applied using a modified retrospective approach. We are currently evaluating the effect that ASU 2016-02 will have on our financial position, results of operations and related disclosures; however, we expect to record our lease obligations on our balance sheet. See Note 5 for disclosure of our minimum lease payments.
In March 2016, the FASB issued ASU 2016-09, “Improvements to Employee Share-Based Payment Accounting,” which amends several aspects of the accounting for share-based payment transactions, including the income tax consequences, classification of awards as either equity or liabilities and classification within the statement of cash flows. ASU 2016-09 is effective for annual periods beginning after December 15, 2016. We adopted the requirements of ASU 2016-09 effective January 1, 2017. The provisions of ASU No. 2016-09 that are applicable to the Company and affect the Company’s consolidated financial statements include the following:
• | This ASU requires the recognition of the excess tax benefit or tax deficiency resulting from the difference between the deduction for tax purposes and the compensation cost recognized for financial reporting purposes created when common stock vests as an income tax benefit or expense in the Company’s statement of operations. Under previous GAAP, this difference was required to be recognized in additional paid-in capital. The expense or benefit required to be recognized is calculated separately as a discrete item each reporting period and not as part of the Company’s projected annual effective tax rate. During the year ended December 31, 2017, we recorded tax expense of $253,000 (approximately $0.02 loss per share) related to the adoption of this ASU. We have adopted these provisions on a prospective basis and our prior period presentation has not changed. Future effects to the Company’s income tax expense (benefit) as a result of the adoption of this ASU will depend on the timing, number of shares and the closing price per share of the Company’s common stock on the dates of vesting. |
• | This ASU also clarifies that cash paid by the Company to taxing authorities in order to satisfy employee income tax withholding obligations from vesting shares should be classified as a financing activity in the Company’s statement of cash flows. We have reported payments of $916,000 within financing activities within our consolidated statement of cash flows for the year ended December 31, 2017, as a result of adoption of this ASU. We have adopted these provisions retrospectively and reclassified $217,000 and $79,000 from operating activities to financing activities in the Company’s consolidated statements of cash flows for the years ended December 31, 2016 and 2015, respectively to conform to the current period presentation. |
In June 2016, the FASB issued ASU 2016-13, “Financial Instruments - Credit Losses - Measurement of Credit Losses on Financial Instruments,” which changes the way companies evaluate credit losses for most financial assets and certain other instruments. For trade and other receivables, held-to-maturity debt securities, loans and other instruments, entities will be required to use a new forward-looking “expected loss” model to evaluate impairment, potentially resulting in earlier recognition of allowances for losses. The new standard also requires enhanced disclosures, including the requirement to disclose the information used to track credit quality by year of origination for most financing receivables. ASU 2016-13 will be effective for annual periods beginning after December 15, 2019. Early adoption is permitted for all entities for annual periods beginning after December 15, 2018. We have not elected to early adopt this guidance. The guidance must be applied using a cumulative-effect transition method. We are currently evaluating the effect that ASU 2016-13 will have on our financial position, results of operations and related disclosures.
F-10
GULF ISLAND FABRICATION, INC.
NOTES TO CONSOLIDATED FINANCIAL STATEMENTS-(Continued)
2. CONTRACT REVENUE AND PERCENTAGE-OF-COMPLETION METHOD
Information with respect to uncompleted contracts as of December 31, is as follows (in thousands):
2017 | 2016 | ||||||
Costs incurred on uncompleted contracts | $ | 266,902 | $ | 246,424 | |||
Estimated profit (loss) earned to date | (19,336 | ) | 21,363 | ||||
Sub-total | 247,566 | 267,787 | |||||
Less billings to date | 224,329 | 244,935 | |||||
Total | $ | 23,237 | $ | 22,852 | |||
The above amounts are included in the accompanying consolidated balance sheets at December 31, under the following captions (in thousands):
2017 | 2016 | ||||||
Contracts in progress | $ | 28,373 | $ | 26,829 | |||
Advance billings on contracts | (5,136 | ) | (3,977 | ) | |||
Total | $ | 23,237 | $ | 22,852 | |||
Provision for Estimated Losses
Provisions for estimated losses on uncompleted contracts are made in the period in which such losses are determined. We recognized contract losses of $36.5 million, $1.8 million and $33.9 million in the years ended December 31, 2017, 2016, and 2015, respectively.
Contract losses for the year ended December 31, 2017, totaling $34.5 million related to cost overruns and delays that we encountered in the newbuild construction of two multi-purpose service vessels that we are building for a customer within our Shipyard Division. These vessels are some of the most technologically-advanced vessels in their class. The cost overruns relate primarily to complexities with the installation of the power and communications systems. We believe the best course of action for the Company is to perform additional engineering and construction planning to ensure we are meeting the contractual performance requirements for these vessels and mitigating any further construction risk. With the additional electrical engineering, planning and construction estimates, the estimated delivery dates of the vessels will be extended beyond the contractual delivery dates, and we estimate that the maximum amount of liquidated damages of $11.2 million will be incurred in the absence of a signed amendment with the customer. We have included the maximum liquidated damages in our 2017 loss provision above and reduced our estimate of the contract price. We continue to work with the customer to complete the contract in a manner that is acceptable to both parties; however, resolution with this customer could take several months. We can provide no assurance that we will be successful in signing an amendment to the contract, or that in the event we are successful in negotiating an amendment, as to when such an amendment will be signed or if such amendment will result in recovery of any cost overruns or liquidated damages that we have recognized to date. We believe that our estimates to complete the vessels are reasonable; however, we cannot guarantee that we will not incur additional costs as we negotiate with our customer.
Contract losses for the year ended December 31, 2016, were primarily attributable to decreasing margins on fabrication work due to continued depressed oil and gas prices within our Fabrication Division and the movement of vessels in progress from our leased Prospect Shipyard to our owned Houma Shipyard within our Shipyard Division. Contract losses for the year ended December 31, 2015, were primarily due to $24.5 million related to a decrease in the contract price due to final weight re-measurements and our inability to recover certain costs on disputed change orders related to a large deepwater project which was delivered in 2015. In addition, we increased accrued contract losses associated with our remaining contracts by approximately $9.4 million during 2015 due to increases in our projected unit labor rates of our fabrication facilities.
Revenue from Major Customers
The Company is not dependent on any one customer, and the revenue earned from each customer varies from year to year based on the contracts awarded; however, the Company is highly dependent on a few large customers in each year, particularly customers for our major deepwater projects, as shown below. Revenue from customers comprising 10% or more of the Company’s total revenue for the years ended December 31, 2017, 2016 and 2015, respectively, are summarized as follows (in thousands):
F-11
GULF ISLAND FABRICATION, INC.
NOTES TO CONSOLIDATED FINANCIAL STATEMENTS-(Continued)
Customer | 2017 | 2016 | 2015 | ||||||||
A | $ | 44,724 | * | * | |||||||
B | $ | 21,781 | * | * | |||||||
C | * | $ | 65,981 | * | |||||||
D | * | * | $ | 55,775 | |||||||
E | * | * | $ | 36,320 | |||||||
_____________
* The customer revenue was less than 10% of the total revenue for the year.
Implementation of ASU No. 2014-09, “Revenue from Contracts with Customers” (Topic 606)
As discussed in Note 1, Implementation of this new standard will be required effective January 1, 2018. Topic 606 requires entities to recognize revenue in a way that depicts the transfer of promised goods or services to customers in an amount that reflects the consideration to which the entity expects to be entitled in exchange for those goods or services. As part of our implementation of this standard, we established an implementation team as well as employed the help of outside consultants to assist with the implementation. Our evaluation concluded revenue from our fixed-price and unit-rate contracts using the percentage-of-completion method, computed by measuring the percentage of labor hours incurred to date as compared to estimated total labor hours for each contract is still appropriate. Revenue from contracts that are based upon time worked and materials incurred at the contracted rates will still be recognized as the work is performed and the costs are incurred. Our implementation included a detailed review of all or our significant contracts. In doing so, we determined that certain contracts will need to include contract labor amounts within the calculation of percentage complete in order to comply with the additional criteria included within Topic 606. Additionally, we concluded that significant costs from outside services will need to be included within our measure of progress and and include a measure of profit and not treated solely as "pass-through costs." While these additional criteria impact the timing of revenue recognition, they do not change the timing for the recognition of costs.
The guidance permits companies to either apply the new requirements retrospectively to all prior periods presented through use of the full retrospective method or apply the new requirements in the year of adoption through a cumulative adjustment using the modified retrospective method. We will adopt the new revenue guidance effective January 1, 2018, by recognizing the cumulative effect of initially applying the new standard as a change in the opening balance of retained earnings. We expect this adjustment to our retained earnings to be immaterial as of December 31, 2017.
International Revenue
The Company’s fabricated structures are used worldwide by U.S. customers operating abroad and by foreign customers. Revenue related to fabricated structures for delivery outside of the United States accounted for 0%, 14%, and 6% of the Company’s revenue for the years ended December 31, 2017, 2016 and 2015, respectively, and are summarized as follows (in thousands):
2017 | 2016 | 2015 | |||||||||
Location: | |||||||||||
United States | $ | 171,022 | $ | 245,039 | $ | 287,892 | |||||
International | — | 41,287 | 18,228 | ||||||||
Total | $ | 171,022 | $ | 286,326 | $ | 306,120 | |||||
F-12
GULF ISLAND FABRICATION, INC.
NOTES TO CONSOLIDATED FINANCIAL STATEMENTS-(Continued)
Contract Costs
Contract costs include all direct material, labor and subcontract costs and those indirect costs related to contract performance, such as indirect labor, supplies and tools. Also included in contract costs are a portion of those indirect contract costs related to plant capacity, such as depreciation, insurance and repairs and maintenance. These indirect costs are allocated to jobs based on actual direct labor hours incurred.
We define pass-through costs as material, freight, equipment rental, and sub-contractor services included in the direct costs of revenue associated with projects. Pass-through costs have no impact in the determination of gross margin recognized for the related project for a particular period. Pass-through costs as a percentage of revenue were 53.1%, 36.5% and 44.4% for the years ended December 31, 2017, 2016 and 2015, respectively.
Some of our contracts contain provisions that require us to pay liquidated damages if we are responsible for the failure to meet specified contractual milestone dates and the applicable customer asserts a claim under those provisions. Those contracts define the conditions under which our customers may make claims against us for liquidated damages. As of December 31 2017, we estimated that the delivery dates for the newbuild construction of two multi-purpose service vessels that we are building for a customer within our Shipyard Division will be extended beyond the contractual delivery dates, and that the maximum amount of liquidated damages of $11.2 million will be assessed in the absence of a signed amendment with the customer as discussed above. Additionally, we successfully resolved our dispute with a customer within our Shipyard Division that had previously rejected delivery of the first of two offshore service vessels that we completed and tendered for delivery on February 6, 2017. During the fourth quarter of 2017, we settled our disputes, and the customer accepted delivery of the first of two vessels less a reduction in the amounts owed under each contract of $233,000 related to discrepancies of dead weight tonnage. We also recommenced construction of the second vessel to be delivered in 2018.
3. CONTRACTS RECEIVABLE AND RETAINAGE
Of our contracts receivable balance at December 31, 2017, approximately $15.6 million, or 55.1%, is for two customers. Approximately $8.6 million, or 42.7% of the December 31, 2016 contracts receivable balance relates to three customers. Amounts due on contracts as of December 31, were as follows (in thousands):
2017 | 2016 | ||||||
Completed contracts | |||||||
Current receivables | $ | 10,246 | $ | 6,812 | |||
Contracts in progress: | |||||||
Current receivables | 15,513 | 14,248 | |||||
Retainage | 4,455 | 113 | |||||
Total contracts receivable | 30,214 | 21,173 | |||||
Less allowance for doubtful accounts | 1,748 | 1,004 | |||||
Net contracts receivable | $ | 28,466 | $ | 20,169 | |||
Our allowance for doubtful accounts as of December 31, 2017, primarily relates to a customer in our Fabrication Division for the storage of an offshore drilling platform which was fully reserved in 2016. We continue to bill this customer under the terms of the contract; however, no longer recognize revenue for these billings as collection is not reasonably assured. Instead, billings for this customer are offset with an increase in the allowance for doubtful accounts.
4. ASSETS HELD FOR SALE
South Texas Properties:
On February 23, 2017, our Board of Directors approved management's recommendation to place our South Texas Properties located in Aransas Pass and Ingleside, Texas, up for sale. Our South Yard in Ingleside, Texas, is located on the northwest corner of the intersection of the U.S. Intracoastal Waterway and the Corpus Christi Ship Channel. The 45-foot deep Corpus Christi Ship Channel provides direct and unrestricted access to the GOM. Our North Yard in Aransas Pass, Texas, is located along the U.S. Intracoastal Waterway and is approximately three miles north of the Corpus Christi Ship Channel. Our net book value of property, plant and equipment for these assets was $102.7 million at December 31, 2017. We measure and record assets held for sale at the lower of their carrying amount or fair value less cost to sell.
F-13
GULF ISLAND FABRICATION, INC.
NOTES TO CONSOLIDATED FINANCIAL STATEMENTS-(Continued)
These properties are underutilized and represent excess capacity within our Fabrication Division. We have ceased all fabrication activities at these locations and re-allocated any remaining backlog and workforce to our Houma fabrication operations as necessary.
On August 25, 2017, our South Texas Properties were impacted by Hurricane Harvey, which made landfall as a Category 4 hurricane. As a result, we suffered damages to our buildings and equipment at our South Texas Properties. Through December 31, 2017, we have incurred approximately $1.3 million in clean-up, inspection and repair related costs. We maintain coverage on these assets up to a maximum of $25.0 million, subject to a 3.0% deductible with a minimum deductible of $500,000. One building at our South Yard and one building at our North Yard were determined to be total losses. As a result we expensed the remaining net book value of $1.5 million related to these buildings and recorded a corresponding insurance recovery of $1.5 million fully offsetting the loss. We are working diligently with our insurance agents and adjusters to finalize our estimate of the damage; however, it may be several months, or even longer, before we can finalize our assessment and receive final payment from our insurance underwriters. Our insurance underwriters have made an initial payment of $6.0 million, and we have recorded a liability for future repairs of $3.3 million which is included in accrued expenses and other liabilities on our balance sheet at December 31, 2017. Our initial estimate of the claim due to us approximates $21.5 million; however, our insurance carrier has not approved these amounts. Based upon our initial assessment of the damages and insurance coverage, management believes that there is no basis to record a net loss at this time and that insurance proceeds will at a minimum be sufficient to reimburse us for any loss of value and repair costs. Our final assessment of the loss incurred to our South Texas Properties as well as the amount of insurance proceeds we will receive could be more or less than our initial estimate when the claim is ultimately settled and such differences could be material.
On December 20, 2017, we granted an exclusive option to a third party for the purchase of our South Yard which consists of approximately 212 acres for a purchase price of $55 million. This option runs through April 25, 2018, which may be extended through May 25, 2018, if proper written notice and additional earnest monies are provided in accordance with the agreement. The terms of the agreement are subject to normal and customary conditions, including the third party's right to conduct inspections of the property related to confirmation of title, surveys, environmental conditions, easements and access rights. In consideration for the option to purchase the South Yard, the third party deposited $750,000 of earnest money on January 3, 2018, which is nonrefundable in the event the third party cancels the agreement.
As a result of the decision to place our South Texas Properties up for sale, we have and will continue to incur costs associated with maintaining these facilities. These costs include insurance, general maintenance of the properties in their current state and property taxes which will be expensed as incurred. We do not expect the sale of these assets to impact our ability to operate our Fabrication Division. Our South Texas Properties held for sale do not qualify for discontinued operations presentation.
Prospect Shipyard Assets:
We formerly leased a 35-acre complex 26 miles from the GOM in Houma, Louisiana that was acquired in the LEEVAC Transaction as further discussed in Note 11 "LEEVAC Transaction". We terminated the lease on December 31, 2017, with the owner of the property (currently a senior vice president within the Company and the former chief executive officer of LEEVAC Shipyards, LLC). During the first quarter of 2017, management placed the assets at this facility up for sale, and we recorded an impairment of $389,000 related to assets based upon their estimated sale price. During the second quarter of 2017, we sold two drydocks from our Prospect Shipyard for proceeds of $2.0 million and recorded a loss on sale of $259,000. Prior to terminating the lease, we moved the significant assets, which primarily consist of a 2,500-ton drydock to our Houma Shipyard and evaluated the remaining assets for impairment. Based upon our evaluation of the remaining fair value less the costs to sell, we recorded additional impairment of $600,000. The remaining $1.9 million, primarily represents the estimated fair value of the drydock. We do not expect the sale of these assets to impact our ability to service our shipyard customers. Our Prospect Shipyard assets held for sale do not qualify for discontinued operations presentation.
F-14
GULF ISLAND FABRICATION, INC.
NOTES TO CONSOLIDATED FINANCIAL STATEMENTS-(Continued)
A summary of the significant assets included in assets held for sale as of December 31, 2017, at our South Texas Properties and our Prospect Shipyard is as follows (in thousands):
Assets | South Yard | North Yard | Prospect Shipyard | Consolidated | ||||||||||||
Land | $ | 3,335 | $ | 2,157 | $ | — | $ | 5,492 | ||||||||
Buildings and improvements | 84,282 | 39,548 | — | 123,830 | ||||||||||||
Machinery and equipment | — | 69,818 | 2,201 | 72,019 | ||||||||||||
Less: accumulated depreciation | (40,838 | ) | (55,629 | ) | (298 | ) | (96,765 | ) | ||||||||
Total assets held for sale | $ | 46,779 | $ | 55,894 | $ | 1,903 | $ | 104,576 | ||||||||
5. PROPERTY, PLANT AND EQUIPMENT
Property, plant and equipment consisted of the following at December 31, (in thousands):
Estimated Useful Life | 2017 | 2016 | |||||||
(in Years) | |||||||||
Land | - | $ | 4,972 | $ | 10,463 | ||||
Buildings | 25 | 34,653 | 65,894 | ||||||
Machinery and equipment | 3 to 25 | 141,704 | 238,029 | ||||||
Furniture and fixtures | 3 to 5 | 4,450 | 5,570 | ||||||
Transportation equipment | 3 to 5 | 2,667 | 3,814 | ||||||
Improvements | 15 | 42,975 | 128,437 | ||||||
Construction in progress | - | 96 | 5,303 | ||||||
Total cost | 231,517 | 457,510 | |||||||
Less accumulated depreciation | 142,618 | 251,288 | |||||||
Net book value | $ | 88,899 | $ | 206,222 | |||||
We lease certain equipment used in the normal course under month-to-month lease agreements cancelable only by us. During 2017, 2016, and 2015, we expensed $1.0 million, $2.5 million, and $5.9 million, respectively, related to these leases.
We lease our corporate office and parking facilities located in Houston, Texas. Leased premises consist of office space of approximately 8,000 square feet. The term of the lease expires on January 31, 2020. We also lease and/or sublease facilities in Lake Charles, Jennings and Houma, Louisiana. See Note 11 "LEEVAC Transaction" for additional description of these leases. The schedule of minimum rental payments under our leases/sublease is as follows (in thousands):
Minimum Payments | |||
2018 | $ | 572 | |
2019 | 379 | ||
2020 | 388 | ||
2021 | 396 | ||
2022 | 405 | ||
Thereafter | 869 | ||
Total | $ | 3,009 | |
F-15
GULF ISLAND FABRICATION, INC.
NOTES TO CONSOLIDATED FINANCIAL STATEMENTS-(Continued)
6. FAIR VALUE MEASUREMENTS
Recurring fair value measurements and financial instruments - The carrying amounts that we have reported for financial instruments, including cash and cash equivalents, accounts receivables and accounts payables approximate their fair values.
Impairment of long-lived assets - We evaluate long-lived assets or asset groups used in operations for impairment losses when events and circumstances indicate that the assets or asset groups might not be recoverable. If events and circumstance indicate that the assets or asset groups might not be recoverable, the expected future undiscounted cash flows from the assets or asset groups are estimated and compared with the carrying amount of the assets or asset groups. If the sum of the estimated undiscounted cash flows is less than the carrying amount of the assets or asset groups, an impairment loss is recorded. We had no impairments of long-lived asset for the years ended December 31, 2017, 2016 and 2015.
Impairment of assets held for sale - We measure and record assets held for sale at the lower of their carrying amount or fair value less cost to sell. The determination of fair value can require the use of significant judgment and can vary on the facts and circumstances. As of December 31, 2017, we had assets held for sale with a book value of $104.6 million related to our South Texas Properties and our Prospect Shipyard.
An asset group constitutes the minimum level for which identifiable cash flows are principally independent of the cash flows of other asset or liability groups. Fair value is determined based on discounted cash flows or appraised values, as appropriate. As discussed in Note 4, we entered into a real estate purchase option and contract with a third party whereby the third party was granted an exclusive option for the purchase of our South Yard for a purchase price of $55 million through April 25, 2018. We compared our carrying value of the South Yard to the purchase price less costs to sell and determined that there was no impairment. For our North Yard we have obtained third party appraisals to determine the fair value of the asset group due to the uncertainty with respect to the future cash flows and compared them to the carrying value which did not result in impairment.
During the year ended December 31, 2017, we recorded impairments totaling $989,000 related to our Prospect Shipyard. The impairments were based upon management's estimates of remaining fair value, less costs to sell. See Note 4 - "Assets Held For Sale." We had no assets held for sale at December 31, 2016.
Impairment of inventory - We measure and record inventory at the lower of cost or net realizable value. Included in our Fabrication Division was $5.9 million of inventory that we received as part of a settlement with a vendor in 2014 consisting of specialty and high-grade copper nickel and steel materials. We previously contracted with a third party broker to market the inventory at their facility; however, the third party canceled the contract during the year and we returned the inventory to our Houma Fabrication Yard. At December 31, 2017, we performed our annual inspection of this inventory and determined that the high-grade stainless steel and copper nickel components remained in good condition; however; much of lower-grade carbon steel pipe and valve fittings had deteriorated significantly due to exposure to the elements as a result of movement of this inventory between our facilities and the third party broker. We continue to market the inventory for sale or use within potential fabrication projects that are bidding; however, management has concluded that there most likely is not a near term opportunity to either sell this inventory as a lump sum or use them in our fabrication process. We recorded an impairment of $3.7 million based upon the estimated net realizable value of the high grade inventory in good condition and the estimated scrap proceeds for the lower grade carbon steel items.
Included in our Fabrication Division is specialty piping and valves inventory for a deepwater construction project that we received as part of a settlement with a customer in 2013 with an original value of $13.5 million. This inventory was impaired $3.2 million during 2014 related to a fair value estimate of $10.3 million with the assistance of third party valuation specialists and again impaired $6.6 million in 2015 based upon estimated sales proceeds and reclassified from assets held for sale to inventory. As of December 31, 2016, the net book value of this inventory was $3.7 million. We sold specialty piping with a net book value of $472,000 during January of 2017 resulting in an immaterial gain; however, there have been no other sales or interest in this inventory during 2017. We have received interest in prior periods for this inventory from offshore projects that remain viable; however, recent recoveries in oil and gas prices are not positively impacting the amount of demand for offshore oil and gas structures. Instead, oil and gas exploration and the resulting capital expenditures are more focused on land-based drilling, particularly in shale production areas. With no expected return of demand in the near term and the inability for us to use these materials in our current projects, it has became more evident to management, particularly during the fourth quarter of 2017, that these assets were impaired. Due to a lack of a market for this inventory, management has estimated the net realizable value based upon scrap prices including the cost to prepare the material to scrap and recorded an impairment of $2.9 million.
We have determined that our impairments of assets held for sale and inventory are non-recurring fair value measurements that fall within Level 3 of the fair value hierarchy. In this situation, we believe net realizable value approximates fair value.
F-16
GULF ISLAND FABRICATION, INC.
NOTES TO CONSOLIDATED FINANCIAL STATEMENTS-(Continued)
7. EARNINGS PER SHARE
The following table sets forth the computation of basic and diluted earnings per share (in thousands, except per share data):
2017 | 2016 | 2015 | |||||||||
Numerator: | |||||||||||
Net income (loss) | $ | (44,766 | ) | $ | 3,515 | $ | (25,364 | ) | |||
Less: distributed loss / distributed and undistributed income (unvested restricted stock) | 3 | 30 | 84 | ||||||||
Net income (loss) attributable to common shareholders | $ | (44,769 | ) | $ | 3,485 | $ | (25,448 | ) | |||
Denominator (basic and fully diluted): | |||||||||||
Denominator for basic earnings per share-weighted-average shares | 14,838 | 14,631 | 14,546 | ||||||||
Basic and fully diluted earnings (loss) per share—common shareholders | $ | (3.02 | ) | $ | 0.24 | $ | (1.75 | ) | |||
8. LINE OF CREDIT
On June 9, 2017, we entered into a $40 million credit agreement. The credit agreement matures June 9, 2019, and may be used for issuing letters of credit and/or general corporate and working capital purposes. We amended our credit agreement on December 29, 2017, and then again on February 26, 2018, lowering the base tangible net worth requirement from the initial $230 million to $185 million in the minimum tangible net worth covenant. In addition, the second amendment to our credit agreement revises the calculation for the minimum tangible net worth covenant to include 50% of any gain attributable to the sale of our South Texas Properties. We believe that our credit agreement, as amended, will provide us with additional working capital flexibility to expand operations as backlog improves, respond to market opportunities and support our ongoing operations.
Interest on drawings under our credit agreement may be designated, at our option, as either Base Rate (as defined in the credit agreement) or LIBOR plus 2.0% per annum. Unused commitment fees on the undrawn portion of the facility are 0.4% per annum, and interest on undrawn stated amounts under letters of credit issued by the lenders is 2.0% per annum. The credit agreement is secured by substantially all of our assets except the South Texas Properties.
We must comply with the following financial covenants each quarter during the term of the facility:
i. | Ratio of current assets to current liabilities of not less than 1.25:1.00; |
ii. | Minimum tangible net worth requirement of at least the sum of: |
a) | $185 million, plus |
b) | An amount equal to 50% of consolidated net income for each fiscal quarter ending after June 30, 2017, including 50% of any gain attributable to the sale of our South Texas Properties (with no deduction for a net loss in any such fiscal quarter); plus |
c) | 100% of all net proceeds of any issuance of any stock or other equity after deducting of any fees, commissions, expenses and other costs incurred in such offering; and |
iii. | Ratio of funded debt to tangible net worth of not more than 0.5:1.00. |
Concurrent with our execution of the credit agreement, we terminated our prior credit agreement. At the time of the termination, there was approximately $4.6 million of letters of credit outstanding. All were reissued as new letters of credit under the new credit agreement and accepted by the beneficiaries. As of December 31, 2017, there were approximately $5.5 million in letters of credit and no outstanding borrowings with availability under our credit agreement for future, additional letters of credit and borrowings of $34.5 million.
As of December 31, 2017, we had no borrowings under our credit agreement, and we were in compliance with all of our covenants. During January 2018, we subsequently drew $10 million under our credit agreement which remains outstanding as of March 9, 2018.
F-17
GULF ISLAND FABRICATION, INC.
NOTES TO CONSOLIDATED FINANCIAL STATEMENTS-(Continued)
9. INCOME TAXES
Our provision for income taxes for 2017 was impacted by the Tax Cuts and Jobs Act enactment in December 2017 and our adoption of Accounting Standards Update (ASU) 2016-09, Improvements to Share-Based Payment Accounting, on January 1, 2017.
As of December 31, 2017, we have not completed our accounting for the tax effects of the Tax Cuts and Jobs Act. In accordance with SAB 118, we have recorded provisional amounts related to the transition tax, impacts of the Tax Cuts and Jobs Act on state taxes and provisions of the Tax Cuts and Jobs Act related to executive compensation. Our accounting for the tax effects of the Tax Cuts and Jobs Act will be completed before the end of the measurement period which is one year from the date of enactment of the Tax Cuts and Jobs Act. Our preliminary estimate of the impact of the Tax Cuts and Jobs Act was immaterial to our deferred tax position as of December 31, 2017. Our net position is based on reasonable estimates for those tax effects of the Tax Cuts and Jobs Act. Changes to these estimates or new guidance issued by regulators may materially impact our provision for income taxes and effective tax rate in the period in which the adjustments are made.
Adoption of ASU2016-09 requires the recognition of the excess tax benefit or tax deficiency resulting from the difference between the deduction for tax purposes and the compensation cost recognized for financial reporting purposes created when common stock vests as an income tax benefit or expense in the Company’s statement of operations. Under previous GAAP, this difference was required to be recognized in additional paid-in capital. The expense or benefit required to be recognized is calculated separately as a discrete item each reporting period and not as part of the Company’s projected annual effective tax rate. During the year ended December 31, 2017, we recorded tax expense of $253,000.
Significant components of the Company’s deferred tax assets and liabilities as of December 31, 2017 and 2016 were as follows (in thousands):
2017 | 2016 | ||||||
Deferred tax liabilities: | |||||||
Property, plant and equipment | $ | 17,605 | $ | 27,468 | |||
Prepaid insurance | 453 | 766 | |||||
Total deferred tax liabilities: | 18,058 | 28,234 | |||||
Deferred tax assets: | |||||||
Employee benefits | 962 | 1,303 | |||||
Uncompleted contracts | 2,664 | 106 | |||||
Stock based compensation expense | 350 | 1,488 | |||||
Allowance for uncollectible accounts | 99 | 192 | |||||
Long term incentive awards | 280 | 264 | |||||
Federal net operating losses | 13,190 | 617 | |||||
State net operating losses | 511 | — | |||||
AMT credit carryforwards | — | 1,030 | |||||
Other | 394 | — | |||||
Less valuation allowance | (392 | ) | — | ||||
Total deferred tax assets: | 18,058 | 5,000 | |||||
Net deferred tax liabilities: | $ | — | $ | 23,234 | |||
F-18
GULF ISLAND FABRICATION, INC.
NOTES TO CONSOLIDATED FINANCIAL STATEMENTS-(Continued)
Significant components of income tax expense (benefit) for the years ended December 31 were as follows (in thousands):
2017 | 2016 | 2015 | |||||||||
Current: | |||||||||||
Federal | $ | — | $ | 302 | $ | 219 | |||||
State | 83 | 361 | 473 | ||||||||
Total current | 83 | 663 | 692 | ||||||||
Deferred: | |||||||||||
Federal | (23,827 | ) | 1,549 | (13,614 | ) | ||||||
State | (449 | ) | (171 | ) | (447 | ) | |||||
Total deferred | (24,276 | ) | 1,378 | (14,061 | ) | ||||||
Income taxes | $ | (24,193 | ) | $ | 2,041 | $ | (13,369 | ) | |||
A valuation allowance is provided to reserve for deferred tax assets if, based upon the available evidence, it is more likely than not that some or all of the deferred tax assets will not be realized. As of December 31, 2017, we had a valuation allowance of $392,000 offsetting our deferred tax assets. As of December 31, 2017 we had gross, federal net operating losses that are eligible for carryforward to offset future net income of $62.8 million, of which $4.0 million will expire on December 31, 2035. Our remaining federal net operating loss carryforwards will expire December 31, 2037.
A reconciliation of income taxes computed at the U.S. federal statutory tax rate to the Company’s income tax (benefit) expense for the years ended December 31, 2017, 2016 and 2015 is as follows (in thousands):
2017 | % | 2016 | % | 2015 | % | ||||||||||||
U.S. statutory rate | $ | (24,136 | ) | 35.0% | $ | 1,945 | 35.0% | $ | (13,556 | ) | 35.0% | ||||||
Increase (decrease) resulting from: | |||||||||||||||||
Permanent differences | 330 | (0.5)% | 64 | 1.1% | 275 | (0.7)% | |||||||||||
State income taxes | (366 | ) | 0.5% | 32 | 0.6% | — | —% | ||||||||||
Vesting of common stock | 253 | (0.4)% | — | —% | — | —% | |||||||||||
Other | (274 | ) | 0.5% | — | —% | (88 | ) | 0.2% | |||||||||
Income tax (benefit) expense | $ | (24,193 | ) | 35.1% | $ | 2,041 | 36.7% | $ | (13,369 | ) | 34.5% | ||||||
10. RETIREMENT AND LONG-TERM INCENTIVE PLANS
401(k) Plan
The Company has a defined contribution plan for all employees that is qualified under Section 401(k) of the Internal Revenue Code. Contributions to the retirement plan by the Company are based on the participants’ contributions, with an additional year-end discretionary contribution determined by the Board of Directors. Effective April 1, 2016, the Company temporarily suspended its matching contribution in response to the downturn in the oil and gas industry. For the years ended December 31, 2017, 2016 and 2015, the Company contributed a total of $0, $670,000, and $2.3 million, respectively.
Long-Term Incentive Plans
Under our long-term incentive plans, the compensation committee of our Board of Directors may grant equity awards related to the Company's common stock, including awards of restricted stock, restricted stock units, other stock-based awards and options to eligible participants as the compensation committee determines. A summary of our long-term incentive plans is as follows:
Long-Term Incentive Plan (approved by our shareholders on February 13, 1997):
• | authorizes the grant of options to purchase an aggregate of 1,000,000 (split adjusted) shares of the Company’s common stock to certain officers, key employees, directors and consultants of the Company chosen by the compensation committee. |
• | no individual employee may be granted awards with respect to more than 400,000 shares of common stock in a calendar year. |
2002 Long-Term Incentive Plan (approved by our shareholders on April 24, 2002, and amended on April 26, 2006):
• | authorizes the grant of awards, including options, to purchase an aggregate of 500,000 shares of the Company’s common stock to certain officers, key employees, directors and consultants of the Company chosen by the compensation committee. |
F-19
GULF ISLAND FABRICATION, INC.
NOTES TO CONSOLIDATED FINANCIAL STATEMENTS-(Continued)
• | no individual employee may be granted awards with respect to more than 200,000 shares of common stock in a calendar year. |
2011 Stock Incentive Plan (approved by our shareholders on April 28, 2011):
• | authorizes the grant of awards, including options, to purchase an aggregate of 500,000 shares of the Company’s common stock to certain officers, key employees, directors and consultants of the Company chosen by the compensation committee. |
• | no individual employee may be granted awards with respect to more than 200,000 shares of common stock in a calendar year. |
2015 Stock Incentive Plan (approved by our shareholders on April 23,2015):
• | authorizes the grant of awards, including options, to purchase an aggregate of 1,000,000 shares of the Company’s common stock to certain officers, key employees, directors and consultants of the Company chosen by the compensation committee. |
• | no individual employee may be granted awards with respect to more than 200,000 shares of common stock and no outside director may receive awards that relate to more than 25,000 shares in any fiscal year. |
At December 31, 2017, there were approximately 833,443 shares in the aggregate remaining available for future issuance under the Long-Term Incentive Plan, the 2002 Long-Term Incentive Plan, the 2011 Stock Incentive Plan and the 2015 Stock Incentive Plan (together, the “Incentive Plans”). The Company issues new shares through its transfer agent in connection with issuances under the Incentive Plans.
Restricted Stock Awards
Restricted stock awards which include shares of restricted stock and restricted stock units are subject to transfer restrictions, forfeit provisions and other terms and conditions of the Incentive Plans. At the time restricted stock awards are made, the compensation committee will establish a period of time during which the transfer of the shares of restricted stock shall be restricted and after which the shares of restricted stock shall be vested. Except for the restricted stock awards that vest based on the attainment of performance goals, the restricted period shall be a minimum of three years, with incremental vesting of portions of the award over the three-year period permitted.
Our Incentive Plans do not have any limitations on the number of shares that can be specifically awarded as restricted stock. Restricted stock granted to our non-employee directors have six-month vesting periods. The fair value of restricted stock is determined based on the closing price of the Company’s common stock on the date of the grant.
A summary of our restricted stock awards activity for the years ended December 31, 2017, 2016 and 2015 is presented in the table below.
2017 | 2016 | 2015 | ||||||||||||||||||
Number of Shares | Weighted- Average Grant-Date Fair Value Per Share | Number of Shares | Weighted- Average Grant-Date Fair Value Per Share | Number of Shares | Weighted- Average Grant-Date Fair Value Per Share | |||||||||||||||
Restricted shares at the beginning of period | 370,565 | $ | 12.99 | 262,964 | $ | 18.33 | 107,840 | $ | 24.27 | |||||||||||
Granted | 383,121 | 13.02 | 259,699 | 8.55 | 215,034 | 16.33 | ||||||||||||||
Vested | (215,478 | ) | 12.52 | (114,804 | ) | 14.37 | (41,112 | ) | 22.04 | |||||||||||
Forfeited | (93,082 | ) | 12.53 | (37,294 | ) | 15.48 | (18,798 | ) | 21.39 | |||||||||||
Restricted shares at the end of period | 445,126 | $ | 12.83 | 370,565 | $ | 12.99 | 262,964 | $ | 18.33 | |||||||||||
As of December 31, 2017, there was $2.7 million of total unrecognized compensation cost related to restricted share-based compensation arrangements granted under the Incentive Plans. This cost is expected to be recognized over a weighted-average period of 1.6 years. The total fair value of shares vested during the year ended December 31, 2017 was $2.1 million.
Share-based compensation cost that has been charged against income for the Incentive Plans was $2.7 million, $2.1 million and $2.7 million for 2017, 2016 and 2015, respectively. The total income tax benefit (expense) recognized in the statement of operations for share-based compensation arrangements was 253,000 for the year ended December 31, 2017, and $0 for each of the years ending December 31, 2016 and 2015, respectively.
F-20
GULF ISLAND FABRICATION, INC.
NOTES TO CONSOLIDATED FINANCIAL STATEMENTS-(Continued)
Performance awards
We issue performance awards to our executives and certain members of management. Performance targets are communicated to employees at the beginning of a performance period and are based upon our total shareholder return compared to an industry peer group as determined by our Board of Directors. Awards granted during 2015 were based upon a two-year performance period ending December 31, 2016, and paid in shares. The shares vest at the completion of the performance period with compensation expense recognized on a straight line basis. Awards granted during 2016 and 2017 are based upon a three-year performance period ending on December 31, 2018, and December 31, 2019, respectively, and are payable in cash. The fair value of the 2017 and 2016 awards is calculated each reporting period and compensation expense (including fair value adjustments) is recognized on a straight line basis.
For the years ended December 31, 2017, 2016 and 2015, expense recognized for performance based award compensation was $1.5 million, $1.3 million and $1.1 million, respectively. The fair value of the performance based awards granted for the years ended December 31, 2017 and 2016 was $4.7 million and $1.6 million, respectively, as determined using a Monte Carlo simulation model. These awards are payable in cash.
11. LEEVAC TRANSACTION
On January 1, 2016, we acquired substantially all of the assets and assumed certain specified liabilities of LEEVAC Shipyards, L.L.C. and its affiliates (“LEEVAC”). The purchase price for the acquisition was $20 million, subject to a working capital adjustment whereby we received a dollar-for-dollar reduction for the assumption of certain net liabilities of LEEVAC and settlement payments applied from sureties on certain ongoing fabrication projects that were assigned to us in the transaction. After taking into account these adjustments, we received approximately $3.0 million in cash from the seller. Strategically, the LEEVAC transaction expands our marine fabrication and repair and maintenance presence in the GOM market. We acquired approximately $121.2 million of newbuild construction backlog inclusive of approximately $9.2 million of purchase price fair value allocated to four, newbuild construction projects for two customers. We own the machinery and equipment that were purchased in the LEEVAC Transaction; however, lease the following facilities.
Jennings Shipyard - Our Jennings Shipyard is an 180-acre complex five miles east of Jennings, Louisiana, on the west bank of the Mermentau River approximately 25 miles north of the U.S. Intracoastal Waterway that we lease from a third party. The lease, including exercisable renewal options, extends through January 2045.
Lake Charles Shipyard - Our Lake Charles Shipyard is a ten-acre complex 17 miles from the GOM on the Calcasieu River near Lake Charles, Louisiana, that we sublease from a third party. The sublease, including exercisable renewal options (subject to sublessor renewals), extends through July 2038.
Former Prospect Shipyard - We formerly leased a 35-acre complex 26 miles from the GOM near Houma, Louisiana, from the former owner of LEEVAC Shipyards, currently one of our Senior Vice Presidents of Business Development. We terminated this lease on December 31, 2017, in accordance with its terms, and we are marketing the remaining assets located at such property for sale. See also Note 4.
F-21
GULF ISLAND FABRICATION, INC.
NOTES TO CONSOLIDATED FINANCIAL STATEMENTS-(Continued)
The results of the LEEVAC Transaction are fully incorporated in our financial statements for the years ended December 31, 2017 and 2016, as the transaction occurred on January 1, 2016. The table below presents our pro forma results of operations for the year ended December 31, 2015, assuming that we acquired substantially all of the assets and certain specified liabilities of LEEVAC on January 1, 2015 (in thousands):
Year Ended December 31, 2015 | Pro forma adjustments | ||||||||||||||||
Historical results | LEEVAC | Adjustments | Pro forma results | ||||||||||||||
Revenue | $ | 306,120 | $ | 87,239 | $ | — | $ | 393,359 | |||||||||
Net income (loss) | $ | (25,364 | ) | $ | (4,655 | ) | $ | 3,738 | (1) | $ | (26,281 | ) | |||||
______________
(1) Adjustments to historical results are as follows:
Year Ended December 31, 2015 | ||||
Effect of purchase price depreciation | $ | 1,217 | ||
Elimination of interest expense | 2,038 | |||
Income taxes | 483 | |||
Total | $ | 3,738 | ||
12. CONTINGENCIES AND COMMITMENTS
The Company is subject to various routine legal proceedings in the normal conduct of its business, primarily involving commercial claims, workers’ compensation claims, and claims for personal injury under general maritime laws of the United States and the Jones Act. While the outcome of these lawsuits, legal proceedings and claims cannot be predicted with certainty, management believes that the outcome of any such proceedings, even if determined adversely, would not have a material adverse effect on the financial position, results of operations or cash flows of the Company.
During the year ended December 31, 2017, we incurred operating losses totaling $34.5 million related to cost overruns and delays that we encountered in the newbuild construction of two multi-purpose service vessels that we are building for a customer within our Shipyard Division. These vessels are some of the most technologically-advanced vessels in their class. The cost overruns relate primarily to complexities with the installation of the power and communications systems. We believe the best course of action for the Company is to perform additional engineering and construction planning to ensure we are meeting the contractual performance requirements for these vessels and mitigating any further construction risk. With the additional electrical engineering, planning and construction estimates, the estimated delivery dates of the vessels will be extended beyond the contractual delivery dates, and we estimate that the maximum amount of liquidated damages of $11.2 million will be incurred in the absence of a signed amendment with the customer. We have included the maximum liquidated damages in our 2017 loss provision above and reduced our estimate of the contract price. We continue to work with the customer to complete the contract in a manner that is acceptable to both parties; however, resolution with this customer could take several months. We can provide no assurance that we will be successful in signing an amendment to the contract, or that in the event we are successful in negotiating an amendment, as to when such an amendment will be signed or if such amendment will result in recovery of any cost overruns or liquidated damages that we have recognized to date. We believe that our estimates to complete the vessels are reasonable; however, we cannot guarantee that we will not incur additional costs as we negotiate with our customer.
13. OPERATING SEGMENTS
We have structured our operations with three significant operating divisions, one corporate non-operating division and one newly formed operating division. Beginning in 2017, management reduced its allocation of corporate administrative costs and overhead expenses from its corporate, non-operating division to its operating divisions in order to individually evaluate corporate administrative costs and overhead within our Corporate Division as well as to not overly burden our operating divisions with costs that do not directly relate to their operations. Accordingly, a significant portion of our corporate administrative costs and overhead expenses are retained within the results of our corporate division. In addition, we have also allocated certain personnel previously included in the operating divisions to our Corporate Division. In doing so, management believes that it has created a fourth reportable segment with each of its three significant operating divisions and its Corporate Division each meeting the criteria of reportable segments under GAAP. Beginning in December 2017, we created a new operating division, which we have named our EPC Division to manage expected work we will perform for the SeaOne Project and other projects that may require EPC project management services. EPC's operating revenue and expenses for 2017 were immaterial and it held no assets.
F-22
GULF ISLAND FABRICATION, INC.
NOTES TO CONSOLIDATED FINANCIAL STATEMENTS-(Continued)
Our three significant operating divisions and Corporate Division are discussed below.
Fabrication Division - Our Fabrication Division primarily fabricates structures such as offshore drilling and production platforms and other steel structures for customers in the oil and gas industries including jackets and deck sections of fixed production platforms, hull, tendon, and/or deck sections of floating production platforms (such as TLPs, SPARs, FPSOs and MinDOCs), piles, wellhead protectors, subsea templates, and various production, compressor, and utility modules along with pressure vessels. Our Fabrication Division also fabricates structures for alternative energy customers (such as the five jackets and piles we constructed for the first offshore wind power project in the United States during 2015) as well as modules for petrochemical facilities. We perform these activities out of our fabrication yards in Houma, Louisiana, and formerly out of our fabrication yards in Aransas Pass and Ingleside, Texas, each of which are marketed for sale.
Shipyard Division - Our Shipyard Division primarily manufactures newbuild and repairs various steel marine vessels in the United States including offshore supply vessels, anchor handling vessels and liftboats to support the construction and ongoing operation of offshore oil and gas production platforms, tug boats, towboats, barges and other marine vessels. We also construct drydocks to lift marine vessels out of the water. Our marine repair activities include steel repair, blasting and painting services, electrical systems repair, machinery and piping system repairs, and propeller, shaft, and rudder reconditioning. In addition, we perform conversion projects that consist of lengthening vessels, modifying vessels to permit their use for a different type of activity, and other modifications to enhance the capacity or functionality of a vessel. We perform these activities out of our shipyards in Houma, Jennings and Lake Charles, Louisiana.
Services Division - Our Services Division primarily provides interconnect piping services on offshore platforms and inshore structures. Interconnect piping services involve sending employee crews to offshore platforms in the GOM to perform welding and other activities required to connect production equipment, service modules and other equipment on a platform. We also contract with oil and gas companies that have platforms and other structures located in the inland lakes and bays throughout the southeastern United States for various on-site construction and maintenance activities. In addition, our Services Division fabricates packaged skid units and perform various municipal and drainage projects, such as pump stations, levee reinforcement, bulkheads and other public works projects for state and local governments. We perform these services at our customer's facilities or out of our Houma Service Yard.
We generally evaluate the performance of, and allocate resources to, our divisions based upon gross profit (loss) and operating income (loss). Segment assets are comprised of all assets attributable to each division. Corporate administrative costs and overhead are generally allocated to our segments except for those costs that are not directly related to the operations of our divisions. Intersegment revenues are priced at the estimated fair value of work performed. Summarized financial information concerning our segments as of and for the three-year period ended December 31, 2017, is as follows (in thousands):
December 31, 2017 | |||||||||||||||
Fabrication | Shipyard (1) | Services | Corp. & Eliminations | Consolidated | |||||||||||
Revenue | $ | 57,880 | $ | 52,699 | $ | 65,445 | $ | (5,002 | ) | $ | 171,022 | ||||
Gross profit (loss) | (1,941 | ) | (44,870 | ) | 4,575 | (689 | ) | (42,925 | ) | ||||||
Operating income (loss) | (12,040 | ) | (49,785 | ) | 1,874 | (8,446 | ) | (68,397 | ) | ||||||
Depreciation expense | 6,592 | 4,073 | 1,676 | 404 | 12,745 | ||||||||||
Capital expenditures | 2,395 | 1,909 | 403 | 127 | 4,834 | ||||||||||
Total Assets | $ | 195,187 | $ | 74,516 | $ | 105,291 | $ | (104,154 | ) | $ | 270,840 | ||||
F-23
GULF ISLAND FABRICATION, INC.
NOTES TO CONSOLIDATED FINANCIAL STATEMENTS-(Continued)
December 31, 2016 | |||||||||||||||
Fabrication | Shipyard | Services | Corp. & Eliminations | Consolidated | |||||||||||
Revenue | $ | 88,683 | $ | 109,502 | $ | 91,414 | $ | (3,273 | ) | $ | 286,326 | ||||
Gross profit (loss) | 5,276 | 7,801 | 12,420 | (644 | ) | 24,853 | |||||||||
Operating income (loss) | 1,500 | 2,375 | 9,106 | (7,798 | ) | 5,183 | |||||||||
Depreciation expense | 18,566 | 4,686 | 1,775 | 421 | 25,448 | ||||||||||
Capital expenditures | 2,633 | 1,861 | 1,495 | 806 | 6,795 | ||||||||||
Total Assets | $ | 272,292 | $ | 81,928 | $ | 96,404 | $ | (128,216 | ) | $ | 322,408 | ||||
December 31, 2015 | |||||||||||||||
Fabrication | Shipyard | Services | Corp. & Eliminations | Consolidated | |||||||||||
Revenue | $ | 151,576 | $ | 59,601 | $ | 100,431 | $ | (5,488 | ) | $ | 306,120 | ||||
Gross profit (loss) | (36,990 | ) | 8,750 | 13,937 | (853 | ) | (15,156 | ) | |||||||
Operating income (loss) | (49,295 | ) | 7,695 | 11,353 | (8,367 | ) | (38,614 | ) | |||||||
Depreciation expense | 22,045 | 1,921 | 1,733 | 505 | 26,204 | ||||||||||
Capital expenditures | 3,360 | 1,206 | 1,379 | 73 | 6,018 | ||||||||||
Total Assets | $ | 310,790 | $ | 54,543 | $ | 94,618 | $ | (143,028 | ) | $ | 316,923 | ||||
____________
(1) | Included in the 2017 operating results for our Shipyard Division is $34.5 million in operating losses related to cost overruns and delays that we encountered in the newbuild construction of two multi-purpose service vessels. The delivery of the vessels will be extended beyond the contractual delivery dates and put us in a position to incur liquidated damages. In absence of a signed amendment with the customer, we have accrued the maximum liquidated damages under the contract of $11.2 million. |
14. QUARTERLY OPERATING RESULTS (UNAUDITED)
A summary of quarterly results of operations for the years ended December 31, 2017 and 2016 were as follows (in thousands, except per share data):
March 31, 2017 | June 30, 2017 | September 30, 2017 | December 31, 2017 (1) | ||||||||||||
Revenue | $ | 37,993 | $ | 45,868 | $ | 49,884 | $ | 37,277 | |||||||
Gross profit (loss) | (4,897 | ) | (11,620 | ) | (494 | ) | (25,914 | ) | |||||||
Net income (loss) | (6,454 | ) | (10,923 | ) | (3,110 | ) | (24,279 | ) | |||||||
Basic and fully diluted EPS | $ | (0.44 | ) | $ | (0.73 | ) | $ | (0.21 | ) | $ | (1.63 | ) | |||
March 31, 2016 | June 30, 2016 | September 30, 2016 | December 31, 2016 | ||||||||||||
Revenue | $ | 83,979 | $ | 81,502 | $ | 65,384 | $ | 55,461 | |||||||
Gross profit (loss) | 5,701 | 14,066 | 5,259 | (173 | ) | ||||||||||
Net income (loss) | 989 | 5,540 | 541 | (3,555 | ) | ||||||||||
Basic and fully diluted EPS | $ | 0.07 | $ | 0.37 | $ | 0.04 | $ | (0.24 | ) | ||||||
(1) | During the fourth quarter of 2017, we incurred $22.5 million in losses related to cost overruns and delays that we encountered in the newbuild construction of two multi-purpose service vessels. The cost overruns relate primarily to complexities with the installation of the power and communications systems. We believe the best course of action for the Company is to perform additional engineering and construction planning to ensure we are meeting the contractual performance requirements for these vessels and mitigating any further construction risk. With the additional electrical engineering, planning and construction estimates, the estimated delivery dates of the vessels will be extended beyond the contractual delivery dates, and we estimate that the maximum amount of liquidated damages of $11.2 million will be incurred in the absence of a signed amendment with the customer. We have included the maximum liquidated |
F-24
GULF ISLAND FABRICATION, INC.
NOTES TO CONSOLIDATED FINANCIAL STATEMENTS-(Continued)
damages in our 2017 loss provision above and reduced our estimate of the contract price. Total contract losses for this customer for the year are $34.5 million.
15. SUBSEQUENT EVENTS
During January 2018, we subsequently drew $10.0 million under our credit agreement. On February 26, 2018, the Company entered into a Second Amendment (the "Second Amendment") to the credit agreement with our lending institution, dated June 9, 2017. The Second Amendment lowers the base tangible net worth requirement from $200 million to $185 million in the minimum tangible net worth covenant. In addition, the Second Amendment revises the calculation for the minimum tangible net worth covenant to include 50% of any gain attributable to the sale of our South Texas Properties.
F-25
GULF ISLAND FABRICATION, INC.
EXHIBIT INDEX
EXHIBIT NUMBER | ||
2.1 | ||
3.1 | ||
3.2 | ||
4.1 | ||
10.1 | ||
10.2 | The Company’s Long-Term Incentive Plan. * † | |
10.3 | ||
10.4 | ||
10.5 | ||
10.6 | ||
10.7 | ||
10.8 | ||
10.9 | ||
10.10 | ||
10.11 | ||
E-1
EXHIBIT NUMBER | ||
10.12 | ||
10.13 | ||
10.14 | ||
10.15 | ||
10.16 | ||
10.17 | ||
10.18 | ||
10.19 | ||
21.1 | Subsidiaries of the Company - The Company’s significant subsidiaries, Gulf Island Works, L.L.C., Gulf Island, L.L.C., Gulf Island Shipyards, L.L.C. (with trade name Gulf Island Marine Fabricators), Gulf Island Services, L.L.C. (with trade names Gulf Island Steel Sales, Dolphin Services and Dolphin Steel Sales) (each organized under Louisiana law) and Gulf Marine Fabricators, L.P. (a Texas limited partnership) are wholly owned and are included in the Company’s consolidated financial statements. | |
23.1 | ||
31.1 | ||
31.2 | ||
32 | ||
101 | Attached as Exhibit 101 to this report are the following items formatted in XBRL (Extensible Business Reporting Language): | |
(i) Consolidated Balance Sheets, (ii) Consolidated Statements of Operations, (iii) Consolidated Statement of Changes in Shareholders’ Equity, (iv) Consolidated Statements of Cash Flows and (v) Notes to Consolidated Financial Statements. | ||
† | Management Contract or Compensatory Plan. |
* | Incorporated by reference to the Company’s Registration Statement on Form S-1 filed with the Commission on February 14, 1997 (Registration Number 333-21863). |
** | Filed herewith. |
^ | SEC File Number 000-22303. |
E-2
SIGNATURES
Pursuant to the requirements of Section 13 or 15(d) of the Securities Exchange Act of 1934, the registrant has duly caused this report to be signed on its behalf by the undersigned, thereunto duly authorized, on March 9, 2018.
GULF ISLAND FABRICATION, INC. (Registrant) | ||
By: | /S/ KIRK J. MECHE | |
Kirk J. Meche | ||
President and Chief Executive Officer | ||
Pursuant to the requirements of the Securities Exchange Act of 1934, this report has been signed below by the following persons on behalf of the registrant and in the capacities indicated on March 9, 2018.
Signature | Title | |
/S/ KIRK J. MECHE | President, Chief Executive Officer and Director (Principal Executive Officer) | |
Kirk J. Meche | ||
/S/ DAVID S. SCHORLEMER | Executive Vice President, Chief Financial Officer, Treasurer and Secretary (Principal Financial Officer) | |
David S. Schorlemer | ||
/S/ ROBERT A. WALLIS | Chief Accounting Officer (Principal Accounting Officer) | |
Robert A. Wallis | ||
/S/ MURRAY W. BURNS | Director | |
Murray W. Burns | ||
/S/ WILLIAM E. CHILES | Director | |
William E. Chiles | ||
/S/ GREGORY J. COTTER | Director | |
Gregory J. Cotter | ||
/S/ MICHAEL A. FLICK | Director | |
Michael A. Flick | ||
/S/ CHRISTOPHER M. HARDING | Director | |
Christopher M. Harding | ||
/S/ MICHAEL J. KEEFFE | Director | |
Michael J. Keeffe | ||
/S/ JOHN P. LABORDE | Chairman of the Board | |
John P. Laborde | ||
S-1