Attached files
| file | filename |
|---|---|
| EX-32.1 - EX-32.1 - Revolution Lighting Technologies, Inc. | d692260dex321.htm |
| EX-31.2 - EX-31.2 - Revolution Lighting Technologies, Inc. | d692260dex312.htm |
| EX-31.1 - EX-31.1 - Revolution Lighting Technologies, Inc. | d692260dex311.htm |
| EX-23.1 - EX-23.1 - Revolution Lighting Technologies, Inc. | d692260dex231.htm |
| EX-21.1 - EX-21.1 - Revolution Lighting Technologies, Inc. | d692260dex211.htm |
Table of Contents
UNITED STATES
SECURITIES AND EXCHANGE COMMISSION
WASHINGTON, D.C. 20549
FORM 10-K
| ☒ | ANNUAL REPORT PURSUANT TO SECTION 13 OR 15(d) OF THE SECURITIES EXCHANGE ACT OF 1934 |
For the fiscal year ended December 31, 2017
OR
| ☐ | TRANSITION REPORT PURSUANT TO SECTION 13 OR 15(d) OF THE SECURITIES EXCHANGE ACT OF 1934 |
For the transition period from to
Commission File Number 000-23590
REVOLUTION LIGHTING TECHNOLOGIES, INC.
(Exact name of registrant as specified in its charter)
| Delaware | 59-3046866 | |
| (State or other jurisdiction of incorporation or organization) |
(I.R.S. Employer Identification No.) | |
| 177 Broad Street, 12th Floor, Stamford, CT | 06901 | |
| (Address of principal executive offices) | (Zip Code) | |
Registrant’s telephone number, including area code: (203) 504-1111
Securities registered pursuant to Section 12 (b) of the Act:
| Title of each class |
Name of each exchange on which registered | |
| Common Stock, $.001 par value | The NASDAQ Stock Market LLC (NASDAQ Capital Market) |
Securities registered pursuant to Section 12(g) of the Act: None
Indicate by check mark if the registrant is a well-known seasoned issuer, as defined in Rule 405 of the Securities Act. Yes ☐ No ☒
Indicate by check mark if the registrant is not required to file reports pursuant to Section 13 or 15(d) of the Act. Yes ☐ No ☒.
Indicate by check mark whether the registrant (1) has filed all reports required to be filed by Section 13 or 15(d) of the Securities Exchange Act of 1934 during the preceding 12 months (or for such shorter period that the registrant was required to file such reports), and (2) has been subject to such filing requirements for the past 90 days. Yes ☒ No ☐
Indicate by check mark whether the registrant has submitted electronically and posted on its corporate Web site, if any, every Interactive Data File required to be submitted and posted pursuant to Rule 405 of Regulation S-T (§232.405 of this chapter) during the preceding 12 months (or for such shorter period that the registrant was required to submit and post such files). Yes ☒ No ☐
Indicate by check mark if disclosure of delinquent filers pursuant to Item 405 of Regulation S-K is not contained herein, and will not be contained, to the best of the registrant’s knowledge, in definitive proxy or information statements incorporated by reference in Part III of this Form 10-K or any amendment to this Form 10-K. ☒
Indicate by check mark whether the registrant is a large accelerated filer, an accelerated filer, a non-accelerated filer, a smaller reporting company, or an emerging growth company. See the definitions of “large accelerated filer,” “accelerated filer,” “smaller reporting company,” and “emerging growth company” in Rule 12b-2 of the Exchange Act.
| Large accelerated filer | ☐ | Accelerated filer | ☒ | |||
| Non-accelerated filer | ☐ (Do not check if a smaller reporting company) | Smaller reporting company | ☐ | |||
| Emerging growth company | ☐ | |||||
If an emerging growth company, indicate by check mark if the registrant has elected not to use the extended transition period for complying with any new or revised financial accounting standards provided pursuant to Section 13(a) of the Exchange Act. ☐
Indicate by check mark whether the registrant is a shell company (as defined in Rule 12b-2 of the Exchange Act). Yes ☐ No ☒
The aggregate market value of common equity held by non-affiliates of the registrant as of June 30, 2017, based upon the last sale price of such equity reported on The NASDAQ Capital Market, was approximately $80,654,819.
As of February 28, 2018, there were 22,358,383 shares of Common Stock, $.001 par value, of the registrant outstanding.
DOCUMENTS INCORPORATED BY REFERENCE
Certain information required by Part III of Form 10-K is incorporated by reference to the Registrant’s definitive proxy statement for the 2018 Annual Meeting of Stockholders, which will be filed with the Securities and Exchange Commission.
Table of Contents
REVOLUTION LIGHTING TECHNOLOGIES, INC.
ANNUAL REPORT ON FORM 10-K
FOR THE FISCAL YEAR ENDED DECEMBER 31, 2017
INDEX
| Page | ||||||
| Form 10-K Item Number |
||||||
| Item 1. |
3 | |||||
| Item 1A. |
11 | |||||
| Item 1B. |
16 | |||||
| Item 2. |
16 | |||||
| Item 3. |
16 | |||||
| Item 4. |
16 | |||||
| Item 5. |
17 | |||||
| Item 6. |
20 | |||||
| Item 7. |
Management’s Discussion and Analysis of Financial Condition and Results of Operations |
21 | ||||
| Item 7A. |
27 | |||||
| Item 8. |
28 | |||||
| Item 9. |
Changes in and Disagreements with Accountants on Accounting and Financial Disclosures |
51 | ||||
| Item 9A. |
51 | |||||
| Item 9B. |
52 | |||||
| Item 10. |
52 | |||||
| Item 11. |
52 | |||||
| Item 12. |
Security Ownership of Certain Beneficial Owners and Management and Related Stockholder Matters |
52 | ||||
| Item 13. |
Certain Relationships and Related Transactions, and Director Independence |
53 | ||||
| Item 14. |
53 | |||||
| Item 15. |
53 | |||||
| Item 16. |
56 | |||||
2
Table of Contents
CAUTIONARY NOTE REGARDING FORWARD-LOOKING STATEMENTS
The information contained in this Annual Report on Form 10-K, other than historical information, may include forward-looking statements. Forward-looking statements can be identified by words such as “may,” “expect,” “intend,” “anticipate,” “believe,” “estimate,” “continue,” “plan,” “predict,” “will,” “would,” “could,” “can,” and similar terms. These forward-looking statements, which are subject to known and unknown risks, uncertainties and assumptions about us, may include projections of our future financial performance based on our growth strategies and anticipated trends in our business. These statements are only predictions based on our current expectations and projections about future events. There are important factors that could cause our actual results, level of activity, performance or achievements to differ materially from the results, level of activity, performance or achievements expressed or implied by the forward-looking statements. In particular, you should consider the numerous risks and uncertainties outlined in “Risk Factors.”
These risks and uncertainties are not exhaustive. Other sections of this Form 10-K may include additional factors, which could adversely impact our business and financial performance. Moreover, we operate in a very competitive and rapidly changing environment. New risks and uncertainties emerge from time to time, and it is not possible for our management to predict all risks and uncertainties, nor can management assess the impact of all factors on our business or the extent to which any factor, or combination of factors, may cause actual results to differ materially from those contained in any forward-looking statements.
Although we believe the expectations reflected in the forward-looking statements are reasonable, we cannot guarantee future results, level of activity, performance or achievements. Moreover, neither we nor any other person assumes responsibility for the accuracy or completeness of any of these forward-looking statements. You should not rely upon forward-looking statements as predictions of future events. We are under no duty to update any of these forward-looking statements after the date of this Form 10-K to conform our prior statements to actual results or revised expectations and we do not intend to do so.
| Item 1. | Business |
General
Revolution Lighting Technologies, Inc., together with its wholly-owned subsidiaries (“Revolution”, “we”, “us” or “our”), is a leader in the designing, manufacturing, marketing, and selling of light-emitting diode (“LED”) lighting solutions focusing on the industrial, commercial and government markets in the United States, Canada, and internationally. Through advanced LED technologies, we have created an innovative lighting company that offers a comprehensive advanced product platform of high-quality interior and exterior LED lamps and fixtures, including signage and state of the art lighting control systems. We are uniquely positioned to act as an expert partner, offering full-service lighting solutions through our operating divisions, including Energy Source, Value Lighting, Tri-State LED, E-Lighting, All-Around Lighting and TNT Energy, to transform lighting into a source of superior energy savings, quality light and well-being.
We generate revenue by selling lighting products for use in the commercial, industrial and government markets, which include vertical markets such as military, municipal, commercial, industrial, warehouse, education, hospitality, retail, healthcare, multi-family and signage-media-accent markets. We market and distribute our products globally through networks of electrical distributors and supply companies, electrical contractors, energy service companies (“ESCOs”), end-users, independent sales agencies and representatives, electrical supply companies, as well as internal marketing and direct sales force.
We bring together the best products in the market today with an experienced, knowledgeable team for our customers to achieve their goals. We continue to make key investments to ensure that we provide the highest quality LED lighting products. This dedication to quality extends beyond our products to the service we provide at every point in a project, to achieve energy savings on time and within budget, managing all phases of the project, including design and specification, scope and budget development, final material selection, pursuit and securing of project incentives, installation, and project management.
Our operations consist of one reportable segment for financial reporting purposes: Lighting Products and Solutions (principally LED fixtures and lamps).
History of Our Business
We were incorporated in Delaware on December 16, 1993. We are the successor by merger to a corporation named Super Vision International, Inc., which was incorporated in January 1991. In April 2007, we changed our name from Super Vision International, Inc. to Nexxus Lighting, Inc. (“Nexxus”).
In 2008, we acquired Lumificient. We began shipping our line of Array LED replacement lamps in December 2008 and continued to launch Array products in 2009. We broadened the product line by adding additional lamp sizes and options, as well as upgrades to the original products. On October 28, 2010, we sold substantially all of the assets of our legacy commercial/architectural lighting and pool and spa lighting businesses, which consisted of the manufacture, marketing and sale of LED and fiber optic lighting products used for
3
Table of Contents
applications in commercial, architectural and pool and spa markets, excluding the Array business and the business of Lumificient. The divestiture of these businesses was consistent with our strategic plans to focus our resources on businesses where we see more significant long-term growth potential.
On September 12, 2012, RVL 1 LLC, an affiliate of Aston Capital, LLC (“RVL”), made an investment of $6.0 million in exchange for newly-created Series B Convertible Preferred Stock, $.001 par value per share, representing 73% of the outstanding voting stock. The RVL investment resulted in a change in control under applicable regulations of the NASDAQ Stock Market (“NASDAQ”). In connection with the RVL investment, Robert V. LaPenta was named Chairman of the Board and Chief Executive Officer, and we changed our name from Nexxus Lighting, Inc. to Revolution Lighting Technologies, Inc.
On December 20, 2012, we acquired Seesmart Technologies, Inc. (“Seesmart”), a designer, manufacturer, marketer and seller of high-performance, commercial grade LED’s, for a combination of cash, shares of common stock and shares of Series D convertible preferred stock, which were subsequently converted into common stock.
On August 22, 2013, we acquired Relume Technologies, Inc. (“Relume”), a manufacturer of outdoor LED products and smart grid control systems for outdoor lighting applications for a combination of cash and shares of common stock.
On November 15, 2013, we acquired Tri-State DE LLC (“Tri-State”), a distributor of Seesmart products, for a combination of cash and shares of common stock.
On April 17, 2014, we acquired Value Lighting, Inc. (“Value Lighting”), a supplier of lighting solutions to the multifamily residential market, for a combination of cash, which was funded with a loan from an affiliate, shares of common stock, and contingent consideration, which was subsequently paid in additional shares of common stock.
On December 18, 2014, we acquired All-Around Lighting, Inc. (“All-Around Lighting”), a supplier of lighting fixtures, for a combination of cash, shares of common stock, and contingent consideration if certain revenue targets were achieved. The additional consideration was issued as shares of common stock in eleven installments over three years, which concluded in the fourth quarter of 2017.
On February 5, 2015, we acquired the assets of DPI Management, Inc. d/b/a E Lighting (“E-Lighting”) for a combination of cash and shares of common stock.
On August 5, 2015, we acquired Energy Source, LLC (“Energy Source”) for a combination of cash, shares of common stock, $10 million in promissory notes and contingent consideration based on projected EBITDA during 2015, 2016 and 2017. The cash portion of the acquisition was funded through the issuance of shares of common stock to a third party investor for $10.0 million. On January 26, 2017, we repaid the promissory notes.
On May 9, 2016, we acquired TNT Energy, LLC (“TNT”) for a combination of cash, $2.0 million in promissory notes and contingent consideration based on defined earnings targets. The cash payment was funded through a common stock offering. On November 16, 2017, we repaid the promissory notes.
The Lighting Industry
The global lighting industry is a component of the electrical portion of the global construction industry. Construction opportunities can be further segmented into two categories – new construction (new work) and retro-fit construction (re-work). Generally the lighting industry focuses on three market segments: commercial, industrial/outdoor and residential. Within these three market segments exist two product categories: fixtures and lamps (more commonly known as light bulbs outside the lighting industry). The fixtures category includes all apparatuses, luminaires and power/heat-control systems, while lamps consist of the replaceable devices that emit light. Both categories historically have incorporated multiple “source” options which include conventional lamps such as incandescent, fluorescent and high-intensity discharge (“HID”) products. For residential applications within the general illumination market, inexpensive incandescent and, to a lesser extent, compact fluorescent (“CFL”) bulbs have been the preferred choice. For commercial applications, metrics show that the more expensive and long-lasting fluorescent and HID bulbs and fixtures have the largest market share at this time.
With rapid advancements in the performance, efficiency and the reduction in cost of energy-efficient lighting, including LED-based solutions, conventional light sources are beginning to be replaced by advanced technologies with lower operating costs over their useful lives. In addition, the energy-efficient nature of LED technology makes it an environmentally friendly light source, and the compact size of LEDs has created new possibilities in lighting fixture and lamp design. Product selection is influenced by a number of factors, including overall cost, energy efficiency, product life, lumen output and other product features, as well as regulatory, maintenance and environmental factors. We believe our unique advanced lighting solutions are well positioned to increasingly displace conventional lighting in each of our targeted markets.
In North America, lighting manufacturers/product providers sell products through multiple channels, including independent manufacturer’s representatives, electrical supply and distribution companies, and ESCOs. These channel partners then market
4
Table of Contents
products to electrical contractors, general contractors and, at times, directly to the end-user. In addition to having direct contact and relationships with the local channel partners, representatives also have direct contact with lighting designers, electrical engineers, architects and general contractors that influence buying decisions. The manufacturer’s representatives often provide value-added services, such as product promotion or design and implementation assistance. The ability of smaller companies to compete against larger more-established rivals is heavily rooted in their capacity to leverage their unique product portfolios and customer service to garner maximum productivity from each representative.
LED Lighting Industry Trends
LEDs are semiconductor-based devices that generate light. As the cost of LEDs decreases while performance improves, combined with increased consumer education and availability of state and utility energy efficiency incentive programs, we expect this lighting technology will continue to compete more effectively in the general illumination market versus traditional lighting. We believe the LED lighting industry is experiencing the following trends:
High Energy Costs Drive LED Adoption. As a result of rising electricity prices, particularly within dense urban areas already impacted by high energy costs, businesses and consumers seek new technologies to reduce energy consumption. LED lighting technology is one of the fastest growing opportunities to generate significant savings and quick returns on investment. LEDs used within residential and multi-family developments, especially ENERGY STAR rated products, use at least 75% less energy and last 25 times longer than incandescent lighting. Based on the percentage of a building’s energy usage consumed by lighting (20% commercial and 10% residential), industry experts believe that the widespread use of LED lighting has the greatest potential impact on energy savings in the United States. According to the U.S. Department of Energy, by 2027, widespread use of LEDs could save about 348 terawatt hours compared to non-LED use of electricity, which is a total savings of more than $30 billion over the next 10 years at today’s electricity prices.
Technological Control: LED lighting is one of today’s most energy-efficient lighting technologies. The technological advancement to LED lighting has achieved commercial viability in terms of brightness, efficiency, lamp life, safety, maintenance reduction and color-rendering (“CRI”). The next step in its technological capabilities lies in its unique capabilities to be controlled. Moving beyond simple on/off control functions, LED lighting with integral controls are proving a “smart” solution, capable of supporting a variety of capabilities, including dimming, daylight harvesting, color tuning and other features.
Internet of Things (IoT): Technological developments surrounding the internet and interconnection with it, also includes LED lighting. In addition to providing advanced control solutions to further improve use function, and optimized lighting energy use, LED lighting, particularly fixture based solutions, are capable of acting as technological nodes, providing another capability to better serve markets as companies, including those within the retail industry capitalize on digital and internet based technologies to better serve respective market customers. Technological advancements within this field, notably power over Ethernet (POE), is further expanding the network capabilities of LED lighting fixtures, strengthening its potential as a versatile light source and node to support other digital services.
Reduced Costs: Market forces, including competitive pressure, greater manufacturing efficiencies, and increased technology adoption among businesses and consumers, continue to reduce LED lamp prices. As a result, the global lighting market is experiencing increased LED adoption.
Superior Efficiency: In an effort to lower energy consumption, lighting companies are focusing on increasing “lumens per watt.” Lumens per watt (often referred to as “efficacy”) is an industry standard that measures the amount of light emitted per watt of electrical power used, meaning the more lumens per watt, the more energy-efficient the product. Typical incandescent light sources produce between 15 and 25 lumens per watt, while fluorescent and HID light sources can produce output between 85 and 100 lumens per watt. Today, high-performing LEDs currently perform at 160 lumens per watt, delivering the highest efficiency light source to the market, and the U.S. Department of Energy projects that a target of 250 lumens per watt can be reached. Combined with reduced material costs, LED lighting has become more economically viable than all other lighting technologies available.
Governmental Influence: U.S. government regulation continues to drive efficiency, requiring greater standards among many lighting products today. Such initiatives by the U.S. Department of Energy and the Environmental Protection Agency’s Energy Star Certification Program set industry-wide standards for lighting products that outline efficiency and performance criteria, helping manufacturers promote their products while enhancing consumer awareness and education, allowing for more informed decisions when purchasing lighting products.
Local governments are also adopting regulations to address greater energy efficiency standards to reduce demand on existing energy infrastructure and limit requirements for new sources of power, while meeting obligations to improve social responsibility and environmental conservation standards, including air and water quality. Mandates requiring greater efficiency are often combined with divestment of energy sources to include more sources of alternate and renewable forms of energy generation, including solar, wind, cogeneration, geothermal and fuel cell technologies. State and federal tax incentives continue to provide a significant rational to support the growing adoption of these renewable and energy efficiency technologies. This net effect translates into reduced energy grid demand, particularly during times of peak energy demand, which often rely on older and dirtier forms of energy generation, typically from coal power plants and other less efficient facilities.
5
Table of Contents
Increased Incentive: Demand on the existing power grid in the United States continues to rise. This increased demand creates unique challenges for municipalities and energy providers in order to generate more power. Extensive investments to expand capacity, construct new facilities, and upgrade aging infrastructure are combined with costly and time-consuming regulatory approval processes, community and environmental challenges, and extended construction periods. As a result, many state government agencies, working in conjunction with the utility companies, provide incentives through the form of credits and rebates to help manage or reduce consumer demand. As LED lighting technology matures, more utilities are now offering incentives and rebate programs toward the installation of LED lighting to reduce upfront costs and improve return on investment. In an effort to encourage the development of high-quality, energy-efficient commercial LED lamps eligible for utility rebates, the Design Lights Consortium (the “DLC”) was created. This organization works to establish rigorous performance standards for the LED lighting industry. LED products that meet DLC’s standards become listed on its qualified products list, making them eligible for substantial rebates from utility companies.
Customer Acceptance: Consumer education has achieved a tipping point where by awareness of the lighting technology and its benefits are understood. As a result and coupled with our lower prices, LED is resulting in greater customer motivation to utilize these high efficiency lighting solutions.
Social Responsibility: LED lighting solutions provide a significant opportunity for individuals, corporations and governments to meet environmental goals. LEDs do not contain mercury, unlike fluorescent lighting, which can be harmful to the environment, do not emit ultraviolet radiation (UV), typically do not contain glass, and are 100% recyclable.
Retrofit Focus: The energy savings and positive environmental impact of LED technology in both commercial and residential applications are increasing the market size of retrofit and renovation as compared to new construction. We believe we are experts in both retrofit and renovation. Retrofit consists of the replacement of a luminaire or lamp, one for one, without changing the location or type of luminaire. Renovation consists of redesign of the existing space with LED, potentially using new luminaires in a different location, and possibly adding a control system to further enhance the environment and the energy savings. There are billions of sockets currently operating with traditional light sources that we believe will be converted to LED.
Our Competitive Advantages
We believe the following strengths of our company provide us with competitive advantages in the marketplace:
Product Quality: We offer a high performance product, allowing clients to maximize economic returns and payback. We source, manufacture and sell high-quality and reliable LED lighting products with demonstrable performance advantages that are cost competitive. Many of our products are designed to operate over 70,000 hours, and are backed by warranties of up to 10 years. We achieve this, in part, through a combination of sourcing high-quality LEDs, utilizing proprietary thermal management techniques and conducting rigorous third-party product testing. To deliver cost-competitive solutions, we are investing in product advancements, leveraging purchasing volume, capitalizing on strategic vendor relationships and migrating high-volume products to our proprietary manufacturing process.
Delivering Solutions and Savings: We believe we provide the highest quality LED lighting products available, capable of supporting multiple markets, and designed to exceed our customers’ goals. Based upon our review of publicly available performance data from competitors, our products can provide a quicker return on investment than competitive products, including a 65% energy savings over fluorescent and up to a 90% energy savings over halogen and incandescent lamps.
Authoritative Knowledge: We invest in employees with extensive knowledge, understanding and experience of lighting technology, building constraints, and regulatory environments that enables us to continue to provide superior quality products and service for our customers.
Direct sales managers, agency sales network, distributors, dealers, and ESCOs: Our sales teams act as an invested partner committed to providing constant, expert, responsive guidance to our customers to ensure projects are completed on time and on budget. Within our various divisions, we have over 50 directly employed sales influencers responsible for the day to day management of business to business relationships with agents and a vast customer base. We have over 100 dealer, distributor and partner relationships in the United States, and four international distribution partners. We are on track to continue to grow in selected domestic and international markets. Our distributor and dealer network provide us with a localized sales focus giving us a competitive advantage in delivering high-quality products rapidly to market and providing leading end-user education. We also have established relationships with over 50 independent commercial sales agencies. These sales agencies, on average, each consist of at least 10 employees, giving us access to approximately 500 additional sales individuals, trained and motivated to sell Revolution Lighting products. We directly employ regional sales managers, responsible for managing and training the sales agencies providing a geographic footprint and local support spanning the entire United States territory, as well as experienced sales leaders focused on niche portions of the market, which include government, military, distribution, national account and lighting controls.
6
Table of Contents
Experienced Management Team. Our senior management team includes individuals with diverse backgrounds and broad experience. We are led by our Chairman, Chief Executive Officer and President Robert V. LaPenta, a very successful leader with over 40 years of executive management experience in building billion-dollar companies, and Chief Financial Officer and Director, James DePalma, with over 40 years of operational and finance experience in the defense and technology industries. Brian L. Daley, our Senior V.P. of Sales and Marketing, provides leadership utilizing over 20 years of industry experienced focused on both lighting and controls. In addition, our division senior management is comprised of individuals with accomplished experience in the lighting industry. Our management team has demonstrated the ability to drive organic growth and pursue and integrate strategic acquisitions.
Our Growth Strategy
Target Markets: Our objective is to become the leading provider of advanced LED lighting solutions and services. A key element of our growth strategy is servicing the following markets through the integration of LED lighting, controls and services including:
| • | Commercial |
| • | Industrial and Warehouse |
| • | State and local municipal government and roadway |
| • | Federal government and military |
| • | Education |
| • | Healthcare |
| • | Hospitality |
| • | Retail |
| • | Multi-family |
| • | Signage, media & accents |
Regional/National Distribution: As the LED lighting market continues to build momentum, becoming a leading provider of LED lighting in the marketplace requires relationships with regional and national distribution groups. We plan to continue to establish relationships with regional and national distribution groups; this will provide us with another sales channel and significant opportunity for mass product distribution across key industries.
Expert Partner. We bring together the best products in the market today with an experienced, knowledgeable team that is focused on helping our customers achieve their results on time and within budget. We understand the technical, engineering, incentives and regulatory constraints in the market, and we bring this expertise to every project, making our customers’ needs and goals our own so that projects run according to plan.
Refining our LED Product Portfolio. We continue to refine and improve our LED product portfolio through our research and development team to ensure the highest quality solutions are available to meet our customers’ lighting needs.
Operational Efficiency: By introducing new products and expanding sales of existing products, we believe that we can significantly improve operational efficiency by reducing our cost of materials, components and manufacturing. Refining our products and increasing our sales also allows us to gain additional leverage from sales representatives within our distribution network, while maintaining competitive price points.
Developing and Protecting Our Intellectual Property. We have devoted significant resources to building an advanced research and development team for developing complementary intellectual property to expand our portfolio of advanced lighting technologies. Securing and defending intellectual property related to the design, manufacture and application of advanced lighting technology is expected to be a key element of our existing and future business. The strength of our design and intellectual property portfolio allows us to provide the highest quality LED solutions available, providing a significant advantage over many of our competitors.
Products
Commercial Lamps and Fixtures and Controls. Revolution Lighting addresses lighting solutions across a variety of categories including:
| • | Interior Luminaires and retrofit kits |
| • | High- and Low-Bay Fixtures |
| • | Linear Tube Lighting |
| • | Lamps |
| • | Street and Area Lighting |
| • | Flood Lighting |
| • | Garage and Parking Area Lighting |
7
Table of Contents
| • | Wall Packs & Washers |
| • | Signage, Media & Accent Lighting |
| • | Lighting Control Systems |
These categories encompass extensive product solutions with various sizes, shapes, color-temperature choices, light angles, lens options, and wattages. Applications for our products include interior use, outdoor use, new fixture installation, retrofit installation, smart grid control systems and integration of our LED technology into custom applications.
We offer Buy American Act (“BAA”) compliant LED lighting solutions, which are manufactured to meet Level 3 (USA) requirements for procurement under the BAA, Section 1605. Our featured BAA compliant LED lighting products include our four (4) foot SEP LED PC tubes, four (4) foot Uni-Fit ballast ready tubes and our four (4) foot SEP LED nano polycarbonate plastic tubes.
Competition
As the market continues to transition towards the use of high efficiency LED lighting solutions, market competition from traditional lighting companies that provide general lighting products, including incandescent, fluorescent, HID, metal halide and neon lighting will diminish. Primary competition occurs from specialized lighting companies that are engaged in providing LED products. In general, we compete with both groups on the basis of design, innovation, quality of light, maintenance costs, safety issues, energy consumption, price, product quality and brightness.
In the general illumination market, we compete with traditional lighting companies that include LSI Industries, Acuity Brands Lighting, Inc., Cooper Lighting (a division of Cooper Industries, Inc.), Hubbell Lighting, Inc. (a division of Hubbell Incorporated), Lithonia Lighting, Osram Sylvania, GE Lighting and Royal Philips Lighting (a division of Koninklijke Philips Electronics N.V.). Our LED products tend to be alternatives to conventional lighting sources for applications within the commercial market. In these markets, we compete on the basis of performance, quality, energy savings, lamp life, durability, price and return on investment.
We also compete with providers of LED replacement lamps and other energy-efficient lighting products and fixtures. These companies include traditional lighting companies such as Sylvania and Philips; specialized lighting companies such as Cree, Inc., Green Creative, Orion Energy Systems, Inc., and RAB Lighting, as well as multiple offshore providers. In the market for LED lighting products, we compete on the basis of design, innovation, light quality, maintenance costs, safety issues, energy consumption, price, return on investment, product quality, luminance, brightness, and DLC, Energy Star and UL certifications.
We believe that we will compete favorably in our markets, based on the following factors:
| • | Quality of our product; |
| • | Superior product performance; |
| • | Significant return on investment; |
| • | Experienced and robust sales and marketing resources; |
| • | Authoritative knowledge of our expansive internal and external national distribution network and developed relationships; |
| • | Deep expertise to provide constant, expert, responsive guidance, and ensure a seamless experience; |
| • | Speed to market with the latest technology at competitive price points; and |
| • | UL, DLC and Energy Star certifications. |
We expect our markets to remain competitive and to reflect rapid technological evolution and continuously evolving customer and regulatory requirements. Our ability to remain competitive depends upon our success in maintaining and delivering superior product performance in the market at competitive prices on a timely basis.
Sales and Marketing
We design, manufacture, market and sell LED solutions; we believe that we furnish exceptional customer service and the highest-quality LED products available for commercial installation. Our mutlifamily division also sells conventional and LED based lighting products in the multifamily market based on customer needs. In recent years, we have seen the use of LED solutions within multi-family projects increase significantly, and believe this trend will continue as developers and property managers look to reduce energy and maintenance expenses, while increasing the quality of lighting throughout their projects.
We market and sell our LED products through our internal sales force, a national dealer and distribution network, and our commercial agency networks, as well as through our ESCOs focus. Through our Revolution Lighting Group division, we continue our expansion of distribution channels to include independent sales agents and representatives, distributors, ESCOs and direct sales. Generally, our distributors, dealers and agencies are recruited, trained and monitored by us directly.
We promote our brands and products through online media, trade shows, print media and educational seminars. Our advertising is geared toward lead generation, distributor and dealer recruitment, brand awareness and end-user acceptance of LED technology. We maintain an in-house channel management team that supports our distributor and dealer base. As we grow, we plan to grow our team to manage their accounts and give them the support they need to build their business and promote the brands we own.
8
Table of Contents
Manufacturing and Suppliers
We design and engineer our products, and we outsource a significant portion of the manufacture and assembly of our products to a number of contract manufacturers both domestically and internationally. These contract manufacturers purchase components that we specify, and provide the necessary facilities and labor to manufacture our products. We leverage the strength of the contract manufacturers, and allocate the manufacturing of specific products to the contract manufacturer best suited to the task. Quality control and lot testing is conducted in our facilities in Simi Valley, California where we also assemble and manufacture certain of our products. These facilities are also dedicated to assemble products that satisfy the definition of “Made in America”.
Some of our products use a custom LED package and are sourced from a limited number of suppliers. Although we currently are dependent on these suppliers, we believe that, if necessary, alternative sources of supply could be found. However, any interruption or delay at our third-party manufacturers or in the supply of the components, or in our ability to obtain components from alternate sources at acceptable prices in a timely manner, could harm our business, financial condition and results of operations.
Research and Product Development
We pride ourselves on delivering the highest quality lighting products. Our research and development team is focused on the design and integration of electronics, optics and thermal management solutions to create advanced lighting solutions. Through these efforts, we seek to enhance our existing products, design new products, and develop solutions for customer applications. We believe that quick responsiveness to customer demands and our ability to achieve industry certifications such as UL, DLC and Energy Star for certain products differentiates us from many of our competitors, as we rapidly introduce new products to address market needs.
During 2017, 2016 and 2015, we spent $3.7 million, $2.4 million and $2.4 million, respectively, on research and product development activities. We continue to invest in our product development, prototypes and specifications as we believe that increased levels of spending on research and development will be necessary to successfully develop advanced lighting products that will have the brightness of traditional lighting systems while being offered at acceptable prices.
Patents and Proprietary Rights
Protection of our proprietary intellectual property is important to our business. At December 31, 2017, we held 16 U.S. patents and 2 foreign patents, and had 5 patent applications currently filed with the United States Patent and Trademark Office or with the World Intellectual Property Organization or foreign patent offices. Although we expect that several of our patent applications will issue, we cannot be certain that patents will be granted with respect to any of our pending patent applications or with respect to any patent applications filed by us in the future, nor can we be sure that any patents that may be granted to us in the future will be commercially useful in protecting our technology. In addition, despite our efforts to protect our intellectual property, unauthorized parties may attempt to copy aspects of our products or obtain and use information that we regard as proprietary.
Royalties
We have, from time to time, entered into agreements whereby we have agreed to pay royalties for the use of certain LED technologies. Royalty expense incurred under these agreements was immaterial for all years presented.
Regulations, Standards and Conventions
Our products are generally required to meet the electrical codes of the jurisdictions in which they are sold. Meeting the typically more stringent codes established in the United States and the European Union usually allows our products to meet the codes in other geographic regions.
Many of our customers require that our products be listed by UL. UL is a U.S., independent, nationally recognized testing laboratory and certification organization. UL develops standards and test procedures for products, materials, components, assemblies, tools and equipment, chiefly dealing with product safety. UL evaluates products, components, materials, systems for compliance to specific requirements, and it permits acceptable products to carry a UL certification mark, as long as they remain compliant with the standards. UL offers several categories of certification. Products that are “UL Listed,” are identified by the distinctive UL mark. Many of our LED lighting products are UL-listed.
Today, many of our customers and end-users also expect our products to meet the applicable DLC or Energy Star requirements. DLC and Energy Star are industry standards for energy-efficient lighting products. To qualify for Energy Star certification, LED lighting products must pass a variety of rigorous tests to prove that the products have certain performance and efficiency characteristics. Four of our former Array-branded lamps were among the first lamps to be certified under the Energy Star program, which began accepting applications for lamps in September 2010. A variety of our LED products are DLC-listed, too, making them eligible for valuable
9
Table of Contents
rebates from utility companies. As of December 31, 2017, the DLC lists 652 Revolution Lighting Technologies LED products on its Qualified Products List. Like Energy Star, DLC sets stringent product performance and efficiency requirements that manufacturers must meet to qualify for certification. In fact, DLC bases many of its performance requirements on the Energy Star model. However, unlike Energy Star, which primarily regulates products for the residential lighting market, DLC regulates lighting products manufactured for the commercial market. By designing and manufacturing LED products that meet DLC, Energy Star and UL standards, we expect to further improve our sales and industry reputation.
Financial Information about Foreign and Domestic Operations
Financial information by geographic region is set forth in Note 18 of Notes to Consolidated Financial Statements included in this Annual Report on Form 10-K.
Environmental Protection Regulations
We believe that compliance with environmental protection regulations will not have a material impact on our financial position and results of operations.
Additional Information
The business exhibits some seasonality, with net sales being affected by the impact of weather and seasonal demand on construction and installation programs, particularly during the winter months. Because of these seasonal factors, we have experienced, and generally expect to experience, increasing revenue as the year progresses. Our lighting solutions are sold to customers in both the new construction, as well as renovation and retrofit markets. The construction market is cyclical in nature and subject to change in general economic conditions. Work performed within the public education sector, including schools and universities, mainly occurs during the summer months when classes are not in session.
As of December 31, 2017, we had approximately 270 full-time employees. We enjoy good employee relations. Our employees are not members of any labor union, and we are not a party to any collective bargaining agreement.
Our public internet site is http:// www.rvlti.com. Other than an investor’s own internet access charges, we make available free of charge through our website our annual reports on Form 10-K, quarterly reports on Form 10-Q and current reports on Form 8-K, proxy statements and amendments to these reports, as soon as reasonably practicable after we have electronically filed such material with, or furnished such material to, the U.S. Securities and Exchange Commission (the “SEC”). We intend to use our website as a regular means of disclosing material information and for complying with disclosure obligations under Regulation FD promulgated by the SEC. Such disclosures will be included on the website under the heading “Investor Relations”. Accordingly, investors should monitor such portions of the website, in addition to following our press releases, SEC filings and public conference calls and webcasts.
We file current, annual and quarterly reports, proxy statements and other information required by the Exchange Act of 1934 with the SEC. Any document we file may be obtained by visiting the Public Reference Room of the SEC at 100 F Street NE, Room 1580, Washington D.C. 20549 or by calling the SEC at +1-800-SEC-0330.Our SEC filings are also available to the public from the SEC’s internet site at http://www.sec.gov.
10
Table of Contents
| Item 1A. | Risk Factors |
The following are some of the factors that we believe could cause our actual results to differ materially from expected and historical results. The risks and uncertainties described below are not the only ones facing our company. Additional risks and uncertainties not currently known to us or those we currently view to be immaterial may also materially and adversely affect our business, financial condition or results of operations.
We have a history of losses and may incur losses in the future.
We have experienced net losses and negative cash flow from operations during 2017, 2016 and 2015, and we currently have an accumulated deficit. In order for us to attain profitability and growth, we will need to successfully execute our production, marketing and sales plans for our product lines, and improve our distribution and supply chain performance. We may fail to achieve profitability in the future, and our business may not be as successful as we envision. Continuing losses could exhaust our capital resources and force us to scale back, suspend or discontinue our operations. Our operating expenses may continue to increase as we spend resources on growing our business, and if our revenue does not correspondingly increase, our operating results and financial condition will suffer.
We may be unable to raise additional capital.
We have funded our operations primarily through the issuance of common stock and bank financing. In addition, we have received financing primarily from our affiliate RVL 1, LLC (“RVL”) and Aston Capital, LLC (“Aston”), entities affiliated with our Chairman, Chief Executive Officer and President. The actual amount of funds that we will need to meet our operating needs will be determined by a number of factors, many of which are beyond our control. These factors include the timing and volume of sales transactions, the success of our marketing strategy, market acceptance of our products, the success of our manufacturing and research and product development efforts (including any unanticipated delays), the costs associated with obtaining and enforcing our intellectual property rights, regulatory changes, competition, technological developments in the market, evolving industry standards and the amount of working capital investments we are required to make. If we are unable to obtain sufficient capital when needed, our business and future prospects will be adversely affected and we could be forced to scale back, suspend or discontinue operations.
The future issuance of additional shares of common stock and/or preferred stock could dilute existing stockholders.
We are authorized to issue 35,000,000 shares of common stock, of which 21,352,383 shares were issued and outstanding at December 31, 2017. To the extent that common shares are available for issuance, subject to compliance with applicable stock exchange listing rules, our board of directors has the ability to issue additional shares of common stock in the future for such consideration as the board of directors may consider sufficient. The issuance of any additional securities could, among other things, result in substantial dilution of the percentage ownership of our stockholders at the time of issuance, result in substantial dilution of our earnings per share and adversely affect the prevailing market price for our common stock.
We are authorized to issue 5,000,000 shares of preferred stock, none of which were issued or outstanding at December 31, 2017. Our board of directors may designate the rights and preferences of preferred stock without a vote by the stockholders. A new series of preferred stockholders could adversely affect the rights of holders of common stock insofar as such series:
| • | provides for voting, redemption and conversion rights to the detriment of the holders of common stock; |
| • | provides for dividends that must be paid prior to any distributions on our common stock; |
| • | receives preferences over the holders of common stock or surplus funds in the event of our dissolution or liquidation; or |
| • | has the potential to delay, defer or prevent a change in control of our company, and discourage bids for our common stock. |
The future trading market for our common stock may not be active on a consistent basis and the market price of our common stock could be subject to significant fluctuations.
Trading in our common stock has been limited and, at times, volatile since our shares were listed on The NASDAQ Capital Market. The trading volume of our common stock in the future depends in part on our ability to increase our revenue and reduce or eliminate our operating losses. If we are unable to achieve these goals, the trading market for our common stock may be negatively affected, which may make it difficult for you to sell your shares. An active trading market for our common stock may not develop or, if developed, be sustained, and the trading price of our common stock may fluctuate substantially. The price of our common stock may also fluctuate as a result of: (i) variations in our operating results; (ii) announcements by us, our competitors or others of significant business developments; (iii) changes in client relationships; (iv) acquisitions or expansion plans; or (v) analysts’ earnings estimates, ratings and research reports.
Our loan agreement contains financial covenants that may limit our operating and strategic flexibility.
Our loan and security agreement with Bank of America, N.A. (“Bank of America”), as amended (the “Revolving Credit Facility”), contains financial covenants and other restrictions that limit our ability to engage in certain types of transactions. For example, these restrictions require that we maintain a fixed charge ratio tied to our ability to borrow under the terms of the Revolving Credit Facility, and generally require us to obtain lender consents for acquisitions. There can be no assurance that we will be in compliance with all covenants in the future or that Bank of America will agree to modify the Revolving Credit Facility, should that become necessary.
11
Table of Contents
Events beyond our control could affect our ability to comply with these covenants and restrictions. Failure to comply with any of these covenants and restrictions would result in an event of default under the Revolving Credit Facility. If we do not cure an event of default or obtain necessary waivers within the required time periods, Bank of America would be permitted to accelerate the maturity of the debt under the Revolving Credit Facility, foreclose upon our assets securing the debt, and terminate any further commitments to lend to us. Under these circumstances, we may not have sufficient funds or other resources to satisfy our other obligations. In addition, the limitations imposed by the Revolving Credit Facility may significantly impair our ability to obtain other debt or equity financing.
There can be no assurance that any waivers we request will be received on a timely basis, if at all, or that any waivers obtained will extend for a sufficient period of time to avoid an acceleration event, an event of default, or other restrictions on our business. The failure to obtain any necessary waivers could have a material adverse effect on our business, liquidity, and financial condition.
Our net operating loss carryforwards provide a future benefit only if we are profitable and may be subject to limitation based upon ownership changes.
We have significant federal net operating loss carryforwards and state net operating loss carryforwards. While our federal and state net operating loss carryforwards are fully reserved for, if we are unable to return to and maintain profitability, we may not be able to fully utilize these tax benefits. Furthermore, generally a change of more than 50% in the ownership of a company’s stock, by value, over a three-year period constitutes an ownership change for federal income tax purposes. An ownership change may limit a company’s ability to use its net operating loss carryforwards attributable to the period prior to such change. Our ability to use our net operating loss carryforwards attributable to the period prior to such ownership change to offset taxable income will be subject to limitations in a particular year, which could potentially result in increased future tax liability for us.
Our growth strategy may include strategic acquisitions. We have made strategic acquisitions in the past and may do so in the future, and if the acquired companies do not perform as expected, this could adversely affect our operating results, financial condition and existing business.
We may continue to expand our business through strategic acquisitions. The success of any acquisition will depend on, among other things:
| • | the availability of suitable candidates; |
| • | competition from other companies for the purchase of available candidates; |
| • | our ability to value those candidates accurately and negotiate favorable terms for those acquisitions; |
| • | the availability of funds to finance acquisitions and obtaining any consents necessary under our credit facility; |
| • | the ability to establish new informational, operational and financial systems to meet the needs of our business; |
| • | the ability to achieve anticipated synergies, including with respect to complementary products or services; and |
| • | the availability of management resources to oversee the integration and operation of the acquired businesses. |
Integration of acquired businesses may be difficult to achieve and will consume significant financial and managerial resources which may adversely affect operations.
Part of our strategy to increase revenue and market share is to grow through strategic acquisitions in order to complement and expand our business. Acquisitions involve risks related to the integration and management of technology, operations and personnel of separate companies. The integration of these businesses will be a complex, time-consuming and expensive process and may disrupt our business if not completed in a timely and efficient manner. We may encounter difficulties, costs and delays involved in integrating the operations, including:
| • | exposure to unknown liabilities of acquired companies or its assets; |
| • | higher than anticipated acquisition costs and expenses; |
| • | potential conflicts between business cultures; |
| • | adverse changes in business focus perceived by third-party constituencies; |
| • | disruption of our ongoing business; |
| • | potential conflicts in distribution, marketing or other important relationships; |
| • | potential constraints of management resources; |
| • | inability to implement uniform standards, controls, procedures and policies; |
| • | failure to maximize our financial and strategic position by the successful incorporation of acquired technology; |
| • | failure to realize the potential of acquired technology, complete product development, or properly obtain or secure appropriate protection of intellectual property rights; and |
| • | loss of key employees and/or the diversion of management’s attention from other ongoing business concerns. |
12
Table of Contents
In addition, the geographic distance between the companies and their respective offices and operations increases the risk that the integration will not be completed successfully or in a timely and cost-effective manner. We may not successfully overcome these risks or any other problems encountered in connection with the integration of the companies.
Our acquisitions could result in future impairment charges and other charges which could adversely affect our results of operations.
As a result of certain prior acquisitions, and in consideration of future acquisitions, goodwill and other intangible assets have been and will be recorded. At the purchase date, the recorded amounts for goodwill and other intangible assets represent fair values estimated at a point in time and are based on valuations that require significant estimates and assumptions about future events, which are derived from information obtained from the management of the acquired businesses and our business plans for the acquired businesses or intellectual property. If estimates and assumptions used to initially record goodwill and intangible assets do not materialize, ongoing reviews of the carrying amounts of such goodwill and intangible assets may result in impairments which will require us to record a noncash charge in the period in which such an impairment is identified. Such charge could have a severe negative impact on our business, financial condition and results of operations.
Our business is cyclical and seasonal, and cash flows could be adversely affected.
Our business exhibits some seasonality, with net sales being affected by the impact of weather and seasonal demand on construction and installation programs, particularly during the winter months. Our revenues in the first half of the year may be affected by the impact of weather on construction and installation programs, as well as the annual budget cycles of major customers. The cyclical and seasonal nature of our business could have a negative impact on our business, financial condition and results of operations.
If we are not able to compete effectively against companies with greater resources, our prospects for future success will be jeopardized.
The lighting industry is highly competitive. In the high performance lighting markets in which we sell our LED lighting solutions, our products compete with lighting products utilizing traditional lighting technology provided by larger and better-established lighting operators. Management expects competition to intensify in the future. Many of our competitors have longer operating histories, larger customer bases, greater brand recognition and significantly greater financial, marketing, technical and other resources. Our competitors may acquire or be acquired by, receive investments from or enter into other commercial relationships with, larger, well established and well-financed competitors. Therefore, some of our competitors with other revenue sources may be able to devote greater resources to marketing and promotional campaigns, adopt more aggressive pricing policies, and devote substantially more resources to product development. It is difficult to effectively compete with companies that have these resources so we cannot assure that we will ever become a significant company in the industry.
In the replacement lamp market where we sell our LED products, we expect to encounter competition from a number of companies. Our competitors are expected to include the large, established companies in the general lighting industry, such as GE Lighting, Osram Sylvania and Royal Philips Lighting. We believe each of these competitors has undertaken initiatives to develop white light LED technology. These companies have global marketing capabilities and substantially greater resources to devote to research and development and other aspects of the development, manufacture and marketing of LED lighting products than we do. We may also face increased competition from traditional lighting fixture companies, such as Acuity Brands, Cree, Cooper Lighting, Hubbell Lighting, Lithonia Lighting and Royal Philips Lighting. In each of our markets, we also anticipate the possibility that LED manufacturers, including those that currently supply us with LEDs, may seek to compete with us by introducing more complete systems that might not infringe on our patents. Our competitors’ lighting technologies and products may be more readily accepted by customers than our products. The relatively low barriers to entry into the lighting industry and the limited proprietary nature of many lighting products also permit new competitors to enter the industry easily. Increased competition may result in reduced operating margins, loss of market share and diminished value in our brands.
If our advanced lighting products do not gain wider market acceptance, prospects for our growth and profitability may be limited.
We face competition from both traditional lighting technologies, such as incandescent, florescent and neon lighting, and from competitors engaged in providing LED lighting products. Traditional lighting technologies have the advantage of a long history of market acceptance and familiarity as compared to our LED lighting solutions. Potential customers for our LED products may be reluctant to adopt these as alternatives to traditional lighting technologies because of their higher initial cost to achieve comparable light output, although our LED lighting products tend to be more energy efficient and require less maintenance.
Our success will depend upon both the increased acceptance of our LED products as an alternative to traditional lighting technologies and the development of higher lumen producing products to meet traditional lighting applications. Obstacles to adoption of LED lighting in the general lighting market include the high initial cost of high brightness white LEDs and the need for further advances in brightness, color characteristics, efficiency and the predicted life of the LEDs before they require replacement. Our future results are dependent upon sales growth in the military, municipal, commercial, industrial, warehouse, education, hospitality, retail, healthcare, multi-family and signage-media-accent markets. As part of our sales and marketing strategy, we actively seek to educate our target markets as to the advantages of our LED lighting solutions. We believe that achievement of this objective is critical to our future success. Our lighting
13
Table of Contents
products may not continue to gain market share within the overall lighting market or competitors may introduce better lighting technologies, displacing our LED and other lighting products in the market. If acceptance of our lighting products in general does not continue to grow, then opportunities to increase our revenue and operate profitably may be limited.
The reduction or elimination of investments in, or incentives to adopt, LED lighting or the elimination of, or changes in, policies, incentives or rebates in certain states or countries that encourage the use of LEDs over some traditional lighting technologies could cause the growth in demand for our products to slow, which could materially and adversely affect our revenues, profits and margins.
Reductions in (including as a result of any budgetary constraints), or the elimination of, government investment and favorable energy policies designed to accelerate the adoption of LED lighting could result in decreased demand for our products and decrease our revenues, profits and margins. Further, if our products fail to qualify for any financial incentives or rebates provided by governmental agencies or utilities for which our competitors’ products qualify, such programs may diminish or eliminate our ability to compete by offering products at lower prices than our competitors.
We believe that certification and compliance issues are critical to adoption of our lighting systems, and failure to obtain such certification or compliance would harm our business.
We are required to comply with certain legal requirements governing the materials in our products. Although we are not aware of any efforts to amend any existing legal requirements or implement new legal requirements in a manner with which we cannot comply, our revenue might be materially harmed if such an amendment or implementation were to occur.
We cannot ensure that we will be able to obtain any required certifications for our new products or that, if certification standards are amended, we will be able to maintain any such certifications for our existing products, especially since existing codes and standards were not created with our lighting products in mind. Moreover, although we are not aware of any effort to amend any existing certification standard or implement a new certification standard in a manner that would render us unable to maintain certification for our existing products or obtain certification for new products, our revenue might be materially harmed if such an amendment or implementation were to occur.
Customers may be unable to obtain financing to make purchases from us.
Some of our customers require financing in order to purchase our products. The potential inability of these customers to access the capital needed to finance purchases of our products and meet their payment obligations to us could adversely impact our financial condition and results of operations. If our customers become insolvent due to market and economic conditions or otherwise, it could have a material adverse impact on our business, financial condition and results of operations.
Sudden or unexpected changes in a customer’s creditworthiness could result in accounts receivable write-offs.
Historically, we have taken a conservative approach when extending credit to our customers. Customers are granted an appropriate credit limit based upon the due diligence performed on the customer. At any given time, we can have credit exposure with some of our customers.
We rely on third-party manufacturers for the manufacture and development of certain of our products and product components.
We depend on third-party suppliers for substantially all of our components and products. We currently depend on a small number of contract manufacturers to manufacture our products at plants in the U.S. and China; however, we believe that alternative sources of supply are readily available for most products and components. Our reliance on contract manufacturers involves certain additional risks, including lack of direct control over production capacity, delivery schedules, quality assurance, manufacturing yields and production costs. Our business prospects, results of operations, financial condition or cash flows could be materially adversely affected if we were to experience problems with changes in government export/import regulations, quality, quantity, credit or liquidity issues, or disruptions or delays in the manufacturing process or delivery of products and components or raw materials used to make such products or components.
We depend on distributors and independent sales representatives for a portion of our revenue and sales, and the failure to successfully manage our relationships with these third-parties, or the termination of these relationships, could cause our revenue to decline and harm our business.
We intend to continue to seek strategic relationships to distribute, license and sell certain products. We intend to maximize organic growth within our market. A portion of our revenue comes from sales to distributors including systems integrators, distributors and resellers. We may not be able to negotiate acceptable relationships in the future and cannot predict whether current or future relationships will be successful.
Some of these relationships have not been formalized in a detailed contract, and may be subject to termination at any time. The agreements that are formalized in a contract are generally short-term, not exclusive, and can be cancelled by these sales channels without significant financial consequence. In addition, these parties provide technical sales support to end-users. We cannot control how these sales channels perform and cannot be certain that end-users will be satisfied by their performance. If these distributors and agents significantly change their terms with us, or change their historical pattern of ordering products from us, there could be a significant impact on our revenue and profits.
14
Table of Contents
Claims by others that our products infringe their patents or other intellectual property rights could prevent us from manufacturing and selling some of our products or require us to pay royalties or incur substantial costs from litigation or development of non-infringing technology.
In recent years, there has been significant litigation in the United States involving patents and other intellectual property rights. We may receive notices that claim we have infringed upon the intellectual property of others. Even if these claims are not valid, they could subject us to significant costs. Any such claims, with or without merit, could be time-consuming to defend, result in costly litigation, divert our attention and resources, cause product shipment delays or require us to enter into royalty or licensing agreements. Such royalty or licensing agreements, if required, may not be available on terms acceptable to us or at all. We have engaged in litigation and litigation may be necessary in the future to enforce our intellectual property rights or to determine the validity and scope of the proprietary rights of others. Litigation may also be necessary to defend against claims of infringement or invalidity by others. A successful claim of intellectual property infringement against us and our failure or inability to license the infringed technology or develop or license technology with comparable functionality could have a material adverse effect on our business, financial condition and operating results.
If we are unable to adequately protect our intellectual property, we may lose some of our competitive advantage.
Protection of our proprietary intellectual property is important to our business. Our ability to compete and the ability of our business to grow could suffer if our intellectual property rights are not adequately protected. Although we expect that several of our patent applications will issue, we cannot be certain that patents will be granted with respect to any of our pending patent applications or with respect to any patent applications filed by us in the future, nor can we be sure that any patents that may be granted to us in the future will be commercially useful in protecting our technology. In addition, despite our efforts to protect our intellectual property, unauthorized parties may attempt to copy aspects of our products or obtain and use information that we regard as proprietary.
Our products could contain defects or they may be installed or operated incorrectly, which could reduce sales of those products or result in claims against us.
Despite testing by us, errors have been found and may be found in the future in our existing or future products. This could result in, among other things, a delay in the recognition or loss of revenue, loss of market share or failure to achieve market acceptance. These defects could cause us to incur significant warranty, support and repair costs, divert the attention of our engineering personnel from our product development efforts and harm our relationships with our customers. The occurrence of these problems could result in the delay or loss of market acceptance of our lighting products and would likely harm our business. Defects, integration issues or other performance problems in our lighting products could result in personal injury or financial or other damages to end-users or could damage market acceptance of our products. Our customers and end-users could also seek damages from us for their losses. A product liability claim brought against us, even if unsuccessful, would likely be time consuming and costly to defend.
If we are unable to attract or retain qualified personnel, our business and product development efforts could be harmed.
To a significant extent, our success will depend on our senior management team, including the Chairman, Chief Executive Officer and President Robert V. LaPenta, and other members of the executive team. The loss of any of these individuals could severely harm the business. Our success also depends on our continued ability to identify, attract, hire, train, retain and motivate highly skilled technical, managerial, manufacturing, administrative and sales and marketing personnel. Competition for these individuals is intense, and we may not be able to successfully recruit, assimilate or retain sufficiently qualified personnel. In particular, we may encounter difficulties in recruiting and retaining a sufficient number of qualified technical personnel, which could harm our ability to develop new products and adversely impact our relationships with existing and future customers. The inability to attract and retain necessary technical, managerial, manufacturing, administrative and sales and marketing personnel could harm our ability to obtain new customers and develop new products and could adversely affect our business and operating results.
If we fail to maintain an effective system of internal controls, we may be unable to report our financial results accurately or prevent fraud.
Effective internal controls are necessary for us to provide reliable financial reports and prevent fraud. As a public company, we are subject to the reporting requirements of Section 404 of the Sarbanes-Oxley Act of 2002, which requires us and our independent registered public accounting firm to annually evaluate and report on our internal control over financial reporting. Our efforts to maintain an effective system of internal controls may not be successful, and we may not be able to maintain adequate controls over our financial processes and reporting in the future. Even if we conclude, and our independent registered public accounting firm concurs, that our internal control over financial reporting provides reasonable assurance regarding the reliability of financial reporting and the preparation of financial statements for external purposes in accordance with generally accepted accounting principles, because of its inherent limitations, internal control over financial reporting may not prevent or detect fraud or misstatements in the future. Failure to maintain proper and effective internal controls could harm our results of operations or cause us to fail to meet our reporting obligations. If we or our independent registered public accounting firm discovers a material weakness in our internal controls in the future, the disclosure of that fact, even if quickly remedied, could reduce the market’s confidence in our financial statements.
15
Table of Contents
Our results of operations and financial condition could be seriously impacted by security breaches, including cybersecurity incidents.
Failure to effectively prevent, detect and recover from security breaches, including attacks on information technology and infrastructure by hackers; viruses; breaches due to employee error or actions; or other disruptions could result in misuse of our assets, business disruptions, loss of property including trade secrets and confidential business information, legal claims or proceedings, reporting errors, processing inefficiencies, negative media attention, loss of sales and interference with regulatory compliance. We have determined that such attacks could result in unauthorized parties gaining access to at least certain confidential business information. However, to date, we have not experienced any material financial impact, changes in the competitive environment or business operations that we attribute to these attacks. Although management does not believe that we have experienced any material losses to date related to security breaches, including cybersecurity incidents, there can be no assurance that we will not suffer such losses in the future. We actively manage the risks within our control that could lead to business disruptions and security breaches. As these threats continue to evolve, particularly around cybersecurity, we may be required to expend significant resources to enhance our control environment, processes, practices and other protective measures. Despite these efforts, such events could materially adversely affect our business, financial condition or results of operations.
| Item 1B. | Unresolved Staff Comments |
None.
| Item 2. | Properties |
The following table summarizes information with respect to our facilities, which are all leased:
| Location | Area (Sq. Feet) |
Year of Lease Expiration |
||||||||
| Corporate headquarters |
Stamford, CT | 16,626 | 2020 | |||||||
| Office and warehouse |
Carrollton, TX | 153,632 | 2022 | |||||||
| Office and warehouse |
Carrollton, TX | 73,986 | 2020 | |||||||
| Office and warehouse |
Simi Valley, CA | 69,554 | 2020 | |||||||
| Office and warehouse |
Marietta, GA | 63,000 | 2024 | |||||||
| Office and warehouse |
Beltsville, MD | 30,451 | 2023 | |||||||
| Office and warehouse |
San Marcos, TX | 26,256 | 2018 | |||||||
| Office and warehouse |
Downey, CA | 18,495 | 2022 | |||||||
| Warehouse and distribution center |
Marietta, GA | 14,372 | 2018 | |||||||
| Office and warehouse |
Simi Valley, CA | 12,200 | 2018 | |||||||
| Office and distribution center |
Greenwich, CT | 5,230 | 2020 | |||||||
| Office |
Plumstead Township, PA | 5,000 | 2019 | |||||||
| Office |
Providence, RI | 4,225 | 2018 | |||||||
| Office |
West Springfield, MA | 4,450 | 2019 | |||||||
| Office |
Billerica, MA | 2,946 | 2020 | |||||||
| Office |
Parker, TX | 2,500 | 2019 | |||||||
| Warehouse |
Beaverton, OR | 2,181 | 2020 | |||||||
| Office |
Scottsdale, AZ | 1,841 | 2018 | |||||||
| Office |
Raynham, MA | 1,365 | 2019 | |||||||
We consider our facilities adequate for our current needs and believe that suitable additional space would be available if necessary.
| Item 3. | Legal Proceedings |
In the ordinary course of business, we may become a party to various legal proceedings generally involving contractual matters, infringement actions, product liability claims and other matters. We are not currently a party to any pending legal proceedings which we believe to be material.
| Item 4. | Mine Safety Disclosures |
Not applicable.
16
Table of Contents
| Item 5. | Market for Registrant’s Common Equity, Related Stockholder Matters and Issuer Purchases of Equity Securities |
Market for our common stock
Our common stock is quoted on The NASDAQ Capital Market under the symbol “RVLT.”
The following table sets forth, for the fiscal quarter indicated, the high and low sales prices per share of our common stock as reported by The NASDAQ Capital Market. All share prices have been adjusted to reflect the 1-for-10 reverse stock split effective March 10, 2016.
| 2017 | 2016 | |||||||||||||||
| High | Low | High | Low | |||||||||||||
| First Quarter |
$ | 8.15 | $ | 5.42 | $ | 8.40 | $ | 5.16 | ||||||||
| Second Quarter |
$ | 9.17 | $ | 6.01 | $ | 7.07 | $ | 5.20 | ||||||||
| Third Quarter |
$ | 8.10 | $ | 5.87 | $ | 7.61 | $ | 6.11 | ||||||||
| Fourth Quarter |
$ | 6.64 | $ | 2.95 | $ | 7.29 | $ | 5.21 | ||||||||
We have never paid a cash dividend on our common stock and intend to continue to follow a policy of retaining earnings to finance future growth. Accordingly, we do not anticipate the payment of cash dividends to holders of our common stock in the foreseeable future. We are also limited in our ability to pay dividends under our loan and security agreement with Bank of America. For additional information on our loan and security agreement, see “Management’s Discussion and Analysis of Financial Condition and Results of Operations – Liquidity, Capital Resources and Cash Flows” and Note 9 of Notes to Consolidated Financial Statements.
Holders of Record
The number of holders of record of our common stock on March 1, 2018 was 7,008. This number does not include beneficial owners of our common stock whose shares are held in the names of various dealers, clearing agencies, banks, brokers and other fiduciaries. On March 1, 2018, the last reported sale price of our common stock on the NASDAQ Capital Market was $3.39 per share.
Stock Performance Graphs
The following information contained in this Item 5 of this Annual Report on Form 10-K is not deemed to be “soliciting material” or to be “filed” with the SEC or subject to Regulation 14A or 14C under the Exchange Act or to the liabilities of Section 18 of the Exchange Act, and will not be deemed to be incorporated by reference into any filing under the Securities Act or the Exchange Act, except to the extent we specifically incorporate it by reference into such filing.
17
Table of Contents
Supplemental stock performance graph
In 2012, a change in control was effected when RVL purchased 73% of our outstanding voting stock. The following supplemental graph compares the cumulative total return on our common stock with the cumulative total returns of the NASDAQ Composite Index and the Dow Jones US Electrical Components and Equipment Index for the period commencing on September 12, 2012, the date when RVL announced its initial investment, to December 31, 2017. The stock price performance shown on the graph is not necessarily indicative of future price performance.
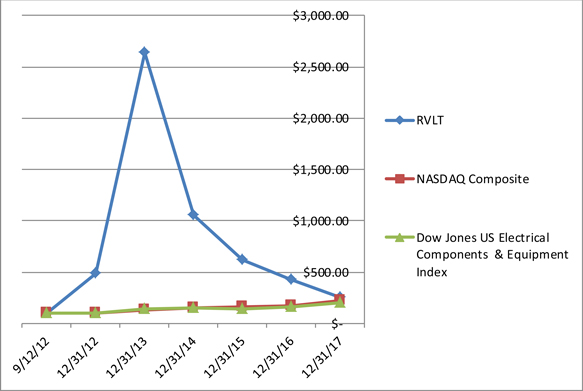
| 9/12/12 | 12/31/12 | 12/31/13 | 12/31/14 | 12/31/15 | 12/31/16 | 12/31/17 | ||||||||||||||||||||||
| Revolution Lighting Technologies, Inc. |
$ | 100.00 | $ | 484.61 | $ | 2,638.68 | $ | 1,038.55 | $ | 615.44 | $ | 423.08 | $ | 253.08 | ||||||||||||||
| NASDAQ Composite |
$ | 100.00 | $ | 96.92 | $ | 133.97 | $ | 151.89 | $ | 160.59 | $ | 172.86 | $ | 221.68 | ||||||||||||||
| Dow Jones US Electrical Components & Equipment Index |
$ | 100.00 | $ | 100.45 | $ | 137.26 | $ | 146.50 | $ | 136.56 | $ | 162.84 | $ | 205.09 | ||||||||||||||
18
Table of Contents
Five-year stock performance graph
The following graph compares the cumulative total return on our common stock with the cumulative total returns of the NASDAQ Composite Index and the Dow Jones US Electrical Components and Equipment Index for the five-year period commencing December 31, 2012. The stock price performance shown on the graph is not necessarily indicative of future price performance.
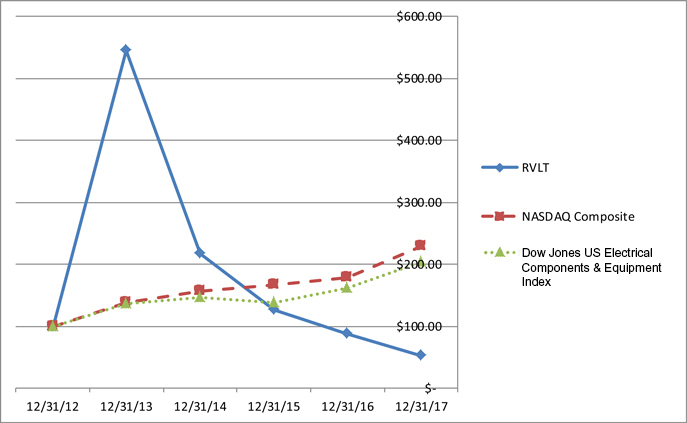
| 2012 | 2013 | 2014 | 2015 | 2016 | 2017 | |||||||||||||||||||
| Revolution Lighting Technologies, Inc. |
$ | 100.00 | $ | 544.44 | $ | 217.46 | $ | 126.98 | $ | 87.30 | $ | 52.22 | ||||||||||||
| NASDAQ Composite |
$ | 100.00 | $ | 138.32 | $ | 156.85 | $ | 165.85 | $ | 178.28 | $ | 228.63 | ||||||||||||
| Dow Jones US Electrical Components & Equipment Index |
$ | 100.00 | $ | 136.64 | $ | 145.79 | $ | 137.87 | $ | 162.11 | $ | 204.17 | ||||||||||||
19
Table of Contents
| Item 6. | Selected Financial Data |
The following table presents selected historical consolidated financial data of Revolution Lighting Technologies, Inc. for the periods indicated. The information presented below should be read together with “Item 7. Management’s Discussion and Analysis of Financial Condition and Results of Operations” and the consolidated financial statements and notes thereto included in “Item 8. Financial Statements and Supplementary Data.”
| Year Ended December 31, | ||||||||||||||||||||
| 2017 | 2016 (1) | 2015 (2) | 2014 (3) | 2013 (4) | ||||||||||||||||
| (In millions, except per share data) | ||||||||||||||||||||
| Statement of Operations Data: |
||||||||||||||||||||
| Revenue |
$ | 152.3 | $ | 172.1 | $ | 129.7 | $ | 76.8 | $ | 26.1 | ||||||||||
| Cost of sales (5) |
110.6 | 116.2 | 86.4 | 52.6 | 16.1 | |||||||||||||||
|
|
|
|
|
|
|
|
|
|
|
|||||||||||
| Gross profit |
41.7 | 55.9 | 43.3 | 24.2 | 10.0 | |||||||||||||||
| Total operating expenses (6) |
91.8 | 53.9 | 44.2 | 35.1 | 20.5 | |||||||||||||||
|
|
|
|
|
|
|
|
|
|
|
|||||||||||
| Operating income (loss) |
(50.1 | ) | 2.0 | (0.9 | ) | (10.9 | ) | (10.5 | ) | |||||||||||
| Interest expense and other charges |
(3.8 | ) | (2.5 | ) | (1.5 | ) | (0.8 | ) | (6.3 | ) | ||||||||||
|
|
|
|
|
|
|
|
|
|
|
|||||||||||
| Loss before income taxes |
(53.9 | ) | (0.5 | ) | (2.4 | ) | (11.7 | ) | (16.8 | ) | ||||||||||
| Income tax (provision) benefit |
— | — | — | 6.5 | — | |||||||||||||||
|
|
|
|
|
|
|
|
|
|
|
|||||||||||
| Net loss |
(53.9 | ) | (0.5 | ) | (2.4 | ) | (5.2 | ) | (16.8 | ) | ||||||||||
| Accretion of preferred stock redemption value, beneficial conversion feature, and discount |
— | — | — | (0.9 | ) | (2.3 | ) | |||||||||||||
| Accrual of preferred stock dividends |
— | — | — | (1.4 | ) | (1.4 | ) | |||||||||||||
| Deemed distribution on exchange of preferred stock |
— | — | — | (5.3 | ) | — | ||||||||||||||
|
|
|
|
|
|
|
|
|
|
|
|||||||||||
| Net loss attributable to common stockholders |
$ | (53.9 | ) | $ | (0.5 | ) | $ | (2.4 | ) | $ | (12.8 | ) | $ | (20.5 | ) | |||||
|
|
|
|
|
|
|
|
|
|
|
|||||||||||
| Basic and diluted net loss per common share (7) |
$ | (2.59 | ) | $ | (0.03 | ) | $ | (0.16 | ) | $ | (1.39 | ) | $ | (2.64 | ) | |||||
|
|
|
|
|
|
|
|
|
|
|
|||||||||||
| Balance Sheet Data: |
||||||||||||||||||||
| Cash and cash equivalents |
$ | 0.9 | $ | 0.9 | $ | 0.2 | $ | 6.0 | $ | 1.8 | ||||||||||
| Working capital (deficit) (8) |
34.3 | 51.3 | 25.9 | 18.8 | (1.8 | ) | ||||||||||||||
| Total assets |
170.2 | 217.5 | 177.6 | 126.5 | 52.2 | |||||||||||||||
| Total debt |
53.4 | 44.5 | 37.4 | 14.5 | 14.1 | |||||||||||||||
| Convertible redeemable preferred stock |
— | — | — | — | 11.0 | |||||||||||||||
| Total stockholders’ equity |
75.9 | 125.7 | 102.1 | 77.3 | 25.5 | |||||||||||||||
| (1) | Reflects the acquisition of TNT Energy, LLC on May 9, 2016. |
| (2) | Reflects the acquisitions of E-lighting on February 5, 2015, and Energy Source, LLC on August 5, 2015. |
| (3) | Reflects the acquisitions of Value Lighting, Inc. on April 17, 2014 and All Around Lighting, Inc. on December 18, 2014, and the Preferred Stock Exchange on December 1, 2014. |
| (4) | Reflects the acquisitions of Relume Technologies, Inc. on August 22, 2013 and Tri-State DE LLC on November 15, 2013. |
| (5) | Includes $9.2 million related to restructuring in 2017. |
| (6) | Includes impairment of goodwill of $10.7 million, impairment of intangibles of $10.5 million and $7.7 million related to restructuring expense in 2017. |
| (7) | On March 10, 2016, we filed a certificate of amendment to our Amended and Restated Certificate of Incorporation, as amended, to effect a 1-for-10 reverse stock split, that became effective for trading purposes on March 11, 2016. All references to number of shares and per share data in the consolidated financial statements have been adjusted to reflect the reverse stock split, unless otherwise noted. |
| (8) | Working capital is defined at the excess (deficit) of current assets over current liabilities. |
20
Table of Contents
| Item 7. | Management’s Discussion and Analysis of Financial Condition and Results of Operations |
The following discussion should be read in conjunction with Revolution Lighting Technologies, Inc. consolidated financial statements and the related notes included elsewhere in this Annual Report on Form 10-K. This discussion contains forward looking statements. Actual results could differ materially from the results discussed in the forward-looking statements. Please see “Risk Factors” and “Cautionary Note Regarding Forward-Looking Statements” for a discussion of some of the uncertainties, risks and assumptions associated with these statements.
This Management’s Discussion and Analysis of Financial Condition and Results of Operations contains certain financial measures, which are not presented in accordance with accounting principles generally accepted in the United States (“U.S. GAAP”). We are presenting these non-U.S. GAAP financial measures because we believe they provide us, and readers of this Form 10-K, with additional insight into our operational performance relative to earlier periods and relative to our competitors. We do not intend for these non-U.S GAAP financial measures to be a substitute for any U.S. GAAP financial information. Readers of these statements should use these non-U.S. GAAP financial measures only in conjunction with the comparable U.S. GAAP financial measures.
Executive Overview
We are a leader in the designing, manufacturing, marketing, and selling of LED lighting solutions focusing on the industrial, commercial and government markets in the United States, Canada, and internationally. Through advanced LED technologies, we have created an innovative lighting company that offers a comprehensive advanced product platform of high-quality interior and exterior LED lamps and fixtures, including signage and control systems. We are uniquely positioned to act as an expert partner, offering full-service lighting solutions through our operating divisions, including Energy Source, Value Lighting, Tri-State LED, E-Lighting, All-Around Lighting and TNT Energy, to transform lighting into a source of superior energy savings, quality light and well-being.
We generate revenue by selling lighting products for use in the commercial, industrial and government markets, which include vertical markets such as military, municipal, commercial office, industrial, warehouse, education, hospitality, retail, healthcare, multi-family and signage-media-accent markets. We market and distribute our products globally through networks of distributors, independent sales agencies and representatives, electrical supply companies, as well as internal marketing and sales forces.
Our operations consist of one reportable segment for financial reporting purposes: Lighting Products and Solutions (principally LED fixtures and lamps).
During the fourth quarter of 2017, we experienced poor performance of our common stock, which led management to believe that a triggering event occurred. As such, an updated goodwill impairment test was performed. The result of the impairment test indicated that the carrying value of goodwill was above the implied fair value. In accordance with Accounting Standards Codification (“ASC”) 350-20, Intangibles – Goodwill and Other (“ASC 350-20”), goodwill with a carrying amount of $72.2 million was reduced to its implied fair value of $61.5 million, resulting in an impairment charge of $10.7 million for the year ended December 31, 2017 in the Consolidated Statements of Operations. See Note 6 of Notes to Consolidated Financial Statements.
As a result of changes we made to our business, which included the consolidation and restructuring of our businesses and operations, we evaluated the recoverability of the carrying value of long-lived assets. The result of such evaluation indicated that gross intangible assets of $18.9 million and related accumulated amortization of $8.4 million were impaired, and we recognized an impairment of $10.5 million for the year ended December 31, 2017 in the Consolidated Statements of Operations. See Note 7 of Notes to Consolidated Financial Statements.
In the fourth quarter of 2017, we announced a restructuring plan to further streamline our operations, eliminate redundancies at certain divisions and address certain operational functions. As part of the restructuring, we (i) consolidated the operations of three divisions into one, (ii) consolidated sales, purchasing, bidding and proposal and accounting functions, (iii) expanded and refocused our marketing resources, including changes to key management positions at certain divisions, and (iv) exited certain product lines and related operations, including the eliminations of a number of warehouse locations. In connection with this restructuring, we abandoned certain assets, including inventory and other, totaling $15.0 million (net of expected recoveries), of which $9.2 million was recorded as part of “Cost of sales” in the Consolidated Statements of Operations. In addition, we recorded $1.9 million of accrued restructuring costs related to severance, outplacement and other employee costs, lease terminations and other relocation costs.
Restructuring charges have been recorded in accordance with ASC 420-10, Exit or Disposal Cost Obligations (“ASC 420-10”). We account for one-time termination benefits, contract terminations and/or costs to terminate lease obligations less assumed sublease income in accordance with ASC 420-10, which addresses financial accounting and reporting for costs associated with restructuring activities. Under ASC 420-10, we established a liability for costs associated with an exit or disposal activity, including severance and lease termination obligations, and other related costs. We will reassess the expected cost to complete the exit or disposal activities at the end of each reporting period and adjust our remaining estimated liabilities, if necessary. It is expected that the actions taken for this restructuring will be substantially completed by the end of the second quarter of 2018.
21
Table of Contents
Recent Developments
Amended Revolving Credit Facility — On January 26, 2017, we amended the Revolving Credit Facility which enabled us to borrow up to $50.0 million on a revolving basis, based upon specified percentages of eligible receivables and inventory, which matures on January 26, 2020 (the “amended Revolving Credit Facility”). See Note 9 of Notes to Consolidated Financial Statements.
Opening of Buy American Act Facility – In March 2017, we opened a new 60,000 square foot state of the art facility in Simi Valley, California, which expanded our warehouse and production space for our industry leading LED technologies, including our high performance Buy American Act (“BAA”) and Trade Agreements Act (“TAA”) compliant LED tubes and fixtures. The new facility offers significantly larger space for inventory, production and testing, and will be key in winning military, government, municipal and commercial projects.
Certification by the U.S. Navy – In April 2017, the U.S. Navy certified our two foot T8 LED tube for the military standard, which is ready for use in the U.S. Navy fleet. Additionally, we received an official part number that can be used throughout the fleet to order our advanced high efficiency LED tube. U.S. Navy ships are now able to purchase our certified LED tube through the standard U.S. Navy supply chain. During the fourth quarter 2017, we received our first order for which delivery began in the fourth quarter and will be completed in the first quarter 2018.
Department of Defense Contract – In August 2017, we were awarded a Department of Defense contract through the Defense Logistics Agency to supply LED tubes to the U.S. Navy. We were selected because our LED lighting products incorporate BAA and TAA compliant components, ensuring they meet the strict requirements needed for implementation into U.S. Navy vessels. These tubes will be manufactured in our new state-of-the-art Simi Valley production and warehouse facility.
U.S. National Guard – In September 2017, we received our first award from the U.S. National Guard, demonstrating that our Navy certified BAA and TAA compliant products could have a large market beyond the U.S. Navy, including other U.S. and international governmental entities.
Lighting as a Service Program – During the fourth quarter of 2017, we initiated our “Lighting as a Service” (“LAAS”) program in two northeastern states. If fully implemented, this program will provide significant revenue opportunities in 2018 and beyond.
Lighting Controls – During 2017, we developed a leading lighting control solution, providing a simple, flexible and scalable system to meet customer needs, now and in the future, for Internet of Things (“IOT”), Power-over-Ethernet (“PoE”) and important security programs.
Lighting mobile management interface (LMMI) – In 2017, we completed the development of our real-time, cloud based software system, which integrated, end-to-end, all operational aspects unique to our lighting products and service businesses. LMMI is currently being implemented throughout our business units and we expect to begin marketing a variation of this groundbreaking system to energy service and other companies to significantly improve their operational processes and monitor projects and opportunities.
22
Table of Contents
Results of Operations
Year Ended December 31, 2017 Compared to the Year Ended December 31, 2016
| Year Ended December 31, | ||||||||
| 2017 | 2016 | |||||||
| (In Millions) | ||||||||
| Revenue |
$ | 152.3 | $ | 172.1 | ||||
| Cost of sales |
101.4 | 116.2 | ||||||
| Restructuring costs |
9.2 | — | ||||||
|
|
|
|
|
|||||
| Total cost of sales |
110.6 | 116.2 | ||||||
| Gross profit |
41.7 | 55.9 | ||||||
| Operating expenses: |
||||||||
| Selling, general and administrative |
44.0 | 39.4 | ||||||
| Research and development |
3.7 | 2.4 | ||||||
| Amortization and depreciation |
6.1 | 6.1 | ||||||
| Acquisition, severance and transition costs |
6.1 | 3.9 | ||||||
| Stock-based compensation |
3.0 | 2.1 | ||||||
| Impairment of goodwill |
10.7 | — | ||||||
| Impairment of intangible assets |
10.5 | — | ||||||
| Restructuring costs |
7.7 | — | ||||||
|
|
|
|
|
|||||
| Total operating expenses |
91.8 | 53.9 | ||||||
|
|
|
|
|
|||||
| Operating income (loss) |
(50.1 | ) | 2.0 | |||||
| Interest expense and other charges |
(3.8 | ) | (2.5 | ) | ||||
|
|
|
|
|
|||||
| Net loss |
$ | (53.9 | ) | $ | (0.5 | ) | ||
|
|
|
|
|
|||||
Revenue for 2017 decreased $19.8 million, or 12%, as compared to 2016. The decrease in revenue primarily reflects the impact of hurricane activity in Texas and the southeastern United States during the third quarter, which impacted multi-family lighting revenue. Additionally, we experienced a delay in a number of Energy Source division projects from the third and fourth quarters of 2017 to 2018. Despite overall lower unit sale prices, gross profit margin, excluding restructuring charges, increased to 33% for 2017 compared to 32% for 2016 reflecting a significantly expanded our product portfolio, including flat panels, wall packs, high bays and other products to capitalize on the changing product mix taking place in the LED space.
Selling, general and administrative expenses increased $4.6 million, or 12%, which includes our ongoing investment in the expansion of sales and marketing resources focusing on agents, ESCOs, dealers and distributors and our investment in resources to advance our U.S. government and U.S. military specific product lines.
Research and development costs increased $1.3 million due to investments in our expanding portfolio of lighting products and controls, including our U.S. government and U.S. military specific product lines.
Acquisition, severance and transition costs primarily consisted of costs associated with the continued streamlining of our operations and the elimination of redundancies at certain of our divisions, partially offset by changes in our assumptions utilized in the calculation of purchase price obligations related to our acquired businesses.
During the fourth quarter of 2017, we experienced poor performance of our common stock, which led management to believe that a triggering event had occurred. As a result, an updated goodwill impairment test was performed. The result of the impairment test indicated that the carrying value of goodwill was above the implied fair value. In accordance with ASC 350-20, goodwill with a carrying amount of $72.2 million was reduced to its implied fair value of $61.5 million, resulting in an impairment charge of $10.7 million for the year ended December 31, 2017 in the Consolidated Statements of Operations (see Note 6).
In order to improve the effectiveness of our business operations, we effectuated certain changes. In light of such changes, we evaluated the recoverability of the carrying value of long-lived assets. The result of such evaluation indicated that the carrying value of intangible assets were impaired, and we recognized a charge of $10.5 million for the year ended December 31, 2017 in the Consolidated Statements of Operations (see Note 7).
23
Table of Contents
In the fourth quarter of 2017, we announced a restructuring plan to further streamlining our operations, eliminate redundancies at certain divisions and address certain operational functions. As part of the restructuring, we (i) consolidated the operations of three divisions into one, (ii) consolidated sales, purchasing, bidding and proposal and accounting functions, (iii) expanded and refocused our marketing resources, including changes to key management positions at certain divisions, and (iv) exited certain product lines and related operations, including the eliminations of a number of warehouse locations. In connection with this restructuring, we abandoned certain assets, including inventory and other, totaling $15.0 million (net of expected recoveries), of which $9.2 million was recorded as part of “Cost of sales” in the Consolidated Statements of Operations. In addition, we recorded $1.9 million of accrued restructuring costs related to severance, outplacement and other employee costs, lease terminations and other relocation costs (see Note 20).
Interest and other expenses for 2017 increased $1.3 million, primarily as a result of higher balances outstanding under our Bank of America Revolving Credit Facility (see Note 9) and the amended note payable with Aston Capital, LLC (“Aston”) (see Note 17), partially offset by the payoff of the $10.0 million Energy Source note on January 26, 2017 (see Note 9).
Year Ended December 31, 2016 Compared to the Year Ended December 31, 2015
| Year Ended December 31, | ||||||||
| 2016 | 2015 | |||||||
| (In Millions) | ||||||||
| Revenue |
$ | 172.1 | $ | 129.7 | ||||
| Cost of sales |
116.2 | 86.4 | ||||||
|
|
|
|
|
|||||
| Gross profit |
55.9 | 43.3 | ||||||
| Operating expenses: |
||||||||
| Selling, general and administrative |
39.4 | 32.2 | ||||||
| Research and development |
2.4 | 2.4 | ||||||
| Amortization and depreciation |
6.1 | 4.9 | ||||||
| Acquisition, severance and transition costs |
3.9 | 2.0 | ||||||
| Stock-based compensation |
2.1 | 2.7 | ||||||
|
|
|
|
|
|||||
| Total operating expenses |
53.9 | 44.2 | ||||||
|
|
|
|
|
|||||
| Operating income (loss) |
2.0 | (0.9 | ) | |||||
| Interest expense and other charges |
(2.5 | ) | (1.5 | ) | ||||
|
|
|
|
|
|||||
| Net loss |
$ | (0.5 | ) | $ | (2.4 | ) | ||
|
|
|
|
|
|||||
Revenue for 2016 increased $42.4 million, or 33%, as compared to 2015. The increase reflects strong volume growth in product sales, as LED market lighting demands continue to rise, as well as the acquisitions of TNT and Energy Source, which were acquired in May 2016 and August 2015, respectively. These increases were partially offset by lower prices in certain retrofit and related-LED products. Despite overall lower unit sale prices, we maintained our gross profit margin of 32% for 2016 compared to 33% for 2015.
Operating expenses increased $9.7 million, or 22%, during 2016 as compared to the corresponding period in 2015. As a percentage of revenue, operating expenses decreased to 31% in 2016 compared to 34% in 2015 as increased revenue enabled us to realize economies of scale. The increase in operating expenses was due to the following:
| • | Selling, general and administrative expenses increased by $7.2 million, which primarily reflects costs attributable to the acquisition of TNT during 2016 and the full-year effect of the 2015 acquisition of Energy Source, increased sales related expenses and other. |
| • | The $1.2 million increase in amortization and depreciation was primarily due to the acquisition of TNT during the second quarter of 2016, as well as the channel distribution agreements entered into during 2016. |
| • | Acquisition, severance and transition costs during 2016 included costs associated with the TNT acquisition, costs related to the streamlining of our operations and costs associated with eliminating redundancies at our divisions, partially offset by adjustments due to a change in assumptions utilized in the calculation of purchase price obligations related to our acquired businesses. Acquisition, severance and transition costs during 2015 were primarily related to costs incurred related to the acquisition of Energy Source. |
Interest and other expenses for 2016 increased $1.0 million over the year-ago period, primarily as a result of higher balances outstanding under our Bank of America Revolving Credit Facility, as well as the Energy Source and TNT promissory notes.
24
Table of Contents
Liquidity and Capital Resources
On January 26, 2017, we entered into an amended Revolving Credit Facility, which enables us to borrow up to $50.0 million on a revolving basis, based upon specified percentages of eligible receivables and inventory.
Our liquidity as of December 31, 2017 and 2016 was $7.4 million and $1.9 million, respectively, which consisted of cash and cash equivalents of $0.9 million and $0.9 million, respectively, and additional borrowing capacity under the Revolving Credit Facility of $6.5 million and $1.0 million, respectively.
As of December 31, 2017, we were in compliance with our covenants under the Bank of America Revolving Credit Facility.
At December 31, 2017 and 2016, we had working capital of $34.3 million and $51.3 million, respectively. We believe we have adequate resources to meet our cash requirements for the foreseeable future.
Although we realized revenues of $152.3 million during 2017, we may face challenges regarding profitability. There can be no assurance that we will achieve positive cash flows from operations or profitability in future periods. Our ability to meet our obligations in the ordinary course of business is dependent upon our ability to establish profitable operations, maintain our revolving credit facility, or raise additional capital through public or private debt or equity financing, or other sources of financing to fund operations, as well as support of our principal stockholder. There can be no assurance such financing will be available on terms acceptable to us or that any financing transaction will not be dilutive to our current stockholders. In addition, our significant shareholder, RVL, and its affiliates have historically been a significant source of financing, and they continue to support our operations.
Cash Flows
| Year Ended December 31, | ||||||||||||
| 2017 | 2016 | 2015 | ||||||||||
| (In Millions) | ||||||||||||
| Cash used in operating activities |
$ | (7.0 | ) | $ | (6.2 | ) | $ | (16.6 | ) | |||
| Cash used in investing activities |
(1.9 | ) | (12.9 | ) | (11.0 | ) | ||||||
| Cash provided by financing activities |
8.9 | 19.8 | 21.8 | |||||||||
|
|
|
|
|
|
|
|||||||
| Net increase (decrease) in cash and cash equivalents |
$ | — | $ | 0.7 | $ | (5.8 | ) | |||||
|
|
|
|
|
|
|
|||||||
Cash Flows used in Operating Activities - Operating cash flows during 2017 primarily reflect increases in inventory, vendor deposits, and prepaid assets and a decrease in accounts payable to support or expand operations, partially offset by decreases in accounts receivable and unbilled receivables. Operating cash flows during 2016 primarily reflect increased trade and other receivables and increased inventory due to increased revenue of 33% year-over-year. Operating cash flows during 2015 reflect our higher working capital investment, particularly in accounts receivable and inventory, to support our greatly expanded operations.
Cash Flows used in Investing Activities — The use of cash during 2017 was primarily attributable to purchases of property and equipment of $1.6 million and the payment of acquisition obligations of $0.3 million. The use of cash during 2016 and 2015 was primarily attributable to cash paid in connection with acquisitions of $11.4 million and $10.5 million, respectively. Additionally, during 2016, we paid $1.0 million related to acquisition obligations.
Cash Flows provided by Financing Activities — Net cash provided during 2017 was primarily attributable to $12.6 million of net proceeds from the Revolving Credit Facility and $10.7 million of net proceeds from related party notes payable, partially offset by repayments on notes payable of $14.4 million, including the $10.0 million Energy Source acquisition notes and the $2.0 million TNT acquisition notes. Net cash provided during 2016 was primarily attributable to $16.2 million of net cash received from the issuance of common stock and $4.0 million of net proceeds from the Bank of America Revolving Credit Facility, partially offset by repayments on notes payable of $0.4 million. Net cash provided during 2015 was primarily attributable to increased borrowings on the Bank of America Revolving Credit Facility of $13.3 million and net proceeds from the issuance of common stock of $9.0 million, partially offset by repayments of borrowings and notes of $0.4 million.
CRITICAL ACCOUNTING POLICIES AND ESTIMATES
The preparation of financial statements in conformity with accounting principles generally accepted in the United States of America (“U.S. GAAP”) requires management to make certain estimates and assumptions regarding matters that are inherently uncertain and that ultimately affect the reported amounts of assets, liabilities, revenues and expense, and the disclosure of contingent assets and liabilities. The estimates and assumptions are based on management’s experience and understanding of current facts and circumstances. These estimates may differ from actual results. Certain of our accounting policies are considered critical as they are both important to reflect our financial position and results of operations and require significant or complex judgement on the part of management. The following is a summary of certain accounting policies considered critical by management.
25
Table of Contents
Business Combinations
Business combinations are accounted for using the acquisition method under ASC 805, Business Combinations, which requires recording assets acquired and liabilities assumed at fair value as of the acquisition date. Under the acquisition method of accounting, each tangible and separately identifiable asset acquired and liability assumed is recorded based on their estimated fair values on the acquisition date. Acquisition related costs are expensed as incurred and are reported separately in the Consolidated Statements of Operations.
Revenue recognition
We recognize revenue from our product sales upon shipment or delivery to customers in accordance with the respective contractual arrangements, provided no significant obligations remain and collection is probable. For sales that include customer acceptance terms, revenue is recorded after customer acceptance. It is our policy that all sales are final. Requests for returns are reviewed on a case by case basis. As revenue is recorded, we accrue an estimated amount for product returns as a reduction of revenue.
We recognize revenue from fixed-price and modified fixed-price contracts for turnkey energy conservation projects using the percentage-of-completion method of accounting. The percentage-of-completion is computed by dividing the actual incurred cost to date by the most recent estimated total cost to complete the project. The computed percentage is applied to the expected revenue for the project to calculate the contract revenue to be recognized in the current period. This method is used because management considers total cost to be the best available measure of progress on these contracts. Contract costs include all direct material and labor costs and indirect costs related to contract performance. Provisions for estimated losses on uncompleted contracts are made in the period in which such losses are determined.
See “Recent accounting pronouncements” in Note 2 of Notes to Consolidated Financial Statements for a discussion of revenue recognition in future periods.
Accounts Receivable
Our strategy for managing doubtful accounts includes establishing credit limits, performing periodic credit evaluations of our customers’ financial condition and collection procedures for all customer accounts. We use a credit risk rating system in order to measure the quality of individual credit transactions. We strive to identify potential problem receivables early, take appropriate collection actions, and maintain adequate reserve levels. As revenue is recorded, we accrue an estimated amount for product returns as a reduction of revenue. Our estimate for product returns is based on our historical return experience and our expectation of future returns.
Inventory Provisions
Inventories are stated at the lower of cost (first-in, first-out) or market, net of allowances for obsolete inventory. Periodically, we review our inventory for both excessive and obsolete inventory (inventory that is no longer marketable for its intended use). In either case, we record any write-downs based on assumptions about alternative uses, market conditions and other factors.
Goodwill
We record goodwill as the excess of purchase price over the fair value of the identifiable net assets acquired. Goodwill is not amortized, but is subject to annual impairment testing unless circumstances dictate more frequent assessments. We perform an annual impairment assessment for goodwill during the fourth quarter of each year or more frequently if changes in circumstances indicate that the fair value of the asset may be less than the carrying amount. Goodwill impairment testing requires determining the fair value of a reporting unit, which is judgmental in nature and requires the use of significant estimates and assumptions, including revenue growth rates, strategic plans and future market conditions, among others. There can be no assurance that our estimates and assumptions made for purposes of the goodwill impairment testing will prove to be accurate predictions of the future. Changes in assumptions and estimates could cause us to perform an impairment test prior to the annual impairment test scheduled in the fourth quarter.
Long-Lived Assets
Key estimates related to long-lived assets, including property and equipment and intangible assets, include useful lives and the recoverability of carrying values. As a result of future decisions, such estimates could be significantly modified. The estimated useful lives of property and equipment range from three to seven years, and depreciation is recognized on a straight-line basis. Useful lives are estimated based upon our historical experience and industry information. Intangible assets with finite useful lives are amortized on the straight-line basis over their estimated useful lives.
We evaluate the recoverability of the carrying value of long-lived assets whenever events or changes in circumstances indicate that the carrying value may not be recoverable. Under such circumstances, we assess whether the projected undiscounted cash flows of our long-lived assets are sufficient to recover the carrying amount of the asset group being assessed. If the undiscounted projected cash flows are less than the carrying value of the assets, we calculate the impairment amount by comparing the carrying value of the asset group to its fair value. The amount of the impairment of long-lived assets is written off against earnings in the period in which the impairment is determined.
Income Taxes
Deferred tax assets and liabilities are determined based on temporary differences between the financial reporting and tax bases of assets and liabilities using enacted tax rates expected to apply to taxable income in the years in which those temporary differences are expected to be recovered or settled. A valuation allowance is provided against a deferred tax asset when it is more likely than not that all or some portion of the deferred tax assets will not be recognized. We evaluate the adequacy of the valuation allowance annually and, if its assessment of whether it is more likely than not that the related tax benefits will be realized changes, the valuation allowance will be increased or reduced with a corresponding benefit or charge included in income.
26
Table of Contents
We have U.S. Federal net operating loss carryforwards, which may be used to reduce future taxable income. Utilization of net operating loss carryforwards is dependent on generating future taxable income of the appropriate type and in the appropriate jurisdiction. In addition, as a result of transactions consummated during 2013 and 2012, including the issuance of common and preferred stock and the acquisitions of Seesmart and Relume, substantially all of our net operating loss carryforwards are subject to limitations imposed by Section 382 of the Internal Revenue Code. The determination of such limitations is complex and requires a significant amount of analysis and review of past transactions, including those related transactions involving acquired companies and their predecessors. During 2013, we performed an evaluation of the Section 382 limitations on the use of net operating loss carryforwards, and adjusted them accordingly.
Uncertain tax positions are recognized if we determine that it is more likely than not that a tax position will be sustained based on the technical merits of the position, on the presumption that the position will be examined by the appropriate taxing authority that would have full knowledge of all relevant information. The tax position is measured at the largest amount of benefit that is greater than 50 percent likely of being realized upon ultimate settlement.
As further discussed in Note 13 of Notes to Consolidated Financial Statements, on December 22, 2017, the United States enacted the Tax Cuts and Jobs Act (“TCJA”), which institutes significant changes to U.S. tax laws. In accordance with the SEC’s Staff Accounting Bulletin No. 118 (“SAB 118”), we have recorded provisional estimates to reflect the effect of the provisions of the TCJA on our income tax assets and liabilities as of December 31, 2017. We continue to collect additional information to support and refine our calculations on the impact of these changes on our operations and recorded income tax assets and liabilities. The ultimate impact of the TCJA may differ from our provisional estimates due to the changes in the interpretations and assumptions we made, as well as additional regulatory guidance.
Contractual Obligations
The following table sets forth information relating to our contractual obligations as of December 31, 2017:
| Contractual Obligation Payments Due by Year (3)(4) |
||||||||||||||||||||
| Total | Less than 1 year |
1-3 years |
3-5 years |
More than 5 years |
||||||||||||||||
| (Millions of U.S. dollars) | ||||||||||||||||||||
| Operating lease obligations |
$ | 13.5 | $ | 3.7 | $ | 6.1 | $ | 2.9 | $ | 0.8 | ||||||||||
| Purchase price obligations and other (1) |
0.1 | 0.1 | — | — | — | |||||||||||||||
| Total debt, including interest |
54.8 | 2.9 | 51.9 | — | — | |||||||||||||||
|
|
|
|
|
|
|
|
|
|
|
|||||||||||
| Total |
$ | 68.4 | $ | 6.7 | $ | 58.0 | $ | 2.9 | $ | 0.8 | ||||||||||
|
|
|
|
|
|
|
|
|
|
|
|||||||||||
| (1) | Includes $0.1 million that will be settled in share of common stock. |
RECENT ACCOUNTING PRONOUNCEMENTS
See Note 2 to the Notes to the Consolidated Financial Statements included in this Annual Report on Form 10-K for information related to new accounting pronouncements.
OFF-BALANCE SHEET ARRANGEMENTS
We do not have any off-balance sheet arrangements that have or are reasonably likely to have a current or future effect on our financial condition, changes in financial condition, revenues or expenses, results of operations, liquidity, capital expenditures or capital resources that are material to our investors.
| Item 7A. | Quantitative and Qualitative Disclosures About Market Risk |
At December 31, 2017, we were exposed to interest rate risk in connection with our variable-rate Bank of America Revolving Credit Facility pursuant to which we may borrow up to $50.0 million on a revolving basis. See Note 9 of the Notes to Consolidated Financial Statements.
27
Table of Contents
| Item 8. | Financial Statements and Supplementary Data |
| Page No. |
||||
| Revolution Lighting Technologies, Inc. Audited Financial Statements |
||||
| Report of Independent Registered Public Accounting Firm on Internal Control Over Financial Reporting |
29 | |||
| 30 | ||||
| 31 | ||||
| Consolidated Statements of Operations for the Years Ended December 31, 2017, 2016 and 2015 |
32 | |||
| Consolidated Statements of Stockholders’ Equity for the Years Ended December 31, 2017, 2016 and 2015 |
33 | |||
| Consolidated Statements of Cash Flows for the Years Ended December 31, 2017, 2016 and 2015 |
34 | |||
| 35 | ||||
28
Table of Contents
Report of Independent Registered Public Accounting Firm
To the Stockholders and the Board of Directors of Revolution Lighting Technologies, Inc.
Opinion on the Internal Control Over Financial Reporting
We have audited Revolution Lighting Technologies, Inc. and subsidiaries’ (the Company) internal control over financial reporting as of December 31, 2017, based on criteria established in Internal Control — Integrated Framework issued by the Committee of Sponsoring Organizations of the Treadway Commission in 2013. In our opinion, the Company maintained, in all material respects, effective internal control over financial reporting as of December 31, 2017, based on criteria established in Internal Control — Integrated Framework issued by the Committee of Sponsoring Organizations of the Treadway Commission in 2013.
We have also audited, in accordance with the standards of the Public Company Accounting Oversight Board (United States) (PCAOB), the consolidated balance sheets as of December 31, 2017 and 2016, and the related consolidated statements of operations, stockholders’ equity and cash flows for each of the three years in the period ended December 31, 2017 of the Company and our report dated March 8, 2018 expressed an unqualified opinion.
Basis for Opinion
The Company’s management is responsible for maintaining effective internal control over financial reporting and for its assessment of the effectiveness of internal control over financial reporting in the accompanying Management’s Annual Report on Internal Control over Financial Reporting appearing under Item 9A. Our responsibility is to express an opinion on the Company’s internal control over financial reporting based on our audit. We are a public accounting firm registered with the PCAOB and are required to be independent with respect to the Company in accordance with U.S. federal securities laws and the applicable rules and regulations of the Securities and Exchange Commission and the PCAOB.
We conducted our audit in accordance with the standards of the PCAOB. Those standards require that we plan and perform the audit to obtain reasonable assurance about whether effective internal control over financial reporting was maintained in all material respects. Our audit included obtaining an understanding of internal control over financial reporting, assessing the risk that a material weakness exists, and testing and evaluating the design and operating effectiveness of internal control based on the assessed risk. Our audit also included performing such other procedures as we considered necessary in the circumstances. We believe that our audit provides a reasonable basis for our opinion.
Definition and Limitations of Internal Control Over Financial Reporting
A company’s internal control over financial reporting is a process designed to provide reasonable assurance regarding the reliability of financial reporting and the preparation of financial statements for external purposes in accordance with generally accepted accounting principles. A company’s internal control over financial reporting includes those policies and procedures that (1) pertain to the maintenance of records that, in reasonable detail, accurately and fairly reflect the transactions and dispositions of the assets of the company; (2) provide reasonable assurance that transactions are recorded as necessary to permit preparation of financial statements in accordance with generally accepted accounting principles, and that receipts and expenditures of the company are being made only in accordance with authorizations of management and directors of the company; and (3) provide reasonable assurance regarding prevention or timely detection of unauthorized acquisition, use or disposition of the company’s assets that could have a material effect on the financial statements.
Because of its inherent limitations, internal control over financial reporting may not prevent or detect misstatements. Also, projections of any evaluation of effectiveness to future periods are subject to the risk that controls may become inadequate because of changes in conditions, or that the degree of compliance with the policies or procedures may deteriorate.
/s/ RSM US LLP
Stamford, Connecticut
March 8, 2018
29
Table of Contents
Report of Independent Registered Public Accounting Firm
To the Stockholders and the Board of Directors of Revolution Lighting Technologies, Inc.
Opinion on the Financial Statements
We have audited the accompanying consolidated balance sheets of Revolution Lighting Technologies, Inc. and its subsidiaries (the Company) as of December 31, 2017 and 2016, the related consolidated statements of operations, stockholders’ equity and cash flows for each of the three years in the period ended December 31, 2017, and the related notes to the consolidated financial statements (collectively, the financial statements). In our opinion, the financial statements present fairly, in all material respects, the financial position of the Company as of December 31, 2017 and 2016, and the results of its operations and its cash flows for each of the three years in the period ended December 31, 2017, in conformity with accounting principles generally accepted in the United States of America.
We have also audited, in accordance with the standards of the Public Company Accounting Oversight Board (United States) (PCAOB), the Company’s internal control over financial reporting as of December 31, 2017, based on criteria established in Internal Control — Integrated Framework issued by the Committee of Sponsoring Organizations of the Treadway Commission in 2013, and our report dated March 8, 2018 expressed an unqualified opinion on the effectiveness of the Company’s internal control over financial reporting.
Basis for Opinion
These financial statements are the responsibility of the Company’s management. Our responsibility is to express an opinion on the Company’s financial statements based on our audits. We are a public accounting firm registered with the PCAOB and are required to be independent with respect to the Company in accordance with U.S. federal securities laws and the applicable rules and regulations of the Securities and Exchange Commission and the PCAOB.
We conducted our audits in accordance with the standards of the PCAOB. Those standards require that we plan and perform the audits to obtain reasonable assurance about whether the financial statements are free of material misstatement, whether due to error or fraud. Our audits included performing procedures to assess the risks of material misstatement of the financial statements, whether due to error or fraud, and performing procedures that respond to those risks. Such procedures included examining, on a test basis, evidence regarding the amounts and disclosures in the financial statements. Our audits also included evaluating the accounting principles used and significant estimates made by management, as well as evaluating the overall presentation of the financial statements. We believe that our audits provide a reasonable basis for our opinion.
/s/ RSM US LLP
We have served as the Company’s auditor since 2010.
Stamford, Connecticut
March 8, 2018
30
Table of Contents
Revolution Lighting Technologies, Inc.
Consolidated Balance Sheets
(In thousands, except per share data)
| December 31, | ||||||||
| 2017 | 2016 | |||||||
| ASSETS |
||||||||
| Current Assets |
||||||||
| Cash and cash equivalents |
$ | 945 | $ | 883 | ||||
| Trade receivable, net of allowance for doubtful accounts |
34,972 | 53,347 | ||||||
| Unbilled contracts receivable |
6,083 | 10,167 | ||||||
| Inventories, net |
26,164 | 26,678 | ||||||
| Vendor deposits, prepaid expenses and other |
9,510 | 8,363 | ||||||
|
|
|
|
|
|||||
| Total current assets |
77,674 | 99,438 | ||||||
| Property and equipment, net |
1,603 | 1,474 | ||||||
| Goodwill |
61,508 | 72,074 | ||||||
| Intangible assets, net |
28,372 | 43,809 | ||||||
| Other assets, net |
1,077 | 704 | ||||||
|
|
|
|
|
|||||
| Total assets |
$ | 170,234 | $ | 217,499 | ||||
|
|
|
|
|
|||||
| LIABILITIES AND STOCKHOLDERS’ EQUITY |
||||||||
| Current Liabilities |
||||||||
| Accounts payable |
$ | 28,833 | $ | 32,409 | ||||
| Accrued and other liabilities |
11,570 | 10,541 | ||||||
| Notes payable |
1,796 | 2,360 | ||||||
| Related party notes payable |
1,000 | 1,500 | ||||||
| Purchase price obligations |
130 | 1,327 | ||||||
|
|
|
|
|
|||||
| Total current liabilities |
43,329 | 48,137 | ||||||
| Revolving credit facility |
38,633 | 25,993 | ||||||
| Notes payable |
270 | 12,066 | ||||||
| Related party notes payable |
11,720 | 2,565 | ||||||
| Purchase price obligations |
— | 1,716 | ||||||
| Other noncurrent liabilities |
419 | 1,309 | ||||||
|
|
|
|
|
|||||
| Total liabilities |
94,371 | 91,786 | ||||||
|
|
|
|
|
|||||
| Contingencies and Commitments |
||||||||
| Stockholders’ Equity |
||||||||
| Common stock, par value $0.001 — 35,000 shares authorized and 21,352 shares issued and outstanding at December 31, 2017 and 35,000 shares authorized and 20,893 shares issued and outstanding at December 31, 2016 |
21 | 21 | ||||||
| Additional paid-in-capital |
204,944 | 200,887 | ||||||
| Accumulated deficit |
(129,102 | ) | (75,195 | ) | ||||
|
|
|
|
|
|||||
| Total stockholders’ equity |
75,863 | 125,713 | ||||||
|
|
|
|
|
|||||
| Total liabilities and stockholders’ equity |
$ | 170,234 | $ | 217,499 | ||||
|
|
|
|
|
|||||
See accompanying notes to consolidated financial statements.
31
Table of Contents
Revolution Lighting Technologies, Inc.
Consolidated Statements of Operations
(In thousands, except per share data)
| Year Ended December 31, | ||||||||||||
| 2017 | 2016 | 2015 | ||||||||||
| Revenue |
$ | 152,312 | $ | 172,121 | $ | 129,656 | ||||||
| Cost of sales |
101,394 | 116,250 | 86,366 | |||||||||
| Restructuring costs |
9,256 | — | — | |||||||||
|
|
|
|
|
|
|
|||||||
| Total cost of sales |
110,650 | 116,250 | 86,366 | |||||||||
| Gross profit |
41,662 | 55,871 | 43,290 | |||||||||
| Operating expenses: |
||||||||||||
| Selling, general and administrative |
44,030 | 39,408 | 32,179 | |||||||||
| Research and development |
3,712 | 2,372 | 2,475 | |||||||||
| Amortization and depreciation |
6,068 | 6,115 | 4,868 | |||||||||
| Acquisition, severance and transition costs |
6,096 | 3,851 | 1,950 | |||||||||
| Stock-based compensation |
2,976 | 2,141 | 2,719 | |||||||||
| Impairment of goodwill |
10,702 | — | — | |||||||||
| Impairment of intangible assets |
10,480 | — | — | |||||||||
| Restructuring costs |
7,652 | — | — | |||||||||
|
|
|
|
|
|
|
|||||||
| Total operating expenses |
91,716 | 53,887 | 44,191 | |||||||||
|
|
|
|
|
|
|
|||||||
| Operating income (loss) |
(50,054 | ) | 1,984 | (901 | ) | |||||||
| Interest expense and other charges |
(3,853 | ) | (2,506 | ) | (1,481 | ) | ||||||
|
|
|
|
|
|
|
|||||||
| Net loss |
$ | (53,907 | ) | $ | (522 | ) | $ | (2,382 | ) | |||
|
|
|
|
|
|
|
|||||||
| Net loss per share, basic and diluted |
$ | (2.59 | ) | $ | (0.03 | ) | $ | (0.16 | ) | |||
|
|
|
|
|
|
|
|||||||
| Weighted average shares outstanding, basic and diluted |
20,847 | 19,034 | 14,930 | |||||||||
|
|
|
|
|
|
|
|||||||
See accompanying notes to consolidated financial statements.
32
Table of Contents
Revolution Lighting Technologies, Inc.
Consolidated Statements of Stockholders’ Equity
Years Ended December 31, 2017, 2016 and 2015
(In thousands)
| Common Stock |
Additional Paid-in- Capital |
Accumulated Deficit |
Total Stockholders’ Equity |
|||||||||||||
| Balance, January 1, 2015 |
$ | 13 | $ | 149,594 | $ | (72,291 | ) | $ | 77,316 | |||||||
| Stock-based compensation |
— | 2,191 | — | 2,191 | ||||||||||||
| Issuance of common stock for cash, net of issuance costs |
1 | 9,506 | — | 9,507 | ||||||||||||
| Shares issued for contingent consideration and acquisition |
2 | 16,016 | — | 16,018 | ||||||||||||
| Cancellation of reacquired escrowed common stock |
— | (547 | ) | — | (547 | ) | ||||||||||
| Net loss |
— | — | (2,382 | ) | (2,382 | ) | ||||||||||
|
|
|
|
|
|
|
|
|
|||||||||
| Balance, December 31, 2015 |
16 | 176,760 | (74,673 | ) | 102,103 | |||||||||||
| Stock-based compensation |
1 | 1,310 | — | 1,311 | ||||||||||||
| Issuance of common stock for cash, net of issuance costs |
3 | 16,189 | — | 16,192 | ||||||||||||
| Shares issued for contingent consideration and acquisition |
1 | 6,628 | — | 6,629 | ||||||||||||
| Net loss |
— | — | (522 | ) | (522 | ) | ||||||||||
|
|
|
|
|
|
|
|
|
|||||||||
| Balance, December 31, 2016 |
21 | 200,887 | (75,195 | ) | 125,713 | |||||||||||
| Stock-based compensation |
— | 2,861 | — | 2,861 | ||||||||||||
| Shares issued for contingent consideration |
— | 1,196 | — | 1,196 | ||||||||||||
| Net loss |
— | — | (53,907 | ) | (53,907 | ) | ||||||||||
|
|
|
|
|
|
|
|
|
|||||||||
| Balance, December 31, 2017 |
$ | 21 | $ | 204,944 | $ | (129,102 | ) | $ | 75,863 | |||||||
|
|
|
|
|
|
|
|
|
|||||||||
See accompanying notes to consolidated financial statements.
33
Table of Contents
Revolution Lighting Technologies, Inc.
Consolidated Statements of Cash Flows
(In thousands)
| Year Ended December 31, | ||||||||||||
| 2017 | 2016 | 2015 | ||||||||||
| Cash Flows from Operating Activities: |
||||||||||||
| Net loss |
$ | (53,907 | ) | $ | (522 | ) | $ | (2,382 | ) | |||
| Adjustments to reconcile net loss to net cash used in operating activities: |
||||||||||||
| Amortization and depreciation |
7,549 | 6,115 | 4,868 | |||||||||
| Stock-based compensation |
2,976 | 2,141 | 2,719 | |||||||||
| Change in fair value of contingent consideration |
(1,433 | ) | (2,248 | ) | 864 | |||||||
| Impairment of goodwill |
10,702 | — | — | |||||||||
| Impairment of intangible assets |
10,480 | — | — | |||||||||
| Restructuring expense, including $9,256 recorded in Cost of sales |
16,908 | — | — | |||||||||
| Other noncash items affecting net income |
(185 | ) | 1,349 | — | ||||||||
| Changes in operating assets and liabilities, net of the effect of the acquisition: |
||||||||||||
| (Increase) decrease in trade receivables, net |
13,613 | (11,780 | ) | (15,111 | ) | |||||||
| (Increase) decrease in unbilled contracts receivable |
4,084 | (5,224 | ) | (2,246 | ) | |||||||
| (Increase) decrease in inventories, net |
(7,371 | ) | (4,430 | ) | (7,234 | ) | ||||||
| (Increase) decrease in prepaid and other assets |
(4,857 | ) | (4,822 | ) | (699 | ) | ||||||
| Increase (decrease) in accounts payable and accrued liabilities |
(5,559 | ) | 13,216 | 2,532 | ||||||||
|
|
|
|
|
|
|
|||||||
| Net cash used in operating activities |
(7,000 | ) | (6,205 | ) | (16,689 | ) | ||||||
|
|
|
|
|
|
|
|||||||
| Cash Flows from Investing Activities: |
||||||||||||
| Payment of acquisition obligations |
(284 | ) | (1,015 | ) | — | |||||||
| Purchase of property and equipment and other |
(1,059 | ) | (555 | ) | (462 | ) | ||||||
| Acquisition of business and other, net of cash acquired |
(530 | ) | (11,360 | ) | (10,499 | ) | ||||||
|
|
|
|
|
|
|
|||||||
| Net cash used in investing activities |
(1,873 | ) | (12,930 | ) | (10,961 | ) | ||||||
|
|
|
|
|
|
|
|||||||
| Cash Flows from Financing Activities: |
||||||||||||
| Net proceeds from revolving credit facility |
12,640 | 3,967 | 13,266 | |||||||||
| Proceeds from related party notes payable |
10,655 | — | — | |||||||||
| Repayments of notes payable and short-term borrowings |
(12,360 | ) | (360 | ) | (390 | ) | ||||||
| Repayments of related party notes payable |
(2,000 | ) | — | — | ||||||||
| Proceeds from issuance of common stock, net of issuance costs |
— | 16,192 | 8,960 | |||||||||
|
|
|
|
|
|
|
|||||||
| Net cash provided by financing activities |
8,935 | 19,799 | 21,836 | |||||||||
|
|
|
|
|
|
|
|||||||
| Net increase (decrease) in cash and cash equivalents |
62 | 664 | (5,814 | ) | ||||||||
| Cash and cash equivalents, beginning of year |
883 | 219 | 6,033 | |||||||||
|
|
|
|
|
|
|
|||||||
| Cash and cash equivalents, end of year |
$ | 945 | $ | 883 | $ | 219 | ||||||
|
|
|
|
|
|
|
|||||||
| Supplemental Disclosure of Cash Flow Information: |
||||||||||||
| Cash paid during the period for interest |
$ | 3,099 | $ | 1,837 | $ | 688 | ||||||
|
|
|
|
|
|
|
|||||||
| Non-Cash Investing and Financing Activities: |
||||||||||||
| Issuance of common stock for contingent consideration |
$ | 1,196 | $ | 6,629 | $ | 6,316 | ||||||
| Contingent consideration for acquisitions |
— | 4,132 | 1,550 | |||||||||
| Issuance of promissory notes for acquisition |
— | 2,000 | 10,000 | |||||||||
| Issuance of common stock for acquisitions |
— | — | 9,702 | |||||||||
| Deferred consideration for acquisition |
— | — | 350 | |||||||||
See accompanying notes to consolidated financial statements.
34
Table of Contents
Revolution Lighting Technologies, Inc.
Notes to Consolidated Financial Statements
(In millions, except share and per share data, or unless otherwise noted)
| 1. | The Company |
Revolution Lighting Technologies, Inc., together with its wholly-owned subsidiaries (“Revolution”, “we”, “us” or “our”), is a leader in the designing, manufacturing, marketing, and selling of light-emitting diode (“LED”) lighting solutions focusing on the industrial, commercial and government markets in the United States, Canada, and internationally. Through advanced LED technologies, we have created an innovative lighting company that offers a comprehensive advanced product platform of high-quality interior and exterior LED lamps and fixtures, including signage and control systems. We are uniquely positioned to act as an expert partner, offering full-service lighting solutions through our operating divisions, including Energy Source, Value Lighting, Tri-State LED, E-Lighting, All-Around Lighting and TNT Energy, to transform lighting into a source of superior energy savings, quality light and well-being.
We generate revenue by selling lighting products for use in the commercial, industrial and government markets, which include vertical markets such as military, municipal, commercial office, industrial, warehouse, education, hospitality, retail, healthcare, multi-family and signage-media-accent markets. We market and distribute our products globally through networks of distributors, independent sales agencies and representatives, electrical supply companies, as well as internal marketing and sales forces.
Our operations consist of one reportable segment for financial reporting purposes: Lighting Products and Solutions (principally LED fixtures and lamps).
Basis of presentation
The consolidated financial statements included in this Form 10-K have been prepared in conformity with accounting principles generally accepted in the United States of America (“U.S. GAAP”). Our consolidated financial statements include the accounts of Revolution Lighting Technologies, Inc. and its wholly owned subsidiaries. All intercompany balances and transactions have been eliminated. Certain prior period amounts have been reclassified to conform to the manner and presentation in the current period.
Use of estimates
The preparation of financial statements in conformity with U.S. GAAP requires management to make estimates and assumptions that affect the reported amounts of assets and liabilities, the disclosure of contingent assets and liabilities at the date of the financial statements and the reported amounts of revenues and expenses during the reporting period. The most significant estimates relate to valuation of receivables and inventories, purchase price allocation of acquired businesses, impairment of goodwill and long-lived assets, income taxes, and contingencies. It is at least reasonably possible that the effect on the financial statements of a change in estimate due to one or more future confirming events could have a material effect on the financial statements.
Stock Split
On March 10, 2016, we filed a certificate of amendment to our Amended and Restated Certificate of Incorporation, as amended, to effect a 1-for-10 reverse stock split, as approved by the holder of a majority of the common stock and the Board (the “Split”), that became effective for trading purposes on March 11, 2016. The number of authorized shares and the par value of our common stock remained unchanged following the Split. All references to number of shares and per share data in the consolidated financial statements and applicable disclosures have been adjusted to reflect the reverse stock split, unless otherwise noted.
Liquidity and Capital Resources
On January 26, 2017, we amended the Revolving Credit Facility which enabled us to borrow up to $50.0 million on a revolving basis, based upon specified percentages of eligible receivables and inventory, which matures on January 26, 2020. See Note 9.
Our liquidity as of December 31, 2017 and 2016 was $7.4 million and $1.9 million, respectively, which consisted of cash and cash equivalents of $0.9 million and $0.9 million, respectively, and additional borrowing capacity under the Revolving Credit Facility of $6.5 million and $1.0 million, respectively.
Historically, our significant shareholder, RVL 1 LLC (“RVL”), and its affiliates have been a significant source of financing, and they continue to support our operations. See Note 17.
At December 31, 2017 and 2016, we had working capital of $34.3 million and $51.3 million, respectively. We believe we have adequate resources to meet our cash requirements for the foreseeable future.
35
Table of Contents
| 2. | Significant Accounting Policies |
Fair Value Measurement
We measure fair value on a recurring basis utilizing valuation techniques that maximize the use of observable inputs and minimize the use of unobservable inputs, to the extent possible, and consider counterparty credit risk in our assessment of fair value. The fair value hierarchy is as follows:
Level 1 – Quoted prices in active markets for identical assets and liabilities;
Level 2 – Quoted prices for similar assets and liabilities in active markets, quoted prices for identical or similar assets and liabilities in markets that are not active or other inputs that are observable or can be corroborated by observable market data; and
Level 3 – Unobservable inputs that are supported by little or no market activity and that are significant to the fair value of the assets and liabilities.
Cash and cash equivalents, trade and unbilled contract receivables, inventories, other current assets, accounts payable, and accrued and other liabilities are classified as Level 1 as their carrying values approximate fair value since they are short term in nature and they are receivable or payable on demand.
Based on the borrowing rates currently available for bank loans with similar terms and average maturities, the fair value of notes payable are equal to the carrying value. As such, notes payable are classified as Level 1. See Notes 9 and 17.
The estimated fair value of the reporting unit in our goodwill impairment assessment utilized the market approach based on inputs that are readily available from public markets or can be derived from observable market transactions, and have been classified as level 2 in the fair value hierarchy. The fair values of intangible assets in our long-lived asset impairment assessment were established based on projected discounted cash flows, which were based on significant unobservable inputs and have been classified as Level 3 in the fair value hierarchy.
The estimated fair value of assets and liabilities acquired in business combinations utilize inputs classified as Level 3 in the fair value hierarchy.
Cash and Cash Equivalents
We consider all investments with an original maturity of three months or less to be cash equivalents. We maintain cash and cash equivalents in bank accounts that may exceed federally insured limits. The financial institutions where our cash and cash equivalents are held are highly rated. We have not experienced any losses in such accounts, and believe we are not exposed to significant credit risk.
Accounts Receivable
Accounts receivable are customer obligations due under normal trade terms. We perform periodic credit evaluations of our customers’ financial condition. We record an allowance for doubtful accounts based upon factors surrounding the credit risk of certain customers, and specifically identified amounts that we believe to be uncollectible. Recovery of bad debt amounts previously written off is recorded as a reduction of bad debt expense in the period the payment is collected. If our actual collection experience changes, revisions to our allowance may be required. After all attempts to collect a receivable have failed, the receivable is written off against the allowance. See Note 3.
Inventories
Inventories are stated at the lower of cost (first-in, first-out) or market. Quarterly, we review our inventory for both excessive and obsolete inventory (inventory that is no longer marketable for its intended use). In either case, we record any write-downs based on assumptions about alternative uses, market conditions and other factors. See Note 4.
Property and Equipment
Property and equipment, net is stated at cost (or fair value, if acquired as part of a business combination) less accumulated depreciation, and is depreciated over its estimated useful life using the straight-line method as follows:
| Machinery and equipment |
3-7 years | |
| Furniture and fixtures |
5-7 years | |
| Computers and software |
3-7 years | |
| Motor vehicles |
5 years | |
| Leasehold improvement |
Lesser of lease term or estimated useful life |
Maintenance and repairs are expensed as incurred. Upon retirement or sale, the cost and related accumulated depreciation are removed from the respective account, and any resulting gain or loss is recognized in the Consolidated Statements of Operations. See Note 5.
36
Table of Contents
Goodwill
Goodwill is not amortized, but is subject to annual impairment testing unless circumstances dictate more frequent assessments. We perform an annual impairment assessment for goodwill during the fourth quarter of each year or more frequently whenever changes in circumstances indicate that the fair value of the asset may be less than the carrying amount. We have one reporting unit for goodwill impairment testing purposes. In testing goodwill for impairment, we compare the fair value of the reporting unit to its carrying amount. The fair value of the reporting unit is determined by calculating our market capitalization at the impairment test day. If the fair value of the reporting unit is greater than its carrying amount, there is no impairment. If the carrying amount of goodwill exceeds the implied fair value of goodwill, an impairment loss is recognized in an amount equal to the excess. On October 1, 2017, we performed our annual goodwill impairment test and the estimated fair value exceeded carrying value. We concluded that goodwill, as of October 1, 2017, was not impaired.
During the fourth quarter of 2017, we experienced poor performance of our stock price, which led management to believe that a triggering event occurred. As such, an updated goodwill impairment test was performed. Because we elected to early adopt Accounting Standards Update (“ASU”) 2017-04, “Simplifying the Test for Goodwill Impairment”, the requirement to perform step 2 in the impairment test was not required. The result of the impairment test indicated that goodwill was impaired by $10.7 million. See Note 6.
Intangible Assets
Intangible assets, net is stated at cost or fair value, if acquired as part of a business combination, less accumulated amortization, and is amortized over its estimated useful life using the straight-line method as follows:
| Customer relationships |
10-15 years | |
| Trademarks and trade names |
12-17 years | |
| Non-compete agreements |
6 years | |
| Favorable leases |
10 years |
We evaluate the recoverability of the carrying value of long-lived assets whenever events or changes in circumstances indicate that the carrying value may not be recoverable. The long-lived asset is grouped with other assets at the lowest level for which identifiable cash flows are largely independent of the cash flows of other groups of assets and liabilities. We assess whether the projected undiscounted cash flows of our long-lived assets are sufficient to recover the carrying amount of the asset group being assessed. If the undiscounted projected cash flows are less than the carrying value of the assets, we calculate an impairment by comparing the carrying value of the asset group to its fair value. The amount of the impairment of long-lived assets is written off against earnings in the period in which the impairment is determined. During the fourth quarter of 2017, management performed an impairment test on certain long-lived asset groups. The result of the impairment test indicated that certain intangible assets were impaired by $10.5 million. See Note 7.
Purchase Price Obligations
In connection with certain prior acquisitions, we are obligated to issue contingent consideration. We determine the fair value of certain purchase price obligations on a recurring basis based on a probability-weighted discounted cash flow analysis and Monte Carlo simulation. The fair value remeasurement is based on significant inputs not observable in the market and thus represents a Level 3 measurement. On a quarterly basis, we reassess our current estimates of performance relative to the stated targets and adjust the liability to fair value. Any such adjustments are included in “Acquisition, severance and transition costs” in the Consolidated Statements of Operations. See Note 10.
Contingencies
In accordance with Accounting Standards Codification (“ASC”) 450, Contingencies (“ASC 450”), we recognize a loss and record an undiscounted liability when litigation has commenced or a claim or assessment has been asserted or, based on available information, commencement of litigation or assertion of a claim or assessment is probable, and the associated costs can be reasonably estimated.
Revenue Recognition
We recognize revenue from our product sales upon shipment or delivery to customers in accordance with the respective contractual arrangements, provided no significant obligations remain and collection is probable. For sales that include customer acceptance terms, revenue is recorded after customer acceptance at the applicable location. It is our policy that all sales are final. Requests for returns are reviewed on a case by case basis. As revenue is recorded, we accrue an estimated amount for product returns as a reduction of revenue.
37
Table of Contents
We recognize revenue from fixed-price and modified fixed-price contracts for turnkey energy conservation projects using the percentage-of-completion method of accounting. The percentage-of-completion is computed by dividing the actual incurred cost to date by the most recent estimated total cost to complete the project. The computed percentage is applied to the expected revenue for the project to calculate the contract revenue to be recognized in the current period. This method is used because management considers total cost to be the best available measure of progress on these contracts. Contract costs include all direct material and labor costs and indirect costs related to contract performance. Provisions for estimated losses on uncompleted contracts are made in the period in which such losses are determined. Revenues in excess of amounts billed, which management believes will generally be billed within the next twelve months, are recorded in “Unbilled contracts receivable” in the Consolidated Balance Sheets.
See “Recent accounting pronouncements” below for a discussion of revenue recognition in future periods.
Warranties and product liability
Our products typically carry a warranty that ranges from one to ten years and includes replacement of defective parts. A warranty reserve is recorded for the estimated costs associated with warranty expense related to recorded sales, which is included within accrued liabilities. We recorded warranty expense of $0.2 million for each of the years ended December 31, 2017, 2016 and 2015, which was included in “Selling, general and administrative” in the Consolidated Statements of Operations. At both December 31, 2017 and 2016, we had recorded a warranty and product liability of $0.4 million in the Consolidated Balance Sheets.
Sales Tax Revenue
We record sales tax revenue on a gross basis (included in both “Revenues” and “Cost of sales” in the Consolidated Statements of Operations). For the years ended December 31, 2017, 2016 and 2015, revenues from sales taxes were $4.1 million, $5.2 million and $4.5 million, respectively.
Shipping and Handling
Shipping and handling costs related to the acquisition of goods from vendors are included in cost of sales.
Research and Development
Research and development costs to develop new products, which consist of salaries, contractor fees, building cost, utilities, administrative expenses and allocations of corporate costs, are charged to expense as incurred.
Advertising Expense
Advertising costs, included in “Other selling, general and administrative” on the Consolidated Statements of Operations are expensed when the advertising first takes place. We promote our product lines through print media and trade shows, including trade publications and promotional brochures. Advertising expense was $0.3 million, $0.2 million and $0.3 million for the years ended December 31, 2017, 2016 and 2015, respectively.
Income taxes
Income taxes are provided for the tax effects of transactions reported in the financial statements and consist of taxes currently due plus deferred taxes resulting from temporary differences. Such temporary differences result from differences in the carrying value of assets and liabilities for tax and financial reporting purposes. The deferred tax assets and liabilities represent the future tax consequences of those differences, which will either be taxable or deductible when the assets and liabilities are recovered or settled. Valuation allowances are established when necessary to reduce deferred tax assets to the amount expected to be realized.
We applied the provisions of ASC 740, Income Taxes (“ASC 740”), and have not recognized a liability pursuant to that standard. In addition, a reconciliation of the beginning and ending amount of unrecognized tax benefits has not been provided since there are no unrecognized benefits since the date of adoption. If there were an unrecognized tax benefit, we would recognize interest accrued related to unrecognized tax benefits in interest expense and penalties in operating expenses.
We evaluate the adequacy of the valuation allowance quarterly and, if our assessment of whether it is more likely than not that the related tax benefits will be realized changes, the valuation allowance will be increased or reduced with a corresponding benefit or charge included in income.
In December 2017, the U.S., enacted the Tax Cuts and Jobs Act (“TCJA”), which made significant changes to U.S. federal income tax law. Shortly after enactment of the TCJA, the United States Securities and Exchange Commission’s (the “SEC”) staff issued Staff Accounting Bulletin No. 118 (“SAB 118”), which provides guidance on accounting for the impact of the TCJA. Under SAB 118, an entity would use a similar approach as the measurement period provided in the Business Combinations Topic of the ASC. An entity will recognize those matters for which the accounting can be completed. For matters that have not been completed, the entity would either (1) recognize provisional amounts to the extent that they are reasonably estimable and adjust them over time as more information becomes available or (2) for any specific income tax effects of the TCJA for which a reasonable estimate cannot be determined, continue to apply the Income Taxes Topic of the ASC on the basis of the provisions of the tax laws that were in effect immediately before the TCJA was signed into law. We have prepared our consolidated financial statements for the fiscal year ended December 31, 2017 in accordance with the Income Taxes Topic of the ASC as allowed by SAB 118. See Note 13.
Loss per Share
Basic loss per share is computed by dividing net loss attributable to common stockholders by the weighted average common shares outstanding for the period. Diluted loss per share is computed giving effect to all potentially dilutive common shares. Potentially
38
Table of Contents
dilutive common shares consist of incremental shares issuable upon the exercise of stock options and vesting of restricted shares and the conversion of outstanding convertible securities. In periods in which a net loss has been incurred, all potentially dilutive common shares are considered anti-dilutive and thus are excluded from the calculation. See Note 14.
Stock-Based Compensation
Restricted Stock and Restricted Stock Unit Awards (Equity) – The fair value of equity instruments is measured based on the share price on the grant date, and is recognized using the straight-line method over the vesting period. These awards contain service conditions. If the conditions are not met, no compensation cost is recognized and any previously recognized compensation cost is reversed. See Note 15.
Restricted Stock Awards (Liability) - From time to time, we enter into arrangements with non-employee service providers pursuant to which we issues restricted stock vesting over specified periods for time-based services. These arrangements are accounted for under the provisions of ASC 505 “Equity-Based Payments to Non-Employees” (“ASC 505”). In accordance with ASC 505, the restricted stock is valued at the quoted price at the date of vesting. Liability awards are re-measured to fair value based on quoted market prices at the end of each reporting period. See Note 15.
Option Awards – The Black-Scholes option pricing model is utilized to measure the fair value of options on the grant date. We estimate the volatility of our common stock at the date of grant based on its historical volatility. We determine the expected life based on historical experience with similar awards, giving consideration to the contractual terms, vesting schedules and post-vesting forfeitures. For shares that vest contingent upon achievement of certain performance criteria, an estimate of the probability of achievement is applied in the estimate of fair value. If the conditions are not met, no compensation cost is recognized and any previously recognized compensation cost is reversed. We base the risk-free interest rate on the implied yield currently available on U.S. Treasury issues with an equivalent remaining term approximately equal to the expected life of the award. See Note 15.
Business Acquisitions
Business acquisitions are accounted for using the acquisition method of accounting, which requires recording assets acquired and liabilities assumed at fair value of the acquisition date. Under the acquisition method of accounting, each tangible and separately identifiable intangible asset acquired and liability assumed is recorded based on their preliminary estimated fair values on the acquisition date. Acquisition related costs are expensed as incurred, and are included in “Acquisition, severance and transition costs” in the Consolidated Statements of Operations. See Note 19.
Recent accounting pronouncements not yet adopted
In May 2014, the Financial Accounting Standards Board (the “FASB”) issued ASU 2014-09, “Revenue from Contracts with Customers.” ASU 2014-09, along with the related updates (“ASC 606”), will replace all current GAAP guidance on this topic and eliminate all industry-specific guidance. ASC 606 provides a unified model to determine how revenue is recognized. The core principle of ASC 606 is that an entity should recognize revenue to depict the transfer of promised goods or services to customers in an amount that reflects the consideration to which the entity expects to be entitled in exchange for those goods or services. In doing so, companies will need to use more judgment and make more estimates than under prior guidance. Judgments may include identifying performance obligations in the contract, estimating the amount of variable consideration to include in the transaction price, and allocating the transaction price to each performance obligation. ASC 606 allows companies to elect either full retrospective or modified retrospective approach to adoption. We will adopt ASC 606 on its effective date, January 1, 2018, using the modified retrospective approach.
We have identified that the main types of contracts that require evaluation as to what, if any, changes will be necessary under ASC 606 as compared to legacy accounting guidance are (a) product sales that are shipped to customers from either our warehouses or directly from our vendors and (b) contracts that involve a combination of product and installation services.
We have evaluated the provisions of ASC 606 against our existing accounting policies and practices, including reviewing standard purchase orders, invoices, shipping terms, and agreements with customers to determine the impact, if any, on the timing, measurement and presentation of revenue recognition and the cost of sales. The review considered, among other matters, the evaluation and identification of distinct performance obligations and the measurement of our progress toward satisfying identified performance obligations. We determined that the adoption of ASC 606 will not impact the timing of our billings to customers or the receipt of customer payments.
Under ASC 606, incremental contract costs, which includes sales commissions, are required to be capitalized as contract assets and amortized over the period these costs are expected to be recovered. Although we incur such costs, our contracts are typically completed within one year. As such, we have elected the practical expedient provided in ASC 606 and expense incremental contract costs when incurred.
39
Table of Contents
We have evaluated this standard and determined that the adoption of ASC 606 will not have a material effect on our financial statements. We have evaluated our processes and controls necessary for implementing this standard, including the increased disclosure requirements.
In February 2016, the FASB issued ASU 2016-02, “Leases,” which requires lessees to recognize a right-of-use asset and a lease liability for virtually all of their leases. The standard is effective for fiscal years and interim periods within those fiscal years beginning after December 15, 2018. The adoption of this standard is not expected to have a material effect on our results of operations.
In August 2016, the FASB issued ASU 2016-15, “Statement of Cash Flows: Classification of Certain Cash Receipts and Cash Payments,” which provides guidance on eight specific cash flow issues. The provisions of this standard are effective for periods beginning after December 15, 2017. The adoption of this standard is not expected to have a material effect on our financial statements.
In January 2017, the FASB issued ASU 2017-01, “Business Combinations: Clarifying the Definition of a Business,” which assists entities with evaluating whether transactions should be accounted for as acquisitions of assets or businesses. The provisions of this standard are effective for periods beginning after December 15, 2017. The adoption of this standard is not expected to have a material impact on our financial statements.
In May 2017, the FASB issued ASU 2017-09, “Compensation—Stock Compensation: Scope of Modification Accounting” which provides guidance about which changes to the terms or conditions of a share-based payment award would require an entity to apply modification accounting. The provisions of this standard are effective for periods beginning after December 15, 2017. The adoption of this standard is not expected to have a material impact on our financial statements.
Recently adopted accounting pronouncements
In July 2015, the FASB issued ASU 2015-11, “Simplifying the Measurement of Inventory”,which require an entity to measure inventory at the lower of cost and net realizable value. The standard was effective for fiscal years beginning after December 15, 2016. The adoption of this standard did not have a material effect on our financial statements.
In March 2016, the FASB issued ASU 2016-09, “Compensation – Stock Compensation,” which is intended to simplify the accounting for share-based payment awards, including accounting for the income tax consequences, the classification of awards as either equity or liabilities and the classification on the statement of cash flows. The standard was effective for fiscal years beginning after December 15, 2016. The adoption of this standard did not have a material effect on our financial statements.
In January 2017, the FASB issued ASU 2017-04, which simplifies the subsequent measure of goodwill by eliminating the second step from the goodwill impairment test. The provisions of this standard are effective for periods beginning after December 15, 2019. We elected to early adopt ASU 2017-04 in order to simplify the test for goodwill impairment and, as such, the requirement to perform step 2 in the impairment test was not required. The result of the impairment test indicated that goodwill was impaired by $10.7 million. See Note 6.
| 3. | Accounts Receivable, Net of Allowance for Doubtful Accounts |
Accounts receivable, net of allowance for doubtful accounts, consisted of the following:
| Year Ended December 31, | ||||||||||||
| 2017(1) | 2016 | 2016 | ||||||||||
| Trade receivables |
$ | 35.5 | $ | 54.7 | $ | 42.1 | ||||||
| Allowance for doubtful accounts |
(0.5 | ) | (1.4 | ) | (1.0 | ) | ||||||
|
|
|
|
|
|
|
|||||||
| Accounts receivable, net of allowance for doubtful accounts |
$ | 35.0 | $ | 53.3 | $ | 41.1 | ||||||
|
|
|
|
|
|
|
|||||||
| (1) | Excludes adjustments related to restructuring acitivity. See Note 20. |
Bad debt expense, which was recorded in “Other selling, general and administrative” in the Consolidated Statements of Operations, was $0.5 million, $1.5 million and $1.3 million for the years ended December 31, 2017, 2016 and 2015, respectively.
40
Table of Contents
| 4. | Inventories, Net |
Inventories, which are primarily purchased from third parties, consisted of the following:
| December 31, | ||||||||
| 2017(1) | 2016 | |||||||
| Raw materials |
$ | 0.3 | $ | 2.4 | ||||
| Finished goods |
27.1 | 26.1 | ||||||
|
|
|
|
|
|||||
| Total |
27.4 | 28.5 | ||||||
| Less: Provision for obsolescence |
(1.2 | ) | (1.8 | ) | ||||
|
|
|
|
|
|||||
| Inventories, net |
$ | 26.2 | $ | 26.7 | ||||
|
|
|
|
|
|||||
| (1) | Excludes adjustments related to restructuring activity. See Note 20. |
Activity related to inventory reserves was as follows:
| Year Ended December 31, | ||||||||||||
| 2017(1) | 2016 | 2015 | ||||||||||
| Inventory reserve, January 1 |
$ | (1.8 | ) | $ | (2.0 | ) | $ | (1.7 | ) | |||
| Additions |
— | (0.1 | ) | (1.1 | ) | |||||||
| Write-offs |
0.6 | 0.3 | 0.8 | |||||||||
|
|
|
|
|
|
|
|||||||
| Inventory reserve, December 31 |
$ | (1.2 | ) | $ | (1.8 | ) | $ | (2.0 | ) | |||
|
|
|
|
|
|
|
|||||||
| (1) | Excludes adjustments related to restructuring activity. See Note 20. |
| 5. | Property and Equipment |
Property and equipment, net of accumulated depreciation, consisted of the following:
| December 31, | ||||||||
| 2017 | 2016 | |||||||
| Total property and equipment |
$ | 3.0 | $ | 3.2 | ||||
| Less accumulated depreciation |
(1.4 | ) | (1.7 | ) | ||||
|
|
|
|
|
|||||
| Property and equipment, net |
$ | 1.6 | $ | 1.5 | ||||
|
|
|
|
|
|||||
Depreciation expense related to property and equipment, which was recorded in “Amortization and depreciation” in the Consolidated Statements of Operations, was $0.6 million, $0.4 million and $0.5 million for the years ended December 31, 2017, 2016 and 2015, respectively.
| 6. | Goodwill |
Changes in the carrying amount of goodwill were as follows:
| Year Ended December 31, | ||||||||
| 2017 | 2016 | |||||||
| Goodwill, January 1 |
$ | 72.1 | $ | 64.3 | ||||
| Acquisitions (1) |
0.1 | 7.8 | ||||||
| Impairments |
(10.7 | ) | — | |||||
|
|
|
|
|
|||||
| Goodwill, December 31 |
$ | 61.5 | $ | 72.1 | ||||
|
|
|
|
|
|||||
| (1) | Reflects the effects of the TNT acquisition. See Note 19. |
During the fourth quarter of 2017, we experienced poor performance of our common stock, which led management to believe that a triggering event occurred. As such, an updated goodwill impairment test was performed. The result of the impairment test indicated that the carrying value of goodwill was above the implied fair value.
For the purposes of the goodwill impairment test, we estimated the fair value of our sole reporting unit using the market approach. Under the market approach, we utilized the market capitalization of our common stock, and applied an estimated control premium
41
Table of Contents
based on an analysis of control premiums paid in acquisitions of companies in the same or similar industries. Because the significant inputs used in this analysis are readily available from public markets or can be derived from observable market transactions, they have been classified as level 2 in the fair value hierarchy. Based on this approach, we determined that the carrying value of our sole reporting unit exceeded the fair value by $10.7 million, which was recorded in “Impairment of goodwill” in the Consolidated Statement of Operations for the year ended December 31, 2017.
| 7. | Intangible Assets |
Intangible assets consisted of the following:
| December 31, 2017 | December 31, 2016 | |||||||||||||||||||||||
| Gross Cost |
Accumulated Amortization |
Net Carrying Amount |
Gross Cost |
Accumulated Amortization |
Net Carrying Amount |
|||||||||||||||||||
| Customer relationships and product supply agreements |
$ | 24.6 | $ | (6.6 | ) | $ | 18.0 | $ | 35.0 | $ | (7.9 | ) | $ | 27.1 | ||||||||||
| Trademarks/Trade Names |
12.2 | (2.3 | ) | 9.9 | 17.6 | (3.4 | ) | 14.2 | ||||||||||||||||
| Other |
1.3 | (0.8 | ) | 0.5 | 7.3 | (4.8 | ) | 2.5 | ||||||||||||||||
|
|
|
|
|
|
|
|
|
|
|
|
|
|||||||||||||
| Intangible assets |
$ | 38.1 | $ | (9.7 | ) | $ | 28.4 | $ | 59.9 | $ | (16.1 | ) | $ | 43.8 | ||||||||||
|
|
|
|
|
|
|
|
|
|
|
|
|
|||||||||||||
As a result of changes to our business, we evaluated the recoverability of the carrying value of long-lived assets. The result of such evaluation indicated that net intangible assets of $10.5 million (gross assets of $18.9 million and related accumulated amortization of $8.4 million) were impaired, and we recognized an impairment charge of such amount for the year ended December 31, 2017 in the Consolidated Statements of Operations. Such impairment relates primarily to the consolidation of certain operations and the discontinuation of underperforming product lines.
Amortization expense related to intangible assets, which was recorded in “Amortization and depreciation” in the Consolidated Statements of Operations, was $5.5 million, $5.2 million and $4.0 million for the years ended December 31, 2017, 2016 and 2015, respectively. Estimated future amortization expense related to intangible assets is $3.4 million for 2018, $2.8 million for 2019, $2.6 million for 2020, $2.5 million for 2021, $2.5 million for 2022, and $14.6 million thereafter.
| 8. | Accrued and Other Current Liabilities |
Accrued and other current liabilities consisted of the following:
| December 31, | ||||||||
| 2017 | 2016 | |||||||
| Compensation, benefits and commissions |
$ | 3.7 | $ | 4.4 | ||||
| Accrued restructuring costs (1) |
1.8 | — | ||||||
| Accruals and other current liabilities |
6.1 | 6.1 | ||||||
|
|
|
|
|
|||||
| Accrued and other current liabilities |
$ | 11.6 | $ | 10.5 | ||||
|
|
|
|
|
|||||
| (1) | See Note 20 for additional information regarding restructuring activities. |
| 9. | Financings |
Revolving Credit Facility
On January 26, 2017, we amended the loan and security agreement with Bank of America to borrow up to $50.0 million on a revolving basis, based upon specified percentages of eligible receivables and inventory, which matures on January 26, 2020 (the “Revolving Credit Facility”). Under the Revolving Credit Facility, the maximum applicable margin for LIBOR rate loans is 2.75%, and the maximum applicable margin for base rate loans is 1.75%. As of December 31, 2017, our Chairman, Chief Executive Officer and President had guaranteed $10.0 million of the borrowings under the Revolving Credit Facility (see Note 17). At December 31, 2017 and 2016, the balance outstanding on the Revolving Credit Facility was $38.6 million and $26.0 million, respectively.
Borrowings under the Revolving Credit Facility bear interest at a LIBOR rate or a defined base rate, each plus an applicable margin, depending on the nature of the loan. We are also obligated to pay various fees monthly. At December 31, 2017 and 2016, the weighted average interest rate was 4.59% and 3.95%, respectively. We recorded interest expense of $1.8 million, $0.9 million and $0.7 million for the years ended December 31, 2017, 2016 and 2015, respectively.
42
Table of Contents
Under the Revolving Credit Facility, outstanding loans become payable on demand to the extent that such loans exceed the defined Borrowing Base. All obligations under the Revolving Credit Facility are secured by the assets of Revolution, and are guaranteed by Revolution. The Revolving Credit Facility contains covenants that limit our ability to incur other debt, allow a lien on any property, pay dividends, restrict any wholly owned subsidiary from paying dividends, make investments, dispose of property, make loans or advances or enter into transactions with affiliates, among other things. As of December 31, 2017, we were in compliance with our covenants.
In connection with obtaining the Revolving Credit Facility, we incurred debt issuance costs, which are being amortized through the maturity date. At December 31, 2017 and 2016, we had $0.6 million and $0.2 million, respectively, of deferred debt issuance costs, which are recorded in “Other assets, net” in the Consolidated Balance Sheets.” Amortization expense of deferred debt issuance costs was $0.3 million, $0.2 million and $0.2 million for the years ended December 31, 2017, 2016 and 2015, respectively.
Notes Payable
Notes payable consisted of the following:
| December 31, | ||||||||
| 2017 | 2016 | |||||||
| Value Lighting acquisition note |
$ | 2.1 | $ | 2.4 | ||||
| TNT acquisition notes |
— | 2.0 | ||||||
| Energy Source acquisition notes |
— | 10.0 | ||||||
|
|
|
|
|
|||||
| Total notes payable |
$ | 2.1 | $ | 14.4 | ||||
| Less: Notes payable - current |
(1.8 | ) | (2.4 | ) | ||||
|
|
|
|
|
|||||
| Notes payable - noncurrent |
$ | 0.3 | $ | 12.0 | ||||
|
|
|
|
|
|||||
Value Lighting Acquisition Note
In conjunction with the acquisition of Value Lighting, we refinanced $3.7 million of Value Lighting’s trade accounts payable by issuing a note payable to the creditor. The note is payable in monthly installments through October 2019 and a lump sum payment of $1.4 million due on November 22, 2018, which may be settled, at our option, in either cash or an equivalent amount of common shares based upon their then-current market value.
TNT Acquisition Notes
In connection with the acquisition of TNT in May 2016, we issued $2.0 million in promissory notes bearing interest at 5% per annum, of which $1.0 million was due on April 21, 2017 and $1.0 million was due on November 6, 2017. In February 2017, the maturity date was extended to November 6, 2017 for all of the TNT promissory notes. On November 16, 2017, we repaid the TNT acquisition notes, including interest of $0.2 million. We recorded interest expense of less than $0.1 million for both the years ended December 31, 2017 and 2016.
Energy Source Acquisition Notes
In connection with the acquisition of Energy Source in August 2015, we issued $10.0 million in promissory notes bearing interest at 5% per annum due July 20, 2016, which were supported by an irrevocable letter of credit from RVL. In July 2016, the maturity date was extended to January 20, 2017, with an interest rate of 7%. On January 26, 2017, we repaid the Energy Source acquisition notes, including interest of $0.4 million, using proceeds from the amended Revolving Credit Facility, and the related guarantee provided by RVL was terminated. We recorded interest expense of less than $0.1 million, $0.6 million and $0.2 million during the years ended December 31, 2017, 2016 and 2015, respectively.
43
Table of Contents
Debt Maturities
At December 31, 2017, the scheduled maturities of our borrowings were as follows:
| Total | ||||
| Notes Payable | ||||
| 2018 |
$ | 1.8 | ||
| 2019 |
0.3 | |||
| 2020 |
38.6 | |||
|
|
|
|||
| Total borrowings |
$ | 40.7 | ||
|
|
|
|||
| 10. | Purchase Price Obligations |
In connection with prior acquisitions, we were obligated to issue contingent consideration. At December 31, 2017, the remaining obligation relates to the acquisition of Energy Source, which will be settled in shares of common stock during the first quarter of 2018. Changes in the fair value of purchase price obligations during the year ended December 31, 2017 were as follows:
| December 31, | ||||||||
| 2017 | 2016 | |||||||
| Fair value, January 1 |
$ | 3.0 | $ | 8.8 | ||||
| Fair value of acquisition liabilities paid (1) |
(1.5 | ) | (7.6 | ) | ||||
| Fair value of consideration issued |
— | 4.1 | ||||||
| Change in fair value (2) |
(1.4 | ) | (2.3 | ) | ||||
|
|
|
|
|
|||||
| Fair value, December 31 |
$ | 0.1 | $ | 3.0 | ||||
|
|
|
|
|
|||||
| (1) | Acquisition liabilities settled in common stock totaled $1.2 million and $6.6 million during 2017 and 2016, respectively. |
| (2) | Change in fair value includes a reduction due to a change in assumptions utilized in the calculation of purchase price obligations and not meeting applicable thresholds, which were recorded in “Acquisition, severance and transition costs” on the Consolidated Statements of Operations. |
| 11. | Commitments and Contingencies |
Leases – We lease office, warehouse and manufacturing facilities throughout the United States. Generally, the lease agreements require us to pay the operating expenses of the properties, in some cases including property taxes. The majority of our leases include renewal options at existing or current market rates. Rent expense related to operating leases was $3.2 million, $2.3 million and $2.0 million during the years ended December 31, 2017, 2016 and 2015, respectively.
The future minimum payment obligations as of December 31, 2017 for operating leases are as follows:
| Minimum Lease Payments |
||||
| 2018 |
$ | 3.7 | ||
| 2019 |
3.5 | |||
| 2020 |
2.6 | |||
| 2021 |
1.8 | |||
| 2022 |
1.1 | |||
| Thereafter |
0.8 | |||
|
|
|
|||
| Total future payment obligations |
$ | 13.5 | ||
|
|
|
|||
Other Matters – In the ordinary course of business, we may become a party to various legal proceedings generally involving contractual matters, infringement actions, product liability claims and other matters. Based upon such evaluation, at December 31, 2017, we were not party to any pending legal or administrative proceedings that may have a material adverse effect, either individually or in the aggregate, on our business, financial condition or results of operations. We may be required to make payments under a certain channel distribution agreement if certain revenue targets are achieved. The maximum amount of such payments is $0.5 million, which has been accrued as of December 31, 2017.
44
Table of Contents
| 12. | Stockholders’ Equity |
Common Stock
On March 10, 2016, we filed a certificate of amendment to our Amended and Restated Certificate of Incorporation, as amended, to effect the Split, that became effective for trading purposes on March 11, 2016. The number of authorized shares and the par value of our common stock remained unchanged following the Split. All share amounts in these financial statements have been restated to give effect to the Split, as applicable.
The changes in issued and outstanding common stock during the years ended December 31, 2016, 2015 and 2014 were as follows:
| Shares | ||||
| Balance at January 1, 2015 |
12,971,438 | |||
| Shares issued for stock-based compensation |
142,556 | |||
| Shares issued in private placement offering (1) |
869,600 | |||
| Shares issued for contingent consideration and acquisition |
1,980,909 | |||
|
|
|
|||
| Balance at December 31, 2015 |
15,964,503 | |||
| Shares issued for stock-based compensation |
310,959 | |||
| Shares issued for contingent consideration and acquisition |
1,254,137 | |||
| Shares issued in public offering (2) |
3,191,250 | |||
| Shares issued in private placement offering (3) |
172,413 | |||
|
|
|
|||
| Balance at December 31, 2016 |
20,893,262 | |||
| Shares issued for stock-based compensation |
226,922 | |||
| Shares issued for contingent consideration and acquisition |
232,199 | |||
|
|
|
|||
| Balance at December 31, 2017 |
21,352,383 | |||
|
|
|
|||
| (1) | Shares sold in a private placement to one of our distributors. Net proceeds were used for general corporate purposes. |
| (2) | Underwritten public offering of our common stock at an offering price of $5.25 per share. Net proceeds of the offering were $15.2 million, which were used to fund the cash portion of the TNT acquisition, pay down bank debt, and for general corporate purposes. |
| (3) | Shares sold for $1.0 million in a private placement to one of our distributors. Net proceeds were used for general corporate purposes. |
At December 31, 2017, 8,670,386 shares, or 41% of our outstanding shares, were owned by RVL and its affiliates. During the first quarter of 2018, RVL and its affiliates purchased an additional 1,000,000 shares of common stock for $3.6 million. After such purchases, 9,670,386, or 43% of our outstanding shares were owned by RVL and its affiliates.
Preferred Stock
We are authorized to issue up to 5,000,000 shares of preferred stock. There were no shares of preferred stock outstanding at December 31, 2017, 2016 and 2015.
| 13. | Income Taxes |
New Tax Legislation
On December 22, 2017, the President of the United States signed into law the TCJA. This legislation makes broad and complex changes to the U.S. tax code, including, but not limited to, (i) reducing the U.S. federal statutory tax rate from 35% to 21%; (ii) eliminating the corporate alternative minimum tax (AMT) and changing how existing AMT credits can be realized; (iii) modifying the officer’s compensation limitation, and (iv) changing rules related to uses and limitations of net operating loss carryforwards created in tax years beginning after December 31, 2017. Specifically, the TCJA limits the amount the Company is able to deduct for net operating loss carryforwards generated in taxable years beginning after December 31, 2017 to 80% of taxable income however these net operating loss carryforwards can be carried forward indefinitely.
We recognize the effects of changes in tax law, including the TCJA, in the period the law is enacted. Accordingly, the effects of the TCJA have been recognized in the financial statements for the year ended December 31, 2017. Under the Act, our $20.6 million in federal net operating loss carryforwards generated as of December 31, 2017 will continue to be carried forward for 20 years and are expected to be available to fully offset taxable income earned in future tax years. In the quarter ending December 31, 2017, we revalued our deferred tax assets and liabilities due to these changes, including (a) revaluing our federal net deferred tax assets before valuation allowance using the 21% tax rate, resulting in a federal deferred tax provision of $8.8 million; (b) revaluing our federal valuation allowance using the 21% tax rate, including the impact of tax planning strategies, resulting in a federal deferred tax benefit to continuing operations of $(9.2) million; (c) recognizing a federal deferred tax benefit of $(0.7) million for 80% of indefinite lived deferred tax liabilities, which are anticipated to be available as a source of taxable income upon reversal of deferred tax assets that would also have indefinite lives; and (d) recognizing $0.2 million deferred tax benefit due to refundable AMT credits.
At December 31, 2017, we have not completed our accounting for the tax effects of the enactment of the TCJA; however in certain cases we have made a reasonable estimate of the effects of the TCJA.
45
Table of Contents
Our preliminary estimate of the effects TCJA, including the remeasurement of deferred tax assets and liabilities and the recognition of an income tax benefit related to AMT tax credit carryforwards, is subject to the finalization of management’s analysis related to certain matters, such as developing interpretations of the provisions of the TCJA and the filing of our tax returns. U.S. Treasury regulations, administrative interpretations or court decisions interpreting the TCJA may require further adjustments and changes in our estimates. The final determination of the effects of the TCJA will be completed as additional information becomes available, but no later than one year from the enactment of the TCJA. In all cases, we will continue to make and refine our calculations as additional analysis is completed. In addition, our estimates may also be affected as we gain a more thorough understanding of the tax law.
Income Taxes
As of December 31, 2017 and December 31, 2016, we reported net operating loss carry forwards for federal income tax purposes of $49.9 million and $21.0 million, respectively, which expire between 2021 and 2037. As of December 31, 2017, we reported net operating loss carry forwards for state income tax purposes of $36.3 million which expire between 2021 and 2037. Utilization of net operating loss carryforwards is dependent on generating future taxable income of the appropriate type and in the appropriate jurisdiction. In addition, as a result of transactions consummated during 2012 and 2013, including the issuance of common and preferred stock and the acquisitions of Seesmart and Relume, substantially all of our net operating loss carryforwards since December 31, 2013 are subject to limitations imposed by Section 382 of the Internal Revenue Code. During 2013, we performed an evaluation of the Section 382 limitations on the use of net operating loss carryforwards and adjusted them accordingly. We have recognized a full valuation allowance related to our remaining net deferred tax assets, including the remaining net operating loss carryforwards.
In connection with prior asset acquisitions, including the acquisition of Energy Source, LLC and TNT Energy, LLC, we have recorded a deferred tax liability related to indefinite lived intangibles. In connection with the 2017 tax reform, we released valuation allowance equal to the effect of the deferred tax assets that will create indefinite lived net operating losses and will be available to offset the
indefinite lived deferred tax liability. We also released valuation allowance against AMT credits as they have been refundable under the new tax law.
Components of deferred tax assets (liabilities) are as follows:
| December 31, | ||||||||
| 2017 | 2016 | |||||||
| Accounts receivable |
$ | 2.1 | $ | 0.5 | ||||
| Inventories |
0.6 | 1.0 | ||||||
| Stock options |
1.9 | 2.2 | ||||||
| Accrued liabilities |
1.0 | 2.3 | ||||||
| Other |
0.2 | — | ||||||
| Net operating loss carryforwards |
16.4 | 9.8 | ||||||
|
|
|
|
|
|||||
| Total deferred tax assets |
22.2 | 15.8 | ||||||
|
|
|
|
|
|||||
| Depreciation |
(0.2 | ) | (0.2 | ) | ||||
| Intangible assets |
(3.1 | ) | (9.0 | ) | ||||
|
|
|
|
|
|||||
| Total deferred tax liabilities |
(3.3 | ) | (9.2 | ) | ||||
|
|
|
|
|
|||||
| Valuation allowance |
(18.9 | ) | (6.6 | ) | ||||
|
|
|
|
|
|||||
| Net deferred tax liability |
$ | — | $ | — | ||||
|
|
|
|
|
|||||
In accordance with ASC 740, valuation allowances are provided against deferred tax assets if, based on the weight of available evidence, it is more likely than not that some or all of the deferred tax assets will not be realized.
For the year ended December 31, 2017, we recorded a provision for income taxes related to the deferred tax liabilities that was netted against deferred tax assets. For the year ended December 31, 2016, we recorded a provision of $0.1 million, respectively, related to AMT taxes as the deferred tax benefits of the net losses were offset by a corresponding increase in the deferred tax valuation allowance.
46
Table of Contents
The following is a reconciliation of tax computed at the statutory federal rate to the income tax expense in the statements of operations for the years ended December 31, 2017, 2016, and 2015:
| December 31, | ||||||||||||||||||||||||
| 2017 | 2016 | 2015 | ||||||||||||||||||||||
| Amount | % | Amount | % | Amount | % | |||||||||||||||||||
| Tax benefit at statutory federal rate |
$ | (18.1 | ) | (34.0 | ) | $ | (0.3 | ) | (34.0 | ) | $ | (0.8 | ) | (34.0 | ) | |||||||||
| Change in valuation allowance |
7.5 | 14.1 | 1.5 | 178.8 | 0.4 | 16.2 | ||||||||||||||||||
| Change in income tax rate to 21% |
8.8 | 16.6 | — | — | — | — | ||||||||||||||||||
| Non-deductible expenses |
2.3 | 4.3 | 0.5 | 57.0 | 1.1 | 45.0 | ||||||||||||||||||
| Adjustment to net operating loss carryforwards |
— | — | — | — | (0.5 | ) | (21.1 | ) | ||||||||||||||||
| Other adjustments |
(0.5 | ) | (0.2 | ) | (1.7 | ) | (201.8 | ) | (0.2 | ) | (6.1 | ) | ||||||||||||
|
|
|
|
|
|
|
|
|
|
|
|
|
|||||||||||||
| Income tax benefit |
$ | — | 0.8 | $ | — | — | $ | — | — | |||||||||||||||
|
|
|
|
|
|
|
|
|
|
|
|
|
|||||||||||||
| 14. | Loss per Share |
The computation of basic and diluted net loss per share for the periods indicated is as follows:
| Year Ended December 31, | ||||||||||||
| 2017 | 2016 | 2016 | ||||||||||
| Numerator: |
||||||||||||
| Net loss |
$ | (53.9 | ) | $ | (0.5 | ) | $ | (2.4 | ) | |||
|
|
|
|
|
|
|
|||||||
| Denominator: |
||||||||||||
| Weighted-average common shares (in thousands) - diluted |
20,847 | 19,034 | 14,930 | |||||||||
|
|
|
|
|
|
|
|||||||
| Basic and Diluted net loss per share |
$ | (2.59 | ) | $ | (0.03 | ) | $ | (0.16 | ) | |||
|
|
|
|
|
|
|
|||||||
At December 31, 2017, 2016 and 2015, we were contingently obligated to pay $0.1 million, $0.8 million and $0.5 million, which may be settled, at our option, in either cash or an equivalent amount of common shares based upon their then-current market value, if certain performance criteria had been met. The equivalent amount of common shares have been excluded from the computation of diluted net loss per share for the years ended December 31, 2017, 2016 and 2015, as they were antidilutive.
Included in the computation of basic net loss per share for the years ended December 31, 2016 and 2015 were 53,335 and 292,967 potentially dilutive shares, respectively, representing $0.6 million and $6.5 million, respectively, of the total contingent obligation related to shares we unconditionally agreed to issue.
At December 31, 2017, 2016 and 2015, 24,875, 27,828 and 31,483 outstanding options, respectively, with an average exercise price of $44.45, $44.76 and $43.64, respectively, were not recognized in the diluted earnings per share calculation as they were antidilutive.
| 15. | Stock-Based Compensation |
The 2003 Plan
On September 18, 2003, we adopted a stock option plan (the “2003 Plan”) that provided for the grant of incentive stock options and nonqualified stock options. The option price of incentive stock options were required to be at least 100% of market value at the date of the grant. Incentive stock options had a maximum term of 10 years. Options granted typically vested ratably over a three-year period or were based on achievement of performance criteria. We granted selected executives and other key employees share option awards, whose vesting was contingent upon meeting various departmental and company-wide performance goals including meeting sales targets and net profit targets. In March 2009, we amended the 2003 Plan to extend the post-service termination exercise period of non-statutory stock options granted to directors for their service as directors from three months after the director’s termination date to the tenth anniversary of the date of grant. The 2003 Plan does not contain any provisions which would trigger automatic vesting upon a change in control. The Board has determined that no further awards will be made pursuant to the 2003 Plan.
47
Table of Contents
The following table presents a summary of activity for the year ended December 31, 2017:
| Number of Options |
Weighted Average Exercise Price |
Weighted Average Contractual Life |
||||||||||
| Outstanding, January 1, 2017 |
27,828 | $ | 44.76 | 3.01 | ||||||||
| Expired |
(2,953 | ) | 47.40 | |||||||||
|
|
|
|
|
|
|
|||||||
| Outstanding and expected to vest, December 31, 2017 |
24,875 | $ | 44.45 | 2.57 | ||||||||
|
|
|
|
|
|
|
|||||||
| Exercisable, December 31, 2017 |
24,875 | $ | 44.45 | 2.57 | ||||||||
|
|
|
|
|
|
|
|||||||
During the years ended December 31, 2017 and 2016, no options were issued. We issue new shares upon the exercise of options. Options outstanding at December 31, 2017 had no intrinsic value. At December 31, 2017, unrecognized compensation expense related to options was less than $0.1 million, which is expected to be recognized over a weighted-average period of one year.
The 2013 Plan
Under our 2013 Stock Incentive Plan, as amended (the “2013 Plan”), an aggregate of 1,600,000 shares (which includes an additional 500,000 shares approved by the shareholders on May 2, 2017) of our common stock may be issued to officers, employees, non-employee directors and consultants of Revolution and its affiliates. Awards under the 2013 Plan may be in the form of stock options, which may constitute incentive stock options, or non-qualified stock options, restricted shares, restricted stock units, performance awards, stock bonus awards, share appreciation rights and other stock-based awards. Stock options will be issued at an exercise price not less than 100% of the market value at the date of grant and expire no later than ten years after the date of grant. Stock awards typically vest over three years but vesting periods for non-employees may be longer or based on the achievement of performance goals.
Restricted Shares
The following table presents a summary of activity for the year ended December 31, 2017:
| Number of Shares |
Weighted Average Grant Date Fair Value |
|||||||
| Outstanding, January 1, 2017 |
360,305 | $ | 7.32 | |||||
| Vested |
(136,039 | ) | 8.67 | |||||
| Forfeited |
(767 | ) | 17.24 | |||||
|
|
|
|
|
|||||
| Outstanding and expected to vest, December 31, 2017 |
223,499 | $ | 6.46 | |||||
|
|
|
|
|
|||||
At December 31, 2017, there was $0.2 million of unrecognized compensation expense related to nonvested restricted shares, which is expected to be recognized over a weighted-average period of 1.9 years. During the years ended December 31 2016 and 2015, we granted 327,508 and 110,350 shares, respectively, at a weighted average grant date fair value of $6.25 and $13.30, respectively. The total fair value of restricted shares that vested during the years ended December 31, 2017, 2016 and 2015 was $1.2 million, $1.3 million and $1.5 million, respectively.
Restricted Share Units
During the year ended December 31, 2017, we granted restricted share units to employees which vest ratably over a three-year period. These awards are classified as equity awards, and are accounted for using the fair value established at the grant date.
The following table presents a summary of activity for the year ended December 31, 2017:
| Number of Units |
Weighted Average Grant Date Fair Value |
|||||||
| Outstanding, January 1, 2017 |
132,517 | $ | 6.84 | |||||
| Granted |
351,449 | 7.20 | ||||||
| Vested |
(227,689 | ) | 7.03 | |||||
| Forfeited |
(13,593 | ) | 7.20 | |||||
|
|
|
|
|
|||||
| Outstanding and expected to vest, December 31, 2017 |
242,684 | $ | 7.17 | |||||
|
|
|
|
|
|||||
48
Table of Contents
At December 31, 2017, there was $1.7 million of unrecognized compensation expense related to nonvested restricted share units, which is expected to be recognized over a weighted-average period of 2.7 years. The total fair value of restricted shares that vested during the year ended December 31, 2017 was $1.6 million.
| 16. | Defined Contribution Plan |
We have established a 401(k) plan that permits participants to make contributions by salary reduction, and we match these contributions up to a predefined threshold. During the years ended December 31, 2017, 2016 and 2015, compensation expense associated with our matching contribution was $0.4 million, $0.3 million and $0.2 million, respectively.
| 17. | Related Party Transactions |
Chairman, Chief Executive Officer and President
As of December 31, 2017, our Chairman, Chief Executive Officer, and President has guaranteed $10.0 million of borrowings under our Revolving Credit Facility. See Note 9.
Aston Capital, LLC
On April 1, 2016, we entered into a $2.6 million amended and restated promissory note with Aston Capital, LLC (“Aston”), which bears interest at 9% annually and matures on April 1, 2019, which can be prepaid at our option. In May 2017, we amended the promissory note with Aston to include an additional $9.1 million of borrowings.
In March 2017, Aston provided a $1.5 million advance that bears interest annually at 9%, which is included in “Related party notes payable” in the Consolidated Balance Sheets at December 31, 2017. During 2017, we repaid $0.5 million of the advance. On November 30, 2016, Aston provided a $1.5 million advance that bore interest annually at 9%, which is included in “Related party notes payable” in the Consolidated Balance Sheets at December 31, 2016, and was repaid on January 26, 2017 using proceeds from the amended Revolving Credit Facility.
At December 31, 2017 and 2016, we had accrued interest of $0.1 million and $0.2 million, respectively. During the years ended December 31, 2017, 2016 and 2015, we recorded interest expense related to financing agreements with Aston of $0.8 million, $0.2 million and $0.2 million, respectively.
On January 5, 2017, we ratified a management services agreement with Aston (the “Management Agreement”) to memorialize certain management services that Aston has been providing to us since RVL acquired majority control of our voting securities in September 2012. Pursuant to the Management Agreement, Aston provides consulting services in connection with financing matters, budgeting, strategic planning and business development, including, without limitation, assisting us in (i) analyzing the operations and historical performance of target companies; (ii) analyzing and evaluating the transactions with such target companies; (iii) conducting financial, business and operational due diligence, and (iv) evaluating related structuring and other matters. In addition, two of the Aston members hold executive positions in Revolution, and receive no compensation. On May 12, 2016, we granted 250,000 shares of restricted stock to Aston, which vest in three annual installments on May 12, 2017, 2018, and 2019. The Audit Committee of the Board will consider from time to time (at a minimum at such times when the Compensation Committee of the Board evaluates director compensation) whether additional compensation to Aston is appropriate given the nature of the services provided.
Our corporate headquarters utilizes space in Stamford, Connecticut, which is also occupied by affiliates of our Chairman and Chief Executive Officer. Our proportionate share of the space under the underlying lease, which we paid to Aston, was $0.3 million during each of the years ended December 31, 2017, 2016 and 2015.
18. Segment, Geographic and Concentration Information
Our operations consist of one reportable segment for financial reporting purposes, Lighting Products and Solutions (principally LED fixtures and lamps), for which financial information is available and which is utilized on a regular basis by our Chief Executive Officer, who is our chief operating decision maker (“CODM”), to assess performance.
Revenue by geographic location, based on location of customers, were as follows:
| Year Ended December 31, | ||||||||||||
| 2017 | 2016 | 2015 | ||||||||||
| United States |
$ | 152.2 | $ | 172.0 | $ | 129.3 | ||||||
| Other |
0.1 | 0.1 | 0.4 | |||||||||
|
|
|
|
|
|
|
|||||||
| Revenue |
$ | 152.3 | $ | 172.1 | $ | 129.7 | ||||||
|
|
|
|
|
|
|
|||||||
49
Table of Contents
All long-lived assets were held at locations within the United States. A portion of our LEDs and LED lighting products and systems are manufactured by select contract manufacturers. While we believe alternative manufacturers for the production of these products are available, we have selected these particular manufacturers based on their ability to consistently produce these products per our specifications ensuring the best quality product at the most cost effective price. We depend on these manufacturers to satisfy performance and quality specifications and to dedicate sufficient production capacity for finished products within scheduled delivery times. Accordingly, the loss of one or more of these manufacturers or delays in obtaining shipments could have a material adverse effect on our operations until such time as an alternative manufacturer could be found.
| 19. | Acquisition of TNT Energy, LLC |
In May 2016, we completed the acquisition of TNT, a turnkey provider of LED lighting-based energy savings projects within the commercial, industrial, hospitality, retail, education and municipal sectors. TNT’s headquarters is located in Raynham, Massachusetts. The acquisition of TNT is expected to expand our footprint within key lighting retrofit markets in the United States. We believe this is a direct complementary fit with our division, Energy Source, based in Providence, RI. In addition to its broad existing customer base, TNT is a contract vendor for the Small C&I Business Programs of northeast utility companies, with a defined territory of approximately 120 municipalities throughout Massachusetts. We acquired TNT for its management team, its client base and operational and business development synergies.
We accounted for the acquisition of TNT under ASC 805, Business Combinations (“ASC 805”), which requires recording assets and liabilities at fair value. Under the acquisition method of accounting, each tangible and separately identifiable intangible asset acquired and liabilities assumed were recorded based on their estimated fair values on the date of the acquisition.
| Consideration: |
||||
| Cash paid |
$ | 8.6 | ||
| Promissory note |
2.0 | |||
| Contingent consideration |
4.1 | |||
|
|
|
|||
| Net Assets |
$ | 14.7 | ||
|
|
|
|||
| Fair Value of Assets Acquired and Liabilities Assumed: |
||||
| Working capital, net |
$ | 0.9 | ||
| Goodwill (1) |
7.9 | |||
| Intangible assets |
5.9 | |||
|
|
|
|||
| Net Assets |
$ | 14.7 | ||
|
|
|
| (1) | Since our initial valuation on the date of the acquisition, we recorded a $1.7 million increase to goodwill related to adjustments in working capital, including $0.1 million in the second quarter of 2017. Goodwill is expected to be deductible for income tax purposes. |
| 20. | Restructuring Activities |
In the fourth quarter of 2017, we announced a restructuring plan to further streamline our operations, eliminate redundancies at certain divisions and address certain operational functions. As part of the restructuring, we (i) consolidated the operations of three divisions into one, (ii) consolidated sales, purchasing, bidding and proposal and accounting functions, (iii) expanded and refocused our marketing resources, including changes to key management positions at certain divisions, and (iv) exited certain product lines and related operations, including the eliminations of a number of warehouse locations.
In connection with this restructuring, we abandoned certain assets, including inventory of $9.2 million and certain discontinued customer accounts and other, totaling $15.0 million (net of expected recoveries), of which $9.2 million was recorded as part of “Cost of sales” in the Consolidated Statements of Operations. In addition, we recorded $1.9 million of accrued restructuring costs related to severance, outplacement and other employee costs, lease terminations and other relocation costs.
Restructuring charges have been recorded in accordance with ASC 420-10, “Exit or Disposal Cost Obligations.” We account for one-time termination benefits, contract terminations and/or costs to terminate lease obligations less assumed sublease income in accordance with ASC 420-10, which addresses financial accounting and reporting for costs associated with restructuring activities. Under ASC 420-10, we established a liability for costs associated with an exit or disposal activity, including severance and lease termination obligations, and other related costs. We will reassess the expected cost to complete the exit or disposal activities at the end of each reporting period and adjusted our remaining estimated liabilities, if necessary. It is expected that the actions taken for this restructuring will be substantially completed by the end of the second quarter of 2018.
The actions taken for this restructuring will be substantially completed by the end of the first quarter of 2018.
50
Table of Contents
| 21. | Quarterly Results of Operations (Unaudited) |
The following represents our unaudited quarterly results for the years ended December 31, 2017 and 2016. These quarterly results were prepared in conformity with GAAP and reflect all adjustments that are, in the opinion of management, fair and necessary for a fair statement of results, and were of a normal recurring nature. The 2017 and 2016 acquisitions are included in the quarterly consolidated results of operations from their respectively acquisition dates.
Unaudited quarterly results for 2017:
| First Quarter | Second Quarter | Third Quarter | Fourth Quarter | |||||||||||||
| Revenues |
$ | 30.6 | $ | 43.4 | $ | 43.1 | $ | 35.2 | ||||||||
| Gross profit |
10.1 | 14.2 | 13.9 | 3.5 | ||||||||||||
|
|
|
|
|
|
|
|
|
|||||||||
| Net loss |
$ | (5.0 | ) | $ | (0.7 | ) | $ | (2.5 | ) | $ | (45.7 | ) | ||||
|
|
|
|
|
|
|
|
|
|||||||||
| Basic and diluted net loss per common share |
$ | (0.24 | ) | $ | (0.03 | ) | $ | (0.12 | ) | $ | (2.17 | ) | ||||
|
|
|
|
|
|
|
|
|
|||||||||
Unaudited quarterly results for 2016:
| First Quarter | Second Quarter | Third Quarter | Fourth Quarter | |||||||||||||
| Revenues |
$ | 27.6 | $ | 43.1 | $ | 50.2 | $ | 51.2 | ||||||||
| Gross profit |
9.1 | 13.3 | 15.9 | 17.6 | ||||||||||||
|
|
|
|
|
|
|
|
|
|||||||||
| Net income (loss) |
$ | (2.6 | ) | $ | (1.1 | ) | $ | 1.6 | $ | 1.6 | ||||||
|
|
|
|
|
|
|
|
|
|||||||||
| Basic and diluted net income (loss) per common share |
$ | (0.16 | ) | $ | (0.06 | ) | $ | 0.08 | $ | 0.08 | ||||||
|
|
|
|
|
|
|
|
|
|||||||||
The sum of the quarterly per share amounts may not equal the annual per share amounts due to relative changes in the weighted average number of shares used to calculated net income (loss) per share.
Item 9. Changes In and Disagreements with Accountants on Accounting and Financial Disclosure
None.
Item 9A. Controls and Procedures
The certifications of our principal executive officer and principal financial officer in accordance with Rule 13a-14(a) under the Exchange Act are attached as exhibits to this Annual Report on Form 10-K. The disclosures set forth in this Item 9A contain information concerning the evaluation of our disclosure controls and procedures, and changes in our internal control over financial reporting referred to in paragraph 4 of such certifications. Such certifications should be read in conjunction with this Item 9A for a more complete understanding of the matters covered by the certifications.
(a) Evaluation of disclosure controls and procedures
We maintain disclosure controls and procedures (as such term is defined in Rules 13a-15(e) and 15d-15(e) under the Securities Exchange Act of 1934, as amended) that are designed to ensure that information required to be disclosed in the reports we file under the Securities Exchange Act of 1934, as amended, is recorded, processed, summarized and reported within the time periods specified in the Securities and Exchange Commission’s rules and forms, and that such information is accumulated and communicated to our management, including our chief executive officer and chief financial officer as appropriate, to allow timely decisions regarding required disclosure.
In designing and evaluating the disclosure controls and procedures, our management recognizes that any controls and procedures, no matter how well designed and operated, can provide only reasonable assurance of achieving the desired control objectives, and our management necessarily was required to apply its judgment in evaluating the cost-benefit relationship of possible controls and procedures. Furthermore, our controls and procedures can be circumvented by the individual acts of some persons, by collusion of two or more people or by management override of the control and misstatements due to error or fraud may occur and not be detected on a timely basis.
An evaluation was performed under the supervision and with the participation of our management, including our chief executive officer and chief financial officer, of the effectiveness of our disclosure controls and procedures as of the end of the period covered by this Annual Report on Form 10-K. Based on this evaluation, our management concluded that our disclosure controls and procedures were effective at a reasonable assurance level as of the end of the period covered by this report.
51
Table of Contents
(b) Management’s annual report on internal control over financial reporting
Our management is responsible for establishing and maintaining adequate internal control over financial reporting for our Company. Internal control over financial reporting is a process to provide reasonable assurance regarding the reliability of our financial reporting and the preparation of financial statements for external purposes in accordance with accounting principles generally accepted in the United States of America. Internal control over financial reporting includes maintaining records that in reasonable detail accurately and fairly reflect our transactions; providing reasonable assurance that transactions are recorded as necessary for preparation of our financial statements; providing reasonable assurance that receipts and expenditures of our assets are made in accordance with management’s authorization; and providing reasonable assurance that unauthorized acquisition, use or disposition of our assets that could have a material effect on the financial statements would be prevented or detected on a timely basis. Because of its inherent limitations, internal control over financial reporting is not intended to provide absolute assurance that a misstatement of our financial statements would be prevented or detected. Furthermore, our controls and procedures can be circumvented by the individual acts of some persons, by collusion of two or more people or by management override of the control and misstatements due to error or fraud may occur and not be detected on a timely basis.
Management conducted its evaluation of the effectiveness of our Company’s internal control over financial reporting based on the framework in Internal Control — Integrated Framework issued by the Committee of Sponsoring Organizations of the Treadway
Commission in 2013, and concluded that our Company’s internal control over financial reporting was effective as of December 31, 2017.
The effectiveness of our internal control over financial reporting as of December 31, 2017 has been audited by RSM US LLP, an independent registered public accounting firm, as stated in their attestation report, which appears herein.
(c) Changes in internal controls
There was no change in our internal control over financial reporting that occurred during the quarter ended December 31, 2017 that has materially affected, or is reasonably likely to materially affect, our internal control over financial reporting.
| Item 9B. | Other Information |
None.
| Item 10. | Directors, Executive Officers and Corporate Governance |
The information required by this item will be set forth in our definitive proxy statement to be filed with the Securities and Exchange Commission in connection with our 2018 annual meeting of stockholders and is incorporated herein by reference. Information relating to our Code of Business Conduct and Ethics and to compliance with Section 16(a) of the Securities Exchange Act of 1934, as amended, will be set forth in our definitive proxy statement relating to our 2018 annual meeting of stockholders and is incorporated herein by reference.
| Item 11. | Executive Compensation |
The information required by this item will be set forth in our definitive proxy statement to be filed with the Securities and Exchange Commission in connection with our 2018 annual meeting of stockholders and is incorporated herein by reference.
| Item 12. | Security Ownership of Certain Beneficial Owners and Management, and Related Stockholder Matters |
The information required by this item will be set forth in our definitive proxy statement to be filed with the Securities and Exchange Commission in connection with our 2018 annual meeting of stockholders and is incorporated herein by reference.
Equity Compensation Plan Information
The following table provides information as of December 31, 2017 with respect to shares of our common stock that may be issued under our equity compensation plans. For additional information regarding our stock option plans and the accounting effects of our stock-based compensation, please see Notes 2 and 15 of our Notes to Consolidated Financial Statements.
52
Table of Contents
| Number of common shares to be issued upon exercise of outstanding options, warrants and rights (a) |
Weighted-average exercise price of outstanding options, warrants and rights (b) |
Number of common shares available for future issuance (excluding securities reflected in column (a) |
||||||||||
| Equity compensation plans approved by stockholders |
24,875 | $ | 44.45 | — | ||||||||
| Equity compensation plans not approved by stockholders |
— | N/A | 709,837 | |||||||||
|
|
|
|
|
|
|
|||||||
| Totals |
24,875 | N/A | 709,837 | |||||||||
|
|
|
|
|
|
|
|||||||
| Item 13. | Certain Relationships and Related Transactions and Director Independence |
The information required by this item will be set forth in our definitive proxy statement to be filed with the Securities and Exchange Commission in connection with our 2018 annual meeting of stockholders and is incorporated herein by reference.
| Item 14. | Principal Accountant Fees and Services |
The information required by this item will be set forth in our definitive proxy statement to be filed with the Securities and Exchange Commission in connection with our 2018 annual meeting of stockholders and is incorporated herein by reference.
53
Table of Contents
| Item 15. | Exhibits and Financial Statement Schedules |
54
Table of Contents
55
Table of Contents
56
Table of Contents
| * | Filed or furnished herewith. |
| ** | Submitted electronically with this Report pursuant to Rule 405 of Regulation S-T. |
| + | Revolution Lighting Technologies, Inc. hereby agrees to furnish a supplemental copy of any omitted schedule or similar attachment to this agreement to the Securities and Exchange Commission upon its request. |
| ++ | Management contract or compensatory plan or arrangement. |
| Item 16. | Form 10-K Summary |
None.
57
Table of Contents
Pursuant to the requirements of Section 13 or 15(d) of the Securities Exchange Act of 1934, the registrant has duly caused this report to be signed on its behalf by the undersigned, thereunto duly authorized.
| REVOLUTION LIGHTING TECHNOLOGIES, INC. | ||||||
| Date: March 8, 2018 | By: | /s/ Robert V. LaPenta | ||||
| Robert V. LaPenta | ||||||
| Chairman of the Board, Chief Executive | ||||||
| Officer and President | ||||||
Pursuant to the requirements of the Securities Exchange Act of 1934, this report has been signed below by the following persons on behalf of the registrant and in the capacities and on the dates indicated.
| /s/ Robert V. LaPenta |
March 8, 2018 | |||
| Robert V. LaPenta | ||||
| Chairman of the Board, Chief Executive | ||||
| Officer and President | ||||
| (Principal Executive Officer) | ||||
| /s/ James A. DePalma |
March 8, 2018 | |||
| James A. DePalma – Chief Financial Officer and Director (Principal Financial and Accounting Officer) | ||||
| /s/ William Ingram |
March 8, 2018 | |||
| William Ingram – Director | ||||
| /s/ Dennis McCarthy |
March 8, 2018 | |||
| Dennis McCarthy – Director | ||||
| /s/ Stephen G. Virtue |
March 8, 2018 | |||
| Stephen G. Virtue – Director | ||||