Attached files
| file | filename |
|---|---|
| EX-21.1 - EXHIBIT 21.1 - National Vision Holdings, Inc. | exhibit211-subsidiaries.htm |
| EX-31.2 - EXHIBIT 31.2 - National Vision Holdings, Inc. | exhibit312201710-k.htm |
| EX-32.2 - EXHIBIT 32.2 - National Vision Holdings, Inc. | exhibit322201710-k.htm |
| EX-32.1 - EXHIBIT 32.1 - National Vision Holdings, Inc. | exhibit321201710-k.htm |
| EX-31.1 - EXHIBIT 31.1 - National Vision Holdings, Inc. | exhibit311201710-k.htm |
| EX-23.1 - EXHIBIT 23.1 - National Vision Holdings, Inc. | exhibit231-consentofaudito.htm |
| EX-10.39 - EXHIBIT 10.39 - National Vision Holdings, Inc. | exhibit1039-jmcallistersto.htm |
UNITED STATES
SECURITIES AND EXCHANGE COMMISSION
Washington, D.C. 20549
_______________________________________________________________________
FORM 10-K
_______________________________________________________________________
(Mark One)
☒ ANNUAL REPORT PURSUANT TO SECTION 13 OR 15(d) OF THE SECURITIES EXCHANGE ACT OF 1934
For the fiscal year ended December 30, 2017
OR
☐ TRANSITION REPORT PURSUANT TO SECTION 13 OR 15(d) OF THE SECURITIES EXCHANGE ACT OF 1934
For the transition period from _____ to_____
Commission file number 001-38257
______________________________________________________________________
National Vision Holdings, Inc.
(Exact name of registrant as specified in its charter)
______________________________________________________________________
Delaware (State or other jurisdiction of incorporation or organization) | 46‑4841717 (I.R.S. Employer Identification No.) | |
2435 Commerce Ave, Building 2200 Duluth, Georgia 30096 (Address of principal executive offices) (770) 822‑3600 (Registrant’s telephone number, including area code) | ||
_______________________________________________________________________
Securities registered pursuant to section 12(b) of the Act:
Title of each class | Name of each exchange on which registered | |
Common Stock, par value $0.01 per share | NASDAQ | |
Securities registered pursuant to section 12(g) of the Act: None
Indicate by check mark if the registrant is a well-known seasoned issuer, as defined in Rule 405 of the Securities Act. Yes ☐ No ☒
Indicate by check mark if the registrant is not required to file reports pursuant to Section 13 or Section 15(d) of the Act. Yes ☐ No ☒
Indicate by check mark whether the registrant (1) has filed all reports required to be filed by Section 13 or 15(d) of the Securities Exchange Act of 1934 during the preceding 12 months (or for such shorter period that the registrant was required to file such reports), and (2) has been subject to such filing requirements for the past 90 days Yes ☒ No ☐
Indicate by check mark whether the registrant has submitted electronically and posted on its corporate Web site, if any, every Interactive Data File required to be submitted and posted pursuant to Rule 405 of Regulation S-T (§232.405 of this chapter) during the preceding 12 months (or for such shorter period that the registrant was required to submit and post such files). Yes ☒ No ☐
Indicate by check mark if disclosure of delinquent filers pursuant to Item 405 of Regulation S-K is not contained herein, and will not be contained, to the best of registrant's knowledge, in definitive proxy or information statements incorporated by reference in Part III of this Form 10-K or any amendment to this Form 10-K. ☒
Indicate by check mark whether the registrant is a large accelerated filer, an accelerated filer, a non-accelerated filer, a smaller reporting company, or an emerging growth company. See the definitions of “large accelerated filer,” “accelerated filer,” “smaller reporting company,” and “emerging growth company” in Rule 12b-2 of the Exchange Act.
Large accelerated filer | ☐ | Accelerated filer | ☐ | |
Non-accelerated filer (Do not check if a smaller reporting company) | ☒ | Smaller reporting company Emerging growth company | ☐ | |
If emerging growth company, indicate by check mark if the registrant has elected not to use the excluded transition period for complying with any new or revised financial accounting standards provided pursuant to Section 13(a) of the Act. ☐
Indicate by check mark whether the registrant is a shell company (as defined in Rule 12b-2 of the Exchange Act). Yes ☐ No ☒
As of July 1, 2017, the last day of the registrant’s most recently completed second quarter, the registrant’s common stock was not publicly traded. The registrant's common stock, $0.01 par value per share, began trading on the NASDAQ Global Select Market on October 26, 2017. As of February 28, 2018, the aggregate market value of the registrant’s common stock held by non-affiliates of the registrant was approximately $671.6 million (based upon the closing sale price of the common stock on that date on the NASDAQ).
Indicate the number of shares outstanding of each of the registrant’s classes of common stock, as of the latest practicable date.
Class | Outstanding at February 28, 2018 | |
Common stock, $0.01 par value per share | 74,656,175 | |
Documents incorporated by reference: None
NATIONAL VISION HOLDINGS, INC. AND SUBSIDIARIES
Table of Contents
Page | |||
Item 6. | |||
Item 7. | |||
Item 7A. | |||
Item 8. | |||
Item 9. | |||
Item 9A. | |||
Item 9B. | |||
Item 10. | |||
Item 11. | |||
Item 12. | |||
Item 13. | |||
Item 14. | |||
Item 15. | |||
Item 16. | |||
SPECIAL NOTE REGARDING FORWARD-LOOKING STATEMENTS
This Annual Report on Form 10-K (this “Form 10-K”) contains “forward-looking statements” within the meaning of Section 27A of the Securities Act of 1933, as amended, and Section 21E of the Securities Exchange Act of 1934, as amended (the “Exchange Act”), which are subject to the “safe harbor” created by those sections. All statements, other than statements of historical facts included in this Form 10-K, including statements concerning our plans, objectives, goals, beliefs, business strategies, future events, business conditions, results of operations, financial position, business outlook, business trends and other information, may be forward-looking statements.
Words such as “believes,” “expects,” “may,” “will,” “should,” “seeks,” “intends,” “plans,” “estimates,” or “anticipates,” and variations of such words or similar expressions are intended to identify forward-looking statements. The forward-looking statements are not historical facts, or guarantees of future performance and are based upon our current expectations, beliefs, estimates and projections, and various assumptions, many of which, by their nature, are inherently uncertain and beyond our control. Our expectations, beliefs, and projections are expressed in good faith and we believe there is a reasonable basis for them. However, there can be no assurance that management’s expectations, beliefs and projections will result or be achieved and actual results may vary materially from what is expressed in or indicated by the forward-looking statements.
There are a number of risks, uncertainties and other important factors, many of which are beyond our control, that could cause our actual results to differ materially from the forward-looking statements contained in this Form 10-K. These risks and uncertainties include, but are not limited to, those described in Part I. Item 1A. “Risk Factors” and elsewhere in this Form 10-K and those described from time to time in our future reports filed with the Securities and Exchange Commission (the “SEC”).
We caution you that the risks, uncertainties and other factors referenced above may not contain all of the risks, uncertainties and other factors that are important to you. In addition, we cannot assure you that we will realize the results, benefits or developments that we expect or anticipate or, even if substantially realized, that they will result in the consequences or affect us or our business in the way expected. There can be no assurance that (i) we have correctly measured or identified all of the factors affecting our business or the extent of these factors’ likely impact, (ii) the available information with respect to these factors on which such analysis is based is complete or accurate, (iii) such analysis is correct or (iv) our strategy, which is based in part on this analysis, will be successful. All forward-looking statements in this Form 10-K, apply only as of the date of this Form 10-K or as of the date they were made and, except as required by applicable law, we undertake no obligation to publicly update or revise any forward-looking statement, whether as a result of new information, future developments or otherwise.
3
PART I
Item 1. Business
National Vision Holdings, Inc., a Delaware corporation, and its consolidated subsidiaries are referred to here as “we,” “our,” “us,” “the Company,” or “National Vision.” National Vision Holdings, Inc. conducts substantially all of its activities through its direct, wholly-owned subsidiary, National Vision, Inc. (“NVI”), and NVI’s subsidiaries. National Vision is controlled by affiliates of Kohlberg Kravis Roberts & Co. L.P. (“KKR Sponsor”) and private equity funds managed by Berkshire Partners LLC (“Berkshire”). KKR Sponsor and Berkshire are collectively referred to herein as the “Sponsors.”
General
We are one of the largest and fastest growing optical retailers in the United States and a leader in the attractive value segment of the U.S. optical retail industry. We believe that vision is central to quality of life and that people deserve to see their best to live their best, no matter what their budget. Our mission is to make quality eye care and eyewear affordable and accessible to all Americans. We achieve this by providing eye exams, eyeglasses and contact lenses to cost-conscious and low-income consumers. We deliver exceptional value and convenience to our customers, with an opening price point that strives to be among the lowest in the industry, enabled by our low-cost operating platform. We reach our customers through a diverse portfolio of 1,013 retail stores across five brands and 18 consumer websites as of December 30, 2017, our 2017 fiscal year end.
Our History
Through its predecessors, NVI commenced operations in 1990. In 2005, private equity funds managed by Berkshire acquired both NVI and Consolidated Vision Group, Inc., which operated America’s Best stores, and merged these entities, with NVI surviving. In 2009, NVI acquired the Eyeglass World store chain. In 2011, after a multi-year partnership, NVI acquired Arlington Contact Lens Service, Inc. (“AC Lens”) to bolster its e-commerce platform.
In March 2014, NVI was acquired by affiliates of KKR Sponsor (the “KKR Acquisition”). National Vision Holdings, Inc. was incorporated in Delaware on February 14, 2014 under the name “Nautilus Parent, Inc.” and NVI became our wholly-owned subsidiary in connection with the KKR Acquisition. In 2017, we changed our name to “National Vision Holdings, Inc.”
In October 2017, we completed the initial public offering of our common stock (the “IPO”). Our common stock trades on the NASDAQ Global Select Market (“NASDAQ”) under the symbol “EYE.” Our principal executive offices are located at 2435 Commerce Avenue, Bldg. 2200, Duluth, Georgia 30096.
Our Business Model
Our history of profitable growth is founded on a commitment to a relatively simple business model: providing exceptional value and convenience to customers, enabled by our low-cost operating platform. Our disciplined approach to new store openings, combined with our attractive store economics, has led to strong returns on investment. The following chart depicts our new store growth:
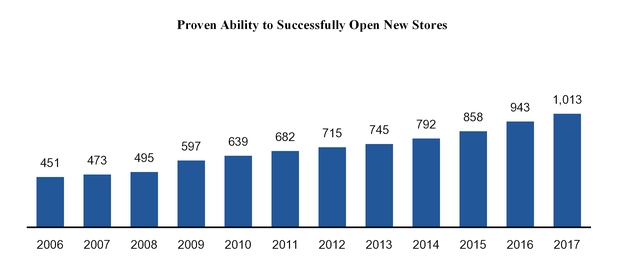
Note: Represents stores in operations across all five company brands at the end of each fiscal year.
4
The fundamentals of our model are described below:
• | Differentiated and Defensible Value Proposition. We believe our success is driven by our low prices, convenient locations, broad assortment of branded and private label merchandise and the high levels of in-store service provided by our well-trained and passionate store associates and vision care professionals. We believe our bundled offers, including two-pairs of eyeglasses plus an eye exam for $69.95 at America’s Best and two-pairs of eyeglasses for $78.00 at Eyeglass World, represent among the lowest price offerings of any national chain. Our ability to utilize national advertising for America’s Best allows us to communicate this value proposition to a meaningfully greater number of current and potential customers. We believe that our value proposition will continue to drive comparable store sales growth as we attract new customers and increase loyalty with existing customers. |
• | Recurring Revenue Characteristics. Eye care purchases are predominantly a medical necessity and are therefore considered non-discretionary in nature. We estimate that optical consumers typically replace their eyeglasses every two to three years, while contact lens customers typically order new lenses every six to twelve months, reflecting the predictability of these recurring purchase behaviors. This is further demonstrated by the customer mix of our mature stores, with existing customers representing 63% of total customers in 2017 and new customers representing the remaining 37% of total customers in 2017. |
• | Attractive Store Economics. Since 2006, we have opened 566 stores in the aggregate, including 490 stores under our America’s Best and Eyeglass World retail brands. Our store economics are based on low capital investment, steady ramping of sales in new locations, low operating costs and consistent sales volume and earnings growth in mature stores, which result in attractive returns on capital. On average, our owned stores achieve profitability shortly after their first-year opening anniversary and pay back invested capital in less than four years. By consistently replicating the key characteristics of our store model, we execute a formula-based approach to opening new stores and managing existing stores, which has delivered predictable store performance across vintages, diverse geographies and new and existing markets. |
Our Mission and Philanthropic Efforts
Our mission is to help people by making quality eye care and eyewear more affordable and accessible. Our financial success has helped fuel our ever-growing philanthropic engine. Through multiple charitable partnerships with organizations such as VisionSpring, RestoringVision and Vosh International, we have directly assisted approximately 900,000 individuals to see and have indirectly helped improve the vision of approximately 14 million individuals globally. In addition, through a multi-year partnership with the Boys & Girls Clubs of America we provide free vision screenings, eye exams and eyeglasses to thousands of young Americans. We also work diligently to help a portion of the world’s population who live with uncorrected vision problems. Our philanthropic culture instills a sense of purpose and engagement in our employees, from in-store staff to senior management. Our employees feel pride in the positive work they are doing, which allows us to attract and retain both store associates and vision care professionals, thus improving the customer experience in our stores. In addition, our mission has been essential to the formation and retention of our cohesive management team, whose extensive experience and minimal turnover are unique components of our business success.
Our Business
We are well positioned to serve our new and existing customers through a diverse portfolio of 1,013 retail stores across five brands and 18 consumer websites as of December 30, 2017. We have two reportable segments: our owned & host segment and our legacy segment. Our owned & host segment includes our two owned brands, America’s Best and Eyeglass World, and our Vista Optical locations in Fred Meyer stores. Within this segment, we also provide low-cost vision care products and services to American military service members by operating Vista Optical locations on military bases across the country. Our legacy segment consists of our 27-year strategic relationship with Walmart to operate Vision Centers in select Walmart stores. In addition, our wholly-owned subsidiary, FirstSight, which is licensed as a single-service health plan under California law, issues individual vision care benefit plans in connection with our America’s Best operations in California, and provides or arranges for the provision of optometric services at almost all of the optometric offices next to Walmart and Sam’s Club stores in California. FirstSight also sells contact lenses to its members in certain locations. We support our owned brands and our Vista Optical military operations through our ever-evolving omni-channel offerings and we also have an established standalone e-commerce business. Our e-commerce platform serves our proprietary e-commerce websites and the e-commerce websites of third parties, including Walmart, Sam’s Club and Giant Eagle. The following table provides an overview of our portfolio of brands:
5
Overview of Our Brands and Omni-channel & E-commerce Platform
Owned & Host Brands | Legacy | |||||
 |  |  |  |  | ||
Lowest Price | Eyewear Value Superstore | Shop-Within-A-Shop | Commissary Store | Shop-Within-A-Shop | ||
 |  | “Great Deals Everywhere You Look” | “Fantastic Military Pricing” | “Everyday Low Price” | ||
Employed ODs | Mostly Independent ODs | Mostly Independent ODs | Mostly Independent ODs | Mostly Independent ODs | ||
594 Stores | 107 Stores | 29 Stores | 56 Stores | 227 Stores | ||
~3,500 sq. ft. | ~4,500 sq. ft. | ~800 sq. ft. | ~1,000 sq. ft. | ~1,800 sq. ft. | ||
~1,320 SKUs | ~1,935 SKUs | ~600 SKUs | ~700 SKUs | ~800 SKUs | ||
Centralized Lab | Lab in Store / Centralized Lab | Centralized Lab | Centralized Lab | Centralized Lab | ||
OMNI-CHANNEL & E-COMMERCE (3.5% of 2017 Sales) | ||||||
Sister Sites (4) | Proprietary Sites (6) | Partner Sites (8) | ||||
 | ||||||
___________ | ||||||
Note: Store count as of December 30, 2017. SKU figures refer to eyeglass frame SKUs. ODs are Doctors of Optometry. | ||||||
(1) Vista Optical in Fred Meyer stores does not offer omni-channel services. | ||||||
All of our brands leverage our highly-efficient centralized laboratory network and distribution system, which helps us minimize production and distribution costs. As one of the largest purchasers of eyeglass frames, optical lenses and contact lenses in the United States, we also benefit from centralized procurement efforts and purchasing economies of scale.
Our stores present our products in an inviting and engaging atmosphere. Our merchandise is showcased to highlight the products and maximize the appeal of our image and brands. Our stores are clean and spacious, with orderly merchandising and strategic product placements to optimize our selling space, increase productivity and optimize customer flow. We utilize display samples to foster customer interaction with products, while providing price transparency and simplicity. We provide a hands-on, solutions-based service approach and further enhance the customer’s store experience with convenient, time-saving and value-added services.
Our America’s Best Brand. America’s Best strives to be the value leader in virtually every market in which it operates. Its signature offer of two pairs of eyeglasses for $69.95, including a free eye exam, is typically priced significantly lower than the competition on a per-pair basis and provides customers with a wide selection of frame choices at this entry point. In America’s Best stores, vision care services are provided by optometrists employed either by us or by independent professional corporations. This model facilitates the brand’s bundled offer and its Eyecare Club programs, which offer two free eye exams per year for the duration of the membership plus a discount on replacement contact lenses and eyeglasses. By leveraging our efficient centralized laboratory network, America’s Best stores are able to minimize processing costs and drive significant economies of scale. These stores typically stock approximately 1,320 eyeglass frame SKUs, including imports from low-cost overseas manufacturers, higher-margin private label brands and discounted well-known frame brands. America’s Best stores, which average 3,500 square feet, are primarily located in high-traffic strip centers next to similar off-price designer retailers, such as Marshalls stores.
Our Eyeglass World Brand. Eyeglass World also offers a value price point for customers, with an opening offer of “two pairs of eyeglasses for $78” and eye exams starting at $39. This brand is positioned as an eyeglass superstore that caters to a more cost-conscious customer base, with a broader selection of designer brands and price points, and offers more personalized levels of service. We source eyeglass frames for our Eyeglass World stores from leading designer brands, private label manufacturers, overstock inventories and low-cost overseas manufacturers. Eyeglass World locations offer eye exams, primarily from independent optometrists, and have on-site laboratories that enable stores to quickly fulfill customer orders and make repairs. On-site laboratories can process a variety of lens options, with same-
6
day service. Lens orders that are not completed in-store are completed by our centralized laboratory network. Due to the wider brand selection and on-site laboratories, Eyeglass World stores are larger, averaging approximately 4,500 square feet and typically stocking approximately 1,935 eyeglass frame SKUs. These stores are primarily located in freestanding or in-line locations near high-foot-traffic shopping centers.
Our Partner Brands. We have three partner brands consisting of 227 Vision Centers in Walmart stores across the country, 56 Vista Optical locations on military bases and 29 Vista Optical locations within Fred Meyer stores as of December 30, 2017. We have strong, long-standing relationships with these partners. Our strategic relationship with Walmart extends over 27 years and our partnerships with Fred Meyer and the U.S. military have been maintained for over 18 years. Our partner brands all compete within the value segment of the U.S. optical retail industry, with a starting price point for a pair of eyeglasses in the $38 to $99 range. These brands combine a broad selection of products and attentive customer service with the convenience of one-stop shopping. These brands also utilize our centralized laboratories and provide eye exams principally by independent optometrists in nearly all locations. Our partner brands are attractive businesses with relatively light capital requirements.
Our Omni-Channel and E-Commerce Platforms. We offer our customers an engaging digital shopping experience through an established platform of four store websites, three of which are omni-channel, and 14 dedicated e-commerce consumer websites. Our three omni-channel websites augment our America’s Best, Eyeglass World and Vista Optical in military brands and provide a customer experience that extends across our in-store, mobile and e-commerce channels. We offer a range of services to customers, including eyeglass purchasing for our America’s Best stores and Vista Optical locations on U.S. military bases, online scheduling and appointment reminders, contact lens purchasing, “buy-in-store and ship-to-home” capabilities, online frame browsing and virtual frame try-on, among others. Our omni-channel offerings work in concert with these brands to enhance the overall quality of the customer experience.
Our 14 dedicated e-commerce websites are managed by our subsidiary, AC Lens. AC Lens operates six proprietary branded websites, including aclens.com and discountcontacts.com. In addition, AC Lens operates and provides support services for eight third-party websites owned by other companies, including Walmart, Sam’s Club and Giant Eagle. AC Lens handles site management, customer relationship management and order fulfillment and also sells a wide variety of contact lenses, eyeglasses and eye care accessories. In the aggregate, sales from our omni-channel and e-commerce platforms represented approximately 3.5% of our net revenue in fiscal year 2017.
Our Industry
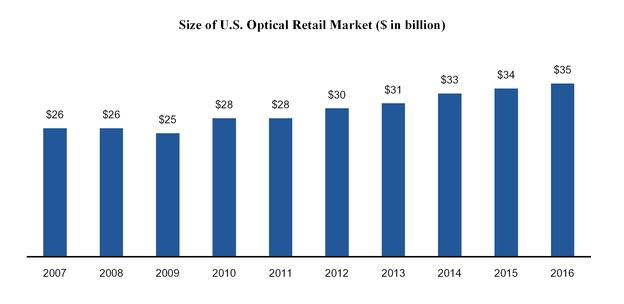
Overview. The U.S. optical retail industry, defined by Vision Monday to include optical retailers’ revenues from the sales of products (including managed vision care benefit revenues and omni-channel and e-commerce sales) and eye care services provided by vision care professionals, including eye exams, is a $35 billion industry that has exhibited consistent, stable growth across economic cycles. According to Vision Monday, over the period from 2007 to 2016, the industry grew from $26 billion to $35 billion in annual sales, representing a compound annual growth rate (“CAGR”) of 3.4%. The industry experienced only a modest decline of approximately 3.8% during the 2008 to 2009 recession and rebounded with robust post-recession sales growth of 4.6% CAGR from 2009 to 2016, according to Vision Monday. The steady growth of the industry and its resilience to economic cycles is due in large part to the medical, non-discretionary and recurring nature of eye care purchases.
7
Source: Vision Monday
The majority of eyewear purchases are driven by need, with two primary drivers of demand: (i) diminishing eyesight with increasing age, causing new customers to buy corrective eyewear and (ii) a steady and consistent replacement cycle, as customers frequently replace or purchase new eyewear for a variety of reasons, including changes in prescriptions, fashion trends and necessity (e.g., lost or broken eyewear).
The need for eyesight correction is diagnosed through eye tests and eye exams.
We anticipate that there are four key secular growth trends that will continue to contribute to the stability and growth of the U.S. optical retail industry:
• | Aging Population. According to The Vision Council, approximately 76% of adults in the United States used some form of vision correction as of September 2016. At age 45, the need for vision correction begins to increase significantly, with approximately 86% of adults in the United States between the ages of 45 and 54 and approximately 92% of adults in the United States aged 55 and older using vision correction, according to The Vision Council. As the U.S. population ages and life expectancy increases, the pool of potential customers and opportunities for repeat purchases in the optical retail industry are anticipated to rise. In 2014, the U.S. Census Bureau estimated that approximately 42% of the U.S. population would be 45 years old or older by 2020 (the 0.9% increase from 2015 population projections implies an additional 8.4 million adults will enter this 45-plus demographic by 2020). Given that eyesight deteriorates progressively with age, aging of the U.S. population should result in incremental sales of eyewear and related accessories. |
• | Frequent Replacement Cycle. The repetitive and predictable nature of customer behavior results in a significant volume of recurring revenue for the optical retail industry. The purchasing cycle of vision correction devices is closely tied to the frequency with which consumers obtain eye exams. Most optometrists recommend annual eye exams as a preventive measure against serious eye conditions and to help patients identify changes in their vision correction needs. According to The Vision Council, an estimated 189 million people in the United States using vision correction devices in 2015 received nearly 114 million eye exams that year, implying an average interval between exams of 20 months. The interval between exams contributes to the industry’s stability and shortening this interval represents an opportunity to increase the frequency of customer purchases. |
• | Increased Usage of Computer and Mobile Screens. Due to the proliferation of smartphones, laptops and tablets, the U.S. population has experienced a dramatic increase in the amount of time spent viewing electronic screens. According to The Vision Council, almost 90% of Americans use digital devices for two or more hours each day, with almost 60% using them for five or more hours each day and approximately 70% using multiple devices simultaneously. This is anticipated to result in a larger percentage of the population suffering from screen-related vision problems, driving incremental sales of vision correction devices, such as traditional eyeglasses and contact lenses, as well as higher margin products designed specifically to counteract the effect of looking at screens for prolonged stretches of time. |
8
• | Growing Focus on Health and Wellness. The optical retail industry is poised to benefit from expansive trends underlying an increasing societal focus on health and wellness. Consumers want personalized solutions that allow them to make informed decisions about their health. Additionally, rising healthcare costs are driving a growing emphasis on preventative healthcare. Eye exams can detect a host of physical ailments, such as hypertension or diabetes, and are one of the most inexpensive and effective forms of detection for many of these conditions. As consumers continue to develop greater awareness of health and wellness issues, there is an opportunity for retailers that are able to offer personalized, inexpensive, health-oriented products and services that can increase quality of life and reduce an individual’s overall level of healthcare expenditures. Furthermore, this increased focus on health means that people are living longer, which increases the overall demand for vision care and the frequency with which people visit their eye care practitioners for vision care products and services. |
Value Chains Gaining Market Share in Optical Retail Industry. Providing consumers with quality vision care and products involves multiple steps and several parties. In the process of purchasing vision care products a consumer will interact directly with eye care practitioners who prescribe (and may also dispense) products. Consumers may likewise interact with optical retail outlets which dispense products, and may offer on-site optometry services to increase customers’ convenience. Retailers also assist consumers in selecting and fitting vision care products and, directly or through third parties, manufacture and finish vision care products and their components. As part of the purchase, the consumer and retailer may interact with an insurance company or managed vision care provider. Further, vision care and optical retail require compliance with numerous regulations, which often vary by state. The industry experience and knowledge to initiate and maintain relationships across all of these parties is crucial to the success of optical retailers.
There are several types of optical retailers with differing approaches to fulfilling consumer needs at each step of the vision care process. The types of optical retailers include independent eye care practitioners, multi-doctor purchasing alliances, national and regional optical retail chains, mass merchant/warehouse club retail chains and e-commerce. Some optical retail chains, like us, have vertically integrated some or all of the sectors of the industry. However, the industry remains highly fragmented.
Several key factors drive the changing dynamics across the optical retail market:
• | Optical Retail Chains Gaining Market Share From Independents. As a result of customers’ desire for the convenience of a one-stop shop with broad product selection, strong customer service and competitive prices, larger optical retailers have gained market share from independent practitioners over the past approximately 20 years, with total market share of the ten largest optical retailers in the United States increasing from 18% in 1992 to 32% in 2016 according to 20/20 magazine and Vision Monday. Despite this growth, the top ten optical retailers still have a relatively small share of the overall market and the largest optical retailers are well-positioned to continue increasing their share. |
• | Value Chains Are Growing Faster Than Industry. According to Vision Monday estimates, from 2007 to 2016, the value segment of the U.S. optical retail industry grew at a CAGR of 6.6%, nearly twice the rate of the broader optical retail industry. Increased consumer cost consciousness has shifted market share toward value optical retail chains and mass merchants that serve the value segment. To the extent this trend continues, the value segment is expected to continue to outpace overall industry growth. |
• | E-commerce. The optical retail industry is currently underpenetrated in the e-commerce channel relative to other categories of retail. This is due to inherent penetration barriers that make optical retail better suited for omni-channel offerings rather than pure e-commerce. Although contact lenses lend themselves more to online purchases than do eyeglasses, users still generally need to visit an eye care practitioner or a store to update their prescription. Such visits are an opportunity to sell an annual supply of contact lenses to the customer. |
Optometrists, Ophthalmologists and Opticians. Within the vision care industry, there are multiple providers of eye care and vision services, including optometrists, ophthalmologists and opticians.
• | Optometrists are healthcare professionals who have received a four-year doctor of optometry, or OD, degree and are licensed to perform vision tests, prescribe and dispense vision correction devices such as eyeglasses and contact lenses, perform diagnostic eye exams and prescribe certain types of ocular medication. In a few states, optometrists may also perform surgery. |
• | Ophthalmologists are medical doctors specializing in vision and eye care. These doctors are licensed to prescribe medication and perform surgery and may also perform eye exams and dispense vision correction products. |
9
• | Opticians are technicians who use prescriptions written by optometrists or ophthalmologists to dispense corrective eyeglasses and contact lenses. However, they are not licensed to diagnose or treat ocular conditions. Most states do not license the practice of opticianry. |
Product Categories and Suppliers. The optical retail market consists of multiple product categories, including vision correction devices such as eyeglass lenses, frames and contact lenses and other products and services, including sunglasses, eyeglass accessories and refractive surgery.
• | Eyeglass frames are generally available in a wide range of materials, styles, designs and brands. The most common materials used to manufacture frames include plastic, cellulose acetate and metal. For many customers, eyeglasses are not only an eye care solution but also a fashion accessory, and therefore brand and aesthetics are important factors in customers’ purchasing decisions. There are many recognized eyeglass frame brands, some of which are controlled by vertically-integrated optical retail chains. There are numerous suppliers that offer unbranded, white-label or generic eyeglass frames. |
• | Eyeglass lenses are manufactured using a range of standard and proprietary organic and inorganic materials. Customers generally have the option of selecting individualized features such as lightweight designs, photochromatic capabilities and special coatings for ultraviolet protection, anti-fog, anti-reflection, anti-scratch protection. There are several global manufacturers of lenses, with some additionally offering integrated lens finishing services through owned optical laboratories. |
• | Contact lenses are available in soft or rigid formats. Soft lenses are typically made from silicone hydrogels and are often characterized by the period of use (primarily daily disposable or monthly reusable). Rigid lenses are typically made with oxygen-permeable polymers and can often be used for several years without replacement. Contact lenses are primarily manufactured by a relatively concentrated group of four major suppliers. Re-useable contact lenses require the regular use of cleaning solutions. Demand for contact lenses is driven by structural growth, as more consumers come to recognize the benefits of the more comfortable modern lenses and existing contact lens users switch to monthly, weekly or daily disposable lenses. Despite the attractiveness of contact lens usage, most consumers do not rely exclusively on contact lenses, opting to also purchase traditional eyeglasses for secondary use. |
• | Sunglasses are also sold by many optical retailers. These sunglasses can come with or without prescription lenses, and are worn both for fashion and protection of the eyes from UV rays. Sunglasses are more of a discretionary purchase than prescription eyewear, and sales of sunglasses are therefore more sensitive to the economic environment. According to The Vision Council, for most optical retailers (as opposed to non-prescription sunglass retailers), prescription sunglasses make up the majority of their sunglass sales. |
• | Refractive surgery offers a permanent solution to vision correction problems. The most common refractive surgical procedures are LASIK and PRK. Both technologies utilize lasers to reshape the curvature of the cornea. Due to the high cost, lack of insurance coverage, potential for side effects and invasive nature of the procedures, refractive surgery as a method of vision correction has low penetration relative to traditional eyeglasses or contact lenses. |
Optical Laboratories. Optical laboratories transform semi-finished and finished lenses to match the specifications from an optician or prescriber’s order and fit them into the requested eyeglass frames. The process entails surfacing and polishing the lens, followed by the application of any requested special coatings. Some retailers have in-store laboratories to provide convenience and speed to customers. Laboratories can also be operated on a centralized basis by the retailer or on an outsourced basis, offering economies of scale and expertise across a wide range of lens types and prescriptions.
Third Party Payors. Similar to other healthcare services, optical retail chains often receive payment for services and products from third parties, including managed vision care programs, other insurance programs and government healthcare programs such as Medicare and Medicaid. Managed care has become increasingly important to the optical retail industry. Managed vision care programs provide benefits across all optical retail sales channels, including independent eye care practitioners and national and regional chains, though some managed care programs are affiliated with specific integrated optical retail chains. According to The Vision Council, managed care accounts for a substantial percentage of sales of prescription eyeglasses and, in the 12 months ended September 30, 2016, approximately half of the U.S. adult population surveyed stated they were enrolled in vision care plans. Moreover, the enrolled child population is increasing, as federal health care reform includes pediatric vision as a covered benefit. These trends could be reversed, however, if federal health care reform is repealed or its scope is reduced.
Our Competitive Advantages
10
We are one of the largest and fastest growing optical retailers in the United States and a leader in the attractive value segment of the U.S. optical retail industry. We believe that a number of factors have established our market-leading position and differentiate us from our competitors. These include: our value positioning and compelling customer offers, decades of brand building, low-cost operating model, store network and portfolio of brands, size and scale, strong industry partnerships, highly-experienced management team and disciplined real estate strategy, among others.
Highly-differentiated and Defensible Value Proposition. Our value price positioning extends across our entire portfolio of brands. We offer among the lowest price points in the optical retail industry and this highly-compelling customer value positioning has been a critical driver of our outsized market share gains and revenue growth. Through its arrangements with individual optometrists or professional corporations owned by eye care practitioners, America’s Best is able to offer customers two distinctive bundled eyewear pricing offers: (i) the two pairs of eyeglasses offer for $69.95, including an eye exam, and (ii) the Eyecare Club program, which offers several years of eye exams plus a discount on products for a low price. In addition, Eyeglass World’s opening price point offer of two pairs of eyeglasses for $78.00 is among the lowest in our industry. Based on a recent study of leading optical retailers and based on these bundled offers, we believe that America’s Best and Eyeglass World’s opening price points for eyeglasses and an eye exam are currently 74% and 37% lower on a per-pair basis than the next lowest retailer surveyed and 82% and 56% lower than the average of independent retailers surveyed, respectively, each as indicated in the following chart:

______ | ||||
Note: One-pair price for “two-pair shops” calculated by dividing “two-pair price” by two and adding back exam price. For retailers who do not provide eye exams, the average exam price of the other retailers shown has been used. | ||||
Source: Haynes and Company Research Study (2016). KKR Capstone analysis. | ||||
We are also committed to providing our customers with high levels of in-store customer service and a convenient and compelling shopping experience. On-site optometrists enable a convenient one-stop shop for the clinically-assisted sale of eye exams and eyewear and attract customers. The quality care provided by vision care professionals is then complemented by our highly-trained in-store sales associates. Through one-on-one consultations, we can better understand the complete scope of our customers’ needs and recommend the appropriate products and services. Our customers are then able to choose from a broad assortment of frames, including high-quality designer and private label frames, and contact lenses. We believe that the comprehensive proposition of our value pricing, the breadth and quality of our product mix and high levels of customer service drive repeat visits and customer loyalty, engagement and ambassadorship.
11
Our optical retail offerings are also more defensible to potential e-commerce pressure relative to other categories of retail. This is due to inherent penetration barriers that make optical retail better suited for omni-channel offerings rather than pure e-commerce. Eye exams typically involve in-person visits to eye care practitioners or stores and customers generally want to try eyeglasses on before purchasing, as slight changes in style, size and color can make a meaningful difference to the functionality and visual appeal of the eyeglass frame. Lastly, the service and sales consultations provided by our on-site vision care professionals and in-store associates are a key part of the vision correction product purchase process, which cannot be replicated online.
Leading Low-cost Operating Model. Our low-cost structure allows us to maintain our low prices to our customers while generating attractive margins. This low-cost structure is a result of our highly-efficient laboratory network and manufacturing capabilities. Orders are routed via a centralized proprietary system to the appropriate processing laboratory, minimizing cost and delivery time. Through a combination of volume increases, continuous operating efficiency improvements and implementation of technological enhancements across our laboratory network, we have increased the number of orders processed through our laboratory network and reduced the cost per job. This has allowed us to maintain our introductory offer of two-pairs of eyeglasses and an eye exam for $69.95 at America’s Best for over ten years.
Our scale and business model allow us to benefit from procurement and real estate cost structure advantages as well as efficiencies in advertising spend and corporate management. As a result of these factors, we are able to drive attractive profitable growth while maintaining industry-low prices for our customers.
Best-in-class Management Team With Deep Optical Experience. Our Company is led by a highly-accomplished and proven management team with deep expertise. The current team is one of the longest-tenured in the optical retail industry. Collectively, this team has a wide range of experience across optical merchandising, store openings, customer engagement, operations, omni-channel platform and technology. Combining this operational expertise with a finely-tuned formulaic playbook, management has achieved an impressive long-term track record of significant industry outperformance.
Diverse Portfolio of Attractive Brands. We have a differentiated collection of five complementary brands, four of which are supported by either our omni-channel or e-commerce platform that all target the fast-growing value segment within the U.S. optical retail industry. America’s Best and Eyeglass World, our owned brands, have been the primary source of our store growth. Our partner brands (Vision Centers in Walmart and Vista Optical in Fred Meyer stores and on U.S. military bases) are based in well-known, high-traffic environments, exhibit low capital intensity and generate reliable cash flow. Our omni-channel and e-commerce platforms allow us to capture digital sales, deliver several customer convenience capabilities and serve as an educational resource for our customers.
Proven Real Estate Site Selection Process. We locate our owned stores in highly-desirable retail developments surrounded by dense concentrations of our target customers. We maintain a disciplined approach to new store growth and perform comprehensive market research before selecting a new site based on customer demographics and data from our existing customer database. Our data-driven approach and consistent new store model have resulted in strong performance across our store base. We have rarely closed or relocated a store due to underperformance, and our five-year rolling average new store success rate-defined as the percentage of stores opened in the last five years that are still open-was 99% as of December 30, 2017. We have long-standing relationships with many leading commercial real estate firms and believe that we are a preferred tenant given our brands and the high volume of customers that visit our stores. As a result, we believe we will continue to have access to desirable retail sites.
Strong Partnerships With Retail Partners and Vendors. We have developed extensive and long-term strategic relationships with our frame and lens suppliers, our host and legacy partners and managed vision care companies. Our highly-experienced procurement team leverages long-standing relationships with our vendors to source all of our products. Our strong vendor relationships and scale allow us to maintain broad, on-trend assortments, competitive pricing and favorable payment terms. We have maintained and broadened relationships with our host and legacy partners over several decades. For example, in 2012, we expanded our relationship with Walmart to manage walmartcontacts.com and samsclubcontacts.com and to undertake the back-end logistics and fulfilment services for Walmart’s “ship-to-home” contact lens sales and for virtually all of Sam’s Club contact lens orders. We have also developed strong relationships with managed vision care companies through our network of stores, efficient billing and focus on value. We continually seek to partner with additional managed vision care payors, and to increase participation in our partners’ networks. We believe that our above-market growth is also an attractive growth driver for our business partners and positions us as a preferred retailer for key vendors and industry partners.
Deep Experience with the Regulatory Complexity of the Optical Industry. There are extensive and diverse sets of laws and regulations governing the provision of vision care. As a result, regulatory compliance for optical retailers in the United States is complicated and time-consuming, involving many regulatory bodies and licensing agencies at both
12
the federal and state levels. We believe that our deep knowledge of the optical regulatory framework and our significant compliance experience provide us with an important competitive advantage. We also believe that these compliance and licensure requirements, and related costs, serve as a significant hurdle for potential new entrants into the optical retail industry.
Our Growth Strategies
We intend to further drive growth from five distinct sources: growing our store base, increasing comparable store sales, optimizing our existing business, leveraging technology and exploiting strategic opportunities.
Grow Our Store Base. We believe that our expansion opportunities in the United States are significant. We have adopted a disciplined expansion strategy designed to leverage the strengths of our compelling and distinct value proposition and recognized America’s Best and Eyeglass World brand names to develop new stores successfully in an array of markets that are primed for growth, including new, existing, small and large markets. In the aggregate, we have opened 498 stores on a net basis (opened 566 new stores and closed 68 stores) since 2006 and in the past three years, we have increased our new store growth to approximately 75 new stores per annum. We have an established partnership with a third party real estate firm to evaluate potential new America’s Best and Eyeglass World stores and our analysis suggests that we can grow America’s Best to at least 1,000 stores and Eyeglass World to at least 850 stores, inclusive of those already open. We believe that these two brands can accordingly grow from approximately 700 stores as of 2017 to a total of at least 1,850 stores, with similar economics to the existing store base. In the near term, our primary focus will continue to be to open new America’s Best stores, most notably in California as well as Northern New Jersey and parts of the New York metro area, with a longer-term focus on expanding our Eyeglass World store footprint. We believe that our consistent track record of successfully opening stores across vintages, geographies and markets demonstrates our ability to further increase our store count and, as a result, we believe that our current level of new store growth of approximately 75 stores per annum is sustainable for the foreseeable future.
Drive Comparable Store Sales Growth. We expect that our value proposition will generate profitable comparable store sales growth. The vast majority of our comparable store sales growth over the past five years has been driven by increased traffic. The typical eyewear replacement cycle, which we estimate is two to three years, creates substantial opportunity for us to increase sales from our existing customer base. We continually strive to improve our in-store shopping experience and to enhance our solutions-based service approach to increase the volume of customer traffic to our stores. We also expect to increase customer traffic by improving marketing programs and omni-channel offerings, and by expanding our participation in managed vision care programs. We are currently underpenetrated in the managed vision care market relative to the broader optical retail industry. We expect that these initiatives collectively will help us to attract new customers to our stores and increase the frequency of purchases by our existing customers.
Improve Operating Productivity. We believe that our continued growth will provide further opportunities to improve operating margin over time. Growth, both in revenue and stores, will enable us to leverage corporate overhead, our centralized laboratory network and our advertising spend. We expect to benefit from our national network television advertising campaign for America’s Best, which we believe is more cost effective than local market campaigns. This national campaign has helped raise our brand awareness in both existing and new markets, allowing us to save advertising spend when entering new markets. We also believe that continued efficiencies in store operations and technological advancements in our centralized laboratory network will further enhance margins.
Leverage Technology to Optimize and Expand the Business. Our experienced management team has consistently leveraged innovative strategies to grow our business and remain at the forefront of technological development in the optical retail industry. We have invested significantly in technological improvements to position us for future growth. We have implemented software solutions that allow omni-channel purchases to be linked to a “single view of the customer” and to offer a seamless experience across our in-store, mobile and e-commerce channels designed to enable stronger customer communication and to drive traffic to our stores and websites. Going forward, we plan to continue investing in software solutions that further develop our omni-channel platform and enhance our customer engagement capabilities, and we will also continue to invest in tools to improve the quality of the in-store eye exam experience. Since eye exams are a critical service element of our business, we believe that investing in technology to improve this experience will aid in retention of both customers and optometric talent. We are regularly presented with opportunities to invest in technological innovators across the optical retail industry and we have invested $8.6 million in venture-backed emerging companies since June 2014. We believe that these investments provide direct access to optical technology innovators, giving us a deeper understanding of emerging trends and developments. We are thus in a better position to evolve our products and services to meet the needs of our customers.
Explore Strategic Opportunities. We will selectively evaluate strategic acquisition opportunities from time to time as part of our growth strategy.
13
Our Products and Services
Within our two reportable segments, we primarily offer two products and one service: eyeglasses, contact lenses and eye exams. Nonetheless, our diverse product portfolio encompasses many brand names and thousands of SKUs. Depending on the brand, our stores display approximately 600 to 1,935 eyeglass frame SKUs, covering all age groups. Offerings include both brand name designers, like Ray-Ban, Guess and Calvin Klein, as well as private label options at attractive prices. Our frames are manufactured by market leaders such as Luxottica, Marchon and Zyloware, as well as private label brands made for us in Asia. We also offer a broad portfolio of lenses, including single vision and bifocal lenses, with a variety of treatments to enhance vision. Through one-on-one consultative-selling, our sales associates have a number of opportunities to share information about value-added lenses, including thinner lenses and photochromatic options, which carry higher margins. As a result, a significant number of America’s Best customers and Eyeglass World customers who purchase eyeglasses choose upgraded lenses and/or frames instead of each brand’s base offer. We also offer contact lenses and accessories from all major contact lens manufacturers, including our own private label brand (Sofmed, made by CooperVision) that is offered in our America’s Best and Eyeglass World stores. Collectively, our broad product offerings deliver consistent financial results and reduce our reliance on any individual product, style or trend.
In both of our reportable segments, eye exam services are provided by optometrists employed by us or by professional corporations owned by eye care practitioners with whom we have contractual arrangements or by independent optometrists who have not formed such corporations and with whom we have contracted.
Within our owned & host segment, America’s Best offers its Eyecare Club programs primarily to its contact lens customers. As of December 30, 2017, the Eyecare Club had approximately 1.3 million active members. Benefits of the Eyecare Club include two free eye exams per year for the duration of the multi-year membership, 10% off all replacement contact lenses and eyeglasses and other periodic benefits and discounts, such as free samples of contact lens solutions. Memberships can be purchased in stores or on our America’s Best website. Two separate club memberships are available: the three-year Silver membership, which costs $99, and the five-year Gold membership, which costs $139. By comparison, the cost of a contact lens exam, exclusive of the Eyecare Club, is $79. There is a high adoption rate of Eyecare Club membership by America’s Best customers who are not part of a managed care program and who visited an America’s Best store for a contact lens examination. The disposable nature of contact lenses means that customers must replenish their contacts frequently, and in order to refill their prescriptions, contact lens users must have a current prescription. For a prescription to be current, customers generally need to have an eye exam every one or two years, depending on the state in which they reside. The multiyear nature of these memberships facilitates repeat traffic to America’s Best stores for exams and contact lens purchases and builds customer loyalty. The Eyecare Club also has attractive working capital characteristics, as customers pay the full membership cost at the time that they join.
See Note 14. “Segment Reporting” in our audited consolidated financial statements included in Part II. Item 8. of this Form 10-K for additional information.
Our Customers
Our customers need to see their best to perform their jobs, care for their families and contribute to their communities. Purchasing decisions are based on value, quality of service, fashion, location and eye health, among others. Based on a variety of third-party research studies, we have found that our customers typically prioritize value and convenience above other considerations. Value encompasses a combination of eye health with quality products and services, all offered at a fair price. Convenience encompasses multiple vectors: (i) retail locations near where our customers work and shop, with easy, convenient parking, (ii) store hours that fit their lifestyles, (iii) product selection that achieves aesthetic and/or fashion goals, (iv) availability of on-site eye exams and (v) acceptance of certain vision insurance benefits.
For our two owned brands, we have developed specific customer demographic profiles. More specifically, we estimate that our typical America’s Best customer has a household income between $35,000 to $100,000, is a high school graduate, holds a blue collar job and is between 35 to 64 years old, while our typical Eyeglass World customer is slightly more affluent, has a college degree or higher, holds a professional or technical job and is between 35 to 79 years old. These profiles demonstrate that, even within the same market, our America’s Best and Eyeglass World brands appeal to and attract a different consumer, which speaks favorably to our growth potential and our ability to open new stores of both brands in the same markets.
14
Our Sales and Marketing
We developed our marketing strategy based on the in-depth knowledge we have of our customers. Our brands are positioned to stand for low prices and great value, which resonate with our target consumers and leave a lasting impression that is distinct from the competition.
We believe that television is a key channel for connecting with our customers. Approximately two-thirds of America’s Best and Eyeglass World’s advertising expenditures are on traffic-driving television advertisements, which we leverage broadly across multiple stores in each television market to gain a larger share of voice, and, in turn, drive traffic and margins. Our recent America’s Best expansion into California has allowed us to shift from local campaigns to purchasing television advertising nationally, starting in the first quarter of fiscal year 2017, which we believe is more cost effective. We expect that this national campaign will raise our brand awareness in both existing and new markets, allowing us to save advertising spend when entering new markets.
For our host and legacy brands, we rely on our host and legacy partners’ marketing initiatives to drive traffic into their stores, and then we develop and execute highly targeted local marketing campaigns within stores to create awareness of our service and product offerings.
Our customer relationship management (“CRM”) system is used to collect customer demographic data. With this information and the third-party data that we use to supplement the customer information, we create targeted mailing lists (both direct mail and email) to send communications to our customers based on their vision needs and interests to help improve retention of our existing customers. In addition to our CRM program, digital advertising is a critical component of our media mix, as we believe both of these programs generate a high rate of return. Potential customers gain awareness of our brands through paid and organic digital efforts via content, video and social media that lead them to our websites.
Our Sourcing and Supplier Relationships
We purchase our merchandise from a wide variety of vendors, with no vendor accounting for more than 20% of our total cost of products sold. We are a large customer for all of our suppliers and we strive to form meaningful, long-lasting and mutually beneficial relationships with our vendors. We have long-term contracts with certain of our suppliers, including Essilor and CooperVision. Under our agreement with Essilor, Essilor has the sole and exclusive right to supply certain lenses for eyeglasses to us. Our agreement with Essilor expires on December 31, 2018, automatically renewing for one-year terms unless a party elects to terminate upon 90 days’ written notice. We are collaborative in our vendor negotiations so as to develop a partnership with our vendors and, in time, a sense of loyalty to National Vision. Each of our top ten vendors has been with us for at least ten years, and several of these vendors have been with us since our inception in 1990. We focus on sourcing low-cost products, including discounted well-known frame brands, secondary frame brands, direct import frames and private label contact lenses under our Sofmed label. By investing in our sourcing operations, we have increased our direct importation of eyeglass frames, which has enabled us to offer high quality frames at low prices while also generating strong gross margins.
Our Optical Laboratories
We use a highly-efficient mix of three domestic, company-operated processing facilities and two international, outsourced facilities. We have state-of-the-art lens processing capabilities in our three, geographically-diverse company-operated production facilities in Lawrenceville, Georgia, St. Cloud, Minnesota and Salt Lake City, Utah. In addition, we intend to enter into a lease for an additional laboratory facility in 2018 and expect the laboratory to be operational in time for the first quarter 2019. Our centralized optical laboratories handle all aspects of customizing eyeglass lenses, and have digital capabilities for grinding, coating and edging to customer prescription and eyeglass frame specifications. We have developed a high-volume, low-cost lens processing model to provide seven-day turnaround service through our domestic owned laboratories and our international partner laboratories. This network was created through significant investment by us, and is leveraged across our portfolio of brands in both segments to provide efficiency and scale. We route eyeglass orders to both our owned and outsourced laboratories through an automated decision tree that incorporates information on (i) the nature of the job; (ii) the technical capabilities of each laboratory; (iii) the capacity of each laboratory; (iv) the inventory at each laboratory; and (v) the cost of that particular type of job at each laboratory. This architecture is integrated with the point-of-sale system and enables us to minimize our processing costs, while ensuring on-time deliveries. The processing system is designed such that the more eyeglasses we sell, the more efficient the laboratories become, creating significant cost savings over time.
In addition, our Eyeglass World stores are equipped with on-site laboratories, which typically process less complicated customer orders with same-day service. On-site laboratories can process a variety of lens options. For fiscal year 2017, over half of Eyeglass World in-store customer orders were processed entirely in the store. All lens orders that are not processed or completed in-store are processed or completed by our centralized laboratory network.
15
Our Distribution Network
Our approximately 66,000 square foot distribution center in Lawrenceville, Georgia is located near our corporate offices in Duluth, Georgia. We utilize third-party carriers to transport all of our products from this distribution center to our stores.
Our approximately 52,000 square foot distribution center in Columbus, Ohio is located close to the headquarters of our AC Lens subsidiary. We utilize third-party carriers to transport our products from this distribution center directly to customers and to store locations for our partners.
We believe that the size and scalability of our distribution centers is more than sufficient to support our future expansion over the next four to five years.
Our Employees
As of December 30, 2017, we had 10,902 full-time and part-time employees, inclusive of employees of the professional corporations with which we contract. We are not a party to any collective bargaining agreements. We have never experienced a strike or work stoppage, and we believe that our relations with employees are excellent.
Managed Vision Care
We are currently underpenetrated in the managed care market relative to the broader optical retail industry, and we believe that this represents an important opportunity for us in the future. Although we have relationships with many of the major insurance and vision care companies, we believe that there are opportunities for us to expand existing relationships as well as to create new ones. We strive to create a high-quality, high-satisfaction experience for both our in-store customers and managed care partners. Through our point-of-sale system and our back-office electronic data interchange, or EDI, capabilities, we attempt to create a seamless transactional experience for our in-store managed care customers. From time to time, vision care insurance payors may make changes to their EDI claim systems. Such changes may require us to update our processes and could impact our ability to submit claims or to timely receive reimbursements from our managed care partners. As such, when asked, we have assisted a number of our larger vision care insurance payors to either implement or improve their EDI claim systems.
We monitor both industry and national healthcare changes and are well-positioned to take advantage of these changes due to our low-cost offerings and strong electronic infrastructure. We expect to continue to grow the managed care component of our business through our relationships and partnership initiatives with managed care payors.
Competition
The optical retail industry is highly competitive. Competition is generally based upon brand name recognition, price, convenience, selection, service and product quality.
We operate within the value segment of the U.S. optical retail industry, which emphasizes price and value. This segment is fragmented. We compete with mass merchants and warehouse club stores, specialty retail chains and independent eye care practitioners and opticians. In the broader optical retail industry, we also compete with large national retailers such as (in alphabetical order) LensCrafters, Pearle Vision and Visionworks. This competition takes place both in physical retail locations and online.
We also compete with online sellers of contact lenses and eyewear. The online sale of contact lenses has steadily increased in particular since the passage of the Fairness to Contact Lens Consumers Act. See Part I. Item 1. “Business-Government Regulation.” The online sale of eyeglasses has not developed as quickly, but a number of firms are focused on this market, including Warby Parker and Zenni Optical. We also face potential competition from companies that employ emerging technologies in the optical industry, including, for example, online vision exams and 3D printing of eyewear.
We also compete to be a provider under managed care contracts, which can provide us with access to new customers and also allow us to better serve our customers who are covered by managed care by filing claims directly with the payor and collecting only the applicable co-pay amount from these customers. Competition is based on many factors, including price and the density of the provider network. Several large managed care payors are vertically integrated, with substantial retail networks. We have, in the past, and may, in the future, experience heightened challenges to be admitted as a provider to these networks or to maintain our status in them.
Seasonality
Our business is moderately seasonal in nature. Historically, our business has realized a higher portion of revenue, operating income and cash flows from operations in the first fiscal quarter, and a lower portion of net revenue, operating income and cash flows from operations in the fourth fiscal quarter. The seasonally larger first quarter is attributable
16
primarily to the timing of our customers’ income tax refunds and annual health insurance program start/reset periods. We believe that many customers in our target market, which consists of cost-conscious and low-income consumers, rely on tax refunds to pay for eyewear and eye care. A delay in the issuance of tax refunds can accordingly have a negative impact on our financial results. Consumers could also alter how they utilize tax refund proceeds.
With respect to our fourth quarter results, compared to other retailers, our products and services are less likely to be included in consumer’s holiday spending budgets, therefore reducing spending on personal vision correction during the weeks preceding December 25 of each year. Additionally, although the period between December 25 and the end of our fiscal year is typically a high-volume period, the net revenue associated with substantially all orders of prescription eyeglasses and contact lenses during that period is deferred until January due to our policy of recognizing revenue only after the product has been accepted by the customer, further contributing to higher first quarter results. Our quarterly results may also be affected by the timing of new store openings and store closings, the amount of sales contributed by new and existing stores, as well as the timing of certain holidays.
Information Technology
Information technology systems are critical to our day-to-day operations as well as to our long-term growth strategies. Our systems are designed to deliver a consistent, scalable, high-performing and secure experience for our customers and partners. We utilize a combination of co-location data center and cloud-based solutions for our infrastructure and the majority of our applications consist of standard, integrated software solutions. Our systems provide the data analysis and automation necessary to support our marketing, merchandising, inventory, distribution, store operations and point-of-sale, e-commerce, finance, accounting and human resources initiatives. We believe our current systems allow us to identify and respond to operating trends in our business.
Since 2011, we have modernized our point-of-sale system, upgraded multiple financial package components and are currently implementing software systems to enhance the growth of our omni-channel and customer engagement efforts. We believe this implementation, along with maintenance of our existing information technology capabilities, will provide the flexibility and capacity to accommodate our future growth plans.
Intellectual Property
We own a number of registered and common law trademarks and pending applications for trademark registrations in the United States, primarily through our subsidiaries, including: America’s Best, America’s Best & design, America’s Best Contacts & Eyeglasses, America’s Best Contacts & Eyeglasses & design, America’s Best Vision Plan, America’s Best owl mascot image, the slogan “It’s not just a better deal. It’s America’s Best.,” Eyeglass World, Eyeglass World logos, the slogans “See yourself smile. See yourself save.,” “The world’s best way to buy glasses,” and “The world’s best way to buy contacts,” the Eyeglass World mast image Mr. World, AC Lens, FirstSight, Vista Optical, Eyecare Club, Sofmed, Digimax, Neverglare, Neverglare Advantage and Neverglare Advantage & design. Solely for convenience, the trademarks, service marks and tradenames referred to in this report are presented without the ®, SM and ™ symbols, but such references are not intended to indicate, in any way, that we will not assert, to the fullest extent under applicable law, our rights or the rights of the applicable licensors to these trademarks, service marks and tradenames. All trademarks, service marks and tradenames appearing in this Form 10-K (or in documents we have incorporated by reference) are the property of their respective owners.
Government Regulation
Our operations are subject to extensive federal, state, provincial and local laws and regulations. Because of the various facets of our business, the scope and extent of laws and regulations applicable to our business are always subject to the risk of change or material increase. Noncompliance with these laws and regulations can subject us to sanctions (including suspension and loss of operating licenses), fines or various forms of civil or criminal prosecution, any of which could have a material adverse effect on our reputation, business, financial position, results of operations and cash flows. See Part I. Item 1A. “Risk Factors” below for a discussion of these and other risks. A summary of certain laws and regulations is described below.
Corporate Practice of Medicine/Optometry and Similar Laws
Many states prohibit the corporate practice of medicine/optometry where a business corporation practices medicine or employs a physician to provide professional medical services. Many states interpret the corporate practice of medicine/optometry rules broadly to prohibit employment of eye care practitioners by corporations like us and to prohibit various financial arrangements, such as fee-splitting, between eye care practitioners and other entities. A number of states that permit these relationships nevertheless regulate them extensively. For example, some states prohibit a common entrance to a retail optical location and an optometric office. These laws and regulations can vary significantly by state, requiring us to tailor our operations in each state to the particular laws of such state. Many of these laws and regulations are
17
vague and are subject to the interpretation of regulators and enforcement authorities, which may change over time. States periodically revisit these laws and regulations and we are subject to the ongoing risk that the regulatory scheme in any state can change in ways adverse to us. Our America’s Best operations, which feature a bundled offer of eyeglasses and an eye examination, are particularly implicated by these laws.
Professional Licensure and Regulation
Our operations are also subject to state licensing laws. All states license the practice of ophthalmology and optometry and many states license opticians. The dispensing of prescription eyewear is further regulated in most states in which we do business. In some states, we are also required to register our stores.
Fairness to Contact Lens Consumers Act (“FCLCA”)
In connection with our sales of contact lens, we must comply with the FCLCA, and its implementing regulations, which establish a national uniform standard in the United States with regard to releasing and verifying contact lens prescriptions. This law also contains a “passive verification” requirement pursuant to which a prescription is deemed verified if a prescriber fails to respond within eight business hours to a request by a seller for confirmation of the accuracy of the prescription.
Managed Care Regulation
We are engaged in managed vision care, both as a managed care entity and as a provider to managed care payors and insurers. In California, our subsidiary, FirstSight, a specialized health maintenance organization (“HMO”), is subject to the managed care laws of the State of California and is licensed and comprehensively regulated by the California Department of Managed Health Care (the “DMHC”). These regulations contain operating, disclosure, reporting, and financial viability requirements, among others. Material changes to the operations of FirstSight, including the opening of America’s Best locations outside of defined service areas, must be approved by the DMHC. This approval process can be complex and can cause delays in the projected opening of our stores. We also offer Eyecare Club programs pursuant to which, in exchange for a fixed payment, individuals can obtain eye examinations and discounts on eyeglasses, contact lenses and accessories during the program period. These programs may be subject to regulation under managed care and related state laws, including those of California, where these programs are offered as managed care products by FirstSight. In addition, our Eyecare Club programs may subject us to state statutes regulating discount medical plans. These laws, which have been adopted in a number of states, require the licensing or registration of organizations that provide discounted access to health care providers. It is possible that state regulators could determine that we are operating as a discount medical plan and as such are subject to the various registration, disclosure and solvency requirements.
Privacy and Security
We directly collect, use, access, disclose, transmit and/or store protected health information (“PHI”) and personally identifiable information (“PII”) in connection with the sales of our products and services, customer service, billing and employment practices. As a health care provider and as a business associate to health care providers, we are subject to federal and comparable state laws governing privacy and security, including the Health Insurance Portability and Accountability Act of 1996 (“HIPAA”) and its implementing regulations, such as the Privacy Rule, the Security Rule and the Breach Notification Rule. The Health Information Technology for Economic and Clinical Health Act of 2009 (the “HITECH Act”) extends the Privacy Rule and the Security Rule directly to business associates. We are also subject to comparable state health privacy laws to the extent they are more protective of individual privacy than the Privacy Rule. Nearly all states have adopted their own data breach laws with comparable (and sometimes conflicting) standards and requirements. These state laws apply to breaches of specified elements of personal information.
Laws Related to Reimbursement by Government Programs
Our participation in federal reimbursement programs, such as Medicare and Medicaid, subjects us to federal anti-kickback, false claims, self-referral and similar laws. The federal Anti-Kickback Statute prohibits, among other things, persons from knowingly and willfully soliciting, offering, paying, receiving or providing remuneration, directly or indirectly, to induce, or in exchange for, the referral of an individual or purchasing, furnishing, recommending or arranging for a good or service for which payment may be made under a federal healthcare program, such as Medicare or Medicaid. The definition of “remuneration” has been broadly interpreted to include anything of value, including, for example, gifts, certain discounts, the furnishing of free supplies, equipment or services, credit arrangements, payment of cash and waivers of payments. Several courts have found a violation of the statute’s intent requirement if a single purpose of an arrangement involving remuneration is to induce referrals of federal healthcare covered businesses. There are also a number of healthcare fraud statutes that impose criminal and civil liability for, among other things, knowingly and willfully executing, or attempting to execute, a scheme to defraud any healthcare benefit program, or knowingly
18
and willfully falsifying, concealing or covering up a material fact or making any materially false statement, in connection with the delivery of, or payment for, healthcare benefits, items or services. A person or entity does not need to have actual knowledge of the Anti-Kickback Statute or healthcare fraud statutes, or specific intent to violate them in order to have committed a violation. Many states have adopted similar laws that apply to any third-party payors including commercial plans.
In addition, the federal Anti-Kickback Statute provides that any claim for government reimbursement in violation of the statute also violates the False Claims Act (“FCA”). The FCA prohibits intentionally submitting, conspiring to submit, or causing to be submitted, false or otherwise improper claims, records or statements to the federal government, or intentionally failing to return overpayments, in connection with reimbursement by federal government programs. Most states have enacted false claims laws analogous to the FCA, and both federal and state false claims laws permit private individuals to file qui tam or “whistleblower” lawsuits on behalf of the federal or state government. The Social Security Act also imposes significant penalties for false or improper Medicare and Medicaid billings.
The U.S. Physician Self-Referral Law, or the Stark Law, generally prohibits physicians (which the Stark Law defines to also include optometrists) from referring, for certain services, Medicare or Medicaid beneficiaries to any entity with which the physician or an immediate family member of the physician has a financial relationship. This law further prohibits the entity receiving a prohibited referral from presenting a claim for reimbursement by Medicare or Medicaid for services furnished pursuant to the prohibited referral. Many states have adopted similar self-referral laws which are not limited to Medicare or Medicaid reimbursed services. In some cases, the rental of space constitutes a financial relationship under this law.
Federal Food and Drug Administration (“FDA”) Regulation
The FDA generally has authority to, among other things, regulate the manufacture, distribution, sale and labeling of medical devices, including contact and spectacle lenses. Under the U.S. Federal Food, Drug and Cosmetic Act (the “FDC Act”), medical devices must meet a number of regulatory requirements. We engage in certain manufacturing, repackaging and relabeling activities at our optical laboratories and at certain Eyeglass World stores, which subject us to the FDA’s registration, listing, and quality requirements. We are required to register our laboratories with the FDA.
Consumer Protection Laws
Federal and state consumer protection laws and regulations can apply to our operations and retail offers. Some of our promotions, such as our America’s Best offer of a “free” eye exam, are subject to compliance with laws and regulations governing use of this term. The Federal Trade Commission (“FTC”) has authority under Section 5 of the Federal Trade Commission Act (the “FTC Act”) to investigate and prosecute practices that are “unfair trade practices,” “deceptive trade practices,” or “unfair methods of competition.” State attorneys general typically have comparable authority and many states permit private plaintiffs to bring actions on the basis of these laws. In addition, state regulators or boards of optometry may challenge our promotional practices, including America’s Best’s bundled offers, as, among other things, violating applicable state laws regarding unfair competition or false advertising to consumers.
E-commerce Laws
Our e-commerce business, operated by our subsidiary AC Lens, must comply with various federal and state laws, most notably the FCLCA, and its implementing regulation, the Contact Lens Rule, adopted by the FTC. This law and Rule require that, before we sell contact lenses online, we verify the prescriptions we receive from our customers. A violation of the Contact Lens Rule constitutes an unfair or deceptive act or practice under the FTC Act. Our online business must also be registered in various states. Our international sales online can also implicate other laws, particularly the requirements under the Treasury Department’s Office of Foreign Assets Control (“OFAC”), which prohibit us from engaging in transactions with certain individuals and companies designated by OFAC. In addition, although we do not have material online sales to the European Union, the General Data Protection Regulation of the European Union, which will be effective in May 2018, will apply to these transactions.
Foreign Corrupt Practices Act (“FCPA”)
We source a significant portion of our products from outside the United States. The FCPA and other similar anti-bribery and anti-kickback laws and regulations generally prohibit companies and their intermediaries from making improper payments or offering anything of value to non-U.S. officials for the purpose of obtaining or retaining business. Our policies and our code of conduct mandate compliance with applicable law, including these laws and regulations.
Payment Card Industry Data Security Standard (“PCI Standard”)
Because we accept debit and credit cards for payment, we are subject to the PCI Standard, which contains compliance guidelines with regard to our security surrounding the physical and electronic storage, processing and transmission of
19
cardholder data. Certain states have incorporated these requirements into state law. Our credit card agreements with our banks require that we comply with this standard and pay for any fines and assessments imposed by the credit card companies in the event of a compromise of card data.
Service Contract Regulations
We offer product protection plans for our eyeglasses; in certain states, service contract and similar laws regulate these plans. These laws, which vary by state, mandate that sellers of such contracts comply with various registration, disclosure and financial requirements. It is possible that regulators in certain states could determine that our extended warranty plans should be subject to these laws.
Environmental and Safety Regulation
Our optical laboratories in the United States and our in-store laboratories in our Eyeglass World locations subject us to various federal, state and local laws, regulations and other requirements pertaining to protection of the environment, public health and employee safety, including, for example, regulations governing the management of hazardous substances, and the maintenance of safe working conditions. These laws also apply generally to all our properties. Our failure to comply with these laws can subject us to criminal and civil liabilities.
Insurance and Risk Management
We use a combination of insurance and self-insurance for workers’ compensation, general liability, property insurance, director and officers’ liability insurance, vehicle liability and employee health-care benefits, among others. Liabilities associated with the risks that are retained by us are estimated, in part, by considering historical claims experience, demographic factors, severity factors and other actuarial assumptions. Where we have retained risk through self-insurance or similar arrangements, we utilize third-party firms to assist management in assessing the financial impact of risk retention.
Item 1A. Risk Factors
You should carefully consider the risks described below and the other information contained in this report and other filings that we make from time to time with the SEC, including our consolidated financial statements and accompanying notes. Any of the following risks could materially and adversely affect our business, financial condition, results of operations or liquidity. These risks are not the only risks we face. Our business, financial condition, results of operations or liquidity could also be adversely affected by additional factors that apply to all companies generally or by risks not currently known to us or that we currently view to be immaterial. We can provide no assurance and make no representation that our risk mitigation efforts, although we believe they are reasonable, will be successful.
Risks Related to Our Business and Our Industry
If we fail to open and operate new stores in a timely and cost-effective manner or fail to successfully enter new markets, our financial performance could be materially and adversely affected.
Our growth strategy depends, in large part, on growing our store base and expanding our operations, both in existing and new geographic regions, and operating our new stores successfully. We cannot assure you that our contemplated expansion, including our further expansion in the California market and our expansion in Northern New Jersey and parts of the New York metro area, will be successful. Our costs in these and other new markets may increase due to the supply and demand for real estate sites as well as increased labor and other costs.
Our ability to successfully open and operate new stores depends on many factors, including, among others, our ability to:
• | recruit and retain qualified vision care professionals (who may be licensed or unlicensed, depending on state regulations) for any new store; |
• | address regulatory, competitive, merchandising, marketing, distribution and other challenges encountered in connection with expansion into new markets; |
• | hire, train and retain an expanded workforce of store managers and other personnel; |
• | maintain adequate laboratory, distribution facility, information system and other operational system capabilities; |
• | successfully integrate new stores into our existing management structure and operations, including information system integration; |
• | negotiate acceptable lease terms at suitable retail locations; |
• | source sufficient levels of inventory at acceptable costs; |
• | obtain necessary permits and licenses; |
20
• | construct and open our stores on a timely basis; |
• | generate sufficient levels of cash or obtain financing on acceptable terms to support our expansion; |
• | participate in managed care arrangements for new stores; |
• | achieve and maintain brand awareness in new and existing markets; and |
• | identify and satisfy the merchandise and other preferences of our customers. |
Our failure to effectively address challenges such as these could adversely affect our ability to successfully open and operate new stores in a timely and cost-effective manner.
In addition, there can be no assurance that newly-opened stores will achieve net sales or profitability levels comparable to those of our existing stores in the time periods estimated by us, or at all. If our stores fail to achieve, or are unable to sustain, acceptable total net sales and profitability levels, our business may be materially harmed and we may incur significant costs associated with closing those stores. Our plans to accelerate the growth of our store base may increase this risk.
Accordingly, we cannot assure you that we will achieve our planned growth or, even if we are able to grow our store base as planned, that our new stores will perform as expected. Our failure to implement our growth strategy and to successfully open and operate new stores in the time frames and at the costs estimated by us could have a material adverse effect on our business, financial condition and results of operations.
We will require significant capital to fund our expanding business. If we are unable to maintain sufficient levels of cash flow from our operations, we may not be able to execute or sustain our growth strategy or we may require additional financing, which may not be available to us on satisfactory terms or at all.
To support our expanding business and execute our growth strategy, we will need significant amounts of capital, including funds to pay our lease obligations, build out new store spaces, laboratories and distribution centers, purchase inventory, pay personnel and further invest in our infrastructure and facilities. Further, our plans to grow our store base may create cash flow pressure if new locations do not perform as projected. We have and expect to continue to primarily depend on cash flow from operations to fund our business and growth plans. If we do not generate sufficient cash flow from operations, we may need to obtain additional equity or debt financing. Tightening in the credit markets, low liquidity and volatility in the capital markets could result in diminished availability of credit, higher cost of borrowing and lack of confidence in the equity market, making it more difficult to obtain additional financing on terms that are favorable to us. If such financing is not available to us, or is not available on satisfactory terms, our ability to operate and expand our business could be curtailed and we may need to delay, limit or eliminate planned store openings or operations or other elements of our growth strategy.
Failure to recruit and retain vision care professionals for our stores could adversely affect our business, financial condition and results of operations.
Our ability to hire and/or contract with vision care professionals for our stores is critical to our operations as well as our growth strategy. Our operations, like those of many of our competitors, depend on our ability to offer both eyewear and eye exams. In particular, our America’s Best brand promotes bundled offers of eyewear and eye exams, which require the availability of optometrists in or near our stores. Furthermore, many states require that opticians be licensed to dispense and fit eyeglasses and contact lenses. In addition, failure to have vision care professionals available in or near our stores could adversely affect our ability to win managed vision care contracts.
Our ability to attract and retain vision care professionals depends on several factors. We compete with other optical retail companies, health systems and group practices for vision care professionals. We, as well as the professional corporations that employ optometrists in our retail locations, could face difficulties attracting and retaining qualified professionals if we or such corporations fail to offer competitive compensation and benefits. Increased compensation for vision care professionals could raise our costs and put pressure on our margins. We believe that the demand for optometrists in particular is likely to exceed supply in the near future and that the costs to employ or retain optometrists are likely to increase, potentially materially, from current levels.
Additionally, our ability to recruit, hire and/or contract with vision care professionals is closely regulated. For example, there is a risk that state authorities in some jurisdictions may find that our contractual relationships with our optometrists or professional corporations that employ optometrists violate laws prohibiting the corporate practice of medicine/optometry, in which case we may be required to restructure these arrangements, which may make it more difficult for us to attract and retain their services. See Part I. Item 1. “Business-Government Regulation.”
A material change in our relationship with vision care professionals, whether resulting from a dispute with an eye care practitioner or a group of eye care practitioners controlling multiple practice locations, a government or regulatory authority challenging our operating structure or our relationship with vision care professionals or other changes to
21
applicable laws or regulations (or interpretations of the same), or the loss of these relationships, could impair our ability to provide services to our customers, cause our customers to go elsewhere for their optical needs, or result in legal sanctions against us. In addition, some optometrists provide, through their professional corporations, the vision care services at a number of our retail locations, exposing us to some concentration risk. A material change to any of the foregoing relationships could have a material adverse effect on our business, financial condition and results of operations. Any difficulties or delays in securing the services of these professionals could also adversely affect our relationships with our host and legacy partners.
We are subject to extensive state, local and federal vision care and healthcare laws and regulations and failure to adhere to such laws and regulations would adversely affect our business.
We are subject to extensive state, local and federal vision care and healthcare laws and regulations. See Part I. Item 1. “Business-Government Regulation.”
Many states regulate relationships between optical retailers and eye care practitioners. Many states interpret the corporate practice of medicine/optometry rules broadly to prohibit employment of eye care practitioners by corporations like us and to prohibit various financial arrangements, such as fee-splitting, between eye care practitioners and other entities. We have implemented arrangements with optometrists and professional corporations owned by eye care practitioners that regulators could seek to challenge, such as America’s Best’s bundled offers of eye exams and eyewear. The laws applicable to us are also subject to evolving interpretations. As such, we must monitor our compliance with laws in every jurisdiction in which we operate on an ongoing basis and we cannot guarantee that subsequent interpretation of or changes to the applicable laws will not further circumscribe our business operations. In addition, the arrangements into which we have entered could subject us to additional scrutiny by federal and state regulatory bodies regarding federal and state fraud and abuse laws.
All states license the practice of ophthalmology and optometry and many states license opticians. The dispensing of prescription eyewear is further regulated in most states in which we do business. In some states, we are also required to register our stores. Our failure, or the failure of vision care professionals who are our employees or with whom we have contractual arrangements, to obtain and maintain appropriate licenses could result in the unavailability of vision care professionals in or near our stores, loss of sales and/or the closure of our stores without licensed professionals.
We must also comply with the FCLCA and its implementing regulations, with respect to verifying contact lens prescriptions in connection with our online sales of contact lenses. Our extended warranty plans may subject us to state laws, which vary by state, that regulate the sale of product service contracts. It is possible that regulators in certain states could determine that our warranty plans should be subject to these laws and mandate that we comply with various registration, disclosure and financial requirements. In such event, we could be required to incur enhanced compliance costs, as well as the risk of cease and desist orders and monetary penalties.
We are subject to HIPAA, the HITECH Act, and the health data privacy, security and breach notification regulations issued pursuant to these statutes, which govern our collection, use, access, disclosure, transmission and/or storage of PHI, in connection with the sales of our products and services, customer service, billing and employment practices. In addition, there are state privacy, security and breach notification laws and regulations that apply to both PHI and PII collected by us. Our failure to effectively implement the required or addressable data privacy and security safeguards and breach notification procedures, or our failure to accurately anticipate the application or interpretation of these statutes, regulations and standards, could lead to invalidation or modification of our agreements with optometrists or professional corporations owned by eye care practitioners, create material civil and/or criminal liability for us or require us to change our business practices, which could result in adverse publicity, and have a material adverse effect on our business, financial condition and results of operations. In addition to applicable U.S. law, the collection, use, access, disclosure, transmission and storage of PHI and other sensitive data is subject to regulation in foreign jurisdictions in which we do business or expect to do business in the future, in particular through the operations of our websites, and data privacy and security laws and regulations in some of these jurisdictions may be more stringent than those in the United States (such as the European Union, which adopted the General Data Protection Regulation, which will become effective in May 2018).
22
Our participation in federal healthcare programs, such as Medicare and Medicaid, requires us to comply with laws regarding the way in which we conduct business and submit claims. These laws include the federal anti-kickback statute, which attaches criminal liability to unlawful inducements for the referral of business reimbursable under federally-funded healthcare programs; the federal self-referral laws, which attach repayment and monetary damages where a healthcare service provider seeks reimbursement for providing certain services to a patient who was referred by a physician that has certain types of direct or indirect financial relationships with such service provider; and the FCA, which attaches per-claim liability and potentially treble damages to the filing of false claims for federal payment. Many states have also adopted similar laws that apply to any third-party payor including commercial plans. Our operating results could be negatively impacted by developments in these areas due to the costs of compliance in addition to possible civil and criminal penalties, litigation and exclusion from government healthcare programs in the event of deemed noncompliance.
In addition, a person who offers or transfers to a federal healthcare program beneficiary any remuneration, including the transfer of items or services for free or other than fair market value, that the person knows or should know is likely to influence the beneficiary’s selection of a particular provider, practitioner or supplier of Medicare or Medicaid payable items or services, may be liable for significant civil monetary penalties. Although this prohibition applies only to federal healthcare program beneficiaries, the provision of free items and services to patients covered by commercial payors may implicate applicable state laws related to, among other things, unlawful schemes to defraud, excessive fees for services, tortious interference with patient contracts and statutory or common law fraud. In addition, state regulators or boards of optometry may also challenge our promotional practices, including America’s Best’s bundled offers, as, among other things, violating applicable state laws regarding unfair competition or false advertising to consumers. To the extent our promotional programs are found to be inconsistent with applicable laws, we may be required to restructure or discontinue such programs, or be subject to other significant penalties.
Eyeglasses and contact lenses are regulated as medical devices in the United States by the FDA, and under the FDC Act, such medical devices must meet a number of regulatory requirements. We do not hold any marketing authorizations for the eyeglasses and contact lenses that we sell as we serve as the retailer for third-party manufacturers’ devices. We cannot provide assurance that such third-party manufacturers’ eyeglasses or contact lenses we sell comply with these regulatory requirements. We also engage in certain manufacturing, repackaging and relabeling activities that subject us to direct oversight by the FDA under the FDC Act and its implementing regulations. If we, or any of the third-party manufacturers whose products we sell, fail to comply with applicable requirements, we or they may be subject to legal action by the U.S. Department of Justice, (“DOJ”), on behalf of the FDA and/or various forms of FDA enforcement and compliance actions, which include recalls, fines, penalties, injunctions, seizures, prosecutions, adverse publicity (such as FDA press releases) or other adverse actions.
Our failure to comply with the applicable regulations could have severe consequences, including the closure of our stores, possible breaches of the agreements relating to certain of our brands, changes to our way of doing business, and the imposition of fines and penalties.
Future operational success depends on our ability to develop and maintain relationships with managed vision care companies, vision insurance providers and other third-party payors.
An increasing percentage of our customers receive vision insurance coverage through managed care payors. These payors represent an increasingly significant portion of our overall revenues and our revenue growth. Currently, a relatively small number of payors comprise the majority of our managed care revenues, subjecting us to concentration risk. Our future operational success could depend on our ability to negotiate contracts with managed vision care companies, vision insurance providers and other third-party payors, several of whom have significant market share. We may be unable to establish or maintain satisfactory relationships with managed care and other third-party payors. In addition, many managed care payors have existing provider structures in place that they may be unable or unwilling to change. Some vertically-integrated payors also have their own networks, and these payors may take actions to maintain or protect these networks in ways that negatively affect us, including by not allowing our new or existing stores to participate in their networks. Increasing consolidation in the optical industry may give such payors greater market power which may adversely affect our ability to negotiate reimbursement rates under managed care arrangements. Our inability to enter into arrangements with managed care payors in the future could have a material adverse effect on our business, financial condition and results of operations. In addition, delays in receiving or the failure to receive reimbursements under our managed care arrangements or the loss of a significant managed care contract or relationship could have a significant negative impact on our business, financial condition and results of operations.
23
If we are unable to maintain our current operating relationships with our host and legacy partners, our business, profitability and cash flows may be adversely affected.
We derive significant revenues and operating cash flows from our relationships with our legacy and host partners through our operations of 227 Vision Centers in Walmart stores, 29 Vista Optical locations within Fred Meyer stores and 56 Vista Optical locations on military bases. Through our subsidiary, FirstSight, we also provide or arrange for the provision of optometric services at almost all of the optometric offices next to Walmart stores and Sam’s Club locations in California.
Termination of our host and legacy agreements could result in a reduction of our revenues and operating cash flows, which could be material and which could adversely affect our business, financial condition and results of operations. The loss of our Vision Centers or Vista Optical locations could impair our ability to attract and retain management and retail associates, compete for managed vision care contracts, obtain favorable terms, such as discounts and rebates, from optical vendors and generate cash to fund our business and service our debt obligations. We may seek to replace any lost host or legacy locations with new America’s Best or Eyeglass World stores but we may not be able to replace the lost revenues and cash flows.
For example, our current management & services agreement with Walmart presents a variety of risks. Sales associated with our arrangement with Walmart represented 11.2% of consolidated net revenue in fiscal year 2017, which exposes us to concentration of customer risk. In addition, the agreement permits Walmart to control many aspects of the retail operations at the Vision Centers we manage on behalf of Walmart, including pricing, merchandising and similar matters. If Walmart exercises its rights under this agreement in a way that adversely affects us, our sole remedy would be to terminate the agreement after participating in an informal resolution and, if necessary, a mediation process. There are no assurances that Walmart will not seek to exercise these rights in a manner that is materially adverse to our interests. In addition, under our current management & services agreement, we earn fees based on a percentage of the revenues from the Vision Centers we manage. The agreement also allows Walmart to collect penalties from us if the Vision Centers do not generate a requisite amount of revenues, which penalties equal a percentage of the shortfall. We may not be able to maintain the performance levels required and, as a result, may be forced to pay penalties to Walmart or default under this agreement at a point in time when our fees from the arrangement will already be lower than anticipated. Further, a breach by us of the terms and conditions of this agreement could cause us to lose all management fees derived under this agreement, which could adversely affect our financial position and results of operations.
We depend on our distribution centers and optical laboratories. The loss of, or disruption in the operations of, one or more of these facilities may adversely affect our ability to process and fulfill customer orders and deliver our products in a timely manner, or at all, and may result in quality issues, which would adversely affect our reputation, our business and our profitability.
Substantially all of our inventory is shipped directly from suppliers to our two distribution centers in Lawrenceville, Georgia and Columbus, Ohio. Inventory is then processed, sorted and shipped using third-party carriers to our stores, to our laboratories for further processing, to our online customers or to Walmart stores and Sam’s Club locations. We operate laboratory facilities in Lawrenceville, Georgia; St. Cloud, Minnesota; and Salt Lake City, Utah. In addition, we intend to enter into a lease for an additional laboratory facility in 2018 and expect the laboratory to be operational in time for the first quarter 2019. We also have outsourcing relationships with third-party laboratories in Mexico and China. These laboratories process most of the lenses ordered by our customers in our stores, as well as on our websites. Once processed at the laboratories, the finished products are returned to our distribution centers for shipment to stores, our customers or our business partners.
We depend in large part on the orderly operation of this receiving and distribution process, which depends, in turn, on adherence to shipping schedules and effective management of our distribution centers. Increase in transportation costs (including increases in fuel costs), increased shipping costs, issues with overseas shipments, supplier-side delays, reductions in the transportation capacity of carriers, labor strikes or shortages in the transportation industry, disruptions to the national and international transportation infrastructure and unexpected delivery interruptions or delays also have the potential to derail our distribution process. We face additional risks related to the laboratories in China and Mexico, including port of entry risks such as longshoremen strikes, import restrictions, foreign government regulations, trade restrictions, customs and duties.
In addition, if we change the transportation companies we use, we could face logistical difficulties that could adversely affect deliveries and we could incur costs and expend resources in connection with such change. We also may not be able to obtain terms as favorable as those received from the third-party transportation providers we currently use, which could increase our costs. We also may not anticipate changing demands on our distribution system, including the effect of any expansion we may need to implement in our distribution centers.
24
Additionally, events beyond our control, such as disruptions in operations due to natural or man-made disasters, inclement weather conditions, accidents, system failures, power outages, political instability, break-in, server failure, work stoppages, slowdowns or strikes by employees, acts of terrorism, widespread illness and other unforeseen or catastrophic events, could damage our optical laboratories and/or distribution centers or render them inoperable, making it difficult or impossible for us to process customer orders for an extended period of time. Such events may also result in delays in our receipt of inventory and the delivery of merchandise between our stores, our optical laboratories and our distribution centers. We could also incur significantly higher costs and longer lead times associated with distributing inventory during the time it takes for us to reopen or replace one or both of our distribution centers. In addition, the unavailability of, or disruptions to, equipment to process lenses and assemble custom-made eyeglasses or trained operators of such equipment in our optical laboratories could adversely affect our ability to fulfill customer orders in a timely manner. Any disruption to the laboratories’ operations may reduce or impair the quality of assembled eyeglasses.
The inability to fulfill, or any delays in processing, customer orders through our laboratory network or any quality issues could result in the loss of customers, issuances of refunds or credits and may also adversely affect our reputation. The success of our stores depends on their timely receipt of products for sale and any repeated, intermittent or long-term disruption in, or failures of, the operations of our distribution centers and/or optical laboratories could result in lower sales and profitability, a loss of loyalty to our brands and excess inventory. The insurance we maintain for business interruption may not cover all risk, or be sufficient to cover all of our potential losses, may not continue to be available to us on acceptable terms, if at all, and any insurance proceeds may not be paid to us in a timely manner.
We face risks associated with vendors from whom our products are sourced.
We purchase all of our merchandise from domestic and international vendors. For our business to be successful, our suppliers must be willing and able to provide us with products in substantial quantities, in compliance with regulatory requirements, at acceptable costs and on a timely basis. Our ability to obtain a sufficient selection or volume of merchandise on a timely basis at competitive prices could suffer as a result of any deterioration or change in our vendor relationships or events that adversely affect our vendors.
Other than our contracts for the supply of spectacle lenses and our private label contact lenses, we typically do not enter into long-term contracts with our vendors and, as such, we operate without any contractual assurances of continued supply, pricing or access to new products. Any of our vendors could discontinue supplying us with desired products in sufficient quantities or offer us less favorable terms on future transactions for a variety of reasons. The benefits we currently experience from our vendor relationships could be adversely affected if our vendors:
• | discontinue selling merchandise to us; |
• | enter into arrangements with competitors that could impair our ability to sell their products, including by giving our competitors exclusivity arrangements or limiting our access to certain products; |
• | sell similar or identical products to our competitors with similar or better pricing, some of whom may already purchase merchandise in significantly greater volume and at lower prices than we do; |
• | raise the prices they charge us; |
• | refuse to allow us to return merchandise purchased from them; |
• | change pricing terms to require us to pay on delivery or upfront, including as a result of changes in the credit relationships some of our vendors have with their various lending institutions; |
• | lengthen their lead times; or |
• | initiate or expand sales of their products to retail customers directly through their own stores, catalogs or on the Internet and compete with us directly. |
Events that adversely impact our vendors could impair our ability to obtain adequate and timely supplies. Such events include, among others, difficulties or problems associated with our vendors’ business, the financial instability and labor problems of vendors, merchandise quality and safety issues, natural or man-made disasters, inclement weather conditions, war, acts of terrorism and other political instability, economic conditions, shipment issues, the availability of raw materials and increased production costs. Our vendors may be forced to reduce their production, shut down their operations or file for bankruptcy. The occurrence of one or more of these events could impact our ability to get products to our customers, result in disruptions to our operations, increase our costs and decrease our profitability.
We also source merchandise directly from suppliers outside of the United States. Additionally, a significant amount of our domestically-purchased merchandise is manufactured abroad. Global sourcing and foreign trade involve numerous factors and uncertainties beyond our control including increased shipping costs, the imposition of additional import or trade restrictions, including legal or economic restrictions on overseas suppliers’ ability to produce and deliver products, increased custom duties and tariffs, unforeseen delays in customs clearance of goods, more restrictive quotas, loss of a most favored nation trading status, currency exchange rates, transportation delays, port of entry issues and foreign government regulations, political instability and economic uncertainties in the countries from which we or our vendors
25
source our products. Our sourcing operations may also be hurt by health concerns regarding infectious diseases in countries in which our merchandise is produced. Moreover, negative press or reports about internationally manufactured products may sway public opinion, and thus customer confidence, away from the products sold in our stores. These and other issues affecting our international vendors or internationally manufactured merchandise could have a material adverse effect on our business, financial condition and results of operations.
Furthermore, attempts by the presidential administration to impose significant tariffs or other restrictions on imports, in particular from China and Mexico where our outsourced optical laboratories are located, or to withdraw from or materially modify the North American Free Trade Agreement and other international trade agreements, could have an adverse impact on our business. Any such restrictions, tariffs or other changes could lead to additional costs, delays in shipments, embargos and other uncertainties that could negatively impact our relationships with our international vendors and materially adversely affect our business.
Material changes in the pricing practices of our suppliers could negatively impact our profitability. For example, we have in the past been subject to the unilateral pricing policies implemented by certain contact lens manufacturers, which policies mandated the minimum prices at which certain contact lenses could be sold to consumers. Such manufacturers could refuse to supply us with their products if they deemed us in breach of such policies. Our vendors may also increase their pricing if their raw materials became more expensive. The raw materials used to manufacture our products are subject to availability constraints and price volatility. Our vendors may pass the increase in sourcing costs to us through price increases, thereby impacting our margins.
In addition, some of our vendors may not have the capacity to supply us with sufficient merchandise to keep pace with our growth plans, especially if we need significantly greater amounts of inventory. In such cases, our ability to pursue our growth strategy will depend in part upon our ability to develop new vendor relationships.
Some of our suppliers are owned by vertically-integrated companies with retail divisions that compete with us and, as such, we are exposed to the risk that these suppliers may not be willing, or may become unwilling, to sell their products to us on acceptable terms, or at all.
The optical retail industry is highly competitive, and if we do not compete successfully, our business may be adversely impacted.
We compete directly with national, regional and local retailers, including other optical retail chains, warehouse clubs, mass merchandisers and internet-based retailers. We also compete with independent ophthalmologists, optometrists and opticians located in our markets as they often provide many of the same goods and services we provide. The retail landscape is changing as a result of changes in consumers’ shopping habits, as well as the introduction of new technologies such as online vision exams. See Part I. Item 1. “Competition.”
Some of our competitors are larger companies and have greater financial and operational resources, greater brand recognition and broader geographic presence than we do. As a result, they may be able to engage in extensive and prolonged price promotions or otherwise offer competitive prices, which may adversely affect our business. They may also be able to spend more than we do for advertising. We may be at a substantial disadvantage to larger competitors with greater economies of scale. If our costs are greater compared to those of our competitors, the pricing of our products and services may not be as attractive, thus depressing sales or the profitability of our products and services. Our competitors may expand into markets in which we currently operate and we remain vulnerable to the marketing power and high level of customer recognition of these larger competitors and to the risk that these competitors or others could attract our customer base. Some of our competitors are vertically integrated and are also engaged in the manufacture and distribution of eyewear as well as managed care. These competitors can leverage this structure to their advantage to better compete and some of these vertically-integrated organizations have significant market power and could potentially use this power in ways that could make it more difficult for us to compete. We purchase many of our products from suppliers who are affiliates of our competitors. We also compete for managed vision care contracts with certain of our competitors who are affiliates of managed care payors. In addition, if any of our competitors were to consolidate operations, such consolidation would exacerbate the aforementioned risks.
We may not continue to be able to successfully compete against existing or future competitors. Our inability to respond effectively to competitive pressures, improved performance by our competitors and changes in the retail markets could result in lost market share and have a material adverse effect on our business, financial condition and results of operations.
We are dependent on a limited number of suppliers.
We rely on a limited number of vendors to supply the majority of our eyeglass frames, eyeglass lenses and contact lenses, and are thus exposed to concentration of supplier risk. In particular, we have agreed to exclusively purchase almost all of our spectacle lenses from one supplier. During fiscal year 2017, four vendors supplied 56% of frames,
26
two vendors provided 91% of lenses and three vendors supplied 94% of contact lenses. If our suppliers experience difficulties or disruptions in their operations or if we were to lose any significant supplier, we may be unable to establish additional or replacement sources for our products that meet our quality controls and standards in a timely manner or on commercially reasonable terms, if at all. As a few major suppliers dominate the optical retail industry, the risks associated with finding alternative sources may be exacerbated.
Our and our vendors’ systems containing personal information and payment card data of our retail store and e-commerce customers, employees and other third parties, could be breached, which could subject us to adverse publicity, costly government enforcement actions or private litigation.
We collect, process and store sensitive and confidential information, including our proprietary business information and that of our customers, employees, suppliers and business partners, including Walmart and Sam’s Club. The secure processing, maintenance and transmission of this information is critical to our operations. The regulatory environment surrounding information security and privacy is increasingly demanding, with the frequent imposition of new and changing requirements across our business. For instance, as a health care provider, we could be forced, in the event of a data breach, to report the breach not only to affected customers, but also to various public agencies and media outlets, potentially harming our reputation and our business. In addition, our customers and employees have a high expectation that we will adequately protect their personal information from cyber-attack or other security breaches. Our business partners may have contractual rights of indemnification against us in the event that their customer or proprietary business information is released as a result of a breach of our information systems. In such an event, these business partners could also seek to terminate our contracts with them.
Our systems and those of our third-party service providers and business partners may be vulnerable to security breaches, attacks by hackers, acts of vandalism, computer viruses, misplaced or lost data, human errors or other similar events. If unauthorized parties gain access to our networks or databases, or those of our third-party service providers or business partners, they may be able to steal, publish, delete, use inappropriately or modify our private and sensitive third-party information including personal health information, credit card information and personal identification information. In addition, employees may intentionally or inadvertently cause data or security breaches that result in unauthorized release of personal or confidential information. Because the techniques used to circumvent security systems can be highly sophisticated, change frequently, are often not recognized until launched against a target and may originate from less regulated and remote areas around the world, we may be unable to proactively address all possible techniques or implement adequate preventive measures for all situations. Like most corporations, the Company's systems are a target of attacks. Although the incidents that we have experienced to date have not had a material effect on our business, there can be no assurance that such incidents will not have a material adverse effect on us in the future. Any such breach, attack, virus or other event could result in costly investigations and litigation exceeding applicable insurance coverage or contractual rights available to us, civil or criminal penalties, operational changes or other response measures, loss of consumer confidence in our security measures, and negative publicity that could adversely affect our financial condition, results of operations and reputation.
Further, if we are unable to comply with the security standards established by banks and the payment card industry, we may be subject to fines, restrictions, and expulsion from card acceptance programs, which could adversely affect our retail operations. As privacy and information security laws and regulations change, we may incur additional compliance costs.
Any failure, inadequacy, interruption, security failure or breach of our information technology systems, whether owned by us or outsourced or managed by third parties, could harm our ability to effectively operate our business and could have a material adverse effect on our business, financial condition and results of operations.
We rely heavily on our information technology systems for many functions across our operations, including managing our supply chain and inventory, processing customer transactions in our stores, allocating lens processing jobs to the appropriate laboratories, our financial accounting and reporting, compensating our employees and operating our websites. Our ability to effectively manage our business and coordinate the sourcing, distribution and sale of our products depends significantly on the reliability and capacity of these systems. Such systems are subject to damage or interruption from power outages or damages, telecommunications problems, data corruption, software errors, network failures, security breaches, acts of war or terrorist attacks, fire, flood and natural disasters. Our servers could be affected by physical or electronic break-ins, and computer viruses or similar disruptions may occur. A system outage may also cause the loss of important data. Our existing safety systems, data backup, access protection, user management and information technology emergency planning may not be sufficient to prevent data loss or long-term network outages.
In addition, we may have to upgrade our existing information technology systems from time to time in order for such systems to withstand the increasing needs of our expanding business. We rely on certain hardware, telecommunications and software vendors to maintain and periodically upgrade many of these systems so that we can continue to support
27
our business. Costs and potential problems and interruptions associated with the implementation of new or upgraded systems and technology or with maintenance or adequate support of existing systems could disrupt or reduce the efficiency of our operations. We also depend on our information technology staff. If we cannot meet our staffing needs in this area, we may not be able to fulfill our technology initiatives while continuing to provide maintenance on existing systems.
We could be required to make significant capital expenditures to remediate any such failure, malfunction or breach with our information technology systems. Further, additional investment needed to upgrade and expand our information technology infrastructure will require significant investment of additional resources and capital, which may not always be available or available on favorable terms. Any material disruption or slowdown of our systems, including those caused by our failure to successfully upgrade our systems, and our inability to convert to alternate systems in an efficient and timely manner could have a material adverse effect on our business, financial condition and results of operations.
An overall decline in the health of the economy and other factors impacting consumer spending, such as the timing and issuance of tax refunds, governmental instability and natural disasters, may affect consumer purchases, which could reduce demand for our products and materially harm our sales, profitability and financial condition.
Our business depends on consumer demand for our products and, consequently, is sensitive to a number of factors that influence consumer confidence and spending, such as general economic conditions, consumer disposable income, energy and fuel prices, recession and fears of recession, unemployment, minimum wages, availability of consumer credit, consumer debt levels, conditions in the housing market, interest rates, tax rates and policies, inflation, consumer confidence in future economic conditions and political conditions, war and fears of war, inclement weather, natural disasters, terrorism, outbreak of viruses or widespread illness and consumer perceptions of personal well-being and security. For example, in August and September of 2017, we temporarily closed certain stores in the Houston, Texas area and in Alabama, Florida and Georgia due to Hurricanes Harvey and Irma, respectively. Although these store closures did not have a material adverse impact on our business, similar events in the future that are outside of our control could materially adversely affect our sales and profitability.
Reduced customer confidence and spending cutbacks may result in reduced demand for our merchandise and may force us to take inventory markdowns. Reduced demand also may require increased selling and promotional expenses. Prolonged or pervasive economic downturns could slow the pace of new store openings or cause current stores to close.
Furthermore, our target market, which consists of cost-conscious and low-income consumers, is sensitive to various factors outside of our control. For example, this population relies on tax refunds to pay for eyewear and eye care. A delay in the issuance of tax refunds can accordingly have a negative impact on our financial results. Consumers could also alter how they utilize tax refund proceeds. In addition, periods of instability in the government can also cause this population to either delay or refrain from making such purchases. We believe these factors came into play in the first quarter of fiscal year 2017 and had a negative impact on our financial results when the U.S. Internal Revenue Service, or IRS, announced that tax refunds would be issued significantly later than they had been in 2016. In addition, we believe that instability in the federal government, coupled with a renewed emphasis on immigration matters, further caused our target population to reduce its spending. A continuation of these and similar circumstances could have a material negative impact on our financial performance. Because of the importance of the first quarter for us, a significant downward trend in the first quarter could have a substantial negative impact on our annual financial results.
Our growth strategy could strain our existing resources and cause the performance of our existing stores to suffer.
Our planned expansion will place increased demands on our existing operational, managerial, supply-chain and administrative resources. These increased demands could strain our resources and cause us to operate our business less effectively, which in turn could cause the performance of our new and existing stores to suffer.
As our store base grows, we will need to continually evaluate the adequacy of our laboratory, distribution and information system capabilities. Our laboratories and distribution centers have a finite capacity and, to the extent we grow beyond this capacity, we will need to expand our current laboratories and/or distribution centers or add new laboratories and/or distribution capabilities, the cost of which could be material. Implementing new operating capabilities or changing existing operating capabilities could present challenges we do not anticipate and could negatively affect our business, financial condition and results of operations. Should we open additional laboratories or distribution centers, any related construction or expansion projects entail risks which could cause delays and cost overruns, such as unavailability of suitable space, shortages of materials, shortages of skilled labor or work stoppages, unforeseen construction, scheduling, engineering, environmental or geological problems, weather interference, fires or other casualty losses and unanticipated cost increases. For example, we intend to enter into a lease for an additional laboratory facility in 2018 and expect the laboratory to be operational in time for the first quarter 2019. The completion date and ultimate cost of this and other future projects could differ significantly from initial expectations due to construction-related or other reasons. We
28
cannot guarantee that any project will be completed on time or within established budgets. Any delay or increased costs associated with any project could adversely affect the financial and overall performance of our existing and planned new stores.
In addition, opening new stores in our established markets may result in inadvertent oversaturation, temporarily or permanently divert customers and sales from our existing stores to new stores and reduce comparable store sales, thus adversely affecting our overall financial performance. Furthermore, we have opened and expect to continue to open America’s Best and Eyeglass World stores in close proximity to one another. However, we may not be able to effectively manage stores of both brands in the same market, and this close proximity may cause the performance of such America’s Best and/or Eyeglass World stores to suffer. In addition, oversaturation, or the risk of oversaturation, may reduce or adversely affect the number or location of stores we plan to open, and could thereby materially and adversely affect our growth plans overall or in particular markets.
We cannot anticipate all of the demands that our expanding operations will impose on our business, personnel and systems and our failure to address such demands and to profitably manage our growth could have a material adverse effect on our business, financial condition and results of operations.
If we fail to retain our existing senior management team or attract qualified new personnel, such failure could have a material adverse effect on our business, financial condition, and results of operations.
Our business requires disciplined execution at all levels of our organization. This execution requires an experienced and talented management team. If we were to lose the benefit of the experience, efforts and abilities of key executive personnel, it could have a material adverse effect on our business, financial condition and results of operations. Competition for skilled and experienced management is intense, and we may not be successful in attracting and retaining new qualified personnel required to grow and operate our business profitably.
We are a low-cost provider and our business model relies on the low cost of inputs. Factors such as wage rate increases, inflation, cost increases, increases in raw material prices and energy prices could have a material adverse effect on our business, financial condition and results of operations.
Increases in compensation and other expenses for vision care professionals, as well as our other associates, may adversely affect our profitability. Wage and hour regulations can exacerbate this risk. Other future cost increases, such as increases in the cost of merchandise, shipping rates, raw material prices, freight costs and store occupancy costs, may also reduce our profitability. These cost increases may be the result of inflationary pressures which could further reduce our sales or profitability. Increases in other operating costs, including changes in energy prices and lease and utility costs, may increase our cost of products sold or selling, general and administrative expenses. Our low price model and competitive pressures in the optical retail industry may inhibit our ability to reflect these increased costs in the prices of our products, in which case such increased costs could have a material adverse effect on our business, financial condition and results of operations.
Our success depends upon our marketing, advertising and promotional efforts. If we are unable to implement them successfully, or if our competitors are more effective than we are, it could have a material adverse effect on our business, financial condition and results of operations.
We use marketing and promotional programs to attract customers to our stores and to encourage purchases by our customers. If we fail to successfully develop and implement marketing, advertising and promotional strategies, we may be unable to achieve and maintain brand awareness, and customer traffic to our stores and/or websites may be reduced. We may not be able to advertise cost-effectively in new or smaller markets in which we have lower store density, which could slow growth at such stores. Changes in the amount and degree of promotional intensity or merchandising strategy by our competitors could cause us to have difficulties in retaining existing customers and attracting new customers. If the efficacy of our marketing or promotional activities declines or if such activities of our competitors are more effective than ours, or if for any other reason we lose the loyalty of our customers, it could have a material adverse effect on our business, financial condition and results of operations. Further, in connection with our planned continued expansion in California, we have launched a national advertising campaign for America’s Best as opposed to only utilizing local advertising campaigns. We cannot provide assurances that a national advertising campaign will be cost-effective or successful or that we will continue such campaigns.
We are subject to risks associated with leasing substantial amounts of space, including future increases in occupancy costs.
We lease our America’s Best and Eyeglass World store locations, our corporate headquarters, the AC Lens corporate office, the FirstSight corporate office, our laboratories in Georgia and Utah and our distribution centers. We also lease
29
our Vista Optical locations inside Fred Meyer stores. As a result, we are susceptible to changes in the property rental market and increases in our occupancy costs.
The success of our business depends, in part, on our ability to identify suitable premises for our stores and to negotiate acceptable lease terms. Our ability to effectively renew our existing store leases or obtain store leases to open new stores depends on the availability of store premises that meet our criteria for traffic, square footage, lease economics, demographics and other factors. We may not be able to renew or extend our existing store leases on acceptable terms, or at all, and may have to abandon desirable locations or renew leases on unfavorable terms. In addition, tenants at shopping centers in which we are located or have executed leases, or to which our locations are near, may fail to open or may cease operations. Decreases in total tenant occupancy in shopping centers in which we are located, or to which our locations are near, may affect traffic at our stores. All of these factors could have a material adverse impact on our operations.
Most leases for our stores provide for a minimum rent and typically include escalating rent increases over time. In certain circumstances we pay a percentage rent based upon sales after certain minimum thresholds are achieved. Our failure to achieve these thresholds could cause our occupancy costs for these locations to increase materially on a percentage of sales basis. The leases generally require us to pay insurance, utilities, real estate taxes and common area maintenance expenses. Our substantial lease obligations could have significant negative consequences, including:
• | requiring that a substantial portion of our available cash be applied to pay our rental obligations, reducing cash available for other purposes and reducing our operating profitability; |
• | increasing our vulnerability to general adverse economic and industry conditions; |
• | limiting our flexibility in planning for, or reacting to changes in, our business or in the industry in which we compete; and |
• | limiting our ability to obtain additional financing |
We depend on cash flows from operations to pay our lease expenses and to fulfill our other cash needs. If our business does not generate sufficient cash flow from operating activities, and sufficient funds are not otherwise available to us from borrowings or other sources, we may not be able to service our lease expenses, grow our business, respond to competitive changes or fund our other liquidity and capital needs, which could harm the business. If we are not able to make the required payments under our leases, landlords with a contractual or statutory security interest in the assets of the relevant stores may, among other things, repossess those assets, which could adversely affect our ability to conduct our operations.
Further, the substantial majority of our leased sites are both currently and in the future expected to be subject to long-term non-cancellable leases. If an existing or future store is not profitable and we decide to close it, we may nonetheless be obligated to perform our obligations under the applicable lease including, among other things, paying the base rent and other charges for the balance of the lease term. Even if a lease has an early cancellation clause, we may not satisfy the contractual requirements for early cancellation under that lease.
As we expand our store base, particularly in certain markets that are more expensive, such as California, our lease expense and our cash outlays for rent under lease agreements may increase. Our inability to enter into new leases or renew existing leases on terms acceptable to us or be released from our obligations under leases for stores that we close could materially and adversely affect our business, financial condition and results of operations.
We could be adversely affected by product liability, product recall or personal injury issues.
We could be adversely impacted by the supply of defective products, including the infiltration of counterfeit products into the supply chain and contamination or product mishandling issues. Product liability or personal injury claims may be asserted against us with respect to any of the products we sell or services we provide. The provision of professional eye care services by the vision care professionals employed by us or with whom we have contractual arrangements also increases our exposure to professional liability claims. There is a risk that these claims may exceed, or fall outside the scope of, our insurance coverage. In addition, a government or other regulatory agency could require us or one of our vendors or suppliers to remove a particular product from the market for, among other reasons, failure to adhere to product safety requirements or quality control standards. Product recalls can result in the disposal or write-off of merchandise, harm our reputation and cause us to lose customers, particularly if those recalls cause consumers to question the performance, quality, safety or reliability of our products. Any significant returns or warranty claims, as well as the timing of such returns or claims, could result in significant additional costs to us and could adversely affect our results of operations.
We rely on our suppliers to control the quality of both eyeglass components and contact lenses. We are not involved in the manufacture of the merchandise we purchase from our vendors for sale to our customers, and we do not independently investigate whether these vendors legally hold sufficient intellectual property rights to the merchandise
30
that they are manufacturing or distributing. Our ability to seek recourse for liabilities and recover costs from our vendors depends on our contractual rights as well as on the financial condition and integrity of the vendors. If we purchase products on a closeout basis, some of these products may be obtained through brokers or intermediaries rather than through manufacturers, which may make it more difficult for us to investigate all aspects of these products. Moreover, we engage in certain manufacturing, repackaging and relabeling activities at our optical laboratories and at certain Eyeglass World stores. If the products that we manufacture, repackage, or relabel are defective or otherwise result in product liability or personal injury claims against us, our business could be adversely affected and we could be subject to adverse regulatory action.
If our merchandise or services do not meet applicable governmental safety standards or our customers’ expectations regarding quality or safety, we could experience lost sales and increased costs, be exposed to legal and reputational risk and face fines or penalties which could materially adversely affect our financial results.
We are subject to managed vision care laws and regulations.
We are engaged in managed vision care, both as a managed care entity through our subsidiary, FirstSight, and as a provider to managed care payors and insurers, and are subject to additional regulations as a result. FirstSight is licensed as a single-service HMO and is subject to the managed care laws of the State of California and is comprehensively regulated by the DMHC. FirstSight’s failure to comply with the regulations and requirements under such managed care laws may result in the imposition of various sanctions, including the suspension or revocation of FirstSight’s license, civil penalties and appointment of a receiver, among others. Material changes to the operations of FirstSight, including the opening of America’s Best locations outside of defined service areas, must be approved by the DMHC. This approval process can be complex and can cause delays in the projected opening of our stores. The sale of managed care products by FirstSight is essential to our expansion of America’s Best in California, and the suspension or loss of our license and our failure to comply with applicable regulatory requirements could have a material adverse impact on our expansion plans in California.
In addition, our Eyecare Club programs may be subject to regulation under managed care and related state laws, including those of California, where these programs are offered by FirstSight. Our Eyecare Club programs may also subject us to state statutes regulating discount medical plans, requiring the licensing or registration of organizations that provide discounted access to health care providers. It is possible that state regulators could determine that we are operating as a discount medical plan and as such are subject to various registration, disclosure and solvency requirements. We could incur increased compliance costs as a result. We would also be subject to the risk of cease and desist orders and monetary penalties.
We rely on third-party coverage and reimbursement, including government programs, for an increasing portion of our revenues, the future reduction of which could adversely affect our results of operations.
We rely on third-party coverage and reimbursement, including government and private insurance plans, such as managed vision care plans, for an increasing portion of our net revenue. We are generally reimbursed for the vision care services and products that we provide through payment systems managed by private insurance companies, managed care organizations and governmental agencies. Coverage and payment levels are determined at each third-party payor’s discretion, and we have no direct control over third-party payor’s decision-making with respect to coverage and payment levels. Coverage restrictions and reductions in reimbursement levels or payment methodologies may negatively impact our sales and profits. Many third-party payors may continue to explore cost-containment strategies that may potentially impact coverage and/or payment levels for our services and products and impose utilization restrictions and risk-based compensation arrangements. We cannot provide any assurances that we will be able to maintain or increase our participation in managed care arrangements or that we will be adequately reimbursed by managed care payors, vision insurance providers and other third-party payors for the services we provide and the products we sell. From time to time, vision care insurance payors may make changes to their EDI claim systems. Such changes may require us to update our processes and could impact our ability to submit claims or to timely receive reimbursements from our managed care partners. If claims for payment are disputed by managed care payors or if we fail to timely or accurately submit claims, we may not receive payment for such claims in a timely manner or at all, which could negatively impact our relationship with manage care organizations and could require us to take writeoffs or otherwise have a significant negative impact on our business, financial condition and results of operations. Furthermore, any changes to or repeal of the Patient Protection and Affordable Care Act, as amended by the Health Care and Education Reconciliation Act, in connection with the presidential administration or otherwise, may reduce or eliminate coverage or reimbursement rates of insurance-funded eye exams or eyewear.
31
Our profitability and cash flows may be negatively affected if we are not successful in managing our inventory balances and inventory shrinkage.
Efficient inventory management is a key component of our business success and profitability. To be successful, we must maintain sufficient inventory levels to meet our customers’ demands without allowing those levels to increase to such an extent that the costs to distribution centers, laboratories and stores to hold the goods unduly impacts our financial results. If our buying and distribution decisions do not accurately predict customer trends or spending levels in general or at particular stores or if we inappropriately price products, we may have to take unanticipated markdowns and discounts to dispose of obsolete or excess inventory or record potential write-downs relating to the value of obsolete or excess inventory. For example, in the fiscal year ended December 30, 2017, we wrote off $2.3 million of inventory related to a slow-moving contact lens product which had expired or would expire prior to possible sale. Conversely, if we underestimate future demand for a particular product or do not respond quickly enough to replenish our best performing products, we may have a shortfall in inventory of such products, likely leading to unfulfilled orders, reduced revenue and customer dissatisfaction.
Our business is partly dependent on our ability to strategically source a sufficient volume and variety of brand name merchandise at opportunistic pricing. Some of our products are sourced from suppliers or with significantly reduced prices for specific reasons, and we are not always able to purchase specific merchandise on a recurring basis and we may not have control over the supply, design, cost or availability of some products we offer for sale in our stores. We also compete with other retailers for discounted merchandise to sell in our stores. To the extent that certain of our suppliers are better able to manage their inventory levels and reduce the amount of their excess inventory, the amount of discount merchandise available to us could also be materially reduced, potentially compromising our profit margin for procured merchandise.
Maintaining adequate inventory requires significant attention and monitoring of market trends, local markets, developments with suppliers and our distribution network, and it is not certain that we will be effective in our inventory management. We are subject to the risk of inventory loss or theft and we may experience higher rates of inventory shrinkage or incur increased security costs to combat inventory theft. In addition, any casualty or disruption to our laboratories, distribution centers or stores may damage or destroy our inventory located there. As we expand our operations, it may be more difficult to effectively manage our inventory. If we are not successful in managing our inventory balances, it could have a material adverse effect on our business, financial condition and results of operations.
Our e-commerce business faces distinct risks, and our failure to successfully manage it could have a negative impact on our profitability.
As an e-commerce retailer, we encounter risks and difficulties frequently experienced by internet-based businesses. The successful operation of our e-commerce business as well as our ability to provide a positive shopping experience that will generate orders and drive subsequent visits depends on efficient and uninterrupted operation of our order-taking and fulfillment operations. Risks associated with our e-commerce business include:
• | uncertainties associated with our websites including changes in required technology interfaces, website downtime and other technical failures, costs and technical issues as we upgrade our website software, inadequate system capacity, computer viruses, human error, security breaches, legal claims related to our website operations and e-commerce fulfillment; |
• | disruptions in telephone service or power outages; |
• | reliance on third parties for computer hardware and software, as well as delivery of merchandise to our customers; |
• | rapid technology changes; |
• | credit or debit card fraud and other payment processing related issues; |
• | changes in applicable federal, state and international regulations; |
• | liability for online content; |
• | cybersecurity and consumer privacy concerns and regulation; and |
• | natural disasters or adverse weather conditions. |
In addition, we have contractual relationships with several third parties, including Walmart and Sam’s Club, whereby we host websites for the online sale of contact lenses and other optical products and perform related back office functions for these parties. We could be exposed to contractual liability to these third parties in the event of a failure or disruption to these websites or our failure to properly provide the services called for by these agreements.
Our online sales also expose us to broader applicability of regulations, as well as additional regulations, such as the prescription verification and other requirements under the FCLCA, rules relating to registration of internet sellers, certain requirements under the Treasury Department’s OFAC, FCPA, anti-money laundering and trade sanction laws
32
and similar anti-corruption, anti-bribery and international trade laws. Problems in any of these areas could result in a reduction in sales, increased costs, sanctions or penalties and damage to our reputation and brands.
In addition, we must keep up to date with competitive technology trends, including the use of new or improved technology, creative user interfaces and other e-commerce marketing tools such as paid search and mobile applications, among others, which may increase our costs and which may not increase sales or attract customers. Our competitors, some of whom have greater resources than we do, may also be able to benefit from changes in e-commerce technologies, which could harm our competitive position. If we are unable to allow real-time and accurate visibility to product availability when customers are ready to purchase, quickly and efficiently fulfill our customers’ orders using the fulfillment and payment methods they demand, provide a convenient and consistent experience for our customers regardless of the ultimate sales channel or effectively manage our online sales, our ability to compete and our results of operations could be adversely affected.
Furthermore, if our e-commerce business successfully grows, it may do so in part by attracting existing customers, rather than new customers, who choose to purchase products from us online rather than from our brick and mortar stores, thereby detracting from the financial performance of our stores.
Our operating results and inventory levels fluctuate on a seasonal basis.
Our business is subject to seasonal fluctuation. We typically realize a higher portion of net sales during the first fiscal quarter, due, among other things, to the timing of tax refunds and the impact of healthcare plan resets after the close of the prior year. Adverse events, such as higher unemployment, lapses in or the lack of insurance coverage, delays in the issuance of tax refunds, deteriorating economic conditions, public transportation disruptions, or unanticipated adverse weather or travel conditions can deter consumers from shopping. Any significant decrease in net sales during the first fiscal quarter could have a material adverse effect on us and could negatively impact our annual results. In addition, in order to prepare for our peak shopping quarters, we must increase the staffing at our stores and order and keep in stock more merchandise than we carry during other parts of the year. This staffing increase and inventory build-up may require us to expend cash faster than is generated by our operations during this period. Any unanticipated decrease in demand for our products during such period could require us to sell excess inventory at a substantial markdown, which could have a material adverse effect on our business, financial condition and results of operations.
Certain technological advances, greater availability of, or increased consumer preferences for, vision correction alternatives to prescription eyeglasses or contact lenses, and future drug development for the correction of vision-related problems may reduce the demand for our products and adversely impact our business and profitability.
Technological advances in vision care, including the development of new or improved products, as well as future drug development for the correction of vision-related problems, could make our existing products less attractive or even obsolete. Several companies have developed technologies for the remote delivery of eye examinations and eye refractions. If consumers accept the use of these technologies, they could become less likely to obtain an in-person eye examination and therefore less likely to shop at our retail locations. Additionally, the greater availability and acceptance, or reductions in the cost, of vision correction alternatives to prescription eyeglasses and contact lenses, such as corneal refractive surgery procedures, including radial-keratotomy, photo-refractive keratotomy, or PRK, and LASIK, may reduce the demand for our products, lower our sales and thereby adversely impact our business and profitability.
We may incur losses arising from our investments in technological innovators in the optical retail industry, which would negatively affect our financial results.
We are regularly presented with opportunities to invest and have invested in certain venture-backed emerging companies and technological innovators across the optical retail industry. Such investments could include equity or debt instruments in companies that may be non-marketable. The success of these companies may depend on product development, market acceptance, operational efficiency, and other key business factors. If any of these companies fail, we could lose all or part of our investment in that company. If we determine that impairment indicators exist and that there are other-than-temporary declines in the fair value of the investment, we may be required to write down the investments to their fair value and recognize the related write-down as an investment loss.
Failure to comply with laws, regulations and enforcement activities or changes in statutory, regulatory, accounting, and other legal requirements could potentially impact our operating and financial results.
In addition to the vision care and healthcare laws and regulations discussed above, we are subject to numerous federal, state, local and foreign laws and governmental regulations including those relating to environmental protection, personal injury, intellectual property, consumer product safety, building, land use and zoning requirements, workplace regulations, wage and hour, privacy and information security, consumer protection laws, immigration and employment
33
law matters. If we fail to comply with existing or future laws or regulations, or if these laws or regulations are violated by importers, manufacturers or distributors, we may be subject to governmental or judicial fines or sanctions, while incurring substantial legal fees and costs. In addition, our capital expenditures could increase due to remediation measures that may be required if we are found to be noncompliant with any existing or future laws or regulations.
Further, the FTC has authority to investigate and prosecute practices that constitute “unfair trade practices,” “deceptive trade practices” or “unfair methods of competition.” State attorneys general typically have comparable authority, and many states also permit private plaintiffs to bring actions on the basis of these laws. Federal and state consumer protection laws and regulations may apply to our operations and retail offers. For example, our America’s Best offer of a “free” eye exam is subject to compliance with laws and regulations governing the use of this term.
Our transactions with the international laboratories we contract with may subject us to the FCPA and trade sanction laws, and similar anti-corruption, anti-bribery and international trade laws, any violation of which could create substantial liability for us and also harm our reputation. Our three laboratories in the United States and our in-store laboratories at our Eyeglass World locations subject us to various federal, state and local laws, regulations and other requirements pertaining to protection of the environment, public health and employee safety, including regulations governing the management of hazardous substances and the maintenance of safe working conditions, such as the Occupational Safety and Health Act of 1970, as amended. These laws also apply generally to all our properties. Our failure to comply with these laws can subject us to criminal and civil liabilities. In connection with our Vista Optical military locations, we must comply with regulations governing the occupancy of military bases. In connection with our philanthropic endeavors, we must also comply with additional federal, state and local tax and other laws and regulations.
Additionally, because we accept debit and credit cards for payment, we are subject to the PCI Standard issued by the Payment Card Industry Security Standards Council, with respect to payment card information. The PCI Standard contains compliance guidelines with regard to our security surrounding the physical and electronic storage, processing and transmission of cardholder data. Compliance with the PCI Standard and implementing related procedures, technology and information security measures requires significant resources and ongoing attention. Costs and potential problems and interruptions associated with the implementation of new or upgraded systems and technology such as those necessary to achieve compliance with the PCI Standard or with maintenance or adequate support of existing systems could also disrupt or reduce the efficiency of our operations. Any material interruptions or failures in our payment-related systems could have a material adverse effect on our business, financial condition and results of operations. If there are amendments to the PCI Standard, the cost of re-compliance could also be substantial and we may suffer loss of critical data and interruptions or delays in our operations as a result.
Adverse litigation judgments or settlements resulting from legal proceedings relating to our business operations could materially adversely affect our business, financial condition and results of operations.
From time to time, we are subject to allegations, and may be party to legal claims and regulatory proceedings, relating to our business operations. See Part I. Item 3. “Legal Proceedings.” Such allegations, claims and proceedings may be brought by third parties, including our customers, employees, governmental or regulatory bodies or competitors, and may include class actions. Defending against such claims and proceedings is costly and time consuming and may divert management’s attention and personnel resources from our normal business operations, and the outcome of many of these claims and proceedings cannot be predicted. If any of these claims or proceedings were to be determined adversely to us, a judgment, a fine or a settlement involving a payment of a material sum of money were to occur, or injunctive relief were issued against us, our business, financial condition and results of operations could be materially adversely affected.
We may not be able to adequately protect our intellectual property, which could harm the value of our brand and adversely affect our business.
Our ability to implement our business plan successfully depends in part on our ability to further build brand recognition using our trademarks, service marks and other proprietary intellectual property, including our name and logos. While it is our policy to protect and defend vigorously our rights to our intellectual property, we cannot predict whether steps taken by us to protect our intellectual property rights will be adequate to prevent infringement or misappropriation of these rights. It may be difficult for us to prevent others from copying elements of our products and any litigation to enforce our rights could be costly, divert attention of management, and may not be successful. Although we believe that we have sufficient rights to all of our trademarks, service marks and other intellectual property rights, we may face claims of infringement that could interfere with our ability to market and promote our brands. Any such litigation may be costly and divert resources from our business. Moreover, if we are unable to successfully defend against such claims, we may be prevented from using our trademarks, service marks or other intellectual property rights in the future and
34
may be liable for damages, which in turn could materially adversely affect our business, financial condition or results of operations.
Risks Related to Our Indebtedness
Our leverage could adversely affect our ability to raise additional capital to fund our operations, limit our ability to react to changes in the economy or our industry, expose us to interest rate risk to the extent of our variable rate debt and prevent us from meeting our debt obligations.
We have a significant amount of indebtedness. As of December 30, 2017, we had approximately $568.5 million of aggregate principal amount of indebtedness outstanding (excluding capital lease obligations). Our leverage could have important consequences for us, including:
• | requiring us to utilize a substantial portion of our cash flows from operations to make payments on our indebtedness, reducing the availability of our cash flows to fund working capital, capital expenditures, general corporate and other purposes; |
• | increasing our vulnerability to adverse economic, industry, or competitive developments; |
• | making it more difficult for us to satisfy our obligations with respect to our indebtedness, and any failure to comply with the obligations of any of our debt instruments, including any financial maintenance and restrictive covenants, could result in an event of default under the agreements governing our indebtedness; |
• | restricting us from capitalizing on business opportunities; |
• | limiting our ability to obtain additional financing for working capital, capital expenditures, execution of our business strategy, debt service requirements, acquisitions, and other general corporate purposes; and |
• | limiting our flexibility in planning for, or reacting to, changes in our business or market conditions and placing us at a competitive disadvantage compared to our competitors who are less highly leveraged and who, therefore, may be able to take advantage of opportunities that our leverage prevents us from exploiting. |
In addition, as of December 30, 2017, after inclusion of $500.0 million interest rate swaps fixing a portion of the variable rate debt, $68.6 million, or 12.1%, of our term loans was subject to variable rates. As a result, an increase in interest rates, whether because of an increase in market interest rates or a decrease in our creditworthiness, could increase the cost of servicing our debt and could materially reduce our profitability and cash flows.
Our credit agreement contains restrictions that limit our flexibility in operating our business.
Our credit agreement imposes significant operating and financial restrictions. These covenants may limit our ability and the ability of our subsidiaries, under certain circumstances, to, among other things:
• | incur additional indebtedness; |
• | create or incur liens; |
• | engage in certain fundamental changes, including mergers or consolidations; |
• | sell or transfer assets; |
• | pay dividends and distributions on our subsidiaries’ capital stock; |
• | make acquisitions, investments, loans or advances; |
• | pay or modify the terms of certain indebtedness; |
• | engage in certain transactions with affiliates; and |
• | enter into negative pledge clauses and clauses restricting subsidiary distributions. |
Our credit agreement also contains certain customary affirmative covenants and events of default, including a change of control. The credit agreement also contains a springing financial maintenance requirement with respect to the revolving credit facility, prohibiting us from exceeding a certain first lien secured leverage ratio under certain circumstances. As a result of these covenants and restrictions, we are limited in how we conduct our business, and we may be unable to raise additional debt or equity financing to compete effectively or to take advantage of new business opportunities. The terms of any future indebtedness we may incur could include more restrictive covenants. We cannot guarantee that we will be able to maintain compliance with these covenants in the future and, if we fail to do so, that we will be able to obtain waivers from the lenders and/or amend the covenants.
Our failure to comply with the restrictive covenants described above as well as others contained in our future debt instruments from time to time could result in an event of default, which, if not cured or waived, could result in our being required to repay these borrowings before their maturity dates. In addition, any event of default or declaration of acceleration under one debt instrument could also result in an event of default under one or more of our other debt instruments. If we are unable to repay, refinance or restructure our indebtedness under our secured debt, the holders of such debt could proceed against the collateral securing that indebtedness. If we are forced to refinance these borrowings
35
on less favorable terms or if we are unable to repay, refinance or restructure such indebtedness, our financial condition and results of operations could be adversely affected.
We may be unable to generate sufficient cash flow to satisfy our significant debt service obligations, which could have a material adverse effect on our business, financial condition and results of operations.
Our ability to make principal and interest payments on and to refinance our indebtedness will depend on our ability to generate cash in the future and is subject to general economic, financial, competitive, legislative, regulatory and other factors that are beyond our control. If our business does not generate sufficient cash flow from operations, in the amounts projected or at all, or if future borrowings are not available to us in amounts sufficient to fund our other liquidity needs, our business, financial condition and results of operations could be materially adversely affected.
If we cannot generate sufficient cash flow from operations to make scheduled principal and interest payments in the future, we may need to refinance all or a portion of our indebtedness on or before maturity, sell assets, delay capital expenditures or seek additional equity. The terms of our existing or future debt agreements may also restrict us from affecting any of these alternatives. Any refinancing of our debt could be at higher interest rates and may require us to comply with more onerous covenants, which could further restrict our business operations. Further, changes in the credit and capital markets, including market disruptions and interest rate fluctuations, may increase the cost of financing, make it more difficult to obtain favorable terms, or restrict our access to these sources of future liquidity. In addition, any failure to make scheduled payments of interest and principal on our outstanding indebtedness would likely result in a reduction of our credit rating, which could harm our ability to incur additional indebtedness on commercially reasonable terms or at all. Our inability to generate sufficient cash flow to satisfy our debt service obligations, or to refinance or restructure our obligations on commercially reasonable terms or at all, could have a material adverse effect on our business, financial condition and results of operations, as well as on our ability to satisfy our obligations in respect of our indebtedness.
Risks Related to Ownership of Our Common Stock
Because we have no current plans to pay cash dividends on our common stock, you may not receive any return on investment unless you sell your common stock for a price greater than that which you paid for it.
We have no current plans to pay cash dividends on our common stock. The declaration, amount and payment of any future dividends on our common stock will be at the sole discretion of our Board of Directors. Our Board of Directors may take into account general and economic conditions, our financial condition and results of operations, our available cash and current and anticipated cash needs, capital requirements, contractual, legal, tax and regulatory restrictions and implications on the payment of dividends by us to our stockholders or by our subsidiaries to us, including restrictions under our credit agreement and other indebtedness we may incur, and such other factors as our Board of Directors may deem relevant. As a result, you may not receive any return on an investment in our common stock unless you sell our common stock for a price greater than your purchase price.
We are a holding company with no operations of our own and, as such, we depend on our subsidiaries for cash to fund all of our operations and expenses, including future dividend payments, if any.
Our operations are conducted entirely through our subsidiaries and our ability to generate cash to meet our debt service obligations or to make future dividend payments, if any, is highly dependent on the earnings and the receipt of funds from our subsidiaries via dividends or intercompany loans. We do not currently expect to declare or pay dividends on our common stock for the foreseeable future; however, to the extent that we determine in the future to pay dividends on our common stock, the agreements governing our indebtedness may restrict the ability of our subsidiaries to pay dividends or otherwise transfer assets to us.
Maintaining the requirements of being a public company may strain our resources, divert management’s attention and affect our ability to attract and retain qualified board members.
As a public company, we incur significant legal, accounting, insurance and other expenses that we did not incur as a private company, including costs associated with public company governance and reporting requirements. We also have incurred and will continue to incur costs associated with our compliance with the Sarbanes-Oxley Act of 2002, or the Sarbanes-Oxley Act, and the Dodd-Frank Wall Street Reform and Consumer Protection Act, or the Dodd-Frank Act, as well as rules and regulations implemented by the SEC, and costs in connection with continued listing on NASDAQ. Our efforts to comply with these rules and regulations have significantly increased our legal and financial compliance costs, including costs associated with the hiring of additional personnel, and have made some activities more difficult, time-consuming or costly. Our management devote a substantial amount of time to ensure that we comply with all of these requirements, diverting the attention of management away from revenue-producing activities. The expenses incurred by public companies generally for reporting and corporate governance purposes have been increasing.
36
These laws and regulations also could make it more difficult or costly for us to obtain certain types of insurance, including director and officer liability insurance, and we may be forced to accept reduced policy limits and coverage or incur substantially higher costs to obtain the same or similar coverage. These laws and regulations could also make it more difficult for us to attract and retain qualified persons to serve on our Board of Directors, our board committees or as our executive officers. Furthermore, if we are unable to satisfy our obligations as a public company, we could be subject to delisting of our common stock, fines, sanctions and other regulatory action and potentially civil litigation.
Failure to comply with requirements to design, implement and maintain effective internal controls could have a material adverse effect on our business and stock price, and any failure to maintain financial controls could result in our financial statements becoming unreliable. We currently have material weaknesses in our internal control over financial reporting.
As a public company, we have significant requirements for enhanced financial reporting and internal controls. We have made, and will continue to make, changes to our internal controls and procedures for financial reporting and accounting systems to meet our reporting obligations as a public company. The process of designing and implementing effective internal controls is a continuous effort that requires us to anticipate and react to changes in our business and the economic and regulatory environments and to expend significant resources to maintain a system of internal controls that is adequate to satisfy our reporting obligations as a public company. The measures we take may not be sufficient to satisfy our obligations as a public company and if we are unable to establish or maintain appropriate internal financial reporting controls and procedures, it could cause us to fail to meet our reporting obligations on a timely basis, result in material misstatements in our consolidated financial statements and harm our results of operations. In addition, we will be required, pursuant to Section 404(a) of the Sarbanes-Oxley Act, or Section 404, to furnish a report by management on, among other things, the effectiveness of our internal control over financial reporting in the annual report for the fiscal year ending December 29, 2018. This assessment will need to include disclosure of any material weaknesses identified by our management in our internal control over financial reporting. The rules governing the standards that must be met for our management to assess our internal control over financial reporting are complex and require significant documentation, testing and possible remediation. Testing and maintaining internal controls may divert our management’s attention from other matters that are important to our business. Our independent registered public accounting firm will be required to issue an attestation report on the effectiveness of our internal controls in the annual report for the fiscal year ending December 29, 2018.
In connection with the implementation of the necessary procedures and practices related to internal control over financial reporting, we have identified and may identify additional deficiencies that we may not be able to remediate in time to meet the deadline imposed by the Sarbanes-Oxley Act for compliance with the requirements of Section 404. In addition, we may encounter problems or delays in completing the remediation of any deficiencies identified by our independent registered public accounting firm in connection with the issuance of their attestation report.
As disclosed in our prospectus, dated October 25, 2017, filed with the SEC on October 27, 2017, management concluded that we have material weaknesses in our internal control over financial reporting. A material weakness is a deficiency, or a combination of deficiencies, in internal control over financial reporting, such that there is a reasonable possibility that a material misstatement of the Company’s annual or interim consolidated financial statements will not be prevented or detected on a timely basis. We identified a deficiency in the design of controls related to the timely detection of damaged, expired or expiring contact lens inventory for purposes of recording inventory at net realizable value. We also identified a material weakness related to a deficiency in the design of entity level controls to identify and assess changes in our business environment that could significantly impact the system of internal control over financial reporting. As a result of these material weaknesses, we wrote off $2.3 million of inventory related to the expired or expiring contact lens inventory in fiscal year 2017. As a result of the material weakness in our entity level controls, we overstated net sales of services and plans in our legacy segment and consolidated net sales of services and plans and understated net product sales in our legacy segment and consolidated net product sales by $7.2 million and $7.6 million for fiscal years 2016 and 2015, respectively. We have designed and are implementing controls to remediate these material weaknesses. These remediation measures may be time consuming, costly, and may place significant demands on our financial and operational resources. Our efforts to remediate these material weaknesses may not be effective. If our efforts to remediate these material weaknesses are not successful, the material weaknesses may reoccur or related material weaknesses could occur in the future.
Our testing, or the subsequent testing by our independent registered public accounting firm, may reveal deficiencies in our internal controls over financial reporting that are deemed to be material weaknesses in addition to the material weaknesses described above. The material weaknesses described above or any newly-identified material weaknesses could result in a material misstatement of our annual or quarterly consolidated financial statements or disclosures that may not be prevented or detected.
37
We may not be able to conclude on an ongoing basis that we have effective internal control over financial reporting in accordance with Section 404 or our independent registered public accounting firm may not issue an unqualified opinion. If either we are unable to conclude that we have effective internal control over financial reporting or our independent registered public accounting firm is unable to provide us with an unqualified report, investors could lose confidence in our reported financial information, which could have a material adverse effect on the trading price of our common stock.
We are a “controlled company” within the meaning of NASDAQ rules and the rules of the SEC and, as a result, qualify for, and rely on, exemptions from certain corporate governance requirements. You do not have the same protections afforded to stockholders of other companies that are subject to such requirements.
The Sponsors control a majority of the voting power of our outstanding common stock. As a result, we are a “controlled company” within the meaning of the corporate governance standards of NASDAQ. Under these rules, a company of which more than 50% of the voting power is held by an individual, group or another company is a “controlled company” and may elect not to comply with certain corporate governance requirements, including the requirements that:
• | a majority of our Board of Directors consist of “independent directors” as defined under the rules of NASDAQ; |
• | our Board of Directors have a compensation committee that is composed entirely of independent directors with a written charter addressing the committee purpose and responsibilities; and |
• | our director nominations be made, or recommended to the full Board of Directors, by our independent directors or by a nominations committee that is composed entirely of independent directors and that we adopt a written charter or board resolution addressing the nominations process. |
Because we utilize these exemptions, we do not have a majority of independent directors, our compensation committee does not consist entirely of independent directors and our director nominations are not made, or recommended to the full Board of Directors, by our independent directors and we do not have a nominating/corporate governance committee composed of independent directors. Accordingly, you do not have the same protections afforded to stockholders of companies that are subject to all of the corporate governance requirements of NASDAQ.
In addition, Rule 10C-1 under the Exchange Act implements provisions of the Dodd-Frank Act pertaining to compensation committee independence and the role and disclosure of compensation consultants and other advisers to the compensation committee. The listing standards of the national securities exchanges (including NASDAQ) comply with provisions of Rule 10C-1 and require, among others, that:
• | compensation committees be composed of fully independent directors, as determined pursuant to new and existing independence requirements; |
• | compensation committees be explicitly charged with hiring and overseeing compensation consultants, legal counsel and other committee advisers; and |
• | compensation committees be required to consider, when engaging compensation consultants, legal counsel or other advisers, certain independence factors, including factors that examine the relationship between the consultant or adviser’s employer and us. |
As a “controlled company,” we are not subject to these compensation committee independence requirements.
Our Sponsors control us and their interests may conflict with ours or yours in the future.
As of December 30, 2017, the Sponsors beneficially owned approximately 72% of our common stock. As a result, the Sponsors are able to control the election and removal of our directors and thereby control our policies and operations, including the appointment of management, future issuances of our common stock or other securities, payment of dividends, if any, on our common stock, the incurrence or modification of indebtedness by us, amendment of our amended and restated certificate of incorporation and amended and restated bylaws and the entering into of extraordinary transactions, and their interests may not in all cases be aligned with your interests. In addition, the Sponsors and their affiliates may have an interest in pursuing acquisitions, divestitures and other transactions that, in their judgment, could enhance their investment, even though such transactions might involve risks to you. For example, the Sponsors could cause us to make acquisitions that increase our indebtedness or cause us to sell revenue-generating assets.
Our Sponsors and their affiliates are in the business of making investments in companies and may from time to time acquire and hold interests in businesses that compete directly or indirectly with us. Our amended and restated certificate of incorporation provides that none of the Sponsors, any of their affiliates or any director who is not employed by us (including any non-employee director who serves as one of our officers in both his director and officer capacities) or his or her affiliates have any duty to refrain from engaging, directly or indirectly, in the same business activities or similar business activities or lines of business in which we operate. The Sponsors and their affiliates also may pursue
38
acquisition opportunities that may be complementary to our business and, as a result, those acquisition opportunities may not be available to us.
In addition, the Sponsors and their affiliates are able to determine the outcome of all matters requiring stockholder approval and to cause or prevent a change of control of our company or a change in the composition of our Board of Directors and could preclude any acquisition of our company. This concentration of voting control could deprive you of an opportunity to receive a premium for your shares of common stock as part of a sale of our company and ultimately might affect the market price of our common stock.
Future sales, or the perception of future sales, by us or our existing stockholders, could cause the market price for our common stock to decline.
Sales of a substantial number of shares of our common stock in the public market, or the perception that such sales could occur, could substantially decrease the market price of our common stock.
As of December 30, 2017, we had 74,653,812 shares of our common stock outstanding. Of the outstanding shares, the 18,170,000 shares sold in the IPO are freely tradable without restriction or further registration under the Securities Act of 1933, as amended, or the Securities Act, except for any shares held by our affiliates, as that term is defined under Rule 144 of the Securities Act, or Rule 144, including our directors, executive officers and other affiliates (including affiliates of the Sponsors).
54,967,047 shares of common stock held by affiliates of KKR Sponsors, affiliates of Berkshire and certain of our directors and executive officers as of December 30, 2017, representing approximately 74% of the total outstanding shares of our common stock as of December 30, 2017, are “restricted securities” within the meaning of Rule 144 and subject to certain restrictions on resale. Restricted securities may be sold in the public market only if they are registered under the Securities Act or are sold pursuant to an exemption from registration such as Rule 144.
In connection with our IPO, we, our directors and executive officers and holders of substantially all of our outstanding common stock prior to the IPO signed lock-up agreements with the underwriters that, subject to certain exceptions, restrict the disposition of, or hedging with respect to, the shares of our common stock or securities convertible into or exchangeable for shares of common stock, each held by them until April 2018, except with the prior written consent of any two of Merrill Lynch, Pierce, Fenner & Smith Incorporated, Goldman Sachs & Co. LLC and Citigroup Global Markets Inc.
In addition, pursuant to a registration rights agreement, each of the Sponsors has the right, subject to certain conditions, to require us to register the sale of their shares of our common stock under the Securities Act. By exercising its registration rights and selling a large number of shares, a Sponsor could cause the prevailing market price of our common stock to decline. Certain of our other stockholders have “piggyback” registration rights with respect to future registered offerings of our common stock. The shares covered by registration rights represent approximately 76% of our total common stock outstanding as of December 30, 2017. Registration of any of these outstanding shares of common stock would result in such shares becoming freely tradable without compliance with Rule 144 upon effectiveness of the registration statement.
14,585,568 shares of our common stock subject to our outstanding options or subject to issuance under our 2013 Equity Incentive Plan, our 2014 Stock Incentive Plan and our 2017 Omnibus Incentive Plan have been registered with a registration statement on Form S-8 and will be available for sale in the open market, subject to limitations in the management stockholder’s agreements. As of December 30, 2017, there were stock options outstanding to purchase a total of 10,608,559 shares of our common stock and 182,138 shares of our common stock subject to restricted stock units. In addition, as of December 30, 2017, 3,794,871 shares of our common stock were reserved for future issuance under our incentive plans.
As restrictions on resale end, or if the Sponsors exercise their registration rights, the market price of our shares of common stock could drop significantly if the holders of these shares sell them or are perceived by the market as intending to sell them. These factors could also make it more difficult for us to raise additional funds through future offerings of our shares of common stock or other securities.
In the future, we may also issue our securities in connection with investments or acquisitions. The amount of shares of our common stock issued in connection with an investment or acquisition could constitute a material portion of our then-outstanding shares of our common stock. Any issuance of additional securities in connection with investments or acquisitions may result in additional dilution to you.
39
Anti-takeover provisions in our organizational documents could delay or prevent a change of control.
Certain provisions of our amended and restated certificate of incorporation and amended and restated bylaws may have an anti-takeover effect and may delay, defer or prevent a merger, acquisition, tender offer, takeover attempt, or other change of control transaction that a stockholder might consider in its best interest, including those attempts that might result in a premium over the market price for the shares held by our stockholders.
These provisions provide for, among other things:
• | a classified board of directors, as a result of which our Board of Directors is divided into three classes, with each class serving for staggered three-year terms; |
• | the ability of our Board of Directors to issue one or more series of preferred stock; |
• | advance notice requirements for nominations of directors by stockholders and for stockholders to include matters to be considered at our annual meetings; |
• | certain limitations on convening special stockholder meetings; |
• | the removal of directors only for cause and only upon the affirmative vote of the holders of at least 66 2∕3 % of the shares of common stock entitled to vote generally in the election of directors if the Sponsors and their affiliates cease to beneficially own at least 40% of shares of common stock entitled to vote generally in the election of directors; and |
• | that certain provisions may be amended only by the affirmative vote of at least 66 2∕3 % of shares of common stock entitled to vote generally in the election of directors if the Sponsors and their affiliates cease to beneficially own at least 40% of shares of common stock entitled to vote generally in the election of directors. |
These anti-takeover provisions could make it more difficult for a third party to acquire us, even if the third party’s offer may be considered beneficial by many of our stockholders. As a result, our stockholders may be limited in their ability to obtain a premium for their shares.
Item 1B. Unresolved Staff Comments
None.
40
Item 2. Properties
We lease all of our America’s Best and Eyeglass World retail stores. Our leases generally have a term of five to ten years, with renewal options that generally range from five to 15 years. Recently, we have begun entering into more leases with ten year initial terms, with renewal options. Most leases for these retail stores provide for a minimum rent, typically with escalating rent increases. In certain circumstances we pay a percentage rent based upon sales after certain minimum thresholds are achieved. These leases generally require us to pay insurance, utilities, real estate taxes and common area maintenance expenses.
We occupy our host locations through master agreements with our host partners, which contain standard terms and conditions, such as fixed and percentage-based payments. We occupy our legacy locations through master agreements with standard terms and conditions, such as percentage-based payments.
A summary of our stores by location as of December 30, 2017 is as follows:
State | America’s Best | Eyeglass World | Legacy | Other | State | America’s Best | Eyeglass World | Legacy | Other | |
AK | — | — | 1 | 7 | MT | — | — | 1 | — | |
AL | 9 | 1 | 3 | 3 | NC | 10 | — | 36 | 3 | |
AR | — | — | — | 1 | ND | — | — | — | — | |
AZ | 18 | 4 | 9 | 2 | NE | 3 | 1 | — | 1 | |
CA | 46 | 17 | 43 | 4 | NH | — | — | 3 | — | |
CO | 19 | 1 | 7 | 3 | NJ | 15 | — | 4 | 1 | |
CT | — | — | 7 | — | NM | — | 1 | 6 | 3 | |
DE | — | — | — | — | NV | — | 3 | 2 | 1 | |
FL | 49 | 33 | 2 | 2 | NY | 13 | — | 13 | 1 | |
GA | 32 | 3 | 25 | 5 | OH | 22 | 1 | — | 1 | |
HI | — | — | 3 | — | OK | — | — | — | — | |
IA | 6 | 1 | — | — | OR | 9 | — | 3 | 9 | |
ID | 5 | — | — | — | PA | 29 | 2 | 13 | — | |
IL | 44 | 2 | — | — | RI | — | — | — | — | |
IN | 10 | 10 | — | — | SC | 11 | 1 | 6 | 1 | |
KS | — | 1 | 8 | 2 | SD | — | — | 1 | — | |
KY | 2 | 1 | — | 2 | TN | 16 | 2 | — | — | |
LA | 13 | — | 1 | 1 | TX | 84 | 5 | 3 | 5 | |
MA | — | — | 2 | — | UT | 9 | 3 | — | 1 | |
MD | 17 | — | 1 | 1 | VA | 25 | — | 16 | 2 | |
ME | — | — | — | — | VT | — | — | — | — | |
MI | 28 | 12 | — | — | WA | 11 | 1 | 1 | 19 | |
MN | 13 | — | — | — | WI | 7 | — | — | — | |
MO | 18 | 1 | — | 1 | WV | — | — | 6 | — | |
MS | — | — | — | 2 | WY | — | — | 1 | — | |
Note: ‘Other’ includes Vista Optical in Fred Meyer stores and on military bases. There is one America’s Best location in Washington, D.C. and one Vista Optical location in Puerto Rico.
We lease laboratories in Georgia and Utah and distribution centers in Georgia and Ohio, and we own our laboratory in Minnesota. In addition, we intend to enter into a lease for an additional laboratory facility 2018 and expect the laboratory to be operational in time for the first quarter 2019.
Our corporate offices are located in approximately 73,000 square feet of leased space in Duluth, Georgia. In addition, we lease approximately 27,000 square feet of office space for our AC Lens corporate office in Columbus, Ohio, and we lease approximately 3,000 square feet of office space for our FirstSight corporate office in Upland, California.
41
Item 3. Legal Proceedings
We are currently and may in the future become subject to various claims and pending or threatened lawsuits in the normal course of our business.
Our subsidiary, FirstSight is a defendant in a purported class action in the U.S. District Court for the Southern District of California that alleges that FirstSight participated in arrangements that caused the illegal delivery of eye examinations and that FirstSight thereby violated, among other laws, the corporate practice of optometry and the unfair competition and false advertising laws of California. The lawsuit was filed in 2013 and FirstSight was added as a defendant in 2016. In March 2017, the court granted the motion to dismiss previously filed by FirstSight and dismissed the complaint with prejudice. The plaintiffs filed an appeal with the U.S. Court of Appeals for the Ninth Circuit in April 2017. We intend to continue to defend the litigation vigorously. We believe that the claims alleged are without merit.
In May 2017, a complaint was filed against us and other defendants alleging, on behalf of a proposed class of consumers who purchased contact lenses online, that 1-800 Contacts, Inc. entered into a series of agreements with the other defendants, including AC Lens, to suppress certain online advertising and that each defendant thereby engaged in anticompetitive conduct in violation of the Sherman Antitrust Act. We have settled this litigation for $7.0 million, without admitting liability. Accordingly, we recorded a charge for this amount in litigation settlement in the consolidated statement of operations during during the second quarter of fiscal year 2017 in in our audited consolidated financial statements included in Part II. Item 8. of this Form 10-K.
On November 8, 2017, the court in the 1-800 Contacts Matter entered an order preliminarily approving the settlement agreement, subject to a settlement hearing. Pursuant to this order, we deposited 50% of the settlement amount, or $3.5 million, into an escrow account, to be distributed subject to and in accordance the terms of the settlement agreement and any further order of the court.
We are not currently party to any other legal proceedings that we believe would have a material adverse effect on our financial position, results of operations or cash flows.
Item 4. Mine Safety Disclosures
Not applicable.
42
PART II
Item 5. Market for Registrant’s Common Equity, Related Stockholder Matters and Issuer Purchases of Equity Securities
Market Information
Our common stock has been listed on NASDAQ Global Select Market under the symbol “EYE” since October 26, 2017, the Company’s initial day of trading. Prior to that date, there was no public market for our common stock. The following table sets forth, for the period indicated, the high and low sales price of our common stock as reported by NASDAQ:
2017 | High Sales Price | Low Sales Price | |||||
Fourth quarter (beginning October 26, 2017) | $ | 40.76 | $ | 22.00 | |||
Holders
As of December 30, 2017, there were approximately 85 holders of record of our common stock. The number of holders of record is based upon the actual number of holders registered at such date and does not include holders of shares in “street name” or persons, partnerships, associates, corporations or other entities identified in security position listing maintained by depositories.
Issuer Purchases of Equity Securities
During the quarter and year ended December 30, 2017, we did not purchase any of our equity securities that are registered under Section 12(b) of the Exchange Act.
Dividends
We have no current plans to pay dividends on our common stock. Any decision to declare and pay dividends in the future will be made at the sole discretion of our Board of Directors and will depend on, among other things, our results of operations, cash requirements, financial condition, contractual restrictions and other factors that our Board of Directors may deem relevant.
Performance Graph
This performance graph shall not be deemed “soliciting material” or “filed” with the SEC for purposes of Section 18 of the Exchange Act, or otherwise subject to the liabilities under that Section, and shall not be deemed to be incorporated by reference into any of our filings under the Securities Act or the Exchange Act.
The graph below presents the Company’s cumulative total stockholder returns relative to the performance of the NASDAQ Global Composite Index and the NASDAQ US Benchmark Retail Index for our fiscal year 2017, commencing October 26, 2017 (the Company’s initial day of trading). All values assume a $100 initial investment at the opening price of the Company’s common stock on the NASDAQ and data for the NASDAQ Global Composite Index and the NASDAQ US Benchmark Retail Index assumes all dividends were reinvested on the date paid. The points on the graph represent fiscal month-end values based on the last trading day of each fiscal month. The comparisons are based on historical data and are not indicative of, nor intended to forecast, the future performance of our common stock.
43
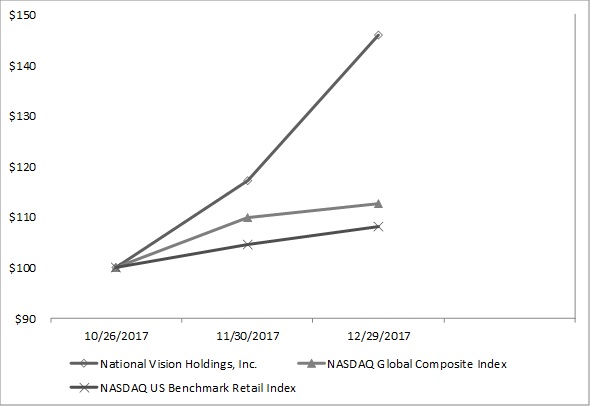
Purchases of Equity Securities by Issuer and Affiliated Purchasers
None.
Unregistered Sales of Equity Securities
(a) Sales of Unregistered Securities
Issuances of Capital Stock
The following sets forth information regarding all unregistered sales of securities by the Company during the fiscal year ended December 30, 2017. The following reflects the 1.96627-for-one reverse stock split of the Company’s common stock effective October 24, 2017.
On August 14, 2017, we issued 63,572 shares of our common stock at a price per share of $15.73 to certain of our employees in connection with their hiring and/or promotion.
In addition, we issued shares of common stock to certain employees related to the exercise of (i) rollover options and (ii) stock options that had previously been awarded and vested and in connection with services provided by such employees as follows:
• | On February 1, 2017, we issued 16,274 shares of our common stock at a price per share of $9.24. |
• | On February 8, 2017, we issued 36,617 shares of our common stock at a price per share of $7.24. |
• | On March 20, 2017, we issued 122,058 shares of our common stock at a price per share of $4.27. |
• | On March 22, 2017, we issued 36,617 shares of our common stock at a price per share of $4.27. |
Also, on July 24, 2017, we issued 6,357 restricted shares of common stock, based on the fair market value of $15.73 per share as of the award date, to a non-employee director.
No underwriters were involved in the foregoing issuance of securities. The issuances of shares of common stock described in this Item 15(a) were issued pursuant to written compensatory plans or arrangements with our employees in reliance on the exemption from the registration requirements of the Securities Act provided by Rule 701 promulgated under the Securities Act or the exemption set forth in Section 4(2) under the Securities Act and Regulation D promulgated thereunder relative to transactions by an issuer not involving any public offering, to the extent an exemption from such registration was required.
44
Stock Option Grants
We granted stock options to certain employees in connection with services provided by such employees or the hiring/promotion of such employees as follows:
• | On March 20, 2017, we granted stock options to purchase an aggregate of 63,572 shares of our common stock with an exercise price of $11.92 per share. |
• | On April 13, 2017, we granted stock options to purchase an aggregate of 50,857 shares of our common stock with an exercise price of $15.06 per share. |
• | On May 16, 2017, we granted stock options to purchase an aggregate of 101,715 shares of our common stock with an exercise price of $15.06 per share. |
• | On June 5, 2017, we granted stock options to purchase an aggregate of 228,859 shares of our common stock with an exercise price of $15.06 per share. |
• | On July 24, 2017, we granted stock options to purchase an aggregate of 101,715 shares of our common stock with an exercise price of $15.73 per share. |
• | On August 14, 2017, we granted stock options to purchase an aggregate of 642,034 shares of our common stock with an exercise price of $15.73 per share. |
• | On August 24, 2017, we granted stock options to purchase an aggregate of 76,286 shares of our common stock with an exercise price of $15.73 per share. |
As of December 30, 2017, options (excluding rollover options) to purchase 565,860 shares of common stock had been exercised for aggregate consideration in the amount of $3.9 million, and options to purchase 823,093 shares of common stock had been canceled or repurchased.
The issuances of stock options and the shares of common stock issuable upon the exercise of the options described in this Item 15(b) were issued pursuant to written compensatory plans or arrangements with our employees, and directors, in reliance on the exemption from the registration requirements of the Securities Act provided by Rule 701 promulgated under the Securities Act or the exemption set forth in Section 4(2) under the Securities Act and Regulation D promulgated thereunder relative to transactions by an issuer not involving any public offering, to the extent an exemption from such registration was required.
(b) Use of Proceeds
On October 30, 2017, we completed our IPO in which we issued and sold 18,170,000 shares of common stock, including 2,370,000 shares of common stock pursuant to the exercise in full of the underwriters’ option to purchase additional shares. The shares sold in the IPO were registered under the Securities Act pursuant to our Registration Statement on Form S-1 (File No. 333-220719), which was declared effective by the SEC on October 25, 2017. The common stock is listed on the NASDAQ Global Select Market under the symbol “EYE.” The shares of our common stock were sold at an initial offering price of $22.00 per share, which generated net proceeds of approximately $375.8 million to us, after deducting underwriting discounts and commissions of approximately $24.0 million and other offering expenses. We used the net proceeds from the IPO to repay all $125.0 million outstanding aggregate amount of our second lien term loans and approximately $235.0 million of the outstanding amount of our first lien term loans and accrued and unpaid interest thereon. Additionally, we paid $4.0 million of transaction related expenses. The remaining $11.8 million of proceeds was used for general corporate purposes, and payment of the termination fees described below.
Merrill Lynch, Pierce, Fenner & Smith Incorporated, Goldman Sachs & Co. LLC, Citigroup Global Markets Inc. and KKR Capital Markets LLC acted as joint book-running managers and as representatives of the underwriters in the IPO. Morgan Stanley & Co. LLC, Jefferies LLC, UBS Securities LLC, Wells Fargo Securities, LLC, Guggenheim Securities, LLC, Mizuho Securities USA LLC and Macquarie Capital (USA) Inc. acted as co-managers in the IPO. NVI was party to a monitoring agreement, dated as of March 14, 2014, with KKR Sponsor and Berkshire, which was terminated automatically in accordance with its terms upon the completion of the IPO. The Company paid termination fees of approximately $3.6 million and $0.8 million to KKR Sponsor and Berkshire, respectively.
45
Item 6. Selected Financial Data
Set forth below is our selected historical consolidated financial data as of the dates and for the periods indicated. For the purpose of discussing our financial results, we refer to ourselves as the “Successor” in the periods following the KKR Acquisition and the “Predecessor” during the periods preceding the KKR Acquisition.
The selected historical consolidated financial data as of and for fiscal years 2017 (Successor), 2016 (Successor) and 2015 (Successor) have been derived from our audited consolidated financial statements included elsewhere in this Form 10-K. The selected historical consolidated financial data as of January 3, 2015 and for the period from March 13, 2014 to January 3, 2015 (Successor) and the period from December 29, 2013 to March 12, 2014 (Predecessor) and fiscal year 2013 (Predecessor) have been derived from our audited consolidated financial statements not included in this Form 10-K. The results of operations for any period are not necessarily indicative of the results to be expected for any future period. Share and per share data in the table below has been retroactively adjusted to give effect to the 1.96627-for-one reverse stock split, effected on October 24, 2017.
The selected historical consolidated financial data set forth below should be read in conjunction with, and is qualified by reference to, “Management’s Discussion and Analysis of Financial Condition and Results of Operations” and our audited consolidated financial statements and related notes thereto, each included elsewhere in this Form 10-K.
46
Successor | Predecessor | |||||||||||||||||||||||
In thousands, except earnings per share | Fiscal Year 2017 | Fiscal Year 2016 | Fiscal Year 2015 | From March 13, 2014 to January 3, 2015 | From December 29, 2013 to March 12, 2014 | Fiscal Year 2013 | ||||||||||||||||||
Consolidated Statement of Operations Data: | ||||||||||||||||||||||||
Net revenue | $ | 1,375,308 | $ | 1,196,195 | $ | 1,062,528 | $ | 735,680 | $ | 197,017 | $ | 840,046 | ||||||||||||
Cost applicable to revenue | 636,966 | 544,781 | 491,100 | 366,476 | 93,194 | 403,486 | ||||||||||||||||||
Operating expenses | 671,106 | 585,030 | 526,751 | 382,146 | 93,873 | 390,029 | ||||||||||||||||||
Income (loss) from operations | 67,236 | 66,384 | 44,677 | (12,942 | ) | 9,950 | 46,531 | |||||||||||||||||
Interest expense, net | 55,536 | 39,092 | 36,741 | 26,823 | 4,757 | 23,254 | ||||||||||||||||||
Debt issuance cost | 4,527 | — | 2,551 | — | — | — | ||||||||||||||||||
Earnings (loss) before income taxes | 7,173 | 27,292 | 5,385 | (39,765 | ) | 5,193 | 23,277 | |||||||||||||||||
Income tax (benefit) provision | (38,647 | ) | 12,534 | 1,768 | (12,715 | ) | 2,061 | 9,165 | ||||||||||||||||
Net income (loss) | $ | 45,820 | $ | 14,758 | $ | 3,617 | $ | (27,050 | ) | $ | 3,132 | $ | 14,112 | |||||||||||
Earnings (loss) per share: | ||||||||||||||||||||||||
Basic | $ | 0.77 | $ | 0.26 | $ | 0.06 | $ | (0.48 | ) | $ | 47.45 | $ | 213.45 | |||||||||||
Diluted | $ | 0.74 | $ | 0.26 | $ | 0.06 | $ | (0.48 | ) | $ | 46.75 | $ | 211.82 | |||||||||||
Weighted average shares outstanding: | ||||||||||||||||||||||||
Basic | 59,895 | 56,185 | 55,962 | 55,807 | 66 | 66 | ||||||||||||||||||
Diluted | 62,035 | 57,001 | 55,962 | 55,807 | 67 | 67 | ||||||||||||||||||
Statement of Cash Flow Data: | ||||||||||||||||||||||||
Net cash provided by operating activities | $ | 90,252 | $ | 97,588 | $ | 83,131 | $ | 17,996 | $ | 31,008 | $ | 57,989 | ||||||||||||
Net cash used for investing activities | $ | (94,827 | ) | $ | (91,664 | ) | $ | (80,051 | ) | $ | (43,740 | ) | $ | (11,958 | ) | $ | (47,311 | ) | ||||||
Net cash provided by (used for) financing activities | $ | 3,838 | $ | (6,574 | ) | $ | (4,317 | ) | $ | 7,130 | $ | (28 | ) | $ | (9,261 | ) | ||||||||
Balance Sheet Data (at period end): | ||||||||||||||||||||||||
Cash and cash equivalents | $ | 4,208 | $ | 4,945 | $ | 5,595 | $ | 6,832 | N/A | $ | 6,424 | |||||||||||||
Total assets | $ | 1,583,791 | $ | 1,531,117 | $ | 1,475,595 | $ | 1,444,913 | N/A | $ | 336,233 | |||||||||||||
Total Debt | $ | 569,238 | $ | 745,625 | $ | 747,825 | $ | 601,452 | N/A | $ | 289,664 | |||||||||||||
Total stockholders’ equity | $ | 659,588 | $ | 401,887 | $ | 386,230 | $ | 523,594 | N/A | $ | (122,240 | ) | ||||||||||||
47
Item 7. Management’s Discussion and Analysis of Financial Condition and Results of Operations
The following discussion contains management’s discussion and analysis of our financial condition and results of operations and should be read together with the consolidated financial statements and the related notes thereto included elsewhere in this Form 10-K. This discussion contains forward-looking statements that reflect our plans, estimates and beliefs and involve numerous risks and uncertainties, including, but not limited to, those described in the “Risk Factors” section included in Part I. Item 1A. in this Form 10-K, as such risk factors may be updated from time to time in our periodic filings with the SEC. Actual results may differ materially from those contained in any forward-looking statements. You should carefully read “Special Note Regarding Forward-Looking Statements” in this Form 10-K.
We conduct substantially all of our activities through our direct wholly-owned subsidiary, NVI, and its subsidiaries. We operate on a retail fiscal calendar that results in a given fiscal year consisting of a 52- or 53-week period ending on the Saturday closest to December 31. In a 52-week fiscal year, each quarter contains 13 weeks of operations; in a 53-week fiscal year, each of the first, second and third quarters includes 13 weeks of operations and the fourth quarter includes 14 weeks of operations. References herein to “fiscal year 2017” relate to the 52 weeks ended December 30, 2017, references herein “fiscal year 2016” relate to the 52 weeks ended December 31, 2016 and references herein to “fiscal year 2015” relate to the 52 weeks ended January 2, 2016.
Overview
We are one of the largest and fastest growing optical retailers in the United States and a leader in the attractive value segment of the U.S. optical retail industry. We believe that vision is central to quality of life and that people deserve to see their best to live their best, no matter what their budget. Our mission is to make quality eye care and eyewear affordable and accessible to all Americans. We achieve this by providing eye exams, eyeglasses and contact lenses to cost-conscious and low-income consumers. We deliver exceptional value and convenience to our customers, with an opening price point that strives to be among the lowest in the industry, enabled by our low-cost operating platform. We reach our customers through a diverse portfolio of 1,013 retail stores across five brands and 18 consumer websites as of fiscal year end 2017.
Our operations consist of two reportable segments:
• | Owned & host – As of fiscal year end 2017, our owned brands consisted of 594 America’s Best Contacts and Eyeglasses (“America’s Best”) retail stores and 107 Eyeglass World retail stores. In America’s Best stores, vision care services are provided by optometrists employed by us or by independent professional corporations. America’s Best stores are primarily located in high-traffic strip centers next to similar nationally-known discount retailers. Eyeglass World locations primarily feature independent optometrists who perform eye exams and on-site optical laboratories that enable stores to quickly fulfill many customer orders and make repairs on site. Eyeglass World stores are primarily located in freestanding or in-suite locations near high-foot-traffic shopping centers. Our two host brands consisted of 56 Vista Optical locations on military bases and 29 Vista Optical locations within Fred Meyer stores as of fiscal year end 2017. We have strong, long-standing relationships with our host partners and have maintained each partnership for over 18 years. Both host brands compete within the value segment of the U.S. optical retail industry. These brands provide eye exams principally by independent optometrists in nearly all locations. All brands utilize our centralized laboratories. This segment also includes sales from our four store brand websites, three of which are omni-channel. |
• | Legacy – We manage the operations of, and supply inventory and laboratory processing services to, 227 Vision Centers in Walmart retail locations as of fiscal year 2017. Under our management & services agreement with Walmart, our responsibilities include ordering and maintaining merchandise inventory, arranging the provision of optometry services, providing managers and staff at each location, training personnel, providing sales receipts to customers, maintaining necessary insurance, obtaining and holding required licenses, permits and accreditations, owning and maintaining store furniture, fixtures and equipment, and developing annual operating budgets and reporting. We earn management fees as a result of providing such services and we record revenue related to sales of products and product protection plans on a net basis. Our management & services agreement also allows our legacy partner to collect penalties if the Vision Centers do not generate a requisite amount of revenues. We also sell to our legacy partner merchandise that is stocked in retail locations we manage pursuant to a separate supplier agreement, and provide to our legacy partner centralized laboratory services for the finished eyeglasses for our legacy partner’s customers in stores that we manage. We lease space from Walmart within or adjacent to each of the locations we manage and use this space for the provision of optometric examination services. During the fiscal year 2017, sales associated with our legacy partner arrangement represented 11.2% of consolidated net revenue. This exposes us to concentration of customer |
48
risk. Our agreements with our legacy partner expire on August 23, 2020, and will automatically renew for a three-year period unless a party elects not to renew.
Our consolidated results also include other non-reportable segment activity recorded in our corporate/other category:
• | Our wholly-owned subsidiary, AC Lens, manages our e-commerce platform, which consists of 14 dedicated websites. Our e-commerce business consists of six proprietary branded websites, including aclens.com and discountcontactlenses.com, and eight third-party websites with established retailers, such as Walmart, Sam’s Club and Giant Eagle, and mid-sized vision insurance providers. AC Lens handles site management, customer relationship management and order fulfillment and also sells a wide variety of contact lenses, eyeglasses and eye care accessories. |
• | AC Lens also distributes contact lenses to Walmart and Sam’s Club under fee for service arrangements. We record revenue for these activities and we incur costs at a higher percentage of sales than other product categories, given the wholesale nature of the business. |
• | Managed care business conducted by FirstSight, our wholly-owned subsidiary that is licensed as a single-service health plan under California law, which issues individual vision care benefit plans in connection with our America’s Best operations in California, provides or arranges for the provision of optometric services at almost all of the optometric offices next to Walmart and Sam’s Club stores in California and also sells contact lenses to its members in certain locations. |
• | Unallocated corporate overhead expenses, which are a component of selling, general and administrative expenses and are comprised of various home office general and administrative expenses such as payroll expenses, occupancy costs, and consulting and professional fees. Corporate overhead expenses also include field supervision for stores included in our owned & host and legacy segments. |
Reportable segment information is presented on the same basis as our consolidated financial statements, except for owned & host reportable segment revenue, which is presented on a cash basis, excluding the effects of unearned and deferred revenue, consistent with what our chief operating decision maker (“CODM”) regularly reviews. Reconciliations of segment results to consolidated results include financial information necessary to adjust reportable segment revenues to a consolidated basis in accordance with accounting principles generally accepted in the United States of America (“GAAP”), specifically the change in unearned and deferred revenues during the period. There are no revenue transactions between reportable segments, and there are no other items in the reconciliations other than deferred and unearned revenue items previously described.
Deferred revenue represents cash basis sales of product protection plans and eye care club memberships, and is the timing difference of when we collect the cash from the customer and performance of the service to the customer. The increases or decreases in deferred revenue represent cash collections in the reporting period in excess of or below the recognition of previous deferrals and are presented in the reconciliation column in Note 14. “Segment Reporting” in our consolidated financial statements, to adjust segment revenues on a cash basis to revenues as presented in our consolidated financial statements.
Unearned revenue represents cash basis sales of prescription eyewear only for approximately the last week of the reporting period and is the timing difference of when we collect the cash from the customer and the delivery/customer acceptance of the product.
Trends and Other Factors Affecting Our Business
Various trends and other factors affect or have affected our operating results, including:
New Store Openings
We expect that new stores will be a key driver of growth in our net revenue and operating profit in the future. Our results of operations have been and will continue to be materially affected by the timing and number of new store openings. As stores mature, profitability typically increases significantly. The performance of new stores may vary depending on various factors such as the store opening date, the time of year of a particular opening, the amount of store opening costs, the amount of store occupancy costs, its level of participation in managed care plans, and the location of the new store, including whether it is located in a new or existing market. For example, we typically incur higher than normal employee costs at the time of a new store opening associated with set-up and other opening costs. The multi-year maturation process of our stores is influenced by customer purchasing behavior in our industry, with consumers getting eye exams every 20 months on average and with a substantial majority of our customers being repeat buyers. Our planned store expansion will place increased demands on our operational, managerial, administrative and other resources. Managing our growth effectively will require us to continue to enhance our store management systems,
49
financial and management controls and information systems. We will also be required to hire, train and retain store management and store personnel, which, together with increased marketing costs, affects our operating margins.
Comparable Store Sales Growth
Comparable store sales growth is a key driver of our business. Various factors affect comparable store sales, including:
• | consumer preferences, buying trends and overall economic trends; |
• | the recurring nature of eye care purchases; |
• | our ability to identify and respond effectively to customer preferences and trends; |
• | our ability to provide an assortment of high quality/low cost product offerings that generate new and repeat visits to our stores; |
• | the customer experience we provide in our stores; |
• | the availability of vision care professionals; |
• | our participation in managed care plans; |
• | our ability to source and receive products accurately and timely; |
• | changes in product pricing, including promotional activities; |
• | the number of items purchased per store visit; and |
• | the number of stores that have been in operation for more than 12 months. |
A new store is included in the comparable store sales calculation beginning the thirteenth full fiscal month following the store’s opening and we consider a store to be mature when it has been opened longer than five years. Closed stores are removed from the calculation for time periods that are not comparable. In the past, we have closed our stores as a result of poor store performance, lease expiration or non-renewal and/or the terms of our arrangements with our host and legacy partners.
Managed Care and Insurance
Our managed care business relates to vision care programs and associated benefits (i) sponsored by employers or other groups, (ii) provided by insurers and managed care entities, such as health maintenance organizations to individuals, and (iii) delivered, typically on a fee-for-service or capitated basis, by health care providers, such as ophthalmologists, optometrists and opticians. Managed care has become increasingly important to the optical retail industry.
An increasing percentage of our customers receive vision insurance coverage through managed care payors. These payors represent an increasingly significant portion of our overall revenues and our revenue growth. While we have relationships with almost all vision care insurers in the United States and with all of the major carriers, currently, a relatively small number of payors comprise the majority of our managed care revenues, subjecting us to concentration risk. Our future operational success could depend on our ability to negotiate contracts with managed vision care companies, vision insurance providers and other third-party payors, several of whom have significant market share.
Vision Care Professional Recruitment and Coverage
Our ability to operate our stores is largely dependent upon our ability to attract and retain qualified vision care professionals, and to maintain our relationships with independent optometrists and professional corporations owned by eye care practitioners that provide vision care services in our stores.
Overall Economic Trends
Macroeconomic factors that may affect customer spending patterns, and thereby our results of operations, include employment rates, business conditions, changes in the housing market, the availability of credit, interest rates, tax rates and fuel and energy costs. However, eye care purchases are predominantly a medical necessity and are considered non-discretionary in nature. Therefore, the overall economic environment and related changes in consumer behavior have less of an impact on our business than for retailers in other industries. We also benefit from our low prices during periods of economic downturn and uncertainty.
Consumer Preferences and Demand
Our ability to maintain our appeal to existing customers and attract new customers depends on our ability to originate, develop and offer a compelling product assortment responsive to customer preferences and design trends. We estimate that optical consumers typically replace their eyeglasses every two to three years, while contact lens customers typically order new lenses every six to twelve months, reflecting the predictability of these recurring purchase behaviors.
50
Infrastructure Investment
Our historical results of operations reflect the impact of our ongoing investments in infrastructure to support our growth. We have made significant investments in information technology systems, supply chain systems and marketing. These investments include significant additions to our personnel, including experienced industry executives, and management and merchandising teams to support our long-term growth objectives. We intend to continue making targeted investments in our infrastructure as necessary to support our growth.
Pricing Strategy
We are committed to providing our products to our customers at low prices. We generally employ a simple low price/high value strategy that consistently delivers savings to our customers without the need for extensive promotions.
Our Ability to Source and Distribute Products Effectively
Our revenue and operating income are affected by our ability to purchase our products in sufficient quantities at competitive prices. While we believe our vendors have adequate capacity to meet our current and anticipated demand, our level of revenue could be adversely affected in the event we face constraints in our supply chain, including the inability of our vendors to produce sufficient quantities of merchandise in a manner that is able to match market demand from our customers, leading to lost revenue. We rely on a limited number of vendors to supply the majority of our eyeglass frames, eyeglass lenses and contact lenses, and are thus exposed to concentration of supplier risk. In particular, we have agreed to exclusively purchase almost all of our spectacle lenses from one supplier. During fiscal year 2017, four vendors supplied 56% of frames, two vendors provided 91% of lenses and three vendors supplied 94% of contact lenses.
Inflation
Our financial results can be expected to be directly impacted by substantial increases in product costs due to materials cost increases or general inflation which could lead to greater profitability pressure as costs may not be able to be passed on to consumers. To date, changes in materials prices and general inflation have not materially impacted our business.
Interim Results and Seasonality
Historically, our business has realized a higher portion of net revenue, operating income, and cash flows from operations in the first fiscal quarter, and a lower portion of net revenue, operating income, and cash flows from operations in the fourth fiscal quarter. The seasonally larger first quarter is attributable primarily to the timing of our customers’ income tax refunds and annual health insurance program start/reset periods. Because our target market consists of cost-conscious and low-income consumers, a delay in the issuance of tax refunds can have a negative impact on our financial results. Consumers could also alter how they utilize tax refund proceeds. With respect to our fourth quarter results, compared to other retailers, our products and services are less likely to be included in consumer’s holiday spending budgets, therefore reducing spending on personal vision correction during the weeks preceding December 25 of each year. Additionally, although the period between December 25 and the end of our fiscal year is typically a high-volume period, the net revenue associated with substantially all orders of prescription eyeglasses during that period is deferred until January due to our policy of recognizing revenue only after the product has been accepted by the customer, further contributing to higher first quarter results. For fiscal years 2017 and 2016, approximately 23% of our revenues were recorded in the fourth quarter. However, approximately 25% of annual SG&A costs were recorded in the fourth quarter for each of fiscal years 2017 and 2016, due to certain SG&A costs being more fixed in nature. In addition to reduced revenues in the fourth quarter compared to the other quarters, our fourth quarter operating income may include annual impairment charges, and to a lesser extent, higher depreciation of property and equipment due to timing of placing property and equipment in service, which further reduces operating income relative to other quarters. Our quarterly results may also be affected by the timing of new store openings and store closings, the amount of sales contributed by new and existing stores, as well as the timing of certain holidays. As a result of these factors, our working capital requirements and demands on our product distribution and delivery network may fluctuate during the year.
Competition
The U.S. optical retail industry is highly competitive. Competition is generally based upon brand name recognition, price, convenience, selection, service and product quality. We operate within the value segment of the U.S. optical retail industry, which emphasizes price and value. This segment is fragmented. We compete with mass merchants, specialty retail chains and independent eye practitioners and opticians. In the broader optical retail industry, we also compete with large national retailers such as, in alphabetical order, LensCrafters, Pearle Vision and Visionworks. This competition takes place both in physical retail locations and online.
51
Consolidation in the Industry
Recently announced mergers of large, global competitors will create organizations that are involved in virtually every sector of the optical industry, from retail and wholesale to frames, spectacle lenses, and managed vision care. These companies will benefit from purchasing advantages and by leveraging management capabilities across a larger revenue base. Recent trends indicate that national and regional optical retail chains are gaining market share from independent vision care providers, benefiting from economies of scale unavailable to smaller competitors. Other trends include the formation of buying groups and similar forms of practice affiliations.
How We Assess the Performance of Our Business
We consider a variety of financial and operating measures in assessing the performance of our business. The key measures we use to determine how our business is performing are net revenue, costs applicable to revenue, and selling, general, and administrative expenses. In addition, we also review other important metrics such as store growth, adjusted comparable store sales growth, Adjusted EBITDA and Adjusted Net Income.
Net Revenue
We report as net revenue amounts generated in transactions with customers who are the end users of our products, services, and plans. Net product sales include sales of prescription and non-prescription eyewear, contact lenses, and related accessories to retail customers and sales of inventory in which our customer is another retail entity. Net sales of services and plans include sales of eye exams, eye care club memberships, product protection plans (i.e. warranties), and HMO memberships. Net sales of services and plans also includes fees we earn for managing certain Vision Centers located in Walmart stores, for laboratory services to Walmart, and fulfillment fees earned by AC Lens.
Costs Applicable to Revenue
Costs applicable to revenue include both costs of net product sales and costs of net sales of services and plans. Costs of net product sales include (i) costs to procure non-prescription eyewear, contact lenses, and accessories, which we purchase and sell in finished form, (ii) costs to manufacture finished prescription eyeglasses, including direct materials, labor, and overhead, and (iii) remake costs, warehousing and distribution expenses, and internal transfer costs. Costs of services and plans include costs associated with warranty programs, eye care club memberships, HMO membership fees, eye care practitioner and eye exam technician payroll, taxes and benefits and optometric and other service costs. Customer tastes and preferences, product mix, changes in technology, significant increases or slowdowns in production, and other factors impact costs applicable to revenue. The components of our costs applicable to revenue may not be comparable to other retailers.
Selling, General, and Administrative Expenses
Selling, general, and administrative expenses, or SG&A, include store associate (including optician) payroll, taxes and benefits, store occupancy, advertising and promotion, field supervision, corporate support and other costs associated with the provision of vision care services. Non-capital expenditures associated with opening new stores, including rent, store remodels, marketing expenses, travel and relocation costs, and training costs, are recorded in SG&A as incurred. SG&A generally fluctuates consistently with revenue due to the variable store, field office and corporate support costs; however, some fixed costs slightly improve as a percentage of net revenue as our net revenues grow over time. We expect slight decreases in SG&A as a percentage of net revenue given our ongoing focus on cost containment.
New Store Openings
The total number of new stores per year and the timing of store openings has, and will continue to have, an impact on our results as described above in “—Trends and Other Factors Affecting Our Business.”
52
Adjusted Comparable Store Sales Growth
We measure adjusted comparable store sales growth as the increase or decrease in sales recorded by the comparable store base in any reporting period, compared to sales recorded by the comparable store base in the prior reporting period, which we calculate as follows: (i) sales are recorded on a cash basis (i.e. when the order is placed and paid for, compared to when the order is delivered), utilizing cash basis point of sale information from stores; (ii) stores are added to the calculation in their 13th full fiscal month following the store’s opening; (iii) closed stores are removed from the calculation for time periods that are not comparable; (iv) sales from partial months of operation are ignored when stores do not open or close on the first day of the month; and (v) when applicable, we adjust for the effect of the 53rd week. Quarterly, year-to-date and annual adjusted comparable store sales are aggregated using only sales from all whole months of operation included in both the current reporting period and the prior reporting period. When a partial month is excluded from the calculation, the corresponding month in the subsequent period is also excluded from the calculation. There may be variations in the way in which some of our competitors and other retailers calculate comparable store sales. As a result, our adjusted comparable store sales may not be comparable to similar data made available by other retailers.
Adjusted comparable store sales growth is a non-GAAP financial measure, which we believe is useful because it provides timely and accurate information relating to the two core metrics of retail sales: number of transactions and value of transactions. We use adjusted comparable store sales growth as the basis for key operating decisions, such as allocation of advertising to particular markets and implementation of special marketing programs. Accordingly, we believe that adjusted comparable store sales growth provides timely and accurate information relating to the operational health and overall performance of each brand. We also believe that, for the same reasons, investors find our calculation of adjusted comparable stores sales growth to be meaningful.
Adjusted EBITDA and Adjusted Net Income
We define Adjusted EBITDA as net income, plus interest expense, income tax provision (benefit) and depreciation and amortization, as further adjusted to exclude stock compensation expense, costs associated with debt refinancing, asset impairment, non-cash inventory write-offs, management fees, new store pre-opening expenses, non-cash rent, litigation settlement and other expenses. We define Adjusted Net Income as net income, plus stock compensation expense, costs associated with debt refinancing, asset impairment, non-cash inventory write-offs, management fees, new store pre-opening expenses, non-cash rent, litigation settlement, amortization of acquisition intangibles and deferred financing costs and other expenses, tax legislation adjustment, less the tax effect of these adjustments. Adjusted EBITDA and Adjusted Net Income are key metrics used by management to assess our financial performance. Adjusted EBITDA and Adjusted Net Income are also frequently used by analysts, investors and other interested parties. We use Adjusted EBITDA and Adjusted Net Income to supplement GAAP measures of performance to evaluate the effectiveness of our business strategies, to make budgeting decisions, to establish discretionary annual incentive compensation and to compare our performance against that of other peer companies using similar measures. See “—Non-GAAP Financial Measures” for additional information.
53
Results of Operations
The following table summarizes key components of our results of operations for the periods indicated, both in dollars and as a percentage of our net revenue.
In thousands, except percentage and store data | Fiscal Year 2017 | Fiscal Year 2016 | Fiscal Year 2015 | ||||||||
Revenue: | |||||||||||
Net product sales | $ | 1,129,313 | $ | 980,953 | $ | 870,463 | |||||
Net sales of services and plans | 245,995 | 215,242 | 192,065 | ||||||||
Total net revenue | 1,375,308 | 1,196,195 | 1,062,528 | ||||||||
Costs applicable to revenue (exclusive of depreciation and amortization): | |||||||||||
Products | 456,078 | 390,369 | 353,894 | ||||||||
Services and plans | 180,888 | 154,412 | 137,206 | ||||||||
Total costs applicable to revenue | 636,966 | 544,781 | 491,100 | ||||||||
Operating expenses: | |||||||||||
Selling, general and administrative expenses | 597,924 | 524,238 | 474,053 | ||||||||
Depreciation and amortization | 61,115 | 51,993 | 44,069 | ||||||||
Asset impairment | 4,117 | 7,132 | 7,716 | ||||||||
Litigation settlement | 7,000 | — | — | ||||||||
Other expense, net | 950 | 1,667 | 913 | ||||||||
Total operating expenses | 671,106 | 585,030 | 526,751 | ||||||||
Income from operations | 67,236 | 66,384 | 44,677 | ||||||||
Interest expense, net | 55,536 | 39,092 | 36,741 | ||||||||
Debt issuance costs | 4,527 | — | 2,551 | ||||||||
Earnings before income taxes | 7,173 | 27,292 | 5,385 | ||||||||
Income tax (benefit) provision | (38,647 | ) | 12,534 | 1,768 | |||||||
Net income | $ | 45,820 | $ | 14,758 | $ | 3,617 | |||||
Operating data: | |||||||||||
Number of stores open at end of period | 1,013 | 943 | 858 | ||||||||
New stores opened | 76 | 86 | 70 | ||||||||
Adjusted EBITDA | $ | 159,721 | $ | 137,774 | $ | 112,585 | |||||
Total costs applicable to revenue | 46.3 | % | 45.5 | % | 46.2 | % | |||||
Selling, general, and administrative expenses | 43.5 | % | 43.8 | % | 44.6 | % | |||||
Total operating expenses | 48.8 | % | 48.9 | % | 49.6 | % | |||||
Income from operations | 4.9 | % | 5.5 | % | 4.2 | % | |||||
Net income | 3.3 | % | 1.2 | % | 0.3 | % | |||||
Adjusted EBITDA | 11.6 | % | 11.5 | % | 10.6 | % | |||||
54
Fiscal Year 2017 compared to Fiscal Year 2016
Net revenue
The following presents, by segment and by brand, comparable store sales growth, stores open at the end of the period and net revenue for fiscal year 2017 compared to fiscal year 2016.
Comparable store sales growth(1) | Stores open at end of period | Net revenue(2) | ||||||||||||||||||||||
In thousands, except percentage and store data | Fiscal Year 2017 | Fiscal Year 2016 | Fiscal Year 2017 | Fiscal Year 2016 | Fiscal Year 2017 | Fiscal Year 2016 | ||||||||||||||||||
Owned & host segment | ||||||||||||||||||||||||
America’s Best | 10.1 | % | 9.5 | % | 594 | 529 | $ | 848,294 | 62 | % | $ | 714,431 | 60 | % | ||||||||||
Eyeglass World | 6.5 | % | 4.5 | % | 107 | 102 | 150,287 | 11 | % | 133,979 | 11 | % | ||||||||||||
Military | (6.4 | )% | 1.6 | % | 56 | 56 | 25,340 | 2 | % | 26,444 | 2 | % | ||||||||||||
Fred Meyer | 0.6 | % | (1.7 | )% | 29 | 29 | 14,646 | 1 | % | 14,554 | 1 | % | ||||||||||||
Owned & host segment total | 786 | 716 | $ | 1,038,567 | 76 | % | $ | 889,408 | 74 | % | ||||||||||||||
Legacy segment | 1.0 | % | (2.2 | )% | 227 | 227 | 153,842 | 11 | % | 152,210 | 13 | % | ||||||||||||
Corporate/Other | — | — | — | — | 191,890 | 14 | % | 168,616 | 14 | % | ||||||||||||||
Reconciliations | — | — | — | — | (8,991 | ) | (1 | )% | (14,039 | ) | (1 | )% | ||||||||||||
Total | 8.4 | % | 6.9 | % | 1,013 | 943 | $ | 1,375,308 | 100 | % | $ | 1,196,195 | 100 | % | ||||||||||
Adjusted comparable store sales growth(3) | 7.5 | % | 6.1 | % | ||||||||||||||||||||
_________
(1) | We calculate total comparable store sales based on consolidated net revenue excluding the impact of (i) Corporate/Other segment net revenue, (ii) sales from stores opened less than 12 months, (iii) stores closed in the periods presented, (iv) sales from partial months of operation when stores do not open or close on the first day of the month and (v) if applicable, the impact of a 53rd week in a fiscal year. Brand-level comparable store sales growth is calculated based on cash basis revenues consistent with what the CODM reviews, and consistent with reportable segment revenues presented in Note 14. "Segment Reporting" in our consolidated financial statements included in Part II. Item 8. of this Form 10-K, with the exception of the legacy segment, which is adjusted as noted in clause (ii) of footnote (3) below. |
(2) | Percentages reflect line item as a percentage of net revenue. |
(3) | There are two differences between total comparable store sales growth based on consolidated net revenue and adjusted comparable store sales growth: (i) adjusted comparable store sales growth includes the effect of deferred and unearned revenue as if such revenues were earned at the point of sale, resulting in a decrease of 0.7% and 0.4% from total comparable store sales growth based on consolidated net revenue for fiscal year 2017 and fiscal year 2016, respectively, and (ii) adjusted comparable store sales growth includes retail sales to the legacy partner’s customers (rather than the revenues recognized consistent with the management & services agreement), resulting in a decrease of 0.2% and 0.4% from total comparable store sales growth based on consolidated net revenue for fiscal year 2017 and fiscal year 2016, respectively. |
Total net revenue of $1,375.3 million for fiscal year 2017 increased $179.1 million, or 15.0%, from $1,196.2 million for fiscal year 2016. This increase was driven approximately 45% by comparable store sales growth, approximately 40% by new stores and approximately 15% by order volume in our AC Lens business within the Corporate/Other segment.
During fiscal year 2017, we opened 76 new stores, including 68 new America’s Best stores, seven new Eyeglass World stores and one new Vista Optical location on a military base. Additionally, we closed three America’s Best stores, two Eyeglass World stores and one Vista Optical location on a military base. Overall, store count grew 7.4% from the end of fiscal year 2016 to the end of fiscal year 2017. Comparable store sales growth was 8.4% for fiscal year 2017. Adjusted comparable store sales growth was 7.5% for fiscal year 2017. Comparable store sales growth and adjusted comparable store sales growth were driven by increases in customer transactions. We believe the increase in net revenue and customer transaction volume was due to execution of our key strategies, including new store maturation, advertising and expansion of our participation in managed care programs.
Net product sales increased $148.4 million, or 15.1%, in fiscal year 2017 compared to fiscal year 2016, driven primarily by strong eyeglass sales. To a lesser extent, contact lens sales and unit growth in our wholesale order fulfillment business also contributed to the increase. Net sales of services and plans increased $30.8 million, or 14.3%, driven primarily by strong eye exam sales in our owned & host segment. The eye exam increase was driven primarily by our store growth and expanding participation in managed care programs.
55
We believe that our first quarter fiscal year 2017 results were negatively impacted by the Earned Income Tax Credit processing rules implemented by the federal government in 2017 which caused a two- to three-week delay in the issuance of many federal tax refunds in the first quarter. A weaker than expected first quarter was offset by strong performance in our comparable store sales growth and overall customer transactions in the balance of fiscal year 2017. Additionally, we believe the negative impact of temporary store closings due to Hurricanes Harvey and Irma in the third quarter were generally offset by a stronger fourth quarter, and we believe that the hurricanes had an immaterial impact on fiscal year 2017 results.
As a result of changes in applicable California law, certain optometrists employed by FirstSight were transferred to a professional corporation that contracts directly with our legacy segment in the third quarter of fiscal year 2017. This change led to an increase in legacy segment eye exam revenue and optometrist payroll costs of $2.7 million and $2.2 million, respectively, in fiscal year 2017. A corresponding decrease was recorded in our FirstSight subsidiary within the corporate/other segment. Therefore, the change had no impact on consolidated operating income. As of December 30, 2017, approximately half of the applicable optometrists have been transferred and we expect the remaining half to be transferred in the fourth quarter of fiscal year 2018.
In addition, in connection with these changes in California law, effective October 1, 2017, FirstSight ceased the sale of vision managed care products in Walmart locations in California that are not operated by the Company. As a result, FirstSight net revenue and associated costs in the fourth quarter of fiscal year 2017 were both approximately $1.5 million lower than the fourth quarter of fiscal year 2016, and there was an immaterial impact on net income. In fiscal year 2018, we expect this change to negatively impact both FirstSight net revenue and associated costs by approximately $1.8 million to $2.0 million in each of the first three quarters, with an immaterial impact on net income.
Owned & host segment net revenue. Net revenue for our owned & host segment increased $149.2 million, or 16.8%, due to comparable store sales growth and new store openings. The growth was predominately driven by performance in America’s Best and Eyeglass World, partially offset by a decrease in net revenue in Vista Optical locations on military bases as a result of lower customer transaction volume.
Legacy segment net revenue. Net revenue for our legacy segment grew $1.6 million, or 1.1%, primarily driven by $2.7 million in incremental eye exam sales, partially offset by lower customer transaction volume. The increased eye exam sales were the result of changes to our FirstSight operations required by changes in applicable California law discussed above. The FirstSight operations changes resulted in a favorable impact of approximately 145 basis points in comparable store sales growth in the legacy segment.
Corporate/Other segment net revenue. Net revenue in the corporate/other segment increased $23.3 million, or 13.8%, driven by unit growth in our wholesale order fulfillment business, partially offset by a $4.2 million reduction in sales as a result of the combined FirstSight operations changes discussed above.
Net revenue reconciliations. Reconciliations include increases in deferred revenue of $6.8 million and $9.6 million, and increases in unearned revenue of $2.2 million and $4.5 million for fiscal year 2017 and fiscal year 2016, respectively. The purchase accounting adjustment related to the KKR Acquisition contributed to the increases in deferred revenue by $0.2 million and $3.0 million for fiscal year 2017 and fiscal year 2016, respectively, resulting in larger increases in deferred revenue compared to corresponding periods. Absent the impact of the KKR Acquisition, deferred revenue is comparable to the prior year due to slower growth in our warranty program sales and Eyecare Club membership sales than other product categories. The increases in unearned revenue were the result of overall increases in cash basis sales of prescription eyewear in our stores in the last week of each fiscal year. In fiscal year 2017, the Christmas holiday was on a Monday. In fiscal year 2016, the Christmas holiday was on a Sunday, when many of our stores are typically closed. As a result, we had one less selling day in the last week of fiscal year 2017 compared to the last week of fiscal year 2016, which drove the lower unearned revenue increase year-over-year.
Costs applicable to revenue
Costs applicable to revenue of $637.0 million for fiscal year 2017 increased $92.2 million, or 16.9%, from $544.8 million for fiscal year 2016. As a percentage of net revenue, costs applicable to revenue increased from 45.5% for fiscal year 2016 to 46.3% for fiscal year 2017. The increase was primarily driven by higher wholesale fulfillment mix (our wholesale order fulfillment units have a higher cost as a percentage of sales than other product categories), higher optometrist costs and a $2.3 million inventory write-off in the first half of fiscal year 2017 related to slow-moving contact lens inventory which had expired or would expire prior to possible sale. Optometrist costs increased as a result of increased store coverage primarily in our new California market and overall wage pressure.
56
Costs of products as a percentage of net product sales increased from 39.8% for fiscal year 2016 to 40.4% for fiscal year 2017, driven primarily by wholesale fulfillment mix as described above. To a lesser extent, a $2.3 million inventory write-off as discussed above, partially offset by a lower mix of contact lens sales, also contributed to the variance. Our contact lens units have a higher cost as a percentage of sales than other product categories.
Owned & host segment costs of products. In the owned & host segment, costs of products as a percentage of net product sales increased from 29.0% for fiscal year 2016 to 29.3% for fiscal year 2017. The increase was primarily driven by modest increases in contact lens costs.
Legacy segment costs of products. In the legacy segment, costs of products as a percentage of net product sales increased from 46.4% for fiscal year 2016 to 46.5% for fiscal year 2017, impacted by higher other costs of sales, substantially offset by favorable eyeglass costs.
Costs of services and plans as a percentage of net sales of services and plans increased from 71.7% for fiscal year 2016 to 73.5% for fiscal year 2017. The increase was primarily driven by a lower mix of management fees from our legacy segment and higher optometrist costs as discussed above, partially offset by a higher mix of eye exam sales as a result of our growing managed care business. The lower mix of management fees from our legacy segment was driven by a decline in customer transaction volume in the legacy segment described in “—Net revenue” above.
Owned & host segment costs of services and plans. Costs of services and plans as a percentage of net sales of services and plans in the owned & host segment was 80.6% for fiscal year 2016 and for fiscal year 2017. Year-over-year, our growing managed care business increased eye exam sales mix which was offset by a lower mix of Eyecare Club and warranty program sales.
Legacy segment costs of services and plans. In the legacy segment, costs of services and plans as a percentage of net sales of services and plans increased from 23.7% for fiscal year 2016 to 33.3% for fiscal year 2017. The increase was primarily driven by a classification change in reporting for certain eye exam technicians beginning in 2017, a lower mix of management fees and higher optometrist costs, partially offset by a higher mix of eye exam sales. The lower mix of management fees was driven by a decline in customer transaction volume in the legacy segment described in “—Net revenue” above. The higher optometrist costs were primarily as a result of the FirstSight operations changes discussed above. Higher eye exam sales were driven by the FirstSight operations changes described in “—Net revenue” above.
Selling, general, and administrative expenses
SG&A of $597.9 million for fiscal year 2017 increased $73.7 million, or 14.1%, from fiscal year 2016. As a percentage of net revenue, SG&A decreased from 43.8% for fiscal year 2016 to 43.5% for fiscal year 2017. The decrease as a percentage of net revenue was primarily driven by reduced occupancy expense, certain e-commerce partner fees, advertising and corporate overhead as a percentage of net revenue, partially offset by the monitoring agreement termination fee paid to the Sponsors in connection with the completion of our IPO in the fourth quarter of fiscal year 2017 and write-offs of certain managed care receivables. In fiscal year 2017, we began signing an increased number of leases with longer terms which were designated as capital leases (as opposed to operating leases) and, as a result, our occupancy expense as a percentage of net revenue decreased compared to the comparable prior year period. In our e-commerce business, we remit earnings back to certain partners and retain a fulfillment fee. The year-over-year decline of e-commerce partner fees was driven by certain partner pricing strategy changes, which reduced the partner fees that we remit back. The decrease in advertising expense as a percentage of net revenue was driven by increased advertising spend leverage as a result of the transition to national advertising for America’s Best in fiscal year 2017. The decrease in corporate overhead was primarily driven by a slower growth rate of corporate payroll and lower performance-based incentive compensation expense compared to net revenue. Write-offs of managed care receivables increased because we experienced information technology challenges associated with a change in claims processing systems by one of our payors and also expanded our participation in managed care programs.
Owned & host segment SG&A. In the owned & host segment, SG&A as a percentage of net revenue was 38.7% for fiscal year 2017 and fiscal year 2016. Year-over-year, decreases in occupancy expense as described above and advertising as a percentage of net revenue were offset by increases in store payroll and write-offs of certain managed care receivables as described above. The decrease in advertising expense as a percentage of net revenue was driven by increased advertising spend leverage. The increase in store payroll as a percentage of net revenue was driven by lower than anticipated store transactions in the first quarter of fiscal year 2017. Our stores were fully staffed in anticipation of our seasonally strong first quarter. When sales fell short of plan, we maintained store staffing in anticipation of customer transaction recovery. Additionally, in the third quarter, we continued to pay our store associates while our stores were closed due to Hurricanes Harvey and Irma.
57
Legacy segment SG&A. In the legacy segment, SG&A as a percentage of net revenue decreased from 34.8% for fiscal year 2016 to 34.3% for fiscal year 2017, driven primarily by decreases in store payroll reflecting the impact of a classification change in reporting for certain eye exam technicians beginning in 2017 partially offset by higher write-offs associated with increased managed care activity as described above.
Depreciation and amortization
Depreciation and amortization expense of $61.1 million for fiscal year 2017 increased $9.1 million, or 17.5%, from $52.0 million for fiscal year 2016 primarily driven by new store openings and other ongoing growth capital investment in our information technology infrastructure, eyeglass laboratories, and distribution centers. Our property and equipment balance, net increased $47.7 million, or 18.6%, during fiscal year 2017, reflective of $94.0 million in purchases of property and equipment, $8.5 million in new capital leases, less $52.7 million in depreciation expense and $2.1 million in impairment and other adjustments. New assets are out-pacing retirements by a significant margin and, therefore, we expect continued increases in depreciation expense for the foreseeable future as we continue to execute our growth strategy.
Interest expense, net
Interest expense, net, of $55.5 million for fiscal year 2017 increased $16.4 million, or 42.1%, from $39.1 million for fiscal year 2016. On February 2, 2017, we declared a recapitalization dividend to our stockholders. The dividend was funded with $175.0 million of incremental term loans under our first lien credit agreement. The borrowing rate was consistent with the initial term loans under the first lien credit agreement.
Interest expense, net, increased $3.2 million due to additional deferred debt cost amortization as a result of the $125.0 million pay off of our second lien term credit agreement. Additionally, we incurred $8.7 million in additional interest expense during fiscal year 2017 related to interest payments due to counterparties associated with our derivative cash flow hedges. The remaining increase of interest expense, net, primarily results from the additional principal outstanding under the first lien credit agreement following the recapitalization dividend.
Debt issuance costs
We incurred debt issuance costs of $4.5 million for fiscal year 2017. We recorded $2.7 million in fees associated with the incurrence of additional term loans under the first lien credit agreement discussed above during fiscal year 2017. Additionally, $1.8 million was recorded in conjunction with fees relating to the entry into a joinder and amendment agreement as discussed in Note 4. “Long-term Debt” included in Part II. Item 8. of this Form 10-K. No such transaction occurred in fiscal year 2016.
Income tax provision
Our effective income tax rate (“ETR”) was (538.8%) during fiscal year 2017 compared to 45.9% during fiscal year 2016. During fiscal year 2017, our combined statutory federal and state rate was reduced by a $1.4 million income tax benefit (18.4%) resulting from the recapitalization dividend described in Note 8. “Related Party Transactions” to our consolidated financial statements included in Part II. Item 8. of this Form 10-K. Additionally, our rate was increased by $2.2 million of tax expense (29.0%) in connection with items not deductible for income tax purposes.
As a result of the Tax Cuts and Jobs Act (“Tax Legislation”) signed into law on December 22, 2017, the Company recorded a tax benefit in fiscal year 2017 of $43.0 million due to a re-measurement of deferred tax assets and liabilities. The tax benefit represents a provisional amount and is the Company’s current best estimate. Any adjustments recorded to the provisional amounts during fiscal year 2018 will be included in income from operations as an adjustment to tax expense. The provisional amounts incorporate assumptions made based upon the Company’s current interpretation of the Tax Legislation and may change as the Company receives additional clarification and implementation guidance.
58
Fiscal Year 2016 compared to Fiscal Year 2015
Net revenue
The following presents, by segment and by brand, comparable store sales growth, stores open at the end of the period and net revenue for fiscal year 2016 compared to fiscal year 2015.
Comparable store sales growth(1) | Stores open at end of period | Net revenue(2) | ||||||||||||||||||||||
In thousands, except percentage and store data | Fiscal Year 2016 | Fiscal Year 2015 | Fiscal Year 2016 | Fiscal Year 2015 | Fiscal Year 2016 | Fiscal Year 2015 | ||||||||||||||||||
Owned & host segment | ||||||||||||||||||||||||
America’s Best | 9.5 | % | 11.4 | % | 529 | 461 | $ | 714,431 | 60 | % | $ | 601,241 | 57 | % | ||||||||||
Eyeglass World | 4.5 | % | 9.1 | % | 102 | 93 | 133,979 | 11 | % | 117,919 | 11 | % | ||||||||||||
Military | 1.6 | % | 0.7 | % | 56 | 48 | 26,444 | 2 | % | 25,288 | 2 | % | ||||||||||||
Fred Meyer | (1.7 | )% | 2.4 | % | 29 | 29 | 14,554 | 1 | % | 14,877 | 1 | % | ||||||||||||
Owned & host segment total | 716 | 631 | $ | 889,408 | 74 | % | $ | 759,325 | 71 | % | ||||||||||||||
Legacy segment | (2.2 | )% | 4.1 | % | 227 | 227 | 152,210 | 13 | % | 155,013 | 15 | % | ||||||||||||
Corporate/Other | — | — | — | — | 168,616 | 14 | % | 164,262 | 15 | % | ||||||||||||||
Reconciliations | — | — | — | — | (14,039 | ) | (1 | )% | (16,072 | ) | (1 | )% | ||||||||||||
Total | 6.9 | % | 11.3 | % | 943 | 858 | $ | 1,196,195 | 100 | % | $ | 1,062,528 | 100 | % | ||||||||||
Adjusted comparable store sales growth(3) | 6.1 | % | 8.9 | % | ||||||||||||||||||||
_________
(1) | We calculate total comparable store sales based on consolidated net revenue excluding the impact of (i) Corporate/Other segment net revenue, (ii) sales from stores opened less than 12 months, (iii) stores closed in the periods presented, (iv) sales from partial months of operation when stores do not open or close on the first day of the month and (v) if applicable, the impact of a 53rd week in a fiscal year. Brand-level comparable store sales growth is calculated based on cash basis revenues consistent with what the CODM reviews, and consistent with reportable segment revenues presented in Note 14. "Segment Reporting" in our consolidated financial statements included in Part II. Item 8. of this Form 10-K, with the exception of the legacy segment, which is adjusted as noted in clause (ii) of footnote (3) below. |
(2) | Percentages reflect line item as a percentage of net revenue. |
(3) | There are two differences between total comparable store sales growth based on consolidated net revenue and adjusted comparable store sales growth: (i) adjusted comparable store sales growth includes the effect of deferred and unearned revenue as if such revenues were earned at the point of sale, resulting in a decrease of 0.4% and 2.0% from total comparable store sales growth based on consolidated net revenue for fiscal year 2016 and fiscal year 2015, respectively, and (ii) adjusted comparable store sales growth includes retail sales to the legacy partner’s customers (rather than the revenues recognized consistent with the management & services agreement), resulting in a decrease of 0.4% and 0.4% from total comparable store sales growth based on consolidated net revenue for fiscal year 2016 and fiscal year 2015, respectively. |
Total net revenue of $1,196.2 million for fiscal year 2016 increased $133.7 million, or 12.6%, from $1,062.5 million for fiscal year 2015. This increase was driven approximately 50% by new stores, approximately 45% by comparable store sales growth and approximately 5% by increased AC Lens order volume paired with a decrease in recognized deferred revenue.
During fiscal year 2016, we opened 86 new stores, including 69 new America’s Best stores, nine new Eyeglass World stores and eight new Vista Optical locations on military bases. Overall, store count grew 9.9% (net of one America’s Best store closure in fiscal year 2016) from the end of fiscal year 2015 to the end of fiscal year 2016. Secondarily, adjusted comparable store sales growth of 6.1% contributed to our sales growth. Overall comparable store sales growth is driven primarily by comparable store sales growth in new stores (stores opened between 13 months to five years) compared to mature stores (stores opened longer than five years), as well as other factors impacting retail foot traffic such as advertising and expansion of our participation in managed care programs. Net revenue for our owned & host segment grew $130.1 million, or 17.1%, impacted by new stores and comparable store sales growth as previously described. Within our owned & host segment, net revenue from our Vista Optical locations in Fred Meyer stores declined $0.3 million, or 2.2%, as a result of lower overall customer transaction volume. Net revenue for our legacy segment decreased by $2.8 million, or 1.8%, driven by customer transaction volume. Other net revenue activities increased $4.4 million, or 2.7%, driven by unit growth in our wholesale order fulfillment business, partially offset by contractual rate concessions.
Net product sales increased $110.5 million, or 12.7%, compared to fiscal year 2015, driven primarily by strong eyeglass sales. Net sales of services and plans increased $23.2 million, or 12.1%, driven primarily by strong eye exam and
59
Eyecare Club sales in our owned & host segment. The eye exam increase was driven primarily by our expanding participation in managed care programs. The increase in Eyecare Club sales was driven by increased sales in our America’s Best brand.
Reconciliations includes increases in deferred revenue of $9.6 million (12.3%) and $13.7 million (21.3%), and increases in unearned revenue of $4.5 million (21.5%) and $2.4 million (13.1%) for fiscal year 2016 and fiscal year 2015, respectively. The 2014 purchase accounting adjustment in connection with the KKR Acquisition contributed to the increases in deferred revenue by $3.0 million and $7.4 million for fiscal year 2016 and fiscal year 2015, respectively, resulting in larger increases in deferred revenue compared to corresponding periods. Absent the impact of the KKR Acquisition, increases in deferred revenue for each respective period is consistent with our growth in overall net sales of services and plans. The increases in unearned revenue were the result of overall increases in cash basis sales of prescription eyewear in our stores during the last week of fiscal year 2016 compared to the last week of fiscal year 2015.
Costs applicable to revenue
Costs applicable to revenue of $544.8 million for fiscal year 2016 increased $53.7 million, or 10.9%, from $491.1 million for fiscal year 2015. We analyze the costs applicable to revenue as a percentage of net revenue.
As a percentage of net revenue, costs applicable to revenue improved from 46.2% for fiscal year 2015 to 45.5% for fiscal year 2016. Costs of products as a percentage of net product sales improved from 40.7% for fiscal year 2015 to 39.8% for fiscal year 2016, primarily driven by favorable product mix. During fiscal year 2016 compared to the prior year, we sold a higher mix of eyeglasses, which generate higher product margin, compared to other product categories. Over the past few years, we have invested in new technology in our optical laboratories equipment, improving capacity and efficiency. Additionally, increased sales resulting from new stores and comparable store sales growth drove improved utilization of capacity and scale improvements in our optical laboratories.
In the owned & host segment, costs of products as a percentage of net product sales was 29.0% for both fiscal years 2015 and 2016. In the legacy segment, costs of products as a percentage of net product sales improved from 47.7% for fiscal year 2015 to 46.4% for fiscal year 2016, driven primarily by favorable eyeglass product mix.
Costs of services and plans as a percentage of net sales of services and plans increased from 71.4% for fiscal year 2015 to 71.7% for fiscal year 2016. The increase was primarily driven by higher optometrist costs in our legacy segment and warranty expense, partially offset by favorable HMO claims expense.
From a segment perspective, costs of services and plans as a percentage of net sales of services and plans in the owned & host segment improved from 81.6% for fiscal year 2015 to 80.6% for fiscal year 2016, driven primarily by favorable optometrist wages, partially offset by unfavorable warranty expense and optometrist health care costs. In the legacy segment, costs of services and plans as a percentage of net sales of services and plans increased from 21.2% for fiscal year 2015 to 23.7% for fiscal year 2016 driven primarily by fixed optometrist labor costs with declining revenue.
Selling, general, and administrative expenses
SG&A of $524.2 million for fiscal year 2016 increased $50.2 million, or 10.6%, from fiscal year 2015. As a percentage of net revenue, SG&A improved from 44.6% for fiscal year 2015 to 43.8% for fiscal year 2016 driven primarily by a $3.4 million expense incurred in fiscal year 2015 related to our agreement with the Boys and Girls Clubs of America and associated cash contributions promised over a three-year period. Stock option compensation expense and corporate performance-based incentive compensation also contributed to favorability as a percentage of net revenue. We recorded lower stock option compensation expense in fiscal year 2016 when compared to fiscal year 2015 as a result of declining amortization of grant date fair value due to the use of graded vesting (i.e. accelerated method). We incurred lower performance-based incentive compensation expense in fiscal year 2016 compared to fiscal year 2015. Unfavorable store associate wage pressure in fiscal year 2016 partially offset the favorable variances.
In the owned & host segment, SG&A as a percentage of net revenue was 38.7% for both fiscal years 2015 and 2016. In the legacy segment, SG&A as a percentage of net revenue increased from 34.1% for fiscal year 2015 to 34.8% for fiscal year 2016 driven primarily by fixed store associate labor costs paired with declining revenue.
During fiscal year 2015 and 2014, in order to support the growth in our business, we invested in headcount and related infrastructure at our corporate resource center driving higher SG&A costs as a percentage of net revenue compared to the previous year. This investment relative to net revenue growth subsided in fiscal year 2016.
Depreciation and amortization
Depreciation and amortization expense of $52.0 million for fiscal year 2016 increased $7.9 million, or 18.0%, from $44.1 million for fiscal year 2015. The increase is substantially reflective of depreciation resulting from new store
60
openings, purchases of new information technology infrastructure, optical laboratories equipment and our expanded distribution center. Our property and equipment balance increased $49.2 million on a net basis from 2015 to 2016, reflective of $94.0 million in purchases of property and equipment, less $42.8 million in deprecation expense, less $2.0 million in impairment and other adjustments. New assets are out-pacing retirements by a significant margin and, therefore, we expect continued increases in depreciation expense for the foreseeable future as we continue to execute our growth strategy. See our summary of capital expenditures in the “Liquidity and Capital Resources” section below for further discussion.
Impairment of goodwill and other long-lived assets
Impairment expenses of $7.1 million were recorded for fiscal year 2016 compared to $7.7 million for fiscal year 2015. See “—Critical Accounting Policies and Estimates” below for details regarding specific testing performed on various long-lived assets. The majority of the impairment charges are associated with our AC Lens business, primarily as a result of competitive pressure in the e-commerce contact lens business. We recorded impairment charges of $5.8 million related to AC Lens for fiscal year 2016. Impairment charges of $1.2 million related to our retail store long-lived assets were recorded for fiscal year 2016, resulting from decreased cash flow projections at individual stores.
Interest expense, net
Interest expense, net, of $39.1 million for fiscal year 2016 increased $2.4 million, or 6.4%, from $36.7 million for fiscal year 2015. On June 1, 2015, we declared a recapitalization dividend to our stockholders. The dividend was funded with $150.0 million of incremental term loans under our first lien credit agreement. The borrowing rate was consistent with the initial term loans under the first lien credit agreement. Therefore, the increase in interest expense, net, is primarily the result of the additional principal outstanding under the first lien credit agreement for the entire fiscal year 2016, compared to fiscal year 2015, where the additional principal was only outstanding from June 1, 2015 to January 2, 2016.
Debt issuance costs
We recorded $2.6 million in fees associated with the incurrence of additional term loans under the first lien credit agreement discussed above during fiscal year 2015. No such transaction occurred in fiscal year 2016.
Income tax provision
Our effective income tax rate for fiscal year 2016 was 45.9%. The effective income tax rate for fiscal year 2015 was 32.8%. During fiscal year 2016 our income tax provision differed from the statutory rate as a result of $1.0 million valuation allowance for deferred income tax assets recorded in association with cumulative losses on our equity method investment, and $1.0 million income tax impact of non-deductible permanent items in the normal course of business, offset by $0.5 million in federal employment credits. During fiscal year 2015, our income tax provision differed from the statutory rate primarily as a result of decreases in deferred tax asset valuation allowances and Federal employment credits, providing income tax benefits of $0.5 million and $0.2 million, respectively, offset by the impact to the provision of $0.3 million related to non-deductible items.
Non-GAAP Financial Measures
EBITDA, Adjusted EBITDA and Adjusted Net Income
We define EBITDA as net income, plus interest expense, income tax provision (benefit) and depreciation and amortization. We define Adjusted EBITDA as EBITDA, further adjusted to exclude stock compensation expense, costs associated with debt refinancing, asset impairment, non-cash inventory write-offs, management fees, new store pre-opening expenses, non-cash rent, litigation settlement and other expenses. We describe these adjustments reconciling net income to EBITDA and Adjusted EBITDA in the tables below. We define Adjusted Net Income as net income, plus stock compensation expense, costs associated with debt refinancing, asset impairment, non-cash inventory write-offs, management fees, new store pre-opening expenses, non-cash rent, litigation settlement, amortization of acquisition intangibles and deferred financing costs and other expenses, tax legislation adjustment, less the tax effect of these adjustments. We describe these adjustments reconciling net income to Adjusted Net Income in the tables below.
61
EBITDA, Adjusted EBITDA and Adjusted Net Income have been presented as supplemental measures of financial performance that are not required by, or presented in accordance with GAAP, because we believe they assist investors and analysts in comparing our operating performance across reporting periods on a consistent basis by excluding items that we do not believe are indicative of our core operating performance. Management believes EBITDA, Adjusted EBITDA and Adjusted Net Income are useful to investors in highlighting trends in our operating performance, while other measures can differ significantly depending on long-term strategic decisions regarding capital structure, the tax jurisdictions in which we operate and capital investments. We also use EBITDA, Adjusted EBITDA and Adjusted Net Income to supplement GAAP measures of performance in the evaluation of the effectiveness of our business strategies, to make budgeting decisions, to establish discretionary annual incentive compensation and to compare our performance against that of other peer companies using similar measures. Management supplements GAAP results with non-GAAP financial measures to provide a more complete understanding of the factors and trends affecting the business than GAAP results alone.
EBITDA, Adjusted EBITDA and Adjusted Net Income are not recognized terms under GAAP and should not be considered as an alternative to net income or income from operations as a measure of financial performance or cash flows provided by operating activities as a measure of liquidity, or any other performance measure derived in accordance with GAAP. Additionally, these measures are not intended to be a measure of free cash flow available for management’s discretionary use as they do not consider certain cash requirements such as interest payments, tax payments and debt service requirements. Our presentation of EBITDA, Adjusted EBITDA and Adjusted Net Income should not be construed to imply that our future results will be unaffected by unusual or non-recurring items. In evaluating EBITDA, Adjusted EBITDA and Adjusted Net Income, you should be aware that in the future we may incur expenses that are the same as or similar to some of the adjustments in this presentation. Our presentation of EBITDA, Adjusted EBITDA and Adjusted Net Income should not be construed to imply that our future results will be unaffected by any such adjustments. Management compensates for these limitations by primarily relying on our GAAP results in addition to using EBITDA, Adjusted EBITDA and Adjusted Net Income supplementally.
The presentations of these measures have limitations as analytical tools and should not be considered in isolation, or as a substitute for analysis of our results as reported under GAAP. Some of these limitations are:
• | they do not reflect costs or cash outlays for capital expenditures or contractual commitments; |
• | they do not reflect changes in, or cash requirements for, our working capital needs; |
• | EBITDA and Adjusted EBITDA do not reflect the interest expense, or the cash requirements necessary to service interest or principal payments, on our debt; |
• | EBITDA and Adjusted EBITDA do not reflect period to period changes in taxes, income tax expense or the cash necessary to pay income taxes; |
• | they do not reflect the impact of earnings or charges resulting from matters we consider not to be indicative of our ongoing operations, including costs related to new store openings, which are incurred on a non-recurring basis with respect to any particular store when opened; |
• | although depreciation and amortization are non-cash charges, the assets being depreciated and amortized will often have to be replaced in the future, and EBITDA and Adjusted EBITDA do not reflect cash requirements for such replacements; and |
• | other companies in our industry may calculate these measures differently than we do, limiting their usefulness as comparative measures. |
Because of these limitations, EBITDA, Adjusted EBITDA and Adjusted Net Income should not be considered as measures of discretionary cash available to invest in business growth or to reduce indebtedness.
62
The following table reconciles our net income to EBITDA, Adjusted EBITDA and Adjusted Net Income for the periods presented:
In thousands | Fiscal Year 2017 | Fiscal Year 2016 | Fiscal Year 2015 | ||||||||
Net income | $ | 45,820 | $ | 14,758 | $ | 3,617 | |||||
Interest expense | 55,536 | 39,092 | 36,741 | ||||||||
Income tax (benefit) provision | (38,647 | ) | 12,534 | 1,768 | |||||||
Depreciation and amortization | 61,115 | 51,993 | 44,069 | ||||||||
EBITDA | 123,824 | 118,377 | 86,195 | ||||||||
Stock compensation expense (a) | 5,152 | 4,293 | 6,635 | ||||||||
Debt issuance costs (b) | 4,527 | — | 2,551 | ||||||||
Asset impairment (c) | 4,117 | 7,132 | 7,716 | ||||||||
Non-cash inventory write-offs (d) | 2,271 | — | — | ||||||||
Management fees (e) | 5,263 | 1,126 | 1,649 | ||||||||
New store pre-opening expenses (f) | 2,531 | 1,983 | 1,962 | ||||||||
Non-cash rent (g) | 1,112 | 1,343 | 1,233 | ||||||||
Litigation settlement (h) | 7,000 | — | — | ||||||||
Other (i) | 3,924 | 3,520 | 4,644 | ||||||||
Adjusted EBITDA | $ | 159,721 | $ | 137,774 | $ | 112,585 | |||||
Net income | $ | 45,820 | $ | 14,758 | $ | 3,617 | |||||
Stock compensation expense (a) | 5,152 | 4,293 | 6,635 | ||||||||
Debt issuance costs (b) | 4,527 | — | 2,551 | ||||||||
Asset impairment (c) | 4,117 | 7,132 | 7,716 | ||||||||
Non-cash inventory write-offs (d) | 2,271 | — | — | ||||||||
Management fees (e) | 5,263 | 1,126 | 1,649 | ||||||||
New store pre-opening expenses (f) | 2,531 | 1,983 | 1,962 | ||||||||
Non-cash rent (g) | 1,112 | 1,343 | 1,233 | ||||||||
Litigation settlement (h) | 7,000 | — | — | ||||||||
Other (i) | 3,924 | 3,520 | 4,644 | ||||||||
Amortization of acquisition intangibles and deferred financing costs (j) | 14,481 | 11,311 | 11,221 | ||||||||
Tax legislation adjustment (k) | (42,965 | ) | — | — | |||||||
Tax effect of total adjustments (l) | (20,152 | ) | (12,283 | ) | (15,044 | ) | |||||
Adjusted Net Income | $ | 33,081 | $ | 33,183 | $ | 26,184 | |||||
____________
(a) | Non-cash charges related to stock-based compensation programs, which vary from period to period depending on the timing of awards. |
(b) | For fiscal year 2017, includes $2.7 million of fees associated with the borrowing of $175.0 million in additional principal under our first lien credit agreement and $1.8 million of fees associated with the refinancing of our first lien credit agreement. For fiscal year 2015, includes $2.6 million of fees associated with the borrowing of $150.0 million in additional principal under our first lien credit agreement. |
(c) | Reflects write-off of a cost basis investment, and write-off of capitalized software and property and equipment for the fiscal year 2017. Non-cash charges related to impairment of long-lived assets, primarily goodwill in our Fred Meyer brand and our AC Lens business during fiscal years 2016 and 2015. |
(d) | Reflects write-offs of inventory relating to the expiration of a specific type of contact lens that could not be sold and required disposal. |
(e) | Reflects management fees paid to KKR Sponsor and Berkshire in accordance with our monitoring agreement with them. The monitoring agreement was terminated automatically in accordance with its terms upon the consummation of the IPO in October 2017 and we paid termination fees of approximately $3.6 million and $0.8 million to KKR Sponsor and Berkshire, respectively. |
63
(f) | Pre-opening expenses, which include marketing and advertising, labor and occupancy expenses incurred prior to opening a new store, are generally higher than comparable expenses incurred once such store is open and generating revenue. We believe that such higher pre-opening expenses are specific in nature and amount to opening a new store and as such, are not indicative of ongoing core operating performance. We adjust for these costs to facilitate comparisons of store operating performance from period to period. Pre-opening costs are permitted exclusions in our calculation of Adjusted EBITDA pursuant to the terms of our existing credit agreement. |
(g) | Consists of the non-cash portion of rent expense, which reflects the extent to which our straight-line rent expense recognized under GAAP exceeds or is less than our cash rent payments. The adjustment can vary depending on the average age of our lease portfolio, which has been impacted by our significant growth in recent years. For newer leases, our rent expense recognized typically exceeds our cash rent payments, while for more mature leases, rent expense recognized under GAAP is typically less than our cash rent payments. |
(h) | Amounts accrued related to settlement of litigation. See Part I. Item 3. “Legal Proceedings” and Note 12. “Commitments and Contingencies” in our consolidated financial statements included in Part II. Item 8. of this Form 10-K for further details. |
(i) | Other adjustments include amounts that management believes are not representative of our operating performance (amounts in brackets represent reductions in Adjusted EBITDA and Adjusted Net Income) including our share of losses on equity method investments of $1.0 million, $1.4 million, and $0.9 million for the fiscal years 2017, 2016 and 2015, respectively; the amortization impact of the KKR Acquisition-related adjustments (e.g., fair value of leasehold interests) of $(0.3) million, $(0.7) million, and $(1.3) million for the fiscal years 2017, 2016, and 2015, respectively; expenses related to preparation for being an SEC registrant that were not directly attributable to our IPO and therefore not charged to equity of $1.8 million, $2.0 million, and $0.5 million for the fiscal years 2017, 2016 and 2015, respectively; differences between the timing of expense versus cash payments related to contributions to charitable organizations of $(1.0) million, $(1.0) million, and $3.0 million for the fiscal years 2017, 2016 and 2015, respectively; costs of severance and relocation of $1.4 million, $1.1 million, and $0.5 million, for the fiscal years 2017, 2016, and 2015, respectively; non-cash write-down of property and equipment of $0.4 million, $0.2 million, and $0.2 million for the fiscal years 2017, 2016 and 2015, respectively; and other expenses and adjustments totaling $0.6 million, $0.6 million and $0.8 million for the fiscal years 2017, 2016 and 2015, respectively. |
(j) | Amortization of the increase in carrying values of definite-lived intangible assets resulting from the application of purchase accounting to the KKR Acquisition of $7.4 million for each of the fiscal years 2017, 2016 and 2015; and 2) Amortization of debt discounts associated with the March 2014 term loan borrowings in connection with the KKR Acquisition and, to a lesser extent, amortization of debt discounts associated with the May 2015 and February 2017 incremental first lien term loans and the November 2017 first lien term loan refinancing, aggregating to $7.1 million, $3.9 million, and $3.8 million of additional expense for fiscal years 2017, 2016 and 2015, respectively. The $7.1 million additional expense for fiscal year 2017 includes a $3.3 million write-off of debt discounts associated with the repayment of the entire $125.0 million second lien term loan balance. |
(k) | The adjustment represents re-measuring and reassessing the net realizability of our deferred tax assets and liabilities during fiscal year 2017. See Note 6. “Income Taxes” in Part II. Item 8. of this Form 10-K for additional information regarding the Tax Legislation. |
(l) | Represents the income tax effect of the total adjustments at our estimated effective tax rate. |
Liquidity and Capital Resources
We principally rely on cash flows from operations as our primary source of liquidity and, if needed, up to $100.0 million in revolving loans under our revolving credit facility. Our primary cash needs are for inventory, payroll, store rent, capital expenditures associated with new stores and updating existing stores, as well as information technology and infrastructure, including our corporate office, distribution centers, and laboratories. The most significant components of our operating assets and liabilities are inventories, accounts receivable, prepaid expenses and other assets, accounts payable, other payables, and accrued expenses. Due to the seasonality of when we recognize revenue, any borrowings would generally occur in the fourth or first quarters as we prepare for our peak season, which is the first quarter. We believe that cash expected to be generated from operations and the availability of borrowings under the revolving credit facility will be sufficient for our working capital requirements, liquidity obligations, anticipated capital expenditures, and payments due under our existing credit facilities for at least the next 12 months.
As of fiscal year 2017, we had $4.2 million in cash and cash equivalents and $88.8 million of availability under our revolving credit facility, which reflects $11.2 million in outstanding letters of credit.
We spent $93.2 million in capital expenditures during fiscal year 2017, including $41.9 million in connection with new store growth and store improvement plans, $23.3 million for laboratories, distribution centers, and optometric equipment, and $28.1 million for maintenance and infrastructure. Approximately 80% of our capital spend is related to our expected growth (i.e. new stores, optometric equipment, additional capacity in our optical laboratories and distribution centers, and our IT infrastructure). Our working capital requirements for inventory will increase as we continue to open additional stores. We primarily fund our working capital needs using cash provided by operations.
64
The following table summarizes the net cash provided by (used for) operating activities, investing activities and financing activities for the periods indicated:
In thousands | Fiscal Year 2017 | Fiscal Year 2016 | Fiscal Year 2015 | ||||||||
Cash flows provided by (used for): | |||||||||||
Operating activities | $ | 90,252 | $ | 97,588 | $ | 83,131 | |||||
Investing activities | (94,827 | ) | (91,664 | ) | (80,051 | ) | |||||
Financing activities | 3,838 | (6,574 | ) | (4,317 | ) | ||||||
Net decrease in cash and cash equivalents | $ | (737 | ) | $ | (650 | ) | $ | (1,237 | ) | ||
Net Cash Provided by Operating Activities
Net cash provided by operating activities consists primarily of net income adjusted for non-cash items, including depreciation and amortization, asset impairment, deferred income taxes, non-cash stock option compensation, non-cash inventory adjustments, debt issuance costs, and changes in operating assets and liabilities.
Net cash provided by operating activities decreased $7.3 million, or 7.5%, during the fiscal year 2017 compared to fiscal year 2016. Net cash provided by operating activities was $90.3 million for the fiscal year 2017, as non-cash items of $57.0 million and $45.8 million of net income were partially offset by an increase in net working capital and other assets and liabilities of $12.5 million. Net cash provided by operating activities was $97.6 million for fiscal year 2016, which consisted of non-cash items of $85.3 million, $14.8 million of net income and an increase in net working capital and other assets and liabilities of $2.5 million.
The increase in net working capital and other assets and liabilities during the fiscal year 2017 was primarily due to an increase in inventories of $9.6 million, accounts receivable of $16.9 million, other assets of $2.1 million and a decrease in accounts payable of $3.7 million. Increases in accounts receivable primarily reflect our overall net revenue growth, and decreases in accounts payable reflect the timing of payments to vendors. Increases in inventory are generally expected each period, and reflect our growth in sales of products, including product replenishment needs at existing stores and inventory needed to outfit new stores. The increase in other assets is also reflective of overall Company growth. These changes were partially offset by an increase in accrued expenses and other liabilities of $10.7 million and deferred and unearned revenues of $8.9 million. Increases in accrued expenses and other liabilities were primarily due to new store growth. We opened 76 new stores during fiscal year 2017, with six closures. Liabilities for deferred and unearned revenues represent cash basis sales that are deferred until we meet our performance obligations to deliver products and provide services. Increases in deferred and unearned revenues are consistent with increased overall net revenue resulting from new store growth and comparable store sales growth.
The increase in net working capital and other assets and liabilities during fiscal year 2016 was due to an increase in inventories of $13.8 million, accounts receivable of $9.1 million, and prepaid expenses and other assets of $4.1 million, offset by an increase in deferred and unearned revenue of $14.3 million, accounts payable of $5.6 million, and accrued expenses and other liabilities of $4.6 million. Consistent growth in the number of stores and positive comparable store sales has resulted in consistent increases in deferred and unearned revenue. We opened 86 new stores, with one closure during fiscal year 2016, which also drove an increase in accrued expenses and other liabilities as our scale increases with store growth. Increases in accounts receivable and inventories from year to year are also reflective of our growth as new stores are added. Increases in accounts payable primarily reflect timing of payments to vendors.
Net cash provided by operating activities was $83.1 million for fiscal year 2015, as non-cash items of $72.2 million were combined with $3.6 million of net income and a decrease in net working capital and other assets and liabilities of $7.3 million. The decrease in net working capital and other assets and liabilities during fiscal year 2015 was due to an increase in deferred and unearned revenue of $16.2 million and accrued expenses and other liabilities of $13.2 million, offset by an increase in inventories of $10.7 million, accounts receivable of $6.9 million, and prepaid expenses and other assets of $4.6 million. Consistent with 2016 discussed above, increases in assets and liabilities are consistent with overall growth in the number of stores and positive comparable store sales. We opened 70 new stores and closed four stores during fiscal year 2015.
65
Net Cash Used for Investing Activities
Net cash used for investing activities increased by $3.2 million, to $94.8 million, during fiscal year ended 2017 from $91.7 million during fiscal year 2016. The change in cash used for investing activities included an increase of $3.2 million in purchases of property and equipment driven by timing of purchases. During fiscal year 2017, we made an investment of $1.5 million in the form of a secured convertible promissory note. Comparatively, during fiscal year, 2016, we purchased an investment for $1.0 million.
Net cash used for investing activities increased by $11.6 million, to $91.7 million, during fiscal year 2016 from $80.1 million during fiscal year 2015. The change in cash used for investing activities included an increase of $12.9 million in purchases of property and equipment to support our growth, including new stores, improvements to our optical laboratories and distribution centers, and continued development of our IT infrastructure. Partially offsetting the increase in capital expenditures was a decrease of $1.9 million in purchases of investments from fiscal year 2015 to fiscal year 2016.
Net Cash Provided by/ Used for Financing Activities
Net cash provided by financing activities was $3.8 million for fiscal year 2017 and net cash used for financing activities was $6.6 million for fiscal year 2016. Net cash provided by financing activities in 2017 were primarily related to the proceeds received from our IPO of $370.9 million, which were used to repay outstanding long-term debt of $367.7 million and pay associated debt financing costs of $1.8 million during fiscal year 2017. This was partially offset by $1.1 million in proceeds related to the exercise of stock options during fiscal year 2017. In addition to the IPO, we received $1.0 million in proceeds from the issuance of common stock during fiscal year 2017.
On February 2, 2017, we declared a recapitalization dividend to our stockholders. The dividend was funded with $175.0 million of incremental term loans under our first lien credit agreement. Proceeds from the additional first lien term loans were $174.9 million, net of discounts and fees, offset by the dividend payment of $171.0 million and $2.7 million in debt issuance costs. No such transactions occurred during fiscal year 2016.
Net cash used for financing activities increased by $2.3 million, to $6.6 million, during fiscal year 2016 from $4.3 million during fiscal year 2015. The primary driver of the overall cash used for financing activities is quarterly principal payments required under our first lien credit agreement. We paid $6.5 million and $6.1 million in principal payments during fiscal years 2016 and 2015, respectively. Also, on June 1, 2015, we declared a recapitalization dividend to our stockholders. The dividend was funded with $150.0 million of incremental term loans under our first lien credit agreement. Proceeds from the additional first lien term loans were $145.6 million net of discounts and fees, offset by the dividend payment of $145.7 million. The increase in net cash used for financing activities in fiscal year 2016 was primarily the result of a decrease of $1.4 million in net cash provided by transactions in our outstanding equity, including purchases of stock by employees, exercises of stock options by employees, and the related income tax benefit of stock option exercises.
Debt
The Company used proceeds from its IPO to repay $125.0 million in outstanding aggregate amount of our second lien term loans, and accrued and unpaid interest thereon, which terminated the second lien credit agreement. Additional IPO proceeds were used to repay $235.0 million in outstanding aggregate amount of our first lien term loans, and accrued and unpaid interest thereon.
On October 31, 2017 and November 20, 2017 the credit agreement dated as of March 13, 2014, among Nautilus Acquisition Holdings, Inc., a wholly-owned subsidiary of the Company, NVI, as borrower, Goldman Sachs Bank USA, as administrative agent, collateral agent, and letter of credit issuer, and the lenders from time to time party thereto and the other parties thereto (as amended, restated, supplemented or otherwise modified from time to time, the “first lien credit agreement”), was amended pursuant to separate joinder and amendment agreements (collectively, the “Amendments”) to, among other things, (a) establish new first lien term loans in an aggregate principal amount of $570.0 million to refinance all of the first lien term loans outstanding immediately prior to the amendment, (b) extend the maturity of such term loans to November 20, 2024 and (c) reprice the rates applicable to such term loans by amending the definitions of ABR, Applicable Margin and LIBOR Rate (each, as defined in the first lien credit agreement). The first lien credit agreement also provide for a $100.0 million revolving credit facility, which matures on October 15, 2022. A portion of the revolving credit facility is available for letters of credit and swingline loans. As of the end of fiscal year 2017, we had $88.8 million of availability under our revolving credit facility, which reflects $11.2 million in outstanding letters of credit.
66
Pursuant to the Amendments, the initial new Applicable Margins are (i) 2.75% for the new first lien term loans that are LIBOR Loans (as defined in the first lien credit agreement), which is 25 basis points lower than the previous interest rate margin and (ii) 1.75% for the new first lien term loans that are ABR Loans (as defined in the first lien credit agreement), which is 25 basis points lower than the previous interest rate margin. The Amendments further provide that the above Applicable Margins for the new term loans will be based on NVI’s public corporate credit rating from Moody’s as follows: (i) if NVI’s rating is lower than Ba3 (stable), the Applicable Margin will be 2.75% for LIBOR Loans and 1.75% for ABR Loans and (ii) if NVI’s rating is Ba3 (stable) or better, the Applicable Margin will step down to 2.50% for LIBOR Loans and 1.5% for ABR Loans, as specified in the Amendments.
The principal under the first lien credit agreement is payable in equal installments of $1.4 million on the last business day of each of our fiscal quarters. We are required to prepay an amount equal to 50% of the preceding fiscal year’s excess cash flow, as defined in the agreement. The required prepayment is reduced to 25% of the preceding year’s excess cash flow if our consolidated earnings before interest, tax, depreciation and amortization (“Credit Agreement EBITDA”) ratio, as defined in the agreement, is less than or equal to 4.25 to 1.00. No prepayment is required if such ratio is less than or equal to 4.00 to 1.00. We have not been required to make a prepayment related to our first lien credit agreement.
The following table sets forth the amounts owed under our first lien credit agreement and the effective interest rate on such outstanding amount, and the amount available for additional borrowing thereunder, as of the end of fiscal year 2017:
In thousands, except percentage data | Effective Interest Rate | Amount Outstanding | Amount Available for Additional Borrowing | ||||||||
First lien term loans | 4.32 | % | $ | 568,575 | $ | — | |||||
First lien revolving credit facility(1) | 4.32 | % | — | 88,800 | |||||||
Total | $ | 568,575 | $ | 88,800 | |||||||
____________
(1) | At December 30, 2017, the amount available under our revolving credit facility reflected a reduction of $11.2 million of letters of credit outstanding. |
The first lien credit agreement also provides for a $100.0 million revolving credit facility, which matures on October 15, 2022. A portion of the revolving credit facility is available for letters of credit and swingline loans. Amounts borrowed under the revolving credit facility bear interest, at our election, at either 2.0% over ABR or 3.0% over LIBOR. These interest rate spreads will decline to 1.75% and 2.75%, respectively, if our Credit Agreement EBITDA ratio declines to 4.25 to 1.00 or less, and the spreads will further decline to 1.50% and 2.50%, respectively, if such ratio declines to 3.75 to 1.00 or less. We may use up to $20 million of the revolving credit facility to issue letters of credit. Letter of Credit fees accrue at the same rate as the then-applicable LIBOR spread. Our first lien credit agreement also provides that, if aggregate borrowings (inclusive of certain letters of credit) under our revolving credit facility exceed 30% of the total revolving commitment, the ratio of debt under our first lien credit agreement to Credit Agreement EBITDA may not, on the last day of the applicable measurement period, exceed 7.75 to 1.00.
The first lien credit agreement contain covenants that, among other things, limit our ability to incur additional debt, create liens against our assets, make acquisitions, pay dividends or distributions on our stock, merge or consolidate with another entity and transfer or sell assets.
Capital Expenditures
In thousands | Fiscal Year 2017 | Fiscal Year 2016 | Fiscal Year 2015 | ||||||||
New stores (owned brands) | $ | 41,894 | $ | 41,509 | $ | 33,281 | |||||
Laboratories, distribution centers and optometric equipment | 23,269 | 17,996 | 15,264 | ||||||||
Maintenance and infrastructure | 28,056 | 30,521 | 28,612 | ||||||||
Total | $ | 93,219 | $ | 90,026 | $ | 77,157 | |||||
67
Contractual Obligations and Commercial Commitments
As of fiscal year end 2017, our lease commitments and contractual obligations are as follows:
In thousands | 2018 | 2019 | 2020 | 2021 | 2022 | Thereafter | Total | |||||||||||||||||||||
Term loans(a) | $ | 5,700 | $ | 5,700 | $ | 5,700 | $ | 5,700 | $ | 5,700 | $ | 540,075 | $ | 568,575 | ||||||||||||||
Revolving credit facility(b) | — | — | — | — | — | — | — | |||||||||||||||||||||
Estimated interest(c) | 25,917 | 27,622 | 28,553 | 29,503 | 30,453 | 32,068 | 174,116 | |||||||||||||||||||||
Non-cancelable operating leases(d) | 81,939 | 73,745 | 60,843 | 46,574 | 34,782 | 86,151 | 384,034 | |||||||||||||||||||||
Capital leases(e) | 2,760 | 2,297 | 1,993 | 1,876 | 1,791 | 7,461 | 18,178 | |||||||||||||||||||||
Other commitments(f) | 4,300 | 3,300 | — | — | — | — | 7,600 | |||||||||||||||||||||
Total | $ | 120,616 | $ | 112,664 | $ | 97,089 | $ | 83,653 | $ | 72,726 | $ | 665,755 | $ | 1,152,503 | ||||||||||||||
____________
(a) | Principal under the first lien credit agreement is payable in equal installments of $1.4 million on the last business day of each of our fiscal quarters. |
(b) | As of fiscal year 2017, we had no outstanding revolving loan obligation and had $11.2 million in outstanding letters of credit under our first lien revolving credit facility. |
(c) | We have estimated our interest payments on our term loans based on our current interest elections described in “Liquidity and Capital Resources.” Amounts and timing may be different from our estimated interest payments due to potential voluntary prepayments, borrowings and interest rate fluctuations. Expected obligations on our hedging instruments are excluded from estimated interest presented in the table above. |
(d) | We lease our retail stores, optometric examination offices, distribution centers, office space, and all of our optical laboratories with the exception of our St. Cloud, Minnesota lab, which we own. The vast majority of our leases are classified as operating leases under current accounting guidance. Although rent expense on operating leases is recorded in SG&A on a straight-line basis over the term of the lease, contractual obligations above represent required cash payments. |
(e) | For leases classified as capital leases, the capital lease asset is recorded as property and equipment and a corresponding amount is recorded as a long-term debt obligation in the consolidated balance sheets at an amount equal to the lesser of the net present value of minimum lease payments to be made over the lease term or the fair value of the property being leased. We allocate each lease payment between a reduction of the lease obligation and interest expense using the effective interest method. Capital lease amounts above represent required contractual cash payments in the periods presented. |
(f) | Other commitments include contributions made to our philanthropic endeavors and marketing and promotional agreements. |
Off-balance Sheet Arrangements
We follow U.S. GAAP in making the determination as to whether or not to record an asset or liability related to our arrangements with third parties. Consistent with current accounting guidance, we do not record an asset or liability associated with operating leases or with long-term marketing and promotional commitments. We have disclosed the amount of future commitments associated with these items in our consolidated financial statements. We are not a party to any other off-balance sheet arrangements.
Critical Accounting Policies and Estimates
The preparation of financial statements in accordance with U.S. GAAP requires management to make estimates and assumptions about future events that affect amounts reported in our consolidated financial statements and related notes, as well as the related disclosure of contingent assets and liabilities at the date of the financial statements. Management evaluates our accounting policies, estimates and judgments on an ongoing basis. Management bases its estimates and judgments on historical experience and various other factors that are believed to be reasonable under the circumstances. Actual results may differ from these estimates under different assumptions and conditions.
Management has evaluated the accounting policies used in the preparation of the Company’s consolidated financial statements and related notes and believe those policies to be reasonable and appropriate. Certain of these accounting policies require the application of significant judgment by management in selecting appropriate assumptions for calculating financial estimates. By their nature, these judgments are subject to an inherent degree of uncertainty. These judgments are based on historical experience, trends in the industry, information provided by customers and information available from other outside sources, as appropriate. More information on all of our significant accounting policies can be found in Note 1. “Business and Significant Accounting Policies,” to our consolidated financial statements included in Part II. Item 8. of this Form 10-K.
68
Impairment of P&E
We evaluate long-lived tangible store assets at an individual store level, which is the lowest level at which independent cash flows can be identified, when events or conditions indicate the carrying value of such assets may not be recoverable. If the store's projected undiscounted cash flows expected to be generated by the related assets over the remaining useful life are less than the carrying value of the related assets, we measure impairment based on a discounted cash flow model (Level 3 inputs) and record an impairment loss as the difference between carrying value and estimated fair value.
In circumstances where a discounted cash flow analysis is not appropriate for assessing impairment of P&E, we use a liquidation approach, whereby we estimate the fair value of the subject assets based on the expected sales value that a market participant would be willing to pay for the assets in their current location and condition, net of expected cost to remove and transport the assets to the buyer where applicable.
We assess non-store tangible assets, including capitalized software costs in use or under development, for impairment if events or changes in circumstances indicate that the carrying value of those assets may not be recoverable.
Impairment of Goodwill and Intangible Assets
If impairment indicators related to amortizing intangible assets are present, we estimate cash flows expected to be generated over the remaining useful lives of the related assets based on current projections. If the projected undiscounted cash flows are less than the carrying value of the related assets, we then measure impairment based on a discounted cash flow model (Level 3 inputs) and record an impairment charge as the difference between carrying value and estimated fair value.
We evaluate non-amortizing trademarks and tradenames for impairment annually or whenever events or changes in circumstances indicate that those assets may be impaired. We use the relief-from-royalty method to estimate fair value, whereby an estimated royalty rate is determined based on comparable licensing arrangements, which is then applied to the revenue projections for the subject asset. The estimated fair value is calculated using a discounted cash flow analysis (Level 3 inputs). We record an impairment charge as the excess of carrying value over estimated fair value.
Goodwill impairment is present if a reporting unit’s carrying value exceeds its fair value, not to exceed the carrying value of goodwill. We consider each of our operating segments to be separate reporting units. We calculate the fair value of our reporting units primarily utilizing the income approach. The income approach is based on a discounted cash flow analysis and calculates the fair value of reporting units by estimating after-tax cash flows attributable to the reporting units and then discounting the after-tax cash flows using the weighted average cost of capital. The cash flows utilized in the discounted cash flow analysis are based on financial forecasts developed internally by management (Level 3 inputs) and require significant judgment. We record an impairment charge for the amount by which a reporting unit’s carrying value exceeds its fair value, not to exceed the carrying amount of goodwill. See Note 3. “Goodwill and Intangible Assets” to our consolidated financial statements included in Part II. Item 8. of this Form 10-K. for further detail on goodwill impairment.
Revenue Recognition
Product revenues include sales of prescription and non-prescription eyewear, contact lenses, and related accessories to retail customers and sales of inventory in which our customer is another retail entity. Revenues from services and plans include eye exams, eye-care club membership fees, product protection plans (i.e. warranties), and HMO membership fees. Service revenue also includes fees we earn for managing certain vision centers and performing laboratory processing services for our legacy partner.
Our retail customers generally make payments for prescription eyewear products at the time they place an order. Amounts we collect in advance for undelivered merchandise are reported as unearned revenue in the accompanying consolidated balance sheets. Unearned revenue at the end of a reporting period is estimated based on delivery times throughout the concurrent month and generally ranges from four to 10 days. For sales of in-store non-prescription eyewear and related accessories, and paid eye exams, we generally recognize revenue at the point of sale. Revenue is recognized net of sales taxes and returns. The returns allowance is based on historical return patterns.
At our America’s Best brand, our lead offer is two pairs of eyeglasses and a free eye exam for one low price (“two-pair deal”). The Company has determined that the eye exam included in the two-pair deal represents a separate unit of accounting, and therefore, the offer represents a multiple element arrangement. However, the arrangement with the customer requires delivery of acceptable prescription eyeglasses. Otherwise the Company refunds the entire price of the two-pair deal. As a result, we do not allocate revenue to the eye exam associated with the two-pair deal, and we record all revenue associated with the offer in net product sales when the customer has received and accepted the merchandise.
69
We offer extended warranty plans that generally provide for repair and replacement of eyeglasses for a one- or two-year period after purchase. We offer three- and five-year eye-care club memberships to our contact lens customers. In California, we offer 12-month HMO memberships through our FirstSight subsidiary. We recognize service revenue under these programs on a straight-line basis over the warranty or service period. Amounts collected in advance for these programs are reported as deferred revenue in the accompanying consolidated balance sheets.
Leases
We lease our retail stores, optometric examination offices, distribution centers, vehicles, office space and optical labs, with the exception of our St. Cloud, Minnesota lab, which we own. Rent expense on operating leases is recorded in SG&A on a straight-line basis over the term of the lease, commencing on the date the Company takes possession of the leased property. Generally, the Company is required to pay base rent, real estate taxes, maintenance, and insurance. Certain of our lease agreements include rent holidays and rent escalation provisions and may include contingent rent provisions for percentage of sales in excess of specified levels. The Company recognizes rent holidays, including the time period during which the Company has control of the property prior to the opening of the store, as well as escalating rent provisions, as deferred rent expense and amortizes these balances on a straight-line basis over the term of the lease.
For leases classified as capital leases, the capital lease asset is recorded as P&E and a corresponding amount is recorded as a long-term debt obligation at an amount equal to the lesser of the net present value of minimum lease payments to be made over the lease term or the fair value of the property being leased. We allocate each lease payment between a reduction of the lease obligation and interest expense using the effective interest method.
Tenant improvement allowances (“TIAs”) are contractual amounts received by a lessee from a lessor for improvements made to leased properties by the lessee, and are amortized as a reduction in rental expense over the life of the respective leases.
In the event a leased store is closed before the expiration of the lease, the discounted remaining lease obligation less estimated sublease rental income, asset impairment charges related to improvements and fixtures, inventory write-downs, and other miscellaneous expenses are recognized when the store closes.
Income Taxes
We account for deferred income taxes based on the asset and liability method. The Company must make certain estimates and judgments in determining income tax expense. We are required to determine the aggregate amount of income tax expense to accrue and the amount which will be currently payable or refundable based upon tax statutes of each jurisdiction in which the Company does business. Deferred income taxes are recognized for the estimated future tax consequences attributable to differences between the financial statement carrying amounts of existing assets and liabilities and their respective tax bases. Deferred tax assets also include future tax benefits to be derived from the utilization of tax loss carry-forwards and application of certain carry-forward credits. The net carrying amount of deferred income tax assets and liabilities is recorded in non-current deferred income tax liabilities in the accompanying consolidated balance sheets.
Deferred income taxes are measured using enacted tax rates in effect for the years in which those differences are expected to be recovered or settled. The effect on deferred taxes from a change in the tax rate is recognized through continuing operations in the period that includes the enactment of the change. Changes in tax laws and rates could affect recorded deferred tax assets and liabilities in the future.
A valuation allowance is recorded if it is more-likely-than-not that some portion of a deferred tax asset will not be realized. Valuation allowances are released as positive evidence of future taxable income sufficient to realize the underlying deferred tax assets becomes available.
We establish a liability for tax positions for which there is uncertainty as to whether the position will ultimately be sustained. We assess our tax positions by determining whether it is more-likely-than-not that a tax position will be sustained upon examination by the appropriate taxing authorities, including resolution of any related appeals or litigation, based solely on the technical merits of the position. These calculations and assessments involve estimates and judgments because the ultimate tax outcomes are uncertain and future events are unpredictable. See Note 6. “Income Taxes” to our consolidated financial statements included in Part II. Item 8 of this Form 10-K.
70
On December 22, 2017, the 2017 Tax Cuts and Jobs Act (the “Tax Legislation”) was enacted into law. We are required to recognize the effect of tax law changes in the period of enactment, such as re-measuring our U.S. deferred tax assets and liabilities as well as reassessing the net realizability of our deferred tax assets and liabilities. In December 2017, the SEC staff issued Staff Accounting Bulletin No. 118, Income Tax Accounting Implications of the Tax Cuts and Jobs Act (“SAB 118”), which allows us to record provisional amounts during a measurement period not to extend beyond one year of the enactment date. Since the Tax Legislation was passed late in the fourth quarter of 2017, and ongoing guidance and accounting interpretation is expected over the next 12 months, we consider the deferred tax re-measurements and other items to be incomplete due to the forthcoming guidance and our ongoing analysis of final year end data and tax positions. We expect to complete our analysis within the measurement period in accordance with SAB 118. See Note 6. “Income Taxes” to our consolidated financial statements included in Part II. Item 8 of this Form 10-K.
Inventories
The cost of inventory is determined using the weighted average cost method. Inventories at retail stores are comprised of finished goods and are valued at the lower of cost or estimated net realizable value (“NRV”). Manufacturing inventories are valued using absorption accounting which includes material, labor, other variable costs, and other applicable manufacturing overhead. Inventory values are adjusted for estimated obsolescence and written down to NRV based on estimates of current and anticipated demand, customer preference, merchandise age, planned promotional activities, technology developments, market conditions, and estimates of future retail sales prices. Shrinkage is estimated and recorded throughout the period as a percentage of cost of sales based on historical results and current inventory levels. Actual shrinkage is recorded throughout the year based upon periodic physical counts.
Derivative Financial Instruments
The Company uses interest rate swaps to manage its exposure to adverse fluctuations in interest rates by converting a portion of our debt portfolio from a floating rate to a fixed rate. We designate our interest rate swaps as cash flow hedges and formally document our hedge relationships, including identification of the hedging instruments and the hedged items, as well as our risk management objectives and strategies for undertaking the hedge transactions. We record all interest rate swaps in our consolidated balance sheets on a gross basis at fair value. We do not hold or enter into financial instruments for trading or speculative purposes.
The gain or loss resulting from fair value adjustments on cash flow hedges are recorded in accumulated other comprehensive loss (“AOCL”) in the accompanying consolidated balance sheets until the hedged item is recognized as interest expense in the consolidated statements of operations. We perform periodic assessments of the effectiveness of our derivative contracts designated as hedges, including the possibility of counterparty default.
To manage credit risk associated with our interest rate hedging program, we select counterparties based on their credit ratings and limit our exposure to any single counterparty. The counterparties to our derivative contracts are major domestic financial institutions with investment grade credit ratings. We periodically monitor the credit risk of our counterparties and adjust our hedging position as appropriate. The impact of credit risk, as well as the ability of each party to fulfill its obligations under our derivative financial instruments, is considered in determining the fair value of the contracts. Credit risk has not had a significant effect on the fair value of our derivative instruments. We do not have any credit risk-related contingent features or collateral requirements associated with our derivative contracts.
Recently Issued Accounting Pronouncements
In May 2014, the Financial Accounting Standards Board (“FASB”) issued ASU No. 2014-09, Revenue from Contracts with Customers. ASU No. 2014-09 provides new guidance related to the core principle that an entity recognizes revenue to depict the transfer of promised goods or services to customers in an amount that reflects the consideration to which the entity expects to be entitled in exchange for those goods or services. The FASB issued additional ASUs to clarify certain aspects of ASU No. 2014-09, including ASU No. 2016-08, Principal versus Agent Considerations (Reporting Revenue Gross versus Net) in March 2016, and ASU No. 2016-10, Identifying Performance Obligations and Licensing in April 2016. This new guidance is effective for fiscal years beginning after December 15, 2017, and interim reporting periods within that fiscal year. The Company will adopt this new guidance in the first quarter of 2018 using the modified retrospective method.
The majority of our revenue arrangements generally consist of a single performance obligation to transfer promised goods or services. Based on our evaluation process and review of our contracts with customers, the timing and amount of revenue recognized under the new guidance for those single performance obligation arrangements will be consistent with our current revenue recognition policy. Those revenues will be recognized at a point in time either at the point of sale or upon delivery and customer acceptance.
71
The remaining revenues are recognized over time, including product protection plans (i.e. warranties), eye care club memberships, and HMO memberships. Under current guidance, we recognize revenue ratably on a straight-line basis over the contract period for these programs. Under the new guidance we expect the timing of revenue recognition for membership programs to be accelerated since a significant amount of the membership services are transferred to the customer early in the contract period. Membership programs comprise approximately 3% of our consolidated net revenue. Absent a significant increase or decrease in the number of memberships sold each period, this change is not expected to have a significant impact on our on-going consolidated results of operations.
Under the modified retrospective transition method, periods prior to the date of adoption are not retrospectively revised, but a cumulative effect of adoption will be recognized for the impact on uncompleted contracts at the date of adoption.
In preparation of adopting this new guidance, we have implemented the necessary changes to our business processes, systems and controls to support recognition and disclosure upon adoption on December 31, 2017, which is the first day of our fiscal year 2018. We drafted our accounting policy for this new guidance based on a detailed review of our business and contracts. Except for the earlier recognition of revenue related to our membership programs, we do not currently expect that the adoption of the new guidance will have a material impact on our revenues, results of operations or financial position. We expect to make additional disclosures related to the nature, amount, timing and uncertainty of revenue and cash flows arising from contracts with customers as required by the new guidance.
In February 2016, the FASB issued ASU No. 2016-02, Leases. This new guidance establishes a right-of-use (“ROU”) model that requires a lessee to record a ROU asset and a lease liability on the balance sheet for all leases with terms longer than 12 months. Leases will be classified as either financing or operating, with such classification affecting the pattern of expense recognition in the statement of operations. This new guidance is effective for fiscal years beginning after December 15, 2018, and interim reporting periods within that fiscal year. A cumulative transition approach in adjusting to the opening balance of retained earnings can be applied. The Company will adopt this new guidance in the first quarter of 2019. We expect that adoption will have a material impact to the Company’s total assets and liabilities since we have a significant number of operating leases not currently recognized on our consolidated balance sheets.
For additional information on recently issued accounting pronouncements, see Note 1. “Business and Significant Accounting Policies” to our consolidated financial statements included in Part II. Item 8 of this Form 10-K.
Impact of Inflation
Our results of operations and financial condition are presented based on historical cost. While it is difficult to accurately measure the impact of inflation due to the imprecise nature of the estimates required, we believe the effects of inflation, if any, on our results of operations and financial condition have been immaterial.
Item 7A. Quantitative and Qualitative Disclosures About Market Risk
We have market risk exposure from changes in interest rates. When appropriate, we use derivative financial instruments to mitigate the risk from such exposure. A discussion of our accounting policies for derivative financial instruments is included in Note 10. “Fair Value Measurement of Financial Assets and Liabilities” to our consolidated financial statements included in Part II. Item 8 of this Form 10-K.
A substantial portion of our debt bears interest at variable rates. If market interest rates increase, the interest rate on our variable rate debt will increase and will create higher debt service requirements, which would adversely affect our cash flow and could adversely impact our results of operations. We also have a revolving line of credit at variable interest rates. The general levels of LIBOR affect interest expense. We periodically use interest rate swaps to manage such risk. The net amounts to be paid or received under interest rate swap agreements are accrued as interest rates change, and are recognized over the life of the swap agreements as an adjustment to interest expense from the underlying debt to which the swap is designated. The related amounts payable to, or receivable from, the contract counterparties are included in accrued liabilities or accounts receivable in the consolidated balance sheets.
As of fiscal year 2017, all of our $568.6 million in term loan debt was subject to variable interest rates, with a weighted average borrowing rate of 4.3%. After inclusion of the notional amount of $500.0 million of interest rate swaps fixing a portion of the variable rate debt, $68.6 million, or 12.1% of our debt, is subject to variable rates. Assuming an increase to market rates of 1.0% as of December 30, 2017, we would incur an annual increase to interest expense of approximately $0.7 million related to debt subject to variable rates.
72
Item 8. Consolidated Financial Statements and Supplementary Data
INDEX TO CONSOLIDATED FINANCIAL STATEMENTS
Page | |
73
REPORT OF INDEPENDENT REGISTERED PUBLIC ACCOUNTING FIRM
To the Stockholders and Board of Directors of National Vision Holdings, Inc. and Subsidiaries
Opinion on the Financial Statements
We have audited the accompanying consolidated balance sheets of National Vision Holdings, Inc. and subsidiaries (the "Company") as of December 30, 2017 and December 31, 2016, the related consolidated statements of operations and comprehensive income (loss), stockholders' equity, and cash flows, for each of the three years in the period ended December 30, 2017, and the related notes and the schedule listed in the Index at Item 15 (collectively referred to as the "financial statements"). In our opinion, the financial statements present fairly, in all material respects, the financial position of the Company as of December 30, 2017 and December 31, 2016, and the results of its operations and its cash flows for each of the three years in the period ended December 30, 2017, in conformity with accounting principles generally accepted in the United States of America.
Basis for Opinion
These financial statements are the responsibility of the Company's management. Our responsibility is to express an opinion on the Company's financial statements based on our audits. We are a public accounting firm registered with the Public Company Accounting Oversight Board (United States) (PCAOB) and are required to be independent with respect to the Company in accordance with the U.S. federal securities laws and the applicable rules and regulations of the Securities and Exchange Commission and the PCAOB.
We conducted our audits in accordance with the standards of the PCAOB. Those standards require that we plan and perform the audit to obtain reasonable assurance about whether the financial statements are free of material misstatement, whether due to error or fraud. The Company is not required to have, nor were we engaged to perform, an audit of its internal control over financial reporting. As part of our audits, we are required to obtain an understanding of internal control over financial reporting but not for the purpose of expressing an opinion on the effectiveness of the Company’s internal control over financial reporting. Accordingly, we express no such opinion.
Our audits included performing procedures to assess the risks of material misstatement of the financial statements, whether due to error or fraud, and performing procedures that respond to those risks. Such procedures included examining, on a test basis, evidence regarding the amounts and disclosures in the financial statements. Our audits also included evaluating the accounting principles used and significant estimates made by management, as well as evaluating the overall presentation of the financial statements. We believe that our audits provide a reasonable basis for our opinion.
/s/ Deloitte & Touche LLP
Atlanta, Georgia
March 8, 2018
We have served as the Company's auditor since 2002.
74
National Vision Holdings, Inc. and Subsidiaries
Consolidated Balance Sheets
As of December 30, 2017 and December 31, 2016
In Thousands, Except Par Value
ASSETS | As of December 30, 2017 | As of December 31, 2016 | |||||
Current assets: | |||||||
Cash and cash equivalents | $ | 4,208 | $ | 4,945 | |||
Accounts receivable, net | 43,193 | 34,370 | |||||
Inventories | 91,151 | 87,064 | |||||
Prepaid expenses and other current assets | 23,925 | 20,880 | |||||
Total current assets | 162,477 | 147,259 | |||||
Property and equipment, net | 304,132 | 256,414 | |||||
Other assets: | |||||||
Goodwill | 792,744 | 793,229 | |||||
Trademarks and trade names | 240,547 | 240,547 | |||||
Other intangible assets, net | 72,903 | 81,338 | |||||
Other assets | 10,988 | 12,330 | |||||
Total non-current assets | 1,421,314 | 1,383,858 | |||||
Total assets | $ | 1,583,791 | $ | 1,531,117 | |||
LIABILITIES AND STOCKHOLDERS’ EQUITY | |||||||
Current liabilities: | |||||||
Accounts payable | $ | 35,708 | $ | 39,400 | |||
Other payables and accrued expenses | 77,611 | 69,402 | |||||
Unearned revenue | 27,739 | 25,600 | |||||
Deferred revenue | 62,993 | 57,996 | |||||
Current maturities of long-term debt | 7,258 | 7,285 | |||||
Total current liabilities | 211,309 | 199,683 | |||||
Long-term debt, less current portion and debt discount | 561,980 | 738,340 | |||||
Other non-current liabilities: | |||||||
Deferred revenue | 31,222 | 29,432 | |||||
Other liabilities | 46,044 | 50,497 | |||||
Deferred income taxes, net | 73,648 | 111,278 | |||||
Total other non-current liabilities | 150,914 | 191,207 | |||||
Commitments and contingencies (See Note 12) | |||||||
Stockholders’ equity: | |||||||
Common stock, $0.01 par value; 200,000 shares authorized; 74,654 and 56,202 shares issued and outstanding as of December 30, 2017 and December 31, 2016, respectively | 746 | 562 | |||||
Additional paid-in capital | 631,798 | 424,789 | |||||
Accumulated other comprehensive loss | (9,868 | ) | (14,556 | ) | |||
Retained earnings (accumulated deficit) | 37,145 | (8,675 | ) | ||||
Treasury stock, at cost; 28 shares as of December 30, 2017 and December 31, 2016 | (233 | ) | (233 | ) | |||
Total stockholders’ equity | 659,588 | 401,887 | |||||
Total liabilities and stockholders’ equity | $ | 1,583,791 | $ | 1,531,117 | |||
The accompanying notes are an integral part of these consolidated financial statements.
75
National Vision Holdings, Inc. and Subsidiaries
Consolidated Statements of Operations and Comprehensive Income (Loss)
For the Years Ended December 30, 2017, December 31, 2016, and January 2, 2016
In Thousands, Except Earnings Per Share
Fiscal Year 2017 | Fiscal Year 2016 | Fiscal Year 2015 | |||||||||
Revenue: | |||||||||||
Net product sales | $ | 1,129,313 | $ | 980,953 | $ | 870,463 | |||||
Net sales of services and plans | 245,995 | 215,242 | 192,065 | ||||||||
Total net revenue | 1,375,308 | 1,196,195 | 1,062,528 | ||||||||
Costs applicable to revenue (exclusive of depreciation and amortization): | |||||||||||
Products | 456,078 | 390,369 | 353,894 | ||||||||
Services and plans | 180,888 | 154,412 | 137,206 | ||||||||
Total costs applicable to revenue | 636,966 | 544,781 | 491,100 | ||||||||
Operating expenses: | |||||||||||
Selling, general and administrative expenses | 597,924 | 524,238 | 474,053 | ||||||||
Depreciation and amortization | 61,115 | 51,993 | 44,069 | ||||||||
Asset impairment | 4,117 | 7,132 | 7,716 | ||||||||
Litigation settlement | 7,000 | — | — | ||||||||
Other expense, net | 950 | 1,667 | 913 | ||||||||
Total operating expenses | 671,106 | 585,030 | 526,751 | ||||||||
Income from operations | 67,236 | 66,384 | 44,677 | ||||||||
Interest expense, net | 55,536 | 39,092 | 36,741 | ||||||||
Debt issuance costs | 4,527 | — | 2,551 | ||||||||
Earnings before income taxes | 7,173 | 27,292 | 5,385 | ||||||||
Income tax (benefit) provision | (38,647 | ) | 12,534 | 1,768 | |||||||
Net income | $ | 45,820 | $ | 14,758 | $ | 3,617 | |||||
Earnings per share: | |||||||||||
Basic | $ | 0.77 | $ | 0.26 | $ | 0.06 | |||||
Diluted | $ | 0.74 | $ | 0.26 | $ | 0.06 | |||||
Weighted average shares outstanding: | |||||||||||
Basic | 59,895 | 56,185 | 55,962 | ||||||||
Diluted | 62,035 | 57,001 | 55,962 | ||||||||
Comprehensive income (loss): | |||||||||||
Net income | $ | 45,820 | $ | 14,758 | $ | 3,617 | |||||
Change in unrealized gain (loss) on hedge instruments | 7,613 | (5,116 | ) | (7,065 | ) | ||||||
Tax (provision) benefit of change in unrealized gain (loss) on hedge instruments | (2,925 | ) | 1,844 | 2,837 | |||||||
Comprehensive income (loss) | $ | 50,508 | $ | 11,486 | $ | (611 | ) | ||||
The accompanying notes are an integral part of these consolidated financial statements.
76
National Vision Holdings, Inc. and Subsidiaries
Consolidated Statements of Stockholders' Equity
For the Years Ended December 30, 2017, December 31, 2016, and January 2, 2016
In Thousands
Common Stock | Additional Paid-In Capital | Accumulated Other Comprehensive Loss | Retained Earnings (Accumulated Deficit) | Treasury Stock | Total Stockholders' Equity | |||||||||||||||
Shares | Amount | |||||||||||||||||||
Balances at January 3, 2015 | 55,831 | $ | 558 | $ | 557,142 | $ | (7,056 | ) | $ | (27,050 | ) | $ | — | $ | 523,594 | |||||
Dividend to stockholders | — | — | (145,667 | ) | — | — | — | (145,667 | ) | |||||||||||
Tax benefit of dividend | — | — | 407 | — | — | — | 407 | |||||||||||||
Stock option exercises | 245 | 3 | 1,759 | — | — | — | 1,762 | |||||||||||||
Issuance of common stock, net | 12 | — | 110 | — | — | — | 110 | |||||||||||||
Stock option compensation | — | — | 6,635 | — | — | — | 6,635 | |||||||||||||
Change in unrealized loss on hedge instruments | — | — | — | (4,228 | ) | — | — | (4,228 | ) | |||||||||||
Net income | — | — | — | — | 3,617 | — | 3,617 | |||||||||||||
Balances at January 2, 2016 | 56,088 | 561 | 420,386 | (11,284 | ) | (23,433 | ) | — | 386,230 | |||||||||||
Tax impact of stock option exercises | — | — | (619 | ) | — | — | — | (619 | ) | |||||||||||
Stock option exercises | 142 | 1 | 1,040 | — | — | — | 1,041 | |||||||||||||
Stock option compensation | — | — | 4,293 | — | — | — | 4,293 | |||||||||||||
Repurchase of stock options | — | — | (167 | ) | — | — | — | (167 | ) | |||||||||||
Repurchase of common stock | (28 | ) | — | (144 | ) | — | — | (233 | ) | (377 | ) | |||||||||
Change in unrealized loss on hedge instruments | — | — | — | (3,272 | ) | — | — | (3,272 | ) | |||||||||||
Net income | — | — | — | — | 14,758 | — | 14,758 | |||||||||||||
Balances at December 31, 2016 | 56,202 | 562 | 424,789 | (14,556 | ) | (8,675 | ) | (233 | ) | 401,887 | ||||||||||
Dividend to stockholders | — | — | (170,983 | ) | — | — | — | (170,983 | ) | |||||||||||
Stock option exercises | 212 | 2 | 1,090 | — | — | — | 1,092 | |||||||||||||
Issuance of common stock, net | 18,240 | 182 | 371,750 | — | — | — | 371,932 | |||||||||||||
Stock option compensation | — | — | 5,152 | — | — | — | 5,152 | |||||||||||||
Change in unrealized gain on hedge instruments | — | — | — | 4,688 | — | — | 4,688 | |||||||||||||
Net income | — | — | — | — | 45,820 | — | 45,820 | |||||||||||||
Balances at December 30, 2017 | 74,654 | $ | 746 | $ | 631,798 | $ | (9,868 | ) | $ | 37,145 | $ | (233 | ) | $ | 659,588 | |||||
The accompanying notes are an integral part of these consolidated financial statements.
77
National Vision Holdings, Inc. and Subsidiaries
Consolidated Statements of Cash Flows
For the Years Ended December 30, 2017, December 31, 2016, and January 2, 2016
In Thousands
Fiscal Year 2017 | Fiscal Year 2016 | Fiscal Year 2015 | |||||||||
Cash flows from operating activities: | |||||||||||
Net income | $ | 45,820 | $ | 14,758 | $ | 3,617 | |||||
Adjustments to reconcile net income to cash provided by operating activities: | |||||||||||
Depreciation of property and equipment | 52,680 | 42,804 | 34,859 | ||||||||
Amortization of intangible assets | 8,435 | 9,189 | 9,210 | ||||||||
Amortization of loan costs | 7,078 | 3,906 | 3,816 | ||||||||
Asset impairment | 4,117 | 7,132 | 7,716 | ||||||||
Deferred income tax (benefit) expense | (39,734 | ) | 11,181 | 1,528 | |||||||
Non-cash stock option compensation | 5,152 | 4,293 | 6,635 | ||||||||
Non-cash inventory adjustments | 5,496 | 1,728 | 2,056 | ||||||||
Bad debt expense | 8,035 | 4,052 | 3,816 | ||||||||
Debt issuance costs | 4,527 | — | 2,551 | ||||||||
Other | 1,188 | 1,028 | 25 | ||||||||
Changes in operating assets and liabilities: | |||||||||||
Accounts receivable, net | (16,858 | ) | (9,075 | ) | (6,851 | ) | |||||
Inventories | (9,583 | ) | (13,827 | ) | (10,664 | ) | |||||
Other assets | (2,075 | ) | (4,153 | ) | (4,563 | ) | |||||
Accounts payable | (3,692 | ) | 5,616 | (82 | ) | ||||||
Deferred revenue | 6,787 | 9,550 | 13,678 | ||||||||
Other liabilities | 12,879 | 9,406 | 15,784 | ||||||||
Net cash provided by operating activities | 90,252 | 97,588 | 83,131 | ||||||||
Cash flows from investing activities: | |||||||||||
Purchase of property and equipment | (93,219 | ) | (90,026 | ) | (77,157 | ) | |||||
Purchase of investments | (1,500 | ) | (1,000 | ) | (2,850 | ) | |||||
Other | (108 | ) | (638 | ) | (44 | ) | |||||
Net cash used for investing activities | (94,827 | ) | (91,664 | ) | (80,051 | ) | |||||
Cash flows from financing activities: | |||||||||||
Proceeds from issuance of long-term debt | 174,924 | — | 148,185 | ||||||||
Proceeds from issuance of common stock | 371,932 | — | 110 | ||||||||
Proceeds from exercise of stock options | 1,092 | 915 | 1,762 | ||||||||
Principal payments on long-term debt | (367,660 | ) | (6,515 | ) | (6,136 | ) | |||||
Debt issuance costs | (4,527 | ) | — | (2,551 | ) | ||||||
Dividend to stockholders | (170,983 | ) | — | (145,667 | ) | ||||||
Other | (940 | ) | (974 | ) | (20 | ) | |||||
Net cash provided by (used for) financing activities | 3,838 | (6,574 | ) | (4,317 | ) | ||||||
Net change in cash and cash equivalents | (737 | ) | (650 | ) | (1,237 | ) | |||||
Cash and cash equivalents, beginning of year | 4,945 | 5,595 | 6,832 | ||||||||
Cash and cash equivalents, end of year | $ | 4,208 | $ | 4,945 | $ | 5,595 | |||||
Supplemental cash flow information ($000’s): | |||||||||||
Cash paid for interest | 47,090 | 34,873 | 33,386 | ||||||||
Cash paid (received) for taxes | 2,647 | (415 | ) | 365 | |||||||
Property and equipment accrued at the end of the period | 10,782 | 9,202 | 5,956 | ||||||||
Fixed assets acquired under capital lease obligations | 10,117 | 1,004 | 1,073 | ||||||||
Non-cash issuance of common shares | — | 157 | — | ||||||||
Non-cash repurchase of common shares | — | (188 | ) | — | |||||||
The accompanying notes are an integral part of these consolidated financial statements.
78
National Vision Holdings, Inc. and Subsidiaries
Notes to Consolidated Financial Statements
1. Business and Significant Accounting Policies
Nature of Operations
National Vision Holdings, Inc. (“NVHI,” the “Company,” “we,” “our,” or “us”) is a holding company whose operating subsidiaries include its indirect wholly owned subsidiary, National Vision, Inc. (“NVI”) and NVI’s direct wholly owned subsidiaries.
We are a leading value retailer of eyeglasses and contact lenses in the United States. We operated 1,013 and 943 retail optical locations in the United States and its territories as of the fiscal years ended December 30, 2017 and December 31, 2016, respectively, through our five store brands, including America’s Best Contacts and Eyeglasses (“America’s Best”), Eyeglass World, Vista Optical locations on U.S. Army/Air Force military bases (“Military”) and within Fred Meyer (“Fred Meyer”) stores, and our management and services arrangement with Walmart (“legacy”).
We sell contact lenses and optical accessory products to retail customers through our wholly owned e-commerce subsidiary, Arlington Contact Lens Service, Inc. (“AC Lens”). AC Lens operates several of its own proprietary retail web sites as well as web sites on behalf of certain independent retailers and insurance companies. AC Lens also distributes contact lenses to Walmart and Sam's Club under fee for services arrangements. Under the associated agreements, AC Lens sells contact lens products to Walmart and Sam’s Club store locations at its cost, and earns a fulfillment fee per order shipped.
Our wholly-owned subsidiary specialized health maintenance organization (“HMO”), FirstSight Vision Services, Inc. (“FirstSight”), that is licensed as a single-service health plan under California law, issues individual vision care benefit plans in connection with our America’s Best operations in California, provides or arranges for the provision of optometric services at almost all of the optometric offices next to Walmart and Sam’s Club stores in California and also sells contact lenses to its members in certain locations. As of December 30, 2017, FirstSight operated 124 optometric offices in Walmart locations in California, of which 20 are adjacent to vision centers we manage and that FirstSight subleases from us and 104 that are leased directly from Walmart.
Fiscal Year
We operate on a retail fiscal calendar that results in a given fiscal year consisting of a 52- or 53-week period ending on the Saturday closest to December 31. In a 52-week fiscal year, each quarter contains 13 weeks of operations; in a 53-week fiscal year, each of the first, second and third quarters includes 13 weeks of operations and the fourth quarter includes 14 weeks of operations.
References herein to “fiscal year 2017,” “fiscal year 2016,” and “fiscal year 2015,” relate to the 52 weeks ended December 30, 2017, December 31, 2016, and January 2, 2016, respectively. Unless otherwise stated, references to years in this report relate to fiscal years rather than calendar years.
Basis of Presentation and Principles of Consolidation
We prepare our consolidated financial statements in accordance with accounting principles generally accepted in the United States of America (“U.S. GAAP”). The consolidated financial statements include our accounts and those of our subsidiaries, all of which are wholly-owned. All intercompany balances and transactions have been eliminated in consolidation.
Use of Estimates
The preparation of financial statements in conformity with U.S. GAAP requires management to make estimates and assumptions that affect the reported amounts of assets and liabilities and disclosure of contingent assets and liabilities at the date of the financial statements and the reported amounts of revenues and expenses during the reporting period. Actual results could differ from those estimates.
79
National Vision Holdings, Inc. and Subsidiaries
Notes to Consolidated Financial Statements
1. Business and Significant Accounting Policies (continued)
Initial Public Offering
On October 30, 2017, we completed an initial public offering of our common stock (“IPO”) in which we issued and sold 18,170,000 shares, including 2,370,000 shares pursuant to the exercise in full of the underwriters’ option to purchase additional shares. The shares sold in the offering were registered under the Securities Act pursuant to our Registration Statement on Form S-1 (File No. 333-220719), which was declared effective by the Securities and Exchange Commission on October 25, 2017. The shares were sold at an initial offering price of $22.00 per share, which generated net proceeds of approximately $375.8 million to the Company, after deducting underwriting discounts and commissions of approximately $24.0 million which included $0.7 million paid to KKR Capital Markets LLC (“KCM”), an affiliate of Kohlberg Kravis Roberts & Co. (“KKR Sponsor”), for underwriting services in connection with the IPO.
We primarily used the proceeds from the IPO to repay $125.0 million in outstanding aggregate principal amount of our second lien term loans and approximately $235.0 million of the outstanding principal amount of our first lien term loans and accrued and unpaid interest thereon. The repayment resulted in a retirement of debt in the amount of $353.3 million. Additionally, we paid $4.8 million of transaction related costs which are recorded as a charge against additional paid-in capital included in the consolidated balance sheets. The remaining $11.0 million of the proceeds was used for general corporate purposes, and payment of the termination fees described below.
NVI was party to a Monitoring Agreement, dated as of March 14, 2014, with KKR Sponsor and Berkshire Partners LLC (“Berkshire”), which was terminated automatically in accordance with its terms upon the completion of the IPO. The Company paid termination fees of approximately $3.6 million and $0.8 million to KKR Sponsor and Berkshire, respectively, recorded in selling, general and administrative expenses in the consolidated statements of operations. Affiliates of KKR Sponsor and Berkshire retained 58.2% and 13.6% ownership interest, respectively, in the Company after the IPO.
Second Amended and Restated Certificate of Incorporation and Bylaws
The Company’s Second Amended and Restated Certificate of Incorporation became effective in connection with the completion of the IPO on October 30, 2017, which among other things, provides that the Company’s authorized capital stock consists of 200,000,000 shares of Common Stock and 50,000,000 shares of preferred stock, par value $0.01 per share. The Company’s bylaws were also amended and restated as of October 30, 2017.
Stock Split
On October 12, 2017, the Company’s Board of Directors approved a 1.96627-for-one reverse stock split of the Company’s common stock, effective October 24, 2017. The accompanying consolidated financial statements and notes thereto give retroactive effect to the reverse stock split for all periods presented.
Property and Equipment
Property and equipment (“P&E”) is stated at cost less accumulated depreciation. Depreciation associated with P&E is included in depreciation and amortization in the accompanying consolidated statements of operations. When we retire or otherwise dispose of P&E, the cost and related accumulated depreciation are removed from the accounts and any gain or loss on sale of such assets is included in selling, general, and administrative (“SG&A”) expenses in the consolidated statements of operations. Major replacements, remodeling, or betterments are capitalized. Expenditures for maintenance and repairs are charged to SG&A.
80
National Vision Holdings, Inc. and Subsidiaries
Notes to Consolidated Financial Statements
1. Business and Significant Accounting Policies (continued)
P&E is depreciated for financial accounting purposes using the straight-line method over the following estimated useful lives:
Buildings | 34 years |
Land improvements(a) | 10 years |
Equipment(b) | 5 - 7 years |
Information systems hardware and software | 2 - 5 years |
Furniture and fixtures | 6 years |
Leasehold improvements(a) | 10 years |
P&E under capital leases | Shorter of useful life or lease term |
____________ | |
(a) Depreciation of land and leasehold improvements is recognized over the shorter of the estimated useful life of the asset or the term of the lease. The term of the lease includes renewal options for additional periods if the exercise of the renewal is considered to be reasonably assured. | |
(b) Costs of developing or obtaining software for internal use, such as direct costs of materials or services and internal payroll costs related to the software development projects, are capitalized to equipment. | |
Goodwill and Intangible Assets
Indefinite-lived, non-amortizing intangible assets include goodwill and our trademarks and tradenames and are evaluated annually for impairment. Our annual testing date for impairment of goodwill and indefinite-lived intangible assets is the first day of the fourth fiscal quarter, which for fiscal years 2017 and 2016 was October 1, 2017, and October 2, 2016, respectively.
Definite-lived, amortizing intangible assets primarily consist of our contracts and relationships with certain retailers, and also our customer database tool. We amortize definite-lived intangible assets on a straight-line basis over their estimated useful lives, ranging from four to 23 years. Amortization expense associated with definite-lived intangible assets is included in depreciation and amortization in the accompanying consolidated statements of operations.
Fair Value Measurement of Assets and Liabilities (Non-Recurring Basis)
Non-financial assets such as P&E, intangible assets, and goodwill are subject to nonrecurring fair value measurements if impairment indicators are present. Factors we consider important that could trigger an impairment review include a significant under-performance relative to expected operating results, a significant or adverse change in customer business climate, or a significant negative industry or economic trend.
Impairment of P&E
We evaluate impairment of long-lived tangible store assets at an individual store level, which is the lowest level at which independent cash flows can be identified, when events or conditions indicate the carrying value of such assets may not be recoverable. If the store's projected undiscounted cash flows expected to be generated by the related assets over the remaining useful life are less than the carrying value of the related assets, we then measure impairment based on a discounted cash flow model (Level 3 inputs) and record an impairment charge as the difference between carrying value and estimated fair value.
In circumstances where a discounted cash flow analysis is not appropriate for assessing impairment of P&E, we use a liquidation approach, whereby we estimate the fair value of the subject assets based on the expected sales value that a market participant would be willing to pay for the assets in their current location and condition, net of expected cost to remove and transport the assets to the buyer where applicable.
As a result of our tests for impairment of our long-lived tangible store assets classified as held and used, impairment of $1.6 million, $1.2 million, and $2.4 million was recorded for fiscal year 2017, 2016, and 2015, respectively. There was no remaining fair value of the assets that were impaired during fiscal years 2017 and 2016.
We assess non-store tangible assets, including capitalized software costs in use or under development, for impairment if events or changes in circumstances indicate that the carrying value of those assets may not be recoverable. During fiscal year 2017 we recorded $1.5 million in impairment charges associated with capitalized software costs. There was no impairment of capitalized software costs during fiscal year 2016. An impairment charge of $0.5 million was recorded during fiscal year 2015 associated with software that was replaced during the year.
81
National Vision Holdings, Inc. and Subsidiaries
Notes to Consolidated Financial Statements
1. Business and Significant Accounting Policies (continued)
Impairment of Goodwill and Intangible Assets
If impairment indicators related to amortizing intangible assets are present, we estimate cash flows expected to be generated over the remaining useful lives of the related assets based on current projections. If the projected undiscounted cash flows are less than the carrying value of the related assets, we then measure impairment based on a discounted cash flow model (Level 3 inputs) and record an impairment charge as the difference between carrying value and estimated fair value.
We evaluate non-amortizing trademarks and tradenames for impairment annually or whenever events or changes in circumstances indicate that those assets may be impaired. We use the relief-from-royalty method to estimate fair value, whereby an estimated royalty rate is determined based on comparable licensing arrangements, which is then applied to the revenue projections for the subject asset. The estimated fair value is calculated using a discounted cash flow analysis (Level 3 inputs). We record an impairment charge as the excess of carrying value over estimated fair value.
Goodwill impairment is present if a reporting unit’s carrying value exceeds its fair value, not to exceed the carrying value of goodwill. We consider each of our operating segments to be separate reporting units. We estimate the fair value of our reporting units primarily utilizing the income approach. The income approach is based on a discounted cash flow analysis and calculates the fair value of reporting units by estimating after-tax cash flows attributable to the reporting units and then discounting the after-tax cash flows using the weighted average cost of capital. The cash flows utilized in the discounted cash flow analysis are based on financial forecasts developed internally by management (Level 3 inputs) and require significant judgment. We record an impairment charge for the amount by which a reporting unit’s carrying value exceeds its fair value, not to exceed the carrying amount of goodwill. See Note 3. “Goodwill and Intangible Assets” for further detail on impairment of goodwill and intangible assets.
Equity Method Investment
The Company has an investment in a private start-up company whose principal business is licensing software to eyeglass retailers. We evaluate the recoverability of our investment by first reviewing the investment for any indicators of impairment. If indicators are present, we estimate the fair value of the investment. If the carrying value of the investment is greater than the estimated fair value, we make an assessment of whether the impairment is other-than-temporary (“OTTI”). In making this assessment, we consider the length of time and the extent to which fair value has been less than cost and our intent and ability to retain our interest long enough for a recovery in market value. Based on our current year assessment, we did not identify OTTI in our equity method investment. See Note 9. “Equity in Net Assets of Non-Consolidated Affiliates,” for further discussion relating to this investment.
Cost Method Investment
As of fiscal year end 2016, the Company had a $1.0 million cost method investment in a private start-up entity whose principal business is creating eyeglasses through three dimensional printing. During the second quarter of fiscal year 2017, management determined that it is unlikely that the business will be able to continue operations for the foreseeable future. Therefore, we have recorded an impairment charge for the entire amount of the investment in asset impairment in the consolidated statement of operations for fiscal year 2017.
Revenue Recognition
Product revenues include sales of prescription and non-prescription eyewear, contact lenses, and related accessories to retail customers (including those covered by managed care) and sales of inventory in which our customer is another retail entity. Revenues from services and plans include eye exams, eye-care club membership fees, product protection plans (i.e. warranties), and HMO membership fees. Service revenue also includes fees we earn for managing certain vision centers and performing laboratory processing services for our legacy partner.
Our retail customers generally make payments for prescription eyewear products at the time they place an order. Amounts we collect in advance for undelivered merchandise are reported as unearned revenue in the accompanying consolidated balance sheets. Unearned revenue at the end of a reporting period is estimated based on delivery times throughout the current month and generally ranges from four to 10 days. For sales of in-store non-prescription eyewear and related accessories, and paid eye exams, we recognize revenue at the point of sale. Revenue is recognized net of sales taxes and returns. The returns allowance is based on historical return patterns.
At our America’s Best brand, our lead offer is two pairs of eyeglasses and a free eye exam for one low price (“two-pair deal”). The Company has determined that the eye exam included in the two-pair deal represents a separate unit of accounting, and therefore, the offer represents a multiple element arrangement. However, the arrangement with the customer requires delivery of acceptable prescription eyeglasses. Otherwise the Company refunds the entire price of
82
National Vision Holdings, Inc. and Subsidiaries
Notes to Consolidated Financial Statements
1. Business and Significant Accounting Policies (continued)
the two-pair deal. As a result, we do not allocate revenue to the eye exam associated with the two-pair deal, and we record all revenue associated with the offer in net product sales when the customer has received and accepted the merchandise.
We offer extended warranty plans that generally provide for repair and replacement of eyeglasses for a one- or two-year period after purchase. We offer three- and five-year eye-care club memberships to our contact lens customers. In California, we offer 12-month HMO memberships through our FirstSight subsidiary. We recognize service revenue under these programs on a straight-line basis over the warranty or service period. Amounts collected in advance for these programs are reported as deferred revenue in the accompanying consolidated balance sheets. Refer to Note 11. “Deferred Revenue” for further details.
Costs Applicable To Revenue
Costs applicable to revenue consist primarily of cost of products sold and costs of administering services and plans. Costs of products sold include (i) costs to procure non-prescription eyewear, contacts, and accessories which we purchase and sell in their finished form, (ii) costs to manufacture finished prescription eyeglasses, including direct materials, labor, and overhead, and (iii) remake costs, warehousing and distribution expenses, and internal transfer costs. Costs of services and plans include costs associated with warranty programs, eye-care club memberships, HMO memberships, eye-care practitioner and eye exam technician payroll, taxes, and benefits, and optometric and other service costs. Depreciation and amortization are excluded from costs applicable to revenue and are presented as separate items on the consolidated statements of operations.
As a component of the Company's consolidated procurement program, the Company frequently enters into contracts with its vendors that provide for payments of rebates or other allowances. These vendor payments are reflected in the carrying value of the inventory when earned or as progress is made toward earning the rebate or allowance and as a component of cost of products as the inventory is sold.
Selling, General and Administrative Expenses
SG&A includes store associate payroll, taxes, and benefits, store occupancy, advertising and promotion, field supervision, and corporate support. Advertising and promotion costs, including online marketing arrangements, newspaper, direct mail, television and radio, are recorded in SG&A and expensed at the time the advertising first occurs. Production costs of future media advertising and related promotional campaigns are deferred until the advertising events occur.
Advertising expenses were $93.2 million, $85.4 million and $77.0 million for fiscal years 2017, 2016, and 2015, respectively. Non-capital expenditures associated with opening new stores, including rent, store remodels, marketing expenses, travel and relocation costs, and training costs, are recorded in SG&A as incurred.
Leases
We lease our retail stores, optometric examination offices, distribution centers, vehicles, office space and optical labs, with the exception of our St. Cloud, Minnesota lab, which we own. Rent expense on operating leases is recorded in SG&A on a straight-line basis over the term of the lease, commencing on the date the Company takes possession of the leased property. Generally, the Company is required to pay base rent, real estate taxes, maintenance, and insurance. Certain of our lease agreements include rent holidays and rent escalation provisions and may include contingent rent provisions for sales in excess of specified levels. The Company recognizes rent holidays, including the time period during which the Company has control of the property prior to the opening of the store, as well as escalating rent provisions, as deferred rent expense and amortizes these balances on a straight-line basis over the term of the lease. Deferred rent is included in non-current other liabilities on the accompanying consolidated balance sheets.
For capital leases, a lease asset is recorded as P&E and a corresponding amount is recorded as a long-term debt obligation at an amount equal to the lesser of the net present value of minimum lease payments to be made over the lease term or the fair value of the property. The Company allocates capital lease payments to reductions in the lease obligation and interest expense using the effective interest method.
See Note 4. “Long-term Debt” for further details related to our capital lease commitments and Note 12. “Commitments and Contingencies” for further details related to our operating lease commitments.
Tenant improvement allowances (“TIAs”) are contractual amounts received by a lessee from a lessor for improvements made to leased properties by the lessee. TIAs are recorded in other non-current liabilities in the accompanying
83
National Vision Holdings, Inc. and Subsidiaries
Notes to Consolidated Financial Statements
1. Business and Significant Accounting Policies (continued)
consolidated balance sheets, and are amortized as a reduction in rental expense over the life of the respective leases. Receivables for TIA’s are recorded in accounts receivable in the accompanying consolidated balance sheets.
In the event a leased store is closed before the expiration of the lease, the discounted remaining lease obligation less estimated sublease rental income, asset impairment charges related to improvements and fixtures, inventory write-downs, and other miscellaneous expenses are recognized when the store closes. Accruals for store closure costs are recorded in current and non-current other liabilities in the accompanying consolidated balance sheets and are not material.
Stock-Based Compensation
We measure stock-based compensation cost, which consists of grants of stock options, restricted stock units and restricted shares to employees, consultants and non-employee directors, based on the estimated grant date fair value of the awards. We recognize compensation expense for service-based vesting awards over the requisite service period. For awards that are subject to performance conditions, we recognize compensation expense once achievement of the conditions is considered to be probable. See Note 5. “Stock Incentive Plan” for further details related to our stock-based compensation plans.
Income Taxes
We account for deferred income taxes based on the asset and liability method. The Company must make certain estimates and judgments in determining income tax expense. We are required to determine the aggregate amount of income tax expense to accrue and the amount which will be currently payable or refundable based upon tax statutes of each jurisdiction in which the Company does business. Deferred income taxes are recognized for the estimated future tax consequences attributable to differences between the financial statement carrying amounts of existing assets and liabilities and their respective tax bases. Deferred tax assets also include future tax benefits to be derived from the utilization of tax loss carry-forwards and application of certain carry-forward credits. The net carrying amount of deferred income tax assets and liabilities is recorded in non-current deferred income tax liabilities in the accompanying consolidated balance sheets.
Deferred income taxes are measured using enacted tax rates in effect for the years in which those differences are expected to be recovered or settled. The effect on deferred taxes from a change in the tax rate is recognized through continuing operations in the period that includes the enactment of the change. Changes in tax laws and rates could affect recorded deferred tax assets and liabilities in the future.
A valuation allowance is recorded if it is more-likely-than-not that some portion of a deferred tax asset will not be realized. Valuation allowances are released as positive evidence of future taxable income sufficient to realize the underlying deferred tax assets becomes available.
We establish a liability for tax positions for which there is uncertainty as to whether the position will ultimately be sustained. We assess our tax positions by determining whether it is more-likely-than-not that a tax position will be sustained upon examination by the appropriate taxing authorities, including resolution of any related appeals or litigation, based solely on the technical merits of the position. These calculations and assessments involve estimates and judgments because the ultimate tax outcomes are uncertain and future events are unpredictable. See Note 6. “Income Taxes” for further details.
On December 22, 2017, the 2017 Tax Cuts and Jobs Act (the “Tax Legislation”) was enacted into law. We are required to recognize the effect of tax law changes in the period of enactment, such as re-measuring and reassessing the net realizability of our deferred tax assets and liabilities. In December 2017, the SEC staff issued Staff Accounting Bulletin No. 118, Income Tax Accounting Implications of the Tax Cuts and Jobs Act (“SAB 118”), which allows us to record provisional amounts during a measurement period not to extend beyond one year of the enactment date. Since the Tax Legislation was passed late in the fourth quarter of 2017, and ongoing guidance and accounting interpretation is expected over the next 12 months, we consider the deferred tax re-measurements and other items to be incomplete due to the forthcoming guidance and our ongoing analysis of final year end data and tax positions. We expect to complete our analysis within the measurement period in accordance with SAB 118. See Note 6. “Income Taxes” for additional information.
Cash and Cash Equivalents
Cash consists of currency and demand deposits with banks. We consider all highly liquid investments with an original maturity of three months or less at the date of purchase to be cash equivalents. We maintain the majority of our cash and cash equivalents in one large national banking institution. Such amounts are in excess of federally insured limits.
84
National Vision Holdings, Inc. and Subsidiaries
Notes to Consolidated Financial Statements
1. Business and Significant Accounting Policies (continued)
We also review cash balances on a bank by bank basis to identify book overdrafts. Book overdrafts occur when the amount of outstanding checks exceed the cash deposited at a bank. We reclassify book overdrafts, if any, to accounts payable.
Accounts Receivable, Net
Accounts receivable consists primarily of credit card receivables and receivables from health care plans and programs located throughout the United States (“managed care”). Accounts receivable are reduced by allowances for amounts that may become uncollectible. Estimates of our allowance for uncollectible accounts are based on our historical and current operating, billing, and collection trends.
Receivables from managed care represents 47% of accounts receivable, net, presented in the accompanying consolidated balance sheets as of fiscal year end 2017. A relatively small number of payors comprise the majority of our managed care receivables, which potentially subjects us to concentration of credit risk. We monitor the financial condition of managed care payors and establish an allowance for doubtful accounts for balances estimated to be uncollectible.
Inventories
The cost of inventory is determined using the weighted average cost method. Inventories at retail stores are comprised of finished goods and are valued at the lower of cost or estimated net realizable value (“NRV”). Manufacturing inventories are valued using absorption accounting which includes material, labor, other variable costs, and other applicable manufacturing overhead. Inventory values are adjusted for estimated obsolescence and written down to NRV based on estimates of current and anticipated demand, customer preference, merchandise age, planned promotional activities, technology developments, market conditions, and estimates of future retail sales prices. Shrinkage is estimated and recorded throughout the period as a percentage of cost of sales based on historical results and current inventory levels. Actual shrinkage is recorded throughout the year based upon periodic physical counts. See Note 2. “Details of Certain Balance Sheet Accounts” for further details.
The Company’s inventory purchasing consists primarily of contact lenses, eyeglass frames, and unprocessed eyeglass lenses. Our inventory is supplied by a small number of key vendors. During fiscal year 2017 , three vendors supplied 94% of contact lenses, four vendors supplied 56% of frames, and two vendors provided 91% of lenses. This exposes us to concentration of vendor risk.
Prepaid Expenses and Other Current Assets
Prepaid expenses and other current assets include primarily prepaid software maintenance and licensing fees, prepaid rent, prepaid insurance, and income taxes receivable.
Deferred Financing Costs and Loan Discounts
Costs incurred in connection with long-term debt which are paid directly to the Company’s lenders and to third parties are treated as a debt discount. Loan discounts are amortized over the term of the related financing agreement and included in interest expense in the accompanying consolidated statements of operations.
Other Non-Current Assets
Other non-current assets consist primarily of our equity method investment, below market leases, security deposits associated with leased properties, and other long-term prepaid expenses.
Self-Insurance Accruals
We are primarily self-insured for workers’ compensation, employee health benefits, and general liability claims. We record self-insurance liabilities based on claims filed, including the development of those claims, and an estimate of claims incurred but not yet reported. Should a different amount of claims occur compared to what was estimated, or costs of the claims increase or decrease beyond what was anticipated, reserves may need to be adjusted accordingly. We periodically update our estimates and record such adjustments in the period in which such determination is made. Self-insurance reserves are recorded in other payables and accrued expenses (current portion) and other non-current liabilities on an undiscounted basis in the accompanying consolidated balance sheets.
We reinsure worker’s compensation and medical claims above our retention levels of $0.3 million per claim and $0.2 million per individual, respectively. Estimated recoveries from reinsurance are included in prepaid expenses and other current assets in the amounts of $0.6 million and $0.4 million (current portion) as of fiscal year end 2017 and fiscal year end 2016, respectively, and other assets in the amounts of $1.0 million and $0.7 million (non-current portion) as of fiscal year end 2017 and fiscal year end 2016, respectively, in the accompanying consolidated balance sheets. The
85
National Vision Holdings, Inc. and Subsidiaries
Notes to Consolidated Financial Statements
1. Business and Significant Accounting Policies (continued)
accrued obligation for self-insurance programs was $6.9 million and $7.2 million (current portion) and $4.6 million and $3.9 million (non-current portion) as of fiscal year end 2017 and fiscal year end 2016, respectively.
Derivative Financial Instruments
The Company uses interest rate swaps to manage its exposure to adverse fluctuations in interest rates by converting a portion of our debt portfolio from a floating rate to a fixed rate. We designate our interest rate swaps as cash flow hedges and formally document our hedge relationships, including identification of the hedging instruments and the hedged items, as well as our risk management objectives and strategies for undertaking the hedge transactions. We record all interest rate swaps in our consolidated balance sheets on a gross basis at fair value. We do not hold or enter into financial instruments for trading or speculative purposes.
The gain or loss resulting from fair value adjustments on cash flow hedges are recorded in accumulated other comprehensive loss (“AOCL”) in the accompanying consolidated balance sheets until the hedged item is recognized as interest expense in the consolidated statements of operations. We perform periodic assessments of the effectiveness of our derivative contracts designated as hedges, including the possibility of counterparty default.
To manage credit risk associated with our interest rate hedging program, we select counterparties based on their credit ratings and limit our exposure to any single counterparty. The counterparties to our derivative contracts are major domestic financial institutions with investment grade credit ratings. We periodically monitor the credit risk of our counterparties and adjust our hedging position as appropriate. The impact of credit risk, as well as the ability of each party to fulfill its obligations under our derivative financial instruments, is considered in determining the fair value of the contracts. Credit risk has not had a significant effect on the fair value of our derivative instruments. We do not have any credit risk-related contingent features or collateral requirements associated with our derivative contracts. See Note 7. “Interest Rate Derivatives” for further details.
Accumulated Other Comprehensive Loss
AOCL is defined as the change in equity of a business enterprise during a period from transactions and other events and circumstances from non-owner sources. Accumulated other comprehensive loss, net of income tax, is entirely comprised of the cumulative change in the fair value of our hedging instruments. See Note 15. “Accumulated Other Comprehensive Loss” for further details of reclassifications out of AOCL.
Correction of an Error
During the first quarter of 2017, we identified an error in our previously issued 2016 consolidated financial statements related to contact lens inventories that were expired or expiring and could not be sold as of December 31, 2016. Fiscal year 2016 costs applicable to revenue (products) was understated by $2.1 million, and net income was overstated by $1.3 million. We corrected the error in the second quarter of fiscal year 2017. We concluded that the error was not material to the 2016 or the 2017 consolidated financial statements.
Recently Issued Accounting Pronouncements
In May 2014, the Financial Accounting Standards Board (“FASB”) issued ASU No. 2014-09, Revenue from Contracts with Customers. ASU No. 2014-09 provides new guidance related to the core principle that an entity recognizes revenue to depict the transfer of promised goods or services to customers in an amount that reflects the consideration to which the entity expects to be entitled in exchange for those goods or services. The FASB issued additional ASUs to clarify certain aspects of ASU No. 2014-09, including ASU No. 2016-08, Principal versus Agent Considerations (Reporting Revenue Gross versus Net) in March 2016, and ASU No. 2016-10, Identifying Performance Obligations and Licensing in April 2016. This new guidance is effective for fiscal years beginning after December 15, 2017, and interim reporting periods within that fiscal year. The Company will adopt this new guidance in the first quarter of 2018 using the modified retrospective method.
The majority of our revenue arrangements generally consist of a single performance obligation to transfer promised goods or services. Based on our evaluation process and review of our contracts with customers, the timing and amount of revenue recognized under the new guidance for those single performance obligation arrangements will be consistent with our current revenue recognition policy. Those revenues will be recognized at a point in time either at the point of sale or upon delivery and customer acceptance.
The remaining revenues are recognized over time, including product protection plans (i.e. warranties), eye care club memberships, and HMO memberships. Under current guidance, we recognize revenue ratably on a straight-line basis over the contract period for these programs. Under the new guidance we expect the timing of revenue recognition for
86
National Vision Holdings, Inc. and Subsidiaries
Notes to Consolidated Financial Statements
1. Business and Significant Accounting Policies (continued)
membership programs to be accelerated since a significant amount of the membership services are transferred to the customer early in the contract period. Membership programs comprise approximately 3% of our consolidated net revenue. Absent a significant increase or decrease in the number of memberships sold each period, this change is not expected to have a significant impact on our on-going consolidated results of operations.
Under the modified retrospective transition method, periods prior to the date of adoption are not retrospectively revised, but a cumulative effect of adoption will be recognized for the impact on uncompleted contracts at the date of adoption.
In preparation of adopting this new guidance, we have implemented the necessary changes to our business processes, systems and controls to support recognition and disclosure upon adoption on December 31, 2017, which is the first day of our fiscal year 2018. We drafted our accounting policy for this new guidance based on a detailed review of our business and contracts. Except for the earlier recognition of revenue related to our membership programs, we do not currently expect that the adoption of the new guidance will have a material impact on our revenues, results of operations or financial position. We expect to make additional disclosures related to the nature, amount, timing and uncertainty of revenue and cash flows arising from contracts with customers as required by the new guidance.
In February 2016, the FASB issued ASU No. 2016-02, Leases. This new guidance establishes a right-of-use (“ROU”) model that requires a lessee to record a ROU asset and a lease liability on the balance sheet for all leases with terms longer than 12 months. Leases will be classified as either financing or operating, with such classification affecting the pattern of expense recognition in the statement of operations. This new guidance is effective for fiscal years beginning after December 15, 2018, and interim reporting periods within that fiscal year. The guidance allows a cumulative transition approach in adjusting the opening balance of retained earnings. The Company will adopt this new guidance in the first quarter of 2019. We expect that adoption will have a material impact on the Company’s total assets and liabilities since we have a significant number of operating leases not currently recognized on our consolidated balance sheets.
In April 2016, the FASB issued ASU No. 2016-09, Improvements to Employee Share-Based Payment Accounting. This new guidance simplifies the accounting for share-based payment transactions, including income tax consequences, classification of certain items on the statement of cash flows, forfeitures, and minimum statutory withholding requirements. We adopted this new guidance in the first quarter of 2017. The adoption of this new guidance did not have a material effect on the Company’s financial condition, results of operations, or cash flows.
In January 2017, the FASB issued ASU No. 2017-04, Intangibles - Goodwill and Other. This new guidance removes Step 2 of the goodwill impairment test. A goodwill impairment will now be the amount by which a reporting unit’s carrying value exceeds its fair value, not to exceed the carrying amount of goodwill. We adopted this new guidance during the first quarter of 2017. The adoption of this new guidance did not have a material effect on the Company’s financial condition, results of operations, or cash flows.
In August 2017, the FASB issued ASU No. 2017-12, Derivatives and Hedging: Targeted Improvements to Accounting for Hedging Activities. This new guidance better aligns an entity’s risk management activities and financial reporting for hedging relationships through changes to both the designation and measurement guidance for qualifying hedging relationships and the presentation of hedge results. Under the new guidance, the application of hedge accounting is simplified. Specifically, the guidance eliminates the requirement to separately measure and report hedge ineffectiveness. For cash flow hedges, the entire change in the fair value of the hedging instrument included in the assessment of hedge effectiveness will be recorded in AOCL and will be reclassified to earnings in the same income statement line item that is used to present the earnings effect of the hedged item when the hedged item affects earnings. We adopted this new guidance during fiscal year 2017. The adoption of this new guidance did not have a material effect on the Company’s financial condition, results of operations, or cash flows.
87
National Vision Holdings, Inc. and Subsidiaries
Notes to Consolidated Financial Statements
2. Details of Certain Balance Sheet Accounts
In thousands | As of December 30, 2017 | As of December 31, 2016 | |||||
Accounts receivable, net: | |||||||
Trade receivables | $ | 28,862 | $ | 20,817 | |||
Credit card receivables | 10,459 | 9,398 | |||||
Tenant improvement allowances receivable | 4,794 | 3,308 | |||||
Other receivables | 2,936 | 2,430 | |||||
Allowance for uncollectible accounts | (3,858 | ) | (1,583 | ) | |||
$ | 43,193 | $ | 34,370 | ||||
Inventories: | |||||||
Raw materials and work in process (1) | $ | 43,953 | $ | 42,266 | |||
Finished goods | 47,198 | 44,798 | |||||
$ | 91,151 | $ | 87,064 | ||||
(1) Due to the immaterial amount of estimated work in process and the short lead times for the conversion of raw materials to finished goods, the Company does not separately present raw materials and work in process. | |||||||
Property and equipment, net: | |||||||
Land and building | $ | 3,608 | $ | 3,607 | |||
Equipment | 220,088 | 161,714 | |||||
Furniture and fixtures | 42,708 | 36,046 | |||||
Leasehold improvements | 155,369 | 121,963 | |||||
Construction in progress | 18,375 | 28,099 | |||||
Property under capital leases | 11,756 | 3,244 | |||||
451,904 | 354,673 | ||||||
Less accumulated depreciation | 147,772 | 98,259 | |||||
$ | 304,132 | $ | 256,414 | ||||
88
National Vision Holdings, Inc. and Subsidiaries
Notes to Consolidated Financial Statements
2. Details of Certain Balance Sheet Accounts (continued)
In thousands | As of December 30, 2017 | As of December 31, 2016 | |||||
Other payables and accrued expenses: | |||||||
Employee compensation and benefits | $ | 21,134 | $ | 19,009 | |||
Self-insurance reserves | 6,854 | 7,209 | |||||
Capital expenditures | 10,782 | 9,202 | |||||
Advertising | 2,900 | 1,058 | |||||
Reserves for customer returns and remakes | 4,565 | 4,611 | |||||
Legacy management and services agreement | 6,000 | 4,591 | |||||
Fair value of derivative liabilities | 6,969 | 8,218 | |||||
Rental expenses | 1,140 | 2,172 | |||||
Sales and use taxes | 1,218 | 954 | |||||
Amounts payable to charitable organizations | 1,000 | 1,000 | |||||
Supplies and other store support expenses | 3,014 | 3,489 | |||||
Litigation settlements | 3,942 | 422 | |||||
Other | 8,093 | 7,467 | |||||
$ | 77,611 | $ | 69,402 | ||||
Other non-current liabilities: | |||||||
Fair value of derivative liabilities | $ | 9,155 | $ | 15,518 | |||
Tenant improvements (2) | 22,894 | 21,089 | |||||
Deferred rental expenses | 7,246 | 6,256 | |||||
Other | 6,749 | 7,634 | |||||
$ | 46,044 | $ | 50,497 | ||||
(2) Obligations for tenant improvements are amortized as a reduction of rental expense over the life of the respective leases. | |||||||
3. Goodwill and Intangible Assets
No goodwill impairment was identified during fiscal year 2017. Fair value exceeded carrying value by a substantial margin (in excess of 75%) for each reporting unit except Fred Meyer, to which fair value exceeded carrying value by 5.0%. Fred Meyer goodwill comprises less than 5.0% of total consolidated goodwill. A goodwill impairment of $3.3 million and $4.8 million was identified at the AC Lens reporting unit for fiscal year 2016 and 2015, respectively, as a result of performing our annual impairment tests. The primary reason for the impairment charges in each year was due to competitive pressure in the e-commerce contact lens business. As of fiscal year end 2016, there was no remaining goodwill at the AC Lens reporting unit.
No impairment of indefinite-lived or definite-lived intangible assets was identified during fiscal year 2017. We recorded impairment of $1.3 million in definite-lived intangible assets and $1.2 million in P&E during fiscal year 2016 at AC Lens. There was no remaining fair value of definite-lived intangible assets after the impairment charges, and the remaining fair value of the P&E was $0.3 million.
The following table presents the changes in the carrying amount of our goodwill during fiscal year 2015, fiscal year 2016, and fiscal year 2017:
89
National Vision Holdings, Inc. and Subsidiaries
Notes to Consolidated Financial Statements
3. Goodwill and Intangible Assets (continued)
Balance as of January 2, 2016 | In thousands | ||
Goodwill | $ | 805,562 | |
Accumulated impairment losses | (8,989 | ) | |
Subtotal | 796,573 | ||
Balance as of December 31, 2016 | |||
Goodwill | 805,562 | ||
Accumulated impairment losses | (12,333 | ) | |
Subtotal | 793,229 | ||
Balance as of December 30, 2017 | |||
Goodwill | 805,562 | ||
Other | (485 | ) | |
Total gross goodwill | 805,077 | ||
Accumulated impairment losses | (12,333 | ) | |
Subtotal | $ | 792,744 | |
Goodwill in our reportable segments (see Note 14. “Segment Reporting”) as of the fiscal year end 2017 is as follows:
In thousands | Owned & Host Segment | Legacy Segment | Corporate/Other | Total | |||||||||||
Gross goodwill | $ | 736,901 | $ | 60,069 | $ | 8,107 | $ | 805,077 | |||||||
Accumulated impairment | (4,226 | ) | — | (8,107 | ) | (12,333 | ) | ||||||||
Goodwill as of December 30, 2017 | $ | 732,675 | $ | 60,069 | $ | — | $ | 792,744 | |||||||
Indefinite-lived, non-amortizing intangible assets by major asset class are as follows:
In thousands | As of December 30, 2017 | As of December 31, 2016 | |||||
Trademarks and tradenames: | |||||||
America's Best Contacts and Eyeglasses | $ | 200,547 | $ | 200,547 | |||
Eyeglass World | 40,000 | 40,000 | |||||
$ | 240,547 | $ | 240,547 | ||||
Definite-lived, amortizing intangible assets by major asset class are as follows:
As of December 30, 2017 | As of December 31, 2016 | ||||||||||||||||||
In thousands | Gross Carrying Amount | Accumulated Amortization | Remaining Life (Years) | Gross Carrying Amount | Accumulated Amortization | Remaining Life (Years) | |||||||||||||
Contracts and relationships: | |||||||||||||||||||
Legacy | $ | 65,000 | $ | 22,470 | 7 | $ | 65,000 | $ | 16,582 | 8 | |||||||||
Fred Meyer | 35,000 | 5,787 | 19 | 35,000 | 4,271 | 20 | |||||||||||||
Customer database | 4,400 | 3,347 | 1 | 4,400 | 2,470 | 2 | |||||||||||||
Other | 738 | 631 | 1 | 738 | 477 | 1 - 2 | |||||||||||||
$ | 105,138 | $ | 32,235 | $ | 105,138 | $ | 23,800 | ||||||||||||
90
National Vision Holdings, Inc. and Subsidiaries
Notes to Consolidated Financial Statements
3. Goodwill and Intangible Assets (continued)
Aggregate amortization expense is included in depreciation and amortization in the accompanying consolidated statements of operations. Aggregate future estimated amortization expense is shown in the following table:
Fiscal Year | In thousands | |||
2018 | $ | 8,371 | ||
2019 | 7,598 | |||
2020 | 7,547 | |||
2021 | 7,405 | |||
2022 | 7,405 | |||
Thereafter | 34,577 | |||
$ | 72,903 | |||
4. Long-term Debt
Long-term debt consists of the following:
In thousands | As of December 30, 2017 | As of December 31, 2016 | |||||
First lien term loans, due November 20, 2024 | $ | 568,575 | $ | 633,598 | |||
Second lien term loans | — | 125,000 | |||||
Term loans before unamortized discount | 568,575 | 758,598 | |||||
Unamortized discount | (11,322 | ) | (15,661 | ) | |||
Total term loans | 557,253 | 742,937 | |||||
Less current maturities | (5,700 | ) | (6,515 | ) | |||
Term loans - non-current portion | 551,553 | 736,422 | |||||
Capitalized lease obligations | 11,985 | 2,688 | |||||
Less current maturities | (1,558 | ) | (770 | ) | |||
Long-term debt, less current portion and unamortized debt discount | $ | 561,980 | $ | 738,340 | |||
The Company used proceeds from the IPO to repay $125.0 million in outstanding aggregate amount of our second lien term loans, $235.0 million in outstanding amount of our first lien term loans, and accrued and unpaid interest thereon.
The dividend discussed in Note 8. “Related Party Transactions” was funded with $175.0 million in borrowed funds under the Company’s first lien credit agreement which was then repaid with IPO proceeds, as discussed in Note 1. “Description of Business and Basis of Presentation.”
Scheduled annual maturities of debt are as follows:
Fiscal Year | In thousands | |||
2018 | $ | 5,700 | ||
2019 | 5,700 | |||
2020 | 5,700 | |||
2021 | 5,700 | |||
2022 | 5,700 | |||
Thereafter | 540,075 | |||
$ | 568,575 | |||
First Lien Credit Agreement - Joinder and Amendment Agreement
On October 30, 2017 and November 20, 2017, the credit agreement dated as of March 13, 2014, among Nautilus Acquisition Holdings, Inc., a wholly-owned subsidiary of the Company, NVI, as borrower, Goldman Sachs Bank USA, as administrative agent, collateral agent, swingline lender and letter of credit issuer, and the lenders from time to time
91
National Vision Holdings, Inc. and Subsidiaries
Notes to Consolidated Financial Statements
4. Long-term Debt (continued)
party thereto and the other parties thereto (the “first lien credit agreement”) was amended pursuant to joinder and amendment agreements (the “Amendments”) to (a) establish new first lien term loans in an aggregate principal amount of $570.0 million to refinance all of the first lien term loans outstanding immediately prior to the amendment, (b) extend the maturity of such term loans to November 24, 2024 and (c) reprice the rates applicable to such term loans by amending the definitions of ABR, Applicable Margin and LIBOR Rate (each, as defined in the first lien credit agreement). Pursuant to the Amendments, the initial new Applicable Margins are (i) 2.75% for the new first lien term loans that are LIBOR Loans (as defined in the first lien credit agreement), which is 25 basis points lower than the previous interest rate margin and (ii) 1.75% for the new first lien term loans that are ABR Loans (as defined in the first lien credit agreement), which is 25 basis points lower than the previous interest rate margin. The Amendments further provide that the above Applicable Margins for the new term loans will be based on NVI’s public corporate credit rating from Moody’s as follows: (i) if NVI’s rating is lower than Ba3 (stable), the Applicable Margin will be 2.75% for LIBOR Loans and 1.75% for ABR Loans and (ii) if NVI’s rating is Ba3 (stable) or better, the Applicable Margin will step down to 2.50% for LIBOR Loans and 1.5% for ABR Loans, as specified in the Amendments.
The principal under the first lien credit agreement is payable in equal installments of $1.4 million on the last business day of each of our fiscal quarters. We are required to prepay an amount equal to 50% of the preceding fiscal year’s excess cash flow, as defined in the agreement. The required prepayment is reduced to 25% of the preceding year’s excess cash flow if our consolidated earnings before interest, tax, depreciation and amortization (“Credit Agreement EBITDA”) ratio, as defined in the agreement, is less than or equal to 4.25 to 1.00. No prepayment is required if such ratio is less than or equal to 4.00 to 1.00. We have not been required to make a prepayment related to our current first lien credit agreement.
The first lien credit agreement contains covenants that limit our ability to incur additional debt, create liens against our assets, make acquisitions, pay dividends or distributions on our stock, merge or consolidate with another entity, and transfer or sell assets.
Revolving Credit Facility - Joinder and Amendment Agreement
The first lien credit agreement provides for a revolving credit facility which was amended in October 2017 pursuant to a joinder and amendment agreement to (a) increase the size of the credit facility from $75.0 million to $100.0 million and (b) extend the maturity of such facility to October 15, 2022.
Amounts borrowed under the revolving credit facility bear interest, at our election, at either 2.0% over ABR or 3.0% over LIBOR. These interest rate spreads will decline to 1.75% and 2.75%, respectively, if our Credit Agreement EBITDA ratio declines to 4.25 to 1.00 or less, and the spreads will further decline to 1.50% and 2.50%, respectively, if such ratio declines to 3.75 to 1.00 or less. We may use up to $20.0 million of the revolving credit facility to issue letters of credit. Letter of credit fees accrue at the same rate as the then-applicable LIBOR spread. Our credit agreement also provides that, if aggregate borrowings (inclusive of certain letters of credit) under our revolving credit facility exceed 30% of the total revolving commitment, the ratio of debt under our first lien credit agreement to Credit Agreement EBITDA may not, on the last day of the applicable measurement period, exceed 7.75 to 1.00.
92
National Vision Holdings, Inc. and Subsidiaries
Notes to Consolidated Financial Statements
4. Long-term Debt (continued)
Capital Leases
Our obligations under capital leases are included in the consolidated balance sheets as long-term debt, less current portion and debt discount (non-current portion) and current maturities of long-term debt (current portion). Future minimum lease payments required under our capital leases as of fiscal year end 2017 are as follows:
Fiscal Year | In thousands | ||||
2018 | $ | 2,760 | |||
2019 | 2,297 | ||||
2020 | 1,993 | ||||
2021 | 1,876 | ||||
2022 | 1,791 | ||||
Thereafter | 7,461 | ||||
Total minimum lease payments | 18,178 | ||||
Less: Amount representing interest | (6,193 | ) | |||
Present value of net minimum lease payments | 11,985 | ||||
Less: Current maturities of capital lease obligations | (1,558 | ) | |||
Capital lease obligations - non-current portion | $ | 10,427 | |||
5. Stock Incentive Plans
2014 Stock Incentive Plan
In 2014, our Board of Directors and stockholders of the Company approved the 2014 Stock Incentive Plan for Key Employees of National Vision Holdings, Inc. (formerly known as Nautilus Parent, Inc.) and its Subsidiaries (the “2014 Stock Incentive Plan”). Only stock options to purchase common stock of NVHI have been granted under the 2014 Stock Incentive Plan. The Board of Directors determined the exercise price of service-based and performance-based options on the basis of the fair value of the common stock as of the grant date. Due to the limited number of participants in the plan and high levels of retention among participants, forfeitures of outstanding service-based options are not expected to be material. Therefore, all service-based options outstanding at fiscal year end 2017 are expected to vest.
There are 10,988,827 stock options available for issuance pursuant to the 2014 Stock Incentive Plan, of which 10,347,067 are issued and outstanding, and 69,452 are authorized but unissued as of fiscal year end 2017.
Vesting of performance-based options is conditional upon the achievement by KKR Sponsor, with respect to its investment in the Company, of both a minimum internal rate of return and a minimum multiple of invested capital and then increases proportionally as the multiple of invested capital increases up to a defined target. No compensation expense has been recorded relating to performance based options since achievement of vesting conditions has not been deemed to be probable as of the fiscal years ended 2017, 2016 and 2015.
The following presents a roll-forward of performance-based options:
Outstanding options at January 3, 2015 | 5,135,945 | |
Granted | 544,032 | |
Forfeited | (62,032 | ) |
Outstanding options at January 2, 2016 | 5,617,945 | |
Granted | 396,690 | |
Forfeited | (249,479 | ) |
Outstanding options at December 31, 2016 | 5,765,156 | |
Granted | 758,996 | |
Forfeited | — | |
Outstanding options at December 30, 2017 | 6,524,152 | |
93
National Vision Holdings, Inc. and Subsidiaries
Notes to Consolidated Financial Statements
5. Stock Incentive Plan (continued)
Compensation expense associated with service-based stock options is included in SG&A in the accompanying consolidated statements of operations. Service-based options have a contractual maturity of 10 years. The following table summarizes service-based stock option activity during the fiscal years ended 2017, 2016 and 2015 (amounts reflect the effects of modifications to exercise prices resulting from the recapitalization dividend discussed in Note 8. “Related Party Transactions”):
Number of Options Outstanding | Weighted Average Exercise Price ($) | Weighted Average Remaining Contractual Life (Years) | Aggregate Intrinsic Value (In Thousands) | ||||||||
Outstanding options at January 3, 2015 | 3,423,962 | 9.83 | |||||||||
Granted | 362,688 | 8.20 | |||||||||
Exercised | (211,891 | ) | 8.22 | ||||||||
Forfeited | (41,354 | ) | 8.22 | ||||||||
Outstanding options at January 2, 2016 | 3,533,405 | 7.45 | |||||||||
Granted | 264,460 | 13.80 | |||||||||
Exercised | (142,402 | ) | 7.31 | ||||||||
Repurchased | (22,333 | ) | 7.41 | ||||||||
Forfeited | (104,605 | ) | 7.24 | ||||||||
Outstanding options at December 31, 2016 | 3,528,525 | 7.94 | |||||||||
Granted | 505,958 | 15.34 | |||||||||
Exercised | (211,568 | ) | 5.16 | ||||||||
Outstanding options at December 30, 2017 | 3,822,915 | 7.22 | 6.96 | $ | 127,641 | ||||||
Vested and exercisable at December 30, 2017 | 1,631,023 | 6.75 | 6.42 | $ | 55,229 | ||||||
Substantially all service-based options vest in 20% annual increments on each of the first five anniversaries of the grant date. The Company has selected an accelerated method of recording compensation expense associated with service-based options, whereby the total grant-date fair value of the awards is amortized 46%, 25%, 16%, 9%, and 4% for years one through five, respectively.
The fair value of service-based stock option grants was estimated at the grant date using the Black-Scholes-Merton option pricing model. The following assumptions were used in our estimate:
Fiscal Year 2017 | Fiscal Year 2016 | ||||
Expected term | 6.5 years | 6.5 years | |||
Expected volatility | 60.4 | % | 60.4 | % | |
Risk-free interest rate | 2.0 | % | 1.6% to 2.0% | ||
Dividend yield | — | % | — | % | |
The expected term was based on the mid-point between the weighted average time to vesting and the contractual time to maturity. Since all options granted in the 2014 Stock Incentive Plan were issued prior to the IPO, expected volatility was based on the volatility of comparable publicly traded companies. The risk-free interest rate was based on the U.S. Treasury yield curve. The dividend yield was based on our expectation of not paying dividends on the common stock of NVHI for the foreseeable future.
94
National Vision Holdings, Inc. and Subsidiaries
Notes to Consolidated Financial Statements
5. Stock Incentive Plan (continued)
The following table summarizes information about the 2014 Stock Incentive Plan service-based options outstanding as of fiscal year end 2017:
Grants During: | Weighted Average Grant Date Fair Value | Options Granted | Aggregate Grant Date Fair Value (In Thousands) | Remaining Unrecognized Service Cost (In Thousands) | Remaining Requisite Service Period (Years) | Non-Vested Options Outstanding | Fair Value Of Options Vested (In Thousands) | ||||||||||||||||
Fiscal Year 2015 | $ | 5.63 | 362,688 | $ | 2,043 | $ | 386 | 2.70 | 187,796 | $ | 894 | ||||||||||||
Fiscal Year 2016 | $ | 8.58 | 264,460 | $ | 2,270 | $ | 1,125 | 3.81 | 211,568 | $ | 454 | ||||||||||||
Fiscal Year 2017 | $ | 9.01 | 505,958 | $ | 4,559 | $ | 3,579 | 4.53 | 505,958 | $ | — | ||||||||||||
The aggregate intrinsic value of service-based options exercised was $1.5 million for the fiscal year ended December 30, 2017 and $0.3 million for the fiscal year ended December 31, 2016.
Vision Holding Corp. Amended and Restated 2013 Equity Incentive Plan
As of fiscal year end 2017, there were 169,049 options to purchase common shares of NVHI vested and outstanding under the Vision Holding Corp. Amended and Restated 2013 Equity Incentive Plan, at a weighted average exercise price of $1.66.
2017 Omnibus Incentive Plan
In connection with the IPO, on October 23, 2017 the Company’s Board of Directors adopted, and its stockholders approved, the National Vision Holdings, Inc. 2017 Omnibus Incentive Plan (the “2017 Omnibus Incentive Plan”). The total number of shares of common stock that may be issued under the plan is 4,000,000. Under the plan, we may grant stock options, stock appreciation rights, restricted stock, restricted stock units, other equity-based awards and other cash-based awards to our employees, directors, officers, consultants and advisers.
Effective October 25, 2017, we granted stock options to purchase 92,443 shares of our common stock at an exercise price of $22.00 per share to an employee under the 2017 Omnibus Incentive Plan. The fair value of the award was $0.8 million on the grant date, with three year vesting. As of fiscal year-end 2017, none of the options had vested, the remaining contractual life was 9.82 years, the intrinsic value of the award was $1.7 million, the remaining unrecognized service cost was $0.8 million, and the remaining requisite service period was 2.82 years.
Effective October 26, 2017, we granted an aggregate of 182,138 restricted stock units, net of forfeitures, to certain employees under the 2017 Omnibus Incentive Plan. Restricted stock units of 59,800 vest in two equal installments on the first and second anniversaries of the grant date, and 122,338 restricted stock units vest in three equal installments on the first, second and third anniversaries of the grant date. The fair value of the awards on the grant date were $1.3 million and $2.7 million for the two and three year awards, respectively. The remaining unrecognized service cost was $1.2 million and $2.5 million for the two and three year awards, respectively. The remaining requisite service period was 1.82 years and 2.82 years for the two and three year awards, respectively.
6. Income Taxes
The income tax (benefit) provision consists of:
95
National Vision Holdings, Inc. and Subsidiaries
Notes to Consolidated Financial Statements
6. Income Taxes (continued)
In thousands | Fiscal Year 2017 | Fiscal Year 2016 | Fiscal Year 2015 | ||||||||
Current income tax: | |||||||||||
Federal | $ | 5 | $ | 51 | $ | 38 | |||||
State | 1,082 | 1,302 | 202 | ||||||||
Deferred income tax: | |||||||||||
Federal | (40,044 | ) | 10,058 | 1,360 | |||||||
State | 310 | 1,123 | 168 | ||||||||
Income tax (benefit) provision | $ | (38,647 | ) | $ | 12,534 | $ | 1,768 | ||||
Our income tax (benefit) provision differs from the amounts computed by multiplying earnings before income taxes by the statutory federal income tax rate as shown in the following table:
In thousands | Fiscal Year 2017 | Fiscal Year 2016 | Fiscal Year 2015 | ||||||||
Federal income tax provision at statutory rate of 35% | $ | 2,511 | $ | 9,552 | $ | 1,885 | |||||
State income tax provision, net of federal income tax | 273 | 1,058 | 211 | ||||||||
Increase (decrease) in deferred tax asset valuation allowance | 769 | 979 | (497 | ) | |||||||
Benefit of tax legislation | (42,965 | ) | — | — | |||||||
Other, net | 765 | 945 | 169 | ||||||||
Net income tax (benefit) provision | $ | (38,647 | ) | $ | 12,534 | $ | 1,768 | ||||
Effective income tax rate | (538.8 | )% | 45.9 | % | 32.8 | % | |||||
The Tax Legislation signed into law on December 22, 2017 makes broad and complex changes to the U.S. tax code including, but not limited to: (1) reducing the U.S. federal rate from 35% to 21%, effective January 1, 2018; (2) eliminating the corporate alternative minimum tax (“AMT”) and changing how the credits can be realized; (3) creating new limitations on deductions for interest expense; (4) changing rules related to limitations of net operating loss (“NOL”) carryforwards, and (5) enhancing and extending through 2026 the option to claim accelerated depreciation deductions on qualified property.
The effects of new legislation are required to be recognized upon enactment. Accordingly, recognition of the tax effects of the legislation is required in the annual period that includes December 22, 2017. The Company recorded a tax benefit of $43.0 million due to a re-measurement of deferred tax assets and liabilities in fiscal year 2017.
Pursuant to the guidance within SAB 118, as of December 30, 2017, the Company recognized the provisional effects of the enactment of the Tax Legislation for which measurement could be reasonably estimated. Although we continue to analyze certain aspects of the new legislation and refine our assessment, the ultimate impact of the legislation may differ from these estimates due to our continued analysis or further regulatory guidance that may be issued as a result of the legislation. Adjustments to the provisional amounts recorded by the Company as of December 30, 2017 that are identified within a subsequent measurement period of up to one year from the enactment date will be included as an adjustment to tax expense from continuing operations in the period the amounts are determined.
96
National Vision Holdings, Inc. and Subsidiaries
Notes to Consolidated Financial Statements
6. Income Taxes (continued)
The sources of the differences between the financial accounting and tax bases of our assets and liabilities that give rise to the deferred tax assets and deferred tax liabilities and the tax effects of each are as follows:
In thousands | As of December 30, 2017 | As of December 31, 2016 | |||||
Deferred tax assets: | |||||||
NOL carry-forwards | $ | 6,278 | $ | 3,195 | |||
AMT payment and employment credits | 3,741 | 2,721 | |||||
Deferred revenue | 7,643 | 10,751 | |||||
Accrued expenses and reserves | 12,934 | 15,193 | |||||
Loss on equity and cost method investments | 1,175 | 1,000 | |||||
Stock option compensation | 6,606 | 6,489 | |||||
Unrealized losses on hedging instruments | 4,130 | 9,180 | |||||
Other | 4,222 | 5,171 | |||||
Subtotal | 46,729 | 53,700 | |||||
Valuation allowances | 1,296 | 1,131 | |||||
Total net deferred tax assets | 45,433 | 52,569 | |||||
Deferred tax liabilities: | |||||||
Depreciation of property and equipment | (38,355 | ) | (41,872 | ) | |||
Amortization of intangible assets | (78,329 | ) | (120,346 | ) | |||
Other | (2,397 | ) | (1,629 | ) | |||
Total deferred tax liabilities | (119,081 | ) | (163,847 | ) | |||
Net deferred tax liabilities | $ | (73,648 | ) | $ | (111,278 | ) | |
As of fiscal year end 2017, we had available U.S. federal NOL carry-forwards aggregating to $26.1 million that can be utilized to reduce future federal income taxes. If not utilized, $5.1 million, $3.3 million and $17.7 million of these carry-forward losses expire at the end of fiscal year 2020, fiscal year 2033 and fiscal year 2037, respectively. In addition, we have NOL carry-forwards in varying amounts and with varying expiration dates in various states in which we operate. We believe it is more-likely-than-not that we will realize a tax benefit for these NOL’s in the future.
As of fiscal year end 2017, we also have non-expiring federal and state AMT carry-forward credits and employment credits totaling $3.7 million available to offset certain future taxes.
We have a $0.9 million deferred income tax asset for non-deductible losses that are associated with our equity method non-consolidated affiliate and a $0.3 million deferred income tax asset for capital losses associated with the impairment of a cost method investment. We do not expect to generate significant capital gains from these investments, or other sources, in the near future. Therefore, we believe it is more-likely-than-not that we will not realize a tax benefit for these deferred income tax assets, and accordingly we have established a full valuation allowance for those amounts.
As a result of our utilization of NOL carry-forwards to reduce or eliminate subsequent years’ tax obligations, our federal and a substantial number of our state income tax returns for fiscal years 2001 through 2016 remain open for examination by the tax authorities. We had no uncertain tax positions or unrecognized tax benefits as of fiscal year 2017 and fiscal year 2016.
7. Interest Rate Derivatives
The Company is party to three pay-fixed and receive-floating interest rate swap agreements to offset the variability of cash flows in LIBOR-indexed debt interest payments, subject to a 1.0% floor, attributable to changes in the benchmark interest rate from March 13, 2017 to March 13, 2021 related to its current first lien credit agreement. The fixed rates associated with the first derivative (“Derivative 1”) notional amount of $175.0 million and the second derivative (“Derivative 2”) notional amount of $225.0 million were 3.4063% and 3.5125% , respectively. The fixed rate associated with the third derivative (“Derivative 3”) notional amount of $100.0 million was 2.6000%. Derivative 1 will hedge the first amount of LIBOR-based interest payments up to its applicable notional amount and Derivative 2 will hedge the
97
National Vision Holdings, Inc. and Subsidiaries
Notes to Consolidated Financial Statements
7. Interest Rate Derivatives (continued)
next amount (i.e., the first amount not already hedged by Derivative 1) up to its applicable notional amount. Derivative 3 will hedge interest payments not already hedged by Derivatives 1 and 2.
Changes in the cash flows of each derivative are expected to be highly effective in offsetting the changes in interest payments on a principal balance equal to the derivative’s notional amount, attributable to the hedged risk.
Our cash flow hedge position related to interest rate derivative contracts is as follows:
In thousands | Notional Amount | Final Maturity Date | Other Payables and Accrued Expenses | Other Liabilities | AOCL, Net of Tax | ||||||||||||
As of December 31, 2016 | $ | 500,000 | March 2021 | $ | 8,218 | $ | 15,518 | $ | 14,556 | ||||||||
As of December 30, 2017 | $ | 500,000 | March 2021 | $ | 6,969 | $ | 9,155 | $ | 9,868 | ||||||||
As of December 30, 2017, the Company expects to reclassify $7.0 million of AOCL into earnings in the next 12 months. See Note 15. “Accumulated Other Comprehensive Loss” for further detail regarding AOCL.
8. Related Party Transactions
Transactions With Equity Sponsors
Under certain agreements we have entered into with our equity sponsors, we recorded the following expenses:
In thousands | Fiscal Year 2017 | Fiscal Year 2016 | Fiscal Year 2015 | ||||||||
KKR Sponsor | $ | 7,259 | $ | 851 | $ | 3,533 | |||||
Berkshire | $ | 955 | $ | 199 | $ | 194 | |||||
Fees paid to equity sponsors include retainer fees and certain other on-going project-oriented initiatives and are presented in SG&A in the accompanying consolidated statements of operations, except KKR Sponsor fees during the fiscal year 2017 include $2.3 million presented in debt issuance costs. Fiscal year 2017 expenses also include the monitoring agreement termination fee discussed in Note 1. “Description of Business and Basis of Presentation.”
Dividend & Stockholders’ Equity
On February 2, 2017, the Company declared a recapitalization dividend to its stockholders. Common stockholders received a dividend per common share of $1.51. There were 110.5 million common shares outstanding and eligible for the dividend. Vested and roll-over option holders received an additional cash payment of $1.51 per option, for an aggregate payment of $3.7 million. The income tax benefit of the additional cash payment was $1.4 million. The exercise price of unvested options was reduced by $1.51 per option. Since the Company was in an accumulated deficit position on the date of declaration, according to our accounting policy the combined total cash payment of $171.0 million was recorded as a reduction to additional paid-in capital in the accompanying consolidated balance sheet.
9. Equity in Net Assets of Non-Consolidated Affiliates
From time to time the Company invests in technological innovators across the optical retail industry. One of these investments is a nonconsolidated affiliate (the “affiliate”) in which an equity ownership interest is maintained and for which the equity method of accounting is used due to our ability to exert significant influence over decisions relating to the affiliate’s operating and financial affairs. We hold a 28% equity interest in the affiliate as of fiscal year end 2017.
Revenues and expenses of the affiliate are not consolidated into our financial statements; rather, our proportionate share of the earnings or losses of the affiliate is reflected as equity income or loss in other expense, net in our consolidated statements of operations. We have determined that we should not consolidate our affiliate because, although it is a variable interest entity, we are not the primary beneficiary. After adjusting the carrying value of our interest in the affiliate’s reported net losses, our investment balance in the business was $2.3 million and $3.3 million at the end of fiscal years 2017 and 2016, respectively, which is included in other assets in the accompanying consolidated balance sheets.
98
National Vision Holdings, Inc. and Subsidiaries
Notes to Consolidated Financial Statements
9. Equity in Net Assets of Non-Consolidated Affiliates (continued)
The Company's fiscal year end for 2017 was December 30, 2017. Our affiliate's year-end date was December 31, 2017. The Company's fiscal year end for 2015 was January 2, 2016. Our affiliate's year-end date was December 31, 2015. No material transactions occurred on December 31, 2017 or from January 1, 2016 to January 2, 2016 requiring adjustment to the our affiliate's or our results as presented in the tables below.
Summarized balance sheet information for our affiliate is as follows:
In thousands | As of December 30, 2017 | As of December 31, 2016 | |||||
Current assets | $ | 2,407 | $ | 1,610 | |||
Non-current assets | 557 | 718 | |||||
Total assets | 2,964 | 2,328 | |||||
Current liabilities | 1,046 | 1,018 | |||||
Non-current liabilities | 3,000 | — | |||||
Total liabilities | 4,046 | 1,018 | |||||
Net assets | $ | (1,082 | ) | $ | 1,310 | ||
Summarized income statement information for our affiliate is as follows:
In thousands | Fiscal Year 2017 | Fiscal Year 2016 | Fiscal Year 2015 | ||||||||
Revenues | $ | 6,244 | $ | 5,847 | $ | 1,910 | |||||
Net loss | $ | (3,433 | ) | $ | (4,153 | ) | $ | (3,233 | ) | ||
National Vision’s share of net loss | $ | (1,001 | ) | $ | (1,370 | ) | $ | (896 | ) | ||
In the ordinary course of business we are a licensee of our affiliate. Additionally, on August 29, 2017, the affiliate issued a secured convertible promissory note to the Company, in the principal amount of $1.5 million, due on August 29, 2020. The note bears interest at a fixed rate of 5.00% with an additional variable interest component based on the base rate of the Bank of England, as published on the first day of each calendar year, which is 0.25% for 2017.
Transactions with our non-consolidated affiliate included in our consolidated statements of operations and balance sheets were as follows:
In thousands | Fiscal Year 2017 | Fiscal Year 2016 | Fiscal Year 2015 | ||||||||
Statements of operations | |||||||||||
Licensing fees (SG&A) | $ | 955 | $ | 987 | $ | 1,061 | |||||
As of December 30, 2017 | As of December 31, 2016 | ||||||||||
Balance sheets | |||||||||||
Prepaid expenses and other current assets | $ | 172 | $ | 172 | |||||||
Other assets (1) | $ | 1,518 | $ | — | |||||||
____________
(1) | Other assets include loan receivable and accrued interest receivable of $1.5 million and $18.0 thousand, respectively as of December 30, 2017. |
99
National Vision Holdings, Inc. and Subsidiaries
Notes to Consolidated Financial Statements
10. Fair Value Measurement of Financial Assets and Liabilities
The Company uses a fair value hierarchy that is intended to increase consistency and comparability in fair value measurements and related disclosures. The fair value hierarchy is based on inputs to valuation techniques that are used to measure fair value that are either observable or unobservable. Observable inputs reflect assumptions market participants would use in pricing an asset or liability based on market data obtained from independent sources while unobservable inputs reflect a reporting entity’s pricing based upon its own market assumptions.
Under U.S. GAAP, the Company is required to, a) measure certain assets and liabilities at fair value or, b) disclose the fair values of certain assets and liabilities recorded at cost. Accounting standards define fair value as the price that would be received upon sale of an asset or paid upon transfer of a liability in an orderly transaction between market participants at the measurement date. Fair value is estimated assuming the transaction occurs in the principal or most advantageous market for the asset or liability and includes consideration of non-performance risk and credit risk of both parties. A three-tier fair value hierarchy prioritizes the inputs used in measuring fair value. These tiers include:
• | Level 1 - Valuation inputs are based upon unadjusted quoted prices for identical instruments traded in active markets. |
• | Level 2 - Valuation inputs are based upon quoted prices for similar instruments in active markets, quoted prices for identical or similar instruments in inactive markets, and model-based valuation techniques for which all significant assumptions are observable in the market or can be corroborated by observable market data for substantially the full term of the assets or liabilities. |
• | Level 3 - Valuation inputs are unobservable and typically reflect management's estimates of assumptions that market participants would use in pricing the asset or liability. The fair values are determined using model-based techniques that include option pricing models, discounted cash flow models, and similar techniques. |
The fair value estimates of financial instruments are not necessarily indicative of the amounts we might pay or receive in actual market transactions. The use of different market assumptions and/or estimation methodologies may have a material effect on the estimated fair value amounts.
Cash and Cash Equivalents
The carrying amount of cash and cash equivalents approximates fair value due to the short term maturity of the instruments. All cash and cash equivalents are denominated in U.S. currency.
Accounts Receivable
The carrying amount of accounts receivable approximates fair value due to the short-term nature of those items and the effect of related allowances for doubtful accounts.
Accounts Payable and Other Payables and Accrued Expenses
The carrying amounts of accounts payable and other payables and accrued expenses approximate fair value due to the short-term nature of those items.
Long-term Debt First Lien Credit Agreements
Loans under our first lien credit agreement are traded in private markets on a less-than-daily basis. Fair value is based on the average of trading prices and bid/ask quotes around period-end (Level 2 inputs). The estimated fair values of our first lien term loans were $570.2 million and $753.0 million as of fiscal year end 2017 and 2016, respectively, compared to carrying values of $557.3 million and $742.9 million, respectively, which includes the current portion, and is net of unamortized discounts and deferred debt issuance costs.
Long-term Debt - Capital Leases
The fair value of capital lease obligations is based on estimated future contractual cash flows discounted at an appropriate market rate of interest (Level 2 inputs). The estimated fair values of our capital leases were $14.0 million and $2.9 million as of fiscal year end 2017 and 2016, respectively, compared to carrying values of $12.0 million and $2.7 million, respectively.
Interest Rate Derivatives
We recognize as assets or liabilities at fair value the estimated amounts we would receive or pay upon a termination of interest rate swaps prior to their scheduled expiration dates. The fair value was based on information that is model-driven and whose inputs were observable (Level 2 inputs). See Note 7. “Interest Rate Derivatives” for further details.
100
National Vision Holdings, Inc. and Subsidiaries
Notes to Consolidated Financial Statements
11. Deferred Revenue
The following depicts a roll-forward of deferred revenue:
Fiscal Year 2017 | |||||||||||||||
In thousands | Product Protection Plans | Eye Care Clubs | HMO Memberships | Total | |||||||||||
Beginning of the year | $ | 23,855 | $ | 63,478 | $ | 95 | $ | 87,428 | |||||||
Sold | 54,028 | 46,443 | 7,926 | 108,397 | |||||||||||
Revenue recognized | (51,152 | ) | (42,491 | ) | (7,967 | ) | (101,610 | ) | |||||||
End of year | $ | 26,731 | $ | 67,430 | $ | 54 | $ | 94,215 | |||||||
Current | $ | 26,312 | $ | 36,627 | $ | 54 | $ | 62,993 | |||||||
Non-current | 419 | 30,803 | — | 31,222 | |||||||||||
$ | 26,731 | $ | 67,430 | $ | 54 | $ | 94,215 | ||||||||
Fiscal Year 2016 | |||||||||||||||
In thousands | Product Protection Plans | Eye Care Clubs | HMO Memberships | Total | |||||||||||
Beginning of the year | $ | 20,972 | $ | 56,802 | $ | 104 | $ | 77,878 | |||||||
Sold | 48,021 | 43,767 | 10,915 | 102,703 | |||||||||||
Revenue recognized | (45,138 | ) | (37,091 | ) | (10,924 | ) | (93,153 | ) | |||||||
End of year | $ | 23,855 | $ | 63,478 | $ | 95 | $ | 87,428 | |||||||
Current | $ | 23,437 | $ | 34,464 | $ | 95 | $ | 57,996 | |||||||
Non-current | 418 | 29,014 | — | 29,432 | |||||||||||
$ | 23,855 | $ | 63,478 | $ | 95 | $ | 87,428 | ||||||||
Deferred revenue recorded as of fiscal year end 2017 is expected to be reflected in future operating results as follows:
Fiscal Year | In thousands | |||
2018 | $ | 62,993 | ||
2019 | 23,021 | |||
2020 | 7,766 | |||
2021 | 329 | |||
2022 | 106 | |||
$ | 94,215 | |||
101
National Vision Holdings, Inc. and Subsidiaries
Notes to Consolidated Financial Statements
12. Commitments and Contingencies
Leases
Total rental expenses related to operating leases were approximately $77.1 million, $69.7 million, and $60.4 million in the fiscal years ended 2017, 2016 and 2015, respectively. Total rental expense includes percentage rent of approximately $6.1 million, $6.3 million, and $4.6 million during the fiscal years ended 2017, 2016 and 2015, respectively.
As of fiscal year end 2017, aggregate future minimum rental payments under our operating leases are as follows:
Fiscal Year | In thousands | |||
2018 | $ | 81,939 | ||
2019 | 73,745 | |||
2020 | 60,843 | |||
2021 | 46,574 | |||
2022 | 34,782 | |||
Thereafter | 86,151 | |||
$ | 384,034 | |||
Other Agreements
The Company is a party to a multi-year marketing agreement with a term from January 2017 through December 2019, with no renewal provision. The Company has committed to pay a total fee of $9.9 million over the term of the agreement.
Warranty Costs
The Company records an allowance for the estimated amount of future warranty costs when the related revenue is recognized, which is recorded in other payables and accrued expenses on the accompanying consolidated balance sheets. Expense associated with warranty costs is presented in cost of services and plans in the accompanying consolidated statements of operations. Estimated future warranty costs are primarily based on historical experience of identified warranty claims. However, there can be no assurance that future warranty costs will not exceed historical amounts. The following details the activity in our product warranty liability accounts:
In thousands | Fiscal Year 2017 | Fiscal Year 2016 | |||||
Beginning of year balance | $ | 1,343 | $ | 1,077 | |||
Accrued obligation | 26,806 | 23,857 | |||||
Claims paid | (26,556 | ) | (23,591 | ) | |||
End of year balance | $ | 1,593 | $ | 1,343 | |||
401(k) Plan
The Company sponsors a 401(k) plan into which employees may defer a portion of their wages. We match a portion of such deferred wages. The expense for the plan was $3.1 million, $2.6 million, and $2.2 million in the fiscal years ended 2017, 2016 and 2015, respectively. Expense associated with our 401(k) plan is presented in SG&A in the accompanying consolidated statements of operations.
Legal Proceedings
From time to time, the Company is involved in various legal proceedings incidental to its business. Because of the nature and inherent uncertainties of litigation, we cannot predict with certainty the ultimate resolution of these actions and, should the outcome of these actions be unfavorable, the Company's business, financial position, results of operations or cash flows could be materially and adversely affected.
102
National Vision Holdings, Inc. and Subsidiaries
Notes to Consolidated Financial Statements
12. Commitments and Contingencies (continued)
The Company reviews the status of its legal proceedings and records a provision for a liability when it is considered probable that both a liability has been incurred and the amount of the loss can be reasonably estimated. This review is updated periodically as additional information becomes available. If either or both of the criteria are not met, we reassess whether there is at least a reasonable possibility that a loss, or additional losses, may be incurred. If there is a reasonable possibility that a loss may be incurred, we disclose the estimate of the amount of the loss or range of losses, or that an estimate of loss cannot be made. The Company expenses its legal fees as incurred.
In January 29, 2016, FirstSight, our wholly-owned specialized health maintenance organization, was named as a defendant in a proposed class action filed on behalf of all persons who paid for an eye examination from an optometrist at a Walmart location in California from November 5, 2009 through the date of the resolution of the litigation. The complaint alleges in particular that FirstSight participated in arrangements that caused the illegal delivery of eye examinations to the plaintiffs, and that FirstSight thereby violated, among other statutes, the Unfair Competition and False Advertising laws of California. In March 2017, the Court granted a motion to dismiss previously filed by FirstSight. The plaintiffs have appealed to the U.S. Court of Appeals for the Ninth Circuit. The Company believes that the claim against it is without merit and intends to vigorously defend the litigation.
In May 2017, a complaint (the “1-800 Contacts Matter”) was filed against the Company and other defendants alleging, on behalf of a proposed class of consumers who purchased contact lenses online, that 1-800 Contacts, Inc. entered into a series of agreements with the other defendants, including AC Lens, the Company’s subsidiary, to suppress certain online advertising and that each defendant thereby engaged in anticompetitive conduct in violation of the Sherman Antitrust Act. The Company has settled the 1-800 Contacts Matter for $7.0 million, without admitting liability. Accordingly, the Company recorded a charge for this amount in litigation settlement in the accompanying consolidated statement of operations during the second quarter of fiscal year 2017.
On November 8, 2017, the court in the 1-800 Contacts Matter entered an order preliminarily approving the settlement agreement, subject to a settlement hearing. Pursuant to this order, the Company deposited 50% of the settlement amount, or $3.5 million, into an escrow account, to be distributed subject to and in accordance with the terms of the settlement agreement and any further order of the court.
13. Earnings Per Share
Basic earnings per share (“EPS”) is computed by dividing net income by the weighted average number of common shares outstanding for the period. Diluted EPS is computed by dividing net income by the weighted average shares outstanding for the period and includes the dilutive impact of potential new shares issuable upon exercise of stock options and vesting of restricted stock units. Potentially dilutive securities are excluded from the computation of diluted EPS if their effect is anti-dilutive. A reconciliation of the numerators and denominators of the basic and diluted EPS calculations is as follows:
In thousands, except EPS | Fiscal Year 2017 | Fiscal Year 2016 | Fiscal Year 2015 | ||||||||
Net income | $ | 45,820 | $ | 14,758 | $ | 3,617 | |||||
Weighted average shares outstanding for basic EPS | 59,895 | 56,185 | 55,962 | ||||||||
Effect of dilutive securities: | |||||||||||
Stock options | 2,140 | 817 | — | ||||||||
Weighted average shares outstanding for diluted EPS | 62,035 | 57,001 | 55,962 | ||||||||
Basic EPS | $ | 0.77 | $ | 0.26 | $ | 0.06 | |||||
Diluted EPS | $ | 0.74 | $ | 0.26 | $ | 0.06 | |||||
Anti-dilutive options outstanding excluded from EPS | 254 | 88 | 887 | ||||||||
14. Segment Reporting
The Company’s reportable segments were determined on the same basis as used by the Chief Operating Decision Maker (“CODM”) to evaluate performance internally. Our operations consist of two reportable segments:
103
National Vision Holdings, Inc. and Subsidiaries
Notes to Consolidated Financial Statements
14. Segment Reporting (continued)
• | Owned & host store brands - Our owned brands consist of our America’s Best and Eyeglass World operating segments. In America’s Best stores, vision care services are provided by optometrists employed either by us or by independent professional corporations. Eyeglass World locations primarily feature independent optometrists to perform eye exams and on-site laboratories. Our two host operating segments consist of Military and Fred Meyer. These brands provide eye exams principally by independent optometrists in nearly all locations. We have aggregated our America’s Best, Eyeglass World, Military, and Fred Meyer operating segments into a single reportable segment due to similar economic characteristics and similarity of the nature of products and services, production processes, class of customers, regulatory environment, and distribution methods of those brands. |
• | Legacy - The Company manages the operations of, and supplies inventory and lab processing services to, 227 legacy retail vision centers. Under our legacy agreements, our responsibilities include development of annual operating budgets, providing managers and staff at each location, training personnel, ordering and maintaining merchandise inventory at the locations, providing sales receipts to customers, and owning and maintaining store furniture, fixtures and equipment. We earn management fees as a result of providing such services and therefore we record revenue related to sales of products and product protection plans to our legacy partner’s customers on a net basis. We also sell to our legacy partner wholesale merchandise that is stocked in retail locations, and provide central lab services associated with the manufacture of finished eyeglasses and frames housed in our optical labs expected to be consumed in the production of eyeglasses for our legacy partner’s customers. We lease space from our legacy partner within or adjacent to each of the locations we manage and use this space for providing optometric examination services. During fiscal year 2017, sales associated with our legacy partner arrangement represented 11.2% of consolidated net revenue. This exposes us to concentration of customer risk. Our legacy agreements were renewed on January 13, 2017, and expire on August 23, 2020, subject to extension pursuant to the terms of the agreements. Sales of services and plans in our legacy segment consist of fees earned for managing the operations of our legacy partner and revenues associated with the provision of eye exams. Revenues associated with managing operations of our legacy partner were $36.7 million, $38.3 million and $40.6 million for fiscal years ended 2017, 2016 and 2015, respectively. |
The “Corporate/Other” category includes the results of operations of our other operating segments AC Lens, FirstSight and corporate overhead support. The “Reconciliations” category represents other adjustments to reportable segment results necessary for the presentation of consolidated financial results in accordance with U.S. GAAP for the two reportable segments.
The operating segments identified above are the business activities of the Company for which discrete financial information is available and for which operating results are regularly reviewed by our CODM to allocate resources and assess performance. Our CODM is our Chief Executive Officer. The Company considers each of our brands to be an operating segment and has further concluded that presenting the results of our reportable segments provides meaningful information consistent with the objectives of ASC 280, Segment Reporting. Strategic initiatives and financial objectives for each reportable segment are determined at the corporate level. Each operating segment is responsible for implementing defined strategic initiatives and achieving certain financial objectives, and has a general manager responsible for the sales and marketing initiatives and financial results for product lines within the segment.
Revenues from the Corporate/Other segments are attributable to the AC Lens and FirstSight operating segments and the Company’s corporate function. AC Lens sells contact lenses and optical accessory products to retail customers through e-commerce. AC Lens also distributes contact lenses to Walmart and Sam’s Club under fee for services arrangements. FirstSight issues individual vision care benefit plans in connection with our America’s Best operations in California, issues individual vision care benefit plans in connection with our America’s Best operations in California, provides or arranges for the provision of optometric services at almost all of the optometric offices next to Walmart and Sam’s Club stores in California and also sells contact lenses to its members in certain locations. None of those segments met the quantitative thresholds for determining reportable segments for any of the periods presented.
Our reportable segment profit measure is earnings before interest, tax, depreciation and amortization (“EBITDA”), excluding asset impairment, debt issuance costs, litigation settlement, and other expense, net. There are no transactions between our reportable segments. There are no differences between the measurement of our reportable segments’ assets and consolidated assets. There have been no changes from prior periods in the measurement methods used to determine reportable segment profit or loss, and there have been no asymmetrical allocations to segments.
104
National Vision Holdings, Inc. and Subsidiaries
Notes to Consolidated Financial Statements
14. Segment Reporting (continued)
The following is a summary of certain financial data for each of our segments. Reportable segment information is presented on the same basis as our consolidated financial statements, except for net revenue, which is presented on a cash basis, excluding the effects of unearned and deferred revenue, consistent with what the CODM regularly reviews. Asset information is not included in the following summary since the CODM does not regularly review such information for the reportable segments. In addition, impairments are treated in the same manner and are not presented in the reportable segment columns. See Note 1. “Business and Significant Accounting Policies” for discussion regarding retail store long-lived assets and Note 3. “Goodwill and Intangible Assets” for discussion regarding goodwill on a reportable segment level.
Fiscal Year 2017 | |||||||||||||||||||
In thousands | Owned & Host | Legacy | Corporate/Other | Reconciliations | Total | ||||||||||||||
Segment product revenues | $ | 847,866 | $ | 103,887 | $ | 179,718 | $ | (2,158 | ) | $ | 1,129,313 | ||||||||
Segment services and plans revenues | 190,701 | 49,955 | 12,172 | (6,833 | ) | 245,995 | |||||||||||||
Total net revenue | 1,038,567 | 153,842 | 191,890 | (8,991 | ) | 1,375,308 | |||||||||||||
Cost of products | 248,548 | 48,275 | 159,789 | (534 | ) | 456,078 | |||||||||||||
Cost of services and plans | 153,691 | 16,624 | 10,573 | — | 180,888 | ||||||||||||||
Total costs applicable to revenue | 402,239 | 64,899 | 170,362 | (534 | ) | 636,966 | |||||||||||||
SG&A | 401,762 | 52,705 | 143,457 | — | 597,924 | ||||||||||||||
Asset impairment | — | — | 4,117 | — | 4,117 | ||||||||||||||
Debt issuance cost | — | — | 4,527 | — | 4,527 | ||||||||||||||
Litigation settlement | — | — | 7,000 | — | 7,000 | ||||||||||||||
Other expense, net | — | — | 950 | — | 950 | ||||||||||||||
EBITDA | $ | 234,566 | $ | 36,238 | $ | (138,523 | ) | $ | (8,457 | ) | $ | 123,824 | |||||||
Depreciation and amortization | 61,115 | ||||||||||||||||||
Interest expense, net | 55,536 | ||||||||||||||||||
Income before income taxes | $ | 7,173 | |||||||||||||||||
Fiscal Year 2016 | |||||||||||||||||||
In thousands | Owned & Host | Legacy | Corporate/Other | Reconciliations | Total | ||||||||||||||
Segment product revenues | $ | 730,741 | $ | 103,618 | $ | 151,083 | $ | (4,489 | ) | $ | 980,953 | ||||||||
Segment services and plans revenues | 158,667 | 48,592 | 17,533 | (9,550 | ) | 215,242 | |||||||||||||
Total net revenue | 889,408 | 152,210 | 168,616 | (14,039 | ) | 1,196,195 | |||||||||||||
Cost of products | 212,208 | 48,097 | 131,257 | (1,193 | ) | 390,369 | |||||||||||||
Cost of services and plans | 127,904 | 11,510 | 14,998 | — | 154,412 | ||||||||||||||
Total costs applicable to revenue | 340,112 | 59,607 | 146,255 | (1,193 | ) | 544,781 | |||||||||||||
SG&A | 343,838 | 52,925 | 127,475 | — | 524,238 | ||||||||||||||
Asset impairment | — | — | 7,132 | — | 7,132 | ||||||||||||||
Other expense, net | — | — | 1,667 | — | 1,667 | ||||||||||||||
EBITDA | $ | 205,458 | $ | 39,678 | $ | (113,913 | ) | $ | (12,846 | ) | $ | 118,377 | |||||||
Depreciation and amortization | 51,993 | ||||||||||||||||||
Interest expense, net | 39,092 | ||||||||||||||||||
Income before income taxes | $ | 27,292 | |||||||||||||||||
105
National Vision Holdings, Inc. and Subsidiaries
Notes to Consolidated Financial Statements
14. Segment Reporting (continued)
Fiscal Year 2015 | |||||||||||||||||||
In thousands | Owned & Host | Legacy | Corporate/Other | Reconciliations | Total | ||||||||||||||
Segment product revenues | $ | 622,845 | $ | 104,218 | $ | 145,794 | $ | (2,394 | ) | $ | 870,463 | ||||||||
Segment services and plans revenues | 136,480 | 50,795 | 18,468 | (13,678 | ) | 192,065 | |||||||||||||
Total net revenue | 759,325 | 155,013 | 164,262 | (16,072 | ) | 1,062,528 | |||||||||||||
Cost of products | 180,847 | 49,701 | 123,771 | (425 | ) | 353,894 | |||||||||||||
Cost of services and plans | 111,383 | 10,759 | 15,064 | — | 137,206 | ||||||||||||||
Total costs applicable to revenue | 292,230 | 60,460 | 138,835 | (425 | ) | 491,100 | |||||||||||||
SG&A | 293,700 | 52,924 | 127,429 | — | 474,053 | ||||||||||||||
Asset impairment | — | — | 7,716 | — | 7,716 | ||||||||||||||
Debt issuance costs | — | — | 2,551 | — | 2,551 | ||||||||||||||
Other expense, net | — | — | 913 | — | 913 | ||||||||||||||
EBITDA | $ | 173,395 | $ | 41,629 | $ | (113,182 | ) | $ | (15,647 | ) | $ | 86,195 | |||||||
Depreciation and amortization | 44,069 | ||||||||||||||||||
Interest expense, net | 36,741 | ||||||||||||||||||
Income before income taxes | $ | 5,385 | |||||||||||||||||
Consolidated Net Product Revenue Information
The following table presents our consolidated net product revenue information:
In thousands | Fiscal Year 2017 | Fiscal Year 2016 | Fiscal Year 2015 | ||||||||
Net Product Sales | |||||||||||
Eyeglasses and sunglasses | $ | 763,268 | $ | 663,253 | $ | 574,969 | |||||
Contact lenses | 358,808 | 310,322 | 288,570 | ||||||||
Accessories and other | 7,237 | 7,378 | 6,924 | ||||||||
Total net product revenues | $ | 1,129,313 | $ | 980,953 | $ | 870,463 | |||||
15. Accumulated Other Comprehensive Loss
Cumulative unrealized losses on the Company’s cash flow hedge derivative instruments are recorded in AOCL. The following table presents the change in AOCL, net of tax during the fiscal years 2017, 2016, and 2015, respectively:
In thousands | Fiscal Year 2017 | Fiscal Year 2016 | Fiscal Year 2015 | ||||||||
Cash flow hedging activity | |||||||||||
Balance at beginning of period | $ | (14,556 | ) | $ | (11,284 | ) | $ | (7,056 | ) | ||
Other comprehensive loss before reclassification | (1,051 | ) | (5,116 | ) | (7,065 | ) | |||||
Tax effect of other comprehensive loss before reclassification | 436 | 1,844 | 2,837 | ||||||||
Amount reclassified from AOCL | 8,664 | — | — | ||||||||
Tax effect of amount reclassified from AOCL | (3,361 | ) | — | — | |||||||
Net current period other comprehensive income (loss), net of tax | 4,688 | (3,272 | ) | (4,228 | ) | ||||||
Balance at end of fiscal year | $ | (9,868 | ) | $ | (14,556 | ) | $ | (11,284 | ) | ||
Amounts reclassified from AOCL to earnings are included in interest expense, net in the accompanying consolidated statements of operations.
106
National Vision Holdings, Inc. and Subsidiaries
Notes to Consolidated Financial Statements
16. Subsequent Events
None.
17. Quarterly Financial Information (Unaudited)
The unaudited quarterly financial information reflects all normal and recurring accruals and adjustments necessary for a fair presentation of net income for interim periods. Quarterly results are not necessarily indicative of a full year’s operations because of various factors. The following tables present unaudited quarterly financial information for the periods presented:
Fiscal Year 2017 | |||||||||||||||
In thousands, except EPS | Fourth Quarter Ended December 30, 2017 | Third Quarter Ended September 30, 2017 | Second Quarter Ended July 1, 2017 | First Quarter Ended April 1, 2017 | |||||||||||
Total net revenue | $ | 321,819 | $ | 346,089 | $ | 337,541 | $ | 369,859 | |||||||
(Loss) income from operations | $ | (2,818 | ) | $ | 16,560 | $ | 13,772 | $ | 39,722 | ||||||
Net income (loss) | $ | 28,700 | $ | 1,546 | $ | (1,496 | ) | $ | 17,070 | ||||||
Weighted-average shares used in computing basic EPS | 70,454 | 56,414 | 56,414 | 56,261 | |||||||||||
Weighted-average shares used in computing diluted EPS | 73,256 | 58,459 | 56,414 | 57,934 | |||||||||||
Basic EPS | $ | 0.41 | $ | 0.03 | $ | (0.03 | ) | $ | 0.30 | ||||||
Diluted EPS | $ | 0.39 | $ | 0.03 | $ | (0.03 | ) | $ | 0.29 | ||||||
Fiscal Year 2016 | |||||||||||||||
In thousands, except EPS | Fourth Quarter Ended December 31, 2016 | Third Quarter Ended October 1, 2016 | Second Quarter Ended July 2, 2016 | First Quarter Ended April 2, 2016 | |||||||||||
Total net revenue | $ | 277,114 | $ | 301,216 | $ | 291,056 | $ | 326,809 | |||||||
(Loss) income from operations | $ | (3,353 | ) | $ | 14,315 | $ | 15,737 | $ | 39,685 | ||||||
Net (loss) income | $ | (9,709 | ) | $ | 3,026 | $ | 3,587 | $ | 17,854 | ||||||
Weighted-average shares used in computing basic EPS | 56,210 | 56,211 | 56,210 | 56,107 | |||||||||||
Weighted-average shares used in computing diluted EPS | 56,210 | 57,170 | 57,075 | 56,197 | |||||||||||
Basic EPS | $ | (0.17 | ) | $ | 0.05 | $ | 0.06 | $ | 0.32 | ||||||
Diluted EPS | $ | (0.17 | ) | $ | 0.05 | $ | 0.06 | $ | 0.32 | ||||||
107
Schedule I - Condensed Financial Information of Registrant
National Vision Holdings, Inc. and Subsidiaries (Parent Company Only)
Condensed Balance Sheets
In Thousands, Except Par Value
As of December 30, 2017 | As of December 31, 2016 | ||||||
ASSETS | |||||||
Current assets: | |||||||
Cash and cash equivalents | $ | 23 | $ | 12 | |||
Total current assets | 23 | 12 | |||||
Deferred income taxes | 304 | 212 | |||||
Investment in subsidiary | 659,536 | 401,704 | |||||
Total non-current assets | 659,840 | 401,916 | |||||
Total assets | $ | 659,863 | $ | 401,928 | |||
LIABILITIES AND STOCKHOLDERS’ EQUITY | |||||||
Current liabilities: | |||||||
Other current liabilities | $ | 46 | $ | 32 | |||
Non-current liabilities: | |||||||
Other non-current liabilities | 229 | 9 | |||||
Stockholders’ equity: | |||||||
Common stock, $0.01 par value; 200,000 shares authorized; 74,654 and 56,202 shares issued and outstanding as of December 30, 2017 and December 31, 2016, respectively | 746 | 562 | |||||
Additional paid-in capital | 631,798 | 424,789 | |||||
Accumulated other comprehensive loss | (9,868 | ) | (14,556 | ) | |||
Retained earnings (accumulated deficit) | 37,145 | (8,675 | ) | ||||
Treasury stock, at cost; 28 shares as of December 30, 2017 and December 31, 2016 | (233 | ) | (233 | ) | |||
Total stockholders’ equity | 659,588 | 401,887 | |||||
Total liabilities and stockholders’ equity | $ | 659,863 | $ | 401,928 | |||
The accompanying notes are an integral part of these condensed financial statements.
108
Schedule I - Condensed Financial Information of Registrant
National Vision Holdings, Inc. And Subsidiaries (Parent Company Only)
Condensed Statements of Operations and Comprehensive Income (Loss)
In Thousands
Fiscal Year 2017 | Fiscal Year 2016 | Fiscal Year 2015 | |||||||||
Total net revenue | $ | — | $ | — | $ | — | |||||
Cost applicable to revenue | — | — | — | ||||||||
Operating expenses | 218 | 195 | 343 | ||||||||
Loss before income taxes | (218 | ) | (195 | ) | (343 | ) | |||||
Income tax benefit | (85 | ) | (76 | ) | (134 | ) | |||||
Loss before equity in net income of subsidiaries | (133 | ) | (119 | ) | (209 | ) | |||||
Net income of subsidiaries | 45,953 | 14,877 | 3,826 | ||||||||
Net income | $ | 45,820 | $ | 14,758 | $ | 3,617 | |||||
Comprehensive income (loss): | |||||||||||
Net income | 45,820 | 14,758 | 3,617 | ||||||||
Change in unrealized gain (loss) on hedge instruments | 7,613 | (5,116 | ) | (7,065 | ) | ||||||
Tax (provision) benefit of change in unrealized gain (loss) on hedge instruments | (2,925 | ) | 1,844 | 2,837 | |||||||
Comprehensive income (loss) | $ | 50,508 | $ | 11,486 | $ | (611 | ) | ||||
The accompanying notes are an integral part of these condensed financial statements.
109
Schedule I - Condensed Financial Information of Registrant
National Vision Holdings, Inc. and Subsidiaries (Parent Company Only)
Condensed Statements of Cash Flows
In Thousands
Fiscal Year 2017 | Fiscal Year 2016 | Fiscal Year 2015 | |||||||||
Operating Activities | |||||||||||
Net cash provided by (used for) operating activities | $ | 11 | $ | (564 | ) | $ | (335 | ) | |||
Investing Activities | |||||||||||
Dividend from subsidiary | 170,983 | 167 | 145,667 | ||||||||
Investment in subsidiary | (373,024 | ) | (884 | ) | (1,181 | ) | |||||
Net cash (used in) provided by investing activities | (202,041 | ) | (717 | ) | 144,486 | ||||||
Financing Activities | |||||||||||
Proceeds from stock option exercises | 1,092 | 915 | 1,762 | ||||||||
Proceeds from sale of common stock | 371,932 | — | 110 | ||||||||
Dividend to stockholders | (170,983 | ) | — | (145,667 | ) | ||||||
Other | — | (387 | ) | 404 | |||||||
Net cash provided by (used in) financing activities | 202,041 | 528 | (143,391 | ) | |||||||
Net change in cash and cash equivalents | 11 | (753 | ) | 760 | |||||||
Cash and cash equivalents, beginning of year | 12 | 765 | 5 | ||||||||
Cash and cash equivalents, end of year | $ | 23 | $ | 12 | $ | 765 | |||||
The accompanying notes are an integral part of these condensed financial statements.
110
Schedule I - Condensed Financial Information of Registrant
National Vision Holdings, Inc. and Subsidiaries (Parent Company Only)
Notes to Condensed Financial Statements
1. Basis of Presentation
National Vision Holdings, Inc. (“NVHI,” or the “Company”) conducts substantially all of its activities through its indirect wholly owned subsidiary, National Vision, Inc. (“NVI”) and its subsidiaries. NVHI was incorporated in Delaware on February 14, 2014 under the name Nautilus Parent, Inc. There were no financial transactions between the inception date and March 13, 2014, the date the majority ownership of NVI was transferred from private equity funds managed by Berkshire Partners LLC to affiliates of Kohlberg Kravis Roberts & Co. L.P. In the parent-company-only financial statements, NVHI’s investment in subsidiaries is stated at cost, plus equity in undistributed earnings of subsidiaries since the date of acquisition, less dividends. The parent-company-only financial statements should be read in conjunction with the NVHI consolidated financial statements.
2. Guarantees and Restrictions
On February 2, 2017, the Company declared a recapitalization dividend to its stockholders. The dividend was funded with $175.0 million in new term loans under NVI’s first lien credit agreement.
As described in the Initial Public Offering section included in Note 1. “Description of Business and Basis of Presentation,” to the NVHI consolidated financial statements, NVI used proceeds from the NVHI IPO to repay all $125.0 million outstanding aggregate amount of its second lien term loans and approximately $235.0 million of the outstanding amount of its first lien term loans and accrued and unpaid interest thereon. As of December 30, 2017, NVI had $568.6 million of principal amount of long-term debt outstanding under its first lien term loans. Pursuant to the joinder and amendment agreements, as described in Note 4. “Long-term Debt,” to the NVHI consolidated financial statements, the first lien credit agreement also provides for up to $100.0 million in revolving loans (“revolving credit facility”). As of fiscal year end 2017, NVI had no outstanding revolving loan obligations and had $11.2 million in outstanding letters of credit related to the revolving credit facility.
The first lien credit agreement contains covenants that, among other things, limit NVI’s ability to incur additional debt, create liens against our assets, make acquisitions, pay dividends or distributions on our stock, merge or consolidate with another entity, and transfer or sell assets. Under the agreement, provided no event of default has occurred and is continuing, NVI is permitted to pay dividends to NVHI with certain restrictions as stated in the credit agreement.
111
Item 9. Changes in and Disagreements With Accountants on Accounting and Financial Disclosure
Not Applicable.
Item 9A. Controls and Procedures
Evaluation of Disclosure Controls and Procedures
We maintain disclosure controls and procedures (as that term is defined in Rules 13a-15(e) and 15d-15(e) of the Exchange Act) that are designed to ensure that information required to be disclosed in our reports under the Exchange Act, is recorded, processed, summarized and reported within the time periods specified in the SEC’s rules and forms, and that such information is accumulated and communicated to our management, including our Chief Executive Officer (“CEO”) and our Chief Financial Officer (“CFO”), as appropriate, to allow timely decisions regarding required disclosures. Any controls and procedures, no matter how well designed and operated, can provide only reasonable assurance of achieving the desired control objectives.
Our management, with the participation of our CEO and our CFO, evaluated the effectiveness of the design and operation of our disclosure controls and procedures as of the end of the period covered by this Form 10-K. Based on their evaluation, our CEO and CFO concluded that, because the previously identified material weaknesses in our internal control over financial reporting described below had not been remediated by the end of the period covered by this Form 10-K, our disclosure controls and procedures were not effective as of the end of the period covered by this Form 10-K.
Material Weakness and Status of Material Weakness Remediation
As previously disclosed in our prospectus, dated October 25, 2017 filed with the SEC on October 27, 2017, we had identified material weaknesses in our internal control over financial reporting. A material weakness is a deficiency, or a combination of deficiencies, in internal control over financial reporting, such that there is a reasonable possibility that a material misstatement of the Company’s annual or interim consolidated financial statements will not be prevented or detected on a timely basis. We identified a deficiency in the design of controls related to the timely detection of damaged, expired or expiring contact lens inventory for purposes of recording inventory at net realizable value. We also identified a material weakness related to a deficiency in the design of entity level controls to identify and assess changes in our business environment that could significantly impact the system of internal control over financial reporting.
Remediation Plan - We have designed and are implementing controls to remediate these material weaknesses, which include the following new policies, procedures, and internal controls:
• | Removed higher obsolescence risk contact lenses from our stores to our Distribution Center in order to better manage inventory turns and related obsolescence potential and established a policy requiring stores to return all contact lenses expiring within the next twelve months to our central distribution center. |
• | Changed our store inventory observation procedures to monitor the compliance with the policy described above, in order to allow for the Company to sell or exchange products with respective vendors for newer products with similar value. |
• | Implemented an automated reporting system to report financial results consistent with Regulation S-X and to provide reconciliations between internal and external reporting, highlighting any changes in reporting and business requirements. |
• | Established a disclosure committee, consisting of certain key members of management, to assist in formalizing our disclosure, risk assessment, internal controls and procedures. |
• | Established an internal audit department that reports directly to the Audit Committee. |
• | Added additional resources to enhance the overall control environment. |
We are committed to maintaining a strong internal control environment, and we expect to continue our efforts to remediate the material weaknesses described above. However, the material weaknesses cannot be considered remediated until the applicable remedial controls operate for a sufficient period of time and management has concluded, through testing, that these controls are operating effectively.
112
Management’s Annual Report on Internal Control Over Financial Reporting
This Form 10-K does not include a report of management’s assessment regarding internal control over financial reporting or an attestation report of the Company’s registered public accounting firm due to a transition period established by rules of the Securities and Exchange Commission for newly public companies.
Changes in Internal Control over Financial Reporting
There were no changes in our internal control over financial reporting (as that term is defined in Rules 13a-15(f) and 15d-15(f) of the Exchange Act) that occurred during the fourth quarter of fiscal year 2017 that have materially affected, or are reasonably likely to materially affect, our internal control over financial reporting, other than as described above under “Material Weakness and Status of Material Weakness Remediation.”
Item 9B. Other Information
None.
113
PART III
Item 10. Directors, Executive Officers and Corporate Governance
Directors and Executive Officers
The following table sets forth the names, ages and positions of our directors and officers as of March 8, 2018.
Name | Age | Position | ||
L. Reade Fahs | 57 | Chief Executive Officer and Director | ||
Nathaniel H. Taylor | 41 | Chairman and Director | ||
Felix Gernburd | 31 | Director | ||
Virginia A. Hepner | 60 | Director | ||
D. Randolph Peeler | 53 | Director | ||
David M. Tehle | 61 | Director | ||
Jeff McAllister | 59 | Chief Operating Officer | ||
Patrick R. Moore | 54 | Senior Vice President, Chief Financial Officer | ||
Mitchell Goodman | 64 | Senior Vice President, General Counsel and Secretary | ||
John Vaught | 64 | Senior Vice President, Chief Information Officer | ||
Chris Beasley | 47 | Senior Vice President, Accounting, and Controller | ||
Jeff Busbee | 57 | Senior Vice President, Chief Human Resources Officer | ||
Charlie Foell | 67 | Senior Vice President, Manufacturing & Distribution | ||
L. Reade Fahs has served as the Chief Executive Officer of NVI since January 2003, having joined NVI in April 2002 as the President and Chief Operating Officer, and was appointed the Chief Executive Officer of National Vision Holdings, Inc. in March 2014. Mr. Fahs has also served as our director since March 2014. Prior to joining NVI, Mr. Fahs served as the Chief Executive Officer of First Tuesday and was Managing Director of Vision Express U.K. Previously, Mr. Fahs worked at LensCrafters, which he joined in 1986 for a decade of their most rapid growth. Mr. Fahs is the chairman of the board of directors of VisionSpring and co-founder of Frames for the World. Mr. Fahs also serves on the boards of RestoringVision, Ditto Technologies, Inc., Affordable Care, Inc. and Atlanta’s Alliance Theatre. Mr. Fahs holds a B.A. degree in English Literature from Harvard College.
Nathaniel H. Taylor has been a director since February 2014 and has served as Chairman of the Board since October 2017. Mr. Taylor joined KKR & Co. in 2005 and currently heads the Americas Consumer Retail team. Mr. Taylor also helped establish KKR & Co.’s Indian operations. Mr. Taylor has been involved with many investments at KKR & Co. and currently sits on the board of directors of Academy Sports + Outdoors, Mills Fleet Farm, and Nature’s Bounty Company. Before joining KKR & Co., Mr. Taylor was with Bain Capital, where he was involved in the execution of investments in the retail, health care and technology sectors. Mr. Taylor holds a B.A. from Dartmouth College and an M.B.A. from Stanford University Graduate School of Business.
Felix Gernburd has been a director since September 2015. Mr. Gernburd joined KKR & Co. in 2010 and is currently a Director, Private Equity and a member of the Retail and Consumer industry team. At KKR & Co., Mr. Gernburd has been involved with many investments and currently sits on the board of directors of Channel Control Merchants, LLC, Mills Fleet Farm and The Nature’s Bounty Company. Before joining KKR & Co., Mr. Gernburd was with Goldman, Sachs & Co., where he was involved in a variety of merger, acquisition and financing transactions in the consumer, retail and industrials sectors. Mr. Gernburd holds an Honors B.A. with distinction from the Richard Ivey School of Business, University of Western Ontario.
Virginia A. Hepner has been a director since January 2018. Ms. Hepner is the former President and Chief Executive Officer of The Woodruff Arts Center, in Atlanta, Georgia, having served in that position from July 2012 to July 2017. Ms. Hepner has over 25 years of corporate banking experience with Wachovia Bank and its predecessors, having held numerous positions in corporate finance and capital markets until retiring in 2005 as an Executive Vice President. Ms. Hepner has been a member of the board of directors of State Bank Financial Corporation, serving on its audit committee and independent director committee, and a director of its subsidiary bank, State Bank and Trust Company, since 2010. Additionally, Ms. Hepner has been a member of the board of directors of Oxford Industries, Inc. since 2016, serving on its nominating, compensation and governance committee. Ms. Hepner holds a bachelor’s degree in finance from The Wharton School of the University of Pennsylvania.
114
D. Randolph Peeler has been a director since March 2014. Mr. Peeler joined Berkshire in 1996 and became a Managing Director in 2000. Before joining Berkshire, Mr. Peeler co-founded a privately-owned healthcare services company and also served as Special Assistant for the Assistant Secretary for Economic Policy in the U.S. Department of the Treasury. Mr. Peeler previously worked as a consultant with Cannon Associates and Bain & Co. Mr. Peeler is or has been a director of several Berkshire portfolio companies, including Affordable Care, Inc., Curriculum Associates, LLC, Husky Injection Molding Systems Ltd. and Lightower Fiber Networks. Mr. Peeler has an A.B. from Duke University and an M.B.A. from Harvard Business School.
David M. Tehle has been a director since July 2017. Mr. Tehle retired from Dollar General Corporation in July 2015 as Executive Vice President and Chief Financial Officer, having served in that role since 2004. Dollar General Corporation is a value discount retailer. Mr. Tehle has been a director of Jack in the Box Inc. since December 2004, serving on the audit and finance committees. Additionally, he joined the board of directors of Genesco, Inc. in 2016, serving on the audit committee, and the board of directors of US Foods Holding Corp. in 2016, serving on the audit and compensation committees. Mr. Tehle holds a B.S. from the University of Wisconsin-Oshkosh and an M.B.A. from the University of Michigan’s Ross School of Business.
Jeff McAllister has served as the Chief Operating Officer of NVI since August 2017, and was appointed the Chief Operating Officer of National Vision Holdings, Inc. in October 2017. Prior to joining NVI, Mr. McAllister was Senior Vice President, Next Generation Supply Chain for Walmart U.S., a position he had held since January 2015. A Navy Veteran, Mr. McAllister joined Walmart in 1998 as Vice President of Logistics Engineering and Planning, and he has since served in a variety of supply chain and operations capacities, including Vice President of Walmart’s Global Supply Chain, Chief Operating Officer for Walmart Japan, and Senior Vice President for Optical. In addition, he has led operations for Walmart’s Health and Wellness Group. Immediately prior to his current role, Mr. McAllister served as Senior Vice President, Store Operations, Texas and then as Senior Vice President, Innovations from February 2011 until January 2015. Prior to joining Walmart, Mr. McAllister managed logistics for Saks Fifth Avenue and The May Department Stores Company. Mr. McAllister holds a B.S. in Industrial Engineering from the University of Michigan.
Patrick R. Moore has served as the Senior Vice President, Chief Financial Officer of NVI since September 2014, and was appointed the Senior Vice President, Chief Financial Officer of National Vision Holdings, Inc. in February 2015. Prior to joining NVI, Mr. Moore served in both divisional and group chief financial officer roles for Fiserv, Inc. (where he served as Senior Vice President, Finance and Chief Financial Officer of the Digital Solutions Group from March 2014 until September 2014), First Data Corporation (where he served as Senior Vice President, Business Transformation from August 2013 until February 2014 and Division Chief Financial Officer/Senior Vice President of First Data North America from October 2009 until July 2013), Fluor Corporation and BellSouth Corporation (now AT&T). Mr. Moore began his career with BellSouth Corporation, serving in roles involving engineering, operations, finance, strategy, investor relations and merger integration. Mr. Moore holds a B.A. in Mechanical Engineering, as well as an MBA from the University of Alabama. Mr. Moore also attended the Stanford Executive program in 2002.
Mitchell Goodman has served as the Senior Vice President, General Counsel and Secretary of NVI since May 1998, and was appointed the Senior Vice President, General Counsel and Secretary of National Vision Holdings, Inc. in March 2014. Mr. Goodman joined NVI in 1992 as General Counsel and was named a Vice President in November 1993. Prior to joining NVI, Mr. Goodman was Vice President, General Counsel for NuVision, Inc. Mr. Goodman holds a B.A. degree in philosophy from the University of Pennsylvania, an M.Litt. in philosophy from Oxford University, and a J.D. degree from Wayne State University Law School.
John Vaught has served as the Senior Vice President, Chief Information Officer of NVI since joining National Vision in 2005, and was appointed the Senior Vice President, Chief Information Officer of National Vision Holdings, Inc. in June 2017. Mr. Vaught has been involved in all acquisition integrations and growth at National Vision beginning with the acquisition of America’s Best in 2005. Mr. Vaught has 45 years of retail and manufacturing information technology experience, and has held technical and IT management positions at Revco Drug Stores (CVS), Invacare, and Office Depot.
Chris Beasley has served as the Senior Vice President, Accounting of NVI since July 2015 and as the Controller since May 2017, and was appointed the Senior Vice President, Accounting of National Vision Holdings, Inc. in April 2016 and as the Controller in May 2017. Prior to joining NVI, Mr. Beasley served as Chief Financial Officer of Sierra-Cedar Holdings Inc., a private equity owned information technology consulting company, from July 2014 to July 2015. Prior to that role, Mr. Beasley served as Sierra-Cedar’s Global Controller and Vice President of Finance from January 2012 to July 2014. Prior to joining Sierra-Cedar, Mr. Beasley served as Corporate Controller at Eclipsys Corporation and Director of Financial Reporting for BellSouth Corporation (now AT&T). Mr. Beasley began his career with PricewaterhouseCoopers as an audit manager. Mr. Beasley holds a B.B.A. in Accounting from the University of Georgia and is a Certified Public Accountant.
115
Jeff Busbee has served as the Senior Vice President, Chief Human Resources Officer of NVI since January 2010, and was appointed the Senior Vice President and Chief Human Resources Officer of National Vision Holdings, Inc. in June 2017. Mr. Busbee joined NVI in November 1995 as Director, Human Resources. Prior to joining NVI, Mr. Busbee held various positions at General Motors Company, Hitachi, Ltd., Delta Airlines and the Coca Cola Export Corporation, Belgium. Mr. Busbee holds a B.B.A degree in Management from Georgia State University.
Charlie Foell has served as the Senior Vice President, Manufacturing and Distribution of NVI since April 2009, and was appointed the Senior Vice President, Manufacturing and Distribution of National Vision Holdings, Inc. in June 2017. Mr. Foell joined NVI in 1998 as Director of Distribution and was appointed to Vice President, Manufacturing and Distribution of NVI in 2003. Prior to joining NVI, Mr. Foell spent 25 years in various management roles supporting independently owned retail locations. Mr. Foell holds a Business Logistics degree from Penn State University.
Controlled Company Exception
As of the date of this report, the Sponsors beneficially own shares representing more than 50% of the voting power of our shares eligible to vote in the election of directors. As a result, we are a “controlled company” within the meaning of the NASDAQ Listing Rules. Under such corporate governance standards, a company of which more than 50% of the voting power is held by an individual, group or another company is a “controlled company” and may elect not to comply with certain corporate governance standards, including the requirements that (1) a majority of our Board of Directors consist of independent directors, (2) our Board of Directors have a compensation committee that is composed entirely of independent directors with a written charter addressing the committee’s purpose and responsibilities, and (3) that our director nominations be made, or recommended to the full Board of Directors, by our independent directors or by a nominating committee that is composed entirely of independent directors and that we adopt a written charter or board resolution addressing the nominations process.
For at least some period, we intend to utilize these exemptions. As a result, we do not have a majority of independent directors on our Board of Directors, do not have a compensation committee that is composed entirely of independent directors and our director nominations are not made, or recommended to the full Board of Directors, by our independent directors or by a nominating/corporate governance committee that is composed entirely of independent directors. Accordingly, our stockholders do not have the same protections afforded to stockholders of companies that are subject to all of these corporate governance requirements. In the event that we cease to be a “controlled company” and our shares continue to be listed on NASDAQ, we will be required to comply with these provisions within the applicable transition periods.
Composition of the Board of Directors
Our business and affairs are managed under the direction of our Board of Directors. Our Board of Directors currently consists of six directors, of whom Mr. Tehle and Ms. Hepner have been affirmatively determined to be independent.
Our certificate of incorporation provides for a classified board of directors consisting of three classes of directors, each serving staggered three-year terms, as follows:
• | Our Class I directors are Nathaniel H. Taylor and L. Reade Fahs, and their terms will expire at the annual meeting of stockholders to be held in 2018. |
• | Our Class II directors are D. Randolph Peeler and Felix Gernburd, and their terms will expire at the annual meeting of stockholders to be held in 2019. |
• | Our Class III directors are David M. Tehle and Virginia A. Hepner, and their terms will expire at the annual meeting of stockholders to be held in 2020. |
At each annual meeting of stockholders, the successors to directors whose terms then expire will be elected to serve from the time of election and qualification until the third annual meeting following election. Our amended and restated certificate of incorporation provides that the authorized number of directors may be changed only by resolution of our Board of Directors. Any additional directorships resulting from an increase in the number of directors will be distributed among the three classes so that, as nearly as possible, each class will consist of one-third of the directors. The division of our Board of Directors into three classes with staggered three-year terms may delay or prevent a change of our management or a change in control of our Company.
In addition, pursuant to a stockholders agreement entered into in connection with our initial public offering, each of the Sponsors have the right to designate nominees to our Board of Directors subject to the maintenance of certain ownership requirements in us. See “Certain Relationships and Related Party Transactions—Stockholders Agreement.”
116
Background and Experience of Directors
When considering whether directors and nominees have the experience, qualifications, attributes or skills, taken as a whole, to enable our Board of Directors to satisfy its oversight responsibilities effectively in light of our business and structure, the Board of Directors focused primarily on each person’s background and experience as reflected in the information discussed in each of the directors’ individual biographies set forth above. We believe that our directors provide an appropriate mix of experience and skills relevant to the size and nature of our business.
In particular, the members of our Board of Directors considered the following important characteristics, among others:
• | Mr. Fahs, our Chief Executive Officer, has many years of executive experience in the optical retail industry. |
• | Mr. Taylor and Mr. Gernburd each have significant financial, investment and operational experience from their involvement with numerous portfolio companies of KKR & Co. and its affiliated funds and have played active roles in overseeing those businesses. |
• | Mr. Peeler has significant experience and expertise in private equity investments through his involvement in Berkshire’s investments. |
• | Mr. Tehle has many years of experience as the chief financial officer of a publicly held company and as a director of publicly held companies and has significant knowledge of financial reporting, internal controls and procedures and risk management. |
• | Ms. Hepner has leadership experience as the president and chief executive officer of a nationally-esteemed arts center, has significant financial expertise in corporate banking and capital markets having served as a senior officer with financial oversight responsibilities and has served as a director of publicly held companies. |
Leadership Structure of our Board of Directors
Our amended and restated bylaws provide our Board of Directors with flexibility to combine or separate the positions of Chairman of the Board and Chief Executive Officer in accordance with its determination that utilizing one or the other structure would be in the best interests of our Company. Currently, these positions are separated, with Mr. Taylor serving as Chairman of the Board and Mr. Fahs serving as our Chief Executive Officer and also as a director. Our Board of Directors has concluded that our current leadership structure is appropriate at this time. However, our Board of Directors will continue to periodically review our leadership structure and may make such changes in the future as it deems appropriate.
Role of Board of Directors in Risk Oversight
Our Board of Directors has extensive involvement in the oversight of risk management. The Board and the audit committee receive regular reports from management to help ensure effective and efficient oversight of our activities and to assist in proper risk management, including with respect to cybersecurity, and the ongoing evaluation of management controls. Through its regular meetings with management, including the finance, legal, internal audit, and compliance functions, the audit committee reviews and discusses significant areas of our business, including areas of risk and appropriate mitigating factors. Internal audit reports functionally and administratively to our Chief Financial Officer and directly to the audit committee. We believe that the leadership structure of our Board of Directors provides appropriate risk oversight of our activities given the controlling interests held by the Sponsors.
Committees of our Board of Directors
Our Board of Directors has an audit committee and a compensation committee, each of which operates under a charter that has been approved by our Board of Directors. Copies of each committee’s charter are posted in the investors section of our website, www.nationalvision.com. The reference to our website address does not constitute incorporation by reference of the information contained at or available through our website, and you should not consider it to be a part of this Form 10-K.
Audit Committee
Our audit committee consists of David M. Tehle, who serves as the Chair, Virginia A. Hepner and Felix Gernburd. Mr. Tehle and Ms. Hepner each qualifies as an independent director under NASDAQ corporate governance standards and the independence requirements of Rule 10A-3 of the Exchange Act. Our Board of Directors has determined that Mr. Tehle and Ms. Hepner each qualifies as an “audit committee financial expert” as such term is defined in Item 407(d)(5) of Regulation S-K. The audit committee is responsible for, among other things, preparing the audit committee report required by the SEC to be included in our proxy statement and assisting our Board of Directors with respect to its oversight of (1) our risk management policies and procedures, (2) the audits and integrity of our financial statements, and the effectiveness of internal control over financial reporting, (3) our compliance with legal and regulatory requirements, (4) the qualifications, performance and independence of the outside auditors and (5) the performance of our internal audit function.
117
Compensation Committee
Our compensation committee consists of Nathaniel H. Taylor, who serves as the Chair, and Felix Gernburd. The purpose of the compensation committee is to assist our Board of Directors in discharging its responsibilities relating to (1) setting our compensation philosophy and compensation of our executive officers and directors, (2) monitoring our equity-based and certain incentive compensation plans and (3) preparing the compensation committee report required to be included in our proxy statement or annual report under the rules and regulations of the SEC.
Code of Ethics
We maintain a written code of ethics that applies to our directors, officers and employees, including our principal executive officer, principal financial officer, principal accounting officer or controller, or persons performing similar functions, which we call our Code of Conduct. Our Code of Conduct is a “code of ethics” as defined in item 406(b) of Regulation S-K under the Securities Act and is posted in the investors section of our website, www.nationalvision.com. We intend to make any legally required disclosures regarding amendments to, or waivers of, provisions of our Code of Conduct on our website. The reference to our website address does not constitute incorporation by reference of the information contained at or available through our website, and you should not consider it to be a part of this Form 10-K.
Section 16(a) Beneficial Ownership Reporting Compliance
Section 16(a) of the Exchange Act, requires our directors, executive officers, and persons who beneficially own more than 10% of our common stock to file reports of holdings and transactions in our common stock with the SEC. Based solely on a review of the copies of reports furnished to the Company and written representations from our executive officers and directors that no other reports were required to be filed, the Company believes that during 2017 all reports required by Section 16(a) were timely filed.
Item 11. Executive Compensation
Compensation Discussion and Analysis
Section Overview
Our executive compensation program is designed to attract and retain individuals with the skills and qualifications to manage and lead the Company effectively. The overarching goal of our programs is to motivate our leaders to contribute to the achievement of our financial goals and to focus on long-term value creation for our stockholders.
This section contains a discussion of the material elements of compensation awarded to, earned by or paid to our named executive officers, or NEOs, which include our Chief Executive Officer, Chief Financial Officer and each of our three other most highly compensated executive officers who served in such capacities for the fiscal year ended December 30, 2017. In addition, our former President, who retired from such position as of September 1, 2017, also qualifies as an NEO for 2017. Our NEOs for 2017 were:
Name | Position | |
L. Reade Fahs | Chief Executive Officer and Director | |
Patrick R. Moore | Senior Vice President, Chief Financial Officer | |
Jeff McAllister* | Chief Operating Officer | |
Mitchell Goodman | Senior Vice President, General Counsel and Secretary | |
John Vaught | Senior Vice President, Chief Information Officer | |
J. Bruce Steffey* | Former President | |
____________ | ||
* Mr. McAllister joined NVI in August 2017. Mr Steffey retired from his President position in September 2017 and remains employed in a part-time capacity. | ||
Executive Summary
Compensation Philosophy and Approach
We expect our executive team to possess and demonstrate strong leadership and management capabilities. To reward and retain our leaders, including our NEOs, we have designed a total compensation approach that rewards both short-term and long-term success.
Compensation Objectives
Our compensation program for executives is currently designed to support the following objectives:
118
• | align executive compensation with achievement of our overall business goals; |
• | provide overall levels of compensation that are competitive to attract, retain and motivate highly-qualified executives to continue to enhance long-term equity value; and |
• | foster a strong relationship between stockholder value and executive compensation by having a portion of compensation composed of equity-based incentive awards. |
Program Design. Our executive compensation program has three main components: (1) base salary; (2) annual cash incentive compensation; and (3) long-term incentive awards. Each component is designed to be consistent with the Company’s compensation philosophy.
Our compensation packages are designed to promote integrity, leadership, teamwork, ownership and initiative by our employees whose performance and responsibilities directly affect our results of operations. We strive to create competitive compensation packages for all employees that encourage them to achieve our long-term business goals without taking unnecessary risks. We believe that, to attract and retain senior executives, we must provide them with a competitive level of predictable compensation that rewards their continued service. We also believe that performance-based compensation plays a significant role in aligning senior executives’ interests with those of our stockholders, and should be emphasized in the overall program structure. We motivate and reward NEOs for successfully executing our business strategy, and believe that a combination of both short-term and long-term compensation creates an optimal pay-for-performance environment.
As we have recently transitioned from being privately held to publicly traded, we intend to critically evaluate our executive compensation program as frequently as circumstances require, to ensure that we maintain a competitive environment for talent and that our incentive programs are achieving their desired results. Consistent with prior practice, we do not intend to adhere to rigid formulas or react to short-term changes in business performance in determining the amount and mix of compensation elements.
Our Annual Compensation-Setting Process
Role of Our Board of Directors and the NVI Board
Prior to our IPO, our executive compensation and related issues were administered by our full Board of Directors and the board of NVI (the “NVI Board”). Our Board of Directors was responsible for determining and approving equity compensation grants while the NVI Board determined other aspects of compensation, including base salaries, and administered our Management Incentive Plan (“MIP”). Our Board of Directors and the NVI Board were responsible for determining the compensation of our CEO and for reviewing and approving the compensation of other executive officers, as recommended by our CEO and Senior Vice President, Chief Human Resources Officer, (the “Chief Human Resources Officer”). At the beginning of each performance cycle, our Board of Directors or the NVI Board, as applicable, approved financial goals designed to align executive pay with company performance and stockholder interests, provide competitive pay opportunities dependent on performance, retain talent, create optimal stockholder value and mitigate material risk.
In connection with our IPO, our Board of Directors established a compensation committee that, going forward, has responsibility for overseeing the executive compensation program, including (but not limited to) executive salaries, goals and payouts under the MIP, the size and structure of equity awards and any executive perquisites or other benefits.
Except where the context requires otherwise, the term “Board of Directors” as used in this “Compensation Discussion and Analysis” section refers to the Board of Directors of National Vision Holdings, Inc.
Role of Management
In setting executive compensation for 2017, our CEO and our Chief Human Resources Officer worked closely with the NVI Board in managing the executive compensation program and attended meetings of our Board of Directors. Our CEO made recommendations to the NVI Board regarding compensation for the executive officers other than himself. Our CEO and CFO also provided input in discussions regarding the financial goals for which annual incentive payouts under our MIP could be earned. Following our IPO, the compensation committee of our Board of Directors assumed the responsibility that the NVI Board had in approving compensation decisions with respect to our NEOs.
Role of the Compensation Consultant
In early 2016, our Board of Directors retained Meridian Compensation Partners, LLC (“Meridian”), an independent compensation consulting firm, to assist our Board of Directors regarding various executive compensation matters. Since 2016, Meridian has assisted with the development of our compensation peer group, conducted compensation benchmarking studies for our senior executives using both the peer group and survey data, consulted on various matters related to the annual and long-term incentive programs and consulted on various matters related to compensation of our independent directors.
In early 2018, the compensation committee engaged Meridian to serve as its independent compensation consulting firm. In connection with this appointment, the compensation committee assessed Meridian’s independence, including considering the factors specified
119
in the NASDAQ listing standards and receiving confirmation by Meridian of its independent status. The compensation committee believes that Meridian is independent and that there is no conflict of interest between Meridian and the compensation committee.
Use of Comparative Market Data
We aim to compensate our executive officers competitively in the market for executive talent. To gain a general understanding of current market compensation practices, our Board of Directors has reviewed the findings as presented in a market study conducted by Meridian. The external market data reviewed included proxy data from the peer group companies described below, and a broad cross-section of general industry survey data.
The current peer group was approved by the Board of Directors in October 2016. The criteria used to select the peer group focused on industry, business model, scope of operations (as measured by annual revenue and market capitalization), and performance results (as indicated by various earnings metrics). We believe it is appropriate for the peer group to reflect the health care aspects of our business yet retain a “retail” component. The peer group consists of the following 15 companies:
Alere, Inc. | Kate Spade & Co. |
Align Technology Inc. | Surgery Partners Inc. |
Amsurg Corp. | Surgical Care Affiliates Inc. |
Columbia Sportswear Co. | Ulta Salon Cosmetics and Fragrances |
Cooper Companies Inc. | U.S. Physical Therapy Inc. |
Container Store Group | VCA Inc. |
Dentsply Sirona Inc. | West Pharmaceutical Services Inc. |
Five Below Inc. | |
As more fully described below under “-Compensation Elements,” the NVI Board reviewed the compensation data provided by Meridian and set total compensation for our NEOs accordingly. The NVI Board did not target a specific percentile with respect to the peer group in determining our NEOs’ total compensation, nor did it establish a prescribed mix of pay for our executives.
Compensation Elements
Base Salary
We believe it is important to provide a competitive fixed level of pay to attract and retain experienced and successful executives. In determining the amount of base salary that each NEO receives, we look to the executive’s current compensation, time in position, any change in the executive’s position or responsibilities, including complexity and scope and the relation of his or her position to those of other executives within the Company and in similar positions at peer companies. Base salaries are reviewed annually or at other times when appropriate and may be increased from time to time pursuant to such review.
Consistent with this approach, in April 2017, we adjusted the base salaries of Mr. Goodman from $330,000 to $350,000, Mr. Vaught from $280,000 to $288,000 and Mr. Steffey from $566,500 to $610,000; and in September 2017, we adjusted the base salary of Mr. Fahs from $610,000 to $900,000. Following Mr. Steffey’s retirement from the position of President in September 2017, his base salary was adjusted to $305,000. There were no changes made to the bases salaries of Messrs. Moore ($400,000) and McAllister ($562,000) in 2017.
Management Incentive Plan
Our executives participate in the MIP, which is an annual cash incentive program. The primary purpose of the MIP is to focus management on key measures that drive financial performance and to provide competitive bonus opportunities tied to the achievement of our annual financial and strategic growth objectives.
We believe that tying the NEOs’ bonuses to company-wide performance goals encourages collaboration across the executive leadership team. For fiscal 2017, MIP awards were based on achievement of a MIP EBITDA goal (with EBITDA for purposes of the MIP defined as Adjusted EBITDA (as defined in Part II. Item 7. “ Management’s Discussion and Analysis” of this Form 10-K), plus MIP expense, change in the margin on unearned revenue, change in deferred revenue, interest income and parent company items, less new store pre-opening expenses and non-cash rent). The compensation committee has reserved the ability to adjust the actual EBITDA results to exclude the effects of unplanned or unusual items (whether favorable or unfavorable).
Each NEO’s target annual bonus under the MIP is expressed as a percentage of base salary with the targets ranging from 32.5% to 100% for 2017. Actual MIP awards were calculated by multiplying each NEO’s base salary by his payout percentage. MIP awards are earned at 100% of target if the Company achieved 2017 MIP EBITDA of $169.1 million. For fiscal 2017, there was a threshold level and five additional levels of MIP EBITDA achievement under the MIP, with Tier I being the target achievement level and Tier V the maximum achievement level. Awards could be earned at more or less than target based on the pre-established scale set forth in the following table:
120
Threshold | Tier I (Target) | Tier II | Tier III | Tier IV | Tier V (Max) | |||||||||||||||
% Attainment of MIP EBITDA Target | ||||||||||||||||||||
90 | % | 100 | % | 102.7 | % | 106.9 | % | 112.2 | % | 118.5 | % | |||||||||
Named Executive Officer | Payout Percentages | |||||||||||||||||||
L. Reade Fahs* | 1/1/17-8/31/17 | 30 | % | 60 | % | 70 | % | 90 | % | 110 | % | 130 | % | |||||||
9/1/17-12/30/17 | 50 | % | 100 | % | 110 | % | 130 | % | 150 | % | 170 | % | ||||||||
Patrick R. Moore | 1/1/17-12/30/17 | 25 | % | 50 | % | 58.75 | % | 76.25 | % | 93.75 | % | 111.25 | % | |||||||
Jeff McAllister | 1/1/17-12/30/17 | 30 | % | 60 | % | 70 | % | 90 | % | 110 | % | 130 | % | |||||||
Mitchell Goodman | 1/1/17-12/30/17 | 25 | % | 50 | % | 58.75 | % | 76.25 | % | 93.75 | % | 111.25 | % | |||||||
John Vaught | 1/1/17-12/30/17 | 16.25 | % | 32.5 | % | 40 | % | 55 | % | 70 | % | 85 | % | |||||||
J. Bruce Steffey | 1/1/17-12/30/17 | 30 | % | 60 | % | 70 | % | 90 | % | 110 | % | 130 | % | |||||||
_________
* | Effective September 1, 2017, the Board of Directors approved updated target levels for Mr. Fahs for the remainder of fiscal 2017. In determining Mr. Fahs’ increased annual target bonus, the Board of Directors generally reviewed (without targeting a specific percentile) the target cash bonus opportunities of CEOs at the Company’s peer group. |
For performance percentages between the specified threshold, target, and other tier levels, payouts were interpolated on a straight-line basis.
Notwithstanding the establishment of the MIP EBITDA goal and the scale for determining the resulting MIP awards earned, as described above, the compensation committee had the ability to exercise positive or negative discretion and award a greater or lesser amount to our NEOs than the amount determined by the scale above if it determined that circumstances so warranted. The compensation committee did not exercise such discretion in fiscal 2017.
For fiscal 2017, the Company’s MIP EBITDA achieved was $171.8 million, resulting in a payout percentage of 66.12% of base salary for Mr. Fahs from January 1, 2017 to August 31, 2017 and 106.12% from September 1, 2017 and December 30, 2017, 55.35% of base salary for each of Messrs. Moore and Goodman, 66.12% of base salary for each of Messrs. McAllister and Steffey, and 37.09% of base salary for Mr. Vaught. Each of the NEOs earned MIP awards for fiscal 2017 as follows, which are included in the “Non-Equity Incentive Plan Compensation” column of the “Summary Compensation Table” below.
Named Executive Officer | 2017 Base Salary | Target Percentage | Target Amount | Achievement Factor as a Percentage of Target Amount | Actual MIP Award | |||||||||||||||
L. Reade Fahs | 1/1/17-8/31/17 | $ | 422,308 | 60 | % | $ | 253,385 | 111 | % | $ | 279,209 | |||||||||
9/1/17-12/30/17 | $ | 278,038 | 100 | % | $ | 278,038 | 106 | % | $ | 295,040 | ||||||||||
$ | 574,249 | |||||||||||||||||||
Patrick R. Moore | $ | 400,000 | 50 | % | $ | 200,000 | 111 | % | $ | 221,403 | ||||||||||
Jeff McAllister | $ | 227,164 | 60 | % | $ | 136,298 | 110 | % | $ | 150,189 | ||||||||||
Mitchell Goodman | $ | 344,615 | 50 | % | $ | 172,308 | 111 | % | $ | 190,747 | ||||||||||
John Vaught | $ | 285,846 | 32.5 | % | $ | 92,900 | 114 | % | $ | 106,009 | ||||||||||
J. Bruce Steffey | $ | 504,442 | 60 | % | $ | 302,665 | 110 | % | $ | 333,512 | ||||||||||
Long-Term Incentive Awards
In connection with our IPO, our board of directors adopted, and our stockholders approved, the National Vision Holdings, Inc. 2017 Omnibus Incentive Plan (the “2017 Omnibus Incentive Plan”). The purpose of our 2017 Omnibus Incentive Plan is to provide a means through which to attract and retain key personnel and to provide a means whereby our directors, officers, employees, consultants and advisors can acquire and maintain an equity interest in us, or be paid incentive compensation, including incentive compensation measured by reference to the value of our common stock, thereby strengthening their commitment to our welfare and aligning their interests with those of our stockholders.
In 2014, our Board of Directors and stockholders of the Company approved the 2014 Stock Incentive Plan for Key Employees of Nautilus Parent, Inc. and its Subsidiaries (the “2014 Stock Incentive Plan,” and together with the 2017 Omnibus Incentive Plan, the “Equity Incentive Plans”).
As of December 30, 2017, only stock options have been granted to any of the NEOs under our Equity Incentive Plans.
121
Pre-IPO Stock Option Grants. Each of our NEOs, except Mr. McAllister, received option grants in fiscal year 2014, which we refer to as the “2014 Options.” On August 14, 2017, in connection with being hired by us, our Board of Directors granted Mr. McAllister an option to purchase 362,317 shares of our common stock pursuant to our 2014 Stock Incentive Plan, with an exercise price of $15.74 per share (the “McAllister 2017 Options,” and together with the 2014 Options, the “Pre-IPO Options”). The Pre-IPO Options consist of 40% time-based and 60% performance-based options. For additional information regarding stock options, see “Narrative to Summary Compensation Table and 2017 Grants of Plan-Based Awards-Equity Awards” below.
Post-IPO Stock Option Grants. In connection with our IPO, on October 25, 2017, our Board of Directors granted Mr. Moore a time-based option to purchase 92,443 shares of our common stock pursuant to our 2017 Omnibus Incentive Plan, with an exercise price of $22.00 per share (the “2017 Post-IPO Options”). For additional information regarding stock options, see “Narrative to Summary Compensation Table and 2017 Grants of Plan-Based Awards-Equity Awards” below.
Exercise Price Adjustment of Stock Options. As provided under the 2014 Stock Incentive Plan and related award agreements, the exercise price of options is subject to reduction to reflect cash dividends paid after the grant date. In connection with extraordinary dividends paid in June 2015 and February 2017, the exercise prices of the options granted to our NEOs prior to such dates were reduced. In February 2017, our Board of Directors approved a cash dividend payable to holders of our common stock, which we refer to as the “2017 Dividend,” of $2.977 per share, which we refer to as the “2017 Dividend Amount.” To equitably reflect the impact of the 2017 Dividend on the holders of outstanding options, our Board of Directors approved cash payments to be made with respect to rollover options (as described below) and vested options and approved reductions of the exercise price for unvested options. Specifically, holders of vested options and rollover options received a one-time cash payment equal to the number of vested options and/or rollover options held by such holder, as applicable, multiplied by an amount equal to the 2017 Dividend Amount, less any applicable withholding taxes. The per share exercise prices of unvested options were reduced to $4.27, to the extent the per share exercise price could be reduced under applicable tax rules.
Payments for Pre-Acquisition Options and Rollover Options. Certain outstanding options to acquire stock that were issued prior to our acquisition by affiliates of KKR Sponsor in 2014, whether or not fully vested, became fully vested immediately prior to such acquisition and were either rolled over into options to purchase shares of our common stock or canceled and converted into cash payments, based on the difference between the change in control price and the option’s exercise price. Certain of our executives, including Mr. Vaught, rolled over a portion of their pre-acquisition outstanding options into options to purchase shares of our common stock. These “rollover options” were fully vested as of their date of grant and remain outstanding in accordance with the terms of the governing stock incentive plans and grant agreements and a separate rollover option agreement entered into with each of the individual option holders, including Mr. Vaught. However, in connection with our acquisition by affiliates of KKR Sponsor, the exercise price and number of shares underlying the rollover options were adjusted as a result of the acquisition, including for Mr. Vaught, whose exercise price for such options was adjusted to $2.42 per option.
Perquisites and Other Benefits
Our team members, including the NEOs, are eligible for specified benefits, such as group health, dental, disability and life insurance. These benefits are intended to provide competitive and adequate protection in case of sickness and the NEOs participate in these plans on the same basis as all other team members.
We provide specified perquisites to our NEOs when appropriate, including relocation as required. We also provide our executives, including our NEOs, with additional basic life insurance coverage and supplemental long-term disability and accidental death insurance. In addition, we provide our CEO with tax accounting services and a Young Presidents’ Organization (“YPO”) membership. These perquisites are intended to enable us to attract and retain highly qualified employees for key positions and are believed to be reasonable and consistent with our overall compensation program. The value of these perquisites and other personal benefits are reflected in the “All Other Compensation” column to the “Summary Compensation Table” and the accompanying footnotes below.
Retirement Benefits
Our eligible U.S. employees, including our NEOs, participate in the National Vision, Inc. 401(k) Retirement Savings Plan, or the 401(k) Plan. Eligible employees are eligible to enroll in the 401(k) Plan during the first month following three months of service with the Company. Under the 401(k) Plan, we match 50% of the first 3% of a participant’s contributions. The Company’s matching contributions vest pro rata over each of the following four years of employment with the Company.
Severance Benefits
The Company provides severance benefits to its executives in order to offer competitive total compensation packages and to be competitive in the Company’s executive attraction and retention efforts. The National Vision, Inc. Severance Plan, or the Severance Plan, in which all of our NEOs participate, provides for severance payments and benefits to executives upon a qualifying termination of employment. In addition, as of December 30, 2017, Messrs. Fahs, Moore and Goodman participate in the Executive Supplement to the Severance Plan.
122
See “Potential Payments upon Termination or Change in Control,” which describes the payments to which each of the NEOs may be entitled under the Severance Plan and the Executive Supplement.
Tax and Accounting Considerations
We consider the effect of tax, accounting and other regulatory requirements in designing and implementing compensation programs so that our programs meet regulatory requirements and efficiently deliver compensation. While these factors may impact plan designs, ultimately, decisions reflect the pay strategy of the Company and the program intent.
Section 162(m) of the Internal Revenue Code of 1986, as amended (the “Code”) generally disallows tax deductions to publicly-held companies for individual compensation over $1 million paid to certain executive officers in a taxable year. Historically, compensation above $1 million could be deducted if it was considered “performance-based compensation” within the meaning of the Code, but as a result of tax legislation enacted at the end of 2017, this exemption is no longer available.
Currently, but subject to final rules with respect to the new tax legislation, we are able to claim the benefit of a special exemption rule that applies to compensation paid (or compensation in respect of equity awards such as stock options or restricted stock granted) during a specified transition period under Section 162(m) for corporations that become publicly traded. This transition period may extend until the first annual stockholders meeting that occurs after the end of the third calendar year following the calendar year in which this offering occurs, unless the transition period is terminated earlier under the Section 162(m) post-offering transition rules. At such time as we are subject to the deduction limitations of Section 162(m), as a result of the elimination of the performance-based compensation exemption, as described above, we would not expect that the compensation committee will take the deductibility limitations of Section 162(m) into account in its compensation decisions.
Compensation Committee Report
The Compensation Committee has reviewed and discussed the Compensation Discussion and Analysis with management. Based on its review and discussion with management, the Compensation Committee recommended to the Board of Directors that the Compensation Discussion and Analysis be included in the Form 10-K for the fiscal year ended December 30, 2017.
Compensation Committee
Nathaniel H. Taylor, Chair
Felix Gernburd
Compensation Tables
Summary Compensation Table
The following table presents summary information regarding the total compensation awarded to, earned by, or paid to each of our NEOs for services rendered in all capacities for the fiscal year ended December 30, 2017.
123
Name and Principal Position | Year | Salary ($)(1) | Bonus ($) | Stock Awards ($) | Option Awards (2) ($) | Non-Equity Incentive Plan Compensation ($) | Change in Pension Value and Nonqualified Deferred Compensation Earnings ($) | All Other Compensation(3) ($) | Total ($) | |||||||||||||||||
L. Reade Fahs Chief Executive Officer | 2017 | 700,346 | — | — | — | 574,249(4) | — | 23,240 | 1,297,835 | |||||||||||||||||
2016 | 605,221 | — | — | — | 503,074 | — | 16,911 | 1,125,206 | ||||||||||||||||||
Patrick R. Moore Senior Vice President and Chief Financial Officer | 2017 | 400,000 | — | — | 848,442 | 221,403 | — | 93,882 | 1,563,727 | |||||||||||||||||
2016 | 378,950 | — | — | 266,144 | — | 9,380 | 654,474 | |||||||||||||||||||
Jeff McAllister* Chief Operating Officer | 2017 | 227,164 | — | — | 3,346,209 | 150,189 | — | 6,301 | 3,729,863 | |||||||||||||||||
Mitchell Goodman Senior Vice President, General Counsel and Secretary | 2017 | 344,615 | — | — | — | 190,747 | — | 177,887 | 713,249 | |||||||||||||||||
2016 | 324,615 | — | — | — | 227,984 | — | 11,728 | 564,327 | ||||||||||||||||||
John Vaught Senior Vice President and Chief Information Officer | 2017 | 285,846 | — | — | — | 106,009 | — | 127,193 | 519,048 | |||||||||||||||||
2016 | 267,250 | — | — | — | 133,202 | — | 8,422 | 408,874 | ||||||||||||||||||
J. Bruce Steffey * Former President | 2017 | 504,442 | — | — | — | 333,512 | — | 367,804 | 1,205,758 | |||||||||||||||||
2016 | 552,635 | — | — | — | 459,363 | — | 7,093 | 1,019,091 | ||||||||||||||||||
_________
* | Mr. McAllister joined NVI in August 2017. Mr Steffey retired from his President position in September 2017 and remains employed by the Company in a part-time capacity. |
(1) | Amounts in this column reflect the salary earned during the fiscal year. In April 2017, base salaries of each of Messrs. Goodman, Vaught and Steffey were increased and in September 2017, Mr. Fahs’ base salary was increased. Following Mr. Steffey’s retirement from the position of President in September 2017, his base salary was decreased. See “Compensation Discussion and Analysis-Compensation Elements-Base Salary” above. |
(2) | Amounts reflect the aggregate grant date fair value of option awards calculated in accordance with Financial Accounting Standards Board Accounting Standards Codification Topic 718, Compensation - Stock Compensation (“Topic 718”) and utilizing the assumptions discussed in Note 5 to our consolidated financial statements for the year ended December 31, 2017 in this Form 10-K. |
(3) | All Other Compensation for 2017 included: |
NEO | Employer 401 (k) Matching Contributions ($) (a) | Tax Services Reimbursement ($) (b) | Life Insurance Premiums ($) (c) | Disability and AD&D Insurance Premiums ($) (d) | Dividend Equivalent $ (e) | Other ($) (f) | Total ($) | ||||||||||||||
L. Reade Fahs | 2,564 | 4,650 | 360 | 2,516 | — | 13,150 | 23,240 | ||||||||||||||
Patrick R. Moore | 2,564 | — | 360 | 120 | 90,838 | — | 93,882 | ||||||||||||||
Jeff McAllister | — | — | 90 | 1,049 | — | 5,162 | 6,301 | ||||||||||||||
Mitchell Goodman | 2,564 | — | 360 | 5,399 | 169,564 | — | 177,887 | ||||||||||||||
John Vaught | 2,564 | — | 360 | 4,174 | 120,095 | — | 127,193 | ||||||||||||||
J. Bruce Steffey | 2,564 | — | 270 | 1,619 | 363,351 | — | 367,804 | ||||||||||||||
_____________ | |||||||||||||||||||||
(a) Our 401(k) plan provides for a 50% matching contribution on the first 3% of participants’ pre-tax contributions up to IRS limits. | |||||||||||||||||||||
(b) With respect to each calendar year of employment, Mr. Fahs is entitled to be reimbursed by us for the reasonable cost of tax accounting services. | |||||||||||||||||||||
(c) Each of our NEOs is entitled to basic life insurance coverage of up to two times base salary up to $500,000. | |||||||||||||||||||||
(d) Each of our NEOs is entitled to supplemental long-term disability and accidental death insurance coverage. The total benefit maximum of both the basic and supplemental disability insurance coverage is $10,000 and the maximum accidental death benefit is up to the lessor of two times base salary or $500,000. | |||||||||||||||||||||
(e) Represents a one-time cash payment made to equitably reflect the impact of the 2017 Dividend on vested options, equal to the number of vested options multiplied by an amount equal to the 2017 Dividend Amount, less any applicable withholding taxes. | |||||||||||||||||||||
(f) Represents fees paid for Mr. Fahs’ YPO membership and fees paid for Mr. McAllister’s taxable relocation expenses. | |||||||||||||||||||||
124
(4) | Amount shown reflects the proration of Mr. Fahs’ annual, performance-based cash bonus under the MIP for fiscal 2017 based on the increase in his target bonus percentage that took effect on September 1, 2017. See Part III. Item 10. “Compensation Elements - Management Incentive Plan” of this Form 10-K for additional information. |
2017 Grants of Plan-Based Awards
The following table sets forth information concerning grants of plan-based awards to the NEOs during the fiscal year ended December 30, 2017.
Estimated Possible Payouts Under Non-Equity Incentive Plan Awards(1) | Estimated Possible Payouts Under Equity Incentive Plan Awards | All other option awards: Number of securities underlying options (#)(2) | ||||||||||||||||||||||||
Name | Grant Date | Threshold ($) | Target ($) | Maximum ($) | Threshold (#) | Target (#) | Maximum (#) | Exercise or base price of option awards ($/Sh) | Grant Date Fair Value of Option Award ($)(3) | |||||||||||||||||
L. Reade Fahs | 265,712(4) | 531,423(4) | 1,021,665(4) | |||||||||||||||||||||||
Patrick R. Moore | 10/25/2017 | 92,443 | 22.00 | 848,442 | ||||||||||||||||||||||
100,000 | 200,000 | 445,000 | ||||||||||||||||||||||||
Jeff McAllister | 8/14/2017 | 43,478 (5) | 217,390(5) | 144,927 | 15.74 | 3,346,209 | ||||||||||||||||||||
56,791 | 113,582 | 252,719 | ||||||||||||||||||||||||
Mitchell Goodman | 86,154 | 172,308 | 383,385 | |||||||||||||||||||||||
John Vaught | 46,450 | 92,900 | 242,969 | |||||||||||||||||||||||
J. Bruce Steffey | 151,323 | 302,665 | 655,775 | |||||||||||||||||||||||
______________
(1) | Reflects the possible payouts of cash incentive compensation under the MIP. See “Compensation Discussion and Analysis-Compensation Elements-Management Incentive Plan” above for a description of the MIP. The actual amounts paid are described in the “Non-Equity Incentive Plan Compensation” column of the “Summary Compensation Table.” |
(2) | For Mr. Moore, reflects 2017 Post-IPO Options and for Mr. McAllister, represents the time-vesting portion of the McAllister 2017 Options, the terms of which are summarized under “Narrative to Summary Compensation Table and 2017 Grants of Plan-Based Awards” below. |
(3) | Represents the grant date fair value of the time-vesting options computed in accordance with Topic 718 and utilizing the assumptions discussed in Note 5 to our consolidated financial statements for the year ended December 31, 2017 in this Form 10-K. |
(4) | Amounts shown reflect the net proration of Mr. Fahs’ possible payouts under the MIP based on the increase in his target bonus percentage that took effect on September 1, 2017. See “Compensation Discussion and Analysis - Compensation Elements - Management Incentive Plan” for additional information. |
(5) | Reflects the performance-vesting portion of the McAllister 2017 Options, the terms of which are summarized under “Narrative to Summary Compensation Table and 2017 Grants of Plan-Based Awards” below. |
Narrative to Summary Compensation Table and 2017 Grants of Plan-Based Awards
Equity Awards. Each of our NEOs is party to a Management Stockholder’s Agreement with us. The Management Stockholder’s Agreement, along with an Option Agreement and, with respect to Mr. Vaught, an Option Rollover Agreement, generally govern each NEO’s rights with respect to shares of common stock of the Company held by such NEO, such NEO’s stock options, and, with respect to Mr. Vaught, his rollover options, and contain certain rights and obligations of the parties thereto with respect to vesting, transfer restrictions, put and call rights, tag-along rights, drag-along rights, registration rights and rights of first refusal, and certain other matters.
Vesting Terms. The Pre-IPO Options consist of 40% time-based and 60% performance-based options. With respect to the 2014 Options, the time-based options vest as to 20% of the shares subject to such option on each anniversary of the closing date of our acquisition by affiliates of KKR Sponsor, such that all of the shares subject to such time-based options will be vested and exercisable on March 13, 2019, the fifth anniversary of the closing date of our acquisition by affiliates of KKR Sponsor, subject to the holder continuing to provide services through such vesting date. The performance-based Pre-IPO Options are eligible to vest upon (i) a change in control (as defined in our 2014 Stock Incentive Plan), (ii) extraordinary dividend payment(s), (iii) a sale of shares by affiliates of KKR Sponsor into the public market or (iv) any other event or transaction (or series of events or transactions) wherein affiliates of KKR Sponsor receive cash, on a cumulative basis, in respect of their shares, which we refer to as a “Realization Event.” Upon each date that a Realization Event occurs, a percentage of the performance-based options will vest if affiliates of KKR Sponsor receive proceeds that result in the achievement of a cumulative internal rate of return equal to at least 20% and:
• | If the multiple of invested capital, or MOIC, achieved is less than two times, no portion of the performance-based options will vest; |
• | If the MOIC achieved is equal to two times, then 25% of the performance-based options will vest; and |
• | If the MOIC achieved is greater than two times, then an additional percentage of the performance-based options above 25% will vest with up to 100% of the performance-based options becoming vested upon the achievement of a MOIC equal to or greater than 5x based on the following formula: the product of (x)(1) the actual MOIC received as of the given Realization Event minus (2) the MOIC equal to two, and (y) 25%. |
125
With respect to the McAllister 2017 Options, the time-based options vest as to 20% of the shares subject to such option on each anniversary of the grant date, such that all of the shares subject to such time-based options will be vested and exercisable on the fifth anniversary of the grant date, subject to the holder continuing to provide services through the vesting date. The performance-based McAllister 2017 Options are eligible to vest as to 20% of the shares subject to such option on each of the first five concluded fiscal years following the grant date (each, an “Option Tranche”) if the Company achieves the applicable management EBITDA target for the respective fiscal year under the MIP (the “Target”) established by the Board of Directors as follows:
• | For the 2017 fiscal year, the Target shall be deemed to have been met and 100% of the 2017 Option Tranche will vest; |
• | For each of the subsequent four fiscal years, if the management EBITDA achieved in the applicable fiscal year: (i) is less than 95% of the Target, then no portion of the applicable Option Tranche will vest, (ii) is 95% of the Target, then 50% of the applicable Option Tranche will vest, (iii) exceeds 95% of the Target, then 50% plus an additional percentage of the applicable Option Tranche will vest, up to 50%, calculated linearly and (iv) is 100%, then 100% of the applicable Option Tranche will vest. |
The time-based and performance-based McAllister 2017 Options fully vest upon a change in control, subject to Mr. McAllister remaining employed with the Company on the date of such change in control.
The 2017 Post-IPO Options are time based options that will vest in three substantially equal installments on each of the first, second and third anniversaries of the grant date, subject to continued employment through the applicable vesting date. Mr. Vaught’s rollover options were fully vested as of their date of grant.
Put Rights. Prior to the later of (1) March 13, 2019 and (2) a change of control (as defined in the Management Stockholder’s Agreement), if an NEO’s employment is terminated as a result of death or disability, then such NEO has a right, subject to specified limitations and for a specified period following such termination, to cause the Company to repurchase all or any vested Pre-IPO Options for an amount equal to the product of (x) the excess, if any, of fair market value on the repurchase calculation date (as defined in the Management Stockholder’s Agreement) of a share underlying the option over the exercise price and (y) the number of options. We refer to this calculation as the “Option Formula.”
Call Rights Regarding the NEOs’ Vested Pre-IPO Options. Prior to the later of (1) March 13, 2019 and (2) a change of control, if an NEO’s employment is terminated for any reason, or in the event of a breach by an NEO of the Management Stockholder’s Agreement, including a restrictive covenant violation, the Company has the right, for a specified period following the termination of such NEO’s employment, to purchase all of such NEO’s vested options as follows:
Triggering Event | Call Price | |
Death or Disability | Option Formula | |
Termination for Cause | Options are terminated without payment | |
Termination Without Cause or for Good Reason | Option Formula | |
Termination Without Good Reason Prior to March 13, 2017 (other than due to death or Disability) | Options are terminated without payment | |
Termination Without Good Reason on or After March 13, 2017 (other than due to death or Disability) | Option Formula | |
Material Breach of Management Stockholder’s Agreement | Options are terminated without payment | |
Call Rights Regarding Mr. Vaught’s Rollover Options. Prior to the later of (1) March 13, 2019 and (2) a change of control, if Mr. Vaught’s employment is terminated for any reason, or in the event of a breach by Mr. Vaught of the Management Stockholder’s Agreement, including a restrictive covenant violation, the Company has the right, for a specified period following the termination of such NEO’s employment, to purchase all of Mr. Vaught’s vested rollover options as follows:
Triggering Event | Call Price | |
Death or Disability | Option Formula | |
Termination for Cause | Option Formula | |
Termination Without Cause or for Good Reason | Option Formula | |
Termination Without Good Reason Prior to March 13, 2017 (other than due to death or Disability) | Option Formula | |
Termination Without Good Reason on or After March 13, 2017 (other than due to death or Disability) | Option Formula | |
Material Breach of Management Stockholder’s Agreement | Option Formula | |
126
Restrictive Covenants. In addition, our NEOs have agreed to specified restrictive covenants, including an indefinite confidentiality covenant, and covenants related to non-disparagement, non-competition and non-solicitation of our employees, consultants and independent contractors at all times during the NEO’s employment, and for eighteen months thereafter.
Additional terms regarding the equity awards are summarized above under “Compensation Discussion and Analysis—Compensation Elements—Long-Term Incentive Awards” and under “Potential Payments upon Termination or Change in Control” below. See also Part III. Item 13. “Certain Relationships and Related Transactions, and Director Independence” of this Form 10-K for additional information regarding the Management Stockholder’s Agreements.
Outstanding Equity Awards at 2017 Fiscal Year End
The following table sets forth information regarding outstanding equity awards made to our NEOs as of December 30, 2017.
Name | Grant Date | Number of Securities Underlying Unexercised Options (#) Exercisable (1) | Number of Securities Underlying Unexercised Options (#) Unexercisable (2) | Equity Incentive Plan Awards: Number of Securities Underlying Unexercised Unearned Options (#) (3) | Option Exercise Price ($) (4) | Option Expiration Date (5) | ||||||
L. Reade Fahs | 3/13/2014 | - | 244,117 | 915,438 | 4.27 | 3/13/2024 | ||||||
Patrick R. Moore | 9/16/2014 | 21,360 | 42,720 | 160,201 | 4.27 | 9/16/2024 | ||||||
9/16/2014 | 21,360 | - | - | 7.25 | 9/16/2024 | |||||||
9/16/2014 | 9,154 | - | - | 8.23 | 9/16/2024 | |||||||
10/25/2017 | - | 92,443 | - | 22.00 | 10/25/2027 | |||||||
Jeff McAllister | 8/14/2017 | 43,478 | 144,927 | 173,912 | 15.74 | 8/14/2027 | ||||||
Mitchell Goodman | 3/13/2014 | 28,480 | 56,960 | 213,602 | 4.27 | 3/13/2024 | ||||||
3/13/2014 | 28,480 | - | - | 7.25 | 3/13/2024 | |||||||
3/13/2014 | 28,480 | - | - | 8.23 | 3/13/2024 | |||||||
John Vaught | 4/11/2013 (6) | 13,490 | - | - | 1.66 | 4/11/2023 | ||||||
3/13/2014 | 13,426 | 26,853 | 100,698 | 4.27 | 3/13/2024 | |||||||
3/13/2014 | 13,426 | - | - | 7.25 | 3/13/2024 | |||||||
3/13/2014 | 13,426 | - | - | 8.23 | 3/13/2024 | |||||||
J. Bruce Steffey | 3/13/2014 | 61,029 | 122,058 | 457,719 | 4.27 | 3/13/2024 | ||||||
3/13/2014 | 61,029 | - | - | 7.25 | 3/13/2024 | |||||||
3/13/2014 | 61,029 | - | - | 8.23 | 3/13/2024 | |||||||
_____________
(1) | The numbers in this column represent vested and exercisable time-based and performance-based options and, for Mr. Vaught, also represent vested and exercisable rollover options. |
(2) | The numbers in this column represent unvested outstanding time-based options. The time-based 2014 Options vest as to 20% of the shares subject to such option on each anniversary of the closing date of our acquisition by affiliates of KKR Sponsor, subject to the holder continuing to provide services through such vesting date. The time-based McAllister 2017 Options vest as to 20% of the shares subject to such option on each anniversary of the grant date, subject to the holder continuing to provide services through such vesting date. The 2017 Post-IPO Options will vest in three substantially equal installments on each of the first, second and third anniversaries of the grant date, subject to continued employment through the applicable vesting date. See “Narrative to Summary Compensation Table and 2017 Grants of Plan-Based Awards-Equity Awards-Vesting Terms.” Vesting of the time-based options will be accelerated upon a change in control that occurs while the executive is still employed by us, as described under “Potential Payments upon Termination or Change in Control” below. |
(3) | The numbers in this column represent unvested outstanding performance-based options. The performance-based pre-IPO Options are eligible to vest upon a Realization Event as follows: (i) If the MOIC achieved is less than two times, no portion of the performance-based options will vest; (ii) If the MOIC achieved is equal to two times, then 25% of the performance-based options will vest; and (iii) If the MOIC achieved is greater than two times, then an additional percentage of the performance-based options above 25% will vest with up to 100% of the performance-based options becoming vested upon the achievement of a MOIC equal to or greater than 5x based on the following formula: the product of (x)(1) the actual MOIC received as of the given Realization Event minus (2) the MOIC equal to two, and (y) 25%. The performance-based McAllister 2017 Options are eligible to vest as to each Option Tranche (20% of the shares subject to such option) on each of the first five concluded fiscal years following the grant date if the Company achieves the applicable management EBITDA Target established by the Board of Directors as follows: (i) for the 2017 fiscal year, the Target shall be deemed to have been met and 100% of the 2017 Option Tranche will vest; (ii) for each of the subsequent four fiscal years, if the management EBITDA achieved in the applicable fiscal year: (i) is less than 95% of the Target, then no portion of the applicable Option Tranche will vest, (ii) is 95% of the Target, then 50% of the applicable Option Tranche will vest, (iii) exceeds 95% of the Target, then 50% plus an additional percentage of the applicable Option Tranche will vest, up to 50%, calculated linearly and (iv) is 100%, then 100% of the applicable Option Tranche will vest. See “Narrative to Summary Compensation Table and 2017 Grants of Plan-Based Awards-Equity Awards-Vesting Terms.” None of the outstanding performance-based options have vested. |
127
(4) | In connection with our acquisition by affiliates of KKR Sponsor, the exercise price of Mr. Vaught’s rollover options was adjusted to $2.42 per option. The exercise price for Mr. Vaught’s rollover options was further adjusted in 2015 as a result of an extraordinary dividend payment to $1.66 per option. The exercise prices for outstanding time-based and performance-based options were also adjusted as a result of the 2015 extraordinary dividend payment as follows: unvested time-based and performance-based options were adjusted to $7.25 per option and vested time-based options were adjusted to $8.23 per option. In February 2017, the exercise prices for outstanding unvested time-based and performance-based options were further adjusted to $4.27 per option as a result of an extraordinary dividend payment. |
(5) | The expiration date shown is the normal expiration date occurring on the tenth anniversary of the grant date. Options may terminate earlier in certain circumstances, such as in connection with an NEO’s termination of employment or in connection with certain corporate transactions, including a change in control of the Company. |
(6) | Represents the original grant date of Mr. Vaught’s rollover options. See “Compensation Discussion and Analysis-Compensation Elements-Long-Term Incentive Awards.” |
2017 Option Exercises and Stock Vested
The following table provides information regarding options exercised by the NEOs during the fiscal year ended December 30, 2017.
Option Awards | ||||
Name | Number of Shares Acquired on Exercise (#) | Value Realized on Exercise ($)(1) | ||
L. Reade Fahs | 122,058 | 932,828 | ||
Patrick R. Moore | — | — | ||
Jeff McAllister | — | — | ||
Mitchell Goodman | — | — | ||
John Vaught | — | — | ||
J. Bruce Steffey | — | — | ||
______________ | ||||
(1) Represents the difference between the fair market value of the shares acquired on exercise, on the exercise date multiplied by the exercise price of the option. | ||||
2017 Pension Benefits
We have no defined pension benefit plans for our executive officers.
2017 Non-Qualified Deferred Compensation
We have no non-qualified defined contribution or other non-qualified deferred compensation plans for our executive officers.
Potential Payments upon Termination or Change in Control
The following section describes the payments and benefits that may become payable to the NEOs in connection with their termination of employment and/or a change in control. All such payments and benefits will be paid or provided by us or National Vision, Inc. Consistent with SEC requirements, these estimated amounts have been calculated as if the NEO’s employment had been terminated as of December 30, 2017, the last day of fiscal 2017, and using the closing market price of our Common Stock on December 29, 2017, the last trading day in 2017 ($40.61 per share). For purposes of this section, we have assumed that (1) we do not exercise any discretion to accelerate the vesting of outstanding options in connection with a change in control, and (2) the value of any stock options that may be accelerated is equal to the full value of such awards (i.e., the full “spread” value for stock options as of December 30, 2017).
Severance Plan
The Severance Plan provides for severance payments and benefits to eligible employees, including our NEOs, upon a qualifying termination of employment, which includes a termination of employment for one or more of the following reasons, as determined by the Company: (1) lack of work, (2) reorganization, (3) business necessity, (4) economic condition, (5) termination of employment by us without “Cause” or (6) termination of employment by the executive for “Good Reason.” In the event of a qualifying termination of employment, the Severance Plan provides for the following payments and benefits:
• | Severance in an amount equal to 12 months of the executive’s annual base salary, payable over the 12-month period following the date of such qualifying termination; and |
• | If the executive has executed a non-compete and restrictive covenant agreement, which we refer to as the “Non-Compete Agreement,” with the Company on or after July 21, 2011, has not violated the Non-Compete Agreement and has properly elected COBRA continuation coverage, Company-paid COBRA premiums for up to 12 months, which we refer to as the “COBRA Benefit.” |
128
Certain executives who are designated by our Board of Directors and participate in the Company’s MIP are eligible for certain severance payments and benefits in lieu of the severance payments and benefits described above in the event of a qualifying termination of employment pursuant to an Executive Supplement to the Severance Plan. As of December 30, 2017, Messrs. Fahs, Goodman and Moore were eligible to participate in the Executive Supplement to the Severance Plan.
The payments and benefits under the Executive Supplement to the Severance Plan in the event of a qualifying termination of employment include the following:
• | Severance in an amount equal to 24 months of the executive’s annual base salary, payable over the 24-month period following the date of such qualifying termination; |
• | An amount equal to 30% of the executive’s annual base salary, payable over the 24-month period following the date of such qualifying termination; and |
• | The COBRA Benefit. |
As a condition to receiving severance payments and benefits under the Severance Plan, executives are required to execute a severance agreement which includes a release of claims against the Company and certain restrictive covenants. Such restrictive covenants include prohibiting the executive from:
• | Disparaging the Company or any officer, director or employee of the Company; |
• | Disclosing or using any confidential information or trade secrets of the Company; and |
• | Engaging in any activities, directly or indirectly, which have the effect of disrupting the Company’s operations or harming the Company’s reputation with its customers, suppliers or employees. |
If an executive is found to have violated the terms of the Severance Plan, severance agreement or Non-Compete Agreement, the Company may initiate proceedings to recover any severance payments the executive received under the Severance Plan.
“Cause” generally means the following act(s) by an executive, after written notification to the executive by the Company of its demand for the executive to cure such act(s), and a failure by the executive to cure such act(s):
• | Commission of an act or acts of fraud, dishonesty, gross negligence or willful misconduct of his or her duties that does, or could, if continued or repeated, result directly or indirectly in significant gain or personal enrichment to the executive at the expense of the Company or in injury to the Company; |
• | Commission of an act or acts constituting any felony or any criminal act involving moral turpitude, or any other criminal act involving dishonesty, disloyalty, fraud or theft with respect to the Company; or |
• | Material breach of any agreement under which he or she has committed to confidentiality, nondisclosure or non-solicitation protections for the Company. |
“Good Reason” generally means a termination of employment upon the occurrence (without express written consent of the executive) of any of the following acts by the Company, or failure by the Company to act, and such act or failure to act has not been corrected within thirty (30) days after the executive provides written notice to the Company of such act or failure to act:
• | A significant, adverse change by the Company in the executive’s employment responsibilities; |
• | A reduction in base salary; |
• | Relocation without the executive’s consent to a location more than fifty (50) miles from the executive’s principal office in the Atlanta metropolitan area, except for required travel on the Company’s business; or |
• | Failure by the Company, without the executive’s consent, to pay any portion of the executive’s current compensation or any portion of an installment of deferred compensation within seven days of the date such compensation is due. |
Pre-IPO Options
Effect of Change in Control on Vesting of Time-Based and Performance-Based Options. Upon a change in control (as defined in the 2014 Stock Incentive Plan), unvested time options would become immediately vested and exercisable. Upon a change in control, performance options would become vested and exercisable up to the following percentage (to the extent not already vested up to or in excess of the following percentage):
• | If the MOIC is less than two times, no portion of the performance-based options will vest; |
• | If the MOIC achieved is at least equal to two times, then 25% of the performance-based options will vest; and |
• | If the MOIC achieved is greater than two times, then an additional percentage of the performance-based options above 25% will vest with up to 100% of the performance-based options becoming vested upon the achievement of a MOIC equal to or greater than 4x based on the following formula: the product of (x)(i) the actual MOIC achieved on the change in control minus (ii) the MOIC equal to two, and (y) 37.5%. |
Any portion of the performance-based options that do not vest on a change in control will immediately expire on the date of such change in control.
129
Effect of Death or Disability on Vesting. Upon a termination of an NEO’s employment with the Company by reason of death or disability, the next installment of time-based options that would have become exercisable on the next vesting date following the date of such termination of employment will become vested and exercisable.
Effect of Other Terminations of Employment. Except as set forth above with respect to the effect of death or disability on vesting of time-based options, unvested options will not become vested and exercisable following termination of employment with us for any reason and any option that is unvested as of the date of termination of employment will immediately expire.
2017 Post-IPO Options.
Effect of Change in Control on Vesting. Upon a change in control (as defined below in the 2017 Omnibus Incentive Plan), unvested time-based options would become immediately vested and exercisable.
Effect of Death or Disability on Vesting. Upon a termination of an NEO’s employment with the Company by reason of death or disability, the next installment of time-based options that would have become exercisable on the next vesting date following the date of such termination of employment will become vested and exercisable.
Effect of Other Terminations of Employment. Except as set forth above with respect to the effect of death or disability on vesting of time-based options, unvested options will not become vested and exercisable following termination of employment with us for any reason and any option that is unvested as of the date of termination of employment will immediately expire.
Quantification of Payments upon Termination or Change in Control. The following table lists the payments and benefits that would have been triggered for each of our NEOs under the circumstances described below assuming that the applicable triggering event occurred on December 30, 2017.
Named Executive Officer | Severance Benefit ($)(1) | Continuation of Health Benefits ($)(2) | Value of Accelerated Stock Options ($)(3) | ||||||
L. Reade Fahs | |||||||||
Qualifying Termination of Employment | 2,070,000 | — | — | ||||||
Change in Control | — | — | 8,871,212 | ||||||
Termination Upon Death or Disability | — | — | 4,435,606 | ||||||
Patrick R. Moore | |||||||||
Qualifying Termination of Employment | 920,000 | — | — | ||||||
Change in Control | — | — | 3,272,809 | ||||||
Termination Upon Death or Disability | — | — | 1,349,677 | ||||||
Jeff McAllister | |||||||||
Qualifying Termination of Employment | 1,293,675 | 3,849 | — | ||||||
Change in Control | — | — | 3,604,334 | ||||||
Termination Upon Death or Disability | — | — | 720,867 | ||||||
Mitchell Goodman | |||||||||
Qualifying Termination of Employment | 805,000 | 15,397 | — | ||||||
Change in Control | — | — | 2,069,926 | ||||||
Termination Upon Death or Disability | — | — | 1,034,963 | ||||||
John Vaught | |||||||||
Qualifying Termination of Employment | 288,000 | 15,397 | — | ||||||
Change in Control | — | — | 975,838 | ||||||
Termination Upon Death or Disability | — | — | 487,919 | ||||||
J. Bruce Steffey | |||||||||
Qualifying Termination of Employment | — | — | — | ||||||
Change in Control | — | — | 4,435,588 | ||||||
Termination Upon Death or Disability | — | — | 2,217,794 | ||||||
130
______________
(1) | Amounts reported for Messrs. Fahs, Moore, McAllister, Goodman and Steffey represent 24 months of the executive’s annual base salary plus an amount equal to 30% of the executive’s annual base salary. Amount reported for Mr. Vaught represents 12 months of the executive’s annual base salary. |
(2) | The amounts reported represent the cost of providing each applicable NEO with COBRA continuation coverage for group health benefits for a period of 12 months following the date of termination. |
(3) | The amounts reported represent accelerated vesting of unvested options as described above under “Pre-IPO Options” and “2017 Post-IPO Options,” and are based on the closing price of our common stock of $40.61 per share on December 29, 2017, the last trading day in 2017. The amounts reported for Messrs. Fahs, Moore, Steffey, Goodman and Vaught reflect the “spread” value of $36.34 per share for the 2014 Options, representing the difference between the exercise price of $4.27 and the closing price on December 29, 2017. The amount reported for Mr. Moore also includes the difference between the exercise price of $22.00 per share for the 2017 Post-IPO Options and the closing price on December 29, 2017. The amount reported for Mr. Moore reflects the “spread” value of $18.61 per share representing the difference between the exercise price of $22.00 and the closing price on December 29, 2017. The amount reported for Mr. McAllister reflects the “spread” value of $24.87 per share for the McAllister 2017 Options, representing the difference between the exercise price of $15.74 and the closing price on December 29, 2017. |
Compensation Committee Interlocks and Insider Participation
During fiscal 2017, our compensation committee was composed of Messrs. Taylor and Gernburd, neither of whom has at any time been one of our executive officers or employees. None of our executive officers served as a member of the compensation committee (or other committee serving an equivalent function) or a director of any other entity whose executive officers served on our compensation committee or board of directors. Messrs. Taylor and Gernburd are affiliates of KKR. We are parties to certain transactions with KKR described in Part III. Item 13. “Certain Relationships and Related Transactions, and Director Independence” of this Form 10-K.
Director Compensation
Directors who are our employees or are associated with our Sponsors do not receive remuneration for serving on our Board. Non-employee directors receive an annual cash retainer of $75,000, paid quarterly, in arrears. The Chair of each of the audit committee and the compensation committee receives an additional annual cash retainer of $20,000, paid quarterly, in arrears. In addition, each non-employee director receives an annual $100,000 restricted stock grant. The shares of restricted stock vest in three equal installments on each of the first, second and third anniversaries of the grant date, subject to continued service through the applicable vesting date. Upon the occurrence of a change in control, all shares of restricted stock fully vest. Upon any termination of a director’s service, all unvested shares of restricted stock will be forfeited. Our directors are not paid any fees for attending meetings. However, our directors are reimbursed for reasonable travel and related expenses associated with attendance at board or committee meetings.
The following table reflects the fees earned by our non-employee directors for service in fiscal 2017:
Name | Fees earned or paid in cash ($) | Stock awards ($)(1) | All other compensation ($) | Total ($) | ||||
Nataniel H. Taylor | — | — | — | — | ||||
Felix Gernburd | — | — | — | — | ||||
Virginia A. Hepner(2) | — | — | — | — | ||||
D. Randolph Peeler | — | — | — | — | ||||
David M. Tehle(3) | 18,750 | 100,000 | — | 118,750 | ||||
______________
(1) | The amount reported reflects the grant date fair value associated with the grant to Mr. Tehle of 6,357 shares of restricted stock on July 24, 2017 under the 2014 Stock Incentive Plan. As of December 30, 2017, Mr. Tehle held 6,357 shares of restricted stock. |
(2) | Ms. Hepner joined our Board on January 22, 2018 and therefore did not receive any compensation for the year ended December 30, 2017. |
(3) | Mr. Tehle joined our Board on July 17, 2017 and his cash retainer was prorated for his partial year of service. |
131
Item 12. Security Ownership of Certain Beneficial Owners and Management and Related Stockholder Matters
Beneficial Ownership of National Vision Common Stock
The following table and accompanying footnotes set forth information with respect to the beneficial ownership of our common stock as of February 28, 2018 by (1) each individual or entity known by us to beneficially own more than 5% of our outstanding common stock, (2) each of our named executive officers, (3) each of our directors and (4) all of our directors and our executive officers as a group. As of February 28, 2018, there were 74,656,175 shares of our common stock, par value $0.01 per share, outstanding.
A person is a “beneficial owner” of a security if that person has or shares “voting power,” which includes the power to vote or to direct the voting of the security, or “investment power,” which includes the power to dispose of or to direct the disposition of the security or has the right to acquire such powers within 60 days.
To our knowledge, unless otherwise noted in the footnotes to the following table, and subject to applicable community property laws, the persons named in the table have sole voting and investment power with respect to their beneficially owned common stock.
Securities subject to option grants that have vested or will vest within 60 days are deemed outstanding for calculating the percentage ownership of the person holding the options, but are not deemed outstanding for calculating the percentage ownership of any other person.
Except as otherwise indicated in the footnotes below, the address of each beneficial owner is c/o National Vision Holdings, Inc., 2435 Commerce Avenue, Bldg. 2200, Duluth, Georgia 30096.
Name of Beneficial Owner | Number | Percentage of Total Common Stock (1) | ||||
Greater than 5% Stockholders: | ||||||
KKR Vision Aggregator L.P. (2) | 43,475,462 | 58.24 | % | |||
Investment funds affiliated with Berkshire (3) | 10,171,541 | 13.62 | % | |||
Name Executive Officers and Directors: | ||||||
L. Reade Fahs (4) | 1,098,526 | 1.47 | % | |||
Patrick R. Moore | 120,454 | * | ||||
Jeff McAllister | 118,250 | * | ||||
Mitchell Goodman | 215,635 | * | ||||
John Vaught | 67,195 | * | ||||
Bruce Steffey | 498,404 | |||||
Nathaniel H. Taylor (2) | - | - | ||||
Felix Gernburd (2) | - | - | ||||
D. Randolph Peeler (5) | - | - | ||||
David M. Tehle | 6,357 | * | ||||
Virginia A. Hepner | 2,363 | * | ||||
All directors and executive officers as a group (14 persons) | 2,384,724 | 3.19 | % | |||
____________
(*) | Less than one percent. |
(1) | The number of shares reported includes shares covered by options that are exercisable within 60 days as follows: Mr. Fahs, 122,059; Mr. Moore, 73,234; Mr. Goodman, 113,920; Mr. Vaught, 67,195; and all directors and executive officers as a group, 808,029. |
(2) | Includes 43,475,462 shares directly owned by KKR Vision Aggregator L.P. KKR Vision Aggregator GP LLC, as the general partner of KKR Vision Aggregator L.P., KKR North America Fund XI L.P., as the sole member of KKR Vision Aggregator GP LLC, KKR Associates North America XI L.P., as the general partner of KKR North America Fund XI L.P., KKR North America XI Limited, as the general partner of KKR Associates North America XI L.P., KKR Fund Holdings L.P., as the sole shareholder of KKR North America XI Limited, KKR Fund Holdings GP Limited, as a general partner of KKR Fund Holdings L.P., KKR Group Holdings L.P., as the sole shareholder of KKR Fund Holdings GP Limited and a general partner of KKR Fund Holdings L.P., KKR Group Limited, as the general partner of KKR Group Holdings L.P., KKR & Co. L.P., as the sole shareholder of KKR Group Limited, KKR Management LLC, as the general partner of KKR & Co. L.P., and Messrs. Henry R. Kravis and George R. Roberts, as the designated members of KKR Management LLC, may be deemed to be the beneficial owners having shared voting and investment power with respect to the shares described in this footnote. The principal business address of each of the entities and persons identified in this paragraph, except Mr. Roberts, is c/o Kohlberg Kravis Roberts & Co. L.P., 9 West 57th Street, Suite 4200, New York, NY 10019. The principal business address for Mr. Roberts is c/o Kohlberg Kravis Roberts & Co. L.P., 2800 Sand Hill Road, Suite |
132
200, Menlo Park, CA 94025. Each of Messrs. Taylor and Gernburd is a member of our Board of Directors and serves as an executive of Kohlberg Kravis Roberts & Co. L.P. and/or one or more of its affiliates. Each of Messrs. Kravis, Roberts, Taylor and Gernburd disclaims beneficial ownership of the shares held by KKR Vision Aggregator L.P. The principal business address of each of Messrs. Taylor and Gernburd is c/o Kohlberg Kravis Roberts & Co. L.P., 9 West 57th Street, New York, New York 10019.
(3) | Represents (i) 9,988,898 shares of common stock held by Berkshire Fund VI, Limited Partnership, or Fund VI, (ii) 129,780 shares of common stock held by Berkshire Investors LLC, or Berkshire Investors, and (iii) 52,863 shares of common stock held by Berkshire Investors III LLC, or Berkshire Investors III. Sixth Berkshire Associates LLC, or 6BA, is the general partner of Fund VI. 6BA is managed by a number of individuals who are managing directors of Berkshire, including D. Randolph Peeler who serves as one of our directors. Certain of the managing directors of Berkshire, including Mr. Peeler, are also the managing members of Berkshire Investors and Berkshire Investors III. Fund VI, Berkshire Investors and Berkshire Investors III often make acquisitions in, and dispose of, securities of an issuer on the same terms and conditions and at the same time. Berkshire is the investment adviser to Fund VI. Berkshire Partners Holdings LLC, or BPH, is the general partner of BPSP, L.P., or BPSP, which is the managing member of Berkshire. BPH, BPSP, Berkshire, Fund VI, 6BA, Berkshire Investors and Berkshire Investors III may be deemed to constitute a “group” for purposes of Section 13(d) of the Exchange Act although they do not admit to being part of a group nor have they agreed to act as part of a group. By virtue of the relationships described above, each of BPH, BPSP and 6BA may be deemed to share beneficial ownership with respect to the shares of common stock held by Fund VI. The principal business address of each of the entities identified in this paragraph is c/o Berkshire Partners LLC, 200 Clarendon St., 35th Floor, Boston, MA 02116. |
(4) | Includes shares held by the Fahs Family Trust. |
(5) | Excludes shares held by investment funds affiliated with Berkshire. See footnote (3) above. |
Equity Compensation Plan Information
All numbers in the following table are as of December 30, 2017.
Plan category | Number of securities to be issued upon exercise of outstanding options, warrants and rights (a) | Weighted-average exercise price of outstanding options, warrants and rights (b) | Number of securities remaining available for future issuance under equity compensation plans (excluding securities reflected in column (a)) (c) | |||
Equity compensation plans approved by security holders | 10,608,559(1) | $6.55 | 3,794,871(2) | |||
Equity compensation plans not approved by security holders | — | — | — | |||
Total | 10,608,559 | $6.55 | 3,794,871 | |||
____________
(1) | Includes 169,049 shares issuable pursuant to outstanding options under the 2013 Stock Incentive Plan. The weighted-average exercise price of such options is $1.66. Includes10,347,067 shares issuable pursuant to outstanding options under the 2014 Stock Incentive Plan. The weighted-average exercise price of such options is $6.49. Includes 92,443 shares issuable pursuant to outstanding options under the 2017 Omnibus Incentive Plan. The weighted-average exercise price of such options is $22.00. |
(2) | Includes 69,452 shares that can be issued pursuant to future awards under the 2014 Stock Incentive Plan. Also includes 3,725,419 shares that can be issued pursuant to future awards under the 2017 Omnibus Incentive Plan. |
Item 13. Certain Relationships and Related Transactions, and Director Independence
Related Persons Transaction Policy
In connection with our IPO, our Board of Directors adopted a written related person transaction policy that sets forth the policies and procedures for the review and approval or ratification of related person transactions. This policy covers, with certain exceptions set forth in Item 404 of Regulation S-K under the Securities Act, any transaction, arrangement or relationship, or any series of similar transactions, arrangements or relationships, in which we were or are to be a participant, where the amount involved exceeds $120,000 and a related person had or will have a direct or indirect material interest, including, without limitation, purchases of goods or services by or from the related person or entities in which the related person has a material interest, indebtedness, guarantees of indebtedness and employment by us of a related person. It is our policy that no related person transaction will be executed without the approval or ratification of the disinterested members of the Board or a committee of the Board.
Certain Related Person Transactions
133
Stockholders Agreement. In connection with our IPO, we entered into a stockholders agreement with the Sponsors. This agreement grants the Sponsors the right to nominate to our board of directors a number of designees equal to: (A) in the case of private equity funds managed by Berkshire, one director so long as such funds and its affiliates collectively beneficially own at least 5% of the outstanding shares of our common stock and (B) in the case of affiliates of KKR Sponsor, (i) at least a majority of the total number of directors comprising our board of directors at such time as long as affiliates of KKR Sponsor beneficially own at least 50% of the outstanding shares of our common stock; (ii) at least 40% of the total number of directors comprising our board of directors at such time as long as affiliates of KKR Sponsor beneficially own at least 40% but less than 50% of the outstanding shares of our common stock; (iii) at least 30% of the total number of directors comprising our board of directors at such time as long as affiliates of KKR Sponsor beneficially own at least 30% but less than 40% of the outstanding shares of our common stock; (iv) at least 20% of the total number of directors comprising our board of directors at such time as long as affiliates of KKR Sponsor beneficially own at least 20% but less 30% of the outstanding shares of our common stock; and (v) at least 10% of the total number of directors comprising our board of directors at such time as long as affiliates of KKR Sponsor beneficially own at least 5% but less than 20% of the outstanding shares of our common stock. For purposes of calculating the number of directors that affiliates of KKR Sponsor are entitled to nominate pursuant to the formula outlined above, any fractional amounts would be rounded up to the nearest whole number and the calculation would be made on a pro forma basis, taking into account any increase in the size of our board of directors (e.g., one and one quarter (11∕4) directors shall equate to two directors). In addition, in the event a vacancy on the board of directors is created by the death, disability, retirement or resignation of a Sponsor director designee, private equity funds managed by Berkshire or affiliates of KKR Sponsor, as applicable, who designated such director shall, to the fullest extent permitted by law, have the right to have the vacancy filled by a new Sponsor director-designee.
In addition, the stockholders agreement grants to affiliates of KKR Sponsor special governance rights, for as long as affiliates of KKR Sponsor maintain ownership of at least 25% of our outstanding common stock, including rights of approval over certain corporate and other transactions such as mergers or other transactions involving a change in control and certain rights regarding the appointment of our chief executive officer.
Registration Rights Agreement. In connection with the KKR Acquisition, we entered into a registration rights agreement with the Sponsors and with other persons who may become party thereto. Subject to certain conditions, the registration rights agreement provides certain affiliates of KKR Sponsor with an unlimited number of “demand” registrations, and provides certain affiliates of Berkshire with two “demand” registrations following an initial public offering. Under the registration rights agreement, all holders of registrable securities party thereto are provided with customary “piggyback” registration rights following an initial public offering, with certain exceptions. The registration rights agreement also provides that we will pay certain expenses of these holders relating to such registrations and indemnify them against certain liabilities which may arise under the Securities Act.
Monitoring Agreement. In connection with the KKR Acquisition, NVI entered into a monitoring agreement (the “Monitoring Agreement”) with KKR Sponsor and Berkshire pursuant to which the Sponsors provide management and advisory services to NVI and receive fees and reimbursements of related out-of-pocket expenses. The Monitoring Agreement was terminated automatically in accordance with its terms upon the consummation of the IPO and we paid termination fees of approximately $3.6 million and $0.8 million to KKR Sponsor and Berkshire, respectively.
We also recorded the following expenses related to management and/or advisory fees: we paid management and/or advisory fees of $0.7 million to KKR Sponsor and $0.2 million to Berkshire in fiscal year 2017 prior to the termination of the Monitoring Agreement in October 2017, $0.8 million to KKR Sponsor and $0.2 million to Berkshire in fiscal year 2016, $3.5 million to KKR Sponsor and $0.2 million to Berkshire in fiscal year 2015.
Fees paid to KKR Sponsor and Berkshire included retainer fees and certain other project-oriented initiatives and are presented in selling, general and administrative expenses in our consolidated statements of operations and comprehensive income (loss), with the exception of $2.1 million in fees paid to KKR Sponsor and its affiliates for expenses related to new debt issued during the second quarter of fiscal year 2015 and $2.3 million in fees paid to KKR Sponsor and its affiliates for expenses related to debt issuance costs in fiscal year 2017, which are recorded in debt issuance costs in our consolidated statements of operating and comprehensive income (loss).
Indemnification Agreement with KKR Sponsor and Berkshire. In connection with the KKR Acquisition, we and certain of our subsidiaries entered into an indemnification agreement (the “Indemnification Agreement”) with each of KKR Sponsor and Berkshire, whereby the parties agreed to customary exculpation and indemnification provisions in favor of KKR Sponsor and Berkshire in connection with certain transactions, including in connection with the services provided under the Monitoring Agreement.
Relationship with KKR Capital Markets. KKR Capital Markets LLC (“KCM”), an affiliate of KKR Sponsor, acted as an arranger and bookrunner for various financing transactions under our first lien and second lien credit agreements,
134
and received underwriter and transaction fees totaling approximately $2.6 million in fiscal year 2017 and $2.0 million in fiscal year 2015.
KCM also acted as an underwriter in our IPO and received underwriting discounts and commissions of $4.8 million.
KKR Corporate Lending LLC, an affiliate of KKR Capital Markets LLC, has been a participating lender under our revolving credit facility since 2014 and as of December 30, 2017, had received interest payments of approximately $0.9 million.
Relationship with KKR Credit. Investment funds or accounts managed or advised by the global credit business of KKR & Co. (collectively “KKR Credit”) have been participating lenders under our first lien and second lien credit agreements since 2014, and as of December 30, 2017, had received aggregate principal payments of approximately $15.4 million and interest or other associated payments relating to their holdings of debt of approximately $2.4 million. As of December 30, 2017, investment funds or accounts managed or advised by KKR Credit held a portion of our outstanding principal balance of our first lien term loans.
Relationship with KKR Capstone. We have utilized and may continue to utilize KKR Capstone Americas LLC and/or its affiliates, or KKR Capstone, a consulting company that works exclusively with portfolio companies of KKR & Co. and its affiliated funds for consulting services, and have paid to KKR Capstone related fees and expenses. KKR Capstone is not a subsidiary or affiliate of KKR & Co. KKR Capstone operates under several consulting agreements with KKR & Co. and uses the “KKR” name under license from KKR & Co.
Management Stockholder’s Agreements. In connection with the KKR Acquisition and thereafter, we entered into management stockholder’s agreements, or Management Stockholder’s Agreements, with certain of our senior executive officers and other employees who made an equity investment in us or were granted equity based awards.
The Management Stockholder’s Agreements impose significant restrictions on transfers of shares of our common stock held by management stockholders. Generally, shares will be nontransferable by any means at any time prior to the later of a “Change in Control” (as defined in the applicable Management Stockholder’s Agreement) or the fifth anniversary of the closing date of the KKR Acquisition, or March 13, 2019, except (i) a sale of shares of common stock pursuant to an effective registration statement under the Securities Act filed by the Company in accordance with the applicable Management Stockholder’s Agreement upon the proper exercise of certain “piggyback” registration rights (described below), (ii) certain transfers to a management stockholder’s estate or trust in accordance with the applicable Management Stockholder’s Agreement, (iii) transfers approved by our Board of Directors in writing (such approval being in the sole discretion of our Board of Directors) or (iv) transfers to us or our designee.
The Management Stockholder’s Agreements also provide for management stockholders’ ability to cause us to repurchase their outstanding stock and options in the event of their death or disability, and for our ability to cause a management stockholder to sell his or her stock or options back to the Company upon certain termination events.
Additionally, management stockholders have limited “piggyback” registration rights with respect to their shares of common stock.
Sale Participation Agreements. The Sale Participation Agreements granted management stockholders the right to participate in any private direct or indirect sale of shares of common stock by certain affiliates of KKR Sponsor (such right being referred to herein as the “Tag-Along Right”), and required such management stockholders to participate in any such private sale if so elected by such affiliates of KKR Sponsor in the event that they are proposing to sell stock in a transaction that would constitute a Change in Control (as defined in the Management Stockholder’s Agreements, as applicable) (such right being referred to herein as the “Drag-Along Right”). The Sale Participation Agreements were terminated in accordance with their terms upon the consummation of the IPO.
Agreements with Directors and Officers. In addition, we have certain agreements with our directors and officers which are described in Part III. Item 11. “Executive Compensation” of this Form 10-K.
In connection with our IPO, we entered into indemnification agreements with our directors. These agreements and our amended and restated bylaws require us to indemnify these individuals to the fullest extent permitted under Delaware law against liabilities that may arise by reason of their service to us, and to advance expenses incurred as a result of any proceeding against them as to which they could be indemnified. The indemnification provided under the indemnification agreements is not exclusive of any other indemnity rights. Insofar as indemnification for liabilities arising under the Securities Act may be permitted to directors, we have been informed that in the opinion of the SEC such indemnification is against public policy and is therefore unenforceable. There is currently no pending material litigation or proceeding involving any of our directors for which indemnification is sought.
Director Independence
135
The disclosure included in Item 10 of the report under the heading “Composition of the Board of Directors” is incorporated by reference into this Item 13.
Item 14. Principal Accountant Fees and Services
Audit Committee Pre-Approval of Audit and Permissible Non-Audit Services
Consistent with SEC policies regarding auditor independence and the Audit Committee’s charter, the Audit Committee has responsibility for engaging, setting compensation for and reviewing the performance of the independent registered public accounting firm. In exercising this responsibility, the Audit Committee has adopted policies and procedures relating to the approval of all audit and non-audit services that are to be performed by our independent registered public accounting firm and pre-approves all audit and permitted non-audit services provided by any independent registered public accounting firm prior to each engagement. Effective with the completion of our IPO, the Audit Committee, prior to such engagement, pre-approves independent public accounting firm services within each category and the fees of each category are budgeted. During the year, circumstances may arise when it may become necessary to engage the independent registered public accounting firm for additional services not contemplated in the original pre-approval categories. In those instances, the Audit Committee requires specific pre-approval before engaging the independent registered public accounting firm.
Audit and Non-Audit Fees
The following table presents fees for professional services rendered by our independent registered public accounting firm, Deloitte & Touche LLP,(“Deloitte”) for the audit of our financial statements for 2017 and 2016 and for fees billed for other services rendered by Deloitte during those periods.
In thousands | Fiscal Year 2017 | Fiscal Year 2016 | |||
Audit fees(1) | 2,420 | 817 | |||
Audit-related fees(2) | 397 | 293 | |||
Tax fees(3) | 6 | 89 | |||
All other fees | — | — | |||
Total | 2,823 | 1,199 | |||
(1) | Includes the aggregate fees for professional services rendered for the audit of the Company’s annual financial statements and the quarterly reviews of its financial statements, assistance with documents filed with the SEC, and assistance with documents related to our IPO process. |
(2) | Represents amounts for due diligence services. |
(3) | Includes the aggregate fees for professional services rendered for tax compliance, and tax consultation and planning. |
136
PART IV
Item 15. Exhibits and Financial Statement Schedules
The following documents are filed as a part of this report:
(1) Consolidated financial statements | ||||
For the following consolidated financial information included herein, see Index on Page 73 | ||||
Page | ||||
(2) Financial statement Schedule I as filed in Part II. Item 8. of this Form 10-K: | ||||
Schedule I - Condensed financial information of the Registrant | ||||
(3) Exhibits: | ||||
The exhibits listed in the accompanying Exhibit Index attached hereto are filed or incorporated by reference into this Form 10-K. | ||||
137
Exhibit Index
Exhibit No. | Exhibit Description | |
Second Amended and Restated Certificate of Incorporation of National Vision Holdings, Inc. -incorporated herein by reference to Exhibit 3.1 to the Company’s Current Report on Form 8-K filed on October 31, 2017. | ||
Second Amended and Restated Bylaws of National Vision Holdings, Inc. -incorporated herein by reference to Exhibit 3.2 to the Company’s Current Report on Form 8-K filed on October 31, 2017 | ||
Amended and Restated Stockholders’ Agreement, dated as of October 30, 2017, by and among National Vision Holdings, Inc. and the stockholders party thereto -incorporated herein by reference to Exhibit 4.1 to the Company’s Current Report on Form 8-K filed on October 31, 2017 | ||
Registration Rights Agreement, dated as of March 13, 2014, by and among National Vision Holdings, Inc. (formerly known as Nautilus Parent, Inc.) and the stockholders party thereto - incorporated herein by reference to Exhibit 4.2 to the Company’s Form S-1 Registration Statement filed on September 29, 2017 | ||
Amended and Restated Stockholders’ Agreement by and among National Vision Holdings, Inc. and the stockholders party thereto incorporated herein by reference to Exhibit 4.1 to the Company’s Current Report on Form 8-K filed on October 31, 2017 | ||
Monitoring Agreement, dated as of March 13, 2014, by and among National Vision, Inc., Kohlberg Kravis Roberts & Co. L.P. and Berkshire Partners LLC - incorporated herein by reference to Exhibit 10.2 to the Company’s Amendment No. 2 to Form S-1 Registration Statement filed on October 16, 2017 | ||
First Lien Credit Agreement, dated as of March 13, 2014, among Nautilus Acquisition Holdings, Inc., Nautilus Merger Sub, Inc., Vision Holdings Corp. and National Vision, Inc., Goldman Sachs Bank USA, as administrative agent, collateral agent, swingline lender and a lender, Morgan Stanley Bank N.A., as the letter of credit issuer, Goldman Sachs Bank USA, Morgan Stanley Senior Funding, Inc., Citigroup Global Markets Inc., Mizuho Bank, Ltd., KKR Capital Markets LLC, Barclays Bank PLC, and Macquarie Capital (USA) Inc., as joint lead arrangers and bookrunners, and the several lenders from time to time parties thereto - incorporated herein by reference to Exhibit 10.3 to the Company’s Form S-1 Registration Statement filed on September 29, 2017 | ||
Joinder and Amendment Agreement, dated as of May 29, 2015, among KKR Corporate Lending LLC, National Vision, Inc., as borrower, the guarantors party thereto and Goldman Sachs Bank USA, as administrative agent and collateral agent - incorporated herein by reference to Exhibit 10.4 to the Company’s Form S-1 Registration Statement filed on September 29, 2017 | ||
Joinder Agreement, dated as of February 3, 2017, among KKR Corporate Lending LLC, National Vision, Inc., as borrower, the guarantors party thereto and Goldman Sachs Bank USA, as administrative agent and collateral agent - incorporated herein by reference to Exhibit 10.5 to the Company’s Form S-1 Registration Statement filed on September 29, 2017 | ||
Joinder and Amendment Agreement, dated as of October 31, 2017, among National Vision, Inc., as borrower, the guarantors party thereto, each revolving credit lender, Goldman Sachs Bank USA, as administrative agent, collateral agent, swingline lender and a letter of credit issuer, Bank of America, N.A., as a letter of credit issuer, and Citibank, N.A., as a letter of credit issuer - incorporated herein by reference to Exhibit 10.1 to the Company’s Current Report on Form 8-K filed on October 31, 2017 | ||
Joinder and Amendment Agreement, dated as of November 20, 2017, among National Vision, Inc., as borrower, the guarantors party thereto, each lender party thereto, Goldman Sachs Bank USA, as administrative agent and collateral agent-incorporated herein by reference to Exhibit 10.5 to the Company’s Current Report on Form 8-K filed on November 20, 2017 | ||
First Lien Guarantee, dated as of March 13, 2014, by the guarantors party thereto - - incorporated herein by reference to Exhibit 10.6 to the Company’s Form S-1 Registration Statement filed on September 29, 2017 | ||
First Lien Security Agreement, dated as of March 13, 2014, among Nautilus Acquisition Holdings, Inc., Nautilus Merger Sub, Inc., Vision Holdings Corp., National Vision, Inc., subsidiary grantors party thereto, Goldman Sachs Bank USA, as collateral agent - - incorporated herein by reference to Exhibit 10.7 to the Company’s Form S-1 Registration Statement filed on September 29, 2017 | ||
First Lien Pledge Agreement, dated as of March 13, 2014, among Nautilus Acquisition Holdings, Inc., Nautilus Merger Sub, Inc., Vision Holdings Corp., National Vision, Inc. subsidiary pledgors party thereto, Goldman Sachs Bank USA, as collateral agent - incorporated herein by reference to Exhibit 10.8 to the Company’s Form S-1 Registration Statement filed on September 29, 2017 | ||
138
Second Lien Credit Agreement, dated as of March 13, 2014, among Nautilus Acquisition Holdings, Inc., Nautilus Merger Sub, Inc., Vision Holdings Corp. and National Vision, Inc., Morgan Stanley Senior Funding, Inc., as administrative agent and collateral agent, and Goldman Sachs Bank USA, Morgan Stanley Senior Funding, Inc., Citigroup Global Markets Inc., Mizuho Bank, Ltd., KKR Capital Markets LLC, Barclays Bank PLC, and Macquarie Capital (USA) Inc., as joint lead arrangers and bookrunners, and the several lenders from time to time parties thereto - incorporated herein by reference to Exhibit 10.9 to the Company’s Form S-1 Registration Statement filed on September 29, 2017 | ||
Second Lien Guarantee, dated as of March 13, 2014, by the guarantors party thereto - incorporated herein by reference to Exhibit 10.10 to the Company’s Form S-1 Registration Statement filed on September 29, 2017 | ||
Second Lien Security Agreement, dated as of March 13, 2014, among Nautilus Acquisition Holdings, Inc., Nautilus Merger Sub, Inc., Vision Holdings Corp., National Vision, Inc., subsidiary grantors party thereto, Morgan Stanley Senior Funding, Inc., as collateral agent - incorporated herein by reference to Exhibit 10.11 to the Company’s Form S-1 Registration Statement filed on September 29, 2017 | ||
Second Lien Pledge Agreement, dated as of March 13, 2014, among Nautilus Acquisition Holdings, Inc., Nautilus Merger Sub, Inc., Vision Holdings Corp., National Vision, Inc., subsidiary pledgors party thereto, Morgan Stanley Senior Funding, Inc., as collateral agent - incorporated herein by reference to Exhibit 10.12 to the Company’s Form S-1 Registration Statement filed on September 29, 2017 | ||
First Lien/Second Lien Intercreditor Agreement, dated as of March 13, 2014, among Nautilus Acquisition Holdings, Inc., Nautilus Merger Sub, Inc., other grantors party thereto, Goldman Sachs Bank USA, Morgan Stanley Senior Funding, Inc. and each additional representative from time to time party thereto - incorporated herein by reference to Exhibit 10.13 to the Company’s Form S-1 Registration Statement filed on September 29, 2017 | ||
National Vision Holdings, Inc. 2017 Omnibus Incentive Plan - incorporated herein by reference to Exhibit 10.2 to the Company’s Current Report on Form 8-K filed on October 31, 2017 | ||
Form of Restricted Stock Agreement for Non-Employee Directors under the 2017 Omnibus Incentive Plan - incorporated herein by reference to Exhibit 10.15 to the Company’s Amendment No. 2 to Form S-1 Registration Statement filed on October 16, 2017 | ||
2014 Stock Incentive Plan for Key Employees of National Vision Holdings, Inc. (formerly known as Nautilus Parent, Inc.) and its Subsidiaries - incorporated herein by reference to Exhibit 10.16 to the Company’s Form S-1 Registration Statement filed on September 29, 2017 | ||
Amendment No. 1 to the 2014 Stock Incentive Plan for Key Employees of National Vision Holdings, Inc. (formerly known as Nautilus Parent, Inc.) and its Subsidiaries - incorporated herein by reference to Exhibit 10.17 to the Company’s Form S-1 Registration Statement filed on September 29, 2017 | ||
Amendment No. 2 to the 2014 Stock Incentive Plan for Key Employees of National Vision Holdings, Inc. (formerly known as Nautilus Parent, Inc.) and its Subsidiaries - incorporated herein by reference to Exhibit 10.18 to the Company’s Form S-1 Registration Statement filed on September 29, 2017 | ||
Form of Stock Option Agreement under the 2014 Stock Incentive Plan for Key Employees of National Vision Holdings, Inc. (formerly known as Nautilus Parent, Inc.) and its Subsidiaries - incorporated herein by reference to Exhibit 10.19 to the Company’s Form S-1 Registration Statement filed on September 29, 2017 | ||
Form of Management Stockholder’s Agreement - incorporated herein by reference to Exhibit 10.20 to the Company’s Form S-1 Registration Statement filed on September 29, 2017 | ||
Form of Option Rollover Agreement - incorporated herein by reference to Exhibit 10.21 to the Company’s Form S-1 Registration Statement filed on September 29, 2017 | ||
Form of Sale Participation Agreement - incorporated herein by reference to Exhibit 10.22 to the Company’s Form S-1 Registration Statement filed on September 29, 2017 | ||
Form of Contribution Agreement - incorporated herein by reference to Exhibit 10.23 to the Company’s Form S-1 Registration Statement filed on September 29, 2017 | ||
National Vision, Inc. Severance Plan, as amended and restated as of March 15, 2017 - incorporated herein by reference to Exhibit 10.24 to the Company’s Form S-1 Registration Statement filed on September 29, 2017 | ||
National Vision, Inc. Severance Plan Summary Plan Description (Executives), effective as of July 21, 2011 - incorporated herein by reference to Exhibit 10.25 to the Company’s Form S-1 Registration Statement filed on September 29, 2017 | ||
139
National Vision, Inc. Severance Plan Executive Supplement, effective as of November 11, 2013 and amended as of March 15, 2017 - incorporated herein by reference to Exhibit 10.26 to the Company’s Form S-1 Registration Statement filed on September 29, 2017 | ||
National Vision, Inc. Management Incentive Plan - incorporated herein by reference to Exhibit 10.27 to the Company’s Form S-1 Registration Statement filed on September 29, 2017 | ||
Indemnification Agreement, dated as of March 13, 2014, among National Vision Holdings, Inc. (formerly known as Nautilus Parent, Inc.), Nautilus Acquisition Holdings, Inc., Vision Holding Corp., National Vision, Inc., Kohlberg Kravis Roberts & Co. L.P. and Berkshire Partners LLC - incorporated herein by reference to Exhibit 10.28 to the Company’s Form S-1 Registration Statement filed on September 29, 2017 | ||
Letter Agreement between National Vision, Inc. and Essilor of America, Inc., dated as of May 25, 2011 - incorporated herein by reference to Exhibit 10.29 to the Company’s Form S-1 Registration Statement filed on September 29, 2017 | ||
Letter of Amendment between National Vision, Inc. and Essilor of America, Inc., dated as of December 2, 2014 - incorporated herein by reference to Exhibit 10.30 to the Company’s Form S-1 Registration Statement filed on September 29, 2017 | ||
Management & Services Agreement by and between National Vision, Inc. and Wal-Mart Stores, Inc., dated as of May 1, 2012 - incorporated herein by reference to Exhibit 10.31 to the Company’s Form S-1 Registration Statement filed on October 16, 2017 | ||
Letter Agreement by and between National Vision, Inc. and Wal-Mart Stores, Inc. re: Management & Services Agreement, dated as of January 11, 2017 - incorporated herein by reference to Exhibit 10.32 to the Company’s Form S-1 Registration Statement filed on September 29, 2017 | ||
Amended and Restated Supplier Agreement between National Vision, Inc. and Walmart, dated as of January 17, 2017 - incorporated herein by reference to Exhibit 10.33 to the Company’s Form S-1 Registration Statement filed on September 29, 2017 | ||
Option Agreement for Patrick R. Moore under the 2017 Omnibus Incentive Plan - incorporated herein by reference to Exhibit 10.34 to the Company’s Amendment No. 2 to Form S-1 Registration Statement filed on October 16, 2017 | ||
Restricted Stock Award Agreement for David M. Tehle under the 2014 Stock Incentive Plan for Key Employees of National Vision Holdings, Inc. (formerly known as Nautilus Parent, Inc.) and its Subsidiaries - incorporated herein by reference to Exhibit 10.35 to the Company’s Amendment No. 2 to Form S-1 Registration Statement filed on October 16, 2017 | ||
Form of Director Indemnification Agreement - incorporated herein by reference to Exhibit 10.36 to the Company’s Amendment No. 2 to Form S-1 Registration Statement filed on October 16, 2017 | ||
Option Agreement for Jeff McAllister under the 2014 Stock Incentive Plan for Key Employees of National Vision Holdings, Inc. (formerly known as Nautilus Parent, Inc.) and its Subsidiaries | ||
Form of Director Stockholder’s Agreement - incorporated herein by reference to Exhibit 10.1 to the Company’s Current Report on Form 8-K filed on January 23, 2018 | ||
Vision Holding Corp. Amended and Restated 2013 Equity Incentive Plan - incorporated herein by reference to Exhibit 4.4 to the Company’s Form S-8 Registration Statement filed on October 26, 2017 | ||
Subsidiaries of National Vision Holdings, Inc. | ||
Consent of Deloitte & Touche LLP. | ||
Certification of Periodic Report by Chief Executive Officer under Section 302 of the Sarbanes-Oxley Act of 2002 (furnished herewith) | ||
Certification of Periodic Report by Chief Financial Officer under Section 302 of the Sarbanes-Oxley Act of 2002 (furnished herewith) | ||
Certification of Chief Executive Officer Pursuant to 18 U.S.C. Section 1350 as Adopted Pursuant to Section 906 of the Sarbanes-Oxley Act of 2002 (furnished herewith) | ||
Certification of Chief Financial Officer Pursuant to 18 U.S.C. Section 1350 as Adopted Pursuant to Section 906 of the Sarbanes-Oxley Act of 2002 (furnished herewith) | ||
101.INS | XBRL Instance Document. | |
101.SCH | XBRL Taxonomy Extension Schema Document. | |
101.CAL | XBRL Taxonomy Extension Calculation Linkbase Document. | |
101.DEF | XBRL Taxonomy Extension Definition Linkbase Document. | |
140
101.LAB | XBRL Taxonomy Extension Label Linkbase Document. | |
101.PRE | XBRL Taxonomy Extension Presentation Linkbase Document. | |
____________
(*) | Filed herewith. |
(**) | Previously filed. |
(†) | Identifies exhibits that consist of a management contract or compensatory plan or arrangement. |
(‡) Confidential treatment has been requested with respect to certain portions of identified exhibits. Omitted portions have been filed separately with the Securities and Exchange Commission.
Item 16. Form 10-K Summary
None.
141
Signatures
Pursuant to the requirements of Section 13 or 15(d) of the Securities Exchange Act of 1934, as amended, the registrant has duly caused this report to be signed on its behalf by the undersigned, thereunto duly authorized.
National Vision Holdings, Inc. | ||
By: | /s/ L. Reade Fahs | |
L. Reade Fahs | ||
Chief Executive Officer and Director | ||
(Principal Executive Officer) | ||
Date: | March 8, 2018 | |
Pursuant to the requirements of the Securities Exchange Act of 1934, this report has been signed below by the following persons on behalf of the Registrant and in the capacities and on the dates indicated:
Signature | Title | Date |
/s/ L. Reade Fahs | Chief Executive Officer and Director | March 8, 2018 |
L. Reade Fahs | (Principal Executive Officer) | |
/s/ Patrick R. Moore | Senior Vice President, Chief Financial Officer | March 8, 2018 |
Patrick R. Moore | (Principal Financial Officer) | |
/s/ Chris Beasley | Senior Vice President, Accounting, and Controller | March 8, 2018 |
Chris Beasley | (Principal Accounting Officer) | |
/s/ Felix Gernburd | Director | March 8, 2018 |
Felix Gernburd | ||
/s/ Viginia A. Hepner | Director | March 8, 2018 |
Virginia A. Hepner | ||
/s/ D. Randolph Peeler | Director | March 8, 2018 |
D. Randolph Peeler | ||
/s/ Nathaniel H. Taylor | Chairman and Director | March 8, 2018 |
Nathaniel H. Taylor | ||
/s/ David M. Tehle | Director | March 8, 2018 |
David M. Tehle | ||
142