Attached files
| file | filename |
|---|---|
| EX-23.1 - EX-23.1 - GOLD RESOURCE CORP | goro-20171231ex23184e241.htm |
| EX-32 - EX-32 - GOLD RESOURCE CORP | goro-20171231xex32.htm |
| EX-31.2 - EX-31.2 - GOLD RESOURCE CORP | goro-20171231ex312ca9d4b.htm |
| EX-31.1 - EX-31.1 - GOLD RESOURCE CORP | goro-20171231ex311197854.htm |
| EX-23.2 - EX-23.2 - GOLD RESOURCE CORP | goro-20171231ex232354565.htm |
| EX-21 - EX-21 - GOLD RESOURCE CORP | goro-20171231ex21d706d8b.htm |
| EX-10.14 - EX-10.14 - GOLD RESOURCE CORP | goro-20171231ex101430a7c.htm |
UNITED STATES
SECURITIES AND EXCHANGE COMMISSION
Washington, D.C. 20549
FORM 10-K
(Mark One)
☒ANNUAL REPORT PURSUANT TO SECTION 13 OR 15(d) OF THE SECURITIES EXCHANGE ACT OF 1934
For the fiscal year ended December 31, 2017
◻TRANSITION REPORT PURSUANT TO SECTION 13 OR 15(d) OF THE SECURITIES EXCHANGE ACT OF 1934
For the transition period from to
Commission File Number: 001-34857
Gold Resource Corporation
(Exact name of registrant as specified in its charter)
|
Colorado |
84-1473173 |
|
(State or other jurisdiction of |
(I.R.S. Employer |
2886 Carriage Manor Point, Colorado Springs, Colorado 80906
(Address of Principal Executive Offices) (Zip Code)
(303) 320-7708
(Registrant’s telephone number including area code)
Securities registered under Section 12(b) of the Exchange Act:
|
Title of each class |
Name of each exchange on which registered |
|
Common Stock, $0.001 par value |
NYSE American |
Securities registered under Section 12(g) of the Exchange Act:
None
Indicate by check mark if the registrant is a well-known seasoned issuer, as defined in Rule 405 of the Securities Act. Yes ◻ No ☒
Indicate by check mark if the registrant is not required to file reports pursuant to Section 13 or Section 15(d) of the Act. Yes ◻ No ☒
Indicate by check mark whether the registrant (1) filed all reports required to be filed by Section 13 or 15(d) of the Securities Exchange Act of 1934 during the preceding 12 months (or for such shorter period that the registrant was required to file such reports), and (2) has been subject to such filing requirements for the past 90 days. Yes ☒ No ◻
Indicate by check mark whether the registrant has submitted electronically and posted on its corporate Website, if any, every Interactive Data File required to be submitted and posted pursuant to Rule 405 of Regulation S-T (§232.405 of this chapter) during the preceding 12 months (or for such shorter period that the registrant was required to post such files). Yes ☒ No ◻
Indicate by checkmark if disclosure of delinquent filers pursuant to Item 405 of Regulation S-K (§229.405 of this chapter) is not contained herein, and will not be contained, to the best of registrant’s knowledge, in definitive proxy or information statements incorporated by reference in Part III of this Form 10-K or any amendment to this Form 10-K. ☒
Indicate by check mark whether the registrant is a large accelerated filer, an accelerated filer, a non-accelerated filer, smaller reporting company, or an emerging growth company. See definition of “large accelerated filer,” “accelerated filer”, “smaller reporting company”, and “emerging growth company” in Rule 12b-2 of the Exchange Act.
|
Larger accelerated filer |
◻ |
Accelerated filer |
☒ |
|
|
|
|
|
|
Non-accelerated filer |
◻ (Do not check if a smaller reporting company) |
Smaller reporting company |
◻ |
|
|
|
||
|
|
|
Emerging growth company |
◻ |
|
|
|
|
|
If an emerging growth company, indicate by check mark if the registrant has elected not to use the extended transition period for complying with any new or revised financial accounting standards provided pursuant to Section 13(a) of the Exchange Act ◻
Indicate by check mark whether registrant is a shell company (as defined in Rule 12b-2 of the Exchange Act). Yes ◻ No ☒
The aggregate market value of the common stock of Gold Resource Corporation held by non-affiliates as of June 30, 2017, the last business day of the registrant’s most recently completed second fiscal quarter, was $223,772,333 based on the closing price of the common stock of $4.08 as reported on the NYSE American.
As of March 7, 2018, there were 57,107,884 shares of the registrant’s common stock outstanding.
DOCUMENTS INCORPORATED BY REFERENCE:
Portions of the Definitive Proxy Statement to be filed pursuant to Regulation 14A for the registrant’s 2018 annual meeting of shareholders are incorporated by reference into Part III of this Form 10-K.
2
ADDITIONAL INFORMATION
Descriptions of agreements or other documents contained in this report are intended as summaries and are not necessarily complete. Please refer to the agreements or other documents filed or incorporated herein by reference as exhibits. Please see the exhibit index at the end of this report for a complete list of those exhibits.
SPECIAL NOTE REGARDING FORWARD-LOOKING STATEMENTS
This report contains forward-looking statements that involve risks and uncertainties. The statements contained in this report that are not purely historical are forward-looking statements within the meaning of Section 27A of the Securities Act of 1933 and Section 21E of the Securities Exchange Act of 1934. When used in this report, the words “plan,” “target,” “anticipate,” “believe,” “estimate,” “intend”, “expect” and similar expressions are intended to identify such forward-looking statements. Such forward-looking statements include, without limitation, the statements regarding Gold Resource Corporation’s strategy, future plans for production, future expenses and costs, future liquidity and capital resources, future dividends and estimates of mineralized material. All forward-looking statements in this report are based upon information available to Gold Resource Corporation on the date of filing this report, and the company assumes no obligation to update any such forward-looking statements. Forward looking statements involve a number of risks and uncertainties and there can be no assurance that such statements will prove to be accurate. Gold Resource Corporation’s actual results could differ materially from those discussed in this report. Factors that could cause or contribute to such differences include, but are not limited to, those discussed in the Item 1A. Risk Factors section of this report.
In addition to the specific factors identified under Item 1A. Risk Factors in this report, other uncertainties that could affect the accuracy of forward-looking statements include:
|
· |
Commodity price fluctuations; |
|
· |
Mine protests and work stoppages; |
|
· |
Rock formations, faults and fractures, water flow and possible CO2 gas exhalation or other unanticipated geological situations; |
|
· |
Decisions of foreign countries and banks within those countries; |
|
· |
Unexpected changes in business and economic conditions, including the rate of inflation; |
|
· |
Changes in interest rates and currency exchange rates; |
|
· |
Timing and amount of production; |
|
· |
Technological changes in the mining industry; |
|
· |
Our costs; |
|
· |
Access to and availability of materials, equipment, supplies, labor and supervision, power and water; |
|
· |
Results of current and future feasibility studies; |
|
· |
The level of demand for our products; |
|
· |
Changes in our business strategy, plans and goals; |
|
· |
Interpretation of drill hole results and the geology, grade and continuity of mineralization; |
|
· |
Litigation by private parties or regulatory action by governmental entities; |
|
· |
Acts of God such as floods, earthquakes and any other natural disasters; and |
|
· |
The uncertainty of mineralized material estimates and timing of mine construction expenditures. |
This list, together with the factors identified under Item 1A. Risk Factors, is not exhaustive of the factors that may affect any of our forward-looking statements. You should read this report completely and with the understanding that our actual future results may be materially different from what we expect. These forward-looking statements represent our beliefs, expectations and opinions only as of the date of filing this report. We do not intend to update these forward-looking statements except as required by law. We qualify all of our forward-looking statements by these cautionary statements.
3
Gold Resource Corporation was organized under the laws of the State of Colorado on August 24, 1998. We are a producer of metal concentrates that contain gold, silver, copper, lead and zinc, and doré containing gold and silver from the Aguila and Alta Gracia Projects in the southern state of Oaxaca, Mexico (“Oaxaca Mining Unit”). The Aguila Project includes the Arista underground mine and processing facility, which are currently in operation. The Alta Gracia Project includes the Mirador underground mine which began operations in 2017. We also perform exploration and evaluation work on our portfolio of precious and base metal exploration properties in Nevada, United States of America (“Nevada Mining Unit”) and continue to evaluate other properties for possible acquisition.
In this report, “Company,” “our,” “us” and “we” refer to Gold Resource Corporation together with our subsidiaries, unless the context otherwise requires. See glossary on page 30 for additional definitions.
The majority of our assets are located at our Oaxaca Mining Unit, including our Aguila processing facility, and Arista and Mirador underground mines. The Aguila processing facility produces metal concentrates and doré from ore mined from both the Arista and Mirador Mines. All of our production and revenue currently comes from our Oaxaca Mining Unit.
The Aguila and Alta Gracia Projects, which comprise our only operating properties, include a total of approximately 35,390 hectares of mining concessions, access roads from a major highway, haul roads, a processing facility, and adjoining buildings, an assay lab, an open pit and underground mines, tailings facilities and other infrastructure. Please see Item 2. Properties for maps and additional information.
We commenced mining and milling operations from the Aguila Project in July 2010, initially from the Aguila open pit mine, followed by development and mining the Arista underground mine. The Arista Mine was expanded in 2016 with the development of the Switchback vein system. The Arista underground mine is located approximately two kilometers from the processing facility. Most of the production from our Oaxaca Mining Unit from 2011 to present has been from the Arista Mine.
We first reported Proven and Probable (“P&P”) reserves for our Arista Mine in 2014. In 2016, we expanded Arista Mine’s P&P reserves with the addition of the Switchback vein system. In February 2017, we announced our first proven and probable reserves for our Mirador Mine. In 2017, development of the Mirador Mine advanced to a point which allowed for consistent ore feed to the Aguila processing facility. Please see Item 2. Properties, Proven and Probable Reserves for more information.
Our operations in Oaxaca are conducted through our Mexican subsidiary, Don David Gold Mexico S.A. de C.V. (“DDGM”). Our Nevada exploration and evaluation work is performed through two wholly-owned subsidiaries, GRC Nevada Inc. and Walker Lane Minerals Corp. (“Walker Lane”).
Our principal executive offices are located at 2886 Carriage Manor Point, Colorado Springs, Colorado 80906, and our telephone number is (303) 320-7708. We maintain a website at www.goldresourcecorp.com and through a link on our website you can view the periodic filings that we make with the U.S. Securities and Exchange Commission (“SEC”), as well as certain of our corporate governance documents such as our code of ethics.
Segment Information
Our segments are broken into two geographic regions. The geographic regions include Oaxaca, Mexico (“Mexico”) and Nevada, U.S.A. (“Nevada”) and represent the Company’s operating segments. Please see Note 21 in Item 8. Financial Statements and Supplementary Data for additional information.
4
Developments in 2017
For the year ended December 31, 2017, we reported revenue of $110.2 million, mine gross profit of $42.1 million and net income of $4.2 million. Substantially all of our 2017 revenue was from the Arista Mine in Mexico. Our annual 2017 mill production totaled 28,117 gold ounces, 1,773,263 silver ounces, 1,141 copper tonnes, 5,365 lead tonnes and 16,301 zinc tonnes. In 2017, dividends distributed to shareholders totaled $0.02 per share or $1.1 million.
Oaxaca Mining Unit
During 2017, we continued to develop the Arista underground mine, including the Switchback vein system. Development of the Switchback vein system in 2017 reached the point that allows for bulk tonnage mining techniques planned in 2018.
In addition to the Arista underground mine, we advanced development of the Mirador Mine in 2017 and began delivering a limited amount of development ore to the Aguila processing facility in the second quarter.
Nevada Mining Unit
During 2017, we acquired the highly prospective East Camp Douglas exploration property, and added a significant number of additional claims to the Isabella Pearl Project. In addition, we continued to advance the permitting process for our Isabella Pearl Project.
Since July 2010, we have paid a monthly dividend. During 2017, we paid one-sixth cent per share per month, which totaled $0.02 per share per year. Please see Item 5. Market for Registrant’s Common Equity, Related Stockholder Matters and Issuer Purchase of Equity Securities for additional information.
Condition of Physical Assets and Insurance
Our business is capital intensive and requires ongoing investment for the replacement, modernization or expansion of equipment and facilities. For more information, please see Item 7. Management’s Discussion and Analysis of Financial Condition and Results of Operations, Liquidity and Capital Resources, below. We maintain insurance policies against property loss and business interruption and insure against risks that are typical in the operation of our business in amounts that we believe to be reasonable. Such insurance, however, contains exclusions and limitations on coverage, particularly with respect to property loss, environmental liability and political risk. There can be no assurance that claims would be paid under such insurance policies in connection with a particular event. Please see Item 1A. Risk Factors, below for additional information.
We conduct our operations so as to protect the environment and believe our operations are in compliance with applicable laws and regulations in all material respects. Our operating mines have reclamation plans in place that we believe meet all applicable legal and regulatory requirements. At December 31, 2017, $2.9 million was accrued on our consolidated balance sheet for reclamation costs relating to operating properties.
5
Competitive Business Conditions
The exploration for, and the acquisition of, gold and silver properties are subject to intense competition. Identifying and evaluating potential mining prospects is a costly and time-consuming endeavor. Due to our limited capital and personnel, we are at a competitive disadvantage compared to many other companies with regard to exploration and, if warranted, advancement of mining properties. Our present limited capital means that our ability to compete for properties to be explored and developed is limited. We believe that competition for acquiring mineral prospects will continue to be intense in the future.
Government Regulations and Permits
In connection with mining, milling and exploration activities, we are subject to United States and Mexican federal, state and local laws and regulations governing the protection of the environment, including laws and regulations relating to protection of air and water quality, hazardous waste management and mine reclamation as well as the protection of endangered or threatened species. The department responsible for environmental protection in Mexico is Secretaria de Medio Ambiente y Recursos Naturales (“SEMARNAT”), which is similar to the United States Environmental Protection Agency. SEMARNAT has broad authority to shut down and/or levy fines against facilities that do not comply with its environmental regulations or standards. Potential areas of environmental consideration for mining companies, including ours, include but are not limited to, acid rock drainage, cyanide containment and handling, contamination of water sources, dust and noise. The agencies responsible for environmental protections and permitting in our Nevada Mining Unit include the Bureau of Land Management (“BLM”) and the Nevada Division of Environmental Protection (“NDEP”).
For operations at our Oaxaca Mining Unit, we have secured and continue to secure various regulatory permits from federal, state and local agencies. These governmental and regulatory permits generally govern the processes being used to operate, the stipulations concerning air quality and water issues, and the plans and obligations for reclamation of the properties at the conclusion of operations. We have received the required local community support for the Aguila and Alta Gracia Projects in the area where we are currently producing.
We are actively seeking the permits necessary to place our Nevada Mining Unit’s Isabella Pearl Project into production. Please see Item 2. Properties – Nevada Mining Unit, for more information on the status of our permitting efforts. In connection with these permits and exploration activities in Nevada, we are subject to various federal, state and local laws and regulations governing protection of the environment, including, but not limited to, the Clean Air Act; the Clean Water Act; the Comprehensive Environmental Response, Compensation and Liability Act; the Emergency Planning and Community Right-to-Know Act; the Endangered Species Act; the Federal Land Policy and Management Act; the National Environmental Policy Act; the Resource Conservation and Recovery Act; and related state laws. These laws and regulations are continually changing and are generally becoming more restrictive.
During the year ended December 31, 2017, one customer accounted for 95% of our revenue in our Oaxaca Mining Unit. In the event that our relationship with the customer is interrupted for any reason, we believe that we would be able to locate another entity to purchase our products. However, any interruption could temporarily disrupt the sale of our principal products and adversely affect our operating results. We periodically review our options for alternative sales outlets to mitigate the concentration of risk in case of any unforeseen disruptions.
We currently have sixteen full-time employees, six of which serve as our executive officers. These individuals devote all of their business time to our affairs.
We contract for the services of approximately 490 individuals employed by a third party and also use various independent contractors for underground mining, surface exploration drilling and trucking.
6
This report, including Management’s Discussion and Analysis of Financial Condition and Results of Operations, contains forward-looking statements that may be materially affected by several risk factors, including those summarized below:
Our results of operations, cash flows and the value of our properties are highly dependent on the market prices of gold and silver and certain base metals and these prices can be volatile. The profitability of our gold and silver mining operations and the value of our mining properties, are directly related to the market price of gold and silver, and to a lesser extent, copper, lead and zinc. The price of gold and silver may also have a significant influence on the market price of our common stock. The market price of gold and silver historically has fluctuated significantly and is affected by numerous factors beyond our control. These factors include supply and demand fundamentals, global or national political or economic conditions, expectations with respect to the rate of inflation, the relative strength of the U.S. dollar and other currencies, interest rates, gold and silver sales and loans by central banks, forward sales by metal producers, accumulation and divestiture by exchange traded funds, and a number of other factors.
We derive a significant portion of our revenue from the sale of gold and silver and our results of operations will fluctuate as the prices of these metals change. A period of significant and sustained lower gold and silver prices would materially and adversely affect our results of operations and cash flows. The volatility of mineral prices represents a substantial risk which no amount of planning or technical expertise can fully eliminate. In the event mineral prices decline or remain low for prolonged periods of time, we might be unable to develop our existing exploration properties, which may adversely affect our results of operations, financial performance and cash flows. An asset impairment charge may result from the occurrence of unexpected adverse events that impact our estimates of expected cash flows generated from our producing properties or the market value of our non-producing properties, including a material diminution in the price of gold and/or silver.
During 2017, the price of gold and silver, as measured by the London P.M. fix, fluctuated from a low of $1,151 per ounce to a high of $1,346 per ounce while the price of silver fluctuated from a low of $15.22 per ounce to a high of $18.56 per ounce. As of March 7, 2018, gold and silver prices were $1,329 per ounce and $16,65 per ounce, respectively. The volatility in gold and silver prices is illustrated by the following table, which sets forth for each of the past five calendar years, the high, low, and average annual market prices in U.S. dollars per ounce of gold and silver based on the daily London P.M. fix:
|
|
|
2013 |
|
2014 |
|
2015 |
|
2016 |
|
2017 |
|
|||||
|
Gold: |
|
|
|
|
|
|
|
|
|
|
|
|
|
|
|
|
|
High |
|
$ |
1,694 |
|
$ |
1,385 |
|
$ |
1,297 |
|
$ |
1,366 |
|
$ |
1,346 |
|
|
Low |
|
$ |
1,192 |
|
$ |
1,142 |
|
$ |
1,049 |
|
$ |
1,077 |
|
$ |
1,151 |
|
|
Average |
|
$ |
1,411 |
|
$ |
1,266 |
|
$ |
1,160 |
|
$ |
1,251 |
|
$ |
1,257 |
|
|
Silver: |
|
|
|
|
|
|
|
|
|
|
|
|
|
|
|
|
|
High |
|
$ |
32.23 |
|
$ |
22.05 |
|
$ |
18.23 |
|
$ |
20.71 |
|
$ |
18.56 |
|
|
Low |
|
$ |
18.61 |
|
$ |
15.28 |
|
$ |
13.71 |
|
$ |
13.58 |
|
$ |
15.22 |
|
|
Average |
|
$ |
23.79 |
|
$ |
19.08 |
|
$ |
15.68 |
|
$ |
17.14 |
|
$ |
17.04 |
|
Most of our production is limited to a single mine and any interruptions or stoppages in our mining activities would adversely affect our revenue. We are presently relying on revenues from a single mine to fund our operations. Any interruption in our ability to mine this location, such as a labor strike, natural disaster, or loss of permits would negatively impact our ability to collect revenue following such interruption. Additionally, if we are unable to economically develop additional mines, we will eventually deplete the body of mineralized material and will no longer generate revenue sufficient to fund our operations. A decrease in, or cessation of, our mining operations would adversely affect our financial performance and may eventually cause us to cease operations.
7
If we are unable to achieve anticipated gold and silver production levels, our financial condition and results of operations will be adversely affected. We have proceeded with the processing of the mineralized material from the Arista and Mirador underground mines at the Aguila and Alta Gracia Projects, respectively, based on estimates of mineralized material identified during exploration and in our Proven and Probable Reserve report. However, risks related to metallurgy are inherent when working with extractable minerals. Sales of gold and silver that we realize from future mining activity will be less than anticipated if the mined material does not contain the concentration of gold and silver predicted by our geological exploration, studies and reports. If sales of gold and silver are less than anticipated, we may not be able to recover our investment in our property and our operations may be adversely affected. Our inability to realize production based on quarterly or annual projections may also adversely affect the price of our common stock and you may lose part or all of your investment.
Estimates of proven and probable reserves and mineralized material are uncertain and the volume and grade of ore actually recovered may vary from our estimates. The proven and probable reserves stated in this report represent the amount of gold, silver, copper, lead and zinc that we estimated, at December 31, 2017 could be economically and legally extracted or produced at the time of the reserve determination. Estimates of proven and probable reserves and mineralized material are subject to considerable uncertainty. Such estimates are, to a large extent, based on the prices of gold, silver, copper, lead and zinc and interpretations of geologic data obtained from drill holes and other exploration techniques. These prices and interpretations are subject to change. If we determine that certain of our estimated reserves or mineralized material have become uneconomic, we may be forced to reduce our estimates. Actual production may be significantly less than we expect.
Any material changes in mineral estimates and grades of mineralization may affect the economic viability of placing a property into production and such property’s return on capital. There can be no assurance that minerals recovered in small scale tests will be recovered in large‑scale tests under on‑site conditions or in production scale. Extended declines in market prices for gold and/or silver may render portions of our mineralization estimates uneconomic and result in reduced reported mineralization or adversely affect the commercial viability of one or more of our properties. Any material reductions in estimates of mineralization, or of our ability to extract this mineralization, could have a material adverse effect on our results of operations or financial condition.
Additionally, the term “mineralized material” as used in this report does not indicate proven and probable reserves as defined by Industry Guide 7 (“Guide 7”) promulgated by the SEC or our standards. Estimates of mineralized material are subject to further exploration and development and are therefore subject to considerable uncertainty. We cannot be certain that any part or parts of the mineralized material deposit will ever be confirmed or converted into Guide 7 compliant reserves or that mineralized material can be economically or legally extracted.
Our current property portfolio is limited to two producing properties and our ability to remain profitable over the long-term will depend on our ability to expand the known deposits like Arista and Mirador, and /or identify, explore and develop additional properties in Mexico and Nevada. Gold and silver producers must continually replace reserves depleted by production to maintain production levels over the long term and provide a return on invested capital. Depleted reserves can be replaced in several ways, including expanding known ore bodies, locating new deposits, or acquiring interests in reserves from third parties. Exploration is highly speculative in nature, capital intensive, involves many risks and is frequently unproductive. Our current or future exploration programs may not result in new mineral producing operations. Even if significant mineralization is discovered, it will likely take many years from the initial phases of exploration until commencement of production, during which time the economic feasibility of production may change.
From time to time, we may acquire mineral interests from other parties. Such acquisitions are based on an analysis of a variety of factors including historical exploration results, estimates of and assumptions regarding the extent of ore reserves, the timing of production from such reserves and cash and other operating costs. In addition, we may rely on data and reports prepared by third parties (including the ability to permit and compliance with existing regulations) and which may contain information or data that we are unable to independently verify or confirm. All of these factors are
8
uncertain and may have an impact on our ability to develop the properties, as well as contributing to the uncertainties related to the process used to estimate ore reserves.
As a result of these uncertainties, our exploration programs and any acquisitions which we may pursue may not result in the expansion or replacement of our current production with new ore reserves or operations, which could have a material adverse effect on our business, prospects, results of operations and financial position.
We may not continue to be profitable. During the fiscal years ended December 31, 2017, 2016 and 2015, we reported net income of $4.2 million, $4.4 million and $3.1 million, respectively. We have accumulated retained earnings of $4.5 million as of December 31, 2017. The metal prices in recent years have had a significant impact on our profit margin and there is no assurance that we will be profitable in the future. Unexpected interruptions in our mining business may cause us to incur losses, or the revenue that we generate from production may not be sufficient to fund continuing operations including exploration and mine construction costs. Our failure to generate future profits may adversely affect the price of our common stock and you may lose all or part of your investment.
We may require significant additional capital to fund our business plans. We may be required to expend significant funds to determine if mineralized material and proven and probable mineral reserves exist at any of our non-producing properties, to continue exploration, and if warranted, develop our existing properties and to identify and acquire additional properties to diversify our property portfolio. If we receive the necessary permits and make a positive development decision, we will require significant additional capital to bring the project into production. We have spent, and may be required to continue to expend, significant amounts of capital for drilling, geological and geochemical analysis, assaying, feasibility studies, mine development, and process equipment in connection with our exploration, development, and production activities. We may not benefit from these investments if we are unable to identify commercially exploitable mineralized material.
Our ability to obtain necessary funding for these purposes, in turn, depends upon a number of factors, including our historical and prospective results of operations, the status of the national and worldwide economy, the price of gold, silver and other valuable metals, the condition of the debt and equity markets, and the costs associated with extracting minerals. We may not be successful in generating or obtaining the required financing, or if we can obtain such financing, such financing may not be on terms that are favorable to us. Failure to obtain such additional financing could result in delay or indefinite postponement of further mining operations or exploration and construction and the possible partial or total loss of our interest in our properties.
If we do not hedge our exposure to reductions in gold and silver prices, we may be subject to significant reductions in price. We do not use hedging transactions with respect to any of our gold and silver production and we do not expect to do so in the future. Accordingly, we may be fully exposed to price fluctuations if gold and/or silver prices decline. While the use of hedging transactions limits the downside risk of price declines, their use also may limit future revenues from price increases. Hedging transactions also involve the risk that the counterparty may be unable to satisfy its obligations.
Revenue from the sale of metal concentrate may be adversely affected by loss or damage during shipment and storage at our buyer’s facilities. We rely on third-party transportation companies to transport our metal concentrate to the buyer’s facilities for processing and further refining. The terms of our sales contracts with the buyers require us to rely on assay results from samples of our metal concentrate that are obtained at the buyer’s warehouse to determine the final sales value for our metals. Once the metal concentrate leaves our processing facility, we no longer have direct custody and control of these products. Theft, loss, automobile accidents, improper storage, fire, natural disasters, tampering or other unexpected events while in transit or at the buyer’s location may lead to the loss of all or a portion of our metal concentrate products. Such losses may not be covered by insurance and may lead to a delay or interruption in our revenue and our operating results may be adversely affected.
9
Exploration and, if deemed feasible, development of mineral properties is inherently risky and could lead to unproductive properties and/or capital investments. Our long-term success depends on our ability to identify additional mineral deposits on our properties and any other properties that we may acquire and to develop one or more of those properties into commercially viable mining operations. Mineral exploration is highly speculative in nature, involves many risks and is frequently unproductive. These risks include unusual or unexpected geologic formations and the inability to obtain suitable or adequate machinery, equipment or labor. The success of gold exploration is determined in part by the following factors:
|
· |
The identification of potential gold mineralization based on surface and drill analysis; |
|
· |
Availability of government-granted exploration and construction permits; |
|
· |
The quality of our management and our geological and technical expertise; and |
|
· |
The capital available for exploration and development. |
Substantial expenditures are required to establish proven and probable reserves through detailed drilling and analysis, to develop metallurgical processes to extract metal and to develop the mining and processing facilities and infrastructure at any site chosen for mining. Whether a mineral deposit will be commercially viable depends on a number of factors, which include, without limitation, the particular attributes of the deposit, such as size, grade, metallurgy, rock competency and proximity to infrastructure like power, water and roads; metal prices, which fluctuate widely; and government regulations, including, without limitation, regulations relating to prices, taxes, royalties, land tenure, land use, importing and exporting of minerals, environmental protection and local and community support. We may invest significant capital and resources in exploration activities and abandon such investments if we are unable to identify commercially exploitable mineral reserves. The decision to abandon a project may have an adverse effect on the market value of our securities and our ability to raise future financing.
We may acquire additional exploration stage properties and our business may be negatively impacted if reserves are not located on acquired properties. We have in the past and may in the future acquire additional exploration stage properties. There can be no assurance that reserves will be identified on any properties that we acquire. We may also experience negative reactions from the financial markets if we successfully complete acquisitions of additional properties and reserves are not located on acquired properties. These factors may adversely affect the trading price of our common stock or our financial condition or results of operations.
To the extent that we seek to expand our operations and increase our reserves through acquisitions, we may experience issues in executing acquisitions or integrating acquired operations. From time to time, we examine opportunities to make selective acquisitions in order to provide increased returns to our shareholders and to expand our operations and reported reserves and, potentially, generate synergies. The success of any acquisition would depend on a number of factors, including, but not limited to:
|
· |
Identifying suitable candidates for acquisition and negotiating acceptable terms; |
|
· |
Obtaining approval from regulatory authorities and potentially our shareholders; |
|
· |
Implementing our standards, controls, procedures and policies at the acquired business and addressing any pre-existing liabilities or claims involving the acquired business; and |
|
· |
To the extent the acquired operations are in a country in which we have not operated historically, understanding the regulations and challenges of operating in that new jurisdiction. |
There can be no assurance that we will be able to conclude any acquisitions successfully, or that any acquisition will achieve the anticipated synergies or other positive results. Any material problems that we encounter in connection with such an acquisition could have a material adverse effect on our business, results of operations and financial position.
10
We rely on contractors to conduct a significant portion of our operations and construction projects. A significant portion of our okperations and construction projects are currently conducted in whole or in part by contractors. As a result, our operations are subject to a number of risks, some of which are outside our control, including:
|
· |
The difficulty and inherent delay in replacing a contractor and its operating equipment in the event that either party terminates the agreement; |
|
· |
Reduced control and oversight over those aspects of operations which are the responsibility of the contractor; |
|
· |
Failure of a contractor to perform under its agreement; |
|
· |
Interruption of operations or increased costs in the event that a contractor ceases its business due to insolvency or other unforeseen events; |
|
· |
Failure of a contractor to comply with applicable legal and regulatory requirements, to the extent it is responsible for such compliance; and |
|
· |
Problems of a contractor with managing its workforce, labor unrest or other related employment issues. |
In addition, we may incur liability to third parties as a result of the actions of our contractors. The occurrence of one or more of these risks could adversely affect our results of operations and financial position.
Our profits are subject to two mining duties imposed by the Mexican government. The Mexican government requires mineral producers to pay a ‘special’ mining duty to the government of 7.5% on net profits and an additional ‘extraordinary’ mining duty of 0.5% on gross sales of precious metals of gold, silver and platinum. This legislation has and may in the future significantly and adversely affect our results of operations, including our cash flows, which may in turn affect the amount of capital we have available for typical uses of cash, including but not limited to, reinvestment into our business, funding new projects and paying dividends to our shareholders.
The facilities and development of our underground mine and operations are subject to all of the risks inherent in development and operations. These risks include potential delays, cost overruns, shortages of material or labor, construction defects, breakdowns and injuries to persons and property. We expect to engage subcontractors and material suppliers in connection with the continued mine activities at the Aguila and Alta Gracia Projects. While we anticipate taking all measures which we deem reasonable and prudent in connection with our facilities, construction of the underground mine and the operation of the processing facility, there is no assurance that the risks described above will not cause delays or cost overruns in connection with such construction or operation. Any delays would postpone our anticipated receipt of revenue and adversely affect our operations, which in turn may adversely affect the price of our stock.
Underground mining operations are subject to unique risks. The exploration for minerals, mine construction and mining operations in an underground mine involve a high level of risk and are often affected by hazards outside of our control. Some of these risks include, but are not limited to, underground fires or floods, fall-of-ground accidents, seismic activity and unexpected geological formations or conditions including noxious fumes or gases. The occurrence of one or more of these events in connection with our exploration, mine construction, or production activities may result in the death of, or personal injury to, our employees, other personnel or third parties, the loss of mining equipment, damage to or destruction of mineral properties or production facilities, monetary losses, deferral or unanticipated fluctuations in production, environmental damage and potential legal liabilities, all of which may adversely affect our reputation, business, prospects, results of operations and financial condition.
Construction of mine and process facilities is subject to all of the risks inherent in construction and start-up, including delays and costs of construction in excess of our projections. Many factors could delay or prevent the start or completion of, or increase the costs of, anticipated future construction of the mine and process facility, including:
|
· |
Design, engineering and construction difficulties or delays; |
|
· |
Cost overruns; |
|
· |
Our failure or delay in obtaining necessary legal, regulatory and other approvals; |
11
|
· |
Interruptions in the supply of the necessary equipment, or construction materials or labor or an increase in their price; |
|
· |
Injuries to persons and property; |
|
· |
Opposition of local and or Non-Governmental-Organization interests; and |
|
· |
Natural disasters, accidents, political unrest or unforeseen events. |
If any of the foregoing events were to occur, our financial condition could be adversely affected and we may be required to seek additional capital, which may not be available on commercially acceptable terms, or at all. If we are unable to complete such construction, we may not be able to recover any costs already incurred. Even if construction of the mine and the processing facilities is completed as scheduled, the costs could exceed our expectations and result in a materially adverse effect on our business, results of operations, financial condition, and cash flows.
Our operations are subject to permitting requirements which could result in the delay, suspension or termination of our operations. Our operations, including our ongoing exploration drilling programs and production, require permits from governmental authorities. If we cannot obtain or maintain the necessary permits or if there is a delay in receiving future permits, our timetable and business plan will be adversely affected.
Our ability to recognize the benefits of deferred tax assets is dependent on future cash flows and taxable income. We recognize deferred tax assets when the tax benefit is considered to be more likely than not of being realized; otherwise, a valuation allowance is applied against deferred tax assets. Assessing the recoverability of deferred tax assets requires management to make significant estimates related to expectations of future taxable income. Estimates of future taxable income are based on forecasted cash flows from operations and the application of existing tax laws in each jurisdiction. To the extent that future cash flows and taxable income differ significantly from estimates, our ability to realize the deferred tax assets could be impacted. Additionally, future changes in tax laws could limit our ability to obtain the future tax benefits represented by our deferred tax assets. At December 31, 2017, our net deferred tax assets were $6.9 million.
Our continuing reclamation obligations at our operations could require significant additional expenditures. We are responsible for the reclamation obligations related to disturbances located on all of our properties. We have a liability on our balance sheet to cover the estimated reclamation obligation. However, there is a risk that any reserve could be inadequate to cover the actual costs of reclamation when carried out. Continuing reclamation obligations will require a significant amount of capital. There is a risk that we will be unable to fund these additional obligations and further, that the regulatory authorities may increase reclamation requirements to such a degree that it would not be commercially reasonable to continue mining and exploration activities, which may adversely affect our results of operations, financial performance and cash flows.
Our operating properties located in Mexico are subject to changes in political or economic conditions and regulations in that country. The risks with respect to Mexico or other developing countries include, but are not limited to: nationalization of properties, military repression, extreme fluctuations in currency exchange rates, criminal activity, lack of personal safety or ability to safeguard property, labor instability or militancy, mineral title irregularities and high rates of inflation. In addition, changes in mining or investment policies or shifts in political attitude in Mexico may adversely affect our business. We may be affected in varying degrees by government regulation with respect to restrictions on production, price controls, export controls, income taxes, expropriation of property, maintenance of claims, environmental legislation, land use, land claims of local people, opposition from non-governmental organizations, water use and mine safety. The effect of these factors cannot be accurately predicted and may adversely impact our operations.
Our ability to develop our Mexican properties is subject to the rights of the Ejido (agrarian cooperatives) who use or own the surface for agricultural purposes. Our ability to mine minerals is subject to maintaining satisfactory arrangements and relationships with the Ejido for access and surface disturbances. Ejidos are groups of local inhabitants who were granted rights to conduct agricultural activities on the property. We must negotiate and maintain a satisfactory arrangement with these residents in order to disturb or discontinue their rights to farm. While we have successfully
12
negotiated and signed such agreements related to the Aguila and Alta Gracia Projects, our inability to maintain these agreements or consummate similar agreements for new projects could impair or impede our ability to successfully explore, develop and mine the properties.
Competition in the mining industry is intense, and we have limited financial and personnel resources with which to compete. Competition in the mining industry for desirable properties, investment capital and personnel is intense. Numerous companies headquartered in the United States, Canada, and elsewhere throughout the world compete for properties and personnel on a global basis. We are a small participant in the gold mining industry due to our limited financial and personnel resources. We presently operate with a limited number of personnel and we anticipate operating in the same manner going forward. We compete with other companies in our industry to hire qualified personnel when needed to successfully operate our mine and processing facility. We may be unable to attract the necessary investment capital or personnel to fully explore and if warranted, develop our properties and be unable to acquire other desirable properties. We believe that competition for acquiring mineral properties, as well as the competition to attract and retain qualified personnel, may continue to be intense in the future.
Since a significant amount of our expenses in Mexico are paid in Mexican pesos, we are subject to changes in currency values that may adversely affect our results of operations. Our operations in the future could be affected by changes in the value of the Mexican peso against the United States dollar. The appreciation of non-U.S. dollar currencies such as the peso against the U.S. dollar increases expenses and the cost of purchasing capital assets in U.S. dollar terms in Mexico, which can adversely impact our operating results and cash flows. Conversely, depreciation of non-U.S. dollar currencies usually decreases operating costs and capital asset purchases in U.S. dollar terms. The value of cash and cash equivalents, and other monetary assets and liabilities denominated in foreign currencies also fluctuate with changes in currency exchange rates.
Our activities are subject to significant environmental regulations, which could raise the cost of doing business or adversely affect our ability to develop our properties. Our mining operations in Mexico are subject to environmental regulation by SEMARNAT. Regulations governing advancement of new projects or significant changes to existing projects require an environmental impact statement, known in Mexico as a MIA. We may also be required to submit proof of local community support for a project to obtain final approval. If an environmental impact statement is adverse or if we cannot obtain community support, our ability to explore and develop our properties could be adversely affected. Significant environmental legislation exists in Mexico, including fines and penalties for spills, release of emissions into the air, and other environmental damage, which fines or penalties could adversely affect our financial condition or results of operations.
In addition, significant state and federal environmental protection laws in the U.S. may hinder our ability to explore at our Nevada Mining Unit and may also delay or prohibit us from developing properties where economic mineralization is found. Federal laws that govern mining claim location and maintenance and mining operations on federal lands are generally administered by the BLM. Additional federal laws, governing mine safety and health, also apply. State laws also require various permits and approvals before exploration, development or production operations can begin. Among other things, a reclamation plan must typically be prepared and approved, with bonding in the amount of projected reclamation costs. The bond is used to ensure that proper reclamation takes place, and the bond will not be released until that time. Local jurisdictions may also impose permitting requirements (such as conditional use permits or zoning approvals).
Our business is subject to the U.S. Foreign Corrupt Practices Act and similar worldwide anti-bribery laws, a breach or violation of which could lead to civil and criminal fines and penalties, loss of licenses or permits and reputational harm. We operate in certain jurisdictions that have experienced governmental and private sector corruption to some degree, and in certain circumstances, strict compliance with anti-bribery laws may conflict with certain local customs and practices. The U.S. Foreign Corrupt Practices Act and anti-bribery laws in other jurisdictions generally prohibit companies and their intermediaries from making improper payments for the purpose of obtaining or retaining business or other commercial advantage. Our Code of Ethics and other corporate policies mandate compliance with these anti-bribery laws, which often carry substantial penalties. There can be no assurance that our internal control policies and
13
procedures will always protect us from recklessness, fraudulent behavior, dishonesty or other inappropriate acts committed by our affiliates, employees or agents. As such, our corporate policies and processes may not prevent all potential breaches of law or other governance practices. Violations of these laws, or allegations of such violations, could lead to civil and criminal fines and penalties, litigation, and loss of operating licenses or permits, and may damage our reputation, which could have a material adverse effect on our business, financial position and results of operations or cause the market value of our common stock to decline.
We are dependent upon information technology systems, which are subject to disruption, damage, failure and risks associated with implementation and integration. We are dependent upon information technology systems in the conduct of our operations. Our information technology systems are subject to disruption, damage or failure from a variety of sources, including, without limitation, computer viruses, security breaches, cyber-attacks, natural disasters and defects in design. Cybersecurity incidents, in particular, are evolving and include, but are not limited to, malicious software, attempts to gain unauthorized access to data and other electronic security breaches that could lead to disruptions in systems, unauthorized release of confidential or otherwise protected information and the corruption of data. Various measures have been implemented to manage our risks related to information technology systems and network disruptions. However, given the unpredictability of the timing, nature and scope of information technology disruptions, we could potentially be subject to production downtimes, operational delays, the compromising of confidential or otherwise protected information, destruction or corruption of data, security breaches, other manipulation or improper use of our systems and networks or financial losses from remedial actions, any of which could have a material adverse effect on our cash flows, competitive position, financial condition or results of operations.
We may also be adversely affected by system or network disruptions if new or upgraded information technology systems are defective, not installed properly or not properly integrated into our operations. We are modifying our enterprise software to support various operational functions, financial reporting and controls management. The modification of this system carries risks such as cost overruns, delays and interruptions. If we are not able to successfully implement these system modifications, we may have to rely on manual reporting processes and controls over financial reporting that have not been planned, designed or tested. Various measures have been implemented to manage our risks related to the system implementation and modification, but system modification failures could have a material adverse effect on our business, financial condition and results of operations and could, if not successfully implemented, adversely impact the effectiveness of our internal controls over financial reporting.
The nature of mineral exploration and production activities involves a high degree of risk and the possibility of uninsured losses. Exploration for and the production of minerals is highly speculative and involves greater risk than many other businesses. Many exploration programs do not result in the discovery of mineralization, and any mineralization discovered may not be of sufficient quantity or quality to be profitably mined. Our operations are, and any future mining operations or construction we may conduct will be, subject to all of the operating hazards and risks normally incident to exploring for and mining of mineral properties, such as, but not limited to:
|
· |
Economically insufficient mineralized material; |
|
· |
Fluctuation in production costs that make mining uneconomic; |
|
· |
Labor disputes; |
|
· |
Unanticipated variations in grade and other geologic problems; |
|
· |
Environmental hazards; |
|
· |
Water conditions; |
|
· |
Difficult surface or underground conditions; |
|
· |
Industrial accidents; |
|
· |
Metallurgic and other processing problems; |
|
· |
Mechanical and equipment performance problems; |
|
· |
Failure of pit walls, dams, declines, drifts and shafts; |
|
· |
Unusual or unexpected rock formations; |
|
· |
Personal injury, fire, flooding, cave-ins and landslides; and |
14
|
· |
Decrease in the value of mineralized material due to lower gold, silver prices, and other metal prices. |
Any of these risks can materially and adversely affect, among other things, the construction of properties, production quantities and rates, costs and expenditures, potential revenues and targeted production dates. We currently have limited insurance to guard against some of these risks. If we determine that capitalized costs associated with any of our mineral interests are not likely to be recovered, we would incur a write down of our investment in these interests. All of these factors may result in losses in relation to amounts spent which are not recoverable or result in additional expenses.
We do not insure against all of the risks to which we may be subject in our operations. While we currently maintain insurance for general commercial liability claims and the physical assets at our Aguila and Alta Gracia Projects, we do not maintain insurance to cover all of the potential risks associated with our operations. We might be subject to liability for environmental, pollution or other hazards associated with mineral exploration and mine construction, for which insurance may not be available, which may exceed the limits of our insurance coverage, or which we may elect not to insure against because of premium costs or other reasons. We may also not be insured against interruptions to our operations. Losses from these or other events may cause us to incur significant costs which could materially adversely affect our financial condition and our ability to fund activities on our property. A significant loss could force us to reduce or suspend our operations.
We depend upon a limited number of personnel and the loss of any of these individuals could adversely affect our business. Due to the relatively limited number of personnel that we employ, we are dependent on certain individuals to run our business. These individuals include our executive officers and other key employees. If any of these individuals were to die, become disabled or leave our company, we would be forced to identify and retain individuals to replace them. There is no assurance that we can find suitable individuals to replace them or to add to our employee base if that becomes necessary. We have no life insurance on any individual, and we may be unable to hire a suitable replacement on favorable terms should that become necessary.
Title to mineral properties can be uncertain, and we are at risk of loss of ownership of one or more of our properties. Our ability to explore and operate our properties depends on the validity of our title to that property. Our U.S. mineral properties include patented and unpatented mining claims. Unpatented mining claims provide only possessory title and their validity is often subject to contest by third parties or the federal government, which makes the validity of unpatented mining claims uncertain and generally riskier. Our concessions in Mexico are subject to continuing government regulation and failure to adhere to such regulations will result in termination of the concession. Uncertainties inherent in mineral properties relate to such things as the sufficiency of mineral discovery, proper posting and marking of boundaries, assessment work and possible conflicts with other claims not determinable from public record. We have not obtained title opinions covering our entire property, with the attendant risk that title to some claims, particularly title to undeveloped property, may be defective. There may be valid challenges to the title to our property which, if successful, could impair development and/or operations.
In the event of a dispute regarding title to our Mexican properties, it will likely be necessary for us to resolve the dispute in Mexico, where we would be faced with unfamiliar laws and procedures. The resolution of disputes in foreign countries can be costly and time consuming. In a foreign country we face the additional burden of understanding unfamiliar laws and procedures. We may not be entitled to a jury trial, as we might be in the United States. Further, to litigate in any foreign country, we would be faced with the necessity of hiring lawyers and other professionals who are familiar with the foreign laws. For these reasons, we may incur unforeseen costs if we are forced to resolve a dispute in Mexico or any other foreign country.
Our directors and officers may be protected from certain types of lawsuits. The laws of the State of Colorado provide that our directors will not be liable to us or our shareholders for monetary damages for all but certain types of conduct as directors of the company. Our Articles of Incorporation permit us to indemnify our directors and officers against all damages incurred in connection with our business to the fullest extent provided or allowed by law. Additionally, we entered into individual indemnification agreements with our current directors and officers and we
15
intend to execute substantially similar agreements with future directors and officers. The exculpation provisions of any of these items may have the effect of preventing shareholders from recovering damages against our directors caused by their negligence, poor judgment or other circumstances. The indemnification provisions may require us to use our limited assets to defend our directors and officers against claims, including claims arising out of their negligence, poor judgment or other circumstances. Pursuant to the terms of the indemnification agreements, we are required to advance funds to our directors and officers prior to the final disposition of any threatened or actual legal proceeding, and including in the event it is ultimately determined that such officer or director is not entitled to indemnification pursuant to the terms of the indemnification agreement, in which case we will depend on reimbursement of advanced expenses from such individual.
Risks Related to Our Common Stock
Our stock price may be volatile and as a result you could lose part or all of your investment. In addition to other risk factors identified and to volatility associated with equity securities in general, the value of your investment could decline due to the impact of numerous factors upon the market price of our common stock, including:
|
· |
Changes in the worldwide price for gold and/or silver; |
|
· |
Volatility in the equities markets; |
|
· |
Adverse results from our exploration, development, or production efforts; |
|
· |
Producing at rates lower than those targeted; |
|
· |
Political and regulatory risks; |
|
· |
Weather conditions, including unusually heavy rains; |
|
· |
Failure to meet our revenue or profit goals or operating budget; |
|
· |
Decline in demand for our common stock; |
|
· |
Downward revisions in securities analysts’ estimates or changes in general market conditions; |
|
· |
Technological innovations by competitors or in competing technologies; |
|
· |
Investor perception of our industry or our prospects; |
|
· |
Lawsuits; |
|
· |
Actions by government or central banks; and |
|
· |
General economic trends. |
Stock markets in general have experienced extreme price and volume fluctuations and the market prices of securities have been highly volatile. These fluctuations are often unrelated to operating performance and may adversely affect the market price of our common stock. As a result, you may be unable to resell your shares at a desired price.
Past payments of dividends on our common stock are not an indicator of future payments of dividends. In 2011, we instituted a monthly cash dividend payable to holders of our common stock. However, our ability to continue to pay dividends in the future will depend on a number of factors, including, cash flow, mine construction requirements and strategies, other acquisition and/or construction projects, spot gold and silver prices, taxation, government-imposed royalties and general market conditions. Further, a portion of our cash flow is expected to be retained to finance our operations and development of mineral properties. Any material change in our operations may affect future dividends which may be modified or canceled at the discretion of our Board of Directors. Any decrease in our monthly dividend would likely have an adverse impact on the price of our common stock.
We are subject to the Continued Listing Criteria of the New York Stock Exchange (“NYSE American”), and our failure to satisfy these criteria may result in delisting of our common stock. Our common stock is currently listed on the NYSE American. In order to maintain the listing, we must maintain certain share price and other targets, including maintaining a minimum amount of shareholders’ equity and a minimum number of public shareholders. In addition to objective standards, the NYSE American may delist the securities of any issuer if, in its opinion, the issuer’s financial condition and/or operating results appear unsatisfactory; if it appears that the extent of public distribution or the aggregate market value of the security has become so reduced as to make continued listing on the NYSE American inadvisable; if the issuer sells or disposes of principal operating assets or ceases to be an operating company; if an issuer
16
fails to comply with the NYSE American’s listing requirements; if an issuer’s common stock sells at what the NYSE American considers a “low selling price” and the issuer fails to correct this via a reverse split of shares after notification by the NYSE American; or if any other event occurs or any condition exists which makes continued listing on the NYSE American, in its opinion, inadvisable.
If the NYSE American delists our common stock, investors may face material adverse consequences, including, but not limited to, a lack of trading market for our securities, reduced liquidity, decreased analyst coverage of our securities, and an inability for us to obtain additional financing to fund our operations.
Issuances of our stock in the future could dilute existing shareholders and adversely affect the market price of our common stock. We have the authority to issue up to 100,000,000 shares of common stock, 5,000,000 shares of preferred stock, and to issue options and warrants to purchase shares of our common stock without stockholder approval. As of March 7, 2018, there were 57,107,884 shares of common stock outstanding. Future issuances of our securities could be at prices substantially below the price paid for our common stock by our current shareholders. In addition, we can issue blocks of our common stock in amounts up to 20% of the then outstanding shares without further shareholder approval. Because we have issued less of our common stock than many of our larger peers, the issuance of a significant amount of our common stock may have a disproportionately large impact on our share price compared to larger companies.
Our awards of our shares and stock options to employees may not have their intended effect. A portion of our total compensation program for our executive officers and key personnel has historically included the award of shares and options to buy shares of our common stock. If the price of our common stock performs poorly, such performance may adversely affect our ability to retain or attract critical personnel. In addition, any changes made to our stock option policies or to any other of our compensation practices which are made necessary by governmental regulations or competitive pressures could affect our ability to retain and motivate existing personnel and recruit new personnel.
ITEM 1B.UNRESOLVED STAFF COMMENTS
None.
We classify our mineral properties into two categories: “Operating Properties” and “Exploration Properties”. Operating Properties are properties on which we operate a producing mine and are what we consider a “material” property in accordance with SEC Industry Guide 7.
We currently have an interest in ten properties. Six of our properties, including two Operating Properties and four Exploration Properties, are within our Oaxaca Mining Unit located in Oaxaca, Mexico, along the San Jose structural corridor. In addition, we have four Exploration Properties within our Nevada Mining Unit located in south central Nevada, U.S.A in the Walker Lane Mineral Belt. We own three of the Nevada properties and have an option to purchase the fourth. Please see Item 1. Business for additional information about our business.
The term “proven (measured) reserves” means reserves for which (a) quantity is computed from dimensions revealed in outcrops, trenches, workings or drill holes, grade, and/or quality are computed from the results of detailed sampling; and (b) the sites for inspection, sampling and measurements are spaced so closely and the geologic character is sufficiently defined that the size, shape, depth and mineral content of reserves is well established. The term “probable (indicated) reserves” means reserves for which quantity and grade and/or quality are computed from information similar to that used for proven (measured) reserves, but the sites for inspection, sampling, and measurement are farther apart or are otherwise less adequately spaced. The degree of assurance, although lower than that for proven (measured) reserves, is high enough to assume continuity between points of observation.
17
As of December 31, 2017, our estimate of Proven and Probable (“P&P”) reserves was:
|
Description |
|
Tonnes |
|
Gold |
|
Silver |
|
Precious Metal Gold Equivalent g/t |
|
Gold Ounces |
|
Silver Ounces |
|
Precious Metal Gold Equivalent Ounces |
|
Copper % |
|
Lead % |
|
Zinc % |
|
|
Arista Mine |
|
|
|
|
|
|
|
|
|
|
|
|
|
|
|
|
|
|
|
|
|
|
Proven |
|
1,987,600 |
|
1.87 |
|
130 |
|
3.64 |
|
119,800 |
|
8,299,800 |
|
232,600 |
|
0.3 |
|
1.3 |
|
3.6 |
|
|
Probable |
|
433,400 |
|
1.50 |
|
124 |
|
3.19 |
|
20,800 |
|
1,730,600 |
|
44,400 |
|
0.3 |
|
1.1 |
|
3.0 |
|
|
Arista Mine Total |
|
2,421,000 |
|
1.81 |
|
129 |
|
3.56 |
|
140,600 |
|
10,030,400 |
|
277,000 |
|
0.3 |
|
1.3 |
|
3.6 |
|
|
Mirador Mine |
|
|
|
|
|
|
|
|
|
|
|
|
|
|
|
|
|
|
|
|
|
|
Proven |
|
59,400 |
|
0.71 |
|
352 |
|
5.49 |
|
1,400 |
|
672,600 |
|
10,500 |
|
|
|
|
|
|
|
|
Probable |
|
20,700 |
|
0.65 |
|
337 |
|
5.23 |
|
400 |
|
224,900 |
|
3,500 |
|
|
|
|
|
|
|
|
Mirador Mine Total |
|
80,100 |
|
0.69 |
|
348 |
|
5.43 |
|
1,800 |
|
897,500 |
|
14,000 |
|
|
|
|
|
|
|
|
Oaxaca Mining Unit Total |
|
2,501,100 |
|
1.77 |
|
136 |
|
3.62 |
|
142,400 |
|
10,927,900 |
|
291,000 |
|
|
|
|
|
|
|
Notes to the 2017 P&P reserves:
|
1. |
Metal prices used for P&P reserves were $1,222 per ounce of gold, $16.62 per ounce of silver, $2.50 per pound of copper, $0.90 per pound of lead and $1.05 per pound of zinc. These prices reflect the three-year trailing average prices for gold, silver, copper, lead and zinc. |
|
2. |
Precious metal gold equivalent is 73.53:1 using gold and silver only to calculate gold equivalencies. |
|
3. |
A breakeven Net Smelter Return (“NSR”) cutoff grade of $80 per tonne was used for estimations of P&P reserves at the Arista Underground Mine. The term “cutoff grade” means the lowest NSR value considered economic to process. |
|
4. |
No appreciable amounts of base metals are present in the veins identified to-date at the Mirador Underground Mine at the Alta Gracia property. A breakeven cutoff grade of 2.04 g/t gold-equivalent (AuEq) was used for proven and probable reserves at the Mirador Underground Mine using gold and silver only to calculate gold equivalencies. |
|
5. |
Mining, processing, energy, administrative and smelting/refining costs were based on 2017 actual costs for the Oaxaca Mining Unit. |
|
6. |
Arista Mine metallurgical recovery assumptions used were 81% for gold, 92% for silver, 73% for copper, 74% for lead and 84% for zinc. Mirador Mine metallurgical recovery assumptions used were 74% for gold and 81% for silver. These recoveries reflect 2017 actual average recoveries for the Aguila and Alta Gracia Projects. |
|
7. |
P&P reserves are diluted and factored for expected mining recovery. |
|
8. |
Minimum mining width for P&P reserves is 1.5 meters. |
|
9. |
Figures in tables are rounded to reflect estimate precision and small differences generated by rounding are not material to estimates |
For comparison, at December 31, 2016, our estimate of P&P reserves was:
|
Description |
|
Tonnes |
|
Gold |
|
Silver |
|
Precious Metal Gold Equivalent g/t |
|
Gold Ounces |
|
Silver Ounces |
|
Precious Metal Gold Equivalent Ounces |
|
Copper % |
|
Lead % |
|
Zinc % |
|
|
Arista Mine |
|
|
|
|
|
|
|
|
|
|
|
|
|
|
|
|
|
|
|
|
|
|
Proven |
|
1,495,300 |
|
2.72 |
|
163 |
|
5.03 |
|
131,000 |
|
7,860,500 |
|
241,900 |
|
0.3 |
|
1.3 |
|
3.6 |
|
|
Probable |
|
352,400 |
|
3.07 |
|
147 |
|
5.15 |
|
34,800 |
|
1,667,400 |
|
58,300 |
|
0.3 |
|
1.1 |
|
3.0 |
|
|
Arista Mine Total |
|
1,847,700 |
|
2.79 |
|
160 |
|
5.05 |
|
165,800 |
|
9,527,900 |
|
300,200 |
|
0.3 |
|
1.3 |
|
3.6 |
|
|
Mirador Mine |
|
|
|
|
|
|
|
|
|
|
|
|
|
|
|
|
|
|
|
|
|
|
Proven |
|
32,600 |
|
1.12 |
|
358 |
|
6.18 |
|
1,200 |
|
374,800 |
|
6,500 |
|
|
|
|
|
|
|
|
Probable |
|
11,200 |
|
0.86 |
|
295 |
|
5.03 |
|
300 |
|
106,600 |
|
1,800 |
|
|
|
|
|
|
|
|
Mirador Mine Total |
|
43,800 |
|
1.06 |
|
342 |
|
5.88 |
|
1,500 |
|
481,400 |
|
8,300 |
|
|
|
|
|
|
|
|
Oaxaca Mining Unit Total |
|
1,891,500 |
|
2.75 |
|
165 |
|
5.07 |
|
167,300 |
|
10,009,300 |
|
308,500 |
|
|
|
|
|
|
|
Notes to the 2016 P&P reserves:
|
1. |
Metal prices used for P&P reserves were $1,225 per ounce of gold, $17.29 per ounce of silver, $2.60 per pound of copper, $0.87 per pound of lead and $0.94 per pound of zinc. These prices reflect the three-year trailing average prices for gold, silver, copper, lead and zinc. |
18
|
2. |
Precious metal gold equivalent is 70.85:1 using gold and silver only to calculate gold equivalents. |
|
3. |
A breakeven Net Smelter Return (“NSR”) cutoff grade of $80 per tonne was used for estimations of P&P reserves. The term “cutoff grade” means the lowest NSR value considered economic to process. |
|
4. |
Mining, processing, energy, administrative and smelting/refining costs were based on 2016 actual costs for the Oaxaca Mining Unit. |
|
5. |
Metallurgical recovery assumptions used were 89% for gold, 92% for silver, 78% for copper, 74% for lead and 84% for zinc. These recoveries reflect 2016 actual average recoveries for the Aguila project. |
|
6. |
P&P reserves represents estimated in-place material, diluted and factored for expected mining recovery. |
|
7. |
Minimum mining width for P&P reserves is 1.5 meters. |
|
8. |
Figures in tables are rounded to reflect estimate precision and small differences generated by rounding are not material to estimates. |
Mineralized Material
We use the term “mineralized material” to describe mineralization in our mineral deposits that do not constitute “reserves” under U.S. reporting requirements set forth in Guide 7.
In addition to our P&P reserves, we estimate measured and indicated (“M&I”) mineralized material within the definition of Guide 7. Mineralized material does not have demonstrated economic viability. The SEC only permits issuers to report “mineralized material” in tonnage and average grade without reference to contained ounces or quantities of other metals. All of our mineralized material is located at our Oaxaca Mining Unit.
As of December 31, 2017, our estimate of M&I mineralized material was:
|
|
Description |
|
Tonnes |
|
Gold |
|
Silver |
|
Copper % |
|
Lead % |
|
Zinc % |
|
|
|
Arista Mine |
|
|
|
|
|
|
|
|
|
|
|
|
|
|
|
Measured |
|
677,100 |
|
1.55 |
|
112 |
|
0.3 |
|
1.2 |
|
3.9 |
|
|
|
Indicated |
|
1,008,700 |
|
1.49 |
|
99 |
|
0.2 |
|
1.2 |
|
3.6 |
|
|
|
Arista Mine Total |
|
1,685,800 |
|
1.51 |
|
104 |
|
0.3 |
|
1.7 |
|
3.7 |
|
|
|
Alta Gracia Project |
|
|
|
|
|
|
|
|
|
|
|
|
|
|
|
Measured |
|
23,300 |
|
0.74 |
|
275 |
|
|
|
|
|
|
|
|
|
Indicated |
|
23,900 |
|
0.58 |
|
241 |
|
|
|
|
|
|
|
|
|
Alta Gracia Project Total |
|
47,200 |
|
0.66 |
|
258 |
|
|
|
|
|
|
|
|
|
Margaritas Project |
|
|
|
|
|
|
|
|
|
|
|
|
|
|
|
Measured |
|
19,800 |
|
0.70 |
|
280 |
|
|
|
|
|
|
|
|
|
Indicated |
|
38,100 |
|
0.73 |
|
274 |
|
|
|
|
|
|
|
|
|
Margaritas Project Total |
|
57,900 |
|
0.72 |
|
276 |
|
|
|
|
|
|
|
|
|
Oaxaca Mining Unit Total |
|
1,790,900 |
|
|
|
|
|
|
|
|
|
|
|
Notes to the 2017 M&I mineralized material:
|
1. |
Metal prices used for M&I mineralized material were $1,222 per ounce of gold, $16.62 per ounce of silver, $2.50 per pound of copper, $0.90 per pound of lead and $1.05 per pound of zinc. These prices reflect the three-year trailing average prices for gold, silver, copper, lead and zinc. |
|
2. |
A breakeven Net Smelter Return (“NSR”) cutoff grade of $80 per tonne was used for estimations of M&I mineralized material. The term “cutoff grade” means the lowest NSR value considered economic to process. |
|
3. |
No appreciable amounts of base metals are present in the veins identified to-date at the Alta Gracia Project including the Mirador Underground Mine, and the Margaritas Project. A breakeven cutoff grade of 2.04 g/t gold-equivalent (AuEq) was used for M&I mineralized material at the Alta Gracia and Margaritas Projects using gold and silver only to calculate gold equivalencies. |
|
4. |
Arista Mine metallurgical recovery assumptions used were 81% for gold, 92% for silver, 73% for copper, 74% for lead and 84% for zinc. Alta Gracia and Margaritas projects metallurgical recovery assumptions used were 74% for gold and 81% for silver. These recoveries reflect 2017 actual average recoveries for the Aguila and Alta Gracia Projects. |
|
5. |
M&I mineralized material is diluted and factored for expected mining recovery. |
|
6. |
Minimum mining width for M&I mineralized material is 1.5 meters. |
|
7. |
Figures in tables are rounded to reflect estimate precision and small differences generated by rounding are not material to estimates |
19
For comparison, at December 31, 2016, our estimate of M&I mineralized material was:
|
Description |
|
Tonnes |
|
Gold |
|
Silver |
|
Copper % |
|
Lead % |
|
Zinc % |
|
|
Arista Mine |
|
|
|
|
|
|
|
|
|
|
|
|
|
|
Measured |
|
777,800 |
|
1.95 |
|
127 |
|
0.4 |
|
1.7 |
|
5 |
|
|
Indicated |
|
955,100 |
|
1.21 |
|
118 |
|
0.3 |
|
1.6 |
|
4.5 |
|
|
Arista Mine Total |
|
1,732,900 |
|
1.54 |
|
122 |
|
0.3 |
|
1.7 |
|
4.8 |
|
|
Alta Gracia Project |
|
|
|
|
|
|
|
|
|
|
|
|
|
|
Measured |
|
145,000 |
|
0.36 |
|
242 |
|
|
|
|
|
|
|
|
Indicated |
|
151,900 |
|
0.36 |
|
222 |
|
|
|
|
|
|
|
|
Alta Gracia Project Total |
|
296,900 |
|
0.36 |
|
232 |
|
|
|
|
|
|
|
|
Margaritas Project |
|
|
|
|
|
|
|
|
|
|
|
|
|
|
Measured |
|
19,800 |
|
0.70 |
|
280 |
|
|
|
|
|
|
|
|
Indicated |
|
38,100 |
|
0.73 |
|
274 |
|
|
|
|
|
|
|
|
Margaritas Project Total |
|
57,900 |
|
0.72 |
|
276 |
|
|
|
|
|
|
|
|
Oaxaca Mining Unit Total |
|
2,087,700 |
|
|
|
|
|
|
|
|
|
|
|
Notes to the 2016 M&I mineralized material:
|
1. |
Metal prices used for M&I mineralized material were $1,225 per ounce of gold, $17.29 per ounce of silver, $2.60 per pound of copper, $0.87 per pound of lead, and $0.94 per pound of zinc. These prices reflect the three-year trailing average prices for gold, silver, copper, lead and zinc. |
|
2. |
A breakeven NSR return cutoff grade of $80 per tonne was used for estimations of M&I mineralized material. The term “cutoff grade” means the lowest NSR value considered economic to process. |
|
3. |
Metallurgical recovery assumptions used were 89% for gold, 92% for silver, 78% for copper, 74% for lead and 84% for zinc. These recoveries reflect 2016 actual average recoveries for the Oaxaca Mining Unit. |
|
4. |
M&I mineralized material represents estimated material in place and diluted and factored for expected mining recovery. |
|
5. |
Minimum mining width for M&I mineralized material is 1.5 meters. |
|
6. |
Figures in tables are rounded to reflect estimate precision and small differences generated by rounding are not material to estimates |
Our P&P Reserve and M&I Mineralized Material estimates were prepared by our technical staff under the direction of Fred H. Brown, Senior Resource Geologist, and Barry Devlin, Vice President of Exploration. Mr. Brown graduated with a Bachelor of Science degree in Geology from New Mexico State University in 1987, obtained a Graduate Diploma in Engineering (Mining) in 1997 from the University of the Witwatersrand and a Master of Science in Engineering (Civil) from the University of the Witwatersrand in 2005. He is registered with the Association of Professional Engineers and Geoscientists of British Columbia and as a Professional Geoscientist and the Society for Mining, Metallurgy and Exploration as a Registered Member. Mr. Devlin holds a Bachelor of Science degree with honors in Geology, 1981, and a Masters in Geology, 1987, from the University of British Columbia, Vancouver, Canada. He is also a Professional Geologist registered with the Association of Professional Engineers and Geoscientists of British Columbia.
For a description of the key assumptions, parameters and methods used to estimate Proven and Probable Reserves and Mineralized Material included in this report, as well as data verification procedures and a general discussion of the extent to which the estimates may be affected by any known environmental, permitting, legal, title, taxation, socio-political, marketing or other factors, investors may review the annual reserve report posted on our website (http://www.goldresourcecorp.com.)
20
All of the properties that make up our Oaxaca Mining Unit are located in Oaxaca, Mexico in what is known as the San Jose structural corridor, which runs north 70 degrees west. Our properties comprise 55 continuous kilometers of this structural corridor which spans three historic mining districts in Oaxaca; the map below shows the general location our properties:
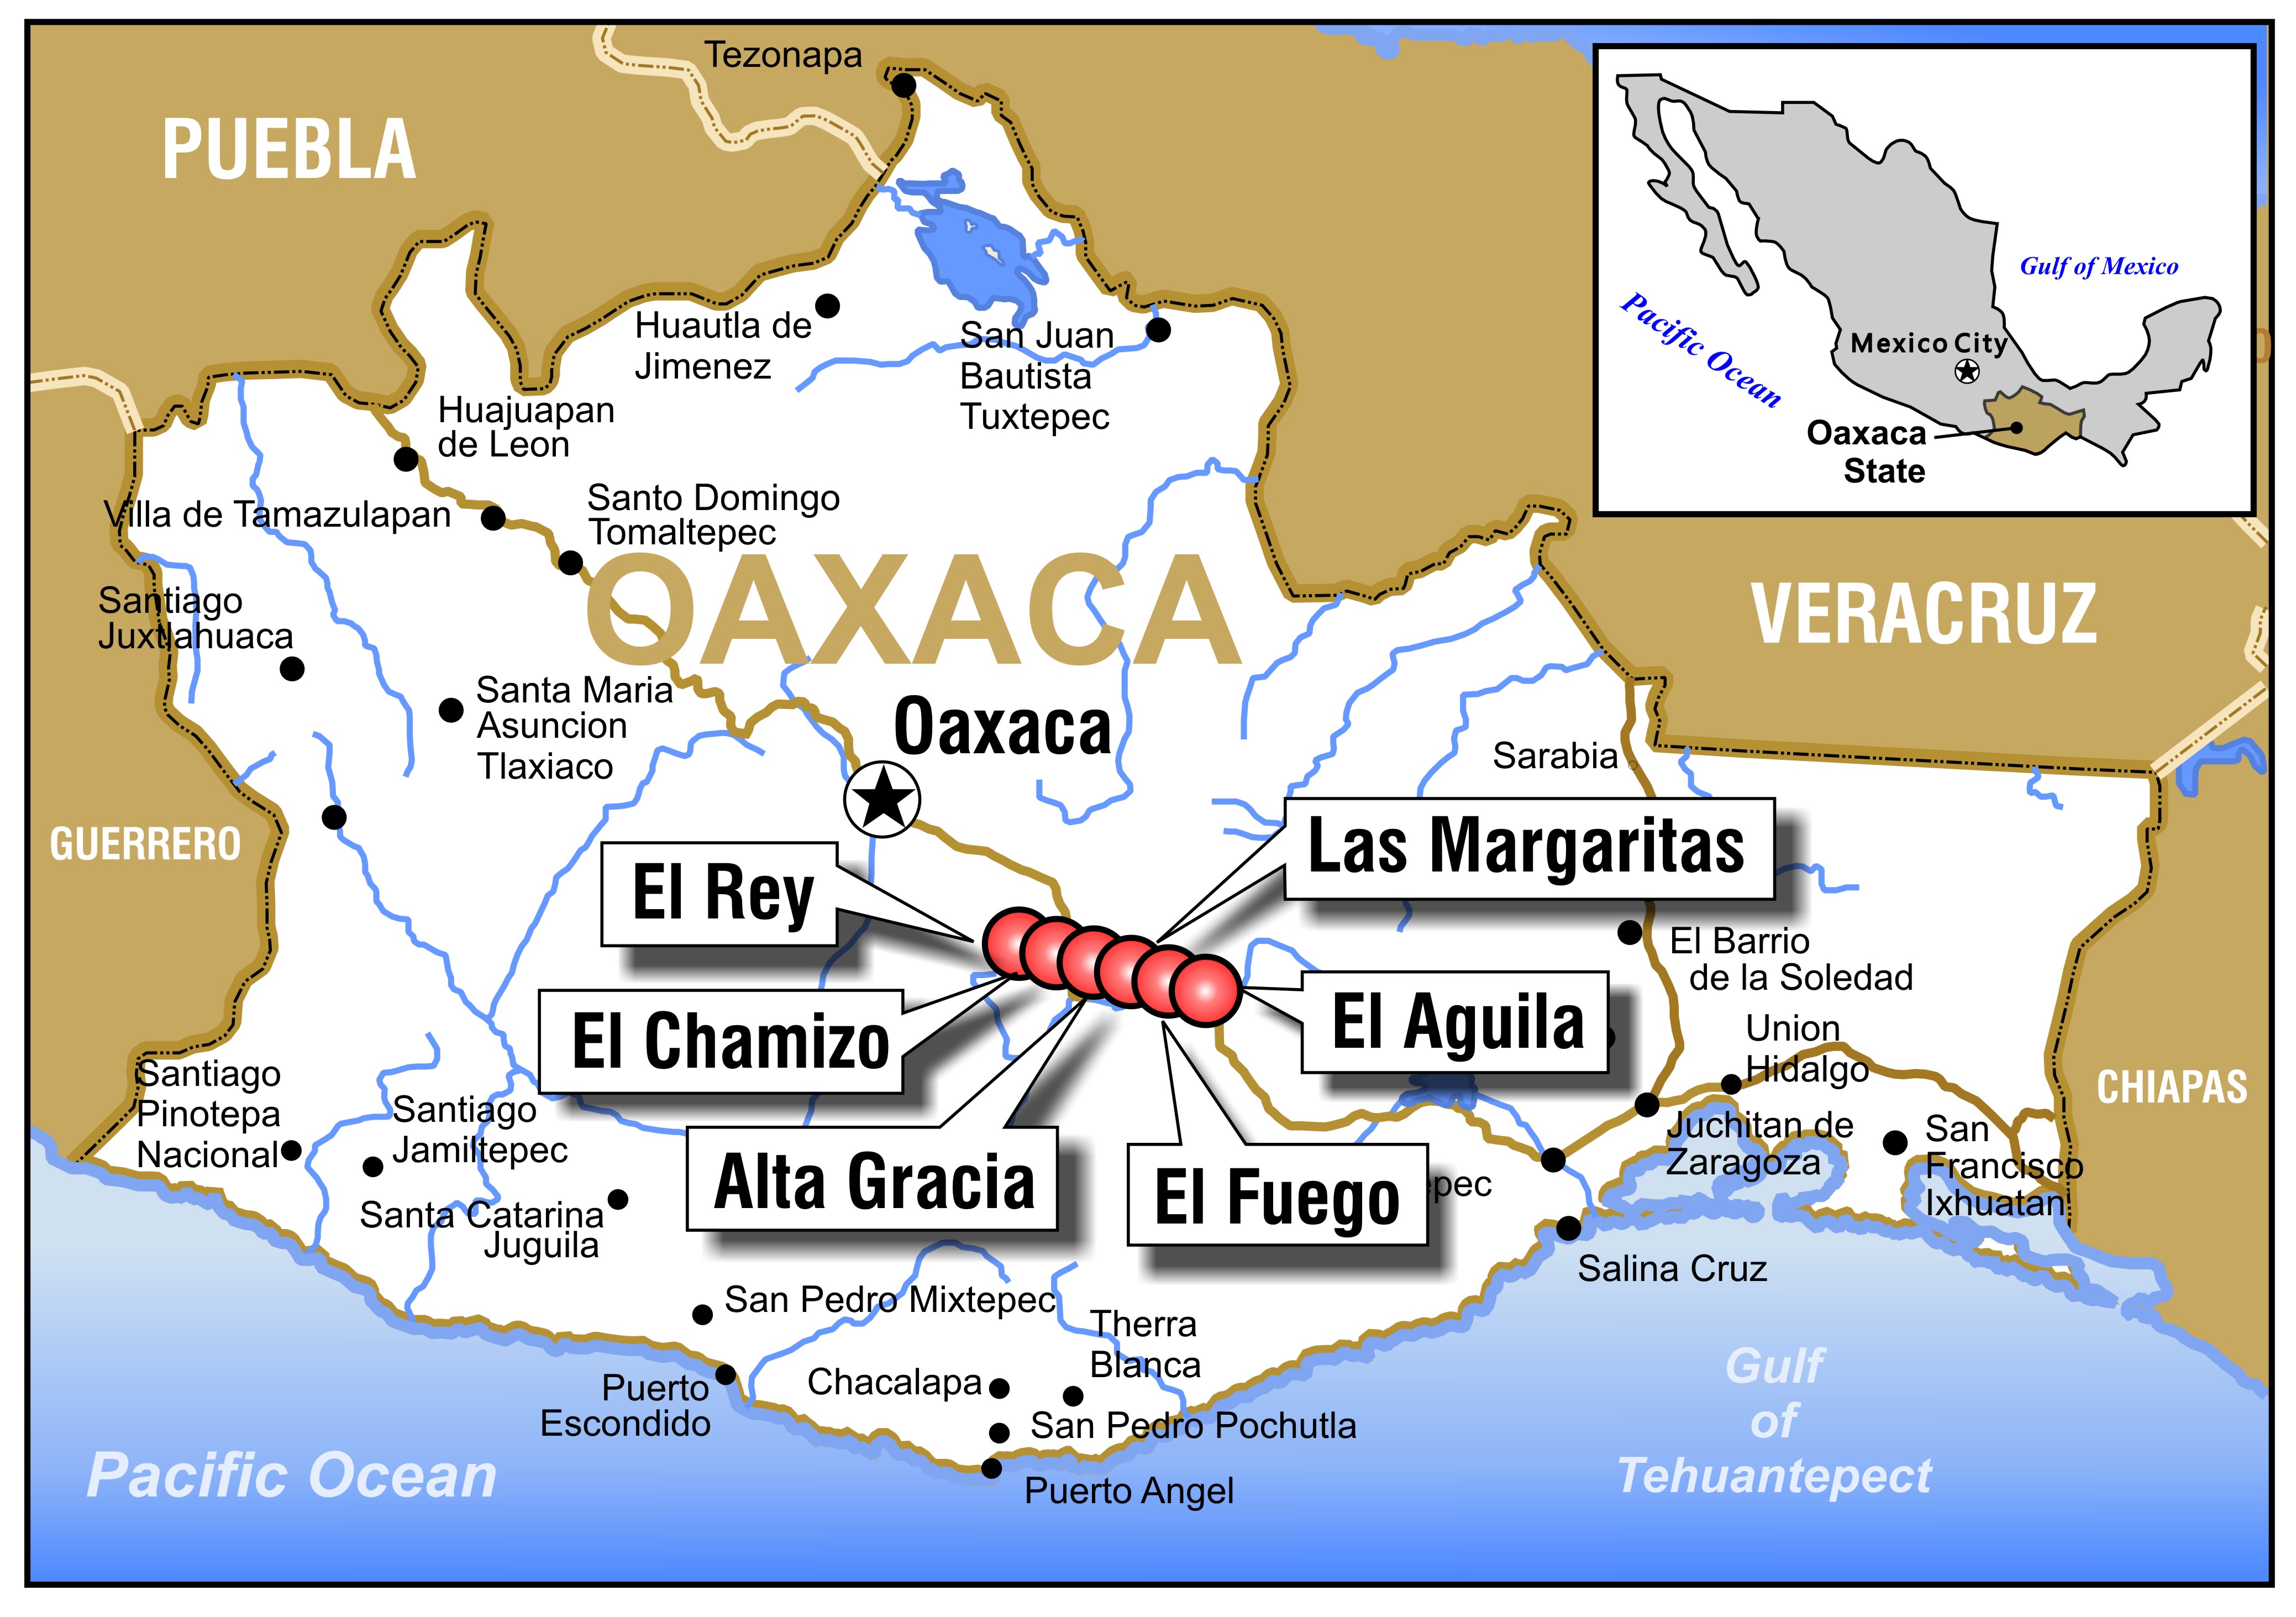
We are granted concessions from the Mexican federal government to explore and mine our properties in Mexico. We hold certain properties directly as the concession holder and lease other properties from a third party. Our Oaxaca Mining Unit encompasses approximately 69,889 hectares (172,700 acres) covered by 25 mining concessions and 5 lease concessions. The annual concession fees are $430,454 and we have made all necessary payments for 2017. Please see Mining Concessions and Regulations in Mexico, below.
Operating Properties
Aguila Project
Background: The Aguila Project currently comprises 19 mining concessions aggregating 30,215 hectares.
The early history of activity at the Aguila Project included prospecting and limited mining for gold and silver from the early 1900’s to the mid 1960’s. In 1998, the concessions were leased to Apex Silver Mines Corporation of Denver, Colorado. Apex carried out an exploration program involving geologic mapping, surface sampling and an 11-hole drilling program (1,242 meters). The results did not meet Apex’s expectations so it cancelled its lease on the property in 2002.
21
In 2002, we leased the Aguila, El Aire, and La Tehuana concessions from a third party. The Aguila and El Aire concessions are part of the Aguila Project and the La Tehuana concession comprises the Margaritas property. The lease agreement is subject to a 4% net smelter return royalty where production is sold in the form of gold/silver doré and 5% for production sold in concentrate form. Subject to meeting minimum exploration requirements, there is no expiration term for the lease. We may terminate it at any time upon written notice to the lessor and the lessor may terminate it if we fail to fulfill any of our obligations, which primarily consist of paying the appropriate royalty to the lessor.
In August 2003, we commenced an initial drilling and exploration program at the Aguila Project. Through 2017, we have drilled a total of 907 core holes (both surface and underground) equaling 274,212 meters and 166 reverse circulation holes equaling 14,367 meters for a total of 1,073 holes totaling 288,579 meters.
In 2010, we acquired from a third party, at no additional cost, the El Chacal and El Pilon concessions, which are subject to a 2% royalty, but are not subject to the Aguila lease agreement. We filed for and received additional concessions from the Mexican government which are also not part of the concessions leased or acquired from the third party. The mineral concessions making up the Aguila Project are located within the San Pedro Totolapam and San Pedro Quiatoni Ejidos.
Location and Access: The Aguila Project is located in the Sierra Madre del Sur Mountains of southern Mexico in the central part of the State of Oaxaca. The property is located along a major paved highway approximately 120 kilometers southeast of Oaxaca City, the state’s capital city. The property is approximately four kilometers due northwest from the village of San Jose de Gracia. We have constructed gravel and paved roads from the village to the mine and processing facility which provides adequate access to the property.
The climate of the Aguila Project area is dry and warm to very warm with most rainfall occurring in June through September and annual precipitation averaging 423.7 mm. The average yearly temperature is 26.6 degrees centigrade. The area is very rocky with arid vegetation. Subsistence farming occurs and the main agricultural crop is agave cactus that is cultivated for the production of mescal.
Geology and Mineralization: The Aguila Project is located in the San Jose de Gracia Mining District in Oaxaca. Multiple volcanic domes of various scales, and probably non-vented intrusive domes, dominate the district geology. These volcanogenic features are imposed on a pre-volcanic basement of sedimentary rocks. Gold and silver mineralization in this district is related to the manifestations of this classic volcanogenic system and is considered epithermal in character.
Historically, we have produced ore from two locations on the Aguila property, the Aguila open pit mine and the Arista underground mine. The Aguila open pit mineralization is considered low sulfidation, epithermal mineralization primarily of gold with some silver and no base metals. The Arista underground mine is considered intermediate epithermal mineralization of gold, silver, copper, lead, and zinc. The host rock in the Arista vein system is primarily andesite.
Facilities: We constructed a processing facility and other infrastructure at the Aguila Project for approximately $35 million in 2009, and expanded the processing facility in 2012 and 2013, spending an additional $23 million. The flotation mill expansion, completed at the end of 2013, increased the number of flotation cells, added a second ball mill to allow for additional processing capacity and a Knelson gravity concentrator. In 2014 we completed a doré processing facility. The Aguila processing facility is flexible in its ability to process several types of mineralization. It has a differential flotation section capable of processing polymetallic ore and producing up to three separate concentrate products for sale. The facility also has an agitated leach circuit capable of producing gold and silver doré for sale. Depending on the specific type and characteristics of the ore, the facility can process sulfide material in its flotation circuit at a nominal 1,500 tonnes of ore per day. The agitated leach circuit can process a nominal 300 tonnes per day.
22
Power is provided by diesel generators at the site. We obtained water rights from the Mexican government for an amount of water that we believe is sufficient to meet our operating requirements and pump it approximately five kilometers to the site from a permitted well located near the Totolapam River.
Additional improvements at the site include installation of a second diesel generation power plant and switch gear, paving a three-kilometer section of the road from the mine to the processing facility, construction of a new surface maintenance garage and fuel station, construction of haul roads from the mine site to the processing facility, office space at the processing facility, an assay lab, an exploration office, a tailings impoundment facility and other infrastructure.
Major construction projects in 2017 consisted of new underground explosive magazines on the second level, a ventilation upgrade for the Switchback mining zone, which included the installation of a new 400 horsepower surface exhaust fan, and the upgrade of the diesel power generation plant to 9.6 MW installed capacity.
Exploration Activities
Our exploration activities during 2017 mainly focused on underground exploration drilling at the Arista and Switchback vein systems in the Arista Mine. The Switchback drilling program continued to target further expansion and delineation of the multiple high-grade parallel veins for reserve definition, expansion and mine plan optimization. The Switchback strike length has expanded to over 625 meters, a 325-meter expansion from the beginning of 2017, with results adding to reserve definition, expansion and Arista Mine plan optimization. The Switchback vein system remains open on strike and vertical extent. Underground drilling during 2017 also delineated 200 meters of strike length on a new high-grade ore-shoot discovered on the Splay 31 vein of the Arista vein system. Forty-one underground diamond drill holes totaling 13,021 meters were completed at the Aguila Project during 2017. Data compilation, review, and field studies were also conducted during the year in a prospective exploration target area located in the southern portion of the Aguila Project.
Alta Gracia
Background: In August 2009, we acquired claims adjacent to the Margaritas property in the Alta Gracia Mining District by filing concessions known as the David 1, the David 2 and La Herradura, totaling 5,175 hectares.
As of December 31, 2016, proven and probable reserves had been established for the Mirador Underground Mine on our Alta Gracia property. In July 2017, mine development reached the economic ore zone of the Mirador vein and mining began. A total of 6,350 tonnes were extracted from the Mirador Mine, trucked to, and processed at our Aguila processing facility in 2017.
Location and Access: The Alta Gracia Project is approximately 20 kilometers northeast from the village of San Pedro Totalapam, in the Municipality of San Pedro Totolapam. Access to the project is by a gravel road that departs the paved highway approximately 13 kilometers east of the village of San Pedro Totalapam. The haulage distance by road from Alta Gracia to the Aguila processing facility is approximately 32 kilometers.
Geology and Mineralization: The sedimentary and volcanic units mapped at Alta Gracia are similar to those observed at the Aguila project. The district is dominated by Tertiary-age rhyolite flows and tuffs which are underlain by andesite flows and tuff. Granodiorite and felsic intrusives are observed to outcrop to north and east of the Mirador mine. Known vein occurrences at Alta Gracia are mainly hosted in andesite and rhyolite. The veins currently being mined at Alta Gracia are considered low sulfidation epithermal mineralization with economic values only for gold and silver.
Facilities: During 2016, we received our operational permit for the Mirador Mine. Explosive magazines, located inside the Mirador Mine at the Alicia portal, were also constructed and permitted.
In 2017, two mine portals were developed to provide access to the Mirador vein. Mine site offices and a mobile equipment maintenance shop was established adjacent to the Aguacate portal at the lower 1470 level. Additionally, a
23
diesel power generation plant, compressed air and a mine water pumping station were developed and became operational.
High grade silver ore from the Mirador Mine is transported by contracted haul trucks to and processed at our agitated leach plant at the Aguila processing facility, with final product being doré.
Exploration Activities: In 2017, we completed 44 surface exploration diamond drill holes totaling 9,936 meters. These holes mainly targeted extensions of ore shoots on known veins, such as Huaje and Victoria, that were historically mined on a small-scale. Surface and underground geological mapping and sampling along with detailed topographic surveying also continued in the historic mining areas at Alta Gracia. The new information was used for estimation of additional ore and mineralized material and to guide follow-up drilling planned for Alta Gracia in 2018.
Please see Item 7. Management’s Discussion and Analysis of Financial Condition and Results of Operations for information concerning our mining operations at the Aguila Project.
Exploration Properties
Margaritas Property
The Margaritas property is made up of the La Tehuana concession. We leased this concession from a third party in October 2002. The terms of this agreement are discussed under “Aguila Project” above. It is comprised of approximately 925 hectares located along our 55-kilometer mineralized trend and adjacent to the Aguila Project
In 2017, results from previous surface drilling, surveying, detailed geological mapping and rock chip channel sampling were analyzed for the Margaritas property. Additional rock chip channel sampling of historic workings was also carried out in the Trenes mineralized zone. A follow-up surface diamond drilling program is targeted for Trenes in 2018. Trenes is located approximately 10-kilometers northwest of the Arista Mine along our 55-kilometer mineralized trend.
Chamizo Property
In June 2011, we staked mineral claims between the Rey property and Alta Gracia property along a trend and acquired an exploration concession from the Mexican government of approximately 26,386 hectares referred to as Chamizo. In March 2013, we acquired a property known as Cerro Colorado (comprised of the San Pedro Fracc. 2 concession) from Almaden Minerals, Ltd. consisting of approximately 1,860 hectares. The Cerro Colorado property is surrounded by our Chamizo concession and we include it as part of the Chamizo property. Any future production from the Cerro Colorado concession is subject to a 2% net smelter return royalty in favor of Almaden.
Because of the close proximity of Chamizo to Alta Gracia, exploration activity began on this property during late 2011 and to date has included geochemical sampling and drilling of eight shallow core holes for a total of 1,327 meters. We completed the acceptable minimum amount of work required to maintain the claims during 2017 and target the same amount of work in 2018.
Fuego Property
In March 2013, we acquired the Fuego property (comprised of the San Pedro Fracc. 1 concession) from Almaden Minerals Ltd. subject to a 2% net smelter return royalty. The Fuego property consists of approximately 2,554 hectares and is located south of our Alta Gracia and Chamizo properties. In 2013, Fuego was included in the property-wide airborne geophysical survey. Geologic mapping and surface sampling were conducted on the Fuego property during 2013 through 2017 to allow us to meet the acceptable minimum amount of work required to maintain the claims. We do
24
not anticipate any significant exploration activities at El Fuego in 2018. However, we plan to conduct the acceptable minimum amount of work required to maintain the claims.
Rey Property
The Rey property consists of concessions on the far northwest end of our 55-kilometer mineralized corridor in the State of Oaxaca known as Rey, El Virrey, La Reyna and El Marquez. We acquired the Rey concession from a third party and it is subject to a 2% net smelter return royalty payable to them on a portion of the claims. We obtained the remaining concessions by staking claims and filing for concessions with the Mexican government.
The Rey property is located approximately 64.4 kilometers by road from the Aguila Project. There is no plant or equipment on the Rey property. If exploration is successful, any mining would probably require an underground mine where mineralized material could be trucked to the Aguila processing facility for processing. To date, we have drilled 48 core holes for a total of 5,273 meters at the Rey property. Early in 2012, we completed a small amount of work to finish refurbishing and extending an existing shaft on the property to permit underground exploratory drilling. We ceased work at the Rey property during 2012, following a request to obtain additional approvals from local community agencies. In 2018, we plan to work with the local agencies and anticipate resolving the matter, but we have no assurance that we will be able to resume our exploration activities in the near term. If the matter is resolved, we plan to conduct follow-up drilling and exploration based on the drilling done in 2008. We do not anticipate any significant exploration activities at Rey in 2018. However, we plan to conduct the acceptable minimum amount of work required to maintain the claims.
Mining Concessions and Regulations in Mexico
Mineral rights in Mexico belong to the Mexican federal government and are administered pursuant to Article 27 of the Mexican Constitution. All of our mining concessions are exploitation concessions, which may be granted or transferred to Mexican citizens and corporations. Our leases or concessions are held by our Mexican subsidiary. Exploitation concessions have a term of 50 years and can be renewed for another 50 years. Concessions grant us the right to explore and exploit all minerals found in the ground. Maintenance of concessions requires the semi-annual payment of mining duties (due in January and July) and the performance of assessment work, on a calendar year basis, with assessment work reports required to be filed in the month of May for the preceding calendar year. The amount of mining duties and annual assessment are set by regulation, may increase over the life of the concession and include periodic adjustments for inflation. Mining concessions are registered at the Public Registry of Mining in Mexico City and in regional offices in Mexico.
Mexican mining law does not require payment of finder’s fees to the government, except for a discovery premium in connection with national mineral reserves, concessions and claims or allotments contracted directly from the Mexican Geological Survey. None of the claims held by DDGM are under such a discovery premium regime.
Ejido Lands and Surface Right Acquisitions in Mexico
Surface lands within our Oaxaca Mining Unit are Ejido lands (agrarian cooperative lands granted by the federal government to groups of Campesinos pursuant to Article 27 of the Mexican Constitution of 1917). Prior to January 1, 1994, Ejidos could not transfer Ejido lands into private ownership. Amendments to Article 27 of the Mexican Constitution in 1994 now allow individual property ownership within Ejidos and allow Ejidos to enter into commercial ventures with individuals or entities, including foreign corporations. We have an agreement with the local San Pedro Totolapam Ejido allowing exploration and exploitation of mineralization at the Aguila Project and some of our surrounding properties.
Mexican law recognizes mining as a land use generally superior to agriculture. However, the law also recognizes the rights of the Ejidos to compensation in the event mining activity interrupts or discontinues their use of the agricultural lands. Compensation is typically made in the form of a cash payment to the holder of the agricultural rights.
25
The amount of such compensation is generally related to the perceived value of the agricultural rights as negotiated in the first instance between the Ejidos and the owner of the mineral rights. If the parties are unable to reach agreement on the amount of the compensation, the decision will be referred to the government.
We have established surface rights agreements with the San Pedro Totolapam Ejido and the individuals impacted by our proposed operations which allow disturbance of the surface where necessary for our exploration activities and mining operations.
Nevada Mining Unit
In Nevada, we are the owner of three properties and hold the option to purchase a fourth property totaling 1,043 unpatented mining claims covering approximately 20,600 acres, subject to the paramount title of the United States of America, under the administration of the BLM. Under the Mining Law of 1872, which governs the location of unpatented mining claims on federal lands, the owner (locator) has the right to explore, develop, and mine minerals on unpatented mining claims without payments of production royalties to the U.S. government, subject to the surface management regulation of the BLM. Currently, annual claim maintenance fees are the only federal payments related to unpatented mining claims. Annual maintenance fees of $161,665 were paid during 2017.
In addition to the unpatented claims, we also own or hold the option to purchase 20 patented mining claims covering approximately 333 acres and an additional 200 acres of fee lands in Mineral County, Nevada. The patented claims and fee lands are subject to payment of annual property taxes made to the county where they are located. Annual property taxes on our patented claims and fee lands have been paid through June 30, 2018.
Our primary focus is to discover, delineate and advance potential open pit heap leach gold operations at our Nevada Mining Unit and commence production as soon as possible. We also target equipment sharing synergies whereby we may move equipment from one project to the next due to their close proximity (approximately 20 miles or less). The map below shows the general location of our properties within Nevada:
26
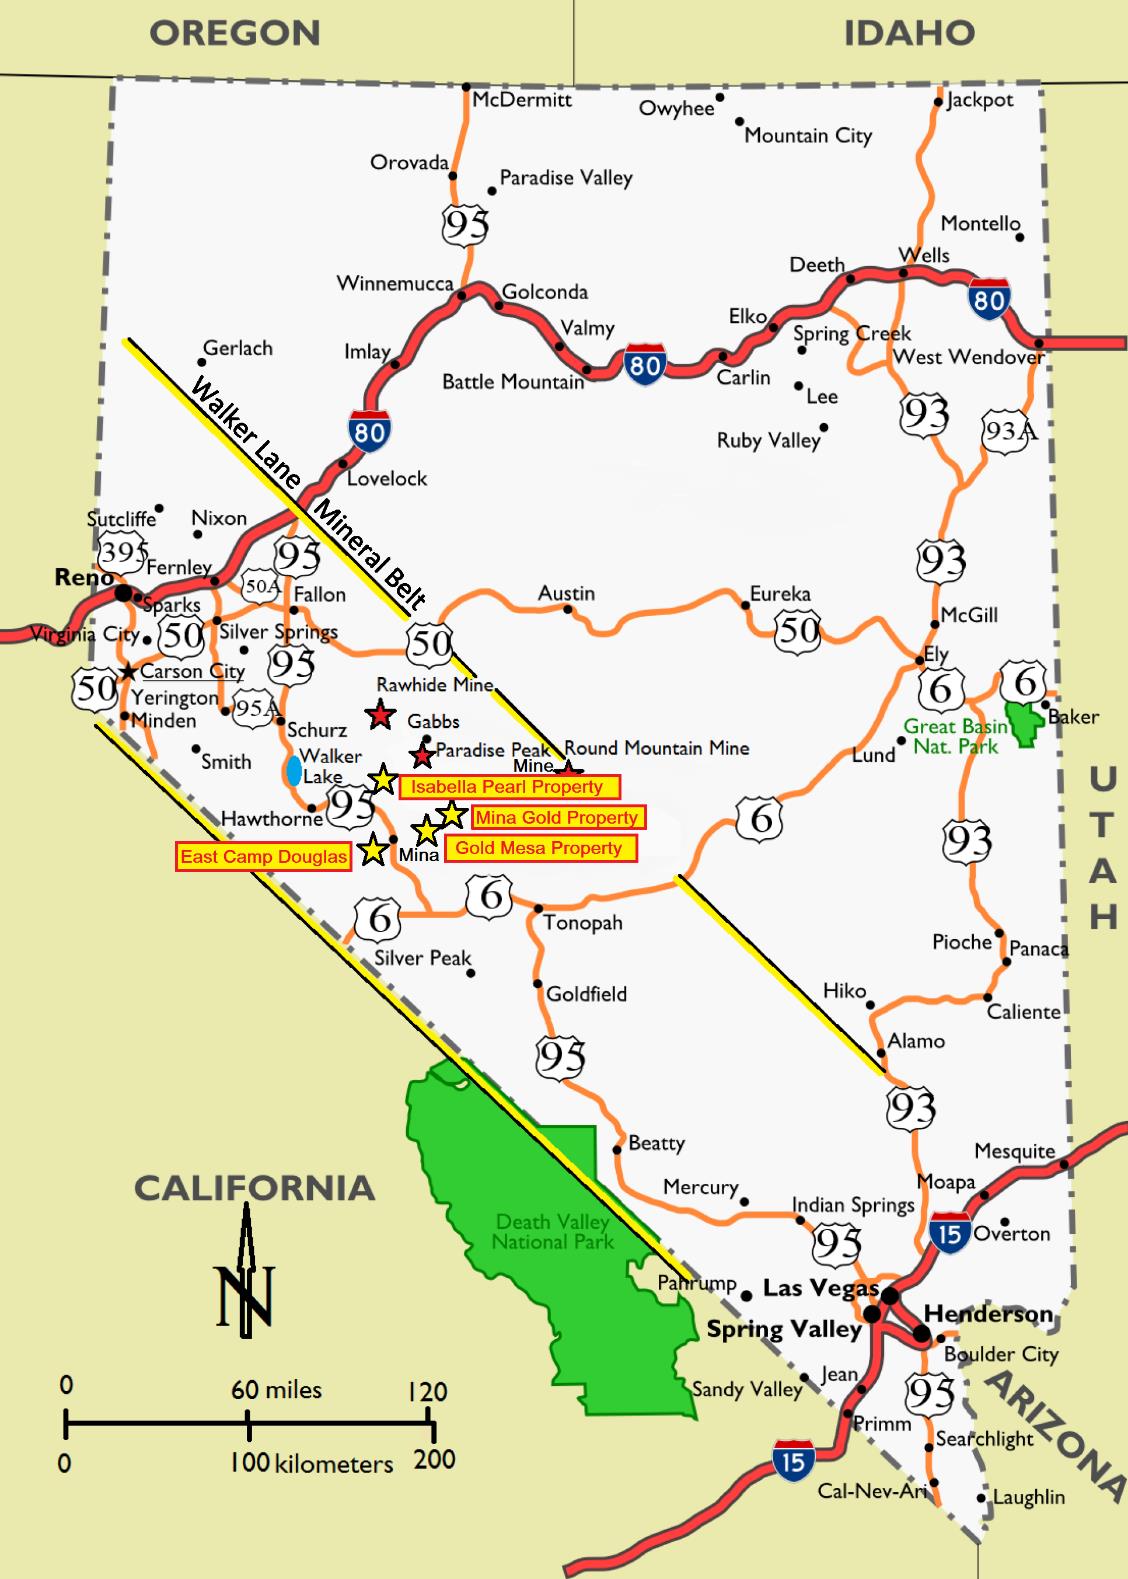
Exploration Properties
Our properties in Nevada are located in the Walker Lane Mineral Belt which is known for its significant and high-grade gold and silver production. Activities at our properties in Nevada range from exploration at East Camp Douglas to mineral delineation phase at Gold Mesa and Mina Gold to advanced engineering and permitting at Isabella Pearl. We believe that our Nevada properties are highly prospective based on their geology, surface samples, drill results, and close
27
proximity to past and current high-grade gold and silver producing mines. In addition, potential exists with the mineralization and historical resource estimates in the case of the Isabella Pearl Project. We believe that our Nevada properties have excellent potential for additional discoveries of both bulk tonnage replacement-type and bonanza-grade vein-type gold deposits, similar to other gold deposits historically mined in the Paradise Peak, Borealis, Bodie, Tonopah, and Goldfield districts.
Gold Mesa Property
In November 2015, we acquired an option to purchase a gold exploration property in Nevada, held by Silver Reserve Corporation (“SRC”), a wholly-owned subsidiary of Infrastructure Materials Corp., which we refer to as “Gold Mesa.” The option gives the Company the exclusive right to purchase the property at any time over a term of 36 months. The option is exercisable for $270,000 cash and restricted common stock valued at $1,000,000 at closing. There are no work commitments associated with this option.
Gold Mesa consists of 229 unpatented claims and 3 patented claims in central Nevada’s Walker Lane Mineral Belt. A portion of the property’s claims were mined historically on a very small scale as an underground mine in the early 1900’s and as a small open pit mine in the late 1980’s. Existing infrastructure includes nearby electricity, road access and potential water from a historic well located on the property. Gold Mesa includes the gold property historically known as the Clay Peters Project. After acquiring our option on 89 unpatented and 3 patented claims, we staked an additional 140 unpatented claims bringing the total to 4,580 acres for the Gold Mesa property.
The property is subject to a NSR of 2% in favor of SRC on any future production on all claims with no existing royalties and a 1% NSR on the three patented claims. There is an existing 2% NSR on the three patented claims payable to an unrelated third party. We have additional rights to purchase one half of each of the 2% NSR and 1% NSR from SRC subject to certain terms and restrictions and a first right of refusal to purchase the entire NSR upon a proposed disposition by SRC.
Reverse circulation drilling resumed at Gold Mesa during March 2017. The program targeted extensions of the areas of surface and near surface high-grade gold mineralization discovered during previous drilling programs. During the year, 68 shallow drill holes totaling 1,935 meters were completed. We have now tested a total of eight exploration targets on the Gold Mesa property. The Gold Mesa property has potential for a high-grade gold open pit, or multiple gold open pits, with surface and near surface mineralization. During 2018, we plan to continue drilling with the goal of beginning to connect portions of the eight different targets at Gold Mesa into a larger near surface mineralized zone conducive to open pit mining, as well as test the mineralization at depth.
Isabella Pearl
In August 2016, we purchased 100% interest in the Isabella Pearl Project which is in advanced stages of engineering and production permitting. The property covers an area of approximately 9,000 acres consisting of 494 unpatented claims. A historical reserve report completed by a third party prior to our acquisition of the project reported P&P Reserves of 191,400 gold ounces at an average grade of 2.18 g/t, which we are currently evaluating and confirming. After acquiring Isabella Pearl, we drilled several holes in the deposit for further mineral delineation and additional metallurgical testing. This included 4 holes totaling 735 meters of core drilling and 82 meters in 6 holes of reverse circulation drilling. We also drilled a 400-meter deep water well to supply the project’s future water needs for gold production. We retained several engineering firms in Reno, Nevada to assist us with engineering. We are optimizing our internal mine plan, project designs, ordering long lead time process equipment, and soliciting bids for heap leach and mining contractors. Our goal is to advance the project into production at the earliest possible date, subject to permit timing and funding. We are targeting the production of gold doré from a potential open pit heap leach operation.
During 2017, we received approvals from the NDEP for our Plan of Operations which was incorporated into the Environmental Assessment (“EA”). The EA for project production permitting was resubmitted to the BLM in the fourth quarter. We are awaiting the BLM regulatory permit approvals in order to move the project forward.
28
In 2017, we also completed a five-hole, 1,356-meter reverse circulation condemnation drilling program in the proposed heap leach area. In addition, reconnaissance geological mapping and rock chip sampling delineated a new, surface high-grade gold target area located along strike to the northwest of the Isabella Pearl deposit currently targeted for development.
Mina Gold
In August of 2016, we purchased 100% interest in the Mina Gold property located in Nevada’s Walker Lane Mineral Belt. The property has the potential to be a future open pit heap leach gold operation. Mina Gold reported an historic third-party estimate of mineralized material totaling 1,606,000 tonnes grading 1.88 g/t gold. The property covers an area of approximately 825 acres consisting of 43 unpatented claims and 5 patented claims. During 2017, we completed a 28-hole reverse circulation drilling program totaling 3,964 meters on the Mina Gold property and await pending assays. This drilling targeted expansion to depth of known surface high-grade gold mineralization on our patented claims and included five condemnation holes for a proposed heap leach site. Additional reverse circulation drilling, environmental baseline studies and a preliminary engineering evaluation are targeted for the Mina Gold property in 2018.
East Camp Douglas
In January 2017, we purchased 100% interest in the East Camp Douglas gold property located in Nevada’s Walker Lane Mineral Belt. The property covers an area of approximately 5,300 acres consisting of 277 unpatented claims, 12 patented claims and additional fee lands in Mineral County, Nevada. Precious metal epithermal mineralization at East Camp Douglas occurs as both widespread high sulfidation alteration areas and low sulfidation veins. Modern exploration by several mining and exploration companies has established modest gold resource potential in five separate areas on the property, with over 3,000 meters of drill core and a large exploration database. We believe this large property has numerous untested gold targets with open pit heap leach potential warranting an extensive exploration program. During 2017, historical geological, exploration and mining data on the East Camp Douglas property was reviewed and reconnaissance geological mapping and rock chip sampling was carried out on several prospects. A systematic rock chip sampling program covering a more than one square kilometer area of gold-bearing silicified volcanic rocks was also completed. In 2018, we plan to evaluate the resource potential of the old mining areas using extensive historical drilling and sample data available as well as identifying targets for our first drilling program on the gold-bearing silicified volcanic rocks called the “lithocap”.
In 2018, we anticipate spending approximately $4.2 million for exploration activities in Oaxaca, which will include approximately $2.1 million for underground drilling and $2.1 million for surface exploration and concession holding costs. In Nevada we anticipate spending $2.0 million on exploration, mainly for surface drilling on our Isabella Pearl and Gold Mesa properties during 2018. We anticipate that all exploration activities will be funded from internally generated capital.
Office Facilities
We constructed an administrative office building adjacent to the Aguila processing facility and a mine office adjacent to the Arista Mine portal as part of the Aguila Project. We also lease office space in Oaxaca City, Oaxaca consisting of approximately 3,000 square feet. The lease commenced in 2012 for ten years. In 2014, we sold the building that serves as our executive and administrative headquarters in Colorado Springs, Colorado and have leased back a portion under a renewable one-year lease. We also lease an office in Denver, Colorado consisting of approximately 2,500 square feet, which we renewed in 2015 for three years.
29
Glossary
The following terms used in this report shall have the following meanings:
|
Andesite: |
An extrusive igneous, volcanic rock, of intermediate composition, with aphanitic to porphyritic texture characteristic of subduction zones, such as the western margin of South America. |
|
|
|
|
|
|
|
Concentrate: |
A product from a mineral processing facility such as gravity separation or flotation in which the valuable constituents have been upgraded and unwanted gangue materials rejected as waste. |
|
|
|
|
Cut-and-fill: |
Underground mining method used in vertical stopes in which successive cutting of the ore into horizontal slices is carried out starting from the bottom of the stope and progressing upwards towards the surface. |
|
|
|
|
Doré: |
Composite gold and silver bullion usually consisting of approximately 90% precious metals that will be further refined to separate pure metals. |
|
|
|
|
Drift: |
A horizontal tunnel generally driven within or alongside an orebody and aligned parallel to the long dimension of the ore. |
|
|
|
|
Epithermal: |
Used to describe gold deposits found on or just below the surface close to vents or volcanoes, formed at low temperature and pressure. |
|
|
|
|
|
|
|
Exploration: |
Prospecting, sampling, mapping, diamond-drilling and other work involved in locating the presence of economic deposits and establishing their nature, shape and grade. |
|
|
|
|
Grade: |
The concentration of an element of interest expressed as relative mass units (percentage, ounces per ton, grams per tonne (“g/t”), etc.). |
|
|
|
|
|
|
|
Hectare: |
Another metric unit of measurement, for surface area. One hectare equals 1/200th of a square kilometer, 10,000 square meters, or 2.47 acres. A hectare is approximately the size of a soccer field. |
|
|
|
|
|
|
|
Long-hole Stoping: |
Mining method which uses holes drilled by a production drill to a predetermined pattern by a mining engineer. Long-hole stoping is a highly selective and productive method of mining and can cater for varying ore thicknesses and dips (0 - 90 degree). Blasted rock is designed to fall into a supported drawpoint or removed with remote control LHD (load, haul, dump machine). |
|
|
|
|
Mineralized Material: |
Minerals or any mass of host rock in which minerals of potential commercial value occur. |
|
|
|
|
|
|
|
Net Smelter Return (“NSR”): |
The net revenue that the owner of a mining property receives from the sale of the mine's metal products less transportation and refining costs. As a royalty it refers to the fraction of net smelter return that a mine operator is obligated to pay the owner of the royalty agreement. |
|
|
|
30
|
|
|
|
Mineral Deposit: |
Rocks that contain economic amounts of minerals in them and that are expected to be profitably mined. |
|
|
|
|
|
|
|
|
|
|
Patented Claim: |
A mining claim for which the U.S. Federal Government has passed its title to the claimant, making it private land. A person may mine and remove minerals from a mining claim without a mineral patent. However, a mineral patent gives the owner exclusive title to the locatable minerals and in most cases, grants title to the surface. |
|
|
|
|
Tonne: |
A metric ton. One tonne equals 1000 kg. It is equal to approximately 2,204.62 pounds. |
|
|
|
|
|
|
|
Unpatented Claim: |
A particular parcel of U.S. Federal land, valuable or believed to be valuable for a specific mineral deposit or deposits. It is a parcel for which an individual has asserted a right of possession. The right is restricted to the extraction and development of a mineral deposit. |
|
|
|
|
Volcanogenic: |
Of volcanic origin. |
|
|
|
|
|
|
|
Volcanic domes: |
These are mounds that form when viscous lava is erupted slowly and piles up over the vent, rather than moving away as lava flow. The sides of most domes are very steep and typically are mantled with unstable rock debris formed during or shortly after dome emplacement. Most domes are composed of silica-rich lava which may contain enough pressurized gas to cause explosions during dome extrusion. |
Not applicable. There were no legal proceedings at December 31, 2017.
ITEM 4. MINE SAFETY DISCLOSURES
Not applicable. We have no U.S. mines in operation.
31
ITEM 5.MARKET FOR REGISTRANT’S COMMON EQUITY, RELATED STOCKHOLDER MATTERS AND ISSUER PURCHASE OF EQUITY SECURITIES
Our common stock trades on the New York Stock Exchange American (“NYSE American”) under the symbol “GORO”. The table below sets forth the high and low sales prices for our common stock on the NYSE American for the last two fiscal years on a quarterly basis.
|
|
|
2017 |
|
|
2016 |
|
||||||||
|
|
|
High |
|
Low |
|
|
High |
|
Low |
|
||||
|
First Quarter |
|
$ |
6.08 |
|
$ |
4.13 |
|
|
$ |
2.47 |
|
$ |
1.15 |
|
|
Second Quarter |
|
$ |
4.47 |
|
$ |
3.25 |
|
|
$ |
3.85 |
|
$ |
2.28 |
|
|
Third Quarter |
|
$ |
4.32 |
|
$ |
3.46 |
|
|
$ |
7.78 |
|
$ |
3.90 |
|
|
Fourth Quarter |
|
$ |
4.56 |
|
$ |
3.63 |
|
|
$ |
7.26 |
|
$ |
3.80 |
|
On March 7, 2018, the high and low sales prices of our common stock on the NYSE American were $4.19 and $4.08 respectively, and we had approximately 200 holders of record.
The following table provides information about our common stock that may be issued upon the exercise of options, warrants and rights under all of our equity compensation plans as of December 31, 2017:
|
Plan Category |
|
Number of Securities to be issued upon exercise of outstanding options, warrants and rights (a) |
|
Weighted-average exercise price of outstanding options, warrants and rights (b) |
|
Number of securities remaining available for future issuance under equity compensation plans (excluding securities reflected in column (a)) (c) |
|
|
|
Equity compensation plans approved by security holders: |
|
6,454,284 |
|
$ |
6.99 |
|
4,062,317 |
|
Securities Authorized for Issuance Under Equity Compensation Plans
On April 14, 2016, our Board of Directors approved the Gold Resource Corporation 2016 Equity Incentive Plan (the “Plan”). The Plan was approved to, among other things, (i) supersede the Gold Resource Corporation Amended and Restated Non-Qualified Stock Option and Stock Grant Plan and (ii) provide for the grant of options, stock appreciation rights, restricted stock, restricted stock units, stock grants, stock units, performance shares, performance share units, and performance cash. These actions were approved by the shareholders of the Company on June 15, 2016.
Purchases of Equity Securities by the Company
In September 2011, our Board of Directors authorized a share repurchase of up to $20.0 million with no pre-established end date. During 2017 and 2016, we did not repurchase any shares of Gold Resource Corporation common stock on the open market, and approximately $14.0 million remains available in the share repurchase program as of December 31, 2017.
32
Performance Graph
The following performance graph and related information shall not be deemed “soliciting material” or to be “filed” with the SEC, nor shall such information be incorporated by reference into any future filing under the Securities Act of 1933 or Securities Exchange Act of 1934, each as amended, except to the extent that we specifically incorporate it by reference in such filing.
The following graph compares the performance of our common stock with the performance of the NYSE American Composite Index and the S&P TSX Global Gold Fund, assuming reinvestment of dividends on December 31 of each year indicated. The graph assumes $100 invested at the per share closing price in Gold Resource Corporation and each of the indices on December 31, 2012.
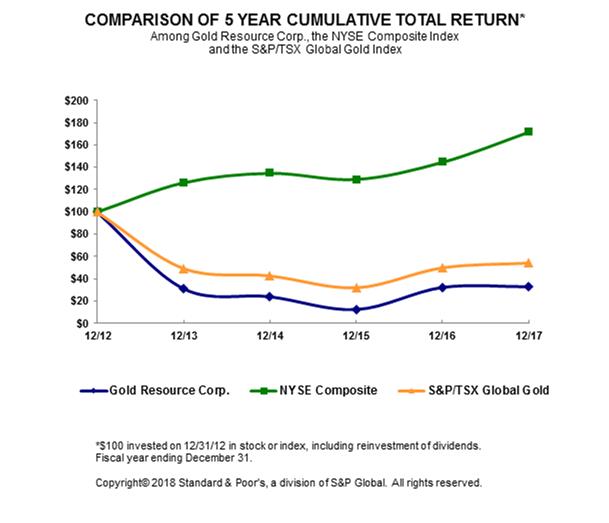
Transfer Agent
Computershare Investor Services, Inc. is the transfer agent for our common stock. The principal office of Computershare is located at 8742 Lucent Boulevard, Suite 225, Highlands Ranch, Colorado 80129 and its telephone number is (303) 262-0600.
33
Since commencing mining operations at our Aguila Project, one of management’s primary goals has been to make cash dividend distributions to shareholders. Since commercial production began in July 2010, we have returned over $110 million back to shareholders in consecutive monthly dividends. Regular dividends should not be considered a prediction or guarantee of future dividends.
Our monthly dividend was modified in December 2015 to reduce the dividend from $0.01 per share per month to one-sixth cent per share per month or $0.02 per share per year. The Board of Directors believed the change in dividend was necessary to help conserve capital as reduced cash flow from operations, as well as the long-term negative outlook in the mining industry, were negatively affecting our financial performance. The instituted dividend may be modified again or discontinued at any time and the declaration of any special dividend is determined at the discretion of our Board of Directors, depending on variables such as, but not limited to, operating cash flow, mine construction requirements and strategies, other construction projects, spot gold and silver prices, taxation, government royalties and general market conditions. At the present time, we are not a party to any agreement that would limit our ability to pay dividends.
Physical Dividend Program
In 2012, we launched a physical dividend program pursuant to which our shareholders have the option to convert the cash dividends that we pay into physical gold and silver bullion. As part of our overall strategy to diversify our treasury and to facilitate this program, we may periodically purchase gold and silver bullion. In order for a shareholder to convert their cash dividend into physical gold and/or silver, the shareholder must opt-in to the physical dividend program and request the conversion of their cash dividend, or portion thereof, into physical gold and/or silver. For those shareholders who elect to convert their cash dividend into gold and/or silver bullion, the gold and silver will be delivered in the form of gold or silver Gold Resource Corporation one-ounce bullion rounds. No action is required by any shareholder who elects not to participate in the physical metals program. For those shareholders who wish to convert any portion of their cash dividend into gold and/or silver bullion, the process is summarized as follows:
|
· |
Shareholders must register and hold their Gold Resource Corporation common shares in their name directly with our transfer agent, Computershare Investor Services, and not through a brokerage house or other intermediary held in a “street name”. This is a requirement so that we can locate and validate the shareholder’s position in our common stock. |
|
· |
Shareholders must set up an individual account with Gold Bullion International (“GBI”), 1325 Avenue of the Americas, 7th Floor, Suite 0703-2, New York, NY 10019. GBI facilitates the cash to gold and silver conversion. |
|
· |
Shareholders then direct their cash dividend check issued by Computershare to be electronically deposited to the shareholder’s GBI account for the option to have it, or any portion thereof that denominates into a one-ounce gold or silver bullion round. The election to convert all or any portion of the shareholder’s cash dividend into bullion is governed by an agreement between the shareholder and GBI. |
|
· |
Shareholders with accounts at GBI who wish to change their current gold, silver or cash allocations for their cash dividend must do so by midnight Eastern Time on the date preceding the monthly dividend record date. We issue a press release with details of each dividend declaration, and the dividend record and payment dates. |
|
· |
On the dividend record date, the number of bullion ounces to be converted and distributed to the shareholder’s individual account on the dividend payment date is calculated as the dollar value of that portion of the cash dividend the shareholder elected to convert to bullion, divided by the London Bullion Market PM gold fix plus gold bullion minting cost factors on the record date or the London Bullion Market silver fix plus silver bullion minting cost factors on the record date. |
34
Only whole ounces of gold and silver bullion are credited to a shareholder’s individual account on the dividend payment date. The cash value attributable to fractional ounces will remain in the shareholder’s individual account as cash until such time as future dividends provide the shareholder with sufficient cash to convert to whole ounces of gold or silver based on the London PM gold fix and silver fix on a future dividend record date, and based on the shareholder’s self-directed gold, silver or cash allocations in effect at that time. The shareholder may also choose to move their cash out of their GBI account. Shareholders cannot move cash into their GBI account for conversion into gold and silver. Only the shareholder’s cash dividend sent from Computershare is eligible for conversion.
We encourage shareholders who have questions concerning the physical dividend program to contact our investor relations department at (303) 320-7708.
ITEM 6. SELECTED FINANCIAL DATA
The following selected financial data sets forth our summary historical financial data as of and for the years ended December 31, 2017, 2016, 2015, 2014 and 2013. This information was derived from our audited consolidated financial statements for each year. Our selected historical financial data is qualified in its entirety by, and should be read in conjunction with, Item 7. Management’s Discussion and Analysis of Financial Condition and Results of Operations and the audited consolidated financial statements and the notes thereto included elsewhere in this report. For additional information relating to our operations, please see Item 1. Business and Item 2. Properties.
|
|
|
Years Ended December 31, |
|
|||||||||||||
|
|
|
2017 |
|
2016 |
|
2015 |
|
2014 |
|
2013 |
|
|||||
|
|
|
(In thousands, except per share amounts) |
|
|||||||||||||
|
Sales, net |
|
$ |
110,156 |
|
$ |
83,227 |
|
$ |
92,701 |
|
$ |
115,405 |
|
$ |
125,784 |
|
|
Mine gross profit |
|
|
42,115 |
|
|
22,433 |
|
|
30,323 |
|
|
50,871 |
|
|
58,258 |
|
|
Net income (1) |
|
|
4,150 |
|
|
4,387 |
|
|
3,062 |
|
|
15,036 |
|
|
5,334 |
|
|
Net income per common share: |
|
|
|
|
|
|
|
|
|
|
|
|
|
|
|
|
|
Basic and diluted |
|
|
0.07 |
|
|
0.08 |
|
|
0.06 |
|
|
0.28 |
|
|
0.10 |
|
|
Cash dividends declared |
|
|
0.02 |
|
|
0.03 |
|
|
0.11 |
|
|
0.12 |
|
|
0.43 |
|
|
|
|
|
|
|
|
|
|
|
|
|
|
|
|
|
|
|
|
|
|
As of December 31, |
|
|||||||||||||
|
|
|
2017 |
|
2016 |
|
2015 |
|
2014 |
|
2013 |
|
|||||
|
|
|
(In thousands) |
|
|||||||||||||
|
Total Assets (1) |
|
$ |
132,923 |
|
$ |
118,443 |
|
$ |
106,499 |
|
$ |
105,983 |
|
$ |
91,236 |
|
|
Long-term obligations |
|
|
5,809 |
|
|
2,425 |
|
|
2,815 |
|
|
3,827 |
|
|
2,887 |
|
|
(1) |
Certain changes between the years 2014 and prior may be related to the transition from an Exploration Stage Enterprise to a Production Stage Enterprise in accordance with Guide 7. Prior to January 1, 2014, we were considered an Exploration Stage Enterprise under SEC criteria since we had not demonstrated proven and probable reserves at our properties. Accordingly, as required under SEC guidelines, substantially all of our investment in mining properties up to that date, including construction of the processing facility, mine facilities and mine construction expenditures, were expensed as incurred and therefore do not appear as assets on our balance sheet. The change in our accounting presentation as a result of our transition to a Production Stage Enterprise may make certain period-over-period comparisons less meaningful. |
Please see the consolidated financial statements included in this Form 10-K under Item 8 for additional information.
35
ITEM 7.MANAGEMENT’S DISCUSSION AND ANALYSIS OF FINANCIAL CONDITION AND RESULTS OF OPERATIONS
Except for the historical information, the following discussion contains forward-looking statements that are subject to risks and uncertainties. We caution you not to put undue reliance on any forward-looking statements, which speak only as of the date of this report. Our actual future results or actions may differ materially from these forward-looking statements for many reasons, including the risks described in “Risk Factors” and elsewhere in this annual report and other reports filed by us with the SEC. Our discussion and analysis of our financial condition and results of operations should be read in conjunction with the audited consolidated financial statements and related notes included in this report and with the understanding that our actual future results may be materially different from what we currently expect.
Introduction
The following discussion summarizes our results of operations for three fiscal years ended December 31, 2017, 2016 and 2015 and our financial condition at December 31, 2017 and 2016, with a particular emphasis on the year ended December 31, 2017.
The discussion also presents certain non-GAAP financial measures that are important to management in its evaluation of our operating results and which are used by management to compare our performance with what we perceive to be peer group mining companies, and are relied on as part of management’s decision-making process. Management believes these measures may also be important to investors in evaluating our performance. For a detailed description of each of the non-GAAP financial measures, please see the discussion under Non-GAAP Measures. Please see Item 1. Business for a discussion of our business and Item 2. Properties for the use of certain mining terms.
In our financial statements, we report the sale of precious and base metals as revenue and we periodically review our revenue streams to ensure that this treatment remains appropriate. We consider precious metals to be the long-term primary driver of our economic decisions and believe that base metals are secondary products.
Precious metal gold equivalent is determined by taking gold ounces produced or sold, plus silver ounces produced or sold converted to precious metal gold equivalent ounces using the gold to silver average realized price ratio for the period.
36
Highlights for the year ended December 31, 2017 are included below and discussed further in our Management’s Discussion and Analysis.
2017 Highlights
|
· |
Achieved seventh consecutive year of profitability; |
|
· |
Achieved the upper range of our annual gold production target with 28,117 ounces; |
|
· |
Achieved our annual silver production range with 1.77 million ounces; |
|
· |
Ending working capital of $27.5 million |
|
· |
Cash balance increased by $8.2 million to $22.4 million; |
|
· |
Commenced production and optimization at our Alta Gracia Project’s Mirador Mine; |
|
· |
Furthered the Arista’s mine development at the Switchback vein system; |
|
· |
Total cash cost after by-product credits per precious metal gold equivalent ounce sold of $75; |
|
· |
Total all-in sustaining cost per precious metal gold equivalent ounce sold of $590; |
|
· |
Distributed $1.1 million in shareholder dividends. |
Results of Operations—Year Ended December 31, 2017 Compared to Year Ended December 31, 2016
Overview
We are a mining company which pursues gold and silver projects that are expected to achieve both low operating costs and high returns on capital. We have two mining units, the Oaxaca Mining Unit located in Oaxaca, Mexico and the Nevada Mining Unit located in Nevada, USA. Our Oaxaca Mining Unit consists of six properties and includes mineral production from the Arista Mine at the Aguila Project and the Mirador Mine at the Alta Gracia Project. Both are underground mining operations that supply ore to our processing facilities located at the Aguila Project. We produce doré, and metal concentrates which contain precious metals of gold and silver and base metals of copper, lead and zinc. Our Nevada Mining Unit consists of four properties and includes the Isabella Pearl Project which is in the advanced stages of engineering and mine permitting. The Isabella Pearl Project mineralization is predominantly gold with some silver. We target a development decision at Isabella Pearl at the earliest possible date.
Sales, net
Metal sales of $110.2 million for the year ended December 31, 2017 increased by $26.9 million, or 32% when compared to the same period in 2016. The increase in our 2017 sales is primarily attributable to an increase in base metal realized prices, volumes, and lower treatment charges, partially offset by lower precious metals sales. For the year ended December 31, 2017, average realized prices for base metals increased from the same period in 2016 as follows: copper by 33% to $6,354 per tonne, lead by 22% to $2,371 per tonne, and zinc by 37% to $2,993 per tonne. Average realized precious metal prices remained substantially unchanged from 2016.
Revenue generated from the sale of base metals in our concentrates is considered a by-product of our gold and silver production for the purpose of our total cash cost/credit after by-product credits measure noted in our non-GAAP measures disclosure. For financial reporting purposes, we report the sale of base metals as part of our revenue. We periodically review our revenues to ensure that our reporting of primary products and by-products is appropriate. Because we consider copper, lead and zinc to be by-products of our precious metal gold equivalent production, the value of these metals is applied as a reduction to total cash costs in our calculation of total cash cost/credit after by-product credits per precious metal gold equivalent ounce sold. Please see Non-GAAP Measures for additional information.
37
Production
For the year ended December 31, 2017, gold production of 28,117 ounces increased 2% over the same period in 2016, while silver production of 1,773,263 ounces decreased 5% from the same period in 2016, primarily due to higher grades.
For the three months ended December 31, 2017, production totaled 9,209 ounces of gold and 555,550 ounces of silver, an increase of 81% and 32%, respectively, over the same period in 2016. The fourth quarter of 2017 benefited from higher grades processed, when compared to the fourth quarter of 2016. The increase in precious metal production is attributable to a high-grade area which accounted for 70% of the gold and silver production in the quarter.
During 2017, the Arista vein system accounted for 55% of the production tonnage followed by Switchback development ore at 35%, and the Aguila open pit and Mirador Mine with 8% and 2%, respectively. Looking forward into 2018, we plan to start production stoping of the Switchback vein system, continue mining at a lesser rate in the Arista vein system, increase production at the Mirador Mine, and to a lesser extent the Aguila open pit.
Gold and silver ore grades vary depending on the area of the Arista vein system being mined at any given time. We have seen an expected decrease of precious metal grades and an increase in base metal grades as we mined deeper in the deposit. The decrease in grades is a function of the metal gradation in the epithermal system. As we move mining operations into the Switchback vein system, we have seen an increase in precious metal grades in the upper levels of the system as compared to the lower levels. Bulk tonnage mining at Switchback during 2018 is planned to commence in the bottom level of the current mine development, in a lower grade area, as we plan to mine upward to higher-grade areas of Switchback. Mine expansions laterally in the upper mine levels have an increased chance of higher precious metal grades as was seen in areas discovered and mined during 2017. Exploration efforts target both deeper and lateral expansion of the deposit.
During the three and twelve months ended December 31, 2017, we processed Arista Mine ore through the flotation circuit at a rate of 1,357 and 1,301 ore tonnes per day, respectively, compared to 1,373 and 1,295 ore tonnes per day for the same periods in 2016. The agitated leach plant was commissioned in the fourth quarter of 2017 reaching 150 dry metric tonnes throughput per day. Operational challenges, however, limited monthly mill production to just over 1,000 tonnes from the Mirador Mine. We are targeting 100 tonnes per day from the Mirador Mine in 2018. Achieving this processing rate in the future is dependent upon our ability to develop the mine to a point where ore extraction can consistently achieve target capacity while meeting grade and dilution parameters.
Our 2017 full year production of 28,117 gold ounces achieved the upper end of our targeted gold range and 1,773,263 silver ounces achieved the targeted silver range for the year. Our 2017 production outlook was 27,500 gold ounces and 1,850,000 silver ounces plus or minus 5%.
On a precious metal gold equivalent basis, our mill production totaled 16,419 ounces and 52,050 ounces for the fourth quarter and year ended December 31, 2017, respectively. Please see the Production and Sales Statistics table below for additional information regarding our mineral production statistics.
During 2017, we sold 25,221 gold ounces and 1,630,003 silver ounces at a total cash cost per ounce, after by-product credits, of $75. The decrease in cash cost per ounce of $473 from the prior year is primarily attributable to higher average realized prices on base metals and higher base metal sales as a result of higher recovered grades, consistent with our mine plan. During the three months ended December 31, 2017, we sold 7,700 gold ounces and 508,133 silver ounces at a total cash credit per gold equivalent ounce of $170. Please see Non-GAAP Measures below for additional information concerning the cash cost per ounce measures.
38
2018 Production Targets
Precious metal production targets for 2018 include 27,000 gold ounces, 1,700,000 silver ounces, with a plus or minus range of 10% of each metal. In addition, significant base metal production of copper, lead, and zinc is expected.
Please see Production and Sales Statistics table below for additional information regarding our actual mineral production statistics.
Production and Sales Statistics
|
Oaxaca Mining Unit |
||||||||||||
|
|
|
Three months ended December 31, |
|
Year ended December 31, |
||||||||
|
|
|
2017 |
|
2016 |
|
2017 |
|
2016 |
||||
|
Milled |
|
|
|
|
|
|
|
|
|
|
|
|
|
Tonnes Milled (1) |
|
|
119,379 |
|
|
118,798 |
|
|
449,177 |
|
|
450,221 |
|
Tonnes Milled per Day (2) |
|
|
1,357 |
|
|
1,373 |
|
|
1,301 |
|
|
1,295 |
|
Grade |
|
|
|
|
|
|
|
|
|
|
|
|
|
Average Gold Grade (g/t) |
|
|
2.83 |
|
|
1.53 |
|
|
2.29 |
|
|
2.13 |
|
Average Silver Grade (g/t) |
|
|
157 |
|
|
121 |
|
|
134 |
|
|
139 |
|
Average Copper Grade (%) |
|
|
0.39 |
|
|
0.26 |
|
|
0.34 |
|
|
0.29 |
|
Average Lead Grade (%) |
|
|
2.03 |
|
|
1.28 |
|
|
1.60 |
|
|
1.21 |
|
Average Zinc Grade (%) |
|
|
4.95 |
|
|
3.98 |
|
|
4.39 |
|
|
3.78 |
|
Recoveries |
|
|
|
|
|
|
|
|
|
|
|
|
|
Average Gold Recovery (%) |
|
|
85 |
|
|
87 |
|
|
85 |
|
|
89 |
|
Average Silver Recovery (%) |
|
|
92 |
|
|
91 |
|
|
92 |
|
|
92 |
|
Average Copper Recovery (%) |
|
|
72 |
|
|
82 |
|
|
75 |
|
|
78 |
|
Average Lead Recovery (%) |
|
|
73 |
|
|
79 |
|
|
75 |
|
|
74 |
|
Average Zinc Recovery (%) |
|
|
82 |
|
|
84 |
|
|
83 |
|
|
84 |
|
Mill production (before payable metal deductions) (3) |
|
|
|
|
|
|
|
|
|
|
|
|
|
Gold (ozs.) |
|
|
9,209 |
|
|
5,088 |
|
|
28,117 |
|
|
27,628 |
|
Silver (ozs.) |
|
|
555,550 |
|
|
419,683 |
|
|
1,773,263 |
|
|
1,857,658 |
|
Copper (tonnes) |
|
|
337 |
|
|
258 |
|
|
1,141 |
|
|
1,035 |
|
Lead (tonnes) |
|
|
1,782 |
|
|
1,202 |
|
|
5,365 |
|
|
4,049 |
|
Zinc (tonnes) |
|
|
4,854 |
|
|
3,996 |
|
|
16,301 |
|
|
14,302 |
|
Payable metal sold |
|
|
|
|
|
|
|
|
|
|
|
|
|
Gold (ozs.) |
|
|
7,700 |
|
|
4,330 |
|
|
25,221 |
|
|
25,426 |
|
Silver (ozs.) |
|
|
508,133 |
|
|
366,667 |
|
|
1,630,003 |
|
|
1,704,336 |
|
Copper (tonnes) |
|
|
297 |
|
|
224 |
|
|
1,066 |
|
|
964 |
|
Lead (tonnes) |
|
|
1,633 |
|
|
1,168 |
|
|
4,932 |
|
|
3,797 |
|
Zinc (tonnes) |
|
|
3,607 |
|
|
3,313 |
|
|
13,059 |
|
|
11,816 |
|
Average metal prices realized (4) |
|
|
|
|
|
|
|
|
|
|
|
|
|
Gold ($ per oz.) |
|
|
1,279 |
|
|
1,184 |
|
|
1,267 |
|
|
1,256 |
|
Silver ($ per oz.) |
|
|
16.60 |
|
|
16.17 |
|
|
17.10 |
|
|
17.18 |
|
Copper ($ per tonne) |
|
|
7,164 |
|
|
5,499 |
|
|
6,354 |
|
|
4,792 |
|
Lead ($ per tonne) |
|
|
2,531 |
|
|
2,224 |
|
|
2,371 |
|
|
1,936 |
|
Zinc ($ per tonne) |
|
|
3,524 |
|
|
2,640 |
|
|
2,993 |
|
|
2,188 |
|
Precious metal gold equivalent ounces produced (mill production) (3) |
|
|
|
|
|
|
|
|
|
|
|
|
|
Gold Ounces |
|
|
9,209 |
|
|
5,088 |
|
|
28,117 |
|
|
27,628 |
|
Gold Equivalent Ounces from Silver |
|
|
7,210 |
|
|
5,730 |
|
|
23,933 |
|
|
25,395 |
|
Total Precious Metal Gold Equivalent Ounces |
|
|
16,419 |
|
|
10,818 |
|
|
52,050 |
|
|
53,023 |
|
Precious metal gold equivalent ounces sold |
|
|
|
|
|
|
|
|
|
|
|
|
|
Gold Ounces |
|
|
7,700 |
|
|
4,330 |
|
|
25,221 |
|
|
25,426 |
|
Gold Equivalent Ounces from Silver |
|
|
6,594 |
|
|
5,006 |
|
|
22,003 |
|
|
23,299 |
|
Total Precious Metal Gold Equivalent Ounces |
|
|
14,294 |
|
|
9,336 |
|
|
47,224 |
|
|
48,725 |
|
Total cash cost before by-product credits per precious metal gold equivalent ounce sold (5) |
|
$ |
1,157 |
|
$ |
2,045 |
|
$ |
1,294 |
|
$ |
1,325 |
|
Total cash (credit) cost after by-product credits per precious metal gold equivalent ounce sold (5) |
|
$ |
(170) |
|
$ |
698 |
|
$ |
75 |
|
$ |
548 |
|
Total all-in sustaining cost per precious metal gold equivalent ounce sold (5) |
|
$ |
253 |
|
$ |
918 |
|
$ |
590 |
|
$ |
845 |
|
Total all-in cost per precious metal gold equivalent ounce sold (5) |
|
$ |
270 |
|
$ |
1,143 |
|
$ |
617 |
|
$ |
964 |
39
|
(1) |
For the fourth quarter of 2017 and 2016 and the year ended December 31, 2017 and 2016, this includes nil, 17,605, 42,079 and 56,369 tonnes, respectively, of low-grade stockpile open pit ore. In addition, includes 3,019 and 6,350 tonnes of Mirador ore for the fourth quarter and year ended December 31, 2017, respectively. |
|
(2) |
Based on actual days the Aguila processing facility operated during the period. |
|
(3) |
Mill production represents metal contained in concentrates produced at the Aguila processing facility, which is before payable metal deductions are levied by the buyer of our concentrates. Payable metal deduction quantities are defined in our contracts with the buyer of our concentrates and represent an estimate of metal contained in the concentrates produced at our Aguila processing facility which the buyer cannot recover through the smelting process. There are inherent limitations and differences in the sampling method and assaying of estimated metal contained in concentrates that are shipped, and those contained metal estimates are derived from sampling methods and assaying throughout the mill production process. The Company monitors these differences to ensure that precious metal mill production quantities are materially correct. |
|
(4) |
Average metal prices realized vary from the market metal prices due to final settlement adjustments from our provisional invoices when they are settled. Our average metal prices realized will therefore differ from the market average metal prices in most cases. |
|
(5) |
For a reconciliation of this non-GAAP measure to total mine cost of sales, which is the most comparable U.S. GAAP measure, please see Non-GAAP Measures. |
Mine gross profit. For the year ended December 31, 2017, mine gross profit and mine gross profit percent totaled $42.1 million and 38% compared to $22.4 million and 27% for the same period in 2016. The increase in mine gross profit and mine gross profit percent during 2017 was primarily driven by higher sales volumes, lower treatment and refining costs, and higher base metal prices during 2017 as compared to 2016.
General and administrative expenses. For the year ended December 31, 2017, general and administrative expenses totaled $8.1 million, compared to $9.5 million for the same period of 2016. The $1.4 million decrease in 2017, compared to 2016 is primarily due to decreased IT support fees and employee compensation expenses.
Exploration expenses. For the year ended December 31, 2017, property exploration expenses totaled $4.3 million which is consistent with exploration expense of $4.3 million for the same period of 2016.
Other expense (income), net. For the year ended December 31, 2017, we recorded other expense of $1.2 million compared to other income of $0.6 million during the same period of 2016. The $1.8 million change in 2017 compared to the same period in 2016 was due to foreign currency losses in 2017 as a result of the Mexican Peso strengthening against the US dollar during the year. Also contributing to the change was one-time income from insurance reimbursements and from the sale of investments in 2016. No such items occurred in 2017.
Provision for income taxes. For the year ended December 31, 2017, income tax expense increased to $24.3 million from $4.8 million for the same period in 2016. The increase in taxes is mostly due to significant changes to U.S. tax legislation which did not result in any cash payments and the Company does not expect any future cash implication. Additionally, increases in pre-tax income, utilization of foreign tax credits, and Mexico fixed assets indexation also contributed to the increase in tax expense. Please see Note 5 in Item 8. Financial Statements and Supplementary Data for additional information.
Results of Operations – Year Ended December 31, 2016 Compared to Year Ended December 31, 2015
Mine gross profit. For the year ended December 31, 2016, mine gross profit and mine gross profit percent totaled $22.4 million and 27% compared to $30.3 million and 33% for the same period in 2015. The decrease in mine gross profit and mine gross profit percent during 2016 was primarily driven by lower sales volume which was partially offset with higher realized gold and silver prices during 2016 as compared to 2015.
General and administrative expenses. For the year ended December 31, 2016, general and administrative expenses totaled $9.5 million, compared to $10.3 million for the same period of 2015. The $0.8 million decrease in 2016 compared to 2015 is primarily due to decreased stock-based compensation, audit fees, and tax consulting fees. These decreases were partially offset by increased IT support fees and employee compensation costs.
Exploration expenses. For the year ended December 31, 2016, property exploration expenses totaled $4.3 million, compared to $7.2 million for the same period of 2015. The $2.9 million decrease in the property exploration spending in 2016 was a result of our cost saving measures for 2016. We continued our exploration activities at our Oaxaca Mining
40
Unit in 2016, although at a reduced rate from 2015. Offsetting the decrease in activities at our Oaxaca Mining Unit were our increased activities at our Nevada Mining Unit on the Isabella Pearl property during the fourth quarter of 2016 where we spent $1.2 million.
Other expense (income), net. For the year ended December 31, 2016, we recorded other income of $0.6 million compared to other expense of $2.5 million during the same period of 2015. The $3.1 million change in 2016 compared to the same period in 2015 was due to foreign currency gains, an increase in value of our gold and silver rounds/bullion, and a gain on the sale of equity investments in 2016. Offsetting these increases were losses on disposal of fixed assets and an increase in our reserve for obsolete materials and supplies inventory in 2016.
Provision for income taxes. For the year ended December 31, 2016, income tax expense decreased to $4.8 million compared to $7.4 million for the same period in 2015. The decrease in taxes is commensurate with a decrease in pre-tax income, utilization of foreign tax credits, and Mexico fixed assets indexation. Please see Note 5 in Item 8. Financial Statements and Supplementary Data for additional information.
Throughout this report, we have provided information prepared or calculated according to U.S. GAAP and have referenced some non-GAAP performance measures which we believe will assist with understanding the performance of our business. These measures are based on precious metal gold equivalent ounces sold and include cash cost before by-product credits per ounce, total cash cost/credit after by-product credits per ounce, total all-in sustaining cost per ounce (“AISC”) and all-in cost per ounce (“AIC”). Because the non-GAAP performance measures do not have any standardized meaning prescribed by U.S. GAAP, they may not be comparable to similar measures presented by other companies. Accordingly, these measures should not be considered in isolation, or as a substitute for, measures of performance prepared in accordance with U.S. GAAP. These non-GAAP measures are not necessarily indicative of operating profit or cash flow from operations as determined under GAAP.
Total cash cost/credit, after by-product credits, is a measure developed by the Gold Institute in an effort to provide a uniform standard for comparison purposes. The guidance was first issued in 1996 and revised in November 1999. AISC and AIC are calculated based on guidance from the World Gold Council issued in June 2013.
Total cash cost before by-product credits includes all direct and indirect production costs related to our production of metals (including mining, milling and other plant facility costs, smelter treatment and refining charges, royalties, and site general and administrative costs) less stock-based compensation allocated to production costs plus treatment and refining costs.
Total cash cost/credit after by-product credits includes total cash cost before by-product credits less by-product credits, or revenues earned from base metals.
AISC includes total cash cost/credit after by-product credits plus other costs related to sustaining production, including sustaining allocated general and administrative expenses and sustaining capital expenditures. We determined sustaining capital expenditures as those capital expenditures that are necessary to maintain current production and execute the current mine plan.
AIC includes all-in sustaining costs plus non-sustaining capital expenditures and exploration expense related to the Oaxaca Mining Unit. Capital expenditures and exploration expenses related to projects in our Oaxaca Mining Unit are classified as non-sustaining. Exploration and capital expenditures to develop new properties outside our Oaxaca Mining Unit are excluded from this calculation.
Cash cost before by-product credits per ounce, total cash cost/credit after by-product credits per ounce, AISC and AIC are calculated by dividing the relevant costs, as determined using the cost elements noted above, by precious metal gold equivalent ounces sold for the periods presented.
41
Reconciliations to U.S. GAAP
The following table provides a reconciliation of total cash cost/credit after by-product credits to total mine cost of sales (a U.S. GAAP measure) as presented in the Consolidated Statements of Operations:
|
|
|
Three months ended December 31, |
|
Year ended December 31, |
||||||||
|
|
|
2017 |
|
2016 |
|
2017 |
|
2016 |
||||
|
|
|
(in thousands) |
||||||||||
|
Total cash (credit) cost after by-product credits |
|
$ |
(2,440) |
|
$ |
6,512 |
|
$ |
3,545 |
|
$ |
26,738 |
|
Treatment and refining charges |
|
|
(2,763) |
|
|
(5,213) |
|
|
(7,760) |
|
|
(16,291) |
|
By-product credits |
|
|
18,972 |
|
|
12,577 |
|
|
57,552 |
|
|
37,827 |
|
Depreciation and amortization |
|
|
4,283 |
|
|
3,120 |
|
|
14,554 |
|
|
12,169 |
|
Reclamation and remediation |
|
|
(50) |
|
|
26 |
|
|
51 |
|
|
165 |
|
Stock-based compensation allocated to production costs |
|
|
33 |
|
|
14 |
|
|
99 |
|
|
186 |
|
Total mine cost of sales |
|
$ |
18,035 |
|
$ |
17,036 |
|
$ |
68,041 |
|
$ |
60,794 |
The following table presents a reconciliation of the non-GAAP measures of total cash cost before by-product credits, total cash cost after by-product credits and AISC to AIC:
|
|
|
Three months ended December 31, |
|
Year ended December 31, |
||||||||
|
|
|
2017 |
|
2016 |
|
2017 |
|
2016 |
||||
|
|
|
(in thousands, except ounces sold and cost per precious metal gold equivalent ounce sold) |
||||||||||
|
Total cash cost before by-product credits (1) |
|
$ |
16,532 |
|
$ |
19,089 |
|
$ |
61,097 |
|
$ |
64,565 |
|
By-product credits (2) |
|
|
(18,972) |
|
|
(12,577) |
|
|
(57,552) |
|
|
(37,827) |
|
Total cash (credit) cost after by-product credits |
|
|
(2,440) |
|
|
6,512 |
|
|
3,545 |
|
|
26,738 |
|
Sustaining capital expenditures |
|
|
5,247 |
|
|
1,263 |
|
|
21,155 |
|
|
11,303 |
|
Sustaining general and administrative expenses |
|
|
793 |
|
|
789 |
|
|
3,156 |
|
|
3,156 |
|
Total all-in sustaining cost |
|
|
3,600 |
|
|
8,564 |
|
|
27,856 |
|
|
41,197 |
|
Non-sustaining capital expenditures |
|
|
- |
|
|
1,205 |
|
|
9 |
|
|
3,802 |
|
Non-sustaining exploration expense |
|
|
236 |
|
|
898 |
|
|
1,288 |
|
|
1,993 |
|
Total all-in cost |
|
$ |
3,836 |
|
$ |
10,667 |
|
$ |
29,153 |
|
$ |
46,992 |
|
|
|
|
|
|
|
|
|
|
|
|
|
|
|
Precious metal gold equivalent ounces sold (3) |
|
|
14,294 |
|
|
9,336 |
|
|
47,224 |
|
|
48,725 |
|
|
|
|
|
|
|
|
|
|
|
|
|
|
|
Total cash cost before by-product credits per precious metal gold equivalent ounce sold |
|
$ |
1,157 |
|
$ |
2,045 |
|
$ |
1,294 |
|
$ |
1,325 |
|
By-product credits per precious metal gold equivalent ounce sold |
|
|
(1,327) |
|
|
(1,347) |
|
|
(1,219) |
|
|
(777) |
|
Total cash (credit) cost after by-product credits per precious metal gold equivalent ounce sold |
|
|
(170) |
|
|
698 |
|
|
75 |
|
|
548 |
|
Other sustaining expenditures per precious metal gold equivalent ounce sold |
|
|
423 |
|
|
220 |
|
|
515 |
|
|
297 |
|
Total all-in sustaining cost per precious metal gold equivalent ounce sold |
|
|
253 |
|
|
918 |
|
|
590 |
|
|
845 |
|
Non-sustaining expenditures per precious metal gold equivalent ounce sold |
|
|
17 |
|
|
225 |
|
|
27 |
|
|
119 |
|
Total all-in cost per precious metal gold equivalent ounce sold |
|
$ |
270 |
|
$ |
1,143 |
|
$ |
617 |
|
$ |
964 |
|
(1) |
Production cost less stock-based compensation allocated to production cost plus treatment and refining charges. |
|
(2) |
Please see the tables below for a summary of our by-product revenue and by-product credit per precious metal equivalent ounces sold. |
|
(3) |
Gold ounces sold, plus gold equivalent ounces of silver ounces sold converted to gold ounces using our realized gold price per ounce to silver price per ounce ratio. |
42
The following tables summarizes our by-product revenue and by-product credit per precious metal gold equivalent ounce sold:
|
|
|
Three months ended December 31, |
|
Year ended December 31, |
||||||||
|
|
|
2017 |
|
2016 |
|
2017 |
|
2016 |
||||
|
|
|
(in thousands) |
||||||||||
|
By-product credits by dollar value: |
|
|
|
|
|
|
|
|
|
|
|
|
|
Copper sales |
|
$ |
2,128 |
|
$ |
1,235 |
|
$ |
6,774 |
|
$ |
4,619 |
|
Lead sales |
|
|
4,134 |
|
|
2,597 |
|
|
11,699 |
|
|
7,352 |
|
Zinc sales |
|
|
12,710 |
|
|
8,745 |
|
|
39,079 |
|
|
25,856 |
|
Total sales from by-products |
|
$ |
18,972 |
|
$ |
12,577 |
|
$ |
57,552 |
|
$ |
37,827 |
|
|
|
Three months ended December 31, |
|
Year ended December 31, |
||||||||
|
|
|
2017 |
|
2016 |
|
2017 |
|
2016 |
||||
|
By-product credits per precious metal gold equivalent ounce sold: |
|
|
|
|
|
|
|
|
|
|
|
|
|
Copper sales |
|
$ |
149 |
|
$ |
132 |
|
$ |
143 |
|
$ |
95 |
|
Lead sales |
|
|
289 |
|
|
278 |
|
|
248 |
|
|
151 |
|
Zinc sales |
|
|
889 |
|
|
937 |
|
|
828 |
|
|
531 |
|
Total by-product credits per precious metal gold ounces sold |
|
$ |
1,327 |
|
$ |
1,347 |
|
$ |
1,219 |
|
$ |
777 |
Liquidity and Capital Resources
As of December 31, 2017, we had working capital of $27.5 million, consisting of current assets of $42.5 million and current liabilities of $15.0 million. This represents an increase of $7.2 million from the working capital balance of $20.3 million at December 31, 2016. Our working capital balance fluctuates as we use cash to fund our operations, exploration, mine development, income taxes and our dividends.
Cash and cash equivalents as of December 31, 2017 increased to $22.4 million from $14.2 million as of December 31, 2016, a net increase in cash of $8.2 million. The increase is primarily due to higher cash flow from operations which was partially offset by higher capital expenditures.
Net cash provided by operating activities for the year ended December 31, 2017 was $35.6 million compared to $17.9 million during the same period in 2016, an increase of $17.7 million. The increase is primarily due to higher income before income taxes.
Net cash used in investing activities for the year ended December 31, 2017 was $25.7 million compared to $14.7 million during the same period in 2016. The increase in investing activities is primarily attributable to increased mine development in our Arista Mine and the purchase of additional mineral rights and equipment at our Nevada Mining Unit.
Net cash used in financing activities for the year ended December 31, 2017 was $1.4 million compared to $1.9 million in 2016. The decrease in financing activities was primarily the result of lower dividend and capital lease payments in 2017.
We believe that our liquidity and capital resources are adequate to fund our operations and corporate activities for the foreseeable future. In the event that construction on our Isabella Pearl Project commences in 2018, we would evaluate the use of cash, equity financing, debt financing, or a combination thereof to fund the capital requirements. There can be no assurances that such financing will be available when or if needed upon acceptable terms, or at all.
43
Off-Balance Sheet Arrangements
As of December 31, 2017, we had no off-balance sheet arrangements.
The following table represents a summary of our contractual obligations at December 31, 2017, except short-term purchase order commitments arising in the ordinary course of business:
|
|
|
Payments due by Period |
||||||||||||||||
|
|
|
Total |
|
2018 |
|
2019 |
|
2020 |
|
2021 |
|
2022 and |
||||||
|
|
|
(in thousands) |
||||||||||||||||
|
Loan payable |
|
$ |
2,213 |
|
$ |
568 |
|
$ |
594 |
|
$ |
621 |
|
$ |
430 |
|
$ |
- |
|
Interest on loan payable |
|
|
191 |
|
|
88 |
|
|
62 |
|
|
34 |
|
|
7 |
|
|
|
|
Capital lease obligations |
|
|
1,600 |
|
|
382 |
|
|
404 |
|
|
427 |
|
|
387 |
|
|
- |
|
Interest on capital lease obligation |
|
|
180 |
|
|
79 |
|
|
57 |
|
|
34 |
|
|
10 |
|
|
|
|
Operating lease obligations |
|
|
397 |
|
|
164 |
|
|
87 |
|
|
74 |
|
|
72 |
|
|
- |
|
Equipment purchase obligations |
|
|
3,791 |
|
|
3,791 |
|
|
- |
|
|
- |
|
|
- |
|
|
- |
|
|
|
$ |
8,372 |
|
$ |
5,072 |
|
$ |
1,204 |
|
$ |
1,190 |
|
$ |
906 |
|
$ |
- |
For a discussion of Recently Adopted Accounting Pronouncements and Recently Issued Accounting Pronouncements, please see Note 1 in Item 8. Financial Statements and Supplementary Data.
The preparation of financial statements in conformity with U.S. GAAP requires management to make estimates and assumptions that affect the reported amount of assets, liabilities and contingencies at the date of the financial statements as well as the reported amounts of revenues and expenses during the reporting period. As a result, management is required to routinely make judgments and estimates about the effects of matters that are inherently uncertain. Actual results may differ from these estimates under different conditions or assumptions. The following discussion pertains to accounting estimates management believes are most critical to the presentation of our financial position and results of operations that require management’s most difficult, subjective or complex judgments.
Proven and Probable Reserves
Critical estimates are inherent in the process of determining our reserves. Our reserves are affected largely by our assessment of future metals prices, as well as by engineering and geological estimates of ore grade, accessibility and production cost. Metals prices are estimated at three-year trailing averages. Our assessment of reserves occurs at least annually, and we may utilize external audits in the future. Reserves are a key component in the valuation of our property, equipment and mine development and related depreciation rates.
Reserve estimates are used in determining appropriate rates of units-of-production depreciation, with net book value of many assets depreciated over remaining estimated reserves. Reserves are also a key component in forecasts, with which we compare estimated future cash flows to current asset values in an effort to ensure that carrying values are reported appropriately. Reserves are a culmination of many estimates and are not guarantees that we will recover the indicated quantities of metals or that we will do so at a profitable level.
Revenue
Concentrate sales are initially recorded using quoted metal prices at the time of shipment and contain an embedded derivative that is required to be separated from the host contract for accounting purposes. The host contract is the
44
receivable from the sale of the concentrates at the quoted metal prices at the time of shipment. The embedded derivative, which does not qualify for hedge accounting, is adjusted to market through revenue each period prior to final settlement. Changes in the prices of metals that we sell between the shipment and final settlement dates will result in adjustments to revenues related to sales of concentrate previously recorded upon shipment. Sales are recorded net of charges for treatment, refining, smelting losses and other charges negotiated with the buyer. These charges are estimated upon shipment of concentrates based on contractual terms and adjusted to reflect actual charges at final settlement. Historically, actual charges have not varied materially from the Company’s initial estimates.
Doré sales are recognized using quoted metal prices, net of treatment and refining charges, when the title has been transferred and collection of the sales price is reasonably assured.
Depreciation and Amortization
Capitalized costs are depreciated or amortized using the straight-line method or unit-of-production (“UOP”) method at rates sufficient to depreciate such costs over the shorter of estimated productive lives of such assets or the useful life of the individual assets. Significant judgment is involved in the determination of the estimated life of the assets. Our estimates for reserves are a key component in determining our UOP rates. Our estimates of proven and probable ore reserves may change, possibly in the near term, resulting in changes to depreciation, depletion and amortization rates in future reporting periods. Productive lives range from 1 to 10 years, but do not exceed the useful life of the individual asset.
Please see Note 1 in Item 8. Financial Statements and Supplementary Data for depreciation rates of major asset categories.
Impairment of Long-Lived Assets
We evaluate the carrying value of long-lived assets to be held and used, using a fair-value based approach when events and circumstances indicate that the related carrying amount of our assets may not be recoverable. The economic environment and commodity prices may be considered as impairment indicators for the purposes of these impairment assessments. In accordance with U.S. GAAP, the carrying value of a long-lived asset or asset group is considered impaired when the anticipated undiscounted cash flows from such asset or asset group is less than its carrying value. In that event, a loss will be recorded in our consolidated statements of operations based on the difference between book value and the estimated fair value of the asset or asset group computed using discounted estimated future cash flows, or the application of an expected fair value technique in the absence of an observable market price. Future cash flows include estimates of recoverable quantities to be produced from estimated proven and probable mineral reserves, commodity prices (considering current and historical prices, price trends and related factors), production quantities, production costs, and capital expenditures, all based on life-of-mine plans and projections. In estimating future cash flows, assets are grouped at the lowest level for which identifiable cash flows exist that are largely independent of cash flows from other asset groups. It is possible that actual future cash flows will be significantly different than the estimates, as actual future quantities of recoverable minerals, gold and other commodity prices, production levels and costs and capital are each subject to significant risks and uncertainties.
Asset Retirement Obligation/Reclamation and Remediation Costs
Our mining and exploration activities are subject to various laws and regulations, including legal and contractual obligations to reclaim, remediate, or otherwise restore properties at the time the property is removed from service. Accounting for reclamation and remediation obligations requires management to make estimates of the future costs that we will incur to complete the work required to comply with existing laws and regulations. Actual costs may differ from the amounts estimated. Reclamation costs are allocated to expense over the life of the related assets and are periodically adjusted to reflect changes in the estimated present value resulting from the passage of time and revisions to the estimates of either the timing or amount of the reclamation and remediation costs. Also, future changes to environmental laws and regulations could increase the extent of reclamation and remediation work required.
45
Stock-based Compensation
We account for stock-based employee compensation plans under the fair value recognition and measurement provisions in accordance with applicable accounting standards, which require all stock-based payments to employees, including grants of stock options and restricted stock units (“RSUs”), to be measured based on the grant date fair value of the awards, with the resulting expense generally recognized on a straight-line basis over the period during which the employee is required to perform service in exchange for the award.
Stock-based compensation expense is recorded net of estimated forfeitures in our consolidated statements of operations and as such is recorded for only those stock-based awards that we expect to vest. We estimate the forfeiture rate based on historical forfeitures of equity awards and adjust the rate to reflect changes in facts and circumstances, if any. We will revise our estimated forfeiture rate if actual forfeitures differ from our initial estimates.
Income Taxes
In preparing our consolidated financial statements, we estimate the actual amount of taxes currently payable or receivable as well as deferred tax assets and liabilities attributable to temporary differences between the financial statement carrying amounts of existing assets and liabilities and their respective tax bases. Deferred income tax assets and liabilities are measured using enacted tax rates expected to apply to taxable income in the years in which these temporary differences are expected to be recovered or settled. Changes in deferred tax assets and liabilities generally have a direct impact on earnings in the period of the changes. Mining taxes represent federal and state taxes levied on mining operations. As the mining taxes are calculated as a percentage of mining profits, we classify them as income taxes. Where applicable tax laws and regulations are either unclear or subject to varying interpretations, it is possible that changes in these estimates could occur that materially affect the amounts of deferred income tax assets and liabilities recorded in the consolidated financial statements.
Each period, we evaluate the likelihood of whether or not some portion or all of each deferred tax asset will be realized and provide a valuation allowance for those deferred tax assets for which is more likely than not that the related benefits will not be realized. When evaluating our valuation allowance, we consider historic and future expected levels of taxable income, the pattern and timing of reversals of taxable temporary timing differences that give rise to deferred tax liabilities, and tax planning initiatives. Levels of future taxable income are affected by, among other things, market gold and silver prices, production costs, quantities of proven and probable reserves, interest rates, federal and local legislation, and foreign currency exchange rates. If we determine that all or a portion of the deferred tax assets will not be realized, a valuation allowance will be recorded with a charge to income tax expense. Conversely, if we determine that we will ultimately be able to realize all or a portion of the related benefits for which a valuation allowance has been provided, all or a portion of the related valuation allowance will be reduced with a credit to income tax expense.
In addition, the calculation of income tax expense involves significant management estimation and judgment involving a number of assumptions. In determining these amounts, management interprets tax legislation in each of the jurisdictions in which we operate and makes estimates of the expected timing of the reversal of future tax assets and liabilities. We also make assumptions about future earnings, tax planning strategies and the extent to which potential future tax benefits will be used. We are also subject to assessments by various taxation authorities which may interpret tax legislation differently, which could affect the final amount or the timing of tax payments.
ITEM 7A.QUANTITATIVE AND QUALITATIVE DISCLOSURES ABOUT MARKET RISK
Our exposure to market risks includes, but is not limited to, the following risks: changes in commodity prices, foreign currency exchange rates, provisional sales contract risks, changes in interest rates, and equity price risks. We do not use derivative financial instruments as part of an overall strategy to manage market risk; however, we may consider such arrangements in the future as we evaluate our business and financial strategy.
46
Commodity Price Risk
The results of our operations depend in large part upon the market prices of gold, silver, and base metal prices of copper, lead and zinc. Gold and silver prices fluctuate widely and are affected by numerous factors beyond our control. The level of interest rates, the rate of inflation, the stability of exchange rates, the world supply of and demand for gold, silver and other metals, among other factors, can all cause significant fluctuations in commodity prices. Such external economic factors are in turn influenced by changes in international investment patterns, monetary systems and political developments. The price of gold and silver has fluctuated widely in recent years, and future price declines could cause a mineral project to become uneconomic, thereby having a material adverse effect on our business and financial condition. We have not entered into derivative contracts to protect the selling price for gold or silver. We may in the future more actively manage our exposure through derivative contracts or other commodity price risk management programs, although we have no intention of doing so in the near-term.
In addition to adversely affecting our reserve estimates, results of operations and/or our financial condition, declining gold and silver prices could require a reassessment of the feasibility of a project. Even if a project is ultimately determined to be economically viable, the need to conduct such a reassessment may cause delays in the implementation of a project.
Foreign Currency Risk
Foreign currency exchange rate fluctuations can increase or decrease our costs to the extent we pay costs in currencies other than the U.S. dollar. We are primarily impacted by Mexican peso rate changes relative to the U.S. Dollar, as we incur some costs in Mexican peso. When the value of the peso rises in relation to the U.S. Dollar, some of our costs in Mexico may increase, thus affecting our operating results. Alternatively, when the value of the peso drops in relation to the US Dollar, peso-denominated costs in Mexico will decrease in U.S. Dollar terms. These fluctuations do not impact our revenues since we sell our metals in U.S. dollars. Future fluctuations may give rise to foreign currency exposure, which may affect our financial results.
We have not utilized market-risk sensitive instruments to manage our exposure to foreign currency exchange rates but may in the future actively manage our exposure to foreign currency exchange rate risk.
Provisional Sales Contract Risk
We enter into concentrate sales contracts which, in general, provide for a provisional payment based upon provisional assays and prices. The provisionally priced sales contracts contain an embedded derivative that is required to be separated from the host contract for accounting purposes. The host contract is the receivable from the sale of concentrates determined at the quoted metal prices at the time of shipment. The embedded derivative, which does not qualify for hedge accounting, is adjusted to market through revenue each period prior to settlement. Changes in the prices of metals between the shipment and final settlement date will result in adjustments to revenues related to the sales of concentrate previously recorded upon shipment. Please see Note 14 in Item 8. Financial Statements and Supplementary Data for additional information.
Interest Rate Risk
Our outstanding debt, at fixed rates, consisted of an equipment loan and leased equipment classified as capital leases. As the debt is at fixed rates, we consider our interest rate risk exposure to be insignificant at this time.
Equity Price Risk
We have in the past sought and may in the future seek to acquire additional funding by sale of common stock and other equity. The price of our common stock has been volatile in the past and may also be volatile in the future. As a result, there is a risk that we may not be able to sell our common stock at an acceptable price should the need for new equity funding arise.
47
ITEM 8. FINANCIAL STATEMENTS AND SUPPLEMENTARY DATA
|
|
Page |
||
|
Index to Financial Statements: |
|
||
|
|
|
|
|
|
|
|
49 | |
|
|
|
52 | |
|
|
Consolidated Statements of Operations for the years ended December 31, 2017, 2016 and 2015 |
|
53 |
|
|
|
54 | |
|
|
Consolidated Statements of Cash Flows for the years ended December 31, 2017, 2016 and 2015 |
|
55 |
|
|
|
56 | |
48
Report of Independent Registered Public Accounting Firm
To the Shareholders and Board of Directors
Gold Resource Corporation
Colorado Springs, Colorado
OPINIONS ON THE FINANCIAL STATEMENTS AND INTERNAL CONTROL OVER FINANCIAL REPORTING
We have audited the accompanying consolidated balance sheets of Gold Resource Corporation (the "Company") as of December 31, 2017 and 2016, and the related consolidated statements of operations, comprehensive income, changes in shareholders' equity, and cash flows, for each year in the two-year period ended December 31, 2017, and the related notes (collectively referred to as the "financial statements"). We have also audited the Company's internal control over financial reporting as of December 31, 2017, based on the criteria established in Internal Control - Integrated Framework: (2013) issued by the Committee of Sponsoring Organizations of the Treadway Commission ("COSO").
In our opinion, the financial statements referred to above present fairly, in all material respects, the financial position of the Company as of December 31, 2017 and 2016, and the results of its operations and its cash flows for each year in the two-year period ended December 31, 2017, in conformity with accounting principles generally accepted in the United States of America. Also, in our opinion, the Company maintained, in all material respects, effective internal control over financial reporting as of December 31, 2017, based on criteria established in Internal Control - Integrated Framework: (2013) issued by COSO.
BASIS FOR OPINIONS
The Company's management is responsible for these financial statements, for maintaining effective internal control over financial reporting, and for its assessment of the effectiveness of internal control over financial reporting, included in the accompanying Management's Report on Internal Control over Financial Reporting. Our responsibility is to express an opinion on the Company's financial statements and an opinion on the Company's internal control over financial reporting based on our audits. We are a public accounting firm registered with the Public Company Accounting Oversight Board (United States) ("PCAOB") and are required to be independent with respect to the Company in accordance with the U.S. federal securities laws and the applicable rules and regulations of the Securities and Exchange Commission and the PCAOB.
We conducted our audits in accordance with the standards of the PCAOB. Those standards require that we plan and perform the audits to obtain reasonable assurance about whether the financial statements are free of material misstatement, whether due to error or fraud, and whether effective internal control over financial reporting was maintained in all material respects.
Our audits of the financial statements included performing procedures to assess the risks of material misstatement of the financial statements, whether due to error or fraud, and performing procedures that respond to those risks. Such procedures included examining, on a test basis, evidence regarding the amounts and disclosures in the financial statements. Our audits also included evaluating the accounting principles used and significant estimates made by management, as well as evaluating the overall presentation of the financial statements. Our audit of internal control over financial reporting included obtaining an understanding of internal control over financial reporting, assessing the risk that a material weakness exists, and testing and evaluating the design and operating effectiveness of internal control based on the assessed risk. Our audits also included
49
performing such other procedures as we considered necessary in the circumstances. We believe that our audits provide a reasonable basis for our opinions.
DEFINITION AND LIMITATIONS OF INTERNAL CONTROL OVER FINANCIAL REPORTING
A company's internal control over financial reporting is a process designed to provide reasonable assurance regarding the reliability of financial reporting and the preparation of financial statements for external purposes in accordance with generally accepted accounting principles. A company's internal control over financial reporting includes those policies and procedures that (i) pertain to the maintenance of records that, in reasonable detail, accurately and fairly reflect the transactions and dispositions of the assets of the company;
(ii) provide reasonable assurance that transactions are recorded as necessary to permit preparation of financial statements in accordance with generally accepted accounting principles, and that receipts and expenditures of the company are being made only in accordance with authorizations of management and directors of the company; and (iii) provide reasonable assurance regarding prevention or timely detection of unauthorized acquisition, use, or disposition of the company's assets that could have a material effect on the financial statements.
Because of its inherent limitations, internal control over financial reporting may not prevent or detect misstatements. Also, projections of any evaluation of effectiveness to future periods are subject to the risk that controls may become inadequate because of changes in conditions, or that the degree of compliance with the policies or procedures may deteriorate.
/s/EKS&H LLLP
Denver, Colorado
March 8, 2018
We have served as the Company's auditor since 2016.
50
Report of Independent Registered Public Accounting Firm
The Board of Directors
Gold Resource Corporation:
We have audited the accompanying consolidated statements of income and comprehensive income, changes in shareholders’ equity, and cash flows of Gold Resource Corporation and subsidiaries (the Company) for the year ended December 31, 2015. These consolidated financial statements are the responsibility of the Company’s management. Our responsibility is to express an opinion on these consolidated financial statements based on our audit.
We conducted our audit in accordance with the standards of the Public Company Accounting Oversight Board (United States). Those standards require that we plan and perform the audit to obtain reasonable assurance about whether the financial statements are free of material misstatement. An audit includes examining, on a test basis, evidence supporting the amounts and disclosures in the financial statements. An audit also includes assessing the accounting principles used and significant estimates made by management, as well as evaluating the overall financial statement presentation. We believe that our audit provides a reasonable basis for our opinion.
In our opinion, the consolidated financial statements referred to above present fairly, in all material respects, the results of operations and cash flows for Gold Resource Corporation and subsidiaries for the year ended December 31, 2015, in conformity with U.S. generally accepted accounting principles.
/s/ KPMG LLP
Denver, Colorado
March 8, 2016
51
GOLD RESOURCE CORPORATION
(U.S. dollars in thousands, except share and per share amounts)
|
|
|
December 31, |
||||
|
|
|
2017 |
|
2016 |
||
|
ASSETS |
|
|
|
|
|
|
|
Current assets: |
|
|
|
|
|
|
|
Cash and cash equivalents |
|
$ |
22,390 |
|
$ |
14,166 |
|
Gold and silver rounds/bullion |
|
|
3,812 |
|
|
3,307 |
|
Accounts receivable |
|
|
2,884 |
|
|
630 |
|
Inventories, net |
|
|
11,636 |
|
|
8,946 |
|
Income tax receivable, net |
|
|
- |
|
|
626 |
|
Prepaid expenses and other current assets |
|
|
1,767 |
|
|
1,587 |
|
Total current assets |
|
|
42,489 |
|
|
29,262 |
|
Property, plant and mine development, net |
|
|
82,599 |
|
|
70,059 |
|
Deferred tax assets, net |
|
|
6,854 |
|
|
17,580 |
|
Other non-current assets |
|
|
981 |
|
|
1,542 |
|
Total assets |
|
$ |
132,923 |
|
$ |
118,443 |
|
LIABILITIES AND SHAREHOLDERS' EQUITY |
|
|
|
|
|
|
|
Current liabilities: |
|
|
|
|
|
|
|
Accounts payable |
|
$ |
6,904 |
|
$ |
5,383 |
|
Loan payable, current |
|
|
568 |
|
|
- |
|
Capital lease, current |
|
|
382 |
|
|
- |
|
Income taxes payable |
|
|
1,944 |
|
|
- |
|
Mining royalty taxes payable |
|
|
2,359 |
|
|
2,033 |
|
Accrued expenses and other current liabilities |
|
|
2,851 |
|
|
1,526 |
|
Total current liabilities |
|
|
15,008 |
|
|
8,942 |
|
Reclamation and remediation liabilities |
|
|
2,946 |
|
|
2,425 |
|
Loan payable, long-term |
|
|
1,645 |
|
|
- |
|
Capital lease, long-term |
|
|
1,218 |
|
|
- |
|
Total liabilities |
|
|
20,817 |
|
|
11,367 |
|
Shareholders' equity: |
|
|
|
|
|
|
|
Common stock - $0.001 par value, 100,000,000 shares authorized: |
|
|
|
|
|
|
|
56,916,484 and 56,566,874 shares outstanding at December 31, 2017 and 2016, respectively |
|
|
57 |
|
|
57 |
|
Additional paid-in capital |
|
|
114,584 |
|
|
112,034 |
|
Retained earnings |
|
|
4,520 |
|
|
2,040 |
|
Treasury stock at cost, 336,398 shares |
|
|
(5,884) |
|
|
(5,884) |
|
Accumulated other comprehensive loss |
|
|
(1,171) |
|
|
(1,171) |
|
Total shareholders' equity |
|
|
112,106 |
|
|
107,076 |
|
Total liabilities and shareholders' equity |
|
$ |
132,923 |
|
$ |
118,443 |
The accompanying notes are an integral part of these consolidated financial statements.
52
GOLD RESOURCE CORPORATION
CONSOLIDATED STATEMENTS OF OPERATIONS
for the years ended December 31, 2017, 2016 and 2015
(U.S. dollars in thousands, except share and per share amounts)
|
|
|
|
|
|
|
|
|
|
|
|
|
|
2017 |
|
2016 |
|
2015 |
|||
|
Sales, net |
|
$ |
110,156 |
|
$ |
83,227 |
|
$ |
92,701 |
|
Mine cost of sales: |
|
|
|
|
|
|
|
|
|
|
Production costs |
|
|
53,436 |
|
|
48,460 |
|
|
54,362 |
|
Depreciation and amortization |
|
|
14,554 |
|
|
12,169 |
|
|
7,974 |
|
Reclamation and remediation |
|
|
51 |
|
|
165 |
|
|
42 |
|
Total mine cost of sales |
|
|
68,041 |
|
|
60,794 |
|
|
62,378 |
|
Mine gross profit |
|
|
42,115 |
|
|
22,433 |
|
|
30,323 |
|
Costs and expenses: |
|
|
|
|
|
|
|
|
|
|
General and administrative expenses |
|
|
8,122 |
|
|
9,533 |
|
|
10,254 |
|
Exploration expenses |
|
|
4,349 |
|
|
4,314 |
|
|
7,150 |
|
Other expense (income), net |
|
|
1,166 |
|
|
(560) |
|
|
2,466 |
|
Total costs and expenses |
|
|
13,637 |
|
|
13,287 |
|
|
19,870 |
|
Income before income taxes |
|
|
28,478 |
|
|
9,146 |
|
|
10,453 |
|
Provision for income taxes |
|
|
24,328 |
|
|
4,759 |
|
|
7,391 |
|
Net income |
|
$ |
4,150 |
|
$ |
4,387 |
|
$ |
3,062 |
|
Net income per common share: |
|
|
|
|
|
|
|
|
|
|
Basic and diluted |
|
$ |
0.07 |
|
$ |
0.08 |
|
$ |
0.06 |
|
Weighted average shares outstanding: |
|
|
|
|
|
|
|
|
|
|
Basic |
|
|
56,854,670 |
|
|
55,140,237 |
|
|
54,186,547 |
|
Diluted |
|
|
57,594,993 |
|
|
55,725,206 |
|
|
54,259,312 |
The accompanying notes are an integral part of these consolidated financial statements.
53
GOLD RESOURCE CORPORATION
CONSOLIDATED STATEMENTS OF CHANGES IN SHAREHOLDERS' EQUITY
for the years ended December 31, 2017, 2016 and 2015
(U.S. dollars in thousands, except share amounts)
|
|
|
Number of Common Shares |
|
Par Value of Common Shares |
|
Additional Paid-in Capital |
|
Accumulated (Deficit)/ Retained Earnings |
|
Treasury Stock |
|
Accumulated Other Comprehensive Loss |
|
Total Shareholders' Equity |
||||||
|
Balance, December 31, 2014 |
|
54,515,767 |
|
$ |
55 |
|
$ |
93,094 |
|
$ |
2,040 |
|
$ |
(5,884) |
|
$ |
(1,171) |
|
$ |
88,134 |
|
Stock options exercised |
|
87,337 |
|
|
- |
|
|
200 |
|
|
- |
|
|
- |
|
|
- |
|
|
200 |
|
Stock-based compensation |
|
- |
|
|
- |
|
|
3,472 |
|
|
- |
|
|
- |
|
|
- |
|
|
3,472 |
|
Dividends declared |
|
- |
|
|
- |
|
|
- |
|
|
(6,050) |
|
|
- |
|
|
- |
|
|
(6,050) |
|
Net income |
|
- |
|
|
- |
|
|
- |
|
|
3,062 |
|
|
- |
|
|
- |
|
|
3,062 |
|
Balance, December 31, 2015 |
|
54,603,104 |
|
$ |
55 |
|
$ |
96,766 |
|
$ |
(948) |
|
$ |
(5,884) |
|
$ |
(1,171) |
|
$ |
88,818 |
|
Stock options exercised |
|
169,999 |
|
|
- |
|
|
391 |
|
|
- |
|
|
- |
|
|
- |
|
|
391 |
|
Stock-based compensation |
|
- |
|
|
- |
|
|
1,240 |
|
|
- |
|
|
- |
|
|
- |
|
|
1,240 |
|
Dividends declared |
|
- |
|
|
- |
|
|
(271) |
|
|
(1,399) |
|
|
- |
|
|
- |
|
|
(1,670) |
|
Acquisitions |
|
2,130,169 |
|
|
2 |
|
|
13,908 |
|
|
- |
|
|
- |
|
|
- |
|
|
13,910 |
|
Net income |
|
- |
|
|
- |
|
|
- |
|
|
4,387 |
|
|
- |
|
|
- |
|
|
4,387 |
|
Balance, December 31, 2016 |
|
56,903,272 |
|
$ |
57 |
|
$ |
112,034 |
|
$ |
2,040 |
|
$ |
(5,884) |
|
$ |
(1,171) |
|
$ |
107,076 |
|
Adjustment to beginning retained earnings as a result of adoption of ASU 2016-16 |
|
- |
|
|
- |
|
|
- |
|
|
(533) |
|
|
- |
|
|
- |
|
|
(533) |
|
Stock-based compensation |
|
- |
|
|
- |
|
|
1,192 |
|
|
- |
|
|
- |
|
|
- |
|
|
1,192 |
|
Stock options exercised |
|
25,000 |
|
|
- |
|
|
58 |
|
|
- |
|
|
- |
|
|
- |
|
|
58 |
|
Common stock issued for vested restricted stock units |
|
78,400 |
|
|
- |
|
|
- |
|
|
- |
|
|
- |
|
|
- |
|
|
- |
|
Common stock issued for the acquisition of mineral rights |
|
246,210 |
|
|
- |
|
|
1,300 |
|
|
- |
|
|
- |
|
|
- |
|
|
1,300 |
|
Dividends declared |
|
- |
|
|
- |
|
|
- |
|
|
(1,137) |
|
|
- |
|
|
- |
|
|
(1,137) |
|
Net income |
|
- |
|
|
- |
|
|
- |
|
|
4,150 |
|
|
- |
|
|
- |
|
|
4,150 |
|
Balance, December 31, 2017 |
|
57,252,882 |
|
$ |
57 |
|
$ |
114,584 |
|
$ |
4,520 |
|
$ |
(5,884) |
|
$ |
(1,171) |
|
$ |
112,106 |
The accompanying notes are an integral part of these consolidated financial statements.
54
GOLD RESOURCE CORPORATION
CONSOLIDATED STATEMENTS OF CASH FLOWS
for the years ended December 31, 2017, 2016 and 2015
(U.S. dollars in thousands)
|
|
|
Year ended December 31, |
|||||||
|
|
|
2017 |
|
2016 |
|
2015 |
|||
|
Cash flows from operating activities: |
|
|
|
|
|
|
|
|
|
|
Net income |
|
$ |
4,150 |
|
$ |
4,387 |
|
$ |
3,062 |
|
Adjustments to reconcile net income to net cash from operating activities: |
|
|
|
|
|
|
|
|
|
|
Deferred income taxes |
|
|
14,991 |
|
|
(1,555) |
|
|
5,133 |
|
Depreciation and amortization |
|
|
14,998 |
|
|
12,588 |
|
|
9,097 |
|
Stock-based compensation |
|
|
1,192 |
|
|
1,240 |
|
|
3,472 |
|
Other operating adjustments |
|
|
1,285 |
|
|
298 |
|
|
2,874 |
|
Changes in operating assets and liabilities: |
|
|
|
|
|
|
|
|
|
|
Accounts receivable |
|
|
(2,254) |
|
|
(309) |
|
|
1,095 |
|
Inventories |
|
|
(2,797) |
|
|
(738) |
|
|
(430) |
|
Prepaid expenses and other current assets |
|
|
(448) |
|
|
793 |
|
|
233 |
|
Accounts payable and other accrued liabilities |
|
|
1,636 |
|
|
(3,579) |
|
|
3,357 |
|
Mining royalty and income taxes payable/receivable |
|
|
2,887 |
|
|
4,695 |
|
|
(7,721) |
|
Other noncurrent assets |
|
|
(7) |
|
|
79 |
|
|
(2) |
|
Net cash provided by operating activities |
|
|
35,633 |
|
|
17,899 |
|
|
20,170 |
|
|
|
|
|
|
|
|
|
|
|
|
Cash flows from investing activities: |
|
|
|
|
|
|
|
|
|
|
Capital expenditures |
|
|
(25,432) |
|
|
(15,140) |
|
|
(26,685) |
|
Proceeds from the sale of equity investments |
|
|
- |
|
|
749 |
|
|
- |
|
Other investing activities |
|
|
(257) |
|
|
(302) |
|
|
(55) |
|
Net cash used in investing activities |
|
|
(25,689) |
|
|
(14,693) |
|
|
(26,740) |
|
|
|
|
|
|
|
|
|
|
|
|
Cash flows from financing activities: |
|
|
|
|
|
|
|
|
|
|
Proceeds from the exercise of stock options |
|
|
- |
|
|
391 |
|
|
- |
|
Dividends paid |
|
|
(1,137) |
|
|
(1,670) |
|
|
(6,502) |
|
Repayment of loan payable |
|
|
(184) |
|
|
- |
|
|
- |
|
Repayment of capital leases |
|
|
(73) |
|
|
(606) |
|
|
(1,501) |
|
Net cash used in financing activities |
|
|
(1,394) |
|
|
(1,885) |
|
|
(8,003) |
|
|
|
|
|
|
|
|
|
|
|
|
Effect of exchange rate changes on cash and cash equivalents |
|
|
(326) |
|
|
23 |
|
|
(146) |
|
Net increase (decrease) in cash and cash equivalents |
|
|
8,224 |
|
|
1,344 |
|
|
(14,719) |
|
Cash and cash equivalents at beginning of period |
|
|
14,166 |
|
|
12,822 |
|
|
27,541 |
|
Cash and cash equivalents at end of period |
|
$ |
22,390 |
|
$ |
14,166 |
|
$ |
12,822 |
|
|
|
|
|
|
|
|
|
|
|
|
Supplemental Cash Flow Information |
|
|
|
|
|
|
|
|
|
|
Interest expense paid |
|
$ |
65 |
|
$ |
13 |
|
$ |
78 |
|
Income and mining taxes paid |
|
$ |
3,102 |
|
$ |
256 |
|
$ |
9,514 |
|
Non-cash investing activities: |
|
|
|
|
|
|
|
|
|
|
Increase (decrease) in accrued capital expenditures |
|
$ |
1,041 |
|
$ |
(2,868) |
|
$ |
1,358 |
|
Equipment purchased through loan payable |
|
$ |
2,397 |
|
$ |
- |
|
$ |
- |
|
Equipment purchased under capital leases |
|
$ |
1,686 |
|
$ |
300 |
|
$ |
- |
|
Common stock issued for the acquisition of mineral rights |
|
$ |
1,300 |
|
$ |
13,910 |
|
$ |
- |
The accompanying notes are an integral part of these consolidated financial statements.
55
GOLD RESOURCE CORPORATION
NOTES TO CONSOLIDATED FINANCIAL STATEMENTS
December 31, 2017, 2016 and 2015
1. Nature of Operations and Summary of Significant Accounting Policies
Nature of Operations
Gold Resource Corporation (the “Company”) was organized under the laws of the State of Colorado on August 24, 1998. The Company is a producer of metal concentrates that contain gold, silver, copper, lead and zinc, and doré containing gold and silver at the Aguila and Alta Gracia Projects in the southern state of Oaxaca, Mexico (“Oaxaca Mining Unit”). The Aguila Project includes the Arista underground mine and processing facility, which are currently in operation. The Alta Gracia Project includes the Mirador underground mine which began operations in 2017. The Company also performs exploration and evaluation work on our portfolio of precious metal exploration properties in Nevada, United States of America (“Nevada Mining Unit”) and continues to evaluate other properties for possible acquisition.
Significant Accounting Policies
Basis of Presentation
The consolidated financial statements included herein are expressed in United States dollars, and conform to United States generally accepted accounting principles (“U.S. GAAP”). The consolidated financial statements include the accounts of the Company, its Mexican subsidiary, Don David Gold Mexico S.A. de C.V. (“Don David Gold Mexico”) and its wholly-owned United States subsidiaries GRC Nevada Inc. and Walker Lane Minerals Corp. (“Walker Lane”). Intercompany accounts and transactions have been eliminated in consolidation.
Use of Estimates
The preparation of financial statements in conformity with U.S. GAAP requires management to make estimates and assumptions that affect the reported amount of assets and liabilities and disclosure of contingent assets and liabilities at the date of the financial statements and the reported amounts of revenues and expenses during the reporting periods. Management routinely makes judgments and estimates about the effects of matters that are inherently uncertain and bases its estimates and judgments on historical experience and on various other factors that are believed to be reasonable under the circumstances. Actual results could differ from these estimates.
Reclassifications
Certain amounts presented in prior periods have been reclassified to conform to the current period presentation. The reclassifications had no material effect on the Company’s results of operations or financial condition.
Cash and Cash Equivalents
Cash and cash equivalents consist of all cash balances and highly liquid investments with a remaining maturity of three months or less when purchased and are carried at cost.
Gold and Silver Rounds/Bullion
From time to time, the Company may purchase gold and silver bullion on the open market in order to diversify its treasury and provide an option for shareholders to convert their dividends into bullion. The purchased gold and silver bullion is carried at quoted market value prices based on the daily London P.M. fix as of the balance sheet date. The
56
Company considers bullion a highly-liquid investment.
Accounts Receivable
Accounts receivable consists of trade receivables from the sale of doré and metals concentrates, as well an embedded derivative based on mark-to-market adjustments for outstanding provisional invoices based on metal forward prices.
Inventories
The major inventory categories are set forth below:
Stockpile Inventories: Stockpile inventories represent ore that has been mined and is available for further processing. Stockpiles are measured by estimating the number of tonnes added and removed from the stockpile, an estimate of the contained metals (based on assay data) and the estimated metallurgical recovery rates. Costs are allocated to stockpiles based on relative values of material stockpiled and processed using current mining costs incurred, including applicable overhead, depreciation and amortization relating to mining operations. Material is removed at each stockpile’s average cost per tonne. Stockpiles are carried at the lower of average cost or net realizable value. Net realizable value represents the estimated future sales price of the product based on current and long-term metals prices, less the estimated costs to complete production and bring the product to sale. The current portion of stockpiles is determined based on the expected amounts to be processed within the next 12 months. Stockpiles not expected to be processed within the next 12 months are classified as long term. As of December 31, 2017, all stockpiles were classified as current.
Concentrate Inventories: Concentrates inventories include metal concentrates located either at the Company’s facilities or in transit to its customer’s port. Inventories consist of copper, lead and zinc metal concentrates, which also contain gold and silver mineralization. Concentrate inventories are carried at the lower of cost of production or net realizable value based on current metals prices.
Doré Inventory: Doré includes gold and silver doré bars held at the Company’s facility. Doré inventories are carried at the lower of cost of production or net realizable value based on current metals prices.
Materials and Supplies Inventories: Materials and supplies inventories consist of chemical reagents, parts, fuels and other materials and supplies. Cost includes applicable taxes and freight. Materials and supplies inventory is carried at lower of average cost or net realizable value.
Write-downs of inventory are charged to expense.
IVA Taxes Receivable and Payable
In Mexico, value added (“IVA”) taxes are assessed on purchases of materials and services and sales of products. Businesses are generally entitled to recover the taxes they have paid related to purchases of materials and services, either as a refund or as a credit against future taxes payable. Likewise, businesses owe IVA taxes as the business sells a product and collects IVA taxes from its customers.
Amounts recorded as IVA taxes in the consolidated financial statements represent the net estimated IVA tax receivable or payable, since there is a legal right of offset of IVA taxes.
Property, Plant and Mine Development
Land and Mineral Rights: The costs of acquiring land and mineral rights are considered tangible assets. Administrative and holding costs to maintain an exploration property are expensed as incurred. If a mineable mineral deposit is discovered, such capitalized costs are amortized when production begins using the units of production (“UOP”) method. If no mineable mineral deposit is discovered or such rights are otherwise determined to have
57
diminished value, such costs are expensed in the period in which the determination is made.
Mine Development: The costs include engineering and metallurgical studies, drilling and other related costs to delineate an ore body, the building of access ways, shafts, lateral access, drifts, ramps and other infrastructure. Costs incurred before mineralization is classified as proven and probable reserves are expensed and classified as exploration expenses. Capitalization of mine development project costs, that meet the definition of an asset, begins once mineralization is classified as proven and probable reserves.
Drilling costs incurred during the production phase for operational ore control are allocated to inventory costs and then included as a component of production costs. All other drilling and related costs are expensed as incurred.
Mine development costs are amortized using UOP based on estimated recoverable ounces in proven and probable reserves.
Property and Equipment: All items of property and equipment are carried at cost. Normal maintenance and repairs are expensed as incurred while expenditures for major maintenance and betterments are capitalized. Gains or losses on disposition are recognized in other expense (income).
Construction in Progress: Expenditures for new facilities or equipment are capitalized and recorded at cost. Once completed and ready for its intended use, the asset is transferred to property and equipment to be depreciated or amortized.
Depreciation and Amortization: Capitalized costs are depreciated or amortized using the straight-line or UOP method at rates sufficient to depreciate such costs over the shorter of estimated productive lives of such assets or the useful life of the individual assets. The estimates for mineral reserves are a key component in determining the UOP depreciation rates. The estimates of reserves may change, possibly in the near term, resulting in changes to depreciation and amortization rates in future reporting periods. The following are the estimated economic lives of depreciable assets:
|
|
Range of Lives |
|
|
|
Asset retirement costs |
|
UOP |
|
|
Furniture, computer and office equipment |
|
3 to 10 years |
|
|
Light vehicles and other mobile equipment |
|
4 years |
|
|
Machinery and equipment |
|
UOP to 4 years |
|
|
Mill facilities and related infrastructure |
|
UOP |
|
|
Mine development |
|
UOP |
|
Impairment of Long-Lived Assets
The Company evaluates its long-lived assets for impairment when events or changes in circumstances indicate that the related carrying amounts may not be recoverable. Asset impairment is considered to exist if the total estimated future cash flows on an undiscounted basis are less than the carrying amount of the asset. If an impairment is indicated, a determination is made whether an impairment has occurred and any impairment losses are measured as the excess of carrying value over the total discounted estimated future cash flows, or the application of an expected fair value technique in the absence of an observable market price and are charged to expense on the Company’s consolidated statements of operations. In estimating future cash flows, assets are grouped at the lowest level for which there are identifiable cash flows that are largely independent of future cash flows from other asset groups.
Existing reserves and other mineralized material are included when estimating the fair value in determining whether the assets are impaired. The Company’s estimates of future cash flows are based on numerous assumptions including expected gold and other commodity prices, production levels, capital requirements and estimated salvage values and it is possible that actual future cash flows will be significantly different than the estimates, as actual future quantities of recoverable minerals, gold and other commodity prices, production levels and costs and capital are each subject to significant risks and uncertainties.
58
Treasury Stock
Treasury stock represents shares of the Company’s common stock which have been repurchased on the open market at the prevailing market price at the time of purchase and have not been cancelled. Treasury stock is shown at cost as a separate component of equity.
Revenue Recognition
The Company recognizes revenue when an arrangement exists, the price is fixed and determinable, the title and risk of loss have transferred to the buyer and collection is reasonably assured.
Concentrate sales: Concentrate sales are initially recorded using quoted metal prices at the time of shipment and contain an embedded derivative that is required to be separated from the host contract for accounting purposes. The host contract is the receivable from the sale of the concentrates at the quoted metal prices at the time of shipment. The embedded derivative, which does not qualify for hedge accounting, is adjusted to market through revenue each period prior to final settlement. Changes in the prices of metals that the Company sells, as quoted on the London Bullion Market, between the shipment and final settlement dates will result in adjustments to revenues related to sales of concentrate previously recorded upon shipment. Sales are recorded net of charges for treatment, refining, smelting losses and other charges negotiated with the buyer. These charges are estimated upon shipment of concentrates based on contractual terms and adjusted to reflect actual charges at final settlement. Historically, actual charges have not varied materially from the Company’s initial estimates.
Doré sales: Doré sales are recognized using quoted metal prices, net of treatment and refining charges, when the title has been transferred and collection of the sales price is reasonably assured.
Production Costs
Production costs include labor and benefits, royalties, concentrate and doré shipping costs, mining subcontractors, fuel and lubricants, legal and professional fees related to mine operations, stock-based compensation attributable to mine workers, materials and supplies, repairs and maintenance, explosives, housing and food, insurance, reagents, travel, medical services, security equipment, office rent, tools and other costs that support mining operations.
Exploration Costs
Exploration costs are charged to expense as incurred. Costs to identify new mineral resources and to evaluate potential resources are considered exploration costs.
Stock-Based Compensation
The Company accounts for stock-based compensation under the fair value recognition and measurement provisions of U.S. GAAP. Those provisions require all stock-based payments, including grants of stock options and restricted stock units (“RSUs”), to be measured based on the grant date fair value of the awards, with the resulting expense generally recognized on a straight-line basis in the consolidated statements of operations over the period during which services are performed in exchange for the award. The majority of the awards are earned over a service period of three years. The Company's estimates may be impacted by certain variables including, but not limited to, stock price volatility, employee stock option exercise behaviors, additional stock option grants, and estimates of forfeitures.
Reclamation and Remediation Costs
Reclamation costs are allocated to expense over the life of the related assets and are periodically adjusted to reflect changes in the estimated present value resulting from the passage of time and revisions to the estimates of either the timing or amount of the reclamation and remediation costs. Reclamation obligations are based in part on when the
59
spending for an existing environmental disturbance will occur. The Company reviews, at least on an annual basis, the reclamation obligation at each mine.
Prior to 2014, the Company had been recognizing only reclamation and remediation obligations and all associated asset retirement costs were written off due to the exploration stage status of the Company. In 2014, the Company became a production stage company and therefore capitalized asset retirement costs and recorded an asset retirement obligation. Please see Note 9 for additional information.
Accounting for reclamation and remediation obligations requires management to make estimates unique to each mining operation of the future costs expected to be incurred to complete the reclamation and remediation work required to comply with existing laws and regulations. Actual costs incurred in future periods could differ from amounts estimated. Additionally, future changes to environmental laws and regulations could increase the extent of reclamation and remediation work required. Any such increases in future costs could materially impact the amounts charged to earnings for reclamation and remediation.
Accumulated Other Comprehensive Loss
Accumulated other comprehensive loss is presented in the consolidated statements of changes in shareholders’ equity. Accumulated other comprehensive loss is composed of foreign currency translation adjustment effects related to the historical adjustment when the functional currency was the Mexican peso.
Income and Mining Royalty Taxes
Income taxes are computed using the asset and liability method. Deferred income taxes reflect the net tax effects of temporary differences between the carrying amounts of assets and liabilities for financial and tax reporting purposes and the effect of net operating loss and foreign tax credit carry-forwards using enacted tax rates in effect in the years in which the differences are expected to reverse. Deferred tax assets are evaluated to determine if it is more likely than not that they will be realized. Please see Note 5 for additional information.
Net Income Per Share
Basic earnings per share is calculated based on the weighted average number of common shares outstanding for the period. Diluted income per share reflects the dilution that could occur if potentially dilutive securities, as determined using the treasury stock method, are converted into common stock. Potentially dilutive securities are excluded from the calculation when their inclusion would be anti-dilutive, such as periods when a net loss is reported or when the exercise price of the instrument exceeds the average fair market value.
Foreign Currency
The functional currency for all of the Company’s subsidiaries is the United States dollar (“U.S. dollar”).
Concentration of Credit Risk
The Company has considered and assessed the credit risk resulting from its concentrate sales and doré sales arrangements with its customers and believes it is not exposed to significant credit risk in relation to the counterparty meeting its contractual obligations as it pertains to its trade receivables during the ordinary course of business. In the event that the Company’s relationships with its customers are interrupted for any reason, the Company believes that it would be able to locate another entity to purchase its metals concentrates and doré bars; however, any interruption could temporarily disrupt the Company’s sale of its products and adversely affect operating results.
The Company’s Aguila and Alta Gracia Projects, which are located in the State of Oaxaca, Mexico, accounted for 100% of the Company’s total sales for the years ended December 31, 2017, 2016 and 2015.
60
Some of the Company’s operating cash balances are maintained in accounts that currently exceed federally insured limits. The Company believes that the financial strength of the depositing institutions mitigates the underlying risk of loss. To date, these concentrations of credit risk have not had a significant impact on the Company’s financial position or results of operations.
Recently Adopted Accounting Pronouncements
Accounting Standards Update 2016-09—Compensation—Stock compensation (Topic 718): Improvements to employee share-based payment accounting. On March 30, 2016, the Financial Accounting Standards Board (“FASB”) issued guidance intended to improve the accounting for employee stock-based payments. The standard affects all organizations that issue stock-based payment awards to their employees and was part of the FASB’s Simplification Initiative. The objective of the Simplification Initiative is to identify, evaluate, and improve areas of U.S. GAAP for which cost and complexity can be reduced while maintaining or improving the usefulness of the information provided to users of financial statements. The areas for simplification in this standard involve several aspects of the accounting for stock-based payment transactions, including the income tax consequences, classification of awards as either equity or liabilities, and classification on the statement of cash flows. For public business entities, the amendments in this standard are effective for annual periods beginning after December 15, 2016, and interim periods within those annual periods. Because of the Company’s current valuation allowance position, the adoption of this guidance, effective January 1, 2017, did not result in an adjustment to retained earnings as of December 31, 2016. Nor did it result in current tax expense or benefit related to vested stock-based awards for the year ended December 31, 2017. As a result, the Company did not exclude any excess tax benefits from the calculation of diluted earnings per share during the year ended December 31, 2017, and there was no method change to the cash flow presentation as required by the guidance. Please see Note 5 for more information.
Accounting Standards Update 2016-16 – Income Taxes, Intra-Entity Transfers of Assets Other Than Inventory (Topic 740). In October 2016, the FASB issued guidance intended to improve the accounting for the income tax consequences of intra-entity transfers of assets other than inventory by requiring an entity to recognize the income tax consequences when a transfer occurs, instead of when an asset is sold to an outside party. The amendments in this guidance should be applied on a modified retrospective basis through a cumulative-effect adjustment directly to retained earnings as of the beginning of the period of adoption. The Company is required to adopt this new standard on January 1, 2018, for its fiscal year 2018 and for interim periods within that fiscal year. Early adoption is permitted as of the beginning of an annual reporting period for which interim or annual financial statements have not been issued. The Company elected to early adopt this guidance as of January 1, 2017 which resulted in the Company adjusting its deferred tax charge, previously reported in other long-term assets, to nil with the related offset to beginning retained earnings. The net effect was a decrease of $0.5 million to other long-term assets and a corresponding decrease to beginning retained earnings.
Recently Issued Accounting Standards Updates
Accounting Standards Update No. 2014-09—Revenue from Contracts with Customers (Topic 606). On May 28, 2014, the FASB issued guidance that requires an entity to recognize the amount of revenue to which it expects to be entitled for the transfer of promised goods or services to customers. This ASU was further amended in August 2015, March 2016, April 2016, May 2016 and December 2016 by ASU No. 2015-14, No. 2016-08, No. 2016-10, No. 2016-12 and No. 2016-20, respectively. The guidance provides a five-step approach to be applied to all contracts with customers and also requires expanded disclosures about revenue recognition.
The Company has performed an assessment of the revised guidance and the impacts on the Company’s Consolidated Financial Statements and disclosures. The Company has completed the review of all contracts and determined that the adoption of this guidance will not impact the timing or the amounts of revenue recognized based on the Company’s determination of when control is transferred. Currently, revenue is recognized for contracts upon delivery of material to the customer and will not change under the new guidance.
The Company completed its evaluation of variable consideration for concentrate sales related to the variable nature of the price and metal quantity. Based on its analysis, the estimate of revenue recognized for concentrates will remain
61
unchanged as sales will initially be recorded on a provisional basis based on the forward prices for the estimated month of settlement and the Company’s estimated metal quantities delivered based on weighing and assay data. The Company believes changes in the underlying weight and metal content are not significant to the sale and not probable of resulting in a material reversal of revenue as a whole and therefore do not preclude the recognition of revenue upon transfer of control.
Additionally, the Company completed its evaluation of the impacts of refining fee classification. The Company also determined that revenue will be recognized, net of treatment and refining charges, when these payments are made to customers. This classification remains unchanged from current practice.
The Company will adopt the new guidance effective January 1, 2018. The guidance may be applied retrospectively for all periods presented or retrospectively with the cumulative effect of initially applying the guidance recognized at the date of initial application. The Company currently anticipates adopting the guidance retrospectively with the cumulative effect of initially applying the amended guidance recognized at January 1, 2018. As there are no changes to the Company’s current revenue recognition model, no changes will be made to prior period amounts or related prior period disclosures.
Accounting Standards Update No. 2016-02 Leases (Topic 842). In February 2016, the FASB issued a new standard regarding leases. There are elements of the new standard that could impact almost all entities to some extent, although lessees will likely see the most significant changes. Lessees will need to recognize virtually all of their leases on the balance sheet, by recording a right-of-use asset and a lease liability. Public business entities are required to adopt the new leasing standard for fiscal years, and interim periods within those fiscal years, beginning after December 15, 2018. For calendar year-end public companies, this means an adoption date of January 1, 2019. Early adoption is permitted. The Company is currently in the process of evaluating the impact on its consolidated financial statements and disclosures.
2. Acquisitions
Mina Gold Property
On August 12, 2016, the Company acquired the Mina Gold property located in Mineral County, Nevada from Nevada Select Royalty Inc. (“Nevada Select”), a privately-held entity, for $1.0 million, which includes 130,169 shares of common stock valued at $0.9 million and cash of $0.1 million. The property consists of patented and unpatented mining claims. Nevada Select retained a net smelter return royalty (“NSR”) of 3% on the patented claims and a 2% NSR on the unpatented claims. The Company has the right to buy down 1% of the NSR on the patented claims for $1.0 million and 0.5% of the NSR on the unpatented claims for $0.5 million.
Isabella Pearl Project
On August 12, 2016, the Company acquired all of the outstanding stock of Walker Lane, a privately-held entity, which owns the Isabella Pearl project located in Mineral County, Nevada, in exchange for 2,000,000 shares of the Company’s common stock valued at $13.1 million and cash of $0.2 million. The land position totals 341 unpatented mining claims, of which 58 claims encompass the Isabella Pearl deposit. The 58 Isabella Pearl claims along with 25 additional claims have a 3% NSR, with the balance of the claims having a 1% NSR.
In connection with the above two acquisitions, the Company incurred acquisition costs of $0.1 million. The transactions were accounted for as asset acquisitions and transaction costs were capitalized in accordance with U.S. GAAP. The assets and liabilities were recorded at the sum of the market value of the Company’s shares at the date of the transactions and cash consideration. The Walker Lane acquisition resulted in the Company recording $5.6 million of deferred tax liability related to the temporary book and tax differences in the basis of the property.
The acquisition method requires the Company to determine the fair value of all acquired assets, including identifiable intangible assets, and all assumed liabilities. The total cost of acquisitions is allocated to the underlying identifiable net assets, based on their respective estimated fair values. Determining the fair value of assets acquired and
62
liabilities assumed requires management’s judgment and often involves the use of significant estimates and assumptions, including assumptions with respect to future cash inflows and outflows, discount rates, and asset lives, among other items.
The preliminary allocation of the purchase price is based on management’s estimates at the time of closing and may be adjusted after obtaining additional information regarding, among other things, asset valuations, liabilities assumed and revisions of previous estimates. During 2017, the Company revised its temporary book and tax differences and as a result finalized the purchase price allocation. The following table summarizes the final purchase price allocation:
|
|
|
Preliminary Purchase Price Allocation |
|
Measurement Period Adjustments |
|
Final Purchase Price Allocation |
|
|||
|
|
|
(in thousands) |
|
|||||||
|
Purchase Price |
|
$ |
14,280 |
|
$ |
- |
|
$ |
14,280 |
|
|
Preliminary allocation of purchase price: |
|
|
|
|
|
|
|
|
|
|
|
ASSETS |
|
|
|
|
|
|
|
|
|
|
|
Prepaid expenses and other current assets |
|
$ |
60 |
|
$ |
- |
|
$ |
60 |
|
|
Mineral interests and mineral rights |
|
|
19,413 |
|
|
(4,155) |
|
|
15,258 |
|
|
Other non-current assets |
|
|
460 |
|
|
- |
|
|
460 |
|
|
Total assets |
|
|
19,933 |
|
|
(4,155) |
|
|
15,778 |
|
|
LIABILITIES |
|
|
|
|
|
|
|
|
|
|
|
Deferred tax liability |
|
|
5,615 |
|
|
(4,155) |
|
|
1,460 |
|
|
Reclamation and remediation liabilities |
|
|
38 |
|
|
- |
|
|
38 |
|
|
Total liabilities |
|
|
5,653 |
|
|
(4,155) |
|
|
1,498 |
|
|
Net fair value |
|
$ |
14,280 |
|
$ |
- |
|
$ |
14,280 |
|
3. Gold and Silver Rounds/Bullion
The Company periodically purchases gold and silver bullion on the open market for investment purposes and to use in its dividend exchange program under which shareholders may exchange their cash dividends for minted gold and silver rounds. During the twelve months ended December 31, 2017 and 2016, the Company purchased 215.85 ounces and nil ounces, respectively, of gold bullion and 90 ounces and nil ounces, respectively, of silver bullion.
At December 31, 2017 and 2016, the Company’s holdings of rounds/bullion, using quoted market prices, consisted of the following:
|
|
|
2017 |
|
2016 |
||||||||||||
|
|
|
Ounces |
|
Per Ounce |
|
Amount |
|
Ounces |
|
Per Ounce |
|
Amount |
||||
|
|
|
|
|
|
|
|
(in thousands) |
|
|
|
|
|
|
(in thousands) |
||
|
Gold |
|
1,905 |
|
$ |
1,291 |
|
$ |
2,459 |
|
1,579 |
|
$ |
1,159 |
|
$ |
1,830 |
|
Silver |
|
80,224 |
|
$ |
16.87 |
|
|
1,353 |
|
90,971 |
|
$ |
16.24 |
|
|
1,477 |
|
Total holdings |
|
|
|
|
|
|
$ |
3,812 |
|
|
|
|
|
|
$ |
3,307 |
63
4. Current Inventories
At December 31, 2017 and 2016, inventories consisted of the following:
|
|
|
2017 |
|
2016 |
||
|
|
|
(in thousands) |
||||
|
Stockpiles - underground mine |
|
$ |
1,450 |
|
$ |
84 |
|
Stockpiles - open pit mine |
|
|
101 |
|
|
288 |
|
Concentrates and doré |
|
|
2,367 |
|
|
1,881 |
|
Materials and supplies (1) |
|
|
7,718 |
|
|
6,693 |
|
Total |
|
$ |
11,636 |
|
$ |
8,946 |
|
(1) |
Net of reserve for obsolescence of $743 and $637, respectively. |
5. Income Taxes
Impact of New U.S. Tax Law
On December 22, 2017, the U.S. government enacted comprehensive tax legislation (the “Tax Act”), which significantly revises the ongoing U.S. corporate income tax law by lowering the U.S. federal corporate income tax rate from 35% to 21%, implementing a territorial tax system, imposing a one-time tax on foreign unremitted earnings and setting limitations on deductibility of certain costs, among other things.
The Company is subject to the provisions of the Financial Accounting Standards Board (“FASB”) ASC 740-10, Income Taxes, which requires that the effect on deferred tax assets and liabilities of a change in tax rates be recognized in the period the tax rate change was enacted. Due to the complexities involved in accounting for the recently enacted Tax Act, the U.S. Securities and Exchange Commission’s Staff Accounting Bulletin (“SAB”) 118 requires that the Company include in its financial statements the reasonable estimate of the impact of the Tax Act on earnings to the extent such estimate has been determined. Accordingly, the Company recorded the following estimates of the tax impact in its earnings for the year ended December 31, 2017.
|
a) |
For the year ended December 31, 2017, the Company recorded an estimate of $4.6 million of tax expense for the Tax Act’s one-time transition tax on its foreign subsidiary’s accumulated, unremitted earnings from inception of the Company in 1998. |
|
b) |
For the year ended December 31, 2017, the Company recorded $2.7 million in provisional tax expense related to the net change in deferred tax assets stemming from the Tax Act’s reduction of the U.S. federal tax rate from 35% to 21%. |
Pursuant to the SAB118, the Company is allowed a measurement period of up to one year after the enactment date of the Tax Act to finalize the recording of the related tax impacts. The final impact on the Company from the Tax Act’s transition tax legislation may differ from the aforementioned estimates due to the complexity of calculating and supporting with primary evidence such U.S. tax attributes such as accumulated foreign earnings and profits, foreign tax paid, and other tax components involved in foreign tax credit calculations for prior years back to 1998. Such differences could be material, due to, among other things, changes in interpretations of the Tax Act, future legislative action to address questions that arise because of the Tax Act, changes in accounting standards for income taxes or related interpretations in response to the Tax Act, or any updates or changes to estimates the Company has utilized to calculate the transition tax's reasonable estimate. The Company will continue to evaluate the impact of the U.S. Tax Act and will record any resulting tax adjustments during 2018.
Based on our current estimate, the new tax legislation did not result in any cash payments as the Company was able to utilize foreign tax credits to offset the tax liability created by the one-time transition tax, and the Company does not expect any future cash implications. However, should the estimate of the impact change in the future, the Company may
64
elect to pay any transition tax in installments over the period of 8 years, pursuant to the guidance of the new Internal Revenue Code Section 965.
Gold Resource Corporation and its U.S. subsidiaries file a consolidated U.S. tax return and the Company’s foreign subsidiary files in Mexico. For financial reporting purposes, net income before income taxes includes the following components:
|
|
|
Years Ended December 31, |
|
|||||||
|
|
|
2017 |
|
2016 |
|
2015 |
|
|||
|
|
|
(in thousands) |
|
|||||||
|
U.S. Operations |
|
$ |
(8,142) |
|
$ |
(7,001) |
|
$ |
(10,389) |
|
|
Foreign Operations, Mexico |
|
|
36,620 |
|
|
16,147 |
|
|
20,842 |
|
|
Total income before income taxes |
|
$ |
28,478 |
|
$ |
9,146 |
|
$ |
10,453 |
|
The Company's income tax expense (benefit) from continuing operations consists of the following:
|
|
|
Years ended December 31, |
|
|||||||
|
|
|
2017 |
|
2016 |
|
2015 |
|
|||
|
|
|
(in thousands) |
|
|||||||
|
Current taxes: |
|
|
|
|||||||
|
Federal |
|
$ |
9 |
|
$ |
353 |
|
$ |
353 |
|
|
State |
|
|
- |
|
|
- |
|
|
- |
|
|
Foreign |
|
|
9,327 |
|
|
5,961 |
|
|
1,905 |
|
|
Total current taxes |
|
$ |
9,336 |
|
$ |
6,314 |
|
$ |
2,258 |
|
|
|
|
|
|
|
|
|
|
|
|
|
|
Deferred taxes: |
|
|
|
|
|
|
|
|
|
|
|
Federal |
|
$ |
4,923 |
|
$ |
(1,715) |
|
$ |
(1,396) |
|
|
State |
|
|
- |
|
|
- |
|
|
- |
|
|
Foreign |
|
|
10,069 |
|
|
160 |
|
|
6,529 |
|
|
Total deferred taxes |
|
$ |
14,992 |
|
$ |
(1,555) |
|
$ |
5,133 |
|
|
Total income tax provision |
|
$ |
24,328 |
|
$ |
4,759 |
|
$ |
7,391 |
|
The provision for income taxes for the years ended December 31, 2017, 2016 and 2015, differs from the amount of income tax determined by applying the applicable United States statutory federal income tax rate to pre-tax income from operations as a result of the following differences:
|
|
|
Years Ended December 31, |
|
|||||||
|
|
|
2017 |
|
2016 |
|
2015 |
|
|||
|
|
|
(in thousands) |
|
|||||||
|
Tax at statutory rates |
|
$ |
9,967 |
|
$ |
3,110 |
|
$ |
3,554 |
|
|
Foreign rate differential |
|
|
(1,780) |
|
|
(617) |
|
|
(819) |
|
|
Dividends, net of foreign tax credits |
|
|
- |
|
|
795 |
|
|
267 |
|
|
One-time tax on foreign unremitted earnings (Tax Act) |
|
|
4,627 |
|
|
|
|
|
|
|
|
Changes in deferred tax assets |
|
|
6,239 |
|
|
(625) |
|
|
2,600 |
|
|
Mexico mining tax |
|
|
2,816 |
|
|
1,270 |
|
|
1,103 |
|
|
U.S. Tax rate reduction from 35% to 21% (Tax Act) |
|
|
2,671 |
|
|
- |
|
|
- |
|
|
Other |
|
|
(212) |
|
|
826 |
|
|
686 |
|
|
Tax provision |
|
$ |
24,328 |
|
$ |
4,759 |
|
$ |
7,391 |
|
65
The following table sets forth deferred tax assets and liabilities:
|
|
|
At December 31, |
|
||||
|
|
|
2017 |
|
2016 |
|
||
|
|
|
|
(in thousands) |
|
|||
|
Non-current deferred tax assets: |
|
|
|
|
|
|
|
|
Tax loss carryforward - U.S. |
|
$ |
1,450 |
|
$ |
1,466 |
|
|
Property and equipment |
|
|
1,935 |
|
|
11,879 |
|
|
Stock-based compensation |
|
|
4,622 |
|
|
7,128 |
|
|
Foreign tax credits |
|
|
4,185 |
|
|
3,029 |
|
|
Other |
|
|
2,284 |
|
|
2,200 |
|
|
Total deferred tax assets |
|
|
14,476 |
|
|
25,702 |
|
|
Valuation allowance |
|
|
(6,720) |
|
|
(2,507) |
|
|
Deferred tax assets after valuation allowance |
|
$ |
7,756 |
|
$ |
23,195 |
|
|
|
|
|
|
|
|
|
|
|
Long-term deferred tax liability |
|
|
(902) |
|
|
(5,615) |
|
|
|
|
|
|
|
|
|
|
|
Net deferred tax asset |
|
$ |
6,854 |
|
$ |
17,580 |
|
Mexico Mining Taxation
Mining entities in Mexico are subject to two mining duties, in addition to the 30% Mexico corporate income tax: (i) a “special” mining duty of 7.5% of taxable income as defined under Mexican tax law (also referred to as “mining royalty tax”) on extracting activities performed by concession holders and (ii) the “extraordinary” mining duty of 0.5% on the gross revenue from the sale of gold, silver and platinum. The mining royalty tax is generally applicable to earnings before income tax, depreciation, depletion, amortization, and interest. In calculating the mining royalty tax, there are no deductions related to depreciable costs from operational fixed assets, but exploration and prospecting depreciable costs are deductible when incurred. Both duties are tax deductible for income tax purposes. As a result, our effective tax rate applicable to the Company’s Mexican operations is substantially higher than Mexico statutory rate.
Other Tax Disclosures
The Company evaluates the evidence available to determine whether a valuation allowance is required on the deferred tax assets. The Company determined that the deferred tax assets related to the foreign tax credits, the state net operating loss carry forwards, and other state related deferred tax assets were not "more likely than not" to be realized and a full valuation allowance was recorded as of December 31, 2017.
As a result of the adoption of ASU 2016-09 in the first quarter of 2017, excess tax benefits and tax deficiencies will be prospectively classified to the statement of operations instead of additional paid-in capital. Upon adoption, the Company recorded a $4.2 million deferred tax asset related to previously unrecognized foreign tax credits but placed a valuation allowance against the full amount of the deferred tax asset due to the Company’s assessment of the realizability of these foreign tax credits. Thus, no net impact to the financial statements was generated as a result of adoption of ASU 2016-09.
During the year ended December 31, 2017, the Company revised its temporary book and tax differences in the basis of its Isabella Pearl property, included in its Walker Lane Minerals Corp. acquisition which resulted in a $4.2 million increase in deferred tax assets, net, and a corresponding decrease in property, plant and mine development.
At December 31, 2017, the Company has U.S. tax loss carry-forward deferred tax assets approximating $1.5 million, which expire between 2021 and 2037, and foreign tax credits of $4.2 million that expire between 2023 and 2026.
During 2016 the Company concluded a tax examination by the Mexican tax authorities of the 2012 and 2013 income tax returns with no adjustments to income taxes being recorded.
66
As of both December 31, 2017 and 2016, the Company believes that it has no uncertain tax positions. If the Company were to determine there was an uncertain tax position, the Company would recognize the liability and related interest and penalties within income tax expense.
6. Prepaid Expenses and Other Current Assets
At December 31, 2017 and 2016, prepaid expenses and other current assets consisted of the following:
|
|
|
2017 |
|
2016 |
||
|
|
|
(in thousands) |
||||
|
Advances to suppliers |
|
$ |
163 |
|
$ |
122 |
|
Prepaid insurance |
|
|
869 |
|
|
531 |
|
Vendor deposits |
|
|
501 |
|
|
218 |
|
IVA taxes receivable, net |
|
|
- |
|
|
489 |
|
Other current assets |
|
|
234 |
|
|
227 |
|
Total |
|
$ |
1,767 |
|
$ |
1,587 |
|
(1) |
|
7. Property, Plant and Mine Development, net
At December 31, 2017 and 2016, property, plant and mine development consisted of the following:
|
|
|
2017 |
|
2016 |
||
|
|
|
(in thousands) |
||||
|
Asset retirement costs |
|
$ |
1,079 |
|
$ |
637 |
|
Construction-in-progress |
|
|
10,838 |
|
|
586 |
|
Furniture and office equipment |
|
|
1,664 |
|
|
1,580 |
|
Land |
|
|
242 |
|
|
230 |
|
Light vehicles and other mobile equipment |
|
|
2,211 |
|
|
1,914 |
|
Machinery and equipment |
|
|
22,916 |
|
|
20,293 |
|
Mill facilities and infrastructure |
|
|
10,075 |
|
|
9,643 |
|
Mineral interests and mineral rights (1) |
|
|
17,658 |
|
|
19,413 |
|
Mine development |
|
|
56,957 |
|
|
42,951 |
|
Software and licenses |
|
|
1,678 |
|
|
1,624 |
|
Subtotal (2) (3) |
|
|
125,318 |
|
|
98,871 |
|
Accumulated depreciation and amortization |
|
|
(42,719) |
|
|
(28,812) |
|
Total |
|
$ |
82,599 |
|
$ |
70,059 |
|
(1) |
During the year ended December 31, 2017, the Company revised its temporary book and tax differences in the basis of its Isabella Pearl property, which resulted in a $4.2 million decrease in property, plant and mine development, net and a corresponding increase in deferred tax assets, net. |
|
(2) |
Includes $1.6 million and nil of assets recorded under capital leases at December 31, 2017 and 2016. Please see Note 11 for additional information. |
|
(3) |
Includes accrued capital expenditures of $1.0 million and nil at December 31, 2017 and 2016, respectively. |
The Company recorded depreciation and amortization expense for years ended December 31, 2017, 2016 and 2015 of $15.0 million, $12.6 million and $9.1 million, respectively.
67
8. Accrued Expenses and Other Current Liabilities
At December 31, 2017 and 2016, accrued expenses and other current liabilities consisted of the following:
|
|
|
2017 |
|
2016 |
||
|
|
|
(in thousands) |
||||
|
Accrued insurance |
|
$ |
662 |
|
$ |
381 |
|
Accrued royalty payments |
|
|
1,805 |
|
|
1,043 |
|
Dividends payable |
|
|
95 |
|
|
94 |
|
IVA taxes payable, net |
|
|
274 |
|
|
- |
|
Other payables |
|
|
15 |
|
|
8 |
|
Total |
|
$ |
2,851 |
|
$ |
1,526 |
9. Reclamation and Remediation
The following table presents the changes in the Company’s reclamation and remediation obligations for the years ended December 31, 2017 and 2016:
|
|
|
2017 |
|
2016 |
||
|
|
|
(in thousands) |
||||
|
Reclamation liabilities – balance at beginning of period |
|
$ |
1,907 |
|
$ |
2,192 |
|
Changes in estimate |
|
|
10 |
|
|
82 |
|
Foreign currency exchange loss (gain) |
|
|
88 |
|
|
(367) |
|
Reclamation liabilities – balance at end of period |
|
|
2,005 |
|
|
1,907 |
|
|
|
|
|
|
|
|
|
Asset retirement obligation – balance at beginning of period |
|
|
518 |
|
|
623 |
|
Changes in estimate |
|
|
366 |
|
|
(21) |
|
Accretion expense |
|
|
35 |
|
|
23 |
|
Foreign currency exchange loss (gain) |
|
|
22 |
|
|
(107) |
|
Asset retirement obligation – balance at end of period |
|
|
941 |
|
|
518 |
|
Total period end balance |
|
$ |
2,946 |
|
$ |
2,425 |
The Company’s reclamation and remediation obligations as of December 31, 2017 and 2016 were discounted using a discount rate of 8%.
10. Loan Payable
On August 8, 2017, the Company entered into a 48-month loan agreement in the amount of $2.4 million for the purchase of certain equipment. The loan bears annual interest of 4.48%, is collateralized by the equipment, and requires monthly principal and interest payments of $0.05 million. As of December 31, 2017, there is an outstanding balance of $2.2 million. Scheduled minimum repayments are $0.6 million in 2018, $0.6 million in 2019, $0.6 million in 2020, and $0.4 million in 2021. The Company is subject to a prepayment penalty, ranging from 1% to 3% of the outstanding loan balance at time of full repayment, depending on time of repayment.
68
11. Capital Lease
On November 13, 2017, the Company entered into a 48-month capital lease agreement in the amount of $1.6 million for certain equipment. The lease bears annual imputed interest of 5.95% and requires monthly principal, interest, and sales tax payments of $0.04 million. Scheduled minimum annual payments as of December 31, 2017 are as follows (in thousands):
|
Year Ending December 31: |
|
|
|
|
2018 |
|
$ |
461 |
|
2019 |
|
|
461 |
|
2020 |
|
|
461 |
|
2021 |
|
|
397 |
|
Total minimum obligations |
|
|
1,780 |
|
Interest portion |
|
|
(180) |
|
Present value of net minimum payments |
|
|
1,600 |
|
Less: current portion |
|
|
(382) |
|
Non-current portion |
|
$ |
1,218 |
12. Commitments and Contingencies
Operating leases
The Company leases its office in Colorado Springs from a related party under a non-cancelable operating lease which expires in 2018. The Company also leases an office in Denver, Colorado consisting of approximately 2,500 square feet, which was renewed in 2015 for three years. The Company’s Mexican subsidiary leases office space in Oaxaca City, Oaxaca. The subsidiary entered into a ten-year lease commencing January 1, 2012. Future minimum lease payments under operating leases are as follows:
|
|
|
Payments due by Period |
|
||||||||||||||||
|
|
|
Total |
|
2018 |
|
2019 |
|
2020 |
|
2021 |
|
2022 and |
|
||||||
|
|
|
(in thousands) |
|
||||||||||||||||
|
Operating leases |
|
$ |
397 |
|
$ |
164 |
|
$ |
87 |
|
$ |
74 |
|
$ |
72 |
|
$ |
- |
|
Other Commitments
As of December 31, 2017, the Company has equipment purchase commitments aggregating approximately $3.8 million.
13. Shareholders’ Equity
The Company declared and paid dividends of $1.1 million during the year ended December 31, 2017. During the year ended December 31, 2016, the Company declared and paid dividends of $1.7 million. During the year ended December 31, 2015, the Company declared dividends of $6.1 million and paid dividends of $6.5 million.
On January 6, 2017, the Company issued 59,642 shares of common stock as partial consideration for additional mineral rights for its Isabella Pearl project. At the time of issuance, the shares were valued at $5.03 per share, for an aggregate value of $0.3 million.
On January 17, 2017, the Company issued 186,568 shares of common stock as partial consideration for mineral rights at the East Camp Douglas property. At the time of issuance, the shares were valued at $5.36 per share, for an aggregate value of $1.0 million.
69
During the year ended December 31, 2016, the Company issued 130,169 shares of common stock as partial consideration for mineral rights at the Mina Gold property. At the time of issuance, the shares were valued at $6.53 per share, for an aggregate value of $0.9 million. Please see Note 2 for more information.
During the year ended December 31, 2016, the Company issued 2,000,000 shares of common stock as partial consideration for its acquisition of Walker Lane. Please see Note 2 for more information.
In 2011, the Board of Directors approved a share repurchase program pursuant to which the Company may repurchase up to $20.0 million of its common stock from time to time in market transactions. There is no pre-determined end date associated with the share repurchase program. During 2017, 2016 and 2015, the Company did not repurchase any additional shares of common stock.
14. Embedded Derivatives
Concentrate sales contracts contain embedded derivatives due to the provisional pricing terms for unsettled shipments. At the end of each reporting period, the Company records an adjustment to accounts receivable and revenue to reflect the mark-to-market adjustments for outstanding provisional invoices based on metal forward prices. Please see Note 19 for additional information.
The following table summarizes the Company’s unsettled sales contracts at December 31, 2017, with the quantities of metals under contract subject to final pricing occurring through February 2018:
|
|
|
|
Gold |
|
|
Silver |
|
|
Copper |
|
|
Lead |
|
|
Zinc |
|
|
|
|
(ounces) |
|
|
(ounces) |
|
|
(tonnes) |
|
|
(tonnes) |
|
|
(tonnes) |
|
Under contract |
|
|
9,434 |
|
|
706,199 |
|
|
437 |
|
|
2,148 |
|
|
6,490 |
|
Average forward (price per ounce or tonne) |
|
$ |
1,286 |
|
$ |
16.87 |
|
$ |
6,754 |
|
$ |
2,462 |
|
$ |
3,057 |
15. Employee Benefits
Effective October 2012, the Company adopted a profit sharing plan (the “Plan”) which covers all U.S. employees. The Plan meets the requirements of a qualified retirement plan pursuant to the provisions of Section 401(k) of the Internal Revenue Code. The Plan provides eligible employees the opportunity to make tax deferred contributions to a retirement trust account up to 45% of their qualified wages, subject to the IRS annual maximums. Any matching contribution by the Company on behalf of the employee is immediately vested; the matching contribution expense amounted to $0.1 million in 2017, $0.1 million in 2016 and $0.2 million in 2015. The unfunded matching contribution obligation was nil for the year ended December 31, 2017.
16. Stock-Based Compensation
During 2016, the Company replaced its Amended and Restated Stock Option and Stock Grant Plan (the “Prior Plan”) with the Gold Resource Corporation 2016 Equity Incentive Plan (the “Incentive Plan”). The Incentive Plan provides for the issuance of five million shares of common stock in the form of incentive and non-qualified stock options, stock appreciation rights, RSUs, stock grants, stock units, performance shares, performance share units and performance cash. Additionally, pursuant to the terms of the Incentive Plan, any award outstanding under the Prior Plan that is terminated, expired, forfeited, or canceled for any reason, will be available for grant under the Incentive Plan.
A total of 416,000 options with a term of 10 years were granted during the year ended December 31, 2017, of which 37,000 vested immediately and the remainder vest over a three-year period. A total of 105,945 RSUs were granted during the year ended December 31, 2017, of which 14,964 vest within six months and the remainder vest over a three- year period.
70
Stock Options
A summary of stock option activity under the Incentive Plan for the years ended December 31, 2017 and 2016 is presented below:
|
|
|
Shares |
|
Weighted |
|
Weighted Average |
|
Aggregate |
|
||
|
Outstanding as of December 31, 2015 |
|
5,550,000 |
|
$ |
7.75 |
|
5.10 |
|
$ |
- |
|
|
Granted |
|
717,000 |
|
|
3.85 |
|
- |
|
|
|
|
|
Exercised |
|
(169,999) |
|
|
2.30 |
|
- |
|
|
|
|
|
Expired |
|
- |
|
|
- |
|
- |
|
|
|
|
|
Forfeited |
|
(48,000) |
|
|
3.16 |
|
- |
|
|
|
|
|
Outstanding as of December 31, 2016 |
|
6,049,001 |
|
$ |
7.48 |
|
5.36 |
|
$ |
3,963 |
|
|
Granted |
|
416,000 |
|
|
4.08 |
|
- |
|
|
|
|
|
Exercised |
|
(25,000) |
|
|
2.30 |
|
- |
|
|
|
|
|
Expired |
|
(195,000) |
|
|
8.99 |
|
- |
|
|
|
|
|
Forfeited |
|
- |
|
|
- |
|
- |
|
|
|
|
|
Outstanding as of December 31, 2017 |
|
6,245,001 |
|
$ |
7.23 |
|
4.68 |
|
$ |
4,040 |
|
|
|
|
|
|
|
|
|
|
|
|
|
|
|
Vested and exercisable as of December 31, 2017 |
|
5,181,995 |
|
$ |
7.99 |
|
3.87 |
|
$ |
3,035 |
|
The weighted-average fair value of options granted during the years ended December 31, 2017, 2016, and 2015 was $2.25, $1.96 and $0.78, respectively. The total intrinsic value of options exercised during the years ended December 31, 2017 and 2016, was $0.1 million and $0.6 million, respectively. There were no options exercised during the year ended December 31, 2015. The total fair value of options vested during the years ended December 31, 2017, 2016 and 2015 was $0.8 million, $1.3 million and $4.7 million, respectively.
The Company received nil and $0.4 million in cash proceeds from options exercised during 2017 and 2016, respectively.
The following table summarizes information about stock options outstanding at December 31, 2017:
|
|
|
Outstanding |
|
Exercisable |
|
||||||||
|
Range of Exercise Prices |
|
Number of |
|
Weighted Average |
|
Weighted |
|
Number of |
|
Weighted |
|
||
|
$0.00 - $6.25 |
|
3,975,001 |
|
4.67 |
|
$ |
3.41 |
|
2,911,995 |
|
$ |
3.37 |
|
|
$6.25 -$12.50 |
|
810,000 |
|
4.56 |
|
$ |
8.75 |
|
810,000 |
|
$ |
8.75 |
|
|
$12.50 - $18.75 |
|
1,340,000 |
|
4.77 |
|
$ |
16.46 |
|
1,340,000 |
|
$ |
16.46 |
|
|
$18.75 - $25.00 |
|
120,000 |
|
4.68 |
|
$ |
20.51 |
|
120,000 |
|
$ |
20.51 |
|
|
|
|
6,245,001 |
|
4.68 |
|
$ |
7.23 |
|
5,181,995 |
|
$ |
7.99 |
|
The assumptions used to determine the value of stock-based awards under the Black-Scholes method are summarized below:
|
|
|
Year ended December 31, |
|
|
||||
|
|
|
2017 |
|
2016 |
|
2015 |
|
|
|
Risk-free interest rate |
|
1.94 |
% |
0.87 |
% |
1.03 |
% |
|
|
Dividend yield |
|
0.53 |
% |
0.46 |
% |
5.2 |
% |
|
|
Expected volatility |
|
67.70 |
% |
62.74 |
% |
58.79 |
% |
|
|
Expected life in years |
|
5 |
|
5 |
|
5 |
|
|
71
Restricted Stock Units
A summary of RSU activity under the Incentive Plan for the years ended December 31, 2017 and 2016 is presented below:
|
|
|
Shares |
|
Weighted |
|
Weighted Average |
|
Aggregate |
|
||
|
Nonvested as of December 31, 2015 |
|
- |
|
$ |
- |
|
- |
|
$ |
- |
|
|
Granted |
|
188,803 |
|
|
- |
|
- |
|
|
|
|
|
Vested |
|
- |
|
|
- |
|
- |
|
|
|
|
|
Expired |
|
- |
|
|
- |
|
- |
|
|
|
|
|
Forfeited |
|
(7,065) |
|
|
- |
|
- |
|
|
|
|
|
Nonvested as of December 31, 2016 |
|
181,738 |
|
$ |
- |
|
1.82 |
|
$ |
791 |
|
|
Granted |
|
105,945 |
|
|
- |
|
- |
|
|
|
|
|
Vested |
|
(78,400) |
|
|
- |
|
- |
|
|
|
|
|
Expired |
|
- |
|
|
- |
|
- |
|
|
|
|
|
Forfeited |
|
- |
|
|
- |
|
- |
|
|
|
|
|
Nonvested as of December 31, 2017 |
|
209,283 |
|
$ |
- |
|
1.91 |
|
$ |
920 |
|
The weighted-average fair value of RSUs granted during the years ended December 31, 2017 and 2016, was $4.11 and $4.60, respectively. There were no RSUs granted in 2015. The total intrinsic value of RSUs vested during the years ended December 31, 2017, 2016, and 2015 was $0.3 million, nil and nil, respectively.
Stock-Based Compensation Expense
Stock-based compensation expense for stock options and RSUs is as follows:
|
|
|
Year ended December 31, |
|
|||||||
|
|
|
2017 |
|
2016 |
|
2015 |
|
|||
|
|
|
(in thousands) |
|
|||||||
|
Stock options |
|
$ |
829 |
|
$ |
1,036 |
|
$ |
3,472 |
|
|
Restricted stock units |
|
|
363 |
|
|
204 |
|
|
- |
|
|
Total |
|
$ |
1,192 |
|
$ |
1,240 |
|
$ |
3,472 |
|
|
|
|
|
|
|
|
|
|
|
|
|
Total stock-based compensation related to stock options and RSUs has been allocated between production costs, general and administrative expenses, and exploration expense as follows:
|
|
|
Year ended December 31, |
|||||||
|
|
|
2017 |
|
2016 |
|
2015 |
|||
|
|
|
(in thousands) |
|||||||
|
Production costs |
|
$ |
99 |
|
$ |
186 |
|
$ |
1,073 |
|
General and administrative expenses |
|
|
1,029 |
|
|
1,040 |
|
|
2,399 |
|
Exploration expense |
|
|
64 |
|
|
14 |
|
|
- |
|
Total |
|
$ |
1,192 |
|
$ |
1,240 |
|
$ |
3,472 |
The estimated unrecognized stock-based compensation expense from unvested options and RSUs as of December 31, 2017 was approximately $2.2 million and $1.1 million, respectively, and is expected to be recognized over the remaining vesting periods of up to three years.
72
17. Other Expense (Income), Net
During the years ended December 31, 2017, 2016 and 2015, other expense (income) consisted of the following:
|
|
|
Year ended December 31, |
|||||||
|
|
|
2017 |
|
2016 |
|
2015 |
|||
|
|
|
(in thousands) |
|||||||
|
Unrealized currency exchange loss (gain) |
|
$ |
983 |
|
$ |
(267) |
|
$ |
(256) |
|
Realized currency exchange (gain) loss |
|
|
(457) |
|
|
(261) |
|
|
246 |
|
Unrealized (gain) loss from gold and silver rounds/bullion, net (1) |
|
|
(493) |
|
|
(411) |
|
|
420 |
|
(Gain) loss from sale of investments, net (1) |
|
|
- |
|
|
(348) |
|
|
1,989 |
|
Loss on disposal of fixed assets |
|
|
474 |
|
|
578 |
|
|
144 |
|
Gain on insurance reimbursement |
|
|
- |
|
|
(620) |
|
|
- |
|
Increase (decrease) in reserve for inventory obsolescence |
|
|
106 |
|
|
545 |
|
|
(125) |
|
Other expense |
|
|
553 |
|
|
224 |
|
|
48 |
|
Total |
|
$ |
1,166 |
|
$ |
(560) |
|
$ |
2,466 |
|
(1) |
Gains and losses due to changes in fair value are non-cash in nature until such time that they are realized through cash transactions. During 2016, the Company sold its current investment in equity and realized a gain of $348. For additional information regarding our fair value measurements and investments, please see Note 19. |
18. Net Income per Common Share
Basic earnings per common share is calculated based on the weighted average number of common shares outstanding for the period. Diluted earnings per common share is calculated based on the assumption that stock options outstanding, which have an exercise price less than the average market price of the Company’s common shares during the period, would have been exercised on the later of the beginning of the period or the date granted and that the funds obtained from the exercise were used to purchase common shares at the average market price during the period. All the Company’s restricted stock units are considered to be dilutive.
The effect of the Company’s dilutive securities is calculated using the treasury stock method and only those instruments that result in a reduction in net income per common share are included in the calculation. Options to purchase 3.1 million, 2.8 million, and 4.3 million shares of common stock at weighted average exercise prices of $11.26, $12.39, and $9.34 were outstanding as of December 31, 2017, 2016, and 2015, respectively, but were not included in the computation of diluted weighted average common shares outstanding, as the exercise price of the options exceeded the average price of the Company’s common stock during those periods, and therefore were anti-dilutive.
Basic and diluted net income per common share is calculated as follows:
|
|
|
Year ended December 31, |
|
|||||||
|
|
|
2017 |
|
2016 |
|
2015 |
|
|||
|
Net income (in thousands) |
|
$ |
4,150 |
|
$ |
4,387 |
|
$ |
3,062 |
|
|
Basic weighted average shares of common stock outstanding |
|
|
56,854,670 |
|
|
55,140,237 |
|
|
54,186,547 |
|
|
Dilutive effect of share-based awards |
|
|
740,323 |
|
|
584,969 |
|
|
72,765 |
|
|
Diluted weighted average common shares outstanding |
|
|
57,594,993 |
|
|
55,725,206 |
|
|
54,259,312 |
|
|
Net income per share: |
|
|
|
|
|
|
|
|
|
|
|
Basic and diluted |
|
$ |
0.07 |
|
$ |
0.08 |
|
$ |
0.06 |
|
73
19. Fair Value Measurement
Fair value accounting establishes a fair value hierarchy that prioritizes the inputs to valuation techniques used to measure fair value. The hierarchy gives the highest priority to unadjusted quoted prices in active markets for identical assets or liabilities (Level 1 measurements) and the lowest priority to unobservable inputs (Level 3 measurements). The three levels of the fair value hierarchy are described below:
Level 1Unadjusted quoted prices in active markets that are accessible at the measurement date for identical, unrestricted assets or liabilities;
Level 2Quoted prices in markets that are not active, or inputs that are observable, either directly or indirectly, for substantially the full term of the asset or liability; and
Level 3Prices or valuation techniques that require inputs that are both significant to the fair value measurement and unobservable (supported by little or no market activity.)
As required by accounting guidance, assets are classified in their entirety based on the lowest level of input that is significant to the fair value measurement. The following tables set forth certain of the Company’s assets measured at fair value by level within the fair value hierarchy as of December 31, 2017 and 2016:
|
|
|
2017 |
|
2016 |
|
Input Hierarchy Level |
||
|
|
|
(in thousands) |
|
|||||
|
Cash and cash equivalents: |
|
|
|
|
|
|
|
|
|
Bank deposits |
|
$ |
22,390 |
|
$ |
14,166 |
|
Level 1 |
|
Gold and silver rounds/bullion |
|
|
3,812 |
|
|
3,307 |
|
Level 1 |
|
Accounts receivable: |
|
|
|
|
|
|
|
|
|
Receivables from provisional concentrate sales |
|
|
2,884 |
|
|
630 |
|
Level 2 |
|
|
|
$ |
29,086 |
|
$ |
18,103 |
|
|
Cash and cash equivalents consist primarily of cash deposits and are valued at cost, which approximates fair value. Gold and silver rounds/bullion consist of precious metals used for investment purposes and in the dividend program which are valued using quoted market prices. Please see Note 3 for additional information. The Company determined that it was not practicable to estimate the fair value of its non-current investment in equity securities of $0.2 million and as such, it is reported at cost. There have been no events or changes in circumstances that may have a significant adverse effect on the investment.
Trade accounts receivable include amounts due to the Company for shipments of concentrates and doré sold to customers. Concentrate sales contracts provide for provisional pricing as specified in such contracts. These sales contain an embedded derivative related to the provisional pricing mechanism which is bifurcated and accounted for as a derivative. At the end of each reporting period, the Company records an adjustment to sales to reflect the mark-to-market of outstanding provisional invoices based on the forward price curve. Because these provisionally priced sales have not yet settled as of the reporting date, the mark-to-market adjustment related to these invoices is included in accounts receivable as of each reporting date. Please see Note 14 for additional information.
74
Gains and losses related to changes in the fair value of these financial instruments were included in the Company’s consolidated statements of operations as shown in the following table:
|
|
|
Year ended December 31, |
|
|
|
|||||||
|
|
|
2017 |
|
2016 |
|
2015 |
|
Statement of Income Classification |
|
|||
|
|
|
(in thousands) |
|
|
|
|||||||
|
Derivative gain |
|
$ |
1,364 |
|
$ |
473 |
|
$ |
463 |
|
Sales, net |
|
|
Gold and silver rounds/bullion (gain) loss |
|
$ |
(282) |
|
$ |
(411) |
|
$ |
420 |
|
Other expense (income), net |
|
|
Investment (gain) loss |
|
$ |
- |
|
$ |
(351) |
|
$ |
1,989 |
|
Other expense (income), net |
|
20. Supplementary Cash Flow Information
During the years ended December 31, 2017, 2016, and 2015, other operating adjustments and write-downs within the net cash provided by operations on the statement of cash flows consisted of the following:
|
|
|
2017 |
|
2016 |
|
2015 |
|||
|
|
|
(in thousands) |
|||||||
|
Unrealized (gain) loss on gold and silver rounds/bullion |
|
$ |
(493) |
|
$ |
(411) |
|
$ |
420 |
|
Unrealized foreign currency exchange loss (gain) |
|
|
983 |
|
|
(267) |
|
|
(256) |
|
Unrealized loss on equity investments |
|
|
- |
|
|
- |
|
|
1,989 |
|
Gain on sale of investments |
|
|
- |
|
|
(348) |
|
|
- |
|
Loss on disposition of fixed assets |
|
|
474 |
|
|
578 |
|
|
144 |
|
Deferred charge |
|
|
- |
|
|
- |
|
|
86 |
|
Increase (decrease) in reserve for inventory obsolescence |
|
|
106 |
|
|
545 |
|
|
(125) |
|
Other |
|
|
215 |
|
|
201 |
|
|
616 |
|
Total other operating adjustments |
|
$ |
1,285 |
|
$ |
298 |
|
$ |
2,874 |
21. Segment Reporting
The Company has organized its operations into two geographic regions. The geographic regions include Oaxaca, Mexico and Nevada, U.S.A. and represent the Company’s operating segments. During the first quarter of 2017, the Company made decisions about resources to be allocated to the operating segments. As a result, these operating segments represent the Company’s reportable segments. The 2017 and 2016 segment information is also presented below. Operations in Nevada during 2015 were neither significant or material and as such the segment information is not presented.
75
The financial information relating to the Company’s segments is as follows (in thousands):
|
|
|
Mexico |
|
Nevada |
|
Corporate and Other |
|
Consolidated |
||||
|
Year ended December 31, 2017 |
|
|
|
|
|
|
|
|
|
|
|
|
|
Revenue |
|
$ |
110,156 |
|
$ |
- |
|
$ |
- |
|
$ |
110,156 |
|
Exploration expense |
|
|
1,288 |
|
|
2,916 |
|
|
145 |
|
|
4,349 |
|
Net income (loss) |
|
|
20,379 |
|
|
(2,423) |
|
|
(13,806) |
|
|
4,150 |
|
Capital expenditures (1) |
|
|
21,760 |
|
|
10,087 |
|
|
9 |
|
|
31,856 |
|
|
|
|
|
|
|
|
|
|
|
|
|
|
|
|
|
Mexico |
|
Nevada |
|
Corporate and Other |
|
Consolidated |
||||
|
Year ended December 31, 2016 |
|
|
|
|
|
|
|
|
|
|
|
|
|
Revenue |
|
$ |
83,227 |
|
$ |
- |
|
$ |
- |
|
$ |
83,227 |
|
Exploration expense |
|
|
1,992 |
|
|
2,057 |
|
|
265 |
|
|
4,314 |
|
Net income (loss) |
|
|
14,705 |
|
|
(1,292) |
|
|
(9,026) |
|
|
4,387 |
|
Capital expenditures (2) |
|
|
12,356 |
|
|
13,956 |
|
|
170 |
|
|
26,482 |
|
|
|
|
|
|
|
|
|
|
|
|
|
|
|
(1) |
Includes an increase in accrued capital expenditures of $1,041 and non-cash additions of $5,383; consolidated capital expenditures on a cash basis were $25,432. |
|
(2) |
Includes a decrease in accrued capital expenditures of $2,868 and non-cash additions of $14,210; consolidated capital expenditures on a cash basis were $15,140. |
Total asset balances, excluding intercompany balances at December 31, 2017 and December 31, 2016 are as follows:
|
|
|
2017 |
|
2016 |
||
|
|
|
(in thousands) |
||||
|
Mexico |
|
$ |
87,739 |
|
$ |
79,677 |
|
Nevada |
|
|
25,741 |
|
|
15,122 |
|
Corporate and Other |
|
|
19,443 |
|
|
23,644 |
|
Consolidated |
|
$ |
132,923 |
|
$ |
118,443 |
22. Quarterly Financial Data (Unaudited)
The following represents selected information from the unaudited quarterly consolidated statements of operations for the years ended December 31, 2017 and 2016:
|
|
|
2017 |
|
||||||||||
|
|
|
First Quarter |
|
Second Quarter |
|
Third Quarter |
|
Fourth Quarter |
|
||||
|
|
|
(in thousands, except per common share data) |
|
||||||||||
|
Sales, net |
|
$ |
24,336 |
|
$ |
21,391 |
|
$ |
31,122 |
|
$ |
33,307 |
|
|
Mine gross profit |
|
$ |
10,416 |
|
$ |
5,226 |
|
$ |
11,201 |
|
$ |
15,272 |
|
|
Net income (loss) |
|
$ |
4,376 |
|
$ |
864 |
|
$ |
4,581 |
|
$ |
(5,671) |
|
|
Net income (loss) per common share: |
|
|
|
|
|
|
|
|
|
|
|
|
|
|
Basic and diluted |
|
$ |
0.08 |
|
$ |
0.02 |
|
$ |
0.08 |
|
$ |
(0.11) |
|
|
Weighted average shares outstanding: |
|
|
|
|
|
|
|
|
|
|
|
|
|
|
Basic |
|
|
56,796,751 |
|
|
56,839,823 |
|
|
56,888,115 |
|
|
56,892,583 |
|
|
Diluted |
|
|
57,991,663 |
|
|
57,375,938 |
|
|
57,455,805 |
|
|
57,452,314 |
|
76
|
|
|
2016 |
|
||||||||||
|
|
|
First Quarter |
|
Second Quarter |
|
Third Quarter |
|
Fourth Quarter |
|
||||
|
|
|
(in thousands, except per common share data) |
|
||||||||||
|
Sales, net |
|
$ |
17,403 |
|
$ |
26,198 |
|
$ |
21,367 |
|
$ |
18,259 |
|
|
Mine gross profit |
|
$ |
3,454 |
|
$ |
12,393 |
|
$ |
5,363 |
|
$ |
1,223 |
|
|
Net income (loss) |
|
$ |
797 |
|
$ |
5,608 |
|
$ |
1,594 |
|
$ |
(3,612) |
|
|
Net income (loss) per common share: |
|
|
|
|
|
|
|
|
|
|
|
|
|
|
Basic and diluted |
|
$ |
0.01 |
|
$ |
0.10 |
|
$ |
0.03 |
|
$ |
(0.06) |
|
|
Weighted average shares outstanding: |
|
|
|
|
|
|
|
|
|
|
|
|
|
|
Basic |
|
|
54,266,706 |
|
|
54,266,706 |
|
|
55,781,382 |
|
|
56,566,874 |
|
|
Diluted |
|
|
54,266,706 |
|
|
54,670,594 |
|
|
57,597,392 |
|
|
57,732,284 |
|
During the fourth quarter of the year ended December 31, 2017, the Company made adjustments to provision for income taxes which had a significant effect on the full year’s results. Please see Note 5 for more information.
ITEM 9. CHANGES IN AND DISAGREEMENTS WITH ACCOUNTANTS ON ACCOUNTING AND FINANCIAL DISCLOSURE
On March 23, 2016, our Audit Committee dismissed KPMG LLP and engaged EKS&H LLLP to serve as our independent registered public accounting firm for the fiscal year ending December 31, 2016. The audit reports of KPMG LLP on our consolidated financial statements as of and for the year ended December 31, 2015, did not contain any adverse opinion or disclaimer of opinion, nor were they qualified or modified as to uncertainty, audit scope, or accounting principles. During the fiscal year ended December 31, 2015, and in the interim period up to March 23, 2016, there were no (1) disagreements between us and KPMG LLP on any matter of accounting principles or practices, financial statement disclosure, or auditing scope or procedures, which disagreements if not resolved to their satisfaction would have caused them to make reference thereto in their reports on the consolidated financial statements for such years, or (2) “reportable events” as that term is defined in Item 304(a)(1)(v) of Regulation S-K.
During the fiscal year ended December 31, 2015, and in the interim period up to March 23, 2016, we have not consulted with EKS&H LLLP regarding either (1) the application of accounting principles to a specified transaction, either completed or proposed, or the type of audit opinion that might be rendered on our consolidated financial statements, and no written report or oral advice was provided by EKS&H LLLP to us that was an important factor considered by us in reaching a decision as to any accounting, auditing or financial reporting issue; or (2) any matter that was the subject of a disagreement (as that term is defined in Item 304(a)(1)(iv) of Regulation S-K and related instructions) or a “reportable event” (as that term is defined in Item 304(a)(1)(v) of Regulation S-K).
ITEM 9A.CONTROLS AND PROCEDURES
Evaluation of Disclosure Controls and Procedures
Our disclosure controls and procedures are designed to ensure that information required to be disclosed in the reports that we file under the Securities Exchange Act of 1934, as amended (the "Exchange Act") is recorded, processed, summarized and reported within the time periods specified in the rules and forms of the Securities and Exchange Commission, and that such information is accumulated and communicated to our management, including our Chief Executive Officer and Chief Financial Officer, as appropriate, to allow timely decisions regarding required disclosure. The Chief Executive Officer and the Chief Financial Officer, with assistance from management, have evaluated the effectiveness of disclosure controls and procedures as of December 31, 2017. Based on that evaluation, the Chief Executive Officer and the Chief Financial Officer have concluded that our disclosure controls and procedures were effective as of December 31, 2017.
Management's Report on Internal Control over Financial Reporting
Management is responsible for establishing and maintaining adequate internal control over financial reporting and
77
for the assessment of the effectiveness of internal control over financial reporting as defined in Rules 13a-15(f) and 15d-15(f) under the Exchange Act. Management assessed the effectiveness of the Company’s internal control over financial reporting as of December 31, 2017, based on the framework set forth by the Committee of Sponsoring Organizations of the Treadway Commission (“COSO”) in Internal Control-Integrated Framework (2013). Based on this assessment, management concluded that our internal control over financial reporting as of December 31, 2017, was effective.
EKS&H LLLP, an independent registered public accounting firm, has audited the consolidated financial statements included in this Annual Report on Form 10-K and, as part of its audit, has issued an opinion on the effectiveness of our internal control over financial reporting which is included as part of Item 8. Financial Statements and Supplementary Data.
Changes in Internal Control over Financial Reporting
There has been no change in our internal control over financial reporting during the fourth quarter ended December 31, 2017 that has materially affected, or is reasonably likely to materially affect, our internal control over financial reporting.
None.
Item 10. Directors, Executive Officers, and Corporate Governance
The information required by this item is incorporated by reference from the information to be contained in our Proxy Statement for the 2018 Annual Meeting of Shareholders (“2018 Proxy Statement”) expected to be filed within 120 days after the end of our fiscal year ended December 31, 2017.
Item 11. Executive Compensation
The information required by this item is incorporated by reference from the information to be contained in our 2018 Proxy Statement.
Item 12. Security Ownership of Certain Beneficial Owners and Management and Related Stockholder Matters
The information required by this item is incorporated by reference from the information to be contained in our 2018 Proxy Statement.
Item 13. Certain Relationships and Related Transactions and Director Independence
The information required by this item is incorporated by reference from the information to be contained in our 2018 Proxy Statement.
Item 14. Principal Accountant Fees and Services
The information required by this item is incorporated by reference from the information to be contained in our 2018 Proxy Statement.
78
ITEM 15. EXHIBITS, FINANCIAL STATEMENT SCHEDULES
|
The following exhibits are filed with or incorporated by referenced in this report:
|
|
|
|
|
|
Item No. |
Description |
|
|
|
|
3.1
|
|
|
|
|
|
3.1.1
|
|
|
|
|
|
3.1.2
|
|
|
|
|
|
3.2
|
|
|
|
|
|
3.2.1
|
|
|
|
|
|
10.1
|
|
|
|
|
|
10.2
|
|
|
|
|
|
10.3
|
|
|
|
|
|
10.4
|
|
|
|
|
|
10.5
|
|
|
|
|
|
10.6
|
|
|
|
|
|
10.7
|
|
|
|
|
|
10.8
|
|
79
|
|
|
|
10.9
|
|
|
|
|
|
10.10
|
|
|
|
|
|
10.11
|
|
|
|
|
|
10.12
|
|
|
|
|
|
10.13
|
|
|
|
|
|
10.14* |
|
|
|
|
|
21* |
|
|
|
|
|
23.1* |
Consent of KPMG LLP, Independent Registered Public Accounting Firm. |
|
|
|
|
23.2* |
Consent of EKS&H, LLLP, Independent Registered Public Accounting Firm. |
|
|
|
|
31.1* |
Certification pursuant to Section 302 of the Sarbanes-Oxley Act of 2002 for Jason D. Reid. |
|
|
|
|
31.2* |
Certification pursuant to Section 302 of the Sarbanes-Oxley Act of 2002 for John A. Labate. |
|
|
|
|
32*
|
|
|
|
|
|
101* |
The following financial statements from the Annual Report on Form 10-K for the year ended December 31, 2017 are furnished herewith, formatted in XBRL: (i) the Consolidated Balance Sheets, (ii) the Consolidated Statements of Operations, (iii) the Consolidated Statements of Changes in Shareholders’ Equity, (iv) the Consolidated Statements of Cash Flows, and (v) the Notes to the Consolidated Financial Statements. |
* filed herewith
None.
80
In accordance with Section 13 or 15(d) of the Exchange Act of 1934, the registrant caused this report to be signed on its behalf by the undersigned, thereunto duly authorized.
|
|
|
|
|
|
GOLD RESOURCE CORPORATION |
|
|
|
|
|
|
Date: March 8, 2018 |
/s/ Jason D. Reid |
|
|
|
By: Jason D. Reid, Chief Executive Officer, |
|
In accordance with the Exchange Act, this Report has been signed below by the following persons on behalf of the Company and in the capacities and on the dates indicated.
|
/s/ Jason D. Reid |
|
Chief Executive Officer, President and Director |
|
March 8, 2018 |
|
|
Jason D. Reid |
|
(Principal Executive Officer) |
|
|
|
|
|
|
|
|
|
|
|
/s/ John A. Labate |
|
Chief Financial Officer |
|
March 8, 2018 |
|
|
John A. Labate |
|
(Principal Financial and Accounting Officer) |
|
|
|
|
|
|
|
|
|
|
|
/s/ Bill M. Conrad |
|
Chairman of the Board of Directors |
|
March 8, 2018 |
|
|
Bill M. Conrad |
|
|
|
|
|
|
/s/ Alex G. Morrison |
|
Director |
|
March 8, 2018 |
|
|
Alex Morrison |
|
|
|
|
|
|
|
|
|
|
|
|
|
/s/ Gary C. Huber |
|
Director |
|
March 8, 2018 |
|
|
Gary C. Huber |
|
|
|
|
|
81