Attached files
| file | filename |
|---|---|
| EX-21.1 - EX-21.1 - ZIX CORP | zixi-ex211_378.htm |
| EX-32.1 - EX-32.1 - ZIX CORP | zixi-ex321_7.htm |
| EX-31.2 - EX-31.2 - ZIX CORP | zixi-ex312_9.htm |
| EX-31.1 - EX-31.1 - ZIX CORP | zixi-ex311_8.htm |
| EX-23.1 - EX-23.1 - ZIX CORP | zixi-ex231_6.htm |
| EX-10.27 - EX-10.27 - ZIX CORP | zixi-ex1027_79.htm |
| EX-10.26 - EX-10.26 - ZIX CORP | zixi-ex1026_80.htm |
| EX-10.25 - EX-10.25 - ZIX CORP | zixi-ex1025_81.htm |
| EX-10.24 - EX-10.24 - ZIX CORP | zixi-ex1024_82.htm |
| EX-10.23 - EX-10.23 - ZIX CORP | zixi-ex1023_83.htm |
| EX-10.22 - EX-10.22 - ZIX CORP | zixi-ex1022_84.htm |
United States
SECURITIES AND EXCHANGE COMMISSION
Washington, D.C. 20549
Form 10-K
(Mark One)
|
☒ |
ANNUAL REPORT PURSUANT TO SECTION 13 OR 15(d) OF THE SECURITIES EXCHANGE ACT OF 1934 |
For the fiscal year ended December 31, 2017
|
☐ |
TRANSITION REPORT PURSUANT TO SECTION 13 OR 15(d) OF THE SECURITIES EXCHANGE ACT OF 1934 |
For the transition period from to
Commission File Number: 0-17995

Zix Corporation
(Exact Name of Registrant as Specified in its Charter)
|
Texas |
75-2216818 |
|
(State or Other Jurisdiction of |
(I.R.S. Employer |
|
Incorporation or Organization) |
Identification Number) |
2711 N. Haskell Avenue, Suite 2200, LB 36, Dallas, Texas 75204-2960
(Address of Principal Executive Offices)
(214) 370-2000
(Registrant’s Telephone Number, Including Area Code)
Securities Registered Pursuant to Section 12(b) of the Act:
|
Title of each class of stock |
Name of each exchange on which registered |
|
Common Stock |
NASDAQ |
|
$0.01 Par Value |
|
Securities Registered Pursuant to Section 12(g) of the Act: None
Indicate by check mark whether the Registrant is a well-known seasoned issuer, as defined in Rule 405 of the Securities Act. Yes ☐ No ☒
Indicate by check mark whether the Registrant is not required to file reports pursuant to Section 13 or Section 15(d) of the Act. Yes ☐ No ☒
Indicate by check mark whether the Registrant: (1) has filed all reports required to be filed by Section 13 or 15(d) of the Securities Exchange Act of 1934 during the preceding 12 months (or for such shorter period that the Registrant was required to file such reports) and (2) has been subject to such filing requirements for the past 90 days. Yes ☒ No ☐
Indicate by check mark whether the Registrant has submitted electronically and posted on its corporate Web site, if any, every Interactive Data File required to be submitted and posted pursuant to Rule 405 of Regulation S-T (§232.405 of this chapter) during the preceding 12 months (or for such shorter period that the registrant was required to submit and post such reports) Yes ☒ No ☐
Indicate by check mark if disclosure of delinquent filers pursuant to Item 405 of Regulation S-K (§229.405 of this chapter) is not contained herein, and will not be contained, to the best of Registrant’s knowledge, in definitive proxy or information statements incorporated by reference in Part III of this Form 10-K or any amendment to this Form 10-K. ☒
Indicate by check mark whether the registrant is a large accelerated filer, an accelerated filer, a non-accelerated filer, or a smaller reporting company. See definitions of “large accelerated filer”, “accelerated filer” and “smaller reporting company” in Rule 12b-2 of the Exchange Act. (Check one):
|
Large accelerated filer |
☐ |
|
Accelerated filer |
☒ |
|
|
|
|
|
|
|
Non-accelerated filer |
☐ |
(Do not check if a smaller reporting company) |
Smaller reporting company |
☐ |
|
Emerging growth company |
☐ |
If an emerging growth company, indicate by check mark if the registrant has elected not to use the extended transition period for complying with any new or revised financial accounting standards provided pursuant to Section 13 (a) of the Exchange Act. ☐
Indicate by check mark whether the registrant is a shell company (as defined in Rule 12b-2 of the Exchange Act). Yes ☐ No ☒
As of March 5, 2018, there were 54,373,952 shares of Zix Corporation $0.01 par value common stock outstanding. As of June 30, 2017, the aggregate market value of the shares of Zix Corporation common stock held by non-affiliates was $312,767,436.
DOCUMENTS INCORPORATED BY REFERENCE
Portions of the Registrant’s 2018 Proxy Statement are incorporated by reference into Part III of this Form 10-K.
TABLE OF CONTENTS
|
|
|
|
|
|
Item 1. |
|
3 |
|
|
Item 1A. |
|
8 |
|
|
Item 1B. |
|
15 |
|
|
Item 2. |
|
15 |
|
|
Item 3. |
|
16 |
|
|
Item 4. |
|
16 |
|
|
|
|
|
|
|
Item 5. |
|
17 |
|
|
Item 6. |
|
18 |
|
|
Item 7. |
|
Management’s Discussion and Analysis of Financial Condition and Results of Operations |
20 |
|
Item 7A. |
|
29 |
|
|
Item 8. |
|
29 |
|
|
Item 9. |
|
Changes in and Disagreements with Accountants on Accounting and Financial Disclosure |
29 |
|
Item 9A. |
|
29 |
|
|
Item 9B. |
|
32 |
|
|
|
|
|
|
|
Item 10. |
|
33 |
|
|
Item 11. |
|
33 |
|
|
Item 12. |
|
Security Ownership of Certain Beneficial Owners and Management and Related Stockholder Matters |
33 |
|
Item 13. |
|
Certain Relationships and Related Transactions, and Director Independence |
33 |
|
Item 14. |
|
33 |
|
|
|
|
|
|
|
Item 15. |
|
34 |
|
|
Item 16. |
|
35 |
|
|
|
|
|
|
2
Zix Corporation (“Zix®,” the “Company,” “we,” “our,” or “us”) offers email encryption, advanced threat protection, archiving, Bring-Your-Own-Device (“BYOD”) security, and data loss prevention (“DLP”) to meet business data protection and compliance needs. Zix customers can purchase any of these solutions on a standalone basis or as a bundled offering for business communication protection. We primarily serve organizations in the healthcare, financial services, insurance and government sectors, including significant federal financial regulators, such as all members of the Federal Financial Institutions Examination Council (“FFIEC”), divisions of the U.S. Treasury, the U.S. Securities and Exchange Commission (“SEC”), more than 30 percent of U.S. banks, more than 30 percent of Blue Cross Blue Shield plans and more than 1,200 U.S. hospitals.
Zix® Email Encryption enables the secure exchange of emails that include sensitive information through a comprehensive secure messaging service, which allows an enterprise to use policy-driven rules to determine which email messages should be sent securely to comply with regulations or company-defined policies.
The main differentiator for Zix Email Encryption in the marketplace is its exceptional ease of use. The best example of this is its ability to provide transparent delivery of encrypted email. Most email encryption solutions are focused on the sender. They typically introduce an added burden on recipients, often requiring additional steps and passwords. We designed our solution to alleviate the recipient’s burden by enabling the delivery of encrypted email automatically and transparently. Zix enables transparent delivery through (1) ZixDirectory®, the world’s largest email encryption community, which is designed to share identities of our tens of millions of members (growing by approximately 170,000 members per week), (2) Zix’s patented Best Method of Delivery®, which is designed to deliver email in the most secure, most convenient method possible for the recipient, and (3) ZixEncryptSM (formerly ZixGateway® and ZixQuarantine SM), which automatically encrypts and decrypts messages with sensitive content. The result is the industry’s most advanced transparent encrypted email, such that secure email can be exchanged without extra steps or passwords for both senders and receivers. Zix delivers more than 1.5 million encrypted messages on a typical business day. On average, 70% of those encrypted messages are exchanged transparently between senders and recipients.
ZixEncrypt also addresses business’s greatest source of data loss – corporate email – with a straightforward DLP approach that decreases the complexity and cost often associated with other DLP solutions. The DLP capabilities of ZixEncrypt are also designed to reduce deployment time from months to hours and minimize impact on customer resources and workflow. In addition, its DLP capabilities offer a convenient experience for both employees interacting with the solution and administrators managing the system.
Leveraging the Company’s leadership and expertise in email encryption, ZixEncrypt uses Zix’s proven policy and content scanning capabilities with quarantine functionality and an intuitive interface, which allow administrators to (1) easily define policies and create custom content filters for quarantining email messages, (2) conveniently manage quarantined messages using flexible searching and filtering options, (3) release or delete individual or multiple quarantined messages with one click, (4) review reports that monitor quarantine activities and trends and (5) automate custom notifications informing employees of quarantined messages.
In March 2017, Zix acquired Greenview Data Inc. (“Greenview”), an email security company. Zix’s acquisition of Greenview addresses increasing buyer demand for email security bundles by adding advanced threat protection, antivirus, anti-spam and archiving capabilities to its industry-leading email encryption. Greenview is a good fit for Zix’s business based on its employees’ expertise in email security and its emphasis on customer success, which align with Zix’s reputation for delivering industry-leading solutions and a superior experience.
Through the acquisition of Greenview, Zix launched two new solutions in April 2017 – ZixProtectSM and ZixArchiveSM. ZixProtect defends organizations from zero-day malware, ransomware, phishing, CEO fraud, W-2 phishing attacks, spam and viruses in email with multi-layer filtering techniques. Accuracy in protecting organizations from email threats is increased further with automated traffic analysis, machine learning and real-time threat analysis.
ZixProtect is available as a cloud-based service in three bundles. ZixProtect Essentials includes email threat protection and business email continuity to enable access to emails during service disruption; ZixProtect Plus adds attachment assurance and time-of-click link defense to provide enhanced protection against sophisticated, targeted threats; and ZixProtect Premium delivers a comprehensive email security solution by including our leading email encryption and data loss prevention with our threat protection capabilities.
ZixArchive is a cost-effective, cloud-based email retention solution that easily enables user retrieval, compliance and eDiscovery. Available as a standalone or add-on solution for ZixEncrypt or ZixProtect bundles, ZixArchive includes policy-based retention, automatic indexing and flexible search capabilities for audit and legal requirements. With on-demand access through the cloud, organizations can conveniently share messages with employees, auditors and outside consultants or legal counsel, as well as revoke access when needed.
3
ZixOne® is a unique mobile email app that solves the key IT challenge created by the BYOD trend in the workplace. BYOD describes the trend of employees using their personal devices to conduct work. ZixOne provides access to corporate email while never allowing that data to be persistently stored on the device where it is vulnerable to loss or theft. If the device is lost or stolen, an administrator can simply disable access to corporate email from that device through ZixOne.
Unlike other BYOD solutions, ZixOne meets employee desire for convenience, control and privacy while giving companies the ability to secure corporate data and meet compliance needs. With seamless access to work email in a secure, simple-to-use environment, employees can stay productive while preserving device independence. A BYOD solution that is acceptable to employees and yet provides strong data protection for corporate data solves one of today’s greatest IT management challenges.
Our business operations and service offerings are supported by the ZixData CenterTM, which is PCI DSS 3.2 certified for applicable services, SOC2 accredited, and SOC3 certified. The operations of the ZixData Center are independently audited annually to maintain AICPA SOC3 certification in the areas of security, confidentiality, integrity and availability. Auditors also produce a SOC2 report on the effectiveness of operational controls used over the audit period. The ZixData Center is staffed 24 hours a day with a track record that exceeds 99.99% availability.
Our company was incorporated in Texas in 1988. Originally named Amtech Corporation, we changed our name to ZixIt® Corporation in 1999 when we entered the encrypted email market. In 2002, we became Zix Corporation, and in 2017, the Company rebranded to Zix. Our executive offices are located at 2711 North Haskell Avenue, Suite 2200, LB 36, Dallas, Texas 75204-2960, (214) 370-2000.
Overview
Email is a mission-critical means of communication for enterprises. However, if email leaves a secure network environment in clear text, it can be intercepted along the path between a sender and a recipient, which permits theft, redirection, manipulation or exposure to unauthorized parties. Failure to control and manage such risks can result in enforcement penalties for noncompliance under numerous regulations, in addition to damaged reputation, competitive disadvantage, a loss of intellectual property or other corporate assets, exposure to negligence or liability claims, and diversion of resources to repair such damage. For example, healthcare organizations, business associates and sub-contractors are subject to the Privacy, Security, and Enforcement Rules of the Health Information Portability and Accountability Act (“HIPAA”) as amended by the Health Information Technology for Economic and Clinical Health Act (“HITECH Act”). Financial institutions are subject to data privacy laws including the Gramm-Leach-Bliley Act (“GLBA”). These federal laws help drive the use of encrypted email. In addition, individual states such as Massachusetts and Nevada have enacted privacy laws requiring the safeguard of personal data, and almost all states encourage email encryption by allowing exemptions from data breach notification laws.
Corporations require easy to use, cost-effective email protection that can be used on an enterprise-wide basis. They need it to be quickly deployed and regularly updated to evolve with innovative technology practices and meet changing regulatory standards. To satisfy these needs, our Email Encryption Service provides a comprehensive solution that analyzes and encrypts email communications.
Our Email Encryption Service allows a user to send encrypted email to any email user anywhere and on any Internet-enabled device. Encrypted email is delivered through the patented Best Method of Delivery protocol which automatically determines the most direct and appropriate means of delivery, based on the sender’s and recipient’s communications environment and preferences. The protocol supports a number of encrypted email delivery mechanisms, including S/MIME, Transport Layer Security (“TLS”), Open Pretty Good Privacy (“PGP”), “push” delivery and secure portal “pull” delivery. These last two mechanisms enable users to send messages securely to anyone with an email address, including those who do not have an encryption tool. Our Best Method of Delivery makes the technology simple for end users and provides flexibility and ease of implementation for information technology professionals. We believe the ability to send messages through different modes of delivery is one of many differentiators that makes our Email Encryption Service superior to competitive offerings.
The deployment of our Email Encryption Service at the periphery of the customer’s network means our Email Encryption Service encrypts outbound email for an enterprise without the need to create, deploy or manage end user encryption keys or deploy desktop software. Our technology solutions are easy to use, easy to deploy, and can be made operational quickly.
Our service has an integrated policy management capability. This policy engine can inspect the contents of emails and apply policies matching specific industry criteria such as HIPAA, the HITECH Act and GLBA. Customers can also build their own custom policies. This policy driven email encryption for regulatory compliance means customers can reduce the training required of their staff and significantly reduce the risk of inadvertently sending sensitive content by controlling the method of delivery through preset policies.
4
Email is the number one communication tool for businesses and it is also one of the top vectors for cyberattacks. Attacks can jeopardize a company through malware, phishing, ransomware, business email compromise, viruses and other threats. Our advanced threat protection solution uses a multi-layer approach to accurately identify email threats and defend against email-borne attacks. Our threat filters first analyze IP addresses and URLs then examine content for targeted phrases, campaign patterns and both known and zero-hour malware attacks. Accuracy is increased further with real-time threat analysts, automated traffic analysis and machine learning.
To safeguard against increasingly targeted and sophisticated attacks, our advanced threat protection can also leverage attachment assurance and time-of-click link defense to provide enhanced protection. Attachment assurance offers quarantine and sandbox inspection of emails to perform forensic analysis of attachments in our secure, cloud-based sandbox environment. Testing efficiently handles evasive attacker techniques while fully examining files for suspicious and malicious activity. Time-of-click link defense reduces the risk of users clicking links in emails and inadvertently visiting malicious or compromised websites. This feature re-writes all full, shortened, or obfuscated links to safe versions and performs time-of-click analysis on the destination address, including IP address and domain blacklists, domain age and reputation, and other checks.
By combining our email encryption and advanced threat protection solutions, Zix meets customers’ increasing desire for a bundled solution that protects inbound and outbound email with leading email security.
Competition
The most significant differentiators for Zix as compared with our competition is ease of use and exceptional support. The best example of our unequalled ease of use is transparent delivery of encrypted email messages. We are able to deliver transparent email encryption as a result of our ZixDirectory, Best Method of Delivery and ZixEncrypt. The most critical and highly differentiated component of our solution is the ZixDirectory which provides the ability to share user identities for encryption, and in turn provides frictionless interoperability between users in a community of interest such as healthcare, finance or government.
Our capability to offer interoperability is particularly important when it is necessary to communicate with external networks, as is the case with the healthcare and financial services markets. Our customers become part of the ZixDirectory, a global “white pages” enabling transparent secure communications with other ZixEncrypt customers using our centralized key management system and overall unique approach to implementing encrypted email. We enable secure communications with other users via TLS, Open PGP, “push” delivery and secure portal “pull” delivery mechanisms. However, we believe our unique transparent delivery is the more preferred delivery model.
Our exceptional support allows customers to reach Zix via phone or email 24/7/365 to address any questions or concerns. With the increasing cost and sophistication of email attacks, convenient access to our threat analysts at any time of the day provides our customers with unmatched peace of mind.
We view our primary competitors in the email security space to be Proofpoint Inc., Mimecast, Microsoft, and Barracuda Networks. Technically, while these companies offer advanced threat protection against email attacks and “send-to-anyone” encrypted email, we believe that Zix offers superior customer service and unparalleled benefits that come from access to the ZixDirectory, use of our Best Method of Delivery protocol, and the industry’s only transparent email encryption. Nevertheless, some of these competitors are large enterprises with substantial financial and technical resources that exceed those we possess.
Regulatory Drivers
We have been successful in securing market penetration in our target vertical markets of healthcare, finance services and government primarily due to regulations that address the need for data privacy and security.
In addition to the need to protect personal data and sensitive business communication, demand for email security in the healthcare sector, including business associates of healthcare providers, is augmented by regulatory requirements under HIPAA and HITECH Act. The Privacy and Security rules under those acts provide severe penalties for violations, include strict breach notification requirements, and allow states to pursue HIPAA violations. In the financial services industry, financial institutions and their service providers are subject to the GLBA, which is enforced by the U.S. Federal Trade Commission (“FTC”). The FTC has issued guidance saying that businesses that transmit sensitive data by email should be sure to encrypt the data.
In choosing an email security provider, companies are influenced by the solutions chosen by their regulators. Our customers include all of the federal regulators that comprise the FFIEC as well as the state banking regulators in more than twenty states. Our service is also a recommended solution of the Conference of State Bank Supervisors, whose members regulate the more than 4,600 state-chartered banks in the U.S.
5
Additionally, state data breach laws and privacy regulations, along with highly publicized breaches, have enhanced security awareness in vertical markets outside of healthcare and financial services and have prompted affected organizations to consider adopting systems that ensure data security and privacy. Even where there are no specific regulations, businesses may require email protection to adhere to evolving industry best practices for protecting sensitive information.
Sales and Marketing
We sell our Zix Email Encryption, ZixProtect, ZixArchive, Zix DLP, and ZixOne Services through a direct sales force that focuses on larger businesses and a telesales force that focuses on small to medium-sized accounts. We also use a network of resellers and other distribution partners, including other service providers seeking an email encryption offering in an original equipment manufacturing (“OEM”)-like relationship. New first year orders (“NFYOs”), defined as the twelve-month value of orders received from new customers, derived from our value-added resellers, OEM and third party distribution channels for 2017 were 56% of the total new first year orders compared to 57% in 2016. In both years, the balance of our NFYOs were originated by our telesales and direct sales forces. Google, Inc. continues to be our largest third party reseller representing approximately 4% of NFYOs in 2017. As of December 31, 2017, we had 250 value-added resellers and 131 managed security service providers across the U.S.
Employees
We had 233 employees as of December 31, 2017. The majority of our employees are located in Dallas, Texas. We also have a sales office in Burlington, Massachusetts; our office in Ann Arbor, Michigan supporting ZixProtect and ZixArchive services; and a smaller office located in Ottawa, Ontario, Canada.
Research and Development
We incurred research and development expenses of $11.0 million, $9.6 million, and $8.3 million for the twelve-month periods ended December 31, 2017, 2016, and 2015, respectively.
Over the course of 2017 we continued to make investments toward strengthening and expanding our service portfolio. We enabled self-configuration of content scanning and encryption for hosted ZixGateway customers and added partner application integration functionality to the ZixGateway platform. We also added multifactor administration authentication and new online reporting capabilities to the ZixPort service.
The R&D organization also successfully integrated base technologies gained through acquisitions and was able to deliver single sign-on for administrative services across new bundled threat protection and encryption capabilities giving our customers a single “pane of glass” for managing their Zix solutions. As the year closed, we were in the process of branding and modernizing the web interface for the encryption appliance software we acquired from Entrust Datacard and we expect to deliver a significantly improved onsite mail portal product in 2018.
Intellectual Property
We depend upon our ability to develop, maintain and protect our proprietary technology and our related intellectual property rights. We rely on a combination of patent, trademark, trade secret and copyright law and contractual restrictions to protect the proprietary aspects of our technology and related property rights and to defend against infringement and/or misappropriation claims from others. We own 21 U.S. patents with expiration dates ranging from 2019 through 2036, and 7 pending U.S. Applications. We have a program to file applications for and obtain patents and trademarks in the United States and in specific foreign countries where we believe filing for such protection is appropriate. While intellectual property rights are generally important to our business, we do not believe that our business is dependent on any single item of intellectual property, or that any single item of intellectual property is material to the operation of our business. Rather, we believe that our intellectual property rights provide us with a competitive advantage, and from time to time we have taken steps to enforce our intellectual property rights as a means of protecting that competitive advantage.
Our Company and certain of our subsidiaries are the owners of trademarks and service marks registered with the United States Patent & Trademark Office. These marks are renewable indefinitely, contingent upon continued use and payment of applicable renewal fees. Additionally, our Company and certain of our subsidiaries own several pending trademark applications with the United States Patent & Trademark Office as well as a number of United States common law trademarks and several service marks and trademarks and service marks registered in foreign countries. We consider our trademark and service marks as valuable assets of the Company due to their recognition by our customers. We are not aware of any valid claims of infringement or challenges to our right to use any of our trademarks or service marks in the United States.
6
Please see generally the risks that are more fully disclosed in “Item 1A. Risk Factors” for risks related to our intellectual property.
Compliance with Environmental Regulations
We have not incurred, and do not expect to incur, any material expenditures or obligations related to environmental compliance issues.
Governmental Contracts
We have contracts with many local, state and federal agencies and regulators, which in the aggregate contribute approximately 7 percent of our annual revenue.
Significant Customers
In each of 2017, 2016, and 2015, no single customer accounted for 10% or more of our total revenues.
Backlog
Our backlog is comprised of contractual commitments that we expect to recognize as revenue in the future. Our backlog was $72.6 million at December 31, 2017, compared to $81.7 million at December 31, 2016.
As of December 31, 2017, our backlog is comprised of the following elements: $29.5 million of deferred revenue that has been billed and paid, $7.6 million billed but unpaid, and approximately $35.5 million of unbilled contracts.
The backlog is recognized into revenue ratably as the services are performed. Approximately 62% of our total backlog at December 31, 2017, is expected to be recognized as revenue during 2018.
Seasonality
The Company typically experiences lower NFYO’s in the first quarter of the calendar year. Our budget anticipates fewer NFYO’s in the first quarter, but historically this has not resulted in a material impact to our revenue or earnings on a seasonal basis.
Geographic Information
Our operations are primarily based in the U.S., with approximately 4% of our employees located in Canada. Except for a United Kingdom based data center, we do not operate in, or have dependencies on, any other foreign countries. Our revenues and orders to-date are almost entirely sourced in the U.S. and all significant corporate assets at December 31, 2017, were located in the U.S.
Financial Information About Industry Segments
We have one reportable segment consisting of email encryption and security solutions. We internally evaluate all of our product offerings and other sources of revenue as one industry segment, and, accordingly, do not report segment information.
Available Information
Our Internet address is www.zixcorp.com. Our Annual Report on Form 10-K, Quarterly Reports on Form 10-Q, Current Reports on Form 8-K, and amendments to those reports filed or furnished pursuant to Section 13(a) or 15(d) of the Securities Exchange Act of 1934, as amended (the “Exchange Act”), are available on our website, without charge, as soon as reasonably practicable after we electronically file such material with, or furnish it to, the SEC. The information found on our website shall not be considered to be part of this or any other report filed with or furnished to the SEC.
In addition to our website, you may read and copy any materials we file with the SEC at the SEC’s Public Reference Room at 450 Fifth Street, N.W., Washington, D.C. 20549. You may obtain information on the operation of the SEC’s Public Reference Room by calling the SEC at 1-800-SEC-0330. The SEC maintains a website that contains reports, proxy and other information statements, and other information regarding issuers, including us, that file electronically with the SEC. The address of the website is www.sec.gov.
7
NOTE ON FORWARD-LOOKING STATEMENTS AND RISK FACTORS
This document contains “forward-looking statements” (including the discussion appearing under the caption “Liquidity Summary” in “Item 7. Management’s Discussion and Analysis of Financial Condition and Results of Operations,”) within the meaning of Section 27A of the Securities Act of 1933, as amended (the “Act”) and Section 21E of the Exchange Act. All statements other than statements of historical fact are “forward-looking statements” for purposes of federal and state securities laws, including: any projections of future business, market share, earnings, revenues, recognition of revenues from backlog, cash receipts, or other financial items; any statements of the plans, strategies, and objectives of management for future operations; any statements concerning proposed new products, services, or developments; any statements regarding future economic conditions or performance; any statements of belief; and any statements of assumptions underlying any of the foregoing. Forward-looking statements may, but need not, include words such as “may,” “will,” “predict,” “project,” “forecast,” “plan,” “should,” “could,” “goal,” “estimate,” “intend,” “continue,” “believe,” “expect,” “outlook,” “anticipate,” “hope,” and other similar expressions. Any forward-looking statements involve risks and uncertainties that could cause actual events or results to differ materially from the events or results described in the forward-looking statements, including, but not limited to, the risks and uncertainties described in the “Item 1A Risk Factors” section.
Although we believe that expectations reflected in and the assumptions underlying our forward-looking statements are reasonable, actual results or assumptions made could differ materially from those projected or assumed in any of our forward-looking statements. Our future financial condition and results of operations, as well as any forward-looking statements, are subject to change and to inherent risks and uncertainties, including, but not limited to, those disclosed in this document. Forward-looking statements speak only as of the date on which they are made, and we do not intend, and undertake no obligation, to update any forward-looking statement.
The following is a cautionary discussion of risks, uncertainties and assumptions that we believe are significant to our business, financial condition and financial results. In addition to the factors discussed elsewhere in this Annual Report on Form 10-K, the following are some of the important factors that, individually or in the aggregate, we believe could make our results differ materially from those described in any forward-looking statements. It is impossible to predict or identify all such factors and, as a result, you should not consider the following factors to be a complete discussion of risks, uncertainties and assumptions.
Our business depends upon customers using email to exchange confidential information, and a significant shift of those messages to other communication channels could impair our growth prospects and negatively affect our business, financial condition and financial results.
Our customers deploy and use our products and services to easily, securely and confidentially send and receive email messages. Our business and revenue substantially depend on our current and potential customers using email to exchange sensitive information electronically. New technologies, products, or business models that could support secure communications could be disruptive to our business. If prospective or current customers were to send and receive sensitive information using technology or communication channels other than email, our growth prospects and our business, financial condition and financial results could be materially adversely affected.
Our business depends on market acceptance of our products and services, and our failure to achieve and maintain influential customers could negatively affect our business, financial condition and financial results.
In order to continue to operate profitably and grow, we must achieve and maintain broad market acceptance of our products and services at a price that provides us with an acceptable rate of return relative to our costs. We have been successful in selling our Email Encryption products and services to high-profile customers in the healthcare, financial services and government segments of the market. The acceptance and use of our products and services by those significant customers facilitates our sales to other potential customers, and an expanding base of users in the Zix Directory aids in our market penetration and expansion. The loss of an influential customer of our existing products and services, or the failure to achieve sufficient market adoption of new products including ZixProtect and ZixArchive, could impair our ability to expand the market penetration of our products and services, or cause us to reduce or increase prices, which could reduce our revenues and net income and materially adversely affect our business, financial condition and financial results.
Our business relies on securing new customer subscriptions and subscription renewals from existing customers.
A large portion of our revenue is derived from customer subscriptions, and existing customers have no contractual obligations to purchase beyond the initial subscription or contract period. Our ability to grow our business is dependent in part on customers renewing their existing subscriptions and purchasing additional solutions or services after the initial term of their agreement. Though we maintain and analyze historical data with respect to rates of customer renewals, upgrades and expansions, those rates may not
8
accurately predict future trends in renewal of certain products and services offered by us. If our customers cancel or amend their agreements with us during their term, do not renew their agreements, renew on less favorable terms or do not purchase additional solutions or products during renewal periods, our revenue may grow more slowly than expected or decline and our profitability may be harmed.
Additionally, we have experienced, and expect to continue to experience, some level of attrition with existing customers and we may not maintain historical subscription rates, and we may be unable to accurately predict our customer renewal rates. Although we have historically retained approximately 90% of our recurring revenue on an annual basis, there has been some recent decline in such retention and our customers’ renewal rates may further decline or fluctuate as a result of a number of factors, including the level of their satisfaction with our products and technical support services, customer merger or acquisition activity, customer budgets, the pricing of our products compared with those offered by our competitors, technology trends, the prevailing regulatory regime and general market conditions. If new subscriptions or subscription renewals decline from their current levels, our revenue or revenue growth may decline, and our business may suffer which could have a materially adverse effect on our financial performance.
The security of our networks and data centers is critical to our business and an actual or perceived breach of security through a cyber-attack or otherwise could cause us to lose customers and could negatively affect our reputation, business, financial condition and financial results.
We are dependent on our networks and data centers to provide our products and services. Due to the nature of the products and services we provide and the sensitive nature of the information we collect, process, store, use and transmit, we may face cyber-attacks, data protection breaches, computer viruses and other similar disruptions from unauthorized tampering or human error that attempt to penetrate and could harm our networks and data centers. Our business depends on customers having and maintaining confidence that we provide effective network and security protection. To reduce the risk of a successful cyber-attack or similar event, we have implemented significant physical and logical security measures to detect, identify and mitigate threats as well as to monitor for and respond to potential breaches and incidents. Despite these security measures, our networks and data centers may remain vulnerable. We may not be able to correct a security flaw or particular vulnerability promptly, or at all. Further efforts to limit the ability of malicious third parties to disrupt or undermine our security efforts may be costly to implement and may not be successful. If a cyber-attack or other breach of security occurs, or is perceived to have occurred, in our internal systems or at our data centers and networks, it could cause negative publicity, interruption of our services, damage to our reputation, unauthorized disclosure of our customers’ confidential or proprietary information (including personally identifiable information), disclosure of our intellectual property, disclosure, modification or removal of our confidential or sensitive information, theft or unauthorized use or publication of our trade secrets, loss of customers, lost revenue and increased expense (including potentially indemnification or warranty costs), any of which could have a material adverse effect on our business, financial condition and financial results.
Public key cryptography technology used in our businesses is subject to technology integrity risks that could reduce demand for our products and services and could negatively affect our business, financial condition and financial results.
Our business employs public key cryptography technology and other encryption technologies to encrypt and decrypt sensitive data. The security afforded by encryption depends on the integrity of the private key, which is predicated on the assumption that it is very difficult to mathematically derive the private key from the related public key. Successful decryption of intercepted encrypted email, or public reports of successful decryption, whether or not true, could reduce demand for our products and services. If new methods or technologies, such as quantum computing, make it easier to derive the private key from the related public key, the security of encryption services using public key cryptography technology could be impaired and our products and services could become less marketable. That could require us to make significant changes to our services, which could increase our costs, damage our reputation, or otherwise harm our business. Any of these events could reduce our revenues, increase our expenses and materially adversely affect our business, financial condition and financial results.
Our business depends substantially on our data center facilities, and their unreliability or unavailability for a significant period could cause us to lose customers and could negatively affect our business, financial condition and financial results.
Much of the computer and communications hardware upon which our businesses depend is located in our data center facilities in North America and in the United Kingdom. Our data centers might be damaged or interrupted as a result of numerous factors, many of which are beyond our control, including fire, flood, power loss, mechanical failure, telecommunications failure, break-ins, cyber-attacks, sabotage, vandalism, earthquakes, terrorist attacks, hostilities or war or other events. Computer viruses, equipment failure, denial of service attacks, and similar disruptions affecting the internet or our systems might cause service interruptions, delays and loss of critical data, and could prevent us from providing our services. Problems affecting our data center operations or the networks on which we rely, whether or not in our control, could result in loss of revenues, increased expenses, failure to achieve market acceptance, diversion of resources, injury to our reputation, liability and increased costs, and may cause our customers to terminate or elect not to renew their agreements. We do not carry sufficient insurance to compensate us for all losses that may occur as a result of any of these events. The occurrence of any of these events could materially adversely affect our business, financial condition and financial results.
9
Outages or problems with systems and infrastructure supplied by third parties could negatively affect our business, financial condition and financial results.
Our business relies on third-party suppliers of the telecommunications infrastructure. We use various communications service suppliers and the global internet to provide network access between our data centers, our customers and end-users of our services. If those suppliers do not enable us to provide our customers with reliable, real-time access to our systems, we may be unable to gain or retain customers. These suppliers periodically experience outages or other operational problems as a result of internal system failures or external third party actions. Though our products generally tolerate isolated supplier failures, multiple supplier outages or problems could materially adversely affect our business, financial condition and financial results.
The infrastructure supporting our business may suffer capacity constraints and business interruptions that could cause us to lose customers, increase our operating costs and could negatively affect our business, financial condition and financial results.
Our business depends on our providing our customers reliable, real-time access to our data centers and networks. Customers will not tolerate a service hampered by slow delivery times, unreliable service levels, service outages, or insufficient capacity. System capacity limits or constraints arising from unexpected increases in our volume of business or network traffic could cause interruptions, outages or delays in our services, or deterioration in their performance, or could impair our ability to process transactions. We may not be able to accurately project the rate of increase in usage of our systems or to timely increase capacity to accommodate increased traffic on our systems. System delays or interruptions may prevent us from efficiently providing services to our customers or other third parties, which could result in our losing customers and revenues, or incurring liabilities that could have a material adverse effect on our business, financial condition and financial results.
The growth of our business may require significant investment in systems and infrastructure and these investments may achieve delayed, or lower than expected benefits, which could impair our profitability and negatively affect our business, financial condition and financial results.
As our operations grow in size and scope, we continually need to improve and upgrade our technology offerings, systems and infrastructure to offer an increasing number of customers enhanced products, services, features and functionality, while maintaining the reliability and integrity of our systems and infrastructure and pursuing reduced costs per transaction. Expanding our technology offerings, systems and infrastructure may require us to commit substantial financial, operational and technical resources, with no assurance that the volume of our business will increase, which could reduce our net income, deplete our cash, and materially adversely affect our business, financial condition and financial results. Developing and launching new product offerings adjacent to or outside of our core service offerings can be particularly costly in terms of capital investments for both product development and marketing. At the same time, these new offerings involve greater uncertainty concerning both market acceptance and our ability to successfully execute a sales and marketing strategy that justifies our investments. Our failure to properly manage and execute new product initiatives could materially adversely affect our business, financial condition and financial results.
Because we recognize subscription revenue over the term of the applicable customer agreement, a decline in subscription renewals or new service agreements may not be reflected immediately in our operating results.
We generally recognize revenue from customers ratably over the terms of their customer agreements, which are typically one year or two years. As a result, much of the revenue we report in each quarter is deferred revenue from customer agreements entered into during previous quarters. Consequently, a decline in new or renewed client agreements in any one quarter will not be fully reflected in our revenue or our results of operations until future periods. Accordingly, this revenue recognition model also makes it difficult for us to rapidly increase our revenue through additional sales in any period, as revenue from new clients must be recognized over the applicable subscription term.
Our failure to keep pace with rapid technology changes could have a negative impact on our business, financial condition and financial results.
The markets for our products and services are characterized by rapid technological developments and frequent changes in customer requirements. We must continually improve the performance, features and reliability of our products and services, particularly in response to competitive offerings, to keep pace with these developments. We must ensure that our products and services address evolving operating environments, devices, industry trends, certifications and standards. For example, we have been required to expand our offerings for virtual computer environments and mobile environments to support a broader range of mobile devices. We also may need to develop products that are compatible with new operating systems while remaining compatible with existing, popular operating systems. Our business could be harmed by our competitors announcing or introducing new products and services that could be perceived by customers as superior to ours. We spend considerable resources on technology research and development, but our research and development resources are more limited than many of our competitors.
10
In addition, we are also focused on addressing new and accelerating market trends, such as the continued decline of on premise email security and advance threat protection solution and the continued transition towards cloud-based solutions, which requires us to continue to improve our product and service offerings. We may experience delays in the anticipated timing of activities related to our efforts to address these challenges and higher than expected or unanticipated execution costs. Our failure to introduce new or enhanced products on a timely basis, to keep pace with rapid industry, technological or market changes or to gain customer acceptance for our new and existing products and services, such as mobile device data protection, could have a material adverse effect on our business, financial condition and financial results.
We face strong competition, which could negatively affect our business, financial condition and financial results.
The markets in which we compete are characterized by rapid change and converging technologies and are very competitive. With rising demand for private and secure email communications, there is strong competition for email encryption products and services. Our Email Encryption Threat Protection, Archive, and Data Loss Prevention business competes with products and services offered by companies such as Microsoft, Barracuda Networks, Inc., Proofpoint, MIMECast, Virtru, and Micro Focus (Voltage). Our ZixOne business competes with products and services offered by companies such as AirWatch/VMWare, Citrix (with XenMobile), Blackberry, IBM/Fiberlink (with MaaS360), Microsoft (with ActiveSync), and MobileIron. Strong competition requires us to develop new technology solutions and service offerings to expand the functionality and value that we offer to our customers. Our competitors may develop products and services that are perceived by customers as equivalent to, or having advantages over, our products and services. Competitors could capture a significant share in our markets, causing our sales and revenue to decline or grow more slowly. Barriers to entry are relatively low, and new ventures are often formed that create products competitive with our products. Competitive pressures could lead to price discounting or to increases in expenses such as advertising and marketing costs. Increased competition could also decrease demand for our products and services. Competition could reduce our revenues and net income and materially adversely affect our business, financial condition and financial results.
Industry consolidation may lead to increased competition and may harm our operating results.
There has been a trend toward industry consolidation in our industry for several years. We expect this trend to continue as companies attempt to strengthen or hold their market positions in an evolving industry and as companies are acquired or are unable to continue operations. For example, some of our current and potential competitors have made acquisitions, or announced new strategic alliances. Companies that are strategic alliance partners in some areas of our business may acquire or form alliances with our competitors, thereby reducing their business with us. We believe that industry consolidation may result in stronger competitors that are better able to compete as sole-source vendors for customers. This could have a material adverse effect on our business, financial condition and financial results.
Some competitors have advantages that may allow them to compete more effectively than us, which could negatively affect our business, financial condition and financial results.
Some of our competitors have longer operating histories, more extensive operations, greater name recognition, larger technical staffs, bigger product development and acquisition budgets, established relationships with more distributors and hardware vendors, and greater financial and marketing resources than we do. These advantages might enable them (independently or through alliances) to develop and expand functionality of products and services faster than we can, to spend more money to market and distribute products and services than we can, or to offer their products and services at prices lower than ours. These advantages could reduce our revenues and net income and materially adversely affect our business, financial condition and financial results.
If we do not effectively expand and train our sales force, we may be unable to add new customers or increase sales to our existing customers and our business may be harmed.
We continue to be substantially dependent on our sales force to obtain new customers and to sell additional solutions to our existing customers. We believe that there is significant competition for sales personnel with the skills and technical knowledge that we require. Our ability to achieve significant revenue growth will depend, in large part, on our success in recruiting, training and retaining sufficient numbers of sales personnel to support our growth. New hires require significant training and, in most cases, take significant time before they achieve full productivity. Our recent hires and planned hires may not become as productive as we expect, and we may be unable to hire or retain sufficient numbers of qualified individuals in the markets where we do business or plan to do business. If we are unable to hire and train sufficient numbers of effective sales personnel, or the sales personnel are not successful in obtaining new clients or increasing sales to our existing client base, our business will be harmed.
11
If we do not successfully manage our strategic alliances, we may not realize the expected benefits from such alliances and we may experience increased competition or delays in product development.
We have entered into several strategic alliances with other companies to offer complementary products and services. These arrangements are generally limited to specific projects or series of projects, and their main goal is generally to facilitate product compatibility and adoption of industry standards. There can be no assurance that we will realize the expected benefits from these strategic alliances. If successful, these relationships may be mutually beneficial and result in industry growth. However, alliances carry an element of risk because, in most cases, we must compete in some business areas with a company with which we have a strategic alliance and, at the same time, cooperate with that company in other business areas. Also, if these partner companies fail to perform or if these relationships fail to materialize as expected, we could suffer delays in product development or other operational difficulties.
We enlist third party distributors to market our products and services, and our failure to succeed in those relationships could negatively affect our business, financial condition and financial results.
We distribute a significant percentage of our products and services by entering into alliances with third parties who can offer our products and services along with their own or our competitors’ products and services. Increased reliance on third parties to market and distribute our products and services exposes us to a variety of risks. For example, we have limited control over and visibility into the sales cycles of third party distributors, which could increase the length of our sales cycle, cause our revenue to fluctuate unpredictably and make it difficult to accurately forecast our revenue. In addition, we may not succeed in developing or maintaining marketing alliances. Companies with which we have marketing alliances may in the future discontinue their relationships with us, form marketing alliances with our competitors, or develop and market their own products and services that compete with ours. If a significant distributor were to discontinue its relationship with us, we could experience an interruption in the distribution of our products and services and our revenues could decline. Our failure to develop, maintain and expand strategic distribution relationships could reduce our revenues and net income and materially adversely affect our business, financial condition and financial results.
Our future growth and success may be affected by acquisitions. If we are not able to successfully identify, negotiate, complete and integrate acquisitions, our operating results and prospects could be harmed.
We have acquired and expect to continue to acquire new products and technology, as well as customers, through acquisitions. The success of our future acquisition strategy will depend on our ability to identify, negotiate, complete and integrate acquisitions. Acquisitions are inherently risky, and any acquisition we complete may not be successful. Acquisitions we pursue involve numerous risks, including the following:
|
|
• |
difficulties in integrating and managing the operations and technologies of the companies and assets we acquire; |
|
|
• |
diversion of our management’s attention from normal daily operations of our business; |
|
|
• |
our inability to maintain the customers, the key employees, the key business relationships and the reputations of the businesses and products we acquire; |
|
|
• |
our inability to generate sufficient revenue from acquisitions to offset increased expenses generally associated with acquisitions; |
|
|
• |
difficulties in predicting or achieving synergies and cost savings between our existing businesses and acquired businesses; |
|
|
• |
our responsibility for the liabilities of the businesses we acquire, including liabilities arising out of their failure to operate correctly, maintain effective data security, data integrity, disaster recovery and privacy controls prior to acquisition, or their infringement or alleged infringement of third-party intellectual property, contract or data access rights prior to acquisition; |
|
|
• |
difficulties in complying with new markets or regulatory standards to which we were not previously subject; |
|
|
• |
difficulties or unanticipated expenses associated with development work that is necessary to achieve interoperability between our products and solutions and the products and solutions we acquire; |
|
|
• |
difficulties or unanticipated expenses associated with migrating customers from products and solutions developed by our acquisition targets to our own products and solutions; |
|
|
• |
delays in our ability to implement internal standards, controls, procedures and policies in the businesses we acquire; and |
|
|
• |
adverse effects of acquisition activity on the key performance indicators we use to monitor our performance as a business. |
12
Unanticipated events and circumstances occurring in future periods may affect the realizability of intangible assets that we are required to record on our balance sheet as a result of acquisitions. These events and circumstances could include significant under-performance relative to projected future operating results and significant changes in our overall business or product strategies. Such events and circumstances may cause us to revise our estimates and assumptions used in analyzing the value of our intangible assets, and any such revision could result in a non-cash impairment charge that could have a material impact on our financial results.
Unfavorable economic environments, particularly in the U.S., could negatively affect our business, financial condition and financial results.
Challenging economic conditions worldwide have from time to time contributed, and may continue to contribute, to slowdowns in the technology and networking industries at large, as well as in the email/data security market and in specific geographic markets in which we operate. If economic growth in those markets, particularly in the U.S., which accounts for a substantial majority of our revenue, slows, or credit is unavailable at a reasonable cost, current and potential customers may delay or reduce technology purchases, including the deployment or expansion of our products and services. Additionally, as we continue our corporate strategy of exploring additional international markets, we may become more susceptible to unfavorable economic environments outside the U.S. and that could compound the negative effects of unfavorable economic environments in markets in which we currently operate. This could result in reduced sales of our products and services, longer sales cycles, slower adoption of new technologies and increased price competition. In addition, adverse economic conditions could negatively affect the cash flow of our customers and distributors, which might result in failures or delays in payments to us. This could increase our credit risk exposure and delay our recognition of revenue. Specific economic trends, such as declines in the demand for cloud computing services and computing devices, or softness in corporate information technology spending, could have a more direct impact on our business. If these conditions persist, spread or deteriorate further, our business, financial condition and financial results could be materially adversely affected.
If our products do not work properly or have security vulnerabilities, our reputation, business, financial condition and financial results could be negatively affected and we could experience negative publicity, declining sales and legal liability.
The threats facing our customers are constantly evolving and the techniques used by experienced hackers to access or sabotage data change frequently, often are not recognized until launched against a target, and may originate from less regulated or remote areas around the world. As a result, we must constantly update our product solutions to respond to these threats. We produce complex solutions that incorporate leading-edge technology, including both hardware and software, that must operate in a wide variety of technology environments. Software may contain defects or “bugs” that can interfere with expected operations or introduce security vulnerabilities that can lead to unauthorized use or data loss. There can be no assurance that our testing programs will be adequate to detect all defects prior to the product being introduced, which might decrease customer satisfaction with our products and services. The product reengineering cost to remedy a product defect or mitigate vulnerabilities could be material to our operating results. Our inability to cure a product defect could result in the temporary or permanent withdrawal of a product or service from the market, a security breach, negative publicity, damage to our reputation, failure to achieve market acceptance, lost revenue and increased expense, any of which could have a material adverse effect on our reputation, business, financial condition and financial results.
Our transmission and storage of personally identifiable information including the personal data of European data subjects and other confidential information, and the potential for inadvertent exposure of PII or CI, could cause us to violate data privacy laws or lose customers and could negatively affect our business, financial condition and financial results.
We transmit and store large amounts of personally identifiable information (“PII”) about individuals, which may include healthcare or financial information, and other confidential information (“CI”). Although we have established, and continue to develop and enhance, security measures and controls to help protect against unauthorized disclosure of such PII and other CI, an inadvertent disclosure of, or unauthorized third-party access to, PII or CI, could disrupt our operations, damage our reputation and subject us to claims or other liabilities.
In addition, our processing and storage of certain types of data is subject to confidentiality agreements with our clients and handling PII is increasingly subject to a variety of changing privacy and data security regulations around the world, such as the European Union’s Data Protection Directive and the forthcoming European Union General Data Protection Regulation, which will take effect on May 25, 2018. Such laws and regulations are subject to new and differing interpretations and may be inconsistent among jurisdictions. For example, in October 2015, the European Court of Justice invalidated the U.S.-EU Safe Harbor framework that had been in place since 2000, which allowed companies including us to meet certain European legal requirements for the transfer of personal data from the European Economic Area to the United States. In the wake of that decision, we decided to participate in the new EU-U.S. Privacy Shield framework established by the U.S. Department of Commerce and the European Commission and opened for participation on August 1, 2016. We applied for and were approved for certification and are now an Active Participant in the Privacy Shield program. Our Privacy Shield self-certification was finalized by the Department of Commerce and became effective as of November 9, 2016 and was renewed in November 2017. This allows us to transfer personal data of European data subjects that we receive from customers to the United States, in compliance with the Privacy Shield principles. While our Privacy Shield certification
13
and other mechanisms (such as Model Clauses) to lawfully transfer such data remain in place, those mechanisms are also subject to pending legal challenges and these legal challenges may result in different European data protection regulators applying differing standards for the transfer of personal data. Future changes in requirements under these regulations may be inconsistent with our existing data management practices. If so, we could be required to fundamentally change our business activities and practices or modify our software, which could have an adverse effect on our business, including increased cost of compliance and limitations on data transfer for us and our customers.
Any inability to adequately address privacy concerns, even if unfounded, or to comply with applicable privacy or data protection laws, regulations and policies, could result in additional costs and liability to us, damage our reputation, inhibit sales, and harm our business. Furthermore, any inadvertent disclosure of, or unauthorized access (including due to a cyber-attack) to, PII or other CI or other failure by us to comply with data privacy requirements could subject us to significant penalties, damages, remediation and other expenses, and damage our reputation, any of which could have a material adverse effect on our business, financial condition and financial results.
Problems with enforcing our intellectual property rights or using third party intellectual property could negatively affect our business, financial condition and financial results.
We rely on a combination of contractual rights, trademarks, trade secrets, patents and copyrights to establish and protect intellectual property rights and other proprietary rights in our products and services. These intellectual property rights or other proprietary rights might be challenged, invalidated or circumvented. The steps we have taken to protect our proprietary information may not prevent its misuse, theft or misappropriation. Competitors may independently develop technologies or products that are substantially equivalent or superior to our products or that inappropriately incorporate our intellectual property rights or other proprietary technology into their products. Competitors may hire our former employees who may misappropriate our intellectual property rights or other proprietary technology. Some jurisdictions may not provide adequate legal protection of our intellectual property rights or other proprietary technology.
We may have to defend or assert our rights in intellectual property that we use in our services, and we could be found to infringe the intellectual property rights of others, which could be disruptive and expensive to our business.
We may have to defend against claims that we or our customers are infringing the rights of third parties in patents, copyrights, trademarks and other intellectual property. If we acquire technology to include in our products from third parties, our exposure to infringement actions may increase because we must rely upon these third parties to verify the origin and ownership of such technology. Also, we may be required to spend significant resources to monitor and protect our intellectual property rights, including initiating claims or litigation against third parties for infringement or misappropriation. Intellectual property litigation and controversies are disruptive and expensive, whether or not resolved in our favor. Even unmeritorious claims brought against us or our customers may harm our reputation and customer relationships, may cause us to incur significant legal and other fees to defend, and may have to be settled for significant amounts. Infringement claims against us could require us to develop non-infringing services or enter into expensive royalty or licensing arrangements. Our business, financial condition and financial results could be materially adversely affected if we are not able to develop non-infringing technology or license technology on commercially reasonable terms.
We may face risks from using “open source” software that could negatively affect our business, financial condition and financial results.
Like many other software companies, we use “open source” software in order to take advantage of common industry building blocks and to add functionality to our products quickly and inexpensively. Open source software license terms could adversely affect our intellectual property rights in our products that include open source software. Depending upon how the open source software is deployed, we could be required to offer products that use the open source software for no cost, or make available the source code for modifications or derivative works. Any of these obligations could have an adverse impact on our intellectual property rights and revenue from products incorporating the open source software. Using open source code could also cause us to inadvertently infringe third-party intellectual property rights or require us to publicly disclose proprietary information. We have processes and controls in place that are designed to address these risks and concerns, but we cannot be sure that our process or controls will be sufficient to mitigate all risk in this regard. Open source software might also introduce security vulnerabilities or defective functionality. The open source community may not always respond with adequate urgency to mitigate the impacts of such defects.
We rely on the availability of third-party intellectual property, which may not be accessible to us on reasonable terms or at all.
Some of our products include third party intellectual property, which may require licenses from third parties. Based on past experience and industry practice, we believe that such licenses can be obtained on reasonable terms; however, there can be no assurance that we will be able to obtain the necessary licenses for new or current products on acceptable terms or at all. Failure to obtain such licenses may limit our ability to sell our products, which could have a material adverse effect on our business, financial condition and financial results.
14
We may fail to recruit and retain key personnel, which could impair our ability to meet key objectives.
Our success depends on our ability to attract and retain highly-skilled technical, managerial, sales, and marketing personnel. Changes in key personnel may be disruptive to our business. It could be difficult, time consuming and expensive to replace key personnel. Integrating new key personnel may be difficult and costly. Volatility, lack of positive performance in our stock price or changes to our overall compensation program including our stock incentive program may adversely affect our ability to retain key employees, many of whom are compensated, in part, based on the performance of our stock price. The loss of services of any of our key personnel, the inability to retain and attract qualified personnel in the future or delays in hiring required personnel could make it difficult to meet key objectives. Any of these impairments related to our key personnel could negatively affect our business, financial condition and financial results.
Governmental restrictions on the sale of our products and services in non-U.S. markets could negatively affect our business, financial condition and financial results.
Exports of software solutions and services using encryption technology such as ours are generally restricted by the U.S. government. Although we have obtained U.S. government approval to export our service to almost all countries, the list of countries to which we (and our distributors) cannot export our products and services could be expanded in the future. In addition, some countries impose restrictions on the importation and use of encryption solutions and services such as ours. The cost of compliance with U.S. and other export laws, or our failure to obtain governmental approvals to offer our products and services in non-U.S. markets, could affect our ability to sell our products and services and could impair our international expansion. We face a variety of other legal and compliance risks. If we or our distributors fail to comply with applicable law and regulations, we may become subject to penalties, fines or restrictions that could materially adversely affect our business, financial condition and financial results.
Our ability to use net operating losses to offset future taxable income may be subject to certain limitations.
In general, under Section 382 of the Internal Revenue Code of 1986, as amended, or the Internal Revenue Code, a corporation that undergoes an “ownership change” is subject to limitations on its ability to utilize its pre-change net operating losses, or NOLs, to offset future taxable income. Our ability to utilize NOLs of companies that we may acquire in the future may be subject to limitations. Future changes in our stock ownership, some of which are outside of our control, could result in an ownership change under Section 382 of the Internal Revenue Code. For these reasons, we may not be able to utilize a material portion of the NOLs reflected on our balance sheet, even if we maintain profitability.
Exercises and vesting of equity awards relating to our common stock may dilute the ownership interests of existing shareholders and could negatively affect the value of our common stock.
Our employees hold a significant number of outstanding options and other equity awards. The vesting and exercise of these awards, and the resulting issuance of additional shares of our common stock, dilutes the ownership interests and voting rights of our current shareholders. Issuances and/or sales of those additional shares could cause our common stock to decline in value. In recent years, we have completed several share repurchase programs, the effect of which has been to mitigate the dilutive effect of our employee equity grants. There can be no assurance, however, that we will continue these share repurchase programs in the future.
Item 1B. Unresolved Staff Comments
None.
We leased properties during 2017 that are considered significant to the operations of the business in the following locations: Burlington, Massachusetts; Ann Arbor, Michigan; Ottawa, Ontario, Canada; the United Kingdom; and Dallas and Austin, Texas. Our Burlington employees perform sales and marketing activities. Our Ann Arbor employees perform the support and development of our ZixProtect product line, which we acquired with our purchase of Greenview. Our Ottawa employees perform both client services and sales support activities. The United Kingdom facility provides data center support for our European customers. The Dallas office is our headquarters, which includes research and development, marketing, sales and all general administrative services, and the ZixData Center. Our Austin location is used primarily for fail-over and business continuity services and is used to some extent to support normal ongoing operations. Our facilities are suitable for our current needs and are considered adequate to support expected near-term growth.
15
We are subject to legal proceedings, claims, and litigation involving our business. While the outcome of these matters is currently not determinable, and the costs and expenses of resolving these matters may be significant, we currently do not expect that the ultimate costs to resolve these matters will have a material adverse effect on our consolidated financial condition or operating results.
Item 4. Mine Safety Disclosures
Not applicable.
16
Item 5. Market for Registrant’s Common Equity, Related Stockholder Matters and Issuer Purchases of Equity Securities
Our common stock trades on The Nasdaq Stock Market under the symbol ZIXI. The table below shows the high and low sales prices by quarter for fiscal 2017 and 2016.
|
|
|
2017 |
|
|
2016 |
|
||||||||||
|
Quarter Ended |
|
High |
|
|
Low |
|
|
High |
|
|
Low |
|
||||
|
March 31 |
|
$ |
5.41 |
|
|
$ |
4.60 |
|
|
$ |
5.09 |
|
|
$ |
3.23 |
|
|
June 30 |
|
$ |
6.67 |
|
|
$ |
4.75 |
|
|
$ |
4.18 |
|
|
$ |
3.61 |
|
|
September 30 |
|
$ |
6.04 |
|
|
$ |
4.55 |
|
|
$ |
4.28 |
|
|
$ |
3.65 |
|
|
December 31 |
|
$ |
5.40 |
|
|
$ |
4.16 |
|
|
$ |
5.08 |
|
|
$ |
3.91 |
|
At March 5, 2018, there were 54,373,952 shares of common stock outstanding held by 420 shareholders of record. On that date, the last reported sales price of the common stock was $4.21.
We have not paid any cash dividends on our common stock and do not anticipate doing so in the foreseeable future.
For information regarding options and stock-based compensation awards outstanding and available for future grants, see “Item 12. Security Ownership of Certain Beneficial Owners and Management and Related Stockholder Matters.”
Performance Graph
The following graph compares the cumulative total return of an investment in our common stock over the five-year period ended December 31, 2017, as compared with the cumulative total return of an investment in (i) the Center for Research in Securities Prices (“CRSP”) Total Return Index for Nasdaq Stock Market (U.S. companies) and (ii) the CRSP Total Return Index for Nasdaq Computer and Data Processing Stocks. The comparison assumes $100 was invested on December 31, 2012, in our common stock and in each of the two indices and assumes reinvestment of all dividends, if any. The stock price performance on the following graph is not necessarily indicative of future stock price performance. A listing of the companies comprising each of the CRSP- NASDAQ indices used in the following graph is available, without charge, upon written request.
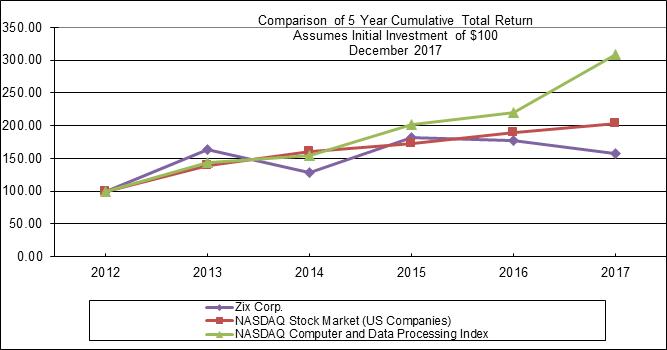
17
Sale of Unregistered Securities
None.
Purchases of Equity Securities by the Issuer
|
Period |
|
Total Number of Shares Purchased(1)(2) |
|
|
Average Price Paid per Share (1) |
|
|
Total Number of Shares Purchased as part of Publically Announced Plans or Programs |
|
|
Maximum Number (or Appropriate Dollar Value) of Shares (or Units) that May Yet Be Purchased Under the Plans or Programs |
|
||||
|
October 1, 2017 to October 31, 2017 |
|
|
347,870 |
|
|
$ |
5.15 |
|
|
|
313,494 |
|
|
$ |
7,100,000 |
|
|
November 1, 2017 to November 30, 2017 |
|
|
194,370 |
|
|
$ |
4.64 |
|
|
|
186,506 |
|
|
$ |
6,200,000 |
|
|
December 1, 2017 to December 31, 2017 |
|
|
— |
|
|
$ |
— |
|
|
|
— |
|
|
$ |
6,200,000 |
|
|
Total |
|
|
542,240 |
|
|
$ |
4.97 |
|
|
|
500,000 |
|
|
$ |
6,200,000 |
|
1 Shares were repurchased under the $10 million stock repurchase program approved by our board of directors on April 24, 2017. No shares were repurchased other than through publically announced programs during the periods shown.
2 Of the total number of shares repurchased for the one month periods ended October 31, 2017, and November 30, 2017, 10,537 shares of Restricted Stock and 31,703 Restricted Stock Units (“RSU”s) represent shares of Restricted Stock and RSUs withheld by us upon the vesting of outstanding Restricted Stock or RSUs. These shares and RSUs were withheld by us to satisfy the minimum statutory tax withholding for the employees for whom the Restricted Stock and RSUs vested during the applicable period.
Item 6. Selected Financial Data
The following selected financial data should be read in conjunction with “Item 7. Management’s Discussion and Analysis of Financial Condition and Results of Operations,” the consolidated financial statements and notes thereto. No cash dividends were declared in any of the five years shown below:
|
|
|
Year Ended December 31, |
|
|||||||||||||||||
|
|
|
2017 |
|
|
2016 |
|
|
2015 |
|
|
2014 |
|
|
2013 |
|
|||||
|
|
|
(In thousands, except per share data) |
|
|||||||||||||||||
|
Statement of Operations Data: |
|
|
|
|
|
|
|
|
|
|
|
|
|
|
|
|
|
|
|
|
|
Revenues |
|
$ |
65,663 |
|
|
$ |
60,144 |
|
|
$ |
54,713 |
|
|
$ |
50,347 |
|
|
$ |
48,138 |
|
|
Cost of revenue |
|
|
12,602 |
|
|
|
10,533 |
|
|
|
9,593 |
|
|
|
8,324 |
|
|
|
7,614 |
|
|
Gross margin |
|
|
53,061 |
|
|
|
49,611 |
|
|
|
45,120 |
|
|
|
42,023 |
|
|
|
40,524 |
|
|
Research and development expenses |
|
|
10,980 |
|
|
|
9,553 |
|
|
|
8,317 |
|
|
|
9,051 |
|
|
|
9,563 |
|
|
Selling, general and administrative expenses |
|
|
31,871 |
|
|
|
30,742 |
|
|
|
28,887 |
|
|
|
26,222 |
|
|
|
21,646 |
|
|
Income tax expense (benefit)(1) |
|
|
18,606 |
|
|
|
3,692 |
|
|
|
3,144 |
|
|
|
2,830 |
|
|
|
(1,006 |
) |
|
Net income (loss) |
|
|
(8,057 |
) |
|
|
5,837 |
|
|
|
5,016 |
|
|
|
4,103 |
|
|
|
10,453 |
|
|
Basic income (loss) per common share |
|
$ |
(0.15 |
) |
|
$ |
0.11 |
|
|
$ |
0.09 |
|
|
$ |
0.07 |
|
|
$ |
0.17 |
|
|
Diluted income (loss) per common share |
|
$ |
(0.15 |
) |
|
$ |
0.11 |
|
|
$ |
0.09 |
|
|
$ |
0.07 |
|
|
$ |
0.17 |
|
|
Shares used in computing basic income per common share |
|
|
53,430 |
|
|
|
53,820 |
|
|
|
56,422 |
|
|
|
57,949 |
|
|
|
61,139 |
|
|
Shares used in computing diluted income per common share |
|
|
53,430 |
|
|
|
54,395 |
|
|
|
57,476 |
|
|
|
58,967 |
|
|
|
62,527 |
|
|
Statements of Cash Flows Data: |
|
|
|
|
|
|
|
|
|
|
|
|
|
|
|
|
|
|
|
|
|
Net cash flows provided by (used for): |
|
|
|
|
|
|
|
|
|
|
|
|
|
|
|
|
|
|
|
|
|
Operating activities |
|
$ |
18,204 |
|
|
$ |
15,251 |
|
|
$ |
15,617 |
|
|
$ |
13,317 |
|
|
$ |
13,298 |
|
|
Investing activities |
|
|
(11,285 |
) |
|
|
(2,136 |
) |
|
|
(1,951 |
) |
|
|
(3,402 |
) |
|
|
(1,593 |
) |
|
Financing activities |
|
|
(367 |
) |
|
|
(15,322 |
) |
|
|
(6,687 |
) |
|
|
(15,748 |
) |
|
|
(7,175 |
) |
|
Balance Sheet Data: |
|
|
|
|
|
|
|
|
|
|
|
|
|
|
|
|
|
|
|
|
|
Cash, Cash Equivalents and Marketable Securities |
|
$ |
33,009 |
|
|
$ |
26,457 |
|
|
$ |
28,664 |
|
|
$ |
21,685 |
|
|
$ |
27,518 |
|
|
Working capital(2) |
|
|
2,104 |
|
|
|
2 |
|
|
|
3,821 |
|
|
|
2,249 |
|
|
|
12,127 |
|
|
Total assets |
|
|
81,308 |
|
|
|
82,358 |
|
|
|
87,286 |
|
|
|
83,724 |
|
|
|
90,702 |
|
|
Stockholders’ equity |
|
|
43,520 |
|
|
|
49,070 |
|
|
|
56,772 |
|
|
|
56,270 |
|
|
|
66,234 |
|
18
|
December 31, 2017, the Company adjusted its deferred tax balances to reflect the new tax rate that resulted in income tax expense of $12.5 million. The $1.0 million tax benefits in 2013 resulted from the release of a portion of our deferred tax asset valuation allowance. Based on analysis of both projected and current earnings, we have estimated our deferred tax asset as likely to be utilized prior to expiration. See “Income Taxes” in “Item 7. Management’s Discussion and Analysis of Financial Condition and Results of Operations.” |
|
(2) |
Working capital includes deferred revenue totaling $28.4 million, $25.8 million, $23.2 million, $21.6 million, and $19.1 million, as of December 31, 2017, 2016, 2015, 2014, and 2013, respectively. |
19
Item 7. Management’s Discussion and Analysis of Financial Condition and Results of Operations
The following discussion and analysis contains forward-looking statements about trends, uncertainties and our plans and expectations of what may happen in the future. Forward-looking statements involve risks and uncertainties that could cause actual events or results to differ materially from the events or results described in the forward-looking statements, including risks and uncertainties described above in “Item 1A. Risk Factors.” Readers are cautioned not to place undue reliance on forward-looking statements. The forward-looking statements in this report are based upon information available to us on the date of this report. We undertake no obligation to publicly update or revise any forward-looking statements. See “Item 1. NOTE ON FORWARD-LOOKING STATEMENTS AND RISK FACTORS.”
The following discussion should be read in conjunction with the consolidated financial statements and related notes beginning on page F-1.
Overview
We are a leader in providing email security. We provide email encryption, DLP, advanced threat protection, archiving, and BYOD solutions to meet the data protection and compliance needs of organizations primarily in the healthcare, finance, and government sectors. A core competency is our ability to deliver this complex service offering with a high level of availability, reliability, integrity and security.
Our 2017 results included record revenues. We attribute our success to on-going efforts to build a solid and predictable business based on our successful recurring revenue subscription business model. For 2017, we continued to benefit from growing concerns about data security and integrity issues, which continue to make headline news, as well as the growing acceptance of cloud-based offerings along with the growing regulatory compliance burdens on many businesses.
For 2017, we reported revenue of $65.7 million, an increase of $5.5 million over the prior year, driven by both continued growth in our subscriber base and new sales attributable to our Greenview acquisition.
For the year ended December 31, 2017, our gross profit of $53.1 million increased 7% compared to 2016. This increase was primarily driven by increased revenue. Our 2017 operating income of $10.2 million increased $894 thousand over the prior year, as the gross profit increase was offset by increased research and development expense and selling and marketing expense, both primarily related to additional headcount costs.
Our $8.1 million net loss in 2017 is a decrease of $13.9 million compared to our $5.8 million net income in 2016. On December 22, 2017, the U.S. enacted the Tax Act which significantly changed U.S. tax law. The Tax Act lowered the Company’s statutory tax rate from 35% to 21% effective January 1, 2018. At December 31, 2017, the Company adjusted its deferred tax balances to reflect the new tax rate that resulted in tax expense of $12.5 million.
Other Financial Highlights
|
|
• |
Backlog was $72.6 million at the end of 2017, compared with $81.7 million at the end of 2016 |
|
|
• |
Total orders for 2017 were $58.9 million, a decrease of 14% from the 2016 total orders of $68.6 million |
|
|
• |
Our deferred revenue at the end of 2017 was $29.4 million, compared with $27.2 million at the end of 2016 |
|
|
• |
We generated cash flows from operations of $18.2 million during fiscal 2017. Our cash and cash equivalents were $33.0 million at the end of 2017, compared with $26.5 million at the end of 2016. |
|
|
• |
Our shared, cloud-based ZixDirectory now has approximately 60 million members including some of the most respected institutions in the country. |
Our services are sold on a subscription basis with contract terms generally ranging from one to five years. At the end of the contract term we attempt to renew the subscription for the originally contracted period. Our customers pay us annually at the start of the subscription term and each succeeding year on the anniversary of the commencement of the service. We recognize revenue ratably on a monthly basis over the term of the subscription once service commences.
We attempt to grow the business by signing new customers to subscription services and/or selling new or higher volume services to existing customers (i.e., “upsell”) while retaining existing customers through renewal of their subscriptions for successive periods.
20
Our total orders consist of orders from new customers, upsell to existing customers, plus renewal orders. Total orders may vary from quarter to quarter due to the timing of renewal orders, which will fluctuate in amount due to timing and length of expiring subscription terms. Similarly, total new orders and upsell orders will fluctuate in amount due to term length.
To better understand new orders, management tracks the first year value of new orders as well as the total order value for the subscription term because total order value will exceed the first year value on multi-year orders. By segregating the first year value of new orders, we eliminate the fluctuation in total order amount caused by the dollar impact of multi-year contracts. We refer to this metric as New First Year Orders (“NFYOs”).
Our backlog consists of the total order value of contracted business that has not yet been recognized into revenue. Backlog is calculated by adding to the existing contracted order value the total value of all orders booked in the period (e.g., quarterly) less the value of revenue recognized for that period. Although orders are non-cancellable, occasionally we adjust backlog for customer bankruptcy or change of term, but these instances are rare and do not materially impact the backlog amount. The backlog will grow if the value of total orders added in a period exceeds the value of revenue recognized in that period. Conversely, the backlog amount will decline if revenue recognized exceeds the total order value added for the period. A decline in backlog may result from fluctuations in total orders caused by timing of renewal orders described above as well as the shortening of the average term of our contracts.
We retain approximately 90% of our recurring revenue on an annual basis. We calculate this percentage by identifying the current period revenue less revenue associated with orders for new services received in the prior twelve month period and comparing this amount to the total revenue in the corresponding prior year period. Deferred revenue is the value of contracted business that has been paid but has not been recognized as revenue. See description of the components of the backlog following in Item 7 of this Form 10-K under the heading, “Backlog and Orders.”
Our revenue growth is dependent on our ability to sell subscription services to new customers, upsell new services or increase volume with existing customers and retain existing customers by renewing their subscription services. Generally, if annual NFYOs exceed the annual value of cancelled subscriptions, revenue should grow. However, revenue growth may fluctuate due to timing of deployment of new services and subscription cancellations. For example, a new order reported in NFYOs in one quarter may not be deployed to the customer until the following quarter and therefore delay commencement of revenue recognition. Similarly, a cancellation of a contract with an expiration in the first month of a quarter will have a higher negative impact on revenue in the quarter than a contract of the same amount with an expiration in the last month of a quarter. The impact of these quarter to quarter fluctuations tends to diminish over annual periods making year over year quarterly revenue comparisons more indicative of revenue growth than sequential quarterly revenue comparisons.
Our operations and future prospects are further discussed throughout this “Management’s Discussion and Analysis of Financial Condition and Results of Operations” (“MD&A”).
There are no assurances we will be successful in our efforts to achieve continued growth. Our continued growth depends on the timely development and market acceptance of our products and services. See “Item 1A. Risk Factors” for more information on the risks relative to our operations and future prospects.
Revenue
Revenue increased by 9% in 2017 compared with 2016. Our revenue growth was driven by our acquisitions of Greenview products and customers, a subscription model that continues to yield steady additions to the subscriber base, and a high rate of renewing existing customers.
Critical Accounting Policies and Estimates
In preparing our consolidated financial statements, we make estimates, assumptions and judgments that can have a significant impact on revenue, income from operations and net income, as well as the value of certain assets and liabilities on our consolidated balance sheet. The application of our critical accounting policies requires an evaluation of a number of complex criteria and significant accounting judgements by us. Management bases its estimates on historical experience and on various other assumptions that are believed to be reasonable under the circumstances, the results of which form the basis for making judgements about the carrying values of assets and liabilities. We evaluate our estimates on a regular basis and make changes accordingly. Senior management has discussed the development, selection and disclosure of these estimates with the Audit Committee of our Board of Directors. Actual results may materially differ from these estimates under different assumptions or conditions. If actual results were to differ from these estimates materially, the resulting changes could have a material adverse effect on our consolidated financial statements.
21
We consider accounting policies to be critical when they require us to make assumptions about matters that are highly uncertain at the time the accounting estimate is made and when different estimates that our management reasonably has used have a material effect on the presentation of our financial condition, changes in financial condition or results of operations. Management believes the following critical accounting policies reflect our more significant estimates and assumptions used in the preparation of the consolidated financial statements.
Our critical accounting policies included the following:
|
|
• |
Revenue recognition |
|
|
• |
Income taxes |
|
|
• |
Valuation of goodwill and other intangible assets |
|
|
• |
Stock-based compensation costs |
For additional discussion of the Company’s significant accounting policies, refer to Note 2 to our consolidated financial statements.
Revenue Recognition
We develop market, and support applications that connect, protect and deliver information in a secure manner. We derive our revenue from subscription fees for rights related to the use of our software. Software subscription terms typically range from one to five years.
Revenue is recognized when all of the following have been met:
|
|
• |
persuasive evidence of an arrangement exists, |
|
|
• |
delivery has occurred or services have been rendered, |
|
|
• |
the price is fixed and determinable, and |
|
|
• |
collectability is probable. |
Discounts provided to customers are recorded as reductions in revenue.
We have determined that substantially all of our revenue arrangements are in the scope of the software revenue recognition rules. Multiple elements in our software arrangements are sold as a single unit consisting of the following elements: (i) subscription licensed software delivered to the customer’s site, (ii) ongoing customer support and (iii) access to our hosted encryption network (Zix encryption network) during the term of the agreement.
|
|
(i) |
Software at the customer site performs critical functions of the email encryption process and is the predominant element in our arrangements. Actions performed by the software at the customer site include identifying when encryption is needed through the use of filters and lexicons, determining the best method of delivery (BMOD) by examining secure connection options and selecting the BMOD. BMOD is a key marketing differentiator for us and is defined as the most secure and easiest method to deliver encrypted email. Customers can install the software on their own hardware or we can deliver hardware that we own to the customer site. |
|
|
(ii) |
Customer support includes unspecified software upgrades, updates and bug fixes and access to live technical support technicians and on-line knowledge resources |
|
|
(iii) |
The Zix encryption network includes access to our central network which facilitates transparent encrypted email exchange among all of our customers by providing public encryption keys (asymmetrical encryption requires two keys- a public key provided by the central network and a private key generated by the software at the customer site). The delivered software element is essential to the functionality and utility of this central network. The network also enables our customers to send encrypted emails to non-Zix customer recipients through a portal. |
Approximately 19% of our revenue in 2017 was derived from hosted email encryption solutions. We apply general revenue recognition guidance to these hosted arrangements.
In all revenue arrangements we cannot determine vendor specific objective evidence (VSOE) and we cannot establish separate units of accounting for the multiple elements of our arrangements that are bundled and sold as one unit. All revenue arrangements are sales of subscription based (i.e. time-based) licenses. We defer revenue until the software is delivered and the service is deployed. Upon deployment, we commence revenue recognition and revenue is recognized ratably over the subscription period generally ranging from one to three years.
22
Deferred tax assets are recognized if it is “more likely than not” that the benefit of the deferred tax asset will be realized on future federal or state income tax returns. At December 31, 2017, we provided a valuation allowance against a significant portion, $30.8 million, of our accumulated U.S. deferred tax assets. This significant valuation allowance reflects our historical losses and the uncertainty of future taxable income sufficient to utilize net operating loss carryforwards prior to their expiration. Our total deferred tax asset not subject to a valuation allowance is valued at $25.6 million, and consists of $20.9 million for federal net operating loss carryforwards, $877 thousand relating to temporary timing differences between U.S. generally accepted accounting principles (“GAAP”) and tax-related expense, $2.3 million relating to U.S. state income tax credits, and $1.5 million related to Alternative Minimum Tax credits. If U.S. taxable income increases from its current level in a future period or if the facts and circumstances on which our estimates and assumptions are based were to change, thereby impacting the likelihood of realizing the deferred tax assets, judgement would have to be applied in determining the amount of valuation allowance no longer required. Reversal of all or a part of this valuation allowance could have a significant positive impact on operating results in the period that it becomes more likely than not that certain of the Company’s deferred tax assets will be realized. Alternatively, should our future income decrease from current levels, a resulting increase to all or a part of this valuation allowance could also have a significant negative impact on our operating results.
Valuation of Goodwill and Other Intangible Assets
We account for the valuation of goodwill and other intangible assets after classifying intangible assets into three categories: (1) intangible assets with finite lives subject to amortization; (2) intangible assets with indefinite lives not subject to amortization; and (3) goodwill. For intangible assets with finite lives, tests for impairment must be performed if conditions exist that indicate that the carrying value may not be recoverable. For intangible assets with indefinite lives and goodwill, tests for impairment must be performed at least annually or more frequently if events or circumstances indicate that assets might be impaired.
Goodwill was $8.5 million, or 10%, and $2.2 million, or 3% of total assets, in each of the years ended December 31, 2017 and 2016, respectively.
We evaluate the goodwill for impairment annually in the fourth quarter, or when there is reason to believe that the value has been diminished or impaired. Evaluations for possible impairment are based upon a comparison of the estimated fair value of the reporting unit to which the goodwill has been assigned, versus the sum of the carrying value of the assets and liabilities of that unit including the assigned goodwill value. We include our entire Company as the reporting unit. The fair values used in this evaluation are estimated based on the Company’s market capitalization, which is based on the Company’s outstanding common stock and market price of the stock. Impairment is deemed to exist if the net book value of the unit exceeds its estimated fair value. We have evaluated our goodwill and determined no impairment adjustment is required.
Our intangible assets with finite lives are amortized using a straight-line basis over their economic useful lives.
Stock-based Compensation
Our share-based awards include stock options, restricted stock awards and restricted stock units. We have non-qualified stock options outstanding to employees and directors under various stock option plans. The plans require the exercise price of options granted under these plans to equal or exceed the fair market value of the Company’s common stock on the date of grant. The options, subject to termination of employment, generally expire ten years from the date of grant. Employee stock options typically vest pro-rata and quarterly over three or four years. Restricted stock is issued to the employee at grant but is subject to transfer restrictions. Stock is issued in exchange for restricted stock units when vesting conditions are met. The transfer restrictions and vesting conditions may be time- or performance-based. Restricted stock and restricted stock units typically vest pro-rata annually over three or four years. We use the straight-line amortization method for recognizing stock-based compensation costs. The weighted average grant-date fair value of awards of restricted stock, and restricted stock units is based on quoted market price of the Company’s common stock on the date of grant. Option, restricted stock and restricted stock unit grants to employees, officers and directors frequently contain accelerated vesting provisions upon the occurrence of a change of control, as defined in the applicable option agreements.
Full Year 2017 Summary of Operations
Financial
|
|
• |
Revenue for 2017 was $65.7 million compared with $60.1 million in 2016 and $54.7 million in 2015. |
|
|
• |
Gross margin for 2017 was $53.1 million or 81% of revenues compared with $49.6 million or 82% of revenues in 2016 and with $45.1 million or 82% of revenues in 2015. |
23
|
|
• |
Net income (loss) per diluted share was $(0.15) for 2017 compared with $0.11 for 2016 and $0.09 for 2015. |
|
|
• |
Unrestricted cash was $33.0 million on December 31, 2017. |
Results of Operations
Revenue
The following table sets forth a year-over-year comparison of our total revenues:
|
|
|
Year Ended December 31, |
|
|
Variance 2017 vs. 2016 |
|
|
Variance 2016 vs. 2015 |
|
|||||||||||||||||||
|
(In thousands) |
|
2017 |
|
|
2016 |
|
|
2015 |
|
|
$ |
|
|
% |
|
|
$ |
|
|
% |
|
|||||||
|
Revenues |
|
$ |
65,663 |
|
|
$ |
60,144 |
|
|
$ |
54,713 |
|
|
$ |
5,519 |
|
|
|
9 |
% |
|
$ |
5,431 |
|
|
|
10 |
% |
Our growth model seeks to continually add new users to the subscriber base, while at the same time retaining a high percentage of existing subscribers whose subscriptions are up for renewal. In the year ended December 31, 2017, excluding our Greenview sales, we categorized our revenue in the following core verticals: 49% healthcare, 28% financial services, 7% government sector, and 16% as other. In the year ended December 31, 2016, we categorized our revenue in the following core verticals: 51% healthcare, 28% financial services, 7% government sector, and 14% as other. Additionally, sales continued from a wide base of distributors – new first year orders (“NFYO’s”) derived from our value-added resellers, OEM and other third party distribution channels for 2017 were 56% of total NFYOs compared to 57% in 2016 and 64% in 2015. We measure additions to the subscriber base by NFYOs, which is defined as the portion of new orders that are expected to be recognized into revenue in the first twelve months of the contract. NFYOs are summarized in the table below:
|
|
|
Year Ended December 31, |
|
|||||||||
|
(In thousands) |
|
2017 |
|
|
2016 |
|
|
2015 |
|
|||
|
New first year order value |
|
$ |
9,340 |
|
|
$ |
9,524 |
|
|
$ |
10,158 |
|
While we introduced bundled email security pricing during 2017, our list pricing has remained generally consistent during the periods shown above. However, there are no assurances that potential increased competition in this market or other factors, including inflation, will not result in future price erosion. Price erosion, should it occur, could have a dampening effect on order growth and the revenue derived from our new orders.
Revenue Outlook:
We expect continued growth in our core Email Encryption offering and in our new products, along with increased sales from our managed security service providers and value-added reseller channels to increase our NFYOs in 2018 and increase our year-over-year revenue.
Backlog and Orders
Backlog — Our backlog was $72.6 million at December 31, 2017 compared with $81.7 million at December 31, 2016. Our decrease in backlog reflects the shorter term contractual commitment generally associated with our new customer pricing as a component of a higher touch strategy. We also had the loss of a large customer in the first quarter 2017, further contributing to the lower backlog. The backlog is comprised of contractual commitments that we expect to amortize into revenue. As of December 31, 2017, the backlog was comprised of the following elements: $29.5 million of deferred revenue that has been billed and paid, $7.6 million billed but unpaid, and approximately $35.5 million of unbilled contracts.
The backlog is recognized into revenue ratably as the services are performed. Approximately 62% of the total backlog is expected to be recognized as revenue during the next twelve months.
Orders — Total orders in 2017 were $58.9 million compared with $68.6 million in 2016. Total orders are comprised of contract renewals, NFYOs, and in the case of new multi-year contracts, the years beyond the first year of service.
24
The following table sets forth a year-over-year comparison of the cost of revenue.
|
|
|
Year Ended December 31, |
|
|
Variance 2017 vs. 2016 |
|
|
Variance 2016 vs. 2015 |
|
|||||||||||||||||||
|
(In thousands) |
|
2017 |
|
|
2016 |
|
|
2015 |
|
|
$ |
|
|
% |
|
|
$ |
|
|
% |
|
|||||||
|
Cost of revenue |
|
$ |
12,602 |
|
|
$ |
10,533 |
|
|
$ |
9,593 |
|
|
$ |
2,069 |
|
|
|
20 |
% |
|
$ |
940 |
|
|
|
10 |
% |
Cost of revenue is comprised of expenses related to operating and maintaining the ZixData Center, a field deployment team, customer service and support and the amortization of Company-owned, customer-based computer appliances. The 20% increase in cost of revenue in 2017 compared with 2016 reflected in the table above resulted primarily from increases in average headcount expense, which now include our ZixProtect support team gained in the Greenview acquisition in March 2017. We are also incurring costs associated with leased equipment currently supporting Greenview customers and we are amortizing expense resulting from the acquisition of Greenview’s internally developed software.
The 10% increase in cost of revenue in 2016 compared with 2015 reflected in the table above resulted primarily from increases in average headcount, software maintenance and license support, costs associated with hardware sales related to our Cisco partnership as well as depreciation expense related to networking equipment. These investments support growth in customers and users.
Research and Development Expenses
The following table sets forth a year-over-year comparison of our research and development expenses:
|
|
|
Year Ended December 31, |
|
|
Variance 2017 vs. 2016 |
|
|
Variance 2016 vs. 2015 |
|
|||||||||||||||||||
|
(In thousands) |
|
2017 |
|
|
2016 |
|
|
2015 |
|
|
$ |
|
|
% |
|
|
$ |
|
|
% |
|
|||||||
|
Research and development expenses |
|
$ |
10,980 |
|
|
$ |
9,553 |
|
|
$ |
8,317 |
|
|
$ |
1,427 |
|
|
|
15 |
% |
|
$ |
1,236 |
|
|
|
|
15% |
Research and development expenses consist primarily of salary, benefits and stock-based compensation for our development staff, independent contractor expense, and other direct and indirect costs associated with enhancing our existing products and services and developing new products and services.
The 15% increase in research and development expense in 2017 compared with 2016 reflected in the table above resulted primarily from additional headcount expense, which now includes ZixProtect R&D employees gained in the Greenview acquisition in March 2017.
The 15% increase in research and development expense in 2016 compared with 2015 reflected in the table above resulted primarily from increased in average headcount focused on development of our core email encryption portfolio, including performance enhancements to our hosted service solutions, and upgrades to our ZixOne product.
Selling and Marketing Expenses
The following table sets forth a year-over-year comparison of our selling and marketing expenses:
|
|
|
Year Ended December 31, |
|
|
Variance 2017 vs. 2016 |
|
|
Variance 2016 vs. 2015 |
|
|||||||||||||||||||
|
(In thousands) |
|
2017 |
|
|
2016 |
|
|
2015 |
|
|
$ |
|
|
% |
|
|
$ |
|
|
% |
|
|||||||
|
Selling and marketing expenses |
|
$ |
20,472 |
|
|
$ |
19,015 |
|
|
$ |
18,075 |
|
|
$ |
1,457 |
|
|
|
8 |
% |
|
$ |
940 |
|
|
|
|
5% |
Selling and marketing expenses consist primarily of salary, commissions, travel, stock-based compensation and employee benefits for selling and marketing personnel as well as costs associated with promotional activities and advertising.
The $1.5 million increase in selling and marketing expense in 2017 compared with 2016 resulted from the addition of sales leadership, sales executives, and the buildout of our Customer Success team. Additional amortization expense resulting from Greenview’s customer base and brand were offset by decreased advertising as compared to our 2016 branding initiative.
The $0.9 million increase in selling and marketing expense in 2016 compared with 2015 resulted primarily from our 2016 branding initiative and planned increase in advertising and promotional expenses, as well as higher payroll costs associated with enhancing our product management team.
25
General and Administrative Expenses
The following table sets forth a year-over-year comparison of our general and administrative expenses:
|
|
|
Year Ended December 31, |
|
|
Variance 2017 vs. 2016 |
|
|
Variance 2016 vs. 2015 |
|
|||||||||||||||||||
|
(In thousands) |
|
2017 |
|
|
2016 |
|
|
2015 |
|
|
$ |
|
|
% |
|
|
$ |
|
|
% |
|
|||||||
|
General and administrative expenses |
|
$ |
11,399 |
|
|
$ |
11,727 |
|
|
$ |
10,812 |
|
|
$ |
(328 |
) |
|
|
(3 |
%) |
|
$ |
915 |
|
|
|
8 |
% |
General and administrative expenses consist primarily of salary and bonuses, travel, stock-based compensation and benefits for administrative and executive personnel as well as fees for professional services and other general corporate activities.
The $0.3 million decrease in general and administrative expense from 2017 compared with 2016 resulted from a $2.6 million reduction in legal fees specific to intellectual property litigation, offset by increased headcount and stock-based compensation expenses, revaluation of earn-out costs associated with our Greenview acquisition, the addition of the Greenview office, and investment in an ERP solution.
The $0.9 million increase in general and administrative expense from 2016 compared with 2015 resulted primarily from an increase in litigation fees associated with defense our intellectual property and other consulting fees. These increases were partially offset by a decrease in year over year severance costs related to transition within our executive team.
Income Taxes
Our Company or one of our subsidiaries files income tax returns in the U.S. federal jurisdiction and various states and in the Canadian federal and provincial jurisdictions. We recognize and measure uncertain tax positions using a two-step approach. The first step is to evaluate the tax position for recognition by determining if the weight of available evidence indicates that it is more likely than not that the position will be sustained on audit, including resolution of related appeals or litigation processes, if any. The second step is to measure the tax benefit as the largest amount that is more than 50% likely of being realized upon settlement.
Our Company incurred tax expense of $18.6 million, $3.7 million, and $3.1 million for 2017, 2016, and 2015, respectively. On December 22, 2017, the U.S. enacted the Tax Act which significantly changed U.S. tax law. The Tax Act lowered the Company’s statutory tax rate from 35% to 21% effective January 1, 2018. At December 31, 2017, the Company adjusted its deferred tax balances to reflect the new tax rate that resulted in tax expense of $12.5 million. For all years presented, tax expense represented deferred tax expense, refundable U.S. Alternative Minimum Tax, U.S. research and development credits, non-U.S. taxes payable related to the operations of the Company’s Canadian subsidiary established in late 2002, and state income taxes.
Significant judgement is required in determining any valuation allowance recorded against deferred tax assets. In assessing the need for a valuation allowance, we consider available evidence, including past earnings, estimates of future taxable income, and the feasibility of tax planning strategies. At December 31, 2017, the Company partially reserved its U.S. net deferred tax assets due to the uncertainty of future taxable income sufficient to utilize net loss carryforwards prior to their expiration. The portion of the Company’s deferred tax asset not reserved was $25.6 million. The majority of this unreserved portion related to $20.9 million U.S. net operating losses (“NOLs”) because we believe the Company will generate sufficient taxable income in future years to utilize these NOLs prior to their expiration. The remaining balance consists of $0.9 million relating to temporary timing differences between GAAP and tax-related expense, $2.3 million relating to U.S. state tax income credits, and $1.5 million related to Alternative Minimum Tax credits.
We have determined that utilization of existing NOLs against future taxable income is not limited by Section 382 of the Internal Revenue Code. Future ownership changes, however, may limit the Company's ability to fully utilize its existing net operating loss carryforwards against any future taxable income.
If we begin to generate additional U.S. taxable income in a future period or if the facts and circumstances on which our current estimates and assumptions are based were to change, thereby impacting the likelihood of realizing a greater or lesser amount of our deferred tax assets, judgement would have to be applied in determining the amount of valuation allowance required. Adjusting our valuation allowance could have a significant impact on operating results in the period that it becomes more likely than not that an additional portion of our deferred tax assets will or will not be realized.
Our provision for income taxes is subject to volatility and could be adversely impacted by earnings being lower or higher than anticipated; by tax effects of nondeductible compensation; or by changes in tax laws, regulations, or accounting principles, including accounting for uncertain tax positions or interpretations. Significant judgment is required to determine the recognition and measurement applicable to all income tax positions. This includes the potential recovery of previously paid taxes, which if settled
26
unfavorably could adversely affect our provision for income taxes or additional paid-in capital. In addition, our income tax returns are subject to examination by the Internal Revenue Service and other tax authorities. We regularly assess the likelihood of adverse outcomes resulting from these examinations to determine the adequacy of our provision for income.
Net Income (Loss)
Net Income (Loss) – The Company generated a net loss of $8.1 million in 2017 compared with net income of $5.8 million and $5.0 million in 2016 and 2015, respectively. The decrease in our net income is primarily due to higher tax expense resulting from the adjustment to our deferred tax asset following 2017 tax-reform legislation, as discussed above. This expense was partially offset by revenue growth.
Liquidity and Capital Resources
Overview
Based on our 2017 financial results and current expectations, we believe our cash and cash equivalents, and cash generated from operations, will satisfy our working capital needs, capital expenditures, investment requirements, contractual obligations, commitments, future customer financings, and other liquidity requirements associated with our operations through at least the next twelve months. We plan for and measure our liquidity and capital resources through an annual budgeting process. During 2017, our cash flow from operations was $18.2 million, which represents an increase over the $15.3 million cash flow from operations during 2016. At December 31, 2017, our cash and cash equivalents totaled $33.0 million, and we had no debt. This represents a $6.6 million increase over our cash balance as of December 31, 2016, despite our expenditures during 2017 of $8.2 million in business acquisitions and $3.8 million under a share repurchase program.
For the year ended December 31, 2017, we achieved 9% growth in revenue, 81% gross margin and strong cash collections. While future results cannot be guaranteed, we expect these trends to continue in the foreseeable future, and believe a significant portion of our spending is discretionary and flexible and that we have the ability to adjust overall cash spending to react, as needed, to any shortfalls in projected cash.
Sources and Uses of Cash
|
|
|
Years Ended December 31, |
|
|||||||||
|
(In thousands) |
|
2017 |
|
|
2016 |
|
|
2015 |
|
|||
|
Net cash provided by operations |
|
$ |
18,204 |
|
|
$ |
15,251 |
|
|
$ |
15,617 |
|
|
Net cash used in investing activities |
|
$ |
(11,285 |
) |
|
$ |
(2,136 |
) |
|
$ |
(1,951 |
) |
|
Net cash used in financing activities |
|
$ |
(367 |
) |
|
$ |
(15,322 |
) |
|
$ |
(6,687 |
) |
Our primary source of liquidity from operations was the collection of revenue in advance from our customers, accounts receivable from our customers, and the management of the timing of payments to our vendors and service providers.
Cash used in our investing activities for 2017 consisted of $8.2 million, net of cash acquired, used in the acquisition of Greenview and EMS technology. We additionally purchased $2.2 million of computer and networking equipment, including Greenview equipment with a provisional fair value of $228 thousand, and invested $802 thousand in new systems to modernize our business processes. Cash used in our investing activities for 2016 consisted primarily of computer and networking equipment purchases to improve our capacity to provide hosting services.
Financing activities in 2017 include the receipt of $4.2 million from the exercise of stock options offset by $3.8 million used in a $10 million share repurchase program authorized by our board of directors in April 2017, and $762 thousand used in the repurchase of common stock related to the tax impact of vesting restricted awards. Cash used in 2016 included $15.0 million used to repurchase our common stock and $527 thousand used in the repurchase of common stock related to the tax impact of vesting restricted awards offset by $205 thousand received from the exercise of stock options. The stock repurchases were made pursuant to a stock repurchase program authorized by our board of directors, which was completed July 2016.
27
We have significant options outstanding that are currently vested. There is no assurance that any of these options will be exercised; therefore the extent of future cash inflow and related dilution from additional option activity is not certain. The following table summarizes the options that were outstanding as of December 31, 2017. The vested options are a subset of the outstanding options. The value of the options is the number of options exercisable into shares multiplied by the exercise price for each share.
|
|
|
Summary of Outstanding Options |
|
|||||||||||||
|
Exercise Price Range |
|
Outstanding Options |
|
|
Total Value of Outstanding Options (In thousands) |
|
|
Vested Options (included in outstanding options) |
|
|
Total Value of Vested Options (In thousands) |
|
||||
|
$1.11 - $1.99 |
|
|
73,564 |
|
|
$ |
112 |
|
|
|
73,564 |
|
|
$ |
112 |
|
|
$2.00 - $3.49 |
|
|
441,813 |
|
|
|
1,137 |
|
|
|
441,813 |
|
|
|
1,137 |
|
|
$3.50 - $4.99 |
|
|
505,937 |
|
|
|
1,929 |
|
|
|
316,999 |
|
|
|
1,214 |
|
|
Total |
|
|
1,021,314 |
|
|
$ |
3,178 |
|
|
|
832,376 |
|
|
$ |
2,463 |
|
Liquidity Summary
Based on our current 2018 budget plans, we believe we have adequate resources and liquidity to sustain operations for at least the next twelve months.
Off-Balance Sheet Arrangements
None.
Contractual Obligations and Contingent Liabilities and Commitments
We have total contractual obligations of $1.6 million over the next year and $4.2 million over the next three years primarily consisting of various operating office lease agreements. The lease of our headquarters facility in Dallas expires in 2024.
A summary of our fixed contractual obligations and commitments at December 31, 2017, is as follows:
|
|
|
Payments Due by Period |
|
|||||||||||||||||
|
(In thousands) |
|
Total |
|
|
1 Year |
|
|
2-3 Years |
|
|
4-5 Years |
|
|
> 5 Years |
|
|||||
|
Operating leases |
|
$ |
8,340 |
|
|
$ |
1,631 |
|
|
$ |
2,584 |
|
|
$ |
2,148 |
|
|
$ |
1,977 |
|
We have severance agreements with certain employees which would require us to pay up to approximately $6.1 million if all such employees were terminated from employment with our Company following a triggering event (e.g., change of control) as defined in the severance agreements.
New Accounting Standards
Revenue Recognition
In May 2014, the FASB issued Accounting Standards Update No. 2014-09, Revenue from Contracts with Customers (ASU 2014-09), which supersedes most current revenue recognition guidance under U.S. GAAP. The core principle of ASU 2014-09 is to recognize revenues when promised goods or services are transferred to customers in an amount that reflects the consideration to which an entity expects to be entitled for those goods or services. ASU 2014-09 defines a five step process to achieve this core principle and, in doing so, more judgement and estimates may be required within the revenue recognition process than are required under existing U.S. GAAP.
The standard is effective for us beginning in 2018, and requires using either of the following transition methods: (i) a full retrospective approach reflecting the application of the standard in each prior reporting period with the option to elect certain practical expedients, or (ii) a retrospective approach with the cumulative effect of initially adopting ASU 2014-09 recognized at the date of adoption (which includes additional footnote disclosures). We have begun an assessment of the guidance and expect our revenue to remain primarily unchanged. We are additionally analyzing the effect of the new guidance on the timing of our recognition of the incremental costs of obtaining contracts. While we are still evaluating the impact of our pending adoption of ASU 2014-09 on our consolidated financial statements, we anticipate applying the modified retrospective approach of adopting the standard. We also expect to record an adjustment of approximately $7 million to our retained earnings opening balance as of January 1, 2018.
28
In February 2016, the FASB issued Accounting Standards Update No. 2016-02 Leases (Topic 842), which introduces a lessee model that brings most leases onto the balance sheet. The new ASU eliminates the requirement in U.S. GAAP that entities use bright-line tests in determining lease classifications and requires lessors to provide additional transparency into their exposure to the changes in value of their residual assets and how they manage that exposure.
The standard is effective for us beginning 2019. We expect the valuation of right to use assets and lease liabilities to be the present value of our forecasted future lease commitments and are assessing the discount rate to be applied in these valuations. We are currently evaluating the potential impact of this new guidance on our consolidated financial statements.
Accounting for Share-Based Payments
In March 2016, the FASB issued Accounting Standards Update No. 2016-09, Improvements to Employee Share-Based Payment Accounting (Topic 718), which simplifies several aspects of the accounting for employees of the accounting for employee share-based payment transactions including the accounting for income taxes, forfeitures, and statutory tax withholding requirements, as well as classification in the statement of cash flows.
The standard became effective for us beginning 2017. We completed an evaluation of the impact of this new guidance in the first quarter 2017, which resulted in $414 thousand in previously unrecognized excess tax benefits being recorded on a modified retrospective basis through a cumulative-effect adjustment to retained earnings. The balance was fully reserved, resulting in a net zero impact to our retained earnings.
Item 7A. Quantitative and Qualitative Disclosures About Market Risk
We do not believe that we face exposure to material market risk with respect to our cash, cash equivalents and restricted cash investments, which totaled $33.0 and $26.5 million at December 31, 2017 and 2016, respectively. We held no marketable securities and no debt as of December 31, 2017 and 2016.
Item 8. Financial Statements and Supplementary Data
The information required by this Item 8 begins on page F-1 of this Annual Report on Form 10-K.
Item 9. Changes in and Disagreements with Accountants on Accounting and Financial Disclosure
None.
Item 9A. Controls and Procedures
Effectiveness of Disclosure Controls and Procedure
In accordance with Rule 13a-15(b) of the Exchange Act, as of the end of the period covered by this Annual Report on Form 10-K, management evaluated, with the participation of our principal executive officer and principal financial officer, the effectiveness of the design and operation of the Company’s disclosure controls and procedures (as defined in Rule 13a-15(e) under the Exchange Act). Based on their evaluation of these disclosure controls and procedures, they have concluded that our disclosure controls and procedures were effective as of the date of such evaluation.
Certifications of our principal executive officer and our principal accounting officer, which are required in accordance with Rule 13a- 14 of the Exchange Act, are attached as exhibits to this Annual Report. This “Controls and Procedures” section includes the information concerning controls evaluation referred to in the certifications, and it should be read in conjunction with the certifications for a more complete understanding of the topics presented.
Management’s Annual Report on Internal Control Over Financial Reporting
Management is responsible for establishing and maintaining adequate internal control over financial reporting, as such term is defined in Exchange Act Rule 13a-15(f). Because of its inherent limitations, internal control over financial reporting may not prevent or detect misstatements. Also, projections of any evaluation of effectiveness to future periods are subject to risk that controls may become inadequate because of changes in conditions, or that the degree of compliance with the policies or procedures may deteriorate.
29
Management assessed the effectiveness of our internal control over financial reporting as of December 31, 2017. In making this assessment, management used the criteria set forth in 2013 by the Committee of Sponsoring Organizations of the Treadway Commission in “Internal Control—Integrated Framework”. Based on this assessment, our management concluded that, as of December 31, 2017, our internal control over financial reporting was effective based on those criteria.
The effectiveness of our internal control over financial reporting as of December 31, 2017, has been audited by Whitley Penn LLP, an independent registered public accounting firm, as stated in their report which is included herein.
Changes in Internal Controls over Financial Reporting
During the three months ended December 31, 2017, there have been no changes in our internal control over financial reporting identified in connection with the evaluation described above that have materially affected or are reasonably likely to materially affect internal control over financial reporting.
30
REPORT OF INDEPENDENT REGISTERED PUBLIC ACCOUNTING FIRM
Board of Directors and Stockholders
Zix Corporation
Opinion on Internal Control Over Financial Reporting
We have audited Zix Corporation and subsidiaries’ (the “Company”) internal control over financial reporting as of December 31, 2017, based on criteria established in 2013 Internal Control—Integrated Framework issued by the Committee of Sponsoring Organizations of the Treadway Commission (COSO). In our opinion, the Company maintained, in all material respects, effective internal control over financial reporting as of December 31, 2017, based on criteria established in 2013 Internal Control—Integrated Framework issued by the Committee of Sponsoring Organizations of the Treadway Commission (COSO).
We also have audited, in accordance with the standards of the Public Company Accounting Oversight Board (United States) (“PCAOB”), the consolidated balance sheets of the Company, as of December 31, 2017 and 2016, and the related consolidated statements of operations, stockholders’ equity, and cash flows for each of the years in the three-year period ended December 31, 2017, and our report dated March 7, 2018 expressed an unqualified opinion on those consolidated financial statements.
Basis for Opinion
The Company’s management is responsible for maintaining effective internal control over financial reporting, and for its assessment of the effectiveness of internal control over financial reporting, included in the accompanying Management’s Report on Internal Control Over Financial Reporting. Our responsibility is to express an opinion on the entity’s internal control over financial reporting based on our audit. We are a public accounting firm registered with the PCAOB and are required to be independent with respect to the Company in accordance with the U.S. federal securities laws and the applicable rules and regulations of the Securities and Exchange Commission and the PCAOB.
We conducted our audit in accordance with the standards of the PCAOB. Those standards require that we plan and perform the audit to obtain reasonable assurance about whether effective internal control over financial reporting was maintained in all material respects. Our audit of internal control over financial reporting included obtaining an understanding of internal control over financial reporting, assessing the risk that a material weakness exists, and testing and evaluating the design and operating effectiveness of internal control based on the assessed risk. Our audit also included performing such other procedures as we considered necessary in the circumstances. We believe that our audit provides a reasonable basis for our opinion.
Definition and Limitations of Internal Control Over Financial Reporting
An entity’s internal control over financial reporting is a process designed to provide reasonable assurance regarding the reliability of financial reporting and the preparation of financial statements for external purposes in accordance with accounting principles generally accepted in the United States of America. An entity’s internal control over financial reporting includes those policies and procedures that (1) pertain to the maintenance of records that, in reasonable detail, accurately and fairly reflect the transactions and dispositions of the assets of the entity; (2) provide reasonable assurance that transactions are recorded as necessary to permit preparation of financial statements in accordance with generally accepted accounting principles, and that receipts and expenditures of the Company are being made only in accordance with authorizations of management and directors of the entity; and (3) provide reasonable assurance regarding prevention or timely detection of unauthorized acquisition, use, or disposition of the Company’s assets that could have a material effect on the financial statements.
Because of its inherent limitations, internal control over financial reporting may not prevent or detect misstatements. Also, projections of any evaluation of effectiveness to future periods are subject to the risk that controls may become inadequate because of changes in conditions, or that the degree of compliance with the policies or procedures may deteriorate.
/s/ WHITLEY PENN LLP
Dallas, Texas
March 7, 2018
31
None.
32
Item 10. Directors, Executive Officers and Corporate Governance
Certain information required by this Item 10 is incorporated by reference from our Proxy Statement related to the 2018 Annual Meeting of Shareholders under the sections “OTHER INFORMATION YOU NEED TO MAKE AN INFORMED DECISION — Directors, Executive Officers and Significant Employees” and “Section 16(a) Beneficial Ownership Reporting Compliance,” and “CORPORATE GOVERNANCE — Code of Ethics,” and “Nominating and Corporate Governance Committee, Selection of Director Nominees,” and “Audit Committee.”
The board of directors has adopted a Code of Conduct and Code of Ethics that applies to all directors, officers and employees of the Company. A copy of this document is available on our website at www.zixcorp.com under “Corporate Governance.” Any waiver or amendment of the Code of Ethics with respect to our chief executive officer and senior financial officers will be publicly disclosed as required by applicable law and regulation, including by posting the waiver on our website.
Item 11. Executive Compensation
The information required by this Item 11, including certain information pertaining to Company securities authorized for issuance under equity compensation plans, is incorporated by reference from our Proxy Statement related to the 2018 Annual Meeting of Shareholders under the section “COMPENSATION OF DIRECTORS AND EXECUTIVE OFFICERS.”
Item 12. Security Ownership of Certain Beneficial Owners and Management and Related Stockholder Matters
The information required by this Item 12 is incorporated by reference from our Proxy Statement related to the 2018 Annual Meeting of Shareholders under the section “SECURITY OWNERSHIP OF CERTAIN BENEFICIAL OWNERS AND MANAGEMENT” and “COMPENSATION OF DIRECTORS AND EXECUTIVE OFFICERS — Equity Compensation Plan Information.”
Item 13. Certain Relationships and Related Transactions, and Director Independence
The information required by this Item 13 is incorporated by reference from our Proxy Statement related to the 2018 Annual Meeting of Shareholders under the section “COMPENSATION OF DIRECTORS AND EXECUTIVE OFFICERS — Certain Relationships and Related Transactions” and “CORPORATE GOVERNANCE — Corporate Governance Requirements and Board Member Independence.”
Item 14. Principal Accountant Fees and Services
The information required by this Item 14 is incorporated by reference from our Proxy Statement related to the 2018 Annual Meeting of Shareholders under the section “INDEPENDENT REGISTERED PUBLIC ACCOUNTANTS.”
33
Item 15. Exhibits and Financial Statement Schedules
(a)(1) Financial Statements
See Index to Consolidated Financial Statements on page F-1 hereof.
(a)(2) Financial Statement Schedules
All schedules for which provision is made in the applicable accounting regulations of the SEC have been omitted because of the absence of the conditions under which they are required or because the information required is included in the consolidated financial statements or notes thereto.
(a)(3) Exhibits
|
Exhibit Number |
|
|
|
Description |
|
|
|
|
|
|
|
3.1 |
|
— |
|
|
|
|
|
|
|
|
|
3.2 |
|
— |
|
|
|
|
|
|
|
|
|
10.1† |
|
— |
|
|
|
|
|
|
|
|
|
10.2† |
|
— |
|
|
|
|
|
|
|
|
|
|
|
|
|
|
|
10.3† |
|
— |
|
|
|
|
|
|
|
|
|
10.4† |
|
— |
|
|
|
|
|
|
|
|
|
10.5† |
|
— |
|
|
|
|
|
|
|
|
|
|
|
|
|
|
|
10.6† |
|
— |
|
|
|
|
|
|
|
|
|
10.7† |
|
— |
|
|
|
|
|
|
|
|
|
10.8† |
|
— |
|
|
|
|
|
|
|
|
|
10.9† |
|
— |
|
|
|
|
|
|
|
|
|
10.10 |
|
— |
|
|
|
|
|
|
|
|
|
10.11 |
|
— |
|
34
|
Exhibit Number |
|
|
|
Description |
|
|
|
|
|
|
|
10.12† |
|
— |
|
|
|
|
|
|
|
|
|
10.13† |
|
— |
|
|
|
|
|
|
|
|
|
10.14† |
|
— |
|
|
|
|
|
|
|
|
|
10.15† |
|
— |
|
|
|
|
|
|
|
|
|
10.16† |
|
— |
|
|
|
|
|
|
|
|
|
10.17† |
|
— |
|
|
|
|
|
|
|
|
|
10.18† |
|
— |
|
|
|
|
|
|
|
|
|
10.19 |
|
— |
|
|
|
|
|
|
|
|
|
10.20† |
|
— |
|
|
|
|
|
|
|
|
|
10.21† |
|
— |
|
|
|
|
|
|
|
|
|
10.22*† |
|
— |
|
|
|
|
|
|
|
|
|
10.23*† |
|
— |
|
Form of Executive Restricted Stock Agreement (Qualified Performance Based Award). |
|
|
|
|
|
|
|
10.24*† |
|
— |
|
|
|
|
|
|
|
|
|
10.25*† |
|
— |
|
Form of Executive Restricted Stock Unit Agreement (Qualified Performance Based Award). |
|
|
|
|
|
|
|
10.26*† |
|
— |
|
|
|
|
|
|
|
|
|
10.27*† |
|
— |
|
Form of Non-Employee Director Deferred Stock Unit Agreement. |
|
|
|
|
|
|
|
21.1* |
|
— |
|
|
|
|
|
|
|
|
|
23.1* |
|
— |
|
Consent of Independent Registered Public Accounting Firm (Whitley Penn LLP). |
|
|
|
|
|
|
|
31.1* |
|
— |
|
|
|
|
|
|
|
|
|
31.2* |
|
— |
|
|
|
|
|
|
|
|
|
32.1** |
|
— |
|
|
|
|
|
|
|
|
|
101.1* |
|
— |
|
101. INS (XBRL Instance Document) 101. SCH (XBRL Taxonomy Extension Schema Document) 101. CAL (XBRL Calculation Linkbase Document) 101. LAB (XBRL Taxonomy Label Linkbase Document) 101. DEF (XBRL Taxonomy Linkbase Document) 101. PRE (XBRL Taxonomy Presentation Linkbase Document) |
|
* |
Filed herewith. |
|
** |
Furnished herewith. |
|
† |
Management contract or compensatory plan or arrangement. |
Not Applicable.
35
Pursuant to the requirements of Section 13 or 15(d) of the Securities Exchange Act of 1934, the Registrant has duly caused this report to be signed on its behalf by the undersigned, thereunto duly authorized, in the city of Dallas, state of Texas, on March 7, 2018.
|
|
ZIX CORPORATION |
|
|
|
|
|
|
|
By: |
/s/ DAVID E. ROCKVAM |
|
|
|
David E. Rockvam |
|
|
|
Chief Financial Officer (Principal Financial Officer and Principal Accounting Officer) |
Pursuant to the requirements of the Securities Exchange Act of 1934, this report has been signed below by the following persons on behalf of the Registrant and in the capacities indicated on March 7, 2018.
|
Signature |
|
Title |
|
|
|
|
|
/s/ DAVID J. WAGNER |
|
Chief Executive Officer, President and Director |
|
(David J. Wagner) |
|
(Principal Executive Officer) |
|
|
|
|
|
/s/ DAVID E. ROCKVAM |
|
Chief Financial Officer |
|
(David E. Rockvam) |
|
(Principal Financial Officer and Principal Accounting Officer) |
|
|
|
|
|
/s/ MARK J. BONNEY |
|
Director |
|
(Mark J. Bonney) |
|
|
|
|
|
|
|
/s/ TAHER A. ELGAMAL |
|
Director |
|
(Taher A. Elgamal) |
|
|
|
|
|
|
|
/s/ ROBERT C. HAUSMANN |
|
Chairman, Director |
|
(Robert C. Hausmann) |
|
|
|
|
|
|
|
/s/ MARIBESS L. MILLER |
|
Director |
|
(Maribess L. Miller) |
|
|
|
|
|
|
|
/s/ RICHARD D. SPURR |
|
Director |
|
(Richard D. Spurr) |
|
|
36
INDEX TO CONSOLIDATED FINANCIAL STATEMENTS
REPORT OF INDEPENDENT REGISTERED PUBLIC ACCOUNTING FIRM
Board of Directors and Stockholders
Zix Corporation
Opinion on the Financial Statements
We have audited the accompanying consolidated balance sheets of Zix Corporation and subsidiaries (the “Company”), as of December 31, 2017 and 2016, and the related consolidated statements of operations, stockholders’ equity, and cash flows for each of the years in the three-year period ended December 31, 2017, and the related notes (collectively referred to as the “financial statements”). In our opinion, the consolidated financial statements present fairly, in all material respects, the financial position of the Company as of December 31, 2017 and 2016, and the results of their operations and their cash flows for each of the three years in the period ended December 31, 2017, in conformity with accounting principles generally accepted in the United States of America.
We also have audited, in accordance with the standards of the Public Company Accounting Oversight Board (United States) (“PCAOB”), the Company’s internal control over financial reporting as of December 31, 2017, based on criteria established in 2013 Internal Control—Integrated Framework issued by the Committee of Sponsoring Organizations of the Treadway Commission (COSO), and our report dated March 7, 2018, expressed an unqualified opinion.
Basis for Opinion
These financial statements are the responsibility of the Company’s management. Our responsibility is to express an opinion on these financial statements based on our audits. We are a public accounting firm registered with the PCAOB and are required to be independent with respect to the Company in accordance with the U.S. federal securities laws and the applicable rules and regulations of the Securities and Exchange Commission and the PCAOB.
We conducted our audits in accordance with the standards of the PCAOB. Those standards require that we plan and perform the audit to obtain reasonable assurance about whether the financial statements are free of material misstatement, whether due to error or fraud. Our audits included performing procedures to assess the risks of material misstatement of the financial statements, whether due to error or fraud, and performing procedures that respond to those risks. Such procedures included examining, on a test basis, evidence regarding the amounts and disclosures in the financial statements. Our audits also included evaluating the accounting principles used and significant estimates made by management, as well as evaluating the overall presentation of the financial statements. We believe that our audits provide a reasonable basis for our opinion.
/s/ WHITLEY PENN LLP
We have served as the Company’s auditor since 2006.
Dallas, Texas
March 7, 2018
F-2
|
|
|
December 31, |
|
|||||
|
(In thousands, except share and par value data) |
|
2017 |
|
|
2016 |
|
||
|
ASSETS |
|
|
|
|
|
|
|
|
|
Current assets: |
|
|
|
|
|
|
|
|
|
Cash and cash equivalents |
|
$ |
33,009 |
|
|
$ |
26,457 |
|
|
Receivables, net |
|
|
1,389 |
|
|
|
1,209 |
|
|
Prepaid and other current assets |
|
|
3,222 |
|
|
|
2,829 |
|
|
Total current assets |
|
|
37,620 |
|
|
|
30,495 |
|
|
Property and equipment, net |
|
|
4,048 |
|
|
|
3,976 |
|
|
Intangible assets, net |
|
|
5,524 |
|
|
|
— |
|
|
Goodwill |
|
|
8,469 |
|
|
|
2,161 |
|
|
Deferred tax assets |
|
|
25,647 |
|
|
|
45,726 |
|
|
Total assets |
|
$ |
81,308 |
|
|
$ |
82,358 |
|
|
LIABILITIES AND STOCKHOLDERS’ EQUITY |
|
|
|
|
|
|
|
|
|
Current liabilities: |
|
|
|
|
|
|
|
|
|
Accounts payable |
|
$ |
1,053 |
|
|
$ |
355 |
|
|
Accrued expenses |
|
|
6,100 |
|
|
|
4,365 |
|
|
Deferred revenue |
|
|
28,362 |
|
|
|
25,773 |
|
|
Customer deposits |
|
|
1 |
|
|
|
— |
|
|
Total current liabilities |
|
|
35,516 |
|
|
|
30,493 |
|
|
Long-term liabilities: |
|
|
|
|
|
|
|
|
|
Deferred revenue |
|
|
1,087 |
|
|
|
1,448 |
|
|
Deferred rent |
|
|
1,185 |
|
|
|
1,347 |
|
|
Total long-term liabilities |
|
|
2,272 |
|
|
|
2,795 |
|
|
Total liabilities |
|
|
37,788 |
|
|
|
33,288 |
|
|
Commitments and contingencies (Note 13) |
|
|
|
|
|
|
|
|
|
Stockholders’ equity: |
|
|
|
|
|
|
|
|
|
Preferred stock, $1 par value, 10,000,000 shares authorized; none issued and outstanding |
|
|
— |
|
|
|
— |
|
|
Common stock, $0.01 par value, 175,000,000 shares authorized; 80,709,970 issued and 54,542,612 outstanding in 2017 and 78,913,266 issued and 53,643,139 outstanding in 2016 |
|
|
778 |
|
|
|
769 |
|
|
Additional paid-in capital |
|
|
381,457 |
|
|
|
374,386 |
|
|
Treasury stock, at cost; 26,167,358 common shares in 2017 and 25,270,127 common shares in 2016 |
|
|
(102,343 |
) |
|
|
(97,770 |
) |
|
Accumulated deficit |
|
|
(236,372 |
) |
|
|
(228,315 |
) |
|
Total stockholders’ equity |
|
|
43,520 |
|
|
|
49,070 |
|
|
Total liabilities and stockholders’ equity |
|
$ |
81,308 |
|
|
$ |
82,358 |
|
See notes to consolidated financial statements.
F-3
CONSOLIDATED STATEMENTS OF OPERATIONS
|
|
|
Year Ended December 31, |
|
|||||||||
|
(In thousands, except share and per share data) |
|
2017 |
|
|
2016 |
|
|
2015 |
|
|||
|
Revenues |
|
$ |
65,663 |
|
|
$ |
60,144 |
|
|
$ |
54,713 |
|
|
Cost of revenue |
|
|
12,602 |
|
|
|
10,533 |
|
|
|
9,593 |
|
|
Gross margin |
|
|
53,061 |
|
|
|
49,611 |
|
|
|
45,120 |
|
|
Research and development expenses |
|
|
10,980 |
|
|
|
9,553 |
|
|
|
8,317 |
|
|
Selling, general and administrative expenses |
|
|
31,871 |
|
|
|
30,742 |
|
|
|
28,887 |
|
|
Operating income |
|
|
10,210 |
|
|
|
9,316 |
|
|
|
7,916 |
|
|
Other income (expense): |
|
|
|
|
|
|
|
|
|
|
|
|
|
Investment and other income |
|
|
339 |
|
|
|
246 |
|
|
|
244 |
|
|
Interest expense |
|
|
— |
|
|
|
33 |
|
|
|
— |
|
|
Total other income |
|
|
339 |
|
|
|
213 |
|
|
|
244 |
|
|
Income before income taxes |
|
|
10,549 |
|
|
|
9,529 |
|
|
|
8,160 |
|
|
Income tax expense |
|
|
18,606 |
|
|
|
3,692 |
|
|
|
3,144 |
|
|
Net income (loss) |
|
$ |
(8,057 |
) |
|
$ |
5,837 |
|
|
$ |
5,016 |
|
|
Basic income (loss) per common share |
|
$ |
(0.15 |
) |
|
$ |
0.11 |
|
|
$ |
0.09 |
|
|
Diluted income (loss) per common share |
|
$ |
(0.15 |
) |
|
$ |
0.11 |
|
|
$ |
0.09 |
|
|
|
|
|
|
|
|
|
|
|
|
|
|
|
|
Weighted average shares outstanding |
|
|
|
|
|
|
|
|
|
|
|
|
|
Basic common shares outstanding |
|
|
53,430,492 |
|
|
|
53,819,772 |
|
|
|
56,421,833 |
|
|
Diluted common shares outstanding |
|
|
53,430,492 |
|
|
|
54,395,145 |
|
|
|
57,476,006 |
|
See notes to consolidated financial statements.
F-4
CONSOLIDATED STATEMENTS OF STOCKHOLDERS’ EQUITY
|
|
|
Stockholders’ Equity |
|
|||||||||||||||||||||
|
|
|
Common Stock |
|
|
Additional Paid-In |
|
|
Treasury |
|
|
Accumulated |
|
|
Total Stockholders’ |
|
|||||||||
|
(In thousands, except share data) |
|
Shares |
|
|
Amount |
|
|
Capital |
|
|
Stock |
|
|
Deficit |
|
|
Equity |
|
||||||
|
Balance, December 31, 2014 |
|
|
75,017,775 |
|
|
$ |
741 |
|
|
$ |
361,579 |
|
|
$ |
(66,882 |
) |
|
$ |
(239,168 |
) |
|
$ |
56,270 |
|
|
Issuance of common stock upon exercise of stock options |
|
|
2,668,928 |
|
|
|
26 |
|
|
|
8,648 |
|
|
|
— |
|
|
|
— |
|
|
|
8,674 |
|
|
Issuance of common stock upon vesting of restricted stock units, net |
|
|
65,750 |
|
|
|
— |
|
|
|
— |
|
|
|
— |
|
|
|
— |
|
|
|
— |
|
|
Issuance of restricted common stock, net |
|
|
100,000 |
|
|
|
— |
|
|
|
— |
|
|
|
— |
|
|
|
— |
|
|
|
— |
|
|
Employee stock-based compensation costs |
|
|
— |
|
|
|
— |
|
|
|
2,173 |
|
|
|
(361 |
) |
|
|
— |
|
|
|
1,812 |
|
|
Treasury repurchase program |
|
|
— |
|
|
|
— |
|
|
|
— |
|
|
|
(15,000 |
) |
|
|
— |
|
|
|
(15,000 |
) |
|
Net income |
|
|
— |
|
|
|
— |
|
|
|
— |
|
|
|
— |
|
|
|
5,016 |
|
|
|
5,016 |
|
|
Balance, December 31, 2015 |
|
|
77,852,453 |
|
|
|
767 |
|
|
|
372,400 |
|
|
|
(82,243 |
) |
|
|
(234,152 |
) |
|
|
56,772 |
|
|
Issuance of common stock upon exercise of stock options |
|
|
123,760 |
|
|
|
2 |
|
|
|
203 |
|
|
|
— |
|
|
|
— |
|
|
|
205 |
|
|
Issuance of common stock upon vesting of restricted stock units, net |
|
|
179,914 |
|
|
|
— |
|
|
|
— |
|
|
|
— |
|
|
|
— |
|
|
|
— |
|
|
Issuance of common stock upon vesting of performance stock units, net |
|
|
97,428 |
|
|
|
— |
|
|
|
— |
|
|
|
— |
|
|
|
— |
|
|
|
— |
|
|
Issuance of restricted common stock, net |
|
|
518,211 |
|
|
|
— |
|
|
|
— |
|
|
|
— |
|
|
|
— |
|
|
|
— |
|
|
Issuance of restricted performance common stock, net |
|
|
141,500 |
|
|
|
— |
|
|
|
— |
|
|
|
— |
|
|
|
— |
|
|
|
— |
|
|
Employee stock-based compensation costs |
|
|
— |
|
|
|
— |
|
|
|
1,783 |
|
|
|
(527 |
) |
|
|
— |
|
|
|
1,256 |
|
|
Treasury repurchase program |
|
|
— |
|
|
|
— |
|
|
|
— |
|
|
|
(15,000 |
) |
|
|
— |
|
|
|
(15,000 |
) |
|
Net income |
|
|
— |
|
|
|
— |
|
|
|
— |
|
|
|
— |
|
|
|
5,837 |
|
|
|
5,837 |
|
|
Balance, December 31, 2016 |
|
|
78,913,266 |
|
|
|
769 |
|
|
|
374,386 |
|
|
|
(97,770 |
) |
|
|
(228,315 |
) |
|
|
49,070 |
|
|
Issuance of common stock upon exercise of stock options |
|
|
932,303 |
|
|
|
9 |
|
|
|
4,197 |
|
|
|
— |
|
|
|
— |
|
|
|
4,206 |
|
|
Issuance of common stock upon vesting of restricted stock units, net |
|
|
126,167 |
|
|
|
— |
|
|
|
— |
|
|
|
— |
|
|
|
— |
|
|
|
— |
|
|
Issuance of common stock upon vesting of performance stock units, net |
|
|
20,999 |
|
|
|
— |
|
|
|
— |
|
|
|
— |
|
|
|
— |
|
|
|
— |
|
|
Issuance of restricted common stock, net |
|
|
645,623 |
|
|
|
— |
|
|
|
— |
|
|
|
— |
|
|
|
— |
|
|
|
— |
|
|
Issuance of restricted performance common stock, net |
|
|
71,612 |
|
|
|
— |
|
|
|
— |
|
|
|
— |
|
|
|
— |
|
|
|
— |
|
|
Employee stock-based compensation costs |
|
|
— |
|
|
|
— |
|
|
|
2,874 |
|
|
|
(762 |
) |
|
|
— |
|
|
|
2,112 |
|
|
Treasury repurchase program |
|
|
— |
|
|
|
— |
|
|
|
— |
|
|
|
(3,811 |
) |
|
|
— |
|
|
|
(3,811 |
) |
|
Net income (loss) |
|
|
— |
|
|
|
— |
|
|
|
— |
|
|
|
— |
|
|
|
(8,057 |
) |
|
|
(8,057 |
) |
|
Balance, December 31, 2017 |
|
|
80,709,970 |
|
|
$ |
778 |
|
|
$ |
381,457 |
|
|
$ |
(102,343 |
) |
|
$ |
(236,372 |
) |
|
$ |
43,520 |
|
See notes to consolidated financial statements.
F-5
CONSOLIDATED STATEMENTS OF CASH FLOWS
|
|
|
Year Ended December 31, |
|
|||||||||
|
(In thousands) |
|
2017 |
|
|
2016 |
|
|
2015 |
|
|||
|
Operating activities: |
|
|
|
|
|
|
|
|
|
|
|
|
|
Net income (loss) |
|
$ |
(8,057 |
) |
|
$ |
5,837 |
|
|
$ |
5,016 |
|
|
Non-cash items in net income (loss): |
|
|
|
|
|
|
|
|
|
|
|
|
|
Depreciation and amortization |
|
|
2,741 |
|
|
|
2,303 |
|
|
|
2,152 |
|
|
Employee stock-based compensation expense |
|
|
2,874 |
|
|
|
1,783 |
|
|
|
2,173 |
|
|
Changes in deferred taxes |
|
|
18,470 |
|
|
|
3,186 |
|
|
|
2,743 |
|
|
Changes in operating assets and liabilities: |
|
|
|
|
|
|
|
|
|
|
|
|
|
Receivables |
|
|
64 |
|
|
|
(711 |
) |
|
|
954 |
|
|
Prepaid and other assets |
|
|
(386 |
) |
|
|
79 |
|
|
|
(536 |
) |
|
Accounts payable |
|
|
645 |
|
|
|
(15 |
) |
|
|
(81 |
) |
|
Deferred revenue |
|
|
1,370 |
|
|
|
3,200 |
|
|
|
1,536 |
|
|
Accrued and other liabilities |
|
|
483 |
|
|
|
(411 |
) |
|
|
1,660 |
|
|
Net cash provided by operating activities |
|
|
18,204 |
|
|
|
15,251 |
|
|
|
15,617 |
|
|
Investing activities: |
|
|
|
|
|
|
|
|
|
|
|
|
|
Purchases of property and equipment |
|
|
(3,041 |
) |
|
|
(2,136 |
) |
|
|
(1,951 |
) |
|
Acquisition of business, net of cash acquired |
|
|
(8,244 |
) |
|
|
— |
|
|
|
— |
|
|
Net cash used in investing activities |
|
|
(11,285 |
) |
|
|
(2,136 |
) |
|
|
(1,951 |
) |
|
Financing activities: |
|
|
|
|
|
|
|
|
|
|
|
|
|
Proceeds from exercise of stock options |
|
|
4,206 |
|
|
|
205 |
|
|
|
8,674 |
|
|
Treasury stock |
|
|
(4,573 |
) |
|
|
(15,527 |
) |
|
|
(15,361 |
) |
|
Net cash used in financing activities |
|
|
(367 |
) |
|
|
(15,322 |
) |
|
|
(6,687 |
) |
|
Increase (decrease) in cash and cash equivalents |
|
|
6,552 |
|
|
|
(2,207 |
) |
|
|
6,979 |
|
|
Cash and cash equivalents, beginning of year |
|
|
26,457 |
|
|
|
28,664 |
|
|
|
21,685 |
|
|
Cash and cash equivalents, end of year |
|
$ |
33,009 |
|
|
$ |
26,457 |
|
|
$ |
28,664 |
|
See notes to consolidated financial statements.
F-6
NOTES TO CONSOLIDATED FINANCIAL STATEMENTS
1. Company Overview
Zix Corporation (“Zix,” the “Company,” “we,” “our,” “us”) provides email encryption, advanced threat protection, email archiving, data loss prevention (“DLP”) and Bring-Your-Own-Device (“BYOD”) solutions to meet the data protection and compliance needs of organizations primarily in the healthcare, financial services, and government sectors.
2. Summary of Significant Accounting Policies
Basis of Presentation — The accompanying consolidated financial statements include the accounts of all our wholly-owned subsidiaries and are prepared in accordance with accounting principles generally accepted in the United States of America (“U.S. GAAP”). All inter-company accounts and transactions have been eliminated in consolidation.
Use of Estimates — The preparation of consolidated financial statements in conformity with accounting principles generally accepted in the United States of America requires management to make estimates and assumptions that affect the reported amount of assets and liabilities and disclosure of contingent assets and liabilities at the date of the consolidated financial statements and the reported amounts of revenue and expenses during the reported period. Our significant estimates include primarily those required in the valuation or impairment analysis of goodwill, property and equipment, revenue recognition, allowances for doubtful accounts, stock-based compensation, litigation accruals, valuation allowances for deferred tax assets and tax accruals. Although we believe that adequate accruals have been made for unsettled issues, additional gains or losses could occur in future years from resolutions of outstanding matters. Actual results could differ materially from original estimates.
Cash Equivalents — Cash investments with maturities of three months or less when purchased are considered cash equivalents.
Fair Value of Financial Instruments —The Company does not measure the fair value of any financial instrument other than cash equivalents, options, and other equity awards. The carrying values of other financial instruments (receivables and accounts payable) are not recorded at fair value but approximate fair values primarily due to their short-term nature. The carrying values of other current assets and accrued expenses are also not recorded at fair value, but approximate fair values primarily due to their short-term nature.
Valuation of Property and Equipment — The accounting policies and estimates relating to property and equipment are considered significant because of the potential impact that impairment, obsolescence, or change in an asset’s useful life could have on the Company’s operating results.
We record an impairment charge on the assets to be held and used when we determine based upon certain triggering events that the carrying value of property and equipment may not be recoverable based on expected undiscounted cash flows attributable to such assets. The amount of a potential impairment is determined by comparing the carrying amount of the asset to either the value determined from a projected discounted cash flow method, using a discount rate that is considered to be commensurate with the risk inherent in the Company’s current business model or the estimated fair market value. Assumptions are made with respect to future net cash flows expected to be generated by the related asset. An impairment charge would be recorded for an amount by which the carrying value of the asset exceeded the discounted projected net cash flows or estimated fair market value. Also, even where a current impairment charge is not necessary, the remaining useful lives are evaluated. No impairment was recorded for any of the periods presented.
Property and equipment are recorded at cost and depreciated or amortized using the straight-line method over their estimated useful lives as follows: computer and office equipment and software — three years; leasehold improvements — the shorter of five years or the lease term; and furniture and fixtures — five years. We recorded a depreciation expense of $2.4 million for the year ended December 31, 2017. We allocated $1.7 million of the expense to cost of revenue, $412 thousand to research and development expense, and $326 thousand to selling, marketing, and general and administrative expenses.
Goodwill and Other Intangible Assets — We account for the valuation of goodwill and other intangible assets after classifying intangible assets into three categories: (1) intangible assets with finite lives subject to amortization; (2) intangible assets with indefinite lives not subject to amortization; and (3) goodwill. For intangible assets with finite lives, tests for impairment must be performed if conditions exist that indicate the carrying value may not be recoverable. For intangible assets with indefinite lives and goodwill, tests for impairment must be performed at least annually or more frequently if events or circumstances indicate that assets might be impaired.
F-7
Goodwill was $8.5 million, or 10%, and $2.2 million, or 3% of total assets for the years ended December 31, 2017 and 2016, respectively.
We evaluate the goodwill for impairment annually in the fourth quarter, or when there is reason to believe that the value has been diminished or impaired. Evaluations for possible impairment are based upon a comparison of the estimated fair value of the reporting unit to which the goodwill has been assigned, versus the sum of the carrying value of the assets and liabilities of that unit including the assigned goodwill value. We include our entire Company as the reporting unit. The fair values used in this evaluation are estimated based on the Company’s market capitalization, which is based on the outstanding stock and market price of the stock. Impairment is deemed to exist if the net book value of the unit exceeds its estimated fair value. No impairment was recorded for any of the periods presented.
Our intangible assets with finite lives are amortized using a straight line basis over their economic useful lives.
Deferred Tax Assets — Deferred tax assets are recognized if it is “more likely than not” that the benefit of the deferred tax asset will be realized on future federal or state income tax returns. At December 31, 2017, we provided a valuation allowance against a significant portion, $30.8 million, of our accumulated U.S. deferred tax assets, reflecting our historical losses and the uncertainty of future taxable income sufficient to utilize net operating loss carryforwards prior to their expiration. Our total deferred tax asset not subject to a valuation allowance is valued at $25.6 million, and consists of $20.9 million for federal net operating loss carryforwards, $877 thousand relating to temporary timing differences between U.S. GAAP and tax-related expense, $2.3 million relating to U.S. state income tax credits and $1.5 million related to Alternative Minimum Tax credits. If U.S. taxable income increases from its current level in a future period or if the facts and circumstances on which our estimates and assumptions are based were to change, thereby impacting the likelihood of realizing the deferred tax assets, judgment would have to be applied in determining the amount of valuation allowance no longer required. Reversal of all or a part of this valuation allowance could have a significant positive impact on operating results in the period that it becomes more likely than not that certain of the Company’s deferred tax assets will be realized. Alternatively, should our future income decrease from current levels, a resulting increase to all or a part of this valuation allowance could also have a significant negative impact on our operating results.
Uncertain Tax Positions — Our Company recognizes and measures uncertain tax positions using a two-step approach. The first step is to evaluate the tax position for recognition by determining if the weight of available evidence indicates that it is more likely than not that the position will be sustained on audit, including resolution of related appeals or litigation processes, if any. The second step is to measure the tax benefit as the largest amount that is more than 50% likely of being realized upon settlement.
Leases — A leased asset whose lease terms meet the criteria for capitalization is recorded as an asset and depreciated. If a lease does not meet the criteria for capitalization, it is classified as an operating lease and payments are recorded as rent expense. For 2017 and 2016 we had no leases that qualified as capital leases. Lease renewal options which we are “reasonably assured” of using and the related payments are taken into account when initially classifying and recording the lease as a capital lease obligation or as straight-line rent if an operating lease. Funds provided by the lessor for leasehold improvements are recorded as a deferred lease incentive and amortized as a reduction of rent expense over the lease term.
Revenue Recognition — We develop, market and support applications that connect, protect and deliver information in a secure manner. We generate our sales through both a direct sales team and, increasingly, through our channel partners. We derive our revenue from subscription fees for rights related to the use of our software. Software subscription terms typically range from one to three years.
Revenue is recognized when all of the following criteria have been met:
|
|
• |
persuasive evidence of an arrangement exists, |
|
|
• |
delivery has occurred or services have been rendered, |
|
|
• |
the price is fixed and determinable, and |
|
|
• |
collectability is probable. |
We record our revenue net of any value added or sales tax. Discounts provided to customers are recorded as reductions in revenue.
F-8
We have determined that substantially all of our revenue arrangements are in the scope of the software revenue recognition rules. Multiple elements in our software arrangements are sold as a single unit consisting of the following elements: (i) subscription licensed software delivered to the customer’s site, (ii) ongoing customer support and (iii) access to our hosted encryption network (Zix encryption network) during the term of the agreement.
|
|
(i) |
Software at the customer site performs critical functions of the email encryption process and is the predominant element in our arrangements. Actions performed by the software at the customer site include identifying when encryption is needed through the use of filters and lexicons, determining the best method of delivery (“BMOD”) by examining secure connection options and selecting the BMOD. BMOD is a key marketing differentiator for us and is defined as the most secure and easiest method to deliver encrypted email. Customers can install the software on their own hardware or we can deliver hardware that we own to the customer site. In recent years more customers have opted to have the software installed on their own hardware, and as a result the number of Zix supplied hardware devices has declined. Any hardware provided as part of our services primarily included manufacturer provided warranty provisions. We recorded no warranty expense in any of the presented periods. |
|
|
(ii) |
Customer support includes unspecified software upgrades, updates and bug fixes and access to live technical support technicians and on-line knowledge resources. |
|
|
(iii) |
The Zix encryption network includes access to our central network which facilitates transparent encrypted email exchange among all of our customers by providing public encryption keys (asymmetrical encryption requires two keys- a public key provided by the central network and a private key generated by the software at the customer site). The delivered software element is essential to the functionality and utility of this central network. The network also enables our customers to send encrypted emails to non-Zix customer recipients through a portal. |
Approximately 19% of our revenue in 2017 was derived from hosted email encryption solutions. We apply general revenue recognition guidance to these hosted arrangements.
In all revenue arrangements we cannot determine vendor specific objective evidence (VSOE) and we cannot establish separate units of accounting for the multiple elements of our arrangements that are bundled and sold as one unit. All revenue arrangements are sales of subscription based (i.e. time-based) licenses. We defer revenue until the software is delivered and the service is deployed. Upon deployment, we commence revenue recognition and revenue is recognized ratably over the subscription period generally ranging from one to three years.
Software Development Costs —Costs incurred in the development and testing of subscription software products related to research, project planning, training, maintenance and general and administrative activities, and overhead costs are expensed as incurred. The costs of relatively minor upgrades and enhancements to the software are also expensed as incurred.
Costs for the development of new software solutions and substantial enhancements to existing software solutions are expensed as incurred until technological feasibility has been established, at which time any additional costs would be capitalized. No research and development costs have been capitalized because we believe that technological feasibility is established concurrent with general release to customers.
Research and development costs associated with software developed for internal use on behalf of our customers are capitalized. To date, capitalized costs for software developed for internal use on behalf of our customers were not material.
Advertising Expense — Advertising costs are expensed as incurred. Our operations include advertising expense of $1.5 million, $1.9 million, and $2.1 million in 2017, 2016, and 2015, respectively.
Stock-Based Compensation — We currently use the straight-line amortization method for recognizing stock option and restricted stock compensation costs. The measurement and recognition of compensation expense for all share-based payment awards made to our employees and directors are based on the estimated fair value of the awards on the grant dates. The grant date fair value is estimated using either an option-pricing model which is consistent with the terms of the award or a market observed price, if such a price exists. Such cost is recognized over the period during which an employee or director is required to provide service in exchange for the award, i.e., “the requisite service period” (which is usually the vesting period). We also estimate the number of instruments that will ultimately be earned, rather than accounting for forfeitures as they occur.
Earnings Per Share (“EPS”) — Basic EPS is based on the weighted average number of common shares outstanding during each period. Diluted EPS adjusts Basic EPS for the effects of dilutive common stock equivalents outstanding during each period using the treasury stock method.
F-9
Revenue Recognition
In May 2014, the FASB issued Accounting Standards Update No. 2014-09, Revenue from Contracts with Customers (ASU 2014-09), which supersedes most current revenue recognition guidance under U.S. GAAP. The core principle of ASU 2014-09 is to recognize revenues when promised goods or services are transferred to customers in an amount that reflects the consideration to which an entity expects to be entitled for those goods or services. ASU 2014-09 defines a five step process to achieve this core principle and, in doing so, more judgment and estimates may be required within the revenue recognition process than are required under existing U.S. GAAP.
The standard is effective for us beginning 2018, and requires using either of the following transition methods: (i) a full retrospective approach reflecting the application of the standard in each prior reporting period with the option to elect certain practical expedients, or (ii) a retrospective approach with the cumulative effect of initially adopting ASU 2014-09 recognized at the date of adoption (which includes additional footnote disclosures). We have begun an assessment of the guidance and expect our revenue to remain primarily unchanged. We are additionally analyzing the effect of the new guidance on the timing of our recognition of the incremental costs of obtaining contracts. While we are still evaluating the impact of our pending adoption of ASU 2014-09 on our consolidated financial statements, we anticipate applying the modified retrospective approach of adopting the standard. We also expect to record an adjustment of approximately $7 million to our retained earnings opening balance as of January 1, 2018.
Leases
In February 2016, the FASB issued Accounting Standards Update No. 2016-02 Leases (Topic 842), which introduces a lessee model that brings most leases onto the balance sheet. The new ASU eliminates the requirement in U.S. GAAP that entities use bright-line tests in determining lease classifications and requires lessors to provide additional transparency into their exposure to the changes in value of their residual assets and how they manage that exposure.
The standard is effective for us beginning 2019. We expect the valuation of the right of use assets and lease liabilities to be the present value of our forecasted future lease commitments and are assessing the discount rate to be applied in these valuations. We are currently evaluating the potential impact of this new guidance on our consolidated financial statements.
Accounting for Share-Based Payments
In March 2016, the FASB issued Accounting Standards Update No. 2016-09, Improvements to Employee Share-Based Payment Accounting (Topic 718), which simplifies several aspects of the accounting for employees of the accounting for employee share-based payment transactions including the accounting for income taxes, forfeitures, and statutory tax withholding requirements, as well as classification in the statement of cash flows.
The standard became effective for us beginning 2017. We completed an evaluation of the impact of this new guidance in the first quarter 2017, which resulted in $414 thousand in previously unrecognized excess tax benefits being recorded on a modified retrospective basis through a cumulative-effect adjustment to retained earnings. The balance was fully reserved, resulting in a net zero impact to our retained earnings.
3. Stock Options and Stock-based Employee Compensation
Below is a summary of common stock options outstanding at December 31, 2017:
|
|
|
Authorized Shares |
|
|
Options Outstanding |
|
|
Options Vested |
|
|
Available for Grant |
|
||||
|
Employee and Director Stock Option Plans: |
|
|
|
|
|
|
|
|
|
|
|
|
|
|
|
|
|
2001 Stock Option Plan |
|
|
2,525,000 |
|
|
|
7,000 |
|
|
|
7,000 |
|
|
|
— |
|
|
2001 Employee Stock Option Plan |
|
|
300,000 |
|
|
|
4,020 |
|
|
|
4,020 |
|
|
|
— |
|
|
2004 Stock Option Plan |
|
|
5,000,000 |
|
|
|
248,544 |
|
|
|
248,544 |
|
|
|
— |
|
|
2006 Director’s Stock Option Plan |
|
|
1,100,000 |
|
|
|
116,000 |
|
|
|
116,000 |
|
|
|
— |
|
|
2012 Incentive Plan |
|
|
6,300,000 |
|
|
|
645,750 |
|
|
|
456,812 |
|
|
|
1,215,406 |
|
|
Total |
|
|
15,225,000 |
|
|
|
1,021,314 |
|
|
|
832,376 |
|
|
|
1,215,406 |
|
Under all of our stock option plans, new shares are issued when options are exercised.
F-10
Employee and Director Stock Option Plans
We have non-qualified stock options outstanding to employees and directors under various stock option plans. The plans require the exercise price of options granted under these plans to equal or exceed the fair market value of the Company’s common stock on the date of grant. The options, subject to termination of employment, generally expire ten years from the date of grant. Historically, our employee options typically vested pro-rata and quarterly over three years. Option grants to employees, officers and directors frequently contain accelerated vesting provisions upon the occurrence of a change of control, as defined in the applicable option agreements.
Under the terms of the 2012 Incentive Plan adopted by the Company’s Board of Directors on April 13, 2012 (the “2012 Plan”), 2,700,000 shares are available for issuance, plus a number of additional shares (not to exceed 1,327,000) underlying options outstanding under certain of the Company’s prior equity plans that thereafter terminate or expire unexercised, or are cancelled, forfeited, or lapse for any reason. Our shareholders approved an Amended and Restated 2012 Incentive Plan during our annual meeting held June 24, 2015, increasing the number of shares available for grant by 3,600,000. Awards issued under the 2012 Plan typically vest pro-rata and quarterly over four years.
Accounting Treatment
We use the straight-line amortization method for recognizing stock option compensation costs. Our share-based awards include (i) stock options, (ii) restricted stock awards, some of which are subject to time-based vesting (“Restricted Stock”) and some of which are subject to performance-based vesting (“Performance Stock”), and (iii) restricted stock units, some of which are subject to time-based vesting (“RSUs”) and some of which are subject to performance-based vesting (“Performance RSUs”).
For the twelve months ended December 31, 2017, 2016, and 2015, respectively, the total stock-based compensation expense resulting from stock options, Restricted Stock, RSUs, Performance RSUs, and Performance Stock was recorded to the following line items of our consolidated statements of operations:
|
|
|
Year Ended December 31, |
|
|||||||||
|
(In thousands) |
|
2017 |
|
|
2016 |
|
|
2015 |
|
|||
|
Cost of revenue |
|
$ |
304 |
|
|
$ |
186 |
|
|
$ |
182 |
|
|
Research and development expenses |
|
|
374 |
|
|
|
246 |
|
|
|
242 |
|
|
Selling, general and administrative expenses |
|
|
2,196 |
|
|
|
1,351 |
|
|
|
1,749 |
|
|
Stock-based compensation expense |
|
$ |
2,874 |
|
|
$ |
1,783 |
|
|
$ |
2,173 |
|
Our 2017 stock-based compensation expense includes $292 thousand related to accelerated vesting of awards associated with executive departures. Our 2016 stock-based compensation expense includes $280 thousand related to the accelerated vesting of awards related to our CFO transition. A deferred tax asset of $824 thousand, $506 thousand, and $625 thousand, resulting from stock-based compensation expense associated with awards relating to the Company’s U.S. operations, was recorded for the twelve months ended December 31, 2017, 2016, and 2015, respectively. As of December 31, 2017, there was $4.6 million of total unrecognized stock-based compensation related to non-vested share-based compensation awards granted under the stock award plans. This cost is expected to be recognized over a weighted average period of 1.5 years.
We use the Black-Scholes Option Pricing Model (“BSOPM”) to determine the fair value of option grants. The Company uses the “historical” method to calculate the estimated life of any options that may be granted beginning 2014. The expected stock price volatility was calculated by averaging the historical volatility of the Company’s common stock over a term equal to the expected life of the options. We granted 30,750 options in 2017 and 373,187 options in 2016. No options were granted in 2015.
The following weighted average assumptions were applied in determining the fair value of options granted during the respective periods:
|
|
|
Year Ended December 31, |
|
|||||||||
|
|
|
2017 |
|
|
2016 |
|
|
2015 |
|
|||
|
Risk-free interest rate |
|
|
2.02 |
% |
|
|
1.21% |
|
|
|
— |
|
|
Expected option life (years) |
|
|
5.7 |
|
|
|
5.3 |
|
|
|
— |
|
|
Expected stock price volatility |
|
|
42 |
% |
|
|
44% |
|
|
|
— |
|
|
Expected dividend yield |
|
|
— |
|
|
|
— |
|
|
|
— |
|
|
Fair value of options granted |
|
$ |
2.06 |
|
|
$ |
1.51 |
|
|
|
— |
|
F-11
The assumptions used in the BSOPM valuation are critical as a change in any given factor could have a material impact on the financial results of the Company. The weighted average grant-date fair value of awards of restricted stock and restricted stock units is based on quoted market price of the Company’s common stock on the date of grant.
Stock Option Activity
There were 932,303 stock options exercised for the twelve months ended December 31, 2017. No excess tax benefit was recorded as a result of these stock option exercises. For the comparative period in 2016, there were 123,760 stock options exercises, resulting in a $55 thousand in excess tax benefit. In the twelve months ended December 31, 2015, there were 2,668,928 stock option exercises, resulting in a $19 thousand excess tax benefit.
The following is a summary of all stock option transactions for the three years ended December 31, 2017:
|
|
|
Shares |
|
|
Weighted Average Exercise Price |
|
|
Weighted Average Remaining Contractual Term (Yrs) |
|
|||
|
Outstanding at January 1, 2015 |
|
|
4,490,509 |
|
|
$ |
3.42 |
|
|
|
|
|
|
Granted at market price |
|
|
— |
|
|
$ |
— |
|
|
|
|
|
|
Cancelled or expired |
|
|
(47,029 |
) |
|
$ |
4.69 |
|
|
|
|
|
|
Exercised |
|
|
(2,668,928 |
) |
|
$ |
3.25 |
|
|
|
|
|
|
Outstanding at December 31, 2015 |
|
|
1,774,552 |
|
|
$ |
3.65 |
|
|
|
|
|
|
Granted at market price |
|
|
373,187 |
|
|
$ |
3.70 |
|
|
|
|
|
|
Cancelled or expired |
|
|
(63,700 |
) |
|
$ |
3.95 |
|
|
|
|
|
|
Exercised |
|
|
(123,760 |
) |
|
$ |
1.66 |
|
|
|
|
|
|
Outstanding at December 31, 2016 |
|
|
1,960,279 |
|
|
$ |
3.78 |
|
|
|
|
|
|
Granted at market price |
|
|
30,750 |
|
|
$ |
4.96 |
|
|
|
|
|
|
Cancelled or expired |
|
|
(37,412 |
) |
|
$ |
4.71 |
|
|
|
|
|
|
Exercised |
|
|
(932,303 |
) |
|
$ |
4.51 |
|
|
|
|
|
|
Outstanding at December 31, 2017 |
|
|
1,021,314 |
|
|
$ |
3.11 |
|
|
|
5.40 |
|
|
Options exercisable at December 31, 2017 |
|
|
832,376 |
|
|
$ |
2.96 |
|
|
|
4.73 |
|
At December 31, 2017, 983,564 options outstanding and 802,314 options exercisable had an exercise price lower than the market value of the Company’s common stock. The aggregate intrinsic value of these options was $1.3 million and $1.2 million, respectively. At December 31, 2016, all 1,960,279 options outstanding and all 1,685,732 options exercisable had an exercise price lower than the market value of the Company’s common stock. The aggregate intrinsic value of these options was $2.3 million and $1.9 million, respectively.
The total intrinsic value of options exercised during the years ended December 31, 2017 and 2016, was $914 thousand and $290 thousand, respectively.
Summarized information about stock options outstanding at December 31, 2017, is as follows:
|
|
|
Options Outstanding |
|
|
Options Exercisable |
|
||||||||||||||
|
Range of Exercise Prices |
|
Number Outstanding |
|
|
Weighted Average Remaining Contractual Life |
|
|
Weighted Average Exercise Price |
|
|
Number Exercisable |
|
|
Weighted Average Exercise Price |
|
|||||
|
$1.11 - $1.99 |
|
|
73,564 |
|
|
|
1.48 |
|
|
$ |
1.52 |
|
|
|
73,564 |
|
|
$ |
1.52 |
|
|
$2.00 - $3.49 |
|
|
441,813 |
|
|
|
3.86 |
|
|
$ |
2.57 |
|
|
|
441,813 |
|
|
$ |
2.57 |
|
|
$3.50 - $4.99 |
|
|
505,937 |
|
|
|
7.31 |
|
|
$ |
3.81 |
|
|
|
316,999 |
|
|
$ |
3.83 |
|
|
|
|
|
1,021,314 |
|
|
|
5.40 |
|
|
$ |
3.11 |
|
|
|
832,376 |
|
|
$ |
2.96 |
|
There were 1,685,732 and 1,636,238 exercisable options at December 31, 2016 and 2015, respectively.
F-12
The following is a summary of all Restricted Stock activity during the three years ended December 31, 2017:
|
|
|
Restricted Shares |
|
|
Weighted Average Fair Value |
|
||
|
Non-vested restricted stock at January 1, 2015 |
|
|
604,250 |
|
|
$ |
3.45 |
|
|
Granted at market price |
|
|
100,000 |
|
|
$ |
5.18 |
|
|
Vested |
|
|
(240,750 |
) |
|
$ |
3.35 |
|
|
Cancelled |
|
|
(40,250 |
) |
|
$ |
3.57 |
|
|
Non-vested restricted stock at December 31, 2015 |
|
|
423,250 |
|
|
$ |
3.91 |
|
|
Granted at market price |
|
|
573,461 |
|
|
$ |
3.75 |
|
|
Vested |
|
|
(292,469 |
) |
|
$ |
3.50 |
|
|
Cancelled |
|
|
(15,000 |
) |
|
$ |
4.11 |
|
|
Non-vested restricted stock at December 31, 2016 |
|
|
689,242 |
|
|
$ |
3.94 |
|
|
Granted at market price |
|
|
665,623 |
|
|
$ |
5.02 |
|
|
Vested |
|
|
(251,956 |
) |
|
$ |
4.00 |
|
|
Cancelled |
|
|
(20,000 |
) |
|
$ |
4.96 |
|
|
Non-vested restricted stock at December 31, 2017 |
|
|
1,082,909 |
|
|
$ |
4.57 |
|
No excess tax benefit was recorded as a result of vesting Restricted Stock in 2017. For the comparative periods in 2016 and 2015, we recorded a $59 thousand, and an $84 thousand excess tax benefit, respectively.
Restricted Stock Unit Activity
The following is a summary of all RSU activity during the three years ended December 31, 2017:
|
|
|
Restricted Stock Units |
|
|
Weighted Average Fair Value |
|
||
|
Non-vested restricted stock units at January 1, 2015 |
|
|
182,750 |
|
|
$ |
3.52 |
|
|
Granted at market price |
|
|
215,000 |
|
|
$ |
3.88 |
|
|
Vested |
|
|
(65,750 |
) |
|
$ |
3.29 |
|
|
Cancelled |
|
|
(32,500 |
) |
|
$ |
3.88 |
|
|
Non-vested restricted stock units at December 31, 2015 |
|
|
299,500 |
|
|
$ |
3.79 |
|
|
Granted at market price |
|
|
38,500 |
|
|
$ |
3.74 |
|
|
Vested |
|
|
(179,914 |
) |
|
$ |
3.66 |
|
|
Cancelled |
|
|
— |
|
|
|
— |
|
|
Non-vested restricted stock units at December 31, 2016 |
|
|
158,086 |
|
|
$ |
3.92 |
|
|
Granted at market price |
|
|
54,500 |
|
|
$ |
4.96 |
|
|
Vested |
|
|
(126,167 |
) |
|
$ |
4.07 |
|
|
Cancelled |
|
|
— |
|
|
|
— |
|
|
Non-vested restricted stock units at December 31, 2017 |
|
|
86,419 |
|
|
$ |
4.36 |
|
No excess tax benefit was recorded as a result of these vesting RSU’s in 2017. For the comparative period in 2016, we recorded an $8 thousand excess tax benefits. No excess tax benefits resulted from the vesting of RSU’s in 2015.
F-13
The following is a summary of all Performance RSU activity during the three years ended December 31, 2017:
|
|
|
Restricted Stock Units |
|
|
Weighted Average Fair Value |
|
||
|
Non-vested performance RSUs at January 1, 2015 |
|
|
— |
|
|
|
— |
|
|
Granted at market price |
|
|
215,000 |
|
|
$ |
3.88 |
|
|
Vested |
|
|
— |
|
|
|
— |
|
|
Forfeited |
|
|
(32,500 |
) |
|
$ |
3.88 |
|
|
Non-vested performance RSUs at December 31, 2015 |
|
|
182,500 |
|
|
$ |
3.88 |
|
|
Granted at market price |
|
|
22,500 |
|
|
$ |
3.61 |
|
|
Vested |
|
|
(97,428 |
) |
|
$ |
3.88 |
|
|
Forfeited |
|
|
(16,741 |
) |
|
$ |
3.88 |
|
|
Non-vested performance RSUs at December 31, 2016 |
|
|
90,831 |
|
|
$ |
3.81 |
|
|
Granted at market price |
|
|
11,500 |
|
|
$ |
4.96 |
|
|
Vested |
|
|
(20,999 |
) |
|
$ |
4.08 |
|
|
Forfeited |
|
|
(41,668 |
) |
|
$ |
3.83 |
|
|
Non-vested performance RSUs at December 31, 2017 |
|
|
39,664 |
|
|
$ |
3.98 |
|
No excess tax benefit was recorded as a result of these vesting performance RSU’s in 2017. For the comparative period in 2016, we recorded a $15 thousand excess tax benefits.
Performance Stock Activity
The following is a summary of all Performance Stock activity during the two years ended December 31, 2017:
|
|
|
Restricted Stock Units |
|
|
Weighted Average Fair Value |
|
||
|
Non-vested performance stock at January 1, 2016 |
|
|
— |
|
|
|
— |
|
|
Granted at market price |
|
|
141,500 |
|
|
$ |
3.61 |
|
|
Vested |
|
|
(20,000 |
) |
|
$ |
3.61 |
|
|
Forfeited |
|
|
— |
|
|
|
— |
|
|
Non-vested performance stock at December 31, 2016 |
|
|
121,500 |
|
|
$ |
3.61 |
|
|
Granted at market price |
|
|
112,112 |
|
|
$ |
4.96 |
|
|
Vested |
|
|
— |
|
|
|
— |
|
|
Forfeited |
|
|
(40,502 |
) |
|
$ |
3.61 |
|
|
Non-vested performance stock at December 31, 2017 |
|
|
193,110 |
|
|
$ |
4.39 |
|
As a result of vesting Performance Stock $5 thousand in excess tax benefits was recorded in 2016.
The weighted average grant-date fair value of awards of Restricted Stock, RSUs, Performance RSU’s, and Performance Stock is based on the quoted market price of the Company’s common stock on the date of grant.
4. Supplemental Cash Flow Information
Supplemental information relating to interest and taxes:
|
|
|
Year Ended December 31, |
|
|||||||||
|
(In thousands) |
|
2017 |
|
|
2016 |
|
|
2015 |
|
|||
|
Interest payments |
|
$ |
— |
|
|
$ |
33 |
|
|
$ |
— |
|
|
Income tax payments |
|
$ |
636 |
|
|
$ |
670 |
|
|
$ |
332 |
|
F-14
|
(In thousands) |
|
December 31, |
|
|||||
|
|
|
2017 |
|
|
2016 |
|
||
|
Gross accounts receivables |
|
$ |
9,307 |
|
|
$ |
8,417 |
|
|
Allowance for returns and doubtful accounts |
|
|
(270 |
) |
|
|
(91 |
) |
|
Unpaid portion of deferred revenue |
|
|
(7,648 |
) |
|
|
(7,117 |
) |
|
Note receivable |
|
|
458 |
|
|
|
458 |
|
|
Allowance for note receivable |
|
|
(458 |
) |
|
|
(458 |
) |
|
Receivables, net |
|
$ |
1,389 |
|
|
$ |
1,209 |
|
The allowance for doubtful accounts includes all specific accounts receivable which we believe are likely not collectable based on known information. In addition, we record 2.5% of all accounts receivable greater than 90 days past due, net of those accounts specifically reserved, as a general allowance against accounts that could potentially become uncollectible.
The reduction for deferred revenue represents future customer service or maintenance obligations which have been billed to customers, but remain unpaid as of the respective balance sheet dates. Deferred revenue on our consolidated balance sheets represents future customer service or maintenance obligations which have been billed and collected as of the respective balance sheet dates.
The note receivable represents the remaining outstanding balance of an original note related to the sale of a product line in 2005 in the amount of $540 thousand. This was fully reserved at the time of the sale as the note’s collectability was not assured. The note receivable is fully reserved at December 31, 2017 and 2016.
6. Prepaid and other current assets
|
(In thousands) |
|
December 31, |
|
|||||
|
|
|
2017 |
|
|
2016 |
|
||
|
Prepaid insurance, maintenance, software licenses and other |
|
$ |
2,386 |
|
|
$ |
2,381 |
|
|
Deferred commissions |
|
|
415 |
|
|
|
435 |
|
|
Tax-related |
|
|
421 |
|
|
|
13 |
|
|
Prepaid and other current assets |
|
$ |
3,222 |
|
|
$ |
2,829 |
|
7. Property and Equipment
|
(In thousands) |
|
December 31, |
|
|||||
|
|
|
2017 |
|
|
2016 |
|
||
|
Computer and office equipment and software |
|
$ |
25,379 |
|
|
$ |
24,303 |
|
|
Leasehold improvements |
|
|
6,763 |
|
|
|
6,733 |
|
|
Furniture and fixtures |
|
|
2,136 |
|
|
|
2,011 |
|
|
|
|
|
34,278 |
|
|
|
33,047 |
|
|
Less accumulated depreciation and amortization |
|
|
(30,230 |
) |
|
|
(29,071 |
) |
|
Property and equipment, net |
|
$ |
4,048 |
|
|
$ |
3,976 |
|
Our operations include depreciation expense related to property and equipment of $2.4 million, $2.3 million, and $2.2 million in 2017, 2016, and 2015, respectfully.
8. Goodwill and Other Intangible Assets
The changes in the carrying amount of goodwill for the years ended December 31, 2017 and 2016, are as follows:
|
|
|
Year Ended December 31, |
|
|||||
|
(In thousands) |
|
2017 |
|
|
2016 |
|
||
|
Opening balance |
|
$ |
2,161 |
|
|
$ |
2,161 |
|
|
Additions |
|
|
6,308 |
|
|
|
— |
|
|
Goodwill |
|
$ |
8,469 |
|
|
$ |
2,161 |
|
F-15
Our 2017 acquisitions of Greenview and EMS resulted in the increase to our goodwill in 2017. We evaluate goodwill for impairment annually in the fourth quarter, or when there is reason to believe that the value has been diminished or impaired. There were no impairment indicators to the goodwill recorded as of December 31, 2017.
Our other intangible assets consist of the following:
|
|
|
December 31, 2017 |
|
|||||||||
|
(In thousands) |
|
Gross Carrying Amount |
|
|
Accumulated Amortization |
|
|
Net Carrying Amount |
|
|||
|
Internal use software |
|
$ |
802 |
|
|
$ |
— |
|
|
$ |
802 |
|
|
Trademark/names |
|
|
170 |
|
|
|
(26 |
) |
|
|
144 |
|
|
Technology |
|
|
4,024 |
|
|
|
(2,183 |
) |
|
|
1,841 |
|
|
Customer relationships |
|
|
2,880 |
|
|
|
(144 |
) |
|
|
2,736 |
|
|
Intangible assets, net |
|
$ |
7,876 |
|
|
$ |
(2,353 |
) |
|
$ |
5,523 |
|
For the twelve months ended December 31, 2017, amortization of intangible assets was recorded to the following line items of our consolidated statements of operations:
|
|
|
Year Ended December 31, |
|
|
|
(In thousands) |
|
2017 |
|
|
|
Cost of revenue |
|
$ |
149 |
|
|
Selling, general and administrative expenses |
|
|
170 |
|
|
Amortization of intangible assets |
|
$ |
319 |
|
The following table summarizes our estimated future amortization expense:
|
(In thousands) |
|
2018 |
|
|
2019 |
|
|
2020 |
|
|
2021 |
|
|
2022 |
|
|
Thereafter |
|
|
Total |
|
|||||||
|
Amortization expense |
|
$ |
614 |
|
|
$ |
614 |
|
|
$ |
614 |
|
|
$ |
614 |
|
|
$ |
447 |
|
|
$ |
2,622 |
|
|
$ |
5,523 |
|
9. Accrued Expenses
|
|
|
December 31, |
|
|||||
|
(In thousands) |
|
2017 |
|
|
2016 |
|
||
|
Employee compensation and benefits |
|
$ |
4,452 |
|
|
$ |
2,739 |
|
|
Professional fees |
|
|
356 |
|
|
|
405 |
|
|
Taxes |
|
|
154 |
|
|
|
434 |
|
|
Other |
|
|
1,138 |
|
|
|
787 |
|
|
Total accrued expenses |
|
$ |
6,100 |
|
|
$ |
4,365 |
|
10. Fair Value Measurements
FASB guidance regarding fair value measurement establishes a three-tier fair value hierarchy, which prioritizes the inputs used in measuring fair value. These tiers include: Level 1, defined as observable inputs such as quoted prices in active markets for identical assets or liabilities; Level 2, defined as inputs other than quoted prices for similar assets and liabilities in active markets that are either directly or indirectly observable; and Level 3, defined as unobservable inputs for which little or no market data exists, therefore requiring an entity to develop its own assumptions.
The Company recorded a contingent liability for the estimated fair value of earn-out consideration payments in our Greenview acquisition. The Company determined the fair value of this earn-out liability based on the probability of attainment of certain sales milestones. Any changes to the variables and assumptions could significantly impact the estimated fair values recorded for the liability, resulting in significant changes to the Consolidated Statements of Operations. The fair value measurements are based on significant inputs not observable in the market and thus represent Level 3 measurements, which reflect the Company’s own assumptions concerning the achievement of the sales milestones in measuring the fair value of the acquisition-related contingent earn-out lability.
F-16
The following table represents a reconciliation of our acquisition-related contingent earn-out liability measured at fair value on a recurring basis, using Level 3 inputs for the year ended December 31, 2017:
|
(In thousands) |
|
Fair Value Measurements Using Significant Unobservable Inputs (Level 3) |
|
|
|
Balance at December 31, 2016 |
|
$ |
— |
|
|
Additions during the period |
|
|
1,020 |
|
|
Adjustments to fair value during the period recorded in General and Administrative expenses |
|
|
468 |
|
|
Balance at December 31, 2017 |
|
$ |
1,488 |
|
11. Earnings Per Share and Potential Dilution
Basic earnings per share are computed using the weighted average number of common shares outstanding for the period. The dilutive effect of potential common shares outstanding is included in diluted earnings per share. The computations for basic and diluted earnings per share for the years ended December 31, 2017, 2016, and 2015, are as follows:
|
|
|
Year Ended December 31, |
|
|||||||||
|
|
|
2017 |
|
|
2016 |
|
|
2015 |
|
|||
|
Basic weighted average shares |
|
|
53,430,492 |
|
|
|
53,819,772 |
|
|
|
56,421,833 |
|
|
Effect of dilutive securities: |
|
|
|
|
|
|
|
|
|
|
|
|
|
Employee and director stock options |
|
|
— |
|
|
|
317,329 |
|
|
|
741,002 |
|
|
Restricted Stock |
|
|
— |
|
|
|
149,817 |
|
|
|
172,126 |
|
|
RSUs |
|
|
— |
|
|
|
63,484 |
|
|
|
100,353 |
|
|
Performance RSUs |
|
|
— |
|
|
|
24,449 |
|
|
|
40,692 |
|
|
Performance Stock |
|
|
— |
|
|
|
20,294 |
|
|
|
— |
|
|
Potential dilutive common shares |
|
|
53,430,492 |
|
|
|
54,395,145 |
|
|
|
57,476,006 |
|
For the year ended December 31, 2017, potential common shares of all securities were excluded from the calculation of diluted earnings per share because the awards were anti- dilutive. For the years ended December 31, 2016, and 2015, weighted average shares related to certain stock options of 1,079,474; and 1,005,328, respectively, were excluded from the calculation of diluted earnings per share because the stock options were anti-dilutive. Anti-dilutive Restricted Stock, RSUs, and Performance RSUs, and Performance Stock of 109,293; 20,600; 886; and 5,572, respectively, were also excluded from the calculation for the year ended December 31, 2016. Anti-dilutive Restricted Stock, RSUs, and Performance RSUs of 56,542; 33,512; and 24,486; respectively, were also excluded from the calculation for the year ended December 31, 2015.
12. Significant Customers
In 2017, 2016, and 2015, no single customer accounted for 10% or more of our revenues.
13. Commitments and Contingencies
Leases
We lease office facilities under non-cancelable operating lease agreements. Our operations include rent expense for these operating leases of $1.4 million in each of 2017, 2016, and 2015. The lease of our headquarters facility in Dallas expires in 2024.
A summary of our fixed contractual obligations and commitments at December 31, 2017, is as follows:
|
(In thousands) |
|
2018 |
|
|
2019 |
|
|
2020 |
|
|
2021 |
|
|
2022 |
|
|
Thereafter |
|
|
Total |
|
|||||||
|
Operating leases |
|
$ |
1,631 |
|
|
$ |
1,435 |
|
|
$ |
1,149 |
|
|
$ |
1,059 |
|
|
$ |
1,089 |
|
|
$ |
1,977 |
|
|
$ |
8,340 |
|
F-17
We are subject to legal proceedings, claims, and litigation against our business. While the outcome of these matters is currently not determinable and the costs and expenses of defending these matters may be significant, we currently do not expect that the ultimate costs to resolve these matters will have a material adverse effect on our consolidated financial statements.
14. Income Taxes
Components of the income taxes are as follows:
|
(In thousands) |
|
2017 |
|
|
2016 |
|
|
2015 |
|
|||
|
Current: |
|
|
|
|
|
|
|
|
|
|
|
|
|
U.S. |
|
$ |
183 |
|
|
$ |
100 |
|
|
$ |
58 |
|
|
State |
|
|
(196 |
) |
|
|
329 |
|
|
|
196 |
|
|
Foreign |
|
|
156 |
|
|
|
75 |
|
|
|
146 |
|
|
Deferred |
|
|
|
|
|
|
|
|
|
|
|
|
|
Federal |
|
|
18,461 |
|
|
|
3,185 |
|
|
|
2,744 |
|
|
Foreign |
|
|
2 |
|
|
|
3 |
|
|
|
— |
|
|
Income tax expense |
|
$ |
18,606 |
|
|
$ |
3,692 |
|
|
$ |
3,144 |
|
On December 22, 2017, the U.S. enacted the Tax Cuts and Jobs Act (‘the Tax Act”) which significantly changed U.S. tax law. The Tax Act, among other things, lowered the federal statutory corporate income tax rate from 35% to 21% effective January 1, 2018. Consequently, we remeasured our deferred tax assets as of December 31, 2017, which increased our income tax expense by approximately $12.5 million.
A reconciliation of the expected U.S. tax expense (benefit) to income taxes is as follows:
|
(In thousands) |
|
2017 |
|
|
2016 |
|
|
2015 |
|
|||
|
Expected tax expense at U.S. statutory rate |
|
$ |
3,587 |
|
|
$ |
3,250 |
|
|
$ |
2,775 |
|
|
Change in Corporate Tax Rate- Deferreds |
|
|
12,473 |
|
|
|
— |
|
|
|
— |
|
|
Decrease in valuations allowance- Other |
|
|
2,064 |
|
|
|
— |
|
|
|
— |
|
|
Nondeductible expense and nontaxable income |
|
|
890 |
|
|
|
114 |
|
|
|
133 |
|
|
State income taxes |
|
|
(129 |
) |
|
|
217 |
|
|
|
129 |
|
|
Foreign income taxes |
|
|
159 |
|
|
|
78 |
|
|
|
146 |
|
|
Other |
|
|
(438 |
) |
|
|
33 |
|
|
|
(39 |
) |
|
Income tax expense |
|
$ |
18,606 |
|
|
$ |
3,692 |
|
|
$ |
3,144 |
|
Deferred income taxes reflect the net tax effects of temporary differences between the carrying amounts of assets and liabilities for financial reporting purposes and the amounts used for income tax purposes. Components of our U.S. deferred income taxes as of December 31, 2017 and 2016 are as follows:
|
(In thousands) |
|
2017 |
|
|
2016 |
|
||
|
Deferred tax assets: |
|
|
|
|
|
|
|
|
|
Nondeductible |
|
$ |
112 |
|
|
$ |
157 |
|
|
U.S. net operating loss carryforwards |
|
|
48,769 |
|
|
|
81,791 |
|
|
State net operating loss carryforwards |
|
|
321 |
|
|
|
268 |
|
|
Tax credit carryforwards |
|
|
6,450 |
|
|
|
6,029 |
|
|
Stock-based compensation |
|
|
750 |
|
|
|
1,536 |
|
|
Intangible assets |
|
|
(1,342 |
) |
|
|
180 |
|
|
Depreciable assets |
|
|
851 |
|
|
|
1,422 |
|
|
Other assets |
|
|
1,039 |
|
|
|
1,065 |
|
|
Total deferred tax assets |
|
|
56,950 |
|
|
|
92,448 |
|
|
Deferred tax liabilities: |
|
|
|
|
|
|
|
|
|
Prepaid expenses |
|
|
(532 |
) |
|
|
(696 |
) |
|
Total deferred tax assets |
|
|
56,418 |
|
|
|
91,752 |
|
|
Less valuation allowance |
|
|
(30,773 |
) |
|
|
(46,028 |
) |
|
Net deferred tax assets |
|
$ |
25,645 |
|
|
$ |
45,724 |
|
F-18
The Company has partially reserved its U.S. net deferred tax assets in 2017 and 2016 due to the uncertainty of future taxable income. The Company has U.S. net operating loss carryforwards of approximately $232 million which begin to expire in 2020. The Company has state credits that net of federal tax expense total $2.2 million which can be utilized through 2027 and state net operating losses that have various expiration dates. The Company also has tax credit carryforwards of approximately $4.2 million consisting of business tax credits which begin to expire in 2017 and alternative minimum tax credits which do not expire.
We have determined that utilization of existing net operating losses against future taxable income is not limited by Section 382 of the Internal Revenue Code. Future ownership changes, however, may limit the Company's ability to fully utilize its existing net operating loss carryforwards against any future taxable income.
The Company or one of our subsidiaries files income tax returns in the U.S. federal jurisdiction and various states and in the Canadian federal and provincial jurisdictions. We have not taken a tax position that, if challenged, would have a material effect on the financial statements or the effective tax rate for the twelve-months ended December 31, 2017, or during the prior three years. We have determined it is not reasonably possible for the amounts of unrecognized tax benefits to significantly increase or decrease within the next twelve months. We are currently subject to a three-year statute of limitations by major tax jurisdictions.
15. Employee Benefit Plan
401(k) Plan — We have a retirement savings plan structured under Section 401(k) of the Internal Revenue Code covering substantially all of our U.S. employees. Under the plan, contributions are voluntarily made by employees, and we may provide contributions based on the employees’ contributions. Our operating income includes $512 thousand, $448 thousand, and $389 thousand in 2017, 2016, and 2015, respectively, for net contributions from operations to this plan.
16. Zix Repurchase Program
On April 24, 2017, the Company’s board of directors approved a share repurchase program that enables the Company to purchase up to $10 million of its shares of common stock. The shares repurchase program will expire May 31, 2018. During the year ended December 31, 2017, the Company repurchased 750,000 shares at an aggregate cost of $3.8 million.
During the year ended December 31, 2016, the Company repurchased 3,830,352 shares at an aggregate cost of $15.0 million. This completed the $15 million share repurchase authorized by our board of directors in January 2016.
During the year ended December 31, 2015, the Company repurchased 3,185,340 shares at an aggregate cost of $15.0 million. This completed the $15 million share repurchase authorized by our board of directors in May 2015. On May 11, 2015, the board of directors also approved the termination of the $10 million share repurchase program announced in January 2015. No shares were repurchased under that program.
17. Acquisitions
Greenview Data, Inc.
On March 15, 2017, the Company acquired all of the outstanding capital stock of Greenview Data, Inc. (“Greenview”), a provider of antivirus, anti-spam, and archiving products, for a total purchase price of $7.7 million, including cash consideration of $6.7 million, subject to a customary post-closing adjustment for working capital. Our acquisition of Greenview addresses increasing buyer demand for email security bundles by adding these capabilities to our existing portfolio of encryption services. Of the cash consideration paid, $650 thousand was deposited into an escrow account for the satisfaction of certain indemnification claims of the Company, if any, during the two year period following the closing of the acquisition, after which the balance, if any, will be distributed to the selling shareholders. Because sales of Greenview products met certain sales milestones by December 31, 2017, the Company is also contractually obligated to pay earn-out consideration in cash of $800 thousand in the first quarter 2018. The Company may be required to pay a further $800 thousand of earn-out consideration in cash should sales of the Greenview products achieve a separate target by December 31, 2018. Contingent consideration is considered a Level 3 fair value measurement.
Revenue from Greenview was $2.4 million for the year ended December 31, 2017, and due to the continued integration of the combined businesses, it was impracticable to determine the earnings. The Company incurred $427 thousand in acquisition-related costs which were recorded within operating expenses for the year ended December 31, 2107.
We accounted for the acquisition as the purchase of a business and have initially recorded the excess purchase price as goodwill. The goodwill from this transaction is not deductible for tax purposes. The intangible assets we acquired from Greenview consist of
F-19
trademarks, internally developed software, and customer relationships, which we are amortizing over an estimated useful live of 5 years, 10 years, and 15 years, respectively. The results of operations and the provisional fair values of the acquired assets and liabilities assumed have been included in the accompanying condensed consolidated financial statements since our March 15, 2017, acquisition date.
The following table summarizes the provisional fair value of acquired assets and liabilities:
|
(In thousands) |
|
Provisional Fair Value |
|
|
|
Assets: |
|
|
|
|
|
Current assets |
|
$ |
334 |
|
|
Property and equipment |
|
|
255 |
|
|
Trademark/names |
|
|
170 |
|
|
Technology |
|
|
1,990 |
|
|
Customer relationships |
|
|
2,880 |
|
|
Goodwill |
|
|
4,337 |
|
|
Total assets |
|
|
9,966 |
|
|
|
|
|
|
|
|
Liabilities: |
|
|
|
|
|
Deferred revenue |
|
$ |
537 |
|
|
Other current liabilities |
|
|
124 |
|
|
Deferred tax liability |
|
|
1,609 |
|
|
Total liabilities |
|
|
2,270 |
|
|
|
|
|
|
|
|
Net assets recorded |
|
$ |
7,696 |
|
Entelligence Messaging Server
On September 13, 2017, the Company acquired Entelligence Messaging Server (“EMS”) technology, an email encryption solution, and the related business from Entrust Datacard Corporation for a cash purchase price of $1.7 million. Our acquisition of EMS strengthens our email encryption suite by offering enterprise-centric capabilities, such as advanced message tracking, PDF statement delivery, high availability on-premises architecture and standards-based end-to-end encryption.
Revenue from EMS was not material for the year ended December 31, 2017, and due to the continued integration of the combined businesses, it was impracticable to determine the earnings. The Company incurred $59 thousand in acquisition-related costs which were recorded within operating expenses for the year ended December 31, 2107.
We accounted for the acquisition as the purchase of a business and have initially recorded the excess purchase price as goodwill. The goodwill from this transaction is deductible for tax purposes. The results of operations and the provisional fair values of the acquired assets and liabilities assumed have been included in the accompanying condensed consolidated financial statements since our September 13, 2017, acquisition date.
The following table summarizes the provisional fair value of acquired assets and liabilities:
|
(In thousands) |
|
Provisional Fair Value |
|
|
|
Assets: |
|
|
|
|
|
Goodwill |
|
$ |
1,972 |
|
|
Total assets |
|
|
1,972 |
|
|
|
|
|
|
|
|
Liabilities: |
|
|
|
|
|
Deferred revenue |
|
$ |
322 |
|
|
Total liabilities |
|
|
322 |
|
|
|
|
|
|
|
|
Net assets recorded |
|
$ |
1,650 |
|
Pro Forma Financial Information (Unaudited)
The following unaudited pro forma financial information presents the combined results of operations for the twelve month periods ending December 31, 2017, and 2016, respectively, as though the Greenview and EMS acquisitions that occurred during the
F-20
reporting period had occurred as of the beginning of the earliest period presented, with adjustments to give effect to pro forma events that are directly attributable to the acquisition, such as amortization expense of intangible assets and acquisition-related transaction costs. These unaudited pro forma results are presented for information purposes only and are not necessarily indicative of what the actual results of operations of the combined company would have been if the acquisition had occurred at the beginning of the earliest period presented, nor are they indicative of future results of operations:
|
|
|
Twelve Months Ended December 31, |
|
|||||
|
(In thousands, except per share data) |
|
2017 |
|
|
2016 |
|
||
|
Revenues |
|
$ |
66,783 |
|
|
$ |
63,774 |
|
|
Net income (loss) |
|
|
(6,816 |
) |
|
|
5,867 |
|
|
Basic income (loss) per common share |
|
$ |
(0.13 |
) |
|
$ |
0.11 |
|
|
Diluted income (loss) per common share |
|
$ |
(0.13 |
) |
|
$ |
0.11 |
|
The Company is in the process of determining the valuation of certain property, equipment and intangible assets and liabilities, which may result in further refinement of the allocation of the purchase price for these acquisitions.
18. Quarterly Results of Operations (Unaudited)
The following is a summary of the quarterly results of operations for the years ended December 31, 2017 and 2016:
|
|
|
Quarter Ended |
|
|||||||||||||
|
(In thousands except per share data) |
|
March 31 |
|
|
June 30 |
|
|
September 30 |
|
|
December 31 |
|
||||
|
2017 |
|
|
|
|
|
|
|
|
|
|
|
|
|
|
|
|
|
Revenues |
|
$ |
15,893 |
|
|
$ |
16,378 |
|
|
$ |
16,592 |
|
|
$ |
16,800 |
|
|
Gross margin |
|
|
13,070 |
|
|
|
13,131 |
|
|
|
13,320 |
|
|
|
13,540 |
|
|
Net income (loss) |
|
|
1,775 |
|
|
|
1,139 |
|
|
|
1,905 |
|
|
|
(12,877 |
) |
|
Basic net income (loss) per common share* |
|
|
0.03 |
|
|
|
0.02 |
|
|
|
0.04 |
|
|
|
(0.24 |
) |
|
Diluted net income (loss) per common share* |
|
|
0.03 |
|
|
|
0.02 |
|
|
|
0.03 |
|
|
|
(0.24 |
) |
|
2016 |
|
|
|
|
|
|
|
|
|
|
|
|
|
|
|
|
|
Revenues |
|
$ |
14,328 |
|
|
$ |
14,930 |
|
|
$ |
15,308 |
|
|
$ |
15,578 |
|
|
Gross margin |
|
|
11,791 |
|
|
|
12,295 |
|
|
|
12,656 |
|
|
|
12,869 |
|
|
Net income |
|
|
1,570 |
|
|
|
559 |
|
|
|
1,769 |
|
|
|
1,939 |
|
|
Basic net income per common share* |
|
|
0.03 |
|
|
|
0.01 |
|
|
|
0.03 |
|
|
|
0.04 |
|
|
Diluted net income per common share* |
|
|
0.03 |
|
|
|
0.01 |
|
|
|
0.03 |
|
|
|
0.04 |
|
|
* |
Net income (loss) per share is calculated independently for each quarter. The sum of Net income (loss) per share for each quarter may not equal the total Net income (loss) per share for the year due to rounding differences. |
F-21