Attached files
| file | filename |
|---|---|
| EX-21.1 - EX-21.1 - Vivint Solar, Inc. | vslr-ex211_213.htm |
| EX-32.2 - EX-32.2 - Vivint Solar, Inc. | vslr-ex322_9.htm |
| EX-32.1 - EX-32.1 - Vivint Solar, Inc. | vslr-ex321_8.htm |
| EX-31.2 - EX-31.2 - Vivint Solar, Inc. | vslr-ex312_6.htm |
| EX-31.1 - EX-31.1 - Vivint Solar, Inc. | vslr-ex311_7.htm |
| EX-23.1 - EX-23.1 - Vivint Solar, Inc. | vslr-ex231_501.htm |
| EX-10.85 - EX-10.85 - Vivint Solar, Inc. | vslr-ex1085_456.htm |
UNITED STATES
SECURITIES AND EXCHANGE COMMISSION
Washington, D.C. 20549
FORM 10-K
(Mark One)
|
☒ |
ANNUAL REPORT PURSUANT TO SECTION 13 OR 15(d) OF THE SECURITIES EXCHANGE ACT OF 1934 |
For the fiscal year ended December 31, 2017
OR
|
☐ |
TRANSITION REPORT PURSUANT TO SECTION 13 OR 15(d) OF THE SECURITIES EXCHANGE ACT OF 1934 |
Commission File Number 001-36642
VIVINT SOLAR, INC.
(Exact name of Registrant as specified in its Charter)
|
Delaware |
|
45-5605880 |
|
(State or other jurisdiction of incorporation or organization) |
|
(I.R.S. Employer |
|
1800 West Ashton Blvd. Lehi, UT |
|
84043 |
|
(Address of principal executive offices) |
|
(Zip Code) |
Registrant’s telephone number, including area code: (877) 404-4129
Securities registered pursuant to Section 12(b) of the Act: Common Stock, Par Value $0.01 Per Share; Common stock traded on the New York Stock Exchange
Securities registered pursuant to Section 12(g) of the Act: None
Indicate by check mark if the Registrant is a well-known seasoned issuer, as defined in Rule 405 of the Securities Act. YES ☐ NO ☒
Indicate by check mark if the Registrant is not required to file reports pursuant to Section 13 or 15(d) of the Act. YES ☐ NO ☒
Indicate by check mark whether the Registrant: (1) has filed all reports required to be filed by Section 13 or 15(d) of the Securities Exchange Act of 1934 during the preceding 12 months (or for such shorter period that the Registrant was required to file such reports), and (2) has been subject to such filing requirements for the past 90 days. YES ☒ NO ☐
Indicate by check mark whether the Registrant has submitted electronically and posted on its corporate Web site, if any, every Interactive Data File required to be submitted and posted pursuant to Rule 405 of Regulation S-T (§232.405 of this chapter) during the preceding 12 months (or for such shorter period that the Registrant was required to submit and post such files). YES ☒ NO ☐
Indicate by check mark if disclosure of delinquent filers pursuant to Item 405 of Regulation S-K (§229.405) is not contained herein, and will not be contained, to the best of Registrant’s knowledge, in definitive proxy or information statements incorporated by reference in Part III of this Form 10-K or any amendment to this Form 10-K. ☐
Indicate by check mark whether the Registrant is a large accelerated filer, an accelerated filer, a non-accelerated filer, a smaller reporting company, or an emerging growth company. See the definitions of “large accelerated filer,” “accelerated filer,” “smaller reporting company,” and “emerging growth company” in Rule 12b-2 of the Exchange Act.
|
Large accelerated filer |
|
☐ |
|
Accelerated filer |
|
☒ |
|
|
|
|
|
|||
|
Non-accelerated filer |
|
☐ (Do not check if a smaller reporting company) |
|
Smaller reporting company |
|
☐ |
|
|
|
|
|
|
|
|
|
Emerging growth company |
|
☒ |
|
|
|
|
If an emerging growth company, indicate by check mark if the Registrant has elected not to use the extended transition period for complying with any new or revised financial accounting standards provided pursuant to Section 13(a) of the Exchange Act. ☒
Indicate by check mark whether the Registrant is a shell company (as defined in Rule 12b-2 of the Exchange Act). YES ☐ NO ☒
As of June 30, 2017, the last business day of the Registrant’s most recently completed second quarter, the aggregate market value of voting stock held by non-affiliates of the Registrant based on the closing price of $5.85 for shares of the Registrant’s common stock as reported by the New York Stock Exchange, was approximately $172.5 million.
As of March 1, 2018, there were 115,141,419 shares of Registrant’s common stock outstanding.
Portions of the Registrant’s Definitive Proxy Statement relating to the Annual Meeting of Shareholders, scheduled to be held on July 12, 2018, are incorporated by reference into Part III of this report.
|
|
|
Page |
|
PART I |
|
|
|
Item 1. |
2 |
|
|
Item 1A. |
9 |
|
|
Item 1B. |
37 |
|
|
Item 2. |
37 |
|
|
Item 3. |
37 |
|
|
Item 4. |
37 |
|
|
|
|
|
|
PART II |
|
|
|
Item 5. |
38 |
|
|
Item 6. |
39 |
|
|
Item 7. |
Management’s Discussion and Analysis of Financial Condition and Results of Operations |
40 |
|
Item 7A. |
63 |
|
|
Item 8. |
64 |
|
|
Item 9. |
Changes in and Disagreements With Accountants on Accounting and Financial Disclosure |
107 |
|
Item 9A. |
107 |
|
|
Item 9B. |
107 |
|
|
|
|
|
|
PART III |
|
|
|
Item 10. |
108 |
|
|
Item 11. |
108 |
|
|
Item 12. |
Security Ownership of Certain Beneficial Owners and Management and Related Stockholder Matters |
108 |
|
Item 13. |
Certain Relationships and Related Transactions, and Director Independence |
108 |
|
Item 14. |
108 |
|
|
|
|
|
|
PART IV |
|
|
|
Item 15. |
109 |
i
Forward-looking Statements
This report, including the sections entitled “Business,” “Risk Factors,” and “Management’s Discussion and Analysis of Financial Condition and Results of Operations” and certain information incorporated by reference into this report contain forward-looking statements within the meaning of Section 27A of the Securities Act of 1933, as amended, and Section 21E of the Securities Exchange Act of 1934, as amended. Forward-looking statements are identified by words such as “believe,” “anticipate,” “expect,” “intend,” “plan,” “will,” “may,” “seek” and other similar expressions. You should read these statements carefully because they discuss future expectations, contain projections of future results of operations or financial condition or state other “forward-looking” information. These statements relate to our future plans, objectives, expectations, intentions and financial performance and the assumptions that underlie these statements.
These forward-looking statements include, but are not limited to:
|
|
• |
federal, state and local regulations and policies governing the electric utility industry; |
|
|
• |
the regulatory regime for our offerings and for third-party owned solar energy systems; |
|
|
• |
technical limitations imposed by operators of the power grid; |
|
|
• |
the continuation of tax rebates, credits and incentives, including changes to the rates of the investment tax credit, or ITC, beginning in 2020; |
|
|
• |
the price of utility-generated electricity and electricity from other sources; |
|
|
• |
our ability to finance the installation of solar energy systems; |
|
|
• |
our ability to efficiently install and interconnect solar energy systems to the power grid; |
|
|
• |
our ability to manage growth, product offering mix and costs; |
|
|
• |
our ability to further penetrate existing markets and expand into new markets; |
|
|
• |
our ability to develop new product offerings and distribution channels; |
|
|
• |
our relationships with our sister company Vivint, Inc., or Vivint, and The Blackstone Group L.P., our Sponsor; |
|
|
• |
our ability to manage our supply chain; |
|
|
• |
the cost of solar panels and the residual value of solar panels after the expiration of our long-term customer contracts; |
|
|
• |
the course and outcome of litigation and other disputes; and |
|
|
• |
our ability to maintain our brand and protect our intellectual property. |
In combination with the risk factors we have identified, we cannot assure you that the forward-looking statements in this report will prove to be accurate. Further, if our forward-looking statements prove to be inaccurate, the inaccuracy may be material. In light of the significant uncertainties in these forward-looking statements, you should not regard these statements as a representation or warranty by us or any other person that we will achieve our objectives and plans in any specified time frame, or at all, or as predictions of future events. Moreover, neither we nor any other person assumes responsibility for the accuracy and completeness of the forward-looking statements. We undertake no obligation to publicly update any forward-looking statements, whether as a result of new information, future events or otherwise, except as required by law.
1
BUSINESS
Overview
We offer distributed solar energy — electricity generated by a solar energy system installed at or near customers’ locations — to residential customers primarily through a customer-focused and neighborhood-driven direct-to-home sales model. Through investment funds, we own a substantial majority of the solar energy systems we install and provide solar electricity pursuant to long-term contracts with our customers. Additionally, we wholly own a smaller number of solar energy systems outside of investment funds. We also sell solar energy systems outright to customers.
Customers that enter long-term contracts pay little to no money upfront, typically receive material savings on solar-generated electricity rates relative to utility-generated electricity rates following system interconnection to the power grid, and continue to benefit from locked-in energy prices over the term of their contracts, insulating them against unpredictable increases in utility rates. The majority of these customers sign 20-year contracts for solar electricity generated by our systems and pay us directly over the term of their contracts.
Our 20-year customer contracts generate predictable, recurring cash flows and establish a long-term relationship with homeowners. As of December 31, 2017 the average estimated nominal contracted payment for our long-term customer contracts was approximately $27,750, and there is the potential for additional payments if customers choose to renew their contracts at the end of the term. The ownership of the solar energy systems we install under long-term customer contracts allows us and the other fund investors to benefit from various local, state and federal incentives. We obtain financing based on cash flows from customers and these incentives. When customers decide to move or sell the home prior to the end of their contract term, the customer contracts allow our customers to transfer their obligations to the new home buyer. If the home buyer does not wish to assume the customer’s obligations, the contract allows us to require the customer to purchase the system. Our sources of financing are used to offset our direct installation costs and most, if not all, of our allocated overhead expenses. As of February 28, 2018, we had raised 22 investment funds to which investors such as banks and other large financial investors have committed to invest approximately $1.5 billion. The undrawn committed capital for these funds as of February 28, 2018 is approximately $85 million, which we estimate will fund approximately 44 megawatts of future deployments.
We also offer our customers the option to purchase solar energy systems for cash or through third-party loan financing, which is becoming an increasingly significant portion of our business. Selling solar energy systems allows us to address customers who prefer to own the solar energy system and assume the long-term benefits and risks of system ownership. Customers who choose this option are generally eligible for various local, state and federal incentives, which may help to offset the cost of their solar energy system.
We have developed an integrated approach to providing residential distributed solar energy where we fully control the lifecycle of our customers’ experience including the initial professional consultation, design and engineering process, installation, and ongoing monitoring and service. We deploy our sales force on a neighborhood-by-neighborhood basis, which allows us to cultivate a geographically concentrated customer base that reduces our costs and increases our operating efficiency. We couple this model with repeatable and scalable processes to establish warehouse facilities, assemble and train sales and installation teams and open new offices. We believe that our processes enable us to expand within existing markets and into new markets. We also believe that our direct sales model and integrated approach represent a differentiated platform, unique in the industry, that maximizes sales effectiveness, delivering high levels of customer satisfaction and driving cost efficiency.
From our inception in May 2011 through December 31, 2017, we have installed solar energy systems with an aggregate of 864.9 megawatts of capacity at approximately 126,800 homes in 21 states for an average solar energy system capacity of approximately 6.8 kilowatts.
2
The key elements of our integrated approach to providing distributed solar energy include:
|
|
• |
Professional consultation. We deploy our direct-to-home sales force to provide in-person professional consultations to prospective customers to evaluate the feasibility of installing a solar energy system at their residence. Our sales closing and referral rates are enhanced by homeowners’ responsiveness to our direct-to-home, neighborhood-by-neighborhood outreach strategy. |
|
|
• |
Design and engineering. We have developed a process that enables us to design and install a custom solar energy system that delivers customer savings. This process, which incorporates proprietary software, standardized templates and data derived from on-site surveys, allows us to design each system to comply with complex and varied state and local regulations and optimize system performance on a per panel basis. We continue to pursue technology innovation to integrate accurate system design into the initial sales consultation process as a competitive tool to enhance the customer experience and increase sales close rates. |
|
|
• |
Installation. We are a licensed contractor in the markets we serve and are responsible for each customer installation. Once we complete the system design, we obtain the necessary building permits and begin installation. Upon completion, we schedule the required inspections and arrange for interconnection to the power grid. By directly handling these logistics, we control quality and streamline the system installation process for our customers. Throughout this process, we apprise our customers of the project status with regular updates from our account representatives. |
|
|
• |
Monitoring and service. We monitor the performance of our solar energy systems, leveraging a combination of internally developed solutions as well as capabilities provided by our suppliers. Our systems use communication gateways and monitoring services to collect performance data, and we use this data to ensure that we deliver quality operations and maintenance services for our solar energy systems. If services are required, our strong local presence enables rapid response times. |
|
|
• |
Referrals. We believe our commitment to delivering customer satisfaction and our concentrated geographic deployment strategy have generated sales through customer referrals, which increase our neighborhood penetration rates and drive our growth. Our financial returns also benefit from the cost savings derived from increasing the density of installations in a neighborhood. |
Our goal is to become the premier provider of distributed solar energy. Key elements of our strategy include:
|
|
• |
Building the most sustainable business in the residential solar industry. We are working to enhance the sustainability of our business by striving to improve the margins we generate on every system we install. We improve our margins by reducing our cost per watt over time, by pricing appropriately in each market and by growing in the right markets. We seek to balance our growth against the operating cash flows and project funding required to offset our operating expenses. |
|
|
• |
Delighting our customers. We strive to provide a best-in-class customer experience. We offer customized solar energy solutions to each of our customers based on their individual situation and needs, and we are streamlining the time from when a customer signs a contract to when their system is operational. We are also continually working to improve our processes and customer communication in an effort to provide superior customer service. Additionally, we employ a detailed quality assessment process to our installations to validate that we maintain a high installation standard. |
|
|
• |
Developing a differentiated solution. We aim to provide unique products in an increasingly commoditized industry, and we believe the market needs smart energy solutions that combine how energy is produced, made available and intelligently consumed. We have formed strategic relationships to develop and provide distinctive solutions to our customers, such as battery storage and electric vehicle charging products. |
|
|
• |
Accessing capital on favorable terms. We partner with various investors to form investment funds that monetize the recurring customer payments under our long-term customer contracts, as well as the ITCs, accelerated tax depreciation and other incentives associated with residential solar energy systems. We have also entered into financing facilities to further monetize recurring cash flows and to fund solar energy system development. We plan to pursue additional debt, equity and other financing strategies in order to access capital on favorable terms to enable our continued growth. |
3
Customer Contracts
Our current product offering includes the following:
|
|
• |
Power Purchase Agreements. Under power purchase agreements, or PPAs, we charge customers a fee per kilowatt hour based on the amount of electricity the solar energy system actually produces, which is billed monthly. PPAs typically have a term of 20 years and are subject to an annual price escalator of 2.9%. Over the term of the PPA, we operate the system and agree to maintain it in good condition. Customers who buy energy from us under PPAs are covered by our workmanship warranty equal to the length of the term of these agreements. |
|
|
• |
Legal-form Leases. Under legal-form leases, or Solar Leases, we charge customers a fixed monthly payment to lease the solar energy system, which is based on a calculation that takes into account expected solar energy generation. Solar Leases typically have a term of 20 years and are subject to an annual price escalator of 2.9%. We provide our Solar Lease customers a performance guarantee, under which we agree to refund payments to the customer if the solar energy system does not meet the guaranteed production level in the prior 12-month period. Liabilities for Solar Lease performance guarantees were $0.1 million and a de minimis amount as of December 31, 2017 and 2016. Over the term of the Solar Lease, we operate the system and agree to maintain it in good condition. Customers who buy energy from us under Solar Leases are covered by our workmanship warranty equal to the length of the term of these agreements. |
|
|
• |
Solar Energy System Sales. Under solar energy system sales, or System Sales, we offer our customers the option to purchase solar energy systems for cash or through third-party financing. The price for these contracts is determined as a function of the respective market rate and the size of the solar energy system to be installed. We agree to warranty and maintain the solar energy systems we sell to customers for periods of one to ten years. Additionally, in connection with the installation of a solar energy system, customers can contract with us for certain structural upgrades, smart home products, battery storage systems, electric vehicle charging stations and other accessories based on the market where they are located. We believe System Sales are advantageous to us as they provide immediate access to cash. |
Of our 183.8 megawatts installed in 2017, approximately 75% were installed under PPAs, 3% were installed under Solar Leases and 22% were installed under System Sales. As of December 31, 2017, the average FICO score of our customers was approximately 760.
We place our integrated residential solar energy systems through a scalable sales organization that relies primarily on a direct-to-home sales model. We believe that a high-touch, customer-focused selling process is important before, during and after the sale of our products to maximize our sales success. The members of our sales force typically reside and work within the markets they serve. We also generate a significant amount of sales through customer referrals. We have found that customer referrals increase in relation to our penetration in a market. Shortly after entering a new market, referrals become an increasingly effective way to market our solar energy systems.
In addition to direct sales, we sell to customers through our inside sales team and through sales dealer agreements that we have entered into with Vivint and others. We also continue to explore opportunities to sell solar energy systems to customers through a number of other distribution channels, including relationships with real estate management companies, home builders, home improvement stores, large construction, electrical and roofing companies and other third parties that have access to large numbers of potential customers.
4
As of December 31, 2017, we operated in 21 states. Our corporate headquarters are located in Utah. We manage inventory through our local warehouses and maintain a fleet of approximately 750 trucks and other vehicles to support our installers and operations. In 2017, our field teams completed on average approximately 2,300 residential installations per month. We manage thousands of projects as they move through the stages of engineering, permitting, installation, maintenance and monitoring.
We offer a range of warranties to our investment funds on our solar energy systems under long-term customer contracts to ensure the solar energy systems remain productive. Under our workmanship warranty, we are obligated, at our cost and expense, to correct defects in our installation work, which depending on the particular investment fund, is for periods of five to 20 years. Generally, our maintenance obligations to our investment funds do not include the cost of panels, inverters or racking, should such major components require replacement. The cost of such components is borne instead by the applicable investment fund, although we are obligated to install such equipment as part of our services covered by the agreed maintenance services fee. We provide ongoing service and repairs to solar energy systems under PPAs and Solar Leases during the entire term of the customer relationship. We also agree to provide a workmanship warranty and maintain the solar energy systems we sell to customers through System Sales for a period of one to ten years. We expect the costs we incur in providing these services will continue to grow as the number of systems in our portfolio increases and as installed solar energy systems age.
Suppliers
We are diversified across our supply chain and purchase solar panels, inverters and other components from multiple manufacturers. Substantially all of our solar panels and inverters are produced outside the United States. We generally source the other products related to our solar energy systems through a variety of suppliers and distributors.
If we fail to develop, maintain and expand our relationships with these or other suppliers, our ability to meet anticipated demand for our solar energy systems may be adversely affected, or we may only be able to offer our systems at higher costs or after delays. To reduce risk, we have added suppliers in the module, inverter and racking product groups. If one or more of the suppliers that we rely upon to meet anticipated demand ceases or reduces production due to its financial condition, acquisition by a competitor or otherwise, it may be difficult to quickly identify alternative suppliers or to qualify alternative products on commercially reasonable terms, and our ability to satisfy this demand may be adversely affected.
We screen all suppliers and components based on expected cost, reliability, warranty coverage, ease of installation and other ancillary costs. We typically enter into master contract arrangements with our major suppliers that define the general terms and conditions of our purchases, including warranties, product specifications, indemnities, licenses, delivery and other customary terms. We typically purchase solar panels, inverters and racking from our suppliers at then prevailing prices pursuant to purchase orders issued under our master contract arrangements.
Although the solar panel market has seen an increase in supply, upward pressure on prices may occur due to growth in the solar industry, regulatory policy changes and the resulting increase in demand for solar panels and the raw materials necessary to manufacture them. On January 22, 2018, in response to a petition filed under Section 201 of the Trade Act of 1974, the President of the United States announced the imposition of safeguard measures for a period of four years that include (1) a 30% tariff on imports of solar cells not partially or fully assembled into other products and (2) a 30% tariff on imported solar modules. The tariff on imported solar modules will decline 5% each year in the second, third and fourth years. The safeguard measures went into effect on February 7, 2018 and apply to imports for all foreign countries, including Mexico and Canada, except certain developing countries that are members of the World Trade Organization. As a result, we will likely pay higher prices on imported solar modules, making it less economical for us to serve certain markets.
Competition
We believe that our primary competitors are the traditional utilities that supply electricity to our potential customers. We compete with these traditional utilities primarily based on price (cents per kilowatt hour), predictability of future prices (by providing pre-determined annual price escalations) and the ease by which customers can switch to electricity generated by our solar energy systems. We believe that we compete favorably with traditional utilities based on these factors in the states where we operate.
We also compete with companies that are not regulated like traditional utilities but that have access to the traditional utility electricity transmission and distribution infrastructure pursuant to state and local pro-competitive and consumer choice policies, as well as with national and local solar companies such as Tesla’s SolarCity subsidiary and Sunrun Inc. These companies may offer products that are similar to our PPAs, Solar Leases and System Sales. We believe that we compete favorably with these companies.
5
In addition, we compete with solar companies in the downstream value chain of solar energy. For example, we face competition from purely finance driven organizations that acquire customers and then subcontract out the installation of solar energy systems, from installation businesses that seek financing from external parties, from large construction companies and utilities and increasingly from sophisticated electrical and roofing companies. These distributed energy competitors typically employ contractual arrangements with third parties, leaving the customer in the position of having to deal with different companies for different aspects of their solar energy systems. We believe that we compete favorably with these companies because we offer an integrated approach to residential solar energy systems, which includes in-house sales, financing, engineering, installation, maintenance and monitoring. Many of our competitors offer only a subset of the services we provide. Aside from simple cost efficiency, we offer distinct practical benefits as an all-in-one provider such as providing a single point of contact and accountability for our offerings during the relationship with our customers. Further, we are not dependent on installation subcontractors, enabling us to better scale our business while maintaining quality control.
Technology and Intellectual Property
As of December 31, 2017, we, directly or through our wholly owned subsidiary Solmetric Corporation, also known as Vivint Solar Labs, had seven patents and eleven pending applications with the U.S. Patent and Trademark Office. These patents and applications relate to shade and site analysis, installation and monitoring technologies. Our issued patents start expiring in 2026. We intend to file additional patent applications as we innovate through our research and development efforts. Vivint Solar Labs is our research and development team focused on technologies that we believe will benefit our business, as they have significant experience with photovoltaic hardware and installation instruments.
As part of our strategy, we may expand our technological capabilities through targeted acquisitions, licensing technology and intellectual property from third parties, joint development relationships with partners and suppliers and other strategic initiatives as we strive to offer the industry’s best operational efficiency, performance prediction, operations and management.
Government Regulation, Policies and Incentives
Government Regulation
Except as described below with respect to New York, we are not regulated as a public utility in any of the markets in which we currently operate. As a result, we are not subject to the various federal, state and local standards, restrictions and regulatory requirements applicable to traditional utilities that operate transmission and distribution systems and that have an obligation to serve electric customers within a specified jurisdiction.
On October 19, 2017, the Public Service Commission of the State of New York, or the NYPSC, entered an order determining that residential rooftop solar energy providers are “electric corporations” (the term for electric utilities under New York state law) and requiring changes that will affect certain aspects of our business. The order, which is part of a broader proceeding before the NYPSC associated with regulating and overseeing distributed energy resource suppliers, is premised on the NYPSC’s determination that it has the jurisdiction to oversee our business, and businesses like ours, in the same way that it oversees public utilities. We have worked with the Solar Energy Industries Association, or SEIA, and others in the industry to petition the NYPSC for a rehearing on the order, specifically challenging its position that the statutes giving it the ability to regulate utilities also give it jurisdiction over us. Though the NYPSC is, to our knowledge, the first state public commission to take the position that residential rooftop solar energy providers are subject to the same regulatory oversight as electric utilities, we understand from SEIA that other public service commissions are monitoring what is happening in New York, and may take similar action depending on the outcome.
Our operations are subject to stringent and complex federal, state and local laws, including regulations governing the occupational health and safety of our employees and wage regulations. For example, we are subject to the requirements of the federal Occupational Safety and Health Act, as amended, or OSHA, the U.S. Department of Transportation, or DOT, and comparable state laws that protect and regulate employee health and safety. We strive to maintain compliance with applicable OSHA, DOT and similar government regulations; however, as discussed in the section captioned “Risk Factors—Compliance with occupational safety and health requirements and best practices can be costly, and noncompliance with such requirements may result in potentially significant monetary penalties, operational delays and adverse publicity,” there have been instances in which we have experienced workplace accidents and received citations from regulators, resulting in fines. Such instances have not materially impacted our business or relations with our employees.
6
Net metering is one of several key policies that have enabled the growth of distributed solar in the United States. Net metering allows homeowners to receive credit for the energy that their solar energy system generates in excess of that consumed onsite to offset energy usage at times when the solar installation is not generating energy. In states that provide for traditional net metering, the customer typically pays for the net energy used and receives a credit against future bills, typically within a 12-month period, at the retail rate if more energy is produced by the solar energy system than consumed onsite. In some states and utility territories, customers are also reimbursed by the electric utility for net excess generation, at the cost avoided rate, on a periodic basis. Forty states, Puerto Rico, the District of Columbia, American Samoa and the U.S. Virgin Islands have adopted some form of net metering. Each of the states where we currently serve customers has adopted some form of a net metering policy.
In recent years, net metering programs have been subject to regulatory scrutiny and legislative proposals in some states, such as Arizona, California, Hawaii, Nevada, New Hampshire, New York, Texas and Utah. Utilities are proposing new and varied revisions to their net metering programs, with such proposals decided by the state public utilities commissions. These revisions include capping the numbers of customers that can elect net metering within a utility service territory, imposing new fixed charges for grid service or interconnection, reducing the retail rate value of the net metered generation, and adjusting the netting period.
In California, for example, customers within the service territory of San Diego Gas and Electric, Pacific Gas and Electric Company, and Southern California Edison Company, must take service on a new net metering successor tariff. For this new tariff, the California Public Utilities Commission largely uses the prior net metering form with full retail compensation for exports, but allows the utilities to impose reasonable interconnection fees and some additional charges on customers, and will require such customers to take service on time-of-use rates. There are no caps under the new net energy metering, or NEM, successor tariff. Further, municipal utilities are generally not subject to the same state laws and public commission oversight as compared to investor owned utilities and may make drastic and abrupt changes. As we continue to expand into areas with municipal utilities, we may be subject to greater risk of regulatory uncertainty.
In October 2015, the Hawaii Public Utilities Commission issued an order closing the Hawaiian Electric Company’s net metering program to new participants and replaced this program with two new options for customers to interconnect to the utilities’ power grids, neither of which provides for compensation for exports at retail electricity rates. Subsequently, in October 2017, the Hawaii Public Utilities Commission issued an order approving two new rooftop solar programs, neither of which provides for compensation for exports at the retail electric rate.
In December 2016, the Arizona Corporation Commission decided to end traditional net metering and transition to a new distributed solar energy net metering compensation regime in which customers are paid for energy generated from solar energy systems located on their roofs pursuant to a resource comparison proxy methodology or avoided cost methodology. Each of these methodologies will yield a compensation rate that is less advantageous than was previously available to customers under the historical net metering regime, limited to a 10% step down in each utility’s rate annually. The Arizona Corporation Commission has also adopted a settlement agreement between the Arizona Public Service Company and industry stakeholders under which demand charges based on a customer’s maximum average rate of energy consumed during a specified interval will be imposed on residential customers under certain rate schedules. These changes reduce the value proposition for residential solar in Arizona as compared to residential solar under the traditional net metering regime.
In December 2016, Rocky Mountain Power submitted a request to the Utah Public Service Commission that the Commission implement new rates for net metered customers seeking interconnection. We, together with other parties and Rocky Mountain Power entered into a settlement agreement that was filed with the Utah Public Service Commission in August 2017. The settlement provides for (among other things): (1) an end to the current net metering program on November 15, 2017 and establishes a grandfathering period through 2035 for all customers enrolled in the program before such date; (2) a transition program through 2020 where customers will receive slightly less than the retail rate for their net metering credits through 2033; and (3) a new proceeding in front of the Utah Public Service Commission to study the value of rooftop solar based on the long-term benefits and costs of distributed energy systems. A decision from the Utah Public Service Commission approving the settlement agreement was issued in September 2017.
As discussed in the section captioned “Risk Factors—We rely on net metering and related policies to offer competitive pricing to our customers in all of our current markets, and changes to net metering policies may significantly reduce demand for electricity from our solar energy systems,” the absence of favorable net metering policies or of net metering entirely, or the imposition of new charges that only or disproportionately impact customers that use net metering, would significantly limit customer demand for our solar energy systems and the electricity they generate and could adversely impact our business, results of operations and future growth.
7
Federal, state and local government bodies and utilities provide for tariff structures and incentives to various parties, including owners, end users, distributors, system integrators and manufacturers of solar energy systems to promote solar energy. These incentives come in various forms, including rebates, tax credits and other financial incentives such as system performance payments, renewable energy credits associated with renewable energy generation, exclusion of solar energy systems from property tax assessments and net metering. We rely on these governmental and regulatory programs to finance solar energy system installations, which enables us to lower the price we charge our customers for energy from, and to lease or purchase, our solar energy systems, helping to catalyze customer acceptance of solar energy with those customers as an alternative to utility-provided power.
The Federal government currently offers a 30% ITC under Section 48(a) of the Internal Revenue Code for the installation of certain solar power facilities; legislation was passed in December 2015 which extended this 30% rate until December 31, 2019. By statute, the ITC is scheduled to decrease to 26% of the fair market value of a solar energy system for 2020, 22% for 2021 and 10% on January 1, 2022.
The economics of purchasing a solar energy system are also improved by eligibility for accelerated depreciation, also known as the modified accelerated cost recovery system, or MACRS, which allows for the depreciation of equipment according to an accelerated schedule established by the Internal Revenue Service, or IRS. The acceleration of depreciation creates a valuable tax benefit that reduces the overall cost of the solar energy system and increases the return on investment.
Many of the states in which we operate offer a personal and/or corporate investment or production tax credit for solar energy that is additive to the ITC. Further, many of the states and local jurisdictions have established property tax incentives for renewable energy systems that include exemptions, exclusions, abatements and credits.
Many state governments, traditional utilities, municipal utilities and co-operative utilities offer a rebate or other cash incentive for the installation and operation of a solar energy system or energy efficiency measures. Capital costs or “up-front” rebates provide funds to solar customers or developers or system owners based on the cost, size or expected production of a customer’s solar energy system. Performance-based incentives provide cash payments to solar customers or a system owner based on the energy generated by the solar energy system during a pre-determined period.
Many states also have adopted procurement requirements for renewable energy production. Twenty-nine states, the District of Columbia and three U.S. territories have adopted a renewable portfolio standard that requires regulated utilities to procure a specified percentage of total electricity delivered to customers in the state from eligible renewable energy sources, such as solar energy systems, by a specified date. To prove compliance with such mandates, utilities usually must surrender solar renewable energy certificates, or SRECs, to the applicable authority. Solar energy system owners such as our investment funds often are able to sell SRECs to utilities directly or in SREC markets.
Workforce
As of December 31, 2017, we had a total workforce of 2,322, which does not include direct sellers. None of our service providers are represented by a labor union, and we consider relations with our employees to be good.
8
You should carefully consider the following risk factors, together with all of the other information included in this report, including the section of this report captioned “Management’s Discussion and Analysis of Financial Condition and Results of Operations” and our financial statements and related notes. If any of the following risks occurred, they could materially adversely affect our business, financial condition or operating results. This report also contains forward-looking statements that involve risks and uncertainties. Our actual results could differ materially from those anticipated in the forward-looking statements as a result of factors that are described below and elsewhere in this report.
Risk Related to Our Business
We need to enter into substantial additional financing arrangements to facilitate new customers’ access to our solar energy systems, and if financing is not available to us on acceptable terms when needed, our ability to continue to grow our business would be materially adversely impacted.
Our future success depends on our ability to raise capital from third-party investors and commercial sources, such as banks and other lenders, on competitive terms to help finance the deployment of our solar energy systems. We seek to minimize our cost of capital in order to maintain the price competitiveness of the electricity produced by, the lease payments for and the cost of our solar energy systems. We rely on investment funds in order to provide solar energy systems with little to no upfront costs to our customers under our PPAs and Solar Leases. We also rely on access to capital to cover the costs of our solar energy systems that are sold outright until the systems are paid for by our customers, whether by cash or through third-party financing arrangements. Certain of our financing arrangements are with fund investors who require particular tax and other benefits. The availability of this tax-advantaged financing depends upon many factors, including:
|
|
• |
our ability to compete with other renewable energy companies for the limited number of potential investment fund investors, each of which has limited funds and limited appetite for the tax benefits associated with these financings; |
|
|
• |
the state of financial and credit markets; |
|
|
• |
changes in the legal or tax risks associated with these financings; and |
|
|
• |
non-renewal of certain incentives or decreases in the associated benefits. |
Moreover, potential investors seeking such tax-advantaged financing must remain satisfied that the structures we offer qualify for the tax benefits associated with solar energy systems available to these investors, which depends both on the investors’ assessment of tax law and the absence of any unfavorable interpretations of that law. Changes in existing law and interpretations by the IRS, and the courts could reduce the willingness of fund investors to invest in funds associated with these solar energy system investments, or cause these investors to require a larger allocation of customer payments. We are not certain that this type of financing will continue to be available to us. If we are unable to establish new financing when needed, or upon desirable terms, to enable our customers’ access to our solar energy systems, we may be unable to finance installation of our customers’ systems, our cost of capital could increase or our liquidity could be constrained, any of which would have a material adverse effect on our business, financial condition, results of operations and prospects. As of February 28, 2018, we had raised 22 investment funds to which investors such as banks and other large financial investors have committed to invest approximately $1.5 billion. The undrawn committed capital for these funds as of February 28, 2018 is approximately $85 million, which we estimate will fund approximately 44 megawatts of future deployments.
The contract terms in certain of our investment fund documents impose conditions on our ability to draw on financing commitments from the fund investors, including if an event occurs that could reasonably be expected to have a material adverse effect on the fund or on us. If we do not satisfy such conditions due to events related to our business or a specific investment fund or developments in our industry or otherwise, and as a result we are unable to draw on existing commitments, our inability to draw on such commitments could have a material adverse effect on our business, liquidity, financial condition and prospects. In addition to our inability to draw on the investors’ commitments, we may incur financial penalties for non-performance, including delays in the installation process and interconnection to the power grid of solar energy systems and other factors. Based on the terms of the investment fund agreements, we will either reimburse a portion of the fund investor’s capital or pay the fund investor a non-performance fee. For example, during the year ended December 31, 2017, we paid contractually agreed upon capital distributions of $8.4 million to reimburse fund investors a portion of their capital contributions primarily due to a delay in solar energy systems being interconnected to the power grid and other factors.
9
To meet the capital needs of our growing business, we will need to obtain additional financing from new investors and investors with whom we currently have arrangements. If any of the financial institutions that currently provide financing decide not to invest in us in the future due to general market conditions, concerns about our business or prospects or any other reason, or decide to invest at levels that are inadequate to support our anticipated needs or materially change the terms under which they are willing to provide future financing, we will need to identify new financial institutions and companies to provide financing and negotiate new financing terms. If we are unable to raise additional capital in a timely manner, our ability to meet our capital needs and fund future growth may be limited.
In the past, we have sometimes been unable to timely establish investment funds in accordance with our plans, due in part to the relatively limited number of investors attracted to such types of funds, competition for such capital and the complexity associated with negotiating the agreements with respect to such funds. Delays in raising financing could cause us to delay expanding in existing markets or entering into new markets and hiring additional personnel. Any future delays in capital raising could similarly cause us to delay deployment of a substantial number of solar energy systems for which we have signed PPAs or Solar Leases with customers. Our future ability to obtain additional financing depends on banks’ and other financing sources’ continued confidence in our business model and the renewable energy industry as a whole. It could also be impacted by the liquidity needs of such financing sources themselves. We face intense competition from a variety of other companies, technologies and financing structures for such limited investment capital. If we are unable to continue to offer a competitive investment profile, we may lose access to these funds or they may only be available to us on terms that are less favorable than those received by our competitors. For example, if we experience higher customer default rates than we currently experience in our existing investment funds, it could be more difficult or costly to attract future financing. In our experience, there are a relatively small number of investors that generate sufficient profits and possess the requisite financial sophistication to benefit from and have significant demand for the tax benefits that our investment funds provide. Historically, in the distributed solar energy industry, investors have typically been large financial institutions and a few large, profitable corporations. Our ability to raise investment funds is limited by the relatively small number of such investors. Any inability to secure financing could lead us to cancel planned installations, impair our ability to accept new customers or increase our borrowing costs, any of which would have a material adverse effect on our business, financial condition, results of operations and prospects.
A material reduction in the retail price of traditional utility-generated electricity or electricity from other sources or other reduction in the cost of such electricity would harm our business, financial condition, results of operations and prospects.
We believe that many of our customers decide to buy solar energy because they want to pay less for their energy costs. However, distributed residential solar energy has yet to achieve broad market adoption for a number of reasons including state regulatory hurdles, utility imposed interconnection issues for distributed electricity generation systems and unfavorable economics from the customer perspective.
The customer’s decision to choose solar energy may also be affected by the cost of other renewable energy sources. Decreases in the retail prices of electricity from the traditional utilities or from other renewable energy sources would harm our ability to offer competitive pricing and could harm our business. The cost of electricity from traditional utilities could decrease as a result of:
|
|
• |
construction of new power generation plants, including plants utilizing natural gas, nuclear, coal, renewable energy or other generation technologies; |
|
|
• |
the construction of additional electric transmission and distribution lines; |
|
|
• |
relief of transmission constraints that enable local centers to generate energy less expensively; |
|
|
• |
reductions in the price of natural gas or other fuel sources; |
|
|
• |
utility rate adjustment and customer class cost reallocation; |
|
|
• |
energy conservation technologies and public initiatives to reduce electricity consumption; |
|
|
• |
widespread deployment of existing or development of new or lower-cost energy storage technologies that have the ability to reduce a customer’s average cost of electricity by shifting load to off-peak times; |
|
|
• |
changes in regulations by federal or state regulatory bodies that lower the cost of generating and transmitting electricity or otherwise reduce regulatory compliance costs for traditional utilities, or otherwise disadvantage residential solar energy providers relative to traditional utilities; and |
|
|
• |
development of new energy generation technologies that provide less expensive energy. |
10
A reduction in utility electricity costs would make PPAs or Solar Leases less economically attractive to customers on a monthly basis and would increase the time to break-even for our System Sales customers. If the cost of energy available from traditional utilities were to decrease due to any of these reasons, or other reasons, we would be at a competitive disadvantage, we may be unable to attract new customers and our growth would be limited. In addition, from time to time we have increased our pricing in certain markets, which may negatively impact our competitiveness.
Electric utility industry policies and regulations may present technical, regulatory and economic barriers to the purchase and use of solar energy systems that may significantly reduce demand for electricity from our solar energy systems.
Federal, state and local government regulations and policies concerning the electric utility industry, utility rate structures, interconnection procedures, and internal policies of electric utilities, heavily influence the market for electricity generation products and services. These regulations and policies often relate to electricity pricing and the interconnection of distributed electricity generation systems to the power grid. Policies and regulations that promote renewable energy and customer-sited energy generation have been challenged by traditional utilities and questioned by those in government and others arguing for less governmental spending and involvement in the energy market. In addition, it is unclear what, if any, actions the current presidential administration in the United States, the U.S. Department of Energy, and the Federal Energy Regulatory Commission may take regarding existing regulations and policies that affect the cost competitiveness of nuclear, coal and gas electric generation, and fossil fuel mining and exploration. Changes in such policies and regulations could increase the cost or decrease the benefits of solar energy systems, or reduce costs and other limitations on competing forms of generation, and adversely affect the attractiveness of our products and our results of operations, cost of capital and growth prospects.
In the United States, governments and the state public service commissions that determine utility rates continuously modify these regulations and policies. These regulations and policies could result in a significant reduction in the potential demand for electricity from our solar energy systems and could deter customers from entering into contracts with us. In addition, in certain of our regions, electricity generated by solar energy systems competes most effectively with the most expensive retail rates for electricity from the power grid, rather than the less expensive average price of electricity. Modifications to the utilities’ peak hour pricing policies or rate design, such as movement to a flat rate, would make our current products less competitive with the price of electricity from the power grid. Other regulatory revisions that could impact the competitiveness of our product include moving from a retail rate to a time-of-use compensation mechanism, imposition of fixed demand or grid-service charges, or limitations on whether third-party owned systems are eligible for such programs. For example, the California Public Utilities Commission has issued a decision that will transition residential rates over four years from a four-tiered structure to a two-tiered structure, with only a 25% differential between the two rates and a surcharge for very high energy users. It is possible that changes such as these could have the effect of lowering the incentive for residential customers of investor-owned utilities to reduce their purchases of electricity from their utility by supplying more of their own electricity from solar, and thereby reducing demand for our product. In addition, California has shifted to a time-of-use rate structure for all residential customers; Nevada and other jurisdictions are also developing time-of-use rate structures. A shift in the timing of peak rates for utility-generated electricity to a time of day when solar energy generation is less efficient or nonexistent could make our solar energy system offerings less competitive and reduce demand for our offerings. Several other states also use time-of-use rates. In addition, since we are required to obtain interconnection permission for each solar energy system from the local utility, changes in a local utility’s regulations, policies or interconnection processes have in the past delayed and in the future could delay or prevent the completion of our solar energy systems. This in turn has delayed and in the future could delay or prevent us from generating revenues from such solar energy systems or cause us to redeploy solar energy systems, adversely impacting our results of operations.
11
In addition, any changes to government or internal utility regulations and policies that favor electric utilities over residential rooftop solar energy (or that favor alternative forms of distributed energy over rooftop solar energy) could reduce our competitiveness and cause a significant reduction in demand for our offerings or increase our costs or the prices we charge our customers. Certain jurisdictions have proposed allowing traditional utilities to assess various fees on customers purchasing energy from solar energy systems or have imposed or proposed new charges or rate structures that would disproportionately impact solar energy system customers who utilize net metering, either of which would increase the cost of energy to those customers and could reduce demand for our solar energy systems. For example, in California, investor owned utilities are allowed to impose a minimum $10 fixed charge on the monthly bill for residential customers that elect net metering and also impose new fees for interconnection and other non-bypassable charges. Such non-bypassable charges are being authorized by other public utilities commissions outside of California. Additionally, certain utilities in Arizona have approved increased rates and charges for net metering customers, and others have proposed doing away with the state’s renewable electricity standard carve-outs for distributed generation. Specifically, in August 2017, the Arizona Corporation Commission adopted a settlement agreement between the Arizona Public Service Company and industry stakeholders under which demand charges based on a customer’s maximum average rate of energy consumed during a specified interval will be imposed on residential customers under certain rate schedules. These policy changes may negatively impact our customers and affect demand for our solar energy systems, and similar changes to net metering policies may occur in other states. It is also possible that these or other changes could be imposed on our current customers, as well as future customers. Due to the current and expected continued concentration of our solar energy systems in California, any such changes in this market would be particularly harmful to our reputation, customer relations, business, results of operations and future growth in these areas. We may be similarly adversely affected if our business becomes concentrated in other jurisdictions.
Our business currently depends on the availability of rebates, tax credits and other financial incentives. The expiration, elimination or reduction of these rebates, credits or incentives or our ability to monetize them could adversely impact our business.
Federal, state and local government and regulatory bodies provide for tariff structures and incentives to various parties including owners, end users, distributors, system integrators and manufacturers of solar energy systems to promote solar energy in various forms, including rebates, tax credits and other financial incentives such as system performance payments, renewable energy credits associated with renewable energy generation, exclusion of solar energy systems from property tax assessments and net metering. We rely on these governmental and regulatory programs to finance solar energy system installations, which enables us to lower the price we charge customers for energy from, and to lease or purchase, our solar energy systems, helping to achieve customer acceptance of solar energy with those customers as an alternative to utility-provided power. However, these programs may expire on a particular date, end when the allocated funding or capacity allocations are exhausted or be reduced or terminated. These reductions or terminations often occur without warning. For example, the Arizona Department of Revenue has previously attempted to assess and collect property taxes in the past on rooftop solar energy systems such as ours, and other jurisdictions may attempt to assess and collect property taxes in the future. In addition, the financial value of certain incentives decreases over time. For example, the value of SRECs in a market tends to decrease over time as the supply of SREC-producing solar energy systems installed in that market increases. If we overestimate the future value of these incentives, it could adversely impact our financial results.
Substantially all of our solar energy systems installed to date have been eligible for ITCs as well as accelerated depreciation benefits. We have relied on, and will continue to rely on, financing structures that monetize a substantial portion of those benefits and provide financing for our solar energy systems. The federal government currently offers a 30% ITC under Section 48(a) of the Internal Revenue Code for the installation of certain solar power facilities; the 30% rate continues until December 31, 2019. By statute, the ITC is scheduled to decrease to 26% of the fair market value of a solar energy system for 2020, 22% for 2021 and 10% on January 1, 2022, and the amounts that fund investors are willing to invest could decrease or we may be required to provide a larger allocation of customer payments to the fund investors as a result of this scheduled decrease. To the extent we have a reduced ability to raise investment funds as a result of this reduction or an inability to continue to monetize such benefits in our financing arrangements, the rate of growth of installations of our residential solar energy systems and our ability to maintain such systems could be negatively impacted. In addition, future changes in existing law and interpretations by the IRS and the courts with respect to certain matters, including but not limited to, treatment of the ITC and our financing arrangements, the taxation of business entities and the deductibility of interest expense could affect the amount that fund investors are willing to invest, which could reduce our access to capital. The ITC has been a significant driver of the financing supporting the adoption of residential solar energy systems in the United States and its scheduled reduction beginning in 2020, unless modified by an intervening change in law, will significantly impact the attractiveness of solar energy to these investors and could potentially harm our business.
12
In addition, the recently enacted Tax Cuts and Jobs Act, or TCJA, contains several provisions that could significantly impact the attractiveness of tax benefits to our fund investors. The TCJA reduces the highest marginal corporate tax rate from 35% to 21%, which causes accelerated depreciation to have less value to investors and results in investors having less appetite for ITCs. In addition, the TCJA imposes a new “base erosion and anti-abuse tax”, or BEAT. The BEAT is a minimum tax applied to certain large taxpayers who make deductible payments that erode their U.S. tax base above a minimum threshold. If an investor is subject to BEAT, ITCs may be used to partially, but not fully offset the BEAT, resulting in a decrease of the value of the ITCs of up to 20%. Thus, investors will likely discount their investments to reflect the lower corporate tax rate as well as the BEAT and may be less likely to invest in solar overall, which could potentially harm our business.
Applicable authorities may adjust or decrease incentives from time to time or include provisions for minimum domestic content requirements or other requirements to qualify for these incentives. An inability to finance solar energy systems through tax-advantaged structures, to realize or monetize depreciation benefits, to monetize or otherwise receive the benefit of rebates, tax credits, SRECs or other financial incentives, or to otherwise structure investment funds in ways that are both attractive to investors and allow us to provide desirable pricing to customers could adversely impact our results of operations and ability to compete in our industry by increasing our cost of capital, causing us to increase the prices of our energy and solar energy systems and reducing the size of our addressable market. In addition, this would adversely impact our ability to attract investment partners and to form new investment funds and our ability to offer attractive financing to prospective customers.
We rely on net metering and related policies to offer competitive pricing to our customers in all of our current markets, and changes to net metering policies may significantly reduce demand for electricity from our solar energy systems.
Our business benefits significantly from favorable net metering policies in states in which we operate. Net metering allows a homeowner to pay his or her local electric utility only for his or her power usage net of production from the solar energy system, transforming the conventional relationship between customers and traditional utilities. Homeowners receive credit for the energy that the solar installation generates in excess of that needed by the home to offset energy usage at times when the solar installation is not generating energy. In states that provide for net metering, the customer typically pays for the net energy used or receives a credit against future bills at the retail rate if more energy is produced by the solar installation than consumed. In some states and utility territories, customers are also reimbursed by the electric utility for net excess generation on a periodic basis.
In recent years, net metering programs have been subject to regulatory scrutiny and legislative proposals in some states, such as Arizona, California, Hawaii, Nevada, New Hampshire, New York, Texas and Utah. Utilities are proposing new and varied revisions to their net metering programs, with such proposals decided by the state public utilities commissions. These revisions include capping the numbers of customers that can elect net metering within a utility service territory, imposing new fixed charges for grid service or interconnection, and reducing the retail rate value of the net metered generation. In California, for example, customers within the service territory of San Diego Gas and Electric, Pacific Gas and Electric Company, and Southern California Edison Company, must take service on a new net metering successor tariff. For this new tariff, the California Public Utilities Commission largely uses the current net metering form with full retail compensation for exports, but allows the utilities to impose reasonable interconnection fees and some additional charges on customers, and will require such customers to take service on time-of-use rates. There are no caps under the new NEM successor tariff. Further, municipal utilities are generally not subject to the same state laws and public commission oversight as compared to investor owned utilities and may make drastic and abrupt changes. As we continue to expand into areas with municipal utilities, we may be subject to greater risk of regulatory uncertainty.
On October 12, 2015, the Hawaii Public Utilities Commission issued an order closing the Hawaiian Electric Company’s net metering program to new participants and replaced this program with two new options for customers to interconnect to the utilities’ power grids, neither of which provides for compensation for exports at retail electricity rates. Subsequently, on October 20, 2017, the Hawaii Public Utilities Commission issued an order approving two new rooftop solar programs, neither of which provides for compensation for exports at the retail electric rate.
In December 2016, the Arizona Corporation Commission decided to end traditional net metering and transition to a new distributed solar energy net metering compensation regime in which customers are paid for energy generated from solar energy systems located on their roofs pursuant to a resource comparison proxy methodology or avoided cost methodology. Each of these methodologies will yield a compensation rate that is less advantageous than was previously available to customers under the historical net metering regime, limited to a 10% step down in each utility’s rate annually. The Arizona Corporation Commission has also adopted a settlement agreement between the Arizona Public Service Company and industry stakeholders under which demand charges based on a customer’s maximum average rate of energy consumed during a specified interval will be imposed on residential customers under certain rate schedules. These changes reduce the value proposition for residential solar in Arizona as compared to residential solar under the traditional net metering regime.
13
In December 2016, Rocky Mountain Power submitted a request to the Utah Public Service Commission to request that the Commission implement new rates for net metered customers seeking interconnection. We, together with other parties and Rocky Mountain Power entered into a settlement agreement that was filed with the Utah Public Service Commission in August 2017. The settlement provides for (among other things): (1) an end to the current net metering program on November 15, 2017 and establishes a grandfathering period through 2035 for all customers enrolled in the program before such date; (2) a transition program through 2020 where customers will receive slightly less than the retail rate for their net metering credits through 2033; and (3) a new proceeding in front of the Utah Public Service Commission to study the value of rooftop solar based on the long-term benefits and costs of distributed energy systems. A decision from the Utah Public Service Commission approving the settlement agreement was issued in September 2017.
In July 2017, Nevada Power Company submitted an application to the Nevada Public Service Commission proposing a change to the net metering program after the passage of the state Assembly Bill 405. The Nevada Public Service Commission conducted hearings on the matter in August and in September issued an order rejecting the Nevada Power Company proposal. In that order, the Commission affirmed that AB 405 provides for monthly netting and established clarity on the tranche classifications for the monthly net excess generation compensation credits. Nevada Power Company continues to file rate cases and other proposals that could have adverse effects on our solar customers in Nevada.
Additionally, in March 2017, the New York Public Service Commission issued an order transitioning from traditional net metering to a new value of distributed energy resource compensation regime in which customers are paid for energy generated from solar energy systems located on their roofs pursuant to a methodology based on the value of the distributed energy from such systems. After a transitional period through January 1, 2020 during which customers can still qualify for net metering (subject to a specified aggregate capacity amount availability for each utility), this value of distributed energy methodology could yield a compensation rate that is less advantageous than was previously available to customers under the historical net metering regime. Several other states plan to revisit their net metering policies in the coming years.
If and when net metering caps in certain jurisdictions are reached while they are still in effect, the value of the credit that customers receive for net metering is significantly reduced, utility rate structures are altered, or fees are imposed on net metering customers, future customers may be unable to recognize the same level of cost savings associated with net metering that current customers enjoy. The absence of favorable net metering policies or of net metering entirely, or the imposition of new charges that only or disproportionately impact customers that use net metering would significantly limit customer demand for our solar energy systems and the electricity they generate, could negatively affect existing customers and lead to missed payments or defaults, and could adversely impact our business, results of operations and future growth.
Our business has benefited from the declining cost of solar panels, and our financial results may be harmed if the cost of solar panels increases in the future.
During previous years, the declining cost of solar panels and the raw materials necessary to manufacture them has been a key driver in the price we charge for electricity and customer adoption of solar energy. Although industry experts indicate that solar panel and raw material prices will generally continue to decline, it is possible they will not decline at the same rate as they have over the past several years or that they may increase. In addition, while the solar panel market has recently seen an increase in supply, growth in the solar industry and the resulting increase in demand for solar panels and the raw materials necessary to manufacture them may put upward pressure on prices. These resulting prices could slow our growth and cause our financial results to suffer. In addition, in the past we have purchased a substantial majority of the solar panels used in our solar energy systems from manufacturers headquartered in China, however, most of the manufacturing now takes place in other Asian countries, such as Malaysia and Vietnam. Changes in governmental support or regulation in China or the other countries where these products are manufactured could affect our ability to purchase them on competitive terms, and access to specialized technologies could be restricted.
In addition, the U.S. government could impose additional tariffs on solar cells manufactured outside the United States or implement additional restraints on trade. In 2014, the U.S. government broadened its investigation of Chinese pricing practices in this area to include solar panels and modules produced in China containing solar cells manufactured in other countries. In July 2015, the U.S. government announced antidumping duties ranging from 9.67% to 238.95% on imports of the majority of solar panels made in China, and, in December 2014, imposed duties ranging from 11.5% to 27.6% on imported solar cells made in Taiwan. Countervailing duties ranging from 15.43% to 49.8% for Chinese modules were announced, and in July 2015 were set at 20.94% for most Chinese modules. In January 2015, the antidumping duties were confirmed by a determination of the U.S. International Trade Commission, or the USITC, that material harm to the U.S. solar industry had occurred. These combined tariffs make such solar cells less competitively priced in the United States, and the Chinese and Taiwanese manufacturers may choose to limit the amount of solar equipment they sell into the United States. If we are required to pay higher prices, accept less favorable terms or purchase solar panels or other system components from alternative, higher-priced sources, our financial results will be adversely affected.
14
The U.S. government may also take broader actions to protect U.S. based manufacturers against imports of solar cells manufactured outside the United States, such as in Southeast Asia, Japan, Germany and South Korea. Recently, a U.S.-based solar manufacturer, which filed for bankruptcy in April 2017, filed a petition under Section 201 of the Trade Act of 1974 for global safeguard relief with the USITC, and requested imposition of tariffs on solar cells and the establishment of a minimum price for solar modules imported into the United States. In May 2017, the USITC accepted the request to review the impact of imported crystalline silicon cells and modules on domestic solar manufacturers. The petition sought steep tariffs and minimum price guarantees on certain solar energy equipment and modules manufactured anywhere outside the United States, including materials that we rely on to provide a cost-competitive product to our customers. On September 22, 2017, the USITC determined by unanimous vote that substantial injury had occurred. On October 31, 2017, the USITC issued three remedy recommendations and formally sent them to the President of the United States on November 13, 2017.
On January 22, 2018, the President announced the imposition of safeguard measures for a period of four years that include (1) a 30% tariff on imports of solar cells not partially or fully assembled into other products and (2) a 30% tariff on imported solar modules. These tariffs are additive to the anti-dumping and countervailing duties imposed in 2014 and 2015. The tariff on imported solar modules will decline 5% each year in the second, third and fourth years. The safeguard measures went into effect on February 7, 2018 and apply to imports for all foreign countries, including Mexico and Canada, except certain developing countries that are members of the World Trade Organization.
While remedies the President imposed are less severe than the remedies requested by petitioners, the safeguard measures will likely increase our costs of solar modules and could have a significant impact on our system costs, business and prospects. If we are required to pay higher prices, accept less favorable terms or purchase solar panels or other system components from alternative, higher-priced sources, or if supply is otherwise constrained, our costs would increase significantly and it may be less economical for us to serve certain markets, which would adversely affect our operating results and growth prospects.
Lack of success in System Sales could negatively impact our operating results and cash flows.
In late 2015, we began offering to customers in select markets the option to purchase solar energy systems as System Sales. We historically offered our solar energy systems through PPAs or Solar Leases. System Sales allow us to expand our product offerings and to enter into additional markets, such as those that prohibit third-party ownership of distributed solar energy systems or that lack a favorable net metering policy. System Sales represented approximately 22% of total megawatts installed in 2017. Industry analysts have indicated that the number of customer-owned solar energy systems has increased significantly relative to third-party ownership in certain markets and that solar energy system sales are expected to account for a larger percentage of total residential solar installations in the future. Continued increases in the variety and availability of third-party loan financing products to consumers and outright solar energy system purchases could further facilitate this growth. If customer preferences or the residential solar energy market continue to shift toward solar energy system sales, and we are not successful in our efforts, we may lose market share, which could have an adverse effect on our business, operating results and growth prospects. To the extent we are unsuccessful in our efforts to sell solar energy systems, or to work with third parties to finance those systems for our customers, our operating cash flows would be negatively affected and our business and growth prospects would be adversely affected.
15
Technical and regulatory limitations may significantly reduce our ability to sell electricity from our solar energy systems and retain employees in certain markets.
Technical and regulatory limits may curb our growth in certain key markets, which may also reduce our ability to retain employees in those markets. For example, the Federal Energy Regulatory Commission, in promulgating the first form small generator interconnection procedures, recommended limiting customer-sited intermittent generation resources, such as our solar energy systems, to a certain percentage of peak load on a given electrical feeder circuit. Similar limits have been adopted by many states as a de facto standard and could constrain our ability to market to customers in certain geographic areas where the concentration of solar installations exceeds this limit. For example, Hawaiian electric utilities have adopted certain policies that limit distributed electricity generation in parts of their service territories. In the first half of 2014, Hawaii was the second largest market in which we operated as measured by total installations. However, despite legislative and regulatory actions to allow further distributed electricity penetration, these limitations constrained growth of distributed residential solar energy in Hawaii in the second half of 2014 and beyond, and Hawaii has become a less important market to us as a result. While a recent Hawaii Public Utilities Commission order seeks to streamline the interconnection process, and while our growth in other markets has more than offset the impact of these limitations in Hawaii, if we experienced similar or other limitations on the deployment of solar energy systems, our business, operating results and growth prospects could be materially adversely affected. Furthermore, in certain areas, we benefit from policies that allow for expedited or simplified procedures related to connecting solar energy systems to the power grid. If such procedures are changed or cease to be available, our ability to sell the electricity generated by solar energy systems we install may be adversely impacted. As adoption of solar distributed generation rises along with the commercial operation of utility scale solar generation in key markets such as California, the amount of solar energy being fed into the power grid will surpass the amount planned for relative to the amount of aggregate demand. Some traditional utilities claim that in less than five years, solar generation resources may reach a level capable of producing an over-generation situation, which may require some solar generation resources to be curtailed to maintain operation of the power grid. While the prospect of such curtailment is somewhat speculative, particularly in the residential sector, the adverse effects of such curtailment without compensation could adversely impact our business, results of operations and future growth.
We have incurred operating losses before income taxes and may be unable to achieve or sustain profitability in the future.
We have incurred operating losses before income taxes since our inception. We incurred losses before income taxes of $148.9 million and $235.1 million for the years ended December 31, 2017 and 2016. In 2017, we recorded a large one-time non-cash tax benefit related to the implementation of the TCJA, which was enacted on December 22, 2017. We expect to continue to incur losses before income taxes from operations as we finance our operations, expand our installation, engineering, administrative, sales and marketing staffs, and implement internal systems and infrastructure to support financing the installation of new solar energy systems. Our ability to achieve profitability depends on a number of factors, including:
|
|
• |
reducing the time between system installation and interconnection to the power grid, which allows us to begin generating revenue; |
|
|
• |
maximizing the benefits of rebates, tax credits, SRECs and other available incentives; and |
|
|
• |
reducing our operating costs by optimizing our sales, design and installation processes and supply chain logistics. |
Even if we do achieve profitability, we may be unable to sustain or increase our profitability in the future.
16
The majority of our business is conducted using one channel, direct-selling.
Historically, our primary sales channel has been a direct sales model. We also sell to customers through our inside sales team but continue to find greatest success using our direct sales channel. In addition, we recently began to establish a retail sales channel and entered into sales dealer agreements with Vivint and others. We may sell through additional distribution channels in the future. We compete against companies with experience selling solar energy systems to customers through a number of distribution channels, including homebuilders, home improvement stores, large construction, electrical and roofing companies, the internet and other third parties and companies that access customers through relationships with third parties in addition to other direct-selling companies. Our less diversified distribution channels may place us at a disadvantage with consumers who prefer to purchase products through these other distribution channels. Recently, one of our competitors announced that it would terminate its direct-selling efforts. If customers demonstrate a preference for other distribution channels, we may need to reduce our direct-selling efforts. We are also vulnerable to changes in laws related to direct sales and marketing that could impose additional limitations on unsolicited residential sales calls and may impose additional restrictions such as adjustments to our marketing materials and direct-selling processes, and new training for personnel. If additional laws affecting direct sales and marketing are passed in the markets in which we operate, it would take time to train our sales force to comply with such laws, and we may be exposed to fines or other penalties for violations of such laws. If we fail to compete effectively through our direct-selling efforts or are not successful in developing other sales channels, our financial condition, results of operations and growth prospects could be adversely affected.
We are highly dependent on our ability to attract, train and retain an effective sales force.
The success of our direct-selling channel efforts depends upon the recruitment, retention and motivation of a large number of sales personnel to compensate for a high turnover rate among sales personnel, which is a common characteristic of a direct-selling business. In order to grow our business, we need to recruit, train and retain sales personnel on a continuing basis. Sales personnel are attracted to direct-selling by competitive earnings opportunities, and direct-sellers typically compete for sales personnel by providing a more competitive earnings opportunity than that offered by the competition. We believe competitors devote substantial effort to determining the effectiveness of such incentives so that they can invest in incentives that are the most cost effective or produce the best return on investment. For example, we have historically compensated our sales personnel on a commission basis, based on the size of the solar energy systems they sell and recently have begun compensating based on system size, contract rate and the expected number of hours the rooftop will be exposed to full sunlight. Some sales personnel may prefer a compensation structure that also includes a salary and equity incentive component. There is significant competition for sales talent in our industry, and from time to time we may need to adjust our compensation model to include such components. These adjustments have caused our customer acquisition costs to increase and could otherwise adversely impact our operating results and financial performance.
In addition to our sales compensation model, our ability to recruit, train and retain effective sales personnel could be harmed by additional factors, including:
|
|
• |
any adverse publicity regarding us, our solar energy systems, our distribution channel or our industry; |
|
|
• |
lack of a compelling product or income opportunity that generates interest for potential new sales personnel, or perception that other product or income opportunities are more attractive; |
|
|
• |
potential saturation or maturity levels in a given market which could negatively impact our ability to attract and retain sales personnel in such market. |
We are subject to significant competition for the recruitment of sales personnel from other direct-selling companies and from other companies that sell solar energy systems in particular. Regional and district managers of our sales personnel are instrumental in recruiting, retaining and motivating our sales personnel. When managers have elected to leave us and join other companies, the sales personnel they supervise have often left with them. We may experience increased attrition in our sales personnel in the future which may impact our results of operations and growth. The impact of such attrition could be particularly acute in those jurisdictions, such as California, where contractual non-competition agreements for service providers are not enforceable or are subject to significant limitations.
It is therefore continually necessary to innovate and enhance our direct-selling and service model as well as to recruit and retain new sales personnel. If we are unable to do so, our business will be adversely affected.
17
We are not currently regulated as an electric utility under applicable law in the jurisdictions in which we operate (other than New York), but we may be subject to regulation as an electric utility in the future.
Except as described below with respect to New York, we are not regulated as a public utility in any of the markets in which we currently operate. As a result, we are not subject to the various federal, state and local standards, restrictions and regulatory requirements applicable to traditional utilities that operate transmission and distribution systems and that have an obligation to serve electric customers within a specified jurisdiction.
On October 19, 2017, the Public Service Commission of the State of New York entered an order determining that residential rooftop solar energy providers are “electric corporations” (the term for electric utilities under New York state law) and requiring changes that will affect certain aspects of our business. The order, which is part of a broader proceeding before the Commission associated with regulating and overseeing distributed energy resource suppliers, is premised on the Commission’s determination that it has the jurisdiction to oversee our business, and businesses like ours, in the same way that it oversees public utilities. We have worked with SEIA and others in the industry to petition the Commission for a rehearing on the order, specifically challenging its position that the statutes giving it the ability to regulate utilities also give it jurisdiction over us. Though New York’s Public Service Commission is, to our knowledge, the first state public commission to take the position that residential rooftop solar energy providers are subject to the same regulatory oversight as electric utilities, we understand from SEIA that other public service commissions are following what is happening in New York, and may take similar action depending on the outcome. If we were subject to the jurisdiction of public service commissions in the same or a similar way as public utilities, those commissions could take action that could materially affect our business operations.
Any additional federal, state, or local regulations that cause us to be treated as an electric utility, or to otherwise be subject to a similar regulatory regime of commission-approved operating tariffs, rate limitations, and related mandatory provisions, could place significant restrictions on our ability to operate our business and execute our business plan by prohibiting, restricting or otherwise regulating our sale of electricity. If we were subject to the same state or federal regulatory authorities as electric utilities in the United States or if new regulatory bodies were established to oversee our business in the United States, then our operating costs would materially increase.
Our business depends in part on the regulatory treatment of third-party owned solar energy systems.
Retail sales of electricity by non-utilities such as us face regulatory hurdles in some states and jurisdictions, including states and jurisdictions that we intend to enter, where the laws and regulatory policies have not historically embraced competition to the service provided by the incumbent, vertically integrated electric utility. Some of the principal challenges pertain to whether non-customer owned systems qualify for the same levels of rebates or other non-tax incentives available for customer-owned solar energy systems, whether third-party owned systems are eligible at all for these incentives and whether third-party owned systems are eligible for net metering and the associated significant cost savings. Furthermore, in some states and utility territories third parties are limited in the way that they may deliver solar to their customers. In jurisdictions such as Arizona, Florida, South Carolina, Utah and Los Angeles, California, laws have been interpreted to either prohibit the sale of electricity pursuant to our standard PPA or regulate entities making such sales, in some cases, such laws have led residential solar energy system providers to use leases in lieu of power purchase agreements. In other states, neither leases nor power purchase agreements are permissible or commercially feasible. Changes in law and reductions in, eliminations of or additional application requirements for, these benefits could reduce demand for our systems, adversely impact our access to capital and could cause us to increase the price we charge our customers for energy.
If the IRS or the U.S. Treasury Department makes a determination that the fair market value of our solar energy systems is materially lower than what we have reported in our fund tax returns, we may have to pay significant amounts to our investment funds, our fund investors and/or the U.S. government. Such determinations could have a material adverse effect on our business, financial condition and prospects.
We report in our fund tax returns that we and our fund investors claim the ITC based on the fair market value of our solar energy systems. Scrutiny by the IRS continues with respect to fair market value determinations industry-wide. The IRS is conducting an audit of one of our investment funds. We are not aware of any other audits or results of audits related to our appraisals or fair market value determinations of any of our investment funds. If as part of an examination the IRS were to review the fair market value that we used to establish our basis for claiming ITCs and determine that the ITCs previously claimed should be reduced, we would owe certain of our investment funds or our fund investors an amount equal to 30% of the investor’s share of the difference between the fair market value used to establish our basis for claiming ITCs and the adjusted fair market value determined by the IRS, plus any costs and expenses associated with a challenge to that fair market value, plus a gross up to pay for additional taxes. We could also be subject to tax liabilities, including interest and penalties, based on our share of claimed ITCs. To date, we have not been required to make such payments under any of our investment funds.
18
Rising interest rates could adversely impact our business.
Rising interest rates could have an adverse impact on our business by increasing our cost of capital. The majority of our cash flows to date have been from customer contracts that have been partially monetized under various investment fund structures. One of the components of this monetization is the present value of the payment streams from the customers who enter into these contracts. If the rate of return required by the fund investor rises as a result of a rise in interest rates, the present value of the customer payment stream and the total value that we are able to derive from monetizing the payment stream will each be reduced. Interest rates are at low levels. It is likely that interest rates will continue to rise in the future, which would cause our costs of capital to increase.
Our investment funds contain arrangements that provide for priority distributions to fund investors until they receive their targeted rates of return. In addition, under the terms of certain of our investment funds, we may be required to make payments to the fund investors if certain tax benefits that are allocated to such fund investors are not realized as expected. Our financial condition may be adversely impacted if a fund is required to make these priority distributions for a longer period than anticipated to achieve the fund investors’ targeted rates of return or if we are required to make any tax-related payments.
Our investment funds contain terms that contractually require the investment funds to make priority distributions to the fund investor, to the extent cash is available, until it achieves its targeted rate of return. The amounts of potential future distributions under these arrangements depends on the amounts and timing of receipt of cash flows into the investment fund, almost all of which is generated from customer payments related to solar energy systems that have been previously purchased (or leased, as applicable) by such fund. If such cash flows are lower than expected, the priority distributions to the investor may continue for longer than initially anticipated.
Additionally, certain of our investment funds require that, under certain circumstances, we forego distributions from the fund that we are otherwise contractually entitled to, or make capital contributions to the fund that can be redirected to the fund investor such that it achieves the targeted return. These forgone distributions or capital contributions will generally occur if the fund investor has not achieved its targeted return prior to the target flip date of the investment fund. None of our investment funds have reached their target flip date at the current time and we anticipate that the first target flip date in which a fund investor is required to have achieved its targeted return is 2020.
Our fund investors also expect returns partially in the form of tax benefits and, to enable such returns, our investment funds contain terms that contractually require us to make payments to the funds that are then used to make payments to the fund investor in certain circumstances so that the fund investor receives value equivalent to the tax benefits it expected to receive when entering into the transaction. The amounts of potential tax payments under these arrangements depend on the tax benefits that accrue to such investors from the funds’ activities and, in some cases, may be impacted by changes in tax law.
Due to uncertainties associated with estimating the timing and amounts of these cash distributions and allocations of tax benefits to such investors, we cannot determine the potential maximum future impact on our cash flows or payments that we could have to make under these arrangements. We may agree to similar terms in the future if market conditions require it. Any significant payments that we may be required to make or distributions to us that are reduced or diverted as a result of these arrangements could adversely affect our financial condition.
We may incur substantially more debt or take other actions that could restrict our ability to pursue our business strategies.
As of December 31, 2017, we have entered into debt facilities through which we have $956.1 million in aggregate principal amounts outstanding and up to $240.0 million of unused borrowing capacity remaining. These debt facilities restrict our ability to dispose of assets, incur indebtedness, incur liens, pay dividends or make other distributions to holders of our capital stock, repurchase our capital stock, make specified investments or engage in transactions with our affiliates. In addition, we do not have full access to the cash and cash equivalents held in our investments funds until distributed per the terms of the arrangements. We and our subsidiaries may incur substantial additional debt in the future and any debt instrument we enter into in the future may contain similar, or more onerous, restrictions. These restrictions could inhibit our ability to pursue our business strategies. Additionally, our ability to make scheduled payments depends on our operating performance, which is subject to economic, financial, competitive and other factors that may be beyond our control. Furthermore, if we default on one of our debt instruments, and such event of default is not cured or waived, the lenders could terminate commitments to lend and cause all amounts outstanding with respect to the debt to be due and payable immediately, which in turn could result in cross acceleration under other debt instruments. Our assets and cash flow may not be sufficient to fully repay borrowings under all of our outstanding debt instruments if some or all of these instruments are accelerated upon a default.
19
Furthermore, there is no assurance that we will be able to enter into new debt instruments on acceptable terms. If we are unable to satisfy financial covenants and other terms under existing or new instruments or obtain waivers or forbearance from our lenders or if we are unable to obtain refinancing or new financings for our working capital, equipment and other needs on acceptable terms if and when needed, our business would be adversely affected.
Our business is concentrated in certain markets, putting us at risk of region specific disruptions.
As of December 31, 2017, approximately 39% of our cumulative installations and 30% of our offices were located in California. In addition, we expect future growth to occur in California, which could further concentrate our customer base and operational infrastructure. Accordingly, our business and results of operations are particularly susceptible to adverse economic, regulatory, political, weather and other conditions in California and in other markets that may become similarly concentrated.
Residential solar energy is an evolving market, which makes it difficult to evaluate our prospects.
The residential solar energy industry is constantly evolving, which makes it difficult to evaluate our prospects. We cannot be certain if historical growth rates reflect future opportunities or whether growth anticipated by us or industry analysts will be realized. Any future growth of the residential solar energy market and the success of our solar energy systems depend on many factors beyond our control, including recognition and acceptance of the residential solar energy market by consumers, the pricing of alternative sources of energy, a favorable regulatory environment, the continuation of expected tax benefits and other incentives and our ability to provide our solar energy systems cost-effectively. If the markets for residential solar energy do not develop at the rate we expect, our business may be adversely affected.
Additionally, there is limited empirical evidence regarding the effect solar energy systems have on the resale value of customers’ houses. Due to the length of our customer contracts, the system deployed on a customer’s roof may be outdated prior to the expiration of the term of the customer contract reducing the likelihood of renewal of our contracts at the end of the 20-year term, and possibly increasing the occurrence of defaults. This could have an adverse effect on our business, financial condition, results of operations and cash flow. As a result, we may be unable to accurately forecast our future performance and to invest accordingly.
We have previously identified a material weakness in our internal control over financial reporting relating to inadequate review procedures in connection with the preparation of our consolidated financial statements that resulted in the restatement of certain of our financial statements, and we may identify material weaknesses in the future.
We previously reported a material weakness in internal control over financial reporting for the years ended December 31, 2015 and 2014 associated with the hypothetical liquidation at book value, or HLBV, method of attributing net income or loss to non-controlling interests and redeemable non-controlling interests and with our financial statement close process. A material weakness is a deficiency, or a combination of deficiencies, in internal control over financial reporting such that there is a reasonable possibility that a material misstatement of our annual or interim financial statements will not be prevented or detected on a timely basis.
We implemented a number of measures to remediate the material weakness described above, and based on these measures, management tested the internal control activities and found them to be effective and concluded that the material weakness described above was remediated as of December 31, 2016. However, if in future periods we identify other material weaknesses in internal control over financial reporting, we will be unable to assert that our internal control over financial reporting is effective, which could result in the loss of investor confidence. In addition, to date, the audit of our consolidated financial statements by our independent registered public accounting firm has included a consideration of internal control over financial reporting as a basis of designing their audit procedures, but not for the purpose of expressing an opinion on the effectiveness of our internal controls over financial reporting. When we cease to be an emerging growth company we will be required to have our independent registered accounting firm perform such an evaluation, and additional material weaknesses or other control deficiencies may be identified.
If we are unable to avoid or remediate any future material weakness, our stock price may be adversely affected and we may be unable to maintain compliance with applicable stock exchange listing requirements.
20
We face competition from traditional regulated electric utilities, from less-regulated third party energy service providers, other solar companies and from new renewable energy companies.
The solar energy and renewable energy industries are both highly competitive and continually evolving as participants strive to distinguish themselves within their markets and compete with large traditional utilities. We believe that our primary competitors are the traditional utilities that supply electricity to our potential customers. Traditional utilities generally have substantially greater financial, technical, operational and other resources than we do. As a result, these competitors may be able to devote more resources to the research, development, promotion and sale of their products or respond more quickly to evolving industry standards and changes in market conditions than we can, including the ability to initiate proceedings before state public utility commissions to reduce the value of net metering. Traditional utilities could also offer other value-added products or services that could help them to compete with us even if the cost of electricity they offer is higher than ours. In addition, a majority of utilities’ sources of electricity is non-solar, which may allow utilities to sell electricity more cheaply than electricity generated by our solar energy systems.
We also compete with companies that are not regulated like traditional utilities but that have access to the traditional utility electricity transmission and distribution infrastructure pursuant to state and local pro-competitive and consumer choice policies. These energy service companies are able to offer customers electricity supply-only solutions that are competitive with our solar energy system options on both price and usage of renewable energy technology while avoiding the long-term agreements and physical installations that our current fund-financed business model requires. This may limit our ability to attract new customers, particularly those who wish to avoid long-term contracts or have an aesthetic or other objection to putting solar panels on their roofs.
Additionally, we compete with solar companies with business models that are similar to ours. Some of these competitors have a higher degree of brand name recognition, differing business and pricing strategies, and greater capital resources than we have, as well as extensive knowledge of our target markets. In addition, our System Sales face increasing competition from other national and local solar energy companies who sell solar energy systems and may offer a broader suite of companion products. We believe the solar industry is becoming increasingly commoditized, and if we are unable to offer differentiated products, establish or maintain a consumer brand that resonates with homeowners or compete with the pricing offered by our competitors, our sales and market share position may be adversely affected.
In addition, we compete with solar companies in the downstream value chain of solar energy. For example, we face competition from purely finance driven organizations that acquire customers and then subcontract out the installation of solar energy systems, from installation businesses that seek financing from external parties, from large construction companies and utilities, and increasingly from sophisticated electrical and roofing companies. Some of these competitors specialize in the residential solar energy market, and some may provide energy at lower costs than we do. Additionally, some of our competitors may offer their products through sales channels that they have more fully developed, such as retail sales. Further, some of our competitors are integrating vertically in order to ensure supply and to control costs. Many of our competitors also have significant brand name recognition and have extensive knowledge of our target markets. For us to remain competitive, we must distinguish ourselves from our competitors by offering an integrated approach that successfully competes with each level of products and services offered by our competitors at various points in the value chain. If our competitors develop an integrated approach similar to ours including sales, financing, engineering, manufacturing, installation, maintenance and monitoring services, this will reduce our marketplace differentiation.
We also compete with solar companies that offer community solar products and utility companies that provide renewable power purchase programs. Some customers might choose to subscribe to a community solar project or renewable subscriber programs instead of installing a solar energy system on their home, which could affect our sales.
As the solar industry grows and evolves, we will also face new competitors who are not currently in the market. Our industry is characterized by low technological barriers to entry and well-capitalized companies could choose to enter the market and compete with us. Our failure to adapt to changing market conditions and to compete successfully with existing or new competitors will limit our growth and will have a material adverse effect on our business and prospects.
Developments in alternative technologies or improvements in distributed solar energy generation may materially adversely affect demand for our offerings.
Significant developments in alternative technologies, such as advances in other forms of distributed solar power generation, storage solutions such as batteries, the widespread use or adoption of fuel cells for residential or commercial properties or improvements in other forms of centralized power production may materially and adversely affect our business and prospects in ways we do not currently anticipate. Any failure by us to adopt new or enhanced technologies or processes, or to react to changes in existing technologies, could materially delay deployment of our solar energy systems, which could result in product obsolescence, the loss of competitiveness of our systems, decreased revenue and a loss of market share to competitors.
21
A failure to hire and retain a sufficient number of employees in key functions would constrain our ability to timely complete our customers’ projects.
To support our business, we need to hire, train, deploy, manage and retain a substantial number of skilled installers and electricians in the markets where there is heightened or increasing demand for solar energy products. Competition for qualified personnel in our industry has increased substantially, and we expect it to continue to do so, particularly for skilled electricians and other personnel involved in the installation of solar energy systems. We also compete with the homebuilding and construction industries for skilled labor. As these industries seek to hire additional workers, our cost of labor may increase. Companies with whom we compete to hire installers may offer compensation or incentive plans that certain installers may view as more favorable. We periodically assess the compensation plans and policies for our service providers, including our installers and electricians, and, if deemed necessary, may decide to revise those plans and policies. Our installers and electricians may not react well to any such revisions, which in turn could adversely affect retention, motivation and productivity. Additionally, we continually monitor our workforce requirements in the markets in which we operate. Any workforce reductions in markets where sales volume does not support the number of installation and other personnel could in turn adversely affect retention, motivation and productivity. We may also subcontract certain aspects of the installation process to independent contractors. Training these independent contractors and monitoring them for compliance with our policies may require significant management oversight and may present additional risks and challenges compared to those related to managing our employees.
Furthermore, trained installers are typically able to more efficiently install solar energy systems. Shortages of skilled labor could significantly delay installations or otherwise increase our costs. While we do not currently have any unionized employees, we have expanded, and may continue to expand, into areas such as the Northeast, where labor unions are more prevalent. The unionization of our labor force could also increase our labor costs. In addition, a significant portion of our business has been concentrated in states such as California, where market conditions are particularly favorable to distributed solar energy generation. We have experienced and may in the future experience greater than expected turnover in our installers in those jurisdictions which would adversely impact the geographic mix of new solar energy system installations.
Because we are a licensed electrical contractor in every jurisdiction in which we operate, we are required to employ licensed electricians. As we expand into new markets, we are required to hire and/or contract with seasoned licensed electricians in order for us to qualify for the requisite state and local licenses. Because of the high demand for these seasoned licensed electricians, these individuals currently or in the future may demand greater compensation. In addition, our inability to attract and retain these qualifying electricians may adversely impact our ability to continue operations in current markets or expand into new areas.
If we cannot meet our hiring, retention and efficiency goals, we may be unable to complete our customers’ projects on time, in an acceptable manner or at all. Any significant failures in this regard would materially impair our growth, reputation, business and financial results. If we are required to pay higher compensation than we anticipate, these greater expenses may also adversely impact our financial results and the growth of our business.
We act as the licensed general contractor for our customers and are subject to risks associated with construction, cost overruns, delays, regulatory compliance and other contingencies, any of which could have a material adverse effect on our business and results of operations.
We are a licensed contractor in every market we service, and we are responsible for every customer installation. We are the general contractor, electrician, construction manager and installer for all our solar energy systems. We may be liable to customers for any damage we cause to their home, belongings or property during the installation of our systems, including any re-roofing services provided under our contracts. In addition, because the solar energy systems we deploy are high-voltage energy systems, we may incur liability for the failure to comply with electrical standards and manufacturer recommendations. Furthermore, prior to obtaining permission to operate our solar energy systems, the systems must pass various inspections. Any delay in passing, or inability to pass, such inspections, would adversely affect our results of operations. Because our profit on a particular installation is based in part on assumptions as to the cost of such project, damage for which we are liable, cost overruns, delays or other execution issues may cause us to not achieve our expected results or cover our costs for that project.
In addition, the installation of solar energy systems is subject to oversight and regulation in accordance with national, state and local laws and ordinances relating to building, fire and electrical codes, safety, environmental protection, utility interconnection and metering, and related matters. We also rely on certain of our employees to maintain professional licenses in many of the jurisdictions in which we operate, and our failure to employ properly licensed personnel could adversely affect our licensing status in those jurisdictions. It is difficult and costly to track the requirements of every authority having jurisdiction over our operations and our solar energy systems. Any new government regulations or utility policies pertaining to our systems, or changes to existing government regulations or utility policies pertaining to our systems, may result in significant additional expenses to us and our customers and, as a result, could cause a significant reduction in demand for our systems.
22
We depend on a limited number of suppliers of solar energy system components and technologies to adequately meet anticipated demand for our solar energy systems. Due to the limited number of suppliers in our industry, the acquisition of any of these suppliers by a competitor or any shortage, delay, price change, imposition of tariffs or duties or other limitation in our ability to obtain components or technologies we use could result in sales and installation delays, cancellations and loss of market share.
We purchase solar panels, inverters and other system components from a limited number of suppliers, making us susceptible to quality issues, shortages and price changes. If we fail to develop, maintain and expand our relationships with our suppliers, our ability to adequately meet anticipated demand for our solar energy systems may be adversely affected, or we may only be able to offer our systems at higher costs or after delays. If one or more of the suppliers that we rely upon to meet anticipated demand ceases or reduces production due to its financial condition, acquisition by a competitor or otherwise, is unable to increase production as industry demand increases or is otherwise unable to allocate sufficient production to us, it may be difficult to quickly identify alternative suppliers or to qualify alternative products on commercially reasonable terms, and our ability to satisfy this demand may be adversely affected. There are a limited number of suppliers of solar energy system components and technologies. While we believe there are other sources of supply for these products available, transitioning to a new supplier may result in additional costs and delays in acquiring our solar products and deploying our systems, and may require us to obtain the approval of our financing partners in order to utilize new products. These issues could harm our business or financial performance.
There have also been periods of industry-wide shortages of key components, including solar panels, in times of rapid industry growth. The manufacturing infrastructure for some of these components has a long lead-time, requires significant capital investment and relies on the continued availability of key commodity materials, potentially resulting in an inability to meet demand for these components. The solar industry is growing and, as a result, shortages of key components, including solar panels, may be more likely to occur, which in turn may result in price increases for such components. Even if industry-wide shortages do not occur, suppliers may decide to allocate key components with high demand or insufficient production capacity to more profitable customers, customers with long-term supply agreements or customers other than us and our supply of such components may be reduced as a result.
We have entered into multi-year agreements with certain of our major suppliers. These agreements are denominated in U.S. dollars. Since our revenue is also generated in U.S. dollars, we are mostly insulated from currency fluctuations. However, since our suppliers often incur a significant amount of their costs by purchasing raw materials and generating operating expenses in foreign currencies, if the value of the U.S. dollar depreciates significantly or for a prolonged period of time against these other currencies, this may cause our suppliers to raise the prices they charge us, which could harm our financial results. As noted above, the U.S. government has imposed tariffs on solar cells produced and assembled in China and Taiwan, and a 30% tariff (decreasing by 5% each year for four years) on imports of solar cells not partially or fully assembled into other products and a 30% tariff (decreasing by 5% each year for four years) on imported solar modules from most foreign countries. It is unclear what further actions the current U.S. presidential administration may take with respect to existing and proposed trade agreements, or restrictions on trade generally. The existing tariffs, and any new tariffs, duties or other trade measures, or shortages, delays, price changes or other limitation in our ability to obtain components or technologies we use could limit our growth, cause cancellations or adversely affect our profitability, and result in loss of market share and damage to our brand.
Our operating results may fluctuate from quarter to quarter and year to year, which could make our future performance difficult to predict and could cause our operating results for a particular period to fall below expectations, resulting in a severe decline in the price of our common stock.
Our quarterly and annual operating results are difficult to predict and may fluctuate significantly in the future. We have experienced seasonal and quarterly fluctuations in the past. However, given that we are in a growing industry, the true extent of these fluctuations may have been masked by our historical growth rates and thus may not be readily apparent from our historical operating results and may be difficult to predict. For example, the amount of revenue we recognize in a given period from our customer contracts is dependent in part on the amount of energy generated by solar energy systems under such contracts. As a result, revenue derived from PPAs is impacted by seasonally shorter daylight hours in winter months. In addition, our ability to install solar energy systems is impacted by weather, such as during the winter months in the Northeastern United States. Such delays can impact the timing of when we can install and begin to generate revenue from solar energy systems. As such, our past quarterly operating results may not be good indicators of future performance.
23
In addition to the other risks described in this “Risk Factors” section, the following factors could cause our operating results to fluctuate:
|
|
• |
the expiration or initiation of any rebates or incentives; |
|
|
• |
significant fluctuations in customer demand for our offerings; |
|
|
• |
our ability to complete installations and interconnect to the power grid in a timely manner; |
|
|
• |
the availability and costs of suitable financing; |
|
|
• |
the amount and timing of sales of SRECs; |
|
|
• |
our ability to continue to expand our operations, and the amount and timing of expenditures related to this expansion; |
|
|
• |
actual or anticipated changes in our growth rate relative to our competitors; |
|
|
• |
announcements by us or our competitors of significant acquisitions, strategic partnerships, joint ventures or capital-raising activities or commitments; |
|
|
• |
changes in our pricing policies or terms or those of our competitors, including traditional utilities; and |
|
|
• |
actual or anticipated developments in our competitors’ businesses or the competitive landscape. |
For these or other reasons, the results of any prior quarterly or annual periods should not be relied upon as indications of our future performance. In addition, our actual revenue, key operating metrics and other operating results in future periods may fall short of the expectations of investors and financial analysts, which could have an adverse effect on the trading price of our common stock.
The profitability and residual value of our solar energy systems during and at the end of the associated term of the PPA or Solar Lease may be lower than projected today and adversely affect our financial performance and valuation.
We maintain ownership of the solar energy systems that we install under our PPAs or Solar Leases. We amortize the costs of our solar energy systems over a 30-year estimated useful life, which exceeds the period of the component warranties and the corresponding payment streams from our contracts with our customers. If we incur repair and maintenance costs on these systems after the warranties have expired, and if they then fail or malfunction, we will be liable for the expense of repairing these systems without a chance of recovery from our suppliers. We are also contractually obligated to remove, store and reinstall the solar energy systems, typically for a nominal fee, if customers need to replace or repair their roofs. However, customer fees may not cover our costs to remove, store and reinstall the solar energy systems. In addition, we typically bear the cost of removing the solar energy systems at the end of the term of the customer contract if the customer does not renew his or her contract or purchase the system. Furthermore, it is difficult to predict how future environmental regulations may affect the costs associated with the removal, disposal or recycling of our solar energy systems. We also face other factors that could increase the costs or diminish the production of a solar energy system, such as unanticipated damage or malfunctions, animal interference and weather-related matters. If the residual value of the systems is less than we expect at the end of the customer contract, after giving effect to any associated removal and redeployment costs, we may be required to accelerate all or some of the remaining unamortized costs. If the profitability or the residual value of the systems is lower than expected, this could materially impair our future operating results and estimated retained value.
Compliance with occupational safety and health requirements and best practices can be costly, and noncompliance with such requirements may result in potentially significant monetary penalties, operational delays and adverse publicity.
The installation of solar energy systems requires our employees to work at heights with complicated and potentially dangerous electrical systems and at potentially high temperatures. The evaluation and modification of buildings as part of the installation process requires our employees to work in locations that may contain potentially dangerous levels of asbestos, lead, mold or other materials known or believed to be hazardous to human health. We also maintain a fleet of approximately 750 trucks and other vehicles to support our installers and operations. There is substantial risk of serious injury or death if proper safety procedures are not followed. Our operations are subject to regulation under OSHA, DOT, and equivalent state laws. Changes to OSHA, DOT or state requirements, or stricter interpretation or enforcement of existing laws or regulations, could result in increased costs. If we fail to comply with applicable OSHA regulations, even if no work-related serious injury or death occurs, we may be subject to civil or criminal enforcement and be required to pay substantial penalties, incur significant capital expenditures or suspend or limit operations. We could be exposed to increased liability in the future. In the past, we have had workplace accidents and received citations from OSHA regulators for alleged safety violations, resulting in fines. Any such accidents, citations, violations, injuries or failure to comply with industry best practices may subject us to adverse publicity, damage our reputation and competitive position and adversely affect our business.
24
Problems with product quality or performance may cause us to incur expenses, may lower the residual value of our solar energy systems and may damage our market reputation and adversely affect our financial results.
We agree to maintain the solar energy systems installed on our customers’ homes in connection with a PPA or Solar Lease during the length of the term of our customer contracts, which is typically 20 years. We are exposed to any liabilities arising from the systems’ failure to operate properly and are generally under an obligation to ensure that each system remains in good condition during the term of the agreement. We also agree to provide a workmanship warranty and maintain the solar energy systems we sell to customers for a period of one to ten years. As part of our operations and maintenance work, we provide a pass-through of the inverter and panel manufacturers’ warranty coverage to our System Sales customers, which generally range from ten to 20 years. We also take advantage of manufacturers’ warranty coverage when maintaining solar energy systems installed under PPAs and Solar Leases. One or more of these third-party manufacturers could cease operations and no longer honor these warranties, leaving us to fulfill these potential obligations to our customers or to our fund investors without underlying warranty coverage. We, either ourselves or through our investment funds, bear the cost of such major equipment. Even if the investment fund bears the direct expense of such replacement equipment, we could suffer financial losses associated with a loss of production from the solar energy systems.
To be competitive in the market and to comply with the requirements of our jurisdictions, our Solar Leases contain a performance guarantee in favor of the lessee. Solar Leases with performance guarantees require us to refund money to the lessee if the solar energy system fails to generate a stated minimum amount of electricity in a 12-month period. We may also suffer financial losses associated with such refunds if significant performance guarantee payments are triggered.
Our failure to accurately predict future liabilities related to material quality or performance expenses could result in unexpected volatility in our financial condition. Because of the long estimated useful life of our solar energy systems, we have been required to make assumptions and apply judgments regarding a number of factors, including our anticipated rate of warranty claims, and the durability, performance and reliability of our solar energy systems. We have made these assumptions based on the historic performance of similar systems or on accelerated life cycle testing. Our assumptions could prove to be materially different from the actual performance of our systems, causing us to incur substantial expense to repair or replace defective solar energy systems in the future or to compensate customers for systems that do not meet their performance guarantees. Equipment defects, serial defects or operational deficiencies also would reduce our revenue from customer contracts because the customer payments under such agreements are dependent on system production or would require us to make refunds under performance guarantees. Any widespread product failures or operating deficiencies may damage our market reputation and adversely impact our financial results.
We are responsible for providing maintenance, repair and billing on solar energy systems that are owned or leased by our investment funds on a fixed fee basis, and our financial performance could be adversely affected if our cost of providing such services is higher than we project.
We typically provide a workmanship warranty for periods of five to 20 years to our investment funds for every system we sell to them. We are also generally contractually obligated to cover the cost of maintenance, repair and billing on any solar energy systems that we sell or lease to our investment funds. We are subject to a maintenance services agreement under which we are required to operate and maintain the system, and perform customer billing services for a fixed fee that is calculated to cover our future expected maintenance and servicing costs of the solar energy systems in each investment fund over the term of the PPA or Solar Lease with the covered customers. If our solar energy systems require an above-average amount of repairs or if the cost of repairing systems were higher than our estimate, we would need to perform such repairs without additional compensation. If our solar energy systems are damaged in the event of a natural disaster beyond our control, such as an earthquake, tornado, wildfire, tsunami or hurricane, losses could be outside the scope of insurance policies or exceed insurance policy limits, and we could incur unforeseen costs that could harm our business and financial condition. We may also incur significant costs for taking other actions in preparation for, or in reaction to, such events. When required to do so under the terms of a particular investment fund, we purchase property and business interruption insurance or other insurance policies with industry standard coverage and limits approved by the investor’s third-party insurance advisors to hedge against risk, but such coverage may not cover our losses, and we have not acquired such coverage for all of our funds.
25
Product liability claims against us or accidents could result in adverse publicity and potentially significant monetary damages.
If our solar energy systems or other products were to injure someone, we could be exposed to product liability claims. In addition, it is possible that our products could cause property damage as a result of product malfunctions, defects, improper installation, fire or other causes. We rely on our general liability insurance to cover product liability claims. Any product liability claim we face could be expensive to defend and divert management’s attention. The successful assertion of product liability claims against us could result in potentially significant monetary damages, penalties or fines, increase our insurance rates, subject us to adverse publicity, damage our reputation and competitive position and adversely affect sales of our systems and other products. In addition, product liability claims, injuries, defects or other problems experienced by other companies in the residential solar industry could lead to unfavorable market conditions to the industry as a whole, and may have an adverse effect on our ability to attract new customers, thus affecting our growth and financial performance.
Failure by our component suppliers to use ethical business practices and comply with applicable laws and regulations may adversely affect our business.
We do not control our suppliers or their business practices. Accordingly, we cannot guarantee that they follow ethical business practices such as fair wage practices and compliance with environmental, safety and other local laws. A lack of demonstrated compliance could lead us to seek alternative suppliers, which could increase our costs and result in delayed delivery of our products, product shortages or other disruptions of our operations. Violation of labor or other laws by our suppliers or the divergence of a supplier’s labor or other practices from those generally accepted as ethical in the United States or other markets in which we do business could also attract negative publicity for us and harm our business.
Damage to our brand and reputation, or change or loss of use of our brand, could harm our business and results of operations.
We depend significantly on our reputation for high-quality products, best-in-class customer service and the brand name “Vivint Solar” to attract new customers and grow our business. If we fail to continue to deliver our solar energy systems within the planned timelines, if our offerings do not perform as anticipated or if we damage any of our customers’ properties or delay or cancel projects, our brand and reputation could be significantly impaired. Future technical improvements may allow us to offer lower prices or offer new technology to new customers; however, technical limitations in our current solar energy systems may prevent us from offering such lower prices or new technology to our existing customers. The inability of our current customers to benefit from technological improvements could cause our existing customers to lower the value they perceive our existing products offer and impair our brand and reputation.
We have focused particular attention on growing our direct sales force, leading us in some instances to take on candidates who we later determined did not meet our standards. In addition, given our direct sales business model and the sheer number of interactions our sales and other personnel have with customers and potential customers, it is inevitable that some customers’ and potential customers’ interactions with our company will be perceived as less than satisfactory. This has led to instances of customer complaints, some of which have affected our digital footprint on rating websites such as Yelp and SolarReviews, which have come to the attention of certain non-profit consumer protection groups. If we cannot manage our hiring and training processes to avoid or minimize these issues to the extent possible, our reputation may be harmed and our ability to attract new customers would suffer.
Given our relationship with our sister company Vivint and the similarity in our names, customers may associate us with any problems experienced with Vivint, such as complaints with the Better Business Bureau. Because we have no control over Vivint, we may not be able to take remedial action to cure any issues Vivint has with its customers, and our brand and reputation may be harmed if we are mistaken for the same company.
In addition, if we were to no longer use, lose the right to continue to use, or if others use, the “Vivint Solar” brand, we could lose recognition in the marketplace among customers, suppliers and partners, which could affect our growth and financial performance, and would require financial and other investment, and management attention in new branding, which may not be as successful.
26
Marketplace confidence in our liquidity and long-term business prospects is important for building and maintaining our business.
Our financial condition, operating results and business prospects may suffer materially if we are unable to establish and maintain confidence about our liquidity and business prospects among consumers and within our industry. Our solar energy systems require ongoing maintenance and support. If we were to reduce operations now or in the future, existing buyers of our systems might have difficulty in having us repair or service our systems, which remain our responsibility under the terms of our customer contracts. As a result, consumers may be less likely to purchase our solar energy systems now if they are uncertain that our business will succeed or that our operations will continue for many years. Similarly, suppliers and other third parties will be less likely to invest time and resources in developing business relationships with us if they are not convinced that our business will succeed. Accordingly, in order to build and maintain our business, we must maintain confidence among customers, suppliers and other parties in our liquidity and long-term business prospects. We may not succeed in our efforts to build this confidence.
If we fail to manage our recent and future operations and growth effectively, we may be unable to execute our business plan, maintain high levels of customer service or adequately address competitive challenges.
We have experienced growth in recent periods with the cumulative capacity of our solar energy systems growing from 681.1 megawatts as of December 31, 2016 to 864.9 megawatts as of December 31, 2017, and we intend to continue to expand our business within existing markets and in a number of new locations in the future. This growth has placed, and any future growth may place, a strain on our management, operational and financial infrastructure. Our operations, growth and expansion require significant time and effort on the part of our management team as it is required to maintain and expand our relationships with customers, suppliers and other third parties and attract new customers, suppliers and financing, as well as manage multiple geographic locations.
In addition, our current and planned operations, personnel, information technology and other systems and procedures might be inadequate to support our future growth and may require us to make additional unanticipated investments in our infrastructure. Our success and ability to further scale our business will depend, in part, on our ability to manage these changes in a cost-effective and efficient manner.
If we cannot manage our operations and growth, we may be unable to meet our or industry analysts’ expectations regarding growth, opportunity and financial targets, take advantage of market opportunities, execute our business strategies, meet our investment fund commitments or respond to competitive pressures. This could also result in declines in quality or customer satisfaction, increased costs, difficulties in introducing new offerings or other operational difficulties. Any failure to effectively manage our operations and growth could adversely impact our business and reputation.
Expansion into new markets could be costly and time-consuming. Historically, we have only provided our offerings to residential customers, which could put us at a disadvantage relative to companies who also compete in other markets.
We have historically only provided our offerings to residential customers. We compete with companies who sell solar energy systems in the commercial, industrial and government markets, in addition to the residential market. While we believe that in the future we could have opportunities to expand our operations into other markets, there are no assurances that our design and installation systems will work for non-residential customers or that we will be able to compete successfully with companies with historical presences in such markets or we may not realize the anticipated benefits of entering such markets, and entering new markets has numerous risks, including the following:
|
|
• |
incurring significant costs if we are required to adapt our current or develop new design and installation processes for use in non-residential applications; |
|
|
• |
diversion of our management and employees from our core residential business; |
|
|
• |
difficulty adapting our current or developing new marketing strategies and sales channels to non-residential customers; |
|
|
• |
inability to obtain key customers, brand recognition and market share and compete successfully with companies with historical presences in such markets; and |
|
|
• |
inability to achieve the financial and strategic goals for such market. |
If we choose to pursue opportunities in additional markets and are unable to successfully compete in such markets, our operating results and growth prospects could be materially adversely affected. Additionally, there is intense competition in the residential solar energy market in the markets in which we operate. As new entrants continue to enter into these markets, we may be unable to gain or maintain market share and we may be unable to compete with companies that earn revenue in both the residential market and non-residential markets.
27
We may not realize the anticipated benefits of past or future acquisitions, and integration of these acquisitions may disrupt our business and management.
In the future we may acquire companies, project pipelines, products or technologies or enter into joint ventures or other strategic initiatives. We may not realize the anticipated benefits of any future acquisition, and any acquisition has numerous risks. These risks include the following:
|
|
• |
difficulty in assimilating the operations and personnel of the acquired company; |
|
|
• |
difficulty in effectively integrating the acquired technologies or products with our current technologies; |
|
|
• |
difficulty in maintaining controls, procedures and policies during the transition and integration; |
|
|
• |
disruption of our ongoing business and distraction of our management and employees from other opportunities and challenges due to integration issues; |
|
|
• |
difficulty integrating the acquired company’s accounting, management information and other administrative systems; |
|
|
• |
inability to retain key technical and managerial personnel of the acquired business; |
|
|
• |
inability to retain key customers, vendors and other business partners of the acquired business; |
|
|
• |
inability to achieve the financial and strategic goals for the acquired and combined businesses; |
|
|
• |
incurring acquisition-related costs or amortization costs for acquired intangible assets that could impact our operating results; |
|
|
• |
potential failure of the due diligence processes to identify significant issues with product quality, intellectual property infringement and other legal and financial liabilities, among other things; |
|
|
• |
potential inability to assert that internal controls over financial reporting are effective; and |
|
|
• |
potential inability to obtain, or obtain in a timely manner, approvals from governmental authorities, which could delay or prevent such acquisitions. |
Mergers and acquisitions of companies are inherently risky, and if we do not complete the integration of acquired businesses successfully and in a timely manner, we may not realize the anticipated benefits of the acquisitions to the extent anticipated, which could adversely affect our business, financial condition or results of operations.
The loss of one or more members of our senior management or key employees may adversely affect our ability to implement our strategy.
We are highly dependent on the efforts and abilities of the principal members of our senior management team, and the loss of one or more key executives could have a negative impact on our business.
We also depend on our ability to retain and motivate key employees and attract qualified new employees. None of our key executives are bound by employment agreements for any specific term, and we do not maintain key person life insurance policies on any of our executive officers. Our compensation structure, which includes salary, bonus, equity and benefits components, is important to our ability to attract, retain and motivate our employees. If we do not provide adequate compensation, or appropriately structure our equity grants, we may be unable to maintain our current workforce or attract new talent in the future, and we may be unable to replace key members of our management team and key employees if we lose their services. Integrating new employees into our team could prove disruptive to our operations, require substantial resources and management attention and ultimately prove unsuccessful. An inability to attract and retain sufficient managerial personnel who have critical industry experience and relationships could limit or delay our strategic efforts, which could have a material adverse effect on our business, financial condition, results of operations and prospects.
28
We may be subject to intellectual property rights claims by third parties, which are extremely costly to defend, could require us to pay significant damages and could limit our ability to use certain technologies.
Third parties, including our competitors, may own patents or other intellectual property rights that cover aspects of our technology or business methods. Such parties may claim we have misappropriated, misused, violated or infringed third party intellectual property rights, and, if we gain greater recognition in the market, we face a higher risk of being the subject of claims that we have violated others’ intellectual property rights. Any claim that we violate a third party’s intellectual property rights, whether with or without merit, could be time-consuming, expensive to settle or litigate and could divert our management’s attention and other resources. If we do not successfully settle or defend an intellectual property claim, we could be liable for significant monetary damages and could be prohibited from continuing to use certain technology, business methods, content or brands. To avoid a prohibition, we could seek a license from third parties, which could require us to pay significant royalties, increasing our operating expenses. If a license is not available at all or not available on reasonable terms, we may be required to develop or license a non-violating alternative, either of which could require significant effort and expense. If we cannot license or develop a non-violating alternative, we would be forced to limit or stop sales of our offerings and may be unable to effectively compete. Any of these results would adversely affect our business, results of operations, financial condition and cash flows. To deter other companies from making intellectual property claims against us or to gain leverage in settlement negotiations, we may be forced to significantly increase the size of our intellectual property portfolio through internal efforts and acquisitions from third parties, both of which could require significant expenditures. However, a robust intellectual property portfolio may provide little or no deterrence, particularly for patent holding companies or other patent owners that have no relevant product revenues.
We use “open source” software in our solutions, which may restrict how we distribute our offerings, require that we release the source code of certain software subject to open source licenses or subject us to possible litigation or other actions that could adversely affect our business.
We currently use in our solutions, and expect to continue to use in the future, software that is licensed under so-called “open source,” “free” or other similar licenses. Open source software is made available to the general public on an “as-is” basis under the terms of a non-negotiable license. We currently combine our proprietary software with open source software but not in a manner that we believe requires the release of the source code of our proprietary software to the public. We do not plan to integrate our proprietary software with open source software in ways that would require the release of the source code of our proprietary software to the public, however, our use and distribution of open source software may entail greater risks than use of third-party commercial software. Open source licensors generally do not provide warranties or other contractual protections regarding infringement claims or the quality of the code. In addition, if we combine our proprietary software with open source software in a certain manner, we could, under certain open source licenses, be required to release to the public or remove the source code of our proprietary software. We may also face claims alleging noncompliance with open source license terms or infringement or misappropriation of proprietary software. These claims could result in litigation, require us to purchase a costly license or remove the software. In addition, if the license terms for open source software that we use change, we may be forced to re-engineer our solutions, incur additional costs or discontinue the sale of our offerings if re-engineering could not be accomplished on a timely basis. Although we monitor our use of open source software to avoid subjecting our offerings to unintended conditions, few courts have interpreted open source licenses, and there is a risk that these licenses could be construed in a way that could impose unanticipated conditions or restrictions on our ability to commercialize our offerings. We cannot guarantee that we have incorporated open source software in our software in a manner that will not subject us to liability, or in a manner that is consistent with our current policies and procedures.
The installation and operation of solar energy systems depends heavily on suitable solar and meteorological conditions. If meteorological conditions are unexpectedly unfavorable, the electricity production from our solar energy systems may be substantially below our expectations and our ability to timely deploy new systems may be adversely impacted.
The energy produced and revenue and cash receipts generated by a solar energy system depend on suitable solar, atmospheric and weather conditions, all of which are beyond our control. Furthermore, components of our systems, such as panels and inverters, could be damaged by severe weather, such as hailstorms, lightning or wildfires. Although we maintain insurance to cover for many such casualty events, our investment funds would be obligated to bear the expense of repairing the damaged solar energy systems, sometimes subject to limitations based on our ability to successfully make warranty claims. Our economic model and projected returns on our systems require us to achieve certain production results from our systems and, in some cases, we guarantee these results for both our customers and our investors. If the systems underperform for any reason, our financial results could suffer.
29
Sustained unfavorable weather also could delay our installation of solar energy systems, leading to increased expenses and decreased revenue and cash receipts in the relevant periods. We have experienced seasonal fluctuations in our operations. The amount of revenue we recognize in a given period from PPAs is dependent in part on the amount of energy generated by solar energy systems under such contracts. As a result, operating leases and incentives revenue is impacted by seasonally shorter daylight hours in winter months. In addition, our ability to install solar energy systems is impacted by weather. We have limited ability to install solar energy systems during the winter months in the Northeastern United States. Such delays can impact the timing of when we can install and begin to generate revenue from solar energy systems. However, given that we are in a growing industry, the true extent of these fluctuations may have been masked by our historical growth rates and thus may not be readily apparent from our historical operating results and may be difficult to predict. As such, our historical operating results may not be indicative of future performance. Furthermore, weather patterns could change, making it harder to predict the average annual amount of sunlight striking each location where we install a solar energy system. This could make our solar energy systems less economical individually or in the aggregate. Any of these events or conditions could harm our business, financial condition, results of operations and prospects.
Disruptions to our solar monitoring systems could negatively impact the operation of our business and our revenues and increase our expenses.
Our ability to accurately charge our customers for the energy produced by our solar energy systems depends on our ability to monitor our customers’ solar energy systems. Our customer agreements require our customers to maintain a broadband internet connection so that we may receive data regarding solar energy system production from their home networks. We could incur significant expenses or disruptions of our operations in connection with failures of our solar monitoring systems, including failures of our customers’ home networks that would prevent us from accurately monitoring solar energy production. In addition, sophisticated hardware and operating system software and applications that we procure from third parties may contain defects in design or manufacture, including “bugs” and other problems that could unexpectedly interfere with the operation of our systems. The costs to us to eliminate or alleviate viruses and bugs, or any problems associated with failures of our customers’ home networks could be significant, and the efforts to address these problems could result in interruptions, delays or cessation of service that may impede our sales, distribution or other critical functions. When a customer’s solar monitoring system is not properly communicating with us, we estimate the production of their solar energy systems. Such estimates may prove inaccurate and could cause us to underestimate the power being generated by our solar energy systems and undercharge our customers, thereby harming our results of operations.
We are exposed to the credit risk of our customers.
Our solar energy customers most commonly purchase energy or lease solar energy systems from us pursuant to one of two types of long-term contracts: a PPA or a Solar Lease. The terms of PPAs and Solar Leases are typically for 20 years, and require the customer to make monthly payments to us. Accordingly, we are subject to the credit risk of our customers. As of December 31, 2017, the average FICO score of our customers was approximately 760. However, as we grow our business, the risk of customer defaults could increase. Our reserve for this exposure is estimated to be $3.6 million as of December 31, 2017, and our future exposure may exceed the amount of such reserves. While we do not currently extend credit to customers interested in System Sales, many of those customers are interested in financing the purchase of a solar energy system. While these customers may seek third-party financing through their own lender or a lender with whom we have a relationship, if they do not have sufficient credit to qualify for a loan, they may be unable to purchase a solar energy system. This could reduce our potential customer pool and limit our System Sales.
A failure to comply with laws and regulations relating to our interactions with current or prospective residential customers could result in negative publicity, claims, investigations and litigation, and adversely affect our financial performance.
Our business focuses on contracts and transactions with residential customers. We must comply with numerous federal, state and local laws and regulations that govern matters relating to our interactions with consumers, including those pertaining to privacy and data security, consumer financial and credit transactions, home improvement contracts, warranties, door-to-door solicitation as well as specific regulations pertaining to solar installations. These laws and regulations are dynamic and subject to potentially differing interpretations, and various federal, state and local legislative and regulatory bodies may initiate investigations, expand current laws or regulations, or enact new laws and regulations, regarding these matters. Changes in these laws or regulations or their interpretation could dramatically affect how we do business, acquire customers, and manage and use information we collect from and about current and prospective customers and the costs associated therewith.
Several states in which we operate, including Arizona, California, Florida, Maryland, Nevada and New Mexico, have enacted new laws, and the Public Service Commission of New York has entered an order (as described above) that provides enhanced rights to customers solicited by way of direct sales, and requires increased disclosures and acknowledgements in any agreement governing the financing, sale or lease of distributed energy systems, such as our solar energy systems. Most of these new laws are specific to the solar industry, and require changes to our contracts and processes. Some of the new laws have been enacted along with other changes to state law that further impact the residential solar industry. To the extent that other states enact further regulations applicable to our industry, we may be required to expend additional resources in order to modify our businesses practices to meet these regulatory requirements.
30
We strive to comply with all applicable laws and regulations relating to our interactions with residential customers. It is possible, however, that these requirements may be interpreted and applied in a manner that is inconsistent from one jurisdiction to another and may conflict with other rules or our practices. For example, members of the U.S. House of Representatives have sent letters to the Consumer Financial Protection Bureau and the Federal Trade Commission, or FTC, requesting that these agencies investigate the sales practices of companies providing solar energy system leases to residential consumers. In 2016, the FTC held a public workshop on competition and consumer protection issues relating to the residential solar industry, and we expect additional regulatory scrutiny of the industry at the state and federal levels. Additionally, in March 2017, we received notice that the New Mexico Attorney General’s office intends to file an action against us and our officers alleging violation of state consumer protection statutes. While we believe our standard sales practices and policies comply with all applicable laws and regulations, if federal, state or other local regulators or agencies were to initiate an investigation against us or enact regulations relating to the marketing of our products to residential consumers, responding to such investigation or complying with such regulations could divert management’s attention to our business, require us to modify our operations and incur significant additional expenses, which could have an adverse effect on our business, financial condition and results of operations or could reduce the number of our potential customers.
As another example, the Fannie Mae Selling Guide imposes certain requirements on the terms of solar power purchase agreements and leases as a condition of eligibility of home mortgages for sale to or securitization by Fannie Mae. These requirements include responsibility for damage to the real property, insurance requirements, and lender rights in the event of foreclosure. Such requirements, and possible future conditions impacting the ability of our customers to sell or refinance their homes impact the terms of our business, the terms on which we are able to obtain financing and could have an adverse effect on our business, financial condition and results of operations. Also, beginning in 2017, the Federal Housing Administration will no longer provide mortgage insurance to homes with solar energy systems or other improvements financed through property accessed clean programs, or PACE.
We cannot ensure that our sales force will comply with our standard practices and policies, as well as applicable laws and regulations. Any such non-compliance, or the perception of noncompliance, potentially could expose us to claims, proceedings, litigation, investigations, and/or enforcement actions by private parties and regulatory authorities, as well as substantial fines and negative publicity, each of which may materially and adversely affect our business. We have incurred, and will continue to incur, significant expenses to comply with the laws, regulations and industry standards that apply to us.
Any unauthorized access to, or disclosure or theft of personal information or other proprietary information we gather, store or use could harm our reputation and subject us to claims or litigation.
We receive, store and use personal information of our customers, including names, addresses, e-mail addresses, credit information and other housing and energy use information. We also store and use personal information of our employees. In addition, we previously used certain shared information and technology systems with Vivint, and Vivint continues to store some of our historical data. We take certain steps in an effort to protect the security, integrity and confidentiality of the personal information and other proprietary and confidential information we collect, store or transmit, but there is no guarantee that inadvertent or unauthorized use or disclosure will not occur or that third parties will not gain unauthorized access to this information despite our efforts. Because techniques used to obtain unauthorized access or sabotage systems change frequently and generally are not identified until they are launched against a target, we and our suppliers or vendors, including Vivint, may be unable to anticipate these techniques or to implement adequate preventative or mitigation measures. In addition, due to a potential time lapse between when a sales representative leaves us and when we are made aware of the separation, sales representatives may have continued access to our customers’ information for a period when they should not.
We are also subject to laws and regulations relating to the collection, use, retention, security and transfer of personal information of our customers. In many cases, these laws apply not only to third-party transactions, but also to transfers of information between one company and its subsidiaries. Several jurisdictions have passed new laws in this area, and other jurisdictions are considering imposing additional restrictions. These laws continue to develop and may be inconsistent from jurisdiction to jurisdiction. In addition to government regulation, privacy advocates and industry groups may propose new and different self-regulatory standards that either legally or contractually apply to us, such as the Payment Card Industry Data Security Standard, or PCI DSS, which may affect any processes associated with handling credit card numbers. In the event we fail to be compliant with the PCI DSS, fines and other penalties could result. Complying with emerging and changing requirements may cause us to incur costs or require us to change our business practices. Any actual or alleged failure by us, our affiliates or other parties with whom we do business to comply with privacy-related or data protection laws, regulations and industry standards could result in proceedings against us by governmental entities or others, which could have a detrimental effect on our business, results of operations and financial condition.
31
Any actual or perceived unauthorized use or disclosure of, or access to, any personal information or other proprietary or confidential information maintained by us or on our behalf, whether through breach of our systems, breach of the systems of our suppliers or vendors, including Vivint, by an unauthorized party, or through employee or contractor error, theft or misuse, or otherwise, could harm our business. If any such unauthorized use or disclosure of, or access to, such personal information were to occur or to be believed to have occurred, our operations could be seriously disrupted and we could be subject to demands, claims and litigation by private parties, and investigations, related actions, and penalties by regulatory authorities. In addition, we could incur significant costs in notifying affected persons and entities and otherwise complying with the multitude of federal, state and local laws and regulations relating to unauthorized access to, or use or disclosure of, personal information. Finally, any perceived or actual unauthorized access to, or use or disclosure of, such information could harm our reputation, substantially impair our ability to attract and retain customers and have an adverse impact on our business, financial condition and results of operations.
We are involved, and may become involved in the future, in legal proceedings that, if adversely adjudicated or settled, could adversely affect our financial results.
We are, and may in the future become, party to litigation. For examples, see Note 17—Commitments and Contingencies. While we intend to defend against these actions vigorously, the ultimate outcomes of these cases are presently not determinable as they are in preliminary phases. In general, litigation claims can be expensive and time consuming to bring or defend against, may result in the diversion of management attention and resources from our business and business goals and could result in settlements or damages that could significantly affect financial results and the conduct of our business. It is not possible to predict the final resolution of the litigation to which we currently are or may in the future become party, and the impact of certain of these matters on our business, prospects, financial condition, liquidity, results of operations and cash flows.
Our reported financial results may be affected, and comparability of our financial results with other companies in our industry may be impacted, by changes in the accounting principles generally accepted in the United States.
Generally accepted accounting principles in the United States are subject to change and interpretation by the Financial Accounting Standards Board, or FASB, the Securities and Exchange Commission, or SEC, and various bodies formed to promulgate and interpret appropriate accounting principles. A change in these principles or interpretations could have a significant effect on our reported financial results and on the financial results of other companies in our industry, and may even affect the reporting of transactions completed before the announcement or effectiveness of a change. For example, in May 2014 the FASB issued Accounting Standards Update No. 2014-09, Revenue from Contracts with Customers (Topic 606), which will affect certain elements of our accounting for revenue and costs incurred to acquire contracts when this standard becomes effective for the us in 2018. Other companies in our industry may be affected differently by the adoption of Topic 606 or other new accounting standards, including timing of the adoption of new accounting standards, adversely affecting the comparability of our financial statements. See Note 2—Summary of Significant Accounting Policies for information about Topic 606.
Risks Related to our Relationship with Vivint
Vivint has provided us with certain information technology support for our business in the past. If we do not successfully implement and operate our own information technology systems, our operations may be disrupted and our operating results could be harmed.
We have historically relied on the technical support of Vivint. We used certain of Vivint’s information technology and infrastructure until we transitioned off in July 2017. Furthermore, while we have transitioned to our own systems, some of our historical data continues to reside on Vivint’s systems. Any difficulty in separating our information technology services or obtaining our historical data from Vivint’s information technology services could result in unexpected costs, impact our results or prevent us from performing other technical, administrative and information technology services on a timely basis and could materially harm our business, financial condition, results of operations and cash flows.
32
Our inability to resolve any disputes that arise between us and Vivint with respect to our past and ongoing relationships may adversely affect our financial results, and such disputes may also result in claims for indemnification.
Disputes may arise between Vivint and us in a number of areas relating to our past and ongoing relationships, including the following:
|
|
• |
intellectual property, labor, tax, employee benefits, indemnification and other matters arising from our separation from Vivint; |
|
|
• |
employee retention and recruiting; |
|
|
• |
our ability to use, modify and enhance the intellectual property that we have licensed from Vivint; |
|
|
• |
business combinations or divestitures; |
|
|
• |
pricing for shared and transitional services; |
|
|
• |
exclusivity arrangements; |
|
|
• |
the nature, quality and pricing of products and services Vivint agrees to provide to us; and |
|
|
• |
business opportunities that may be attractive to both Vivint and us. |
We have entered into certain agreements with Vivint. In August 2017, we entered into a sales dealer agreement with Vivint. Under this agreement, each party will act as a dealer for the other party to market, promote and sell each other’s products. The agreement has a two-year term, which will be automatically renewed for successive one-year terms unless written notice of termination is provided by one of the parties to the other no less than 90 days prior to the end of the then current term. The products, territories and consideration that is payable by each party to the other is determined in accordance with the agreement. There can be no assurances regarding the number of sales and installations of our products that Vivint will be able to generate, or the number of leads that we will be able to generate. In addition, as we work to expand our customer opportunities and product offerings through our relationship with Vivint, our business and results of operations may be adversely affected by factors that affect Vivint’s business and our relationship. Pursuant to the terms of a Non-Competition Agreement we have entered into with Vivint, as amended, we and Vivint each have agreed not to solicit for employment any member of the other’s executive or senior management team, or any of the other’s employees who primarily manage sales, installation or services of the other’s products and services until the termination of the sales dealer agreement. The commitment not to solicit each other’s employees lasts for 180 days after such employee finishes employment with us or Vivint. Historically, we had recruited a significant number of our sales personnel from Vivint. This agreement may require us to obtain personnel from other sources, and any inability to do so may limit our ability to continue scaling our business if we are unable to do so. Notwithstanding the above, a number of sales representatives work for both Vivint and us. To the extent there is any confusion concerning the relationship between us and Vivint with respect to the products and services we offer and the products and services of Vivint, such sales representatives could expose us to increased claims, proceedings, litigation and investigations by consumers and regulatory authorities. In addition, having sales representatives who work for both Vivint and us could distract such sales representatives, impact the effectiveness of our sales force, and potentially increase the turnover of our existing sales representatives who may feel displaced by the addition of Vivint sales representatives to our sales force.
We may not be able to resolve any potential conflicts relating to these agreements or otherwise, and even if we do, the resolution may be less favorable than if we were dealing with an unaffiliated party. In addition, we have indemnification obligations under some of the agreements we have entered into with Vivint, and disputes between us and Vivint may result in claims for indemnification. However, we do not currently expect that these indemnification obligations will materially affect our potential liability compared to what it would be if we did not enter into these agreements with Vivint.
33
Risks Related to Our Common Stock
The price of our common stock may be volatile, and the value of your investment could decline.
The trading price of our common stock may be highly volatile. From our initial public offering on October 1, 2014 to December 31, 2017, the closing price of our common stock has ranged from a high of $16.01 to a low of $2.22. Our stock price could continue to be subject to wide fluctuations in response to various factors, some of which are beyond our control. These factors include:
|
|
• |
our financial condition and the availability and terms of future financing; |
|
|
• |
changes in laws or regulations applicable to our industry or offerings, including any new tariffs or trade regulations that affect our ability to import goods at attractive prices or at all; |
|
|
• |
additions or departures of key personnel; |
|
|
• |
actual or anticipated changes in expectations regarding our performance by investors or securities analysts; |
|
|
• |
securities litigation involving us; |
|
|
• |
price and volume fluctuations in the overall stock market; |
|
|
• |
volatility in the market price and trading volume of companies in our industry or companies that investors consider comparable; |
|
|
• |
share price and volume fluctuations attributable to inconsistent trading volume levels of our shares; |
|
|
• |
the failure of securities analysts to cover our common stock; |
|
|
• |
our ability to protect our intellectual property and other proprietary rights; |
|
|
• |
sales of our common stock by us, our stockholders or our employees, including sales of equity awards granted to our employees to cover tax withholding obligations; |
|
|
• |
litigation or disputes involving us, our industry or both; |
|
|
• |
major catastrophic events; |
|
|
• |
general economic and market conditions; and |
|
|
• |
potential acquisitions. |
Further, the stock markets have experienced extreme price and volume fluctuations that have affected and continue to affect the market prices of equity securities of many companies. These fluctuations often have been unrelated or disproportionate to the operating performance of those companies. In addition, the stock prices of many renewable energy companies have experienced wide fluctuations that have often been unrelated to the operating performance of those companies. These broad market and industry fluctuations, as well as general economic, political and market conditions such as recessions, interest rate changes or international currency fluctuations, may cause the market price of our common stock to decline. If the market price of our common stock decreases, investors may not realize any return on investment and may lose some or all of their investments. In the past, companies that have experienced volatility in the market price of their stock have been subject to securities class action litigation. We could become the target of additional securities litigation in the future, which could result in substantial costs and divert our management’s attention from other business concerns, which could seriously harm our business.
As an emerging growth company within the meaning of the Securities Act, we will utilize certain modified disclosure requirements, and we cannot be certain if these reduced requirements will make our common stock less attractive to investors.
We are an emerging growth company, and, for as long as we continue to be an emerging growth company, we may choose to take advantage of exemptions from various reporting requirements applicable to other public companies but not to “emerging growth companies” including, but not limited to, not being required to have our independent registered public accounting firm audit our internal control over financial reporting under Section 404 of the Sarbanes-Oxley Act, reduced disclosure obligations regarding executive compensation in our periodic reports and proxy statements, and exemptions from the requirements of holding a nonbinding advisory vote on executive compensation and stockholder approval of any golden parachute payments not previously approved. We have utilized, and we plan in future filings with the Securities and Exchange Commission, or SEC, to continue to utilize, the modified disclosure requirements available to emerging growth companies. As a result, our stockholders may not have access to certain information they may deem important.
34
In addition, Section 107 of the JOBS Act also provides that an emerging growth company can utilize the extended transition period provided in Section 7(a)(2)(B) of the Securities Act for complying with new or revised accounting standards. Thus, an emerging growth company can delay the adoption of certain accounting standards until those standards would otherwise apply to private companies. We have irrevocably elected not to avail ourselves of this exemption from new or revised accounting standards and, therefore, we will be subject to the same new or revised accounting standards as other public companies that are not “emerging growth companies.”
We could remain an “emerging growth company” until the earliest of (1) December 31, 2019, (2) the last day of the first fiscal year in which our annual gross revenue exceeds $1.1 billion, (3) the date that we become a “large accelerated filer” as defined in Rule 12b-2 under the Exchange Act, which would occur if we become a seasoned issuer and the market value of our common stock that is held by non-affiliates exceeds $700 million as of the last business day of our most recently completed second fiscal quarter or (4) the date on which we have issued more than $1 billion in non-convertible debt securities during the preceding three-year period.
Our stock price could decline due to the large number of outstanding shares of our common stock eligible for future sale.
Sales of substantial amounts of our common stock in the public market, or the perception that these sales could occur, could cause the market price of our common stock to decline. These sales could also make it more difficult for us to sell equity or equity-related securities in the future at a time and price that we deem appropriate.
As of December 31, 2017, we had 115.1 million outstanding shares of common stock. These shares may be sold in the public market in the United States, subject to prior registration in the United States, if required, or reliance upon an exemption from U.S. registration, including, in the case of shares held by affiliates or control persons, compliance with the volume restrictions of Rule 144.
In addition, we have granted and expect to continue to grant equity awards to our directors and employees as additional compensation in an effort to align their interests with those of our stockholders. Approximately 2.7 million shares of our common stock are reserved for future issuance under our Long-Term Incentive Plan, and these shares will issue, vest and be immediately tradable without restriction on the date that our Sponsor and its affiliates achieve specified returns on their invested capital.
Further, equity awards for 10.5 million shares of common stock remained outstanding as of December 31, 2017, with 2.0 million of those shares being vested and exercisable as of December 31, 2017. Additionally, “sell-to-cover” transactions are utilized in connection with the vesting and settlement of equity awards that are granted to our employees so that shares of our common stock are sold on behalf of our employees in an amount sufficient to cover the tax withholding obligations associated with these awards. As a result of these transactions, a significant number of shares of our stock may be sold over a limited time period in connection with significant vesting events. For example, during the month of May 2017, approximately 3.5 million restricted stock units settled, which increased the volume of our shares that would otherwise have been sold during that time.
Stockholders owning an aggregate of 84.7 million shares of our common stock are entitled, under contracts providing for registration rights, to require us to register shares of our common stock owned by them for public sale in the United States, subject to the restrictions of Rule 144. In October 2014, we filed a registration statement on Form S-8 to register 22.9 million shares previously issued or reserved for future issuance under our equity compensation plans and agreements, and we registered an additional 12.9 million shares in March 2017. Under these registration statements, subject to the satisfaction of applicable vesting periods, the shares of common stock issued upon exercise of outstanding options and vested restricted stock units will be available for immediate resale in the United States in the open market. Sales of our common stock as restrictions end or pursuant to registration rights may make it more difficult for us to sell equity securities in the future at a time and at a price that we deem appropriate. These sales also could cause our stock price to fall and make it more difficult for investors to sell shares of our common stock.
35
Our Sponsor and its affiliates control us and their interests may conflict with ours or investors’ in the future.
As of December 31, 2017, 313 Acquisition LLC, which is controlled by our Sponsor and its affiliates, beneficially owned approximately 72% of our common stock. Moreover, under our organizational documents and the stockholders agreement with 313 Acquisition LLC, for so long as our existing owners and their affiliates retain significant ownership of us, we will agree to nominate to our board individuals designated by our Sponsor, whom we refer to as the Sponsor directors. In addition, for so long as 313 Acquisition LLC continues to own shares representing a majority of the total voting power, we will agree to nominate to our board individuals appointed by Summit Partners and Todd Pedersen. Even when our Sponsor and its affiliates and certain of its co-investors cease to own shares of our stock representing a majority of the total voting power, for so long as our Sponsor and its affiliates continue to own a significant percentage of our stock our Sponsor will still be able to significantly influence the composition of our board of directors and the approval of actions requiring stockholder approval. In addition, under the stockholders agreement, affiliates of our Sponsor will have consent rights with respect to certain actions involving our company, provided a certain aggregate ownership threshold is maintained collectively by our Sponsor and its affiliates, together with Summit Partners, Todd Pedersen and Alex Dunn and their respective affiliates. Accordingly, for such period of time, our Sponsor and certain of its co-investors will have significant influence with respect to our management, business plans and policies, including the appointment and removal of our officers. In particular, for so long as our Sponsor and its affiliates continue to own a significant percentage of our stock, our Sponsor will be able to cause or prevent a change of control of our company or a change in the composition of our board of directors and could preclude any unsolicited acquisition of our company. The concentration of ownership could deprive investors of an opportunity to receive a premium for shares of common stock as part of a sale of our company and ultimately might affect the market price of our common stock.
Our Sponsor and its affiliates engage in a broad spectrum of activities, including investments in the energy sector. In the ordinary course of their business activities, our Sponsor and its affiliates may from time to time acquire and hold interests in businesses that compete directly or indirectly with us. For example, affiliates of our Sponsor regularly invest in utility companies that compete with solar energy and renewable energy companies such as ours. In addition, affiliates of our Sponsor own interests in one of the largest solar power developers in India and may in the future make other investments in solar power, including in the United States. Our certificate of incorporation provides that none of our Sponsor, any of its affiliates or any director who is not employed by us (including any non-employee director who serves as one of our officers in both his or her director and officer capacities) or his or her affiliates will have any duty to refrain from engaging, directly or indirectly, in the same business activities or similar business activities or lines of business in which we operate. Our Sponsor also may pursue acquisition opportunities that may be complementary to our business, and, as a result, those acquisition opportunities may not be available to us. In addition, our Sponsor may have an interest in pursuing acquisitions, divestitures and other transactions that, in its judgment, could enhance its investment, even though such transactions might involve risks to investors.
We have elected to take advantage of the “controlled company” exemption to the corporate governance rules for New York Stock Exchange, or NYSE, listed companies, which could make our common stock less attractive to some investors or otherwise harm our stock price.
Because we qualify as a “controlled company” under the corporate governance rules for NYSE listed companies, we are not required to have a majority of our board of directors be independent, nor are we required to have a compensation committee or an independent nominating function. In light of our status as a controlled company, in the future we could elect not to have a majority of our board of directors be independent or not to have a compensation committee or nominating and governance committee. Accordingly, should the interests of 313 Acquisition LLC or our Sponsor differ from those of other stockholders, the other stockholders may not have the same protections afforded to stockholders of companies that are subject to all of the corporate governance rules for NYSE listed companies. Our status as a controlled company could make our common stock less attractive to some investors or otherwise harm our stock price.
Provisions in our certificate of incorporation, bylaws, stockholders agreement and under Delaware law might discourage, delay or prevent a change of control of our company or changes in our management and, therefore, depress the trading price of our common stock.
Our certificate of incorporation, bylaws and stockholders agreement contain provisions that could depress the trading price of our common stock by discouraging, delaying or preventing a change of control of our company or changes in our management that the stockholders of our company may believe advantageous. These provisions include:
|
|
• |
establishing a classified board of directors so that not all members of our board of directors are elected at one time; |
|
|
• |
authorizing “blank check” preferred stock that our board of directors could issue to increase the number of outstanding shares to discourage a takeover attempt; |
|
|
• |
limiting the ability of stockholders to call a special stockholder meeting; |
|
|
• |
limiting the ability of stockholders to act by written consent; |
36
|
|
• |
providing that the board of directors is expressly authorized to make, alter or repeal our bylaws; |
|
|
• |
establishing advance notice requirements for nominations for elections to our board of directors or for proposing matters that can be acted upon by stockholders at stockholder meetings; |
|
|
• |
requiring our Sponsor to consent to certain actions, as described under the section of our 2017 Proxy Statement captioned “Related Party Transactions—Agreements with Our Sponsor,” for so long as our Sponsor, Summit Partners, Todd Pedersen and Alex Dunn or their respective affiliates collectively own, in the aggregate, at least 30% of our outstanding shares of common stock; |
|
|
• |
the removal of directors only for cause and only upon the affirmative vote of the holders of at least 66-2/3% in voting power of all the then-outstanding shares of stock of our company entitled to vote thereon, voting together as a single class, if Blackstone and its affiliates beneficially own, in the aggregate, less than 30% in voting power of the stock of our company entitled to vote generally in the election of directors; and |
|
|
• |
that certain provisions may be amended only by the affirmative vote of the holders of at least 66-2/3% in voting power of all the then-outstanding shares of stock of our company entitled to vote thereon, voting together as a single class, if Blackstone and its affiliates beneficially own, in the aggregate, less than 30% in voting power of the stock of our company entitled to vote generally in the election of directors. |
If securities or industry analysts do not publish or cease publishing research or reports about us, our business or our market, or if they change their recommendations regarding our stock adversely, our stock price and trading volume could decline.
The trading market for our common stock will be influenced by the research and reports that industry or securities analysts may publish about us, our business, our market or our competitors. If any of the analysts who do now, or may in the future, cover us change their recommendation regarding our stock adversely, or provide more favorable relative recommendations about our competitors, our stock price would likely decline. If any analyst who may cover us were to cease coverage of our company or fail to regularly publish reports on us, we could lose visibility in the financial markets, which in turn could cause our stock price or trading volume to decline.
Item 1B. Unresolved Staff Comments.
None.
Our corporate headquarters and executive offices are located in Lehi, Utah, where we lease approximately 150,000 square feet of office space that expires in 2028. We also have a lease for the construction of a second office building on the corporate headquarters campus that will increase the leased premises by approximately 150,000 square feet. The lease on the second office building is currently anticipated to commence in 2020. We believe that our currently leased space is sufficient to meet our current needs and our anticipated growth.
Our other locations include leased warehouses and sales offices that range from approximately 1,000 to 32,000 square feet for terms ranging from one to seven years in the states in which we operate.
For a list of our current legal proceedings, see Note 17—Commitments and Contingencies.
Item 4. Mine Safety Disclosures.
Not applicable.
37
Item 5. Market for Registrant’s Common Equity, Related Stockholder Matters and Issuer Purchases of Equity Securities.
Our common stock has been traded on the New York Stock Exchange, or NYSE, since October 1, 2014 under the symbol “VSLR.” Prior to October 1, 2014, there was no established public trading market for our common stock. The following table sets forth the high and low sales price for our common stock as reported by the NYSE for the periods indicated.
|
|
High |
|
|
Low |
|
||
|
Fourth quarter 2017 |
4.28 |
|
|
|
3.15 |
|
|
|
Third quarter 2017 |
|
6.10 |
|
|
|
3.20 |
|
|
Second quarter 2017 |
5.95 |
|
|
|
2.65 |
|
|
|
First quarter 2017 |
|
3.70 |
|
|
|
2.55 |
|
|
Fourth quarter 2016 |
3.35 |
|
|
|
2.50 |
|
|
|
Third quarter 2016 |
|
3.70 |
|
|
|
2.74 |
|
|
Second quarter 2016 |
4.06 |
|
|
|
2.16 |
|
|
|
First quarter 2016 |
10.16 |
|
|
|
2.41 |
|
|
As of March 1, 2018, we had 288 stockholders of record of our common stock. Beneficial holders whose stock is in nominee or “street name” accounts through brokers held approximately 27,100 positions.
Stock Performance Graph
The following graph is not “soliciting material,” is not deemed “filed” with the Securities and Exchange Commission, or SEC, and is not to be incorporated by reference into any filing of Vivint Solar, Inc. under the Securities Act of 1933, as amended, or the Securities Act, or the Securities Exchange Act of 1934, as amended, or the Exchange Act, whether made before or after the date hereof and irrespective of any general incorporation language in any such filing.
The following graph compares for the period from October 1, 2014 through December 31, 2017, the total cumulative stockholder return on our common stock with the total cumulative return of the New York Stock Exchange Composite Index and the MAC Global Solar Energy Index. The graph assumes a $100 investment at the beginning of the period in our common stock, the stocks represented in the New York Stock Exchange Composite Index and the MAC Global Solar Energy Index, and assumes reinvestment of any dividends. Historical stock price performance should not be relied upon as an indication of future stock price performance:
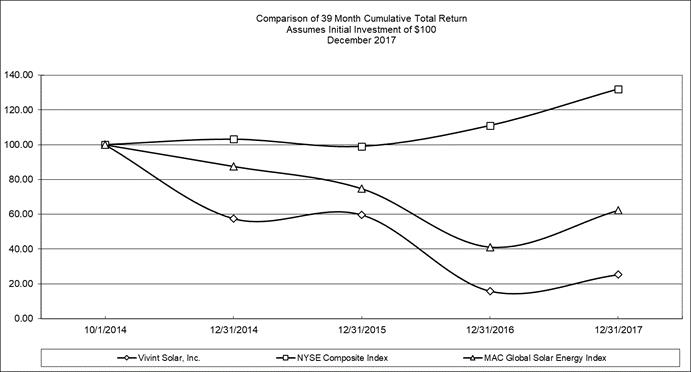
38
Recent Sales of Unregistered Securities
None.
Issuer Purchase of Equity Securities
None.
Dividend Policy
We have never declared or paid any cash dividends on our common stock. We currently intend to retain any future earnings to fund our growth, and we do not anticipate declaring or paying any cash dividends in the foreseeable future. Additionally, the terms of one or more of our current debt instruments restrict our ability to pay cash dividends on our common stock. Any future determination to declare cash dividends will be made at the discretion of our board of directors, subject to applicable laws and provisions of our debt instruments and organizational documents, after taking into account our financial condition, results of operations, capital requirements, general business conditions and other factors that our board of directors may deem relevant.
Item 6. Selected Financial Data.
The following table sets forth selected historical consolidated financial and other data for the periods ended and at the dates indicated below. Our selected historical consolidated statement of operations data for the years ended December 31, 2017, 2016 and 2015 presented in this table and the balance sheet data as of December 31, 2017 and 2016 have been derived from our historical audited consolidated financial statements included elsewhere in this report. Our historical results are not necessarily indicative of the results that may be expected in the future. The following selected financial data should be read in conjunction with the sections of this document captioned “Management’s Discussion and Analysis of Financial Condition and Results of Operations” and our consolidated financial statements and related notes included elsewhere in this report.
|
|
|
Year Ended December 31, |
|
|||||||||||||||||
|
|
|
2017 |
|
|
2016 |
|
|
2015 |
|
|
2014 |
|
|
2013 |
|
|||||
|
|
|
(In thousands, except per share data) |
|
|||||||||||||||||
|
Statements of Operations Data: |
|
|
|
|
|
|
|
|
|
|
|
|
|
|
|
|
|
|
|
|
|
Operating leases and incentives revenue |
|
$ |
150,862 |
|
|
$ |
105,353 |
|
|
$ |
61,150 |
|
|
$ |
21,688 |
|
|
$ |
5,864 |
|
|
Solar energy system and product sales revenue |
|
|
117,166 |
|
|
|
29,814 |
|
|
|
3,032 |
|
|
|
3,570 |
|
|
|
306 |
|
|
Total revenue |
|
|
268,028 |
|
|
|
135,167 |
|
|
|
64,182 |
|
|
|
25,258 |
|
|
|
6,170 |
|
|
Total cost of revenue |
|
|
230,282 |
|
|
|
173,981 |
|
|
|
132,975 |
|
|
|
69,981 |
|
|
|
19,127 |
|
|
Gross profit (loss) |
|
|
37,746 |
|
|
|
(38,814 |
) |
|
|
(68,793 |
) |
|
|
(44,723 |
) |
|
|
(12,957 |
) |
|
Total operating expenses |
|
|
121,993 |
|
|
|
163,719 |
|
|
|
162,321 |
|
|
|
117,571 |
|
|
|
38,381 |
|
|
Interest expense |
|
|
64,264 |
|
|
|
34,008 |
|
|
|
12,568 |
|
|
|
9,323 |
|
|
|
3,144 |
|
|
Net loss attributable to non-controlling interests and redeemable non-controlling interests |
|
|
(200,628 |
) |
|
|
(260,523 |
) |
|
|
(266,345 |
) |
|
|
(137,036 |
) |
|
|
(62,108 |
) |
|
Net income available (loss attributable) to common stockholders |
|
|
209,098 |
|
|
|
17,986 |
|
|
|
13,080 |
|
|
|
(28,883 |
) |
|
|
5,638 |
|
|
Net income available (loss attributable) per share to common stockholders(1): |
|
|
|
|
|
|
|
|
|
|
|
|
|
|
|
|
|
|
|
|
|
Basic |
|
$ |
1.85 |
|
|
$ |
0.17 |
|
|
$ |
0.12 |
|
|
$ |
(0.35 |
) |
|
$ |
0.08 |
|
|
Diluted |
|
$ |
1.77 |
|
|
$ |
0.16 |
|
|
$ |
0.12 |
|
|
$ |
(0.35 |
) |
|
$ |
0.07 |
|
(1) See Note 18—Basic and Diluted Net Income Per Share to our consolidated financial statements for an explanation of the method used to calculate basic and diluted net income available (loss attributable) per share to common stockholders and the weighted-average number of shares used in the computation of the per share amounts.
39
|
|
As of December 31, |
|
||||||||||||||||||
|
|
|
2017 |
|
|
2016 |
|
|
2015 |
|
|
2014 |
|
|
2013 |
|
|||||
|
|
|
(In thousands) |
|
|||||||||||||||||
|
Balance Sheet Data: |
|
|
|
|
|
|
|
|
|
|
|
|
|
|
|
|
|
|
|
|
|
Cash and cash equivalents |
|
$ |
108,452 |
|
|
$ |
96,586 |
|
|
$ |
92,213 |
|
|
$ |
261,649 |
|
|
$ |
6,038 |
|
|
Solar energy systems, net |
|
|
1,673,532 |
|
|
|
1,458,355 |
|
|
|
1,102,157 |
|
|
|
588,167 |
|
|
|
188,058 |
|
|
Total assets |
|
|
2,463,929 |
|
|
|
2,126,356 |
|
|
|
1,609,070 |
|
|
|
1,064,324 |
|
|
|
297,707 |
|
|
Revolving lines of credit, related party |
|
|
— |
|
|
|
— |
|
|
|
— |
|
|
|
— |
|
|
|
41,412 |
|
|
Long-term obligations(1) |
|
|
945,314 |
|
|
|
767,619 |
|
|
|
431,394 |
|
|
|
114,678 |
|
|
|
3,761 |
|
|
Redeemable non-controlling interests |
|
|
122,444 |
|
|
|
129,676 |
|
|
|
169,541 |
|
|
|
128,427 |
|
|
|
73,265 |
|
|
Total equity |
|
|
861,066 |
|
|
|
666,834 |
|
|
|
609,252 |
|
|
|
613,136 |
|
|
|
80,621 |
|
(1) Includes the current and long-term portions of debt outstanding and the amounts payable under capital lease obligations in the years presented.
Item 7. Management’s Discussion and Analysis of Financial Condition and Results of Operations.
Overview
You should read the following discussion together with Item 6 “Selected Financial Data” and our consolidated financial statements and the related notes included in Item 8 of this report. This discussion contains forward-looking statements about our business and operations. Our actual results may differ materially from those we currently anticipate as a result of the many factors, including those we describe under Item 1A “Risk Factors” and elsewhere in this report. See “Forward-Looking Statements.”
Business Overview
We offer distributed solar energy — electricity generated by a solar energy system installed at or near customers’ locations — to residential customers primarily through a customer-focused and neighborhood-driven direct-to-home sales model. We believe we are disrupting the traditional electricity market by satisfying customers’ demand for increased energy independence and less expensive, more socially responsible electricity generation. As a result, we primarily compete with traditional utilities in the markets we serve, and our strategy is to price the energy we sell below prevailing retail electricity rates. The price our customers pay to buy energy from us varies depending on the state where the customer is located, the impact of the local traditional utility, customer price sensitivity, the availability of incentives and rebates, the need to offer a compelling financial benefit and the price other solar energy companies charge in the region. We also compete with distributed solar energy system providers for solar energy system sales on the basis of price, service and availability of financing options.
Our current product offering includes the following:
|
|
• |
Power Purchase Agreements. Under power purchase agreements, or PPAs, we charge customers a fee per kilowatt hour based on the amount of electricity the solar energy system actually produces, which is billed monthly. PPAs typically have a term of 20 years and are subject to an annual price escalator of 2.9%. Over the term of the PPA, we operate the system and agree to maintain it in good condition. Customers who buy energy from us under PPAs are covered by our workmanship warranty equal to the length of the term of these agreements. |
|
|
• |
Legal-form Leases. Under legal-form leases, or Solar Leases, we charge customers a fixed monthly payment to lease the solar energy system, which is based on a calculation that takes into account expected solar energy generation. Solar Leases typically have a term of 20 years and are subject to an annual price escalator of 2.9%. We provide our Solar Lease customers a performance guarantee, under which we agree to refund payments to the customer if the solar energy system does not meet the guaranteed production level in the prior 12-month period. Over the term of the Solar Lease, we operate the system and agree to maintain it in good condition. Customers who buy energy from us under Solar Leases are covered by our workmanship warranty equal to the length of the term of these agreements. |
|
|
• |
Solar Energy System Sales. Under solar energy system sales, or System Sales, we offer our customers the option to purchase solar energy systems for cash or through third-party financing. The price for these contracts is determined as a function of the respective market rate and the size of the solar energy system to be installed. Customers can additionally contract with us for certain structural upgrades, smart home products, battery storage systems, electric vehicle charging stations and other accessories based on the market where they are located in connection with the installation of a solar energy system. We believe System Sales are advantageous to us as they provide immediate access to cash. |
40
Of our 183.8 megawatts installed in 2017, approximately 75% were installed under PPAs, 3% were installed under Solar Leases and 22% were installed under System Sales.
From time to time, we have adjusted our installation policies and pricing. We have become more selective in our installation policies to increase incremental value by limiting the installation of smaller system sizes and limiting installations on certain roof types. We have also changed our pricing in certain markets to increase returns on investment or to place ourselves in a more competitive position. We continue to evaluate and make adjustments to our installation policies and pricing as our processes become more efficient and power rates increase. We also continue to evaluate pricing to optimize our use of capital based on market conditions and utility rates.
Our ability to offer long-term customer contracts depends in part on our ability to finance the installation of the solar energy systems by co-investing or entering into lease arrangements with fund investors who value the resulting customer receivables and investment tax credits, or ITCs, accelerated tax depreciation and other incentives related to the solar energy systems through structured investments known as “tax equity.” Tax equity investments are generally structured as non-recourse project financings known as investment funds. In the context of the distributed solar energy market, tax equity investors make an upfront advance payment to a sponsor through an investment fund in exchange for a share of the tax attributes and cash flows emanating from an underlying portfolio of solar energy systems. In these investment funds, the U.S. federal tax attributes offset taxes that otherwise would have been payable on the investors’ other operations. The terms and conditions of each investment fund vary significantly by investor and by fund. We continue to negotiate with financial investors to create additional investment funds.
With one exception, our investment funds have adopted the partnership or inverted lease structures. Under partnership structures, we and our fund investors contribute cash into a partnership company. The partnership uses this cash to acquire solar energy systems developed by us and sells energy from such systems to customers or directly leases the solar energy systems to customers. Under our existing inverted lease structures, we and the fund investor set up a multi-tiered investment vehicle, comprised of two partnership entities, that facilitates the pass through of the tax benefits to the fund investors. In this structure, we contribute solar energy systems to a lessor partnership entity in exchange for interests in the lessor partnership and the fund investors contribute cash to a lessee partnership in exchange for interests in the lessee partnership which in turn makes an investment in the lessor partnership entity in exchange for interests in the lessor partnership. The lessor partnership distributes the cash contributions received from the lessee partnership to our wholly owned subsidiary that contributed the projects to the lessor partnership. The lessor partnership leases the contributed solar energy systems to the lessee partnership under a master lease, and the lessee partnership pays the lessor partnership rent for those systems.
We have determined that we are the primary beneficiary in these partnership and inverted lease structures for accounting purposes. Accordingly, we consolidate the assets and liabilities and operating results of these partnerships in our consolidated financial statements. We recognize the fund investors’ share of the net assets of the investment funds as non-controlling interests and redeemable non-controlling interests in our consolidated balance sheets. These income or loss allocations, reflected on our consolidated statement of operations, may create significant volatility in our reported results of operations, including potentially changing net income available (loss attributable) to common stockholders from income to loss, or vice versa, from quarter to quarter.
Recent Developments
Investment Funds
In February 2018, our wholly owned subsidiary entered into an investment fund arrangement with an existing fund investor. The total commitment under the investment fund arrangement is $75.0 million. Our wholly owned subsidiary has the right to elect to require the fund investor to sell all of its membership units to our wholly owned subsidiary once certain conditions have been met. The purchase price for the fund investor’s interests is determined based on the fair market value of those interests at the time the option is exercised. We have not yet completed our assessment of whether the investment fund arrangement is a variable interest entity, or VIE.
Subsequent to quarter end, we entered into non-binding letters of intent for five new tax equity investment funds for an aggregate $401 million. The fund investors’ obligations under the letters of intent are subject to the satisfaction of certain conditions, including negotiation of definitive documentation. If the commitments are consummated, we will assess whether the investment fund arrangements are VIEs.
Interest Rate Swaps
In January 2018, we entered into additional interest rate swaps with a notional amount of $73.0 million. The additional interest rate swaps were required by the terms of the Aggregation Facility due to additional draws on the Aggregation Facility that we made during the year ended December 31, 2017. These additional interest rate swaps were not designated as hedge instruments.
41
We regularly review a number of metrics, including the following key operating metrics, to evaluate our business, measure our performance, identify trends affecting our business, formulate financial projections and make strategic decisions. Some of our key operating metrics are estimates. These estimates are based on our management’s beliefs and assumptions and on information currently available to management. Although we believe that we have a reasonable basis for each of these estimates, these estimates are based on a combination of assumptions that may not prove to be accurate over time, particularly given that a number of them involve estimates of cash flows up to 30 years in the future. Underperformance of the solar energy systems, payment defaults by our customers, cancellation of signed contracts, competition from other distributed solar energy companies, development in the distributed solar energy market and the energy market more broadly, technical innovation or other factors described under the section of this report captioned “Risk Factors” could cause our actual results to differ materially from our calculations. Furthermore, while we believe we have calculated these key metrics in a manner consistent with those used by others in our industry, other companies may in fact calculate these metrics differently than we do now or in the future, which would reduce their usefulness as a comparative measure.
|
|
• |
Solar energy system installations. Solar energy system installations represents the number of solar energy systems installed on customers’ premises. Cumulative solar energy system installations represents the aggregate number of solar energy systems that have been installed on customers’ premises. We track the number of solar energy system installations as of the end of a given period as an indicator of our historical growth and as an indicator of our rate of growth from period to period. |
|
|
• |
Megawatts installed. Megawatts installed represents the aggregate megawatt nameplate capacity of solar energy systems for which panels, inverters, and mounting and racking hardware have been installed on customer premises in the period. Cumulative megawatts installed represents the aggregate megawatt nameplate capacity of solar energy systems for which panels, inverters, and mounting and racking hardware have been installed on customer premises. |
|
|
• |
Estimated nominal contracted payments remaining. Estimated nominal contracted payments remaining equals the sum of the remaining cash payments that our customers are expected to pay over the term of their PPAs or Solar Leases with us for systems installed as of the measurement date. For a PPA, we multiply the contract price per kilowatt-hour by the estimated annual energy output of the associated solar energy system to determine the estimated nominal contracted payments. For a Solar Lease, we include the monthly fees and upfront fee, if any, as set forth in the lease. |
|
|
• |
Estimated retained value under energy contracts. Estimated retained value under energy contracts represents the estimated retained value from the solar energy systems during the typical 20-year term of our PPAs and Solar Leases. |
|
|
• |
Estimated retained value of renewal. Estimated retained value of renewal represents the estimated retained value associated with an assumed 10-year renewal term following the expiration of the initial PPA or Solar Lease term. To calculate estimated retained value of renewal, we assume all PPAs and Solar Leases are renewed at 90% of the contractual price in effect at the expiration of the initial term. |
|
|
• |
Estimated retained value. Estimated retained value represents the net cash flows discounted at 6% that we expect to receive from customers pursuant to PPAs and Solar Leases net of estimated cash distributions to fund investors and estimated operating expenses for systems installed as of the measurement date. |
|
|
• |
Estimated retained value per watt. Estimated retained value per watt is calculated by dividing the estimated retained value as of the measurement date by the aggregate nameplate capacity of solar energy systems under PPAs and Solar Leases that have been installed as of such date, and is subject to the same assumptions and uncertainties as estimated retained value. |
|
|
Year Ended December 31, |
|
|||||||||
|
|
2017 |
|
|
2016 |
|
|
2015 |
|
|||
|
Solar energy system installations |
|
27,232 |
|
|
|
31,071 |
|
|
|
32,807 |
|
|
Megawatts installed |
|
183.8 |
|
|
|
222.2 |
|
|
|
230.8 |
|
Solar energy system installations and megawatts installed have decreased for the year ended December 31, 2017 compared to prior years due in part to our taking a disciplined approach to install solar energy systems more profitably, slowing growth in the residential solar market, as well as increased competition. Our focus on profitability has included increasing System Sales, increasing prices in certain markets and expanding in markets with larger returns on investment, which has contributed to the decreases in solar energy system installations and megawatts installed.
42
|
As of December 31, |
|
||||||||||
|
|
2017 |
|
|
2016 |
|
|
2015 |
|
|||
|
Cumulative solar energy system installations |
|
126,830 |
|
|
|
99,598 |
|
|
|
68,527 |
|
|
Cumulative megawatts installed |
|
864.9 |
|
|
|
681.1 |
|
|
|
458.9 |
|
|
Estimated nominal contracted payments remaining (in millions) |
$ |
3,021.6 |
|
|
$ |
2,568.6 |
|
|
$ |
1,871.9 |
|
|
Estimated retained value under energy contracts (in millions) |
$ |
1,238.0 |
|
|
$ |
1,015.1 |
|
|
$ |
705.6 |
|
|
Estimated retained value of renewal (in millions) |
$ |
377.1 |
|
|
$ |
299.4 |
|
|
$ |
200.5 |
|
|
Estimated retained value (in millions) |
$ |
1,615.1 |
|
|
$ |
1,314.5 |
|
|
$ |
906.1 |
|
|
Estimated retained value per watt |
$ |
2.00 |
|
|
$ |
1.98 |
|
|
$ |
1.98 |
|
Factors Affecting Our Performance
Financing Availability
Our future success depends in part on our ability to raise capital from third-party investors on competitive terms to help finance the deployment of our residential solar energy systems under long-term customer contracts. There are a limited number of potential investment fund investors and the competition for this investment capital is intense. The principal tax credit on which fund investors in our industry rely is the ITC. The amount for the ITC is equal to 30% of the value of eligible solar property. By statute, the ITC percentage is scheduled to decrease to 26% on January 1, 2020, 22% on January 1, 2021 and 10% on January 1, 2022. We intend to create additional investment funds with financial investors and corporate investors. We also use debt, equity or other financing strategies to fund our operations, including our obligations to make contributions to investment funds. Such other financing strategies may increase our cost of capital. Our future success also depends in part on our ability to partner with third-parties who administer solar loan products.
Incentives; Net Metering
Our cost of capital, the price we can charge for electricity, the cost of our systems and the demand for residential distributed solar energy is impacted by a number of federal, state and local government incentives and regulations, including: tax credits, particularly the ITC; tax abatements; rebate programs; net metering; and solar renewable energy certificates, or SRECs. These programs have on occasion been challenged by incumbent utilities and questioned by those in government and others arguing for less governmental spending and involvement in the energy market. In recent years, net metering programs have been subject to regulatory scrutiny or legislative proposals in some states, such as Arizona, California, Hawaii, Nevada, New Hampshire, New York, Texas and Utah. Utilities are proposing new and varied revisions to their net metering programs, with such proposals ultimately determined by the state public utilities commissions. These revisions include capping the numbers of customers that can elect net metering within a utility service territory, imposing new fixed charges for grid service or interconnection, and reducing the retail rate value of the net metered generation. In California, for example, customers within the service territory of San Diego Gas and Electric, Pacific Gas and Electric Company, and Southern California Edison Company, must take service on a new net metering successor tariff. For this new tariff, the California Public Utilities Commission largely uses the current net metering form with full retail compensation for exports, but allows the utilities to impose reasonable interconnection fees and some additional charges on customers, and will require such customers to take service on time-of-use rates.
In December 2016, the Arizona Corporation Commission decided to end traditional net metering and transition to a new distributed solar energy net metering compensation regime in which customers are paid for energy generated from solar energy systems located on their roofs pursuant to a resource comparison proxy methodology or avoided cost methodology. Each of these methodologies will yield a compensation rate that is less advantageous than was previously available to customers under the historical net metering regime, limited to a 10% step down in each utility’s rate annually. The Arizona Corporation Commission has also adopted a settlement agreement between the Arizona Public Service Company and industry stakeholders under which demand charges based on a customer’s maximum average rate of energy consumed during a specified interval will be imposed on residential customers under certain rate schedules. These changes reduce the value proposition for residential solar in Arizona as compared to residential solar under the traditional net metering regime.
In December 2016, Rocky Mountain Power submitted a request to the Utah Public Service Commission that the Commission implement new rates for net metered customers seeking interconnection. We, together with other parties and Rocky Mountain Power entered into a settlement agreement that was filed with the Utah Public Service Commission in August 2017. The settlement provides for (among other things): (1) an end to the current net metering program on November 15, 2017 and establishes a grandfathering period through 2035 for all customers enrolled in the program before such date; (2) a transition program through 2020 where customers will receive slightly less than the retail rate for their net metering credits through 2033; and (3) a new proceeding in front of the Utah Public Service Commission to study the value of rooftop solar based on the long-term benefits and costs of distributed energy systems. A decision from the Utah Public Service Commission approving the settlement agreement was issued in September 2017.
43
In July 2017, Nevada Power Company submitted an application to the Nevada Public Service Commission proposing a change to the net metering program after the passage of the state Assembly Bill 405. The Nevada Public Service Commission conducted hearings on the matter in August and in September issued an order rejecting the Nevada Power Company proposal. The Commission affirmed that AB 405 provides for monthly netting and established clarity on the tranche classifications for the monthly net excess generation compensation credits.
Additionally, in March 2017, the New York Public Service Commission issued an order transitioning from traditional net metering to a new value of distributed energy resource compensation regime in which customers are paid for energy generated from solar energy systems located on their roofs pursuant to a methodology based on the value of the distributed energy from such systems. After a transitional period through January 1, 2020 during which customers can still qualify for net metering (subject to a specified aggregate capacity amount availability for each utility), this value of distributed energy methodology could yield a compensation rate that is less advantageous than was previously available to customers under the historical net metering regime. Several other states plan to revisit their net metering policies in the coming years.
We also apply for and receive SRECs and other state-level incentives in certain jurisdictions for power generated by our solar energy systems, which comprise a significant portion of the value to us of the associated solar energy systems. The market for SRECs is extremely volatile and sellers are often able to obtain better unit pricing by selling a large quantity of SRECs. As a result, we may sell SRECs infrequently, at opportune times and in large quantities and the timing and volume of our SREC sales may lead to fluctuations in our quarterly results.
Cost of Solar Energy Systems
Although the solar panel market has seen an increase in supply, upward pressure on prices may occur due to growth in the solar industry, regulatory policy changes and the resulting increase in demand for solar panels and the raw materials necessary to manufacture them. On January 22, 2018, in response to a petition filed under Section 201 of the Trade Act of 1974, the President of the United States announced the imposition of safeguard measures for a period of four years that include (1) a 30% tariff on imports of solar cells not partially or fully assembled into other products and (2) a 30% tariff on imported solar modules. The tariff on imported solar modules will decline 5% each year in the second, third and fourth years. The safeguard measures went into effect on February 7, 2018 and apply to imports for all foreign countries, including Mexico and Canada, except certain developing countries that are members of the World Trade Organization. As a result, we will likely pay higher prices on imported solar modules, making it less economical for us to serve certain markets.
Sustainable Growth
We operate in states whose utility prices, sun exposure, climate conditions and regulatory policies provide for the most compelling market for distributed solar energy. Utility rates, availability of state incentives, other state, regional and local regulations, sun exposure and weather conditions, which can impact sales, installation and system productivity, vary by market. For example, markets in California typically have higher utility rates than markets in the Eastern United States. As a result, systems in California typically have a higher retained value than systems in the Eastern United States. However, we are entitled to receive SRECs and other state incentives in many Eastern states that are not available in the Western United States. Although the impact of such incentives is not reflected in the retained value of the associated systems, they do generate value for us. As a result, our financial and operating results will be affected by the geographic mix of the systems we install. Competition also varies by market and we may compete with national and local solar companies that offer products similar to ours. We plan to enlarge our addressable market by expanding our presence to new states on a measured basis. Offering System Sales to customers allows us to enter markets where customers prefer to own their solar energy systems or locations where our PPAs and Solar Leases are not permitted by local regulations or are not economically feasible.
Sales Channels
We place our integrated residential solar energy systems through a sales organization that primarily uses a direct-to-home sales model. We believe that a high-touch, customer-focused selling process is important before, during and after the sale of our products to maximize our sales success. The members of our sales force typically reside and work within the market they serve. We also generate a significant amount of sales through customer referrals. We have found that customer referrals increase in relation to our penetration in a particular market. Shortly after entering a new market, referrals become an increasingly effective way to market our solar energy systems. In addition to direct sales, we sell to customers through our inside sales team. We also continue to explore opportunities to sell solar energy systems to customers through a number of other distribution channels, including relationships with real estate management companies, home builders, home improvement stores, large construction, electrical and roofing companies and other third parties that have access to large numbers of potential customers.
44
We have historically relied on the technical support of Vivint, Inc., or Vivint. We used certain of Vivint’s information technology and infrastructure until July 2017. Furthermore, while we have transitioned to our own systems, some of our historical data continues to reside on Vivint’s systems. Any difficulty in separating our information technology services or obtaining our historical data from Vivint’s information technology services could result in unexpected costs, impact our results or prevent us from performing other technical, administrative and information technology services on a timely basis and could materially harm our business, financial condition, results of operations and cash flows.
Additionally, we have entered into certain agreements with Vivint. In August 2017, we entered into a sales dealer agreement with Vivint. Under this agreement, each party will act as a dealer for the other party to market, promote and sell each other’s products. The agreement has a two-year term that will be automatically renewed for successive one-year terms unless written notice of termination is provided by one of the parties to the other no less than 90 days prior to the end of the then current term. The products, territories and consideration that is payable by each party to the other is determined in accordance with the agreement. Pursuant to the terms of a Non-Competition Agreement we have entered into with Vivint, as amended, we and Vivint each have agreed not to solicit for employment any member of the other’s executive or senior management team, or any of the other’s employees who primarily manage sales, installation or services of the other’s products and services until the termination of the sales dealer agreement. The commitment not to solicit each other’s employees lasts for 180 days after such employee finishes employment with us or Vivint.
Components of Results of Operations
Revenue
Operating Leases and Incentives. We classify and account for our PPAs as operating leases and recognize revenue from these contracts based on the actual amount of power generated at rates specified under the contracts. We also classify and account for our Solar Leases, which include performance guarantees, as operating leases. Depending on the level of the guarantee, we either recognize revenue on a straight-line basis over the lease term or we recognize revenue based on the amount of power generated at rates specified under the contracts and establish a reserve for those lease contracts for which we may have to make a payment at the end of each year to the customer if the solar energy systems do not meet a guaranteed production level in the prior 12-month period.
One of our investment funds is structured as a lease pass-through fund arrangement. Under the agreement, we contributed solar energy systems and the investor made large upfront payments to one of our wholly owned subsidiaries and is obligated to make subsequent periodic payments. We allocated a portion of the aggregate payments received from the fund investor to the estimated fair value of assigned ITCs, and the balance to the future customer lease payments that are also assigned to the investor. The fair value of the ITCs was estimated by multiplying the ITC rate of 30% by the fair value of the systems that were sold to the lease pass-through fund. The fair value of the systems was determined by independent appraisals. Our subsidiary has an obligation to ensure the solar energy systems are in service and operational for a term of five years to avoid any recapture of the ITCs. Accordingly, we recognize revenue as the recapture provisions lapse assuming all other revenue recognition criteria have been met. The amounts allocated to the ITCs are initially recorded as deferred revenue in the consolidated balance sheet, and subsequently, one-fifth of the amounts allocated to the ITCs is recognized as revenue from operating leases and solar energy systems incentives in the consolidated statements of operations based on the anniversary of each solar energy system’s placed in service date.
We consider the proceeds from solar energy system rebate incentives offered by certain state and local governments to form part of the payments under our operating leases and recognize such payments as revenue over the contract term. We record revenue from our operating leases over the term of our long-term customer contracts, which is typically 20 years. Less than 1% of our revenue was attributable to state and local rebates and incentives in all periods presented. We also apply for and receive SRECs in certain jurisdictions for power generated by solar energy systems we have installed. We generally recognize revenue related to the sale of SRECs upon delivery to the buyer. The market for SRECs is extremely volatile and sellers are often able to obtain better unit pricing by selling a large quantity of SRECs. As a result, we may sell SRECs infrequently, at opportune times and in large quantities and the timing and volume of our SREC sales may lead to fluctuations in our quarterly results.
Solar Energy System and Product Sales. Solar energy system and product sales primarily includes revenue from System Sales. Revenue for System Sales is recognized when systems are interconnected to local power grids and granted permission to operate, assuming all other revenue recognition criteria are met. Revenue from System Sales as a percentage of total revenue has increased significantly during the year ended December 31, 2017 as a result of our increased focus on System Sales. Revenue related to the sale of photovoltaic installation products is recognized at the time of product shipment to the customer, assuming the remaining revenue recognition criteria have been met. We anticipate solar energy system and product sales to continue to increase as a percentage of total revenue over time, albeit at a slower rate than what we have experienced in 2017. Revenue mix will likely vary on a period-to-period basis as a result of regulatory, competitive and other local market conditions.
45
The following table sets forth our revenue by major product (in thousands):
|
|
Year Ended December 31, |
|
|||||||||
|
|
2017 |
|
|
2016 |
|
|
2015 |
|
|||
|
Revenue: |
|
|
|
|
|
|
|
|
|
|
|
|
Operating leases and other incentives |
$ |
110,052 |
|
|
$ |
81,610 |
|
|
$ |
47,224 |
|
|
SREC sales |
|
33,038 |
|
|
|
19,304 |
|
|
|
13,926 |
|
|
ITC revenue |
|
7,772 |
|
|
|
4,439 |
|
|
|
— |
|
|
Total operating leases and incentives |
|
150,862 |
|
|
|
105,353 |
|
|
|
61,150 |
|
|
|
|
|
|
|
|
|
|
|
|
|
|
|
System sales |
|
114,462 |
|
|
|
27,607 |
|
|
|
762 |
|
|
Photovoltaic installation products |
|
1,958 |
|
|
|
2,169 |
|
|
|
2,270 |
|
|
SREC sales |
|
746 |
|
|
|
38 |
|
|
|
— |
|
|
Total solar energy system and product sales |
|
117,166 |
|
|
|
29,814 |
|
|
|
3,032 |
|
|
Total revenue |
$ |
268,028 |
|
|
$ |
135,167 |
|
|
$ |
64,182 |
|
Operating Expenses
Cost of Operating Leases and Incentives Revenue. Cost of operating leases and incentives includes the depreciation of the cost of solar energy systems under long-term customer contracts, which are depreciated for accounting purposes over 30 years; and the amortization of the related capitalized initial direct costs, which are amortized over the term of the long-term customer contract. It also includes allocated indirect material and labor costs related to the processing; account creation; design; installation; interconnection and servicing of solar energy systems that are not capitalized, such as personnel costs not directly associated to a solar energy system installation; warehouse rent and utilities; and fleet vehicle executory costs. The cost of operating leases and incentives also includes allocated facilities and information technology costs. The cost of revenue for the sales of SRECs is limited to broker fees which are paid in connection with certain SREC transactions. In 2018, we expect our cost of operating leases and incentives revenue will increase in absolute dollars compared to 2017 primarily due to depreciation associated with additional solar energy systems being placed in service.
Cost of Solar Energy System and Product Sales Revenue. Cost of solar energy system and product sales consists of direct and allocated indirect material and labor costs and overhead costs for System Sales, photovoltaic installation products and structural upgrades. Indirect material and labor costs are ratably allocated to System Sales and include costs related to the processing; account creation; design; installation; interconnection and servicing of solar energy systems, such as personnel costs not directly associated to a solar energy system installation; warehouse rent and utilities; and fleet vehicle executory costs. The cost of solar energy system and product sales also includes allocated facilities and information technology costs. Costs of solar energy system sales are recognized in conjunction with the related revenue upon the solar energy system passing an inspection by the responsible governmental department after completion of system installation and interconnection to the power grid, assuming all other revenue recognition criteria are met. In 2018, we expect our margins related to our solar energy system and product sales will remain consistent with 2017.
Sales and Marketing Expenses. Sales and marketing expenses include personnel costs, such as salaries, benefits, bonuses and stock-based compensation for our corporate sales and marketing employees and exclude costs related to our direct sales personnel that are accounted for as cost of revenue. Sales and marketing expenses also include advertising, promotional and other marketing-related expenses; allocated facilities and information technology costs; travel; professional services and costs related to pre-installation sales activities. In 2018, we expect sales and marketing costs will increase slightly in absolute dollars compared to 2017.
Research and Development. Research and development expense is comprised primarily of salaries and benefits and other costs related to the development of photovoltaic installation products and other solar technologies. Research and development costs are charged to expense when incurred. In 2018, we expect research and development costs will decrease in absolute dollars compared to 2017.
46
General and Administrative Expenses. General and administrative expenses include personnel costs, such as salaries, bonuses and stock-based compensation related to our general and administrative personnel; professional fees related to legal, human resources, accounting and structured finance services; travel; and allocated facilities and information technology costs. Our financial results have included charges for the use of services provided by Vivint. These costs were based on the actual cost incurred by Vivint without mark-up. The charges to us may not be representative of what the costs would have been had we operated separately from Vivint during the periods presented; however, we believe the amounts charged are representative of the incremental cost to Vivint to provide these services to us. We continued to use certain of Vivint’s information technology and infrastructure until we transitioned off in July 2017. In 2018, we expect that general and administrative expense will remain consistent in absolute dollars compared to 2017.
Amortization of Intangible Assets. We have recorded intangible assets at their fair value related to acquisitions in which we have been involved and at cost for internally developed software projects. Such intangible assets are amortized over their estimated useful lives.
Impairment of Goodwill and Intangible Assets. In conjunction with the acquisition by SunEdison, Inc., or SunEdison, failing to occur, our market capitalization decreased significantly during the first quarter of 2016, from $1.0 billion as of December 31, 2015 to $283.0 million as of March 31, 2016. We considered this significant decrease in market capitalization to be an indicator of goodwill impairment, and we performed a test for potential impairment as of March 31, 2016. The completion of the impairment test resulted in the determination that our goodwill balance of $36.6 million was fully impaired. See Note 7—Intangible Assets and Goodwill.
Non-Operating Expenses
Interest Expense. Interest expense primarily consists of the interest charges associated with our indebtedness including the amortization of debt issuance costs and the interest component of capital lease obligations. In 2018, we expect our interest expense to increase in absolute dollars compared to 2017 as we have incurred additional indebtedness. Additionally, our debt facilities accrue interest at floating rates and increases in the floating rates would result in higher interest expense.
Other Expense (Income), Net. Other expense (income), net includes changes in fair value for the ineffective portions of our cash flow hedges and has included interest and penalties associated with tax payments that were not paid in a timely manner.
Income Tax (Benefit) Expense. All of our business is conducted in the United States, and therefore income tax (benefit) expense consists of current and deferred income taxes incurred in U.S federal, state and local jurisdictions.
Net Income Available to Stockholders
We determine the net income available to common stockholders by deducting from net income (loss) the net loss attributable to non-controlling interests and redeemable non-controlling interests. The net loss attributable to non-controlling interests and redeemable non-controlling interests represents the investment fund investors’ allocable share in the results of operations of the investment funds that we consolidate.
We have determined that the legal provisions in the contractual arrangements of the investment funds in which there is a non-controlling interest represent substantive profit-sharing arrangements, where the allocation to the partners differs from the stated ownership percentages. We have further determined that the appropriate methodology for attributing income and loss to the non-controlling interests and redeemable non-controlling interests each period is a balance sheet approach using the hypothetical liquidation at book value, or HLBV, method. Under the HLBV method, the amounts of income and loss attributed to the non-controlling interests and redeemable non-controlling interests in the consolidated statements of operations reflect changes in the amounts the fund investors would hypothetically receive at each balance sheet date under the liquidation provisions of the contractual agreements of these funds, assuming the net assets of the respective investment funds were liquidated at recorded amounts determined in accordance with U.S. generally accepted accounting principles, or GAAP. The fund investors’ interest in the results of operations of these investment funds is determined as the difference in the fund investors’ claim under the HLBV method at the start and end of each reporting period, after taking into account any capital transactions between the fund and the fund investors. For all of our investment funds in which we have an equity interest, the application of HLBV is performed consistently. However, the results of that application and its impact on the income or loss allocated between us and the non-controlling interests and redeemable non-controlling interests depend on the respective funds’ specific contractual liquidation provisions. HLBV results are generally affected by, among other factors, the tax attributes allocated to the fund investors including tax bonus depreciation and ITCs, the amount of preferred returns that have been paid to the fund investors by the investment funds, and the allocation of taxable income or losses in a liquidation scenario. As of December 31, 2017, we had one operational investment fund that did not utilize the HLBV method to allocate gains and losses, as we own 100% of the equity of that fund and there is no non-controlling interest attributable to a fund investor.
47
The contractual liquidation provisions of our existing funds in which there is a non-controlling interest provide that the allocation percentages between us and the investor change, or “flip,” under certain circumstances. Prior to the point at which the allocation percentage flips, the investor is entitled to receive a contractually agreed upon allocation of the value generated by the solar energy systems. The allocation of cash payments received from customers may differ from the allocation of other tax benefits. Afterwards, we are entitled to receive the majority of the value generated by the solar energy systems. The difference between our current inverted lease structures and our current partnership structures that drives a significant impact on our results from the application of the HLBV method is how the flip point is determined.
The HLBV calculation is also impacted by the difference between the cash received by us from the investment funds and the carrying value of the solar energy systems contributed to the investment funds. The purchase price paid for solar energy systems by an investment fund is based on the fair market value, as determined by an independent appraiser. As we consolidate both the subsidiary that develops the solar energy systems and the investment fund, the sales of the solar energy systems are considered transactions under common control and are therefore reflected at their historical cost, or their carryover basis. Cash received in excess of the installed purchased solar energy systems’ carryover basis is treated as deemed distributions from the investment fund to us. In most cases, any excess of the purchase price over the carryover basis of the solar energy systems would result in allocations of income to us.
A portion of the solar energy systems purchased by, or contributed to, an investment fund are not installed at the time of purchase or contribution and therefore do not have any carryover basis allocated to them. Our wholly owned subsidiary has an obligation to purchase, install and provide the solar energy system equipment to an investment fund for any in-progress projects that were previously purchased by such fund. If our wholly owned subsidiary does not ultimately provide the investment fund with the solar energy systems that it purchased, it is required to refund the purchase price to the investment fund. In these specific cases, we determined that the portion of the cash purchase price paid by an investment fund that relates to in-progress projects should be recorded as a receivable by the investment fund, representing the investment fund’s right to receive solar panels and related equipment for solar energy systems that are installed after the project is purchased by the investment fund. Given that our subsidiary controls the investment fund, we have accounted for the receivable balance as a reduction in the investment fund’s members’ equity in accordance with GAAP. Initially this may result in allocations of losses amongst the partners, as the GAAP equity balance is less than the tax capital account. The allocations of such losses amongst the partners follow the contractual liquidation provisions of the partnership agreements. When such solar energy systems are subsequently installed, the systems are recorded at their carryover basis as a common control transaction and the receivable balance is eliminated. With the elimination of the receivable, the investment fund’s member’s equity is increased to the extent of the carrying amount of the assets contributed, which results in the reversal of a portion of the prior allocation of losses. In most cases, the reversal of such losses occurs within a short period of time, approximately three to six months. As discussed above, the difference between the receivable balance eliminated and the carryover basis of the installed solar energy systems is treated as deemed distributions from the investment fund to us, and as a result, that portion of the prior allocation of losses is not reversed over time.
We classify certain non-controlling interests with redemption features that are not solely within our control outside of permanent equity. The fair values of these redemption features are calculated by discounting the cash flows subsequent to the expected flip date of the respective investment funds. When the redemption value of our redeemable non-controlling interests exceeds their carrying value after attribution of income or loss under the HLBV method in any period, we make an additional attribution of income to our redeemable non-controlling interests such that their carrying value at least equals the redemption value.
48
The results of operations presented below should be reviewed in conjunction with the consolidated financial statements and related notes included elsewhere in this report.
The following table sets forth selected consolidated statements of operations data for each of the periods indicated.
|
|
Year Ended December 31, |
|
|||||||||
|
|
2017 |
|
|
2016 |
|
|
2015 |
|
|||
|
|
(In thousands) |
|
|||||||||
|
Revenue: |
|
|
|
|
|
|
|
|
|
|
|
|
Operating leases and incentives |
$ |
150,862 |
|
|
$ |
105,353 |
|
|
$ |
61,150 |
|
|
Solar energy system and product sales |
|
117,166 |
|
|
|
29,814 |
|
|
|
3,032 |
|
|
Total revenue |
|
268,028 |
|
|
|
135,167 |
|
|
|
64,182 |
|
|
Cost of revenue: |
|
|
|
|
|
|
|
|
|
|
|
|
Cost of revenue—operating leases and incentives |
|
141,305 |
|
|
|
150,796 |
|
|
|
131,213 |
|
|
Cost of revenue—solar energy system and product sales |
|
88,977 |
|
|
|
23,185 |
|
|
|
1,762 |
|
|
Total cost of revenue |
|
230,282 |
|
|
|
173,981 |
|
|
|
132,975 |
|
|
Gross profit (loss) |
|
37,746 |
|
|
|
(38,814 |
) |
|
|
(68,793 |
) |
|
Operating expenses: |
|
|
|
|
|
|
|
|
|
|
|
|
Sales and marketing |
|
38,696 |
|
|
|
41,436 |
|
|
|
48,078 |
|
|
Research and development |
|
3,340 |
|
|
|
2,979 |
|
|
|
3,901 |
|
|
General and administrative |
|
79,399 |
|
|
|
81,802 |
|
|
|
92,664 |
|
|
Amortization of intangible assets |
|
558 |
|
|
|
901 |
|
|
|
13,172 |
|
|
Impairment of goodwill and intangible assets |
|
— |
|
|
|
36,601 |
|
|
|
4,506 |
|
|
Total operating expenses |
|
121,993 |
|
|
|
163,719 |
|
|
|
162,321 |
|
|
Loss from operations |
|
(84,247 |
) |
|
|
(202,533 |
) |
|
|
(231,114 |
) |
|
Interest expense |
|
64,264 |
|
|
|
34,008 |
|
|
|
12,568 |
|
|
Other expense (income), net |
|
352 |
|
|
|
(1,437 |
) |
|
|
(154 |
) |
|
Loss before income taxes |
|
(148,863 |
) |
|
|
(235,104 |
) |
|
|
(243,528 |
) |
|
Income tax (benefit) expense |
|
(157,333 |
) |
|
|
7,433 |
|
|
|
9,737 |
|
|
Net income (loss) |
|
8,470 |
|
|
|
(242,537 |
) |
|
|
(253,265 |
) |
|
Net loss attributable to non-controlling interests and redeemable non-controlling interests |
|
(200,628 |
) |
|
|
(260,523 |
) |
|
|
(266,345 |
) |
|
Net income available to common stockholders |
$ |
209,098 |
|
|
$ |
17,986 |
|
|
$ |
13,080 |
|
Comparison of Years Ended December 31, 2017 and 2016
Revenue
|
|
Year Ended December 31, |
|
|
$ Change |
|
||||||
|
|
2017 |
|
|
2016 |
|
|
2017 from 2016 |
|
|||
|
|
(In thousands) |
|
|||||||||
|
Revenue: |
|
|
|
|
|
|
|
|
|
|
|
|
Operating leases and incentives |
$ |
150,862 |
|
|
$ |
105,353 |
|
|
$ |
45,509 |
|
|
Solar energy system and product sales |
|
117,166 |
|
|
|
29,814 |
|
|
|
87,352 |
|
|
Total revenue |
$ |
268,028 |
|
|
$ |
135,167 |
|
|
$ |
132,861 |
|
Operating Leases and Incentives. The $45.5 million increase was primarily the result of a $28.4 million increase in operating lease revenue as the total megawatts of solar energy systems placed in service under these long-term customer contracts increased by 25%. In addition, SREC sales increased $13.7 million primarily driven by the increased solar energy systems in service and revenue related to our lease pass-through fund arrangement increased $3.3 million as deferred ITC revenue was recognized.
Solar Energy System and Product Sales. The $87.4 million increase was primarily due to our increased focus on System Sales, which has resulted in a significant increase in solar energy systems placed in service under System Sales.
49
|
|
Year Ended December 31, |
|
|
$ Change |
|
||||||
|
|
2017 |
|
|
2016 |
|
|
2017 from 2016 |
|
|||
|
|
(In thousands) |
|
|||||||||
|
Cost of revenue: |
|
|
|
|
|
|
|
|
|
|
|
|
Cost of revenue—operating leases and incentives |
$ |
141,305 |
|
|
$ |
150,796 |
|
|
$ |
(9,491 |
) |
|
Cost of revenue—solar energy system and product sales |
|
88,977 |
|
|
|
23,185 |
|
|
|
65,792 |
|
|
Total cost of revenue |
$ |
230,282 |
|
|
$ |
173,981 |
|
|
$ |
56,301 |
|
Cost of Revenue—Operating Leases and Incentives. The $9.5 million decrease was primarily due to a $24.6 million decrease in non-capitalized compensation and benefits primarily due to decreases in installation and operations employee headcount as a result of lower installation volume, a $6.8 million decrease in facility, warehouse and other building costs and a $2.6 million decrease in stock-based compensation and other administrative expense. These decreases were partially offset by a $14.5 million increase in depreciation and amortization of solar energy systems and a $10.3 million increase in solar energy system portfolio maintenance costs primarily due to the increase in the number of solar energy systems placed in service.
Cost of Revenue—Solar Energy System and Product Sales. The $65.8 million increase reflected the increase in the volume of System Sales.
Operating Expenses
|
|
Year Ended December 31, |
|
|
$ Change |
|
||||||
|
|
2017 |
|
|
2016 |
|
|
2017 from 2016 |
|
|||
|
|
(In thousands) |
|
|||||||||
|
Operating expenses: |
|
|
|
|
|
|
|
|
|
|
|
|
Sales and marketing |
$ |
38,696 |
|
|
$ |
41,436 |
|
|
$ |
(2,740 |
) |
|
Research and development |
|
3,340 |
|
|
|
2,979 |
|
|
|
361 |
|
|
General and administrative |
|
79,399 |
|
|
|
81,802 |
|
|
|
(2,403 |
) |
|
Amortization of intangible assets |
|
558 |
|
|
|
901 |
|
|
|
(343 |
) |
|
Impairment of goodwill |
|
— |
|
|
|
36,601 |
|
|
|
(36,601 |
) |
|
Total operating expenses |
$ |
121,993 |
|
|
$ |
163,719 |
|
|
$ |
(41,726 |
) |
Sales and Marketing Expense. The $2.7 million decrease was primarily due to a $4.2 million decrease in pre-installation costs related to lower activity compared to the prior year and cost savings achieved through implementation of pre-installation operational and system-related process improvements and a $2.4 million decrease in marketing and brand awareness activities. These decreases were partially offset by a $3.1 million increase in compensation and benefits and a $1.1 million increase in stock-based compensation expense resulting primarily from an increase in inside sales, marketing and corporate sales employee headcount.
Research and Development Expense. The $0.4 million increase was primarily due to a $0.7 million increase in stock-based compensation expense resulting from forfeitures in 2016 that reduced stock-based compensation expense in that period.
General and Administrative Expense. The $2.4 million decrease was primarily due to a $4.9 million decrease in legal and other fees related to the failed acquisition by SunEdison in 2016 and a $3.1 million decrease in professional fees related to initiating and servicing tax equity investment funds as we initiated fewer funds in 2017 compared to 2016. Additionally, $2.2 million in costs were incurred in 2016 related to severance for senior management who left our company and other organizational changes during that period, and a $1.0 million fee was incurred to terminate and settle a commercial and industrial investment fund in 2016. These decreases were partially offset by a $5.8 million increase in compensation and benefits primarily related to additional hiring of information technology and other general and administrative employees and a $2.6 million increase in stock-based compensation resulting primarily from forfeitures in 2016 that reduced stock-based compensation expense in that period.
Impairment of Goodwill. An impairment charge of $36.6 million was recorded in 2016 to write off the entire value of goodwill as it was deemed to be fully impaired during the year ended December 31, 2016.
50
|
|
Year Ended December 31, |
|
|
$ Change |
|
||||||
|
|
2017 |
|
|
2016 |
|
|
2017 from 2016 |
|
|||
|
|
(In thousands) |
|
|||||||||
|
Interest expense |
$ |
64,264 |
|
|
$ |
34,008 |
|
|
$ |
30,256 |
|
|
Other expense (income), net |
|
352 |
|
|
|
(1,437 |
) |
|
|
1,789 |
|
Interest Expense. Interest expense increased $30.3 million primarily due to the cost of financing additional borrowings year over year.
Other Expense (Income), Net. The $1.8 million change from other income to other expense was primarily due to unrealized net losses of $2.0 million related to our derivative financial instruments that were recognized during 2017.
Income Taxes
|
|
Year Ended December 31, |
|
|
$ Change |
|
||||||
|
|
2017 |
|
|
2016 |
|
|
2017 from 2016 |
|
|||
|
|
(In thousands) |
|
|||||||||
|
Income tax (benefit) expense |
$ |
(157,333 |
) |
|
$ |
7,433 |
|
|
$ |
(164,766 |
) |
The $164.8 million change from income tax expense to income tax benefit was primarily attributable to a net $187.5 million reduction in deferred tax liabilities due to the corporate federal income tax rate being reduced from 35 percent to 21 percent effective for tax years beginning after 2017, $21.0 million of lower non-controlling interests and redeemable non-controlling interests and a tax-effected $12.8 million associated with the goodwill impairment charge during 2016. These decreases in income tax expense were partially offset by a tax-effected $29.3 million reduced loss before income taxes, $20.5 million of lower tax credits due to significantly fewer solar energy systems not financed through tax equity funds and $3.5 million of higher amortization related to the prepaid tax asset.
Net Loss Attributable to Non-Controlling Interests and Redeemable Non-Controlling Interests
|
|
Year Ended December 31, |
|
|
$ Change |
|
||||||
|
|
2017 |
|
|
2016 |
|
|
2017 from 2016 |
|
|||
|
|
(In thousands) |
|
|||||||||
|
Net loss attributable to non-controlling interests and redeemable non-controlling interests |
$ |
(200,628 |
) |
|
$ |
(260,523 |
) |
|
$ |
59,895 |
|
Net loss attributable to non-controlling interests and redeemable non-controlling interests was allocated using the HLBV method. Generally, gains and losses that are allocated to our fund investors relate to hypothetical liquidation gains and losses resulting from differences between the net assets of the investment fund and the partners’ respective tax capital accounts in the investment fund. Losses allocated to the fund investors are generally derived from the receipt of ITCs and tax depreciation. These tax benefits are primarily allocated to the investors and reduce the fund investors’ tax capital account. The $59.9 million decrease in net loss attributable to non-controlling interests and redeemable non-controlling interests reflects lower volumes of solar energy systems installed and placed in service under PPA and Solar Lease agreements compared to the same period in 2016.
51
Comparison of Years Ended December 31, 2016 and 2015
Revenue
|
|
Year Ended December 31, |
|
|
$ Change |
|
||||||
|
|
2016 |
|
|
2015 |
|
|
2016 from 2015 |
|
|||
|
|
(In thousands) |
|
|||||||||
|
Revenue: |
|
|
|
|
|
|
|
|
|
|
|
|
Operating leases and incentives |
$ |
105,353 |
|
|
$ |
61,150 |
|
|
$ |
44,203 |
|
|
Solar energy system and product sales |
|
29,814 |
|
|
|
3,032 |
|
|
|
26,782 |
|
|
Total revenue |
$ |
135,167 |
|
|
$ |
64,182 |
|
|
$ |
70,985 |
|
Operating Leases and Incentives. The $44.2 million increase was primarily the result of a $34.4 million increase in operating lease revenue as the total megawatts of solar energy systems placed in service under these long-term customer contracts increased 67%. In addition, SREC sales increased $5.4 million primarily driven by the increased solar energy systems in service and revenue related to our lease pass-through fund arrangement increased $4.4 million as deferred ITC revenue was recognized.
Solar Energy System and Product Sales. The $26.8 million increase was primarily the result of our emphasis on System Sales through cash and loan products.
Cost of Revenue
|
|
Year Ended December 31, |
|
|
$ Change |
|
||||||
|
|
2016 |
|
|
2015 |
|
|
2016 from 2015 |
|
|||
|
|
(In thousands) |
|
|||||||||
|
Cost of revenue: |
|
|
|
|
|
|
|
|
|
|
|
|
Cost of revenue—operating leases and incentives |
$ |
150,796 |
|
|
$ |
131,213 |
|
|
$ |
19,583 |
|
|
Cost of revenue—solar energy system and product sales |
|
23,185 |
|
|
|
1,762 |
|
|
|
21,423 |
|
|
Total cost of revenue |
$ |
173,981 |
|
|
$ |
132,975 |
|
|
$ |
41,006 |
|
Cost of Revenue—Operating Leases and Incentives. The $19.6 million increase was primarily due to a $19.1 million increase in depreciation and amortization of solar energy systems and an $8.5 million increase in solar energy system portfolio maintenance costs primarily due to the increase in the number of solar energy systems placed in service. Additionally, warehouse, office and other building costs increased $4.6 million due to new warehouses opened in 2016 and the effect of a full year of expense for warehouses that were opened in the second half of 2015. These increases were partially offset by a $10.3 million decrease in compensation and benefits due to a 35% decrease in installation headcount and increased efficiencies in our installation processes, and a $2.9 million decrease in vehicle fleet costs.
Cost of Revenue—Solar Energy System and Product Sales. The $21.4 million increase reflected the increase in the volume of System Sales.
Operating Expenses
|
|
Year Ended December 31, |
|
|
$ Change |
|
||||||
|
|
2016 |
|
|
2015 |
|
|
2016 from 2015 |
|
|||
|
|
(In thousands) |
|
|||||||||
|
Operating expenses: |
|
|
|
|
|
|
|
|
|
|
|
|
Sales and marketing |
$ |
41,436 |
|
|
$ |
48,078 |
|
|
$ |
(6,642 |
) |
|
Research and development |
|
2,979 |
|
|
|
3,901 |
|
|
|
(922 |
) |
|
General and administrative |
|
81,802 |
|
|
|
92,664 |
|
|
|
(10,862 |
) |
|
Amortization of intangible assets |
|
901 |
|
|
|
13,172 |
|
|
|
(12,271 |
) |
|
Impairment of goodwill and intangible assets |
|
36,601 |
|
|
|
4,506 |
|
|
|
32,095 |
|
|
Total operating expenses |
$ |
163,719 |
|
|
$ |
162,321 |
|
|
$ |
1,398 |
|
52
Sales and Marketing Expense. The $6.6 million decrease was primarily due to a $7.8 million decrease in stock-based compensation. Stock-based compensation expense in 2015 was higher primarily due to the grant and vesting of shares issued to sales personnel under the Long-Term Incentive Plan, or LTIP, and the vesting of options due to a performance condition being met. Total stock-based compensation expense is adjusted for the majority of sales and marketing participants based on our stock price, which declined significantly from December 31, 2015 to December 31, 2016. Additionally, sales and marketing management costs decreased $0.8 million due to decreases in unrecovered employee advances. These decreases were partially offset by a $2.3 million increase in costs associated with customer cancellations.
Research and Development Expense. The $0.9 million decrease was primarily due to a $1.0 million decrease in stock-based compensation primarily driven by the forfeiture of unvested stock options for employees who left our company during 2016.
General and Administrative Expense. The $10.9 million decrease was primarily due to a $6.3 million decrease in stock-based compensation primarily due to performance options that vested in 2015 and the forfeiture of unvested stock options for executives who left our company in 2016. Additionally, professional fees related to initiating and servicing tax equity investment funds decreased $5.1 million as we were no longer subject to the advisory agreement with an affiliate of The Blackstone Group L.P., our Sponsor, in 2016. Legal and other fees related to the failed acquisition by SunEdison decreased $4.5 million and other professional fees decreased $2.7 million primarily due to decreased legal fees. Other administrative costs, including facility and information technology costs, new office equipment and business property tax expense decreased $0.9 million. These decreases were partially offset by a $5.4 million increase in compensation and benefits primarily related to corporate bonuses that were not accrued in 2015. Additionally, in 2016, $2.2 million in costs were incurred related to severance for senior management who left our company and other organizational changes and a $1.0 million fee was incurred to terminate and settle a commercial and industrial investment fund.
Amortization of Intangible Assets. The $12.3 million decrease was primarily due to a $12.8 million decrease in amortization related to our customer contracts intangible asset as it became fully amortized in 2015, which was partially offset by the amortization of other intangible assets.
Impairment of Goodwill and Intangible Assets. An impairment charge of $36.6 million was recorded in 2016 to write off the entire value of goodwill as it was deemed to be fully impaired during the year ended December 31, 2016. An impairment charge of $4.5 million was recorded in 2015 to write down the value of intangibles associated with two Solmetric products for which we ceased external sales.
Non-Operating Expenses
|
|
Year Ended December 31, |
|
|
$ Change |
|
||||||
|
|
2016 |
|
|
2015 |
|
|
2016 from 2015 |
|
|||
|
|
(In thousands) |
|
|||||||||
|
Interest expense |
$ |
34,008 |
|
|
$ |
12,568 |
|
|
$ |
21,440 |
|
|
Other income, net |
|
(1,437 |
) |
|
|
(154 |
) |
|
|
(1,283 |
) |
Interest Expense. Interest expense increased $21.4 million primarily due to the cost of financing additional borrowings year over year.
Other Income, Net. The $1.3 million increase in other income was primarily due to $1.6 million in gains related to the ineffective portions of our cash flow hedges that were recognized during the period.
Income Taxes
|
|
Year Ended December 31, |
|
|
$ Change |
|
||||||
|
|
2016 |
|
|
2015 |
|
|
2016 from 2015 |
|
|||
|
|
(In thousands) |
|
|||||||||
|
Income tax expense |
$ |
7,433 |
|
|
$ |
9,737 |
|
|
$ |
(2,304 |
) |
The $2.3 million decrease in income tax expense was primarily attributable to a net $26.7 million of higher tax credits due to a significantly higher number of solar energy systems that were not financed through tax equity funds and $2.0 million of lower non-controlling interests and redeemable non-controlling interests. These decreases in income tax expense were partially offset by $12.8 million associated with the goodwill impairment charge, $5.1 million of higher amortization related to the prepaid tax asset, $4.5 million due to lower losses before income taxes, and $4.2 million in a lower domestic production activities deduction.
53
Net Loss Attributable to Non-Controlling Interests and Redeemable Non-Controlling Interests
|
|
Year Ended December 31, |
|
|
$ Change |
|
||||||
|
|
2016 |
|
|
2015 |
|
|
2016 from 2015 |
|
|||
|
|
(In thousands) |
|
|||||||||
|
Net loss attributable to non-controlling interests and redeemable non-controlling interests |
$ |
(260,523 |
) |
|
$ |
(266,345 |
) |
|
$ |
5,822 |
|
Net loss attributable to non-controlling interests and redeemable non-controlling interests was allocated using the HLBV method. Generally, gains and losses that are allocated to the fund investors relate to hypothetical liquidation gains and losses resulting from differences between the net assets of the investment fund and the partners’ respective tax capital accounts in the investment fund. Losses allocated to the fund investors were also driven by a reduction in certain fund investors’ claims on net assets due to the agreement of the partnership to take accelerated tax depreciation, as well as the receipt of ITCs that were primarily allocated to fund investors.
Critical Accounting Policies and Estimates
Our discussion and analysis of our financial condition and results of operations are based upon our consolidated financial statements, which have been prepared in accordance with GAAP. GAAP requires us to make estimates and judgments that affect the reported amounts of assets, liabilities, revenue and expenses, cash flows and related footnote disclosures. We base our estimates on historical experience and on various other assumptions that we believe to be reasonable under the circumstances. Actual results may differ from these estimates. Our future consolidated financial statements will be affected to the extent that our actual results materially differ from these estimates.
We believe that the assumptions and estimates associated with ITCs, revenue recognition, solar energy systems, net, the impairment analysis of long-lived assets, stock-based compensation, the provision for income taxes, the valuation of derivative financial instruments, the recognition and measurement of loss contingencies, and non-controlling interests and redeemable non-controlling interests have the greatest potential impact on our consolidated financial statements. Therefore, we consider these to be our critical accounting policies and estimates.
Principles of Consolidation
We consider each of our investment funds to be a separate VIE. We use a qualitative approach in assessing the consolidation requirement for these VIEs. This approach focuses on determining whether we have the power to direct the activities of the VIE that most significantly affect the VIE’s economic performance and whether we have the obligation to absorb losses or the right to receive benefits that could potentially be significant to the VIE. All of these determinations involve significant management judgments. We have determined that we are the primary beneficiary in the operational VIEs in which we have an equity interest, which we consolidate. We evaluate our relationships with the VIEs on an ongoing basis to ensure that we continue to be the primary beneficiary. All intercompany transactions and balances have been eliminated in consolidation.
Investment Tax Credits
We apply for and receive ITCs under Section 48(a) of the Internal Revenue Code. The amount for the ITC is equal to 30% of the value of eligible solar property. We receive all ITCs for solar energy systems that are not sold to customers or placed in our investment funds. We receive minimal allocations of ITCs for solar energy systems placed in our investment funds as the majority of such credits are allocated to the fund investors. Some of our investment funds obligate us to make certain fund investors whole for losses that the investors may suffer in certain limited circumstances resulting from the disallowance or recapture of ITCs as a result of the Internal Revenue Service’s, or the IRS, assessment of the fair value of such systems. We have concluded that the likelihood of a recapture event is remote and consequently have not recorded any liability in the consolidated financial statements for any potential recapture exposure.
Revenue Recognition
We recognize revenue when all of the following criteria are met: (1) persuasive evidence of an arrangement exists, (2) delivery or performance has occurred, (3) the sales price is fixed or determinable and (4) collectability is reasonably assured. Our revenue is comprised of operating leases and incentives, and solar energy system and product sales. Operating leases and incentives revenue includes revenue associated with PPAs and Solar Leases, SREC sales, ITC revenue and rebate incentives. Solar energy system and product sales revenue includes System Sales, which may include structural upgrades included in sales contracts and SREC sales related to sold systems, and the sale of photovoltaic installation products. Revenue is recorded net of any sales tax collected.
54
Operating Leases and Incentives Revenue
Our most common revenue-generating activity consists of entering into PPAs with residential customers, under which the customer agrees to purchase all of the power generated by the solar energy system for the term of the contract, which is 20 years. The agreement includes a fixed price per kilowatt hour with a fixed annual price escalation percentage. Customers have not historically been charged for installation or activation of the solar energy system. For all PPAs, we assess the probability of collectability on a customer-by-customer basis through a credit review process that evaluates their financial condition and ability to pay.
We have determined that PPAs should be accounted for as operating leases after evaluating and concluding that none of the following capitalized lease classification criteria are met: no transfer of ownership or bargain purchase option exists at the end of the lease, the lease term is not greater than 75% of the useful life or the present value of minimum lease payments does not exceed 90% of the fair value at lease inception. As PPA customer payments are dependent on power generation, they are considered contingent rentals and are excluded from future minimum annual lease payments. PPA revenue is recognized based on the actual amount of power generated at rates specified under the contracts, assuming the other revenue recognition criteria discussed above are met.
We also offer solar energy systems to customers pursuant to Solar Leases in certain markets. The customer agreements are structured as legal-form leases due to local regulations that can be read to prohibit the sale of electricity pursuant to our standard PPA. Pursuant to Solar Leases, the customers’ monthly payments are a pre-determined amount calculated based on the expected solar energy generation by the system and include an annual fixed percentage price escalation over the period of the contracts, which is 20 years. We provide our Solar Lease customers a performance guarantee, under which we agree to make a payment at the end of each year to the customer if the solar energy systems do not meet a guaranteed production level in the prior 12-month period.
At times, we make nominal cash payments to customers in order to facilitate the finalization of long-term customer contracts and the installation of related solar energy systems. These cash payments are considered lease incentives that are deferred and recognized over the term of the contract as a reduction of revenue.
The guaranteed production levels have varying terms. Dependent on the level of the production guarantee, we either (1) recognize the monthly lease payments as revenue and record a solar energy performance guarantee liability due to the contingent nature of the lease payments, or (2) straight-line the contracted payments over the initial term of the lease. Solar energy performance guarantee liabilities were $0.1 million and a de minimis amount as of December 31, 2017 and 2016.
We apply for and receive SRECs in certain jurisdictions for power generated by solar energy systems we have installed. When SRECs are granted, we typically sell them to other companies directly, or to brokers, to assist them in meeting their own mandatory emission reduction or conservation requirements. We recognize revenue related to the sale of these certificates upon delivery, assuming the other revenue recognition criteria discussed above are met.
Lease Pass-Through Arrangement
In 2015, a lease pass-through fund arrangement became operational under which we contributed solar energy systems and the investor contributed cash. Contemporaneously, one of our wholly owned subsidiaries entered into a master lease arrangement to lease the solar energy systems and the associated PPAs or Solar Leases to the fund investor. Our wholly owned subsidiary made a tax election to pass the ITCs related to the solar energy systems through to the fund investor, who as the legal lessee of the property is allowed to claim the ITCs under Section 50(d)(5) of the Internal Revenue Code and the related regulations.
Under this arrangement, the fund investor made a large upfront lease payment to our wholly owned subsidiary and is obligated to make subsequent periodic payments. We allocated a portion of the aggregate payments received from the fund investor to the estimated fair value of the assigned ITCs. The fair value of the ITCs was estimated by multiplying the ITC rate of 30% by the fair value of the systems that were sold to the lease pass-through fund. The fair value of the systems was determined by independent appraisals. Our wholly owned subsidiary has an obligation to ensure the solar energy system is in service and operational for a term of five years to avoid any recapture of the ITCs. Accordingly, we recognize ITC revenue as the recapture provisions lapse assuming all other revenue recognition criteria have been met. The amounts allocated to the ITCs were initially recorded as deferred revenue in the consolidated balance sheet, and subsequently, one-fifth of the amounts allocated to the ITCs is recognized as operating leases and incentives revenue in the consolidated statements of operations based on the anniversary of each solar energy system’s placed in service date.
55
System Sale revenue is recognized when the solar energy system is interconnected to the local power grid and granted permission to operate, assuming all other revenue recognition criteria are met. With respect to System Sales where customers obtain third-party financing, we incur a lender fee, which is recognized as a direct reduction of the recognized revenue related to the sale. Additionally, customers who finance System Sales may require structural upgrades to facilitate the installation of the system which we provide for an additional fee. This revenue is recognized at the point the structural upgrade work is completed, assuming all other revenue recognition criteria are met.
In connection with System Sales, we are obligated to assist with processing and submitting customer claims on the manufacturer warranties, provide routine system monitoring services on sold systems and notify the customer of any problems. While the value and nature of these services is not significant, we consider these services to have standalone value to the customer. Therefore, we allocate a portion of the contract consideration to these administrative and maintenance services based on the relative selling price method and we recognize the deferred revenue over the contractual service term.
Photovoltaic Installation Products
We also recognize revenue from the sale of photovoltaic installation products. These sales are standalone and are recognized at the time of product shipment to the customer, assuming the remaining revenue recognition criteria have been met.
Solar Energy Systems, Net
Solar energy systems are stated at cost, less accumulated depreciation and amortization. Solar energy systems, net is comprised of system equipment costs and initial direct costs related to solar energy systems subject to PPAs or Solar Leases. Systems that are sold to customers through System Sales are not part of solar energy systems, net. System equipment costs include components such as solar panels, inverters, racking systems and other electrical equipment, as well as costs for design and installation activities once a long-term customer contract has been executed. Initial direct costs related to solar energy systems consist of sales commissions and other direct customer acquisition expenses. System equipment costs and initial direct costs are capitalized and recorded within solar energy systems, net. This accounting treatment results in decreased depreciation of such solar energy systems over their useful lives.
Depreciation and amortization expense is calculated using the straight-line method over the estimated useful lives of the respective assets as follows:
|
|
|
|
Useful Lives |
|
System equipment costs |
|
|
30 years |
|
Initial direct costs related to solar energy systems |
|
|
Lease term (20 years) |
We commence depreciation of our solar energy systems once the respective systems have been installed, interconnected to the power grid and received permission to operate. The determination of the useful lives of assets included within solar energy systems involves significant management judgment.
Impairment of Long-Lived Assets
The carrying amounts of our long-lived assets, including solar energy systems, property and equipment and finite-lived intangible assets are periodically reviewed for impairment whenever events or changes in circumstances indicate that the carrying value of these assets may not be recoverable or that the useful life is shorter than originally estimated. Factors that we consider in deciding when to perform an impairment review include significant negative industry or economic trends, and significant changes or planned changes in our use of the assets. Recoverability of these assets is measured by comparison of the carrying amount of each asset to the future undiscounted cash flows the asset is expected to generate over its remaining life. If the asset is considered to be impaired, the amount of any impairment is measured as the difference between the carrying value and the fair value of the impaired asset. If the useful life is shorter than originally estimated, we amortize the remaining carrying value over the new shorter useful life.
Goodwill Impairment Analysis
Goodwill represents the excess of the purchase price of an acquired business over the fair value of the net tangible and intangible assets acquired. During the first quarter of 2016, our market capitalization decreased significantly from $1.0 billion as of December 31, 2015 to $283 million as of March 31, 2016. We considered this significant decrease in market capitalization to be an indicator of impairment and we performed a goodwill impairment test as of March 31, 2016. The impairment test determined that there was no implied value of goodwill, which resulted in an impairment charge of $36.6 million, which was recorded in impairment of goodwill and intangible assets for the year ended December 31, 2016.
56
Prior to goodwill being impaired in 2016, we performed our annual impairment test of goodwill as of October 1st of each fiscal year or whenever events or circumstances changed that would indicate that goodwill might be impaired. In conducting the impairment test, we first assessed qualitative factors to determine whether it was more likely than not that the fair value of a reporting unit was less than its carrying amount as a basis for determining whether it was necessary to perform the two-step goodwill impairment test. If the qualitative step was not passed, we performed a two-step impairment test whereby in the first step, we would compare the fair value of the reporting unit with its carrying amount. If the carrying amount exceeded its fair value, we performed the second step of the goodwill impairment test to determine the amount of impairment. The second step, measuring the impairment loss, compared the implied fair value of the goodwill with the carrying value of the goodwill. Any excess of the goodwill carrying value over the implied fair value would be recognized as an impairment loss.
Stock-Based Compensation
Stock-based compensation expense for equity instruments issued to employees is measured based on the grant-date fair value of the awards. The fair value of each restricted stock unit award and performance share unit award is determined as the closing price of our stock on the date of grant. The fair value of each time-based employee stock option is estimated on the date of grant using the Black-Scholes-Merton stock option pricing valuation model. We recognize compensation costs using the accelerated attribution method for all employee stock-based compensation awards over the requisite service period of the awards, which is generally the awards’ vesting period.
Stock-based compensation expense for equity instruments issued to non-employees is recognized based on the estimated fair value of the equity instrument. The fair value of the non-employee awards is subject to remeasurement at each reporting period until services required under the arrangement are completed, which is the vesting date.
Use of the Black-Scholes-Merton option-pricing model requires the input of highly subjective assumptions, including (1) the expected term of the option, (2) the expected volatility of the price of our common stock, (3) risk-free interest rates and (4) the expected dividend yield of our common stock. The assumptions used in the option-pricing model represent our best estimates. These estimates involve inherent uncertainties and the application of our judgment. If factors change and different assumptions are used, our stock-based compensation expense could be materially different in the future.
Effective January 1, 2017, we adopted Accounting Standards Update, or ASU, 2016-09 and ASU 2017-11. ASU 2016-09 simplifies several aspects of the accounting for share-based payment transactions. The adoption of ASU 2016-09 resulted in a net $1.2 million reduction to retained earnings as of January 1, 2017. ASU 2017-09 clarifies when changes to equity awards require the use of modification accounting guidance. This guidance was adopted prospectively and no prior periods were adjusted. See Note 2—Summary of Significant Accounting Policies for additional details on these ASUs.
Provision for Income Taxes
We account for income taxes under an asset and liability approach. Deferred income taxes are classified as long-term and reflect the impact of temporary differences between assets and liabilities recognized for financial reporting purposes and the amounts recognized for income tax reporting purposes, net operating loss carryforwards and other tax credits measured by applying currently enacted tax laws. A valuation allowance is provided when necessary to reduce deferred tax assets to an amount that is more likely than not to be realized. As required by ASC 740, we recognize the effect of tax rate and law changes on deferred taxes in the reporting period in which the legislation is enacted.
We recognize sales of solar energy systems to substantially all of the investment funds for income tax purposes. As the investment funds are consolidated by us, the gain on the sale of the solar energy systems is not recognized in the consolidated financial statements. However, this gain is recognized for tax reporting purposes. Since these transactions are intercompany sales for GAAP purposes, any tax expense incurred related to these intercompany sales is deferred and recorded as a prepaid tax asset and amortized over the estimated useful life of the underlying solar energy systems, which has been estimated to be 30 years.
We determine whether a tax position is more likely than not to be sustained upon examination, including resolution of any related appeals or litigation processes, based on the technical merits of the position. We use a two-step approach to recognizing and measuring uncertain tax positions. The first step is to evaluate the tax position for recognition by determining if the weight of available evidence indicates that it is more likely than not that the position will be sustained upon tax authority examination, including resolution of related appeals or litigation processes, if any. The second step is to measure the tax benefit as the largest amount that is more than 50% likely of being realized upon ultimate settlement.
Our policy is to include interest and penalties related to unrecognized tax benefits, if any, within income tax (benefit) expense.
57
Derivative Financial Instruments
We maintain interest rate swaps as required by the terms of our debt agreements. The interest rate swaps related to the 2016 Term Loan Facility are designated as cash flow hedges. Changes in fair value for the effective portions of these cash flow hedges are recorded in other comprehensive (loss) income and will subsequently be reclassified to interest expense over the life of the related debt facilities as interest payments are made. Changes in fair value for the ineffective portions of the cash flow hedges are recognized in other expense (income), net. As interest payments for the associated debt agreements and derivatives are recognized, we include the effect of these payments in cash flows from operating activities within the consolidated statements of cash flows. The interest rate swaps related to the Aggregation Facility are not designated as hedge instruments and any changes in fair value are accounted for in other expense (income), net. Derivative instruments may be offset under their master netting arrangements.
Loss Contingencies
We are subject to the possibility of various loss contingencies arising in the ordinary course of business. We consider the likelihood of loss or impairment of an asset, or the incurrence of a liability, as well as our ability to reasonably estimate the amount of loss, in determining loss contingencies. We accrue an estimated loss contingency when it is probable that an asset has been impaired or a liability has been incurred and the amount of loss can be reasonably estimated. We regularly evaluate current information available to determine whether an accrual is required, an accrual should be adjusted or a range of possible loss should be disclosed.
Non-Controlling Interests and Redeemable Non-Controlling Interests
Non-controlling interests and redeemable non-controlling interests represent fund investors’ interests in the net assets of certain consolidated investment funds that we have entered into in order to finance the costs of solar energy systems under long-term customer contracts. We have determined that the provisions in the contractual arrangements of the investment funds represent substantive profit-sharing arrangements, which gives rise to the non-controlling interests and redeemable non-controlling interests. We have further determined that the appropriate methodology for attributing income and loss to the non-controlling interests and redeemable non-controlling interests each period is a balance sheet approach using the HLBV method. Under the HLBV method, the amounts of income and loss attributed to the non-controlling interests and redeemable non-controlling interests in the consolidated statements of operations reflect changes in the amounts the fund investors would hypothetically receive at each balance sheet date under the liquidation provisions of the contractual agreements of these structures, assuming the net assets of these funding structures were liquidated at recorded amounts. The fund investors’ non-controlling interest in the results of operations of these funding structures is determined as the difference in the non-controlling interests’ and redeemable non-controlling interests’ claims under the HLBV method at the start and end of each reporting period, after considering any capital transactions, such as contributions or distributions, between the fund and the fund investors.
Attributing income and loss to the non-controlling interests and redeemable non-controlling interests under the HLBV method requires the use of significant assumptions and estimates to calculate the amounts that fund investors would receive upon a hypothetical liquidation. Changes in these assumptions and estimates can have a significant impact on the amount that fund investors would receive upon a hypothetical liquidation. The use of the HLBV methodology to allocate income to the non-controlling and redeemable non-controlling interest holders may create volatility in our consolidated statements of operations as the application of HLBV can drive changes in net income available and loss attributable to non-controlling interests and redeemable non-controlling interests from quarter to quarter.
We classify certain non-controlling interests with redemption features that are not solely within our control outside of permanent equity on our consolidated balance sheets. Estimated redemption value is calculated as the discounted cash flows subsequent to the expected flip date of the respective investment funds. Redeemable non-controlling interests are reported using the greater of their carrying value at each reporting date as determined by the HLBV method or their estimated redemption value in each reporting period. Estimating the redemption value of the redeemable non-controlling interests requires the use of significant assumptions and estimates. Changes in these assumptions and estimates can have a significant impact on the calculation of the redemption value.
Quarterly Results of Operations
The following table presents our unaudited consolidated statement of operations for each of the eight quarters in the 24-month period ended December 31, 2017. Our consolidated statement of operations for each of these quarters have been prepared on a basis consistent with our audited annual consolidated financial statements included elsewhere in this report and, in the opinion of management, include all adjustments necessary for the fair presentation of our consolidated results of operations for these quarters. You should read this information together with our consolidated financial statements and the related notes included elsewhere in this report. The results of operations for any quarter are not necessarily indicative of the results of operations for any future period.
58
|
|
Three Months Ended |
|
|||||||||||||||||||||||
|
|
|
December 31, |
|
September 30, |
|
June 30, |
|
March 31, |
|
December 31, |
|
September 30, |
|
June 30, |
|
March 31, |
|
||||||||
|
|
|
2017 |
|
2017 |
|
2017 |
|
2017 |
|
2016 |
|
2016 |
|
2016 |
|
2016 |
|
||||||||
|
|
|
(In thousands except per share data) |
|
||||||||||||||||||||||
|
Revenue: |
|
|
|
|
|
|
|
|
|
|
|
|
|
|
|
|
|
|
|
|
|
|
|
|
|
|
Operating leases and incentives |
|
$ |
31,151 |
|
$ |
45,909 |
|
$ |
43,413 |
|
$ |
30,389 |
|
$ |
25,320 |
|
$ |
33,394 |
|
$ |
30,061 |
|
$ |
16,578 |
|
|
Solar energy system and product sales |
|
|
35,629 |
|
|
29,230 |
|
|
29,582 |
|
|
22,725 |
|
|
16,451 |
|
|
7,868 |
|
|
4,843 |
|
|
652 |
|
|
Total revenue |
|
|
66,780 |
|
|
75,139 |
|
|
72,995 |
|
|
53,114 |
|
|
41,771 |
|
|
41,262 |
|
|
34,904 |
|
|
17,230 |
|
|
Cost of revenue: |
|
|
|
|
|
|
|
|
|
|
|
|
|
|
|
|
|
|
|
|
|
|
|
|
|
|
Cost of revenue—operating leases and incentives |
|
|
37,741 |
|
|
34,731 |
|
|
33,763 |
|
|
35,070 |
|
|
35,230 |
|
|
39,268 |
|
|
38,538 |
|
|
37,760 |
|
|
Cost of revenue—solar energy system and product sales |
|
|
25,313 |
|
|
22,168 |
|
|
22,831 |
|
|
18,665 |
|
|
12,579 |
|
|
6,468 |
|
|
3,716 |
|
|
422 |
|
|
Total cost of revenue |
|
|
63,054 |
|
|
56,899 |
|
|
56,594 |
|
|
53,735 |
|
|
47,809 |
|
|
45,736 |
|
|
42,254 |
|
|
38,182 |
|
|
Gross profit (loss) |
|
|
3,726 |
|
|
18,240 |
|
|
16,401 |
|
|
(621 |
) |
|
(6,038 |
) |
|
(4,474 |
) |
|
(7,350 |
) |
|
(20,952 |
) |
|
Operating expenses: |
|
|
|
|
|
|
|
|
|
|
|
|
|
|
|
|
|
|
|
|
|
|
|
|
|
|
Sales and marketing |
|
|
10,659 |
|
|
9,808 |
|
|
9,411 |
|
|
8,818 |
|
|
9,358 |
|
|
8,617 |
|
|
10,813 |
|
|
12,648 |
|
|
Research and development |
|
|
653 |
|
|
896 |
|
|
895 |
|
|
896 |
|
|
761 |
|
|
842 |
|
|
144 |
|
|
1,232 |
|
|
General and administrative |
|
|
19,140 |
|
|
19,379 |
|
|
20,301 |
|
|
20,579 |
|
|
21,796 |
|
|
19,022 |
|
|
18,064 |
|
|
22,920 |
|
|
Amortization of intangible assets |
|
|
140 |
|
|
139 |
|
|
139 |
|
|
140 |
|
|
139 |
|
|
342 |
|
|
155 |
|
|
265 |
|
|
Impairment of goodwill and intangible assets |
|
|
— |
|
|
— |
|
|
— |
|
|
— |
|
|
— |
|
|
— |
|
|
— |
|
|
36,601 |
|
|
Total operating expenses |
|
|
30,592 |
|
|
30,222 |
|
|
30,746 |
|
|
30,433 |
|
|
32,054 |
|
|
28,823 |
|
|
29,176 |
|
|
73,666 |
|
|
Loss from operations |
|
|
(26,866 |
) |
|
(11,982 |
) |
|
(14,345 |
) |
|
(31,054 |
) |
|
(38,092 |
) |
|
(33,297 |
) |
|
(36,526 |
) |
|
(94,618 |
) |
|
Interest expense |
|
|
16,557 |
|
|
16,148 |
|
|
16,838 |
|
|
14,721 |
|
|
11,469 |
|
|
9,361 |
|
|
7,413 |
|
|
5,765 |
|
|
Other (income) expense |
|
|
(834 |
) |
|
195 |
|
|
715 |
|
|
276 |
|
|
(1,342 |
) |
|
(434 |
) |
|
309 |
|
|
30 |
|
|
Loss before income taxes |
|
|
(42,589 |
) |
|
(28,325 |
) |
|
(31,898 |
) |
|
(46,051 |
) |
|
(48,219 |
) |
|
(42,224 |
) |
|
(44,248 |
) |
|
(100,413 |
) |
|
Income tax (benefit) expense |
|
|
(181,265 |
) |
|
9,375 |
|
|
5,156 |
|
|
9,401 |
|
|
(2,812 |
) |
|
(2,959 |
) |
|
8,055 |
|
|
5,149 |
|
|
Net income (loss) |
|
|
138,676 |
|
|
(37,700 |
) |
|
(37,054 |
) |
|
(55,452 |
) |
|
(45,407 |
) |
|
(39,265 |
) |
|
(52,303 |
) |
|
(105,562 |
) |
|
Net loss attributable to non-controlling interests and redeemable non-controlling interests |
|
|
(45,245 |
) |
|
(44,605 |
) |
|
(42,034 |
) |
|
(68,744 |
) |
|
(65,545 |
) |
|
(55,961 |
) |
|
(64,674 |
) |
|
(74,343 |
) |
|
Net income available (loss attributable) to common stockholders |
|
$ |
183,921 |
|
$ |
6,905 |
|
$ |
4,980 |
|
$ |
13,292 |
|
$ |
20,138 |
|
$ |
16,696 |
|
$ |
12,371 |
|
$ |
(31,219 |
) |
|
Net income available (loss attributable) per share to common stockholders: |
|
|
|
|
|
|
|
|
|
|
|
|
|
|
|
|
|
|
|
|
|
|
|
|
|
|
Basic |
|
$ |
1.60 |
|
$ |
0.06 |
|
$ |
0.04 |
|
$ |
0.12 |
|
$ |
0.18 |
|
$ |
0.15 |
|
$ |
0.12 |
|
$ |
(0.29 |
) |
|
Diluted |
|
$ |
1.54 |
|
$ |
0.06 |
|
$ |
0.04 |
|
$ |
0.11 |
|
$ |
0.18 |
|
$ |
0.15 |
|
$ |
0.11 |
|
$ |
(0.29 |
) |
|
Weighted-average shares used in computing net income available (loss attributable) per share to common stockholders: |
|
|
|
|
|
|
|
|
|
|
|
|
|
|
|
|
|
|
|
|
|
|
|
|
|
|
Basic |
|
|
114,847 |
|
|
114,505 |
|
|
112,351 |
|
|
110,765 |
|
|
110,198 |
|
|
108,692 |
|
|
107,226 |
|
|
106,619 |
|
|
Diluted |
|
|
119,578 |
|
|
119,465 |
|
|
117,570 |
|
|
116,398 |
|
|
114,898 |
|
|
113,344 |
|
|
111,380 |
|
|
106,619 |
|
Quarterly Trends
Revenue
Revenue from operating leases and incentives increased in 2017 due to increases in the cumulative number of solar energy systems placed in service.
Revenue from solar energy system and product sales increased significantly through 2017 due to our continued emphasis on System Sales through cash and third-party loan products.
Operating Expenses
Cost of revenue—solar energy system and products sales increased significantly through 2017 in line with our increased revenue from System Sales in the period.
In impairment of goodwill and intangible assets, we incurred a $36.6 million impairment charge in the first quarter of 2016 as we determined that our goodwill balance was impaired.
59
Interest expense has increased in 2017 primarily due to additional borrowings incurred to support our growth and increases in floating interest rates.
Other (income) expense fluctuates from quarter to quarter due to changes in the fair value of the ineffective portions of our cash flow hedges and our interest rate swaps not designated as hedge instruments.
Income tax (benefit) expense
There was a large one-time provisional tax benefit in the fourth quarter of 2017 due to the implementation of the Tax Cuts and Jobs Act which was signed into law on December 22, 2017.
Seasonality
We experience seasonal fluctuations in our operations. For example, the amount of revenue we recognize in a given period from PPAs is dependent in part on the amount of energy generated by solar energy systems under such contracts. As a result, operating leases and incentives revenue is impacted by seasonally shorter daylight hours in winter months. In addition, our ability to install solar energy systems is impacted by weather. For example, we have limited ability to install solar energy systems during the winter months in the Northeastern United States and other areas where winter weather is impactful. Such delays can impact the timing of when we can install and begin to generate revenue from solar energy systems. However, the true extent of these fluctuations may have been masked by our historical growth rates and thus may not be readily apparent from our historical operating results and may be difficult to predict. As such, our historical operating results may not be indicative of future performance.
Liquidity and Capital Resources
As of December 31, 2017, we had cash and cash equivalents of $108.5 million, which consisted principally of cash and time deposits with high-credit-quality financial institutions. As discussed in Note 10—Debt Obligations and Note 12—Investment Funds, we do not have full access to a portion of our cash and cash equivalents. We finance our operations primarily from investment fund arrangements that we have formed with fund investors, from borrowings, and from cash inflows from operations. In February 2018, our wholly owned subsidiary entered into an investment fund arrangement with an existing fund investor. The total commitment under the investment fund arrangement is $75.0 million. In addition, subsequent to quarter end, we entered into non-binding letters of intent for five new tax equity investment funds for an aggregate $401 million. If we are unable to consummate these investments or establish the other investment funds that we intend to pursue during this period, we will be required to obtain additional financing in order to continue to grow our business or finance the deployment of solar energy systems using cash on hand until such additional financing has been secured.
Our principal uses of cash are funding our operations, including the costs of acquisition and installation of solar energy systems, working capital requirements and the satisfaction of our obligations under our debt instruments. Our business model requires substantial outside financing arrangements to grow the business and facilitate the deployment of additional solar energy systems. While there can be no assurances, we anticipate raising additional required capital from new and existing fund investors, additional borrowings, cash from System Sales and other potential financing vehicles.
We may seek to raise financing through the sale of equity, equity-linked securities, additional borrowings or other financing vehicles. Additional equity or equity-linked financing may be dilutive to our stockholders. If we raise funding through additional borrowings, such borrowings would have rights that are senior to holders of our equity securities and could contain covenants that restrict our operations. We believe our cash and cash equivalents, including our investment fund commitments, projected investment fund contributions and our current debt facilities as further described below, in addition to financing that we may obtain from other sources, including our financial sponsors, will be sufficient to meet our anticipated cash needs for at least the next 12 months. However, if we are unable to secure additional financing when needed, or upon desirable terms, we may be unable to finance installation of our customers’ systems in a manner consistent with our past performance, our cost of capital could increase, or we may be required to significantly reduce the scope of our operations, any of which would have a material adverse effect on our business, financial condition, results of operations and prospects. In addition, our investment funds and debt instruments impose restrictions on our ability to draw on financing commitments. If we are unable to satisfy such conditions, we may incur penalties for non-performance under certain investment funds, experience installation delays, or be unable to make installations in accordance with our plans or at all. Any of these factors could also impact customer satisfaction, our business, operating results, prospects and financial condition. While we believe additional financing is available and will continue to be available to support our current level of operations, we believe we have the ability and intent to reduce operations to the level of available financial resources for at least the next 12 months, if necessary.
60
Investment Fund Commitments
As of February 28, 2018, we had raised 22 investment funds to which investors such as banks and other large financial investors have committed to invest approximately $1.5 billion. The undrawn committed capital for these funds as of February 28, 2018 is approximately $85 million, which we estimate will fund approximately 44 megawatts of future deployments.
Debt Instruments
Debt obligations consisted of the following as of December 31, 2017 (in thousands, except interest rates):
|
|
Principal |
|
|
Unused |
|
|
|
|
|
|
|
||
|
|
Borrowings |
|
|
Borrowing |
|
|
Interest |
|
|
Maturity |
|||
|
|
Outstanding |
|
|
Capacity |
|
|
Rate |
|
|
Date |
|||
|
2017 Term loan facility |
$ |
197,764 |
|
|
$ |
— |
|
|
|
6.0 |
% |
|
January 2035 |
|
2016 Term loan facility(1) |
|
287,919 |
|
|
|
— |
|
|
|
4.3 |
|
|
August 2021 |
|
Subordinated HoldCo facility |
|
197,625 |
|
|
|
— |
|
|
|
9.3 |
|
|
March 2020 |
|
Credit agreement |
|
1,299 |
|
|
|
— |
|
|
|
6.5 |
|
|
February 2023 |
|
Revolving lines of credit |
|
|
|
|
|
|
|
|
|
|
|
|
|
|
Aggregation facility(2) |
|
135,000 |
|
|
|
240,000 |
|
|
|
4.7 |
|
|
September 2020 |
|
Working capital facility(3) |
|
136,500 |
|
|
|
— |
|
|
|
4.8 |
|
|
March 2020 |
|
Total debt |
$ |
956,107 |
|
|
$ |
240,000 |
|
|
|
|
|
|
|
|
(1) |
The interest rate of this facility is partially hedged to an effective interest rate of 4.0% for $260.9 million of the principal borrowings outstanding. See Note 11—Derivative Financial Instruments. |
|
(2) |
The Aggregation facility was amended in March 2017. See Note 10—Debt Obligations. |
|
(3) |
Facility is recourse debt, which refers to debt that is collateralized by our general assets. All of our other debt obligations are non-recourse, which refers to debt that is only collateralized by specified assets or our subsidiaries. |
See Note 10—Debt Obligations for additional details regarding the debt facilities outstanding at December 31, 2017.
Revenue from Operations
In the year ended December 31, 2017, we generated $150.9 million in revenue from operating leases and incentives, which approximates cash inflow with the exception of $7.8 million of operating lease revenue related to ITCs in our lease pass-through fund. Cash related to our System Sales is generally received prior to revenue recognition and during 2017 we received $119.8 million related to System Sales. The cash from our revenue partially offsets the cash used in operations for the period.
Uses of Funds
Our principal uses of cash are funding our operations, including the costs of acquisition and installation of solar energy systems, satisfaction of our obligations under our debt instruments and other working capital requirements. From time to time, we also reimburse portions of fund investors’ capital as a result of delays in the installation process and interconnection to the power grid of solar energy systems and other factors. We expect our capital expenditures to continue to increase as we continue to install additional solar energy systems. We will need to raise financing to support our operations, and such financing may not be available to us on acceptable terms, or at all.
Historical Cash Flows
The following table summarizes our cash flows for the periods indicated:
|
|
Year Ended December 31, |
|
|||||||||
|
|
2017 |
|
|
2016 |
|
|
2015 |
|
|||
|
Net cash (used in) provided by: |
(In thousands) |
|
|||||||||
|
Operating activities |
$ |
(33,854 |
) |
|
$ |
(165,690 |
) |
|
$ |
(189,244 |
) |
|
Investing activities |
|
(290,808 |
) |
|
|
(414,447 |
) |
|
|
(556,446 |
) |
|
Financing activities |
|
336,528 |
|
|
|
584,510 |
|
|
|
576,254 |
|
|
Net increase (decrease) in cash and cash equivalents |
$ |
11,866 |
|
|
$ |
4,373 |
|
|
$ |
(169,436 |
) |
61
In 2017, we had a net cash outflow from operations of $33.9 million. This outflow was primarily due to an $86.4 million increase in prepaid tax assets. This outflow was partially offset by cash inflows of $41.8 million from our net income excluding noncash and non-operating items and $10.7 million from changes in working capital.
Investing Activities
In 2017, we used $290.8 million in investing activities primarily due to $276.7 million in costs associated with the design, acquisition and installation of solar energy systems and a $19.6 million increase to restricted cash and cash equivalents due primarily to the requirements of the 2017 Term Loan Facility. These outflows were partially offset by $3.7 million in proceeds from state tax credits.
Financing Activities
In 2017, we generated $336.5 million from financing activities, of which $356.8 million was received in proceeds from long-term debt and $213.7 million was received in proceeds from investments by non-controlling interests and redeemable non-controlling interests into our investment funds. These proceeds were partially offset by repayments of long-term debt of $172.5 million, distributions to non-controlling interests and redeemable non-controlling interests of $47.3 million, and payments for debt issuance costs and deferred offering costs of $13.9 million.
Contractual Obligations
Our contractual commitments and obligations were as follows as of December 31, 2017:
|
|
Payments Due by Period(1) |
|
|||||||||||||||||
|
|
Less than |
|
|
|
|
|
|
|
|
|
|
More than |
|
|
|
|
|
||
|
|
1 Year |
|
|
1-3 Years |
|
|
3-5 Years |
|
|
5 Years |
|
|
Total |
|
|||||
|
|
(In thousands) |
|
|||||||||||||||||
|
Long-term debt |
$ |
13,939 |
|
|
$ |
491,052 |
|
|
$ |
283,876 |
|
|
$ |
167,240 |
|
|
$ |
956,107 |
|
|
Interest payments related to long-term debt(2) |
|
54,611 |
|
|
|
86,841 |
|
|
|
28,233 |
|
|
|
69,434 |
|
|
|
239,119 |
|
|
Distributions payable to non-controlling interests and redeemable non-controlling interests(3) |
|
16,437 |
|
|
|
— |
|
|
|
— |
|
|
|
— |
|
|
|
16,437 |
|
|
Capital lease obligations and interest |
|
4,457 |
|
|
|
1,687 |
|
|
|
— |
|
|
|
— |
|
|
|
6,144 |
|
|
Operating lease obligations |
|
11,161 |
|
|
|
15,616 |
|
|
|
18,543 |
|
|
|
73,090 |
|
|
|
118,410 |
|
|
Total |
$ |
100,605 |
|
|
$ |
595,196 |
|
|
$ |
330,652 |
|
|
$ |
309,764 |
|
|
$ |
1,336,217 |
|
|
(1) |
Does not include amounts related to redeemable put options held by fund investors. The redemption price for the fund investors’ interest in the respective fund is equal to the sum of: (a) any unpaid, accrued priority return, and (i) the greater of: (x) a fixed price and (b) the fair market value of such interest at the date the option is exercised. Due to uncertainties associated with estimating the timing and amount of the redemption price, we cannot determine the potential future payments that we could have to make under these redemption options. For additional information regarding the redeemable put options, see Note 13—Redeemable Non-Controlling Interests and Equity and Preferred Stock to our consolidated financial statements. As of December 31, 2017, all fund investors have contributed an aggregate of $1,264.6 million into the funds. For additional information regarding our investment funds, see Note 12—Investment Funds to our consolidated financial statements. |
|
(2) |
Interest payments related to long-term debt are calculated and estimated for the periods presented based on the amount of debt outstanding and the interest rates as of December 31, 2017, given our debt is primarily at floating interest rates. |
|
(3) |
Includes $9.7 million in accrued distributions to reimburse fund investors in order to true up the investors’ expected rate of return primarily due to a delay in solar energy systems being interconnected to the power grid. However, does not include any other potential contractual obligations that may arise as a result of the contractual guarantees we have made with certain investors in our investment funds. The amounts of any potential payments we may be required to make depend on the amount and timing of future distributions to the relevant fund investors and the ITCs that accrue to such investors from the funds’ activities. Due to uncertainties associated with estimating the timing and amounts of distributions and likelihood of an event that may trigger repayment of any forfeiture or recapture of ITCs to such investors, we cannot determine the potential maximum future payments that we could have to make under these guarantees. As a result of these guarantees, as of December 31, 2017, we were required to hold a minimum balance of $10.0 million in the aggregate, which is classified as restricted cash and cash equivalents on our consolidated balance sheet. For additional information, see Note 12—Investment Funds to our consolidated financial statements. |
Off-Balance Sheet Arrangements
We include in our consolidated financial statements all assets and liabilities and results of operations of investment fund arrangements that we have entered into. We do not have any off-balance sheet arrangements.
62
Recent Accounting Pronouncements
For a description of recent accounting pronouncements that will impact us, see Note 2—Summary of Significant Accounting Policies.
Emerging Growth Company Status
Section 107 of the JOBS Act provides that an “emerging growth company” can take advantage of the extended transition period provided in Section 7(a)(2)(B) of the Securities Act for complying with new or revised accounting standards. In other words, an “emerging growth company” can delay the adoption of certain accounting standards until those standards would otherwise apply to private companies. We have irrevocably elected not to avail ourselves of this exemption from new or revised accounting standards and, therefore, we will be subject to the same new or revised accounting standards as other public companies that are not “emerging growth companies.”
Item 7A. Quantitative and Qualitative Disclosures About Market Risk.
Our exposure to market risk for changes in interest rates relates primarily to our cash and cash equivalents and our indebtedness.
As of December 31, 2017, we had cash and cash equivalents of $108.5 million. Our cash equivalents are time deposits with maturities of three months or less at the time of purchase. Our primary exposure to market risk on these funds is interest income sensitivity, which is affected by changes in the general level of the interest rates in the United States. However, because of the short-term nature of the instruments in our portfolio, a sudden change in market interest rates would not be expected to have a material impact on our consolidated financial statements.
As of December 31, 2017, interest on our floating-rate debt facilities accrued at a weighted-average rate of approximately 6.6%. A hypothetical 10% increase in the interest rates on our floating-rate debt facilities would have increased our interest expense by approximately $3.3 million for the year ended December 31, 2017.
All of our operations are in the United States and all purchases of our solar energy system components are denominated in U.S. dollars. However, our suppliers often incur a significant amount of their costs by purchasing raw materials and generating operating expenses in foreign currencies. If the value of the U.S. dollar depreciates significantly or for a prolonged period of time against these currencies, our suppliers may raise the prices they charge us, which could harm our financial results.
63
Item 8. Financial Statements and Supplementary Data.
INDEX TO CONSOLIDATED FINANCIAL STATEMENTS
|
|
|
Page |
|
|
|
|
|
|
65 |
|
|
|
66 |
|
|
|
67 |
|
|
|
68 |
|
|
Consolidated Statements of Redeemable Non-Controlling Interests and Equity |
|
69 |
|
|
70 |
|
|
|
71 |
64
Report of Independent Registered Public Accounting Firm
To the Shareholders and the Board of Directors of Vivint Solar, Inc.
Opinion on the Financial Statements
We have audited the accompanying consolidated balance sheets of Vivint Solar, Inc. (the Company) as of December 31, 2017 and 2016, and the related consolidated statements of operations, comprehensive income, redeemable non-controlling interests and equity, and cash flows for each of the three years in the period ended December 31, 2017, and the related notes (collectively referred to as the “consolidated financial statements”). In our opinion, the consolidated financial statements present fairly, in all material respects, the financial position of the Company at December 31, 2017 and 2016, and the results of its operations and its cash flows for each of the three years in the period ended December 31, 2017, in conformity with U.S. generally accepted accounting principles.
Basis for Opinion
These financial statements are the responsibility of the Company’s management. Our responsibility is to express an opinion on the Company’s financial statements based on our audits. We are a public accounting firm registered with the Public Company Accounting Oversight Board (United States) (PCAOB) and are required to be independent with respect to the Company in accordance with the U.S. federal securities laws and the applicable rules and regulations of the Securities and Exchange Commission and the PCAOB.
We conducted our audits in accordance with the standards of the PCAOB. Those standards require that we plan and perform the audit to obtain reasonable assurance about whether the financial statements are free of material misstatement, whether due to error or fraud. The Company is not required to have, nor were we engaged to perform, an audit of its internal control over financial reporting. As part of our audits we are required to obtain an understanding of internal control over financial reporting but not for the purpose of expressing an opinion on the effectiveness of the Company’s internal control over financial reporting. Accordingly, we express no such opinion.
Our audits included performing procedures to assess the risks of material misstatement of the financial statements, whether due to error or fraud, and performing procedures that respond to those risks. Such procedures included examining, on a test basis, evidence regarding the amounts and disclosures in the financial statements. Our audits also included evaluating the accounting principles used and significant estimates made by management, as well as evaluating the overall presentation of the financial statements. We believe that our audits provide a reasonable basis for our opinion.
/s/ Ernst & Young LLP
We have served as the Company’s auditor since 2012.
Salt Lake City, Utah
March 7, 2018
65
(In thousands, except par value and footnote 1)
|
|
December 31, |
|
|
December 31, |
|
||
|
|
2017 |
|
|
2016 |
|
||
|
ASSETS |
|
|
|
|
|
|
|
|
Current assets: |
|
|
|
|
|
|
|
|
Cash and cash equivalents |
$ |
108,452 |
|
|
$ |
96,586 |
|
|
Accounts receivable, net |
|
19,665 |
|
|
|
12,658 |
|
|
Inventories |
|
22,597 |
|
|
|
11,285 |
|
|
Prepaid expenses and other current assets |
|
34,049 |
|
|
|
46,683 |
|
|
Total current assets |
|
184,763 |
|
|
|
167,212 |
|
|
Restricted cash and cash equivalents |
|
46,486 |
|
|
|
26,853 |
|
|
Solar energy systems, net |
|
1,673,532 |
|
|
|
1,458,355 |
|
|
Property and equipment, net |
|
15,078 |
|
|
|
23,199 |
|
|
Intangible assets, net |
|
862 |
|
|
|
1,420 |
|
|
Prepaid tax asset, net |
|
505,883 |
|
|
|
419,474 |
|
|
Other non-current assets, net |
|
37,325 |
|
|
|
29,843 |
|
|
TOTAL ASSETS(1) |
$ |
2,463,929 |
|
|
$ |
2,126,356 |
|
|
LIABILITIES, REDEEMABLE NON-CONTROLLING INTERESTS AND EQUITY |
|
|
|
|
|
|
|
|
Current liabilities: |
|
|
|
|
|
|
|
|
Accounts payable |
$ |
40,736 |
|
|
$ |
46,630 |
|
|
Accounts payable—related party |
|
163 |
|
|
|
191 |
|
|
Distributions payable to non-controlling interests and redeemable non-controlling interests |
|
16,437 |
|
|
|
16,176 |
|
|
Accrued compensation |
|
20,992 |
|
|
|
20,003 |
|
|
Current portion of long-term debt |
|
13,585 |
|
|
|
6,252 |
|
|
Current portion of deferred revenue |
|
41,846 |
|
|
|
19,911 |
|
|
Current portion of capital lease obligation |
|
4,166 |
|
|
|
5,163 |
|
|
Accrued and other current liabilities |
|
29,675 |
|
|
|
19,364 |
|
|
Total current liabilities |
|
167,600 |
|
|
|
133,690 |
|
|
Long-term debt, net of current portion |
|
925,964 |
|
|
|
750,728 |
|
|
Deferred revenue, net of current portion |
|
29,200 |
|
|
|
34,379 |
|
|
Capital lease obligation, net of current portion |
|
1,599 |
|
|
|
5,476 |
|
|
Deferred tax liability, net |
|
342,382 |
|
|
|
395,218 |
|
|
Other non-current liabilities |
|
13,674 |
|
|
|
10,355 |
|
|
Total liabilities(1) |
|
1,480,419 |
|
|
|
1,329,846 |
|
|
Commitments and contingencies (Note 17) |
|
|
|
|
|
|
|
|
Redeemable non-controlling interests |
|
122,444 |
|
|
|
129,676 |
|
|
Stockholders' equity: |
|
|
|
|
|
|
|
|
Common stock, $0.01 par value—1,000,000 authorized, 115,099 shares issued and outstanding as of December 31, 2017; 1,000,000 authorized, 110,245 shares issued and outstanding as of December 31, 2016 |
|
1,151 |
|
|
|
1,102 |
|
|
Additional paid-in capital |
|
559,788 |
|
|
|
542,348 |
|
|
Accumulated other comprehensive income |
|
6,905 |
|
|
|
7,631 |
|
|
Retained earnings |
|
213,107 |
|
|
|
5,217 |
|
|
Total stockholders' equity |
|
780,951 |
|
|
|
556,298 |
|
|
Non-controlling interests |
|
80,115 |
|
|
|
110,536 |
|
|
Total equity |
|
861,066 |
|
|
|
666,834 |
|
|
TOTAL LIABILITIES, REDEEMABLE NON-CONTROLLING INTERESTS AND EQUITY |
$ |
2,463,929 |
|
|
$ |
2,126,356 |
|
|
(1) |
The Company’s consolidated assets as of December 31, 2017 and 2016 include $1,516.2 million and $1,303.5 million consisting of assets of variable interest entities (“VIEs”) that can only be used to settle obligations of the VIEs. These assets include solar energy systems, net, of $1,486.0 million and $1,273.8 million as of December 31, 2017 and 2016; cash and cash equivalents of $17.3 million and $23.2 million as of December 31, 2017 and 2016; accounts receivable, net, of $5.1 million and $4.0 million as of December 31, 2017 and 2016; other non-current assets, net of $6.8 million and $1.8 million as of December 31, 2017 and 2016; and prepaid expenses and other current assets of $1.0 million and $0.8 million as of December 31, 2017 and 2016. The Company’s consolidated liabilities as of December 31, 2017 and 2016 included $58.4 million and $64.2 million of liabilities of VIEs whose creditors have no recourse to the Company. These liabilities include distributions payable to non-controlling interests and redeemable non-controlling interests of $16.4 million and $16.2 million as of December 31, 2017 and 2016; deferred revenue of $36.0 million and $41.7 million as of December 31, 2017 and 2016; accrued and other current liabilities of $4.5 million as of December 31, 2017 and 2016; and other non-current liabilities of $1.4 million and $1.9 million as of December 31, 2017 and 2016. For further information see Note 12—Investment Funds. |
See accompanying notes to consolidated financial statements.
66
Consolidated Statements of Operations
(In thousands, except per share data)
|
|
Year Ended December 31, |
|
|||||||||
|
|
2017 |
|
|
2016 |
|
|
2015 |
|
|||
|
Revenue: |
|
|
|
|
|
|
|
|
|
|
|
|
Operating leases and incentives |
$ |
150,862 |
|
|
$ |
105,353 |
|
|
$ |
61,150 |
|
|
Solar energy system and product sales |
|
117,166 |
|
|
|
29,814 |
|
|
|
3,032 |
|
|
Total revenue |
|
268,028 |
|
|
|
135,167 |
|
|
|
64,182 |
|
|
Cost of revenue: |
|
|
|
|
|
|
|
|
|
|
|
|
Cost of revenue—operating leases and incentives |
|
141,305 |
|
|
|
150,796 |
|
|
|
131,213 |
|
|
Cost of revenue—solar energy system and product sales |
|
88,977 |
|
|
|
23,185 |
|
|
|
1,762 |
|
|
Total cost of revenue |
|
230,282 |
|
|
|
173,981 |
|
|
|
132,975 |
|
|
Gross profit (loss) |
|
37,746 |
|
|
|
(38,814 |
) |
|
|
(68,793 |
) |
|
Operating expenses: |
|
|
|
|
|
|
|
|
|
|
|
|
Sales and marketing |
|
38,696 |
|
|
|
41,436 |
|
|
|
48,078 |
|
|
Research and development |
|
3,340 |
|
|
|
2,979 |
|
|
|
3,901 |
|
|
General and administrative |
|
79,399 |
|
|
|
81,802 |
|
|
|
92,664 |
|
|
Amortization of intangible assets |
|
558 |
|
|
|
901 |
|
|
|
13,172 |
|
|
Impairment of goodwill and intangible assets |
|
— |
|
|
|
36,601 |
|
|
|
4,506 |
|
|
Total operating expenses |
|
121,993 |
|
|
|
163,719 |
|
|
|
162,321 |
|
|
Loss from operations |
|
(84,247 |
) |
|
|
(202,533 |
) |
|
|
(231,114 |
) |
|
Interest expense |
|
64,264 |
|
|
|
34,008 |
|
|
|
12,568 |
|
|
Other expense (income), net |
|
352 |
|
|
|
(1,437 |
) |
|
|
(154 |
) |
|
Loss before income taxes |
|
(148,863 |
) |
|
|
(235,104 |
) |
|
|
(243,528 |
) |
|
Income tax (benefit) expense |
|
(157,333 |
) |
|
|
7,433 |
|
|
|
9,737 |
|
|
Net income (loss) |
|
8,470 |
|
|
|
(242,537 |
) |
|
|
(253,265 |
) |
|
Net loss attributable to non-controlling interests and redeemable non-controlling interests |
|
(200,628 |
) |
|
|
(260,523 |
) |
|
|
(266,345 |
) |
|
Net income available to common stockholders |
$ |
209,098 |
|
|
$ |
17,986 |
|
|
$ |
13,080 |
|
|
Net income available per share to common stockholders: |
|
|
|
|
|
|
|
|
|
|
|
|
Basic |
$ |
1.85 |
|
|
$ |
0.17 |
|
|
$ |
0.12 |
|
|
Diluted |
$ |
1.77 |
|
|
$ |
0.16 |
|
|
$ |
0.12 |
|
|
Weighted-average shares used in computing net income available per share to common stockholders: |
|
|
|
|
|
|
|
|
|
|
|
|
Basic |
|
113,132 |
|
|
|
108,190 |
|
|
|
106,088 |
|
|
Diluted |
|
118,268 |
|
|
|
112,538 |
|
|
|
109,858 |
|
See accompanying notes to consolidated financial statements.
67
Consolidated Statements of Comprehensive Income
(In thousands)
|
|
Year Ended December 31, |
|
|||||||||
|
|
2017 |
|
|
2016 |
|
|
2015 |
|
|||
|
Net income available to common stockholders |
$ |
209,098 |
|
|
$ |
17,986 |
|
|
$ |
13,080 |
|
|
Other comprehensive (loss) income: |
|
|
|
|
|
|
|
|
|
|
|
|
Unrealized (losses) gains on cash flow hedging instruments (net of tax effect of $(562) and $5,258 in 2017 and 2016) |
|
(843 |
) |
|
|
7,875 |
|
|
|
— |
|
|
Less: Interest income (expense) on derivatives recognized into earnings (net of tax effect of $78 and $(163) in 2017 and 2016) |
|
117 |
|
|
|
(244 |
) |
|
|
— |
|
|
Total other comprehensive (loss) income |
|
(726 |
) |
|
|
7,631 |
|
|
|
— |
|
|
Comprehensive income |
$ |
208,372 |
|
|
$ |
25,617 |
|
|
$ |
13,080 |
|
See accompanying notes to consolidated financial statements.
68
Consolidated Statements of Redeemable Non-Controlling Interests and Equity
(In thousands)
|
|
Redeemable |
|
|
|
|
|
|
|
|
|
|
|
|
|
|
|
Accumulated |
|
|
Retained |
|
|
|
|
|
|
|
|
|
|
|
|
|
|||
|
|
Non- |
|
|
|
|
|
|
|
|
|
|
|
Additional |
|
|
Other |
|
|
Earnings |
|
|
Total |
|
|
Non- |
|
|
|
|
|
||||||
|
|
Controlling |
|
|
|
Common Stock |
|
|
Paid-in |
|
|
Comprehensive |
|
|
(Accumulated |
|
|
Stockholders’ |
|
|
Controlling |
|
|
Total |
|
||||||||||||
|
|
Interests |
|
|
|
Shares |
|
|
Amount |
|
|
Capital |
|
|
Income |
|
|
Deficit) |
|
|
Equity |
|
|
Interests |
|
|
Equity |
|
|||||||||
|
Balance — January 1, 2015 |
$ |
128,427 |
|
|
|
|
105,303 |
|
|
$ |
1,053 |
|
|
$ |
502,785 |
|
|
$ |
— |
|
|
$ |
(25,849 |
) |
|
$ |
477,989 |
|
|
$ |
135,147 |
|
|
$ |
613,136 |
|
|
Stock-based compensation expense |
|
— |
|
|
|
|
— |
|
|
|
— |
|
|
|
25,604 |
|
|
|
— |
|
|
|
— |
|
|
|
25,604 |
|
|
|
— |
|
|
|
25,604 |
|
|
Excess tax benefit from stock-based compensation |
|
— |
|
|
|
|
— |
|
|
|
— |
|
|
|
1,713 |
|
|
|
— |
|
|
|
— |
|
|
|
1,713 |
|
|
|
— |
|
|
|
1,713 |
|
|
Issuance of common stock, net |
|
— |
|
|
|
|
1,273 |
|
|
|
13 |
|
|
|
544 |
|
|
|
— |
|
|
|
— |
|
|
|
557 |
|
|
|
— |
|
|
|
557 |
|
|
Contributions from non-controlling interests and redeemable non-controlling interests |
|
113,896 |
|
|
|
|
— |
|
|
|
— |
|
|
|
— |
|
|
|
— |
|
|
|
— |
|
|
|
— |
|
|
|
178,833 |
|
|
|
178,833 |
|
|
Distributions to non-controlling interests and redeemable non-controlling interests |
|
(6,566 |
) |
|
|
|
— |
|
|
|
— |
|
|
|
— |
|
|
|
— |
|
|
|
— |
|
|
|
— |
|
|
|
(23,542 |
) |
|
|
(23,542 |
) |
|
Net (loss) income |
|
(66,216 |
) |
|
|
|
— |
|
|
|
— |
|
|
|
— |
|
|
|
— |
|
|
|
13,080 |
|
|
|
13,080 |
|
|
|
(200,129 |
) |
|
|
(187,049 |
) |
|
Balance — December 31, 2015 |
|
169,541 |
|
|
|
|
106,576 |
|
|
|
1,066 |
|
|
|
530,646 |
|
|
|
— |
|
|
|
(12,769 |
) |
|
|
518,943 |
|
|
|
90,309 |
|
|
|
609,252 |
|
|
Stock-based compensation expense |
|
— |
|
|
|
|
— |
|
|
|
— |
|
|
|
10,614 |
|
|
|
— |
|
|
|
— |
|
|
|
10,614 |
|
|
|
— |
|
|
|
10,614 |
|
|
Excess tax detriment from stock-based compensation |
|
— |
|
|
|
|
— |
|
|
|
— |
|
|
|
(1,713 |
) |
|
|
— |
|
|
|
— |
|
|
|
(1,713 |
) |
|
|
— |
|
|
|
(1,713 |
) |
|
Issuance of common stock, net |
|
— |
|
|
|
|
3,669 |
|
|
|
36 |
|
|
|
2,801 |
|
|
|
— |
|
|
|
— |
|
|
|
2,837 |
|
|
|
— |
|
|
|
2,837 |
|
|
Contributions from non-controlling interests and redeemable non-controlling interests |
|
42,803 |
|
|
|
|
— |
|
|
|
— |
|
|
|
— |
|
|
|
— |
|
|
|
— |
|
|
|
— |
|
|
|
235,045 |
|
|
|
235,045 |
|
|
Distributions to non-controlling interests and redeemable non-controlling interests |
|
(7,650 |
) |
|
|
|
— |
|
|
|
— |
|
|
|
— |
|
|
|
— |
|
|
|
— |
|
|
|
— |
|
|
|
(29,313 |
) |
|
|
(29,313 |
) |
|
Total other comprehensive income |
|
— |
|
|
|
|
— |
|
|
|
— |
|
|
|
— |
|
|
|
7,631 |
|
|
|
— |
|
|
|
7,631 |
|
|
|
— |
|
|
|
7,631 |
|
|
Net (loss) income |
|
(75,018 |
) |
|
|
|
— |
|
|
|
— |
|
|
|
— |
|
|
|
— |
|
|
|
17,986 |
|
|
|
17,986 |
|
|
|
(185,505 |
) |
|
|
(167,519 |
) |
|
Balance — December 31, 2016 |
|
129,676 |
|
|
|
|
110,245 |
|
|
|
1,102 |
|
|
|
542,348 |
|
|
|
7,631 |
|
|
|
5,217 |
|
|
|
556,298 |
|
|
|
110,536 |
|
|
|
666,834 |
|
|
Cumulative-effect adjustment from adoption of ASU 2016-09 |
|
— |
|
|
|
|
— |
|
|
|
— |
|
|
|
2,014 |
|
|
|
— |
|
|
|
(1,208 |
) |
|
|
806 |
|
|
|
— |
|
|
|
806 |
|
|
Stock-based compensation expense |
|
— |
|
|
|
|
— |
|
|
|
— |
|
|
|
12,917 |
|
|
|
— |
|
|
|
— |
|
|
|
12,917 |
|
|
|
— |
|
|
|
12,917 |
|
|
Issuance of common stock, net |
|
— |
|
|
|
|
4,854 |
|
|
|
49 |
|
|
|
588 |
|
|
|
— |
|
|
|
— |
|
|
|
637 |
|
|
|
— |
|
|
|
637 |
|
|
Contributions from non-controlling interests and redeemable non-controlling interests |
|
65,062 |
|
|
|
|
— |
|
|
|
— |
|
|
|
— |
|
|
|
— |
|
|
|
— |
|
|
|
— |
|
|
|
148,666 |
|
|
|
148,666 |
|
|
Distributions to non-controlling interests and redeemable non-controlling interests |
|
(7,566 |
) |
|
|
|
— |
|
|
|
— |
|
|
|
— |
|
|
|
— |
|
|
|
— |
|
|
|
— |
|
|
|
(39,984 |
) |
|
|
(39,984 |
) |
|
Acquisition of redeemable non-controlling interests |
|
(3,203 |
) |
|
|
|
— |
|
|
|
— |
|
|
|
1,921 |
|
|
|
— |
|
|
|
— |
|
|
|
1,921 |
|
|
|
— |
|
|
|
1,921 |
|
|
Total other comprehensive loss |
|
— |
|
|
|
|
— |
|
|
|
— |
|
|
|
— |
|
|
|
(726 |
) |
|
|
— |
|
|
|
(726 |
) |
|
|
— |
|
|
|
(726 |
) |
|
Net (loss) income |
|
(61,525 |
) |
|
|
|
— |
|
|
|
— |
|
|
|
— |
|
|
|
— |
|
|
|
209,098 |
|
|
|
209,098 |
|
|
|
(139,103 |
) |
|
|
69,995 |
|
|
Balance — December 31, 2017 |
$ |
122,444 |
|
|
|
|
115,099 |
|
|
$ |
1,151 |
|
|
$ |
559,788 |
|
|
$ |
6,905 |
|
|
$ |
213,107 |
|
|
$ |
780,951 |
|
|
$ |
80,115 |
|
|
$ |
861,066 |
|
See accompanying notes to consolidated financial statements.
69
Consolidated Statements of Cash Flows
(In thousands)
|
|
Year Ended December 31, |
|
|||||||||
|
|
2017 |
|
|
2016 |
|
|
2015 |
|
|||
|
CASH FLOWS FROM OPERATING ACTIVITIES: |
|
|
|
|
|
|
|
|
|
|
|
|
Net income (loss) |
$ |
8,470 |
|
|
$ |
(242,537 |
) |
|
$ |
(253,265 |
) |
|
Adjustments to reconcile net income (loss) to net cash used in operating activities: |
|
|
|
|
|
|
|
|
|
|
|
|
Depreciation and amortization |
|
60,606 |
|
|
|
46,821 |
|
|
|
24,924 |
|
|
Amortization of intangible assets |
|
558 |
|
|
|
901 |
|
|
|
13,172 |
|
|
Impairment of goodwill and intangible assets |
|
— |
|
|
|
36,601 |
|
|
|
4,506 |
|
|
Deferred income taxes |
|
(52,828 |
) |
|
|
174,090 |
|
|
|
107,466 |
|
|
Stock-based compensation |
|
12,917 |
|
|
|
10,614 |
|
|
|
25,604 |
|
|
Loss on solar energy systems and property and equipment |
|
6,858 |
|
|
|
6,432 |
|
|
|
1,024 |
|
|
Noncash interest and other expense |
|
9,422 |
|
|
|
7,161 |
|
|
|
3,724 |
|
|
Reduction in lease pass-through financing obligation |
|
(4,515 |
) |
|
|
(4,239 |
) |
|
|
(231 |
) |
|
Losses (gains) on interest rate swaps |
|
359 |
|
|
|
(1,591 |
) |
|
|
— |
|
|
Excess tax detriment from stock-based compensation |
|
— |
|
|
|
(1,713 |
) |
|
|
— |
|
|
Changes in operating assets and liabilities: |
|
|
|
|
|
|
|
|
|
|
|
|
Accounts receivable, net |
|
(7,007 |
) |
|
|
(9,022 |
) |
|
|
(1,799 |
) |
|
Inventories |
|
(11,312 |
) |
|
|
(10,654 |
) |
|
|
143 |
|
|
Prepaid expenses and other current assets |
|
10,864 |
|
|
|
(32,526 |
) |
|
|
(576 |
) |
|
Prepaid tax asset, net |
|
(86,409 |
) |
|
|
(141,978 |
) |
|
|
(165,586 |
) |
|
Other non-current assets, net |
|
(5,502 |
) |
|
|
(6,078 |
) |
|
|
(5,268 |
) |
|
Accounts payable |
|
(93 |
) |
|
|
2,698 |
|
|
|
1,636 |
|
|
Accounts payable—related party |
|
(192 |
) |
|
|
(1,714 |
) |
|
|
(227 |
) |
|
Accrued compensation |
|
495 |
|
|
|
5,567 |
|
|
|
(892 |
) |
|
Deferred revenue |
|
16,756 |
|
|
|
6,018 |
|
|
|
43,492 |
|
|
Accrued and other liabilities |
|
6,699 |
|
|
|
(10,541 |
) |
|
|
12,909 |
|
|
Net cash used in operating activities |
|
(33,854 |
) |
|
|
(165,690 |
) |
|
|
(189,244 |
) |
|
CASH FLOWS FROM INVESTING ACTIVITIES: |
|
|
|
|
|
|
|
|
|
|
|
|
Payments for the cost of solar energy systems |
|
(276,651 |
) |
|
|
(405,635 |
) |
|
|
(540,399 |
) |
|
Payments for property and equipment |
|
(672 |
) |
|
|
(2,785 |
) |
|
|
(6,307 |
) |
|
Proceeds from disposals of solar energy systems and property and equipment |
|
2,428 |
|
|
|
913 |
|
|
|
— |
|
|
Change in restricted cash and cash equivalents |
|
(19,633 |
) |
|
|
(11,818 |
) |
|
|
(8,519 |
) |
|
Proceeds from state tax credits |
|
3,720 |
|
|
|
5,169 |
|
|
|
— |
|
|
Purchase of intangible assets |
|
— |
|
|
|
(291 |
) |
|
|
(1,221 |
) |
|
Net cash used in investing activities |
|
(290,808 |
) |
|
|
(414,447 |
) |
|
|
(556,446 |
) |
|
CASH FLOWS FROM FINANCING ACTIVITIES: |
|
|
|
|
|
|
|
|
|
|
|
|
Proceeds from investment by non-controlling interests and redeemable non-controlling interests |
|
213,728 |
|
|
|
277,848 |
|
|
|
292,729 |
|
|
Distributions paid to non-controlling interests and redeemable non-controlling interests |
|
(47,289 |
) |
|
|
(32,134 |
) |
|
|
(25,541 |
) |
|
Proceeds from long-term debt |
|
356,750 |
|
|
|
589,246 |
|
|
|
310,850 |
|
|
Payments on long-term debt |
|
(172,495 |
) |
|
|
(233,244 |
) |
|
|
— |
|
|
Payments for debt issuance and deferred offering costs |
|
(13,917 |
) |
|
|
(16,774 |
) |
|
|
(6,011 |
) |
|
Proceeds from lease pass-through financing obligation |
|
3,581 |
|
|
|
2,388 |
|
|
|
7,228 |
|
|
Principal payments on capital lease obligations |
|
(4,467 |
) |
|
|
(5,657 |
) |
|
|
(5,363 |
) |
|
Proceeds from issuance of common stock |
|
637 |
|
|
|
2,837 |
|
|
|
649 |
|
|
Excess tax benefits from stock-based compensation |
|
— |
|
|
|
— |
|
|
|
1,713 |
|
|
Net cash provided by financing activities |
|
336,528 |
|
|
|
584,510 |
|
|
|
576,254 |
|
|
NET INCREASE (DECREASE) IN CASH AND CASH EQUIVALENTS |
|
11,866 |
|
|
|
4,373 |
|
|
|
(169,436 |
) |
|
CASH AND CASH EQUIVALENTS—Beginning of period |
|
96,586 |
|
|
|
92,213 |
|
|
|
261,649 |
|
|
CASH AND CASH EQUIVALENTS—End of period |
$ |
108,452 |
|
|
$ |
96,586 |
|
|
$ |
92,213 |
|
|
SUPPLEMENTAL DISCLOSURES OF CASH FLOW INFORMATION: |
|
|
|
|
|
|
|
|
|
|
|
|
Cash paid for interest |
$ |
51,127 |
|
|
$ |
23,733 |
|
|
$ |
8,469 |
|
|
Cash (recovered from) paid for income taxes |
$ |
(33,245 |
) |
|
$ |
15,905 |
|
|
$ |
67,135 |
|
|
NONCASH INVESTING AND FINANCING ACTIVITIES: |
|
|
|
|
|
|
|
|
|
|
|
|
Changes in fair value of interest rate swaps |
$ |
(1,569 |
) |
|
$ |
14,317 |
|
|
$ |
— |
|
|
Vehicles acquired under capital leases |
$ |
874 |
|
|
$ |
1,947 |
|
|
$ |
11,363 |
|
|
Costs of solar energy systems included in changes in accounts payable, accounts payable—related party, accrued compensation and accrued and other liabilities |
$ |
610 |
|
|
$ |
(4,508 |
) |
|
$ |
(6,589 |
) |
|
Accrued distributions to non-controlling interests and redeemable non-controlling interests |
$ |
261 |
|
|
$ |
4,829 |
|
|
$ |
4,567 |
|
|
Receivable for tax credit recorded as a reduction to solar energy system costs |
$ |
102 |
|
|
$ |
1,552 |
|
|
$ |
1,678 |
|
|
Costs of lessor-financed tenant improvements |
$ |
— |
|
|
$ |
7,850 |
|
|
$ |
— |
|
|
Property acquired under build-to-suit agreements |
$ |
— |
|
|
$ |
2,896 |
|
|
$ |
25,560 |
|
|
Sale-leaseback of property under build-to-suit agreements |
$ |
— |
|
|
$ |
(28,456 |
) |
|
$ |
— |
|
See accompanying notes to consolidated financial statements.
70
Notes to Consolidated Financial Statements
1.Organization
Vivint Solar, Inc. and its subsidiaries are collectively referred to as the “Company.” The Company most commonly offers solar energy to residential customers through long-term customer contracts, such as power purchase agreements (“PPAs”) and legal-form leases (“Solar Leases”). The Company also offers its customers the option to purchase solar energy systems (“System Sales”) through third-party loan offerings or a cash purchase. The Company enters into customer contracts through a sales organization that primarily uses a direct-to-home sales model. The long-term customer contracts under PPAs and Solar Leases are typically for 20 years and require the customer to make monthly payments to the Company.
The Company has formed various investment funds and entered into long-term debt facilities to monetize the recurring customer payments under its long-term customer contracts and investment tax credits (“ITCs”), accelerated tax depreciation and other incentives associated with residential solar energy systems. The Company uses the cash received from the investment funds, long-term debt facilities and cash generated from operations, including System Sales, to finance a portion of the Company’s variable and fixed costs associated with installing solar energy systems.
2.Summary of Significant Accounting Policies
Basis of Presentation and Principles of Consolidation
The accompanying consolidated financial statements have been prepared in accordance with U.S. generally accepted accounting principles (“GAAP”) and applicable rules and regulations of the Securities and Exchange Commission (the “SEC”) and reflect the accounts and operations of the Company, its subsidiaries in which the Company has a controlling financial interest and the investment funds formed to fund the purchase of solar energy systems under long-term customer contracts, which are consolidated as variable interest entities (“VIEs”). The Company uses a qualitative approach in assessing the consolidation requirement for VIEs. This approach focuses on determining whether the Company has the power to direct the activities of the VIE that most significantly affect the VIE’s economic performance and whether the Company has the obligation to absorb losses or the right to receive benefits that could potentially be significant to the VIE. All of these determinations involve significant management judgments. The Company has determined that it is the primary beneficiary in the operational VIEs in which it has an equity interest. The Company evaluates its relationships with the VIEs on an ongoing basis to ensure that it continues to be the primary beneficiary. All intercompany transactions and balances have been eliminated in consolidation. For additional information regarding these VIEs, see Note 12—Investment Funds.
Certain prior period amounts have been reclassified to conform to current year presentation. These reclassifications did not have a significant impact on the consolidated financial statements.
Use of Estimates
The preparation of the consolidated financial statements requires management to make estimates and assumptions that affect the amounts reported in the consolidated financial statements and accompanying notes. The Company regularly makes significant estimates and assumptions including, but not limited to, ITCs; revenue recognition; solar energy systems, net; the impairment analysis of long-lived assets; stock-based compensation; the provision for income taxes; the valuation of derivative financial instruments; the recognition and measurement of loss contingencies; and non-controlling interests and redeemable non-controlling interests. The Company bases its estimates on historical experience and on various other assumptions believed to be reasonable, the results of which form the basis for making judgments about the carrying values of assets and liabilities. Actual results could differ materially from those estimates.
Cash and Cash Equivalents
The Company considers all highly liquid investments with maturities of three months or less at the time of purchase to be cash and cash equivalents. Cash equivalents consist principally of time deposits and money market accounts with high quality financial institutions.
71
The Company’s guaranty agreements with certain of its fund investors require the maintenance of minimum cash balances of $10.0 million. For additional information, see Note 12—Investment Funds. As of December 31, 2017, the Company also had $36.5 million in required reserves outstanding in separate collateral accounts in accordance with the terms of its various debt obligations. For additional information, see Note 10—Debt Obligations. These minimum cash balances are classified as restricted cash.
Liquidity
In order to grow, the Company requires cash to finance the deployment of solar energy systems. As of the date of this filing, the Company will require additional sources of cash beyond current cash balances, and currently available financing facilities to fund long-term planned growth. If the Company is unable to secure additional financing when needed, or upon desirable terms, the Company may be unable to finance installation of customers’ systems in a manner consistent with past performance, cost of capital could increase, or the Company may be required to significantly reduce the scope of operations, any of which would have a material adverse effect on the business, financial condition, results of operations and prospects. While the Company believes additional financing is available and will continue to be available to support current levels of operations, the Company believes it has the ability and intent to reduce operations to the level of available financial resources for at least the next 12 months from the date of this report, if necessary.
Accounts Receivable, Net
Accounts receivable are recorded at the invoiced amount, net of allowance for doubtful accounts. Accounts receivable also include unbilled accounts receivable, which is comprised of the monthly PPA power generation not yet invoiced and the monthly bill rate of Solar Leases as of the end of the reporting period. The Company estimates its allowance for doubtful accounts based upon the collectability of the receivables in light of historical trends and adverse situations that may affect customers’ ability to pay. Revisions to the allowance are recorded as an adjustment to bad debt expense or as a reduction to revenue when collectability is not reasonably assured. After appropriate collection efforts are exhausted, specific accounts receivable deemed to be uncollectible would be charged against the allowance in the period they are deemed uncollectible. Recoveries of accounts receivable previously written-off are recorded as credits to bad debt expense. The Company had an allowance for doubtful accounts of $3.6 million and $1.8 million as of December 31, 2017 and 2016.
Inventories
Effective January 1, 2017, the Company adopted Accounting Standards Update (“ASU”) 2015-11, which simplifies the measurement of inventory by changing the measurement principle for inventories valued under the first-in, first-out (“FIFO”) or weighted-average methods from the lower of cost or market to the lower of cost or net realizable value. Net realizable value is defined as the estimated selling price in the ordinary course of business, less reasonably predictable costs of completion, disposal and transportation. The Company adopted this ASU prospectively and no prior periods were adjusted. The adoption of this ASU had no material effect on the consolidated financial statements.
Inventories include solar energy systems under construction that have yet to be interconnected to the power grid and that will be sold to customers. Inventory is stated at the lower of cost, on a FIFO basis, or net realizable value. Upon interconnection to the power grid, solar energy system inventory is removed using the specific identification method. Inventories also include components related to photovoltaic installation products and are stated at the lower of cost, on an average cost basis, or net realizable value. The Company evaluates its inventory reserves on a quarterly basis and writes down the value of inventories for estimated excess and obsolete inventories based on assumptions about future demand and market conditions. See Note 4—Inventories.
Concentrations of Risk
Financial instruments that potentially subject the Company to concentrations of credit risk consist primarily of cash and cash equivalents and accounts receivable. The associated concentration risk for cash and cash equivalents is mitigated by banking with creditworthy institutions. At certain times, amounts on deposit exceed Federal Deposit Insurance Corporation insurance limits. Approximately 64% of accounts receivable, net as of December 31, 2017 was due from a third-party loan provider that offers financing to System Sales customers. The Company does not require collateral or other security to support accounts receivable. The Company is not dependent on any single customer outside of the third-party loan providers.
72
The Company purchases solar panels, inverters and other system components from a limited number of suppliers. Three suppliers accounted for approximately 99% of the solar photovoltaic module purchases for the year ended December 31, 2017. Two suppliers accounted for approximately 98 % of the Company’s inverter purchases for the year ended December 31, 2017. If these suppliers fail to satisfy the Company’s requirements on a timely basis or if the Company fails to develop, maintain and expand its relationship with these suppliers, the Company could suffer delays in being able to deliver or install its solar energy systems, experience a possible loss of revenue, or incur higher costs, any of which could adversely affect its operating results.
As of December 31, 2017, the Company’s customers are located in 21 states. Solar energy system installations in California accounted for approximately 39 %, 31 % and 36 % of total installations for the years ended December 31, 2017, 2016 and 2015. Solar energy system installations in the Northeastern United States accounted for approximately 33 %, 38 % and 40 % of total installations for the years ended December 31, 2017, 2016 and 2015. Future operations could be affected by changes in the economic conditions in these and other geographic areas, by changes in materials costs, by changes in the demand for renewable energy generated by solar panel systems or by changes or eliminations of solar energy related government incentives.
Fair Value of Financial Instruments
Assets and liabilities recorded at fair value on a recurring basis in the consolidated balance sheets are categorized based upon the level of judgment associated with the inputs used to measure their fair values. Fair value is defined as the exchange price that would be received for an asset or an exit price that would be paid to transfer a liability in the principal or most advantageous market for the asset or liability in an orderly transaction between market participants on the measurement date. Valuation techniques used to measure fair value must maximize the use of observable inputs and minimize the use of unobservable inputs. The authoritative guidance on fair value measurements establishes a three-tier fair value hierarchy for disclosure of fair value measurements as follows:
|
|
• |
Level I—Inputs are unadjusted, quoted prices in active markets for identical assets or liabilities at the measurement date; |
|
|
• |
Level II—Inputs are observable, unadjusted quoted prices in active markets for similar assets or liabilities, unadjusted quoted prices for identical or similar assets or liabilities in markets that are not active, or other inputs that are observable or can be corroborated by observable market data for substantially the full term of the related assets or liabilities; and |
|
|
• |
Level III—Unobservable inputs that are significant to the measurement of the fair value of the assets or liabilities that are supported by little or no market data. |
The Company’s financial instruments measured on a recurring basis consist of Level II assets. See Note 3—Fair Value Measurements.
Investment Tax Credits (ITCs)
The Company applies for and receives ITCs under Section 48(a) of the Internal Revenue Code. The amount for the ITC is equal to 30% of the value of eligible solar property. The Company receives all ITCs for solar energy systems that are not sold to customers or placed in its investment funds. The Company accounts for its ITCs as a reduction of income tax expense in the year in which the credits arise. The Company receives minimal allocations of ITCs for solar energy systems placed in its investment funds as the majority of such credits are allocated to the fund investor. Some of the Company’s investment funds obligate it to make certain fund investors whole for losses that the investors may suffer in certain limited circumstances resulting from the disallowance or recapture of ITCs as a result of the Internal Revenue Service’s (the “IRS”) assessment of the fair value of such systems. The Company has concluded that the likelihood of a recapture event related to these assessments is remote and consequently has not recorded any liability in the consolidated financial statements for any potential recapture exposure.
Solar Energy Systems, Net
The Company sells energy to customers through PPAs or leases solar energy systems to customers through Solar Leases. The Company has determined that these contracts should be accounted for as operating leases and, accordingly, the related solar energy systems are stated at cost, less accumulated depreciation and amortization. The Company also sells solar energy systems to customers through System Sales. Systems that are sold to customers are not part of solar energy systems, net.
73
Solar energy systems, net is comprised of system equipment costs and initial direct costs related to solar energy systems subject to PPAs or Solar Leases. System equipment costs include components such as solar panels, inverters, racking systems and other electrical equipment, as well as costs for design and installation activities once a long-term customer contract has been executed. Initial direct costs related to solar energy systems consist of sales commissions and other direct customer acquisition expenses. System equipment costs and initial direct costs are capitalized and recorded within solar energy systems, net. This accounting treatment results in decreased depreciation of such solar energy systems over their useful lives.
Depreciation and amortization is calculated using the straight-line method over the estimated useful lives of the respective assets as follows:
|
|
|
Useful Lives |
|
System equipment costs |
|
30 years |
|
Initial direct costs related to solar energy systems |
|
Lease term (20 years) |
System equipment costs are depreciated and initial direct costs are amortized once the respective systems have been installed, interconnected to the power grid and received permission to operate. The determination of the useful lives of assets included within solar energy systems involves significant management judgment. As of December 31, 2017 and 2016, the Company had recorded costs of $1,803.2 million and $1,532.1 million in solar energy systems, of which $1,717.3 million and $1,417.4 million related to systems that had been interconnected to the power grid, with accumulated depreciation and amortization of $129.6 million and $73.8 million.
The Company’s property and equipment is stated at cost less accumulated depreciation and amortization. Depreciation and amortization are calculated using the straight-line method over the estimated useful lives of the assets. Vehicles leased under capital leases are depreciated over the life of the lease term, which is typically three to five years. The estimated useful lives of computer equipment, furniture, fixtures and purchased software are three years. Leasehold improvements are amortized over the shorter of the lease term or the estimated useful lives of the assets. The estimated useful lives of leasehold improvements currently range from one to 12 years. Repairs and maintenance costs are expensed as incurred. Major renewals and improvements that extend the useful lives of existing assets would be capitalized and depreciated over their estimated useful lives.
Intangible Assets
The Company capitalizes costs incurred in the development of internal-use software during the application development stage. Costs related to preliminary project activities and post-implementation activities are expensed as incurred. Internal-use software is amortized on a straight-line basis over its estimated useful life. The Company tests these assets for impairment whenever events or changes in circumstances occur that could impact the recoverability of these assets. The Company recorded amortization for internal-use software of $0.4 million, $0.8 million, and $0.2 million for the years ended December 31, 2017, 2016, and 2015.
Other finite-lived intangible assets, which consist of developed technology acquired in business combinations, trademarks/trade names and customer relationships are initially recorded at fair value and presented net of accumulated amortization. These intangible assets are amortized on a straight-line basis over their estimated useful lives. The Company amortizes customer relationships over five years, trademarks/trade names over 10 years and developed technology over eight years. See Note 7—Intangible Assets and Goodwill.
Impairment of Long-Lived Assets
The carrying amounts of the Company’s long-lived assets, including solar energy systems, property and equipment and finite-lived intangible assets are periodically reviewed for impairment whenever events or changes in circumstances indicate that the carrying value of these assets may not be recoverable or that the useful life is shorter than originally estimated. Factors that the Company considers in deciding when to perform an impairment review include significant negative industry or economic trends, and significant changes or planned changes in the Company’s use of the assets. Recoverability of these assets is measured by comparison of the carrying amount of each asset to the future undiscounted cash flows the asset is expected to generate over its remaining life. If the asset is considered to be impaired, the amount of any impairment is measured as the difference between the carrying value and the fair value of the impaired asset. If the useful life is shorter than originally estimated, the Company amortizes the remaining carrying value over the new shorter useful life.
74
In February 2015, the Company ceased the external sales of two Solmetric Corporation (“Solmetric”) products: the SunEye and PV Designer. This change was considered an indicator of impairment, and a review regarding the recoverability of the carrying value of the related intangible assets was performed. As a result of this review, the Company recorded a total impairment charge of $4.5 million for the year ended December 31, 2015. See Note 7—Intangible Assets and Goodwill.
Goodwill Impairment Analysis
Goodwill represents the excess of the purchase price of an acquired business over the fair value of the net tangible and intangible assets acquired. During the first quarter of 2016, the Company’s market capitalization decreased significantly from $1.0 billion as of December 31, 2015 to $283 million as of March 31, 2016. The Company considered this significant decrease in market capitalization to be an indicator of impairment and the Company performed a goodwill impairment test as of March 31, 2016. The impairment test determined that there was no implied value of goodwill, which resulted in an impairment charge of $36.6 million, which was recorded in impairment of goodwill and intangible assets for the year ended December 31, 2016.
Prior to goodwill being impaired in 2016, the Company performed its annual impairment test of goodwill as of October 1st of each fiscal year or whenever events or circumstances changed that would indicate that goodwill might be impaired. In conducting the impairment test, the Company first assessed qualitative factors to determine whether it was more likely than not that the fair value of a reporting unit was less than its carrying amount as a basis for determining whether it was necessary to perform the two-step goodwill impairment test. If the qualitative step was not passed, the Company performed a two-step impairment test whereby in the first step, the Company would compare the fair value of the reporting unit with its carrying amount. If the carrying amount exceeded its fair value, the Company performed the second step of the goodwill impairment test to determine the amount of impairment. The second step, measuring the impairment loss, compared the implied fair value of the goodwill with the carrying value of the goodwill. Any excess of the goodwill carrying value over the implied fair value would be recognized as an impairment loss.
Prepaid Tax Asset, Net
The Company recognizes sales of solar energy systems to the investment funds for income tax purposes. As the investment funds are consolidated by the Company, the gain on the sale of the solar energy systems has been eliminated in the consolidated financial statements. However, this gain is recognized for tax reporting purposes. Since these transactions are intercompany sales for GAAP purposes, any tax expense incurred related to these intercompany sales is deferred and recorded as a prepaid tax asset and amortized as deferred tax expense over the estimated useful life of the underlying solar energy systems, which has been estimated to be 30 years.
Other Non-Current Assets
Other non-current assets primarily consist of interest rate swaps, the long-term portion of lease incentive assets, advances receivable due from sales representatives, debt issuance costs, prepaid insurance, a straight-line lease asset and long-term refundable rent deposits. For additional information regarding the interest rate swaps, see “—Derivative Financial Instruments” and Note 11—Derivative Financial Instruments. Lease incentives represent cash payments made by the Company to customers in order to finalize long-term customer contracts. The Company provides advance payments of compensation to direct-sales personnel under certain circumstances. The advance is repaid as a reduction of the direct-sales personnel’s future compensation. The Company has established an allowance related to advances to direct-sales personnel who have terminated their employment agreement with the Company. These are non-interest-bearing advances. Debt issuance costs represent costs incurred in connection with obtaining revolving debt financings and are deferred and amortized utilizing the straight-line method, which approximates the effective-interest method, over the term of the related financing. During the year ended December 31, 2017, the Company acquired two insurance policies to mitigate the risk of ITC recapture. The insurance premiums are being amortized on a straight-line basis over the policy period. For Solar Lease agreements, the Company recognizes revenue on a straight-line basis over the lease term and records an asset that represents future customer payments.
Distributions Payable to Non-Controlling Interests and Redeemable Non-Controlling Interests
As discussed in Note 12—Investment Funds, the Company and fund investors have formed various investment funds that the Company consolidates as the Company has determined that it is the primary beneficiary in the operational VIEs in which it has an equity interest. These VIEs are required to pay cumulative cash distributions to their respective fund investors. The Company accrues amounts payable to fund investors in distributions payable to non-controlling interests and redeemable non-controlling interests.
75
Deferred revenue primarily includes deferred ITC revenue, rebate incentives and cash received related to System Sales. Deferred ITC revenue is related to a lease pass-through arrangement in which a portion of the rent prepayment is allocated to ITC revenue. Rebate incentives are received from utility companies and various government agencies and are recognized as revenue over the related lease term of 20 years. A portion of the cash received for System Sales is attributable to administrative services and is deferred over the period that the administrative services are provided. The majority of the cash received for System Sales is deferred until the solar energy systems are interconnected to the local power grids and receive permission to operate. See “—Revenue Recognition” for additional information regarding revenue.
Home Installation Accruals and Warranties
The Company typically warrants solar energy systems sold to customers for periods of one to ten years against defects in design and workmanship, and for periods of one to ten years that installations will remain watertight. The manufacturers’ warranties on the solar energy system components, which are typically passed through to the customers, have typical product warranty periods of 10 to 20 years and a limited performance warranty period of 25 years. The Company warrants its photovoltaic installation devices for six months to one year against defects in materials or installation workmanship.
The Company generally assesses a loss contingency accrual for damages related to home installations and roof penetrations, and provides for their estimated cost at the time the related revenue is recognized. The Company assesses the accrued home installation and roof penetration reserves regularly and adjusts the amounts as necessary based on actual experience and changes in future estimates. The current portion of this accrual is recorded as a component of accrued and other current liabilities and was $1.4 million and $0.8 million as of December 31, 2017 and 2016. The non-current portion of this accrual is recorded as a component of other non-current liabilities and was $2.1 million and $0.8 million as of December 31, 2017 and 2016.
Derivative Financial Instruments
The Company maintains interest rate swaps as required by the terms of its debt agreements. See Note 10—Debt Obligations. The interest rate swaps related to the 2016 Term Loan Facility are designated as cash flow hedges. Changes in fair value for the effective portions of these cash flow hedges are recorded in other comprehensive (loss) income (“OCI”) and will subsequently be reclassified to interest expense over the life of the related debt facility as interest payments are made. Changes in fair value for the ineffective portions of the cash flow hedges are recognized in other expense (income), net. As interest payments for the associated debt agreement and derivatives are recognized, the Company includes the effect of these payments in cash flows from operating activities within the consolidated statements of cash flows. The interest rate swaps related to the Aggregation Facility are not designated as hedge instruments and any changes in fair value are accounted for in other expense (income), net. Derivative instruments may be offset under their master netting arrangements. See Note 11—Derivative Financial Instruments.
Comprehensive Income
Due to the Company entering into interest rate swaps, OCI includes unrealized gains on the cash flow hedges for the years ended December 31, 2017 and 2016. Prior to 2016, the Company had no comprehensive income or loss.
Revenue Recognition
The Company recognizes revenue when all of the following criteria are met: (1) persuasive evidence of an arrangement exists, (2) delivery or performance has occurred, (3) the sales price is fixed or determinable and (4) collectability is reasonably assured. The Company’s revenue is comprised of operating leases and incentives, and solar energy system and product sales as captioned in the consolidated statements of operations. Operating leases and incentives revenue includes PPA and Solar Lease revenue, solar renewable energy certificates (“SRECs”) sales, ITC revenue and rebate incentives. Solar energy system and product sales revenue includes System Sales, which may include structural upgrades in sales contracts and SREC sales related to sold systems, and the sale of photovoltaic installation products. Revenue is recorded net of any sales tax collected.
76
Operating Leases and Incentives Revenue
The Company’s most common revenue-generating activity consists of entering into PPAs with residential customers, under which the customer agrees to purchase all of the power generated by the solar energy system for the term of the contract, which is 20 years. The agreement includes a fixed price per kilowatt hour with a fixed annual price escalation percentage. Customers have not historically been charged for installation or activation of the solar energy system. For all PPAs, the Company assesses the probability of collectability on a customer-by-customer basis through a credit review process that evaluates their financial condition and ability to pay.
The Company has determined that PPAs should be accounted for as operating leases after evaluating and concluding that none of the following capitalized lease classification criteria are met: no transfer of ownership or bargain purchase option exists at the end of the lease, the lease term is not greater than 75% of the useful life or the present value of minimum lease payments does not exceed 90% of the fair value at lease inception. As PPA customer payments are dependent on power generation, they are considered contingent rentals and are excluded from future minimum annual lease payments. PPA revenue is recognized based on the actual amount of power generated at rates specified under the contracts, assuming the other revenue recognition criteria discussed above are met.
The Company also offers solar energy systems to customers pursuant to Solar Leases in certain markets. The customer agreements are structured as Solar Leases due to local regulations that can be read to prohibit the sale of electricity pursuant to the Company’s standard PPA. Pursuant to Solar Leases, the customers’ monthly payments are a pre-determined amount calculated based on the expected solar energy generation by the system and includes an annual fixed percentage price escalation over the period of the contracts, which is 20 years. The Company provides its Solar Lease customers a performance guarantee, under which the Company agrees to make a payment at the end of each year to the customer if the solar energy system does not meet a guaranteed production level in the prior 12-month period.
At times the Company makes nominal cash payments to customers in order to facilitate the finalization of long-term customer contracts and the installation of related solar energy systems. These cash payments are considered lease incentives that are deferred and recognized over the term of the contract as a reduction of revenue.
The guaranteed production levels have varying terms. Dependent on the level of the production guarantee, the Company either (1) recognizes the monthly lease payments as revenue and records a solar energy performance guarantee liability due to the contingent nature of the lease payments, or (2) straight-lines the contracted payments over the initial term of the lease. Solar energy performance guarantee liabilities were $0.1 million and de minimis as of December 31, 2017 and 2016.
Future minimum annual lease receipts due from customers under Solar Leases as of December 31, 2017 are as follows (in thousands):
|
Years Ending December 31, |
|
|
|
|
2018 |
$ |
6,266 |
|
|
2019 |
|
6,448 |
|
|
2020 |
|
6,635 |
|
|
2021 |
|
6,827 |
|
|
2022 |
|
7,025 |
|
The Company applies for and receives SRECs in certain jurisdictions for power generated by solar energy systems it has installed. When SRECs are granted, the Company typically sells them to other companies directly, or to brokers, to assist them in meeting their own mandatory emission reduction or conservation requirements. The Company recognizes revenue related to the sale of these certificates upon delivery, assuming the other revenue recognition criteria discussed above are met. Total SREC revenue was $33.8 million, $19.3 million and $13.9 million for the years ended December 31, 2017, 2016 and 2015.
Lease Pass-Through Arrangement
In 2015, a lease pass-through fund arrangement became operational under which the Company contributed solar energy systems and the investor contributed cash. Contemporaneously, a wholly owned subsidiary of the Company entered into a master lease arrangement to lease the solar energy systems and the associated PPAs or Solar Leases to the fund investor. The Company’s wholly owned subsidiary made a tax election to pass the ITCs related to the solar energy systems through to the fund investor, who as the legal lessee of the property is allowed to claim the ITCs under Section 50(d)(5) of the Internal Revenue Code and the related regulations.
77
Under this arrangement, the fund investor made a large upfront lease payment to one of the Company’s wholly owned subsidiaries and is obligated to make subsequent periodic payments. The Company allocated a portion of the aggregate payments received from the fund investor to the estimated fair value of the assigned ITCs. The fair value of the ITCs was estimated by multiplying the ITC rate of 30% by the fair value of the systems that were sold to the lease pass-through fund. The fair value of the systems was determined by independent appraisals. The Company’s wholly owned subsidiary has an obligation to ensure the solar energy system is in service and operational for a term of five years to avoid any recapture of the ITCs. Accordingly, the Company recognizes ITC revenue as the recapture provisions lapse assuming all other revenue recognition criteria have been met. The amounts allocated to the ITCs were initially recorded as deferred revenue in the consolidated balance sheet, and subsequently, one-fifth of the amounts allocated to the ITCs is recognized as operating leases and incentives revenue in the consolidated statements of operations based on the anniversary of each solar energy system’s placed in service date.
Solar Energy System Sales
System Sale revenue is recognized when the solar energy system is interconnected to the local power grid and granted permission to operate, assuming all other revenue recognition criteria are met. With respect to System Sales where customers obtain third-party financing, the Company incurs a lender fee, which is recognized as a direct reduction of the recognized revenue related to the sale. Additionally, customers who finance System Sales may require structural upgrades to facilitate the installation of the system, which the Company provides for an additional fee. This revenue is recognized at the point the structural upgrade work is completed, assuming all other revenue recognition criteria are met.
In connection with a System Sale, the Company is obligated to assist with processing and submitting customer claims on the manufacturer warranties, provide routine system monitoring services on sold systems and notify the customer of any problems. While the value and nature of these services is not significant, the Company considers these services to have standalone value to the customer. Therefore, the Company allocates a portion of the contract consideration to these administrative and maintenance services based on the relative selling price method and the Company recognizes the deferred revenue over the contractual service term. As of December 31, 2017 and 2016, the Company’s obligations to customers subsequent to the sale of solar energy systems were approximately $2.1 million and $0.4 million.
Photovoltaic Installation Products
The Company also recognizes revenue from the sale of photovoltaic installation products. These sales are standalone and are recognized at the time of product shipment to the customer, assuming the remaining revenue recognition criteria have been met.
Cost of Revenue
Cost of Revenue—Operating Leases and Incentives
Cost of revenue—operating leases and incentives includes the depreciation of the cost of solar energy systems under long-term customer contracts and the amortization of the related capitalized initial direct costs. It also includes allocated indirect material and labor costs related to the processing; account creation; design; installation; interconnection and servicing of solar energy systems that are not capitalized, such as personnel costs not directly associated to a solar energy system installation; warehouse rent and utilities; and fleet vehicle executory costs. The cost of operating leases and incentives also includes allocated facilities and information technology costs. The cost of revenue for the sales of SRECs is limited to broker fees which are paid in connection with certain SREC transactions.
Cost of Revenue—Solar Energy System and Product Sales
Cost of revenue—solar energy system and product sales consists of direct and allocated indirect material and labor costs for System Sales, photovoltaic installation products and structural upgrades. Indirect material and labor costs are ratably allocated to System Sales and include costs related to the processing; account creation; design; installation; interconnection and servicing of solar energy systems, such as personnel costs not directly associated to a solar energy system installation; warehouse rent and utilities; and fleet vehicle executory costs. The cost of solar energy system and product sales also includes allocated facilities and information technology costs. Costs of solar energy system sales are recognized in conjunction with the related revenue upon the solar energy system passing an inspection by the responsible governmental department after completion of system installation and interconnection to the local power grid, assuming all other revenue recognition criteria are met.
78
Research and development expense is primarily comprised of salaries and benefits associated with research and development personnel and other costs related to photovoltaic installation products and the development of other solar technologies. Research and development costs are charged to expense when incurred. The Company’s research and development expense was $3.3 million, $3.0 million and $3.9 million for the years ended December 31, 2017, 2016 and 2015.
Advertising Costs
Advertising costs are expensed when incurred and are included in sales and marketing expenses in the consolidated statements of operations. The Company’s advertising expense was $2.3 million, $2.3 million and $4.5 million for the years ended December 31, 2017, 2016 and 2015.
Vivint Related Party Expenses
The consolidated financial statements reflect all costs of doing business, including the allocation of expenses incurred by Vivint, Inc. (“Vivint”) on behalf of the Company. The Company has historically relied on the technical support of Vivint to run its business. The Company used certain of Vivint’s information technology and infrastructure until transitioning off in July 2017. These expenses were allocated to the Company on a basis that was considered to reasonably reflect the utilization of the services provided to, or the benefit obtained by, the Company. For additional information, see Note 16—Related Party Transactions.
Other Expense (Income), Net
For the year ended December 31, 2017, other expense (income), net primarily includes changes in fair value for the ineffective portions of the cash flow hedges and the interest rate swaps not designated as hedges.
Provision for Income Taxes
The Company accounts for income taxes under an asset and liability approach. Deferred income taxes are classified as long-term and reflect the impact of temporary differences between assets and liabilities recognized for financial reporting purposes and the amounts recognized for income tax reporting purposes, net operating loss carryforwards, and other tax credits measured by applying currently enacted tax laws. A valuation allowance is provided when necessary to reduce deferred tax assets to an amount that is more likely than not to be realized. As required by ASC 740, the Company recognizes the effect of tax rate and law changes on deferred taxes in the reporting period in which the legislation is enacted.
The Company recognizes sales of solar energy systems to substantially all of the investment funds for income tax purposes. As the investment funds are consolidated by the Company, the gain on the sale of the solar energy systems is not recognized in the consolidated financial statements. However, this gain is recognized for tax reporting purposes. Since these transactions are intercompany sales for GAAP purposes, any tax expense incurred related to these intercompany sales is deferred and recorded as a prepaid tax asset and amortized over the estimated useful life of the underlying solar energy systems, which has been estimated to be 30 years.
The Company determines whether a tax position is more likely than not to be sustained upon examination, including resolution of any related appeals or litigation processes, based on the technical merits of the position. The Company uses a two-step approach to recognizing and measuring uncertain tax positions. The first step is to evaluate the tax position for recognition by determining if the weight of available evidence indicates that it is more likely than not that the position will be sustained upon tax authority examination, including resolution of related appeals or litigation processes, if any. The second step is to measure the tax benefit as the largest amount that is more than 50% likely of being realized upon ultimate settlement.
The Company’s policy is to include interest and penalties related to unrecognized tax benefits, if any, within income tax (benefit) expense.
79
Stock-Based Compensation Expense
Stock-based compensation expense for equity instruments issued to employees is measured based on the grant-date fair value of the awards. The fair value of each restricted stock unit award and performance share unit award is determined as the closing price of the Company’s stock on the date of grant. The fair value of each time-based employee stock option is estimated on the date of grant using the Black-Scholes-Merton stock option pricing valuation model. The Company recognizes compensation costs using the accelerated attribution method for all employee stock-based compensation awards over the requisite service period of the awards, which is generally the awards’ vesting period.
Stock-based compensation expense for equity instruments issued to non-employees is recognized based on the estimated fair value of the equity instrument. The fair value of the non-employee awards is subject to remeasurement at each reporting period until services required under the arrangement are completed, which is the vesting date.
Effective January 1, 2017, the Company adopted ASU 2016-09, which simplifies several aspects of the accounting for share-based payment transactions. The resulting changes were as follows:
|
|
• |
all excess tax benefits and tax deficiencies resulting from stock-based compensation are now recognized as income tax expense or benefit in the consolidated income statements, and excess tax benefits are now recognized regardless of whether the benefit reduces taxes payable in the current period; |
|
|
• |
excess tax benefits are now classified along with other tax cash flows as an operating activity on the consolidated statements of cash flows; |
|
|
• |
the Company elected to recognize forfeitures as they occur beginning on January 1, 2017; |
|
|
• |
the Company may withhold up to the maximum statutory tax rate for each employee without triggering liability accounting; and |
|
|
• |
cash paid by the Company when directly withholding shares for tax withholding purposes is classified as a financing activity on the consolidated statements of cash flows. |
Amendments related to the timing of when excess tax benefits are recognized, minimum statutory withholding requirements and forfeitures were adopted using a modified retrospective transition method by means of a cumulative-effect adjustment, resulting in a net $1.2 million reduction to retained earnings as of January 1, 2017.
Amendments related to the presentation of employee taxes paid on the statements of cash flows when an employer withholds shares for tax withholding purposes was adopted using the retrospective method, but had no impact on prior periods.
Amendments related to the recognition of excess tax benefits and tax deficiencies in the consolidated income statements and the presentation of excess tax benefits on the consolidated statements of cash flows were adopted prospectively. No prior periods were adjusted.
In the second quarter of 2017, the Company adopted ASU 2017-09, which clarifies when changes to equity awards require the use of modification accounting guidance. This update clarifies that if the fair value, vesting conditions and classification of an award remain the same after modification, then modification accounting is not required. This guidance was adopted prospectively and no prior periods were adjusted. The adoption of this ASU had no material effect on the consolidated financial statements.
Post-Employment Benefits
In 2016, the Company began to sponsor its own 401(k) Plan that covered all of the Company’s eligible employees. In 2015, the Company participated in a 401(k) Plan sponsored by Vivint that covered all of the Company’s eligible employees. The Company did not provide a discretionary company match to employee contributions during any of the periods presented.
80
Non-Controlling Interests and Redeemable Non-Controlling Interests
Non-controlling interests and redeemable non-controlling interests represent fund investors’ interests in the net assets of certain consolidated investment funds, which have been entered into by the Company in order to finance the costs of solar energy systems under long-term customer contracts. The Company has determined that the provisions in the contractual arrangements represent substantive profit-sharing arrangements, which gives rise to the non-controlling interests and redeemable non-controlling interests. The Company has further determined that the appropriate methodology for attributing income and loss to the non-controlling interests and redeemable non-controlling interests each period is a balance sheet approach referred to as the hypothetical liquidation at book value (“HLBV”) method. Under the HLBV method, the amounts of income and loss attributed to the non-controlling interests and redeemable non-controlling interests in the consolidated statements of operations reflect changes in the amounts the fund investors would hypothetically receive at each balance sheet date under the liquidation provisions of the contractual agreements of these structures, assuming the net assets of these funding structures were liquidated at recorded amounts. The fund investors’ non-controlling interest in the results of operations of these funding structures is determined as the difference in the non-controlling interests’ and redeemable non-controlling interests’ claims under the HLBV method at the start and end of each reporting period, after considering any capital transactions, such as contributions or distributions, between the fund and the fund investors.
Attributing income and loss to the non-controlling interests and redeemable non-controlling interests under the HLBV method requires the use of significant assumptions and estimates to calculate the amounts that fund investors would receive upon a hypothetical liquidation. Changes in these assumptions and estimates can have a significant impact on the amount that fund investors would receive upon a hypothetical liquidation. The use of the HLBV methodology to allocate income to the non-controlling and redeemable non-controlling interest holders may create volatility in the Company’s consolidated statements of operations as the application of HLBV can drive changes in net income available and loss attributable to non-controlling interests and redeemable non-controlling interests from quarter to quarter.
The Company classifies certain non-controlling interests with redemption features that are not solely within the control of the Company outside of permanent equity on its consolidated balance sheets. Estimated redemption value is calculated as the discounted cash flows subsequent to the expected flip date of the respective investment funds. Redeemable non-controlling interests are reported using the greater of their carrying value at each reporting date as determined by the HLBV method or their estimated redemption value in each reporting period. Estimating the redemption value of the redeemable non-controlling interests requires the use of significant assumptions and estimates. Changes in these assumptions and estimates can have a significant impact on the calculation of the redemption value.
Loss Contingencies
The Company is subject to the possibility of various loss contingencies arising in the ordinary course of business. The Company considers the likelihood of loss or impairment of an asset, or the incurrence of a liability, as well as the Company’s ability to reasonably estimate the amount of loss, in determining loss contingencies. An estimated loss contingency is accrued when it is probable that an asset has been impaired or a liability has been incurred and the amount of loss can be reasonably estimated. The Company regularly evaluates current information available to determine whether an accrual is required, an accrual should be adjusted or a range of possible loss should be disclosed.
Segment Information
The Company’s chief operating decision maker is its chief executive officer. The chief executive officer reviews financial information for purposes of allocating resources and evaluating financial performance. From the second quarter of 2015 through the second quarter of 2016, the Company had aligned its operations as two reporting segments, (1) Residential and (2) Commercial and Industrial (“C&I”), as the result of entering into a C&I investment fund with plans to service customers in the C&I market. During that time, no projects were initiated within the fund and no revenue was recorded in the C&I segment. In June 2016, the Company ended its C&I investment fund and settled with a $1.0 million termination fee. As a result of this termination, the Company realigned and consolidated its reporting segments as the Residential segment, which is again the Company’s only reporting segment. No restatement of prior periods is necessary, as the restated prior periods are the previously disclosed consolidated statements of operations.
Operating expenses in the C&I segment included sales and marketing and general and administrative. For the year ended December 31, 2016 and 2015, sales and marketing expense was $0.3 million and $0.7 million. For the year ended December 31, 2016 and 2015, general and administrative expense was $1.5 million and $2.2 million. The Company did not have any assets or liabilities associated with the C&I fund. For additional information regarding the termination of the C&I investment fund, see Note 12—Investment Funds.
81
Recent Accounting Pronouncements
From March 2016 through December 2016, the Financial Accounting Standards Board (the “FASB”) issued ASU 2016-20, ASU 2016-12, ASU 2016-11, ASU 2016-10 and ASU 2016-08. These updates all clarify aspects of the guidance in ASU 2014-09, Revenue from Contracts with Customers (Topic 606), which represents comprehensive reform to revenue recognition principles related to customer contracts. The effective date of these updates for the Company is January 1, 2018. Adoption of this ASU is either full retrospective to each prior period presented or modified retrospective with a cumulative adjustment to retained earnings or accumulated deficit as of the adoption date. The Company will adopt the standard using the modified retrospective method.
Under the current accounting guidance, the Company accounts for PPAs and Solar Leases as operating leases. The Company has determined that these agreements do not meet the definition of a lease under ASC 842, Leases, and will be accounted for in accordance with Topic 606 once the Company adopts ASC 842. The Company has determined that under Topic 606 there will be no change from current revenue recognition practices for its PPA revenue stream. The Company currently accounts for certain Solar Leases, rebates and incentives as minimum lease payments under ASC 840, Leases. For the Company’s Solar Leases, the Company has concluded that the impact of adopting Topic 606 will be immaterial. Revenue from all of the Company’s Solar Leases will now be recognized on a straight-line basis over the contractual term; currently a significant majority of Solar Leases are recognized on a straight-line basis. The Company has also concluded that there will be no material change related to the timing of revenue recognition for rebates and incentives.
The Company has evaluated the accounting for incremental costs of obtaining a contract, which under current accounting policies are capitalized as initial direct costs and amortized over the lease term. The Company has concluded that it will continue to capitalize the costs of obtaining a PPA, Solar Lease or System Sale contract, which are primarily comprised of sales commissions. For PPA and Solar Lease contracts, the amortization period will remain the life of the related contract, which is 20 years. For System Sales, the capitalized costs of obtaining a contract will continue to be recognized when the related solar energy system is interconnected to the local power grid and granted permission to operate. This will result in minimal changes to the Company’s method of revenue recognition in the consolidated financial statements.
The Company has analyzed the impact of Topic 606 on System Sales and photovoltaic installation products, and has concluded that it will not have a material impact on the method of revenue recognition in the consolidated financial statements.
The Company has assessed the impact of Topic 606 as it relates to the sales of ITCs through its lease pass-through fund arrangement. The Company has concluded that revenue related to the sale of ITCs through its lease pass-through arrangement will be recognized when the related solar energy systems are placed in service. Currently, the Company recognizes this revenue evenly over the five-year ITC recapture period. This earlier recognition of the ITC lease pass-through revenue is anticipated to be material. For example, if Topic 606 was applied retrospectively, the revenue recognized in fiscal 2016 would increase by approximately $12 million and the revenue recognized in fiscal 2017 would be reduced by approximately $8 million.
New Lease Guidance
In February 2016, the FASB issued ASU 2016-02, Leases (Topic 842). The objective of this update is to increase transparency and comparability among organizations by recognizing lease assets and lease liabilities on the balance sheet and disclosing key information about leasing arrangements. This update primarily changes the recognition by lessees of lease assets and liabilities for leases currently classified as operating leases. Lessor accounting remains largely unchanged. This update is effective in fiscal years beginning after December 15, 2018 for public business entities and early adoption is permitted. The amendments are required to be applied using a modified retrospective approach. The Company has determined to adopt this ASU effective January 1, 2019. The Company has operating leases that will be affected by this update and the Company is still evaluating the full impact on its consolidated financial statements and related disclosures. The impact is not expected to be significant to the Company’s consolidated financial statements.
82
Other Recent Accounting Pronouncements
In February 2018, the FASB issued ASU 2018-02, Income Statement—Reporting Comprehensive Income (Topic 220): Reclassification of Certain Tax Effects from Accumulated Other Comprehensive Income. The Tax Cuts and Jobs Act (the “TCJA”) was enacted in December 2017. The TCJA reduced the U.S. federal corporate income tax rate and made other changes to U.S. federal tax law. ASU 2018-02 allows an entity to elect to reclassify the income tax effects of the TCJA on items within accumulated other comprehensive income (“AOCI”) to retained earnings, and requires certain additional disclosures. This update is effective for all entities for fiscal years beginning after December 15, 2018 and early adoption is permitted. The amendments in this update should be applied either in the period of adoption or retrospectively to each period in which the effect of the change in the U.S. federal corporate income tax rate in the TCJA is recognized. The Company expects to early adopt this ASU, effective January 1, 2018, and expects to reclassify the income tax effects of the TCJA on items within AOCI to retained earnings in the period of adoption. The total amount the Company expects to reclassify to retained earnings is approximately $1.5 million.
In August 2017, the FASB issued ASU 2017-12, Derivatives and Hedging (Topic 815): Targeted Improvements to Accounting for Hedging Activities. This update makes targeted improvements to accounting for hedge activities by easing certain documentation and assessment requirements and eliminating the requirement to separately measure and report hedge ineffectiveness. This update is effective for annual periods beginning after December 15, 2018 for public business entities and early adoption is permitted. The amendments in this update should be applied using a modified retrospective transition method by recording a cumulative-effect adjustment related to eliminating the separate measurement of ineffectiveness to AOCI with a corresponding adjustment to the opening balance of retained earnings as of the beginning of the fiscal year of adoption. This ASU will not have a material impact on the Company’s consolidated financial statements and related disclosures. The Company will early adopt the new standard effective January 1, 2018.
In November 2016, the FASB issued ASU 2016-18, Statement of Cash Flows (Topic 230): Restricted Cash (a consensus of the FASB Emerging Issues Task Force). This update clarifies that transfers between cash and restricted cash are not part of the entity’s operating, investing and financing activities, and details of those transfers are not reported as cash flow activities in the statements of cash flows. This update is effective for annual periods beginning after December 15, 2017 for public business entities. The amendments in this update should be applied using the retrospective transition method. This update will have a material impact on the Company’s consolidated statements of cash flows and related disclosures as changes in restricted cash will no longer be presented as cash flows from investing activities.
In October 2016, the FASB issued ASU 2016-16, Income Taxes (Topic 740): Intra-Entity Transfers of Assets Other Than Inventory. Current GAAP prohibits the recognition of current and deferred income taxes for an intra-entity asset transfer until the asset has been sold to an outside party. This update will require an entity to recognize the income tax consequences of an intra-entity transfer of an asset other than inventory when the transfer occurs. This update is effective for annual periods beginning after December 15, 2017 for public business entities. The amendments in this update should be applied using a modified retrospective approach. This update will have a material impact on the Company’s consolidated financial statements and related disclosures as the Company will no longer record prepaid tax assets on the consolidated balance sheets and will record the income tax consequences of intra-entity transfers through income tax expense on the consolidated statements of operations. As of December 31, 2017, the prepaid tax asset, net is $505.9 million and it is anticipated that the vast majority of this amount will be written off to retained earnings upon adoption. Once adopted, the ongoing income tax impacts of these intra-entity transfers will be reported as income tax expense.
In August 2016, the FASB issued ASU 2016-15, Statement of Cash Flows (Topic 230): Classification of Certain Cash Receipts and Cash Payments. This update clarifies how certain cash flows should be classified with the objective of reducing the existing diversity in practice. This update is effective for annual periods beginning after December 15, 2017 for public business entities. The amendments in this update should be applied using a retrospective transition method and must all be applied in the same period. This update will not have a material impact on the Company’s consolidated statements of cash flows.
83
The Company measures and reports its cash equivalents at fair value. The following tables set forth the fair value of the Company’s financial assets and liabilities measured on a recurring basis by level within the fair value hierarchy (in thousands):
|
|
December 31, 2017 |
|
|||||||||||||
|
|
Level 1 |
|
|
Level 2 |
|
|
Level 3 |
|
|
Total |
|
||||
|
Financial Assets |
|
|
|
|
|
|
|
|
|
|
|
|
|
|
|
|
Interest rate swaps |
$ |
— |
|
|
$ |
14,028 |
|
|
$ |
— |
|
|
$ |
14,028 |
|
|
|
|
|
|
|
|
|
|
|
|
|
|
|
|
|
|
|
Financial Liabilities |
|
|
|
|
|
|
|
|
|
|
|
|
|
|
|
|
Interest rate swaps |
$ |
— |
|
|
$ |
1,280 |
|
|
$ |
— |
|
|
$ |
1,280 |
|
|
|
|
|
|
|
|
|
|
|
|
|
|
|
|
|
|
|
|
December 31, 2016 |
|
|||||||||||||
|
|
Level 1 |
|
|
Level 2 |
|
|
Level 3 |
|
|
Total |
|
||||
|
Financial Assets |
|
|
|
|
|
|
|
|
|
|
|
|
|
|
|
|
Interest rate swaps |
$ |
— |
|
|
$ |
14,317 |
|
|
$ |
— |
|
|
$ |
14,317 |
|
|
Time deposits |
|
— |
|
|
|
100 |
|
|
|
— |
|
|
|
100 |
|
|
Total financial assets |
$ |
— |
|
|
$ |
14,417 |
|
|
$ |
— |
|
|
$ |
14,417 |
|
The interest rate swaps (Level 2) were valued using a discounted cash flow model which incorporates an assessment of the risk of non-performance by the interest rate swap counterparties and the Company. The valuation model uses various observable inputs including contractual terms, interest rate curves, credit spreads and measures of volatility. Time deposits (Level 2) approximate fair value due to their short-term nature (30 days) and, upon renewal, the interest rate is adjusted based on current market rates. The Company did not realize gains or losses related to financial assets for any of the periods presented.
The carrying values and fair values of the Company’s long-term debt were as follows (in thousands):
|
|
December 31, 2017 |
|
|
December 31, 2016 |
|
||||||||||
|
|
Carrying Value |
|
|
Fair Value |
|
|
Carrying Value |
|
|
Fair Value |
|
||||
|
Floating-rate long-term debt |
$ |
757,044 |
|
|
$ |
757,044 |
|
|
$ |
771,852 |
|
|
$ |
771,852 |
|
|
Fixed-rate long-term debt |
|
199,063 |
|
|
|
238,618 |
|
|
|
— |
|
|
|
— |
|
|
Total |
$ |
956,107 |
|
|
$ |
995,662 |
|
|
$ |
771,852 |
|
|
$ |
771,852 |
|
The Company’s outstanding principal balance of long-term debt is carried at cost. The Company estimated the fair values of its floating-rate debt facilities to approximate their carrying values as interest accrues at floating rates based on market rates. The Company’s fixed-rate debt facilities (Level 2) were valued using quoted prices for corporate debt with similar terms.
4.Inventories
Inventories consisted of the following (in thousands):
|
|
December 31, |
|
|
December 31, |
|
||
|
|
2017 |
|
|
2016 |
|
||
|
Solar energy systems held for sale |
$ |
21,971 |
|
|
$ |
10,540 |
|
|
Photovoltaic installation products |
|
626 |
|
|
|
745 |
|
|
Total inventories |
$ |
22,597 |
|
|
$ |
11,285 |
|
Solar energy systems held for sale are solar energy systems under construction that have yet to be interconnected to the power grid and that will be sold to customers. Solar energy systems held for sale are stated at the lower of cost, on a FIFO basis, or net realizable value. Photovoltaic installation products are stated at the lower of cost, on an average cost basis, or net realizable value.
84
Solar energy systems, net consisted of the following (in thousands):
|
|
December 31, |
|
|
December 31, |
|
||
|
|
2017 |
|
|
2016 |
|
||
|
System equipment costs |
$ |
1,437,419 |
|
|
$ |
1,238,968 |
|
|
Initial direct costs related to solar energy systems |
|
336,136 |
|
|
|
261,318 |
|
|
|
|
1,773,555 |
|
|
|
1,500,286 |
|
|
Less: Accumulated depreciation and amortization |
|
(129,640 |
) |
|
|
(73,793 |
) |
|
|
|
1,643,915 |
|
|
|
1,426,493 |
|
|
Solar energy system inventory |
|
29,617 |
|
|
|
31,862 |
|
|
Solar energy systems, net |
$ |
1,673,532 |
|
|
$ |
1,458,355 |
|
Solar energy system inventory represents the solar components and materials used in the installation of solar energy systems prior to being installed on customers’ roofs. As such, no depreciation is recorded related to this line item. The Company recorded depreciation and amortization expense related to solar energy systems of $55.8 million, $41.3 million and $22.3 million for the years ended December 31, 2017, 2016 and 2015.
6.Property and Equipment
Property and equipment, net consisted of the following (in thousands):
|
|
|
Estimated |
|
December 31, |
|
|
December 31, |
|
||
|
|
|
Useful Lives |
|
2017 |
|
|
2016 |
|
||
|
Vehicles acquired under capital leases |
|
3-5 years |
|
$ |
15,113 |
|
|
$ |
20,384 |
|
|
Leasehold improvements |
|
1-12 years |
|
|
15,071 |
|
|
|
14,694 |
|
|
Furniture and computer and other equipment |
|
3 years |
|
|
6,492 |
|
|
|
6,270 |
|
|
|
|
|
|
|
36,676 |
|
|
|
41,348 |
|
|
Less: Accumulated depreciation and amortization |
|
|
|
|
(21,598 |
) |
|
|
(18,149 |
) |
|
Property and equipment, net |
|
|
|
$ |
15,078 |
|
|
$ |
23,199 |
|
The Company recorded depreciation and amortization related to property and equipment of $8.4 million, $11.1 million and $8.2 million for the years ended December 31, 2017, 2016 and 2015.
The Company leases fleet vehicles that are accounted for as capital leases and are included in property and equipment, net. Of total property and equipment depreciation and amortization, depreciation on vehicles under capital leases of $3.6 million, $5.5 million and $5.5 million was capitalized in solar energy systems, net for the years ended December 31, 2017, 2016 and 2015.
Future minimum lease payments for vehicles under capital leases as of December 31, 2017 were as follows (in thousands):
|
Years Ending December 31, |
|
|
|
|
|
2018 |
|
$ |
4,457 |
|
|
2019 |
|
|
1,232 |
|
|
2020 |
|
|
455 |
|
|
2021 |
|
|
— |
|
|
2022 |
|
|
— |
|
|
Thereafter |
|
|
— |
|
|
Total minimum lease payments |
|
|
6,144 |
|
|
Less: interest |
|
|
379 |
|
|
Present value of capital lease obligations |
|
|
5,765 |
|
|
Less: current portion |
|
|
4,166 |
|
|
Long-term portion |
|
$ |
1,599 |
|
85
7.Intangible Assets and Goodwill
Intangible Assets
Intangible assets consisted of the following (in thousands):
|
|
December 31, |
|
|
December 31, |
|
||
|
|
2017 |
|
|
2016 |
|
||
|
Cost: |
|
|
|
|
|
|
|
|
Internal-use software |
$ |
1,314 |
|
|
$ |
1,314 |
|
|
Developed technology |
|
522 |
|
|
|
522 |
|
|
Trademarks/trade names |
|
201 |
|
|
|
201 |
|
|
Customer relationships |
|
164 |
|
|
|
164 |
|
|
Total carrying value |
|
2,201 |
|
|
|
2,201 |
|
|
Accumulated amortization: |
|
|
|
|
|
|
|
|
Internal-use software |
|
(872 |
) |
|
|
(434 |
) |
|
Developed technology |
|
(258 |
) |
|
|
(191 |
) |
|
Trademarks/trade names |
|
(79 |
) |
|
|
(59 |
) |
|
Customer relationships |
|
(130 |
) |
|
|
(97 |
) |
|
Total accumulated amortization |
|
(1,339 |
) |
|
|
(781 |
) |
|
Total intangible assets, net |
$ |
862 |
|
|
$ |
1,420 |
|
The Company recorded amortization expense of $0.6 million, $0.9 million and $13.2 million for the years ended December 31, 2017, 2016 and 2015.
In February 2015, the Company ceased the external sales of the SunEye and PV Designer products, the rights to which the Company acquired when it acquired Solmetric. This change was considered an indicator of impairment, and a review regarding the recoverability of the carrying value of the related intangible assets was performed. In-process research and development, which was intended to generate Solmetric product sales in the residential market, was terminated and deemed fully impaired resulting in a charge of $2.1 million. The Solmetric, SunEye and PV Designer trade names were determined to no longer be utilized and were deemed fully impaired resulting in a charge of $1.3 million. The SunEye and PV Designer developed technology assets were deemed fully impaired resulting in a charge of $0.7 million. Customer relationships were deemed partially impaired by $0.4 million due to the loss of external customers who purchased the SunEye and PV Designer. As a result of this review, the Company recorded a total impairment charge of $4.5 million for the year ended December 31, 2015. No impairment was recorded in the years ended December 31, 2017 and 2016. In the second quarter of 2016, the Company resumed external sales of the SunEye product.
As of December 31, 2017, expected amortization expense for the unamortized intangible assets was as follows (in thousands):
|
Years Ending December 31, |
|
|
|
|
2018 |
$ |
515 |
|
|
2019 |
|
134 |
|
|
2020 |
|
86 |
|
|
2021 |
|
86 |
|
|
2022 |
|
20 |
|
|
Thereafter |
|
21 |
|
|
Total |
$ |
862 |
|
86
The Company’s market capitalization decreased significantly during the first quarter of 2016 from $1.0 billion as of December 31, 2015 to $283.0 million as of March 31, 2016 in conjunction with the Company’s determination to terminate an agreement and plan of merger with SunEdison, Inc. (“SunEdison”) and SEV Merger Sub Inc. The Company considered this significant decrease in market capitalization to be an indicator of impairment and the Company performed a goodwill impairment test as of March 31, 2016. The Company performed a step-one test for impairment using the discounted cash flow methodology to estimate the fair value of the reporting unit and determined that the carrying book value of the reporting unit was higher than the business unit’s fair value. The Company then performed a step-two test which utilizes purchase price allocation using the estimated fair value from step-one as the purchase price to determine the implied fair value of the reporting unit’s goodwill. The step-two impairment test determined that there was no implied value of goodwill, which resulted in an impairment charge of $36.6 million. This charge was recorded in impairment of goodwill for the year ended December 31, 2016.
8.Accrued Compensation
Accrued compensation consisted of the following (in thousands):
|
|
December 31, |
|
|
December 31, |
|
||
|
|
2017 |
|
|
2016 |
|
||
|
Accrued payroll |
$ |
13,064 |
|
|
$ |
12,558 |
|
|
Accrued commissions |
|
7,928 |
|
|
|
7,445 |
|
|
Total accrued compensation |
$ |
20,992 |
|
|
$ |
20,003 |
|
9.Accrued and Other Current Liabilities
Accrued and other current liabilities consisted of the following (in thousands):
|
|
December 31, |
|
|
December 31, |
|
||
|
|
2017 |
|
|
2016 |
|
||
|
Accrued unused commitment fees and interest |
$ |
7,445 |
|
|
$ |
3,827 |
|
|
Current portion of lease pass-through financing obligation |
|
4,931 |
|
|
|
4,833 |
|
|
Accrued inventory |
|
4,122 |
|
|
|
2,117 |
|
|
Accrued professional fees |
|
3,977 |
|
|
|
3,222 |
|
|
Sales, use and property taxes payable |
|
3,046 |
|
|
|
1,785 |
|
|
Current portion of deferred rent |
|
937 |
|
|
|
1,155 |
|
|
Other accrued expenses |
|
5,217 |
|
|
|
2,425 |
|
|
Total accrued and other current liabilities |
$ |
29,675 |
|
|
$ |
19,364 |
|
87
Debt obligations consisted of the following as of December 31, 2017 (in thousands, except interest rates):
|
|
Principal |
|
|
Unamortized Debt |
|
|
|
|
|
|
|
|
|
|
Unused |
|
|
|
|
|
|
|
|||||||
|
|
Borrowings |
|
|
Issuance Costs |
|
|
Net Carrying Value |
|
|
Borrowing |
|
|
Interest |
|
|
Maturity |
|||||||||||||
|
|
Outstanding |
|
|
Current |
|
|
Long-term |
|
|
Current |
|
|
Long-term |
|
|
Capacity |
|
|
Rate |
|
|
Date |
|||||||
|
2017 Term loan facility |
$ |
197,764 |
|
|
$ |
(176 |
) |
|
$ |
(4,990 |
) |
|
$ |
6,644 |
|
|
$ |
185,954 |
|
|
$ |
— |
|
|
|
6.0 |
% |
|
January 2035 |
|
2016 Term loan facility(1) |
|
287,919 |
|
|
|
(141 |
) |
|
|
(7,623 |
) |
|
|
4,962 |
|
|
|
275,193 |
|
|
|
— |
|
|
|
4.3 |
|
|
August 2021 |
|
Subordinated HoldCo facility |
|
197,625 |
|
|
|
(35 |
) |
|
|
(3,451 |
) |
|
|
1,965 |
|
|
|
192,174 |
|
|
|
— |
|
|
|
9.3 |
|
|
March 2020 |
|
Credit agreement |
|
1,299 |
|
|
|
(2 |
) |
|
|
(140 |
) |
|
|
14 |
|
|
|
1,143 |
|
|
|
— |
|
|
|
6.5 |
|
|
February 2023 |
|
Revolving lines of credit(2) |
|
|
|
|
|
|
|
|
|
|
|
|
|
|
|
|
|
|
|
|
|
|
|
|
|
|
|
|
|
|
Aggregation facility(3) |
|
135,000 |
|
|
|
— |
|
|
|
— |
|
|
|
— |
|
|
|
135,000 |
|
|
|
240,000 |
|
|
|
4.7 |
|
|
September 2020 |
|
Working capital facility(4) |
|
136,500 |
|
|
|
— |
|
|
|
— |
|
|
|
— |
|
|
|
136,500 |
|
|
|
— |
|
|
|
4.8 |
|
|
March 2020 |
|
Total debt |
$ |
956,107 |
|
|
$ |
(354 |
) |
|
$ |
(16,204 |
) |
|
$ |
13,585 |
|
|
$ |
925,964 |
|
|
$ |
240,000 |
|
|
|
|
|
|
|
Debt obligations consisted of the following as of December 31, 2016 (in thousands, except interest rates):
|
|
Principal |
|
|
Unamortized Debt |
|
|
|
|
|
|
|
|
|
|
Unused |
|
|
|
|
|
|
|
|||||||
|
|
Borrowings |
|
|
Issuance Costs |
|
|
Net Carrying Value |
|
|
Borrowing |
|
|
Interest |
|
|
Maturity |
|||||||||||||
|
|
Outstanding |
|
|
Current |
|
|
Long-term |
|
|
Current |
|
|
Long-term |
|
|
Capacity |
|
|
Rate |
|
|
Date |
|||||||
|
2016 Term loan facility(1) |
$ |
297,506 |
|
|
$ |
(169 |
) |
|
$ |
(9,643 |
) |
|
$ |
4,788 |
|
|
$ |
282,906 |
|
|
$ |
— |
|
|
|
3.6 |
% |
|
August 2021 |
|
Subordinated HoldCo facility |
|
149,500 |
|
|
|
(47 |
) |
|
|
(4,851 |
) |
|
|
1,453 |
|
|
|
143,149 |
|
|
|
50,000 |
|
|
|
8.6 |
|
|
March 2020 |
|
Credit agreement |
|
1,346 |
|
|
|
(1 |
) |
|
|
(161 |
) |
|
|
11 |
|
|
|
1,173 |
|
|
|
— |
|
|
|
6.5 |
|
|
February 2023 |
|
Revolving lines of credit(2) |
|
|
|
|
|
|
|
|
|
|
|
|
|
|
|
|
|
|
|
|
|
|
|
|
|
|
|
|
|
|
Aggregation facility |
|
187,000 |
|
|
|
— |
|
|
|
— |
|
|
|
— |
|
|
|
187,000 |
|
|
|
188,000 |
|
|
|
4.2 |
|
|
March 2018 |
|
Working capital facility(4) |
|
136,500 |
|
|
|
— |
|
|
|
— |
|
|
|
— |
|
|
|
136,500 |
|
|
|
— |
|
|
|
3.9 |
|
|
March 2020 |
|
Total debt |
$ |
771,852 |
|
|
$ |
(217 |
) |
|
$ |
(14,655 |
) |
|
$ |
6,252 |
|
|
$ |
750,728 |
|
|
$ |
238,000 |
|
|
|
|
|
|
|
|
(1) |
The interest rate of this facility is partially hedged to an effective interest rate of 4.0% for $260.9 million of the principal borrowings. See Note 11—Derivative Financial Instruments. |
|
(2) |
Revolving lines of credit are not presented net of unamortized debt issuance costs. |
|
(3) |
The Aggregation facility was amended in March 2017. See the section captioned “—Aggregation Facility.” |
|
(4) |
Facility is recourse debt, which refers to debt that is collateralized by the Company’s general assets. All of the Company’s other debt obligations are non-recourse, which refers to debt that is only collateralized by specified assets or subsidiaries of the Company. |
2017 Term Loan Facility
In January 2017, the Company entered into a long-term fixed rate credit agreement (the “2017 Term Loan Facility”) pursuant to which the Company borrowed $203.8 million with certain financial institutions for which Wells Fargo Bank, National Association is acting as administrative agent. The borrower under the 2017 Term Loan Facility is Vivint Solar Financing III, LLC, a wholly owned subsidiary of the Company. Proceeds of the 2017 Term Loan Facility were used to (1) repay existing indebtedness of $140.3 million under the Aggregation Facility with respect to the portfolio of projects being used as collateral for the 2017 Term Loan Facility (the “2017 Term Loan Portfolio”), (2) fund a debt service reserve account and other agreed reserves of $20.1 million, (3) pay transaction costs and fees in connection with the 2017 Term Loan Facility of $5.5 million, (4) pay the ITC insurance premium of $2.0 million on behalf of one of the Company’s investment funds, and (5) distribute $35.9 million to the Company as reimbursement for capital costs associated with deployment of the 2017 Term Loan Portfolio.
Interest on borrowings accrues at an annual fixed rate equal to 6.0% and is payable in arrears. Certain principal payments are due on a quarterly basis, subject to the occurrence of certain events. The Company’s first principal and interest payment was made in April 2017. Principal and interest payable under the 2017 Term Loan Facility will be paid over the term of the loan until the final maturity date of January 5, 2035. Optional prepayments are permitted under the 2017 Term Loan Facility without premium or penalty.
The 2017 Term Loan Facility includes customary events of default, conditions to borrowing and covenants, including negative covenants that restrict, subject to certain exceptions, the borrower’s and the guarantors’ ability to incur indebtedness, incur liens, make fundamental changes to their respective businesses, make certain types of restricted payments and investments or enter into certain transactions with affiliates. The borrower is required to maintain an average debt service coverage ratio of 1.20 to 1. As of December 31, 2017, the Company was in compliance with such covenants.
88
The obligations of the borrower are secured by a pledge of the membership interests in the borrower, all of the borrower’s assets, and the assets of the borrower’s directly owned subsidiaries acting as managing members of the 2017 Term Loan Portfolio. In addition, the Company guarantees certain obligations of the borrower under the 2017 Term Loan Facility.
Interest expense for the 2017 Term Loan Facility was $12.6 million for the year ended December 31, 2017. No interest expense was incurred for the years ended December 31, 2016 and 2015. As of December 31, 2017, the Company had $19.2 million in required reserves outstanding in collateral accounts with the administrative agent, which were included in restricted cash and cash equivalents.
2016 Term Loan Facility
In August 2016, the Company entered into a credit agreement (the “2016 Term Loan Facility”) pursuant to which it borrowed $300.0 million aggregate principal amount of term borrowings and $12.1 million for letters of credit from certain financial institutions for which Investec Bank PLC is acting as administrative agent. The borrower under the 2016 Term Loan Facility is Vivint Solar Financing II, LLC, a wholly owned subsidiary of the Company.
For the initial four years of the term of the 2016 Term Loan Facility, interest on borrowings accrues at an annual rate equal to the London Interbank Offered Rate (“LIBOR”) plus 3.00%. Thereafter interest accrues at an annual rate equal to LIBOR plus 3.25%. The Company has entered into an interest rate swap hedging arrangement such that approximately 90% of the aggregate principal amount of the outstanding term loan is subject to a fixed interest rate. See Note 11—Derivative Financial Instruments. Certain principal payments are due on a quarterly basis subject to the occurrence of certain events, including proceeds received by the borrower or subsidiary guarantors in respect of casualties, proceeds received for purchased systems and failure to meet certain distribution conditions. Estimated principal payments due in the next 12 months are classified as the current portion of long-term debt, net of the related unamortized debt issuance costs. Optional prepayments, in whole or in part, are permitted under the 2016 Term Loan Facility, without premium or penalty apart from any customary LIBOR breakage provisions.
The 2016 Term Loan Facility includes customary events of default, conditions to borrowing and covenants, including negative covenants that restrict, subject to certain exceptions, the borrower’s and the guarantors’ ability to incur indebtedness, incur liens, make fundamental changes to their respective businesses, make certain types of restricted payments and investments or enter into certain transactions with affiliates. A debt service reserve account was funded with the outstanding letters of credit under the 2016 Term Loan Facility. As such, the debt service reserve is not classified as restricted cash and cash equivalents on the consolidated balance sheets. The borrower is required to maintain an average debt service coverage ratio of 1.55 to 1. As of December 31, 2017, the Company was in compliance with such covenants.
Prior to the maturity of the 2016 Term Loan Facility, a fund investor could exercise a put option in two of the Company’s investment funds and require the Company to purchase the fund investor’s interest in those investment funds. As such, the Company was required to establish a reserve at the inception of the 2016 Term Loan Facility in order to pay the fund investor if either of the put options is exercised prior to the maturity of the 2016 Term Loan Facility. As of December 31, 2017, the Company had $2.6 million in required reserves outstanding in collateral accounts with the administrative agent, which were included in restricted cash and cash equivalents. Previously, the Company was required to establish a $2.4 million escrow account with respect to those systems in the 2016 Term Loan Portfolio that had not been placed in service as of the closing date. During 2017, these conditions were met and the escrow was released.
The obligations of the borrower are secured by a pledge of the membership interests in the borrower, all of the borrower’s assets, and the assets of the borrower’s directly owned subsidiaries acting as managing members of the underlying investment funds. In addition, the Company guarantees certain obligations of the borrower under the 2016 Term Loan Facility.
Interest expense for the 2016 Term Loan Facility was $14.4 million and $5.8 million for the years ended December 31, 2017 and 2016. No interest expense was incurred for the year ended December 31, 2015.
Subordinated HoldCo Facility
In March 2016, the Company entered into a financing agreement (the “Subordinated HoldCo Facility”) pursuant to which it borrowed an aggregate principal amount of $200.0 million of term loans from investment funds and accounts advised by HPS Investment Partners. The borrower under the Subordinated HoldCo Facility is Vivint Solar Financing Holdings, LLC, one of the Company’s wholly owned subsidiaries. Borrowings under the Subordinated Holdco Facility mature in March 2020. The Company may not prepay any borrowings outside of required prepayments until March 2018, and any subsequent prepayments of principal are subject to a 3.0% fee. Borrowings under the Subordinated HoldCo Facility were used for the construction and acquisition of solar energy systems.
89
Interest accrues at a floating rate of LIBOR plus 8.0%. Certain principal payments are due on a quarterly basis. Estimated principal payments due in the next 12 months are classified as current portion of long-term debt, net of the related unamortized debt issuance costs.
The Subordinated HoldCo Facility includes customary events of default, conditions to borrowing and covenants, including covenants that restrict, subject to certain exceptions, the borrower’s, and the guarantors’ ability to incur indebtedness, incur liens, make investments, make fundamental changes to their business, dispose of assets, make certain types of restricted payments or enter into certain related party transactions. These restrictions do not impact the Company’s ability to enter into investment funds, including those that are similar to those entered into previously. Additionally, the parties to the Subordinated HoldCo Facility must maintain certain consolidated and project subsidiary loan-to-value ratios and a consolidated debt service coverage ratio, with such covenants to be tested as of the last day of each fiscal quarter and upon each incurrence of borrowings. As of December 31, 2017, the Company was in compliance with such covenants. Each of the parties to the Subordinated HoldCo Facility has pledged assets not otherwise pledged under another existing debt facility as collateral to secure their obligations under the Subordinated HoldCo Facility. Vivint Solar Financing Holdings Parent, LLC, another of the Company’s wholly owned subsidiaries and the parent company of the borrower and certain other of the Company’s subsidiaries guarantee the borrower’s obligations under the financing agreement.
Interest expense for the Subordinated HoldCo Facility was $19.5 million and $7.3 million for the years ended December 31, 2017 and 2016. No interest expense was recorded for the year ended December 31, 2015. A $10.4 million interest reserve amount was deposited in an interest reserve account with the administrative agent and is included in restricted cash and cash equivalents.
Credit Agreement
In February 2016, a wholly owned subsidiary of the Company entered into a credit agreement (the “Credit Agreement”) pursuant to which Goldman Sachs, through GSUIG Real Estate Member LLC, committed to lend an aggregate principal amount of up to $3.0 million upon the satisfaction of certain conditions and the approval of the lenders. Proceeds from the Credit Agreement were used for the deployment of certain solar energy systems. Principal and interest payments under the Credit Agreement will be paid quarterly over the term of the loan until the final maturity date of February 2023. The Company did not draw upon the full borrowing capacity of the Credit Agreement, and no borrowing capacity remained as of December 31, 2017. Interest accrues on borrowings at a rate of 6.50%. Interest expense under the Credit Agreement was $0.1 million for the years ended December 31, 2017 and 2016. No interest expense was recorded for the year ended December 31, 2015.
Aggregation Facility
In September 2014, the Company entered into an aggregation credit facility (as amended, the “Aggregation Facility”), pursuant to which the Company may borrow up to an aggregate of $375.0 million and, upon the satisfaction of certain conditions and the approval of the lenders, up to an additional aggregate of $175.0 million in borrowings with certain financial institutions for which Bank of America, N.A. is acting as administrative agent.
In March 2017, the Company amended the Aggregation Facility, and the parties agreed to (1) extend the date through which the Company may incur borrowings under the Aggregation Facility to March 31, 2020 (“Availability Period”), with an option to extend such period by an additional 12 months to the extent the lenders agree to such extension; (2) extend the maturity date for the initial loans under the Aggregation Facility from March 2018 to September 2020; and (3) increase the “Applicable Margin” used to determine the applicable interest rate on outstanding borrowings after the Availability Period from 3.50% to 3.75%. The “Applicable Margin” used to determine the applicable interest rate on outstanding borrowings during the Availability Period remains unchanged at 3.25%.
In addition, the amendments to the Aggregation Facility (1) allow the Company to satisfy concentration covenants by maintaining insurance policies with respect to certain tax equity funds for the benefit of the lenders to cover any indemnification payments the Company may be required to make to certain of its tax equity investors in connection with the loss of ITCs, and (2) modify the customer FICO score requirement thresholds to enable the Company to borrow more against certain solar energy systems. The amendments to the Aggregation Facility also provide the ability for the Company to enter into forward-starting interest rate hedges and require no less than 75% of outstanding loan balances to be hedged. The Company is required to meet this threshold within 15 business days after the end of each quarterly period. See Note 11—Derivative Financial Instruments.
90
Prepayments are permitted under the Aggregation Facility, and the principal and accrued interest on any outstanding loans mature in September 2020. Under the Aggregation Facility, interest on borrowings accrues at a floating rate equal to either (1)(a) LIBOR or (b) the greatest of (i) the Federal Funds Rate plus 0.5%, (ii) the administrative agent’s prime rate and (iii) LIBOR plus 1% and (2) a margin that varies between 3.25% during the period during which the Company may incur borrowings and 3.75% after such period. Interest is payable at the end of each interest period that the Company may elect as a term of either one, two or three months.
The borrower under the Aggregation Facility is Vivint Solar Financing I, LLC, one of the Company’s wholly owned subsidiaries, which in turn holds the Company’s interests in the managing members in certain of the Company’s investment funds. These managing members guarantee the borrower’s obligations under the Aggregation Facility. In addition, Vivint Solar Financing I Parent, LLC, has pledged its interests in the borrower, and the borrower has pledged its interests in the guarantors as security for the borrower’s obligations under the Aggregation Facility. The related solar energy systems are not subject to any security interest of the lenders, and there is no recourse to the Company in the case of a default.
The Aggregation Facility includes customary covenants, including covenants that restrict, subject to certain exceptions, the borrower’s, and the guarantors’ ability to incur indebtedness, incur liens, make investments, make fundamental changes to their business, dispose of assets, make certain types of restricted payments or enter into certain related party transactions. Among other restrictions, the Aggregation Facility provides that the borrower may not incur any indebtedness other than that related to the Aggregation Facility or in respect of permitted swap agreements, and that the guarantors may not incur any indebtedness other than that related to the Aggregation Facility or as permitted under existing investment fund transaction documents. These restrictions do not impact the Company’s ability to enter into investment funds, including those that are similar to those entered into previously. As of December 31, 2017, the Company was in compliance with such covenants.
The Aggregation Facility also contains certain customary events of default. If an event of default occurs, lenders under the Aggregation Facility will be entitled to take various actions, including the acceleration of amounts due under the Aggregation Facility and foreclosure on the interests of the borrower and the guarantors that have been pledged to the lenders.
Interest expense was $10.3 million, $14.1 million and $9.9 million for the years ended December 31, 2017, 2016 and 2015. As of December 31, 2017, the current portion of debt issuance costs of $3.1 million was recorded in prepaid expenses and other current assets, and the long-term portion of debt issuance costs of $5.4 million was recorded in other non-current assets, net. As of December 31, 2017, the Company had $4.1 million in required reserves outstanding in collateral accounts with the administrative agent, which were included in restricted cash and cash equivalents.
Working Capital Facility
In March 2015, the Company entered into a revolving credit agreement (the “Working Capital Facility”) pursuant to which the Company may borrow up to an aggregate principal amount of $150.0 million from certain financial institutions for which Goldman Sachs Lending Partners LLC is acting as administrative agent and collateral agent. Available borrowings under the Working Capital Facility are subject to a borrowing base tied to the (1) level of PPA and Solar Lease systems under development and (2) combined future available tax equity fund commitments and available borrowing capacity under the Company’s back-leverage facilities. To the extent that outstanding borrowings exceed the borrowing base, the Company would be required to repay borrowings under the Working Capital Facility. Loans under the Working Capital Facility will be used to pay for the costs incurred in connection with the design and construction of solar energy systems, and letters of credit may be issued for working capital and general corporate purposes. In addition to the outstanding borrowings as of December 31, 2017, the Company had established letters of credit under the Working Capital Facility for up to $13.5 million related to insurance contracts.
The Company has pledged the interests in the assets of the Company and its subsidiaries, excluding the Company’s existing investment funds, their managing members, the 2017 Term Loan Facility, the 2016 Term Loan Facility, the Subordinated HoldCo Facility, the Aggregation Facility and Solmetric Corporation, as security for its obligations under the Working Capital Facility. Prepayments are permitted under the Working Capital Facility, and the principal and accrued interest on any outstanding loans mature in March 2020. Interest accrues on borrowings at a floating rate equal to, dependent on the type of borrowing, (1) a rate equal to the Eurodollar Rate for the interest period divided by one minus the Eurodollar Reserve Percentage, plus a margin of 3.25%; or (2) the highest of (a) the Federal Funds Rate plus 0.50%, (b) the Citibank prime rate and (c) the one-month interest period Eurodollar rate plus 1.00%, plus a margin of 2.25%. Interest is payable dependent on the type of borrowing at the end of (1) the interest period that the Company may elect as a term and not to exceed three months, (2) quarterly or (3) at maturity of the Working Capital Facility.
91
The Working Capital Facility includes customary covenants, including covenants that restrict, subject to certain exceptions, the Company’s ability to incur indebtedness, incur liens, make investments, make fundamental changes to its business, dispose of assets, make certain types of restricted payments or enter into certain related party transactions. Among other restrictions, the Working Capital Facility provides that the Company may not incur any indebtedness other than that related to the Working Capital Facility or permitted swap agreements. These restrictions do not impact the Company’s ability to enter into investment funds, including those that are similar to those entered into previously. The Company is also required to maintain $25.0 million in cash and cash equivalents and certain investments as of the last day of each quarter. As of December 31, 2017, the Company was in compliance with such covenants.
The Working Capital Facility also contains certain customary events of default. If an event of default occurs, lenders under the Working Capital Facility will be entitled to take various actions, including the acceleration of amounts then outstanding.
Interest expense for this facility was $6.7 million, $6.1 million and $2.3 million for the years ended December 31, 2017, 2016 and 2015. As of December 31, 2017, the current portion of debt issuance costs of $0.6 million was recorded in prepaid expenses and other current assets, and the long-term portion of debt issuance costs of $0.7 million was recorded in other non-current assets, net.
Interest Expense and Amortization of Debt Issuance Costs
For the years ended December 31, 2017, 2016 and 2015, total interest expense incurred under debt obligations was $63.6 million, $33.4 million and $12.2 million, of which $8.8 million, $6.5 million and $3.5 million was amortization of debt issuance costs.
Scheduled Maturities of Debt
The scheduled maturities of debt as of December 31, 2017 are as follows (in thousands):
|
2018 |
$ |
13,939 |
|
|
2019 |
|
13,939 |
|
|
2020 |
|
477,113 |
|
|
2021 |
|
278,085 |
|
|
2022 |
|
5,791 |
|
|
Thereafter |
|
167,240 |
|
|
Total |
$ |
956,107 |
|
11.Derivative Financial Instruments
Derivative financial instruments at fair value consisted of the following (in thousands):
|
|
|
December 31, 2017 |
||||
|
|
|
Fair Value |
|
|
Balance Sheet Location |
|
|
Derivatives designated as hedging instruments: |
|
|
|
|
|
|
|
Interest rate swaps |
|
$ |
14,028 |
|
|
Other non-current assets |
|
Derivatives not designated as hedging instruments: |
|
|
|
|
|
|
|
Interest rate swaps |
|
$ |
1,280 |
|
|
Other non-current liabilities |
|
|
|
December 31, 2016 |
||||
|
|
|
Fair Value |
|
|
Balance Sheet Location |
|
|
Derivatives designated as hedging instruments: |
|
|
|
|
|
|
|
Interest rate swaps |
|
$ |
14,317 |
|
|
Other non-current assets |
The Company is exposed to interest rate risk relating to its outstanding debt facilities that have variable interest rates. In connection with the 2016 Term Loan Facility, the Company entered into interest rate swaps to offset changes in the variable interest rate for a portion of the Company’s LIBOR-indexed floating-rate loans. As of December 31, 2017, the notional amount of these interest rate swaps was $260.9 million. The notional amount of the interest rate swaps decreases through July 31, 2028 similar to the Company’s estimated monthly and quarterly principal payments on its loans through that date. The interest rate swaps are designated as cash flow hedges, and unrealized gains or losses on the effective portion are recorded in OCI. The amount of AOCI expected to be reclassified to interest expense within the next 12 months is approximately $2.0 million. The Company will discontinue the hedge accounting designation of these derivatives if interest payments on LIBOR-indexed floating rate loans compared to the payments under the derivatives are no longer highly effective.
92
In connection with the March 2017 amendment of the Aggregation Facility, the Company is required to maintain interest rate swaps such that at least 75% of the outstanding loan balance of the Aggregation Facility is hedged. The Company is required to meet this threshold within 15 business days after the end of each quarterly period. As of December 31, 2017, the Company had entered into interest rate swaps with an aggregate notional amount of $77.0 million. The interest rate swaps terminate when the Aggregation Facility matures in September 2020. The Company did not designate these interest rate swaps as hedge instruments and accounts for any changes in fair value in other expense, net.
The Company records derivatives at fair value. The effect of derivative financial instruments on the consolidated statements of comprehensive income (loss) and the consolidated statements of operations, before tax effect, consisted of the following (in thousands):
|
|
|
Year Ended December 31, |
|
|
|||||||||
|
|
|
2017 |
|
|
2016 |
|
|
2015 |
|
Location of Gain (Loss) |
|||
|
Derivatives designated as cash flow hedges: |
|
|
|
|
|
|
|
|
|
|
|
|
|
|
(Losses) gains recognized in OCI - effective portion: |
|
|
|
|
|
|
|
|
|
|
|
|
|
|
Interest rate swaps |
|
$ |
(1,405 |
) |
|
$ |
13,133 |
|
|
$ |
— |
|
OCI |
|
|
|
|
|
|
|
|
|
|
|
|
|
|
|
|
Gains (losses) reclassified from AOCI into income - effective portion: |
|
|
|
|
|
|
|
|
|
|
|
|
|
|
Interest rate swaps |
|
$ |
195 |
|
|
$ |
(407 |
) |
|
$ |
— |
|
Interest expense |
|
|
|
|
|
|
|
|
|
|
|
|
|
|
|
|
Gains recognized in income - ineffective portion: |
|
|
|
|
|
|
|
|
|
|
|
|
|
|
Interest rate swaps |
|
$ |
921 |
|
|
$ |
1,591 |
|
|
$ |
— |
|
Other expense, net |
|
|
|
Year Ended December 31, |
|
|
|||||||||
|
|
|
2017 |
|
|
2016 |
|
|
2015 |
|
Location of Gain (Loss) |
|||
|
Derivatives not designated as hedging instruments: |
|
|
|
|
|
|
|
|
|
|
|
|
|
|
Interest rate swaps |
|
$ |
(1,280 |
) |
|
$ |
— |
|
|
$ |
— |
|
Other expense, net |
12.Investment Funds
As of December 31, 2017, and 2016, the Company had formed investment funds for the purpose of funding the purchase of solar energy systems under long-term customer contracts. The aggregate carrying value of these funds’ assets and liabilities (after elimination of intercompany transactions and balances) in the Company’s consolidated balance sheets were as follows (in thousands):
|
|
December 31, |
|
|
December 31, |
|
||
|
|
2017 |
|
|
2016 |
|
||
|
Assets |
|
|
|
|
|
|
|
|
Current assets: |
|
|
|
|
|
|
|
|
Cash and cash equivalents |
$ |
17,280 |
|
|
$ |
23,190 |
|
|
Accounts receivable, net |
|
5,143 |
|
|
|
3,958 |
|
|
Prepaid expenses and other current assets |
|
952 |
|
|
|
761 |
|
|
Total current assets |
|
23,375 |
|
|
|
27,909 |
|
|
Solar energy systems, net |
|
1,486,023 |
|
|
|
1,273,813 |
|
|
Other non-current assets, net |
|
6,792 |
|
|
|
1,781 |
|
|
Total assets |
$ |
1,516,190 |
|
|
$ |
1,303,503 |
|
|
Liabilities |
|
|
|
|
|
|
|
|
Current liabilities: |
|
|
|
|
|
|
|
|
Distributions payable to non-controlling interests and redeemable non-controlling interests |
$ |
16,437 |
|
|
$ |
16,176 |
|
|
Current portion of deferred revenue |
|
9,176 |
|
|
|
8,148 |
|
|
Accrued and other current liabilities |
|
4,478 |
|
|
|
4,458 |
|
|
Total current liabilities |
|
30,091 |
|
|
|
28,782 |
|
|
Deferred revenue, net of current portion |
|
26,847 |
|
|
|
33,536 |
|
|
Other non-current liabilities |
|
1,444 |
|
|
|
1,875 |
|
|
Total liabilities |
$ |
58,382 |
|
|
$ |
64,193 |
|
93
The Company consolidates the investment funds in which it has an equity interest, and all intercompany balances and transactions between the Company and the investment funds are eliminated in the consolidated financial statements. The Company determined that each of these investment funds meets the definition of a VIE. The Company uses a qualitative approach in assessing the consolidation requirement for VIEs that focuses on determining whether the Company has the power to direct the activities of the VIE that most significantly affect the VIE’s economic performance and whether the Company has the obligation to absorb losses or the right to receive benefits that could potentially be significant to the VIE.
The Company has considered the provisions within the contractual arrangements that grant it power to manage and make decisions that affect the operation of these VIEs, including determining the solar energy systems and associated long-term customer contracts to be sold or contributed to the VIE, and installation, operation and maintenance of the solar energy systems. The Company considers that the rights granted to the other investors under the contractual arrangements are more protective in nature rather than participating rights. As such, the Company has determined it is the primary beneficiary of the VIEs for all periods presented. The Company evaluates its relationships with the VIEs on an ongoing basis to ensure that it continues to be the primary beneficiary.
Under the fund agreements, cash distributions of income and other receipts by the funds, net of agreed-upon expenses and estimated expenses, tax benefits and detriments of income and loss, and tax benefits of tax credits, are assigned to the fund investors and the Company’s subsidiaries as specified in contractual arrangements. As such, the cash held in investment funds is not readily available to the Company due to the timing of distributions. Certain of these fund arrangements have call and put options to acquire the investor’s equity interest as specified in the contractual agreements. Once the investor’s equity interest is acquired by the Company, the assets, liabilities and operations of the investment fund become wholly owned and no longer require an assessment of non-controlling interests.
Fund investors for three of the funds are managed indirectly by The Blackstone Group L.P. (the “Sponsor”) and are considered related parties. As of December 31, 2017 and 2016, the cumulative total of contributions into the VIEs by all investors was $1,264.6 million and $1,050.9 million. Of these contributions, a cumulative total of $110.0 million was contributed by related parties in prior periods. A third-party provider has agreed to perform backup maintenance services for all funds, if necessary.
C&I Investment Fund
In June 2016, the Company terminated the C&I investment fund that had been initiated in 2015. No projects were purchased by the fund prior to termination. As such, the Company did not have any assets or liabilities associated with the fund. In 2016, the Company paid a fee of $1.0 million to the C&I fund investor to terminate the fund and release any and all claims.
Lease Pass-Through Financing Obligation
During 2015, a wholly owned subsidiary of the Company entered into a lease pass-through fund arrangement under which the Company contributed solar energy systems and the investor contributed cash. The net carrying value of the related solar energy systems was $58.2 million and $60.5 million as of December 31, 2017 and 2016.
Under the arrangement, the fund investor made large upfront payments to one of the Company’s wholly owned subsidiaries and is obligated to make subsequent periodic payments. The Company allocated a portion of the aggregate payments received from the fund investor to the estimated fair value of the assigned ITCs, and the balance to the future customer lease payments that were also assigned to the investor. The fair value of the ITCs was estimated by multiplying the ITC rate of 30% by the fair value of the systems that were sold to the lease pass-through fund. The fair value of the systems was determined by independent appraisals. The Company’s subsidiary has an obligation to ensure the solar energy systems are in service and operational for a term of five years to avoid any recapture of the ITCs. Accordingly, the Company recognizes revenue as the recapture provisions lapse assuming all other revenue recognition criteria have been met. The amounts allocated to the ITCs were initially recorded as deferred revenue, and subsequently, one-fifth of the amounts allocated to the ITCs is recognized as revenue from operating leases and solar energy systems incentives based on the anniversary of each solar energy system’s placed in service date.
94
The Company accounts for the residual of the large upfront payments, net of amounts allocated to the ITCs, and subsequent periodic payments received from the fund investor as a borrowing by recording the proceeds received as a lease pass-through financing obligation, which will be repaid through customer payments that will be received by the investor. Under this approach, the Company continues to account for the arrangement with the customers in its consolidated financial statements, whether the cash generated from the customer arrangements is received by the Company’s wholly owned subsidiary or paid directly to the fund investor. A portion of the amounts received by the fund investor from customer payments is applied to reduce the lease pass-through financing obligation, and the balance is allocated to interest expense. The customer payments are recognized into revenue based on cash receipts during the period as required by GAAP. Interest is calculated on the lease pass-through financing obligation using the effective interest rate method. The effective interest rate is the interest rate that equates the present value of the cash amounts to be received by a fund investor over the master lease term with the present value of the cash amounts paid by the investor to the Company, adjusted for any payments made by the Company. Any additional master lease prepayments by the investor would be recorded as an additional lease pass-through financing obligation, while any refunds of master lease prepayments would reduce the lease pass-through financing obligation.
The lease pass-through financing obligation is nonrecourse. In 2016, a one-time future lease payment reset mechanism occurred that resulted in a return of a portion of the upfront payment to the investor of $1.8 million. As of December 31, 2017 and 2016 the Company had recorded financing liabilities of $32.1 million and $40.4 million related to this fund arrangement, of which $26.4 million and $34.2 million was deferred revenue and $5.8 million and $6.2 million was the lease pass-through financing obligation recorded in other liabilities.
As of December 31, 2017, the future minimum lease payments to be received from the fund investor for each of the next five years and thereafter were as follows (in thousands):
|
Years Ending December 31, |
|
|
|
|
2018 |
$ |
2,994 |
|
|
2019 |
|
3,040 |
|
|
2020 |
|
3,087 |
|
|
2021 |
|
3,133 |
|
|
2022 |
|
3,180 |
|
|
Thereafter |
|
3,992 |
|
|
Total minimum lease payments to be received |
$ |
19,426 |
|
The fund investor is responsible for services such as warranty support, accounting, lease servicing and performance reporting, which have been outsourced to the Company under administrative and maintenance service agreements.
Guarantees
With respect to the investment funds, the Company and the fund investors have entered into guaranty agreements under which the Company guarantees the performance of certain financial obligations of its subsidiaries to the investment funds. These guarantees do not result in the Company being required to make payments to the fund investors unless such payments are mandated by the investment fund governing documents and the investment fund fails to make such payment. Each of the Company’s investment funds and financing subsidiaries maintains separate books and records from each other and from the Company. The assets of each investment fund are not available to satisfy the debts or obligations of any other investment fund, subsidiary or the Company.
The Company is contractually obligated to make certain VIE investors whole for losses that the investors may suffer in certain limited circumstances resulting from the disallowance or recapture of ITCs. The Company has concluded that the likelihood of a significant recapture event is remote and consequently has not recorded any liability in the consolidated financial statements for any potential recapture exposure. The maximum potential future payments that the Company could have to make under this obligation would depend on the IRS successfully asserting upon audit that the fair market values of the solar energy systems sold or transferred to the funds as determined by the Company exceeded the allowable basis for the systems for purposes of claiming ITCs. The fair market values of the solar energy systems and related ITCs are determined and the ITCs are allocated to the fund investors in accordance with the funds governing agreements. Due to uncertainties associated with estimating the timing and amounts of distributions, the likelihood of an event that may trigger repayment, forfeiture or recapture of ITCs to such investors, and the fact that the Company cannot determine how the IRS will evaluate system values used in claiming ITCs, the Company cannot determine the potential maximum future payments that are required under these guarantees. As of December 31, 2017, the Company has not made any payments under these guarantees.
95
From time to time, the Company incurs penalties for non-performance, which non-performance may include delays in the installation process and interconnection to the power grid of solar energy systems and other factors. Based on the terms of the investment fund agreements, the Company will either reimburse a portion of the fund investor’s capital or pay the fund investor a non-performance fee. Distributions paid to reimburse fund investors totaled $8.4 million, $2.7 million and $5.0 million for the years ended December 31, 2017, 2016 and 2015. As of December 31, 2017, the Company accrued an estimated $9.7 million in distributions to reimburse fund investors a portion of their capital contributions primarily due to a delay in solar energy systems being interconnected to the power grid.
As a result of the guaranty arrangements in certain funds, the Company was required to hold a minimum cash balance of $10.0 million as of December 31, 2017 and 2016, which is classified as restricted cash and cash equivalents.
13.Redeemable Non-Controlling Interests and Equity and Preferred Stock
Common Stock
The Company has 1.0 billion authorized shares of common stock. As of December 31, 2017 and 2016, the Company had 115.1 million and 110.2 million shares of common stock issued and outstanding.
The Company had shares of common stock reserved for issuance as follows (in thousands):
|
|
December 31, |
|
|
December 31, |
|
||
|
|
2017 |
|
|
2016 |
|
||
|
Shares available for grant under equity incentive plans |
|
12,774 |
|
|
|
11,596 |
|
|
Restricted stock units issued and outstanding |
|
6,688 |
|
|
|
7,964 |
|
|
Stock options issued and outstanding |
|
3,837 |
|
|
|
4,184 |
|
|
Long-term incentive plan |
|
2,706 |
|
|
|
2,706 |
|
|
Total |
|
26,005 |
|
|
|
26,450 |
|
Non-Controlling Interests and Redeemable Non-Controlling Interests
During the year ended December 31, 2017, the Company purchased all of the third-party investor’s interests in a previously consolidated investment fund for $1.2 million. The purchase price is included in the caption “Distributions paid to non-controlling interests and redeemable non-controlling interests” in the consolidated statements of cash flows. The equity impact of the purchase is represented by the caption “Acquisition of redeemable non-controlling interests” in the consolidated statements of redeemable non-controlling interests and equity. After the acquisition, the investment fund is now a wholly owned entity of the Company.
Six of the investment funds include a right for the non-controlling interest holder to require the Company’s wholly owned subsidiary to purchase all of its membership interests in the fund (each, a “Put Option”). The purchase price for the fund investor’s interest in the six investment funds under the Put Options is the greater of fair market value at the time the option is exercised and a specified amount, ranging from $2.1 million to $4.1 million. The Put Options for these six investment funds are exercisable beginning on the date that specified conditions are met for each respective fund. None of the Put Options are expected to become exercisable prior to 2019.
Because the Put Options represent redemption features that are not solely within the control of the Company, the non-controlling interests in these investment funds are presented outside of permanent equity. Redeemable non-controlling interests are recorded using the greater of their carrying value at each reporting date (which is impacted by attribution under the HLBV method) or their estimated redemption value in each reporting period.
In all investment funds except one, the Company’s wholly owned subsidiary has the right to require the non-controlling interest holder to sell all of its membership units to the Company’s wholly owned subsidiary (each, a “Call Option”). The purchase price for the fund investors’ interests under the Call Options varies by fund, but is generally the greater of a specified amount, which ranges from approximately $1.2 million to $7.0 million, the fair market value of such interest at the time the option is exercised, or an amount that causes the fund investor to achieve a specified return on investment. The Call Options are exercisable beginning on the date that specified conditions are met for each respective fund. None of the Call Options are expected to become exercisable prior to 2020.
Preferred Stock
In October 2014, the Company authorized 10.0 million shares of preferred stock that is issuable in series. As of December 31, 2017 and 2016, there were no series of preferred stock issued or designated.
96
Equity Incentive Plans
2014 Equity Incentive Plan
The Company currently grants equity awards through its 2014 Equity Incentive Plan (the “2014 Plan”). Under the 2014 Plan, the Company may grant stock options, restricted stock, restricted stock units (“RSUs”), stock appreciation rights, performance stock units, performance shares and performance awards to its employees, directors and consultants, and its parent and subsidiary corporations’ employees and consultants.
As of December 31, 2017, a total of 12.8 million shares of common stock were available for grant under the 2014 plan, subject to adjustment in the case of certain events. In addition, any shares that otherwise would be returned to the Omnibus Plan (as defined below) as the result of the expiration or termination of stock options may be added to the 2014 Plan. The number of shares available to grant under the 2014 Plan is subject to an annual increase on the first day of each year, equal to the least of 8.8 million shares, 4% of the outstanding shares of common stock as of the last day of the immediately preceding fiscal year and an amount of shares as determined by the Company. In accordance with the annual increase, an additional 4.4 million shares became available to grant in January 2017 under the 2014 Plan.
As of December 31, 2017, there were 1.2 million time-based stock options and 6.7 million RSUs granted and outstanding under the 2014 Plan. The time-based options are subject to ratable time-based vesting over three to four years. Of the total RSUs outstanding, 5.3 million are subject to ratable time-based vesting over one to four years and 1.4 million vest quarterly or annually over two to four years subject to individual participants’ achievement of quarterly or annual performance goals.
2013 Omnibus Incentive Plan; Non-plan Option Grant
The Company’s 2013 Omnibus Incentive Plan (the “Omnibus Plan”) was terminated in connection with the adoption of the 2014 Plan in September 2014, and accordingly no additional shares are available for issuance under the Omnibus Plan. The Omnibus Plan will continue to govern outstanding awards granted under the plan. The stock options outstanding under the Omnibus Plan have a ten-year contractual period. Certain performance stock options were modified in 2016 as described in the section captioned “—Equity Award Modifications.”
Long-term Incentive Plan
In July 2013, the Company’s board of directors approved 4.1 million shares of common stock for six Long-term Incentive Plan Pools (“LTIP Pools”) that comprise the 2013 Long-term Incentive Plan (the “LTIP”). Participants in the LTIP are allocated a portion of the LTIP Pools relative to the performance of other participants on a measurement date that is determined once performance conditions are met. As of December 31, 2017, 1.1 million shares of common stock had been awarded to participants under the LTIP and 0.3 million shares had been returned to the 2014 Plan. As of December 31, 2017, 2.7 million shares remained outstanding, which will be granted when certain performance conditions are achieved.
Equity Award Modifications
Current CEO Equity Awards
In May 2016, the Company appointed an interim CEO. In December 2016, the interim CEO was appointed as the permanent CEO. In connection with his interim appointment, the CEO was awarded 1.0 million stock options pursuant to the 2014 Plan, which were then cancelled and replaced with 0.5 million RSUs. Either award vested on the first anniversary of his start date, or if earlier, on the date on which a successor CEO was appointed. The cancellation of stock options and grant of RSUs was accounted for as a modification; however, there was no incremental value arising from the modification. As a result of the CEO’s permanent appointment, the RSUs became fully vested and all remaining expense was accelerated and recognized during the year ended December 31, 2016.
97
In May 2016, the Company accepted the resignation of its former CEO. Pursuant to a separation agreement, the Company accelerated the vesting of 0.2 million of the former CEO’s stock options. Further, all of the former CEO’s vested stock options were modified such that they will remain exercisable until the third anniversary of his termination date. As a result of these modifications, the Company recorded incremental stock-based compensation expense of $0.7 million during the year ended December 31, 2016.
Omnibus Plan Performance Options
In May 2016, the Company modified the unvested Omnibus Plan performance options (the “Tier II Options”). The modified Tier II Options vest annually over three years with the first vesting date occurring in May 2017. The original performance condition for the Tier II Options remains in effect and will trigger immediate vesting of the Tier II Options if it is met prior to the three-year time-based vesting period. Due to the modification, the Company now considers the Tier II Options to be time-based options. Additionally, the Company will record incremental stock-based compensation expense of approximately $1.5 million over the three-year time-based vesting period, subject to immediate acceleration if the performance condition is met prior to the three-year time-based vesting period.
Stock Options
Stock Option Activity
Stock option activity for the year ended December 31, 2017 was as follows (in thousands, except term and per share amounts):
|
|
|
|
|
|
|
|
|
|
Weighted- |
|
|
|
|
|
|
|
|
|
|
|
|
Weighted- |
|
|
Average |
|
|
|
|
|
||
|
|
Shares |
|
|
Average |
|
|
Remaining |
|
|
Aggregate |
|
||||
|
|
Underlying |
|
|
Exercise |
|
|
Contractual |
|
|
Intrinsic |
|
||||
|
|
Options |
|
|
Price |
|
|
Term (in years) |
|
|
Value |
|
||||
|
Outstanding—December 31, 2016 |
|
4,184 |
|
|
$ |
1.64 |
|
|
|
|
|
|
$ |
4,876 |
|
|
Granted |
|
561 |
|
|
|
3.34 |
|
|
|
|
|
|
|
|
|
|
Exercised |
|
(590 |
) |
|
|
1.08 |
|
|
|
|
|
|
|
|
|
|
Cancelled |
|
(318 |
) |
|
|
1.31 |
|
|
|
|
|
|
|
|
|
|
Outstanding—December 31, 2017 |
|
3,837 |
|
|
$ |
2.01 |
|
|
|
6.9 |
|
|
$ |
8,522 |
|
|
Options vested and exercisable—December 31, 2017 |
|
1,996 |
|
|
$ |
1.64 |
|
|
|
6.1 |
|
|
$ |
5,278 |
|
The following table summarizes stock option activity by range of exercise price as of December 31, 2017 (number of awards in thousands):
|
|
|
Awards Outstanding |
|
|
Awards Exercisable |
|
||||||||||||
|
|
|
|
|
|
|
Weighted-Average |
|
|
|
|
|
|
|
|
|
|
|
|
|
|
|
|
|
|
|
Remaining |
|
|
|
|
|
|
|
|
|
|
|
|
|
|
|
Number of Awards |
|
|
Contractual Life |
|
Weighted-Average |
|
|
Number of Awards |
|
|
Weighted-Average |
|
||||
|
Range of Exercise Price |
|
Outstanding |
|
|
(in years) |
|
Exercise Price |
|
|
Exercisable |
|
|
Exercise Price |
|
||||
|
$0.00 - $1.00 |
|
|
1,312 |
|
|
5.6 |
|
$ |
1.00 |
|
|
|
940 |
|
|
$ |
1.00 |
|
|
$1.01 - $2.00 |
|
|
1,248 |
|
|
6.1 |
|
|
1.30 |
|
|
|
809 |
|
|
|
1.30 |
|
|
$2.01 - $10.00 |
|
|
1,198 |
|
|
9.2 |
|
|
3.14 |
|
|
|
193 |
|
|
|
3.09 |
|
|
$10.01 - $16.00 |
|
79 |
|
|
7.3 |
|
|
12.63 |
|
|
|
54 |
|
|
|
12.63 |
|
|
|
Total |
|
|
3,837 |
|
|
6.9 |
|
$ |
2.01 |
|
|
|
1,996 |
|
|
$ |
1.64 |
|
The weighted-average grant date fair value of time-based options granted during the years ended December 31, 2017, 2016 and 2015 was $2.25, $2.15 and $9.39 per share. The total intrinsic value of options exercised for the years ended December 31, 2017, 2016 and 2015 was $1.7 million, $5.6 million and $7.4 million. Intrinsic value is calculated as the difference between the exercise price of the underlying options and the fair value of the common stock for the options that had exercise prices that were lower than the fair value per share of the common stock. The total fair value of options vested for the years ended December 31, 2017, 2016 and 2015 was $1.5 million, $1.6 million and $14.8 million.
98
Determination of Fair Value of Stock Options
The Company estimates the fair value of the time-based stock options granted on each grant date using the Black-Scholes-Merton option pricing model and applies the accelerated attribution method for expense recognition.
The fair values using the Black-Scholes-Merton method were estimated on each grant date using the following weighted-average assumptions:
|
|
Year Ended December 31, |
|
|||||||||
|
|
2017 |
|
|
2016 |
|
|
2015 |
|
|||
|
Expected term (in years) |
|
6.2 |
|
|
|
5.8 |
|
|
|
6.2 |
|
|
Volatility |
|
75.3 |
% |
|
|
83.1 |
% |
|
|
89.0 |
% |
|
Risk-free interest rate |
|
2.1 |
% |
|
|
1.7 |
% |
|
|
1.8 |
% |
|
Dividend yield |
|
0.0 |
% |
|
|
0.0 |
% |
|
|
0.0 |
% |
Use of the Black-Scholes-Merton option-pricing model requires the input of highly subjective assumptions, including (1) the expected term of the option, (2) the expected volatility of the price of the Company’s common stock, (3) risk-free interest rates and (4) the expected dividend yield of the Company’s common stock. The assumptions used in the option-pricing model represent management’s best estimates. These estimates involve inherent uncertainties and the application of management’s judgment. If factors change and different assumptions are used, the Company’s stock-based compensation expense could be materially different in the future.
These assumptions and estimates are as follows:
|
|
• |
Expected Term. The expected term represents the period that the Company’s option awards are expected to be outstanding. The Company utilized the simplified method in estimating the expected term of its options granted. The simplified method deems the term to be the average of the time to vesting and the contractual life of the options. |
|
|
• |
Expected Volatility. The volatility is derived from the average historical stock volatilities of the Company and a peer group of public companies within the Company’s industry that it considers to be comparable to its business over a period equivalent to the expected term of the stock-based grants. The Company did not rely on implied volatilities of traded options in its own or the industry peers’ common stock because of the low volume of activity. |
|
|
• |
Risk-Free Interest Rate. The risk-free interest rate is based on the U.S. Treasury yield curve in effect at the time of grant for zero-coupon U.S. Treasury notes with maturities approximately equal to the option’s expected term. |
|
|
• |
Dividend Yield. The Company has never declared or paid any cash dividends and does not presently plan to pay cash dividends in the foreseeable future. Consequently, the Company used an expected dividend yield of zero. |
RSUs
RSU activity for the year ended December 31, 2017 was as follows (awards in thousands):
|
|
|
|
|
|
Weighted- |
|
|
|
|
|
|
|
|
Average |
|
|
|
|
Number of |
|
|
Grant Date |
|
||
|
|
Awards |
|
|
Fair Value |
|
||
|
Outstanding at December 31, 2016 |
|
7,964 |
|
|
$ |
3.14 |
|
|
Granted |
|
4,025 |
|
|
|
3.33 |
|
|
Vested |
|
(4,264 |
) |
|
|
3.23 |
|
|
Forfeited |
|
(1,037 |
) |
|
|
3.10 |
|
|
Outstanding at December 31, 2017 |
|
6,688 |
|
|
$ |
3.20 |
|
The total fair value of RSUs vested was $12.0 million, $4.8 million, and $9.0 million for the years ended December 31, 2017, 2016 and 2015. The Company determined the fair value of RSUs granted on each grant date based on the fair value of the Company’s common stock on the grant date.
99
Stock-Based Compensation Expense
Stock-based compensation was included in operating expenses as follows (in thousands):
|
|
Year Ended December 31, |
|
|||||||||
|
|
2017 |
|
|
2016 |
|
|
2015 |
|
|||
|
Cost of revenue |
$ |
993 |
|
|
$ |
2,428 |
|
|
$ |
3,068 |
|
|
Sales and marketing |
|
4,084 |
|
|
|
2,980 |
|
|
|
10,737 |
|
|
General and administrative |
|
7,649 |
|
|
|
5,716 |
|
|
|
11,310 |
|
|
Research and development |
|
191 |
|
|
|
(510 |
) |
|
|
489 |
|
|
Total stock-based compensation |
$ |
12,917 |
|
|
$ |
10,614 |
|
|
$ |
25,604 |
|
The income tax benefit related to share-based compensation expense was $6.2 million, $5.5 million and $4.8 million for the years ended December 31, 2017, 2016 and 2015.
Unrecognized stock-based compensation expense for time-based stock options and RSUs as of December 31, 2017 was as follows (in thousands, except years):
|
|
Unrecognized |
|
|
Weighted- |
|
||
|
|
Stock-Based |
|
|
Average Period |
|
||
|
|
Compensation |
|
|
of Recognition |
|
||
|
|
Expense |
|
|
(in years) |
|
||
|
RSUs |
$ |
13,530 |
|
|
|
1.6 |
|
|
Time-based stock options |
|
1,930 |
|
|
|
1.5 |
|
|
Total unrecognized stock-based compensation expense |
$ |
15,460 |
|
|
|
|
|
15.Income Taxes
Income tax (benefit) expense is composed of the following (in thousands):
|
|
|
Year Ended December 31, |
|
|||||||||
|
|
|
2017 |
|
|
2016 |
|
|
2015 |
|
|||
|
Current: |
|
|
|
|
|
|
|
|
|
|
|
|
|
Federal |
|
$ |
(9,233 |
) |
|
$ |
(30,301 |
) |
|
$ |
52,578 |
|
|
State |
|
|
(8,864 |
) |
|
|
5,623 |
|
|
|
15,275 |
|
|
Total current (benefit) expense |
|
|
(18,097 |
) |
|
|
(24,678 |
) |
|
|
67,853 |
|
|
Deferred: |
|
|
|
|
|
|
|
|
|
|
|
|
|
Federal |
|
|
(154,316 |
) |
|
|
31,122 |
|
|
|
(46,364 |
) |
|
State |
|
|
15,080 |
|
|
|
989 |
|
|
|
(11,752 |
) |
|
Total deferred (benefit) expense |
|
|
(139,236 |
) |
|
|
32,111 |
|
|
|
(58,116 |
) |
|
Income tax (benefit) expense |
|
$ |
(157,333 |
) |
|
$ |
7,433 |
|
|
$ |
9,737 |
|
100
The Company operates in only one federal jurisdiction, the United States. The following table presents a reconciliation of the income tax benefit computed at the statutory federal rate and the Company’s income tax (benefit) expense (in thousands):
|
|
|
Year Ended December 31, |
|
|||||||||
|
|
|
2017 |
|
|
2016 |
|
|
2015 |
|
|||
|
Income tax benefit—computed as 35% of pretax loss |
|
$ |
(52,102 |
) |
|
$ |
(82,286 |
) |
|
$ |
(85,235 |
) |
|
Effect of non-controlling interests and redeemable non-controlling interests |
|
|
70,219 |
|
|
|
91,183 |
|
|
|
93,221 |
|
|
Goodwill impairment |
|
|
— |
|
|
|
12,810 |
|
|
|
— |
|
|
Amortization of prepaid tax asset |
|
|
15,287 |
|
|
|
11,750 |
|
|
|
6,661 |
|
|
Effect of nondeductible expenses |
|
|
2,781 |
|
|
|
6,942 |
|
|
|
1,232 |
|
|
State and local income tax expenses (net of federal benefit) |
|
|
4,040 |
|
|
|
4,298 |
|
|
|
2,289 |
|
|
Effect of domestic production activities deduction |
|
|
— |
|
|
|
(473 |
) |
|
|
(4,699 |
) |
|
Effect of tax credits |
|
|
(11,849 |
) |
|
|
(36,328 |
) |
|
|
(4,106 |
) |
|
Effect of federal tax rate reduction from 35% to 21% |
|
|
(187,501 |
) |
|
|
— |
|
|
|
— |
|
|
Other |
|
|
1,792 |
|
|
|
(463 |
) |
|
|
374 |
|
|
Income tax (benefit) expense |
|
$ |
(157,333 |
) |
|
$ |
7,433 |
|
|
$ |
9,737 |
|
The TCJA was enacted on December 22, 2017. ASC 740 requires the effect of tax rate and law changes on deferred taxes to be recognized in the reporting period in which the legislation is enacted. This effect is required to be recorded as a component of the income tax provision.
The TCJA made significant changes to the U.S. tax code including reducing the U.S. federal corporate tax rate from 35% to 21% effective on January 1, 2018. The TCJA also includes new tax laws that will impact the Company’s taxable income beginning in 2018, which include, but are not limited to a provision that limits the amount of deductible interest expense, full expensing of acquired property, limitations on the utilization of NOL carryforwards, the repeal of the domestic production activity deduction, limitations on the deductibility of certain executive compensation, and the tax year of income inclusion.
The SEC staff issued Staff Accounting Bulletin (“SAB”) 118, which provides guidance on accounting for the tax effects of the TCJA. SAB 118 provides a measurement period that should not extend beyond one year from the TCJA enactment date for companies to complete the accounting under ASC 740. In accordance with SAB 118, a company must reflect the income tax effects of those aspects of the TCJA for which the accounting under ASC 740 is complete. To the extent that a company’s accounting for certain income tax effects of the TCJA is incomplete but it is able to determine a reasonable estimate, it must record a provisional estimate in the financial statements. If a company cannot determine a provisional estimate to be included in the financial statements, it should continue to apply ASC 740 on the basis of the provisions of the tax laws that were in effect immediately before the enactment of the TCJA.
The Company has recorded a provisional net tax benefit of $187.5 million related to the remeasurement of its deferred tax balances to reflect the corporate rate reduction in the period ending December 31, 2017. Although the Company is able to make a reasonable estimate of the impact of the reduced corporate rate, it continues to analyze the temporary differences that existed on the date of enactment. The impact of the TCJA may differ from the Company’s estimates, possibly materially, due to, among other things, changes in interpretations and assumptions the Company has made, guidance that may be issued and actions the Company may take as a result of the TCJA. The Company is also currently analyzing other previously mentioned provisions of the TCJA that come into effect for tax years starting after 2017 to determine if these items would impact the effective tax rate.
Deferred income taxes reflect the impact of temporary differences between assets and liabilities for financial reporting purposes and the amounts recognized for income tax reporting purposes, net operating loss carryforwards and other tax credits. The differences are measured by applying currently enacted tax laws. The significant components of the Company’s deferred tax assets and liabilities were as follows (in thousands):
101
|
|
December 31, |
|
||||||
|
|
|
2017 |
|
|
2016 |
|
||
|
Deferred tax assets: |
|
|
|
|
|
|
|
|
|
Accruals and reserves |
|
$ |
4,154 |
|
|
$ |
8,523 |
|
|
Stock-based compensation |
|
|
5,047 |
|
|
|
7,791 |
|
|
Tax credits |
|
|
43,071 |
|
|
|
1,744 |
|
|
Net operating losses |
|
|
5,847 |
|
|
|
— |
|
|
Depreciation and amortization |
|
|
2,160 |
|
|
|
— |
|
|
Other |
|
|
324 |
|
|
|
351 |
|
|
Gross deferred tax assets |
|
|
60,603 |
|
|
|
18,409 |
|
|
Valuation allowance |
|
|
(329 |
) |
|
|
(204 |
) |
|
Net deferred tax assets |
|
|
60,274 |
|
|
|
18,205 |
|
|
Deferred tax liabilities: |
|
|
|
|
|
|
|
|
|
Investment in solar funds |
|
|
(361,284 |
) |
|
|
(368,536 |
) |
|
Depreciation and amortization |
|
|
(37,121 |
) |
|
|
(38,116 |
) |
|
Interest rate swaps |
|
|
(3,458 |
) |
|
|
(5,732 |
) |
|
Accruals and reserves |
|
|
(793 |
) |
|
|
(1,039 |
) |
|
Gross deferred tax liabilities |
|
|
(402,656 |
) |
|
|
(413,423 |
) |
|
Net deferred tax liabilities |
|
$ |
(342,382 |
) |
|
$ |
(395,218 |
) |
The Company sells solar energy systems under long-term customer contracts to substantially all of the investment funds for income tax purposes. As the investment funds are consolidated by the Company, the gain on the sale of the solar energy systems is not recognized in the consolidated financial statements. However, this gain is recognized for tax reporting purposes. Since these transactions are intercompany sales for GAAP purposes, any tax expense incurred related to these intercompany sales is deferred and amortized over the estimated useful life of the underlying solar energy systems, which has been estimated to be 30 years. Accordingly, the Company has recorded a prepaid tax asset, net of $505.9 million and $419.5 million as of December 31, 2017 and 2016.
The future reversal of deferred tax liabilities is expected to produce a sufficient source of future taxable income of the necessary character and in the necessary periods and jurisdictions to support the realization of the deferred tax assets. As such, no valuation allowance is required except for as noted below.
The Company had state net operating loss carryforwards of approximately $95.5 million and $1.1 million (the “NOLs”), available to offset future state taxable income as of December 31, 2017 and 2016. The NOLs expire in varying amounts from 2029 through 2037 for state tax purposes if unused. As of December 31, 2017 and 2016, the Company recognized a valuation allowance of $0.3 million and $0.2 million for the existing state NOLs and other existing state tax attributes due to state-imposed limitations on their utilization.
The Company reported federal business tax credits, primarily composed of ITCs, of $12.5 million and $36.3 million for the years ended December 31, 2017 and 2016. The Company accounts for its federal business tax credits as a reduction of income tax expense in the year in which the credits arise. The Company reported AMT credits of $0.9 million and $0.8 million for the years ended December 31, 2017 and 2016. As of December 31, 2017 and 2016, the Company had $11.1 million and $33.2 million of federal income tax refunds receivable which were recorded in prepaid expenses and other current assets. As of December 31, 2017 and 2016, the Company had $9.7 million and $2.6 million of state income tax refunds receivable which were recorded in prepaid expenses and other current assets.
Uncertain Tax Positions
As of December 31, 2017 and 2016, the Company had no unrecognized tax benefits. There were no interest and penalties accrued for any uncertain tax positions as of December 31, 2017 and 2016. The Company does not have any tax positions for which it is reasonably possible the total amount of gross unrecognized benefits will increase or decrease within 12 months of the year ended December 31, 2017. The Company is subject to taxation and files income tax returns in the United States and various state and local jurisdictions. The U.S. and state jurisdictions in which the Company operates have statutes of limitations that generally range from three to four years. The Company’s federal, state and local income tax returns starting with the 2014 tax year are subject to audit. The Company’s 2013 income tax returns for two states are also subject to audit.
102
The Company’s operations included the following expenses from related party transactions (in thousands):
|
|
Year Ended December 31, |
|
|||||||||
|
|
2017 |
|
|
2016 |
|
|
2015 |
|
|||
|
Cost of revenue—operating leases and incentives |
$ |
701 |
|
|
$ |
3,311 |
|
|
$ |
6,054 |
|
|
Sales and marketing |
|
2,643 |
|
|
|
2,610 |
|
|
|
2,133 |
|
|
General and administrative |
|
139 |
|
|
|
749 |
|
|
|
5,241 |
|
Vivint Services
The Company has negotiated and entered into a number of agreements with its sister company, Vivint. Some of those agreements related to the Company’s use of certain of Vivint’s information technology and infrastructure services; however, the Company stopped using such services in July 2017. In August 2017, the Company entered into a sales dealer agreement with Vivint, pursuant to which each company will act as a dealer for the other party to market, promote and sell each other’s products. The agreement has an initial term of two years and replaces substantially all of the activities being undertaken under the parties’ existing marketing and customer relations agreement. The Company and Vivint also agreed to extend the term of the non-solicitation provisions under an existing non-competition agreement to match the term of the sales dealer agreement.
The Company incurred fees under these agreements and its ongoing relationship with Vivint of $2.5 million, $4.3 million and $8.0 million for the years ended December 31, 2017, 2016 and 2015. These amounts reflect the level of services provided by Vivint on behalf of the Company.
Payables to Vivint recorded in accounts payable—related party were $0.2 million as of December 31, 2017 and 2016. These payables include amounts due to Vivint related to the services agreements and other miscellaneous intercompany payables.
Additionally, during the year ended December 31, 2016, the Company agreed to install a solar energy system for a corporate entity in exchange for $1.5 million of value-in-kind consideration. Vivint will utilize approximately $0.6 million of that consideration over three years, which will be applied as a reduction of amounts owed to Vivint by the Company over that period.
Advisory Agreements
In May 2014, the Company entered into an advisory agreement with Blackstone Advisory Partners L.P. (“BAP”), an affiliate of the Sponsor, under which BAP would provide financial advisory and placement services related to the Company’s financing of residential solar energy systems. In August 2015, this agreement was terminated. Under the agreement, the Company was required under certain circumstances to pay a placement fee to BAP ranging from 0.75% to 1.5% of the transaction capital, depending on the identity of the investor and whether the financing related to residential or commercial projects.
The Company incurred fees under these agreements of $4.4 million for the year ended December 31, 2015. The amount was recorded in general and administrative expense. No fees were incurred under these agreements during the years ended December 31, 2017 and 2016.
Advances Receivable—Related Party
Net amounts due from direct-sales personnel were $6.6 million and $3.7 million as of December 31, 2017 and 2016. The Company provided a reserve of $1.0 million and $1.3 million as of December 31, 2017 and 2016 related to advances to direct-sales personnel who have terminated their employment agreement with the Company.
Investment Funds
Fund investors for three of the investment funds are indirectly managed by the Sponsor and accordingly are considered related parties. The Company accrued equity distributions to these entities of $1.2 million and $1.6 million as of December 31, 2017 and 2016, included in distributions payable to non-controlling and redeemable non-controlling interests. See Note 12—Investment Funds.
103
17.Commitments and Contingencies
Non-Cancellable Operating Leases
In September 2014, the Company entered into a non-cancellable lease, which was subsequently amended in July 2015 and October 2016, whereby the Company terminated the lease for its prior corporate headquarters in Lehi, Utah and moved to another building in the same general location. The new headquarters lease is classified and accounted for as a non-cancellable operating lease. The lease term is 12 years, with the option to extend for two additional periods of five years. The base rent for this building commenced at approximately $0.3 million per month and will increase over the term of the lease, as amended, at a rate of 2.5% annually. In October 2016, the Company amended the new headquarters lease to terminate the construction of the studio building. Construction on the studio building had not commenced prior to the amendment date.
In July 2015, the Company entered into a non-cancellable lease for a second office building on the corporate headquarters campus. Subsequently in October 2016, the lease was amended resulting in a new anticipated lease commencement date of January 1, 2020. The second office building will provide approximately 150,000 square feet of office space. The lease term is 12 years, with the option to extend for two additional periods of five years. The monthly rent payments will commence at approximately $0.4 million and increase at a rate of 2.5% annually. As a result, the Company expects to make total lease payments of $57.7 million over the initial term of the lease.
The Company has entered into lease agreements for warehouses and related equipment located in states in which the Company conducts operations. The warehouse lease agreements range from a term of one to seven years, with the majority having a term of three years. The equipment lease agreements range from three to five years, and include basic renewal options for an additional set period, continued renting by the month, or return of the unit.
For all non-cancellable lease arrangements, there are no bargain renewal options, penalties for failure to renew, or any guarantee by the Company of the lessor’s debt or a loan from the Company to the lessor related to the leased property. Aggregate lease expense for these non-cancellable operating lease arrangements was $16.3 million, $17.4 million and $11.0 million for the years ended December 31, 2017, 2016 and 2015. For operating leases having initial or remaining lease terms in excess of one year, the total minimum rental payments to be received under noncancelable subleases was $0.5 million as of December 31, 2017. Rental payments received under non-cancellable subleases are recorded as a reduction to operating lease expense.
Future minimum lease payments under non-cancellable operating leases as of December 31, 2017 were as follows (in thousands):
|
Years Ending December 31, |
|
|
|
|
2018 |
$ |
11,161 |
|
|
2019 |
|
7,290 |
|
|
2020 |
|
8,326 |
|
|
2021 |
|
9,331 |
|
|
2022 |
|
9,212 |
|
|
Thereafter |
|
73,090 |
|
|
Total minimum lease payments |
$ |
118,410 |
|
Letters of Credit
As of December 31, 2017, the Company had established letters of credit under the Working Capital Facility for up to $13.5 million related to insurance contracts and under the 2016 Term Loan Facility for up to $12.1 million related to the debt service reserve for the 2016 Term Loan Facility. See Note 10—Debt Obligations.
104
From time to time, the Company enters into contracts that contingently require it to indemnify parties against claims. These contracts primarily relate to provisions in the Company’s services agreements with related parties that may require the Company to indemnify the related parties against services rendered; and certain agreements with the Company’s officers and directors under which the Company may be required to indemnify such persons for liabilities. In addition, under the terms of the agreements related to the Company’s investment funds and other material contracts, the Company may also be required to indemnify fund investors and other third parties for liabilities. Distributions paid to reimburse fund investors totaled $8.4 million, $2.7 million and $5.0 million for the years ended December 31, 2017, 2016, and 2015. As of December 31, 2017, the Company accrued an estimated $9.7 million in distributions to reimburse fund investors a portion of their capital contributions primarily due to a delay in solar energy systems being interconnected to the power grid and other factors.
Legal Proceedings
In September 2015, two of the Company’s customers, on behalf of themselves and a purported class, named the Company in a putative class action, Case No. BCV-15-100925(Cal. Super. Ct., Kern County), alleging violation of California Business and Professions Code Section 17200 and requesting relief pursuant to Section 1689 of the California Civil Code. The complaint sought: (1) rescission of their PPAs along with restitution to the plaintiffs individually and (2) declaratory and injunctive relief. In October 2015, the Company moved to compel arbitration of the plaintiffs’ claims pursuant to the provisions set forth in the PPAs, which the Court granted and dismissed the class claims without prejudice. The plaintiffs appealed the Court’s order. On July 26, 2017, the Court of Appeal for the Fifth Appellate District ruled that all issues concerning the interpretation, validity, or enforceability of the PPAs, including the arbitrability of class claims, must be submitted to arbitration. The appellate court vacated the portion of the trial court's order dismissing class claims, requiring that issue to be determined by an arbitrator. The case is now proceeding in arbitration administered by JAMS. The Company is unable to estimate the amount or range of potential loss, if any, at this time.
In March 2016, the Company filed suit in the Court of Chancery State of Delaware against SunEdison and SEV Merger Sub Inc. alleging that SunEdison willfully breached its obligations under the Merger Agreement pursuant to which the Company was to be acquired and breached its implied covenant of good faith and fair dealing. The Company is seeking declaratory judgment, award damages, costs and reasonable attorney’s fees and such further relief that the court finds equitable, appropriate and just. In April 2016, SunEdison filed for Chapter 11 bankruptcy, thereby creating a temporary stay on the prosecution of the Company’s litigation in the Delaware court. In July 2016, the Company filed a motion with the bankruptcy court seeking to lift the stay and allow the Company to litigate its claim against SunEdison. In September 2016, the bankruptcy court denied the Company’s motion to lift the stay, effectively requiring that the Company’s claim be litigated in the bankruptcy proceeding. In September 2016, the Company submitted a proof of claim in the bankruptcy case for an unsecured claim in the amount of $1.0 billion. The Company is participating in the bankruptcy case so as to maximize the recovery from the claims against SunEdison.
In November 2016, a customer of the Company filed a putative class action lawsuit in Superior Court in Alameda County, California, purportedly on behalf of all customers of a particular Company sales representative in California, claiming that the representative’s sales practices were improper under California consumer protection law. The Company moved to dismiss that action to compel arbitration. In March 2017, the original plaintiff filed an amended complaint adding an additional plaintiff, purporting to expand the proposed class to include all customers who are eligible for the California Alternate Rates for Energy program, and adding claims of misconduct in the Company’s sales practices apart from the individual representative identified in the original complaint. The Company has moved to compel arbitration of the new plaintiff’s claims as well. The Company disputed the allegations in both the original and amended complaints. In January 2018, the parties reached a settlement with the two individual plaintiffs. Under the settlement, in addition to certain changes to its sales process and immaterial compensation payments to the individual plaintiffs, the Company agreed to pay attorneys’ fees in an amount that has yet to be determined but is expected to be immaterial and will be submitted to the court.
In addition to the matters discussed above, in the normal course of business, the Company has from time to time been named as a party to various legal claims, actions and complaints. While the outcome of these matters cannot be predicted with certainty, the Company does not currently believe that the outcome of any of these claims will have a material adverse effect, individually or in the aggregate, on its consolidated financial position, results of operations or cash flows.
The Company accrues for losses that are probable and can be reasonably estimated. The Company evaluates the adequacy of its legal reserves based on its assessment of many factors, including interpretations of the law and assumptions about the future outcome of each case based on available information.
105
18.Basic and Diluted Net Income Per Share
The Company computes basic net income per share by dividing net income available to common stockholders by the weighted-average number of common shares outstanding for the period. Diluted earnings per share reflects the potential dilution of securities that could be exercised or converted into common shares, and is computed by dividing net earnings available to common stockholders by the weighted-average number of common shares outstanding plus the effect of potentially dilutive shares to purchase common stock.
The following table sets forth the computation of the Company’s basic and diluted net income available per share to common stockholders for the years ended December 31, 2017, 2016 and 2015 (in thousands, except per share amounts):
|
|
Year Ended December 31, |
|
|||||||||
|
|
2017 |
|
|
2016 |
|
|
2015 |
|
|||
|
Numerator: |
|
|
|
|
|
|
|
|
|
|
|
|
Net income available to common stockholders |
$ |
209,098 |
|
|
$ |
17,986 |
|
|
$ |
13,080 |
|
|
Denominator: |
|
|
|
|
|
|
|
|
|
|
|
|
Shares used in computing net income available per share to common stockholders, basic |
|
113,132 |
|
|
|
108,190 |
|
|
|
106,088 |
|
|
Weighted-average effect of potentially dilutive shares to purchase common stock |
|
5,136 |
|
|
|
4,348 |
|
|
|
3,770 |
|
|
Shares used in computing net income available per share to common stockholders, diluted |
|
118,268 |
|
|
|
112,538 |
|
|
|
109,858 |
|
|
Net income available per share to common stockholders: |
|
|
|
|
|
|
|
|
|
|
|
|
Basic |
$ |
1.85 |
|
|
$ |
0.17 |
|
|
$ |
0.12 |
|
|
Diluted |
$ |
1.77 |
|
|
$ |
0.16 |
|
|
$ |
0.12 |
|
In May 2016, the Company modified the unvested performance stock options to vest annually over three years with the first vesting date occurring in May 2017. See Note 14—Equity Compensation Plans. As such, all stock options were considered in the computation of diluted net income (loss) per share on a weighted-average basis as of December 31, 2017 and 2016. As of December 31, 2015, stock-based awards for 3.3 million underlying shares of common stock were subject to performance conditions that had not yet been met. Accordingly, these performance-based stock awards were not included in the computation of diluted net income per share for the year ended December 31, 2015. In addition, options remaining to be granted under the LTIP Pools were not included in the computation of diluted net income per share as these shares had not been granted as of December 31, 2017, 2016 and 2015. For the years ended December 31, 2017, 2016 and 2015, 1.0 million, 0.3 million and a de minimis number of shares were excluded from the dilutive share calculations as the effect on net income per share would have been antidilutive.
19.Subsequent Events
Investment Funds
In February 2018, a wholly owned subsidiary of the Company entered into an investment fund arrangement with an existing fund investor. The total commitment under the investment fund arrangement is $75.0 million. The Company’s wholly owned subsidiary has the right to elect to require the fund investor to sell all of its membership units to the Company’s wholly owned subsidiary once certain conditions have been met. The purchase price for the fund investor’s interests is determined based on the fair market value of those interests at the time the option is exercised. The Company has not yet completed its assessment of whether the investment fund arrangement is a VIE.
Subsequent to quarter end, the Company entered into non-binding letters of intent for five new tax equity investment funds for an aggregate $401 million. The fund investors’ obligations under the letters of intent are subject to the satisfaction of certain conditions, including negotiation of definitive documentation. If the commitments are consummated, the Company will assess whether the investment fund arrangements are VIEs.
Interest Rate Swaps
In January 2018, the Company entered into additional interest rate swaps with a notional amount of $73.0 million. The additional interest rate swaps were required by the terms of the Aggregation Facility due to additional draws on the Aggregation Facility made by the Company during the year ended December 31, 2017. These additional interest rate swaps were not designated as hedge instruments.
106
Item 9. Changes in and Disagreements with Accountants on Accounting and Financial Disclosure.
None.
Item 9A. Controls and Procedures.
Internal Control Over Financial Reporting
Evaluation of Disclosure Controls and Procedures
Our management, with the participation of our chief executive officer and chief financial officer, evaluated the effectiveness of our disclosure controls and procedures as of December 31, 2017 pursuant to Rule 13a-15 under the Securities Exchange Act of 1934, as amended (the “Exchange Act”). The term “disclosure controls and procedures,” as defined in Rules 13a-15(e) and 15d-15(e) under the Exchange Act, means controls and other procedures of a company that are designed to ensure that information required to be disclosed by a company in the reports that it files or submits under the Exchange Act is recorded, processed, summarized and reported within the time periods specified in the SEC’s rules and forms. Disclosure controls and procedures include, without limitation, controls and procedures designed to ensure that information required to be disclosed by a company in the reports that it files or submits under the Exchange Act is accumulated and communicated to the company’s management, including its principal executive and principal financial officers, as appropriate to allow timely decisions regarding required disclosure.
Management’s Report on Internal Control over Financial Reporting
Our management is responsible for establishing and maintaining adequate internal control over financial reporting (as defined by Rule 13a-15(f) under the Exchange Act). In assessing the effectiveness of our internal control over financial reporting as of December 31, 2017, our management used the criteria set forth by the Committee of Sponsoring Organizations of the Treadway Commission (2013 framework).
Based on our assessment using those criteria, our management has concluded that our internal control over financial reporting was effective as of December 31, 2017.
Inherent Limitation on the Effectiveness of Internal Control
The effectiveness of any system of internal control over financial reporting, including ours, is subject to inherent limitations, including the exercise of judgment in designing, implementing, operating, and evaluating the controls and procedures, and the inability to eliminate misconduct completely. Accordingly, any system of internal control over financial reporting, including ours, no matter how well designed and operated, can only provide reasonable, not absolute assurances. The nature of our investment funds increases the complexity of our accounting for the allocation of net income (loss) between our stockholders and non-controlling interests under the HLBV method and the calculation of our tax provision. As we enter into additional investment funds, which may have contractual provisions different from those of our existing funds, the calculation under the HLBV method and the calculation of our tax provision could become increasingly complicated. This additional complexity could increase the chance that we experience a material weakness in the future. In addition, projections of any evaluation of effectiveness to future periods are subject to the risk that controls may become inadequate because of changes in conditions, or that the degree of compliance with the policies or procedures may deteriorate. We intend to continue to monitor and upgrade our internal controls as necessary or appropriate for our business, but cannot assure you that such improvements will be sufficient to provide us with effective internal control over financial reporting.
We will be required to engage an independent registered public accounting firm to opine on the effectiveness of our internal control over financial reporting beginning at the date we are no longer an “emerging growth company” as defined in the JOBS Act. At such time, our management may conclude that our internal control over financial reporting is not effective. Moreover, even if our management concludes that our internal control over financial reporting is effective, our independent registered public accounting firm may issue a report that is adverse if such firm is not satisfied with the level at which our controls are documented, designed, operated or reviewed. As a result, we may need to undertake various actions, such as implementing new internal controls and procedures and hiring additional accounting or internal audit staff.
Changes in Internal Control over Financial Reporting
There were no changes in our internal control over financial reporting during the year ended December 31, 2017 that have materially affected, or are reasonably likely to materially affect, our internal control over financial reporting.
None.
107
Item 10. Directors, Executive Officers and Corporate Governance.
The information required by this Item 10 of Form 10-K that is found in our 2017 Proxy Statement to be filed with the SEC in connection with the solicitation of proxies for our 2018 Annual Meeting of Stockholders, or the 2017 Proxy Statement, is incorporated by reference to our 2017 Proxy Statement. The 2017 Proxy Statement will be filed with the SEC within 120 days after the end of the fiscal year to which this report relates.
Item 11. Executive Compensation.
The information required by Item 11 of Form 10-K is found in our 2017 Proxy Statement and is incorporated here by reference to our 2017 Proxy Statement.
Item 12. Security Ownership of Certain Beneficial Owners and Management and Related Stockholder Matters.
The information required by Item 12 of Form 10-K is found in our 2017 Proxy Statement and is incorporated here by reference to our 2017 Proxy Statement.
Item 13. Certain Relationships and Related Transactions, and Director Independence.
The information required by Item 13 of Form 10-K is found in our 2017 Proxy Statement and is incorporated here by reference to our 2017 Proxy Statement.
Item 14. Principal Accounting Fees and Services.
The information required by Item 14 of Form 10-K is found in our 2017 Proxy Statement and is incorporated here by reference to our 2017 Proxy Statement.
108
Item 15. Exhibits, Financial Statement Schedules.
(a)(1.) Consolidated Financial Statements:
The following documents are filed as a part of this Annual Report on Form 10-K for Vivint Solar, Inc.:
Report of Ernst & Young LLP, Independent Registered Public Accounting Firm.
Consolidated Balance Sheets as of December 31, 2017 and 2016.
Consolidated Statements of Operations for the years ended December 31, 2017, 2016 and 2015.
Consolidated Statements of Comprehensive Income for the years ended December 31, 2017, 2016 and 2015.
Consolidated Statements of Redeemable Non-Controlling Interest and Stockholders’ Equity for the years ended December 31, 2017, 2016 and 2015.
Consolidated Statements of Cash Flows for the years ended December 31, 2017, 2016 and 2015.
Notes to the Consolidated Financial Statements.
(2.) Financial Statement Schedules:
Financial statement schedules are omitted because they are not required, not applicable or because the required information is shown in the consolidated financial statements or notes thereto.
(3.) Exhibits:
Required exhibits are incorporated by reference or are filed with this Annual Report as set forth in the following Exhibit Index, which immediately precedes such exhibits.
109
|
Exhibit Number |
|
Description |
|
Form |
|
File No. |
|
Incorporated by Reference |
|
Filing Date |
|
3.1 |
|
Amended and Restated Certificate of Incorporation of the Company |
|
10-Q |
|
001-36642 |
|
3.1 |
|
November 12, 2014 |
|
3.2 |
|
|
10-Q |
|
001-36642 |
|
3.2 |
|
November 12, 2014 |
|
|
4.1 |
|
|
10-K |
|
001-36642 |
|
4.1 |
|
March 13, 2015 |
|
|
10.1+ |
|
Form of Director and Executive Officer Indemnification Agreement |
|
S-1 |
|
333-198372 |
|
10.1 |
|
August 26, 2014 |
|
10.2+ |
|
|
S-1 |
|
333-198372 |
|
10.2 |
|
August 26, 2014 |
|
|
10.3+ |
|
Form of Stock Option Agreement under the 2013 Omnibus Incentive Plan |
|
10-Q |
|
001-36642 |
|
10.17 |
|
November 12, 2014 |
|
10.4+ |
|
|
S-1/A |
|
333-198372 |
|
10.3 |
|
September 18, 2014 |
|
|
10.5+ |
|
Form of Notice of Stock Option Grant and Stock Option Agreement under the 2014 Equity Incentive Plan |
|
10-Q |
|
001-36642 |
|
10.15 |
|
November 12, 2014 |
|
10.6+ |
|
|
10-Q |
|
001-36642 |
|
10.16 |
|
November 12, 2014 |
|
|
10.7+ |
|
|
S-1 |
|
333-198372 |
|
10.4A |
|
August 26, 2014 |
|
|
10.8+ |
|
|
S-1 |
|
333-198372 |
|
10.4B |
|
August 26, 2014 |
|
|
10.9+ |
|
|
10-K |
|
001-36642 |
|
10.9 |
|
March 13, 2015 |
|
|
10.10+ |
|
|
S-1 |
|
333-198372 |
|
10.4D |
|
August 26, 2014 |
|
|
10.11+ |
|
|
S-1 |
|
333-198372 |
|
10.4E |
|
August 26, 2014 |
|
|
10.12+ |
|
|
S-1 |
|
333-198372 |
|
10.4F |
|
August 26, 2014 |
|
|
10.13+ |
|
|
S-1/A |
|
333-198372 |
|
10.5 |
|
September 18, 2014 |
110
111
|
Exhibit Number |
|
Description |
|
Form |
|
File No. |
|
Incorporated by Reference |
|
Filing Date |
|
|
|
S-1 |
|
333-198372 |
|
10.12 |
|
August 26, 2014 |
||
|
10.30 |
|
|
S-1 |
|
333-198372 |
|
10.12A |
|
August 26, 2014 |
|
|
10.31† |
|
|
S-1 |
|
333-198372 |
|
10.13 |
|
August 26, 2014 |
|
|
10.32† |
|
|
S-1/A |
|
333-198372 |
|
10.46 |
|
September 18, 2014 |
|
|
10.33† |
|
|
10-Q |
|
001-36642 |
|
10.1 |
|
May 9, 2016 |
|
|
10.34† |
|
|
10-Q |
|
001-36642 |
|
10.1 |
|
November 8, 2016 |
|
|
10.35† |
|
|
10-K |
|
001-36642 |
|
10.38 |
|
March 16, 2017 |
|
|
10.36 |
|
|
10-K |
|
001-36642 |
|
10.24 |
|
March 13, 2015 |
|
|
10.37 |
|
|
10-Q |
|
001-36642 |
|
10.1 |
|
November 12, 2014 |
|
|
10.38 |
|
|
10-Q |
|
001-36642 |
|
10.2 |
|
November 12, 2014 |
112
|
Exhibit Number |
|
Description |
|
Form |
|
File No. |
|
Incorporated by Reference |
|
Filing Date |
|
|
|
10-Q |
|
001-36642 |
|
10.3 |
|
November 12, 2014 |
||
|
10.40 |
|
|
10-Q |
|
001-36642 |
|
10.4 |
|
November 12, 2014 |
|
|
10.41 |
|
|
10-Q |
|
001-36642 |
|
10.5 |
|
November 12, 2014 |
|
|
10.42 |
|
|
10-Q |
|
001-36642 |
|
10.6 |
|
November 12, 2014 |
|
|
10.43 |
|
|
10-Q |
|
001-36642 |
|
10.7 |
|
November 12, 2014 |
|
|
10.44 |
|
|
10-Q |
|
001-36642 |
|
10.9 |
|
November 12, 2014 |
|
|
10.45 |
|
|
10-Q |
|
001-36642 |
|
10.10 |
|
November 12, 2014 |
|
|
10.46 |
|
|
10-Q |
|
001-36642 |
|
10.11 |
|
November 12, 2014 |
|
|
10.47 |
|
|
S-1 |
|
333-198372 |
|
10.28 |
|
August 26, 2014 |
|
|
10.48 |
|
Lease Agreement, dated as of August 12, 2014, by and between the Company and T-Stat One, LLC |
|
S-1/A |
|
333-198372 |
|
10.48 |
|
September 18, 2014 |
|
10.49 |
|
First Amendment to Lease, dated as of July 20, 2015, by and between the Company and T-Stat One, LLC |
|
10-K |
|
001-36642 |
|
10.52 |
|
March 16, 2017 |
|
10.50 |
|
|
10-K |
|
001-36642 |
|
10.53 |
|
March 16, 2017 |
|
|
10.51† |
|
|
S-1/A |
|
333-198372 |
|
10.29 |
|
September 18, 2014 |
113
|
Exhibit Number |
|
Description |
|
Form |
|
File No. |
|
Incorporated by Reference |
|
Filing Date |
|
|
|
S-1/A |
|
333-198372 |
|
10.29A |
|
September 18, 2014 |
||
|
10.53 |
|
|
S-1 |
|
333-198372 |
|
10.29B |
|
September 18, 2014 |
|
|
10.54† |
|
|
10-Q |
|
001-36642 |
|
10.2 |
|
May 14, 2015 |
|
|
10.55† |
|
|
S-1/A |
|
333-198372 |
|
10.30 |
|
September 18, 2014 |
|
|
10.56 |
|
|
S-1/A |
|
333-198372 |
|
10.30A |
|
September 18, 2014 |
|
|
10.57 |
|
|
S-1/A |
|
333-198372 |
|
10.30B |
|
September 18, 2014 |
|
|
10.58 |
|
|
10-Q |
|
001-36642 |
|
10.4 |
|
May 14, 2015 |
|
|
10.59 |
|
|
S-1/A |
|
333-198372 |
|
10.31 |
|
September 18, 2014 |
|
|
10.60 |
|
|
10-Q |
|
001-36642 |
|
10.3 |
|
May 14, 2015 |
114
|
Exhibit Number |
|
Description |
|
Form |
|
File No. |
|
Incorporated by Reference |
|
Filing Date |
|
|
|
S-1 |
|
333-198372 |
|
10.32 |
|
September 18, 2014 |
||
|
10.62† |
|
|
S-1/A |
|
333-198372 |
|
10.33 |
|
September 18, 2014 |
|
|
10.63† |
|
|
S-1/A |
|
333-198372 |
|
10.33A |
|
September 18, 2014 |
|
|
10.64 |
|
|
10-Q |
|
001-36642 |
|
10.5 |
|
May 14, 2015 |
|
|
10.65† |
|
|
S-1/A |
|
333-198372 |
|
10.34 |
|
September 18, 2014 |
|
|
10.66 |
|
|
S-1/A |
|
333-198372 |
|
10.34A |
|
September 18, 2014 |
|
|
10.67† |
|
|
S-1/A |
|
333-198372 |
|
10.34B |
|
September 18, 2014 |
|
|
10.68 |
|
|
10-Q |
|
001-36642 |
|
10.7 |
|
May 14, 2015 |
|
|
10.69 |
|
|
S-1/A |
|
333-198372 |
|
10.35 |
|
September 18, 2014 |
115
|
Exhibit Number |
|
Description |
|
Form |
|
File No. |
|
Incorporated by Reference |
|
Filing Date |
|
|
|
10-Q |
|
001-36642 |
|
10.6 |
|
May 14, 2015 |
||
|
10.71 |
|
|
S-1 |
|
333-198372 |
|
10.36 |
|
September 18, 2014 |
|
|
10.72† |
|
|
S-1/A |
|
333-198372 |
|
10.37 |
|
September 18, 2014 |
|
|
10.73 |
|
|
10-Q |
|
001-36642 |
|
10.8 |
|
May 14, 2015 |
|
|
10.74† |
|
|
S-1/A |
|
333-198372 |
|
10.38 |
|
September 18, 2014 |
|
|
10.75 |
|
|
10-Q |
|
001-36642 |
|
10.10 |
|
May 14, 2015 |
|
|
10.76 |
|
|
S-1/A |
|
333-198372 |
|
10.39 |
|
September 18, 2014 |
|
|
10.77 |
|
|
10-Q |
|
001-36642 |
|
10.9 |
|
May 14, 2015 |
|
|
10.78 |
|
|
S-1 |
|
333-198372 |
|
10.40 |
|
September 18, 2014 |
|
|
10.79 |
|
|
S-1 |
|
333-198372 |
|
10.41 |
|
August 26, 2014 |
116
|
Exhibit Number |
|
Description |
|
Form |
|
File No. |
|
Incorporated by Reference |
|
Filing Date |
|
|
|
S-1/A |
|
333-198372 |
|
10.43 |
|
September 18, 2014 |
||
|
10.81† |
|
|
10-Q |
|
001-36642 |
|
10.1 |
|
May 9, 2017 |
|
|
10.82† |
|
|
10-Q |
|
001-36642 |
|
10.2 |
|
May 9, 2017 |
|
|
10.83 |
|
|
10-Q |
|
001-36642 |
|
10.1 |
|
November 7, 2017 |
|
|
10.84† |
|
|
10-Q |
|
001-36642 |
|
10.2 |
|
November 7, 2017 |
|
|
10.85†* |
|
|
|
|
|
|
|
|
|
|
|
21.1* |
|
|
|
|
|
|
|
|
|
|
|
23.1* |
|
|
|
|
|
|
|
|
|
|
|
31.1* |
|
|
|
|
|
|
|
|
|
|
|
31.2* |
|
|
|
|
|
|
|
|
|
|
|
32.1* |
|
|
|
|
|
|
|
|
|
117
|
Exhibit Number |
|
Description |
|
Form |
|
File No. |
|
Incorporated by Reference |
|
Filing Date |
|
|
|
|
|
|
|
|
|
|
||
|
101.INS* |
|
XBRL Instance Document |
|
|
|
|
|
|
|
|
|
101.SCH* |
|
XBRL Taxonomy Extension Schema Document |
|
|
|
|
|
|
|
|
|
101.CAL* |
|
XBRL Taxonomy Extension Calculation Linkbase Document |
|
|
|
|
|
|
|
|
|
101.DEF* |
|
XBRL Taxonomy Extension Definition Linkbase Document |
|
|
|
|
|
|
|
|
|
101.LAB* |
|
XBRL Taxonomy Extension Label Linkbase Document |
|
|
|
|
|
|
|
|
|
101.PRE* |
|
XBRL Taxonomy Extension Presentation Linkbase Document |
|
|
|
|
|
|
|
|
|
|
|
|
||||||||
|
Legend: |
|
|
||||||||
|
+ |
|
Indicates a management contract or compensatory plan. |
||||||||
|
† |
|
Confidential treatment has been requested with respect to certain portions of this exhibit. Omitted portions have been filed separately with the Securities and Exchange Commission. |
||||||||
|
* |
|
Filed herewith. The Certifications attached as Exhibits 32.1 and 32.2 that accompany this Annual Report on Form 10-K are not deemed filed with the Securities and Exchange Commission and are not to be incorporated by reference into any filing of the Company under the Securities Act of 1933, as amended, or the Securities Exchange Act of 1934, as amended, whether made before or after the date of this Form 10-K, irrespective of any general incorporation language contained in such filing. |
||||||||
118
Pursuant to the requirements of Section 13 or 15(d) of the Securities Exchange Act of 1934, as amended, the Registrant has duly caused this report to be signed on its behalf by the undersigned, thereunto duly authorized.
|
|
|
Vivint Solar, Inc. |
|
|
|
|
|
|
|
Date: March 7, 2018 |
|
By: |
/s/ David Bywater |
|
|
|
|
David Bywater |
|
|
|
|
Chief Executive Officer |
Pursuant to the requirements of the Securities Exchange Act of 1934, as amended, this report has been signed below by the following persons on behalf of the Registrant in the capacities and on the dates indicated.
|
Name |
|
Title |
|
Date |
|
|
|
|
|
|
|
/s/ David Bywater |
|
Chief Executive Officer, Director |
|
March 7, 2018 |
|
David Bywater |
|
(Principal Executive Officer) |
|
|
|
|
|
|
|
|
|
/s/ Dana Russell |
|
Chief Financial Officer and Executive Vice President |
|
March 7, 2018 |
|
Dana Russell |
|
(Principal Accounting and Financial Officer) |
|
|
|
|
|
|
|
|
|
/s/ David F. D’Alessandro |
|
Director |
|
March 7, 2018 |
|
David F. D’Alessandro |
|
|
|
|
|
|
|
|
|
|
|
/s/ Alex J. Dunn |
|
Director |
|
March 7, 2018 |
|
Alex J. Dunn |
|
|
|
|
|
|
|
|
|
|
|
/s/ Bruce McEvoy |
|
Director |
|
March 7, 2018 |
|
Bruce McEvoy |
|
|
|
|
|
|
|
|
|
|
|
/s/ Jay D. Pauley |
|
Director |
|
March 7, 2018 |
|
Jay D. Pauley |
|
|
|
|
|
|
|
|
|
|
|
/s/ Todd R. Pedersen |
|
Director |
|
March 7, 2018 |
|
Todd R. Pedersen |
|
|
|
|
|
|
|
|
|
|
|
/s/ Joseph S. Tibbetts, Jr. |
|
Director |
|
March 7, 2018 |
|
Joseph S. Tibbetts, Jr. |
|
|
|
|
|
|
|
|
|
|
|
/s/ Peter F. Wallace |
|
Director |
|
March 7, 2018 |
|
Peter F. Wallace |
|
|
|
|
119