Attached files
| file | filename |
|---|---|
| EX-23.1 - EXHIBIT 23.1 - TerraForm Power NY Holdings, Inc. | terraform-123117xexhibit231.htm |
| EX-32 - EXHIBIT 32 - TerraForm Power NY Holdings, Inc. | terraform-123117xexhibit32.htm |
| EX-31.2 - EXHIBIT 31.2 - TerraForm Power NY Holdings, Inc. | terraform-123117xexhibit312.htm |
| EX-31.1 - EXHIBIT 31.1 - TerraForm Power NY Holdings, Inc. | terraform-123117xexhibit311.htm |
| EX-21.1 - EXHIBIT 21.1 - TerraForm Power NY Holdings, Inc. | terraform-123117xexhibit211.htm |
| EX-10.22 - EXHIBIT 10.22 - TerraForm Power NY Holdings, Inc. | terraform-123117xexhibit1022.htm |
| EX-10.21 - EXHIBIT 10.21 - TerraForm Power NY Holdings, Inc. | terraform-123117xexhibit1021.htm |
| EX-10.20 - EXHIBIT 10.20 - TerraForm Power NY Holdings, Inc. | terraform-123117xexhibit1020.htm |
| EX-10.19 - EXHIBIT 10.19 - TerraForm Power NY Holdings, Inc. | terraform-123117xexhbit1019.htm |
UNITED STATES
SECURITIES AND EXCHANGE COMMISSION
Washington, D.C. 20549
_____________________________________________________________________________
FORM 10-K
_____________________________________________________________________________
(Mark One)
x | ANNUAL REPORT PURSUANT TO SECTION 13 OR 15(d) OF THE SECURITIES EXCHANGE ACT OF 1934 |
For the Fiscal Year ended December 31, 2017
OR
o | TRANSITION REPORT PURSUANT TO SECTION 13 OR 15(d) OF THE SECURITIES EXCHANGE ACT OF 1934 |
For the transition period from to
Commission File Number: 001-36542
______________________________________________________________

TerraForm Power, Inc.
(Exact name of registrant as specified in its charter)
_____________________________________________________________________________
Delaware | 46-4780940 | |
(State or other jurisdiction of incorporation or organization) | (I. R. S. Employer Identification No.) | |
7550 Wisconsin Avenue, 9th Floor, Bethesda, Maryland | 20814 | |
(Address of principal executive offices) | (Zip Code) | |
240-762-7700
(Registrant’s telephone number, including area code)
Securities registered pursuant to Section 12(b) of the Act:
Title of Each Class | Name of Exchange on Which Registered | |
Common Stock, Class A, par value $0.01 | NASDAQ Global Select Market | |
Securities registered pursuant to Section 12(g) of the Act: None
___________________________________________________________
Indicate by check mark if the registrant is a well-known seasoned issuer, as defined by Rule 405 of the Securities Act. Yes o No x
Indicate by check mark if the registrant is not required to file reports pursuant to Section 13 or Section 15(d) of the Act. Yes o No x
Indicate by check mark whether the registrant: (1) has filed all reports required to be filed by Section 13 or 15(d) of the Securities Exchange Act of 1934 during the preceding 12 months (or for such shorter period that the registrant was required to file such reports), and (2) has been subject to such filing requirements for the past 90 days. Yes x No o
Indicate by check mark whether the registrant has submitted electronically and posted on its corporate Web site, if any, every Interactive Data File required to be submitted and posted pursuant to Rule 405 of Regulation S-T (§232.405 of this chapter) during the preceding 12 months (or for such shorter period that the registrant was required to submit and post such files). Yes x No o
Indicate by check mark if disclosure of delinquent filers pursuant to Item 405 of Regulation S-K (§229.405 of this chapter) is not contained herein, and will not be contained, to the best of the registrant's knowledge, in definitive proxy or information statements incorporated by reference in Part III of this Form 10-K or any amendment to this Form 10-K. o
Indicate by check mark whether the registrant is a large accelerated filer, an accelerated filer, a non-accelerated filer, a smaller reporting company or an emerging growth company. See the definitions of “large accelerated filer,” “accelerated filer,” “smaller reporting company” and “emerging growth company” in Rule 12b-2 of the Exchange Act.
Large accelerated filer | x | Accelerated filer | o | |||
Non-accelerated filer | o (Do not check if a smaller reporting company) | Smaller reporting company | o | |||
Emerging growth company | o | |||||
If an emerging growth company, indicate by check mark if the registrant has elected not to use the extended transition period for complying with any new or revised financial accounting standards provided pursuant to Section 13(a) of the Exchange Act. o
Indicate by check mark whether the registrant is a shell company (as defined in Rule 12b-2 of the Exchange Act). Yes o No x
As of June 30, 2017, the last business day of the registrant's most recently completed second fiscal quarter, the aggregate market value of the voting and non-voting common equity of the registrant, held by non-affiliates of the registrant (based upon the closing sale price of shares of Class A common stock of the registrant on the NASDAQ Global Select Market on such date), was approximately $1.1 billion.
As of February 28, 2018, there were 148,086,027 shares of Class A common stock outstanding.
DOCUMENTS INCORPORATED BY REFERENCE
Portions of the registrant's definitive proxy statement relating to its 2018 annual meeting of stockholders (the “2018 Proxy Statement”) are incorporated by reference into Part III of this Form 10-K where indicated. The 2018 Proxy Statement will be filed with the U.S. Securities and Exchange Commission within 120 days after the end of the fiscal year to which this report relates.
TerraForm Power, Inc. and Subsidiaries
Table of Contents
Form 10-K
Item 1. | ||
Item 1A. | ||
Item 1B. | ||
Item 2. | ||
Item 3. | ||
Item 4. | ||
Item 5. | ||
Item 6. | ||
Item 7. | ||
Item 7A. | ||
Item 8. | ||
Item 9. | ||
Item 9A. | ||
Item 9B. | ||
Item 10. | ||
Item 11. | ||
Item 12. | ||
Item 13. | ||
Item 14. | ||
Item 15. | ||
CAUTIONARY STATEMENT CONCERNING FORWARD-LOOKING STATEMENTS
This communication contains forward-looking statements within the meaning of Section 27A of the Securities Act of 1933 and Section 21E of the Securities Exchange Act of 1934. Forward-looking statements can be identified by the fact that they do not relate strictly to historical or current facts. These statements involve estimates, expectations, projections, goals, assumptions, known and unknown risks, and uncertainties and typically include words or variations of words such as “expect,” “anticipate,” “believe,” “intend,” “plan,” “seek,” “estimate,” “predict,” “project,” “goal,” “guidance,” “outlook,” “objective,” “forecast,” “target,” “potential,” “continue,” “would,” “will,” “should,” “could,” or “may” or other comparable terms and phrases. All statements that address operating performance, events, or developments that the Company expects or anticipates will occur in the future are forward-looking statements. They may include estimates of expected cash available for distribution, earnings, revenues, capital expenditures, liquidity, capital structure, future growth, financing arrangements and other financial performance items (including future dividends per share), descriptions of management’s plans or objectives for future operations, products, or services, or descriptions of assumptions underlying any of the above. Forward-looking statements provide the Company’s current expectations or predictions of future conditions, events, or results and speak only as of the date they are made. Although the Company believes its expectations and assumptions are reasonable, it can give no assurance that these expectations and assumptions will prove to have been correct and actual results may vary materially.
Important factors that could cause actual results to differ materially from our expectations, or cautionary statements, are listed below and further disclosed under the section entitled Item 1A. Risk Factors:
• | risks related to the transition to Brookfield Asset Management Inc. sponsorship, including our ability to realize the expected benefits of the sponsorship; |
• | risks related to wind conditions at our wind assets or to weather conditions at our solar assets; |
• | risks related to the effectiveness of our internal controls over financial reporting; |
• | pending and future litigation; |
• | the willingness and ability of counterparties to fulfill their obligations under offtake agreements; |
• | price fluctuations, termination provisions and buyout provisions in offtake agreements; |
• | our ability to enter into contracts to sell power on acceptable prices and terms, including as our offtake agreements expire; |
• | our ability to compete against traditional and renewable energy companies; |
• | government regulation, including compliance with regulatory and permit requirements and changes in tax laws, market rules, rates, tariffs, environmental laws and policies affecting renewable energy; |
• | risks related to the proposed relocation of the Company’s headquarters; |
• | the condition of the debt and equity capital markets and our ability to borrow additional funds and access capital markets, as well as our substantial indebtedness and the possibility that we may incur additional indebtedness going forward; |
• | operating and financial restrictions placed on us and our subsidiaries related to agreements governing indebtedness; |
• | risks related to the expected timing and likelihood of completion of the tender offer for the shares of Saeta Yield, S.A., including the timing or receipt of any governmental approvals; |
• | risks related to our financing of the tender offer for the shares of Saeta Yield, S.A., including our ability to issue equity on terms that are accretive to our shareholders and our ability to implement our permanent funding plan; |
• | our ability to successfully identify, evaluate and consummate acquisitions; and |
• | our ability to integrate the projects we acquire from third parties, including Saeta Yield, S.A., or otherwise and realize the anticipated benefits from such acquisitions. |
The Company disclaims any obligation to publicly update or revise any forward-looking statement to reflect changes in underlying assumptions, factors, or expectations, new information, data, or methods, future events, or other changes, except as required by law. The foregoing list of factors that might cause results to differ materially from those contemplated in the forward-looking statements should be considered in connection with information regarding risks and uncertainties, which are described in this Annual Report on Form 10-K, as well as additional factors we may describe from time to time in other filings with the SEC. We operate in a competitive and rapidly changing environment. New risks and uncertainties emerge from time to time, and you should understand that it is not possible to predict or identify all such factors and, consequently, you should not consider any such list to be a complete set of all potential risks or uncertainties.
GLOSSARY OF TERMS
When the following terms and abbreviations appear in the text of this report, they have the meanings indicated below:
Adjusted EBITDA | Adjusted EBITDA is defined as net income (loss) plus depreciation, accretion and amortization, non-cash general and administrative costs, interest expense, income tax (benefit) expense, acquisition related expenses, and certain other non-cash charges, unusual or non-recurring items and other items that we believe are not representative of our core business or future operating performance. | |
Cash available for distribution | Cash available for distribution is defined as adjusted EBITDA (i) minus cash distributions paid to non-controlling interests in our renewable energy facilities, if any, (ii) minus annualized scheduled interest and project-level amortization payments in accordance with the related borrowing arrangements, (iii) minus average annual sustaining capital expenditures (based on the long-sustaining capital expenditure plans) which are recurring in nature and used to maintain the reliability and efficiency of our power generating assets over our long-term investment horizon, (iv) plus or minus operating items as necessary to present the cash flows we deem representative of our core business operations. For items determined on an annualized basis, we used actual cash payments as a proxy for an annualized number prior to the period commencing January 1, 2018. | |
GWh | Gigawatt hours | |
ITC | Investment tax credit | |
MW | Megawatt | |
MWh | Megawatt hours | |
Nameplate capacity | Nameplate capacity for solar generation facilities represents the maximum generating capacity at standard test conditions of a facility (in direct current, “DC”) multiplied by our percentage ownership of that facility (disregarding any equity interests held by any non-controlling member or lessor under any sale-leaseback financing or any non-controlling interests in a partnership). Nameplate capacity for wind power plants represents the manufacturer’s maximum nameplate generating capacity of each turbine (in alternating current, “AC”) multiplied by the number of turbines at a facility multiplied by our percentage ownership of that facility (disregarding any equity interests held by any tax equity investor or lessor under any sale-leaseback financing or any non-controlling interests in a partnership). | |
PPA | As applicable, Power Purchase Agreement, energy hedge contract and/or REC or SREC contract | |
PTC | Production tax credit | |
REC | Renewable energy certificate or SREC | |
Renewable energy facilities | Solar generation facilities and wind power plants | |
SREC | Solar renewable energy certificate | |
PART I
Item 1. Business.
Overview
TerraForm Power, Inc. (“TerraForm Power”) owns and operates a high-quality, diversified portfolio of solar and wind assets located primarily in the United States and underpinned by long-term contracts, totaling more than 2,600 MW of installed capacity. TerraForm Power’s goal is to acquire operating solar and wind assets in North America and Western Europe and it is sponsored by Brookfield Asset Management Inc. (“Brookfield”), a leading global alternative asset manager with more than $265 billion of assets under management.
TerraForm Power's objective is to deliver an attractive risk-adjusted return to its shareholders. We expect to generate this total return with a regular dividend, which we intend to grow at 5 to 8% per annum, that is backed by stable cash flows.
TerraForm Power is a holding company and its only material asset is an equity interest in TerraForm Power, LLC, or “Terra LLC.” TerraForm Power is the managing member of Terra LLC and operates, controls and consolidates the business affairs of Terra LLC. Unless otherwise indicated or otherwise required by the context, references to “we,” “our,” “us” or the “Company” refer to TerraForm Power and its consolidated subsidiaries.
Our principal executive offices are located at 7550 Wisconsin Avenue, 9th Floor, Bethesda, Maryland 20814, and our telephone number is (240) 762-7700. Our website address is www.terraformpower.com. Information contained on our website is not incorporated by reference into this Annual Report on Form 10-K and does not constitute part of this Annual Report on Form 10-K.
6
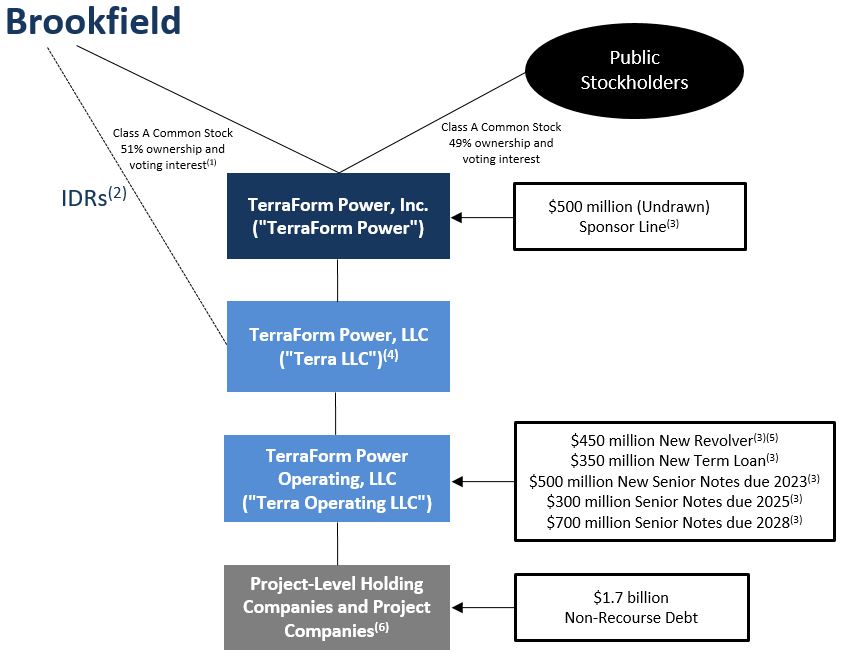
The diagram below is a summary depiction of our organizational and capital structure as of December 31, 2017:
—————
(1) | As of December 31, 2017, there were 148,086,027 Class A shares of TerraForm Power outstanding, of which Orion US Holdings 1 L.P. (“Orion Holdings”) owns 51%. In turn, Orion Holdings is managed and controlled by Brookfield. |
(2) | Incentive distribution rights (“IDRs”) represent a variable interest in distributions by Terra LLC and therefore cannot be expressed as a fixed percentage ownership interest in Terra LLC. BRE Delaware, Inc. (the “Brookfield IDR Holder”) holds all of the IDRs of Terra LLC. Brookfield IDR Holder is an indirect wholly owned subsidiary of Brookfield. |
(3) | See Liquidity and Capital Resources within Item 7. Management's Discussion and Analysis of Financial Condition and Results of Operations for discussion regarding these financing arrangements. |
(4) | Terra LLC is a guarantor of the indebtedness of Terra Operating LLC. |
(5) | Represents total borrowing capacity as of December 31, 2017. As of December 31, 2017, there were $60.0 million of revolving loans and $102.6 million of letters of credit outstanding under the New Revolver, with availability of $287.4 million as of such date. |
(6) | Certain project-level holding companies are guarantors of the indebtedness of Terra Operating LLC. These specific project-level holding companies do not have any indebtedness. |
7
Our Business Strategy
Our primary business strategy is to acquire, own and operate solar and wind assets in North America and Western Europe. We are the owner and operator of a 2,600 MW diversified portfolio of high-quality solar and wind assets, located primarily in the United States and underpinned by long-term contracts. Significant diversity across technologies and locations coupled with contracts across a large, diverse group of creditworthy counterparties significantly reduces the impact of resource variability on cash available for distribution and limits our exposure to any individual counterparty.
On April 21, 2016, SunEdison, Inc. (together with its consolidated subsidiaries excluding the Company and TerraForm Global, Inc. and its subsidiaries, “SunEdison”), our previous sponsor, and certain of its domestic and international subsidiaries (the “SunEdison Debtors”) voluntarily filed for protection under Chapter 11 of the U.S. Bankruptcy Code (the “SunEdison Bankruptcy”). In response to SunEdison’s financial and operating difficulties, we initiated a process for the exploration and evaluation of potential strategic alternatives for the Company. This process resulted in our entry into a definitive merger and sponsorship transaction agreement (the “Merger Agreement”) on March 6, 2017 with Orion Holdings and BRE TERP Holdings Inc. (“Merger Sub”), a wholly-owned subsidiary of Orion Holdings, which are both affiliates of Brookfield. At the same time, we also entered into a settlement agreement (the “Settlement Agreement”) and a voting and support agreement (the “Voting and Support Agreement”) with SunEdison to, among other things, facilitate the closing of the merger transaction and the settlement of claims between the Company and SunEdison.
On October 16, 2017, Merger Sub merged with and into TerraForm Power (the “Merger”), with TerraForm Power continuing as the surviving corporation in the Merger, and the Company entered into a suite of support and sponsorship arrangements (the “Sponsorship Transaction”) with Brookfield and certain of its affiliates, as described in greater detail below. In this Annual Report on Form 10-K, we generally refer to these collective transactions, and any other agreements or arrangements entered into in connection therewith, as the “Merger and Sponsorship Transaction.”
In connection with the successful completion of the Merger and Sponsorship Transaction, Brookfield replaced SunEdison as our sponsor and all outstanding claims between us and SunEdison that may have existed prior to the closing of the Merger and Sponsorship Transaction were finally settled, and all agreements between the Company and the SunEdison Debtors were deemed rejected, subject to certain limited exceptions, without further liability, claims or damages on the part of the Company.
Our goal is to pay dividends to our shareholders that are sustainable on a long-term basis while retaining within our operations sufficient liquidity for recurring growth capital expenditures and general purposes. We expect to generate this return with a regular dividend, which we intend to grow at 5 to 8% per annum, that is supported by a target payout ratio of 80 to 85% of cash available for distribution and our stable cash flows. We expect to achieve this growth and deliver returns by focusing on the following initiatives:
• | Margin Enhancements: |
We believe there is significant opportunity to enhance our cash flow through productivity enhancements by rationalizing our headcount and implementing a more efficient organizational structure. In addition, we plan to automate a number of processes that are currently very labor intensive and expect to realize cost savings through reductions in operations and maintenance (“O&M”) expenses and the in-sourcing of asset management and certain back office functions.
• | Organic Growth: |
We plan to develop a robust organic growth pipeline comprised of opportunities to invest in our existing fleet on an accretive basis as well as add-on acquisitions across our scope of operations. We have identified a number of opportunities which we believe may be compelling to invest in our fleet, including asset repowerings, site expansions and potentially adding energy storage to existing sites.
• | Value-oriented acquisitions: |
We expect to evaluate a number of acquisition opportunities with a focus on sourcing off-market transactions at more attractive valuations than auction processes. Our recently announced tender offer for the outstanding shares of Saeta Yield, S.A. (as described below under Irrevocable Agreement to Launch Tender Offer for the Common Shares of Saeta Yield) is an example of these acquisition opportunities. We believe that multi-faceted transactions such as take-privates and recapitalizations may enable us to acquire high quality assets at attractive relative values.
8
We have a right of first offer (“ROFO”) to acquire certain renewable power assets in North America and Western Europe owned by Brookfield and its affiliates. The ROFO portfolio currently stands at 3,500 MW. Over time, as Brookfield entities look to sell these assets, we will have the opportunity to make offers for these assets and potentially purchase them if the prices meet our investment objectives and are the most favorable offered to Brookfield. We also continue to maintain a call right over 0.5 GW (net) of operating wind power plants that are owned by a warehouse vehicle that was owned and arranged by SunEdison. SunEdison sold its equity interest in this warehouse vehicle to an unaffiliated third party in 2017.
We believe we are well positioned to benefit from Brookfield's deep operational expertise in owning, operating and developing renewable assets, as well as its significant deal sourcing capabilities and access to capital. Brookfield is a leading global alternative asset manager and has a more than 100-year history of owning and operating assets with a focus on renewable power, property, infrastructure and private equity. Brookfield has approximately $40 billion in renewable power assets under management, representing approximately 16,400 MW of generation capacity in 14 countries. It also employs over 2,000 individuals with extensive operating, development and power marketing capabilities and has a demonstrated ability to deploy capital in a disciplined manner, having developed or acquired 12,000 MW of renewable generation capacity since 2012.
Sponsorship Arrangements
On October 16, 2017, in connection with the consummation of the Merger, TerraForm Power entered into the following:
• | Master Services Agreement (the “Brookfield MSA”), with Brookfield, BRP Energy Group L.P., Brookfield Asset Management Private Institutional Capital Adviser (Canada), L.P., Brookfield Global Renewable Energy Advisor Limited, Terra LLC and Terra Operating LLC, pursuant to which Brookfield and certain of its affiliates will provide certain management and administrative services, including the provision of strategic and investment management services, to TerraForm Power and its subsidiaries. |
• | Relationship Agreement (the “Relationship Agreement”) with Brookfield, Terra LLC and Terra Operating LLC, which governs certain aspects of the relationship between Brookfield and TerraForm Power and its subsidiaries. Pursuant to the Relationship Agreement, during the term of the agreement, TerraForm Power and its subsidiaries serve as the primary vehicle through which Brookfield and its affiliates will acquire operating solar and wind assets in certain countries in North America and Western Europe, and Brookfield grants TerraForm Power a right of first offer on any proposed transfer of certain existing projects and all future operating solar and wind projects located in such countries developed by persons sponsored by or under the control of Brookfield. |
• | Governance Agreement (the “Governance Agreement”) with Orion Holdings and any controlled affiliate of Brookfield (other than TerraForm Power and its controlled affiliates) (together with Brookfield, the “Sponsor Group”) that by the terms of the Governance Agreement from time to time becomes a party thereto. The Governance Agreement establishes certain rights and obligations of TerraForm Power and members of the Sponsor Group that own voting securities of TerraForm Power relating to the governance of TerraForm Power and the relationship between such members of the Sponsor Group and TerraForm Power and its controlled affiliates. |
We also entered into an amended and restated limited liability company agreement with Brookfield IDR Holder and a $500.0 million sponsor line of credit with Brookfield and one of its affiliates as discussed in Liquidity and Capital Resources within Item 7. Management's Discussion and Analysis of Financial Condition and Results of Operations.
Recent Corporate Governance and Management Changes
Certain corporate governance changes were implemented following the completion of the Merger and Sponsorship Transaction. As part of the Merger and Sponsorship Transaction, TerraForm Power’s corporate governance was simplified to better align the interests of all of our stakeholders. We now have a single class of A shares worth one vote each, as opposed to our previous dual-class structure. Upon consummation of the Merger and Sponsorship Transaction, the size of our Board of Directors (the “Board”) was set at seven members, of whom four are designated by Brookfield and three are independent and were initially chosen by our Board prior to the Merger and Sponsorship Transaction. On November 16, 2017, one of our three independent directors resigned as a director, and as a result, a new independent director was appointed to our Board on February 5, 2018.
In addition, we have experienced changes to our executive officers and senior management, including the departure of our interim Chief Executive Officer, Chief Financial Officer and General Counsel upon the closing of the Merger and Sponsorship Transaction. The governance agreements entered into between the Company and Brookfield in connection with the
9
Merger and Sponsorship Transaction provide for Brookfield to appoint our Chief Executive Officer, Chief Financial Officer and General Counsel. These three executive officers are not employees of the Company and their services are provided pursuant to the Brookfield MSA.
Our Board has established an Audit Committee and a Conflicts Committee, consisting of our independent directors. The Conflicts Committee will consider, among other things, matters in which a conflict of interest exists between our company and Brookfield. Our Board has also established a Nominating and Governance Committee, which consists of three directors, one of whom is a director designated by Brookfield and two of whom are independent directors. See Item 10. Directors, Executive Officers and Corporate Governance for further discussion regarding our executive officers, directors and corporate governance.
Changes within Our Portfolio
The following table provides an overview of the changes within our portfolio from December 31, 2016 through December 31, 2017:
Net Nameplate Capacity (MW)¹ | ||||||||
Facility Type | Number of Sites | |||||||
Description | ||||||||
Total Portfolio as of December 31, 2016 | 2,983.1 | 2,503 | ||||||
Sale of U.K. Utility Solar Portfolio | Solar | (208.4 | ) | (14 | ) | |||
Sale of Fairwinds & Crundale | Solar | (55.9 | ) | (2 | ) | |||
Sale of Stonehenge Q1 | Solar | (41.2 | ) | (3 | ) | |||
Sale of Stonehenge Operating | Solar | (23.6 | ) | (3 | ) | |||
Sale of Says Court | Solar | (19.8 | ) | (1 | ) | |||
Sale of Crucis Farm | Solar | (16.1 | ) | (1 | ) | |||
Sale of Resi 2015 Portfolio 1 | Solar | (8.9 | ) | (1,246 | ) | |||
Sale of Resi 2014 Portfolio 1 | Solar | (2.8 | ) | (700 | ) | |||
Total Portfolio as of December 31, 2017 | 2,606.4 | 533 | ||||||
(1) | Net nameplate capacity represents the maximum generating capacity at standard test conditions of a facility multiplied by the Company's percentage of economic ownership of that facility after taking into account any redeemable preference shares and stockholder loans the Company holds. Our percentage of economic ownership is subject to change in future periods for certain facilities. |
10
Our Portfolio
Our current portfolio consists of renewable energy facilities located in the United States (including Puerto Rico), Canada, Chile and the United Kingdom with a combined nameplate capacity of 2,606.4 MW as of December 31, 2017. These renewable energy facilities generally have long-term PPAs with creditworthy counterparties. As of December 31, 2017, on a weighted average basis (based on MW), our PPAs had a remaining life of 14 years and our counterparties to our PPAs had an investment grade credit rating.
The following table lists the renewable energy facilities that comprise our portfolio as of December 31, 2017:
Facility Category / Portfolio | Location | Nameplate Capacity (MW) | Net Nameplate Capacity (MW) | Number of Sites | Weighted Average Remaining Duration of PPA (Years)1 | |||||||||
Solar Distributed Generation: | ||||||||||||||
CD DG Portfolio | U.S.2 | 77.8 | 77.8 | 42 | 15 | |||||||||
DG 2015 Portfolio 2 | U.S.2 | 48.1 | 48.1 | 30 | 18 | |||||||||
U.S. Projects 2014 | U.S.2 | 45.4 | 45.4 | 41 | 17 | |||||||||
DG 2014 Portfolio 1 | U.S.2 | 44.0 | 44.0 | 46 | 17 | |||||||||
TEG | U.S.2 | 33.8 | 32.0 | 56 | 12 | |||||||||
HES | U.S.2 | 25.2 | 25.2 | 67 | 12 | |||||||||
MA Solar | Massachusetts | 21.1 | 21.1 | 4 | 24 | |||||||||
Summit Solar Projects | U.S.2 | 19.6 | 19.6 | 50 | 10 | |||||||||
U.S. Projects 2009-2013 | U.S.2 | 15.2 | 15.2 | 73 | 12 | |||||||||
SUNE XVIII | U.S.2 | 16.1 | 16.1 | 21 | 19 | |||||||||
California Public Institutions | California | 13.5 | 7.0 | 5 | 16 | |||||||||
Enfinity | U.S.2 | 13.2 | 13.2 | 15 | 14 | |||||||||
MA Operating | Massachusetts | 12.2 | 12.2 | 4 | 16 | |||||||||
Duke Operating | North Carolina | 10.0 | 10.0 | 3 | 13 | |||||||||
SunE Solar Fund X | U.S.2 | 8.8 | 8.8 | 12 | 13 | |||||||||
Summit Solar Projects | Ontario | 3.8 | 3.8 | 7 | 14 | |||||||||
MPI | Ontario | 4.7 | 4.7 | 13 | 16 | |||||||||
Total Solar Distributed Generation | 412.5 | 404.2 | 489 | 16 | ||||||||||
Solar Utility: | ||||||||||||||
Mt. Signal | California | 265.8 | 265.8 | 1 | 21 | |||||||||
Regulus Solar | California | 81.6 | 81.6 | 1 | 17 | |||||||||
Blackhawk Solar Portfolio | U.S.2 | 72.8 | 72.8 | 10 | 20 | |||||||||
North Carolina Portfolio | North Carolina | 26.4 | 26.4 | 4 | 12 | |||||||||
Atwell Island | California | 23.5 | 23.5 | 1 | 20 | |||||||||
Nellis | Nevada | 14.0 | 14.0 | 1 | 10 | |||||||||
Alamosa | Colorado | 8.2 | 8.2 | 1 | 10 | |||||||||
CalRENEW-1 | California | 6.3 | 6.3 | 1 | 12 | |||||||||
Northern Lights | Ontario | 25.4 | 25.4 | 2 | 16 | |||||||||
Marsh Hill | Ontario | 18.5 | 18.5 | 1 | 17 | |||||||||
SunE Perpetual Lindsay | Ontario | 15.5 | 15.5 | 1 | 17 | |||||||||
Norrington | U.K. | 11.1 | 11.1 | 1 | 11 | |||||||||
CAP | Chile | 101.6 | 101.6 | 1 | 16 | |||||||||
Total Solar Utility | 670.7 | 670.7 | 26 | 18 | ||||||||||
11
Facility Category / Portfolio | Location | Nameplate Capacity (MW) | Net Nameplate Capacity (MW) | Number of Sites | Weighted Average Remaining Duration of PPA (Years)1 | |||||||||
Wind Utility: | ||||||||||||||
South Plains I | Texas | 200.0 | 200.0 | 1 | 10 | |||||||||
California Ridge | Illinois | 217.1 | 195.6 | 1 | 15 | |||||||||
Bishop Hill | Illinois | 211.4 | 190.5 | 1 | 15 | |||||||||
Rattlesnake | Texas | 207.2 | 186.7 | 1 | 10 | |||||||||
Prairie Breeze | Nebraska | 200.6 | 180.7 | 1 | 21 | |||||||||
Cohocton | New York | 125.0 | 125.0 | 1 | 2 | |||||||||
Stetson I & II | Maine | 82.5 | 82.5 | 2 | 2 | |||||||||
Rollins | Maine | 60.0 | 60.0 | 1 | 14 | |||||||||
Mars Hill | Maine | 42.0 | 42.0 | 1 | 2 | |||||||||
Sheffield | Vermont | 40.0 | 40.0 | 1 | 10 | |||||||||
Bull Hill | Maine | 34.5 | 34.5 | 1 | 9 | |||||||||
Kaheawa Wind Power I | Hawaii | 30.0 | 30.0 | 1 | 8 | |||||||||
Kahuku | Hawaii | 30.0 | 30.0 | 1 | 13 | |||||||||
Kaheawa Wind Power II | Hawaii | 21.0 | 21.0 | 1 | 15 | |||||||||
Steel Winds I & II | New York | 35.0 | 35.0 | 2 | 2 | |||||||||
Raleigh | Ontario | 78.0 | 78.0 | 1 | 13 | |||||||||
Total Wind Utility | 1,614.3 | 1,531.5 | 18 | 11 | ||||||||||
Total Renewable Energy Facilities | 2,697.5 | 2,606.4 | 533 | 14 | ||||||||||
———
(1) | Calculated as of December 31, 2017. |
(2) | These portfolios consist of renewable energy facilities located in multiple locations within the U.S., as follows: |
• | CD DG Portfolio: California, Massachusetts, New Jersey, New York and Pennsylvania |
• | DG 2015 Portfolio 2: Arizona, California, Connecticut, Massachusetts, New Jersey, Utah and Vermont |
• | U.S. Projects 2014: Arizona, California, Connecticut, Georgia, Massachusetts, New Jersey, New York and Puerto Rico |
• | DG 2014 Portfolio 1: Arizona, California, Georgia, Hawaii, Massachusetts, Maryland, New Jersey, New York, Oregon, Texas, Vermont and Puerto Rico |
• | TEG: Arizona, California, Connecticut, Massachusetts, New Jersey and Pennsylvania |
• | HES: Massachusetts, New Jersey and Pennsylvania |
• | Summit Solar Projects (U.S.): California, Connecticut, Florida, Maryland and New Jersey |
• | U.S. Projects 2009-2013: California, Colorado, Connecticut, Massachusetts, New Jersey, Oregon and Puerto Rico |
• | SUNE XVIII: Arizona, California, Hawaii, Massachusetts, Maryland, Minnesota, New Hampshire, New York and Texas |
• | Enfinity: Arizona, California and Ohio |
• | SunE Solar Fund X: California, Maryland and New Mexico |
• | Blackhawk Solar Portfolio: Utah, Florida, Nevada and California |
Seasonality and Resource Availability
The amount of electricity produced and revenues generated by our solar generation facilities is dependent in part on the amount of sunlight, or irradiation, where the assets are located. As shorter daylight hours in winter months result in less irradiation, the electricity generated by these facilities will vary depending on the season. Irradiation can also be variable at a particular location from period to period due to weather or other meteorological patterns, which can affect operating results. As the great majority of our solar power plants are located in the Northern hemisphere, our solar portfolio’s power generation will be at its lowest during the first and fourth quarters of each year. Therefore, we expect our first and fourth quarter solar revenue generation to be lower than other quarters.
12
Similarly, the electricity produced and revenues generated by our wind power plants depend heavily on wind conditions, which are variable and difficult to predict. Operating results for wind power plants vary significantly from period to period depending on the wind conditions during the periods in question. As our wind power plants are located in geographies with different profiles, there is some flattening of the seasonal variability associated with each individual wind power plant’s generation, and we expect that as the fleet expands the effect of such wind resource variability may be favorably impacted, although we cannot guarantee that we will purchase wind power facilities that will achieve such results in part or at all. Historically, our wind production is greater in the first and fourth quarters which can partially offset the lower solar revenue expected to be generated in those quarters.
We do not expect seasonality to have a material effect on our ability to pay a regular dividend. We intend to mitigate the effects of any seasonality that we experience by reserving a portion of our cash available for distribution and otherwise maintain sufficient liquidity, including cash on hand in order to, among other things, facilitate the payment of dividends to our stockholders.
Competition
Power generation is a capital-intensive business with numerous industry participants. We compete to acquire new renewable energy facilities with renewable energy developers who retain renewable energy asset ownership, independent power producers, financial investors and certain utilities. We compete to supply energy to our potential customers with utilities and other providers of distributed generation. We compete with other renewable energy developers, independent power producers and financial investors based on our cost of capital, development expertise, pipeline, global footprint and brand reputation. To the extent we re-contract renewable energy facilities upon termination of a PPA or sell electricity into the merchant power market, we compete with traditional utilities and other independent power producers primarily based on low cost of capital, generation located at customer sites, operations and management expertise, price (including predictability of price), green attributes (such as RECs and tax incentives) of renewable power and the ease by which customers can switch to electricity generated by our renewable energy facilities. In our merchant power sales, we also compete with other types of generation resources, including gas and coal-fired power plants.
Environmental Matters
We are subject to environmental laws and regulations in the jurisdictions in which we own and operate renewable energy facilities. These laws and regulations generally require that governmental permits and approvals be obtained and maintained both before construction and during operation of these renewable energy facilities. We incur costs in the ordinary course of business to comply with these laws, regulations and permit requirements. We do not anticipate material capital expenditures for environmental compliance for our renewable energy facilities in the next several years. While we do not expect that the costs of compliance would generally have a material impact on our business, financial condition or results of operations, it is possible that as the size of our portfolio grows we may become subject to new or modified regulatory regimes that may impose unanticipated requirements on our business as a whole that were not anticipated with respect to any individual renewable energy facility. Additionally, environmental laws and regulations frequently change and often become more stringent, or subject to more stringent interpretation or enforcement, and therefore future changes could require us to incur materially higher costs which could have a material negative impact on our financial performance or results of operations.
Regulatory Matters
All of the renewable energy facilities located in the United States that we own are qualifying small power production facilities (“QFs”) as defined under the Public Utilities Regulatory Policies Act of 1978, as amended (“PURPA”) or Exempt Wholesale Generators (“EWGs”). As a result, they and their upstream owners are exempt from the books and records access provisions of the Public Utilities Holding Company Act of 2005, as amended (“PUHCA”), and most are exempt from state organizational and financial regulation of electric utilities. Depending upon the power production capacity of the renewable energy facility in question, our QFs and their immediate project company owners may be entitled to various exemptions from ratemaking and certain other regulatory provisions of the Federal Power Act, as amended (“FPA”).
All of the renewable energy facility companies that we own outside of the United States are Foreign Utility Companies, as defined in PUHCA. They are exempt from state organizational and financial regulation of electric utilities and from most provisions of PUHCA and FPA.
We own a number of renewable energy facilities in the United States that are subject to the jurisdiction of the Federal Energy Regulatory Commission (“FERC”), and that have obtained “market based rate authorization” and associated blanket authorizations and waivers from FERC pursuant to the FPA, which allows it to sell electricity, capacity and ancillary services at
13
wholesale or negotiated market based rates, instead of cost-of-service rates, as well as waivers of, and blanket authorizations under, certain FERC regulations that are commonly granted to market based rate sellers. FERC requires market based rate holders to make additional filings upon certain triggering events in order to maintain market based rate authority. The failure to make timely filings can result in revocation or suspension of market based rate authority, refunds of revenues previously collected and the imposition of civil penalties.
Under Section 203 of the FPA (“FPA Section 203”), prior authorization by FERC is generally required for any direct or indirect acquisition of control over, or merger or consolidation with, a “public utility” or in certain circumstances an “electric utility company,” as such terms are used for purposes of FPA Section 203. All of our renewable energy facilities that sell their output at wholesale in the continental U.S. (except in Texas) and Evergreen Gen Lead, LLC (which owns electric transmission facilities) are public utilities, and all are electric utility companies (including those in Texas) for the purposes of FPA Section 203. FERC generally presumes that the acquisition of direct or indirect voting power of 10% or more in an entity results in a change in control of such entity. Transfers of transmission facilities associated with our electric generation facilities or the whole of any such generation facility could also trigger the need to obtain prior approval from FERC under FPA Section 203. Violation of FPA Section 203 can result in civil or criminal liability under the FPA, including civil penalties, and the possible imposition of other sanctions by FERC. Depending upon the circumstances, liability for violation of FPA Section 203 may attach to a public utility, the parent holding company of a public utility or an electric utility company, or to an acquirer of the voting securities of such holding company or its public utility or electric utility company subsidiaries.
Certain of our renewable energy facilities are also subject to compliance with the mandatory Reliability Standards developed by the North American Electric Reliability Corporation (“NERC”) and approved by FERC. Violation of such Reliability Standards can result in civil penalties under the FPA assessed to the owners and/or operators of such renewable energy facilities. In the United Kingdom, Canada and Chile, the Company is also generally subject to the regulations of the relevant energy regulatory agencies applicable to all producers of electricity under the relevant feed-in tariff or other governmental incentive programs (collectively “FIT”) (including the FIT rates); however it is generally not subject to regulation as a traditional public utility, i.e., regulation of our financial organization and rates other than FIT rates.
As the size of our portfolio grows, it may become subject to new or modified regulatory regimes that may impose unanticipated requirements on its business as a whole that were not anticipated with respect to any individual renewable energy facility. For example, the NERC rules approved by FERC impose fleetwide cyber security requirements regarding electronic and physical access to generating facilities in order to protect system reliability; such requirements expand in scope after the point at which a single owner has more than 1,500 MW of reliability assets under its control in a single connection and expand again once the owner has more than 3,000 MW under construction. Such future changes in our regulatory status or the makeup of our fleet could require it to incur materially higher costs which could have a material adverse impact on its financial performance or results of operations. Similarly, although we are not currently subject to regulation as an electric utility in the foreign markets in which we provide our renewable energy services, our regulatory position in these markets could change in the future. Any local, state, federal or international regulations could place significant restrictions on our ability to operate our business and execute our business plan by prohibiting or otherwise restricting the sale of electricity by us. If we were deemed to be subject to the same state, federal or foreign regulatory authorities as traditional utility companies, or if new regulatory bodies were established to oversee the renewable energy industry in the United States or in our foreign markets, our operating costs could materially increase, adversely affecting our results of operations.
Government Incentives and Legislation
Each of the countries in which we operate has established various incentives and financial mechanisms to reduce the cost of renewable energy and to accelerate the adoption of solar and wind energy. These incentives include tax credits, cash grants, favorable tax treatment and depreciation, rebates, RECs or green certificates, net energy metering programs and other incentives. These incentives help catalyze private sector investments in renewable energy and efficiency measures. Changes in the government incentives in each of these jurisdictions could have a material impact on our financial performance.
United States
Federal government support for renewable energy
On December 22, 2017, the U.S. government enacted comprehensive tax legislation commonly referred to as the Tax Cuts and Jobs Act (the “Tax Act”). The Tax Act makes broad and complex changes to the U.S. tax code, including, but not limited to, (i) reducing the U.S. federal corporate rate from 35% to 21%; (ii) requiring companies to pay a one-time transition tax on certain unrepatriated earnings (where applicable) of foreign subsidiaries; (iii) generally eliminating the U.S. federal income tax on dividends received from foreign subsidiaries; (iv) requiring current inclusion in the U.S. federal taxable income
14
of certain earnings of controlled foreign corporations; (v) eliminating the corporate alternative minimum tax (“AMT”) and changing how existing AMT credits may be realized; (vi) creating the base erosion anti-abuse tax (“BEAT”), a new minimum tax; (vii) creating a new limitation on the deductible interest expense; and (viii) changing rules related to uses and limitations of net operating loss carryforwards created in tax years beginning after December 31, 2017. The Tax Act is expected to have a neutral effect on our current business portfolio. The federal corporate tax rate reduction is expected to have a favorable impact on our business but this favorable impact is expected to be offset by a more or less equal negative impact of the interest expense deduction and loss carryforward limitations. The other measures of the Tax Act are not expected to significantly impact our current portfolio.
The U.S. federal government provides an uncapped investment tax credit, or “Federal ITC,” that allows a taxpayer to claim a credit of 30% of qualified expenditures for a residential or commercial solar generation facility. The Tax Act did not make any changes to the existing laws surrounding tax credits for renewable energy. The Federal ITC is currently scheduled to be reduced to 26% for solar generation facility construction that begins on or after January 1, 2020 and to 22% for solar generation facility construction that begins on or after January 1, 2021. A permanent 10% Federal ITC is available for non-residential solar generation facility construction that begins on or after January 1, 2022.
Certain wind facilities are eligible for PTCs, which are federal income tax credits related to the quantity of renewable energy produced and sold during a taxable year, or ITCs in lieu of PTCs. These credits are available only for wind power plants that began construction on or prior to December 31, 2019 but are reduced over time. The wind PTC (and ITC in lieu of PTC) are 100% in the case of a facility for which construction began by December 31, 2016, 80% in the case of any facility for which construction began in 2017, 60% in the case of a facility for which construction begins in 2018, and 40% in the case of a facility for which construction begins in 2019. ITCs, PTCs and accelerated tax depreciation benefits generated by constructing and operating renewable energy facilities can be monetized by entering into tax equity financing agreements with investors that can utilize the tax benefits, which have been a key financing tool for renewable energy facilities. The federal government also provides accelerated depreciation for eligible renewable energy facilities. Based on our portfolio of assets, we will benefit from Federal ITC, Federal PTC and an accelerated tax depreciation schedule, and we will rely on financing structures that monetize a substantial portion of these benefits and provide financing for our renewable energy facilities at the lowest cost of capital.
U.S. state government support for renewable energy
Many states offer a personal and/or corporate investment or production tax credit for renewable energy facilities, which is additive to the Federal ITC. Further, more than half of the states, and many local jurisdictions, have established property tax incentives for renewable energy facilities that include exemptions, exclusions, abatements and credits. Certain of our renewable energy facilities in the U.S. have been financed with a tax equity financing structure, whereby the tax equity investor is a member holding equity in the limited liability company that directly or indirectly owns the solar generation facility or wind power plant and receives the benefits of various tax credits.
Many state governments, utilities, municipal utilities and co-operative utilities offer a rebate or other cash incentive for the installation and operation of a renewable energy facility for energy efficiency measures. Capital costs or “up-front” rebates provide funds to solar customers based on the cost, size or expected production of a customer’s renewable energy facility. Performance-based incentives provide cash payments to a system owner based on the energy generated by their renewable energy facility during a pre-determined period, and they are paid over that time period. Some states also have established FIT programs that are a type of performance-based incentive where the system owner-producer is paid a set rate for the electricity their system generates over a set period of time.
There are 40 states that have a regulatory policy known as net metering. Net metering typically allows our customers to interconnect their on-site solar generation facilities to the utility grid and offset their utility electricity purchases by receiving a bill credit at the utility’s retail rate for energy generated by their solar generation facility in excess of electric load that is exported to the grid. At the end of the billing period, the customer simply pays for the net energy used or receives a credit at the retail rate if more energy is produced than consumed. Some states require utilities to provide net metering to their customers until the total generating capacity of net metered systems exceeds a set percentage of the utilities’ aggregate customer peak demand.
Many states also have adopted procurement requirements for renewable energy production. There are 29 states that have adopted a renewable portfolio standard (“RPS”) that requires regulated utilities to procure a specified percentage of total electricity delivered to customers in the state from eligible renewable energy sources, such as solar and wind power generation facilities, by a specified date. To prove compliance with such mandates, utilities must procure and retire RECs. System owners often are able to sell RECs to utilities directly or in REC markets.
15
RPS programs and targets have been one of the key drivers of the expansion of solar and wind power and are expected to continue to contribute to solar and wind power installations in many areas of the United States. In addition to the 29 states with RPS programs, eight other states have non-binding goals supporting renewable energy.
International
The international markets in which we operate or may operate in the future also typically have in place regimes to promote renewable energy. These mechanisms vary from country to country. Our objective is to grow our dividend through the growth of our portfolio in North America and Western Europe, including through our recently announced tender offer to acquire Saeta Yield, S.A., a Spanish corporation, that is expected to close in the second quarter of 2018 (as described below under Irrevocable Agreement to Launch Tender Offer for the Common Shares of Saeta Yield). In seeking to achieve this growth, we may rely on governmental incentives in these jurisdictions. For example, a meaningful portion of our existing portfolio is located in the Canadian province of Ontario. With installed capacity of approximately 4,800 MW of wind and 2,300 MW of solar, Ontario, one of our provincial markets, leads Canada in installed wind and solar power capacity. While the current Long Term Energy Plan for Ontario, released in October 2017, no longer specifies targets for renewable energy, it continues to focus on measures supporting innovation and grid modernization, including in respect of renewable distributed generation.
Financial Information about Segments
We have two reportable segments: Solar and Wind. These segments comprise our entire portfolio of renewable energy assets and are determined based on the management approach. This approach designates the internal reporting used by management for making decisions and assessing performance as the source of the reportable segments. Our operating segments consist of Distributed Generation, North America Utility and International Utility that are aggregated into the Solar reportable segment and Northeast Wind, Central Wind and Hawaii Wind that are aggregated into the Wind reportable segment. The operating segments have been aggregated as they have similar economic characteristics and meet all of the aggregation criteria. Corporate expenses include general and administrative expenses, acquisition costs, interest expense on corporate-level indebtedness, stock-based compensation, depreciation, accretion and amortization expense and loss on extinguishment of corporate-level indebtedness. All net operating revenues for the years ended December 31, 2017, 2016 and 2015 were earned by our reportable segments from external customers in the United States (including Puerto Rico), Canada, the United Kingdom and Chile.
Customer Concentration
For the year ended December 31, 2017, significant customers representing greater than 10% of total operating revenue were Tennessee Valley Authority and San Diego Gas & Electric, which accounted for 13.1% and 10.5%, respectively, of our consolidated operating revenues, net.
Employees
Prior to 2017, the Company did not have any of its own employees as the personnel that managed our operations were employees of SunEdison and their services were provided to the Company under the management services agreement or project-level asset management and O&M services agreements with SunEdison. Following the SunEdison Bankruptcy, as part of our efforts to create a stand-alone corporate organization, we established a retention program for key employees. As of January 1, 2017, the key employees that provided most of our corporate-level services were hired directly by the Company to ensure continuity of corporate operations, and throughout the first half of 2017, we hired additional employees from SunEdison who provided services to us, a majority of which focused on project-level operations. However, we continue to depend on a substantial number of outside contractors. As of December 31, 2017, we had 119 employees, the majority of which were located in the United States.
In connection with the expected relocation of our headquarters to New York, New York, we expect to experience departures of a significant number of these employees. 66 of the Company's employees as of December 31, 2017 are employed under short-term transition agreements, which range from three to nine months of service subsequent to the Merger closing date on October 16, 2017. In addition, we have experienced changes to our executive officers and senior management, including the departure of our interim Chief Executive Officer, Chief Financial Officer and General Counsel upon the closing of the Sponsorship Transaction. The governance agreements entered into between the Company and Brookfield in connection with the Merger and Sponsorship Transaction provide for Brookfield to appoint our Chief Executive Officer, Chief Financial Officer and General Counsel. These three executive officers are not employees of the Company and their services are provided pursuant to the Brookfield MSA.
16
Geographic Information
The following table reflects operating revenues, net for the years ended December 31, 2017, 2016 and 2015 by geographic location:
Year Ended December 31, | ||||||||||||
(In thousands) | 2017 | 2016 | 2015 | |||||||||
United States (including Puerto Rico) | $ | 519,551 | $ | 528,513 | $ | 368,117 | ||||||
Chile | 31,282 | 28,065 | 27,148 | |||||||||
United Kingdom | 15,002 | 51,600 | 55,542 | |||||||||
Canada | 44,636 | 46,378 | 18,699 | |||||||||
Total operating revenues, net | $ | 610,471 | $ | 654,556 | $ | 469,506 | ||||||
Long-lived assets, net consist of renewable energy facilities and intangible assets as of December 31, 2017 and 2016. The following table is a summary of long-lived assets, net by geographic area:
As of December 31, | ||||||||
(In thousands) | 2017 | 2016 | ||||||
United States (including Puerto Rico) | $ | 5,270,988 | $ | 5,524,136 | ||||
Chile | 168,440 | 175,204 | ||||||
United Kingdom | 17,284 | 16,045 | ||||||
Canada | 422,999 | 419,978 | ||||||
Total long-lived assets, net | 5,879,711 | 6,135,363 | ||||||
Current assets | 341,536 | 893,016 | ||||||
Other non-current assets1 | 165,774 | 677,486 | ||||||
Total assets | $ | 6,387,021 | $ | 7,705,865 | ||||
———
(1) | As of December 31, 2016, includes $532.7 million and $19.5 million of non-current assets held for sale located in the United Kingdom and United States, respectively. There are no similar amounts as of December 31, 2017 as the sale of these renewable energy facilities closed in the first half of 2017. |
Irrevocable Agreement to Launch Tender Offer for the Common Shares of Saeta Yield
On February 7, 2018, we announced that we intend to launch a voluntary tender offer (the “Tender Offer”) to acquire 100% of the outstanding shares of Saeta Yield, S.A. (“Saeta Yield”), a Spanish corporation and a publicly-listed European owner and operator of wind and solar assets, located primarily in Spain. The Tender Offer will be for 12.20 Euros per share of Saeta Yield. The Tender Offer is expected to be completed in the second quarter of 2018, subject to certain closing conditions.
In connection with this Tender Offer, on February 6, 2018, TERP Spanish HoldCo, S.L. (“TERP Spanish HoldCo”), a subsidiary of the Company, entered into an irrevocable undertaking agreement for the launch and acceptance of the takeover bid for the shares of Saeta Yield with Cobra Concesiones, S.L., a company incorporated under the laws of Spain (“Cobra”), and GIP II Helios, S.à r.l., a société à responsabilité limitée organized under the laws of the Grand Duchy of Luxembourg (“GIP”), as well as two separate irrevocable undertaking agreements with Mutuactivos, S.A.U., S.G.I.I.C., a company incorporated under the laws of Spain (“Mutuactivos”), and with Sinergia Advisors 2006, A.V., S.A., a company incorporated under the laws of Spain (“Sinergia” and, together with Cobra, GIP and Mutuactivos, the “Selling Stockholders”). Under the terms of these irrevocable undertaking agreements, the Selling Stockholders have irrevocably and unconditionally agreed to tender their combined 50.338% interest in Saeta Yield in the Tender Offer.
Our acceptance of the shares of Saeta Yield tendered in the Tender Offer is conditioned upon us obtaining compulsory authorization required from the European Commission and Cobra and GIP irrevocably accepting the Tender Offer in respect of their shares of Saeta Yield representing no less than 48.222% of Saeta Yield’s voting share capital.
The aggregate value of the shares of Saeta Yield held by the Selling Stockholders is approximately $600 million. If we successfully acquire all of the remaining Saeta Yield shares in the Tender Offer, the aggregate purchase price (including the value of the Selling Stockholders shares) will be approximately $1.2 billion. Assuming a $1.2 billion acquisition price, we
17
intend to finance the acquisition with a $400 million equity issuance of our Class A common stock (the “Equity Offering”) and the remaining $800 million will be financed from available liquidity, which we expect will include borrowings under the Sponsor Line Agreement and the New Revolver (as defined and discussed in Liquidity and Capital Resources within Item 7. Management's Discussion and Analysis of Financial Condition and Results of Operations). We expect to repay these borrowings with a combination of sources, including new non-recourse financings of our currently unencumbered wind and solar assets and certain cash released from Saeta Yield’s assets.
In connection with the launch of the Tender Offer, we were required to post a bank guarantee (the “Bank Guarantee”) with the Spanish National Securities Market Commission (Comisión Nacional del Mercado de Valores) (the “CNMV”) for the maximum amount payable in the Tender Offer of approximately $1.2 billion. On March 6, 2018, TERP Spanish HoldCo entered into two letter of credit facilities (the “LC Agreements”) pursuant to which two banks posted the Bank Guarantee with the CNMV for the maximum amount payable in the Tender Offer. On March 6, 2018, TerraForm Power entered into two letter agreements (the “Letter Agreements” and together with the LC Agreements, the “Letter of Credit Facilities”) with those banks. The LC Agreements govern TERP Spanish HoldCo’s obligations to reimburse those banks upon any drawing under the Bank Guarantee. The Letter Agreements govern TerraForm Power’s obligation to utilize drawings on its New Revolver and Sponsor Line Agreement or proceeds from an equity offering of its Class A common stock to contribute funds to TERP Spanish HoldCo to enable TERP Spanish HoldCo to satisfy its reimbursement obligations under the LC Agreements. The Letter of Credit Facilities also contain customary fees, representations and warranties, covenants and events of default. Under the terms of the Letter of Credit Facilities, we are required to maintain minimum liquidity requirements of $500.0 million under the Sponsor Line Agreement and $400.0 million under the New Revolver. In addition, if any amount is drawn under the Bank Guarantee, or if an event of default occurs under the Letter of Credit Facilities, we may be required to cash collateralize the entire amount of the Bank Guarantee that has not been drawn.
Saeta Yield's portfolio is comprised of 100% owned, recently constructed assets located primarily in Spain with additional assets located in Portugal and Uruguay, including 778 MW of onshore wind and 250 MW of concentrated solar, with an average age of six years and a remaining useful life in excess of 25 years as of the date of our tender offer announcement. 100% of Saeta Yield's revenues are generated under stable frameworks with investment grade counterparties. Over 80% of Saeta Yield's revenues are regulated under the Spanish renewable power regime with limited resource and market price risk, and the remaining 20% of revenues are under long-term power purchase or concession agreements. Saeta Yield's revenues have an average remaining regulatory/contractual term of 15 years.
Backstop Agreement with Brookfield
On February 6, 2018, we entered into a support agreement with Brookfield. Pursuant to this agreement, Brookfield agreed that, if requested by us, Brookfield would provide a back-stop to us for up to 100% of the Equity Offering (such agreement, the “Back-Stop”) if the offering price per Class A share of our common stock in the Equity Offering equals the five-day volume weighted average price of the Class A shares ending the trading day prior to our announcement of the Tender Offer, which was $10.66 per share. Brookfield’s obligations in relation to the provision of the Back-Stop under the support agreement are subject to successful commencement of the Tender Offer and to prior effectiveness of a registration statement, if required, that we would file in connection with the Equity Offering and such obligation would not apply to any Equity Offering commenced prior to May 1, 2018 or after September 30, 2018.
Available Information
We make available free of charge through our website (www.terraformpower.com) the reports we file with the SEC, including our annual reports on Form 10-K, quarterly reports on Form 10-Q, current reports on Form 8-K and amendments to those reports filed or furnished pursuant to Section 13(a) or 15(d) of the Securities Exchange Act of 1934, as soon as reasonably practicable after we electronically file such material with, or furnish it to, the SEC. The SEC maintains an internet site containing these reports and proxy and information statements at http://www.sec.gov. Any materials we file can be read and copied online at that site or at the SEC's Public Reference Room at 100 F Street, NE, Washington DC 20549, on official business days during the hours of 10:00 am and 3:00 pm. Information on the operation of the Public Reference Room can be obtained by calling the SEC at 1-800-SEC-0330.
The following corporate governance documents are posted on our website at www.terraformpower.com:
•The TerraForm Power, Inc. Audit Committee Charter;
•The TerraForm Power, Inc. Code of Business Conduct and Ethics;
•The TerraForm Power, Inc. Conflicts Committee Charter;
•The TerraForm Power, Inc. Anti-Bribery and Corruption Policy;
•The TerraForm Power, Inc. Nominating and Corporate Governance Committee Charter; and
18
•The TerraForm Power, Inc. Board of Directors Charter.
If you would like a printed copy of any of these corporate governance documents, please send your request to 7550 Wisconsin Avenue, 9th Floor, Bethesda, Maryland 20814.
The information on our website is not incorporated by reference into this Annual Report on Form 10-K and does not constitute part of this Annual Report on Form 10-K.
Item 1A. Risk Factors.
The following pages discuss the principal risks we face. Any of these risk factors could have a significant or material adverse effect on our businesses, results of operations, financial condition or liquidity. They could also cause significant fluctuations and volatility in the trading price of our securities. Readers should not consider any descriptions of these factors to be a complete set of all potential risks and uncertainties that could affect us. These factors should be considered carefully together with the other information contained in this Annual Report on Form 10-K and the other reports and materials filed by us with the SEC. Furthermore, many of these risks are interrelated, and the occurrence of certain of them may in turn cause the emergence or exacerbate the effect of others. Such a combination could materially increase the severity of the impact of these risks on our businesses, results of operations, financial condition and liquidity.
Risks Related to Our Business
We may not realize the expected benefits of the Merger and Sponsorship Transaction.
Following the closing of the Merger and Sponsorship Transaction, the Company may not perform as we expect, or as the market expects, which could have an adverse effect on the price of our Class A common stock. Concurrently with the closing of the Merger and Sponsorship Transaction, Brookfield and the Company entered into the new sponsorship agreements, which include, among other things, for Brookfield to provide strategic and investment management services to the Company, for Brookfield, subject to certain terms and conditions, to provide the Company with a right of first offer on certain operating wind and solar assets that are located in North America and Western Europe and developed by persons sponsored by or under the control of Brookfield and for Brookfield to provide TerraForm Power with a $500 million secured revolving credit facility to fund certain acquisitions or growth capital expenditures.
The Company may not realize expected benefits of Brookfield’s management services and the other aspects of the sponsorship arrangements. For example, the Company may fail to realize expected operational or margin improvements, synergies or other cost savings or reductions, may not achieve expected growth in its portfolio through organic growth or third-party acquisitions and may not be able to acquire assets from Brookfield. The Company may also not be able to effectively utilize the $500 million revolving credit facility provided by Brookfield for accretive acquisitions or at all. Our failure to realize these aspects of the Sponsorship Transaction may have an adverse effect on the price of our Class A common stock and on our business, growth and the results of our operations.
The Merger and Sponsorship Transaction and related uncertainty could cause disruptions in our business, which could have an adverse effect on our business and financial results and the price of our Class A common stock.
We have important counterparties at every level of operations, including offtakers under our PPAs, corporate and project-level lenders and tax equity investors, suppliers and service providers. Uncertainty about the effect of the sponsorship with Brookfield may negatively affect our relationship with our counterparties due to concerns about the Brookfield sponsorship and its impact on our business. These concerns may cause counterparties to be more likely to reduce utilization of our services (or the provision of supplies or services) where the counterparty has flexibility in volume or duration or otherwise seeks to change the terms on which they do business with us. These concerns may also cause our existing or potential new counterparties to be less likely to enter into new agreements or to demand more expensive or onerous terms, credit support, security or other conditions. Damage to our existing or potential future counterparty relationships may materially and adversely affect our business, financial condition and results of operations, including our growth strategy and the price of our Class A common stock.
The production of wind energy depends heavily on suitable wind conditions, and the production of solar depends on irradiance, which is the amount of solar energy received at a particular site. If wind or solar conditions are unfavorable or below our estimates, our electricity production, and therefore our revenue, may be substantially below our expectations.
The electricity produced and revenues generated by a wind power plant depend heavily on wind conditions, which are
19
variable and difficult to predict. Operating results for wind power plants vary significantly from period to period depending on the wind conditions during the periods in question. The electricity produced and the revenues generated by a solar power plant depends heavily on insolation, which is the amount of solar energy received at a site. While somewhat more predictable than wind conditions, operating results for solar power plants can also vary from period to period depending on the solar conditions during the periods in question. We have based our decisions about which sites to develop in part on the findings of long-term wind, irradiance and other meteorological data and studies conducted in the proposed area, which, as applicable, measure the wind’s speed and prevailing direction, the amount of solar irradiance a site is expected to receive and seasonal variations. Actual conditions at these sites, however, may not conform to the measured data in these studies and may be affected by variations in weather patterns, including any potential impact of climate change. Therefore, the electricity generated by our power plants may not meet our anticipated production levels or the rated capacity of the turbines or solar panels located there, which could adversely affect our business, financial condition and results of operations. In some quarters the wind resources at our operating wind power plants, while within the range of our long-term estimates, have varied from the averages we expected. If the wind or solar resources at a facility are below the average level we expect, our rate of return for the facility would be below our expectations and we would be adversely affected. Projections of wind resources also rely upon assumptions about turbine placement, interference between turbines and the effects of vegetation, land use and terrain, which involve uncertainty and require us to exercise considerable judgment. Projections of solar resources depend on assumptions about weather patterns (including snow), shading, and other assumptions which involve uncertainty and also require us to exercise considerable judgment. We or our consultants may make mistakes in conducting these wind, irradiance and other meteorological studies. Any of these factors could cause our sites to have less wind or solar potential than we expected and may cause us to pay more for wind and solar power plants in connection with acquisitions than we otherwise would have paid had such mistakes not been made, which could cause the return on our investment in these wind and solar power plants to be lower than expected.
If our wind and solar energy assessments turn out to be wrong, our business could suffer a number of material adverse consequences, including:
• | our energy production and sales may be significantly lower than we predict; |
• | our hedging arrangements may be ineffective or more costly; |
• | we may not produce sufficient energy to meet our commitments to sell electricity or RECs and, as a result, we may have to buy electricity or RECs on the open market to cover our obligations or pay damages; and |
• | our wind and solar power plants may not generate sufficient cash flow to make payments of principal and interest as they become due on the notes and our non-recourse debt, and we may have difficulty obtaining financing for future wind power plants. |
Our failure to achieve and maintain effective internal control over financial reporting in accordance with Section 404 of the Sarbanes-Oxley Act could have a material adverse effect on our business and share price.
We are required to comply with Section 404(a) of the Sarbanes-Oxley Act in the course of preparing our financial statements, and our management is required to report on the effectiveness of our internal control over financial reporting for such year. Additionally, our independent registered public accounting firm is required pursuant to Section 404(b) of the Sarbanes-Oxley Act to attest to the effectiveness of our internal control over financial reporting on an annual basis. The rules governing the standards that must be met for our management to assess our internal control over financial reporting are complex and require significant documentation, testing and possible remediation.
Internal control over financial reporting is a process designed to provide reasonable assurance regarding the reliability of financial reporting and the preparation of financial statements in accordance with GAAP. A material weakness is a deficiency, or combination of deficiencies, in internal control over financial reporting, such that there is a reasonable possibility that a material misstatement of the entity’s financial statements will not be prevented or detected on a timely basis. The existence of any material weakness would require management to devote significant time and incur significant expense to remediate any such material weaknesses and management may not be able to remediate any such material weaknesses in a timely manner.
As of December 31, 2017, we did not maintain an effective control environment attributable to certain identified material weaknesses. We describe these material weaknesses in Item 9A. Controls and Procedures in this Annual Report on Form 10-K. These control deficiencies create a reasonable possibility that a material misstatement to the consolidated financial statements will not be prevented or detected on a timely basis, and therefore we concluded that the deficiencies represent material weaknesses in the Company’s internal control over financial reporting and our internal control over financial reporting
20
was not effective as of December 31, 2017.
The existence of these or other material weakness in our internal control over financial reporting could also result in errors in our financial statements that could require us to restate our financial statements, cause us to fail to meet our reporting obligations and cause stockholders to lose confidence in our reported financial information, all of which could materially and adversely affect our business and stock price.
We are involved in costly and time-consuming litigation and other regulatory proceedings which require significant attention from our management, which involve a greater exposure to legal liability and may result in significant damage awards and which may relate to the operations of our renewable energy facilities.
We have been and continue to be involved in legal proceedings, administrative proceedings, claims and other litigation that arise in the ordinary course of business, including proceedings related to the operation of our renewable energy facilities. For example, individuals or groups have in the past and may in the future challenge the issuance of a permit for a renewable energy facility or may make claims related to alleged impacts of the operation of our renewable energy facilities on adjacent properties. In addition, we are named as defendants from time to time in other lawsuits and regulatory actions relating to our business, some of which may claim significant damages. We have also been subject to claims arising out of our acquisition activities with respect to certain payments in connection with the acquisition of First Wind by SunEdison.
Due to the inherent uncertainties of litigation and regulatory proceedings, we cannot accurately predict the ultimate outcome of any such proceedings. Unfavorable outcomes or developments relating to these proceedings, or new proceedings involving similar allegations or otherwise, such as monetary damages or equitable remedies, could have a material adverse impact on our business and financial position, results of operations or cash flows or limit our ability to engage in certain of our business activities. Settlement of claims could adversely affect our financial condition, results of operations and cash flows. In addition, regardless of the outcome of any litigation or regulatory proceedings, such proceedings are often expensive, lengthy and disruptive to normal business operations and require significant attention from our management. We are currently and/or may be subject in the future to claims, lawsuits or arbitration proceedings related to matters in tort or under contracts, employment matters, securities class action lawsuits, shareholder derivative actions, breaches of fiduciary duty, conflicts of interest, tax authority examinations or other lawsuits, regulatory actions or government inquiries and investigations.
In the past, companies that have experienced volatility in the market price of their stock have been subject to securities class action litigation. We have been the target of such securities litigation in the past (see Note 19. Commitments and Contingencies to our consolidated financial statements, included in this Annual Report on Form 10-K) and we may become the target of additional securities litigation in the future, which could result in substantial costs and divert our management’s attention from other business concerns, which could have a material adverse effect on our business.
The settlement of certain existing litigation will trigger a requirement to issue additional Class A common stock to Brookfield.
We have agreed, in the Merger Agreement, to issue additional shares of Class A common stock to Brookfield for no additional consideration in respect of the final resolution of certain specified litigation (see Note 19. Commitments and Contingencies to our consolidated financial statements for a description of such litigation). The number of additional shares of Class A common stock to be issued to Brookfield is subject to a pre-determined formula as set forth in the Merger Agreement as described in greater detail in the Company's Definitive Proxy Statement filed on Schedule 14A with the SEC on September 6, 2017 and will compensate Brookfield for the total amount of losses we incur with respect to such specified litigation. The number of shares of Class A common stock to be issued to Brookfield could be significant, resulting in the dilution of the ownership interests of our remaining Class A common stockholders.
A significant portion of our assets consists of long-lived assets, the value of which may be reduced if we determine that those assets are impaired.
As of December 31, 2017, the net carrying value of long-lived assets represented $5,879.7 million, or 92%, of our total assets and consisted of renewable energy facilities and intangible assets. Renewable energy facilities and intangible assets are reviewed for impairment whenever events or changes in circumstances indicate carrying values may not be recoverable. An impairment loss is recognized if the total future estimated undiscounted cash flows expected from an asset are less than its carrying value.
As a result of classifying substantially all of our portfolio of residential rooftop solar assets located in the United States as held for sale during the fourth quarter of 2016 and determining that the carrying value exceeded the fair value less
21
costs to sell, we recorded an impairment charge of $15.7 million within impairment of renewable energy facilities in the consolidated statement of operations for the year ended December 31, 2016. We also recorded a $3.3 million charge within impairment of renewable energy facilities for the year ended December 31, 2016 due to the decision to abandon certain residential construction in progress assets that were not completed by SunEdison as a result of the SunEdison Bankruptcy. In 2017, we recorded an additional $1.4 million charge within impairment of renewable energy facilities related to our remaining 0.3 MW of residential assets that were not classified as held for sale as of December 31, 2016 as we determined certain impairment indicators were present.
During 2016, our long-lived assets also included goodwill but based on our annual goodwill impairment testing conducted as of December 1, 2016, and a review of any potential indicators of impairment, we concluded that the carrying value of $55.9 million was impaired and it was fully written off in 2016. There have been no impairments of intangible assets to date. If intangible assets or additional renewable energy facilities are impaired based on a future impairment test, we could be required to record further non-cash impairment charges to our operating income. Such non-cash impairment charges, if significant, could materially and adversely affect our results of operations in the period recognized.
Counterparties to our PPAs may not fulfill their obligations or may seek to terminate the PPA early, which could result in a material adverse impact on our business, financial condition, results of operations and cash flows.
All but a minor portion of the electricity generated by our current portfolio of renewable energy facilities is sold under long-term PPAs, including power purchase agreements with public utilities or commercial, industrial or government end-users or hedge agreements with investment banks and creditworthy counterparties. Certain of the PPAs associated with renewable energy facilities in our portfolio allow the offtake purchaser to terminate the PPA in the event certain operating thresholds or performance measures are not achieved within specified time periods or, in certain instances, by payment of an early termination fee. If a PPA was terminated or if, for any reason, any purchaser of power under these contracts is unable or unwilling to fulfill their related contractual obligations or refuses to accept delivery of power delivered thereunder, and if we are unable to enter a new PPA on acceptable terms in a timely fashion or at all, we would be required to sell the power from the associated renewable energy facility into the wholesale power markets, which could have a material adverse effect on our business, financial condition, results of operations and cash flows. Moreover, seeking to enforce the obligations of our counterparties under our PPAs could be time consuming or costly and could involve little certainty of success.
Certain of our PPAs allow the offtake purchaser to buy out a portion of the renewable energy facility upon the occurrence of certain events, in which case we will need to find suitable replacement renewable energy facilities to invest in.
Certain of the PPAs for renewable energy facilities in our portfolio or that we may acquire in the future allow the offtake purchaser to purchase all or a portion of the applicable renewable energy facility from us. If the offtake purchaser exercises its right to purchase all or a portion of the renewable energy facility, we would need to reinvest the proceeds from the sale in one or more renewable energy facilities with similar economic attributes in order to maintain our cash available for distribution. If we were unable to locate and acquire suitable replacement renewable energy facilities in a timely fashion it could have a material adverse effect on our results of operations and cash available for distribution.
Most of our PPAs do not include inflation-based price increases.
In general, our PPAs do not contain inflation-based price increase provisions. To the extent that the countries in which we operate experience high rates of inflation, which increases our operating costs in those countries, we may not be able to generate sufficient revenues to offset the effects of inflation, which could materially and adversely affect our business, financial condition, results of operations and cash flows.
A material drop in the retail price of utility-generated electricity or electricity from other sources could limit our ability to attract new customers and adversely affect our growth.
Decreases in the retail prices of electricity supplied by utilities or other clean energy sources would harm our ability to offer competitive pricing and could harm our ability to sign PPAs with customers. The price of electricity from utilities could decrease for a number of reasons, including:
• | the construction of a significant number of new power generation plants, including nuclear, coal, natural gas or renewable energy facilities; |
• | the construction of additional electric transmission and distribution lines; |
22
• | a reduction in the price of natural gas, including as a result of new drilling techniques or a relaxation of associated regulatory standards; |
• | energy conservation technologies and public initiatives to reduce electricity consumption; and |
• | the development of new clean energy technologies that provide less expensive energy. |
A shift in the timing of peak rates for utility-supplied electricity to a time of day when solar energy generation is less efficient could make solar energy less competitive and reduce demand. If the retail price of energy available from utilities were to decrease, we would be at a competitive disadvantage in negotiating new PPAs and therefore we may be unable to attract new customers and our growth would be limited, and the value of our renewable energy facilities may be impaired or their useful life may be shortened.
We may not be able to replace expiring PPAs with contracts on similar terms. If we are unable to replace an expired distributed generation PPA with an acceptable new contract, we may be required to remove the renewable energy facility from the site or, alternatively, we may sell the assets to the site host.
We may not be able to replace an expiring PPA with a contract on equivalent terms and conditions, including at prices that permit operation of the related facility on a profitable basis. If we are unable to replace an expiring PPA with an acceptable new revenue contract, the affected site may temporarily or permanently cease operations or we may be required to sell the power produced by the facility at wholesale prices which are exposed to market fluctuations and risks. In the case of a distributed generation solar facility that ceases operations, the PPA terms generally require that we remove the assets, including fixing or reimbursing the site owner for any damages caused by the assets or the removal of such assets. The cost of removing a significant number of distributed generation solar facilities could be material. Alternatively, we may agree to sell the assets to the site owner, but the terms and conditions, including price that we would receive in any sale and the sale price may not be sufficient to replace the revenue previously generated by the solar generation facility.
Our ability to generate revenue from certain utility-scale solar and wind power plants depends on having interconnection arrangements and services and the risk of curtailment of our renewable energy facilities may result in a reduced return to us on our investments and adversely impact our business, financial condition, and results of operations.
The operation of our utility scale renewable energy facilities depends on having interconnection arrangements with transmission providers and depends on a reliable electricity grid. If the interconnection or transmission agreement of a renewable energy facility we own or acquire is terminated for any reason, we may not be able to replace it with an interconnection or transmission arrangement on terms as favorable as the existing arrangement, or at all, or we may experience significant delays or costs in securing a replacement. Moreover, if a transmission network to which one or more of our existing power plants or a power plant we acquire is connected experiences “down time,” the affected renewable energy facility may lose revenue and be exposed to non-performance penalties and claims from its customers. Curtailment as a result of transmission system down time can arise from the need to prevent damage to the transmission system and for system emergencies, force majeure, safety, reliability, maintenance or other operational reasons. Under our power purchase arrangements, our offtakers are not generally required to compensate us for energy and ancillary services we could have delivered during these periods of curtailment had our facilities not been curtailed. Further, the owners of the transmission network will not usually compensate electricity generators for lost income due to curtailment. These factors could materially affect our ability to forecast operations and negatively affect our business, results of operations, financial condition and cash flows.
In addition, we cannot predict whether transmission facilities will be expanded in specific markets to accommodate or increase competitive access to those markets. Expansion of the transmission system by transmission providers is costly, time consuming and complex. To the extent the transmission system is not adequate in an area, our operating facilities’ generation of electricity may be physically or economically curtailed without compensation due to transmission capacity limitations, reducing our revenues and impairing our ability to capitalize fully on a particular facility’s generating potential. Such curtailments could have a material adverse effect on our business, financial condition, results of operations and cash flows. Furthermore, economic congestion on the transmission grid (for instance, a positive price difference between the location where power is put on the grid by a clean power generation asset and the location where power is taken off the grid by the facility’s customer) in certain of the bulk power markets in which we operate may occur and we may be deemed responsible for those congestion costs. If we were liable for such congestion costs, our financial results could be adversely affected.
We face competition from traditional and renewable energy companies.
The solar and wind energy industries, and the broader clean energy industry, are highly competitive and continually
23
evolving, as market participants strive to distinguish themselves within their markets and compete with large incumbent utilities and new market entrants. We believe that our primary competitors are the traditional incumbent utilities that supply energy to our potential customers under highly regulated rate and tariff structures. We compete with these traditional utilities primarily based on price, predictability of price and the ease with which customers can switch to electricity generated by our renewable energy facilities. If we cannot offer compelling value to our customers based on these factors, then our business will not grow. Traditional utilities generally have substantially greater financial, technical, operational and other resources than we do, and as a result may be able to devote more resources to the research, development, promotion and sale of their products or respond more quickly to evolving industry standards and changes in market conditions than we can. Traditional utilities could also offer other value-added products or services that could help them to compete with us even if the cost of electricity they offer is higher than ours. In addition, the source of a majority of traditional utilities’ electricity is non-renewable, which may allow them to sell electricity more cheaply than electricity generated by our solar generation facilities, wind power plants, and other types of clean power generation assets we may acquire.
We also face risks that traditional utilities could change their volumetric-based (i.e., cents per kWh) rate and tariff structures to make distributed solar generation less economically attractive to their retail customers. Currently, net metering programs are utilized in the majority of states to support the growth of distributed generation solar facilities by requiring traditional utilities to reimburse certain of their retail customers for the excess power they generate at the level of the utilities’ retail rates rather than the rates at which those utilities buy power at wholesale. In Arizona, the state has allowed its largest traditional utility, Arizona Public Service, to assess a surcharge on customers with solar generation facilities for their use of the utility’s grid, based on the size of the customer’s solar generation facility. This surcharge will reduce the economic returns for the excess electricity that the solar generation facilities produce. These types of changes or other types of changes that could reduce or eliminate the economic benefits of net metering could be implemented in other states, which could significantly change the economic benefits of solar energy as perceived by traditional utilities’ retail customers.
We also face competition in the energy efficiency evaluation and upgrades market and we expect to face competition in additional markets as we introduce new energy-related products and services. As the solar and wind industries grow and evolve, we will also face new competitors who are not currently in the market. Our failure to adapt to changing market conditions and to compete successfully with existing or new competitors could limit our growth and could have a material adverse effect on our business and prospects.
There are a limited number of purchasers of utility-scale quantities of electricity, which exposes us and our utility-scale facilities to additional risk.
Since the transmission and distribution of electricity is either monopolized or highly concentrated in most jurisdictions, there are a limited number of possible purchasers for utility-scale quantities of electricity in a given geographic location, including transmission grid operators, state and investor-owned power companies, public utility districts and cooperatives. As a result, there is a concentrated pool of potential buyers for electricity generated by our renewable energy facilities, which may restrict our ability to negotiate favorable terms under new PPAs and could impact our ability to find new customers for the electricity generated by our renewable energy facilities should this become necessary. Furthermore, if the financial condition of these utilities and/or power purchasers deteriorated or the RPS programs, climate change programs or other regulations to which they are currently subject and that compel them to source renewable energy supplies change, demand for electricity produced by our utility-scale facilities could be negatively impacted.
Our hedging activities may not adequately manage our exposure to commodity and financial risk, which could result in significant losses or require us to use cash collateral to meet margin requirements, each of which could have a material adverse effect on our business, financial condition, results of operations and liquidity, which could impair our ability to execute favorable financial hedges in the future.
Certain of our wind power plants are party to financial swaps or other hedging arrangements. We may also acquire additional assets with similar hedging arrangements in the future. Under the terms of the existing financial swaps, certain wind power plants are not obligated to physically deliver or purchase electricity. Instead, they receive payments for specified quantities of electricity based on a fixed-price and are obligated to pay the counterparty the market price for the same quantities of electricity. These financial swaps cover quantities of electricity that we estimated are highly likely to be produced. As a result, gains or losses under the financial swaps are designed to be offset by decreases or increases in a facility’s revenues from spot sales of electricity in liquid markets. However, the actual amount of electricity a facility generates from operations may be materially different from our estimates for a variety of reasons, including variable wind conditions and wind turbine availability. If a wind power plant does not generate the volume of electricity covered by the associated swap contract, we could incur significant losses if electricity prices in the market rise substantially above the fixed-price provided for in the swap. If a wind power plant generates more electricity than is contracted in the swap, the excess production will not be hedged and
24
the related revenues will be exposed to market price fluctuations.
Moreover, in some power markets, at times we have experienced negative power prices with respect to merchant energy sales. In these situations, we must pay grid operators to take our power. Because our tax investors receive production tax credits from the production of energy from our wind plants, it may be economical for the plant to continue to produce power at negative prices, which results in our wind facility paying for the power it produces. In addition, certain of these financial or hedging arrangements are financially settled with reference to energy prices (or locational marginal prices) at a certain hub or node on the transmission system in the relevant energy market. At the same time, revenues generated by physical sales of energy from the applicable facility may be determined by the energy price (or locational marginal price) at a different node on the transmission system. This is an industry practice used to address the lack of liquidity at individual facility locations. There is a risk, however, that prices at these two nodes differ materially, and as a result of this so called “basis risk,” we may be required to settle our financial hedges at prices that are higher than the prices at which we are able to sell physical power from the applicable facility, thus reducing the effectiveness of the swap hedges.
We are exposed to foreign currency exchange risks because certain of our renewable energy facilities are located in foreign countries.
We generate a portion of our revenues and incur a portion of our expenses in currencies other than U.S. dollars. The portion of our revenues generated in currencies other than U.S. dollars is expected to increase substantially if we complete the Tender Offer for the shares of Saeta Yield and may otherwise increase in the future. Changes in economic or political conditions in any of the countries in which we operate now or in the future could result in exchange rate movement, new currency or exchange controls or other restrictions being imposed on our operations or expropriation. As our financial results are reported in U.S. dollars, if we generate revenue or earnings in other currencies, the translation of those results into U.S. dollars can result in a significant increase or decrease in the amount of those revenues or earnings. To the extent that we are unable to match revenues received in foreign currencies with costs paid in the same currency, exchange rate fluctuations in any such currency could have a negative impact on our profitability. Our debt service requirements are primarily in U.S. dollars even though a percentage of our cash flow is generated in other foreign currencies and therefore significant changes in the value of such foreign currencies relative to the U.S. dollar could have a material negative impact on our financial condition and our ability to meet interest and principal payments on debts denominated in U.S. dollars. In addition to currency translation risks, we incur currency transaction risks whenever we or one of our facilities enter into a purchase or sales transaction using a currency other than the local currency of the transacting entity.
Given the volatility of exchange rates, we cannot assure you that we will be able to effectively manage our currency transaction and/or translation risks. It is possible that volatility in currency exchange rates will have a material adverse effect on our financial condition or results of operations. We expect to experience economic losses and gains and negative and positive impacts on earnings as a result of foreign currency exchange rate fluctuations, particularly as a result of changes in the value of the Canadian dollar, the British pound and other currencies.
Additionally, although a portion of our revenues and expenses are denominated in foreign currency, any dividends we pay will be denominated in U.S. dollars. The amount of U.S. dollar denominated dividends paid to our holders of our Class A common stock will therefore be exposed to a certain level of currency exchange rate risk. Although we have entered into certain hedging arrangements to help mitigate some of this exchange rate risk, these arrangements may not be sufficient to eliminate the risk. Changes in the foreign exchange rates could have a material negative impact on our results of operations and may adversely affect the amount of cash dividends paid by us to holders of our Class A common stock.
A portion of our revenues is attributable to the sale of renewable energy credits and solar renewable energy credits, which are renewable energy attributes that are created under the laws of individual states of the United States, and our failure to be able to sell such RECs or SRECs at attractive prices, or at all, could materially adversely affect our business, financial condition and results of operation.
A portion of our revenues is attributable to our sale of RECs and other environmental attributes of our facilities which are created under the laws of the state of the United States where the facility is located. We sometimes seek to sell forward a portion of our RECs or other environmental attributes under contracts having terms in excess of one year to fix the revenues from those attributes and hedge against future declines in prices of RECs or other environmental attributes. If our renewable energy facilities do not generate the amount of electricity required to earn the RECs or other environmental attributes sold under such forward contracts or if for any reason the electricity we generate does not produce RECs or other environmental attributes for a particular state, we may be required to make up the shortfall of RECs or other environmental attributes under such forward contracts through purchases on the open market or make payments of liquidated damages. We have from time to time provided guarantees of Terra LLC as credit support for these obligations. Additionally, forward contracts for REC sales
25
often contain adequate assurances clauses that allow our counterparties to require us to provide credit support in the form of parent guarantees, letters of credit or cash collateral.
We are currently limited in our ability to hedge sufficient volumes of our anticipated RECs or other environmental attributes, leaving us exposed to the risk of falling prices for RECs or other environmental attributes. RECs are created through state law requirements for utilities to purchase a portion of their energy from renewable energy sources and changes in state laws or regulation relating to RECs may adversely affect the availability of RECs or other environmental attributes and the future prices for RECs or other environmental attributes, which could have an adverse effect on our business, financial condition and results of operations.
Operation of renewable energy facilities involves significant risks and hazards that could have a material adverse effect on our business, financial condition, results of operations and cash flows. We may not have adequate insurance to cover these risks and hazards.
The ongoing operation of our facilities involves risks that include the breakdown or failure of equipment or processes or performance below expected levels of output or efficiency due to wear and tear, latent defect, design error or operator error or force majeure events, among other things. Operation of our facilities also involves risks that we will be unable to transport our product to our customers in an efficient manner due to a lack of transmission capacity. Unplanned outages of generating units, including extensions of scheduled outages, occur from time to time and are an inherent risk of our business. Unplanned outages typically increase our operation and maintenance expenses and may reduce our revenues as a result of generating and selling less power or require us to incur significant costs as a result of obtaining replacement power from third parties in the open market to satisfy our forward power sales obligations.
Our inability to efficiently operate our renewable energy facilities, manage capital expenditures and costs and generate earnings and cash flow from our asset-based businesses could have a material adverse effect on our business, financial condition, results of operations and cash flows. While we maintain insurance, obtain warranties from vendors and obligate contractors to meet certain performance levels, the proceeds of such insurance, warranties or performance guarantees may not cover our lost revenues, increased expenses or liquidated damages payments should we experience equipment breakdown or non-performance by contractors or vendors.
Power generation involves hazardous activities, including delivering electricity to transmission and distribution systems. In addition to natural risks such as earthquake, flood, lightning, hurricane and wind, other hazards, such as fire, structural collapse and machinery failure are inherent risks in our operations. These and other hazards can cause significant personal injury or loss of life, severe damage to and destruction of property, plant and equipment and contamination of, or damage to, the environment and suspension of operations. The occurrence of any one of these events may result in our being named as a defendant in lawsuits asserting claims for substantial damages, including for environmental cleanup costs, personal injury and property damage and fines and/or penalties. We maintain an amount of insurance protection that we consider adequate but we cannot provide any assurance that our insurance will be sufficient or effective under all circumstances and against all hazards or liabilities to which we may be subject. Furthermore, our insurance coverage is subject to deductibles, caps, exclusions and other limitations. A loss for which we are not fully insured could have a material adverse effect on our business, financial condition, results of operations or cash flows. Further, due to rising insurance costs and changes in the insurance markets, we cannot provide any assurance that our insurance coverage will continue to be available at all or at rates or on terms similar to those presently available. Any losses not covered by insurance could have a material adverse effect on our business, financial condition, results of operations and cash flows.
Our business is subject to substantial governmental regulation and may be adversely affected by changes in laws or regulations, as well as liability under, or any future inability to comply with, existing or future regulations or other legal requirements.
Our business is subject to extensive federal, state and local laws in the U.S. and regulations in the foreign countries in which we operate. Compliance with the requirements under these various regulatory regimes may cause us to incur significant costs, and failure to comply with such requirements could result in the shutdown of the non-complying facility or, the imposition of liens, fines and/or civil or criminal liability.
With the exception of certain of our utility scale plants, our renewable energy facilities located in the United States in our portfolio are QFs as defined under PURPA. Depending upon the power production capacity of the facility in question, our QFs and their immediate project company owners may be entitled to various exemptions from ratemaking and certain other regulatory provisions of the FPA, from the books and records access provisions of PUHCA, and from state organizational and financial regulation of electric utilities.
26
Certain of our utility scale plants and their owners are exempt wholesale generators, as defined under PURPA (each, an EWG) which exempts each EWG and us (for purposes of our ownership of each such company) from the federal books and access provisions of PUHCA. Certain of the EWGs are also QFs. EWGs and their owners are subject to regulation for most purposes as “public utilities” under the FPA, including regulation of their rates and their issuances of securities. Each of our EWGs has obtained “market based rate authorization” and associated blanket authorizations and waivers from FERC under the FPA, which allows it to sell electricity, capacity and ancillary services at wholesale at negotiated, market based rates, instead of cost-of-service rates, as well as waivers of, and blanket authorizations under, certain FERC regulations that are commonly granted to market based rate sellers, including blanket authorizations to issue securities.
The failure of our QFs to maintain QF status may result in their becoming subject to significant additional regulatory requirements. In addition, the failure of the EWGs, or our QFs to comply with applicable regulatory requirements may result in the imposition of penalties.
In particular, the EWGs, and any project companies that own or operate our QFs that obtain market based rate authority from FERC under the FPA are or will be subject to certain market behavior and anti-manipulation rules as established and enforced by FERC, and if they are determined to have violated those rules, will be subject to potential disgorgement of profits associated with the violation, penalties, and suspension or revocation of their market-based rate authority. If such entities were to lose their market-based rate authority, they would be required to obtain FERC’s acceptance of a cost-of-service rate schedule for wholesale sales of electric energy, capacity and ancillary services and could become subject to significant accounting, record-keeping, and reporting requirements that are imposed on FERC regulated public utilities with cost-based rate schedules.
Substantially all of our assets are also subject to the rules and regulations applicable to power generators generally, in particular the Reliability Standards of the North American Electric Reliability Corporation or similar standards in Canada, the United Kingdom and Chile. If we fail to comply with these mandatory Reliability Standards, we could be subject to sanctions, including substantial monetary penalties, increased compliance obligations and disconnection from the grid.
The regulatory environment for electricity generation in the United States has undergone significant changes in the last several years due to state and federal policies affecting the wholesale and retail power markets and the creation of incentives for the addition of large amounts of new renewable energy generation and demand response resources. These changes are ongoing and we cannot predict the ultimate effect that the changing regulatory environment will have on our business. In addition, in some of these markets, interested parties have proposed material market design changes, as well as made proposals to re-regulate the markets or require divestiture of power generation assets by asset owners or operators to reduce their market share. If competitive restructuring of the power markets is reversed, discontinued or delayed, our business prospects and financial results could be negatively impacted.
Laws, governmental regulations and policies supporting renewable energy, and specifically solar and wind energy (including tax incentives), could change at any time, including as a result of new political leadership, and such changes may materially adversely affect our business and our growth strategy.
Renewable energy generation assets currently benefit from, or are affected by, various federal, state and local governmental incentives and regulatory policies. In the United States, these policies include federal ITCs, PTCs, and trade import tariff policies, as well as state RPS and integrated resource plan (“IRP”) programs, state and local sales and property taxes, siting policies, grid access policies, rate design, net energy metering, and modified accelerated cost-recovery system of depreciation. The growth of our wind and solar energy business will also be dependent on the federal and state tax and regulatory regimes generally and as they relate in particular to our investments in our wind and solar facilities. For example, future growth in the renewable energy industry in the U.S. will be impacted by the availability of ITC and PTCs and accelerated depreciation and other changes to the federal income tax codes, including reductions in rates or changes that affect the ability of tax equity providers to effectively obtain the benefit of available tax credits or deductions or forecast their future tax liabilities, which may materially impair the market for tax equity financing for wind and solar power plants. Any effort to overturn federal and state laws, regulations or policies that are supportive of wind and solar power plants or that remove costs or other limitations on other types of generation that compete with wind and solar power plants could materially and adversely affect our business, financial condition, results of operations and cash flows.
Many U.S. states have adopted RPS programs mandating that a specified percentage of electricity sales come from eligible sources of renewable energy. If the RPS requirements are reduced or eliminated, it could lead to fewer future power contracts or lead to lower prices for the sale of power in future power contracts, which could have a material adverse effect on our future growth prospects. Such material adverse effects may result from decreased revenues, reduced economic returns on
27
certain project company investments, increased financing costs and/or difficulty obtaining financing.
Renewable energy sources in Canada benefit from federal and provincial incentives, such as RPS programs, accelerated cost recovery deductions allowed for tax purposes, the availability of offtake agreements through RPS and the Ontario FIT program, and other commercially oriented incentives. Renewable energy sources in Chile benefit from an RPS program. Any adverse change to, or the elimination of, these incentives could have a material adverse effect on our business and our future growth prospects.
We are also subject to laws and regulations that are applicable to business entities generally, including local, state and federal tax laws. As discussed in Government Incentives and Legislation within Item 1. Business, on December 22, 2017, the U.S. government enacted the Tax Act, which contains several provisions that positively and negatively impact our business and operations. If any of the laws or governmental regulations or policies that support renewable energy change, or if we are subject to changes to other existing laws or regulations or new laws or regulation that impact our tax position, increase our compliance costs, are burdensome or otherwise negatively impact our business, such new or changed laws or regulations may have a material adverse effect on our business, financial condition, results of operations and cash flows.
Maintenance, expansion and refurbishment of renewable energy facilities involve significant risks that could result in unplanned power outages or reduced output.
Our facilities may require periodic upgrading and improvement. Any unexpected operational or mechanical failure, including failure associated with breakdowns and forced outages, and any decreased operational or management performance, could reduce our facilities’ generating capacity below expected levels, reducing our revenues and jeopardizing our ability to pay dividends to holders of our Class A common stock at forecasted levels or at all. Incomplete performance by us or third parties under O&M agreements may increase the risks of operational or mechanical failure of our facilities. Degradation of the performance of our renewable energy facilities provided for in the related PPAs may also reduce our revenues. Unanticipated capital expenditures associated with maintaining, upgrading or repairing our facilities may also reduce profitability.
We may also choose to refurbish or upgrade our facilities based on our assessment that such activity will provide adequate financial returns and key assumptions underpinning a decision to make such an investment may prove incorrect, including assumptions regarding construction costs, timing, available financing and future power prices. This could have a material adverse effect on our business, financial condition, results of operations and cash flows.
Moreover, spare parts for wind turbines and solar facilities and key pieces of equipment may be hard to acquire or unavailable to us. Sources of some significant spare parts and other equipment are located outside of North America and the other jurisdictions in which we operate. If we were to experience a shortage of or inability to acquire critical spare parts we could incur significant delays in returning facilities to full operation, which could negatively impact our business financial condition, results of operations and cash flows.
Developers of renewable energy facilities depend on a limited number of suppliers of solar panels, inverters, module turbines, towers and other system components and turbines and other equipment associated with wind power plants. Any shortage, delay or component price change from these suppliers could result in construction or installation delays, which could affect the number of renewable energy facilities we are able to acquire in the future.
There have been periods of industry-wide shortage of key components, including solar panels and wind turbines, in times of rapid industry growth. The manufacturing infrastructure for some of these components has a long lead time, requires significant capital investment and relies on the continued availability of key commodity materials, potentially resulting in an inability to meet demand for these components. In addition, the United States government has imposed tariffs on imported solar cells and modules. The tariff begins at 30% in 2018 and declines to 25%, 20% and 15% in 2019, 2020 and 2021, respectively. The first 2.5 gigawatts of imported solar cells are exempted from these tariffs. If project developers purchase solar panels containing cells manufactured in China, our purchase price for renewable energy facilities may reflect the tariff penalties mentioned above. A shortage of key commodity materials could also lead to a reduction in the number of renewable energy facilities that we may have the opportunity to acquire in the future, or delay or increase the costs of acquisitions.
We may incur unexpected expenses if the suppliers of components in our renewable energy facilities default in their warranty obligations.
The solar panels, inverters, modules and other system components utilized in our solar generation facilities are generally covered by manufacturers’ warranties, which typically range from 5 to 20 years. When purchasing wind turbines, the purchaser will enter into warranty agreements with the manufacturer which typically expire within two to five years after the
28
turbine delivery date. In the event any such components fail to operate as required, we may be able to make a claim against the applicable warranty to cover all or a portion of the expense associated with the faulty component. However, these suppliers could cease operations and no longer honor the warranties, which would leave us to cover the expense associated with the faulty component. For example, a portion of our solar power plants utilize modules made by SunEdison and certain of its affiliates that were debtors in the SunEdison Bankruptcy. Our business, financial condition, results of operations and cash flows could be materially adversely affected if we cannot make claims under warranties covering our renewable energy facilities.
We are subject to environmental, health and safety laws and regulations and related compliance expenditures and liabilities.
Our assets are subject to numerous and significant federal, state, local and foreign laws, and other requirements governing or relating to the environment. Our facilities could experience incidents, malfunctions and other unplanned events, such as spills of hazardous materials that may result in personal injury, penalties and property damage. In addition, certain environmental laws may result in liability, regardless of fault, concerning contamination at a range of properties, including properties currently or formerly owned, leased or operated by us and properties where we disposed of, or arranged for disposal of, waste and other hazardous materials. As such, the operation of our facilities carries an inherent risk of environmental liabilities, and may result in our involvement from time to time in administrative and judicial proceedings relating to such matters. While we have implemented environmental management programs designed to continually improve environmental, health and safety performance, we cannot assure you that such liabilities including significant required capital expenditures, as well as the costs for complying with environmental laws and regulations, will not have a material adverse effect on our business, financial condition, results of operations and cash flows.
Harming of protected species can result in curtailment of wind power plant operations, monetary fines and negative publicity.
The operation of wind power plants can adversely affect endangered, threatened or otherwise protected animal species. Wind power plants, in particular, involve a risk that protected species will be harmed, as the turbine blades travel at a high rate of speed and may strike flying animals (such as birds or bats) that happen to travel into the path of spinning blades.
Our wind power plants are known to strike and kill flying animals, and occasionally strike and kill endangered or protected species, including protected golden or bald eagles. As a result, we expect to observe all industry guidelines and governmentally recommended best practices to avoid harm to protected species, such as avoiding structures with perches, avoiding guy wires that may kill birds or bats in flight, or avoiding lighting that may attract protected species at night. In addition, we will attempt to reduce the attractiveness of a site to predatory birds by site maintenance (e.g., mowing, removal of animal and bird carcasses, etc.).
Where possible, we will obtain permits for incidental taking of protected species. We hold such permits for some of our wind power plants, particularly in Hawaii, where several species are endangered and protected by law. We are monitoring the U.S. Fish & Wildlife Service (“USF&WS”) rulemaking and policy about obtaining incidental take permits for bald and golden eagles at locations with low to moderate risk of such events and will seek permits as appropriate. We are also in the process of amending the incidental take permits for certain wind power plants in Hawaii, where observed endangered species mortality has exceeded prior estimates and may exceed permit limits on such takings.
Excessive taking of protected species could result in requirements to implement mitigation strategies, including curtailment of operations, and/or substantial monetary fines and negative publicity. Our wind power plants in Hawaii, several of which hold incidental take permits to authorize the incidental taking of small numbers of protected species, are subject to curtailment (i.e., reduction in operations) if excessive taking of protected species is detected through monitoring. At some of the facilities in Hawaii, curtailment has been implemented, but not at levels that materially reduce electricity generation or revenues. Such curtailments (to protect bats) have reduced nighttime operation and limited operation to times when wind speeds are high enough to prevent bats from flying into a wind power plant’s blades. Based on continuing concerns about species other than bats, however, additional curtailments are possible at those locations. We cannot guarantee that such curtailments, any monetary fines that are levied or negative publicity that we receive as a result of incidental taking of protected species will not have a material adverse effect on our business, financial condition, results of operations and cash flows.
Risks that are beyond our control, including but not limited to acts of terrorism or related acts of war, natural disasters, hostile cyber intrusions, theft or other catastrophic events, could have a material adverse effect on our business, financial condition, results of operations and cash flows.
Our renewable energy facilities, or those that we otherwise acquire in the future, may be targets of terrorist activities that could cause environmental repercussions and/or result in full or partial disruption of the facilities’ ability to generate
29
electricity. Hostile cyber intrusions, including those targeting information systems as well as electronic control systems used at the facilities and for the related distribution systems, could severely disrupt business operations and result in loss of service to customers, as well as create significant expense to repair security breaches or system damage.
Furthermore, certain of our renewable energy facilities are located in active earthquake zones. The occurrence of a natural disaster, such as an earthquake, hurricane, lightning, flood or localized extended outages of critical utilities or transportation systems, or any critical resource shortages, affecting us could cause a significant interruption in our business, damage or destroy our facilities or those of our suppliers or the manufacturing equipment or inventory of our suppliers.
Additionally, certain of our renewable energy facilities and equipment are at risk for theft and damage. For example, we are at risk for copper wire theft, especially at our solar generation facilities, due to an increased demand for copper in the United States and internationally. Theft of copper wire or solar panels can cause significant disruption to our operations for a period of months and can lead to operating losses at those locations. Damage to wind turbine equipment may also occur, either through natural events such as lightning strikes that damage blades or in-ground electrical systems used to collect electricity from turbines, or through vandalism, such as gunshots into towers or other generating equipment. Such damage can cause disruption of operations for unspecified periods which may lead to operating losses at those locations.
Any such terrorist acts, environmental repercussions or disruptions, natural disasters or theft incidents could result in a significant decrease in revenues or significant reconstruction, remediation or replacement costs, beyond what could be recovered through insurance policies, which could have a material adverse effect on our business, financial condition, results of operations and cash flows.
Any cyber-attack or other failure of the Company’s communications and technology infrastructure and systems could have an adverse impact on the Company.
The Company relies on the secure storage, processing and transmission of electronic data and other information and technology systems, including software and hardware, for the efficient operation of its renewable energy facilities. If the Company, its communications systems or computer hardware or software are impacted by a cyber-attack or cyber-intrusion, particularly or as part of a broader attack or intrusion by third parties, including computer hackers, foreign governments and cyber terrorists, the Company’s operations or capabilities could be interrupted or diminished and important information could be lost, deleted or stolen, which could have a negative impact on the Company’s revenues and results of operations or which could cause the Company to incur unanticipated liabilities or costs and expenses to replace or enhance affected systems, including costs related to cyber security for the Company’s renewable energy facilities.
Our use and enjoyment of real property rights for our renewable energy facilities may be adversely affected by the rights of lienholders and leaseholders that are superior to those of the grantors of those real property rights to us.
Renewable energy facilities generally are and are likely to be located on land occupied by the facility pursuant to long-term easements and leases. The ownership interests in the land subject to these easements and leases may be subject to mortgages securing loans or other liens (such as tax liens) and other easement and lease rights of third parties (such as leases of oil or mineral rights) that were created prior to the facility’s easements and leases. As a result, the facility’s rights under these easements or leases may be subject, and subordinate, to the rights of those third parties. We perform title searches and obtain title insurance to protect ourselves against these risks. Such measures may, however, be inadequate to protect us against all risk of loss of our rights to use the land on which our renewable energy facilities are located, which could have a material adverse effect on our business, financial condition and results of operations.
International operations subject us to political and economic uncertainties.
Our portfolio consists of renewable energy facilities located in the United States (including Puerto Rico), Canada, the United Kingdom and Chile. If we consummate the Tender Offer for the shares of Saeta Yield, we will also operate in Spain, Portugal and Uruguay. In addition, we could decide to expand our presence in our existing international markets or further our expansion into new international markets. As a result, our activities are and will be subject to significant political and economic uncertainties that may adversely affect our operating and financial performance. These uncertainties include, but are not limited to:
• | the risk of a change in renewable power pricing policies, possibly with retroactive effect; |
• | political and economic instability; |
• | measures restricting the ability of our facilities to access the grid to deliver electricity at certain times or at all; |
30
• | the macroeconomic climate and levels of energy consumption in the countries where we have operations; |
• | the comparative cost of other sources of energy; |
• | changes in taxation policies and/or the regulatory environment in the countries in which we have operations, including reductions to renewable power incentive programs; |
• | the imposition of currency controls and foreign exchange rate fluctuations; |
• | high rates of inflation; |
• | protectionist and other adverse public policies, including local content requirements, import/export tariffs, increased regulations or capital investment requirements; |
• | changes to land use regulations and permitting requirements; |
• | risk of nationalization or other expropriation of private enterprises and land, including creeping regulation that reduces the value of our facilities or governmental incentives associated with renewable energy; |
• | difficulty in timely identifying, attracting and retaining qualified technical and other personnel; |
• | difficulty competing against competitors who may have greater financial resources and/or a more effective or established localized business presence; |
• | difficulties with, and extra-normal costs of, recruiting and retaining local individuals skilled in international business operations; |
• | difficulty in developing any necessary partnerships with local businesses on commercially acceptable terms; and |
• | being subject to the jurisdiction of courts other than those of the United States, which courts may be less favorable to us. |
These uncertainties, many of which are beyond our control, could have a material adverse effect on our business, financial condition, results of operations and cash flows.
Our international operations require us to comply with anti-corruption laws and regulations of the United States government and various non-U.S. jurisdictions.
Doing business in multiple countries requires us and our subsidiaries to comply with the laws and regulations of the United States government and various non-U.S. jurisdictions. Our failure to comply with these rules and regulations may expose us to liabilities. These laws and regulations may apply to us, our subsidiaries, individual directors, officers, employees and agents, and may restrict our operations, trade practices, investment decisions and partnering activities. In particular, our non-U.S. operations are subject to United States and foreign anti-corruption laws and regulations, such as the Foreign Corrupt Practices Act of 1977, as amended (“FCPA”). The FCPA prohibits United States companies and their officers, directors, employees and agents acting on their behalf from corruptly offering, promising, authorizing or providing anything of value to foreign officials for the purposes of influencing official decisions or obtaining or retaining business or otherwise obtaining favorable treatment. The FCPA also requires companies to make and keep books, records and accounts that accurately and fairly reflect transactions and dispositions of assets and to maintain a system of adequate internal accounting controls. As part of our business, we deal with state-owned business enterprises, the employees and representatives of which may be considered foreign officials for purposes of the FCPA. As a result, business dealings between our employees and any such foreign official could expose the Company to the risk of violating anti-corruption laws even if such business practices may be customary or are not otherwise prohibited between the Company and a private third party. Violations of these legal requirements are punishable by criminal fines and imprisonment, civil penalties, disgorgement of profits, injunctions, debarment from government contracts as well as other remedial measures. We have established policies and procedures designed to assist us and our personnel in complying with applicable United States and non-U.S. laws and regulations; however, we cannot assure you that these policies and procedures will completely eliminate the risk of a violation of these legal requirements, and any such violation (inadvertent or otherwise) could have a material adverse effect on our business, financial condition and results of operations.
In the future, we may acquire certain assets in which we have limited control over management decisions and our interests in such assets may be subject to transfer or other related restrictions.
We have acquired, and may seek to acquire, assets in the future in which we own less than a majority of the related interests in the assets. In these investments, we will seek to exert a degree of influence with respect to the management and operation of assets in which we own less than a majority of the interests by negotiating to obtain positions on management committees or to receive certain limited governance rights, such as rights to veto significant actions. However, we may not
31
always succeed in such negotiations, and we may be dependent on our co-venturers to operate such assets. Our co-venturers may not have the level of experience, technical expertise, human resources management and other attributes necessary to operate these assets optimally. In addition, conflicts of interest may arise in the future between us and our stockholders, on the one hand, and our co-venturers, on the other hand, where our co-venturers’ business interests are inconsistent with our interests and those of our stockholders. Further, disagreements or disputes between us and our co-venturers could result in litigation, which could increase our expenses and potentially limit the time and effort our officers and directors are able to devote to our business.
The approval of co-venturers also may be required for us to receive distributions of funds from assets or to sell, pledge, transfer, assign or otherwise convey our interest in such assets. Alternatively, our co-venturers may have rights of first refusal or rights of first offer in the event of a proposed sale or transfer of our interests in such assets. These restrictions may limit the price or interest level for our interests in such assets, in the event we want to sell such interests.
Negative public or community response to renewable energy facilities could adversely affect our acquisition of new facilities and the operation of our existing facilities.
Negative public or community response to solar, wind and other renewable energy facilities, could adversely affect our ability to acquire and operate our facilities. Our experience is that such opposition subsides over time after renewable energy facilities are completed and are operating, but there are cases where opposition, disputes and even litigation continue into the operating period and could lead to curtailment of a facility or other facility modifications.
The seasonality of our operations may affect our liquidity.
We will need to maintain sufficient financial liquidity to absorb the impact of seasonal variations in energy production or other significant events. Our principal sources of liquidity are cash generated from our operating activities, the cash retained by us for working capital purposes out of the gross proceeds of financing activities as well as our borrowing capacity under our existing credit facilities, subject to any conditions required to draw under such existing credit facilities. Our quarterly results of operations may fluctuate significantly for various reasons, mostly related to economic incentives and weather patterns.
For instance, the amount of electricity and revenues generated by our solar generation facilities is dependent in part on the amount of sunlight, or irradiation, where the assets are located. Due to shorter daylight hours in winter months which results in less irradiation, the generation produced by these facilities will vary depending on the season. The electricity produced and revenues generated by a wind power plant depend heavily on wind conditions, which are variable and difficult to predict. Operating results for wind power plants vary significantly from period to period depending on the wind conditions during the periods in question. Additionally, to the extent more of our renewable energy facilities are located in the northern or southern hemisphere, overall generation of our entire asset portfolio could be impacted by seasonality. Further, time-of-day pricing factors vary seasonally which contributes to variability of revenues. We expect our portfolio of renewable energy facilities to generate the lowest amount of electricity during the first and fourth quarters. However, we expect aggregate seasonal variability to decrease if geographic diversity of our portfolio between the northern and southern hemisphere increases.
If we fail to adequately manage the fluctuations in the timing of distributions from our renewable energy facilities, our business, financial condition or results of operations could be materially affected. The seasonality of our energy production may create increased demands on our working capital reserves and borrowing capacity under our existing credit facilities during periods where cash generated from operating activities are lower. In the event that our working capital reserves and borrowing capacity under our existing credit facilities are insufficient to meet our financial requirements, or in the event that the restrictive covenants in our existing credit facilities restrict our access to such facilities, we may require additional equity or debt financing to maintain our solvency. Additional equity or debt financing may not be available when required or available on commercially favorable terms or on terms that are otherwise satisfactory to us, in which event our financial condition may be materially adversely affected.
The Merger and Sponsorship Transaction may result in significant employee departures, including turnover of our executive officers and members of our senior management.
In connection with the expected relocation of the headquarters of the Company to New York, New York, we expect to experience departures of a significant number of employees. In addition, we have experienced changes to our executive officers and senior management, including the departure of our interim Chief Executive Officer, Chief Financial Officer and General Counsel upon the closing of the Sponsorship Transaction. The governance agreements entered into between the Company and Brookfield in connection with the Merger and Sponsorship Transaction provide for Brookfield to appoint our Chief Executive Officer, Chief Financial Officer and General Counsel, and Brookfield will directly set the compensation of these officers.
32
We have incurred substantial indebtedness and may in the future incur additional substantial indebtedness, which may limit our ability to grow our business, reduce our financial flexibility and otherwise may have a material negative impact on our business, results of operations and financial condition.
We have incurred substantial corporate and project-level indebtedness and may incur additional substantial indebtedness in the future. This substantial indebtedness has certain consequences on our business, results of operations and financial condition, including, but not limited to, the following:
• | increasing our vulnerability to, and reducing our flexibility to, respond to general adverse economic and industry conditions; |
• | limiting our flexibility in planning for, or reacting to, changes in our business and the competitive environment and business in which we operate; |
• | limiting our ability to borrow additional amounts to fund the growth of the Company or otherwise meet our obligations; |
• | requiring us to dedicate a significant portion of our revenues to pay the principal of and interest on our indebtedness; and |
• | magnifying the impact of fluctuations in our cash flows on cash available for the payment of dividends to the holders of our Class A common stock. |
As a result of these consequences, our substantial indebtedness could have a material adverse effect on our business, results of operations and financial condition.
We are subject to operating and financial restrictions through covenants in our corporate loan, debt and security agreements that may limit our operational activities or limit our ability to raise additional indebtedness.
We are subject to operating and financial restrictions through covenants in our loan, debt and security agreements. These restrictions prohibit or limit our ability to, among other things, incur additional debt, provide guarantees for indebtedness, grant liens, dispose of assets, liquidate, dissolve, amalgamate, consolidate or effect corporate or capital reorganizations, and declare distributions. A financial covenant in our corporate revolver limits the overall corporate indebtedness that we may incur to a multiple of our cash available for distribution, which may limit our ability to obtain additional financing, withstand downturns in our business and take advantage of business and development opportunities. If we breach our covenants, our corporate revolving credit facility, term loan facility or senior notes may be terminated or come due and such event may cause our credit rating to deteriorate and subject us to higher interest and financing costs. We may also be required to seek additional debt financing on terms that include more restrictive covenants, require repayment on an accelerated schedule or impose other obligations that limit our ability to grow our business, acquire needed assets or take other actions that we might otherwise consider appropriate or desirable.
Changes in our credit ratings may have an adverse effect on our financial position and ability to raise capital.
The credit rating assigned to the Company or any of our subsidiaries’ debt securities may be changed or withdrawn entirely by the relevant rating agency. A lowering or withdrawal of such ratings may have an adverse effect on our financial position and ability to raise capital.
If we are deemed to be an investment company, we may be required to institute burdensome compliance requirements and our activities may be restricted, which may make it difficult for us to complete strategic acquisitions or affect combinations.
If we are deemed to be an investment company under the Investment Company Act of 1940 (the “Investment Company Act”) our business would be subject to applicable restrictions under the Investment Company Act, which could make it impractical for us to continue our business as contemplated. We believe our company is not an investment company under Section 3(b)(1) of the Investment Company Act because we are primarily engaged in a non-investment company business, and we intend to conduct our operations so that we will not be deemed an investment company. However, if we were to be deemed an investment company, restrictions imposed by the Investment Company Act, including limitations on our capital structure and our ability to transact with affiliates, could make it impractical for us to continue our business as contemplated.
33
Risks Related to Our Tender Offer for the Common Shares of Saeta Yield
The Tender Offer is subject to limited conditions, which may not be satisfied on a timely basis or at all and we may be required to accept conditions, obligations, undertakings or remedies imposed by the European Commission which may limit our ability to realize the expected benefits of the Tender Offer.
As discussed in Item 1. Business above, on February 7, 2018, we announced our plan to launch the Tender Offer for the outstanding shares of Saeta Yield. Under the irrevocable undertaking agreements, TERP Spanish HoldCo agreed to offer 12.20 Euros per share for the outstanding shares of Saeta Yield subject only to obtaining merger control clearance from the European Commission (to the extent such clearance is legally required) and Cobra and GIP irrevocably accepting the Tender Offer in respect of their shares representing no less than 48.222% of Saeta Yield’s voting share capital. If these conditions are not satisfied on a timely basis or at all, we would not be able to complete the Tender Offer in accordance with our business plans or at all, which could have an adverse impact on our business and the market value of our Class A common stock. Moreover, pursuant to the irrevocable undertaking agreements, TERP Spanish HoldCo has agreed to accept any conditions, obligations, undertakings or remedies that may be imposed by the European Commission or other antitrust authority other than any conditions, obligations, undertaking or remedy that requires an action by any person or entity other than the Company and Saeta Yield and its subsidiaries. Any such condition, obligation, undertaking or remedy may adversely impact the Company or may limit the Company’s ability to realize any expected benefits of the Tender Offer.
We may not be able to execute on our funding plan for the Tender Offer on attractive terms or at all.
Under the irrevocable undertaking agreements, we are required to make the Tender Offer to all shareholders of Saeta Yield subject to certain limited exceptions. The Tender Offer is not subject to a financing condition. The aggregate purchase price of the shares subject to the irrevocable undertaking agreements is approximately $600 million, and, if 100% of the remaining shares of Saeta Yield are tendered in connection with the Tender Offer, the aggregate purchase price of the shares (including the shares subject to the irrevocable undertaking agreements) is approximately $1.2 billion. Assuming all of the common shares of Saeta Yield are tendered, we plan to fund the purchase price of the tendered shares using a combination of an equity issuance of our common stock and existing corporate liquidity, including borrowings under the Sponsor Line Agreement and the New Revolver (as defined and discussed in Liquidity and Capital Resources within Item 7. Management's Discussion and Analysis of Financial Condition and Results of Operations). We expect to repay these borrowings using a combination of sources, including new non-recourse financings of our existing unencumbered wind and solar assets and certain cash released from the Saeta Yield assets.
If we are not able to issue common stock, or access our available liquidity as we expect, or are otherwise unable to execute on our funding plan as we expect, we would continue to be obligated to complete the Tender Offer subject to the two conditions described above. We may decide to alter our funding plan to issue more or less equity and use more or less of our existing corporate liquidity. A failure to successfully execute on our funding plan for the Tender Offer could have a material negative impact on the market price of our common stock and our results of operations.
In connection with the Tender Offer, we entered into the Letter of Credit Facilities pursuant to which two banks posted the Bank Guarantee to secure the obligations of TERP Spanish HoldCo to complete the Tender Offer. If we do not have the funding necessary to complete the Tender Offer, the Bank Guarantee held by the CNMV may be drawn and we would have an obligation to reimburse the banks. In addition, if any amount is drawn under the Bank Guarantee, or if an event of default occurs under the Letter of Credit Facilities, we may be required to cash collateralize the entire amount of the Bank Guarantee that has not been drawn. Under the terms of the Letter of Credit Facilities, we are required to maintain minimum liquidity requirements of $500.0 million under the Sponsor Line Agreement and $400.0 million under the New Revolver. These minimum liquidity requirements may limit our ability to pursue or fund other acquisitions or growth capital expenditures.
We may not realize the expected benefits of the acquisition of Saeta Yield.
Our underwriting of the Tender Offer included certain assumptions, including, but not limited to, assumptions related to our ability to integrate Saeta Yield into our business operations, the performance of Saeta Yield’s wind and solar assets, the effect of regulation in Spain, Portugal and Uruguay, the realization of costs savings in connection with taking Saeta Yield private, and our plan to finance the Saeta Yield transaction, including the costs and effects of that financing plan on our capital structure. Even though we believe the Tender Offer will be accretive to cash available for distribution to our shareholders on a per share basis, the Saeta Yield acquisition could result in less accretion than we expect or could result in dilution to cash available for distribution to our shareholders as a result of incorrect assumptions in our evaluation of the Saeta Yield transaction, unforeseen consequences or external events beyond our control, which could have an adverse impact on the trading price of our common stock and our business and results of operations.
34
The wind and solar assets of Saeta Yield in Spain are subject to significant government regulation that has the effect of regulating the return of renewable energy facilities in the country, and any reduction in the regulated return to rates lower than we expect could have a material negative impact on the results of our operations.
The wind and solar assets of Saeta Yield are located primarily in Spain with additional assets located in Portugal and Uruguay. The wind and solar assets located in Spain are subject to regulated rates of return that are subject to revision every six years, with the next revision expected to occur in 2020. This regulation allows the Spanish government to revise the rate of return for renewable energy facilities to set a reasonable rate of return. Although our underwriting assumptions have incorporated a downward revision to the regulated rate of return that renewable energy facilities in Spain are permitted to earn, if the regulated return is revised to a level lower than we expect, then the revenues that we earn from the assets of Saeta Yield would be lower than we expect, which could have a material negative impact on the results of our operations of those assets.
If less than 90% of the outstanding shares of Saeta Yield are tendered in connection with the Tender Offer, we may decide to launch a delisting offer in order to take Saeta Yield private, which would result in a fair price review by Spanish regulators and could result in a higher tender offer price.
Under Spanish law, if 90% of the shares are tendered and accepted, we will be able to invoke procedures to purchase the remaining un-tendered shares of Saeta Yield at the offer price, which would result in us acquiring 100% of the shares of Saeta Yield and would result in a delisting of Saeta Yield. If less than 90% of the Saeta Yield shares are tendered pursuant to our voluntary Tender Offer, we may launch a delisting offer under Spanish law. This delisting offer would be subject to a fair price review by the CNMV, which could result in an increase in the offer price to the remaining shareholders. If less than 90% of the shares of Saeta Yield are tendered, Spanish law would subject governance of Saeta Yield to certain minority protections, including proportionate board representation for minority shareholders and certain protections regarding related party transactions.
Risks Related to our Growth Strategy
The growth of our business depends on locating and acquiring interests in attractive renewable energy facilities at favorable prices and with favorable financing terms. Additionally, even if we consummate such acquisitions and financings on terms that we believe are favorable, such acquisitions may in fact result in a decrease in cash available for distribution per Class A common share.
The following factors, among others, could affect the availability of attractive renewable energy facilities to grow our business and dividend per Class A common share:
• | competing bids for a renewable energy facility, including from companies that may have substantially greater capital and other resources than we do; |
• | fewer third party acquisition opportunities than we expect, which could result from, among other things, available renewable energy facilities having less desirable economic returns or higher risk profiles than we believe suitable for our business plan and investment strategy; |
• | risk relating to our ability to successfully acquire projects from the ROFO portfolio pursuant to the Merger and Sponsorship Transaction with Brookfield; and |
• | our access to the capital markets for equity and debt (including project-level debt) at a cost and on terms that would be accretive to our shareholders. |
Even if we consummate acquisitions that we believe will be accretive to our dividends per share, those acquisitions may in fact result in a decrease in dividends per share as a result of incorrect assumptions in our evaluation of such acquisitions, unforeseen consequences or external events beyond our control.
Our acquisition strategy exposes us to substantial risk.
Our acquisition of renewable energy facilities or of companies that own and operate renewable energy facilities, such as Saeta Yield, is subject to substantial risk, including the failure to identify material problems during due diligence (for which we may not be indemnified post-closing), the risk of over-paying for assets (or not making acquisitions on an accretive basis), the ability to obtain or retain customers and, if the renewable energy facilities are in new markets, the risks of entering markets where we have limited experience. While we perform due diligence on prospective acquisitions, we may not be able to discover
35
all potential operational deficiencies in such renewable energy facilities. In addition, our expectations for the operating performance of newly constructed renewable energy facilities as well as those under construction are based on assumptions and estimates made without the benefit of operating history. However, the ability of these renewable energy facilities to meet our performance expectations is subject to the risks inherent in newly constructed renewable energy facilities and the construction of such facilities, including, but not limited to, degradation of equipment in excess of our expectations, system failures and outages. Future acquisitions may not perform as expected or the returns from such acquisitions may not support the financing utilized to acquire them or maintain them. Furthermore, integration and consolidation of acquisitions requires substantial human, financial and other resources and may divert management’s attention from our existing business concerns, disrupt our ongoing business or not be successfully integrated. As a result, the consummation of acquisitions may have a material adverse effect on our business, financial condition, results of operations and cash flows.
We may not be able to effectively identify or consummate any future acquisitions. Additionally, even if we consummate acquisitions, such acquisitions may in fact result in a decrease in cash available for distribution to holders of our Class A common stock. In addition, we may engage in asset dispositions or other transactions that result in a decrease in our cash available for distribution.
Future acquisition opportunities for renewable energy facilities are limited and there is substantial competition for the acquisition of these assets. Moreover, while Brookfield and its affiliates will grant us a right of first offer with respect to the projects in the right of first offer portfolio as a result of the Merger and Sponsorship Transaction, there is no assurance that we will be able to acquire or successfully integrate any such projects. We will compete with other companies for future acquisition opportunities from Brookfield and its affiliates and third parties.
Competition for acquisitions may increase our cost of making acquisitions or cause us to refrain from making acquisitions at all. Some of our competitors are much larger than us with substantially greater resources. These companies may be able to pay more for acquisitions and may be able to identify, evaluate, bid for and purchase a greater number of assets than our resources permit. If we are unable to identify and consummate future acquisitions, it will impede our ability to execute our growth strategy and limit our ability to increase the amount of dividends paid to holders of our Class A common stock. In addition, as we continue to manage our liquidity profile, we may engage in asset dispositions, or incur additional project-level debt, which may result in a decrease in our cash available for distribution.
Even if we consummate acquisitions that we believe will be accretive to such cash per unit, those acquisitions may in fact result in a decrease in such cash per unit as a result of incorrect assumptions in our evaluation of such acquisitions, unforeseen consequences or other external events beyond our control. Furthermore, if we consummate any future acquisitions, our capitalization and results of operations may change significantly, and stockholders will generally not have the opportunity to evaluate the economic, financial and other relevant information that we will consider in determining the application of these funds and other resources.
Our ability to grow and make acquisitions with cash on hand may be limited by our cash dividend policy.
In the future, we intend to pay dividends to our shareholders each quarter and to rely primarily upon external financing sources, including the issuance of debt and equity securities to fund our acquisitions and growth capital expenditures. We may be precluded from pursuing otherwise attractive acquisitions if the projected short-term cash flow from the acquisition or investment is not adequate to service the capital raised to fund the acquisition or investment. As such, our growth may not be as fast as that of businesses that reinvest their available cash to expand ongoing operations.
We may not have access to all operating wind and solar acquisitions that Brookfield identifies.
Our ability to grow through acquisitions depends on Brookfield’s ability to identify and present us with acquisition opportunities. Brookfield has designated the Company, subject to certain exceptions, as its primary vehicle to acquire operating wind and solar assets in North America and Western Europe. However, Brookfield has no obligation to source acquisition opportunities specifically for us. There are a number of factors which could materially and adversely impact the extent to which suitable acquisition opportunities are made available to the Company by Brookfield, for example:
• | It is an integral part of Brookfield’s strategy to pursue the acquisition or development of renewable power assets through consortium arrangements with institutional investors, strategic partners or financial sponsors and to form partnerships to pursue acquisitions on a specialized basis. In certain circumstances, acquisitions of operating wind and solar assets in the Company’s primary jurisdictions may be made by other Brookfield vehicles, either with or instead of the Company. |
36
• | The same professionals within Brookfield’s organization that are involved in acquisitions that are suitable for us are often responsible for the consortiums and partnerships referred to above, as well as having other responsibilities within Brookfield’s broader asset management business. Limits on the availability of such individuals will likewise result in a limitation on the availability of acquisition opportunities for us. |
• | Brookfield will only recommend acquisition opportunities that it believes are suitable for us. The question of whether a particular acquisition is suitable is highly subjective and is dependent on a number of factors including an assessment by Brookfield of our liquidity position, the risk and return profile of the opportunity, and other factors. If Brookfield determines that an opportunity is not suitable for us, it may still pursue such opportunity on its own behalf, or on behalf of a Brookfield-sponsored vehicle. |
Our ability to raise additional capital to fund our operations and growth may be limited.
We may need to arrange additional financing to fund all or a portion of the cost of acquisitions, including our Tender Offer for the shares of Saeta Yield, potential contingent liabilities and other aspects of our operations. Our ability to arrange additional financing or otherwise access the debt or equity capital markets, either at the corporate-level or at a non-recourse project-level subsidiary, may be limited. Any limitations on our ability to obtain financing may have an adverse effect on our business, or growth prospects or our results of operations. Additional financing, including the costs of such financing, will be dependent on numerous factors, including:
• | general economic and capital market conditions, including the then-prevailing interest rate environment; |
• | credit availability from banks and other financial institutions; |
• | investor confidence in us, our partners, our Sponsor, and the regional wholesale power markets; |
• | our financial performance and the financial performance of our subsidiaries; |
• | our level of indebtedness and compliance with covenants in debt agreements; |
• | our ability to file SEC reports on a timely basis and obtain audited project-level financial statements; |
• | maintenance of acceptable credit ratings or credit quality, including maintenance of the legal and tax structure of the project-level subsidiary upon which the credit ratings may depend; |
• | our cash flows; and |
• | provisions of tax and securities laws that may impact raising capital. |
We may not be successful in obtaining additional financing for these or other reasons. Furthermore, we may be unable to refinance or replace non-recourse financing arrangements or other credit facilities on favorable terms or at all upon the expiration or termination thereof. Our failure, or the failure of any of our renewable energy facilities, to obtain additional capital or enter into new or replacement financing arrangements when due may constitute a default under such existing indebtedness and may have a material adverse effect on our business, financial condition, results of operations and cash flows.
Risks Inherent in an Investment in TerraForm Power, Inc.
We may not be able to pay cash dividends to holders of our Class A common stock in the future.
The amount of our cash available for distribution principally depends upon the amount of cash we generate from our operations, which will fluctuate from quarter to quarter based on, among other things:
• | our ability to realize the expected benefits from Brookfield's sponsorship on our business and results of operations; |
• | any adverse consequences arising out of our separation from SunEdison and of the SunEdison Bankruptcy; |
• | the timing of our ability to complete our audited corporate and project-level financial statements; |
• | risks related to our ability to file our annual and quarterly reports with the SEC on a timely basis and to satisfy the requirements of the NASDAQ Global Select Market; |
• | our ability to integrate acquired assets and realize the anticipated benefits of these acquired assets; |
• | counterparties’ to our offtake agreements willingness and ability to fulfill their obligations under such agreements; |
• | price fluctuations, termination provisions and buyout provisions related to our offtake agreements; |
37
• | our ability to enter into contracts to sell power on acceptable terms as our offtake agreements expire; |
• | delays or unexpected costs during the completion of construction of certain renewable energy facilities we intend to acquire; |
• | our ability to successfully identify, evaluate and consummate acquisitions; |
• | government regulation, including compliance with regulatory and permit requirements and changes in market rules, rates, tariffs and environmental laws; |
• | operating and financial restrictions placed on us and our subsidiaries related to agreements governing our indebtedness and other agreements of certain of our subsidiaries and project-level subsidiaries generally; |
• | our ability to borrow additional funds and access capital markets, as well as our substantial indebtedness and the possibility that we may incur additional indebtedness going forward; |
• | our ability to compete against traditional and renewable energy companies; |
• | hazards customary to the power production industry and power generation operations such as unusual weather conditions, catastrophic weather-related or other damage to facilities, unscheduled generation outages, maintenance or repairs, interconnection problems or other developments, environmental incidents, or electric transmission constraints and the possibility that we may not have adequate insurance to cover losses as a result of such hazards; |
• | our ability to expand into new business segments or new geographies; |
• | seasonal variations in the amount of electricity our wind and solar plants produce, and fluctuations in wind and solar resource conditions; and |
• | our ability to operate our businesses efficiently, manage capital expenditures and costs tightly, manage litigation, manage risks related to international operations and generate earnings and cash flow from our asset-based businesses in relation to our debt and other obligations. |
As a result of all these factors, we cannot guarantee that we will have sufficient cash generated from operations to pay a specific level of cash dividends to holders of our Class A common stock. Furthermore, holders of our Class A common stock should be aware that the amount of cash available for distribution depends primarily on our cash flow, and is not solely a function of profitability, which is affected by non-cash items. We may incur other expenses or liabilities during a period that could significantly reduce or eliminate our cash available for distribution and, in turn, impair our ability to pay dividends to holders of our Class A common stock during the period. We are a holding company and our ability to pay dividends on our Class A common stock is limited by restrictions on the ability of our subsidiaries to pay dividends or make other distributions to us, including restrictions under the terms of the agreements governing project-level financing. Our project-level financing agreements prohibit distributions to us unless certain specific conditions are met, including the satisfaction of financial ratios and the absence of payment or covenant defaults.
Furthermore, we expect to issue additional equity securities in connection with our Tender Offer for the outstanding shares of Saeta Yield, and we may issue additional equity securities in connection with any other acquisitions or growth capital expenditures. The payment of dividends on these additional equity securities may increase the risk that we will be unable to maintain or increase our per share dividend. There are no limitations in our amended and restated certificate of incorporation (other than a specified number of authorized shares) on our ability to issue equity securities, including securities ranking senior to our Class A common stock. The incurrence of bank borrowings or other debt by Terra Operating LLC or by our project-level subsidiaries to finance our growth strategy will result in increased interest expense and the imposition of additional or more restrictive covenants which, in turn, may impact the cash distributions we distribute to holders of our Class A common stock.
Finally, dividends to holders of our Class A common stock will be paid at the discretion of our Board.
Certain of our shareholders have accumulated large concentrations of holdings of our Class A shares, which among other things, may impact the liquidity of our Class A shares.
In addition to Brookfield, certain of our shareholders hold large positions in our Class A shares and new or existing shareholders may accumulate large positions in our Class A shares, which may impact the liquidity of shares of our Class A shares. In the event that shareholders hold these large positions in shares of our Class A common stock not owned by Brookfield this concentration of ownership may reduce the liquidity of our Class A common stock and may also have the effect of delaying or preventing a future change in control of our company or discouraging others from making tender offers for our shares, which could depress the price per share a bidder might otherwise be willing to pay.
38
We are a holding company and our only material asset is our interest in Terra LLC, and we are accordingly dependent upon distributions from Terra LLC and its subsidiaries to pay dividends and taxes and other expenses.
TerraForm Power is a holding company and has no material assets other than its ownership of membership interests in Terra LLC, a holding company that has no material assets other than its interest in Terra Operating LLC, whose sole material assets are interests in holding companies that directly or indirectly own the renewable energy facilities that comprise our portfolio and the renewable energy facilities that we subsequently acquire. TerraForm Power, Terra LLC and Terra Operating LLC have no independent means of generating revenue. We intend to cause Terra Operating LLC’s subsidiaries to make distributions to Terra Operating LLC and, in turn, make distributions to Terra LLC, and, Terra LLC, in turn, to make distributions to TerraForm Power in an amount sufficient to cover all applicable taxes payable and dividends, if any, declared by us. To the extent that we need funds to pay a quarterly cash dividend to holders of our Class A common stock or otherwise, and Terra Operating LLC or Terra LLC is restricted from making such distributions under applicable law or regulation or is otherwise unable to provide such funds (including as a result of Terra Operating LLC’s operating subsidiaries being unable to make distributions, such as due to defaults in project-level financing agreements), it could materially adversely affect our liquidity and financial condition and limit our ability to pay dividends to holders of our Class A common stock.
Market interest rates may have an effect on the value of our Class A common stock.
One of the factors that influences the price of shares of our Class A common stock will be the effective dividend yield of such shares (i.e., the yield as a percentage of the then market price of our shares) relative to market interest rates. An increase in market interest rates may lead prospective purchasers of shares of our Class A common stock to expect a higher dividend yield. If market interest rates increase and we are unable to increase our dividend in response, including due to an increase in borrowing costs, insufficient cash available for distribution or otherwise, investors may seek alternative investments with higher yield, which would result in selling pressure on, and a decrease in the market price of, our Class A common stock. As a result, the price of our Class A common stock may decrease as market interest rates increase.
The market price and marketability of our shares may from time to time be significantly affected by numerous factors beyond our control, which may adversely affect our ability to raise capital through future equity financings.
The market price of our shares may fluctuate significantly. Many factors may significantly affect the market price and marketability of our shares and may adversely affect our ability to raise capital through equity financings and otherwise materially adversely impact our business. These factors include, but are not limited to, the following:
• | price and volume fluctuations in the stock markets generally; |
• | significant volatility in the market price and trading volume of securities of registered investment companies, business development companies or companies in our sectors, which may not be related to the operating performance of these companies; |
• | changes in our earnings or variations in operating results; |
• | changes in regulatory policies or tax law; |
• | operating performance of companies comparable to us; and |
• | loss of funding sources or the ability to finance or refinance our obligations as they come due. |
Investors may experience dilution of their ownership interest due to the future issuance of additional shares of our Class A common stock.
We are in a capital intensive business, and may not have sufficient funds to finance the growth of our business, acquisitions or to support our projected capital expenditures. As a result, we have engaged in, and may require additional funds from further, equity or debt financings, including tax equity financing transactions or sales of preferred shares or convertible debt to complete future acquisitions, expansions and capital expenditures and pay the general and administrative costs of our business. In the future, we may issue our previously authorized and unissued securities, resulting in the dilution of the ownership interests of purchasers of our Class A common stock offered hereby. Under our amended and restated certificate of incorporation, we are authorized to issue 1,200,000,000 shares of Class A common stock and 100,000,000 shares of preferred stock with preferences and rights as determined by our Board. The potential issuance of additional shares of Class A common stock or preferred stock or convertible debt may create downward pressure on the trading price of our Class A common stock. We may also issue additional shares of our Class A common stock or other securities that are convertible into or exercisable for our Class A common stock in future public offerings or private placements for capital raising purposes or for other business
39
purposes, potentially at an offering price, conversion price or exercise price that is below the trading price of our Class A common stock.
If securities or industry analysts do not publish or cease publishing research or reports about us, our business or our market, or if they change their recommendations regarding our Class A common stock adversely, the stock price and trading volume of our Class A common stock could decline.
The trading market for our Class A common stock will be influenced by the research and reports that industry or securities analysts may publish about us, our business, our market or our competitors. If any of the analysts who may cover us change their recommendation regarding our Class A common stock adversely, or provide more favorable relative recommendations about our competitors, the price of our Class A common stock would likely decline. If any analyst who may cover us were to cease coverage of our company or fail to regularly publish reports on us, we could lose visibility in the financial markets, which in turn could cause the stock price or trading volume of our Class A common stock to decline.
As a result of the Merger and Sponsorship Transaction, we are a “controlled company,” controlled by Brookfield, whose interest in our business may be different from ours or other holders of our Class A common stock.
As a result of the Merger and Sponsorship Transaction, Brookfield owns an approximate 51% interest in the Company. At the effective time of the Merger, SunEdison transferred all of the IDRs currently held by SunEdison to Brookfield IDR Holder pursuant to an Incentive Distribution Rights Transfer Agreement, Terra LLC entered into an amended and restated limited liability company agreement (the “New Terra LLC Agreement”) and Brookfield, the Company and certain of their respective affiliates entered into the Brookfield MSA. Pursuant to the terms of the New Terra LLC Agreement, cash distributions from Terra LLC will be allocated between the holders of the Class A units in Terra LLC and the holders of the IDRs according to a fixed formula. In addition, pursuant to the terms of the Brookfield MSA, Brookfield is entitled to certain fixed and variable management fees for services performed for the Company. As a result of these economic rights, Brookfield may have interests in our business that are different from our interests or the interests of the other holders of our Class A common stock.
In addition, pursuant to the Merger Agreement, if there has been a final resolution of certain specified litigation involving the Company, following the effective time of the Merger, the Company has agreed to issue a number of additional Class A shares to Brookfield for no additional consideration based on the amounts paid or accrued by the Company or any of its affiliates, including Brookfield, with respect to such litigation, calculated in accordance with specified formulas. As a result of this arrangement, Brookfield may have interests in the specified litigation that is different from our interests or the interests of the other holders of our Class A common stock.
Brookfield currently owns interests in, manages and controls, and may in the future own or acquire interests in, manage and/or control, other yield focused publicly listed and private electric power businesses that own clean energy assets, primarily hydroelectric facilities and wind assets, and other public and private businesses that own and invest in other real property and infrastructure assets. Brookfield may have conflicts or potential conflicts, including resulting from the operation by Brookfield of its other businesses, including its other yield focused electric power businesses, including with respect to Brookfield’s attention to and management of our business which may be negatively affected by Brookfield’s ownership and/or management of other power businesses and other public and private businesses that it owns, controls or manages.
For so long as Brookfield or another entity controls greater than 50% of the total outstanding voting power of our Class A common stock, we will be considered a “controlled company” for the purposes of the NASDAQ Global Select Market listing requirements. As a “controlled company,” we are permitted to opt out of the NASDAQ Global Select Market listing requirements that require (i) a majority of the members of our Board to be independent, (ii) that we establish a compensation committee and a nominating and governance committee, each comprised entirely of independent directors and (iii) an annual performance evaluation of the nominating and governance and compensation committees. We expect to rely on such exceptions with respect to having a majority of independent directors, establishing a compensation committee or nominating committee and annual performance evaluations of such committees. Brookfield may sell part or all of its stake in the Company, or may have its interest in the Company diluted due to future equity issuances, in each case, which could result in a loss of the “controlled company” exemption under the NASDAQ Global Select Market rules. We would then be required to comply with those provisions of the NASDAQ Global Select Market on which we currently or in the future may rely upon exemptions.
As a result of the Merger and Sponsorship Transaction, Brookfield and its affiliates control the Company and have the ability to designate a majority of the members of the Company’s Board.
The governance agreements entered into between the Company and Brookfield in connection with the Merger and
40
Sponsorship Transaction provide Brookfield the ability to designate a majority of our Board to our Corporate Governance and Nominations Committee for nomination for election by our stockholders. Due to such agreements, and Brookfield’s approximate 51% interest in the Company, the ability of other holders of our Class A common stock to exercise control over the corporate governance of the Company will be limited. In addition, due to its approximate 51% interest in the Company, Brookfield has a substantial influence on our affairs and its voting power constitutes a large percentage of any quorum of our stockholders voting on any matter requiring the approval of our stockholders. As discussed in the risk factor entitled “As a result of the Merger and Sponsorship Transaction, we are a “controlled company,” controlled by Brookfield and its affiliates, whose interest in our business may be different from ours or other holders of our Class A common stock ” above, Brookfield may hold certain interests that are different from ours or other holders of our Class A common stock and there is no assurance that Brookfield will exercise its control over the Company in a manner that is consistent with our interests or those of the other holders of our Class A common stock.
Brookfield’s sponsorship may create significant conflicts of interest that may be resolved in a manner that is not in our best interest or the best interest of our shareholders.
Our sponsorship arrangements with Brookfield involve relationships that may give rise to conflicts of interest between us and our shareholders, on the one hand, and Brookfield, on the other hand. We rely on Brookfield to provide us with, among other things, strategic and investment management services. Although our sponsorship arrangements require Brookfield to provide us with a Chief Executive Officer, Chief Financial Officer and General Counsel who are dedicated to us on a full-time basis and have as their primary responsibility the provision of services to us, there is no requirement for Brookfield to act exclusively for us or for Brookfield to provide any specific individuals to us on an ongoing basis.
In certain instances, the interests of Brookfield may differ from our interests, including among other things with respect to the types of acquisitions we pursue, the timing and amount of distributions we make, the reinvestment of returns generated by our operations, the use of leverage when making acquisitions and the appointment of certain outside advisers and service providers. Although we believe the requirement for our Conflicts Committee to review and approve any potential conflict transactions between us and Brookfield should mitigate this risk, there can be no assurance that such review and approvals will result in a resolution that is entirely in our best interests or the best interests of our shareholders.
Brookfield exercises substantial influence over the Company and we are highly dependent on Brookfield.
We depend on the management and administration services provided by Brookfield pursuant to the Brookfield MSA. Other than our Chief Executive Officer, Chief Financial Officer and General Counsel, Brookfield personnel and support staff that provide services to us under the Brookfield MSA are not required to have as their primary responsibility the management and administration of us or to act exclusively for us and the Brookfield MSA does not require any specific individuals to be provided to us. Failing to effectively manage our current operations or to implement our strategy could have a material adverse effect on our business, financial condition and results of operations.
The departure of some or all of Brookfield’s professionals could prevent us from achieving our objectives.
We depend on the diligence, skill and business contacts of Brookfield’s professionals and the information and opportunities they generate during the normal course of their activities. Our future success will depend on the continued service of these individuals, who are not obligated to remain employed with Brookfield. Brookfield has experienced departures of key professionals in the past and may experience departures again in the future, and we cannot predict the impact that any such departures will have on our ability to achieve our objectives. The departure of a significant number of Brookfield’s professionals for any reason, or the failure to appoint qualified or effective successors in the event of such departures, could have a material adverse effect on our ability to achieve our objectives.
The role and ownership of Brookfield may change.
Our arrangements with Brookfield do not require Brookfield to maintain any ownership level in the Company. If Brookfield decides to sell part or all of its stake in the Company, or has its interest in the Company diluted due to future equity issuances, we could lose the benefit of the “controlled company” exemption for the purposes of the NASDAQ Global Select Market rules as discussed in the risk factor entitled “As a result of the Merger and Sponsorship Transaction, we are a “controlled company,” controlled by Brookfield, whose interest in our business may be different from ours or other holders of our Class A common stock.” Additionally, if Brookfield’s ownership interest falls below 25%, we would have the right to terminate the Brookfield MSA. Any decision by the Company to terminate the Brookfield MSA would trigger a termination of the Relationship Agreement. As a result, we cannot predict with any certainty the effect that any change in Brookfield’s ownership would have on the trading price of our shares or our ability to raise capital or make investments in the future.
41
Risks Related to our Historic Relationship with SunEdison and the SunEdison Bankruptcy
We have transitioned away from our historical dependence on SunEdison for important corporate, project and other services, which involves management challenges and poses risks that may materially adversely affect our business, results of operations and financial condition.
Over the course of 2017, we engaged in efforts to transition away from our historical dependence on SunEdison for corporate, project and other services, including providing for critical systems and information technology infrastructure, by seeking to identify alternative service providers and to establish and manage new relationships, as well as develop our own capabilities and resources in these areas. These efforts include creating a separate stand-alone corporate organization, including, among other things, directly hiring employees and establishing our own accounting, information technology, human resources and other systems and infrastructure, and also include transitioning the project-level O&M and asset management services in-house or to third party service providers. These efforts are largely complete, however, although they were designed to mitigate risks posed by the SunEdison Bankruptcy, they involve a number of new risks and challenges that may materially adversely affect our business, results of operations and financial condition.
For example, we may be unable to replicate the corporate and project-level services we previously received, either through outsourcing or performing those services ourselves on terms or at similar historic costs or at all. The fees for services provided by Brookfield under the Brookfield MSA, which amount to $2.5 million per quarter for the first four quarters plus a certain variable component, and escalate thereafter, are higher than the fees that we were to pay under the SunEdison management services agreement, which were equal to 2.5% of the Company’s cash available for distribution to shareholders in 2016 and 2017 (not to exceed $7.0 million in 2016 or $9.0 million in 2017). In addition, in light of SunEdison’s familiarity with our assets, we may not be able to procure the same level of service either through our self-performance of these tasks or through outsourcing. We also continue to depend on a substantial number of outside contractors for accounting services and the costs for these services are substantially greater than those we would incur if we directly hired employees to perform the same services.
Finalizing these changes in connection with such transition may take longer than we expect, cost more than we expect, and divert management’s attention from other aspects of our business. We may also incur substantial legal and compliance costs in many of the jurisdictions where we operate. In addition, as we have limited experience in developing our own capabilities and resources, there is no assurance that we would ultimately be successful in our efforts in each of these areas, if at all, which could result in delays or disruptions in our business and operations.
Our historic relationship with SunEdison may adversely affect our relationships with current or potential counterparties.
We have important counterparties at every level of operations, including offtakers under the PPAs, corporate and project-level lenders and investors, suppliers and service providers. The SunEdison Bankruptcy may have damaged our relationships with our counterparties due to concerns about the SunEdison Bankruptcy and its impact on our business. These concerns may cause counterparties to be less willing to grant waivers or forbearances if needed for other matters and more likely to enforce contractual provisions or reduce utilization of our services (or the provision of supplies or services) where the counterparty has flexibility in volume or duration. These concerns may also cause our existing or potential new counterparties to be less likely to enter into new agreements or to demand more expensive or onerous terms, credit support, security or other conditions. Damage to our existing or potential future counterparty relationships may materially and adversely affect our business, financial condition and results of operations, including our growth strategy.
Risks Related to our Delayed Exchange Act Filings
Potential future delays in the filing of our reports with the SEC, as well as further delays in the preparation of audited financial statements at the project level, could have a material adverse effect.
The Company did not file with the SEC on a timely basis its Form 10-Ks for the years ended December 31, 2015 and 2016 and its Form 10-Qs for each of the quarters ended March 31, 2016, June 30, 2016, September 30, 2016, March 31, 2017 and June 30, 2017. The Company timely filed its Form 10-Q for the quarter ended September 30, 2017. During the period of these delays, we received notification letters from NASDAQ that granted extensions to regain compliance with NASDAQ’s continued listing requirements, subject to the requirement that we file our SEC reports and hold our annual meeting of stockholders by certain deadlines. While we are now current in our filing of periodic reports under the Securities and Exchange Act of 1934, as amended (the “Exchange Act”), and are in compliance with NASDAQ's continued listing requirements, in the event that any future periodic report is delayed, there is no assurance that we will be able to obtain further extensions from
42
NASDAQ to maintain or regain compliance with NASDAQ’s continued listing requirements with respect to any such delayed periodic report. If we fail to obtain any such further extensions from NASDAQ, our Class A common stock would likely be delisted from the NASDAQ Global Select Market.
The delay in filing our Annual Reports on Form 10-K and our Quarterly Reports on Form 10-Q and related financial statements has impaired our ability to obtain financing and access the capital markets, and to the extent we fail to make timely filings in the future, our access to financing may be impaired. For example, as a result of the delayed filing of our periodic reports with the SEC, we will not be eligible to register the offer and sale of our securities using a short-form registration statement on Form S-3 until we have timely filed all periodic reports required under the Exchange Act for one year. Additional delays may also negatively impact our ability to obtain project financing and our ability to obtain waivers or forbearances to the extent of any defaults or breaches of project-level financing. An inability to obtaining financing may have a material adverse effect on our ability to grow our business, acquire assets through acquisitions or optimize our portfolio and capital structure. Additionally, a delay in audited financial statements may reduce the comfort of our Board with approving the payment of dividends.
Financial statements at the project-level have also been delayed over the course of 2016 and 2017. This delay created defaults under most of our non-recourse financing agreements, which have been substantially cured or waived as of the date hereof. To the extent any remaining defaults remain uncured or unwaived, or new defaults arise because of future delays in the completion of audited or unaudited financial statements, our subsidiaries may be restricted in their the ability to make distributions to us, or the related lenders may be entitled to demand repayment or enforce their security interests, which could have a material adverse effect on our business, results of operations, financial condition, our ability to pay dividends and our ability to comply with corporate-level debt covenants.
Item 1B. Unresolved Staff Comments.
None.
Item 2. Properties.
Our current portfolio consists of distributed generation solar facilities and utility-scale power plants that are located in the United States (including Puerto Rico), Canada, Chile and the United Kingdom with a combined nameplate capacity of 2,606.4 MW as of December 31, 2017. We have financed certain of our assets through project specific debt secured by the renewable energy facility's assets (mainly the renewable energy facility) or equity interests in such renewable energy facilities with no recourse to Terra LLC or Terra Operating LLC. See the table of our properties in Item 1. Business - Our Portfolio.
Distributed generation solar facilities
Distributed generation facilities provide customers with an alternative to traditional utility energy suppliers. Distributed resources are typically smaller in unit size and can be installed at a customer’s site, removing the need for lengthy transmission and distribution lines. By bypassing the traditional utility suppliers, distributed energy systems delink the customer’s price of power from external factors such as volatile commodity prices, costs of the incumbent energy supplier and some transmission and distribution charges. This makes it possible for distributed energy purchasers to buy energy at a predictable and stable price over a long period of time.
The PPAs for certain of our distributed generation solar facilities located in the United States allow the offtake purchaser to elect to purchase the facility from us at a price equal to the greater of a specified amount in the PPA or fair market value. In addition, certain of our PPAs allow the offtake purchaser to terminate the PPA if we do not meet certain prescribed operating thresholds or performance measures or otherwise by the payment of an early termination fee, which would require us to remove the renewable energy facility from the offtaker’s site. These operating thresholds and performance measures are readily achievable in the normal operation of the renewable energy facilities.
Utility-scale power plants
Our utility-scale solar generation facilities and wind facilities are our larger scale power plants where either the purchaser of the electricity is an electric utility, governmental entity or other third party or where power is delivered directly to the grid.
43
Item 3. Legal Proceedings.
See Note 19. Commitments and Contingencies to our consolidated financial statements included in this Annual Report on Form 10-K for disclosures concerning our legal proceedings, which disclosures are incorporated herein by reference.
Item 4. Mine Safety Disclosures.
Not applicable.
44
PART II
Item 5. Market for Registrant’s Common Equity, Related Stockholder Matters and Issuer Purchases of Equity Securities.
Class A Common Stock
TerraForm Power's Class A common stock began trading on the NASDAQ Global Select Market under the symbol “TERP” on July 18, 2014. Prior to that, there was no public market for our Class A common stock.
Immediately prior to the effective time of the Merger, pursuant to the Settlement Agreement, SunEdison exchanged all of the Class B units held by SunEdison or any of its controlled affiliates in Terra LLC for 48,202,310 Class A shares of TerraForm Power, and as a result of this exchange, all shares of Class B common stock of TerraForm Power were automatically redeemed and retired. Our Class B common stock was not publicly traded. Pursuant to the Settlement Agreement, immediately following this exchange, we issued to SunEdison additional Class A shares of TerraForm Power such that immediately prior to the effective time of the Merger, SunEdison and certain of its affiliates held an aggregate number of Class A shares equal to 36.9% of the Company's fully diluted share count (which was subject to proration based on the Merger consideration election results as discussed in Note 15. Stockholders' Equity to our consolidated financial statements). After giving effect to these transactions and this proration, SunEdison and certain of its affiliates held an aggregate 34,273,879 Class A shares in TerraForm Power, which we registered in December of 2017, and these shares were distributed by SunEdison and certain of its affiliates under the plan of reorganization in connection with SunEdison's emergence from bankruptcy in December of 2017. At the effective time of the Merger, TerraForm Power also issued 65,144,459 Class A shares to Orion Holdings pursuant to the Merger Agreement, which are not registered.
Upon the consummation of the Merger, our certificate of incorporation was amended and restated. TerraForm Power's authorized shares of preferred stock and Class A common stock were increased to 100,000,000 shares and 1,200,000,000 shares, respectively. There are no other authorized classes of shares, and we do not have any issued shares of preferred stock.
As of February 28, 2018, there were 18 holders of record of TerraForm Power’s Class A common stock and the closing sale price per share of our Class A common stock on the NASDAQ Global Select Market was $11.51. Orion Holdings, a controlled affiliate of Brookfield, held 51% of TerraForm Power's Class A common stock as of such date.
The table below sets forth, for the periods indicated, the high and low sale prices per share of our Class A common stock on the NASDAQ Global Select Market for the periods indicated below:
High | Low | |||||||
Quarter ended March 31, 2016 | $ | 12.61 | $ | 7.64 | ||||
Quarter ended June 30, 2016 | 11.00 | 7.44 | ||||||
Quarter ended September 30, 2016 | 14.59 | 10.94 | ||||||
Quarter ended December 31, 2016 | 14.38 | 11.40 | ||||||
Quarter ended March 31, 2017 | 13.55 | 10.99 | ||||||
Quarter ended June 30, 2017 | 12.90 | 11.63 | ||||||
Quarter ended September 30, 2017 | 14.00 | 11.69 | ||||||
Quarter ended December 31, 2017 | 14.20 | 10.93 | ||||||
Dividends
On October 6, 2017, our Board declared the payment of a special cash dividend (the “Special Dividend”) to holders of record immediately prior to the effective time of the Merger in the amount of $1.94 per fully diluted share, which included the Company's issued and outstanding Class A shares, Class A shares issued to SunEdison pursuant to the Settlement Agreement (as described above) and Class A shares underlying outstanding restricted stock units of the Company under the Company's long-term incentive plan. The Special Dividend was paid on October 17, 2017. There were no other cash dividends declared or paid on our Class A common stock during the years ended December 31, 2017 and 2016.
On February 6, 2018, our Board declared a quarterly dividend with respect to our Class A common stock of $0.19 per share. The dividend is payable on March 30, 2018 to shareholders of record as of February 28, 2018. This dividend represents our first dividend payment under Brookfield sponsorship.
45
Stock Performance Graph
This performance graph below shall not be deemed “soliciting material” or to be “filed” with the SEC for purposes of Section 18 of the Securities Exchange Act of 1934, as amended, or otherwise subject to the liabilities under that section, and shall not be deemed to be incorporated by reference into any filing of the Company under the Securities Act of 1933, as amended, or the Securities Exchange Act of 1934, as amended.
The performance graph below compares TerraForm Power's cumulative total stockholder return on its Class A common stock from July 18, 2014 through December 31, 2017, with the cumulative total return of the Standard & Poor's 500 Composite Price Index, or the “S&P 500,” the NASDAQ Composite Index, as well as our peer group consisting of Atlantica Yield PLC; NextEra Energy Partners, LP; NRG Yield, Inc.; Pattern Energy Group Inc; and 8point3 Energy Partners LP.
The performance graph below compares each period assuming that $100 was invested on the initial public offering date in each of the Class A common stock of the Company, the stocks in the S&P 500, the NASDAQ Composite Index, our peer group, and that all dividends were reinvested.
Comparison of Cumulative Total Return
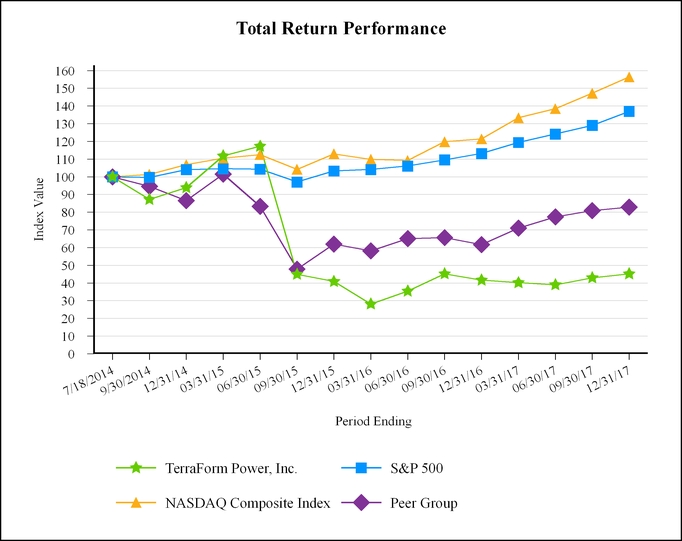
Securities Authorized for Issuance under Equity Compensation Plans
For information regarding our equity compensation plans, see Item 12. Security Ownership of Certain Beneficial Owners and Management and Related Stockholder Matters.
46
Item 6. Selected Financial Data.
Our historical selected financial data is presented in the following table. For all periods prior to our initial public offering (“IPO”) on July 23, 2014, the amounts shown in the table below represent the combination of TerraForm Power and Terra LLC, the accounting predecessor, and were prepared using SunEdison's historical basis in assets and liabilities. For all periods subsequent to the IPO, the amounts shown in the table below represent the results of TerraForm Power, which consolidates Terra LLC through its controlling interest. This historical data should be read in conjunction with the consolidated financial statements and the related notes thereto in Item 15. Exhibits, Financial Statements and Schedules and with Item 7. Management's Discussion and Analysis of Financial Condition and Results of Operations.
Year Ended December 31, | ||||||||||||||||||||
(In thousands, except per share data) | 2017 | 2016 | 2015 | 2014 | 2013 | |||||||||||||||
Statement of Operations Data: | ||||||||||||||||||||
Operating revenues, net | $ | 610,471 | $ | 654,556 | $ | 469,506 | $ | 127,156 | $ | 18,716 | ||||||||||
Operating costs and expenses: | ||||||||||||||||||||
Cost of operations | 150,733 | 113,302 | 70,468 | 10,630 | 1,112 | |||||||||||||||
Cost of operations - affiliate | 17,601 | 26,683 | 19,915 | 8,063 | 1,068 | |||||||||||||||
General and administrative expenses | 139,874 | 89,995 | 55,811 | 20,984 | 289 | |||||||||||||||
General and administrative expenses - affiliate | 13,391 | 14,666 | 55,330 | 19,144 | 5,158 | |||||||||||||||
Acquisition and related costs | — | 2,743 | 49,932 | 10,177 | — | |||||||||||||||
Acquisition and related costs - affiliate | — | — | 5,846 | 5,049 | — | |||||||||||||||
Loss on prepaid warranty - affiliate | — | — | 45,380 | — | — | |||||||||||||||
Goodwill impairment | — | 55,874 | — | — | — | |||||||||||||||
Impairment of renewable energy facilities | 1,429 | 18,951 | — | — | — | |||||||||||||||
Depreciation, accretion and amortization expense | 246,720 | 243,365 | 161,310 | 41,280 | 5,731 | |||||||||||||||
Formation and offering related fees and expenses | — | — | — | 3,570 | — | |||||||||||||||
Formation and offering related fees and expenses - affiliate | — | — | — | 1,870 | — | |||||||||||||||
Total operating costs and expenses | 569,748 | 565,579 | 463,992 | 120,767 | 13,358 | |||||||||||||||
Operating income | 40,723 | 88,977 | 5,514 | 6,389 | 5,358 | |||||||||||||||
Other expenses (income): | ||||||||||||||||||||
Interest expense, net | 262,003 | 310,336 | 167,805 | 86,191 | 8,129 | |||||||||||||||
Loss on extinguishment of debt, net | 81,099 | 1,079 | 16,156 | (7,635 | ) | — | ||||||||||||||
Gain on sale of renewable energy facilities | (37,116 | ) | — | — | — | — | ||||||||||||||
(Gain) loss on foreign currency exchange, net | (6,061 | ) | 13,021 | 19,488 | 14,007 | (771 | ) | |||||||||||||
Loss on investments and receivables - affiliate | 1,759 | 3,336 | 16,079 | — | — | |||||||||||||||
Other (income) expenses, net | (5,017 | ) | 2,218 | 7,362 | 438 | — | ||||||||||||||
Total other expenses, net | 296,667 | 329,990 | 226,890 | 93,001 | 7,358 | |||||||||||||||
Loss before income tax (benefit) expense | (255,944 | ) | (241,013 | ) | (221,376 | ) | (86,612 | ) | (2,000 | ) | ||||||||||
Income tax (benefit) expense | (23,080 | ) | 494 | (13,241 | ) | (4,689 | ) | (88 | ) | |||||||||||
Net loss | $ | (232,864 | ) | $ | (241,507 | ) | $ | (208,135 | ) | $ | (81,923 | ) | $ | (1,912 | ) | |||||
Net loss attributable to Class A common stockholders | $ | (164,189 | ) | $ | (129,847 | ) | $ | (79,886 | ) | $ | (25,617 | ) | N/A | |||||||
Basic and diluted loss per Class A common share | (1.65 | ) | (1.47 | ) | (1.25 | ) | (0.87 | ) | N/A | |||||||||||
Dividends declared per Class A common share | 1.94 | — | 1.01 | 0.44 | N/A | |||||||||||||||
47
As of December 31, | ||||||||||||||||||||
(In thousands) | 2017 | 2016 | 2015 | 2014 | 2013 | |||||||||||||||
Balance Sheet Data: | ||||||||||||||||||||
Cash and cash equivalents | $ | 128,087 | $ | 565,333 | $ | 626,595 | $ | 468,554 | $ | 1,044 | ||||||||||
Restricted cash | 96,700 | 117,504 | 159,904 | 81,000 | 69,722 | |||||||||||||||
Renewable energy facilities, net | 4,801,925 | 4,993,251 | 5,834,234 | 2,648,212 | 433,019 | |||||||||||||||
Long-term debt and financing lease obligations | 3,598,800 | 3,950,914 | 4,562,649 | 1,699,765 | 441,650 | |||||||||||||||
Capital lease obligations | — | — | — | — | 29,171 | |||||||||||||||
Total assets | 6,387,021 | 7,705,865 | 8,217,409 | 3,680,423 | 593,327 | |||||||||||||||
Total liabilities | 3,958,313 | 4,807,499 | 5,101,429 | 2,140,164 | 577,875 | |||||||||||||||
Redeemable non-controlling interests | 58,340 | 180,367 | 175,711 | 24,338 | — | |||||||||||||||
Total stockholders' equity | 2,370,368 | 2,717,999 | 2,940,269 | 1,515,921 | 15,452 | |||||||||||||||
Item 7. Management’s Discussion and Analysis of Financial Condition and Results of Operations.
The following discussion and analysis should be read in conjunction with our audited consolidated financial statements and notes thereto contained herein. The results shown herein are not necessarily indicative of the results to be expected in any future periods. Unless otherwise indicated or otherwise required by the context, references in this section to “we,” “our,” “us,” or the “Company” refer to TerraForm Power, Inc. and its consolidated subsidiaries.
Overview
Our primary business strategy is to acquire, own and operate solar and wind assets in North America and Western Europe. We are the owner and operator of a 2,600 MW diversified portfolio of high-quality solar and wind assets, located primarily in the United States and underpinned by long-term contracts. Significant diversity across technologies and locations coupled with contracts across a large, diverse group of creditworthy counterparties significantly reduces the impact of resource variability on cash available for distribution and limits our exposure to any individual counterparty.
On April 21, 2016, SunEdison, Inc., our previous sponsor, and certain of its domestic and international subsidiaries voluntarily filed for protection under Chapter 11 of the U.S. Bankruptcy Code. In response to SunEdison’s financial and operating difficulties, we initiated a process for the exploration and evaluation of potential strategic alternatives for the Company. As described in Item 1. Business, this process resulted in our entry into the Merger Agreement on March 6, 2017 with affiliates of Brookfield. At the same time, we also entered into the Settlement Agreement and the Voting and Support Agreement with SunEdison to, among other things, facilitate the closing of the Merger and the settlement of claims between the Company and SunEdison.
On October 16, 2017, the Merger was consummated with TerraForm Power continuing as the surviving corporation in the Merger, and the Company entered into a suite of support and sponsorship arrangements with Brookfield and certain of its affiliates, as described in greater detail under Sponsorship Arrangements within Item 1. Business. In connection with the successful completion of the Merger and Sponsorship Transaction, Brookfield replaced SunEdison as our sponsor and all outstanding claims between us and SunEdison that may have existed prior to the closing of the Merger and Sponsorship Transaction were finally settled, and all agreements between the Company and the SunEdison Debtors were deemed rejected, subject to certain limited exceptions, without further liability, claims or damages on the part of the Company.
Our goal is to pay dividends to our shareholders that are sustainable on a long-term basis while retaining within our operations sufficient liquidity for recurring growth capital expenditures and general purposes. We expect to generate this return with a regular dividend, which we intend to grow at 5 to 8% per annum, that is supported by a target payout ratio of 80 to 85% of cash available for distribution and our stable cash flows. We expect to achieve this growth and deliver returns by focusing on the following initiatives:
• | Margin Enhancements: |
We believe there is significant opportunity to enhance our cash flow through productivity enhancements by rationalizing our headcount and implementing a more efficient organizational structure. In addition, we plan to automate a number of processes that are currently very labor intensive and expect to realize cost savings
48
through reductions in O&M expenses and the in-sourcing of asset management and certain back office functions.
• | Organic Growth: |
We plan to develop a robust organic growth pipeline comprised of opportunities to invest in our existing fleet on an accretive basis as well as add-on acquisitions across our scope of operations. We have identified a number of opportunities which we believe may be compelling to invest in our fleet, including asset repowerings, site expansions and potentially adding energy storage to existing sites.
• | Value-oriented acquisitions: |
We expect to evaluate a number of acquisition opportunities with a focus on sourcing off-market transactions at more attractive valuations than auction processes. Our recently announced tender offer for the outstanding shares of Saeta Yield (as described in Irrevocable Agreement to Launch Tender Offer for the Common Shares of Saeta Yield within Item 1. Business) is an example of these acquisition opportunities. We believe that multi-faceted transactions such as take-privates and recapitalizations may enable us to acquire high quality assets at attractive relative values.
We have a right of first offer to acquire certain renewable power assets in North America and Western Europe owned by Brookfield and its affiliates. The ROFO portfolio currently stands at 3,500 MW. Over time, as Brookfield entities look to sell these assets, we will have the opportunity to make offers for these assets and potentially purchase them if the prices meet our investment objectives and are the most favorable offered to Brookfield. We also continue to maintain a call right over 0.5 GW (net) of operating wind power plants that are owned by a warehouse vehicle that was owned and arranged by SunEdison. SunEdison sold its equity interest in this warehouse vehicle to an unaffiliated third party in 2017.
We believe we are well positioned to benefit from Brookfield's deep operational expertise in owning, operating and developing renewable assets, as well as its significant deal sourcing capabilities and access to capital. Brookfield is a leading global alternative asset manager and has a more than 100-year history of owning and operating assets with a focus on renewable power, property, infrastructure and private equity. Brookfield has approximately $40 billion in renewable power assets under management, representing approximately 16,400 MW of generation capacity in 14 countries. It also employs over 2,000 individuals with extensive operating, development and power marketing capabilities and has a demonstrated ability to deploy capital in a disciplined manner, having developed or acquired 12,000 MW of renewable generation capacity since 2012.
Factors that Significantly Affect our Results of Operations and Business
We expect the following factors will affect our results of operations:
Transition to sponsorship by Brookfield
Throughout 2017, we worked to complete our transition away from our historical reliance on SunEdison for operational, systems and staffing support, among other things, as part of a strategic initiative to mitigate the adverse effects of the SunEdison Bankruptcy. Over the course of the year we made significant progress in this area and are now no longer reliant on SunEdison.
In light of the closing of the Merger and Sponsorship Transaction, in 2017 we also began to transition to Brookfield sponsorship of the Company. Our results of operations and business will be affected by the relative success of this transition. In the near term, we are targeting cost improvements by streamlining processes and optimizing our structure, which we expect can be achieved by rationalizing our headcount, adopting a more efficient organizational structure and in-sourcing certain back office functions. In the medium term, we are targeting costs savings in O&M by replacing high cost legacy O&M contracts across our wind fleet through either in-sourcing or renegotiating contracts with third party providers, depending on which alternative provides the best combination of cost and risk transfer, and improvements in fleet availability. We also expect to refocus the Company on growth initiatives that are developed organically and with the benefit of Brookfield’s deal sourcing capabilities. Our results of operations, business and growth prospects will depend on our success in achieving these cost improvements and growth strategy.
49
Offtake contracts
Our revenue is primarily a function of the volume of electricity generated and sold by our renewable energy facilities as well as, to a lesser extent, where applicable, the sale of green energy certificates and other environmental attributes related to energy generation. Our current portfolio of renewable energy facilities is generally contracted under long-term PPAs with creditworthy counterparties. As of December 31, 2017, the weighted average remaining life of our PPAs was 14 years. Pricing of the electricity sold under these PPAs is generally fixed for the duration of the contract, although some of our PPAs have price escalators based on an index (such as the consumer price index) or other rates specified in the applicable PPA.
The Company also generates RECs as it produces electricity. RECs are accounted for as governmental incentives and are not considered output of the underlying renewable energy facilities. These RECs are currently sold pursuant to agreements with third parties and a certain debt holder, and REC revenue is recognized as the underlying electricity is generated if the sale has been contracted with the customer. Under the terms of certain debt agreements with a creditor, SRECs are transferred directly to the creditor to reduce principal and interest payments due under solar program loans.
Project operations and generation availability
Our revenue is a function of the volume of electricity generated and sold by our renewable energy facilities. Generation availability refers to the actual amount of time a power generation asset produces electricity divided by the amount of time such asset is expected to produce electricity, which reflects anticipated maintenance and interconnection interruptions. We track generation availability as a measure of the operational efficiency of our business. The volume of electricity generated and sold by our renewable energy facilities during a particular period is impacted by the number of facilities that have achieved commercial operations, as well as both scheduled and unexpected repair and maintenance required to keep our facilities operational. For some of our plants, particularly our wind plants located in Texas, we sell a portion of the power output of the plant on a merchant basis into the wholesale power markets. Any uncontracted energy sales are dependent on the current or day ahead prices in the power markets. Certain of the wholesale markets have experienced volatility and negative pricing.
The costs we incur to operate, maintain and manage our renewable energy facilities also affect our results of operations. Equipment performance represents the primary factor affecting our operating results because equipment downtime impacts the volume of the electricity that we are able to generate from our renewable energy facilities. The volume of electricity generated and sold by our facilities will also be negatively impacted if any facilities experience higher than normal downtime as a result of equipment failures, electrical grid disruption or curtailment, weather disruptions, or other events beyond our control.
Seasonality and resource variability
The amount of electricity produced and revenues generated by our solar generation facilities is dependent in part on the amount of sunlight, or irradiation, where the assets are located. Shorter daylight hours in winter months result in less irradiation and the generation produced by these facilities will vary depending on the season. Irradiation can also be variable at a particular location from period to period due to weather or other meteorological patterns, which can affect operating results. As the great majority of our solar power plants are located in the Northern hemisphere, we expect our current solar portfolio’s power generation to be at its lowest during the first and fourth quarters of each year. Therefore, we expect our first and fourth quarter solar revenue generation to be lower than other quarters.
Similarly, the electricity produced and revenues generated by our wind power plants depend heavily on wind conditions, which are variable and difficult to predict. Operating results for renewable energy facilities vary significantly from period to period depending on the wind conditions during the periods in question. As our wind power plants are located in geographies with different profiles, there is some flattening of the seasonal variability associated with each individual wind power plant’s generation, and we expect that as the fleet expands the effect of such wind resource variability may be favorably impacted, although we cannot guarantee that we will purchase wind power plants that will achieve such results in part or at all. Historically, our wind production is greater in the first and fourth quarters which can partially offset the lower solar revenue expected to be generated in those quarters.
We do not expect seasonality to have a material effect on our ability to pay a regular dividend. We intend to mitigate the effects of any seasonality that we experience by reserving a portion of our cash available for distribution and otherwise maintain sufficient liquidity, including cash on hand in order to, among other things, facilitate the payment of dividends to our stockholders.
50
Cash distribution restrictions
In certain cases, we obtain project-level or other limited or non-recourse financing for our renewable energy facilities which may limit our ability to distribute funds to the Company. These limitations typically require that the project-level cash is used to meet debt obligations and fund operating reserves of the project company. These financing arrangements also generally limit our ability to distribute funds to the Company if defaults have occurred or would occur with the giving of notice or the lapse of time, or both. Over the course of 2016 and 2017, the Company’s ability to distribute funds from its renewable energy facilities was limited for substantially all of its renewable energy facilities with non-recourse financing due to project-level defaults related to the SunEdison Bankruptcy and the failure to timely deliver audited financial statements. Substantially all of those defaults have now been cured or waived. However, if we fail to timely deliver financial statements in the future, or other defaults occur and continue on our non-recourse financing arrangements, we could again be limited in our ability to distribute funds to TerraForm Power in order to pay corporate-level expenses and debt service obligations, as well as to pay dividends to the holders of our Class A common stock, and in our ability to comply with corporate-level debt covenants.
Renewable energy facility acquisitions and investments
Our long-term growth strategy is dependent on our ability to acquire additional clean power generation assets. Over the course of 2016 and 2017, we have been limited in our ability to grow the Company as a result of the SunEdison Bankruptcy and other risks that we faced. In connection with our transition to Brookfield sponsorship, we have renewed our focus on sustainable growth and opportunistic value driven acquisitions and see a robust opportunity for a sustainable growth strategy over the long-term. This growth is expected to be comprised of organic growth investments in our existing fleet, add-on acquisitions across our scope of operations and value-oriented opportunistic acquisitions, including the recently announced acquisition of Saeta Yield that is expected to close in the second quarter of 2018, subject to certain closing conditions, as discussed in Irrevocable Agreement to Launch Tender Offer for the Common Shares of Saeta Yield within Item 1. Business.
Clean energy has been one of the fastest growing sources of electricity generation in North America and globally over the past decade. We expect the renewable energy generation segment in particular to continue to offer high growth opportunities driven by:
• | the continued reduction in the cost of solar, wind and other renewable energy technologies, which will lead to grid parity in an increasing number of markets; |
• | distribution charges and the effects of an aging transmission infrastructure, which enable renewable energy generation sources located at a customer’s site, or distributed generation, to be more competitive with, or cheaper than, grid-supplied electricity; |
• | the replacement of aging and conventional power generation facilities in the face of increasing industry challenges, such as regulatory barriers, increasing costs of and difficulties in obtaining and maintaining applicable permits, and the decommissioning of certain types of conventional power generation facilities, such as coal and nuclear facilities; |
• | the ability to couple renewable energy generation with other forms of power generation, creating a hybrid energy solution capable of providing energy on a 24/7 basis while reducing the average cost of electricity obtained through the system; |
• | the desire of energy consumers to lock in long-term pricing of a reliable energy source; |
• | renewable energy generation’s ability to utilize freely available sources of fuel, thus avoiding the risks of price volatility and market disruptions associated with many conventional fuel sources; |
• | environmental concerns over conventional power generation; and |
• | government policies that encourage development of renewable power, such as state or provincial renewable portfolio standard programs, which motivate utilities to procure electricity from renewable resources. In addition to renewable energy, we expect natural gas to grow as a source of electricity generation due to its relatively lower cost and lower environmental impact compared to other fossil fuel sources, such as coal and oil. |
Our future growth will be dependent in part on our ability to acquire renewable energy assets from third parties, including our ability to make offers for assets in the ROFO Pipeline of Brookfield and its affiliates to the extent the applicable affiliate of Brookfield elects to sell such assets and we are able to make a successful offer under the terms of the Relationship Agreement.
Access to capital markets
Our ability to acquire additional clean power generation assets and manage our other commitments may be dependent on our ability to raise or borrow additional funds and access debt and equity capital markets, including the equity capital markets for our Class A shares, the corporate debt markets and the project finance market for project-level debt. We accessed
51
the capital markets several times in 2017, including in connection with our New Revolver, New Term Loan, the New Senior Notes due 2023 and the Senior Notes due 2028 (as defined and discussed in Financing Activities within Liquidity and Capital Resources below), each of which we incurred in the fourth quarter of 2017. We also plan to access the capital markets in connection with financing our recently announced acquisition of Saeta Yield that is expected to close in the second quarter of 2018. Limitations on our ability to access the corporate and project finance debt and equity capital markets in the future on terms that are accretive to our existing cash flows would be expected to negatively affect our results of operations, business and future growth.
Foreign exchange
Our operating results are reported in United States dollars. Currently, a substantial majority of our revenues and expenses are generated in U.S. Dollars. Historically, we have also had significant revenue and expenses generated in other currencies, including the British Pound and the Canadian dollar. This mix of currencies changed over the course of 2017 as a result of the closing of the sale of substantially all of our portfolio of solar power plants located in the U.K. (24 operating projects representing an aggregate 365.0 MW, the “U.K. Portfolio”) on May 11, 2017. This mix may continue to change in the future if we elect to alter the mix of our portfolio within our existing markets or elect to expand into new markets, including as a result of the recently announced acquisition of Saeta Yield, a Spanish corporation, that is expected to close in the second quarter of 2018. In addition, our investments (including intercompany loans) in renewable energy facilities in foreign countries are exposed to foreign currency fluctuations. As a result, we expect our revenues and expenses will be exposed to foreign exchange fluctuations in local currencies where our renewable energy facilities are located. To the extent we do not hedge these exposures, fluctuations in foreign exchange rates could negatively impact our profitability and financial position.
Key Metrics
Operating Metrics
Net nameplate capacity
We measure the electricity-generating production capacity of our renewable energy facilities in net nameplate capacity. Rated capacity is the expected maximum output a power generation system can produce without exceeding its design limits. Net nameplate capacity is the rated capacity of all of the renewable energy facilities we own adjusted to reflect our economic ownership of joint ventures and similar power generation facilities. We measure net nameplate capacity for solar generation facilities in MW (DC) and for wind power plants in MW (AC). The size of our renewable energy facilities varies significantly among the assets comprising our portfolio. We believe the combined net nameplate capacity of our portfolio is indicative of our overall production capacity and period to period comparisons of our net nameplate capacity are indicative of the growth rate of our business. Our renewable energy facilities had an aggregate net nameplate capacity of 2,606.4 MW as of December 31, 2017.
Gigawatt hours sold
Gigawatt hours sold refers to the actual volume of electricity sold by our renewable energy facilities during a particular period. We track gigawatt hours sold as an indicator of our ability to realize cash flows from the generation of electricity at our renewable energy facilities. Our GWh sold for solar generation facilities for the years ended December 31, 2017, 2016 and 2015 were 1,895 GWh, 2,225 GWh and 1,973 GWh, respectively. Our GWh sold for wind power plants for the years ended December 31, 2017, 2016 and 2015 were 5,381 GWh, 5,499 GWh and 1,489 GWh, respectively.
52
Consolidated Results of Operations
The amounts shown in the table below represent the results of TerraForm Power, which consolidates Terra LLC through its controlling interest. For the year ended December 31, 2017, the results of the Company include the operating results of Terra LLC, as well as $11.3 million of stock-based compensation expense and $0.9 million of interest expense for the Sponsor Line Agreement (as discussed and defined in Liquidity and Capital Resources below) that was entered into in the fourth quarter of 2017, which are reflected in the operating results of TerraForm Power. For the years ended December 31, 2016 and 2015, the results of the Company include the operating results of Terra LLC and $3.4 million and $12.1 million of stock-based compensation expense, respectively, which is reflected in the operating results of TerraForm Power. The following table illustrates the consolidated results of operations for the years ended December 31, 2017, 2016 and 2015:
Year Ended December 31, | ||||||||||||
(In thousands) | 2017 | 2016 | 2015 | |||||||||
Operating revenues, net | $ | 610,471 | $ | 654,556 | $ | 469,506 | ||||||
Operating costs and expenses: | ||||||||||||
Cost of operations | 150,733 | 113,302 | 70,468 | |||||||||
Cost of operations - affiliate | 17,601 | 26,683 | 19,915 | |||||||||
General and administrative expenses | 139,874 | 89,995 | 55,811 | |||||||||
General and administrative expenses - affiliate | 13,391 | 14,666 | 55,330 | |||||||||
Acquisition and related costs | — | 2,743 | 49,932 | |||||||||
Acquisition and related costs - affiliate | — | — | 5,846 | |||||||||
Loss on prepaid warranty - affiliate | — | — | 45,380 | |||||||||
Goodwill impairment | — | 55,874 | — | |||||||||
Impairment of renewable energy facilities | 1,429 | 18,951 | — | |||||||||
Depreciation, accretion and amortization expense | 246,720 | 243,365 | 161,310 | |||||||||
Total operating costs and expenses | 569,748 | 565,579 | 463,992 | |||||||||
Operating income | 40,723 | 88,977 | 5,514 | |||||||||
Other expenses (income): | ||||||||||||
Interest expense, net | 262,003 | 310,336 | 167,805 | |||||||||
Loss on extinguishment of debt, net | 81,099 | 1,079 | 16,156 | |||||||||
Gain on sale of renewable energy facilities | (37,116 | ) | — | — | ||||||||
(Gain) loss on foreign currency exchange, net | (6,061 | ) | 13,021 | 19,488 | ||||||||
Loss on investments and receivables - affiliate | 1,759 | 3,336 | 16,079 | |||||||||
Other (income) expenses, net | (5,017 | ) | 2,218 | 7,362 | ||||||||
Total other expenses, net | 296,667 | 329,990 | 226,890 | |||||||||
Loss before income tax (benefit) expense | (255,944 | ) | (241,013 | ) | (221,376 | ) | ||||||
Income tax (benefit) expense | (23,080 | ) | 494 | (13,241 | ) | |||||||
Net loss | (232,864 | ) | (241,507 | ) | (208,135 | ) | ||||||
Less: Pre-acquisition net income of renewable energy facilities acquired from SunEdison | — | — | 1,610 | |||||||||
Net loss excluding pre-acquisition net income of renewable energy facilities acquired from SunEdison | (232,864 | ) | (241,507 | ) | (209,745 | ) | ||||||
Less: Net income attributable to redeemable non-controlling interests | 10,884 | 18,365 | 8,512 | |||||||||
Less: Net loss attributable to non-controlling interests | (79,559 | ) | (130,025 | ) | (138,371 | ) | ||||||
Net loss attributable to Class A common stockholders | $ | (164,189 | ) | $ | (129,847 | ) | $ | (79,886 | ) | |||
53
Year Ended December 31, 2017 Compared to Year Ended December 31, 2016
Operating Revenues, net
Operating revenues, net for the years ended December 31, 2017 and 2016 were as follows:
Year Ended December 31, | ||||||||||||
(In thousands, other than MW data) | 2017 | 2016 | Change | |||||||||
Energy: | ||||||||||||
Solar | $ | 232,791 | $ | 258,114 | $ | (25,323 | ) | |||||
Wind | 246,838 | 248,617 | (1,779 | ) | ||||||||
Incentives including affiliates: | ||||||||||||
Solar | 104,442 | 119,374 | (14,932 | ) | ||||||||
Wind | 26,400 | 28,451 | (2,051 | ) | ||||||||
Total operating revenues, net | $ | 610,471 | $ | 654,556 | $ | (44,085 | ) | |||||
GWh sold: | ||||||||||||
Solar | 1,895 | 2,225 | (330 | ) | ||||||||
Wind | 5,381 | 5,499 | (118 | ) | ||||||||
Total GWh sold | 7,276 | 7,724 | (448 | ) | ||||||||
Net nameplate capacity (MW): | ||||||||||||
Solar | 1,075 | 1,452 | (377 | ) | ||||||||
Wind | 1,531 | 1,531 | — | |||||||||
Total net nameplate capacity | 2,606 | 2,983 | (377 | ) | ||||||||
Energy revenue for our Solar segment decreased by $25.3 million during the year ended December 31, 2017, compared to the same period in 2016, primarily due to a $16.1 million decrease resulting from the sale of renewable energy facilities in the second quarter of 2017, a $5.7 million decrease due to lower Distributed Generation solar resource and a $7.7 million decrease due to lower Utility solar resource. Energy revenue for our Wind segment decreased by $1.8 million driven by a $13.6 million decrease resulting from lower Utility wind resource that was partially offset by a $6.7 million increase due to higher availability of our fleet and a $4.9 million increase in unrealized gains on commodity contract derivatives.
Incentive revenue for our Solar segment decreased by $14.9 million during the year ended December 31, 2017, compared to the same period in 2016, primarily due to a $19.6 million decrease resulting from the sale of renewable energy facilities in the second quarter of 2017 that was partially offset by a $9.1 million increase resulting from higher contracting of incentives as compared to the prior year. Incentive revenue for our Wind segment decreased by $2.1 million, primarily due to lower contracting of incentives as compared to the prior year.
Costs of Operations
Costs of operations for the years ended December 31, 2017 and 2016 were as follows:
Year Ended December 31, | ||||||||||||
(In thousands) | 2017 | 2016 | Change | |||||||||
Cost of operations: | ||||||||||||
Solar | $ | 54,766 | $ | 27,934 | $ | 26,832 | ||||||
Wind | 95,967 | 85,368 | 10,599 | |||||||||
Cost of operations - affiliate: | ||||||||||||
Solar | 10,542 | 22,851 | (12,309 | ) | ||||||||
Wind | 7,059 | 3,832 | 3,227 | |||||||||
Total cost of operations | $ | 168,334 | $ | 139,985 | $ | 28,349 | ||||||
54
Cost of operations for our Solar and Wind segments increased by $26.8 million and $10.6 million, respectively, during the year ended December 31, 2017, compared to the same period in 2016, primarily resulting from transitioning away from SunEdison for O&M and asset management services. Costs for asset management and O&M services provided by SunEdison are reported as cost of operations - affiliate, which decreased by $12.3 million for our Solar segment and increased by $3.2 million for our Wind segment, compared to the same period in the prior year. The increase in affiliate costs for our Wind segment was driven by higher inventory and repairs and maintenance costs. Total cost of operations, including cost of operations - affiliate, increased $28.3 million, and was driven by a $5.8 million loss on disposals of property and equipment resulting from the replacement of major components at certain of our wind power plants, higher costs for asset management and O&M services provided by unaffiliated third parties and higher costs for project-level accounting services. During 2016, SunEdison provided project-level accounting services to us pursuant to asset management agreements and the costs were recognized as cost of operations - affiliate. Due to the transition away from SunEdison, project accounting was brought in-house during 2017, and we have incurred significantly higher costs for these services due to our reliance on an hourly-based contractor workforce combined with the extraordinary level of effort involved with filing our past due annual and quarterly reports and regaining compliance with NASDAQ listing requirements. We expect the costs for project accounting to normalize during the second half of 2018 as we transition to an employee workforce and remain current in our accounting close procedures and financial reporting requirements.
General and Administrative Expenses
General and administrative expenses for the years ended December 31, 2017 and 2016 were as follows:
Year Ended December 31, | ||||||||||||
(In thousands) | 2017 | 2016 | Change | |||||||||
General and administrative expenses: | ||||||||||||
Solar | $ | 2,973 | $ | 15,353 | $ | (12,380 | ) | |||||
Wind | 2,276 | 2,387 | (111 | ) | ||||||||
Corporate | 134,625 | 72,255 | 62,370 | |||||||||
Total general and administrative expenses | $ | 139,874 | $ | 89,995 | $ | 49,879 | ||||||
General and administrative expenses - affiliate: | ||||||||||||
Corporate | $ | 13,391 | $ | 14,666 | $ | (1,275 | ) | |||||
General and administrative expenses increased by $49.9 million during the year ended December 31, 2017, compared to the same period in 2016, driven by a $62.4 million increase in corporate general and administrative expenses. The increase in corporate general and administrative expenses is primarily due to the incurrence of $27.0 million of success based advisory fees paid upon the consummation of the Merger, a $24.8 million increase in employee compensation costs, and an increase in professional fees for legal, accounting and advisory services resulting from transition to standalone operations and the Merger. The increase in employee compensation was driven by a $9.3 million increase in annual incentive and retention bonuses to retain key employees, a $7.9 million increase in stock-based compensation expense due to the vesting of all previously unvested RSUs triggered by the change in control upon the consummation of the Merger, a $3.7 million increase for severance and transition bonus costs incurred as a result of the Company's restructuring plan subsequent to the Merger and a $3.2 million increase in salaries and benefits costs due to directly hiring and retaining former employees of SunEdison.
General and administrative expenses - affiliate decreased by $1.3 million during the year ended December 31, 2017, compared to the same period in 2016, due to a $7.5 million decrease in the management and administrative services provided by SunEdison subsequent to the SunEdison Bankruptcy, partially offset by a $3.4 million base management fee charge recorded in the fourth quarter pursuant to the Brookfield MSA and a $2.8 million increase in stock-based compensation expense that was allocated to the Company for unvested equity awards held by the Company's employees in the stock of SunEdison, Inc. This increase was largely driven by the recognition of all previously unrecognized compensation cost pertaining to these awards as a result of the bankruptcy court's approval of SunEdison's plan of reorganization in July of 2017, which provided that all unvested equity awards in the stock of SunEdison, Inc. would be canceled.
Goodwill Impairment
The Company performed its annual impairment test of the carrying value of its goodwill as of December 1, 2016 and concluded that the goodwill balance of $55.9 million was fully impaired. The impairment was driven by a combination of factors, including lack of near-term growth in the operating segment. The impairment test determined there was no implied
55
value of goodwill, which resulted in an impairment charge of $55.9 million, which was recognized in goodwill impairment within the consolidated statement of operations for the year ended December 31, 2016. As a result of this charge, the Company did not have any goodwill as of December 31, 2017 or 2016.
Impairment of Renewable Energy Facilities
During 2016, we began exploring a sale of substantially all of our portfolio of residential rooftop solar assets located in the United States through a strategic sales process, and these assets were determined to meet the criteria to be classified as held for sale during the fourth quarter of 2016. Our analysis indicated that the carrying value of the assets exceeded the fair value less costs to sell, and thus an impairment charge of $15.7 million was recognized within impairment of renewable energy facilities in the consolidated statement of operations for the year ended December 31, 2016. We also recorded a $3.3 million charge within impairment of renewable energy facilities for the year ended December 31, 2016 due to the decision to abandon certain residential construction in progress assets that were not completed by SunEdison as a result of the SunEdison Bankruptcy.
We sold our remaining 0.3 MW of residential assets (that were not classified as held for sale as of December 31, 2016) during the third quarter of 2017. These assets did not meet the criteria for held for sale classification in the second quarter of 2017 but we determined that certain impairment indicators were present and as a result recognized an impairment charge of $1.4 million within impairment of renewable energy facilities in its consolidated statement of operations for the year ended December 31, 2017.
Depreciation, Accretion and Amortization Expense
Depreciation, accretion and amortization expense increased by $3.4 million during the year ended December 31, 2017, compared to the same period in 2016. This increase was primarily the result of a change in the estimated useful lives of the major components of our wind power plants, which was effective October 1, 2016, and the impact of capital additions placed in service during 2016. These increases were partially offset by a reduction in depreciation, accretion and amortization expense related to the classification of our U.K. Portfolio as held for sale as of the end of the first quarter of 2016.
Interest Expense, Net
Year Ended December 31, | ||||||||||||
(In thousands) | 2017 | 2016 | Change | |||||||||
Corporate-level | $ | 114,166 | $ | 127,469 | $ | (13,303 | ) | |||||
Non-recourse: | ||||||||||||
Solar | 70,439 | 97,123 | (26,684 | ) | ||||||||
Wind | 77,398 | 85,744 | (8,346 | ) | ||||||||
Total interest expense, net | $ | 262,003 | $ | 310,336 | $ | (48,333 | ) | |||||
Interest expense, net decreased by $48.3 million during the year ended December 31, 2017, compared to the same period in 2016. Interest expense under corporate-level long-term debt agreements decreased $13.3 million primarily due to lower outstanding balances under the Revolver. Interest expense under our non-recourse long-term debt agreements decreased by $26.7 million and $8.3 million for our Solar and Wind segments, respectively. The decrease at our Solar segment is primarily due to the recognition of $21.8 million of additional expense in the prior year as a result of the discontinuation of hedge accounting for the U.K. Portfolio's interest rate swaps in the second quarter of 2016, as well as lower interest expense in 2017 as a result of the sale of the U.K. Portfolio in May of 2017. The decrease at our Wind segment is primarily due to a $9.8 million decrease resulting from a $100.0 million prepayment of a non-recourse portfolio term loan in June 2017 and the repayment of the remaining outstanding principal balance on November 8, 2017.
Loss on Extinguishment of Debt, net
We incurred a net loss on extinguishment of debt of $81.1 million for the year ended December 31, 2017, compared to a loss of $1.1 million during the same period in the prior year. As discussed in Note 11. Long-term Debt to our consolidated financial statements, we issued the New Senior Notes due 2023 and the Senior Notes due 2028 and used the proceeds to redeem in full our existing Senior Notes due 2023. As a result, we recognized a $72.3 million loss on extinguishment of debt during the year ended December 31, 2017, consisting of the $50.7 million make-whole premium and the write-off of $21.6 million of unamortized deferred financing costs and debt discounts for the Senior Notes due 2023 as of the redemption date. On
56
October 17, 2017, we terminated the Revolver and entered into the New Revolver. As a result of this exchange, we recognized a $4.5 million loss on extinguishment of debt due to the write-off of unamortized deferred financing costs for the Revolver as of the termination date. The remaining loss on extinguishment of debt for 2017 was due to other reductions in borrowing capacity for the Revolver during 2017 prior to its termination and prepayments and a final repayment of a non-recourse portfolio term loan prior to the date a change of control would have occurred.
The loss on extinguishment of debt of $1.1 million for the year ended December 31, 2016 was driven by a reduction in borrowing capacity for the Revolver and corresponding write-off of a portion of the unamortized deferred financing costs, due to entering into the consent agreement and ninth amendment to the terms of the Revolver and a waiver agreement with the requisite lenders pertaining to third quarter reporting deliverables and compliance.
Gain on Sale of Renewable Energy Facilities
On May 11, 2017, we announced that Terra Operating LLC completed its previously announced sale of the U.K. Portfolio to Vortex Solar UK Limited, a renewable energy platform managed by the private equity arm of EFG Hermes, an investment bank. We recognized a gain on the sale of $37.1 million within gain on sale of renewable energy facilities in the consolidated statement of operations for the year ended December 31, 2017.
(Gain) Loss on Foreign Currency Exchange, net
We incurred a net gain on foreign currency exchange of $6.1 million for the year ended December 31, 2017 as compared to a net loss on foreign currency exchange of $13.0 million for the year ended December 31, 2016. The net gain for the year ended December 31, 2017 was primarily due to a $7.1 million unrealized gain on the remeasurement of intercompany loans (which were primarily denominated in Canadian dollars as of the end of 2017), offset by $1.0 million of realized and unrealized net losses on foreign currency derivatives. The net loss for the year ended December 31, 2016 was primarily due to a $14.4 million unrealized loss on the remeasurement of intercompany loans (which were primarily denominated in British pounds in 2016), which was offset by $1.3 million of realized and unrealized net gains on foreign currency derivatives.
Loss on Investments and Receivables - Affiliate
We incurred a net loss on investments and receivables - affiliate of $1.8 million due to the write-off of receivables from SunEdison upon the consummation of the Merger and the effectiveness of the Settlement Agreement with SunEdison on October 16, 2017. During the year ended December 31, 2016, we recognized a $3.3 million loss related to recording a bad debt reserve for outstanding receivables from debtors in the SunEdison Bankruptcy.
Other (Income) Expenses, net
We recognized $5.0 million of other income, net for the year ended December 31, 2017 compared to $2.2 million of other expenses, net for the year ended December 31, 2016. We entered into a settlement agreement with insurers of one of our wind power plants with respect to insurance proceeds related to a battery fire that occurred at the wind power plant in 2012. We received $5.3 million of proceeds from this settlement in the fourth quarter of 2017. Other expenses, net for 2016 was primarily due to a $4.2 million loss on investment offset by $2.0 million of other miscellaneous income.
Income Tax (Benefit) Expense
Income tax benefit from continuing operations was $23.1 million for the year ended December 31, 2017, compared to income tax expense of $0.5 million during the same period in 2016. For the year ended December 31, 2017, the overall effective tax rate of 9.0% was different than the statutory rate of 35% primarily due to loss allocated to the recording of a valuation allowance on certain tax benefits attributed to the Company, loss allocated to non-controlling interests, the revaluation of deferred federal and state tax balances and the effect of foreign and state taxes. As of December 31, 2017, most jurisdictions were in a net deferred tax asset position. A valuation allowance is recorded against the deferred tax assets primarily because of the history of losses in those jurisdictions. Additionally, as discussed in Government Incentives and Legislation within Item 1. Business, the Tax Act was enacted on December 22, 2017, which provides that all U.S. corporations will be taxed at a flat rate of 21% for taxable years beginning January 1, 2018. For certain deferred tax assets and deferred tax liabilities, we have recorded a provisional net adjustment that increased the deferred tax benefit by $5.0 million for the year ended December 31, 2017.
57
Net Loss Attributable to Non-Controlling Interests
Net loss attributable to non-controlling interests, including redeemable non-controlling interests, was $68.7 million for the year ended December 31, 2017. This was the result of a $27.5 million loss attributable to SunEdison's interest in Terra LLC's net loss during the period prior to the consummation of the Merger on October 16, 2017, and a $41.2 million loss attributable to project-level tax equity partnerships. Net loss attributable to non-controlling interests, including redeemable non-controlling interests, was $111.7 million for the year ended December 31, 2016. This was the result of a $65.7 million loss attributable to SunEdison's interest in Terra LLC's net income during the year ended December 31, 2016 and a $46.0 million loss attributable to project-level tax equity partnerships.
Year Ended December 31, 2016 Compared to Year Ended December 31, 2015
Operating Revenues, net
Operating revenues, net for the years ended December 31, 2016 and 2015 were as follows:
Year Ended December 31, | ||||||||||||
(In thousands, other than MW data) | 2016 | 2015 | Change | |||||||||
Energy: | ||||||||||||
Solar | $ | 258,114 | $ | 227,843 | $ | 30,271 | ||||||
Wind | 248,617 | 105,361 | 143,256 | |||||||||
Incentives including affiliates: | ||||||||||||
Solar | 119,374 | 118,190 | 1,184 | |||||||||
Wind | 28,451 | 18,112 | 10,339 | |||||||||
Total operating revenues, net | $ | 654,556 | $ | 469,506 | $ | 185,050 | ||||||
GWh sold: | ||||||||||||
Solar | 2,225 | 1,973 | 252 | |||||||||
Wind | 5,499 | 1,489 | 4,010 | |||||||||
Total GWh sold | 7,724 | 3,462 | 4,262 | |||||||||
Net nameplate capacity (MW): | ||||||||||||
Solar | 1,452 | 1,399 | 53 | |||||||||
Wind | 1,532 | 1,532 | — | |||||||||
Total net nameplate capacity¹ | 2,984 | 2,931 | 53 | |||||||||
________
(1) Excludes 36 MW of projects which were under construction as of December 31, 2015.
58
Energy revenues increased by $173.5 million during the year ended December 31, 2016, compared to the same period in 2015, due to:
(In thousands) | Solar | Wind | Total | |||||||||
Acquisitions of renewable energy facilities from SunEdison in 2015 and Q1 2016 | $ | 24,429 | $ | 18,941 | $ | 43,370 | ||||||
Acquisition of Northern Lights in June 2015 | 5,513 | — | 5,513 | |||||||||
Various other third party acquisitions in 2015 | 3,338 | — | 3,338 | |||||||||
Timing of revenue under the MA Operating Massachusetts Virtual Net Metering PPAs | 2,478 | — | 2,478 | |||||||||
Lower revenue in U.K. due to weakening of the GBP partially offset by growth | (1,929 | ) | — | (1,929 | ) | |||||||
Acquisition of Invenergy Wind in December 2015 | — | 157,669 | 157,669 | |||||||||
Acquisition of First Wind in January 2015 | — | 8,885 | 8,885 | |||||||||
Amortization of revenue contracts | (3,036 | ) | (31,879 | ) | (34,915 | ) | ||||||
Unrealized loss on derivatives | — | (10,360 | ) | (10,360 | ) | |||||||
Other | (522 | ) | — | (522 | ) | |||||||
$ | 30,271 | $ | 143,256 | $ | 173,527 | |||||||
Incentive revenue increased by $11.5 million during the year ended December 31, 2016, compared to the same period in 2015, due to:
(In thousands) | Solar | Wind | Total | |||||||||
Acquisitions of renewable energy facilities from SunEdison in 2015 and Q1 2016 | $ | 6,311 | $ | — | $ | 6,311 | ||||||
Primarily timing of contracting SRECs as well as pricing, volume and other differences | (10,920 | ) | 6,777 | (4,143 | ) | |||||||
Lower revenue in U.K. due to weakening of the GBP partially offset by growth | (2,088 | ) | — | (2,088 | ) | |||||||
Acquisition of Invenergy Wind in December 2015 | — | 2,516 | 2,516 | |||||||||
Acquisition of First Wind in January 2015 | 648 | 1,186 | 1,834 | |||||||||
Various other third party acquisitions in 2015 | 3,003 | — | 3,003 | |||||||||
ITC amortization | 5,427 | — | 5,427 | |||||||||
Other | (1,197 | ) | (140 | ) | (1,337 | ) | ||||||
$ | 1,184 | $ | 10,339 | $ | 11,523 | |||||||
Costs of Operations
Costs of operations for the years ended December 31, 2016 and 2015 were as follows:
Year Ended December 31, | ||||||||||||
(In thousands) | 2016 | 2015 | Change | |||||||||
Cost of operations: | ||||||||||||
Solar | $ | 27,934 | $ | 30,007 | $ | (2,073 | ) | |||||
Wind | 85,368 | 40,461 | 44,907 | |||||||||
Cost of operations - affiliate: | ||||||||||||
Solar | 22,851 | 17,943 | 4,908 | |||||||||
Wind | 3,832 | 1,972 | 1,860 | |||||||||
Total cost of operations | $ | 139,985 | $ | 90,383 | $ | 49,602 | ||||||
59
Cost of operations increased by $42.8 million during the year ended December 31, 2016, compared to the same period in 2015, due to:
(In thousands) | Solar | Wind | Total | |||||||||
Increase in cost of operations relating to acquisitions of renewable energy facilities from SunEdison and unaffiliated third parties | $ | 4,075 | $ | 44,907 | $ | 48,982 | ||||||
Existing renewable energy facility cost of operations | (6,148 | ) | — | (6,148 | ) | |||||||
$ | (2,073 | ) | $ | 44,907 | $ | 42,834 | ||||||
Cost of operations - affiliate increased by $6.8 million during the year ended December 31, 2016, compared to the same period in 2015, due to:
(In thousands) | Solar | Wind | Total | |||||||||
Increase in cost of operations - affiliate relating to acquisitions of renewable energy facilities from SunEdison and unaffiliated third parties | $ | 3,491 | $ | 1,860 | $ | 5,351 | ||||||
Existing renewable energy facility cost of operations - affiliate | 1,417 | — | 1,417 | |||||||||
$ | 4,908 | $ | 1,860 | $ | 6,768 | |||||||
General and Administrative Expenses
General and administrative expenses for the years ended December 31, 2016 and 2015 were as follows:
Year Ended December 31, | ||||||||||||
(In thousands) | 2016 | 2015 | Change | |||||||||
General and administrative expenses: | ||||||||||||
Solar | $ | 15,353 | $ | 17,564 | $ | (2,211 | ) | |||||
Wind | 2,387 | 2,019 | 368 | |||||||||
Corporate | 72,255 | 36,228 | 36,027 | |||||||||
Total general and administrative expenses | $ | 89,995 | $ | 55,811 | $ | 34,184 | ||||||
General and administrative expenses - affiliate: | ||||||||||||
Corporate | $ | 14,666 | $ | 55,330 | $ | (40,664 | ) | |||||
General and administrative expenses increased by $34.2 million compared to the year ended December 31, 2015, and general and administrative expenses - affiliate decreased by $40.7 million compared to the year ended December 31, 2015 due to:
(In thousands) | General and administrative expenses | General and administrative expenses - affiliate | ||||||
Higher corporate costs due to professional fees for legal and accounting services as a result of the SunEdison Bankruptcy | $ | 22,770 | $ | — | ||||
Banker and advisory marketing services for the Merger | 8,402 | — | ||||||
Higher corporate costs for employee retention and annual incentive awards | 3,012 | — | ||||||
Decrease in the management and administrative services provided by SunEdison subsequent to the Bankruptcy | — | (40,664 | ) | |||||
Total change | $ | 34,184 | $ | (40,664 | ) | |||
Pursuant to the management services agreement, SunEdison agreed to provide or arrange for other service providers to provide management and administrative services including legal, accounting, tax, treasury, project finance, information technology, insurance, employee benefit costs, communications, human resources and procurement to the Company. Subsequent to the SunEdison Bankruptcy, SunEdison continued to provide some management and administrative services to the Company, including employee compensation and benefit costs, human resources, information technology and communications, but stopped providing (or reimbursing the Company for) other services pursuant to the management services agreement. Pursuant to the Settlement Agreement entered into with SunEdison, and upon the consummation of the Merger with
60
affiliates of Brookfield on October 16, 2017, the management services agreement with SunEdison was rejected without further liability, claims or damages on the part of the Company.
Acquisition and Related Costs
Acquisition and related costs, including amounts related to affiliates, were $2.7 million during the year ended December 31, 2016, compared to $55.8 million during the same period in 2015. The decrease compared to 2015 is primarily due to the acquisition of wind power plants from First Wind Holdings, LLC, which was completed in the first quarter of 2015, the acquisition of Invenergy Wind power plants, which was completed in the fourth quarter of 2015, and the failed acquisition of the Vivint Operating Assets. These fees primarily consist of investment banker advisory fees and professional fees for legal and accounting services related to our acquisitions.
Goodwill Impairment
The Company performed its annual impairment test of the carrying value of its goodwill as of December 1, 2016 and concluded that the goodwill balance of $55.9 million was fully impaired. The impairment was driven by a combination of factors, including lack of near-term growth in the operating segment. The impairment test determined there was no implied value of goodwill, which resulted in an impairment charge of $55.9 million, which was recognized in goodwill impairment within the consolidated statement of operations for the year ended December 31, 2016. There was no goodwill impairment recognized during the year ended December 31, 2015.
Impairment of Renewable Energy Facilities
During 2016, the Company began exploring a sale of substantially all of its portfolio of residential rooftop solar assets located in the United States through a strategic sales process, and these assets were determined to meet the criteria to be classified as held for sale during the fourth quarter of 2016. The Company's analysis indicated that the carrying value of the assets exceeded the fair value less costs to sell, and thus an impairment charge of $15.7 million was recognized within impairment of renewable energy facilities in the consolidated statement of operations for the year ended December 31, 2016. The Company also recorded a $3.3 million charge within impairment of renewable energy facilities for the year ended December 31, 2016 due to the decision to abandon certain residential construction in progress assets that were not completed by SunEdison as a result of the SunEdison Bankruptcy. There was no impairment of renewable energy facilities recognized during the year ended December 31, 2015.
Depreciation, Accretion and Amortization Expense
Depreciation, accretion and amortization expense increased by $82.1 million during the year ended December 31, 2016, compared to the same period in 2015, due to:
(In thousands) | Solar | Wind | Total | |||||||||
Increases in depreciation, accretion and amortization relating to acquisitions of renewable energy facilities from SunEdison and unaffiliated third parties | $ | 16,851 | $ | 83,343 | $ | 100,194 | ||||||
Decrease in depreciation, accretion and amortization related to the U.K. Portfolio assets held for sale classification as of the first quarter of 2016 | (18,139 | ) | — | (18,139 | ) | |||||||
$ | (1,288 | ) | $ | 83,343 | $ | 82,055 | ||||||
Interest Expense, Net
Interest expense, net for the years ended December 31, 2016 and 2015 were as follows:
Year Ended December 31, | ||||||||||||
(In thousands) | 2016 | 2015 | Change | |||||||||
Corporate-level | $ | 127,469 | $ | 89,463 | $ | 38,006 | ||||||
Non-recourse: | ||||||||||||
Solar | 97,123 | 71,351 | 25,772 | |||||||||
Wind | 85,744 | 6,991 | 78,753 | |||||||||
Total interest expense, net | $ | 310,336 | $ | 167,805 | $ | 142,531 | ||||||
61
Interest expense, net increased by $142.5 million during the year ended December 31, 2016, compared to the same period in 2015, due to increased indebtedness resulting from the acquisition of wind power plants and increased corporate-level indebtedness under the Revolver and the issuance of the Senior Notes due 2025. In addition, during the second quarter, the Company discontinued hedge accounting for interest rate swaps that were previously designated as cash flow hedges of the forecasted interest payments pertaining to variable rate project debt in the U.K. Portfolio. This resulted in the reclassification of $16.9 million of losses from accumulated other comprehensive income into interest expense. Subsequent to the discontinuation of hedge accounting, the Company recognized additional unrealized losses of $7.3 million pertaining to these interest rate swaps that are also reported in interest expense. During the year ended December 31, 2015, we reported an inconsequential amount of interest income related to interest rate swap derivatives not designated as hedges within interest expense, net in the consolidated statement of operations.
Loss on Extinguishment of Debt, net
We incurred a net loss on extinguishment of debt of $1.1 million for the year ended December 31, 2016, driven by a reduction in borrowing capacity for the Revolver and corresponding write-off of a portion of the unamortized deferred financing costs, due to the Company entering into the consent agreement and ninth amendment to the terms of the Revolver and a waiver agreement with the requisite lenders pertaining to third quarter reporting deliverables and compliance. The net loss on extinguishment of debt of $16.2 million for the year ended December 31, 2015, was primarily due to the termination of a corporate-level term loan and related interest rate swap, the exchange of the previous revolver to the Revolver, prepayment of premium paid in conjunction with the payoff of First Wind indebtedness at the acquisition date and termination of financing lease obligations upon acquisition of the Duke Operating portfolio.
Loss on Foreign Currency Exchange, net
We incurred a net loss on foreign currency exchange of $13.0 million for the year ended December 31, 2016, primarily due to a $14.4 million unrealized loss on the remeasurement of intercompany loans, which are primarily denominated in British pounds. These remeasurement losses were offset by $1.3 million of realized and unrealized net gains on foreign currency derivatives.
Loss on Investments and Receivables - Affiliate
We incurred a net loss on investments and receivables - affiliate of $3.3 million and $16.1 million during the years ended December 31, 2016 and 2015, respectively. We recognized $3.3 million and $4.8 million loss during 2016 and 2015, respectively, related to recording a bad debt reserve for outstanding receivables from debtors in the SunEdison Bankruptcy. The year ended December 31, 2015, also includes an $11.3 million loss on investment due to residential project cancellations driven by the SunEdison Bankruptcy.
Other expenses, net
Other expenses were $2.2 million for the year ended December 31, 2016. This was primarily due to $4.2 million loss on the investments offset by $2.0 million of other miscellaneous income. Other expenses were $7.4 million for the year ended December 31, 2015. This was primarily due to $4.2 million loss on investments and $3.2 million of other miscellaneous loss.
Income Tax Expense (Benefit)
Income tax expense from continuing operations was $0.5 million for the year ended December 31, 2016, compared to an income tax benefit of $13.2 million during the same period in 2015. For the year ended December 31, 2016, the overall effective tax rate was different than the statutory rate of 35% primarily due to loss allocated to the recording of a valuation allowance on certain tax benefits attributed to the Company, loss allocated to non-controlling interests, the impairment of goodwill at Capital Dynamics, and the effect of state taxes. The benefit in 2015 was primarily driven by the intraperiod allocation rules under ASC 740, as the Company recognized $14.6 million of offsetting income tax expense in other comprehensive loss. As of December 31, 2016, most jurisdictions are in a net deferred tax asset position. A valuation allowance is recorded against the deferred tax assets primarily because of the history of losses in those jurisdictions.
Net Loss Attributable to Non-Controlling Interests
Net loss attributable to non-controlling interests including redeemable non-controlling interests, was $111.7 million for the year ended December 31, 2016. This was primarily the result of a $65.7 million loss attributable to SunEdison's interest in Terra LLC's net income during the year ended December 31, 2016 and a $46.0 million loss attributable to project-level tax
62
equity partnerships. Net loss attributable to non-controlling interests was $129.9 million for the year ended December 31, 2015. This was primarily the result of $51.5 million loss attributable to SunEdison's and R/C US Solar Investment Partnership, L.P's (“Riverstone”) interest in Terra LLC's net income during the year ended December 31, 2015 and a $72.4 million loss attributable to project-level tax equity partnerships.
Liquidity and Capital Resources
Capitalization
A key element to our financing strategy is to raise the majority of our debt in the form of project specific non-recourse borrowings at our subsidiaries with investment grade metrics. Going forward, we intend to primarily finance acquisitions or growth capital expenditures using long-term non-recourse debt that fully amortizes within the asset's contracted life at investment grade metrics, as well as retained cash flows from operations and issuance of equity securities through public markets. Furthermore, we intend to further reduce corporate leverage by adding leverage at the project level and repaying corporate debt with proceeds from the planned project financings.
The following table summarizes the total capitalization and debt to capitalization as of December 31, 2017 and 2016:
As of December 31, | ||||||||
(In thousands) | 2017 | 2016 | ||||||
Revolving Credit Facility1 | $ | 60,000 | $ | 552,000 | ||||
Senior Notes2 | 1,500,000 | 1,250,000 | ||||||
New Term Loan3 | 350,000 | — | ||||||
Non-recourse long-term debt, including current portion4 | 1,732,516 | 2,201,939 | ||||||
Long-term indebtedness, including current portion5 | $ | 3,642,516 | $ | 4,003,939 | ||||
Total stockholders' equity and redeemable non-controlling interests | 2,428,708 | 2,898,366 | ||||||
Total capitalization | $ | 6,071,224 | $ | 6,902,305 | ||||
Debt to total capitalization | 60 | % | 58 | % | ||||
———
(1) | Represents draws on our senior secured corporate revolving credit facility. See the Financing Activities section below for discussion regarding our termination of our existing revolving credit facility and concurrent entry into a new revolving credit facility in the fourth quarter of 2017. |
(2) | Corporate senior notes. See the Financing Activities section below for discussion regarding 2017 activity. |
(3) | Senior secured term loan facility entered into in the fourth quarter of 2017. See the Financing Activities section below for further discussion. |
(4) | Asset-specific, non-recourse borrowings and financing lease obligations secured against the assets of certain project companies. |
(5) | Represents total principal due for long-term debt and financing lease obligations, including the current portion, which excludes $43.7 million and $53.0 million of unamortized debt discounts and deferred financing costs as of December 31, 2017 and 2016, respectively. |
Liquidity Position
We operate with sufficient liquidity to enable us to fund dividends, growth initiatives, capital expenditures and withstand sudden adverse changes in economic circumstances or short-term fluctuations in resource. Principal sources of funding are cash flows from operations, revolving credit facilities (including our Sponsor Line as discussed and defined below), debt capacity at our projects, non-core asset sales and proceeds from the issuance of equity securities through public markets.
63
The following table summarizes corporate liquidity and available capital as of December 31, 2017 and 2016:
As of December 31, | ||||||||
(In thousands) | 2017 | 2016 | ||||||
Unrestricted corporate cash | $ | 46,810 | $ | 478,357 | ||||
Project-level distributable cash | 21,180 | 29,383 | ||||||
Cash available to corporate | 67,990 | 507,740 | ||||||
Credit facilities: | ||||||||
Authorized credit facility1 | 450,000 | 625,000 | ||||||
Draws on credit facility | (60,000 | ) | (552,000 | ) | ||||
Revolving commitments | (102,637 | ) | (68,867 | ) | ||||
Sponsor Line2 | 500,000 | — | ||||||
Available portion of credit facilities | 787,363 | 4,133 | ||||||
Corporate liquidity | $ | 855,353 | $ | 511,873 | ||||
Other project-level unrestricted cash | 60,097 | 57,593 | ||||||
Project-level restricted cash3 | 96,700 | 117,504 | ||||||
Project-level credit commitments | 2,800 | 3,765 | ||||||
Available capital | $ | 1,014,950 | $ | 690,735 | ||||
———
(1) | See the Financing Activities section below for discussion regarding our termination of our existing revolving credit facility and concurrent entry into a new revolving credit facility in the fourth quarter of 2017. The total borrowing capacity under this new facility was increased to $600.0 million on February 6, 2018 as discussed below. On March 6, 2018, we entered into certain Letter of Credit Facilities, pursuant to which we are required to maintain minimum liquidity of $400.0 million under this new revolving credit facility. |
(2) | As discussed in the Financing Activities section below, the Sponsor Line may only be used to fund all or a portion of certain funded acquisitions or growth capital expenditures. |
(3) | Represents short-term and long-term restricted cash and includes $21.7 million of cash trapped at our project-level subsidiaries which is presented as current restricted cash as the cash balances were subject to distribution restrictions related to debt defaults that existed as of the balance sheet date (see Note 2. Summary of Significant Accounting Policies to our consolidated financial statements for additional details). The amount of trapped cash that remains as of the date of the issuance of this Annual Report on Form 10-K is $11.3 million and is not needed for us to meet our cash flow needs. We expect to obtain waivers for the remaining defaults in the near-term and do not expect these defaults to affect our ability to meet our liquidity requirements and meet corporate credit facility covenants. |
Recently Announced Tender Offer
As discussed in Irrevocable Agreement to Launch Tender Offer for the Common Shares of Saeta Yield within Item 1. Business, on February 7, 2018, we announced a voluntary tender offer for 100% of the outstanding shares of Saeta Yield, and we expect this acquisition to close in the second quarter of 2018, subject to certain closing conditions. We intend to finance this acquisition with a $400 million equity issuance of our Class A common stock and the remaining $800 million will be financed from available liquidity, which is expected to include borrowings under the Sponsor Line and the New Revolver. We expect to repay these borrowings with a combination of sources, including new non-recourse financings of our currently unencumbered wind and solar assets and certain cash released from Saeta Yield's assets. We also entered into a support agreement with Brookfield on February 6, 2018 pursuant to which they have agreed to provide a Back-Stop to us for up to 100% of our expected equity offering if the offering price per Class A share of our common stock in the equity offering equals the five-day volume weighted average price of the Class A shares ending the trading day prior to our announcement of the Tender Offer, which was $10.66 per share, subject to certain conditions as discussed in Irrevocable Agreement to Launch Tender Offer for the Common Shares of Saeta Yield within Item 1. Business. On March 6, 2018, we entered into certain Letter of Credit Facilities, pursuant to which two banks posted a bank guarantee with the CNMV for the maximum amount payable in the Tender Offer. Under the terms of the Letter of Credit Facilities, we are required to maintain minimum liquidity requirements of $500.0 million under the Sponsor Line Agreement and $400.0 million under the New Revolver. These minimum liquidity requirements may limit our ability to pursue or fund acquisitions or growth capital expenditures other than an acquisition of Saeta Yield pursuant to the Tender Offer.
64
Financing Activities
New Revolver
On October 17, 2017, Terra Operating LLC entered into a new senior secured revolving credit facility (the “New Revolver”). The New Revolver consists of a revolving credit facility in an initial amount of $450.0 million, available for revolving loans and letters of credit, which Terra Operating LLC subsequently elected to increase to $600.0 million on February 6, 2018. The New Revolver matures on the four-year anniversary of the closing date of such facility and was used to refinance the Company’s existing revolving credit facility ($250.0 million of revolving loans were initially drawn and used to repay a portion of the outstanding borrowings under the existing revolving credit facility) and will be used for other general corporate purposes and working capital requirements of Terra Operating LLC. Subsequent to the initial issuance, an additional $15.0 million of revolving loans were drawn during the fourth quarter of 2017 and $205.0 million of revolving loans were repaid, primarily using $50.0 million of the proceeds from the issuance of the New Term Loan (as defined below) and $150.0 million of the proceeds from the issuance of the New Senior Notes due 2023 and Senior Notes due 2028 (both defined below). The New Revolver is secured equally and ratably with the New Term Loan.
Senior Notes Supplemental Indentures, New Issuances and Redemption
On August 11, 2017, Terra Operating LLC announced the successful completion of a consent solicitation from holders of its Senior Notes due 2023 and its Senior Notes due 2025 to obtain a waiver of the requirement to make an offer to repurchase the respective Senior Notes upon the occurrence of a change of control that would result from the consummation of the Merger. Terra Operating LLC received consents from the holders of a majority of the aggregate principal amount of each series of the Senior Notes outstanding as of the record date and paid a consent fee to each consenting holder of $1.25 per $1,000 principal amount of such series of the Senior Notes for which such holder delivered its consent. Upon the closing of the Merger, Terra Operating LLC also paid a success fee of $1.25 per $1,000 principal amount of each series of the Senior Notes for which such consenting holder delivered its consent.
On December 12, 2017, Terra Operating LLC issued $500.0 million of 4.25% senior notes due 2023 at an offering price of 100% of the principal amount (the “New Senior Notes due 2023”) and $700.0 million of 5.00% senior notes due 2028 at an offering price of 100% of the principal amount (the “Senior Notes due 2028”). Terra Operating LLC used the proceeds to redeem in full its existing Senior Notes due 2023, of which $950.0 million remained outstanding, at a redemption price that included a make-whole premium of $50.7 million, plus accrued and unpaid interest, and to repay $150.0 million of revolving loans outstanding under the New Revolver.
Sponsor Line Agreement
On October 16, 2017, TerraForm Power entered into a credit agreement (the “Sponsor Line Agreement”) with Brookfield and one of its affiliates. The Sponsor Line Agreement establishes a $500.0 million secured revolving credit facility and provides for the lenders to commit to make LIBOR loans to us during a period not to exceed three years from the effective date of the Sponsor Line Agreement (subject to acceleration for certain specified events). The Sponsor Line Agreement may only be used to fund all or a portion of certain funded acquisitions or growth capital expenditures. The Sponsor Line Agreement will terminate, and all obligations thereunder will become payable, no later than October 16, 2022. As of December 31, 2017, there were no amounts drawn under the Sponsor Line Agreement.
New Term Loan
On November 8, 2017, Terra Operating LLC entered into a 5-year $350 million senior secured term loan (the “New Term Loan”), which was used to repay $300.0 million of outstanding borrowings under a non-recourse portfolio term loan prior to the date a change of control default would have occurred and $50.0 million of revolving loans outstanding under the New Revolver. The New Term Loan is secured and guaranteed equally and ratably with the New Revolver.
See Note 11. Long-term Debt to our consolidated financial statements for further discussion of these financing activities.
Debt Service Obligations
We remain focused on refinancing near-term facilities on acceptable terms and maintaining a manageable maturity ladder. We do not anticipate material issues in addressing our borrowings through 2022 on acceptable terms and will do so
65
opportunistically based on the prevailing interest rate environment.
The aggregate contractual payments of long-term debt due after December 31, 2017, including financing lease obligations and excluding amortization of debt discounts, premiums and deferred financing costs, as stated in the financing agreements, are as follows:
(In thousands) | 20181 | 2019 | 2020 | 2021 | 2022 | Thereafter | Total | |||||||||||||||||||||
Maturities of long-term debt and financing lease obligations2 | $ | 162,597 | $ | 110,512 | $ | 105,305 | $ | 108,408 | $ | 596,732 | $ | 2,558,962 | $ | 3,642,516 | ||||||||||||||
—————
(1) | Includes $60.0 million of New Revolver indebtedness, of which we repaid $42.0 million with cash on hand in the first quarter of 2018. |
(2) | Represents the contractual principal payment due dates for our long-term debt and does not reflect the reclassification of $239.7 million of long-term debt to current as a result of debt defaults under certain of our non-recourse financing arrangements (see Note 11. Long-term Debt to our consolidated financial statements for further discussion). |
Cash Dividends to Investors
On October 6, 2017, our Board declared the payment of the Special Dividend to holders of record immediately prior to the effective time of the Merger in the amount of $1.94 per fully diluted share, which included the Company's issued and outstanding Class A shares, Class A shares issued to SunEdison pursuant to the Settlement Agreement and Class A shares underlying outstanding restricted stock units of the Company under the Company’s long-term incentive plan. The Special Dividend was paid on October 17, 2017.
On February 6, 2018, our Board declared a quarterly dividend with respect to our Class A common stock of $0.19 per share. The dividend is payable on March 30, 2018 to shareholders of record as of February 28, 2018. This dividend represents our first dividend payment under Brookfield sponsorship.
Incentive Distribution Rights
IDRs represented the right to receive increasing percentages (15.0%, 25.0% and 50.0%) of Terra LLC’s quarterly distributions after the Class A Units, Class B units, and Class B1 units of Terra LLC (as applicable) received quarterly distributions in an amount equal to $0.2257 per unit and the target distribution levels were achieved. SunEdison held 100% of the IDRs from the completion of the IPO up until the consummation of the Merger. There were no IDR payments made by us during the years ended December 31, 2017, 2016 and 2015.
In connection with the Settlement Agreement, SunEdison transferred all of the outstanding IDRs of Terra LLC held by SunEdison or certain of its affiliates to Brookfield IDR Holder at the effective time of the Merger, and the Company and Brookfield IDR Holder entered into the New Terra LLC Agreement. The New Terra LLC Agreement, among other things, reset the IDR thresholds of Terra LLC to establish a first distribution threshold of $0.93 per share of Class A common stock and a second distribution threshold of $1.05 per share of Class A common stock. As a result of this amendment and restatement, amounts distributed from Terra LLC will be distributed on a quarterly basis as follows:
• | first, to the Company in an amount equal to the Company’s outlays and expenses for such quarter; |
• | second, to holders of Class A units, until an amount has been distributed to such holders of Class A units that would result, after taking account of all taxes payable by the Company in respect of the taxable income attributable to such distribution, in a distribution to holders of shares of Class A common stock of $0.93 per share (subject to adjustment for distributions, combinations or subdivisions of shares of Class A common stock) if such amount were distributed to all holders of shares of Class A common stock; |
• | third, 15% to the holders of the IDRs and 85% to the holders of Class A units until a further amount has been distributed to holders of Class A units in such quarter that would result, after taking account of all taxes payable by the Company in respect of the taxable income attributable to such distribution, in a distribution to holders of shares of Class A common stock of an additional $0.12 per share (subject to adjustment for distributions, combinations or subdivisions of shares of Class A common stock) if such amount were distributed to all holders of shares of Class A common stock; and |
• | thereafter, 75% to holders of Class A units and 25% to holders of the IDRs. |
66
Cash Flow Discussion
We use traditional measures of cash flow, including net cash flows from operating activities, investing activities and financing activities to evaluate our periodic cash flow results.
Year Ended December 31, 2017 Compared to Year Ended December 31, 2016
The following table reflects the changes in cash flows for the comparative periods:
(In thousands) | Year Ended December 31, | |||||||||||
2017 | 2016 | Change | ||||||||||
Net cash provided by operating activities | $ | 67,197 | $ | 191,809 | $ | (124,612 | ) | |||||
Net cash provided by (used in) investing activities | 206,272 | (49,933 | ) | 256,205 | ||||||||
Net cash used in financing activities | (789,513 | ) | (187,194 | ) | (602,319 | ) | ||||||
Net Cash Provided By Operating Activities
Net cash provided by operating activities for the year ended December 31, 2017 was $67.2 million as compared to $191.8 million for the same period in the prior year. The decrease in operating cash flow of $124.6 million was primarily driven by a $51.4 million decrease in operating revenues (excluding unrealized losses on commodity contract derivatives, recognition of deferred revenue and amortization of favorable and unfavorable rate revenue contracts, net) and a $61.1 million increase in operating costs (excluding non-cash items). The decrease in operating revenues was primarily due to a $35.7 million decrease resulting from the sale of renewable energy facilities in the first half of 2017, $13.4 million of lower solar resource and $13.6 million of lower wind resource, partially offset by a $6.7 million increase due to higher availability of our wind fleet. In addition, the timing of sales and collections resulted in a $6.1 million decrease in cash receipts related to accounts receivable. The increase in operating costs (excluding non-cash items) was primarily driven by $27.0 million of success-based advisory fees paid upon the consummation of the Merger, higher employee compensation and retention costs and higher professional fees for legal, accounting and advisory services resulting from the transition to standalone operations and the Merger. The timing of payments related to accounts payable, accrued expenses and other current liabilities resulted in a $41.6 million decrease in operating cash flow primarily due to a $9.75 million payment for the full settlement of claims under the Eastern Maine Electric Cooperative litigation (see Note 19. Commitments and Contingencies to our consolidated financial statements for further details) and a $30.7 million decrease in accrued interest driven by the payment of interest accrued under our Senior Notes due 2023 as of December 31, 2016 on February 1, 2017, with no corresponding accrual as of December 31, 2017 as these Senior Notes were redeemed in full on December 12, 2017. The impact of the decrease in accrued interest for the Senior Notes due 2023 was largely offset by lower interest expense and corresponding cash payments on non-recourse indebtedness as a result of the sale of the U.K. Portfolio in the second quarter, which resulted in a $17.7 million decrease, and a $7.3 million decrease resulting from prepayments and the final repayment in 2017 of the outstanding principal amount under a non-recourse portfolio term loan the Company had.
Net Cash Provided By (Used In) Investing Activities
Net cash provided by investing activities for the year ended December 31, 2017 was $206.3 million, which was primarily due to $183.2 million of net proceeds received from the sale of renewable energy facilities and $15.5 million of proceeds received from a government rebate for certain costs incurred for capital expenditures. Net cash used in investing activities for the year ended December 31, 2016 was $49.9 million, which included $45.9 million of cash paid to third parties for the construction of renewable energy facilities and other capital expenditures and $4.1 million of cash paid for third party acquisitions, net of cash and restricted cash acquired.
Net Cash Used In Financing Activities
Net cash used in financing activities for the year ended December 31, 2017 was $789.5 million, which was primarily driven by the $950.0 million repayment of the Senior Notes due 2023 principal along with the $50.7 million make-whole redemption premium, $492.0 million of net repayments on our corporate-level revolving credit facility borrowings, $569.5 million of principal payments and prepayments on non-recourse long-term debt and the Special Dividend payment of $285.5 million, which was partially offset by $495.0 million of net proceeds from the issuance of the New Senior Notes due 2023, $693.0 million of net proceeds from the issuance of the Senior Notes due 2028 and $344.7 million of net proceeds from the issuance of the New Term Loan. Net cash used in financing activities for the year ended December 31, 2016 was $187.2 million, which was primarily driven by $156.0 million of principal payments on non-recourse long-term debt and $103.0
67
million of repayments on revolving credit facility borrowings, partially offset by $86.7 million of net proceeds from non-recourse financing arrangements.
Year Ended December 31, 2016 Compared to Year Ended December 31, 2015
The following table reflects the changes in cash flows for the comparative periods:
(In thousands) | Year Ended December 31, | |||||||||||
2016 | 2015 | Change | ||||||||||
Net cash provided by operating activities | $ | 191,809 | $ | 124,260 | $ | 67,549 | ||||||
Net cash used in investing activities | (49,933 | ) | (3,114,340 | ) | 3,064,407 | |||||||
Net cash (used in) provided by financing activities | (187,194 | ) | 3,238,505 | (3,425,699 | ) | |||||||
Net Cash Provided By Operating Activities
Net cash provided by operating activities for the year ended December 31, 2016 was $191.8 million, which represents an increase of $67.5 million compared to the prior year. The increase was driven by the growth of our portfolio resulting from acquisitions from SunEdison and unaffiliated third parties, which was partially offset by higher interest paid under long-term indebtedness.
Net Cash Used In Investing Activities
Net cash used in investing activities for the year ended December 31, 2016 was $49.9 million, which includes $45.9 million of cash paid to third parties for the construction of renewable energy facilities and other capital expenditures and $4.1 million of cash paid for third party acquisitions, net of cash and restricted cash acquired. Net cash used in investing activities for the year ended December 31, 2015 was $3.1 billion, which primarily consisted of $647.6 million of cash paid to third parties for the construction of renewable energy facilities and other capital expenditures and $2.4 billion of cash paid to third parties for acquisitions of renewable energy facilities, net of cash and restricted cash acquired.
Net Cash (Used In) Provided By Financing Activities
Net cash used in financing activities for the year ended December 31, 2016 was $187.2 million, which was primarily driven by $156.0 million of principal payments on non-recourse long-term debt and $103.0 million of repayments on revolving credit facility borrowings, partially offset by $86.7 million of net proceeds from non-recourse financing arrangements. Net cash provided by financing activities for the year ended December 31, 2015 was $3.2 billion, which consisted of $921.6 million of net proceeds from the issuance of Class A common stock, $946.0 million of proceeds from the issuance of the Senior Notes due 2023, $300.0 million of proceeds from the issuance of the Senior Notes due 2025, $655.0 million of net proceeds from revolving credit facility borrowings and $1.5 billion of net proceeds from non-recourse financing arrangements, partially offset by a $573.5 million repayment of our term loan, $517.6 million of principal payments on non-recourse long-term debt and dividend payments of $88.7 million.
68
Contractual Obligations and Commercial Commitments
We have a variety of contractual obligations and other commercial commitments that represent prospective cash requirements. The following table summarizes our outstanding contractual obligations and commercial commitments as of December 31, 2017:
Payment due by Period | ||||||||||||||||||||||||||||
Contractual Cash Obligations (in thousands) | 20181 | 2019 | 2020 | 2021 | 2022 | Thereafter | Total | |||||||||||||||||||||
Long-term debt (principal)2 | $ | 152,745 | $ | 91,404 | $ | 96,087 | $ | 99,278 | $ | 591,032 | $ | 2,496,183 | $ | 3,526,729 | ||||||||||||||
Long-term debt (interest)3 | 182,366 | 176,967 | 172,218 | 166,866 | 159,470 | 598,538 | 1,456,425 | |||||||||||||||||||||
Financing lease obligations4 | 9,852 | 19,108 | 9,218 | 9,130 | 5,700 | 62,779 | 115,787 | |||||||||||||||||||||
Operating leases | 14,940 | 14,545 | 14,713 | 14,922 | 15,062 | 248,175 | 322,357 | |||||||||||||||||||||
Purchase obligations5 | 35,289 | 34,092 | 21,669 | 6,633 | 2,128 | 2,259 | 102,070 | |||||||||||||||||||||
Brookfield MSA6 | 9,583 | 12,000 | 15,000 | 15,000 | 15,000 | N/A7 | 66,583 | |||||||||||||||||||||
Total contractual obligations | $ | 404,775 | $ | 348,116 | $ | 328,905 | $ | 311,829 | $ | 788,392 | $ | 3,407,934 | $ | 5,589,951 | ||||||||||||||
———
(1) | Includes $60.0 million of New Revolver indebtedness, of which we repaid $42.0 million with cash on hand in the first quarter of 2018. |
(2) | Represents the contractual principal payment due dates for our long-term debt and does not reflect the reclassification of $200.3 million of long-term debt to current as a result of debt defaults under certain of our non-recourse financing arrangements (see Note 11. Long-term Debt to our consolidated financial statements for further discussion). |
(3) | Includes fixed rate interest and variable rate interest using December 31, 2017 rates. |
(4) | Represents the minimum lease payment due dates for our financing lease obligations and does not reflect the reclassification of $39.4 million of financing lease obligations to current as a result of debt defaults under certain of our non-recourse financing arrangements (see Note 11. Long-term Debt to our consolidated financial statements for further discussion). |
(5) | Consists of contractual payments due for third party operation and maintenance services and asset management services. |
(6) | Represents the fixed component of the base management fee owed pursuant to the master services agreement with Brookfield and certain of its affiliates for the management and administrative services to be provided by Brookfield and certain of its affiliates to the Company. See Note 20. Related Parties to our consolidated financial statements for further discussion. |
(7) | We will be required to pay a base management fee with a fixed component of $3.75 million per quarter for each quarter in 2023 and beyond that Brookfield and certain of its affiliates provide management and administrative services to us. See Note 20. Related Parties to our consolidated financial statements for further discussion. |
Off-Balance Sheet Arrangements
We enter into guarantee arrangements in the normal course of business to facilitate commercial transactions with third parties. See Note 19. Commitments and Contingencies to our consolidated financial statements included in this Annual Report on Form 10-K for additional discussion.
Critical Accounting Policies and Estimates
The preparation of financial statements in conformity with accounting principles generally accepted in the United States requires us to make estimates and assumptions in certain circumstances that affect amounts reported in our consolidated financial statements and related footnotes. In preparing these consolidated financial statements, we have made our best estimates of certain amounts included in the consolidated financial statements. Application of accounting policies and estimates, however, involves the exercise of judgment and use of assumptions as to future uncertainties and, as a result, actual results could differ from these estimates. In arriving at our critical accounting estimates, factors we consider include how accurate the estimate or assumptions have been in the past, how much the estimate or assumptions have changed and how reasonably likely such change may have a material impact. Our critical accounting policies are discussed below.
Business Combinations
The Company accounts for its business combinations by recognizing in the financial statements the identifiable assets acquired, the liabilities assumed, and any non-controlling interests in the acquiree at fair value at the acquisition date. The Company also recognizes and measures the goodwill acquired or a gain from a bargain purchase in the business combination and determines what information to disclose to enable users of an entity's financial statements to evaluate the nature and financial effects of the business combination. In addition, acquisition costs related to business combinations are expensed as
69
incurred. Business combinations is a critical accounting policy as there are significant judgments involved in the allocation of acquisition cost.
When we acquire renewable energy facilities, we allocate the purchase price to (i) the acquired tangible assets and liabilities assumed, primarily consisting of land, plant, and long-term debt, (ii) the identified intangible assets and liabilities, primarily consisting of the value of favorable and unfavorable rate PPAs and REC agreements and the in-place value of market rate PPAs, (iii) non-controlling interests, and (iv) other working capital items based in each case on their fair values in accordance with ASC 805.
We generally engage independent appraisers to assist with the estimates and methodologies used such as a replacement cost approach, or an income approach or excess earnings approach. Factors considered by management in its analysis include considering current market conditions and costs to construct similar facilities. We also consider information obtained about each facility as a result of our pre-acquisition due diligence in estimating the fair value of the tangible and intangible assets and liabilities acquired or assumed. In estimating the fair value, we also establish estimates of energy production, current in-place and market power purchase rates, tax credit arrangements and operating and maintenance costs. A change in any of the assumptions above, which are subjective, could have a significant impact on the results of operations.
The allocation of the purchase price directly affects the following items in our consolidated financial statements:
• | The amount of purchase price allocated to the various tangible and intangible assets, liabilities and non-controlling interests on our balance sheet; |
• | The amounts allocated to the value of favorable and unfavorable rate PPAs and REC agreements are amortized to revenue over the remaining non-cancelable terms of the respective arrangement. The amounts allocated to all other tangible assets and intangibles are amortized to depreciation or amortization expense, with the exception of favorable and unfavorable rate land leases and unfavorable rate O&M contracts which are amortized to cost of operations; and |
• | The period of time over which tangible and intangible assets and liabilities are depreciated or amortized varies, and thus, changes in the amounts allocated to these assets and liabilities will have a direct impact on our results of operations. |
The Company has not completed any material third party acquisitions since the fourth quarter of 2015.
Non-controlling Interests and Hypothetical Liquidation at Book Value (“HLBV”)
Non-controlling interests represent the portion of net assets in consolidated entities that are not owned by the Company and are reported as a component of equity in the consolidated balance sheets. Non-controlling interests in subsidiaries that are redeemable either at the option of the holder or at fixed and determinable prices at certain dates in the future are classified as redeemable non-controlling interests in subsidiaries between liabilities and stockholders' equity in the consolidated balance sheets. Redeemable non-controlling interests that are currently redeemable or redeemable after the passage of time are adjusted to their redemption value as changes occur. The Company applies the guidance in ASC 810-10 along with the SEC guidance in ASC 480-10-S99-3A in the valuation of redeemable non-controlling interests.
The Company has determined the allocation of economics between the controlling party and the third party for non-controlling interests does not correspond to ownership percentages for certain of its consolidated subsidiaries. In order to reflect the substantive profit sharing arrangements, the Company has determined that the appropriate methodology for determining the value of non-controlling interests is a balance sheet approach using the HLBV method. Under the HLBV method, the amounts reported as non-controlling interest on the consolidated balance sheets represent the amounts the third party investors could hypothetically receive at each balance sheet reporting date based on the liquidation provisions of the respective operating partnership agreements. HLBV assumes that the proceeds available for distribution are equivalent to the unadjusted, stand-alone net assets of each respective partnership, as determined under U.S. GAAP. The third party non-controlling interests in the consolidated statements of operations and statements of comprehensive loss are determined based on the difference in the carrying amounts of non-controlling interests on the consolidated balance sheets between reporting dates, adjusted for any capital transactions between the Company and third party investors that occurred during the respective period.
Where, prior to the commencement of operating activities for a respective renewable energy facility, HLBV results in an immediate change in the carrying value of non-controlling interest on the consolidated balance sheet due to the recognition of ITCs or other adjustments as required by the U.S. Internal Revenue Code, the Company defers the recognition of the respective adjustments and recognizes the adjustments in non-controlling interest on the consolidated statement of operations on a straight-line basis over the expected life of the underlying assets giving rise to the respective difference. Similarly, where the Company has acquired a controlling interest in a partnership and there is a resulting difference between the initial fair value
70
of non-controlling interest and the value of non-controlling interest as measured using HLBV, the Company initially records non-controlling interest at fair value and amortizes the resulting difference over the remaining life of the underlying assets.
Impairment of Renewable Energy Facilities and Intangibles
Long-lived assets that are held and used are reviewed for impairment whenever events or changes in circumstances indicate carrying values may not be recoverable. An impairment loss is recognized if the total future estimated undiscounted cash flows expected from an asset are less than its carrying value. An impairment charge is measured as the difference between an asset's carrying amount and fair value. Fair values are determined by a variety of valuation methods, including appraisals, sales prices of similar assets and present value techniques. During the years ended December 31, 2017 and 2016, the Company recognized a $1.4 million and $19.0 million impairment charge, respectively, related to its portfolio of residential rooftop solar assets as reflected within impairment of renewable energy facilities in the consolidated statements of operations (see Note 4. Assets Held for Sale to our consolidated financial statements for further discussion). There were no impairments of renewable energy facilities or intangibles recognized during the year ended December 31, 2015. Impairment of long-lived assets that are held and used is considered a critical accounting policy as there are significant judgments involved in evaluating these potential indicators and events. Critical estimates primarily include long-term power and incentive prices in the post-contract periods.
Recently Issued Accounting Standards
See Note 2. Summary of Significant Accounting Policies to our consolidated financial statements included in this Annual Report on Form 10-K for disclosures concerning recently issued accounting standards. These disclosures are incorporated herein by reference.
Item 7A. Quantitative and Qualitative Disclosures About Market Risk.
We are exposed to several market risks in our normal business activities. Market risk is the potential loss that may result from market changes associated with our business or with an existing or forecasted financial or commodity transaction. The types of market risks we are exposed to are interest rate risk, foreign currency risk and commodity risk. We do not use derivative financial instruments for speculative purposes.
Interest Rate Risk
As of December 31, 2017, the estimated fair value of our debt was $3,702.5 million and the carrying value of our debt was $3,598.8 million. We estimate that a hypothetical 100 bps, or 1%, increase or decrease in market interest rates would have decreased or increased the fair value of our long-term debt by $89.9 million and $99.1 million, respectively.
As of December 31, 2017, our corporate-level debt amount consisted of the New Senior Notes due 2023 (fixed rate), the Senior Notes due 2025 (fixed rate), the Senior Notes due 2028 (fixed rate), the New Revolver (variable rate) and the New Term Loan (variable rate). We have not entered into any interest rate derivatives to swap our variable rate corporate-level debt to a fixed rate, and thus we are exposed to fluctuations in interest rate risk. A hypothetical increase or decrease in interest rates by 1% would have increased or decreased interest expense related to our New Revolver and New Term Loan, which only had outstanding borrowings during the fourth quarter of 2017, by $0.9 million for the year ended December 31, 2017.
As of December 31, 2017, our non-recourse permanent financing debt was at both fixed and variable rates. 60% of the $1,616.7 million balance had a fixed interest rate and the remaining 40% of the balance had a variable interest rate. We have entered into interest rate derivatives to swap a majority of our variable rate non-recourse debt to a fixed rate. Although we intend to use hedging strategies to mitigate our exposure to interest rate fluctuations, we may not hedge all of our interest rate risk and, to the extent we enter into interest rate hedges, our hedges may not necessarily have the same duration as the associated indebtedness. Our exposure to interest rate fluctuations will depend on the amount of indebtedness that bears interest at variable rates, the time at which the interest rate is adjusted, the amount of the adjustment, our ability to prepay or refinance variable rate indebtedness when fixed rate debt matures and needs to be refinanced and hedging strategies we may use to reduce the impact of any increases in rates. We estimate that a hypothetical 100 bps, or 1%, increase or decrease in our variable interest rates pertaining to interest rate swaps not designated as hedges would have increased or decreased our earnings by $0.7 million for the year ended December 31, 2017.
71
Foreign Currency Risk
During the year ended December 31, 2017, we generated operating revenues in the United States (including Puerto Rico), Canada, the United Kingdom and Chile, with our revenues being denominated in U.S. dollars, Canadian dollars and British pounds. The PPAs, operating and maintenance agreements, financing arrangements and other contractual arrangements relating to our current portfolio are denominated in U.S. dollars, Canadian dollars and British pounds.
We use currency forward contracts in certain instances to mitigate the financial market risks of fluctuations in foreign currency exchange rates. We manage our foreign currency exposures through the use of these currency forward contracts to reduce risks arising from the change in fair value of certain assets and liabilities denominated in Canadian dollars. The objective of these practices is to minimize the impact of foreign currency fluctuations on our operating results. We estimate that a hypothetical 100 bps, or 1%, increase or decrease in Canadian dollars would have increased or decreased our earnings by $0.1 million for the year ended December 31, 2017.
Commodity Risk
For certain of our wind power plants, we use long-term cash settled swap agreements to economically hedge commodity price variability inherent in wind electricity sales arrangements. If we sell electricity generated by our wind power plants to an independent system operator market and there is no PPA available, then we may enter into a commodity swap to hedge all or a portion of the estimated revenue stream. These price swap agreements require periodic settlements, in which we receive a fixed-price based on specified quantities of electricity and we pay the counterparty a variable market price based on the same specified quantity of electricity. We estimate that a hypothetical 1,000 bps, or 10%, increase or decrease in electricity sales prices pertaining to commodity swaps not designated as hedges would have decreased or increased our earnings by $2.9 million for the year ended December 31, 2017.
Counterparty Credit Risk
Credit risk relates to the risk of loss resulting from non-performance or non-payment by offtake counterparties under the terms of their contractual obligations, thereby impacting the amount and timing of expected cash flows. We monitor and manage credit risk through credit policies that include a credit approval process and the use of credit mitigation measures such as having a diversified portfolio of creditworthy offtake counterparties. As of December 31, 2017, on a weighted average basis (based on MW), our PPA counterparties had an investment grade credit rating. However, there are a limited number of offtake counterparties under offtake agreements in each region that we operate, and this concentration may impact the overall exposure to credit risk, either positively or negatively, in that the offtake counterparties may be similarly affected by changes in economic, industry or other conditions.
Item 8. Financial Statements and Supplementary Data.
The financial statements and schedules are listed in Part IV, Item 15. Exhibits, Financial Statement Schedules of this Annual report on Form 10-K and are incorporated by reference herein. Our selected quarterly financial data for each of the quarterly periods ended March 31, June 30, September 30 and December 31 in 2017 and 2016 are included in Note 23. Quarterly Financial Information (Unaudited) to our consolidated financial statements in this Annual report on Form 10-K.
Item 9. Changes in and Disagreements With Accountants on Accounting and Financial Disclosure.
None.
Item 9A. Controls and Procedures.
We carried out an evaluation as of December 31, 2017, under the supervision and with the participation of our management, including our Chief Executive Officer and Chief Financial Officer, of the effectiveness of the design and operation of our disclosure controls and procedures, as defined in Rules 13a-15(e) and 15d-15(e) under the Securities Exchange Act of 1934, as amended. Based upon that evaluation, our Chief Executive Officer and Chief Financial Officer have concluded that our disclosure controls and procedures were not effective as of December 31, 2017, based on the material weaknesses discussed below in Management’s Report on Internal Control over Financial Reporting. These material weaknesses originated in prior years when SunEdison provided the systems and personnel for our financial reporting and control processes (such as information technology, enterprise resource management and accounting systems) under the management services agreement. Subsequent to the SunEdison Bankruptcy, the focus was on establishing an independent company and corresponding financial
72
and reporting processes. By doing so, we have removed our reliance on SunEdison personnel, financial systems and applications. The timing of this key business priority has delayed the Company in remediating the prior year’s material weaknesses and in having an effective control environment.
Notwithstanding such material weakness in internal control over financial reporting, our management concluded that our consolidated financial statements in this Annual Report on Form 10-K present fairly, in all material respects, the Company’s financial position, results of operations and cash flows as of the dates, and for the periods presented, in conformity with U.S. generally accepted accounting principles (“GAAP”).
Management’s Report on Internal Control over Financial Reporting
Our management is responsible for establishing and maintaining adequate internal control over financial reporting as defined in Rules 13a-15(f) and 15d-15(f) under the Securities Exchange Act of 1934. Our internal control over financial reporting is designed to provide reasonable assurance regarding the reliability of financial reporting and the preparation of financial statements for external purposes in accordance with GAAP and includes those policies and procedures that (1) pertain to the maintenance of records that, in reasonable detail, accurately and fairly reflect the transactions and dispositions of the assets of the Company; (2) provide reasonable assurance that transactions are recorded as necessary to permit preparation of financial statements in accordance with GAAP, and that receipts and expenditures of the Company are being made only in accordance with authorizations of management and directors of the Company; and (3) provide reasonable assurance regarding prevention or timely detection of unauthorized acquisition, use, or disposition of the Company’s assets that could have a material effect on the financial statements.
As of December 31, 2017, under the oversight of the principal executive and principal financial officers, and Board of Directors, management conducted an assessment of the effectiveness of our internal control over financial reporting based upon the framework issued by the Committee of Sponsoring Organizations of the Treadway Commission in Internal Control - Integrated Framework (2013) (“COSO 2013 Framework”). Based on management’s assessment using these criteria, they concluded that, as of December 31, 2017, there were material weaknesses in our internal control over financial reporting as further described below.
A material weakness is a deficiency or a combination of deficiencies in internal control over financial reporting, such that there is a reasonable possibility that a material misstatement in our annual or interim financial statements will not be prevented or detected on a timely basis. As of December 31, 2017, we identified the following material weaknesses:
The Company did not maintain an effective control environment, and did not conduct an effective continuous risk assessment, information and communication process, and monitoring activities based on the following:
• | The Company did not have sufficient resources, including contractors, in place throughout the reporting period with the appropriate training and knowledge of internal controls over financial reporting in order to establish the Company’s financial reporting processes and information technology (“IT”) systems and to design, implement and operate an effective system of internal control over financial reporting. |
• | The Company did not conduct continuous risk assessment and monitoring activities over financial reporting and IT systems to identify and analyze risks of financial misstatement due to error and/or fraud and to identify and assess necessary changes in GAAP and financial reporting processes and internal controls impacted by changes in the business, information systems, and transition of key personnel. |
• | The Company did not have an effective information and communication process that ensured appropriate and accurate information was available to financial reporting personnel on a timely basis in order that they could fulfill their roles and responsibilities. |
Accordingly, the Company did not establish appropriate control activities through policies and procedures to mitigate risk to the achievement of the Company’s financial reporting objectives, as follows:
• | The Company did not have effective IT general controls over all operating systems, databases, and IT applications supporting financial reporting. Process-level automated controls and manual controls that were dependent upon the information derived from IT systems were also determined to be ineffective. Additionally, the Company did not have effective end-user computing controls over spreadsheets used in financial reporting. |
• | The Company did not have effective controls over the completeness, existence, and accuracy of revenues and deferred revenue and the completeness, existence, accuracy and valuation of accounts receivable. |
73
• | The Company did not have effective reconciliation controls over the completeness, existence and accuracy of certain balance sheet accounts. Specifically, the reconciliation controls did not always operate timely and did not adequately investigate, resolve and correct reconciling items on a timely basis. |
• | The Company did not have effective controls over the completeness, existence and accuracy of accounts payable, accrued expenses, and expenses. Specifically, the Company did not establish an effective accounts payable voucher and disbursement process and related internal controls in order to review and approve and accurately record expenditures on a timely basis. |
• | The Company did not have effective controls over the completeness, existence and accuracy of renewable energy facilities, accumulated depreciation and depreciation, accretion and amortization expense. |
• | The Company did not have effective process level and management review controls over the application of GAAP and accounting measurements related to certain significant accounts and non-routine transactions. |
• | The Company did not have effective process-level and management review controls over manual financial reporting processes. Specifically, the Company did not have effective controls over the completeness and accuracy of information used in manual spreadsheets and the accuracy of those spreadsheet formulas. |
These control deficiencies resulted in several material and immaterial misstatements to the preliminary consolidated financial statements that were corrected prior to the issuance of the consolidated financial statements. These control deficiencies create a reasonable possibility that a material misstatement to the consolidated financial statements will not be prevented or detected on a timely basis, and therefore we concluded that the deficiencies represent material weaknesses in the Company’s internal control over financial reporting and our internal control over financial reporting was not effective as of December 31, 2017.
Our independent registered public accounting firm, KPMG, LLP, who audited the consolidated financial statements included in this Annual Report, has expressed an adverse report on the operating effectiveness of the Company's internal control over financial reporting. KPMG LLP's report appears on page 78 of this Annual Report on Form 10-K.
Remediation Plan
We continue to strengthen our internal control over financial reporting. We are committed to ensuring that such controls are designed and operating effectively. With the closing of the Merger and Sponsorship Transaction with Brookfield on October 16, 2017, our Board of Directors and management have prioritized developing and implementing a remediation plan, taking the necessary actions to address the root causes that contributed to the material weaknesses identified and establishing and maintaining effective internal controls over financial reporting. Subsequent to the transaction with Brookfield, our Board implemented several actions, including revising our Board, Committee, and Internal Audit Charters, which enabled it to demonstrate that the effective oversight over financial reporting processes and internal controls is being properly exercised. A dedicated executive management team, consisting of experienced Brookfield executives was appointed and is playing an active role in oversight of the business and monitoring of the Company's internal control over financial reporting. Further, we implemented an effective annual process to ensure that all employees, as well as members of the Board, and outsourced service providers confirm their compliance with the Company’s Code of Business Conduct. We also implemented a whistleblower hotline which is available throughout the organization and through an external website. Information regarding the whistleblower hotline has been communicated to all employees. The Company has increased its communication and training to all employees and the Board regarding the Company’s ethical values and the requirement to comply with laws, rules, regulations, and the Company’s policies, including our Code of Conduct and Ethics. By taking these critical steps, two of the material weaknesses that existed as of December 31, 2016 were remediated in 2017. Furthermore, we remain focused on continuing to implement process and control improvements such as the following:
• | We have revised our organization structure and commenced hiring dedicated key employees, including senior management, with assigned responsibility and accountability for financial reporting processes and internal controls. Further, we will continue to provide ongoing GAAP and internal controls training for all the employees. |
• | We are implementing an annual financial control risk assessment process as well as a regularly recurring fraud risk assessment process focused on identifying and analyzing risks of financial misstatement due to error and/or fraud, including management override of controls. |
• | A senior internal audit resource was hired, and the internal audit function is being strengthened through increased interaction and engagement with the Brookfield internal audit team. A company-wide risk assessment has been completed and a risk-based internal audit plan is being developed that is responsive to the risks that were identified in the company-wide risk assessment. This risk-based internal audit plan will assist in monitoring the Company’s |
74
adherence to its policies and procedures including policies and procedures related to any areas of concern or emphasis that the Board identifies as part of its oversight. We are also enhancing the business process documentation and management's self-assessment and testing for internal controls.
• | We are enhancing the information and communication processes to ensure the organization communicates information internally in a timely manner, including information regarding objectives, responsibilities and the functioning of internal controls over financial reporting. These enhancements include more rigorous analysis of the Company’s financial results versus its budgets and operating plans, more frequent discussion of significant business transactions and the impact of these transactions on the Company’s financial reporting, and improving communication to employees regarding their responsibilities for ensuring that effective internal controls are maintained. |
• | We have established an information technology and other critical systems infrastructure, and are enhancing the information technology control framework to support all business applications and infrastructure. Remediation activities will formalize information technology processes to support larger IT initiatives that will address functionality limitations of current systems. |
• | We are developing a more efficient and effective financial close and reporting process through the implementation of a cloud-based SaaS accounting system. We intend to continually review this system for further enhancements and improvements. |
• | Management is developing procedures and controls to obtain reliance on revenue systems and validating energy data used for revenue recognition. |
• | We have implemented a cloud-based application to automate and standardize the account reconciliation process. We are validating controls over this application to ensure completeness, existence and accuracy of account balances on a timely basis. |
• | We are developing policies and procedures for treatment and recognition of changes to renewable energy facilities account balances. This includes developing process level and review controls over accumulated depreciation and depreciation, accretion and amortization expense. |
• | We are enhancing the management review controls over the application of GAAP and accounting measurements for significant accounts and transactions by adding resources with the required skills and assigned responsibility and accountability for performing an effective review. |
• | Management review controls are being reassessed to provide the appropriate level of precision required to mitigate the potential for a material misstatement. In addition, we are enhancing the design and implementation of and supporting documentation over management review controls to make clear: (i) management’s expectations related to transactions that are subject to such controls; (ii) the level of precision and criteria used for investigation; and (iii) evidence that all outliers or exceptions that should have been identified are investigated and resolved. Lastly, management is reassessing and enhancing the controls over the utilization of manual spreadsheets and system generated reports. |
We expect the implementation of our remediation plan will result in significant improvements to the overall internal control environment over financial reporting.
Changes in Internal Control over Financial Reporting
Other than changes described under Remediation Plan above, there have been no changes in the Company’s internal control over financial reporting (as defined in Rules 13a-15(f) and 15d-15(f) of the Securities Exchange Act of 1934, as amended) during the quarter ended December 31, 2017 that have materially affected, or are reasonably likely to materially affect the Company’s internal control over financial reporting.
Item 9B. Other Information.
None.
75
PART III
Certain information required by Part III is omitted from this Form 10-K because the registrant will file with the U.S. Securities and Exchange Commission a definitive proxy statement pursuant to Regulation 14A in connection with the solicitation of proxies for the Company's Annual Meeting of Stockholders, or the 2018 Proxy Statement, within 120 days after the end of the fiscal year covered by this Form 10-K, and certain information included therein is incorporated herein by reference.
Item 10. Directors, Executive Officers and Corporate Governance.
The information required under this Item 10 is incorporated by reference to our 2018 Proxy Statement.
Item 11. Executive Compensation.
The information required under this Item 11 is incorporated by reference to our 2018 Proxy Statement.
Item 12. Security Ownership of Certain Beneficial Owners and Management and Related Stockholder Matters.
The information required under this Item 12 is incorporated by reference to our 2018 Proxy Statement.
Item 13. Certain Relationships and Related Transactions, and Director Independence.
The information required under this Item 13 is incorporated by reference to our 2018 Proxy Statement.
Item 14. Principal Accounting Fees and Services.
The information required under this Item 14 is incorporated by reference to our 2018 Proxy Statement.
76
PART IV
Item 15. Exhibits, Financial Statement Schedules.
(a) The following documents are filed as a part of this report.
(1) Financial Statements:
Page | ||
(2) Financial Statement Schedules:
The information required to be submitted in the Financial Statement Schedules for TerraForm Power, Inc. has either been shown in the financial statements or notes, or is not applicable or required under Regulation S-X; therefore, those schedules have been omitted.
(3) Exhibits:
See Exhibit Index submitted as a separate section of this Annual Report on Form 10-K.
77
Report of Independent Registered Public Accounting Firm
To the Stockholders and Board of Directors
TerraForm Power, Inc.:
Opinion on Internal Control Over Financial Reporting
We have audited TerraForm Power, Inc. and subsidiaries’ (the Company) internal control over financial reporting as of December 31, 2017, based on criteria established in Internal Control - Integrated Framework (2013) issued by the Committee of Sponsoring Organizations of the Treadway Commission. In our opinion, because of the effect of the material weaknesses, described below, on the achievement of the objectives of the control criteria, the Company has not maintained effective internal control over financial reporting as of December 31, 2017, based on criteria established in Internal Control - Integrated Framework (2013) issued by the Committee of Sponsoring Organizations of the Treadway Commission.
We also have audited, in accordance with the standards of the Public Company Accounting Oversight Board (United States) (PCAOB), the consolidated balance sheets of the Company as of December 31, 2017 and 2016, the related consolidated statements of operations, comprehensive loss, stockholders’ equity, and cash flows for each of the years in the three-year period ended December 31, 2017, and the related notes (collectively, the consolidated financial statements), and our report dated March 7, 2018 expressed an unqualified opinion on those consolidated financial statements.
A material weakness is a deficiency, or a combination of deficiencies, in internal control over financial reporting, such that there is a reasonable possibility that a material misstatement of the company’s annual or interim financial statements will not be prevented or detected on a timely basis. The following material weaknesses have been identified and included in management’s assessment:
• | The Company did not have sufficient resources, including contractors, in place throughout the reporting period with the appropriate training and knowledge of internal controls over financial reporting in order to establish the Company’s financial reporting processes and information technology (IT) systems and to design, implement and operate an effective system of internal control over financial reporting. |
• | The Company did not conduct continuous risk assessment and monitoring activities over financial reporting and IT systems to identify and analyze risks of financial misstatement due to error and/or fraud and to identify and assess necessary changes in generally accepted accounting principles (GAAP) and financial reporting processes and internal controls impacted by changes in the business, information systems, and transition of key personnel. |
• | The Company did not have an effective information and communication process that ensured appropriate and accurate information was available to financial reporting personnel on a timely basis in order that they could fulfill their roles and responsibilities. |
• | The Company did not have effective IT general controls over all operating systems, databases, and IT applications supporting financial reporting. Process-level automated controls and manual controls that were dependent upon the information derived from IT systems were also determined to be ineffective. Additionally, the Company did not have effective end-user computing controls over spreadsheets used in financial reporting. |
• | The Company did not have effective controls over the completeness, existence, and accuracy of revenues and deferred revenue and the completeness, existence, accuracy and valuation of accounts receivable. |
• | The Company did not have effective reconciliation controls over the completeness, existence and accuracy of certain balance sheet accounts. Specifically, the reconciliation controls did not always operate timely and did not adequately investigate, resolve and correct reconciling items on a timely basis. |
• | The Company did not have effective controls over the completeness, existence and accuracy of accounts payable, accrued expenses, and expenses. Specifically, the Company did not establish an effective accounts payable voucher and disbursement process and related internal controls in order to review and approve and accurately record expenditures on a timely basis. |
• | The Company did not have effective controls over the completeness, existence and accuracy of renewable energy facilities, accumulated depreciation and depreciation, accretion and amortization expense. |
• | The Company did not have effective process level and management review controls over the application of GAAP and accounting measurements related to certain significant accounts and non-routine transactions. |
• | The Company did not have effective process-level and management review controls over manual financial reporting |
78
processes. Specifically, the Company did not have effective controls over the completeness and accuracy of information used in manual spreadsheets and the accuracy of those spreadsheet formulas.
The material weaknesses were considered in determining the nature, timing, and extent of audit tests applied in our audit of the 2017 consolidated financial statements, and this report does not affect our report on those consolidated financial statements.
Basis for Opinion
The Company’s management is responsible for maintaining effective internal control over financial reporting and for its assessment of the effectiveness of internal control over financial reporting, included in the accompanying Management’s Report on Internal Control over Financial Reporting. Our responsibility is to express an opinion on the Company’s internal control over financial reporting based on our audit. We are a public accounting firm registered with the PCAOB and are required to be independent with respect to the Company in accordance with the U.S. federal securities laws and the applicable rules and regulations of the Securities and Exchange Commission and the PCAOB.
We conducted our audit in accordance with the standards of the PCAOB. Those standards require that we plan and perform the audit to obtain reasonable assurance about whether effective internal control over financial reporting was maintained in all material respects. Our audit of internal control over financial reporting included obtaining an understanding of internal control over financial reporting, assessing the risk that a material weakness exists, and testing and evaluating the design and operating effectiveness of internal control based on the assessed risk. Our audit also included performing such other procedures as we considered necessary in the circumstances. We believe that our audit provides a reasonable basis for our opinion.
Definition and Limitations of Internal Control Over Financial Reporting
A company’s internal control over financial reporting is a process designed to provide reasonable assurance regarding the reliability of financial reporting and the preparation of financial statements for external purposes in accordance with generally accepted accounting principles. A company’s internal control over financial reporting includes those policies and procedures that (1) pertain to the maintenance of records that, in reasonable detail, accurately and fairly reflect the transactions and dispositions of the assets of the company; (2) provide reasonable assurance that transactions are recorded as necessary to permit preparation of financial statements in accordance with generally accepted accounting principles, and that receipts and expenditures of the company are being made only in accordance with authorizations of management and directors of the company; and (3) provide reasonable assurance regarding prevention or timely detection of unauthorized acquisition, use, or disposition of the company’s assets that could have a material effect on the financial statements.
Because of its inherent limitations, internal control over financial reporting may not prevent or detect misstatements. Also, projections of any evaluation of effectiveness to future periods are subject to the risk that controls may become inadequate because of changes in conditions, or that the degree of compliance with the policies or procedures may deteriorate.
/s/ KPMG LLP
McLean, Virginia
March 7, 2018
79
Report of Independent Registered Public Accounting Firm
To the Stockholders and Board of Directors
TerraForm Power, Inc.:
Opinion on the Consolidated Financial Statements
We have audited the accompanying consolidated balance sheets of TerraForm Power, Inc. and subsidiaries (the Company) as of December 31, 2017 and 2016, the related consolidated statements of operations, comprehensive loss, stockholders’ equity, and cash flows for each of the years in the three‑year period ended December 31, 2017, and the related notes (collectively, the consolidated financial statements). In our opinion, the consolidated financial statements present fairly, in all material respects, the financial position of the Company as of December 31, 2017 and 2016, and the results of its operations and its cash flows for each of the years in the three‑year period ended December 31, 2017, in conformity with U.S. generally accepted accounting principles.
We also have audited, in accordance with the standards of the Public Company Accounting Oversight Board (United States) (PCAOB), the Company’s internal control over financial reporting as of December 31, 2017, based on criteria established in Internal Control - Integrated Framework (2013) issued by the Committee of Sponsoring Organizations of the Treadway Commission, and our report dated March 7, 2018 expressed an adverse opinion on the effectiveness of the Company’s internal control over financial reporting.
Basis for Opinion
These consolidated financial statements are the responsibility of the Company’s management. Our responsibility is to express an opinion on these consolidated financial statements based on our audits. We are a public accounting firm registered with the PCAOB and are required to be independent with respect to the Company in accordance with the U.S. federal securities laws and the applicable rules and regulations of the Securities and Exchange Commission and the PCAOB.
We conducted our audits in accordance with the standards of the PCAOB. Those standards require that we plan and perform the audit to obtain reasonable assurance about whether the consolidated financial statements are free of material misstatement, whether due to error or fraud. Our audits included performing procedures to assess the risks of material misstatement of the consolidated financial statements, whether due to error or fraud, and performing procedures that respond to those risks. Such procedures included examining, on a test basis, evidence regarding the amounts and disclosures in the consolidated financial statements. Our audits also included evaluating the accounting principles used and significant estimates made by management, as well as evaluating the overall presentation of the consolidated financial statements. We believe that our audits provide a reasonable basis for our opinion.
/s/ KPMG LLP
We have served as the Company’s auditor since 2014.
McLean, Virginia
March 7, 2018
80
TERRAFORM POWER, INC. AND SUBSIDIARIES
CONSOLIDATED STATEMENTS OF OPERATIONS
(In thousands, except per share data)
Year Ended December 31, | |||||||||||
2017 | 2016 | 2015 | |||||||||
Operating revenues, net | $ | 610,471 | $ | 654,556 | $ | 469,506 | |||||
Operating costs and expenses: | |||||||||||
Cost of operations | 150,733 | 113,302 | 70,468 | ||||||||
Cost of operations - affiliate | 17,601 | 26,683 | 19,915 | ||||||||
General and administrative expenses | 139,874 | 89,995 | 55,811 | ||||||||
General and administrative expenses - affiliate | 13,391 | 14,666 | 55,330 | ||||||||
Acquisition and related costs | — | 2,743 | 49,932 | ||||||||
Acquisition and related costs - affiliate | — | — | 5,846 | ||||||||
Loss on prepaid warranty - affiliate | — | — | 45,380 | ||||||||
Goodwill impairment | — | 55,874 | — | ||||||||
Impairment of renewable energy facilities | 1,429 | 18,951 | — | ||||||||
Depreciation, accretion and amortization expense | 246,720 | 243,365 | 161,310 | ||||||||
Total operating costs and expenses | 569,748 | 565,579 | 463,992 | ||||||||
Operating income | 40,723 | 88,977 | 5,514 | ||||||||
Other expenses (income): | |||||||||||
Interest expense, net | 262,003 | 310,336 | 167,805 | ||||||||
Loss on extinguishment of debt, net | 81,099 | 1,079 | 16,156 | ||||||||
Gain on sale of renewable energy facilities | (37,116 | ) | — | — | |||||||
(Gain) loss on foreign currency exchange, net | (6,061 | ) | 13,021 | 19,488 | |||||||
Loss on investments and receivables - affiliate | 1,759 | 3,336 | 16,079 | ||||||||
Other (income) expenses, net | (5,017 | ) | 2,218 | 7,362 | |||||||
Total other expenses, net | 296,667 | 329,990 | 226,890 | ||||||||
Loss before income tax (benefit) expense | (255,944 | ) | (241,013 | ) | (221,376 | ) | |||||
Income tax (benefit) expense | (23,080 | ) | 494 | (13,241 | ) | ||||||
Net loss | (232,864 | ) | (241,507 | ) | (208,135 | ) | |||||
Less: Pre-acquisition net income of renewable energy facilities acquired from SunEdison | — | — | 1,610 | ||||||||
Net loss excluding pre-acquisition net income of renewable energy facilities acquired from SunEdison | (232,864 | ) | (241,507 | ) | (209,745 | ) | |||||
Less: Net income attributable to redeemable non-controlling interests | 10,884 | 18,365 | 8,512 | ||||||||
Less: Net loss attributable to non-controlling interests | (79,559 | ) | (130,025 | ) | (138,371 | ) | |||||
Net loss attributable to Class A common stockholders | $ | (164,189 | ) | $ | (129,847 | ) | $ | (79,886 | ) | ||
Weighted average number of shares: | |||||||||||
Class A common stock - Basic and diluted | 103,866 | 90,815 | 65,883 | ||||||||
Loss per share: | |||||||||||
Class A common stock - Basic and diluted | $ | (1.65 | ) | $ | (1.47 | ) | $ | (1.25 | ) | ||
See accompanying notes to consolidated financial statements.
81
TERRAFORM POWER, INC. AND SUBSIDIARIES
CONSOLIDATED STATEMENTS OF COMPREHENSIVE LOSS
(In thousands)
Year Ended December 31, | |||||||||||
2017 | 2016 | 2015 | |||||||||
Net loss | $ | (232,864 | ) | $ | (241,507 | ) | $ | (208,135 | ) | ||
Other comprehensive income, net of tax: | |||||||||||
Foreign currency translation adjustments: | |||||||||||
Net unrealized gain (loss) arising during the period | 10,300 | (15,039 | ) | (18,446 | ) | ||||||
Reclassification of net realized loss into earnings1 | 14,741 | — | — | ||||||||
Hedging activities: | |||||||||||
Net unrealized gain (loss) arising during the period | 17,612 | (86 | ) | 26,913 | |||||||
Reclassification of net realized (gain) loss into earnings2 | (2,247 | ) | 15,967 | 4,663 | |||||||
Other comprehensive income, net of tax | 40,406 | 842 | 13,130 | ||||||||
Total comprehensive loss | (192,458 | ) | (240,665 | ) | (195,005 | ) | |||||
Less: Pre-acquisition net income of renewable energy facilities acquired from SunEdison | — | — | 1,610 | ||||||||
Less: Pre-acquisition other comprehensive income of renewable energy facilities acquired from SunEdison | — | — | 40,016 | ||||||||
Comprehensive loss excluding pre-acquisition comprehensive income of renewable energy facilities acquired from SunEdison | (192,458 | ) | (240,665 | ) | (236,631 | ) | |||||
Less comprehensive income (loss) attributable to non-controlling interests: | |||||||||||
Net income attributable to redeemable non-controlling interests | 10,884 | 18,365 | 8,512 | ||||||||
Net loss attributable to non-controlling interests | (79,559 | ) | (130,025 | ) | (138,371 | ) | |||||
Foreign currency translation adjustments | 8,665 | (4,639 | ) | (7,862 | ) | ||||||
Hedging activities | 5,992 | 5,469 | (3,545 | ) | |||||||
Comprehensive loss attributable to non-controlling interests | (54,018 | ) | (110,830 | ) | (141,266 | ) | |||||
Comprehensive loss attributable to Class A common stockholders | $ | (138,440 | ) | $ | (129,835 | ) | $ | (95,365 | ) | ||
———
(1) | Represents reclassification of the accumulated foreign currency translation loss for substantially all of the Company's portfolio of solar power plants located in the United Kingdom, as the Company's sale of these facilities closed in the second quarter of 2017 as discussed in Note 4. Assets Held for Sale. The pre-tax amount of $23.6 million was recognized within gain on sale of renewable energy facilities in the consolidated statement of operations for the year ended December 31, 2017. |
(2) | Includes $16.9 million loss reclassification for the year ended December 31, 2016 that occurred subsequent to the Company's discontinuation of hedge accounting for interest rate swaps pertaining to variable rate non-recourse debt for substantially all of the Company's portfolio of solar power plants located in the United Kingdom as discussed in Note 13. Derivatives. As discussed above, the Company's sale of these facilities closed in the second quarter of 2017. |
See accompanying notes to consolidated financial statements.
82
TERRAFORM POWER, INC. AND SUBSIDIARIES
CONSOLIDATED BALANCE SHEETS
(In thousands, except share and per share data)
As of December 31, | |||||||
2017 | 2016 | ||||||
Assets | |||||||
Current assets: | |||||||
Cash and cash equivalents | $ | 128,087 | $ | 565,333 | |||
Restricted cash | 54,006 | 114,950 | |||||
Accounts receivable, net | 89,680 | 89,461 | |||||
Prepaid expenses and other current assets | 65,393 | 61,749 | |||||
Due from affiliate | 4,370 | — | |||||
Assets held for sale | — | 61,523 | |||||
Total current assets | 341,536 | 893,016 | |||||
Renewable energy facilities, net, including consolidated variable interest entities of $3,273,848 and $3,434,549 in 2017 and 2016, respectively | 4,801,925 | 4,993,251 | |||||
Intangible assets, net, including consolidated variable interest entities of $823,629 and $875,095 in 2017 and 2016, respectively | 1,077,786 | 1,142,112 | |||||
Restricted cash | 42,694 | 2,554 | |||||
Other assets | 123,080 | 122,661 | |||||
Non-current assets held for sale | — | 552,271 | |||||
Total assets | $ | 6,387,021 | $ | 7,705,865 | |||
See accompanying notes to consolidated financial statements.
83
TERRAFORM POWER, INC. AND SUBSIDIARIES
CONSOLIDATED BALANCE SHEETS
(In thousands, except share and per share data)
(CONTINUED)
As of December 31, | |||||||
2017 | 2016 | ||||||
Liabilities, Redeemable Non-controlling Interests and Stockholders' Equity | |||||||
Current liabilities: | |||||||
Current portion of long-term debt and financing lease obligations, including consolidated variable interest entities of $84,691 and $594,442 in 2017 and 2016, respectively | $ | 403,488 | $ | 2,212,968 | |||
Accounts payable, accrued expenses and other current liabilities | 88,538 | 125,596 | |||||
Deferred revenue | 17,859 | 18,179 | |||||
Due to affiliates, net | 3,968 | 16,692 | |||||
Liabilities related to assets held for sale | — | 21,798 | |||||
Total current liabilities | 513,853 | 2,395,233 | |||||
Long-term debt and financing lease obligations, less current portion, including consolidated variable interest entities of $833,388 and $375,726 in 2017 and 2016, respectively | 3,195,312 | 1,737,946 | |||||
Deferred revenue, less current portion | 38,074 | 55,793 | |||||
Deferred income taxes | 18,636 | 27,723 | |||||
Asset retirement obligations, including consolidated variable interest entities of $97,467 and $92,213 in 2017 and 2016, respectively | 154,515 | 148,575 | |||||
Other long-term liabilities | 37,923 | 31,470 | |||||
Non-current liabilities related to assets held for sale | — | 410,759 | |||||
Total liabilities | 3,958,313 | 4,807,499 | |||||
Redeemable non-controlling interests | 58,340 | 180,367 | |||||
Stockholders' equity: | |||||||
Class A common stock, $0.01 par value per share, 1,200,000,000 shares authorized in 2017, 148,586,447 and 92,476,776 shares issued in 2017 and 2016, respectively, and 148,086,027 and 92,223,089 shares outstanding in 2017 and 2016, respectively | 1,486 | 920 | |||||
Class B common stock, $0.01 par value per share, no shares authorized or issued in 2017, 48,202,310 shares issued and outstanding in 2016 | — | 482 | |||||
Additional paid-in capital | 1,866,206 | 1,467,108 | |||||
Accumulated deficit | (398,629 | ) | (234,440 | ) | |||
Accumulated other comprehensive income | 48,018 | 22,912 | |||||
Treasury stock, 500,420 and 253,687 shares in 2017 and 2016, respectively | (6,712 | ) | (4,025 | ) | |||
Total TerraForm Power, Inc. stockholders' equity | 1,510,369 | 1,252,957 | |||||
Non-controlling interests | 859,999 | 1,465,042 | |||||
Total stockholders' equity | 2,370,368 | 2,717,999 | |||||
Total liabilities, redeemable non-controlling interests and stockholders' equity | $ | 6,387,021 | $ | 7,705,865 | |||
See accompanying notes to consolidated financial statements.
84
TERRAFORM POWER, INC. AND SUBSIDIARIES
CONSOLIDATED STATEMENTS OF STOCKHOLDERS’ EQUITY
(In thousands)
Accumulated Other Comprehensive (Loss) Income | Non-controlling Interests | ||||||||||||||||||||||||||||||||||||||||||||||||||||||||||||||
Class A Common Stock Issued | Class B Common Stock Issued | Class B1 Common Stock Issued | Additional Paid-in Capital | Accumulated Deficit | Common Stock Held in Treasury | Accumulated Deficit | Accumulated Other Comprehensive Loss | Total Equity | |||||||||||||||||||||||||||||||||||||||||||||||||||||||
Shares | Amount | Shares | Amount | Shares | Amount | Shares | Amount | Total | Capital | Total | |||||||||||||||||||||||||||||||||||||||||||||||||||||
Balance as of December 31, 2014 | 42,218 | $ | 387 | 64,526 | $ | 645 | 5,840 | $ | 58 | $ | 498,256 | $ | (26,317 | ) | $ | (1,637 | ) | — | $ | — | $ | 471,392 | $ | 1,092,809 | $ | (44,451 | ) | $ | (3,829 | ) | $ | 1,044,529 | $ | 1,515,921 | |||||||||||||||||||||||||||||
Issuance of Class A common stock, net of issuance costs | 31,912 | 318 | (4,162 | ) | (41 | ) | — | — | 921,333 | — | — | — | — | 921,610 | — | — | — | — | 921,610 | ||||||||||||||||||||||||||||||||||||||||||||
Riverstone exchange | 5,840 | 58 | — | — | (5,840 | ) | (58 | ) | — | — | — | — | — | — | — | — | — | — | — | ||||||||||||||||||||||||||||||||||||||||||||
Stock-based compensation | (236 | ) | 21 | — | — | — | — | 22,622 | — | — | (122 | ) | (2,436 | ) | 20,207 | — | — | — | — | 20,207 | |||||||||||||||||||||||||||||||||||||||||||
Net loss | — | — | — | — | — | — | — | (79,886 | ) | — | — | — | (79,886 | ) | — | (138,371 | ) | — | (138,371 | ) | (218,257 | ) | |||||||||||||||||||||||||||||||||||||||||
Pre-acquisition net income of renewable energy facilities acquired from SunEdison | — | — | — | — | — | — | — | 1,610 | — | — | — | 1,610 | — | — | — | — | 1,610 | ||||||||||||||||||||||||||||||||||||||||||||||
Dividends | — | — | — | — | — | — | (88,705 | ) | — | — | — | — | (88,705 | ) | — | — | — | — | (88,705 | ) | |||||||||||||||||||||||||||||||||||||||||||
Consolidation of non-controlling interests in acquired renewable energy facilities | — | — | — | — | — | — | — | — | — | — | — | — | 413,014 | — | — | 413,014 | 413,014 | ||||||||||||||||||||||||||||||||||||||||||||||
Repurchase of non-controlling interest in renewable energy facility | — | — | — | — | — | — | — | — | — | — | — | — | (54,694 | ) | — | — | (54,694 | ) | (54,694 | ) | |||||||||||||||||||||||||||||||||||||||||||
Net SunEdison investment | — | — | — | — | — | — | 84,288 | — | — | — | — | 84,288 | 69,113 | — | — | 69,113 | 153,401 | ||||||||||||||||||||||||||||||||||||||||||||||
Other comprehensive loss | — | — | — | — | — | — | — | — | (15,479 | ) | — | — | (15,479 | ) | — | — | (11,407 | ) | (11,407 | ) | (26,886 | ) | |||||||||||||||||||||||||||||||||||||||||
Pre-acquisition other comprehensive income of renewable energy facilities acquired from SunEdison | — | — | — | — | — | — | — | — | 40,016 | — | — | 40,016 | — | — | — | — | 40,016 | ||||||||||||||||||||||||||||||||||||||||||||||
Sale of membership interests and contributions from non-controlling interests in renewable energy facilities | — | — | — | — | — | — | — | — | — | — | — | — | 346,704 | — | — | 346,704 | 346,704 | ||||||||||||||||||||||||||||||||||||||||||||||
Distributions to non-controlling interests | — | — | — | — | — | — | — | — | — | — | — | — | (83,672 | ) | — | — | (83,672 | ) | (83,672 | ) | |||||||||||||||||||||||||||||||||||||||||||
Equity reallocation | — | — | — | — | — | — | (170,310 | ) | — | — | — | — | (170,310 | ) | 170,310 | — | — | 170,310 | — | ||||||||||||||||||||||||||||||||||||||||||||
Balance as of December 31, 2015 | 79,734 | $ | 784 | 60,364 | $ | 604 | — | $ | — | $ | 1,267,484 | $ | (104,593 | ) | $ | 22,900 | (122 | ) | $ | (2,436 | ) | $ | 1,184,743 | $ | 1,953,584 | $ | (182,822 | ) | $ | (15,236 | ) | $ | 1,755,526 | $ | 2,940,269 | ||||||||||||||||||||||||||||
See accompanying notes to consolidated financial statements.
85
TERRAFORM POWER, INC. AND SUBSIDIARIES
CONSOLIDATED STATEMENTS OF STOCKHOLDERS’ EQUITY
(In thousands)
(CONTINUED)
Non-controlling Interests | ||||||||||||||||||||||||||||||||||||||||||||||||||||||||
Class A Common Stock Issued | Class B Common Stock Issued | Additional Paid-in Capital | Accumulated Deficit | Accumulated Other Comprehensive Income | Common Stock Held in Treasury | Accumulated Deficit | Accumulated Other Comprehensive (Loss) Income | Total Equity | ||||||||||||||||||||||||||||||||||||||||||||||||
Shares | Amount | Shares | Amount | Shares | Amount | Total | Capital | Total | ||||||||||||||||||||||||||||||||||||||||||||||||
Balance as of December 31, 2015 | 79,734 | $ | 784 | 60,364 | $ | 604 | $ | 1,267,484 | $ | (104,593 | ) | $ | 22,900 | (122 | ) | $ | (2,436 | ) | $ | 1,184,743 | $ | 1,953,584 | $ | (182,822 | ) | $ | (15,236 | ) | $ | 1,755,526 | $ | 2,940,269 | ||||||||||||||||||||||||
SunEdison exchange | 12,162 | 122 | (12,162 | ) | (122 | ) | 181,045 | — | — | — | — | 181,045 | (181,045 | ) | — | — | (181,045 | ) | — | |||||||||||||||||||||||||||||||||||||
Stock-based compensation | 581 | 14 | — | — | 6,729 | — | — | (132 | ) | (1,589 | ) | 5,154 | — | — | — | — | 5,154 | |||||||||||||||||||||||||||||||||||||||
Net loss | — | — | — | — | — | (129,847 | ) | — | — | — | (129,847 | ) | — | (130,025 | ) | — | (130,025 | ) | (259,872 | ) | ||||||||||||||||||||||||||||||||||||
Acquisition accounting adjustment to non-controlling interest in acquired renewable energy facility | — | — | — | — | — | — | — | — | — | — | 8,000 | — | — | 8,000 | 8,000 | |||||||||||||||||||||||||||||||||||||||||
Repurchase of non-controlling interest in renewable energy facility | — | — | — | — | — | — | — | — | — | — | (486 | ) | — | — | (486 | ) | (486 | ) | ||||||||||||||||||||||||||||||||||||||
Net SunEdison investment | — | — | — | — | 16,372 | — | — | — | — | 16,372 | 9,028 | — | — | 9,028 | 25,400 | |||||||||||||||||||||||||||||||||||||||||
Other comprehensive income | — | — | — | — | — | — | 12 | — | — | 12 | — | — | 830 | 830 | 842 | |||||||||||||||||||||||||||||||||||||||||
Sale of membership interests and contributions from non-controlling interests in renewable energy facilities | — | — | — | — | — | — | — | — | — | — | 15,674 | — | — | 15,674 | 15,674 | |||||||||||||||||||||||||||||||||||||||||
Distributions to non-controlling interests in renewable energy facilities | — | — | — | — | — | — | — | — | — | — | (13,020 | ) | — | — | (13,020 | ) | (13,020 | ) | ||||||||||||||||||||||||||||||||||||||
Accretion of redeemable non-controlling interest | — | — | — | — | (3,962 | ) | — | — | — | — | (3,962 | ) | — | — | — | — | (3,962 | ) | ||||||||||||||||||||||||||||||||||||||
Equity reallocation | — | — | — | — | (560 | ) | — | — | — | — | (560 | ) | 560 | — | — | 560 | — | |||||||||||||||||||||||||||||||||||||||
Balance as of December 31, 2016 | 92,477 | $ | 920 | 48,202 | $ | 482 | $ | 1,467,108 | $ | (234,440 | ) | $ | 22,912 | (254 | ) | $ | (4,025 | ) | $ | 1,252,957 | $ | 1,792,295 | $ | (312,847 | ) | $ | (14,406 | ) | $ | 1,465,042 | $ | 2,717,999 | ||||||||||||||||||||||||
Net SunEdison investment | — | — | — | — | 7,019 | — | — | — | — | 7,019 | 2,749 | — | — | 2,749 | 9,768 | |||||||||||||||||||||||||||||||||||||||||
Equity reallocation | — | — | — | — | 8,780 | — | — | — | — | 8,780 | (8,780 | ) | — | — | (8,780 | ) | — | |||||||||||||||||||||||||||||||||||||||
SunEdison exchange | 48,202 | 482 | (48,202 | ) | (482 | ) | 641,452 | — | (643 | ) | — | — | 640,809 | (835,662 | ) | 194,210 | 643 | (640,809 | ) | — | ||||||||||||||||||||||||||||||||||||
Issuance of Class A common stock to SunEdison | 6,493 | 65 | — | — | (65 | ) | — | — | — | — | — | — | — | — | — | — | ||||||||||||||||||||||||||||||||||||||||
Write-off of payables to SunEdison | — | — | — | — | 15,677 | — | — | — | — | 15,677 | — | — | — | — | 15,677 | |||||||||||||||||||||||||||||||||||||||||
Stock-based compensation | 1,414 | 19 | — | — | 14,689 | — | — | (246 | ) | (2,687 | ) | 12,021 | — | — | — | — | 12,021 | |||||||||||||||||||||||||||||||||||||||
Net loss | — | — | — | — | — | (164,189 | ) | — | — | — | (164,189 | ) | — | (79,559 | ) | — | (79,559 | ) | (243,748 | ) | ||||||||||||||||||||||||||||||||||||
Special Dividend payment | — | — | — | — | (285,497 | ) | — | — | — | — | (285,497 | ) | — | — | — | — | (285,497 | ) | ||||||||||||||||||||||||||||||||||||||
Other comprehensive income | — | — | — | — | — | — | 25,749 | — | — | 25,749 | — | — | 14,657 | 14,657 | 40,406 | |||||||||||||||||||||||||||||||||||||||||
Sale of membership interests and contributions from non-controlling interests in renewable energy facilities | — | — | — | — | — | — | — | — | — | — | 6,935 | — | — | 6,935 | 6,935 | |||||||||||||||||||||||||||||||||||||||||
Distributions to non-controlling interests in renewable energy facilities | — | — | — | — | — | — | — | — | — | — | (23,345 | ) | — | — | (23,345 | ) | (23,345 | ) | ||||||||||||||||||||||||||||||||||||||
Deconsolidation of non-controlling interest in renewable energy facility | — | — | — | — | — | — | — | — | — | — | (8,713 | ) | — | — | (8,713 | ) | (8,713 | ) | ||||||||||||||||||||||||||||||||||||||
Accretion of redeemable non-controlling interest | — | — | — | — | (6,729 | ) | — | — | — | — | (6,729 | ) | — | — | — | — | (6,729 | ) | ||||||||||||||||||||||||||||||||||||||
Reclassification of Invenergy Wind Interest from redeemable non-controlling interests to non-controlling interests | — | — | — | — | — | — | — | — | — | — | 131,822 | — | — | 131,822 | 131,822 | |||||||||||||||||||||||||||||||||||||||||
Other | — | — | — | — | 3,772 | — | — | — | — | 3,772 | — | — | — | — | 3,772 | |||||||||||||||||||||||||||||||||||||||||
Balance as of December 31, 2017 | 148,586 | $ | 1,486 | — | $ | — | $ | 1,866,206 | $ | (398,629 | ) | $ | 48,018 | (500 | ) | $ | (6,712 | ) | $ | 1,510,369 | $ | 1,057,301 | $ | (198,196 | ) | $ | 894 | $ | 859,999 | $ | 2,370,368 | |||||||||||||||||||||||||
See accompanying notes to consolidated financial statements.
86
TERRAFORM POWER, INC. AND SUBSIDIARIES
CONSOLIDATED STATEMENTS OF CASH FLOWS
(In thousands)
Year Ended December 31, | |||||||||||
2017 | 2016 | 2015 | |||||||||
Cash flows from operating activities: | |||||||||||
Net loss | $ | (232,864 | ) | $ | (241,507 | ) | $ | (208,135 | ) | ||
Adjustments to reconcile net loss to net cash provided by operating activities: | |||||||||||
Depreciation, accretion and amortization expense | 246,720 | 243,365 | 161,310 | ||||||||
Amortization of favorable and unfavorable rate revenue contracts, net | 39,576 | 40,219 | 5,304 | ||||||||
Loss on extinguishment of debt, net | 81,099 | 1,079 | 16,156 | ||||||||
Gain on sale of renewable energy facilities | (37,116 | ) | — | — | |||||||
Goodwill impairment | — | 55,874 | — | ||||||||
Impairment of renewable energy facilities | 1,429 | 18,951 | — | ||||||||
Amortization of deferred financing costs and debt discounts | 23,729 | 24,160 | 27,028 | ||||||||
Unrealized loss on U.K. interest rate swaps | 2,425 | 24,209 | — | ||||||||
Unrealized loss on commodity contract derivatives, net | 6,847 | 11,773 | 1,413 | ||||||||
Recognition of deferred revenue | (18,238 | ) | (16,527 | ) | (9,909 | ) | |||||
Stock-based compensation expense | 16,778 | 6,059 | 13,125 | ||||||||
Unrealized (gain) loss on foreign currency exchange, net | (5,583 | ) | 15,795 | 22,343 | |||||||
Loss on prepaid warranty - affiliate | — | — | 45,380 | ||||||||
Loss on investments and receivables - affiliate | 1,759 | 3,336 | 16,079 | ||||||||
Deferred taxes | (23,350 | ) | 375 | (13,497 | ) | ||||||
Other, net | (1,166 | ) | 2,542 | 9,395 | |||||||
Changes in assets and liabilities: | |||||||||||
Accounts receivable | (2,939 | ) | 3,112 | (11,272 | ) | ||||||
Prepaid expenses and other current assets | 803 | (8,585 | ) | 12,189 | |||||||
Accounts payable, accrued expenses and other current liabilities | (42,736 | ) | (1,156 | ) | 19,887 | ||||||
Due to affiliates, net | 3,968 | — | — | ||||||||
Deferred revenue | 199 | 4,803 | 19,383 | ||||||||
Other, net | 5,857 | 3,932 | (1,919 | ) | |||||||
Net cash provided by operating activities | 67,197 | 191,809 | 124,260 | ||||||||
Cash flows from investing activities: | |||||||||||
Cash paid to third parties for renewable energy facility construction and other capital expenditures | (8,392 | ) | (45,869 | ) | (647,561 | ) | |||||
Proceeds from sale of renewable energy facilities, net of cash and restricted cash disposed | 183,235 | — | — | ||||||||
Proceeds from renewable energy state rebate | 15,542 | — | — | ||||||||
Proceeds from reimbursable interconnection costs | 10,137 | — | — | ||||||||
Acquisitions of renewable energy facilities from third parties, net of cash and restricted cash acquired | — | (4,064 | ) | (2,432,226 | ) | ||||||
Due to SunEdison, net | — | — | (26,153 | ) | |||||||
Other investing activities | 5,750 | — | (8,400 | ) | |||||||
Net cash provided by (used in) investing activities | $ | 206,272 | $ | (49,933 | ) | $ | (3,114,340 | ) | |||
See accompanying notes to consolidated financial statements.
87
TERRAFORM POWER, INC. AND SUBSIDIARIES
CONSOLIDATED STATEMENTS OF CASH FLOWS
(In thousands)
(CONTINUED)
Year Ended December 31, | |||||||||||
2017 | 2016 | 2015 | |||||||||
Cash flows from financing activities: | |||||||||||
Proceeds from issuance of Class A common stock | $ | — | $ | — | $ | 921,610 | |||||
Proceeds from Senior Notes due 2023 | — | — | 945,962 | ||||||||
Repayment of Senior Notes due 2023 | (950,000 | ) | — | — | |||||||
Proceeds from New Senior Notes due 2023 | 494,985 | — | — | ||||||||
Proceeds from Senior Notes due 2025 | — | — | 300,000 | ||||||||
Proceeds from Senior Notes due 2028 | 692,979 | — | — | ||||||||
Proceeds from New Term Loan | 344,650 | — | — | ||||||||
Repayment of Term Loan | — | — | (573,500 | ) | |||||||
Revolver draws | — | — | 890,000 | ||||||||
Revolver repayments | (552,000 | ) | (103,000 | ) | (235,000 | ) | |||||
New Revolver draws | 265,000 | — | — | ||||||||
New Revolver repayments | (205,000 | ) | — | — | |||||||
Borrowings of non-recourse long-term debt | 79,835 | 86,662 | 1,450,707 | ||||||||
Principal payments and prepayments on non-recourse long-term debt | (569,463 | ) | (156,042 | ) | (517,600 | ) | |||||
Debt prepayment premium | (50,712 | ) | — | (6,412 | ) | ||||||
Debt financing fees | (29,972 | ) | (17,436 | ) | (59,672 | ) | |||||
Sale of membership interests and contributions from non-controlling interests in renewable energy facilities | 6,935 | 16,685 | 349,736 | ||||||||
Repurchase of non-controlling interests in renewable energy facilities | — | (486 | ) | (63,198 | ) | ||||||
Distributions to non-controlling interests | (31,163 | ) | (23,784 | ) | (28,145 | ) | |||||
Distributions to SunEdison | — | — | (58,291 | ) | |||||||
Net SunEdison investment | 7,694 | 42,463 | 149,936 | ||||||||
Due to affiliates, net | (8,869 | ) | (32,256 | ) | (138,923 | ) | |||||
Payment of dividends | (285,497 | ) | — | (88,705 | ) | ||||||
Other financing activities | 1,085 | — | — | ||||||||
Net cash (used in) provided by financing activities | (789,513 | ) | (187,194 | ) | 3,238,505 | ||||||
Net (decrease) increase in cash, cash equivalents and restricted cash | (516,044 | ) | (45,318 | ) | 248,425 | ||||||
Net change in cash, cash equivalents and restricted cash classified within assets held for sale | 54,806 | (54,806 | ) | — | |||||||
Effect of exchange rate changes on cash, cash equivalents and restricted cash | 3,188 | (10,072 | ) | (4,946 | ) | ||||||
Cash, cash equivalents and restricted cash at beginning of period | 682,837 | 793,033 | 549,554 | ||||||||
Cash, cash equivalents and restricted cash at end of period | $ | 224,787 | $ | 682,837 | $ | 793,033 | |||||
Supplemental Disclosures: | |||||||||||
Cash paid for interest, net of amounts capitalized | $ | 260,685 | $ | 257,269 | $ | 114,452 | |||||
Cash paid for income taxes | — | — | — | ||||||||
Schedule of non-cash activities: | |||||||||||
Additions to renewable energy facilities in accounts payable, accrued expenses and other current liabilities | $ | 1,622 | $ | — | $ | 6,034 | |||||
Loss on disposal of wind power plant components | 5,828 | — | — | ||||||||
Write-off of payables to SunEdison to additional paid-in capital | 15,677 | — | — | ||||||||
Additions of asset retirement obligation (ARO) assets and liabilities | — | 2,132 | 52,181 | ||||||||
Revisions in estimates for asset retirement obligations | — | (7,920 | ) | — | |||||||
Adjustment to ARO related to change in accretion period | — | (22,204 | ) | — | |||||||
ARO assets and obligations from acquisitions | — | 136 | 74,293 | ||||||||
Long-term debt assumed in connection with acquisitions | — | — | 667,384 | ||||||||
See accompanying notes to consolidated financial statements.
88
TERRAFORM POWER, INC. AND SUBSIDIARIES
NOTES TO CONSOLIDATED FINANCIAL STATEMENTS
(Dollar amounts in thousands, except per share data, unless otherwise noted)
1. NATURE OF OPERATIONS AND BASIS OF PRESENTATION
Nature of Operations
Prior to the consummation of the Merger (as defined below) on October 16, 2017, TerraForm Power, Inc. (“TerraForm Power”) and its subsidiaries (together with TerraForm Power, the “Company”) were controlled affiliates of SunEdison, Inc. (together with its consolidated subsidiaries excluding the Company and TerraForm Global, Inc. and its subsidiaries, “SunEdison”). As a result of the consummation of the Merger, a change of control of TerraForm Power occurred, and Orion US Holdings 1 L.P. (“Orion Holdings”), which is an affiliate of Brookfield Asset Management Inc. (“Brookfield”), now holds 51% of the voting securities of TerraForm Power. As a result of the Merger closing, TerraForm Power is no longer a controlled affiliate of SunEdison, Inc. and is now a controlled affiliate of Brookfield.
TerraForm Power is a holding company and its only material asset is an equity interest in TerraForm Power, LLC (“Terra LLC”), which through its subsidiaries owns and operates renewable energy facilities that have long-term contractual arrangements to sell the electricity generated by these facilities to third parties. The related green energy certificates, ancillary services and other environmental attributes generated by these facilities are also sold to third parties. TerraForm Power is the managing member of Terra LLC and operates, controls and consolidates the business affairs of Terra LLC. The Company is sponsored by Brookfield and has an objective to acquire operating solar and wind assets in North America and Western Europe.
The Consummation of the Brookfield Sponsorship Transaction and of the Settlement with SunEdison
On April 21, 2016, SunEdison, Inc. and certain of its domestic and international subsidiaries (the “SunEdison Debtors”) voluntarily filed for protection under Chapter 11 of the U.S. Bankruptcy Code (the “SunEdison Bankruptcy”). In response to SunEdison’s financial and operating difficulties, the Company initiated a process for the exploration and evaluation of potential strategic alternatives for the Company, including potential transactions to secure a new sponsor or sell the Company, and a process to settle claims with SunEdison. This process resulted in the Company's entry into a definitive merger and sponsorship transaction agreement (the “Merger Agreement”) on March 6, 2017 with Orion Holdings and BRE TERP Holdings Inc. (“Merger Sub”), a wholly-owned subsidiary of Orion Holdings, which are affiliates of Brookfield. At the same time, the Company and SunEdison also entered into a settlement agreement (the “Settlement Agreement”) and a voting and support agreement (the “Voting and Support Agreement”), among other things, to facilitate the closing of the merger transaction and the settlement of claims between the Company and SunEdison.
On October 6, 2017, the Merger Agreement was approved by the holders of a majority of the outstanding Class A shares of TerraForm Power, excluding SunEdison, Orion Holdings, any of their respective affiliates or any person with whom any of them has formed (and not terminated) a “group” (as such term is defined in the Securities Exchange Act of 1934, as amended) and by the holders of a majority of the total voting power of the outstanding shares of the Company's common stock entitled to vote on the transaction. With these votes, all conditions to the merger transaction contemplated by the Merger Agreement were satisfied. On October 16, 2017, Merger Sub merged with and into TerraForm Power (the “Merger”), with TerraForm Power continuing as the surviving corporation in the Merger. Immediately following the consummation of the Merger, there were 148,086,027 Class A shares of TerraForm Power outstanding (which excludes 138,402 Class A shares that were issued and held in treasury to pay applicable employee tax withholdings for restricted stock units (“RSUs”) held by employees that vested upon the consummation of the Merger) and Orion Holdings holds 51% of such shares. In addition, pursuant to the Merger Agreement, at or prior to the effective time of the Merger, the Company and Orion Holdings (or one of its affiliates), among other parties, entered into a suite of agreements providing for sponsorship arrangements, including a master services agreement, relationship agreement, governance agreement and a sponsor line of credit (the “Sponsorship Transaction”), as are more fully described in Note 20. Related Parties and Note 11. Long-term Debt.
Immediately prior to the effective time of the Merger, pursuant to the Settlement Agreement, SunEdison exchanged all of the Class B units held by SunEdison or any of its controlled affiliates in Terra LLC for 48,202,310 Class A shares of TerraForm Power, and as a result of this exchange, all shares of Class B common stock of TerraForm Power held by SunEdison or any of its controlled affiliates were automatically redeemed and retired. Pursuant to the Settlement Agreement, immediately following this exchange, the Company issued to SunEdison additional Class A shares such that immediately prior to the effective time of the Merger, SunEdison and certain of its affiliates held an aggregate number of Class A shares equal to 36.9% of the Company’s fully diluted share count (which was subject to proration based on the Merger consideration election results
89
as discussed in Note 15. Stockholders' Equity). SunEdison and certain of its affiliates also transferred all of the outstanding incentive distribution rights (“IDRs”) of Terra LLC held by SunEdison or certain of its affiliates to BRE Delaware, Inc. (the “Brookfield IDR Holder”) at the effective time of the Merger. Under the Settlement Agreement, upon the consummation of the Merger, all agreements between the Company and the SunEdison Debtors were deemed rejected, subject to certain limited exceptions, without further liability, claims or damages on the part of the Company. The settlements, mutual release and certain other terms and conditions of the Settlement Agreement also became effective upon the consummation of the Merger. Refer to Note 20. Related Parties for further discussion.
Going Concern
In its Form 10-K for the year ended December 31, 2016 and its Forms 10-Q for each of the quarters ended March 31, 2017 and June 30, 2017, the Company disclosed there was substantial doubt about its ability to continue as a going concern. While the financial statements accompanying those filings and the accompanying consolidated financial statements were prepared on a going concern basis, the matters disclosed in those filings raised substantial doubt about the Company’s ability to continue as a going concern as a result of the SunEdison Bankruptcy and the related impacts on the Company, including the Company’s historic reliance on SunEdison, defaults under project-level financing arrangements and the potential for creditors or other stakeholders of SunEdison to petition the court to substantively consolidate the Company’s assets and liabilities into the SunEdison bankruptcy estate.
Since the date of the SunEdison Bankruptcy, the Company has implemented significant measures to mitigate its impact on the Company. Consistent with the disclosures in the Company's Form 10-Q for the quarter ended September 30, 2017, management no longer believes the SunEdison Bankruptcy and the related impacts raise substantial doubt about the Company’s ability to continue as a going concern for the following reasons:
• | The Company has eliminated its reliance on SunEdison by transitioning the asset management, operations and maintenance of its renewable energy facilities in-house or to third parties, by hiring directly its own employees and contractors and by establishing its own information technology systems. As a result, management believes they are in a position to operate the business of the Company on a stand-alone basis under Brookfield sponsorship. |
• | The Company has cured or obtained waivers with respect to substantially all of its project-level financing arrangements that were in default during the course of 2016 and 2017 as a result of the SunEdison Bankruptcy and delays in delivering financial statements and other required deliverables. The amount of restricted cash associated with the limited number of defaults that persist that cannot be distributed from the projects as of the date of the issuance of these financial statements is $11.3 million and is not needed for the Company to meet its cash flow needs. The Company expects to obtain waivers for these remaining defaults in the near-term and does not expect these defaults to affect its ability to meet its liquidity requirements and meet corporate credit facility covenants. |
• | Finally, during the course of the SunEdison Bankruptcy there was a risk that an interested party in the SunEdison Bankruptcy could request that the assets and liabilities of the Company be substantively consolidated with SunEdison. As a result of SunEdison's emergence from bankruptcy in December of 2017, there is no longer any risk that the United States Bankruptcy Court for the Southern District of New York (the “Bankruptcy Court”) would order substantive consolidation of the Company with the SunEdison Debtors. |
Basis of Presentation
When the Company was a controlled affiliate of SunEdison, it was required to recast historical financial statements when renewable energy facilities were acquired from SunEdison. The recast reflected the assets and liabilities, results of operations and cash flows of the acquired renewable energy facilities for the period the facilities were owned by SunEdison, which was in accordance with applicable rules governing transactions between entities under common control. The Company has not acquired any renewable energy facilities from SunEdison since the first quarter of 2016, and as a result, there have been no corresponding changes to the Company's previously reported consolidated financial statements included in the Company's Form 10-K for the year ended December 31, 2016. Subsequent to the consummation of the Merger and change of control that occurred in October 2017, the Company has not acquired any renewable energy facilities from Brookfield or any of its affiliates.
The accompanying consolidated financial statements represent the results of TerraForm Power, which consolidates Terra LLC through its controlling interest.
90
The Company has elected to not push-down the application of the acquisition method of accounting to its consolidated financial statements following the consummation of the Merger and the change of control that occurred.
2. SUMMARY OF SIGNIFICANT ACCOUNTING POLICIES
Use of Estimates
In preparing the consolidated financial statements, the Company used estimates and assumptions that affect the reported amounts of assets and liabilities and the disclosure of contingent assets and liabilities as of the date of the financial statements. Such estimates also affect the reported amounts of revenues, expenses and cash flows during the reporting period. To the extent there are material differences between the estimates and actual results, the Company's future results of operations would be affected.
Principles of Consolidation
The accompanying consolidated financial statements have been prepared in accordance with U.S. generally accepted accounting principles (“U.S. GAAP”). They include the results of wholly owned and partially owned subsidiaries in which the Company has a controlling interest with all significant intercompany accounts and transactions eliminated.
Variable Interest Entities
The Company assesses entities for consolidation in accordance with ASC 810. The Company consolidates variable interest entities (“VIEs”) in renewable energy facilities when determined to be the primary beneficiary. VIEs are entities that lack one or more of the characteristics of a voting interest entity (“VOE”). The Company has a controlling financial interest in a VIE when its variable interest or interests provide it with (i) the power to direct the activities of the VIE that most significantly impact the VIE’s economic performance and (ii) the obligation to absorb losses of the VIE or the right to receive benefits from the VIE that could potentially be significant to the VIE.
VOEs are entities in which (i) the total equity investment at risk is sufficient to enable the entity to finance its activities independently and (ii) the equity holders have the power to direct the activities of the entity that most significantly impact its economic performance, the obligation to absorb the losses of the entity and the right to receive the residual returns of the entity. The usual condition for a controlling financial interest in a voting interest entity is ownership of a majority voting interest. If the Company has a majority voting interest in a voting interest entity, the entity is consolidated.
For the Company's consolidated VIEs, the Company has presented on its consolidated balance sheets, to the extent material, the assets of its consolidated VIEs that can only be used to settle specific obligations of the consolidated VIE, and the liabilities of its consolidated VIEs for which creditors do not have recourse to the Company's general assets outside of the VIE.
Cash and Cash Equivalents
Cash and cash equivalents include all cash balances and money market funds with original maturity periods of three months or less when purchased. As of December 31, 2017 and 2016, cash and cash equivalents included $60.1 million and $57.6 million, respectively, of unrestricted cash held at project-level subsidiaries, which was available for project expenses but not available for corporate use.
Restricted Cash
Restricted cash consists of cash on deposit in financial institutions that is restricted to satisfy the requirements of certain debt agreements and funds held within the Company's project companies that are restricted for current debt service payments and other purposes in accordance with the applicable debt agreements. These restrictions include: (i) cash on deposit in collateral accounts, debt service reserve accounts and maintenance reserve accounts; and (ii) cash on deposit in operating accounts but subject to distribution restrictions related to debt defaults existing as of the balance sheet date.
As discussed in Note 11. Long-term Debt, the Company was in default under certain of its non-recourse financing agreements as of the financial statement issuance date for the years ended December 31, 2017 and 2016. As a result, the
91
Company reclassified $18.8 million and $65.3 million, respectively, of long-term restricted cash to current as of December 31, 2017 and 2016, consistent with the corresponding debt classification, as the restrictions that required the cash balances to be classified as long-term restricted cash were driven by the financing agreements. As of December 31, 2017 and 2016, $21.7 million and $67.1 million, respectively, of cash and cash equivalents was also reclassified to current restricted cash as the cash balances were subject to distribution restrictions related to debt defaults that existed as of the respective balance sheet date. $33.8 million of the December 31, 2016 reclassification amount was reclassified from current restricted cash to assets held for sale as it related to the portfolios discussed in Note 4. Assets Held for Sale. There was no similar reclassification to assets held for sale for the December 31, 2017 reclassification amount as the sale of the related renewable energy facilities closed in the first half of 2017.
Accounts Receivable and Allowance for Doubtful Accounts
Accounts receivable are reported on the consolidated balance sheets, including both billed and unbilled amounts, and are adjusted for any write-offs as well as the allowance for doubtful accounts. The Company establishes an allowance for doubtful accounts to adjust its receivables to amounts considered to be ultimately collectible and charges to the allowance are recorded within general and administrative expenses in the consolidated statements of operations. The Company's allowance is based on a variety of factors, including the length of time receivables are past due, significant one-time events, the financial health of its customers and historical experience. The allowance for doubtful accounts was $1.7 million and $3.2 million as of December 31, 2017 and 2016, respectively, and charges (reductions) to the allowance recorded within general and administrative expenses for the years ended December 31, 2017, 2016 and 2015 were $(1.5) million, $0.5 million and $2.7 million, respectively. Accounts receivable are written off in the period in which the receivable is deemed uncollectible and collection efforts have been exhausted. There were no write-offs of accounts receivable for the years ended December 31, 2017, 2016 and 2015.
Renewable Energy Facilities
Renewable energy facilities consist of solar generation facilities and wind power plants that are stated at cost. Expenditures for major additions and improvements are capitalized, and minor replacements, maintenance and repairs are charged to expense as incurred. When renewable energy facilities are retired, or otherwise disposed of, the cost and accumulated depreciation is removed from the consolidated balance sheet and any resulting gain or loss is included in the results of operations for the respective period. Depreciation of renewable energy facilities is recognized using the straight-line method over the estimated useful lives of the renewable energy facilities, which range from 20 to 30 years for the Company's solar generation facilities. Effective October 1, 2016, the Company changed its estimates of the useful lives of the major components of its wind power plants to better reflect the estimated periods during which these major components will remain in service. These major components comprising the Company's wind power plants had remaining useful lives ranging from 5 to 41 years and had an overall weighted average remaining useful life of 24 years as of October 1, 2016. This prospective change in estimate increased depreciation expense and net loss by $1.9 million for the quarter and year ended December 31, 2016 and increased basic and diluted loss per share by $0.02 for the quarter and year ended December 31, 2016. These major wind components had a weighted average remaining useful life of 23 years as of December 31, 2017.
Intangibles
The Company's intangible assets and liabilities represent revenue contracts, consisting of long-term power purchase agreements (“PPAs”) and renewable energy certificates (“RECs”), lease agreements and operations and maintenance (“O&M”) contracts that were obtained through third party acquisitions. The revenue contract intangibles are comprised of favorable and unfavorable rate PPAs and REC agreements and the in-place value of market rate PPAs. The lease agreement intangibles are comprised of favorable and unfavorable rate land leases, and the O&M contract intangibles consist of unfavorable rate O&M contracts. Intangible assets and liabilities that have determinable estimated lives are amortized over those estimated lives. Amortization of favorable and unfavorable rate revenue contracts is recorded within operating revenues, net in the consolidated statements of operations. Amortization expense related to the in-place value of market rate revenue contracts is recorded within depreciation, accretion and amortization expense in the consolidated statements of operations, and amortization of favorable and unfavorable rate land leases and unfavorable rate O&M contracts is recorded within cost of operations. The straight-line method of amortization is used because it best reflects the pattern in which the economic benefits of the intangibles are consumed or otherwise used up. The amounts and useful lives assigned to intangible assets and liabilities acquired impact the amount and timing of future amortization.
92
Impairment of Renewable Energy Facilities and Intangibles
Long-lived assets that are held and used are reviewed for impairment whenever events or changes in circumstances indicate carrying values may not be recoverable. An impairment loss is recognized if the total future estimated undiscounted cash flows expected from an asset are less than its carrying value. An impairment charge is measured as the difference between an asset's carrying amount and fair value. Fair values are determined by a variety of valuation methods, including appraisals, sales prices of similar assets and present value techniques. During the years ended December 31, 2017 and 2016, the Company recognized a $1.4 million and $19.0 million impairment charge, respectively, related to its portfolio of residential rooftop solar assets as reflected within impairment of renewable energy facilities in the consolidated statements of operations (see Note 4. Assets Held for Sale for further discussion). There were no impairments of renewable energy facilities or intangibles recognized during the year ended December 31, 2015.
Goodwill
When the Company has goodwill, it evaluates it for impairment at least annually on December 1st. The Company performs an impairment test between scheduled annual tests if facts and circumstances indicate that it is more-likely-than-not that the fair value of a reporting unit that has goodwill is less than its carrying value.
The Company may first make a qualitative assessment of whether it is more-likely-than-not that a reporting unit’s fair value is less than its carrying value to determine whether it is necessary to perform the two-step quantitative goodwill impairment test. The qualitative impairment test includes considering various factors including macroeconomic conditions, industry and market conditions, cost factors, a sustained share price or market capitalization decrease and any reporting unit specific events. If it is determined through the qualitative assessment that a reporting unit’s fair value is more-likely-than-not greater than its carrying value, the two-step impairment test is not required. If the qualitative assessment indicates it is more-likely-than-not that a reporting unit’s fair value is not greater than its carrying value, the Company must perform the two-step impairment test. The Company may also elect to proceed directly to the two-step impairment test without considering such qualitative factors.
The first step in the two-step impairment test is the comparison of the fair value of a reporting unit with its carrying amount, including goodwill. The Company defines its reporting units to be consistent with its operating segments. In accordance with the authoritative guidance over fair value measurements, the Company defines the fair value of a reporting unit as the price that would be received to sell the unit as a whole in an orderly transaction between market participants at the measurement date. The Company primarily uses the income approach methodology of valuation, which uses the discounted cash flow method, to estimate the fair values of the Company's reporting units. The Company does not believe that a cost approach is relevant to measuring the fair values of its reporting units.
Significant management judgment is required when estimating the fair value of the Company's reporting units, including the forecasting of future operating results, the discount rates and expected future growth rates that it uses in the discounted cash flow method of valuation, and in the selection of comparable businesses that are used in the market approach. If the estimated fair value of the reporting unit exceeds the carrying value assigned to that unit, goodwill is not impaired and no further analysis is required.
If the carrying value assigned to a reporting unit exceeds its estimated fair value in the first step, then the Company is required to perform the second step of the impairment test. In this step, the Company assigns the fair value of the reporting unit calculated in step one to all of the assets and liabilities of that reporting unit as if a market participant just acquired the reporting unit in a business combination. The excess of the fair value of the reporting unit determined in the first step of the impairment test over the total amount assigned to the assets and liabilities in the second step of the impairment test represents the implied fair value of goodwill. If the carrying value of a reporting unit’s goodwill exceeds the implied fair value of goodwill, the Company would record an impairment loss equal to the difference. The Company recorded a goodwill impairment charge of $55.9 million for the year ended December 31, 2016 as reflected in the consolidated statement of operations (see Note 8. Goodwill for further discussion). As a result of this charge, the Company did not have any goodwill as of December 31, 2017 or 2016.
Capitalized Interest
Interest incurred on funds borrowed to finance construction of renewable energy facilities is capitalized until the
93
system is ready for its intended use. The amount of interest capitalized during the years ended December 31, 2016 and 2015 was $1.6 million and $22.7 million, respectively. There was no interest capitalized during the year ended December 31, 2017.
Financing Lease Obligations
Certain of the Company's assets were financed with sale-leaseback arrangements. Proceeds received from a sale-leaseback are treated using the deposit method when the sale of the renewable energy facility is not recognizable. A sale is not recognized when the leaseback arrangements include a prohibited form of continuing involvement, such as an option or obligation to repurchase the assets under the Company's master lease agreements. Under these arrangements, the Company does not recognize any profit until the sale is recognizable, which the Company expects will be at the end of the arrangement when the contract is canceled and the initial deposits received are forfeited by the financing party.
The Company is required to make rental payments over the course of the leaseback arrangements. These payments are allocated between principal and interest payments using an effective yield method.
Deferred Financing Costs
Financing costs incurred in connection with obtaining construction and term financing are deferred and amortized over the maturities of the respective financing arrangements using the effective interest method and are presented as a direct deduction from the carrying amount of the related debt (see Note 11. Long-term Debt), with the exception of the costs related to the Company's revolving credit facilities, which are presented as a non-current asset on the balance sheet within other assets. As of December 31, 2017 and 2016, the Company had $9.4 million and $7.8 million, respectively, of unamortized deferred financing costs related to its revolving credit facilities. The prior year amount was reclassified from deferred financing costs, net to other assets to conform to the current year presentation. Amortization of deferred financing costs is capitalized during construction and recorded as interest expense in the consolidated statements of operations following achievement of commercial operation.
Asset Retirement Obligations
Asset retirement obligations are accounted for in accordance with ASC 410-20, Asset Retirement Obligations. Retirement obligations associated with renewable energy facilities included within the scope of ASC 410-20 are those for which a legal obligation exists under enacted laws, statutes, and written or oral contracts, and for which the timing and/or method of settlement may be conditional on a future event. Asset retirement obligations are recognized at fair value in the period in which they are incurred and the carrying amount of the related renewable energy facility is correspondingly increased. Over time, the liability is accreted to its expected future value. The corresponding renewable energy facility that is capitalized at inception is depreciated over its useful life. Historically, the Company accreted its asset retirement obligations over the term of the related PPA agreement. During the fourth quarter of 2016, the Company revised the accretion period and determined that these obligations should be accreted to expected future value over the remaining useful life of the corresponding renewable energy facility, consistent with the depreciation expense that is recorded on the asset retirement cost recognized within renewable energy facilities and with its estimate of the future timing of settlement. This change in accretion period and related estimate associated with the timing of the original undiscounted cash flows resulted in a $22.2 million reduction in the Company's asset retirement obligation and corresponding renewable energy facility carrying amount as of December 31, 2016. The Company also recorded an adjustment during the fourth quarter of 2016 to reduce previously reported accretion and depreciation expense by $4.4 million as a result of this change. $2.9 million of the accretion and depreciation expense reduction related to amounts previously reported for the year ended December 31, 2015. The quarterly accretion and depreciation expense reduction that related to each of the first three quarters of 2016 was $0.5 million. Management performed an assessment of the balance sheet and income statement impact on its previously issued filings and determined it to be immaterial.
The Company generally reviews its asset retirement obligations annually, based on its review of updated cost studies and its evaluation of cost escalation factors. The Company evaluates newly assumed costs or substantive changes in previously assumed costs to determine if the cost estimate impacts are sufficiently material to warrant application of the updated estimates to the asset retirement obligations. Changes resulting from revisions to the timing or amount of the original estimate of cash flows are recognized as an increase or a decrease in the asset retirement cost to the extent applicable. Effective December 31, 2016, the Company revised its original estimates of the costs and related amount of cash flows for certain of its asset retirement obligations which resulted in a $7.9 million reduction in the asset retirement obligation and related renewable energy facility carrying amount as of December 31, 2016. As this was a prospective change in estimate, there was no impact to accretion or
94
depreciation expense for the year ended December 31, 2016 as a result of this change. There were no similar adjustments during the years ended December 31, 2017 or 2015.
Revenue Recognition
Power Purchase Agreements
A significant majority of the Company's revenues are obtained through the sale of energy (based on megawatts, “MW”) pursuant to terms of PPAs or other contractual arrangements which have a weighted average remaining life of 14 years as of December 31, 2017. Most of the Company's PPAs are accounted for as operating leases and have no minimum lease payments. Rental income under these leases is recorded as revenue when the electricity is delivered.
Incentive Revenue
The Company generates RECs as it produces electricity. RECs are accounted for as government incentives and are not considered output of the underlying renewable energy facilities. These RECs are currently sold pursuant to agreements with unaffiliated third parties and a certain debt holder, and revenue is recognized as the underlying electricity is generated if the sale has been contracted with the customer.
The Company also receives performance-based incentives (“PBIs”) from public utilities in connection with certain locally sponsored programs. Payments are based on a fixed price per kilowatt hour (“kWh”) produced over the term of the respective program. PBI revenue is recognized as energy is generated over the term of the agreement.
Deferred Revenue
Deferred revenue primarily consists of upfront incentives or subsidies received from various state governmental jurisdictions for operating certain of the Company's renewable energy facilities or from the sale of investment tax credits to non-controlling members. The amounts deferred are recognized as revenue on a straight-line basis over the depreciable life of the renewable energy facility or upon the contingency of claw-back of the tax credits resolve as the Company fulfills its obligation to operate these renewable energy facilities. Recognition of deferred revenue was $18.2 million, $16.5 million and $9.9 million during the years ended December 31, 2017, 2016 and 2015, respectively.
Income Taxes
The Company accounts for income taxes using the liability method, which requires that it use the asset and liability method of accounting for deferred income taxes and provide deferred income taxes for all significant temporary differences.
The Company reports certain of its revenues and expenses differently for financial statement purposes than for income tax return purposes, resulting in temporary and permanent differences between the Company's financial statements and income tax returns. The tax effects of such temporary differences are recorded as either deferred income tax assets or deferred income tax liabilities in the Company's consolidated balance sheets. The Company measures its deferred income tax assets and deferred income tax liabilities using income tax rates that are currently in effect. The Company believes it is more likely than not that the results of future operations will generate sufficient taxable income, which includes the future reversal of existing taxable temporary differences to realize deferred tax assets, net of valuation allowances. A valuation allowance is recorded to reduce the net deferred tax assets to an amount that is more-likely-than-not to be realized. Tax benefits are recognized when it is more-likely-than-not that a tax position will be sustained upon examination by the authorities. The benefit recognized from a position that has surpassed the more-likely-than-not threshold is the largest amount of benefit that is more than 50% likely to be realized upon settlement. The Company recognizes interest and penalties accrued related to uncertain tax benefits as a component of income tax expense. Changes to existing net deferred tax assets or valuation allowances or changes to uncertain tax benefits are recorded to income tax expense.
Non-controlling Interests and Hypothetical Liquidation at Book Value (“HLBV”)
Non-controlling interests represent the portion of net assets in consolidated entities that are not owned by the Company and are reported as a component of equity in the consolidated balance sheets. Non-controlling interests in subsidiaries that are redeemable either at the option of the holder or at fixed and determinable prices at certain dates in the future are classified as
95
redeemable non-controlling interests in subsidiaries between liabilities and stockholders' equity in the consolidated balance sheets. Redeemable non-controlling interests that are currently redeemable or redeemable after the passage of time are adjusted to their redemption value as changes occur. The Company applies the guidance in ASC 810-10 along with the SEC guidance in ASC 480-10-S99-3A in the valuation of redeemable non-controlling interests.
The Company has determined the allocation of economics between the controlling party and the third party for non-controlling interests does not correspond to ownership percentages for certain of its consolidated subsidiaries. In order to reflect the substantive profit sharing arrangements, the Company has determined that the appropriate methodology for determining the value of non-controlling interests is a balance sheet approach using the HLBV method. Under the HLBV method, the amounts reported as non-controlling interest on the consolidated balance sheets represent the amounts the third party investors could hypothetically receive at each balance sheet reporting date based on the liquidation provisions of the respective operating partnership agreements. HLBV assumes that the proceeds available for distribution are equivalent to the unadjusted, stand-alone net assets of each respective partnership, as determined under U.S. GAAP. The third party non-controlling interests in the consolidated statements of operations and statements of comprehensive loss are determined based on the difference in the carrying amounts of non-controlling interests on the consolidated balance sheets between reporting dates, adjusted for any capital transactions between the Company and third party investors that occurred during the respective period.
Where, prior to the commencement of operating activities for a respective renewable energy facility, HLBV results in an immediate change in the carrying value of non-controlling interest on the consolidated balance sheet due to the recognition of ITCs or other adjustments as required by the U.S. Internal Revenue Code, the Company defers the recognition of the respective adjustments and recognizes the adjustments in non-controlling interest on the consolidated statement of operations on a straight-line basis over the expected life of the underlying assets giving rise to the respective difference. Similarly, where the Company has acquired a controlling interest in a partnership and there is a resulting difference between the initial fair value of non-controlling interest and the value of non-controlling interest as measured using HLBV, the Company initially records non-controlling interest at fair value and amortizes the resulting difference over the remaining life of the underlying assets.
Contingencies
The Company is involved in conditions, situations or circumstances in the ordinary course of business with possible gain or loss contingencies that will ultimately be resolved when one or more future events occur or fail to occur. If some amount within a range of loss appears at the time to be a better estimate than any other amount within the range, that amount will be accrued. When no amount within the range is a better estimate than any other amount, the minimum amount in the range will be accrued. The Company continually evaluates uncertainties associated with loss contingencies and records a charge equal to at least the minimum estimated liability for a loss contingency when both of the following conditions are met: (i) information available prior to the issuance of the financial statements indicates that it is probable that an asset had been impaired or a liability had been incurred at the date of the financial statements; and (ii) the loss or range of loss can be reasonably estimated. Legal costs are expensed when incurred. Gain contingencies are not recorded until realized or realizable.
Derivative Financial Instruments
The Company recognizes its derivative instruments as assets or liabilities at fair value in the consolidated balance sheets. Accounting for changes in the fair value (i.e., gains or losses) of a derivative instrument depends on whether it has been designated as part of a hedging relationship and the type of hedging relationship.
The effective portion of changes in fair value of derivative instruments designated as cash flow hedges is reported as a component of other comprehensive income. Changes in the fair value of these derivatives are subsequently reclassified into earnings in the period that the hedged transaction affects earnings. The ineffective portion of changes in fair value is recorded as a component of net loss in the consolidated statements of operations.
The change in fair value of undesignated derivative instruments is reported as a component of net loss in the consolidated statements of operations.
Fair Value Measurements
The Company performs fair value measurements defined as the price that would be received from selling an asset or paid to transfer a liability in an orderly transaction between market participants at the measurement date. When determining the
96
fair value measurements for assets and liabilities required to be recorded at their fair values, the Company considers the principal or most advantageous market in which it would transact and considers assumptions that market participants would use when pricing the assets or liabilities, such as inherent risk, transfer restrictions and risk of nonperformance.
In determining fair value measurements, the Company maximizes the use of observable inputs and minimizes the use of unobservable inputs. Assets and liabilities are categorized within a fair value hierarchy based upon the lowest level of input that is significant to the fair value measurement:
• | Level 1: Quoted prices in active markets for identical assets or liabilities; |
• | Level 2: Inputs other than Level 1 that are observable, either directly or indirectly, such as quoted prices in active markets for similar assets or liabilities, quoted prices for identical or similar assets or liabilities in markets that are not active or other inputs that are observable or can be corroborated by observable market data for substantially the full term of the assets or liabilities; or |
• | Level 3: Unobservable inputs that are supported by little or no market activity and that are significant to the fair values of the assets or liabilities. |
The Company maintains various financial instruments recorded at cost in the consolidated balance sheets that are not required to be recorded at fair value. For cash and cash equivalents, restricted cash, accounts receivable, prepaid expenses and other current assets, accounts payable, accrued expenses and other current liabilities and due to affiliates, net, the carrying amount approximates fair value because of the short-term maturity of the instruments. See Note 14. Fair Value of Financial Instruments for disclosures related to the fair value of the Company's derivative instruments and long-term debt.
Foreign Operations
The Company's reporting currency is the U.S. dollar. Certain of the Company's subsidiaries maintain their records in local currencies other than the U.S. dollar, which are their functional currencies. When a subsidiary’s local currency is considered its functional currency, the Company translates its assets and liabilities to U.S. dollars using exchange rates in effect at the balance sheet date and its revenue and expense accounts to U.S. dollars at average exchange rates for the period. Translation adjustments are reported in accumulated other comprehensive income in stockholders’ equity. Transaction gains and losses and changes in fair value of the Company's foreign exchange derivative contracts not accounted for under hedge accounting are included in results of operations as incurred. (Gain) loss on foreign currency exchange, net was $(6.1) million, $13.0 million and $19.5 million during the years ended December 31, 2017, 2016 and 2015, respectively, as reported in the consolidated statements of operations.
Business Combinations
The Company accounts for its business combinations by recognizing in the financial statements the identifiable assets acquired, the liabilities assumed and any non-controlling interests in the acquiree at fair value at the acquisition date. The Company also recognizes and measures the goodwill acquired or a gain from a bargain purchase in the business combination and determines what information to disclose to enable users of an entity's financial statements to evaluate the nature and financial effects of the business combination. In addition, acquisition costs related to business combinations are expensed as incurred.
When the Company acquires renewable energy facilities, the purchase price is allocated to (i) the acquired tangible assets and liabilities assumed, primarily consisting of land, plant and long-term debt, (ii) the identified intangible assets and liabilities, primarily consisting of the value of favorable and unfavorable rate PPAs and REC agreements and the in-place value of market rate PPAs, (iii) non-controlling interests, and (iv) other working capital items based in each case on their fair values.
The Company generally uses independent appraisers to assist with the estimates and methodologies used such as a replacement cost approach, or an income approach or excess earnings approach. Factors considered by the Company in its analysis include considering current market conditions and costs to construct similar facilities. The Company also considers information obtained about each facility as a result of its pre-acquisition due diligence in estimating the fair value of the tangible and intangible assets and liabilities acquired or assumed. In estimating the fair value the Company also establishes estimates of energy production, current in-place and market power purchase rates, tax credit arrangements and operating and maintenance costs. A change in any of the assumptions above, which are subjective, could have a significant impact on the results of operations.
97
The allocation of the purchase price directly affects the following items in the consolidated financial statements:
• | The amount of purchase price allocated to the various tangible and intangible assets, liabilities and non-controlling interests on the balance sheet; |
• | The amounts allocated to the value of favorable and unfavorable rate PPAs and REC agreements are amortized to revenue over the remaining non-cancelable terms of the respective arrangement. The amounts allocated to all other tangible assets and intangibles are amortized to depreciation or amortization expense, with the exception of favorable and unfavorable rate land leases and unfavorable rate O&M contracts which are amortized to cost of operations; and |
• | The period of time over which tangible and intangible assets and liabilities are depreciated or amortized varies, and thus, changes in the amounts allocated to these assets and liabilities will have a direct impact on the Company's results of operations. |
Stock-Based Compensation
Stock-based compensation expense for all share-based payment awards to employees who provide services to the Company is based on the estimated grant-date fair value. The Company recognizes these compensation costs net of an estimated forfeiture rate for only those shares expected to vest on a straight-line basis over the requisite service period of the award, which is generally the award vesting term. For ratable awards, the Company recognizes compensation costs for all grants on a straight-line basis over the requisite service period of the entire award.
Assets Held for Sale
The Company records assets held for sale at the lower of the carrying value or fair value less costs to sell. The following criteria are used to determine if property is held for sale: (i) management has the authority and commits to a plan to sell the property; (ii) the property is available for immediate sale in its present condition; (iii) there is an active program to locate a buyer and the plan to sell the property has been initiated; (iv) the sale of the property is probable within one year; (v) the property is being actively marketed at a reasonable price relative to its current fair value; and (vi) it is unlikely that the plan to sell will be withdrawn or that significant changes to the plan will be made.
In determining the fair value of the assets less costs to sell, the Company considers factors including current sales prices for comparable assets in the region, recent market analysis studies, appraisals and any recent legitimate offers. If the estimated fair value less costs to sell of an asset is less than its current carrying value, the asset is written down to its estimated fair value less costs to sell. Due to uncertainties in the estimation process, it is reasonably possible that actual results could differ from the estimates used in the Company's historical analysis. The Company's assumptions about project sale prices require significant judgment because the current market is highly sensitive to changes in economic conditions. The Company estimates the fair values of assets held for sale based on current market conditions and assumptions made by management, which may differ from actual results and may result in additional impairments if market conditions deteriorate.
When assets are classified as held for sale, the Company does not record depreciation or amortization for the respective renewable energy facilities or intangibles.
Restructuring
The Company accounts for restructuring costs in accordance with ASC 712 and ASC 420, as applicable. In connection with the consummation of the Merger and the expected relocation of the headquarters of the Company to New York, New York, the Company announced a restructuring plan that went into effect upon the closing of the Merger. The Company recognized $3.7 million of severance and transition bonus costs related to this restructuring within general and administrative expenses in the consolidated statement of operations for the year ended December 31, 2017, of which $1.0 million was paid in the fourth quarter of 2017.
Recently Adopted Accounting Standards
In March 2016, the Financial Accounting Standards Board (“FASB”) issued Accounting Standards Update (“ASU”) No. 2016-09, Compensation - Stock Compensation (Topic 718). This update was issued as part of the FASB's simplification initiative and affects all entities that issue share-based payment awards to their employees. The amendments in this update cover such areas as the recognition of excess tax benefits and deficiencies, the classification of those excess tax benefits on the
98
statement of cash flows, an accounting policy election for forfeitures, the amount an employer can withhold to cover income taxes and still qualify for equity classification and the classification of those taxes paid on the statement of cash flows. This update is effective for annual and interim periods beginning after December 15, 2016, with early adoption permitted if all provisions are adopted within the same period. The Company adopted ASU No. 2016-09 as of January 1, 2017, which did not result in any material adjustments to the Company's consolidated financial statements and related disclosures.
In March 2016, the FASB issued ASU No. 2016-06, Derivatives and Hedging (Topic 815), which clarifies that determining whether the economic characteristics of a put or call are clearly and closely related to its debt host requires only an assessment of the four-step decision sequence outlined in FASB ASC paragraph 815-15-25-24. Additionally, entities are not required to separately assess whether the contingency itself is clearly and closely related. This standard is effective for annual and interim periods beginning after December 15, 2016, with early adoption permitted. The amendments in this update should be applied on a modified retrospective basis. The adoption of ASU No. 2016-06 as of January 1, 2017 did not have an impact on the Company's consolidated financial statements.
In October 2016, the FASB issued ASU No. 2016-17, Consolidation (Topic 810), Interests Held through Related Parties That Are under Common Control. ASU No. 2016-17 updates ASU No. 2015-02. Under the amendments, a single decision maker is not required to consider indirect interests held through related parties that are under common control with the single decision maker to be the equivalent of direct interests in their entirety. Instead, a single decision maker is required to include those interests on a proportionate basis consistent with indirect interests held through other related parties. ASU No. 2016-17 is effective for annual reporting periods beginning after December 15, 2016, and interim periods within those annual periods, with early adoption permitted. The adoption of ASU No. 2016-17 as of January 1, 2017 did not have an impact on the Company's consolidated financial statements.
In November 2016, the FASB issued ASU No. 2016-18, Statement of Cash Flows (Topic 320), Restricted Cash, a Consensus of the FASB Emerging Issues Task Force. The amendments require that a statement of cash flows explain the change during the period in the total of cash, cash equivalents and amounts generally described as restricted cash or restricted cash equivalents. Therefore, amounts generally described as restricted cash and restricted cash equivalents should be included with cash and cash equivalents when reconciling the beginning-of-period and end-of-period total amounts shown on the statement of cash flows. The Company elected to early adopt ASU No. 2016-18 during the second quarter of 2017, which requires retrospective application, and has revised its consolidated statements of cash flows for the years ended December 31, 2016 and 2015. Net cash used in investing activities for the years ended December 31, 2016 and 2015 decreased by $13.8 million and $88.0 million, respectively, as a result of the adoption of this standard. The sum of the Company's cash and cash equivalents of $565.3 million, current portion of restricted cash of $114.9 million and non-current portion of restricted cash of $2.6 million reported within the consolidated balance sheet as of December 31, 2016 equals the beginning balance of cash, cash equivalents and restricted cash of $682.8 million shown in the consolidated statement of cash flows for the year ended December 31, 2017. The sum of the Company's cash and cash equivalents of $128.1 million, current portion of restricted cash of $54.0 million and non-current portion of restricted cash of $42.7 million reported within the consolidated balance sheet as of December 31, 2017 equals the ending balance of cash, cash equivalents and restricted cash of $224.8 million shown in the consolidated statement of cash flows for the year ended December 31, 2017. The Company had $54.8 million of restricted cash classified within assets held for sale as of December 31, 2016, with no comparable amount as of December 31, 2015, and thus had to add this reclassification amount to the net change in cash, cash equivalents and restricted cash classified within assets held for sale line reported in the consolidated statement of cash flows for the year ended December 31, 2016 to reconcile the change in the beginning and end-of-period cash, cash equivalents and restricted cash. The Company's restricted cash balances during 2016 and 2015 also included amounts related to its renewable energy facilities located in the United Kingdom (the “U.K.”) and Canada, which resulted in a $7.9 million and $2.5 million change in the effect of exchange rate changes on cash, cash equivalents and restricted cash line reported in the consolidated statements of cash flows for the years ended December 31, 2016 and 2015, respectively.
In December 2016, the FASB issued ASU No. 2016-19, Technical Corrections and Improvements. The amendments cover a wide range of topics in the Accounting Standards Codification, covering differences between original guidance and the Accounting Standards Codification, guidance clarification and reference corrections, simplification and minor improvements. The adoption of ASU No. 2016-19 is effective for annual periods, including interim periods within those annual periods, beginning after December 15, 2016. The Company evaluated this standard and determined that it did not have an impact on its consolidated financial statements.
99
Recently Issued Accounting Standards Not Yet Adopted
In May 2014, the FASB issued ASU No. 2014-09, Revenue from Contracts with Customers (Topic 606), which requires an entity to recognize the amount of revenue to which it expects to be entitled for the transfer of promised goods or services to customers. ASU No. 2014-09 will replace most existing revenue recognition guidance in U.S. GAAP when it becomes effective. In March 2016, the FASB issued ASU No. 2016-08, Revenue from Contracts with Customers (Topic 606), Principal versus Agent Considerations (Reporting Revenue Gross versus Net), which clarifies how to apply the implementation guidance on principal versus agent considerations related to the sale of goods or services to a customer as updated by ASU No. 2014-09. ASU No. 2014-09 and ASU No. 2016-08 will become effective for the Company on January 1, 2018. ASU No. 2014-09 and ASU No. 2016-08 permit the use of either the retrospective or modified retrospective method.
The Company has analyzed the impact of Topic 606 on its revenue contracts which primarily include bundled energy and incentive sales through PPAs, individual REC sales, and upfront sales of federal & state incentive benefits recorded as deferred revenue and accreted into revenue. The Company has determined to apply a modified retrospective approach with a cumulative adjustment to accumulated deficit as of January 1, 2018 for changes to revenue recognition resulting from Topic 606 adoption.
The Company accounts for the majority of its PPAs as operating leases under ASC 840, Leases and recognizes rental income as revenue when the electricity is delivered. The Company has elected not to early adopt ASC 842, Leases in fiscal 2018 and therefore these PPAs are currently being evaluated in anticipation of the new lease standard adoption in fiscal 2019. For the bundled PPAs under the scope of Topic 606 in fiscal 2018, we concluded there will be no material change to revenue recognition patterns from current accounting practice.
The Company has evaluated the impact of Topic 606 as it relates to the individual sale of RECs. In certain jurisdictions, there may be a lag between physical generation of the underlying energy and the transfer of RECs to the customer due to administrative processes imposed by state regulations. Under the Company’s current accounting policy, the revenue is recognized as the underlying electricity is generated if the sale has been contracted with the customer. Based on the framework in Topic 606, for a portion of the existing individual REC sale arrangements where the transfer of control to the customer is determined to occur upon the transfer of the RECs, the Company will initiate revenue recognition commensurate with the transfer of RECs to the customer as compared to the generation of the underlying energy under the current accounting policy. The adoption of Topic 606 is expected to result in an increase in accumulated deficit on January 1, 2018 of approximately $25 million. The Company expects the impact on its fiscal 2018 results of operations will be minimal.
The Company has evaluated the impact of Topic 606 as it relates to the upfront sale of ITCs through its lease pass-through fund arrangements. The Company has concluded that revenue related to the sale of ITCs through its lease pass-through arrangements will be recognized at the point in time when the related solar energy systems are placed in service. Currently, the Company recognizes this revenue evenly over the five-year ITC recapture period. The adoption of Topic 606 is anticipated to be material to fiscal 2018. The adjustment on January 1, 2018 from the adoption is expected to decrease accumulated deficit by approximately $41 million. The Company expects the impact on its fiscal 2018 results of operations to result in a decrease in non-cash deferred revenue recognition of approximately $16 million.
In February 2016, the FASB issued ASU No. 2016-02, Leases (Topic 842), which primarily changes the lessee's accounting for operating leases by requiring recognition of lease right-of-use assets and lease liabilities. The Company expects to adopt the standard on January 1, 2019. The issued guidance requires a modified retrospective transition approach, which requires entities to recognize and measure leases at the beginning of the earliest period presented. In January 2018, the FASB proposed amending the standard to give entities another option for transition. The proposed transition method would allow entities to initially apply the requirements of the standard in the period of adoption (January 1, 2019). The Company will assess this transition option if the FASB issues the revised standard. The Company expects to elect certain of the practical expedients permitted in the issued standard, including the expedient that permits the Company to retain its existing lease assessment and classification. In January 2018, the FASB issued additional guidance which provides another optional transition practical expedient that allows entities to not evaluate existing and expired land easements under the new guidance at adoption if they were not previously accounted for as leases. The Company is currently working through an adoption plan which includes the evaluation of lease contracts compared to the new standard. While the Company is currently evaluating the impact the new guidance will have on its financial position and results of operations, the Company expects to recognize lease liabilities and
100
right of use assets. The extent of the increase to assets and liabilities associated with these amounts remains to be determined pending the Company’s review of its existing lease contracts which may contain embedded leases.
In August 2016, the FASB issued ASU No. 2016-15, Statement of Cash Flows (Topic 230), Classification of Certain Cash Receipts and Cash Payments. The amendments of ASU No. 2016-15 were issued to address eight specific cash flow issues for which stakeholders have indicated to the FASB that a diversity in practice existed in how entities were presenting and classifying these items in the statement of cash flows. The issues addressed by ASU No. 2016-15 include but are not limited to the classification of debt prepayment and debt extinguishment costs, payments made for contingent consideration for a business combination, proceeds from the settlement of insurance proceeds, distributions received from equity method investees and separately identifiable cash flows and the application of the predominance principle. The amendments of ASU No. 2016-15 are effective for public entities for fiscal years beginning after December 15, 2017 and interim periods in those fiscal years. The adoption of ASU No. 2016-15 is required to be applied retrospectively. The Company does not expect this standard to have a material impact on its consolidated statements of cash flows.
In October 2016, the FASB issued ASU No. 2016-16, Income Taxes (Topic 740), Intra-Entity Transfers of Assets Other Than Inventory. The amendments of ASU No. 2016-16 were issued to improve the accounting for the income tax consequences of intra-entity transfers of assets other than inventory. Current GAAP prohibits the recognition of current and deferred income taxes for an intra-entity asset transfer until the asset has been sold to an outside party which has resulted in diversity in practice and increased complexity within financial reporting. The amendments of ASU No. 2016-16 would require an entity to recognize the income tax consequences of an intra-entity transfer of an asset other than inventory when the transfer occurs and do not require new disclosure requirements. The amendments of ASU No. 2016-16 are effective for annual reporting periods beginning after December 15, 2017, and interim periods within those annual periods. The adoption of ASU No. 2016-16 should be applied on a modified retrospective basis through a cumulative-effect adjustment directly to retained earnings as of the beginning of the period of adoption. The Company does not expect this standard to have an impact on its consolidated financial statements.
In January 2017, the FASB issued ASU No. 2017-01, Business Combinations (Topic 805), Clarifying the Definition of a Business. The amendment seeks to clarify the definition of a business with the objective of adding guidance to assist entities with evaluating whether transactions should be accounted for as acquisitions (or disposals) of assets or businesses. The definition of a business affects many areas of accounting including acquisitions, disposals, goodwill and consolidation. The adoption of ASU No. 2017-01 is effective for annual periods beginning after December 15, 2017, including interim periods within those periods. The amendments should be applied prospectively on or after the effective dates. Accordingly, the adoption will not have an effect on the Company's historical financial statements.
In January 2017, the FASB issued ASU No. 2017-04, Intangibles - Goodwill and Other (Topic 350), Simplifying the Test for Goodwill Impairment. The amendment simplifies the accounting for goodwill impairment by removing Step 2 of the current test, which requires calculation of a hypothetical purchase price allocation. Under the revised guidance, goodwill impairment will be measured as the amount by which a reporting unit’s carrying value exceeds its fair value, not to exceed the carrying amount of goodwill (currently Step 1 of the two step impairment test). Entities will continue to have the option to perform a qualitative assessment to determine if a quantitative impairment test is necessary. The standard is effective January 1, 2020, with early adoption permitted, and must be adopted on a prospective basis. This updated guidance is not currently expected to impact the Company's financial reporting as the Company does not have any goodwill. The Company will evaluate the impact of this standard in the future should it consummate any acquisition that results in the recognition of goodwill.
In February 2017, the FASB issued ASU No. 2017-05, Other Income - Gains and Losses from the Derecognition of Nonfinancial Assets (Subtopic 610-20): Clarifying the Scope of Asset Derecognition Guidance and Accounting for Partial Sales of Nonfinancial Assets. This ASU is meant to clarify the scope of ASC Subtopic 610-20, Other Income - Gains and Losses from the Derecognition of Nonfinancial Assets and to add guidance for partial sales of nonfinancial assets. ASU No. 2017-05 is to be applied using a full retrospective method or a modified retrospective method as outlined in the guidance and is effective at the same time as ASU No. 2014-09. Further, the Company is required to adopt ASU No. 2017-05 at the same time that it adopts the guidance in ASU No. 2014-09. The Company is currently evaluating the effect of this standard on its consolidated financial statements.
In May 2017, the FASB issued ASU No. 2017-09, Compensation - Stock Compensation (Topic 718): Scope of Modification Accounting. The amendment clarifies when changes to the terms or conditions of a share-based payment award must be accounted for as a modification. The new guidance is expected to reduce diversity in practice and result in fewer
101
changes to the terms of an award being accounted for as a modification. Changes to the terms or conditions of a share-based payment award that do not impact the fair value of the award, vesting conditions and the classification as an equity or liability instrument will not need to be assessed under modification accounting. The guidance is effective for annual periods, and interim periods within those annual periods, beginning after December 15, 2017. The amendments in this update should be applied prospectively to an award modified on or after the adoption date. Accordingly, the adoption will not have an effect on the Company's historical financial statements.
In August 2017, the FASB issued ASU No. 2017-12, Derivatives and Hedging (Topic 815): Targeted Improvements to Accounting for Hedging Activities. This ASU amends the hedge accounting model to enable entities to better portray the economics of their risk management activities in the financial statements and simplifies the application of hedge accounting in certain situations. ASU No. 2017-12 is effective for annual periods, and interim periods within those annual periods, beginning after December 15, 2018, with early adoption permitted. The Company is currently evaluating the effect of this standard on its consolidated financial statements.
In February 2018, the FASB issued ASU No. 2018-02, Reclassification of Certain Tax Effects from Accumulated Other Comprehensive Income, to help entities address certain stranded income tax effects in accumulated other comprehensive income resulting from the U.S. government's enactment of the Tax Cuts and Jobs Act (the “Tax Act”) on December 22, 2017. The amendment provides entities with an option to reclassify stranded tax effects within accumulated other comprehensive income to retained earnings in each period in which the effect of the change in the U.S. federal corporate income tax rate in the Tax Act (or portion thereof) is recorded. The amendment also includes disclosure requirements regarding the issuer’s accounting policy for releasing income tax effects from accumulated other comprehensive income. The optional guidance is effective for annual periods, and interim periods within those annual periods, beginning after December 15, 2018. Early adoption is permitted, and entities should apply the provisions of the amendment either in the period of adoption or retrospectively to each period (or periods) in which the effect of the change in the U.S. federal corporate income tax rate in the Tax Act is recognized. The Company is currently evaluating whether it will adopt the new guidance along with any related impacts it may have on the Company’s consolidated financial statements.
3. TRANSACTIONS BETWEEN ENTITIES UNDER COMMON CONTROL
Acquisitions of Renewable Energy Facilities from SunEdison
The following tables summarize the renewable energy facilities acquired by the Company from SunEdison through a series of transactions during the years ended December 31, 2016 and 2015. There were no renewable energy facilities acquired from SunEdison during the year ended December 31, 2017. As TerraForm Power was a controlled affiliate of SunEdison during 2016 and 2015, the assets and liabilities transferred to the Company from SunEdison related to interests under common control with SunEdison, and accordingly, were recorded at historical cost. The difference between the cash purchase price and historical cost of the net assets acquired was recorded as a contribution or distribution from SunEdison, as applicable, upon final funding of the acquisition.
Year Ended December 31, 2016 | As of December 31, 2016 | |||||||||||||||||||||||||
Facility Category | Type | Location | Nameplate Capacity (MW) | Number of Sites | Cash Paid1 | Cash Due to SunEdison2 | Debt Assumed | Debt Transferred3 | ||||||||||||||||||
Distributed Generation | Solar | U.S. | 1.2 | 3 | $ | 2,750 | $ | — | $ | — | $ | — | ||||||||||||||
Utility | Solar | U.S. | 18.0 | 1 | 36,231 | — | — | — | ||||||||||||||||||
Total | 19.2 | 4 | $ | 38,981 | $ | — | $ | — | $ | — | ||||||||||||||||
————
(1) | Represents the total amount paid to SunEdison. Excludes aggregated tax equity partner payments of $1.6 million to SunEdison. |
(2) | All amounts were paid to SunEdison for these renewable energy facilities as of December 31, 2016. |
(3) | $16.7 million of construction debt existed for one of the renewable energy facilities as of the acquisition date. This debt was fully repaid by SunEdison during the third quarter of 2016 using cash proceeds paid by the Company to SunEdison for the acquisition of the facility. |
102
Year Ended December 31, 2015 | As of December 31, 2015 | |||||||||||||||||||||||||
Facility Category | Type | Location | Nameplate Capacity (MW) | Number of Sites | Cash Paid1 | Cash Due to SunEdison2 | Debt Assumed3 | Debt Transferred4 | ||||||||||||||||||
Distributed Generation | Solar | U.S. | 91.5 | 74 | $ | 155,573 | $ | 2,600 | $ | — | $ | — | ||||||||||||||
Residential | Solar | U.S. | 12.9 | 1,806 | 25,053 | — | — | — | ||||||||||||||||||
Utility | Solar | U.S. | 54.8 | 9 | 69,868 | 14,341 | — | 14,475 | ||||||||||||||||||
Utility | Solar | U.K. | 214.3 | 14 | 150,595 | — | 205,587 | — | ||||||||||||||||||
Utility | Wind | U.S. | 200.0 | 1 | 127,000 | — | — | — | ||||||||||||||||||
Total | 573.5 | 1,904 | $ | 528,089 | $ | 16,941 | $ | 205,587 | $ | 14,475 | ||||||||||||||||
————
(1) | Represents the amount paid to SunEdison as of December 31, 2015. Excludes aggregated tax equity partner payments of $363.6 million to SunEdison, of which $0.7 million was refunded to the respective tax equity partner for one of the acquired projects in 2016. |
(2) | Represents commitments by the Company to SunEdison for the amount required for SunEdison to complete the construction of renewable energy facilities acquired from SunEdison, which was paid to SunEdison during the first quarter of 2016. Excludes tax equity partner payments of $9.2 million due to SunEdison, which were paid during the first quarter of 2016. |
(3) | Represents debt that was assumed by the Company as of the acquisition date of these facilities which was subsequently refinanced on November 6, 2015 (see Note 11. Long-term Debt). |
(4) | Represents debt that was recorded on the Company's balance sheet as of such date. This debt was repaid by SunEdison during the first quarter of 2016 using cash proceeds paid by the Company and the tax equity partner to SunEdison for the acquisition of these facilities. |
The difference between the cash paid and historical cost of the net assets acquired from SunEdison for projects that achieved final funding during the years ended December 31, 2016 and 2015 was $19.5 million and $41.8 million, respectively, and was recorded as a net contribution from SunEdison, which is reflected within Net SunEdison investment on the consolidated statements of stockholders' equity.
The operating revenues of the facilities acquired from SunEdison in 2016 and 2015 reflected in the consolidated statements of operations for the years ended December 31, 2016 and 2015, respectively, are $2.3 million and $37.6 million. The net income (loss) of the facilities acquired from SunEdison in 2016 and 2015 reflected in the consolidated statements of operations for the years ended December 31, 2016 and 2015, respectively, are $0.7 million and $(3.9) million.
4. ASSETS HELD FOR SALE
U.K. Portfolio Sale
The Company commenced a sale of substantially all of its portfolio of solar power plants located in the U.K. through a broad based sales process pursuant to a plan approved by management during 2016 (24 operating projects for sale representing an aggregate 365.0 MW, the “U.K. Portfolio”), and it was determined that this portfolio met the criteria to be classified as held for sale during the first quarter of 2016. As a result, the Company classified the assets and liabilities of this portfolio as held for sale as of December 31, 2016 (refer to the table below) and measured each at the lower of carrying value or fair value less costs to sell. The Company's analysis indicated that the fair value less costs to sell exceeded the carrying value of the assets for each period the portfolio was classified as held for sale.
On May 11, 2017, the Company announced that TerraForm Power Operating, LLC (“Terra Operating LLC”) completed its sale of the U.K. Portfolio to Vortex Solar UK Limited, a renewable energy platform managed by the private equity arm of EFG Hermes, an investment bank. Terra Operating LLC received approximately $214.1 million of proceeds from the sale, which was net of transaction expenses of $3.9 million and distributions taken from the U.K. Portfolio after announcement and before closing of the sale. The Company also disposed of $14.8 million of cash and cash equivalents and $21.8 million of restricted cash as a result of the sale. The proceeds were used for the reduction of the Company's indebtedness (a $30.0 million prepayment for the Midco Portfolio Term Loan (as defined in Note 11. Long-term Debt) and the remainder was applied towards revolving loans outstanding under the Revolver (also defined in Note 11. Long-term Debt)). The sale also resulted in a reduction in the Company's non-recourse project debt by approximately 301 million British Pounds (“GBP”) at the U.K. Portfolio level. The Company recognized a gain on the sale of $37.1 million which is reflected within gain on sale of
103
renewable energy facilities in the consolidated statement of operations for the year ended December 31, 2017. The Company has retained an 11.1 MW solar asset in the U.K., which is not held for sale.
Residential Portfolio Sale
The Company also began exploring a sale of substantially all of its portfolio of residential rooftop solar assets located in the United States (11.4 MW of assets as described below) through a strategic sales process in 2016, and it was determined that these assets met the criteria to be classified as held for sale during the fourth quarter of 2016. As a result, the Company classified the related assets and liabilities as held for sale as of December 31, 2016 (refer to the table below) and measured each at the lower of carrying value or fair value less costs to sell. The Company's analysis indicated that the carrying value of the assets exceeded the fair value less costs to sell, and thus an impairment charge of $15.7 million was recognized within impairment of renewable energy facilities in the consolidated statement of operations for the year ended December 31, 2016. The Company also recorded a $3.3 million charge within impairment of renewable energy facilities for the year ended December 31, 2016 due to the decision to abandon certain residential construction in progress assets that were not completed by SunEdison as a result of the SunEdison Bankruptcy.
In the first half of 2017, the Company closed on the sale of 100% of the membership interests of Enfinity Colorado DHA 1, LLC, a Colorado limited liability company that owns and operates 2.5 MW of solar installations situated on the roof of public housing units located in Colorado and owned by the Denver Housing Authority, and 100% of the membership interests of TerraForm Resi Solar Manager, LLC, a subsidiary of the Company that owns and operates 8.9 MW of rooftop solar installations, to Greenbacker Residential Solar II, LLC. The Company received proceeds of $7.1 million during 2017 as a result of the sale of these companies and also disposed of $0.6 million of cash and cash equivalents and $0.8 million of restricted cash. There was no additional loss recognized during 2017 as a result of these sales.
The Company sold its remaining 0.3 MW of residential assets (that were not classified as held for sale as of December 31, 2016) during the third quarter of 2017. These assets did not meet the criteria for held for sale classification in the second quarter of 2017 but the Company determined that certain impairment indicators were present and as a result recognized an impairment charge of $1.4 million during the second quarter which is reflected within impairment of renewable energy facilities in the consolidated statement of operations for the year ended December 31, 2017. There was no additional loss recognized during the second half of 2017 as a result of the sale.
104
The following table summarizes the major classes of assets and liabilities which are classified as held for sale on the Company's consolidated balance sheet as of December 31, 2016. As discussed above, the Company closed on the sale of these renewable energy facilities in the first half of 2017.
As of December 31, 2016 | ||||||||||||
(In thousands) | U.K. Portfolio | Residential Portfolio | Total | |||||||||
Assets held for sale: | ||||||||||||
Restricted cash | $ | 53,604 | $ | 1,202 | $ | 54,806 | ||||||
Accounts receivable, net | 4,952 | 300 | 5,252 | |||||||||
Prepaid expenses and other current assets | 1,295 | 170 | 1,465 | |||||||||
Total current assets held for sale | 59,851 | 1,672 | 61,523 | |||||||||
Renewable energy facilities, net | 529,154 | 19,534 | 548,688 | |||||||||
Intangible assets, net | 1,480 | — | 1,480 | |||||||||
Other assets | 2,103 | — | 2,103 | |||||||||
Total non-current assets held for sale | 532,737 | 19,534 | 552,271 | |||||||||
Total assets held for sale | $ | 592,588 | $ | 21,206 | $ | 613,794 | ||||||
Liabilities related to assets held for sale: | ||||||||||||
Current portion of long-term debt | $ | 14,510 | $ | 175 | $ | 14,685 | ||||||
Accounts payable, accrued expenses and other current liabilities | 5,980 | 245 | 6,225 | |||||||||
Deferred revenue | — | 10 | 10 | |||||||||
Due to affiliates, net | 692 | 186 | 878 | |||||||||
Total current liabilities related to assets held for sale | 21,182 | 616 | 21,798 | |||||||||
Long-term debt, less current portion | 349,687 | 4,190 | 353,877 | |||||||||
Deferred revenue, less current portion | — | 246 | 246 | |||||||||
Asset retirement obligations | 39,563 | 287 | 39,850 | |||||||||
Other long-term liabilities | 16,786 | — | 16,786 | |||||||||
Total non-current liabilities related to assets held for sale | 406,036 | 4,723 | 410,759 | |||||||||
Total liabilities related to assets held for sale | $ | 427,218 | $ | 5,339 | $ | 432,557 | ||||||
5. ACQUISITIONS
2015 Acquisitions
Acquisition of First Wind
On January 29, 2015, the Company, through Terra LLC, acquired from First Wind Holdings, LLC (together with its subsidiaries, “First Wind”) operating renewable energy facilities that have a combined nameplate capacity of 521.1 MW, including 500.0 MW of wind power plants and 21.1 MW of solar generation facilities (the “First Wind Acquisition”). The operating renewable energy facilities the Company acquired are located in Maine, New York, Hawaii, Vermont and Massachusetts and are contracted under PPAs including energy hedge contracts. Certain of the renewable energy facilities also receive revenue from RECs. The cash purchase price for this acquisition was $811.6 million, net of cash acquired.
During the year ended December 31, 2015, the Company acquired an operating wind facility located in Texas and seven solar generation facilities located in Utah from SunEdison with a combined nameplate capacity of 222.6 MW. These facilities were initially acquired by SunEdison from First Wind on January 29, 2015. The purchase price paid by SunEdison to the third party for these facilities was $168.4 million, net of cash acquired. The acquisitions were treated as transactions
105
between entities under common control and as a result the acquisition accounting as of January 29, 2015 by SunEdison has been reflected in the Company's consolidated financial statements.
Acquisition of Northern Lights Solar Generation Facilities
On June 30, 2015, the Company acquired two utility-scale, ground mounted solar generation facilities (“Northern Lights”) from Invenergy Solar LLC. The facilities are located in Ontario, Canada and have a combined nameplate capacity of 25.4 MW. The facilities are contracted under long-term PPAs with an investment grade utility that had a credit rating of Aa2 as of the acquisition date. The purchase price for this acquisition was 125.4 million Canadian Dollars (“CAD”) (equivalent of $101.1 million on the acquisition date), net of cash acquired, including the repayment of project-level debt and breakage fees for the termination of interest rate swaps.
Acquisition of Invenergy Wind Power Plants
On December 15, 2015, the Company acquired operating wind power plants with a combined nameplate capacity of 831.5 MW (net) from Invenergy Wind Global LLC (together with its subsidiaries, “Invenergy Wind”) for $1.3 billion in cash and the assumption of $531.2 million of non-recourse indebtedness. The wind power plants that the Company acquired from Invenergy Wind have contracted PPAs and had an average counterparty credit rating of AA as of the acquisition date. Invenergy Wind retained a 9.9% non-controlling interest in the wind power plants located in the U.S. that the Company acquired and is providing certain O&M services for such assets.
Acquisition of Integrys Solar Generation Facilities
During the year ended December 31, 2015, the Company acquired 56 solar generation facilities with a combined nameplate capacity of 32.0 MW (net) from Integrys Group, Inc. (“Integrys”) for a purchase price of $70.7 million, net of cash acquired, and $15.9 million of project-level debt assumed. The facilities are located in Arizona, California, Connecticut, Massachusetts, New Jersey and Pennsylvania. The facilities are contracted under long-term PPAs with commercial and municipal customers.
Acquisition of Other Solar Generation Facilities
During the year ended December 31, 2015, the Company acquired two solar generation facilities from SunEdison with a combined nameplate capacity of 38.8 MW. These facilities were initially acquired by SunEdison through other unaffiliated third parties during the year ended December 31, 2015. The purchase price paid by SunEdison to the third parties for these acquisitions was $18.9 million, net of cash acquired. The acquisitions were treated as transactions between entities under common control and as a result the acquisition accounting by SunEdison has been reflected in the Company's consolidated financial statements.
During the year ended December 31, 2015, the Company acquired 10 solar generation facilities with a combined nameplate capacity of 3.8 MW for a purchase price of $19.9 million, net of cash acquired. The facilities are located in Ontario, Canada.
106
Acquisition Accounting for the 2015 Acquisitions
The acquisition accounting for the First Wind, Northern Lights, Integrys and other solar generation facilities acquisitions was completed as of the fourth quarter of 2015, at which point the provisional fair values became final. The final acquisition-date fair values of assets, liabilities and non-controlling interests for these business combinations, were as follows:
(In thousands) | First Wind | Other First Wind1 | Northern Lights | Integrys | Other | ||||||||||||||
Renewable energy facilities in service | $ | 795,462 | $ | — | $ | 62,018 | $ | 69,935 | $ | 7,931 | |||||||||
Construction in progress | — | 264,858 | — | — | 28,878 | ||||||||||||||
Accounts receivable | 30,031 | — | 1,361 | 2,610 | — | ||||||||||||||
Intangible assets | 123,600 | — | 39,000 | 28,966 | 12,454 | ||||||||||||||
Restricted cash | 7,240 | 60 | — | 827 | — | ||||||||||||||
Derivative assets | 44,755 | — | — | — | — | ||||||||||||||
Other assets | 5,873 | — | 11 | 234 | 200 | ||||||||||||||
Total assets acquired | 1,006,961 | 264,918 | 102,390 | 102,572 | 49,463 | ||||||||||||||
Accounts payable, accrued expenses and other current liabilities | 9,854 | 442 | 440 | 409 | 1,854 | ||||||||||||||
Long-term debt, including current portion | 47,400 | 72,881 | — | 15,882 | — | ||||||||||||||
Asset retirement obligations | 19,890 | — | 818 | 5,730 | 509 | ||||||||||||||
Other long-term liabilities | 18,562 | 23,237 | — | 5,786 | — | ||||||||||||||
Total liabilities assumed | 95,706 | 96,560 | 1,258 | 27,807 | 2,363 | ||||||||||||||
Redeemable non-controlling interest | 3,076 | — | — | — | 8,298 | ||||||||||||||
Non-controlling interest | 96,624 | — | — | 4,045 | — | ||||||||||||||
Purchase price, net of cash acquired | $ | 811,555 | $ | 168,358 | $ | 101,132 | $ | 70,720 | $ | 38,802 | |||||||||
————
(1) | Represents renewable energy facilities with a combined nameplate capacity of 222.6 MW acquired from SunEdison during the year ended December 31, 2015. These facilities were acquired by SunEdison from First Wind on January 29, 2015. |
107
The acquisition accounting for the Invenergy Wind acquisition was initially completed as of the second quarter of 2016, at which point the provisional fair values became final. However, during the fourth quarter of 2016, management identified immaterial errors in the final opening balance sheet. These opening balance sheet errors, including the income statement impact, were corrected in the fourth quarter of 2016. The income statement impact resulted in an increase to depreciation expense and a net decrease to amortization expense. Management performed an assessment of the balance sheet and income statement impact on its previously issued second and third quarter filings and determined it to be immaterial. The final acquisition-date fair values of assets, liabilities and non-controlling interests pertaining to the Invenergy Wind acquisition as of December 31, 2016, the balance sheet error corrections in the fourth quarter of 2016 and the initial opening balance sheet as of December 31, 2015, were as follows:
Invenergy Wind Acquisition-date Fair Values | |||||||||||||||||||
(In thousands) | As of December 31, 2015 | Acquisition Accounting Adjustments | As of June 30, 2016 | Q4 2016 Corrections | As of December 31, 2016 | ||||||||||||||
Renewable energy facilities | $ | 1,486,746 | $ | (8,858 | ) | $ | 1,477,888 | $ | 45,903 | $ | 1,523,791 | ||||||||
Accounts receivable | 25,811 | — | 25,811 | — | 25,811 | ||||||||||||||
Intangible assets | 748,300 | — | 748,300 | (37,000 | ) | 711,300 | |||||||||||||
Restricted cash | 31,247 | — | 31,247 | — | 31,247 | ||||||||||||||
Derivative assets | 32,311 | — | 32,311 | — | 32,311 | ||||||||||||||
Other assets | 12,070 | 8,078 | 20,148 | — | 20,148 | ||||||||||||||
Total assets acquired | 2,336,485 | (780 | ) | 2,335,705 | 8,903 | 2,344,608 | |||||||||||||
Accounts payable, accrued expenses and other current liabilities | 23,195 | — | 23,195 | 3,041 | 26,236 | ||||||||||||||
Long-term debt, including current portion | 531,221 | — | 531,221 | — | 531,221 | ||||||||||||||
Deferred income taxes | 242 | — | 242 | — | 242 | ||||||||||||||
Asset retirement obligations | 47,346 | — | 47,346 | — | 47,346 | ||||||||||||||
Other long-term liabilities | 6,004 | — | 6,004 | 5,000 | 11,004 | ||||||||||||||
Total liabilities assumed | 608,008 | — | 608,008 | 8,041 | 616,049 | ||||||||||||||
Redeemable non-controlling interest | 141,415 | (780 | ) | 140,635 | (7,138 | ) | 133,497 | ||||||||||||
Non-controlling interest | 308,000 | — | 308,000 | 8,000 | 316,000 | ||||||||||||||
Purchase price, net of cash acquired | $ | 1,279,062 | $ | — | $ | 1,279,062 | $ | — | $ | 1,279,062 | |||||||||
The acquired renewable energy facilities' non-financial assets and other long-term liabilities primarily represent estimates of the fair value of acquired PPA and REC contracts based on significant inputs that are not observable in the market and thus represent a Level 3 measurement (as defined in Note 14. Fair Value of Financial Instruments). The estimated fair values were determined based on an income approach. Refer below for additional disclosures related to the acquired intangibles.
The operating revenues and net loss of the facilities acquired in 2015 reflected in the consolidated statement of operations for the year ended December 31, 2015 were $161.1 million and $8.8 million, respectively.
Valuation of Non-controlling Interest
First Wind
The majority of the fair value of the non-controlling interest was determined using a market approach using a quoted price for the instrument. Upon the acquisition of the First Wind assets, the Company purchased a portion of the equity interest from the non-controlling interest holders of one of the joint venture investment funds. The quoted price for the purchase of a portion of the non-controlling interest is the best indicator of fair value and was supported by a discounted cash flow technique. The Company estimated the fair value of the remainder of the non-controlling interest balances using a discounted cash flow approach.
108
Invenergy Wind
The fair value of the non-controlling interest for Invenergy Wind was determined using a discounted cash flow approach. The non-controlling interest represents the fair value of 9.9% sponsor equity held by Invenergy Wind. Sun Edison LLC, a wholly owned subsidiary of SunEdison, acting as intermediary, entered into certain option arrangements with Invenergy Wind for its remaining 9.9% interest in the acquired companies (the ‘‘Invenergy Wind Interest’’). Simultaneously, Terra LLC entered into a back to back option agreement with Sun Edison LLC on substantially identical terms (collectively, the “Option Agreements”). The Option Agreements effectively permitted (i) Terra LLC to exercise a call option to purchase the Invenergy Wind Interest over a 180-day period beginning on September 30, 2019, and (ii) Invenergy Wind to exercise a put option with respect to the Invenergy Wind Interest over a 180-day period beginning on September 30, 2018. The exercise prices of the put and call options described above were to be based on the determination of the fair market value of the Invenergy Wind Interest at the time the relevant option was exercised, subject to certain minimum and maximum thresholds set forth in the Option Agreements. The minimum put option price per the Option Agreements was $137.8 million in aggregate. As the put options represented redemption rights outside the control of the Company, this non-controlling interest was classified as a redeemable non-controlling interest as of the acquisition date and as of December 31, 2016. The Company was accreting this redeemable non-controlling interest, using the straight-line method, from the acquisition date fair value to the redemption value, which was to extend through the period ended September 30, 2018. Accretion adjustments to the carrying value of this redeemable non-controlling interest were recorded against additional paid-in capital. As part of the Settlement Agreement with SunEdison, the Option Agreement between Terra LLC and Sun Edison LLC was rejected upon the consummation of the Merger with affiliates of Brookfield on October 16, 2017. As a result, the Company is no longer obligated to perform on its Option Agreement, and as of October 16, 2017, the Invenergy Wind non-controlling interest was no longer considered redeemable and accretion ceased as of such date. See Note 18. Non-controlling Interests for further discussion.
109
2015 Acquisitions - Intangibles at Acquisition Date
The following table summarizes the final fair value and weighted average amortization period of acquired intangible assets and liabilities as of the acquisition date for transactions closed during 2015. The acquisition accounting was finalized during 2015 for all 2015 acquisitions, with the exception of Invenergy Wind, which was finalized in 2016. The final intangibles fair value reflects the following changes from the initial opening balance sheet for Invenergy; a decrease of $2.7 million to favorable rate revenue contracts, a decrease of $34.3 million to the in-place value of market rate revenue contracts and an increase of $5.0 million to unfavorable rate O&M contracts.
Fair Value | |||||||||||||||||||
(In thousands) | Invenergy Wind | First Wind | Northern Lights | Integrys | Other | ||||||||||||||
Intangible assets | |||||||||||||||||||
Favorable rate revenue contracts | $ | 547,300 | $ | 3,900 | $ | 39,000 | $ | 21,168 | $ | 12,454 | |||||||||
In-place value of market rate revenue contracts | 164,000 | 103,900 | — | 7,798 | — | ||||||||||||||
Favorable rate land leases | — | 15,800 | — | — | — | ||||||||||||||
Intangible liabilities | |||||||||||||||||||
Unfavorable rate revenue contracts | — | 17,200 | — | 5,786 | — | ||||||||||||||
Unfavorable rate O&M contracts | 5,000 | — | — | — | — | ||||||||||||||
Unfavorable rate land lease | — | 1,000 | — | — | — | ||||||||||||||
Weighted Average Amortization Period1 | |||||||||||||||||||
(In years) | Invenergy Wind | First Wind | Northern Lights | Integrys | Other | ||||||||||||||
Intangible assets | |||||||||||||||||||
Favorable rate revenue contracts | 17 | 3 | 18 | 12 | 20 | ||||||||||||||
In-place value of market rate revenue contracts | 22 | 18 | — | 22 | — | ||||||||||||||
Favorable rate land leases | — | 20 | — | — | — | ||||||||||||||
Intangible liabilities | |||||||||||||||||||
Unfavorable rate revenue contracts | — | 6 | — | 19 | — | ||||||||||||||
Unfavorable rate O&M contracts | 4 | — | — | — | — | ||||||||||||||
Unfavorable rate land lease | — | 18 | — | — | — | ||||||||||||||
————
(1) | For purposes of this disclosure, the weighted average amortization period is determined based on a weighting of the individual intangible fair values against the total fair value for each major intangible asset and liability class. |
Unaudited Pro Forma Supplementary Data
The unaudited pro forma supplementary data presented in the table below gives effect to the significant 2015 acquisitions, Invenergy Wind, First Wind and Northern Lights, as if those transactions had each occurred on January 1, 2014. The unaudited pro forma supplementary data is provided for informational purposes only and should not be construed to be indicative of the Company’s results of operations had the acquisitions been consummated on the date assumed or of the Company’s results of operations for any future date.
(In thousands, unaudited) | Year Ended December 31, 2015 | ||
Total operating revenues, net | $ | 605,441 | |
Net loss | (128,588 | ) | |
Acquisition costs incurred by the Company related to third party acquisitions were $2.7 million and $55.8 million for the years ended December 31, 2016 and 2015, respectively. There were no acquisition costs incurred for the year ended December 31, 2017. These costs are reflected as acquisition and related costs and acquisition and related costs - affiliate in the consolidated statements of operations and are excluded from the unaudited pro forma net loss amount disclosed above.
110
6. RENEWABLE ENERGY FACILITIES
Renewable energy facilities, net consists of the following:
As of December 31, | ||||||||
(In thousands) | 2017 | 2016 | ||||||
Renewable energy facilities in service, at cost | $ | 5,378,462 | $ | 5,354,883 | ||||
Less accumulated depreciation - renewable energy facilities | (578,474 | ) | (364,756 | ) | ||||
Renewable energy facilities in service, net | 4,799,988 | 4,990,127 | ||||||
Construction in progress - renewable energy facilities | 1,937 | 3,124 | ||||||
Total renewable energy facilities, net | $ | 4,801,925 | $ | 4,993,251 | ||||
Depreciation expense related to renewable energy facilities was $212.6 million, $209.2 million and $135.7 million for the years ended December 31, 2017, 2016 and 2015, respectively.
As of December 31, 2017, construction in progress primarily represented initial costs incurred for the construction of a new battery energy storage system for one of the Company's wind power plants, for which construction began in the fourth quarter of 2017. As of December 31, 2016, construction in progress represented costs incurred to complete the construction of the facilities in the Company's portfolio that were acquired from SunEdison and is stated at SunEdison's historical cost. Construction in progress amounts include capitalized interest costs and amortization of deferred financing costs incurred during the asset's construction period when funds are borrowed to finance construction, which totaled $1.6 million and $22.7 million during the years ended December 31, 2016 and 2015, respectively. There was no capitalization of interest costs or deferred financing cost amortization for the year ended December 31, 2017.
As of December 31, 2016, the Company reclassified $548.7 million from renewable energy facilities, net to non-current assets held for sale in the consolidated balance sheet. There was no similar reclassification as of December 31, 2017 as the sale of these renewable energy facilities closed in the first half of 2017 (see Note 4. Assets held for Sale).
7. ASSET RETIREMENT OBLIGATIONS
Activity in asset retirement obligations for the years ended December 31, 2017, 2016 and 2015 was as follows:
Year Ended December 31, | ||||||||||||
(In thousands) | 2017 | 2016 | 2015 | |||||||||
Balance as of the beginning of the year | $ | 148,575 | $ | 215,146 | $ | 78,175 | ||||||
Additional obligations from renewable energy facilities achieving commercial operation | — | 2,132 | 52,181 | |||||||||
Revisions in estimates for current obligations1 | — | (7,920 | ) | — | ||||||||
Adjustment related to change in accretion period2 | — | (22,204 | ) | — | ||||||||
Assumed through acquisition | — | 136 | 74,293 | |||||||||
Acquisition accounting adjustments related to prior year acquisitions | — | — | 5,640 | |||||||||
Accretion expense | 8,578 | 8,992 | 7,209 | |||||||||
Reclassification to non-current liabilities related to assets held for sale | — | (39,850 | ) | — | ||||||||
Other | (3,238 | ) | — | — | ||||||||
Currency translation adjustment | 600 | (7,857 | ) | (2,352 | ) | |||||||
Balance as of the end of the year | $ | 154,515 | $ | 148,575 | $ | 215,146 | ||||||
————
(1) | As discussed in Note 2. Summary of Significant Accounting Policies, effective December 31, 2016, the Company revised its original estimates of the costs and related amount of cash flows for certain of its asset retirement obligations. |
(2) | As discussed in Note 2. Summary of Significant Accounting Policies, during the fourth quarter of 2016, the Company revised the accretion period for its asset retirement obligations from the term of the related PPA agreement to the remaining useful life of the |
111
corresponding renewable energy facility, consistent with the period over which depreciation expense is recorded on the corresponding asset retirement cost recognized within renewable energy facilities and with its estimate of the future timing of settlement.
The Company did not have any assets that were legally restricted for the purpose of settling the Company's asset retirement obligations as of December 31, 2017, 2016 and 2015.
8. GOODWILL
Goodwill is recorded as the difference between the aggregate consideration paid for an acquisition and the fair value of the net tangible and identified intangible assets acquired. The Company did not have any goodwill as of December 31, 2017 or 2016.
During 2015, the Company recorded $55.9 million of goodwill attributable to its 2014 acquisition of solar distributed generation facilities from Capital Dynamics, which provided the Company with a scalable distributed generation platform. The goodwill existed within the Company's distributed generation reporting unit within the solar reportable segment and was not deductible for federal income tax purposes. The Company performed its annual impairment test of the carrying value of its goodwill as of December 1, 2016 and concluded that the goodwill balance of $55.9 million was fully impaired. The impairment was driven by a combination of factors, including lack of near-term growth in the operating segment. The impairment test determined there was no implied value of goodwill, which resulted in an impairment charge of $55.9 million as reflected in goodwill impairment within the consolidated statement of operations for the year ended December 31, 2016.
The Company used an income approach methodology of valuation, which used the discounted cash flow method based on forecasted cash flows of the distributed generation reporting unit. The market approach was considered but not used due to the lack of direct similarities with comparable companies in the market.
9. INTANGIBLES
The following table presents the gross carrying amount, accumulated amortization and net book value of intangibles as of December 31, 2017:
(In thousands, except weighted average amortization period) | Weighted Average Amortization Period | Gross Carrying Amount | Accumulated Amortization | Net Book Value | ||||||||||
Favorable rate revenue contracts | 15 years | $ | 718,639 | $ | (102,543 | ) | $ | 616,096 | ||||||
In-place value of market rate revenue contracts | 19 years | 521,323 | (73,104 | ) | 448,219 | |||||||||
Favorable rate land leases | 17 years | 15,800 | (2,329 | ) | 13,471 | |||||||||
Total intangible assets, net | $ | 1,255,762 | $ | (177,976 | ) | $ | 1,077,786 | |||||||
Unfavorable rate revenue contracts | 7 years | $ | 35,086 | $ | (16,030 | ) | $ | 19,056 | ||||||
Unfavorable rate O&M contracts | 2 years | 5,000 | (2,552 | ) | 2,448 | |||||||||
Unfavorable rate land lease | 15 years | 1,000 | (162 | ) | 838 | |||||||||
Total intangible liabilities, net | $ | 41,086 | $ | (18,744 | ) | $ | 22,342 | |||||||
112
The following table presents the gross carrying amount, accumulated amortization and net book value of intangibles as of December 31, 2016:
(In thousands, except weighted average amortization period) | Weighted Average Amortization Period | Gross Carrying Amount | Accumulated Amortization | Net Book Value | ||||||||||
Favorable rate revenue contracts | 16 years | $ | 714,758 | $ | (57,634 | ) | $ | 657,124 | ||||||
In-place value of market rate revenue contracts | 20 years | 518,003 | (47,284 | ) | 470,719 | |||||||||
Favorable rate land leases | 18 years | 15,800 | (1,531 | ) | 14,269 | |||||||||
Total intangible assets, net | $ | 1,248,561 | $ | (106,449 | ) | $ | 1,142,112 | |||||||
Unfavorable rate revenue contracts | 7 years | $ | 35,086 | $ | (10,541 | ) | $ | 24,545 | ||||||
Unfavorable rate O&M contracts | 3 years | 5,000 | (1,302 | ) | 3,698 | |||||||||
Unfavorable rate land lease | 16 years | 1,000 | (107 | ) | 893 | |||||||||
Total intangible liabilities, net | $ | 41,086 | $ | (11,950 | ) | $ | 29,136 | |||||||
The Company has intangible assets related to revenue contracts, representing long-term PPAs and REC agreements, and favorable rate land leases that were obtained through acquisitions. The revenue contract intangible assets are comprised of favorable rate PPAs and REC agreements and the in-place value of market rate PPAs. The Company also has intangible liabilities related to unfavorable rate PPAs and REC agreements, unfavorable rate O&M contracts and an unfavorable rate land lease, which are classified within other long-term liabilities in the consolidated balance sheets. These intangible assets and liabilities are amortized on a straight-line basis over the remaining lives of the agreements, which range from 1 to 27 years as of December 31, 2017.
Amortization expense related to favorable rate revenue contracts is reflected in the consolidated statements of operations as a reduction of operating revenues, net. Amortization related to unfavorable rate revenue contracts is reflected in the consolidated statements of operations as an increase to operating revenues, net. During the years ended December 31, 2017, 2016 and 2015, net amortization expense related to favorable and unfavorable rate revenue contracts resulted in a reduction of operating revenues, net of $39.6 million, $40.2 million and $5.3 million, respectively.
Amortization expense related to the in-place value of market rate revenue contracts is reflected in the consolidated statements of operations within depreciation, accretion and amortization expense. During the years ended December 31, 2017, 2016 and 2015, amortization expense related to the in-place value of market rate revenue contracts was $25.5 million, $25.2 million and $18.4 million, respectively.
Amortization expense related to favorable rate land leases is reflected in the consolidated statements of operations within cost of operations. Amortization related to the unfavorable rate land lease and unfavorable rate O&M contracts is reflected in the consolidated statements of operations as a reduction of cost of operations. During the years ended December 31, 2017, 2016 and 2015, net amortization related to favorable and unfavorable rate land leases and unfavorable rate O&M contracts resulted in a $0.5 million and $0.6 million reduction of cost of operations and $0.7 million increase to cost of operations, respectively.
113
Over the next five fiscal years, the Company expects to recognize annual amortization on its intangibles as follows:
(In thousands) | 2018 | 2019 | 2020 | 2021 | 2022 | |||||||||||||||
Favorable rate revenue contracts | $ | 44,270 | $ | 44,184 | $ | 44,184 | $ | 42,376 | $ | 41,269 | ||||||||||
Unfavorable rate revenue contracts | (4,956 | ) | (4,845 | ) | (2,620 | ) | (1,379 | ) | (1,275 | ) | ||||||||||
Total net amortization expense recorded to operating revenues, net | $ | 39,314 | $ | 39,339 | $ | 41,564 | $ | 40,997 | $ | 39,994 | ||||||||||
In-place value of market rate revenue contracts | $ | 25,557 | $ | 25,557 | $ | 25,557 | $ | 25,557 | $ | 25,552 | ||||||||||
Total amortization expense recorded to depreciation, accretion and amortization expense | $ | 25,557 | $ | 25,557 | $ | 25,557 | $ | 25,557 | $ | 25,552 | ||||||||||
Favorable rate land leases | $ | 799 | $ | 799 | $ | 799 | $ | 799 | $ | 799 | ||||||||||
Unfavorable rate O&M contracts | (1,250 | ) | (1,198 | ) | — | — | — | |||||||||||||
Unfavorable rate land lease | (56 | ) | (56 | ) | (56 | ) | (56 | ) | (56 | ) | ||||||||||
Total net amortization recorded to cost of operations | $ | (507 | ) | $ | (455 | ) | $ | 743 | $ | 743 | $ | 743 | ||||||||
10. VARIABLE INTEREST ENTITIES
The Company consolidates VIEs in renewable energy facilities when the Company is the primary beneficiary. The VIEs own and operate renewable energy facilities in order to generate contracted cash flows. The VIEs were funded through a combination of equity contributions from the owners and non-recourse, project-level debt. As a result of the Company's sale of TerraForm Resi Solar Manager, LLC, a subsidiary of the Company that owned and operated 8.9 MW of residential rooftop solar installations, during the second quarter of 2017, the related assets and liabilities of this variable interest entity were deconsolidated (see Note 4. Assets Held for Sale). No other VIEs were deconsolidated during the years ended December 31, 2017 and 2016.
The carrying amounts and classification of the consolidated VIEs’ assets and liabilities included in the Company's consolidated balance sheets are as follows:
As of December 31, | ||||||||
(In thousands) | 2017 | 2016 | ||||||
Current assets | $ | 142,403 | $ | 191,244 | ||||
Non-current assets | 4,155,558 | 4,351,635 | ||||||
Total assets | $ | 4,297,961 | $ | 4,542,879 | ||||
Current liabilities | $ | 119,021 | $ | 638,452 | ||||
Non-current liabilities | 975,839 | 514,464 | ||||||
Total liabilities | $ | 1,094,860 | $ | 1,152,916 | ||||
The amounts shown in the table above exclude intercompany balances that are eliminated upon consolidation. All of the assets in the table above are restricted for settlement of the VIE obligations, and all of the liabilities in the table above can only be settled by using VIE resources.
114
11. LONG-TERM DEBT
Long-term debt consists of the following:
As of December 31, | Interest Type | Interest Rate (%)1 | ||||||||||||
(In thousands, except rates) | 2017 | 2016 | Financing Type | |||||||||||
Corporate-level long-term debt2: | ||||||||||||||
Senior Notes due 2023 | $ | — | $ | 950,000 | Fixed | N/A | Senior notes | |||||||
New Senior Notes due 2023 | 500,000 | — | Fixed | 4.25 | Senior notes | |||||||||
Senior Notes due 2025 | 300,000 | 300,000 | Fixed | 6.63 | Senior notes | |||||||||
Senior Notes due 2028 | 700,000 | — | Fixed | 5.00 | Senior notes | |||||||||
Revolver | — | 552,000 | Variable | N/A | Revolving loan | |||||||||
New Revolver | 60,000 | — | Variable | 4.38 | Revolving loan | |||||||||
New Term Loan | 350,000 | — | Variable | 4.15 | Term debt | |||||||||
Non-recourse long-term debt3: | ||||||||||||||
Permanent financing | 1,616,729 | 2,078,009 | Blended4 | 5.715 | Term debt / Senior notes | |||||||||
Financing lease obligations | 115,787 | 123,930 | Imputed | 5.615 | Financing lease obligations | |||||||||
Total principal due for long-term debt and financing lease obligations | 3,642,516 | 4,003,939 | 5.285 | |||||||||||
Unamortized discount, net | (19,027 | ) | (13,620 | ) | ||||||||||
Deferred financing costs, net | (24,689 | ) | (39,405 | ) | ||||||||||
Less current portion of long-term debt and financing lease obligations6 | (403,488 | ) | (2,212,968 | ) | ||||||||||
Long-term debt and financing lease obligations, less current portion7 | $ | 3,195,312 | $ | 1,737,946 | ||||||||||
———
(1) | As of December 31, 2017. |
(2) | Outstanding corporate-level debt represents debt issued by Terra Operating LLC and guaranteed by Terra LLC and certain subsidiaries of Terra Operating LLC other than non-recourse subsidiaries as defined in the relevant debt agreements (with the exception of certain unencumbered non-recourse subsidiaries). |
(3) | Non-recourse debt represents debt issued by subsidiaries with no recourse to Terra LLC, Terra Operating LLC or guarantors of the Company's corporate-level debt, other than limited or capped contingent support obligations, which in aggregate are not considered to be material to the Company's business and financial condition. |
(4) | Includes fixed rate debt and variable rate debt. As of December 31, 2017, 60% of this balance had a fixed interest rate and the remaining 40% of this balance had a variable interest rate. The Company has entered into interest rate swap agreements to fix the interest rates of a majority of the variable rate permanent financing non-recourse debt (see Note 13. Derivatives). |
(5) | Represents the weighted average interest rate as of December 31, 2017. |
(6) | As of December 31, 2016, the Company reclassified $14.7 million from current portion of long-term debt and financing lease obligations to current liabilities related to assets held for sale in the consolidated balance sheet. There was no similar reclassification as of December 31, 2017 as the sale of the related renewable energy facilities closed in the first half of 2017 (see Note 4. Assets Held for Sale). |
(7) | As of December 31, 2016, the Company reclassified $353.9 million from long-term debt and financing lease obligations, less current portion to non-current liabilities related to assets held for sale in the consolidated balance sheet. There was no similar reclassification as of December 31, 2017 as the sale of the related renewable energy facilities closed in the first half of 2017 (see Note 4. Assets Held for Sale). |
Corporate-level Long-term Debt
Term Loan
On January 28, 2015, Terra Operating LLC repaid the remaining outstanding principal balance on its term loan facility (the “Term Loan”) of $573.5 million. The Company recognized a $12.0 million loss on extinguishment of debt during the year ended December 31, 2015 as a result of this repayment.
115
Revolver
On January 28, 2015, Terra Operating LLC replaced its existing revolving credit facility with a new $550.0 million revolving credit facility (the “Revolver”), which was available for revolving loans and letters of credit, and was subsequently increased to a $725.0 million facility over the course of 2015. The Company recognized a $1.3 million loss on extinguishment of debt during the year ended December 31, 2015 as a result of the revolver exchange.
During 2016 and 2017, Terra Operating LLC entered into a number of amendments to the terms of the Revolver and obtained certain waivers in regards to extending financial statement reporting deliverable due dates, maintaining compliance with financial maintenance covenants and modifying or obtaining consent regarding certain other provisions. In connection therewith, Terra Operating LLC agreed to permanently reduce the revolving commitments and borrowing capacity under the Revolver by $100.0 million and $105.0 million during 2016 and 2017, respectively, and as a result recognized a $1.1 million loss on extinguishment of debt during both of these years due to the corresponding write-off of a portion of the unamortized deferred financing costs.
At Terra Operating LLC’s option, all outstanding amounts under the Revolver bore interest at a rate per annum equal to either (i) a base rate plus a margin ranging between 1.25% and 1.75% or (ii) a reserve adjusted Eurodollar rate plus a margin ranging between 2.25% and 2.75%, as determined by reference to a leverage-based grid. An amendment the Company entered into on September 9, 2016 increased the interest rate under the Revolver at all applicable margin levels by 50% of the increase in the interest rate on the Senior Notes due 2023 (as defined below) agreed to as part of the consent solicitation process for the Senior Notes due 2023 described below. This amendment resulted in an increase in the interest rate payable under the Revolver by 1.75% for the period from September 6, 2016 to December 6, 2016 and, thereafter, an increase of 0.25%.
On October 17, 2017, concurrently with its entry into the New Revolver (as defined below), Terra Operating LLC terminated the Revolver and repaid the outstanding loan amount of $277.0 million, using $27.0 million of cash on hand and $250.0 million of borrowings drawn under the New Revolver. As a result of this revolver exchange, the Company recognized a $4.5 million loss on extinguishment of debt during the year ended December 31, 2017 due to the write-off of the unamortized deferred financing costs for the Revolver as of the termination date.
New Revolver
On October 17, 2017, Terra Operating LLC entered into a new senior secured revolving credit facility (the “New Revolver”). The New Revolver consists of a revolving credit facility in an initial amount of $450.0 million, available for revolving loans and letters of credit, which Terra Operating LLC subsequently elected to increase to $600.0 million on February 6, 2018. The New Revolver matures on the four-year anniversary of the closing date of such facility. Each of Terra Operating LLC’s existing and subsequently acquired or organized domestic restricted subsidiaries (excluding non-recourse subsidiaries) and Terra LLC are or will become guarantors under the New Revolver. $250.0 million of revolving loans were initially drawn and used to repay a portion of the outstanding borrowings under the existing Revolver as discussed above. Subsequent to the initial issuance, an additional $15.0 million of revolving loans were drawn during the fourth quarter of 2017 and $205.0 million of revolving loans were repaid, primarily using $50.0 million of the proceeds from the issuance of the New Term Loan (as defined below) and $150.0 million of the proceeds from the issuance of the New Senior Notes due 2023 and Senior Notes due 2028 (both defined below).
All outstanding amounts under the New Revolver bear interest at a rate per annum equal to, at Terra Operating LLC’s option, either (i) a base rate plus a margin ranging between 1.25% to 2.00% or (ii) a reserve adjusted Eurodollar rate plus a margin ranging between 2.25% to 3.00%. In addition to paying interest on outstanding principal under the New Revolver, the Company is required to pay a standby fee in respect of the unutilized commitments thereunder, payable quarterly in arrears. This standby fee ranges between 0.375% and 0.50% per annum. The New Revolver provides for voluntary prepayments, in whole or in part, subject to notice periods. There are no prepayment penalties or premiums other than customary breakage costs.
The New Revolver, each guarantee and any interest rate, currency hedging or hedging of REC obligations of Terra Operating LLC or any guarantor owed to the administrative agent, any arranger or any lender under the New Revolver is secured by first priority security interests in (i) all of Terra Operating LLC’s, each guarantor’s and certain unencumbered non-recourse subsidiaries’ assets, (ii) 100% of the capital stock of each of Terra Operating LLC and its domestic restricted
116
subsidiaries and 65% of the capital stock of Terra Operating LLC’s foreign restricted subsidiaries and (iii) all intercompany debt. The New Revolver is secured equally and ratably with the New Term Loan (as defined below).
Senior Notes
On January 28, 2015, Terra Operating LLC issued $800.0 million of 5.875% senior notes due 2023 at an offering price of 99.214% of the principal amount. Terra Operating LLC used the net proceeds from the offering to fund a portion of the purchase price payable in the First Wind Acquisition. On June 11, 2015, Terra Operating LLC issued an additional $150.0 million of 5.875% senior notes due 2023 (collectively, with the $800.0 million initially issued, the “Senior Notes due 2023”). The offering price of the additional $150.0 million of notes was 101.5% of the principal amount, and Terra Operating LLC used the net proceeds from the offering to repay existing borrowings under the Revolver.
On July 17, 2015, Terra Operating LLC issued $300.0 million of 6.125% senior notes due 2025 at an offering price of 100% of the principal amount (the “Senior Notes due 2025”). Terra Operating LLC used the net proceeds from the offering to fund a portion of the purchase price of the acquisition of the wind power plants from Invenergy Wind.
During 2016 and 2017, Terra Operating LLC received certain notices of an event of default from the Senior Notes due 2023 and Senior Notes due 2025 trustee for failure to comply with its obligation under the respective indentures to timely file certain of the Company's periodic financial statements, but in each case the Company filed the respective financial statements with the SEC within the grace period for delivery that still applied per the respective indentures (which was extended in one case as discussed directly below), and consequently no events of default occurred with respect to these late filings.
On August 30, 2016, the Company announced the successful completion of a consent solicitation from holders of its Senior Notes due 2023 and its Senior Notes due 2025 to obtain waivers relating to certain reporting covenants (which included an extension of the deadline for filing the Company's 2015 Form 10-K and Form 10-Q for the first quarter of 2016) and to effectuate certain amendments under the respective indentures. Terra Operating LLC received consents from the holders of a majority of the aggregate principal amount of each series of the Senior Notes outstanding as of the record date and paid a consent fee to each consenting holder of $5.00 for each $1,000 principal amount of such series of the Senior Notes for which such holder delivered its consent. Following receipt of the requisite consents, Terra Operating LLC entered into a supplemental indenture for each series of the Senior Notes on August 29, 2016. Effective as of September 6, 2016, these indentures respectively permanently increased the interest rate payable on the Senior Notes due 2023 from 5.875% per annum to 6.375% per annum and the interest rate payable on the Senior Notes due 2025 from 6.125% per annum to 6.625% per annum. In addition, beginning on September 6, 2016 through and including December 6, 2016, special interest accrued on the Senior Notes due 2023 and the Senior Notes due 2025 at a rate equal to 3.0% per annum, which was payable in the same manner as regular interest payments on the first interest payment date following December 6, 2016.
On August 11, 2017, the Company announced the successful completion of another consent solicitation from holders of its Senior Notes due 2023 and its Senior Notes due 2025 to obtain a waiver of the requirement to make an offer to repurchase the Senior Notes issued under the respective indentures (at 101% of the applicable principal amount, plus accrued and unpaid interest) upon the occurrence of the change of control that would result from the consummation of the Merger. Terra Operating LLC received consents from the holders of a majority of the aggregate principal amount of each series of the Senior Notes outstanding as of the record date and paid a consent fee to each consenting holder of $1.25 per $1,000 principal amount of such series of the Senior Notes for which such holder delivered its consent. Upon the closing of the Merger, Terra Operating LLC also paid a success fee of $1.25 per $1,000 principal amount of each series of the Senior Notes for which such consenting holder delivered its consent.
On December 12, 2017, Terra Operating LLC issued $500.0 million of 4.25% senior notes due 2023 at an offering price of 100% of the principal amount (the “New Senior Notes due 2023”) and $700.0 million of 5.00% senior notes due 2028 at an offering price of 100% of the principal amount (the “Senior Notes due 2028”). Terra Operating LLC used the proceeds to redeem in full its existing Senior Notes due 2023, of which $950.0 million remained outstanding, at a redemption price that included a make-whole premium of $50.7 million, plus accrued and unpaid interest, and to repay $150.0 million of revolving loans outstanding under the New Revolver as described above. As a result of the extinguishment of the Company's existing Senior Notes due 2023, the Company recognized a $72.3 million loss on extinguishment of debt during the year ended December 31, 2017, consisting of the $50.7 million make-whole premium and the write-off of $21.6 million of unamortized deferred financing costs and debt discounts for the Senior Notes due 2023 as of the redemption date.
117
The New Senior Notes due 2023, Senior Notes due 2025 and Senior Notes due 2028 are senior obligations of Terra Operating LLC and are guaranteed by Terra LLC and each of Terra Operating LLC's subsidiaries that guarantee the New Revolver, the New Term Loan (as defined below) or certain other material indebtedness of Terra Operating LLC or Terra LLC. Each series of the Senior Notes rank equally in right of payment with all existing and future senior indebtedness of Terra Operating LLC, including the New Revolver and the New Term Loan, senior in right of payment to any future subordinated indebtedness of Terra Operating LLC, and effectively subordinated to all borrowings under the New Revolver and the New Term Loan, which are secured by substantially all of the assets of Terra Operating LLC and the guarantors of the Senior Notes.
At its option, Terra Operating LLC may redeem some or all of each series of the Senior Notes at any time or from time to time prior to their maturity. If Terra Operating LLC elects to redeem the New Senior Notes due 2023 prior to October 31, 2022 or the Senior Notes due 2028 prior to July 31, 2027, Terra Operating LLC would be required to pay a make-whole premium as set forth in the applicable indenture. If Terra Operating LLC elects to redeem the New Senior Notes due 2023 or the Senior Notes due 2028 on or after these respective dates, Terra Operating LLC would be required to pay a redemption price equal to 100% of the aggregate principal amount of the Senior Notes redeemed plus accrued and unpaid interest thereon. If Terra Operating LLC elects to redeem the Senior Notes due 2025 prior to June 15, 2020, it would be required to pay a make-whole premium as set forth in the indenture. If Terra Operating LLC elects to redeem the Senior Notes due 2025 on or after June 15, 2020 but prior to June 15, 2023, it would be required pay a redemption premium that includes a premium to par adjustment as set forth in the indenture, and if Terra Operating LLC elects to redeem the Senior Notes due 2025 on or after June 15, 2023, it would be required to pay a redemption price equal to 100% of the aggregate principal amount of the Senior Notes redeemed plus accrued and unpaid interest thereon. If certain change of control triggering events occur in the future, Terra Operating LLC must offer to repurchase all of each series of the Senior Notes at a price equal to 101% of the principal amount thereof, plus accrued and unpaid interest, if any, to the repurchase date.
Sponsor Line Agreement
On October 16, 2017, TerraForm Power entered into a credit agreement (the “Sponsor Line Agreement”) with Brookfield and one of its affiliates. The Sponsor Line Agreement establishes a $500.0 million secured revolving credit facility and provides for the lenders to commit to make LIBOR loans to the Company during a period not to exceed three years from the effective date of the Sponsor Line Agreement (subject to acceleration for certain specified events). The Company may only use the revolving credit facility to fund all or a portion of certain funded acquisitions or growth capital expenditures. The Sponsor Line Agreement will terminate, and all obligations thereunder will become payable, no later than October 16, 2022. As of December 31, 2017, there were no amounts drawn under the Sponsor Line Agreement.
Borrowings under the Sponsor Line Agreement will bear interest at a rate per annum equal to a LIBOR rate determined by reference to the costs of funds for U.S. dollar deposits for the interest period relevant to such borrowing adjusted for certain additional costs, in each case plus 3.00% per annum. In addition to paying interest on outstanding principal under the Sponsor Line Agreement, the Company is required to pay a standby fee of 0.50% per annum in respect of the unutilized commitments thereunder, payable quarterly in arrears.
TerraForm Power will be permitted to voluntarily reduce the unutilized portion of the commitment amount and repay outstanding loans under the Sponsor Line Agreement at any time without premium or penalty, other than customary “breakage” costs. TerraForm Power’s obligations under the Sponsor Line Agreement are secured by first-priority security interests in substantially all assets of TerraForm Power, including 100% of the capital stock of Terra LLC, in each case subject to certain exclusions set forth in the credit documentation governing the Sponsor Line Agreement.
New Term Loan
On November 8, 2017, Terra Operating LLC entered into a 5-year $350.0 million senior secured term loan (the “New Term Loan”), which was used to repay outstanding borrowings under the Midco Portfolio Term Loan (as defined and discussed below) and $50.0 million of revolving loans outstanding under the New Revolver. The New Term Loan bears interest at a rate per annum equal to, at Terra Operating LLC's option, either (i) a base rate plus a margin of 1.75% or (ii) a reserve adjusted Eurodollar rate plus a margin of 2.75%, and is secured and guaranteed equally and ratably with the New Revolver. The New Term Loan provides for voluntary prepayments, in whole or in part, subject to notice periods. There are no prepayment penalties or premiums other than customary breakage costs subsequent to the six-month anniversary of the closing date. Within the first six months following the closing date, a prepayment premium of 1.00% would apply to any principal amounts that were prepaid.
118
Covenants and Cross-defaults
The terms of the Company's corporate-level debt agreements and indentures include customary affirmative and negative covenants and provide for customary events of default, which include, among others, nonpayment of principal or interest and failure to timely deliver financial statements. This includes quarterly financial maintenance covenants for the New Revolver. The occurrence of an event of default for one corporate-level debt instrument could also cause a cross-default for the other respective corporate-level debt instruments as described below.
Pursuant to both the terms of the New Revolver and the New Term Loan, a default of more than $75.0 million of indebtedness (other than non-recourse indebtedness, and indebtedness under the Sponsor Line Agreement, which is an obligation of TerraForm Power), including under these respective agreements, would result in a cross-default under the respective agreements that would permit the lenders holding more than 50% of the aggregate exposure under each to accelerate any outstanding principal amount of loans, terminate any outstanding letter of credit and terminate the outstanding commitments (as applicable to each).
Pursuant to the terms of each series of the Senior Notes, a default of indebtedness that exceeds the greater of $100.0 million or 1.5% of the Company’s consolidated total assets (other than non-recourse indebtedness and indebtedness under the Sponsor Line Agreement, which is an obligation of TerraForm Power), that is (i) caused by a failure to pay principal of, or interest or premium, if any, on such indebtedness prior to the expiration of the grace period provided in such indebtedness on the date of such default or (ii) results in the acceleration of such indebtedness would give the trustee under the respective indentures or the holders of at least 25% in the aggregate principal amount of the then outstanding Senior Notes under the respective indentures the right to accelerate any outstanding principal amount of loans and terminate the outstanding commitments under the respective indentures.
An event of default of more than $75.0 million of indebtedness under the New Revolver, New Term Loan and each series of the Senior Notes would trigger an event of default under the Sponsor Line Agreement that would permit the lenders to accelerate any outstanding principal amount of loans and terminate the outstanding commitments under the Sponsor Line Agreement.
Non-recourse Long-term Debt
Indirect subsidiaries of the Company have incurred long-term non-recourse debt obligations with respect to the renewable energy facilities that those subsidiaries own directly or indirectly. The indebtedness of these subsidiaries is typically secured by the renewable energy facility's assets (mainly the renewable energy facility) or equity interests in subsidiaries that directly or indirectly hold renewable energy facilities with no recourse to TerraForm Power, Terra LLC or Terra Operating LLC other than limited or capped contingent support obligations, which in aggregate are not considered to be material to the Company's business and financial condition. In connection with these financings and in the ordinary course of its business, the Company and its subsidiaries observe formalities and operating procedures to maintain each of their separate existence and can readily identify each of their separate assets and liabilities as separate and distinct from each other. As a result, these subsidiaries are legal entities that are separate and distinct from TerraForm Power, Terra LLC, Terra Operating LLC and the guarantors under the New Revolver, the New Senior Notes due 2023, the Senior Notes due 2025, the Senior Notes due 2028, the Sponsor Line Agreement and the New Term Loan.
U.K. Debt Refinancing
On November 6, 2015, the Company entered into definitive agreements to refinance GBP 178.6 million (equivalent of $270.8 million on the closing date) of existing non-recourse indebtedness by entering into a new GBP 313.5 million (equivalent of $475.2 million on the closing date) facility. The new facility was comprised of Tranche A for GBP 87.0 million (equivalent of $131.9 million) which was fully amortizing over the seven-year term, and Tranche B for GBP 226.5 million (equivalent of $343.3 million), which was payable at maturity in 2022. This new facility bore interest at a rate per annum equal to LIBOR plus an applicable margin of 2.10% for Tranche A and 2.35% for Tranche B. The non-recourse facility was secured by all of the Company's solar generation facilities located in the U.K. except for the Norrington facility. The Company recognized a loss on extinguishment of debt of $7.5 million during the year ended December 31, 2015 as a result of this refinancing. As discussed in Note 4. Assets Held for Sale, Terra Operating LLC closed on its sale of the U.K. Portfolio on May 11, 2017 to Vortex Solar UK Limited, which resulted in the reduction of this indebtedness.
119
Non-recourse Portfolio Term Loan
A wholly owned subsidiary of the Company entered into a $500.0 million non-recourse portfolio term loan commitment that was funded on December 15, 2015 (the “Midco Portfolio Term Loan”) and a majority of the proceeds were used to acquire wind power plants from Invenergy Wind. Interest under the term loan accrued at a rate equal to an adjusted Eurodollar rate plus 5.5%, subject to a 1.0% LIBOR floor (or base rate plus 4.5%). The term loan was secured by indirect equity interests in approximately 1,104.3 MW of the Company's renewable energy facilities, consisting of assets acquired from Invenergy Wind and certain other renewable energy facilities acquired from SunEdison, and was to mature on January 15, 2019, to the extent the Company exercised its extension options. The Company exercised the first two extension options in January and July of 2017, respectively.
In June of 2017, the Company agreed to make a $100.0 million prepayment for this loan in connection with obtaining (i) a waiver to extend the 2016 audited project financial statement deadline under the loan agreement and (ii) a waiver of the change of control default that would arise under this loan agreement as a result of the Merger until, in the case of the change of control waiver, the date that is the earlier of three months following the closing of the Merger and March 31, 2018. This prepayment was made using a portion of the proceeds the Company received from the sale of the U.K. Portfolio as discussed in Note 4. Assets Held for Sale. The Company made approximately $68 million of additional prepayments in the second half of 2017 and repaid the remaining principal balance of $300.0 million on November 8, 2017 using borrowings from the New Term Loan that was entered into on that date as discussed above. The Company recognized a $3.2 million loss on extinguishment of debt during the year ended December 31, 2017 as a result of these prepayments and final repayment.
Canada Project-level Financing
On November 2, 2016, certain of the Company's subsidiaries entered into a new non-recourse loan financing in an aggregate principal amount of CAD $120.0 million (including a CAD $6.9 million letter of credit) secured by approximately 59 MW of utility-scale solar power plants located in Canada that are owned by the Company's subsidiaries. The proceeds of this financing were used to pay down the Revolver by $70.0 million and were used for general corporate purposes. On February 28, 2017, the Company increased the principal amount of the credit facility by an additional CAD $113.9 million (including an additional CAD $6.7 million letter of credit), increasing the total facility to CAD $233.9 million. The proceeds of this additional financing were primarily used for general corporate purposes. This non-recourse loan has a seven-year maturity and amortizes on a 17-year sculpted amortization schedule.
Non-recourse Debt Defaults
Over the course of 2016 and 2017, the Company experienced defaults in its non-recourse debt financings that principally arose as a result of the filing for bankruptcy of certain SunEdison Debtors that served as providers of O&M or asset management services to its renewable energy facilities (or as guarantors of those service providers) and as a result of the failure of the applicable subsidiary or the Company to timely deliver audited or unaudited financial statements and other deliverables required by the applicable financing arrangements. With the exception of its 101.6 MW renewable energy facility in Chile, to date the Company has transitioned all the project-level services provided by SunEdison Debtors to third parties or in-house to a Company affiliate. The Company has also delivered all outstanding Company and project-level financial statements and deliverables as of the date hereof, has substantially obtained all waivers needed for late delivery of financial statements that were delivered after the grace period expired and expects to complete its project-level audits for fiscal year 2017 within the time periods (taking into account the respective grace periods) for their delivery.
As a result of non-recourse debt defaults that were outstanding as of the financial statement issuance date for the Company’s 2016 Form 10-K, the Company reclassified $1.6 billion of the Company's non-recourse long-term indebtedness, net of unamortized debt discounts and deferred financing costs, to current in the consolidated balance sheet as of December 31, 2016. The Company reclassified these amounts because at that time the applicable contractual grace periods had already expired or the Company could not assert that it was probable that the default would be cured within any remaining grace periods, and the lender had not waived or subsequently lost the right to demand repayment for more than one year from the balance sheet date. The Company accounts for debt in default as of the date the financial statements are issued in the same manner as if the default existed as of the balance sheet date. As of December 31, 2017, the Company reclassified $239.7 million of non-recourse long-term indebtedness to current in the consolidated balance sheet due to defaults still existing as of the date of the issuance of these financial statements, which primarily consisted of indebtedness of the Company's renewable energy
120
facility in Chile.
The Company continued to amortize deferred financing costs and debt discounts over the maturities of the respective financing agreements as before the violations, as the Company believed there was a reasonable likelihood that it would be able to successfully negotiate a waiver with the lenders and/or cure the defaults. The Company based this conclusion on (i) its past history of obtaining waivers and/or forbearance agreements with lenders, (ii) the nature and existence of active negotiations between the Company and the respective lenders to secure a waiver, (iii) ongoing efforts to cure certain of the defaults, (iv) the Company's timely servicing of these debt instruments and (v) the fact that no non-recourse financing has been accelerated to date and no project-level lender has notified the Company of such lenders election to enforce project security interests.
Refer to Note 2. Summary of Significant Accounting Policies and Note 13. Derivatives, respectively, for discussion of corresponding restricted cash and interest rate swap reclassifications to current as a result of these defaults.
Financing Lease Obligations
In certain transactions, the Company accounts for the proceeds of sale-leasebacks as financings, which are typically secured by the renewable energy facility asset and its future cash flows from energy sales, with no recourse to Terra LLC or Terra Operating LLC under the terms of the arrangement.
As a result of the First Wind Acquisition, the Company acquired $47.4 million of financing lease obligations. The financing lease obligations assumed by the Company include those pursuant to a sale-leaseback agreement, entered into by First Wind on November 21, 2012, whereby First Wind sold substantially all of the property, plant and equipment of the related wind power plant to a financial institution and simultaneously entered into a long-term lease with that financial institution for the use of the assets. Under the terms of the agreement, the Company will continue to operate the wind facility and has the option to extend the lease or repurchase the assets sold at the end of the lease term.
On May 22, 2015, SunEdison acquired the lessor interest in an operating solar generation facility referred to as the Duke Energy operating facility and concurrently sold the facility to the Company. Upon acquisition of this operating facility, the Company recognized a net gain on the extinguishment of debt of $11.4 million during the year ended December 31, 2015 due to the termination of $31.5 million of financing lease obligations of the operating facility.
First Wind Debt Extinguishment
The Company repaid certain long-term indebtedness for the renewable energy facilities acquired as part of the First Wind Acquisition. The Company recognized a loss on the extinguishment of debt of $6.4 million during the year ended December 31, 2015 as a result of this repayment.
Minimum Lease Payments
The aggregate amounts of minimum lease payments on the Company's financing lease obligations are $115.8 million. Contractual obligations for 2018 through 2022 and thereafter, are as follows:
(In thousands) | 2018 | 2019 | 2020 | 2021 | 2022 | Thereafter | Total | ||||||||||||||||||||
Minimum lease obligations1 | $ | 9,852 | $ | 19,108 | $ | 9,218 | $ | 9,130 | $ | 5,700 | $ | 62,779 | $ | 115,787 | |||||||||||||
———
(1) | Represents the minimum lease payment due dates for the Company's financing lease obligations and does not reflect the reclassification of $39.4 million of financing lease obligations to current as a result of debt defaults under certain of the Company's non-recourse financing arrangements. |
121
Maturities
The aggregate contractual payments of long-term debt due after December 31, 2017, excluding financing lease obligations and amortization of debt discounts, premiums and deferred financing costs, as stated in the financing agreements, are as follows:
(In thousands) | 20181 | 2019 | 2020 | 2021 | 2022 | Thereafter | Total | ||||||||||||||||||||
Maturities of long-term debt as of December 31, 20172 | $ | 152,745 | $ | 91,404 | $ | 96,087 | $ | 99,278 | $ | 591,032 | $ | 2,496,183 | $ | 3,526,729 | |||||||||||||
———
(1) | Includes $60.0 million of New Revolver indebtedness, of which the Company repaid $42.0 million with cash on hand in the first quarter of 2018. |
(2) | Represents the contractual principal payment due dates for the Company's long-term debt and does not reflect the reclassification of $200.3 million of long-term debt to current as a result of debt defaults under certain of the Company's non-recourse financing arrangements. |
12. INCOME TAXES
The income tax provision consisted of the following:
(In thousands) | Current | Deferred | Total | |||||||||
Year ended December 31, 2017 | ||||||||||||
U.S. federal | $ | (45 | ) | $ | (23,928 | ) | $ | (23,973 | ) | |||
State and local | 95 | (1,211 | ) | (1,116 | ) | |||||||
Foreign | 220 | 1,789 | 2,009 | |||||||||
Total expense (benefit) | $ | 270 | $ | (23,350 | ) | $ | (23,080 | ) | ||||
Tax expense in equity | — | 14,081 | 14,081 | |||||||||
Total | $ | 270 | $ | (9,269 | ) | $ | (8,999 | ) | ||||
Year ended December 31, 2016 | ||||||||||||
U.S. federal | $ | 66 | $ | (103 | ) | $ | (37 | ) | ||||
State and local | 53 | (1,109 | ) | (1,056 | ) | |||||||
Foreign | — | 1,587 | 1,587 | |||||||||
Total expense | $ | 119 | $ | 375 | $ | 494 | ||||||
Tax expense in equity | — | 406 | 406 | |||||||||
Total | $ | 119 | $ | 781 | $ | 900 | ||||||
Year ended December 31, 2015 | ||||||||||||
U.S. federal | $ | 98 | $ | (12,507 | ) | $ | (12,409 | ) | ||||
State and local | — | (1,182 | ) | (1,182 | ) | |||||||
Foreign | 158 | 192 | 350 | |||||||||
Total expense (benefit) | $ | 256 | $ | (13,497 | ) | $ | (13,241 | ) | ||||
Tax expense in equity | — | 14,627 | 14,627 | |||||||||
Total | $ | 256 | $ | 1,130 | $ | 1,386 | ||||||
122
Effective Tax Rate
The income tax provision differed from the amounts computed by applying the statutory U.S. federal income tax rate of 35% to loss before income taxes, as follows:
Year Ended December 31, | |||||||||
2017 | 2016 | 2015 | |||||||
Income tax benefit at U.S. federal statutory rate | 35.0 | % | 35.0 | % | 35.0 | % | |||
Increase (reduction) in income taxes: | |||||||||
State income taxes, net of U.S. federal benefit | 4.0 | (5.9 | ) | 1.0 | |||||
Foreign operations | 8.7 | (1.5 | ) | 9.9 | |||||
Non-controlling interest | (9.4 | ) | (15.9 | ) | (20.6 | ) | |||
Goodwill impairment | — | (6.2 | ) | — | |||||
Stock-based compensation | — | — | (2.2 | ) | |||||
Tax Act rate change impact | 2.0 | — | — | ||||||
Change in valuation allowance | (34.1 | ) | (4.7 | ) | (17.7 | ) | |||
Other | 2.8 | (1.0 | ) | 0.6 | |||||
Effective tax rate | 9.0 | % | (0.2 | )% | 6.0 | % | |||
Prior to the consummation of the Merger on October 16, 2017, TerraForm Power owned approximately 66% of Terra LLC and SunEdison owned approximately 34% of Terra LLC. On October 16, 2017, pursuant to the Settlement Agreement, SunEdison transferred its interest in Terra LLC to TerraForm Power. As a result of this transaction, TerraForm Power now owns 100% of the capital and profits interest in Terra LLC, except for the IDRs which are owned by Brookfield IDR Holder.
Terraform Power consolidates the results of Terra LLC through its controlling interest. Prior to the consummation of the Merger, it recorded SunEdison's ownership of Terra LLC as a non-controlling interest in the financial statements. Terra LLC is treated as a partnership for income tax purposes. As such, the Company recorded income tax on its share of Terra LLC's taxable income and SunEdison recorded income tax on its share of Terra LLC's taxable income in accordance with the applicable ownership percentages before and after the Merger on October 16, 2017.
For the year ended December 31, 2017, the overall effective tax rate was different than the statutory rate of 35% primarily due to loss allocated to the recording of a valuation allowance on certain tax benefits attributed to the Company, loss
allocated to non-controlling interests, the revaluation of deferred federal and state tax balances and the effect of foreign and state taxes. For the year ended December 31, 2016, the overall effective tax rate was different than the statutory rate of 35% primarily due to loss allocated to the recording of a valuation allowance on certain tax benefits attributed to the Company, loss allocated to non-controlling interests, the impairment of goodwill at Capital Dynamics and the effect of state taxes. For the year ended December 31, 2015, the overall effective tax rate was different than the statutory rate of 35% primarily due to the recording of a valuation allowance on certain tax benefits attributed to the Company, loss allocated to non-controlling interests and due to the application of the intraperiod allocation rules, resulting in a significant tax provision recorded in other comprehensive income. As of December 31, 2017 and 2016, most jurisdictions were in a net deferred tax asset position. A valuation allowance is recorded against the deferred tax assets primarily because of the history of losses in those jurisdictions.
123
The tax effects of the major items recorded as deferred tax assets and liabilities were as follows:
As of December 31, | ||||||||
(In thousands) | 2017 | 2016 | ||||||
Deferred tax assets: | ||||||||
Net operating losses and tax credit carryforwards | $ | 402,162 | $ | 463,940 | ||||
Deferred revenue | — | 743 | ||||||
Other | — | 5,445 | ||||||
Total deferred tax assets | 402,162 | 470,128 | ||||||
Valuation allowance | (152,142 | ) | (419,875 | ) | ||||
Net deferred tax assets | 250,020 | 50,253 | ||||||
Deferred tax liabilities: | ||||||||
Investment in partnership | 234,312 | 73,629 | ||||||
Renewable energy facilities | 29,541 | 4,347 | ||||||
Deferred revenue | 13 | — | ||||||
Other | 4,790 | — | ||||||
Total deferred tax liabilities | 268,656 | 77,976 | ||||||
Net deferred tax liabilities | $ | 18,636 | $ | 27,723 | ||||
The underlying renewable energy facilities are controlled under Terra LLC, and thus deferred tax assets and liabilities at the Company's portfolio companies are captured within the deferred tax asset for investment in partnership. The Company has gross net operating loss carryforwards of $1.4 billion in the U.S. and gross net operating loss carryforwards of $138.4 million in foreign jurisdictions that will both expire beginning in 2035. The Company believes that it is more likely than not that it will not generate sufficient taxable income to realize the deferred tax assets associated with its net operating losses and tax credit carryforwards and has recorded a valuation allowance against its deferred tax assets, with the exception of $31.4 million of net operating losses at its Canadian operations. The Company is currently performing an analysis of limitations on the use of net operating losses under Section 382. The results of this analysis may impact the Company's ability to utilize portions of its net operating losses in future periods or could reduce the net operating losses available for carryover and utilization in future periods.
The decrease in the valuation allowance during 2017 was primarily driven by a $75.9 million decrease resulting from the reduction of the U.S. federal tax rate to 21% due to the enactment of the Tax Act, a $43.0 million U.S. return to provision adjustment and a $150.0 million decrease related to an offsetting adjustment to deferred tax liabilities to correct the outside basis in the partnership.
During the fourth quarter of 2017, management identified an immaterial error resulting from the ownership percentages used to allocate lower-tier partnership income to a subsidiary of the Company included in the U.S. tax provision. The error caused an overstatement of taxable income used in the income tax provision calculation in 2016 of approximately $16.2 million, which resulted in an error in the income tax provision. This 2016 error was corrected in the fourth quarter of 2017, which resulted in an increase to the net operating loss carryforward deferred tax asset at the corresponding subsidiary and an offsetting $6.4 million increase in the income tax benefit recognized. Management determined that this error did not have an impact on its previously issued filings for the first, second and third quarter of 2017.
As of December 31, 2017 and 2016, the Company had not identified any uncertain tax positions for which a liability was required.
124
13. DERIVATIVES
As part of the Company’s risk management strategy, the Company has entered into derivative instruments which include interest rate swaps, foreign currency contracts and commodity contracts to mitigate interest rate, foreign currency and commodity price exposure. If the Company elects to do so and if the instrument meets the criteria specified in ASC 815, Derivatives and Hedging, the Company designates its derivative instruments as cash flow hedges. The Company enters into interest rate swap agreements in order to hedge the variability of expected future cash interest payments. Foreign currency contracts are used to reduce risks arising from the change in fair value of certain foreign currency denominated assets and liabilities. The objective of these practices is to minimize the impact of foreign currency fluctuations on operating results. The Company also enters into commodity contracts to economically hedge price variability inherent in electricity sales arrangements. The objectives of the commodity contracts are to minimize the impact of variability in spot electricity prices and stabilize estimated revenue streams. The Company does not use derivative instruments for speculative purposes.
As of December 31, 2017 and 2016, fair values of the following derivative instruments were included in the balance sheet captions indicated below:
Fair Value of Derivative Instruments | ||||||||||||||||||||||||||||||||
Hedging Contracts | Derivatives Not Designated as Hedges | |||||||||||||||||||||||||||||||
(In thousands) | Interest Rate Swaps | Commodity Contracts | Interest Rate Swaps | Foreign Currency Contracts | Commodity Contracts | Gross Amounts of Assets/Liabilities Recognized | Gross Amounts Offset in Consolidated Balance Sheet | Net Amounts in Consolidated Balance Sheet | ||||||||||||||||||||||||
As of December 31, 2017 | ||||||||||||||||||||||||||||||||
Prepaid expenses and other current assets | $ | — | $ | 8,961 | $ | — | $ | 63 | $ | 12,609 | $ | 21,633 | $ | (63 | ) | $ | 21,570 | |||||||||||||||
Other assets | 4,686 | 71,307 | — | — | 14,787 | 90,780 | — | 90,780 | ||||||||||||||||||||||||
Total assets | $ | 4,686 | $ | 80,268 | $ | — | $ | 63 | $ | 27,396 | $ | 112,413 | $ | (63 | ) | $ | 112,350 | |||||||||||||||
Accounts payable, accrued expenses and other current liabilities | $ | 2,490 | $ | — | $ | 197 | $ | 99 | $ | — | $ | 2,786 | $ | (63 | ) | $ | 2,723 | |||||||||||||||
Other long-term liabilities | 4,796 | — | 404 | — | — | 5,200 | — | 5,200 | ||||||||||||||||||||||||
Total liabilities | $ | 7,286 | $ | — | $ | 601 | $ | 99 | $ | — | $ | 7,986 | $ | (63 | ) | $ | 7,923 | |||||||||||||||
As of December 31, 2016 | ||||||||||||||||||||||||||||||||
Prepaid expenses and other current assets | $ | 1,150 | $ | 3,664 | $ | — | $ | 953 | $ | 12,028 | $ | 17,795 | $ | — | $ | 17,795 | ||||||||||||||||
Other assets | 411 | 62,474 | — | 460 | 25,167 | 88,512 | — | 88,512 | ||||||||||||||||||||||||
Total assets | $ | 1,561 | $ | 66,138 | $ | — | $ | 1,413 | $ | 37,195 | $ | 106,307 | $ | — | $ | 106,307 | ||||||||||||||||
Accounts payable, accrued expenses and other current liabilities | $ | 10,689 | $ | — | $ | 814 | $ | — | $ | — | $ | 11,503 | $ | — | $ | 11,503 | ||||||||||||||||
Liabilities related to assets held for sale | — | — | 4,041 | — | — | 4,041 | — | 4,041 | ||||||||||||||||||||||||
Other long-term liabilities | 47 | — | — | — | — | 47 | — | 47 | ||||||||||||||||||||||||
Non-current liabilities related to assets held for sale | — | — | 16,786 | — | — | 16,786 | — | 16,786 | ||||||||||||||||||||||||
Total liabilities | $ | 10,736 | $ | — | $ | 21,641 | $ | — | $ | — | $ | 32,377 | $ | — | $ | 32,377 | ||||||||||||||||
125
As of December 31, 2017 and 2016, notional amounts for derivative instruments consisted of the following:
Notional Amount as of December 31, | ||||||
(In thousands) | 2017 | 2016 | ||||
Derivatives designated as hedges: | ||||||
Interest rate swaps (USD) | 395,986 | 433,874 | ||||
Interest rate swaps (CAD) | 156,367 | 84,713 | ||||
Commodity contracts (MWhs) | 15,579 | 16,988 | ||||
Derivatives not designated as hedges: | ||||||
Interest rate swaps (USD) | 13,520 | 14,681 | ||||
Interest rate swaps (GBP) | — | 222,018 | ||||
Foreign currency contracts (CAD) | 9,875 | 25,075 | ||||
Commodity contracts (MWhs) | 987 | 1,407 | ||||
The Company has elected to present net derivative assets and liabilities on the balance sheet as a right to setoff exists. For interest rate swaps, the Company either nets derivative assets and liabilities on a trade-by-trade basis or nets them in accordance with a master netting arrangement if such an arrangement exists with the counterparties. Foreign currency contracts are netted by currency in accordance with a master netting arrangement. The Company has a master netting arrangement for its commodity contracts for which no amounts were netted as of December 31, 2017 or 2016 as each of the commodity contracts were in a gain position.
Gains and losses on derivatives not designated as hedges for the years ended December 31, 2017, 2016 and 2015 consisted of the following:
Location of Loss (Gain) in the Statements of Operations | Year Ended December 31, | |||||||||||||
(In thousands) | 2017 | 2016 | 2015 | |||||||||||
Interest rate swaps | Interest expense, net | $ | 3,161 | $ | 26,280 | $ | 345 | |||||||
Foreign currency contracts | (Gain) loss on foreign currency exchange, net | 966 | (1,325 | ) | (3,600 | ) | ||||||||
Commodity contracts | Operating revenues, net | (5,117 | ) | (10,890 | ) | (10,178 | ) | |||||||
During the second quarter of 2016, the Company discontinued hedge accounting for interest rate swaps that were previously designated as cash flow hedges of the forecasted interest payments pertaining to variable rate project debt in the U.K. Portfolio. Hedge accounting was prospectively discontinued for interest payments occurring before the anticipated sale date of June 2017, and for periods beyond that, the losses of $16.9 million accumulated in other comprehensive income were fully reclassified into interest expense, net during the second quarter of 2016. Subsequent to the discontinuation of hedge accounting, the Company recognized additional net unrealized losses of $7.3 million pertaining to these interest rate swaps during the year ended December 31, 2016 that are also reported in interest expense, net in the consolidated statement of operations.
As discussed in Note 4. Assets Held for Sale, the Company consummated the sale of the U.K. Portfolio on May 11, 2017. As part of the sale agreement, Vortex Solar UK Limited assumed the debt and the associated interest rate swaps. As of the date of the sale, the remaining loss amount accumulated in other comprehensive income of $0.4 million was reclassified into interest expense, net, and the fair value of the interest rate swap liability of $23.4 million is reflected within gain on sale of renewable energy facilities in the consolidated statement of operations for the year ended December 31, 2017. The interest expense amount reflected in the table above for the year ended December 31, 2017 primarily pertains to these interest rate swaps.
126
Gains and losses recognized related to derivatives designated as cash flow hedges for the years ended December 31, 2017, 2016 and 2015 consisted of the following:
Year Ended December 31, | ||||||||||||||||||||||||||||||||||||||
(Loss) Gain Recognized in Other Comprehensive Income (Effective Portion) net of taxes1 | Location of Amount Reclassified from Accumulated Other Comprehensive Income into Income (Effective Portion) | Amount of Loss (Gain) Reclassified from Accumulated Other Comprehensive Income into Income (Effective Portion)2 | Amount of Loss (Gain) Recognized in Income (Ineffective Portion and Amount Excluded from Effectiveness Testing) | |||||||||||||||||||||||||||||||||||
(In thousands) | 2017 | 2016 | 2015 | 2017 | 2016 | 2015 | 2017 | 2016 | 2015 | |||||||||||||||||||||||||||||
Interest rate swaps | $ | (396 | ) | $ | (20,360 | ) | $ | (11,482 | ) | Interest expense, net | $ | 5,507 | $ | 11,618 | $ | 4,663 | $ | (1,270 | ) | $ | — | $ | — | |||||||||||||||
Commodity contracts | 18,008 | 20,274 | 38,395 | Operating revenues, net | (7,754 | ) | (12,572 | ) | — | (2,923 | ) | 5,121 | — | |||||||||||||||||||||||||
Total | $ | 17,612 | $ | (86 | ) | $ | 26,913 | $ | (2,247 | ) | $ | (954 | ) | $ | 4,663 | $ | (4,193 | ) | $ | 5,121 | $ | — | ||||||||||||||||
————
(1) | Net of tax benefit of $0.1 million attributed to interest rate swaps during the year ended December 31, 2017 and tax expense of $2.5 million, $0.4 million and $14.6 million attributed to commodity contracts during the years ended December 31, 2017, 2016 and 2015, respectively. There were no taxes attributed to interest rate swaps during the years ended December 31, 2016 and 2015. |
(2) | Net of tax benefit of $1.1 million and tax expense of $1.5 million attributed to interest rate swaps and commodity contracts during the year ended December 31, 2017, respectively. There were no taxes attributed to derivatives designated as cash flow hedges during the years ended December 31, 2016 and 2015. |
As of December 31, 2017 and 2016, the Company had posted letters of credit in the amount of $15.0 million and $18.0 million, respectively, as collateral related to certain commodity contracts. Certain derivative contracts contain provisions providing the counterparties a lien on specific assets as collateral. There was no cash collateral received or pledged as of December 31, 2017 and 2016 related to the Company's derivative transactions.
Derivatives Designated as Hedges
Interest Rate Swaps
The Company has interest rate swap agreements to hedge variable rate non-recourse debt. These interest rate swaps qualify for hedge accounting and were designated as cash flow hedges. Under the interest rate swap agreements, the renewable energy facilities pay a fixed rate and the counterparties to the agreements pay a variable interest rate. The amounts deferred in other comprehensive income and reclassified into earnings during the years ended December 31, 2017, 2016 and 2015 related to these interest rate swaps are provided in the tables above. The loss expected to be reclassified into earnings over the next twelve months is approximately $1.4 million. The maximum term of outstanding interest rate swaps designated as hedges is 16 years.
As discussed in Note 11. Long-term Debt, the Company experienced defaults under certain of its non-recourse financing agreements. As the Company's interest rate swap agreements contain cross-default provisions, $4.8 million of related liabilities were reclassified to current as of December 31, 2016. There was no similar reclassification for these interest rate swaps as of December 31, 2017 as the defaults under the corresponding financing agreements were cured and/or waived prior to the issuance of the financial statements. The Company did not expect any changes to the underlying cash flows as a result of the defaults that existed in the prior year and thus determined that there was no impact to the swaps' qualification for hedge accounting and designation as cash flow hedges.
Commodity Contracts
The Company has long-dated physically delivered commodity contracts that hedge variability in cash flows associated with the sales of power from certain renewable energy facilities located in Texas. These commodity contracts qualify for hedge accounting and are designated as cash flow hedges. Accordingly, the effective portions of the change in fair value of these derivatives are reported in accumulated other comprehensive income and subsequently reclassified to earnings in the periods when the hedged transactions affect earnings. Any ineffective portions of the derivatives’ change in fair value are recognized currently in earnings. The amounts deferred in other comprehensive income and reclassified into earnings during the years ended December 31, 2017, 2016 and 2015 related to these commodity contracts are provided in the tables above. The gain
127
expected to be reclassified into earnings over the next twelve months is approximately $9.4 million. The maximum term of outstanding commodity contracts designated as hedges is 12 years.
Derivatives Not Designated as Hedges
Interest Rate Swaps
The Company has interest rate swap agreements that economically hedge the cash flows for non-recourse debt. These interest rate swaps pay a fixed rate and the counterparties to the agreements pay a variable interest rate. The changes in fair value are recorded in interest expense, net in the consolidated statements of operations as these hedges are not accounted for under hedge accounting.
As discussed in Note 11. Long-term Debt, the Company experienced defaults under certain of its non-recourse financing agreements. As the Company's interest rate swap agreements contain cross-default provisions, $0.5 million of related liabilities were reclassified to current as of December 31, 2016. There was no similar reclassification for these interest rate swaps as of December 31, 2017 as the defaults under the corresponding financing agreements were cured and/or waived prior to the issuance of the financial statements.
As of December 31, 2016, the Company reclassified $4.0 million of current derivative liabilities to liabilities related to assets held for sale and $16.8 million of non-current derivative liabilities to non-current liabilities related to assets held for sale. These pertained to interest rate swap agreements for the U.K. Portfolio. There was no similar reclassification as of December 31, 2017 as the sale of the related renewable energy facilities closed in the first half of 2017. The Company discontinued hedge accounting for these interest rate swaps during the second quarter of 2016 as discussed above.
Foreign Currency Contracts
The Company has foreign currency contracts in order to economically hedge its exposure to foreign currency fluctuations. The settlement of these hedges occurs on a quarterly basis through maturity. As these hedges are not accounted for under hedge accounting, the changes in fair value are recorded in (gain) loss on foreign currency exchange, net in the consolidated statements of operations.
Commodity Contracts
The Company has commodity contracts in order to economically hedge commodity price variability inherent in certain electricity sales arrangements. If the Company sells electricity to an independent system operator market and there is no PPA available, it may enter into a commodity contract to hedge all or a portion of their estimated revenue stream. These commodity contracts require periodic settlements in which the Company receives a fixed-price based on specified quantities of electricity and pays the counterparty a variable market price based on the same specified quantity of electricity. As these hedges are not accounted for under hedge accounting, the changes in fair value are recorded in operating revenues, net in the consolidated statements of operations.
14. FAIR VALUE OF FINANCIAL INSTRUMENTS
The fair value of assets and liabilities are determined using either unadjusted quoted prices in active markets (Level 1) or pricing inputs that are observable (Level 2) whenever that information is available and using unobservable inputs (Level 3) to estimate fair value only when relevant observable inputs are not available. The Company uses valuation techniques that maximize the use of observable inputs. Assets and liabilities are classified in their entirety based on the lowest priority level of input that is significant to the fair value measurement. Where observable inputs are available for substantially the full term of the asset or liability, the instrument is categorized in Level 2. If the inputs into the valuation are not corroborated by market data, in such instances, the valuation for these contracts is established using techniques including extrapolation from or interpolation between actively traded contracts, as well as calculation of implied volatilities. When such inputs have a significant impact on the measurement of fair value, the instrument is categorized as Level 3. The Company regularly evaluates and validates the inputs used to determine fair value of Level 3 contracts by using pricing services to support the underlying market price of the commodity.
128
The Company uses a discounted cash flow valuation technique to fair value its derivative assets and liabilities. The primary inputs in the valuation models for commodity contracts are market observable forward commodity curves and risk-free discount rates and to a lesser degree credit spreads and volatilities. The primary inputs into the valuation of interest rate swaps and foreign currency contracts are forward interest rates and foreign currency exchange rates and to a lesser degree credit spreads.
Recurring Fair Value Measurements
The following table summarizes the financial instruments measured at fair value on a recurring basis classified in the fair value hierarchy (Level 1, 2 or 3) based on the inputs used for valuation in the consolidated balance sheets:
As of December 31, 2017 | As of December 31, 2016 | ||||||||||||||||||||||||||||||
(In thousands) | Level 1 | Level 2 | Level 3 | Total | Level 1 | Level 2 | Level 3 | Total | |||||||||||||||||||||||
Assets | |||||||||||||||||||||||||||||||
Interest rate swaps | $ | — | $ | 4,686 | $ | — | $ | 4,686 | $ | — | $ | 1,561 | $ | — | $ | 1,561 | |||||||||||||||
Commodity contracts | — | 27,396 | 80,268 | 107,664 | — | 37,195 | 66,138 | 103,333 | |||||||||||||||||||||||
Foreign currency contracts | — | — | — | — | — | 1,413 | — | 1,413 | |||||||||||||||||||||||
Total derivative assets | $ | — | $ | 32,082 | $ | 80,268 | $ | 112,350 | $ | — | $ | 40,169 | $ | 66,138 | $ | 106,307 | |||||||||||||||
Liabilities | |||||||||||||||||||||||||||||||
Interest rate swaps | $ | — | $ | 7,887 | $ | — | $ | 7,887 | $ | — | $ | 32,377 | $ | — | $ | 32,377 | |||||||||||||||
Foreign currency contracts | — | 36 | — | 36 | — | — | — | — | |||||||||||||||||||||||
Total derivative liabilities | $ | — | $ | 7,923 | $ | — | $ | 7,923 | $ | — | $ | 32,377 | $ | — | $ | 32,377 | |||||||||||||||
The Company's interest rate swaps, commodity contracts not designated as hedges and foreign currency contracts are considered Level 2, since all significant inputs are corroborated by market observable data. The Company's commodity contracts designated as hedges are considered Level 3 as they contain significant unobservable inputs. There were no transfers in or out of Level 1, Level 2 and Level 3 during the year ended December 31, 2017.
The following table reconciles the changes in the fair value of derivative instruments classified as Level 3 in the fair value hierarchy for the years ended December 31, 2017 and 2016:
Year Ended December 31, | |||||||
(In thousands) | 2017 | 2016 | |||||
Beginning balance | $ | 66,138 | $ | 63,154 | |||
Realized and unrealized gains (losses): | |||||||
Included in other comprehensive income | 11,207 | 8,104 | |||||
Included in operating revenues, net | 12,205 | 7,451 | |||||
Settlements | (9,282 | ) | (12,571 | ) | |||
Balance as of December 31 | $ | 80,268 | $ | 66,138 | |||
The significant unobservable inputs used in the valuation of the Company's commodity contracts categorized as Level 3 in the fair value hierarchy as of December 31, 2017 are as follows:
(In thousands, except range) | Fair Value as of December 31, 2017 | |||||||||||||||||||
Transaction Type | Assets | Liabilities | Valuation Technique | Unobservable Inputs | Range | |||||||||||||||
Commodity contracts - power | $ | 80,268 | $ | — | Discounted cash flow | Forward price (per MWh) | $ | 13.8 | - | $ | 77.4 | |||||||||
Option model | Volatilities | 3.0 | % | - | 7.1 | % | ||||||||||||||
129
The sensitivity of the Company's fair value measurements to increases (decreases) in the significant unobservable inputs is as follows:
Significant Unobservable Input | Position | Impact on Fair Value Measurement | ||
Increase (decrease) in forward price | Forward sale | Decrease (increase) | ||
Increase (decrease) in implied volatilities | Purchase option | Increase (decrease) | ||
The Company measures the sensitivity of the fair value of its Level 3 commodity contracts to potential changes in commodity prices using a mark-to-market analysis based on the current forward commodity prices and estimates of the price volatility. An increase in power forward prices will produce a mark-to-market loss, while a decrease in prices will result in a mark-to-market gain.
Fair Value of Debt
The carrying amount and estimated fair value of the Company's long-term debt as of December 31, 2017 and 2016 is as follows:
As of December 31, 2017 | As of December 31, 2016 | |||||||||||||||
(In thousands) | Carrying Amount | Fair Value | Carrying Amount | Fair Value | ||||||||||||
Long-term debt, including current portion | $ | 3,598,800 | $ | 3,702,470 | $ | 3,950,914 | $ | 4,080,397 | ||||||||
The fair value of the Company's long-term debt, except the senior notes was determined using inputs classified as Level 2 and a discounted cash flow approach using market rates for similar debt instruments. The fair value of the senior notes is based on market price information which is classified as a Level 1 input. They are measured using the last available trades at the end of each respective fiscal year. The fair value of the New Senior Notes due 2023, Senior Notes due 2025 and Senior Notes due 2028 were 99.50%, 109.50% and 99.38% of face value as of December 31, 2017, respectively. The fair value of the Senior Notes due 2023 and Senior Notes due 2025 were 101.38% and 103.75% of face value as of December 31, 2016, respectively.
Nonrecurring Fair Value Measurements
Assets and liabilities that are measured at fair value on a nonrecurring basis relate primarily to renewable energy facilities, goodwill and intangibles, which are remeasured when the derived fair value is below carrying value on the Company's consolidated balance sheet. For these assets, the Company does not periodically adjust carrying value to fair value except in the event of impairment. When the impairment has occurred, the Company measures the impairment and adjusts the carrying value as discussed in Note 2. Summary of Significant Accounting Policies.
During the fourth quarter of 2016, certain long-lived assets met the criteria to be classified as held for sale (as discussed in Note 4. Assets Held for Sale). The fair value of these long-lived assets was measured, resulting in expected disposal losses of $15.7 million. The long-lived asset fair value amount of $19.5 million was measured by obtaining multiple bids from prospective buyers. The Company did not engage third-party appraisers. The fair value measurement was categorized as Level 2, as significant observable inputs were used in the valuation. The expected disposal losses, which represented the difference between the fair value less costs to sell and the carrying amount of the assets and liabilities held for sale, were recognized in impairment of renewable energy facilities within the consolidated statement of operations for the year ended December 31, 2016. As discussed in Note 4. Assets Held for Sale, the Company closed on the sale of these assets in the first half of 2017 and no additional loss was recognized as a result of the sale.
As discussed in Note 8. Goodwill, the Company performed its annual impairment test of the carrying value of its goodwill as of December 1, 2016 and concluded that the goodwill amount of $55.9 million was fully impaired. The inputs used to measure the estimated fair value of goodwill are classified as a Level 3 fair value measurement due to the significance of unobservable inputs using company-specific information.
130
15. STOCKHOLDERS' EQUITY
January 2015 Public Offering
On January 22, 2015, TerraForm Power sold 13,800,000 shares of its Class A common stock to the public in a registered offering including 1,800,000 shares sold pursuant to the underwriters' overallotment option. TerraForm Power received net proceeds of $390.6 million, which were used to purchase 13,800,000 Class A units of Terra LLC. Terra LLC used $50.9 million to repurchase 1,800,000 Class B units from SunEdison. Concurrent with this transaction, 1,800,000 shares of TerraForm Power Class B common stock were canceled.
June 2015 Public Offering
On June 24, 2015, TerraForm Power sold 18,112,500 shares of its Class A common stock to the public in a registered offering including 2,362,500 shares sold pursuant to the underwriters' overallotment option. TerraForm Power received net proceeds of $667.6 million, which were used to purchase 18,112,500 Class A units of Terra LLC. Terra LLC used $87.1 million to repurchase 2,362,500 Class B units from SunEdison. Concurrent with this transaction, 2,362,500 shares of TerraForm Power Class B common stock were canceled.
Riverstone Exchange
As of May 28, 2015, all outstanding Class B1 units in Terra LLC and all outstanding shares of Class B1 common stock of TerraForm Power held by R/C US Solar Investment Partnership, L.P. (“Riverstone”) had been converted into Class A units of Terra LLC held by TerraForm Power and shares of Class A common stock of TerraForm Power.
Reduction in SunEdison’s Ownership of Class B Shares
On January 22, 2016, TerraForm Power issued 12,161,844 shares of Class A common stock to affiliates of the D.E. Shaw group, Madison Dearborn Capital Partners IV, L.P. and Northwestern University, and Terra LLC issued 12,161,844 Class A units of Terra LLC to TerraForm Power upon conversion of 12,161,844 Class B shares of TerraForm Power common stock and 12,161,844 Class B units of Terra LLC held by SunEdison. After giving effect to the conversion, SunEdison indirectly owned 48,202,310 Class B shares of TerraForm Power and 48,202,310 Class B units of Terra LLC.
Stockholder Protection Rights Agreement
On July 24, 2016, the Company's Board of Directors (the “Board”) adopted a Stockholder Protection Rights Agreement (the “Rights Agreement”) and declared a dividend of one right on each outstanding share of TerraForm Power Class A common stock. The record date to determine which stockholders were entitled to receive the rights was August 4, 2016. The Rights Agreement was adopted in response to the potential sale of a significant equity stake in the Company by SunEdison and the potential accumulation of TerraForm Power Class A shares. The Rights Agreement and the rights expired in accordance with their terms on August 10, 2017, which was the date of the annual shareholders meeting for 2017 of TerraForm Power.
Merger Consummation and SunEdison Settlement Agreement
As discussed in Note 1. Nature of Operations and Basis of Presentation, on October 16, 2017, pursuant to the Merger Agreement, Merger Sub merged with and into TerraForm Power, with TerraForm Power continuing as the surviving corporation in the Merger. Immediately following the consummation of the Merger, there were 148,086,027 Class A shares of TerraForm Power outstanding, which excludes 138,402 Class A shares that were issued and held in treasury to pay applicable employee tax withholdings for RSUs held by employees that vested upon the consummation of the Merger. As a result of the Merger, Orion Holdings holds 51% of TerraForm Power's outstanding Class A shares.
Prior to the consummation of the Merger, SunEdison was the indirect holder of 100% of the shares of Class B common stock of TerraForm Power and held approximately 83.9% of the combined total voting power of the holders of TerraForm Power’s Class A common stock and Class B common stock. As contemplated by the Merger Agreement and in satisfaction of its obligations under the Settlement Agreement, SunEdison exchanged, effective immediately prior to the effective time of the Merger, all of the Class B units of Terra LLC held by it or any of its controlled affiliates for 48,202,310 Class A shares of TerraForm Power. Following completion of this exchange, all of the issued and outstanding shares of Class B common stock of
131
TerraForm Power were automatically redeemed and retired. Pursuant to the Settlement Agreement, immediately following this exchange, the Company issued to SunEdison additional Class A shares such that immediately prior to the effective time of the Merger, SunEdison and certain of its affiliates held an aggregate number of Class A shares equal to 36.9% of TerraForm Power’s fully diluted share count (which was subject to proration based on the Merger consideration election results as discussed below). As a result of the Merger closing, TerraForm Power is no longer a controlled affiliate of SunEdison, Inc. and is now a controlled affiliate of Brookfield.
At the effective time of the Merger, each share of Class A common stock of TerraForm Power issued and outstanding immediately prior to the effective time of the Merger, with the exception of certain excluded shares, was converted into the right to, at the holder’s election and subject to proration as described below, either (i) receive $9.52 per Class A Share, in cash, without interest (the “Per Share Cash Consideration”) or (ii) retain one share of Class A common stock, par value $0.01 per share, of the surviving corporation (the “Per Share Stock Consideration,” and, together with the Per Share Cash Consideration, without duplication, the “Per Share Merger Consideration”). Issued and outstanding shares included shares issued in connection with the SunEdison Settlement Agreement as more fully described above and shares underlying outstanding RSUs of the Company under the Company's long-term incentive plan. At the effective time of the Merger, any vesting conditions applicable to any Company RSU outstanding immediately prior to the effective time of the Merger under the Company’s long-term incentive plan were automatically and without any required action on the part of the holder, deemed to be satisfied in full, and such Company RSU was canceled and converted into the right to receive the Per Share Merger Consideration, including the election of the Per Share Stock Consideration or the Per Share Cash Consideration in respect of each share (in the case of RSUs subject to performance conditions, with such conditions deemed satisfied at “target” levels), less any tax withholdings. The Per Share Stock Consideration was subject to proration in the event that the aggregate number of Class A Shares for which an election to receive the Per Share Stock Consideration exceeded 49% of the TerraForm Power fully diluted share count (the “Maximum Stock Consideration Shares”). Additionally, the Per Share Cash Consideration was subject to proration in the event that the aggregate number of Class A shares for which an election to receive the Per Share Cash Consideration exceeded the TerraForm Power fully diluted share count minus (i) the Maximum Stock Consideration Shares, (ii) any Class A shares currently held by affiliates of Brookfield, and (iii) any shares for which the holders seek appraisal under Delaware law. Based on the results of the consideration election, the elections of the Per Share Stock Consideration were oversubscribed and the proration ratio was 62.6%, which meant that stockholders electing to receive 100% of their merger consideration in stock retained 62.6% of their Class A shares in the Merger and received cash consideration in respect of 37.4% of their shares.
On October 16, 2017, in connection with the consummation of the Merger, the Company entered into a registration rights agreement (the “SunEdison Registration Rights Agreement”) with SunEdison, Inc., SunEdison Holdings Corporation (“SHC”) and SUNE ML 1, LLC (“SML1”). The SunEdison Registration Rights Agreement governed the rights of SunEdison, Inc., SHC, SML1 and certain permitted assigns with respect to the registration for resale of Class A shares held by them immediately following the Merger. The Company registered these shares in December of 2017, and these shares were distributed by SunEdison, Inc., SHC and SML1 under the plan of reorganization in connection with SunEdison's emergence from bankruptcy in December of 2017.
Upon the consummation of the Merger, the Company's certificate of incorporation was amended and restated. TerraForm Power now has 100,000,000 authorized shares of preferred stock, par value $0.01 per share, and 1,200,000,000 authorized shares of Class A common stock, par value $0.01 per share. There are no other authorized classes of shares, and the Company does not have any issued shares of preferred stock.
132
Dividends
The following table presents cash dividends declared and/or paid on Class A common stock during 2017, 2016 and 2015. Prior to the Special Dividend (as defined below), TerraForm Power had not declared or paid a dividend since the quarterly dividend for the third quarter of 2015.
Dividends per Share | Declaration Date | Record Date | Payment Date | ||||||
2017: | |||||||||
Special Dividend1 | $ | 1.940 | October 6, 2017 | October 16, 2017 | October 17, 2017 | ||||
2015: | |||||||||
Third Quarter | 0.350 | November 9, 2015 | December 1, 2015 | December 15, 2015 | |||||
Second Quarter | 0.335 | August 6, 2015 | September 1, 2015 | September 15, 2015 | |||||
First Quarter | 0.325 | May 7, 2015 | June 1, 2015 | June 15, 2015 | |||||
2014: | |||||||||
Fourth Quarter | 0.270 | December 22, 2014 | March 2, 2015 | March 16, 2015 | |||||
———
(1) | On October 6, 2017, the Board declared the payment of a special cash dividend (the “Special Dividend”) to holders of record immediately prior to the effective time of the Merger in the amount of $1.94 per fully diluted share, which included the Company’s issued and outstanding Class A shares, Class A shares issued to SunEdison pursuant to the Settlement Agreement (more fully described above) and Class A shares underlying outstanding RSUs of the Company under the Company’s long-term incentive plan. |
On February 6, 2018, the Board declared a quarterly dividend with respect to TerraForm Power's Class A common stock of $0.19 per share. The dividend is payable on March 30, 2018 to shareholders of record as of February 28, 2018. This dividend represents the Company's first dividend payment under Brookfield sponsorship.
16. STOCK-BASED COMPENSATION
The Company has an equity incentive plan that provides for the award of incentive and nonqualified stock options, restricted stock awards (“RSAs”) and RSUs to personnel and directors who provide services to the Company, including personnel and directors who also provide services to the Company's affiliates, including SunEdison and TerraForm Global, Inc. during the periods those companies were affiliates of the Company. The maximum contractual term of an award is ten years from the date of grant. As of December 31, 2017, an aggregate of 3,926,121 shares of Class A common stock were available for issuance under this plan. Upon exercise of stock options or the vesting of RSUs, the Company will issue shares that have been previously authorized to be issued.
Historically, stock-based compensation costs related to equity awards in the Company's stock were allocated to the Company, SunEdison and TerraForm Global, Inc. based on the relative percentage of time that the personnel and directors spent providing services to the respective companies. As of January 1, 2017, the Company hired certain former employees of SunEdison who provided dedicated services to the Company. The amount of stock-based compensation expense related to equity awards in the Company's stock which has been awarded to the Company’s employees was $11.3 million, $3.4 million and $12.1 million for the years ended December 31, 2017, 2016 and 2015, respectively, and is reflected in the consolidated statements of operations within general and administrative expenses. The total amount of stock-based compensation cost related to equity awards in the Company's stock which has been allocated to SunEdison and TerraForm Global, Inc. was $3.4 million for the years ended December 31, 2017 and 2016 and $10.5 million for the year ended December 31, 2015, and was recognized as a distribution to SunEdison within Net SunEdison investment on the consolidated statement of stockholders' equity with no impact to the Company's consolidated statement of operations. Similarly, stock-based compensation costs related to equity awards in the stock of SunEdison, Inc. and TerraForm Global, Inc. awarded to employees of the Company were allocated to the Company. The amount of stock-based compensation expense related to equity awards in the stock of SunEdison, Inc. and TerraForm Global, Inc. that was allocated to the Company was $5.5 million, $2.7 million and $1.0 million for the years ended December 31, 2017, 2016 and 2015, respectively, and is reflected in the consolidated statement of operations within general and administrative expenses - affiliate and has been treated as an equity contribution from SunEdison within Net SunEdison investment on the consolidated statements of stockholders' equity. In July of 2017, the Bankruptcy Court approved SunEdison's plan of reorganization which provided that all unvested equity awards in the stock of SunEdison, Inc. would be canceled. As a result, all previously unrecognized compensation cost pertaining to unvested equity awards in the stock of SunEdison, Inc. that
133
were held by the Company's employees of $2.2 million was allocated to the Company, which is reflected within the stock-based compensation expense amount for the year ended December 31, 2017.
Restricted Stock Awards
RSAs provide the holder with immediate voting rights, but are restricted in all other respects until vested. Upon a termination of employment for any reason, any unvested shares of Class A common stock held by the terminated participant will be forfeited. All unvested RSAs are paid dividends and distributions. There were no unvested RSAs as of December 31, 2017.
The following table presents information regarding outstanding RSAs as of December 31, 2017 and changes during the year then ended:
Number of RSAs Outstanding | Weighted-Average Grant-Date Fair Value Per Share | Aggregate Intrinsic Value (in millions) | |||||||||
Balance at January 1, 2017 | 366,195 | $ | 8.51 | ||||||||
Vested | (366,195 | ) | 8.51 | ||||||||
Balance as of December 31, 2017 | — | $ | — | $ | — | ||||||
The total fair value of RSAs that vested during the years ended December 31, 2017, 2016 and 2015 was $4.3 million, $5.8 million and $65.0 million, respectively. No RSAs were granted during those periods. As of December 31, 2017, there was no unrecognized compensation cost in relation to RSAs.
The removal of a former Chief Executive Officer of the Company on November 20, 2015 resulted in the forfeiture from an accounting perspective of 454,586 RSAs as well as the immediate accelerated vesting of an additional 454,586 RSAs. The aforementioned termination resulted in a net increase to the Company's stock-based compensation expense for the year ended December 31, 2015 of $0.3 million.
Restricted Stock Units
RSUs will not entitle the holders to voting rights and holders of the RSUs will not have any right to receive dividends or distributions. The following table presents information regarding outstanding RSUs as of December 31, 2017 and changes during the year then ended:
Number of RSUs Outstanding | Aggregate Intrinsic Value (in millions) | Weighted Average Remaining Contractual Life (In Years) | ||||||||
Balance at January 1, 2017 | 1,622,953 | |||||||||
Granted | 523,877 | |||||||||
Vested | (1,414,857 | ) | ||||||||
Forfeited | (731,973 | ) | ||||||||
Balance as of December 31, 2017 | — | $ | — | — | ||||||
The total fair value of RSUs that vested during the years ended December 31, 2017, 2016 and 2015 was $16.7 million, $5.6 million and $5.7 million, respectively. The weighted average fair value of RSUs on the date of grant during the same periods was $12.22, $11.61 and $20.60, respectively.
As discussed in Note 1. Nature of Operations and Basis of Presentation, on October 16, 2017, TerraForm Power consummated the Merger with certain affiliates of Brookfield. Pursuant to the TerraForm Power 2014 Second Amended and Restated Long-Term Incentive Plan, the Merger resulted in a change of control causing all unvested equity awards issued under the plan to vest. As a result, the Company recognized a $7.0 million stock-based compensation charge in the fourth quarter of 2017, which is reflected in the consolidated statements of operations within general and administrative expenses. The Company also recognized a $1.0 million charge related to allocated stock-based compensation costs for equity awards in the stock of TerraForm Global, Inc. that vested upon the change of control of TerraForm Power. The charge is reflected in the consolidated
134
statements of operations within general and administrative expenses - affiliate. As of December 31, 2017, the Company had not awarded any additional RSUs, and as a result, there was no unrecognized compensation cost in relation to RSUs as of December 31, 2017.
Time-based RSUs
During the years ended December 31, 2017, 2016 and 2015, the Company awarded 523,877, 439,595 and 1,979,098 time-based RSUs, respectively, to certain employees and executive officers of SunEdison, TerraForm Global, Inc. and the Company. The weighted average grant-date fair value of these time-based awards during the same periods was $6.4 million, $5.1 million and $29.4 million, respectively, which was calculated based on the Company's closing stock price on the respective dates of grant. The vesting schedules of the awarded RSUs ranged from six months to four years, and the Company was recognizing the grant-date fair value as compensation cost on a straight-line basis over the vesting period.
The removal of a former Chief Financial Officer of the Company on November 20, 2015 resulted in the forfeiture of 106,250 RSUs as well as the immediate accelerated vesting of an additional 106,250 RSUs. The aforementioned termination resulted in a net increase to the Company's stock-based compensation expense for the year ended December 31, 2015 of $0.9 million.
Performance-based RSUs
On July 28, 2015, SunEdison began recognizing expense related to 199,239 performance-based RSUs granted by the Company to certain employees of First Wind in connection with its acquisition by SunEdison on January 29, 2015. The performance-based awards were issued in three tranches covering the 2015, 2016 and 2017 fiscal year performance periods and were based on the achievement of targets related to additions to SunEdison's renewable energy generation project development pipeline and backlog, the volume of renewable energy generation projects transferred into the Company or SunEdison's warehouse vehicles and the achievement of cash available for distribution by wind power plants sold to the Company through the First Wind Acquisition agreement. The grant-date fair value of these awards was $6.2 million which was being recognized as compensation expense on a straight-line basis over the requisite service periods of one year for the 2015 tranche, two years for the 2016 tranche, and three years for the 2017 tranche. The grant-date fair value of these awards was calculated based on the Company's stock price on the date of grant since meeting the requisite performance conditions was considered probable as of that date. As the achievement of these performance metrics was not considered probable as of the first quarter of 2016, all previously recognized compensation expense for the tranches covering 2015 and 2016 was reversed during the first quarter of 2016. These performance-based RSUs were all forfeited prior to the consummation of the Merger.
Stock Options
As of December 31, 2017 and 2016, there were no outstanding stock options and no unrecognized compensation cost in relation to stock options.
17. LOSS PER SHARE
Basic loss per share is computed by dividing net loss attributable to Class A common stockholders by the number of weighted average ordinary shares outstanding during the period. Diluted loss per share is computed by adjusting basic loss per share for the impact of weighted average dilutive common equivalent shares outstanding during the period, unless the impact is anti-dilutive. Common equivalent shares represent the incremental shares issuable for unvested restricted Class A common stock.
Unvested RSAs that contain non-forfeitable rights to dividends are treated as participating securities and are included in the loss per share computation using the two-class method. The two-class method is an earnings allocation formula that treats participating securities as having rights to earnings that would otherwise have been available to common stockholders. This method determines earnings (loss) per share based on dividends declared on common stock and participating securities (i.e. distributed earnings), as well as participation rights of participating securities in any undistributed earnings. Undistributed losses are not allocated to participating securities since they are not contractually obligated to share in the losses of the Company. The numerator for undistributed loss per share is also adjusted by the amount of deemed dividends related to the accretion of redeemable non-controlling interest since the redemption value of the non-controlling interest was considered to be at an amount other than fair value (and was considered a right to an economic distribution that differed from other common stockholders) and as accretion adjustments were recognized in additional paid-in capital and not within net loss attributable to
135
Class A common stockholders.
Basic and diluted loss per share of the Company's Class A common stock for the years ended December 31, 2017, 2016 and 2015 was calculated as follows:
Year Ended December 31, | ||||||||||||
(In thousands, except per share amounts) | 2017 | 2016 | 2015 | |||||||||
Basic and diluted loss per share: | ||||||||||||
Net loss attributable to Class A common stockholders | $ | (164,189 | ) | $ | (129,847 | ) | $ | (79,886 | ) | |||
Less: accretion of redeemable non-controlling interest | (6,729 | ) | (3,962 | ) | — | |||||||
Less: dividends paid on Class A shares and participating RSAs | (285,497 | ) | — | (74,377 | ) | |||||||
Undistributed loss attributable to Class A shares | $ | (456,415 | ) | $ | (133,809 | ) | $ | (154,263 | ) | |||
Weighted average basic and diluted Class A shares outstanding1 | 103,866 | 90,815 | 65,883 | |||||||||
Distributed earnings per share | $ | 2.75 | $ | — | $ | 1.09 | ||||||
Undistributed loss per share | (4.40 | ) | (1.47 | ) | (2.34 | ) | ||||||
Basic and diluted loss per share | $ | (1.65 | ) | $ | (1.47 | ) | $ | (1.25 | ) | |||
———
(1) | The computation for diluted loss per share of the Company's Class A common stock for the year ended December 31, 2017 excludes the impact of potentially dilutive unvested RSAs and RSUs outstanding during the year as the effect would have been anti-dilutive. As of December 31, 2017, there were no potentially dilutive unvested securities. The computation for diluted loss per share of the Company's Class A common stock for the year ended December 31, 2016 excludes 459,800 of potentially dilutive unvested RSAs and 1,622,953 of potentially dilutive unvested RSUs because the effect would have been anti-dilutive, and the computation for diluted loss per share of the Company's Class A common stock for the year ended December 31, 2015 excludes 1,334,158 of potentially dilutive unvested RSAs, 3,208,394 of potentially dilutive unvested RSUs and 56,250 of potentially dilutive vested and exercisable options to purchase the Company's shares because the effect would have been anti-dilutive. |
136
18. NON-CONTROLLING INTERESTS
Non-controlling Interests
Non-controlling interests represent the portion of net assets in consolidated entities that are not owned by the Company. The following table presents the non-controlling interest balances reported in stockholders’ equity in the consolidated balance sheets as of December 31, 2017 and 2016:
As of December 31, | ||||||||
(In thousands) | 2017 | 2016 | ||||||
SunEdison's non-controlling interest in Terra LLC1 | $ | — | $ | 660,799 | ||||
Non-controlling interests in renewable energy facilities2 | 859,999 | 804,243 | ||||||
Total non-controlling interests | $ | 859,999 | $ | 1,465,042 | ||||
————
(1) | As of December 31, 2016, TerraForm Power owned 65.7% of Terra LLC and consolidated the results of Terra LLC through its controlling interest, with SunEdison's 34.3% interest shown as a non-controlling interest. As discussed in Note 1. Nature of Operations and Basis of Presentation, on October 16, 2017, SunEdison exchanged all of its Class B units in Terra LLC for Class A shares of TerraForm Power, and after giving effect to this exchange, TerraForm Power owned 100% of Terra LLC. In accordance with ASC 810-10-45-23, the Company reallocated SunEdison's non-controlling interest balance as of such date of $641.5 million to additional paid-in capital (which was net of the reallocation of $0.6 million of previously allocated accumulated other comprehensive losses back to accumulated other comprehensive income). |
(2) | As discussed in Note 5. Acquisitions and below, as part of the Settlement Agreement, the Option Agreement between Terra LLC and Sun Edison LLC with respect to Invenergy Wind's remaining 9.9% interest in certain subsidiaries of the Company was rejected upon the consummation of the Merger with affiliates of Brookfield on October 16, 2017. As a result, the Company is no longer obligated to perform on its Option Agreement, and as of October 16, 2017, the Invenergy Wind non-controlling interest amount of $131.8 million was no longer considered redeemable and was reclassified to non-controlling interests as of such date. In addition, as a result of the Company's sale of TerraForm Resi Solar Manager, LLC, a subsidiary of the Company that owned and operated 8.9 MW of residential rooftop solar installations, during the second quarter of 2017 (see Note 4. Assets Held for Sale), the amount of non-controlling interest in this entity of $8.7 million was deconsolidated. |
Non-controlling Interest Buyout
On March 31, 2015, the Company completed the buyout of approximately 92% of one of the partners' tax equity ownership interest in the Company's Kaheawa Wind Power I facility. The value associated with the buyout was deemed to be the fair value of the non-controlling interest as of the acquisition date. The cash paid for this buyout was $54.7 million.
Redeemable Non-controlling Interests
Non-controlling interests in subsidiaries that are redeemable either at the option of the holder or at fixed and determinable prices at certain dates are classified as redeemable non-controlling interests in subsidiaries between liabilities and stockholders' equity in the consolidated balance sheets. The redeemable non-controlling interests in subsidiaries balance is determined using the hypothetical liquidation at book value method for the VIE funds or allocation of share of income or losses in other subsidiaries subsequent to initial recognition; however, the non-controlling interests balance cannot be less than the estimated redemption value.
The Company recorded a $6.7 million and $4.0 million adjustment during the years ended December 31, 2017 and 2016, respectively, to the value of the Invenergy Wind redeemable non-controlling interest, reflecting the excess of the future redemption value over its carrying amount based on SEC guidance in ASC 480-10-S99-3A. There was no similar adjustment recorded for the year ended December 31, 2015. As discussed in Note 5. Acquisitions, the Company was accreting the redemption value of the Invenergy Wind redeemable non-controlling interest over the redemption period using the straight-line method and accretion adjustments were recorded against additional paid-in capital. As part of the Settlement Agreement, the Option Agreement between Terra LLC and Sun Edison LLC with respect to Invenergy Wind's remaining 9.9% interest in certain subsidiaries of the Company was rejected upon the consummation of the Merger with affiliates of Brookfield on October 16, 2017. As a result, the Company is no longer obligated to perform on its Option Agreement, and as of October 16, 2017, the Invenergy Wind non-controlling interest amount of $131.8 million was no longer considered redeemable and was reclassified to non-controlling interests as of such date. The redemption adjustments recorded in additional paid-in capital will remain in additional paid-in capital.
137
The following table presents the activity of the redeemable non-controlling interests balance for the years ended December 31, 2017, 2016 and 2015:
Redeemable Non-controlling Interests | ||||||||||||
(In thousands) | Capital | Retained Earnings | Total | |||||||||
Balance as of December 31, 2014 | $ | 24,338 | $ | — | $ | 24,338 | ||||||
Consolidation of redeemable non-controlling interests in acquired renewable energy facilities | 151,408 | — | 151,408 | |||||||||
Sale of membership interests and contributions | 3,032 | — | 3,032 | |||||||||
Repurchase of redeemable non-controlling interest in renewable energy facility | (8,504 | ) | — | (8,504 | ) | |||||||
Distributions | (2,764 | ) | — | (2,764 | ) | |||||||
Currency translation adjustment | (311 | ) | — | (311 | ) | |||||||
Net income | — | 8,512 | 8,512 | |||||||||
Balance as of December 31, 2015 | $ | 167,199 | $ | 8,512 | $ | 175,711 | ||||||
Sale of membership interests and contributions | 1,011 | — | 1,011 | |||||||||
Distributions | (10,764 | ) | — | (10,764 | ) | |||||||
Acquisition accounting adjustment | (7,918 | ) | — | (7,918 | ) | |||||||
Accretion | 3,962 | — | 3,962 | |||||||||
Net income | — | 18,365 | 18,365 | |||||||||
Balance as of December 31, 2016 | $ | 153,490 | $ | 26,877 | $ | 180,367 | ||||||
Distributions | (7,818 | ) | — | (7,818 | ) | |||||||
Accretion | 6,729 | — | 6,729 | |||||||||
Net income | — | 10,884 | 10,884 | |||||||||
Reclassification of Invenergy Wind Interest to non-controlling interests | (130,241 | ) | (1,581 | ) | (131,822 | ) | ||||||
Balance as of December 31, 2017 | $ | 22,160 | $ | 36,180 | $ | 58,340 | ||||||
19. COMMITMENTS AND CONTINGENCIES
Letters of Credit
The Company's customers, vendors and regulatory agencies often require the Company to post letters of credit in order to guarantee performance under relevant contracts and agreements. The Company is also required to post letters of credit to secure obligations under various swap agreements and leases and may, from time to time, decide to post letters of credit in lieu of cash deposits in reserve accounts under certain financing arrangements. The amount that can be drawn under some of these letters of credit may be increased from time to time subject to the satisfaction of certain conditions. As of December 31, 2017, the Company had outstanding letters of credit under the New Revolver of $102.6 million and outstanding project-level letters of credit of $147.0 million.
Guarantee Agreements
The Company and its subsidiaries have provided guarantees to certain of its institutional tax equity investors and financing parties in connection with its tax equity financing transactions. These guarantees do not guarantee the returns targeted by the tax equity investors or financing parties, but rather support any potential indemnity payments payable under the tax equity agreements, including related to management of tax partnerships and recapture of tax credits or renewable energy grants in connection with transfers of the Company’s direct or indirect ownership interests in the tax partnerships to entities that are not qualified to receive those tax benefits. The Company and its subsidiaries have also provided guarantees in connection with acquisitions of third party assets or to support project contractual obligations, including renewable energy credit sales agreements. The Company and its subsidiaries have also provided other capped or limited contingent guarantees and other support obligations with respect to certain project-level indebtedness.
138
Commitments to Acquire Renewable Energy Facilities
As of December 31, 2017, the Company did not have any open commitments to acquire renewable energy facilities.
Operating Leases
The Company leases land and buildings under operating leases. Total rental expense was $21.0 million, $23.5 million and $12.2 million during the years ended December 31, 2017, 2016 and 2015, respectively. The following table summarizes the Company's future commitments under operating leases as of December 31, 2017:
(In thousands) | 2018 | 2019 | 2020 | 2021 | 2022 | Thereafter | Total | |||||||||||||||||||||
Rent | $ | 14,940 | $ | 14,545 | $ | 14,713 | $ | 14,922 | $ | 15,062 | $ | 248,175 | $ | 322,357 | ||||||||||||||
Legal Proceedings
The Company is not a party to any material legal proceedings other than various administrative and regulatory proceedings arising in the ordinary course of the Company's business or as described below. While the Company cannot predict with certainty the ultimate resolution of such proceedings or other claims asserted against the Company, certain of the claims, if adversely concluded, could result in substantial damages or other relief.
Securities Class Action
On April 4, 2016, a securities class action under federal securities laws (Chamblee v. TerraForm Power, Inc., et al., Case No. 1:16-cv-00981-JFM) (the "Chamblee Class Action") was filed in the United States District Court for the District of Maryland against the Company and two of its former officers (one of which was also a director of the Company) asserting claims under Section 10(b) and 20(a) of the Securities and Exchange Act of 1934 and SEC Rule 10b-5 on behalf of a putative class. The complaint alleges that the defendants made materially false and misleading statements regarding the Company’s business, operational and compliance policies, including with respect to disclosures regarding SunEdison’s internal controls and the Company's reliance on SunEdison. An amended complaint was filed on September 26, 2016 and a former officer and director of the Company were added as defendants. On October 4, 2016, the Judicial Panel on Multidistrict Litigation transferred this matter to the U.S. District Court for the Southern District of New York (SDNY) for consolidated or coordinated pretrial proceedings. On December 19, 2016, an initial case management conference was held in the multidistrict litigation proceedings in the SDNY. The Court entered an order requiring all parties to the multidistrict litigation to mediate and entered a partial stay of all proceedings through March 31, 2017. On March 24, 2017, the plaintiffs filed an amended complaint adding three additional directors and officers of the Company as defendants, as well as additional factual allegations. On June 9, 2017, the Company filed a motion to dismiss the case. After mediation, the parties agreed in principle to a settlement of $14.8 million on behalf of a putative settlement class containing all persons and entities that purchased or otherwise acquired the publicly traded securities of the Company between July 18, 2014 and March 15, 2016, expressly conditioned on, among other things, funding of the settlement by the Company’s directors’ and officers’ liability insurance providers in the amount of $13.63 million. The Company reserved $1.13 million for its estimated probable loss related to this complaint as of December 31, 2016, which was the amount the Company would have been prepared to fund the settlement out of its own funds. On September 14, 2017, the U.S. District Court for the SDNY preliminarily approved the settlement and provided the Company with an express termination right in the event that the settlement was not timely funded with proceeds from the directors’ and officers’ liability insurance. In January of 2018, the insurers funded $13.63 million and the Company funded $1.13 million into the settlement escrow account. The settlement was finally approved at a hearing of the court on January 31, 2018. As of December 31, 2017, the Company recorded an insurance receivable of $13.63 million within prepaid expenses and other current assets and a corresponding additional liability of $13.63 million within accounts payable, accrued expenses and other current liabilities in the consolidated balance sheet.
Pursuant to the Merger Agreement with Orion Holdings, the Company has agreed to issue additional shares of Class A common stock to Orion Holdings for no additional consideration in respect of the Company’s net losses, such as out-of-pocket losses, damages, costs, fees and expenses, within a prescribed period following the final resolution of the Chamblee Class Action. These net losses would include the $1.13 million contributed by the Company to the settlement but would not include the $13.63 million contributed by the Company's insurers and certain attorneys’ fees that TerraForm Global, Inc. has agreed to
139
reimburse to the Company pursuant to the insurance allocation arrangements described in Insurance Allocation Agreements within Note 20. Related Parties.
Settlement Agreement with Latin America Power Holding
On April 20, 2016, TerraForm Power and Terra LLC (together, the “TerraForm Power Parties”) entered into a Settlement and Mutual Release Agreement (the “LAP Settlement Agreement”) with BTG Pactual Brazil Infrastructure Fund II, L.P., P2 Brasil Private Infrastructure Fund II, L.P., P2 Fund II LAP Co-Invest, L.P., P2 II LAP Co-Invest UK, L.P., GMR Holding B.V. (collectively, the “LAP Shareholders”), and Roberto Sahade, LAP’s chief executive officer (together with the LAP Shareholders and the TerraForm Power Parties, the “Parties”). The LAP Settlement Agreement resolved the disputes between the Parties in connection with the previously announced termination of that certain Amended and Restated Share Purchase Agreement, dated May 19, 2015 (the “Share Purchase Agreement”), among SunEdison Holdings Corporation and the LAP Shareholders, and the guarantee issued by TerraForm Power in connection therewith, relating to the acquisition of Latin America Power Holding, B.V. (“LAP”), that were the subject of an arbitration proceeding (the “Arbitration”). Pursuant to the LAP Settlement Agreement, TerraForm Power made a one-time payment to LAP in the amount of $10.0 million in April of 2016 in exchange for and contingent on the termination of the Arbitration against TerraForm Power. This amount was accrued for in 2015 and is reported in general and administrative expenses in the consolidated statement of operations for the year ended December 31, 2015. None of the Parties admitted to any wrongdoing or liability with respect to the claims asserted in the Arbitration, and the Parties granted each other full releases of any further obligations under the Share Purchase Agreement and related agreements (including the TerraForm Power guarantee).
Claim relating to First Wind Acquisition
On May 27, 2016, D.E. Shaw Composite Holdings, L.L.C. and Madison Dearborn Capital Partners IV, L.P., as the representatives of the sellers (the “First Wind Sellers”) filed an amended complaint for declaratory judgment against TerraForm Power and Terra LLC in the Supreme Court of the State of New York alleging breach of contract with respect to the Purchase and Sale Agreement, dated as of November 17, 2014 (the “FW Purchase Agreement”) between, among others, SunEdison, TerraForm Power and Terra LLC and the First Wind Sellers. The amended complaint alleges that Terra LLC and SunEdison became jointly obligated to make $231.0 million in earn-out payments in respect of certain development assets SunEdison acquired from the First Wind Sellers under the FW Purchase Agreement, when those payments were purportedly accelerated by SunEdison's bankruptcy and by the resignations of two SunEdison employees. The amended complaint further alleges that TerraForm Power, as guarantor of certain Terra LLC obligations under the FW Purchase Agreement, is liable for this sum. The defendants filed a motion to dismiss the amended complaint on July 5, 2016, on the ground that, among other things, SunEdison is a necessary party to this action. The plaintiffs filed an opposition to the motion to dismiss on August 22, 2016. The defendants filed their reply on September 12, 2016. A hearing on the motion to dismiss took place on January 24, 2017. On February 6, 2018, the court denied the Company’s motion to dismiss, and the Company expects discovery to proceed in the case. The Company cannot predict the impact on this litigation of any information that may become available in discovery.
The Company has agreed to issue additional shares of Class A common stock to Orion Holdings for no additional consideration in respect of the Company’s net losses, such as out-of-pocket losses, damages, costs, fees and expenses, upon the final resolution of the litigation brought by the First Wind Sellers described above. The number of additional shares of Class A common stock to be issued to Orion Holdings is subject to a pre-determined formula as set forth in the Merger Agreement as described in greater detail in the Company’s Definitive Proxy Statement filed on Schedule 14A with the SEC on September 6, 2017. As of the date hereof, the Company is unable to predict the quantum of any net losses arising from the litigation brought by the First Wind Sellers described above or the number of additional shares, if any, that may be required to be issued to Orion Holdings pursuant to the terms of the Merger Agreement in connection with any such final resolution.
The issuance of additional shares to Orion Holdings would dilute the holdings of the Company's common stockholders and may negatively affect the value of the Company's common stock.
The Company believes the First Wind Sellers’ allegation is without merit and will contest the claim and allegations vigorously. However, the Company cannot predict with certainty the ultimate resolution of any proceedings brought in connection with such a claim.
140
Whistleblower Complaint By Francisco Perez Gundin
On May 18, 2016, the Company’s former Director and Chief Operating Officer, Francisco Perez Gundin (“Perez”), filed a complaint against the Company, TerraForm Global, Inc. and certain individuals, with the United States Department of Labor. The complaint alleges that the defendants engaged in a retaliatory termination of Mr. Perez's employment after he allegedly voiced concerns to SunEdison’s Board of Directors about public representations made by SunEdison officers regarding SunEdison’s liquidity position, and after he allegedly voiced his opposition to transactions that he alleges were self-interested and which he alleges SunEdison forced on the Company. He alleges that the Company participated in SunEdison’s retaliatory termination by constructively terminating his position as Chief Operating Officer of the Company in connection with SunEdison’s constructive termination of his employment. He seeks lost wages, bonuses, benefits, and other money that he alleges that he would have received if he had not been subjected to the allegedly retaliatory termination. The Company's Position Statement in response to the complaint was filed in October of 2016.
On February 21, 2017, Mr. Perez filed Gundin v. TerraForm Global, Inc. et al. against TerraForm Power, TerraForm Global, Inc. and certain individuals as defendants in the United States District Court for the District of Maryland. The complaint asserts claims for retaliation, breach of the implied covenant of good faith and fair dealing and promissory estoppel based on the same allegation in Mr. Perez's Department of Labor complaint. On March 15, 2017, the Company filed notice with the Judicial Panel on Multidistrict Litigation to transfer this action to the Southern District of New York where the Chamblee Class Action was tried and other cases not involving the Company relating to the SunEdison Bankruptcy are being tried. The plaintiff did not oppose the transfer, which was approved by the Judicial Panel on Multidistrict Litigation. On November 6, 2017, TerraForm Power and the other defendants filed a motion to dismiss Mr. Perez's complaint, and Mr. Perez filed a response on December 21, 2017.
The Company has agreed to issue additional shares of Class A common stock to Orion Holdings for no additional consideration in respect of the Company’s net losses, such as out-of-pocket losses, damages, costs, fees and expenses, upon the final resolution of the litigation brought by Mr. Perez described above. The number of additional shares of Class A common stock to be issued to Orion Holdings is subject to a pre-determined formula as set forth in the Merger Agreement as described in greater detail in the Company’s Definitive Proxy Statement filed on Schedule 14A with the SEC on September 6, 2017. As of the date hereof, the Company is unable to predict the quantum of any net losses arising from the litigation brought by Mr. Perez described above or the number of additional shares, if any, that may be required to be issued to Orion Holdings pursuant to the terms of the Merger Agreement in connection with any such final resolution.
The issuance of additional shares to Orion Holdings would dilute the holdings of the Company's common stockholders and may negatively affect the value of the Company's common stock.
The Company reserved for its estimated loss related to this complaint in 2016, which was not considered material to the Company's consolidated results of operations, and this amount remains accrued as of December 31, 2017. However, the Company is unable to predict with certainty the ultimate resolution of these proceedings.
Whistleblower Complaint By Carlos Domenech Zornoza
On May 10, 2016, the Company’s former Director and Chief Executive Officer, Carlos Domenech Zornoza (“Domenech”), filed a complaint against the Company, TerraForm Global, Inc. and certain individuals, with the United States Department of Labor. The complaint alleges that the defendants engaged in a retaliatory termination of Mr. Domenech’s employment on November 20, 2015 after he allegedly voiced concerns to SunEdison’s Board of Directors about public representations made by SunEdison officers regarding SunEdison’s liquidity position, and after he allegedly voiced his opposition to transactions that he alleges were self-interested and which he alleges SunEdison forced on the Company. He alleges that the Company participated in SunEdison’s retaliatory termination by terminating his position as Chief Executive Officer of the Company in connection with SunEdison’s termination of his employment. He seeks lost wages, bonuses, benefits, and other money that he alleges that he would have received if he had not been subjected to the allegedly retaliatory termination. The Company's Position Statement in response to the complaint was filed in October of 2016.
On February 21, 2017, Mr. Domenech filed Domenech Zornoza v. TerraForm Global, Inc. et. al against TerraForm Power, TerraForm Global, Inc. and certain individuals as defendants in the United States District Court for the District of Maryland. The complaint asserts claims for retaliation, breach of the implied covenant of good faith and fair dealing and promissory estoppel based on the same allegations in Mr. Domenech's Department of Labor complaint. On March 15, 2017, the
141
Company filed notice with the Judicial Panel on Multidistrict Litigation to transfer this action to the Southern District of New York where the Chamblee Class Action was tried and other cases not involving the Company relating to the SunEdison Bankruptcy are being tried. The plaintiff opposed the transfer. However, the transfer was approved by the Judicial Panel on Multidistrict Litigation. On November 6, 2017, TerraForm Power and the other defendants filed a motion to dismiss Mr. Domenech's complaint, and Mr. Domenech filed a response on December 21, 2017.
The Company has agreed to issue additional shares of Class A common stock to Orion Holdings for no additional consideration in respect of the Company’s net losses, such as out-of-pocket losses, damages, costs, fees and expenses, upon the final resolution of the litigation brought by Mr. Domenech described above. The number of additional shares of Class A common stock to be issued to Orion Holdings is subject to a pre-determined formula as set forth in the Merger Agreement as described in greater detail in the Company’s Definitive Proxy Statement filed on Schedule 14A with the SEC on September 6, 2017. As of the date hereof, the Company is unable to predict the quantum of any net losses arising from the litigation brought by Mr. Domenech described above or the number of additional shares, if any, that may be required to be issued to Orion Holdings pursuant to the terms of the Merger Agreement in connection with any such final resolution.
The issuance of additional shares to Orion Holdings would dilute the holdings of the Company's common stockholders and may negatively affect the value of the Company's common stock.
The Company reserved for its estimated loss related to this complaint in 2016, which was not considered material to the Company's consolidated results of operations, and this amount remains accrued as of December 31, 2017. However, the Company is unable to predict with certainty the ultimate resolution of these proceedings.
Eastern Maine Electric Cooperative Litigation
On November 21, 2016, the Penobscot County Maine Superior Court entered judgment in the amount of $13.6 million against First Wind Holdings, LLC (“First Wind”), an indirect subsidiary of SunEdison, Inc., and several subsidiaries of the Company. The plaintiff filed judgment liens against the defendants which will stay outstanding through the appeals process. The action involved a claimed breach of contract arising out of a contract between First Wind and Eastern Maine Electric Cooperative, Inc. (“EMEC”), under which First Wind, on behalf of itself and its then wholly-owned subsidiaries, agreed to negotiate a definitive agreement to transfer to EMEC a portion of a transmission line. The transmission line is owned, in part, by one of the Company's subsidiaries, and is the sole means of transmitting power from the Rollins, Stetson I and Stetson II wind farms. The subsidiaries that own these wind farms and the transmission line were acquired by the Company as part of the Company's acquisition of certain of the operating assets of First Wind Holdings. The subsidiaries of the Company settled this matter in the fourth quarter of 2017 for $9.75 million in exchange for a full release of these claims. The amount of the initial judgment was reserved for in 2015 and is reported in general and administrative expenses in the consolidated statement of operations for the year ended December 31, 2015. As a result of this settlement, the Company recorded a $4 million gain within general and administrative expenses for the year ended December 31, 2017.
Threatened Avoidance Actions
On November 7, 2016, the unsecured creditors’ committee in the SunEdison Bankruptcy filed a motion with the Bankruptcy Court seeking standing to assert against the Company, on behalf of SunEdison, avoidance claims arising from payments and other intercompany transactions between the Company and SunEdison dating back to the Company’s initial public offering and including drop-down transactions involving the sale of renewable energy facilities by SunEdison to the Company. The Company’s objection to the standing motion was filed on November 29, 2016. As described in Note 1. Nature of Operations and Basis of Presentation and Note 20. Related Parties, the Company and SunEdison entered into the Settlement Agreement pursuant to which the Company and SunEdison released these claims and substantially all other intercompany claims between the Company and SunEdison upon the consummation of the Merger with affiliates of Brookfield on October 16, 2017. Therefore, any claims with respect to these avoidance actions have been released.
142
20. RELATED PARTIES
As discussed in Note 1. Nature of Operations and Basis of Presentation, prior to the consummation of the Merger, TerraForm Power was a controlled affiliate of SunEdison, Inc. As a result of the consummation of the Merger on October 16, 2017, a change of control of TerraForm Power occurred, and Orion Holdings, which is an affiliate of Brookfield, now holds 51% of the voting securities of TerraForm Power. As a result of the Merger closing, TerraForm Power is no longer a controlled affiliate of SunEdison, Inc. and is now a controlled affiliate of Brookfield.
SunEdison Bankruptcy and Settlement with SunEdison
As discussed in Note 1. Nature of Operations and Basis of Presentation, TerraForm Power entered into the Settlement Agreement with SunEdison on March 6, 2017, which was approved by the Bankruptcy Court. The settlements, mutual intercompany releases and certain other terms and conditions became effective upon the consummation of the Merger with affiliates of Brookfield on October 16, 2017. The effectiveness of these Settlement Agreement provisions has resolved claims between TerraForm Power and SunEdison, including, among other things, claims of SunEdison against the Company for alleged fraudulent and preferential transfers and claims of the Company against SunEdison, including those outlined in the initial proof of claim filed by the Company in the SunEdison Bankruptcy on September 25, 2016 and on October 7, 2016. Under the Settlement Agreement, all such claims have been mutually released. Moreover, with certain limited exceptions, any agreements between SunEdison Debtors and SunEdison parties to the Settlement Agreement on the one hand and the Company on the other hand have been deemed rejected without further liability, claims or damages on the part of the Company. These exceptions included directors' and officers' liability insurance allocation agreements and certain corporate and project-level transition services agreements.
Historical Management Services Agreement with SunEdison
Historically, general and administrative expenses - affiliate primarily represented costs incurred by SunEdison for services provided to the Company pursuant to the management services agreement (the "SunEdison MSA"). Pursuant to the SunEdison MSA, SunEdison agreed to provide or arrange for other service providers to provide management and administrative services to the Company. As consideration for the services provided, the Company agreed to pay SunEdison a base management fee equal to 2.5% of the Company's cash available for distribution in 2015, 2016 and 2017 but not to exceed $4.0 million in 2015, $7.0 million in 2016 or $9.0 million in 2017. Subsequent to the SunEdison Bankruptcy, SunEdison continued to provide some of these services, including services related to information technology, human resources, tax, treasury, finance and controllership, but stopped providing or reimbursing the Company for other services.
The Company entered into a corporate-level transition services agreement with SunEdison on September 7, 2017 that covered the services that SunEdison continued to provide under the SunEdison MSA and retroactively applied to transition services provided since February 1, 2017. The Company paid SunEdison certain monthly fees in exchange for these services at rates consistent with past practice. Amounts incurred by the Company under this transition services agreement with SunEdison and by SunEdison under the SunEdison MSA totaled $4.5 million, $12.0 million and $54.3 million for the years ended December 31, 2017, 2016 and 2015, respectively, and are reported within general and administrative expenses - affiliate in the consolidated statements of operations. As discussed above, the SunEdison MSA was rejected without further liability, claims or damages on the part of the Company pursuant to the Settlement Agreement upon the closing of the Merger. The corporate-level transition services agreement was extended through the end of the fourth quarter of 2017 with respect to certain information technology services. Amounts incurred for these services subsequent to the Merger closing date on October 16, 2017 are included within general and administrative expenses in the consolidated statement of operations since SunEdison was no longer an affiliate of the Company.
Historical O&M and Asset Management Services with SunEdison
O&M services, as well as asset management services, were historically provided to the Company substantially by SunEdison pursuant to contractual agreements. The Company has completed its transition away from SunEdison for these services, with the exception of services provided to its 101.6 MW renewable energy facility in Chile. In the first half of 2017, the Company entered into certain transition services agreements with SunEdison to facilitate this transition. These transition services agreements allowed the Company, among other things, to hire employees of SunEdison that were performing these project-level services for the Company and to terminate project-level asset management and O&M services on 10 days advance notice. Total costs incurred for O&M and asset management services from SunEdison were $17.6 million, $26.7 million and
143
$19.9 million during the years ended December 31, 2017, 2016 and 2015, respectively, and are reported as cost of operations - affiliate in the consolidated statements of operations. Amounts incurred for O&M and asset management services from SunEdison subsequent to the Merger closing date on October 16, 2017 are included within cost of operations in the consolidated statement of operations since SunEdison was no longer an affiliate of the Company.
In addition, in conjunction with the First Wind Acquisition in 2015, SunEdison committed to reimburse the Company for capital expenditures and O&M labor fees in excess of budgeted amounts (not to exceed $53.9 million through 2019) for certain of its wind power plants. During the year ended December 31, 2015, the Company received contributions pursuant to this agreement of $4.3 million. The total amount related to capital expenditures of $50.0 million was initially recognized in renewable energy facilities as a prepaid warranty as the amount was part of the consideration paid on the acquisition date. As a result of the SunEdison Bankruptcy, the Company recorded a loss of $45.4 million during the year ended December 31, 2015 related to the write-off of the remaining balance of the prepaid warranty, which was net of depreciation expense of $1.9 million and capital expenditure reimbursements received of $2.7 million, and is reported as loss on prepaid warranty - affiliate in the consolidated statement of operations. As a result of the SunEdison Bankruptcy, no contributions were received during 2016 or 2017.
Historical Engineering, Procurement and Construction Contracts and Module Warranties
SunEdison served as the prime construction contractor for most of the Company's renewable energy facilities acquired from SunEdison pursuant to engineering, procurement and construction contracts with the Company's project-level subsidiaries. The Company also generally obtained solar module warranties from SunEdison, including workmanship warranties and output guarantees, for those solar facilities that the Company acquired from SunEdison that utilized SunEdison modules. Third party insurance was procured by SunEdison to back-stop payment of warranty claims for SunEdison modules purchased from January of 2011 through January of 2017.
During the first quarter of 2017, the Company received $7.0 million from SunEdison in satisfaction of outstanding claims made under engineering, procurement and construction contracts, of which $4.8 million related to the Company's renewable energy facility located in Chile and compensated the relevant project company as the facility's performance during the warranty period was below that guaranteed by an affiliate of SunEdison under the applicable EPC contract. These receipts were treated as equity contributions from SunEdison within Net SunEdison investment on the consolidated statement of stockholders' equity for the year ended December 31, 2017. As discussed above, pursuant to the Settlement Agreement entered into with SunEdison, and upon the consummation of the Merger with affiliates of Brookfield on October 16, 2017, these construction and related contracts were rejected without further liability, claims or damages on the part of the Company.
Historical Interest Payment Agreement with SunEdison
Since the Company's initial public offering (“IPO”) on July 23, 2014, the Company was a party to an interest payment agreement with SunEdison, pursuant to which SunEdison would pay a portion of the scheduled interest payments on certain corporate-level indebtedness. The Company received equity contributions totaling $8.0 million and $10.6 million from SunEdison pursuant to this agreement during the years ended December 31, 2016 and 2015, respectively. The 2016 contribution was received in the first quarter of 2016 and accrued for during fiscal 2015. As of the first quarter of 2016, the Company had received a cumulative amount of $24.0 million under this agreement from SunEdison with $24.0 million of scheduled payments due in future periods. The Company did not receive any payments from SunEdison pursuant to this agreement subsequent to the first quarter of 2016. As discussed above, pursuant to the Settlement Agreement entered into with SunEdison, and upon the consummation of the Merger with affiliates of Brookfield on October 16, 2017, this agreement was rejected without further liability, claims or damages on the part of the Company.
Historical Support Agreement and Intercompany Agreement with SunEdison
The Company entered into a project support agreement with SunEdison (the “Support Agreement”) on July 23, 2014, which provided the Company the option to purchase additional renewable energy facilities from SunEdison and also provided the Company a right of first offer with respect to certain other renewable energy facilities. During the years ended December 31, 2016 and 2015, the Company acquired renewable energy facilities with a combined nameplate capacity of 19.2 MW and 350.9 MW, respectively, from SunEdison under the Support Agreement (see Note 3. Transactions Between Entities Under Common Control). The Company did not acquire any renewable energy facilities from SunEdison under the Support Agreement during the year ended December 31, 2017.
144
In connection with the First Wind Acquisition, the Company and SunEdison entered into an agreement (the “Intercompany Agreement”) pursuant to which the Company was granted the option to purchase additional renewable energy facilities in the First Wind pipeline from SunEdison. During the year ended December 31, 2015, the Company acquired renewable energy facilities with a combined nameplate capacity of 222.6 MW from SunEdison under the Intercompany Agreement (see Note 3. Transactions Between Entities Under Common Control). The Company did not acquire any renewable energy facilities from SunEdison under the Intercompany Agreement during the years ended December 31, 2017 or 2016.
As discussed above, pursuant to the Settlement Agreement entered into with SunEdison, and upon the consummation of the Merger with affiliates of Brookfield on October 16, 2017, the Support Agreement and Intercompany Agreement were rejected without further liability, claims or damages on the part of the Company.
The Company continues to maintain a call right over 0.5 GW (net) of operating wind power plants that are owned by a warehouse vehicle that was owned and arranged by SunEdison (the “AP Warehouse”). SunEdison sold its equity interest in the AP Warehouse to an unaffiliated third party in 2017.
Insurance Allocation Agreements
The Company, TerraForm Global, Inc., SunEdison and certain of their respective directors and officers shared $150.0 million of directors’ and officers’ liability insurance policies that covered the period from July 15, 2015 to July 14, 2016 (the “D&O Insurance”). SunEdison and the independent directors of SunEdison (the “SUNE D&O Parties”) entered into an agreement, dated March 27, 2017 and amended on June 7, 2017, with the Company, TerraForm Global, Inc., their respective current directors (as of that date) and certain of their respective current officers (as of that date) (the “YieldCo D&O Parties”) related to the D&O Insurance, which included, among other things, an agreement by SunEdison to consent to proposed settlements of up to $32.0 million to be funded from the D&O Insurance for certain lawsuits against the YieldCo D&O Parties. The agreement was approved by the Bankruptcy Court on June 28, 2017.
On August 31, 2017, the Company, TerraForm Global, Inc., SunEdison and certain of their respective current and former directors and officers entered into a second agreement related to the D&O insurance, which provided, among other things, that no party to the second D&O insurance allocation agreement would object to the settlement of the Chamblee Class Action (as discussed in Note 19. Commitments and Contingencies) with the use of $13.63 million of the D&O insurance. On September 11, 2017, the Bankruptcy Court granted approval of the second D&O insurance allocation. In connection with the second D&O insurance allocation agreement, the Company and TerraForm Global, Inc. entered into an agreement pursuant to which TerraForm Global, Inc. agreed to indemnify and reimburse the Company for certain legal costs and expenses related to the defense or settlement of the Chamblee Class Action that are not covered by the D&O insurance.
In addition to the insurance allocation agreements, from time to time, the Company agreed to orders or stipulations with SunEdison and TerraForm Global, Inc. in connection with the SunEdison Bankruptcy related to, among other things, insurance proceeds, interim operating protocols, bankruptcy filing protocols and other matters.
Due to affiliates, net and due from affiliate
As of December 31, 2016, the Company had a net payable to SunEdison of $16.7 million, which is reported as due to affiliates, net in the consolidated balance sheet. As discussed above, under the Settlement Agreement, the settlements and mutual intercompany releases became effective upon the consummation of the Merger with affiliates of Brookfield on October 16, 2017, and as a result, the Company wrote-off $15.7 million of payables to SunEdison as of such date. The write-off was recognized in additional paid-in capital as the entire settlement with SunEdison was accounted for as an equity transaction.
The $4.0 million due to affiliates, net amount reported in the consolidated balance sheet as of December 31, 2017 represents a $3.4 million payable to an affiliate of Brookfield for the quarterly base management fee that was payable pursuant to the Brookfield MSA (as defined and discussed below under Brookfield Master Services Agreement) and $0.6 million of accrued standby fee interest that was payable to a Brookfield affiliate under the Sponsor Line Agreement. As of December 31, 2017, the Company also had a $4.4 million receivable from TerraForm Global, Inc. as a result of payments made by the Company on its behalf regarding rent for its shared corporate headquarters, compensation for certain employees that provided services to both companies during 2017 and certain other information technology services. On December 28, 2017, TerraForm Global, Inc. merged with and into an affiliate of Brookfield, with TerraForm Global, Inc. continuing as the surviving
145
corporation in the merger, and it became a wholly-owned subsidiary of Orion Holdings. As a result, TerraForm Global, Inc. was no longer a controlled affiliate of SunEdison and instead was a controlled affiliate of Brookfield as of December 31, 2017 (and was again an affiliate of the Company). There is no right of set-off with respect to the receivable from TerraForm Global, Inc. and the payables to the Brookfield affiliates, and thus this receivable is separately reported in due from affiliate in the consolidated balance sheet.
As a result of the SunEdison Bankruptcy, the Company recognized an $11.3 million loss on investment within loss on investments and receivables - affiliate in the consolidated statement of operations for the year ended December 31, 2015 as a result of residential project cancellations. Further, the Company recognized an additional $1.8 million, $3.3 million and $4.8 million loss within loss on investments and receivables - affiliate for the years ended December 31, 2017, 2016 and 2015, respectively, related to the write-off of outstanding receivables from the SunEdison Debtors.
Net SunEdison Investment
During the years ended December 31, 2017, 2016 and 2015, SunEdison made net contributions to Terra LLC pursuant to the related party agreements discussed above and in connection with drop down acquisitions. The following table illustrates the detail of Net SunEdison investment for the years ended December 31, 2017, 2016 and 2015 as reported on the consolidated statements of stockholders' equity:
Year ended December 31, | ||||||||||||
(in thousands) | 2017 | 2016 | 2015 | |||||||||
General and administrative expenses - affiliate1 | $ | 6,154 | $ | 7,666 | $ | 51,330 | ||||||
Failed deal costs 2 | — | — | 6,069 | |||||||||
Interest payment agreement3 | — | — | 18,597 | |||||||||
First Wind capital expenditures and O&M labor fees4 | — | — | 4,303 | |||||||||
TerraForm Power, Inc. equity awards distributed to SunEdison5 | (3,372 | ) | (3,369 | ) | (10,509 | ) | ||||||
Deemed contribution related to acquisitions from SunEdison6 | — | 19,517 | 41,773 | |||||||||
Lindsay debt repayment7 | — | — | 40,306 | |||||||||
Other8 | 6,986 | 1,586 | 1,532 | |||||||||
Net SunEdison investment | $ | 9,768 | $ | 25,400 | $ | 153,401 | ||||||
———
(1) | Represents costs incurred by SunEdison for services provided to the Company pursuant to the SunEdison MSA in excess of cash paid or payable to SunEdison, as well as stock-based compensation expense related to equity awards in the stock of SunEdison, Inc. and TerraForm Global, Inc. that was allocated to the Company (as discussed in Note 16. Stock-based Compensation). The Company did not pay SunEdison the $7.0 million base management fee that it was contractually obligated to in 2016 as the amount the Company had to pay third party service providers to cover the services that SunEdison stopped providing exceeded this contractual amount. Since this fee was not paid to SunEdison as of December 31, 2016, it was recorded within Due to affiliates, net and as a reduction to the net equity contribution from SunEdison. Pursuant to the Settlement Agreement and upon the consummation of the Merger on October 16, 2017, this liability was written off to additional paid-in capital as discussed under Due to affiliates, net above. |
(2) | Represents acquisition costs related to failed deals that were paid by SunEdison. Such costs were reimbursable by SunEdison under the SunEdison MSA. |
(3) | Represents contributions received pursuant to an interest payment agreement with SunEdison. $8.0 million of the amount for the year ended December 31, 2015 was not received in cash from SunEdison until February 3, 2016 and a receivable from SunEdison was recorded as of December 31, 2015. |
(4) | Represents contributions received for capital expenditures and O&M labor fees in excess of budgeted amounts for certain of the Company's wind power plants, which SunEdison committed to reimburse the Company for in conjunction with the First Wind Acquisition. |
(5) | Represents stock-based compensation cost related to equity awards in the Company's stock which was allocated to SunEdison and TerraForm Global, Inc. |
(6) | Represents the difference between the cash purchase price and historical cost of the net assets acquired from SunEdison for projects that achieved final funding during the respective year. |
(7) | SunEdison repaid the remaining outstanding principal balance and interest due on the SunE Perpetual Lindsay construction term loan on the Company's behalf as required pursuant to the terms of a project investment agreement entered into prior to the IPO of the Company. |
(8) | Amount for the year ended December 31, 2017 represents cash received from SunEdison in satisfaction of outstanding claims made under engineering, procurement and construction contracts as discussed above. |
146
Historical Distributions to SunEdison
During the year ended December 31, 2015, Terra LLC paid distributions of $58.3 million to SunEdison, its Class B unit holder at that time. No distributions were paid to SunEdison during the years ended December 31, 2017 or 2016.
Historical Incentive Distribution Rights of SunEdison
Immediately prior to the completion of the IPO on July 23, 2014, Terra LLC entered into the Amended and Restated Operating Agreement of Terra LLC which granted SunEdison 100% of the IDRs of Terra LLC. IDRs represented the right to receive increasing percentages (15.0%, 25.0% and 50.0%) of Terra LLC’s quarterly distributions after the Class A Units, Class B units and Class B1 units of Terra LLC (as applicable) received quarterly distributions in an amount equal to $0.2257 per unit and the target distribution levels were achieved. SunEdison held 100% of the IDRs from the completion of the IPO up until the consummation of the Merger. There were no payments for IDRs made by the Company during the years ended December 31, 2017, 2016 and 2015.
As discussed in Note 1. Nature of Operations and Basis of Presentation, SunEdison transferred all of the outstanding IDRs of Terra LLC held by SunEdison or certain of its affiliates to Brookfield IDR Holder at the effective time of the Merger, and the Company and Brookfield IDR Holder entered into an amended and restated limited liability company agreement of Terra LLC as discussed below under Brookfield Sponsorship Transaction, which adjusted the distribution thresholds and percentages applicable to the Terra LLC IDRs.
Brookfield Sponsorship Transaction
As discussed in Note 1. Nature of Operations and Basis of Presentation, pursuant to the Merger Agreement, at or prior to the effective time of the Merger that occurred on October 16, 2017, the Company and Orion Holdings (or one of its affiliates), among other parties, entered into a suite of agreements providing for sponsorship arrangements, as are more fully described below.
Brookfield Master Services Agreement
In connection with the consummation of the Merger, the Company entered into a master services agreement (the “Brookfield MSA”) with Brookfield and certain affiliates of Brookfield (collectively, the “MSA Providers”) pursuant to which the MSA Providers provide certain management and administrative services to the Company, including the provision of strategic and investment management services. As consideration for the services provided or arranged for by Brookfield and certain of its affiliates pursuant to the master services agreement, the Company will pay a base management fee on a quarterly basis that will be paid in arrears and calculated as follows:
• | for each of the first four quarters following the closing date of the Merger, a fixed component of $2.5 million per quarter (subject to proration for the quarter including the closing date of the Merger) plus 0.3125% of the market capitalization value increase for such quarter; |
• | for each of the next four quarters, a fixed component of $3.0 million per quarter plus 0.3125% of the market capitalization value increase for such quarter; and |
• | thereafter, a fixed component of $3.75 million per quarter plus 0.3125% of the market capitalization value increase for such quarter. |
For purposes of calculating the quarterly payment of the base management fee, the term market capitalization value increase means, for any quarter, the increase in value of the Company’s market capitalization for such quarter, calculated by multiplying the number of outstanding shares of Class A common stock as of the last trading day of such quarter by the difference between (x) the volume-weighted average trading price of a share of Class A common stock for the trading days in such quarter and (y) $9.52. If the difference between (x) and (y) in the market capitalization value increase calculation for a quarter is a negative number, then the market capitalization value increase is deemed to be zero.
Pursuant to the Brookfield MSA, the Company recorded a $3.4 million charge within general and administrative expenses - affiliate in the consolidated statement of operations for the year ended December 31, 2017 with an offsetting payable within due to affiliates, net in the consolidated balance sheet as of December 31, 2017.
147
Relationship Agreement
In connection with the consummation of the Merger, the Company entered into a relationship agreement (the “Relationship Agreement”) with Brookfield, which governs certain aspects of the relationship between Brookfield and the Company. Pursuant to the Relationship Agreement, Brookfield agrees that the Company will serve as the primary vehicle through which Brookfield and certain of its affiliates will own operating wind and solar assets in North America and Western Europe and that Brookfield will provide, subject to certain terms and conditions, the Company with a right of first offer on certain operating wind and solar assets that are located in such countries and developed by persons sponsored by or under the control of Brookfield.
Governance Agreement
In connection with the consummation of the Merger, the Company entered into a governance agreement (the “Governance Agreement”) with Orion Holdings and any controlled affiliate of Brookfield (other than the Company and its controlled affiliates) that by the terms of the Governance Agreement from time to time becomes a party thereto. The Governance Agreement establishes certain rights and obligations of the Company and controlled affiliates of Brookfield that own voting securities of the Company relating to the governance of the Company and the relationship between such affiliates of Brookfield and the Company and its controlled affiliates.
Brookfield Registration Rights Agreement
The Company also entered into a registration rights agreement (the “Brookfield Registration Rights Agreement”) on October 16, 2017 with Orion Holdings. The Brookfield Registration Rights Agreement governs Orion Holdings’ and the Company’s rights and obligations with respect to the registration for resale of all or a part of the Class A shares that Orion Holdings now holds following the Merger.
New Terra LLC Agreement
As discussed above, SunEdison transferred all of the outstanding IDRs of Terra LLC held by SunEdison or certain of its affiliates to Brookfield IDR Holder at the effective time of the Merger, and the Company and Brookfield IDR Holder entered into an amended and restated limited liability company agreement of Terra LLC (the “New Terra LLC Agreement”). The New Terra LLC Agreement, among other things, resets the IDR thresholds of Terra LLC to establish a first distribution threshold of $0.93 per share of Class A common stock and a second distribution threshold of $1.05 per share of Class A common stock. As a result of this amendment and restatement, amounts distributed from Terra LLC will be distributed on a quarterly basis as follows:
• | first, to the Company in an amount equal to the Company’s outlays and expenses for such quarter; |
• | second, to holders of Class A units, until an amount has been distributed to such holders of Class A units that would result, after taking account of all taxes payable by the Company in respect of the taxable income attributable to such distribution, in a distribution to holders of shares of Class A common stock of $0.93 per share (subject to adjustment for distributions, combinations or subdivisions of shares of Class A common stock) if such amount were distributed to all holders of shares of Class A common stock; |
• | third, 15% to the holders of the IDRs and 85% to the holders of Class A units until a further amount has been distributed to holders of Class A units in such quarter that would result, after taking account of all taxes payable by the Company in respect of the taxable income attributable to such distribution, in a distribution to holders of shares of Class A common stock of an additional $0.12 per share (subject to adjustment for distributions, combinations or subdivisions of shares of Class A common stock) if such amount were distributed to all holders of shares of Class A common stock; and |
• | thereafter, 75% to holders of Class A units and 25% to holders of the IDRs. |
21. SEGMENT REPORTING
The Company has two reportable segments: Solar and Wind. These segments comprise the Company's entire portfolio of renewable energy facility assets and are determined based on the management approach. This approach designates the internal reporting used by management for making decisions and assessing performance as the source of the reportable segments. The Company’s operating segments consist of Distributed Generation, North America Utility and International
148
Utility that are aggregated into the Solar reportable segment and Northeast Wind, Central Wind and Hawaii Wind that are aggregated into the Wind reportable segment. The operating segments have been aggregated as they have similar economic characteristics and meet all of the aggregation criteria. Corporate expenses include general and administrative expenses, acquisition costs, interest expense on corporate-level indebtedness, stock-based compensation, depreciation, accretion and amortization expense and loss on extinguishment of corporate-level indebtedness. All net operating revenues for the years ended December 31, 2017, 2016 and 2015 were earned by the Company's reportable segments from external customers in the United States (including Puerto Rico), Canada, the United Kingdom and Chile.
The following table reflects summarized financial information concerning the Company’s reportable segments for the years ended December 31, 2017, 2016 and 2015:
Year Ended December 31, 2017 | ||||||||||||||||
(In thousands) | Solar | Wind | Corporate | Total | ||||||||||||
Operating revenues, net | $ | 337,233 | $ | 273,238 | $ | — | $ | 610,471 | ||||||||
Depreciation, accretion and amortization expense | 108,695 | 135,785 | 2,240 | 246,720 | ||||||||||||
Other operating costs and expenses | 66,642 | 105,817 | 150,569 | 323,028 | ||||||||||||
Interest expense, net | 70,439 | 77,398 | 114,166 | 262,003 | ||||||||||||
Loss on extinguishment of debt, net | — | 3,151 | 77,948 | 81,099 | ||||||||||||
Gain on sale of renewable energy facilities | (37,116 | ) | — | — | (37,116 | ) | ||||||||||
Other non-operating expenses (income), net | 717 | 499 | (10,535 | ) | (9,319 | ) | ||||||||||
Income tax benefit1 | — | — | (23,080 | ) | (23,080 | ) | ||||||||||
Net income (loss) | $ | 127,856 | $ | (49,412 | ) | $ | (311,308 | ) | $ | (232,864 | ) | |||||
Cash Flows | ||||||||||||||||
Capital expenditures | $ | 302 | $ | 7,670 | $ | 420 | $ | 8,392 | ||||||||
Balance Sheet | ||||||||||||||||
Total assets2 | 2,897,036 | 3,400,858 | 89,127 | 6,387,021 | ||||||||||||
Year Ended December 31, 2016 | ||||||||||||||||
(In thousands) | Solar | Wind | Corporate | Total | ||||||||||||
Operating revenues, net | $ | 377,488 | $ | 277,068 | $ | — | $ | 654,556 | ||||||||
Depreciation, accretion and amortization expense | 115,050 | 126,735 | 1,580 | 243,365 | ||||||||||||
Other operating costs and expenses | 140,459 | 91,613 | 90,142 | 322,214 | ||||||||||||
Interest expense, net | 97,123 | 85,744 | 127,469 | 310,336 | ||||||||||||
Other non-operating (income) expenses, net | (1,017 | ) | 1,126 | 19,545 | 19,654 | |||||||||||
Income tax expense1 | — | — | 494 | 494 | ||||||||||||
Net income (loss) | $ | 25,873 | $ | (28,150 | ) | $ | (239,230 | ) | $ | (241,507 | ) | |||||
Cash Flows | ||||||||||||||||
Capital expenditures | $ | 32,132 | $ | 12,177 | $ | 1,560 | $ | 45,869 | ||||||||
Balance Sheet | ||||||||||||||||
Total assets2 | 3,595,387 | 3,609,471 | 501,007 | 7,705,865 | ||||||||||||
149
Year Ended December 31, 2015 | ||||||||||||||||
(In thousands) | Solar | Wind | Corporate | Total | ||||||||||||
Operating revenues, net | $ | 346,033 | $ | 123,473 | $ | — | $ | 469,506 | ||||||||
Depreciation, accretion and amortization expense | 117,727 | 43,392 | 191 | 161,310 | ||||||||||||
Other operating costs and expenses | 65,515 | 89,831 | 147,336 | 302,682 | ||||||||||||
Interest expense, net | 71,351 | 6,991 | 89,463 | 167,805 | ||||||||||||
Other non-operating expenses, net | 13,986 | 6,682 | 38,417 | 59,085 | ||||||||||||
Income tax benefit1 | — | — | (13,241 | ) | (13,241 | ) | ||||||||||
Net income (loss) | $ | 77,454 | $ | (23,423 | ) | $ | (262,166 | ) | $ | (208,135 | ) | |||||
Cash Flows | ||||||||||||||||
Capital expenditures | $ | 462,719 | $ | 181,594 | $ | 3,248 | $ | 647,561 | ||||||||
———
(1) | Income tax (benefit) expense is not allocated to the Company's Solar and Wind segments. |
(2) | As of December 31, 2017 and 2016, respectively. |
Operating Revenues, net
The following table reflects operating revenues, net for the years ended December 31, 2017, 2016 and 2015 by specific customers exceeding 10% of total operating revenue:
Year Ended December 31, | |||||||||||||||||||||||
2017 | 2016 | 2015 | |||||||||||||||||||||
(In thousands, except for percentages) | Segment | Amount | Percentage | Amount | Percentage | Amount | Percentage | ||||||||||||||||
Tennessee Valley Authority | Wind | $ | 79,773 | 13.1 | % | $ | 73,068 | 11.2 | % | N/A | N/A | ||||||||||||
San Diego Gas & Electric | Solar | 63,905 | 10.5 | 65,709 | 10.0 | $ | 67,562 | 14.4 | % | ||||||||||||||
———
N/A - This customer did not exceed 10% of total operating revenue for the period indicated above.
The following table reflects operating revenues, net for the years ended December 31, 2017, 2016 and 2015 by geographic location:
Year Ended December 31, | ||||||||||||
(In thousands) | 2017 | 2016 | 2015 | |||||||||
United States (including Puerto Rico) | $ | 519,551 | $ | 528,513 | $ | 368,117 | ||||||
Chile | 31,282 | 28,065 | 27,148 | |||||||||
United Kingdom | 15,002 | 51,600 | 55,542 | |||||||||
Canada | 44,636 | 46,378 | 18,699 | |||||||||
Total operating revenues, net | $ | 610,471 | $ | 654,556 | $ | 469,506 | ||||||
150
Long-lived Assets, Net
Long-lived assets, net consist of renewable energy facilities and intangible assets as of December 31, 2017 and 2016. The following table is a summary of long-lived assets, net by geographic area:
As of December 31, | ||||||||
(In thousands) | 2017 | 2016 | ||||||
United States (including Puerto Rico) | $ | 5,270,988 | $ | 5,524,136 | ||||
Chile | 168,440 | 175,204 | ||||||
United Kingdom | 17,284 | 16,045 | ||||||
Canada | 422,999 | 419,978 | ||||||
Total long-lived assets, net | 5,879,711 | 6,135,363 | ||||||
Current assets | 341,536 | 893,016 | ||||||
Other non-current assets1 | 165,774 | 677,486 | ||||||
Total assets | $ | 6,387,021 | $ | 7,705,865 | ||||
———
(1) | As of December 31, 2016, includes $532.7 million and $19.5 million of non-current assets held for sale located in the United Kingdom and United States, respectively. There are no similar amounts as of December 31, 2017 as the sale of these renewable energy facilities closed in the first half of 2017. |
151
22. ACCUMULATED OTHER COMPREHENSIVE (LOSS) INCOME
The following table presents the changes in each component of accumulated other comprehensive (loss) income, net of tax:
(In thousands) | Foreign Currency Translation Adjustments | Hedging Activities1 | Accumulated Other Comprehensive (Loss) Income | |||||||||
Balance as of December 31, 2014 | $ | (1,149 | ) | $ | (488 | ) | $ | (1,637 | ) | |||
Net unrealized (loss) gain arising during the period (net of zero tax benefit and $14,627 tax expense, respectively) | (18,446 | ) | 26,913 | 8,467 | ||||||||
Reclassification of net realized loss into earnings (net of zero tax impact) | — | 4,663 | 4,663 | |||||||||
Other comprehensive (loss) income | (18,446 | ) | 31,576 | 13,130 | ||||||||
Accumulated other comprehensive (loss) income | (19,595 | ) | 31,088 | 11,493 | ||||||||
Less: Other comprehensive loss attributable to non-controlling interests | (7,862 | ) | (3,545 | ) | (11,407 | ) | ||||||
Balance as of December 31, 2015 | $ | (11,733 | ) | $ | 34,633 | $ | 22,900 | |||||
Net unrealized loss arising during the period (net of zero tax benefit and $406 tax expense, respectively) | (15,039 | ) | (86 | ) | (15,125 | ) | ||||||
Reclassification of net realized loss into earnings (net of zero tax impact)2 | — | 15,967 | 15,967 | |||||||||
Other comprehensive (loss) income | (15,039 | ) | 15,881 | 842 | ||||||||
Accumulated other comprehensive (loss) income | (26,772 | ) | 50,514 | 23,742 | ||||||||
Less: Other comprehensive (loss) income attributable to non-controlling interests | (4,639 | ) | 5,469 | 830 | ||||||||
Balance as of December 31, 2016 | $ | (22,133 | ) | $ | 45,045 | $ | 22,912 | |||||
Net unrealized gain arising during the period (net of tax expense of $3,238 and $2,428, respectively) | 10,300 | 17,612 | 27,912 | |||||||||
Reclassification of net realized loss (gain) into earnings (net of tax benefit of $8,858 and tax expense of $443, respectively)3 | 14,741 | (2,247 | ) | 12,494 | ||||||||
Other comprehensive income | 25,041 | 15,365 | 40,406 | |||||||||
Accumulated other comprehensive income | 2,908 | 60,410 | 63,318 | |||||||||
Less: Other comprehensive income attributable to non-controlling interests | 8,665 | 5,992 | 14,657 | |||||||||
Plus: Reallocation from non-controlling interests as a result of SunEdison exchange4 | (7,655 | ) | 7,012 | (643 | ) | |||||||
Balance as of December 31, 2017 | $ | (13,412 | ) | $ | 61,430 | $ | 48,018 | |||||
———
(1) | See Note 13. Derivatives for further breakout of hedging gains and losses between interest rate swaps and commodity contracts. |
(2) | Includes $16.9 million loss reclassification that occurred subsequent to the Company's discontinuation of hedge accounting for interest rate swaps within the U.K. Portfolio as discussed in Note 13. Derivatives. |
(3) | The foreign currency translation adjustment amount represents the reclassification of the accumulated foreign currency translation loss for the U.K. Portfolio, as the Company's sale of this portfolio closed in the second quarter of 2017 as discussed in Note 4. Assets Held for Sale. The pre-tax amount of $23.6 million was recognized within gain on sale of renewable energy facilities in the consolidated statement of operations for the year ended December 31, 2017. |
(4) | Represents reclassification of accumulated comprehensive (losses) income previously attributed to SunEdison's non-controlling interest in Terra LLC from non-controlling interests to accumulated other comprehensive income as of October 16, 2017, as a result of SunEdison's exchange of its Class B units in Terra LLC for Class A shares of TerraForm Power as discussed in Note 18. Non-controlling Interests. |
152
23. QUARTERLY FINANCIAL INFORMATION (UNAUDITED)
Quarterly results of operations for the year ended December 31, 2017 were as follows:
(In thousands, except per share data) | Q1 | Q2(1) | Q3(2) | Q4(3) | ||||||||||||
Operating revenues, net | $ | 151,135 | $ | 170,367 | $ | 153,430 | $ | 135,539 | ||||||||
Operating income (loss) | 12,068 | 25,547 | 24,686 | (21,578 | ) | |||||||||||
Interest expense, net | 68,312 | 68,205 | 70,232 | 55,254 | ||||||||||||
Net loss | (56,273 | ) | (680 | ) | (34,820 | ) | (141,091 | ) | ||||||||
Net (loss) income attributable to Class A common stockholders | (31,769 | ) | 7,425 | (26,546 | ) | (113,299 | ) | |||||||||
Weighted average basic Class A common shares outstanding | 92,072 | 92,257 | 92,352 | 138,401 | ||||||||||||
Weighted average diluted Class A common shares outstanding | 92,072 | 92,745 | 92,352 | 138,401 | ||||||||||||
Net (loss) earnings per weighted average Class A common share - basic and diluted | $ | (0.37 | ) | $ | 0.06 | $ | (0.31 | ) | $ | (0.82 | ) | |||||
———
(1) | The Company closed on the sale of the U.K. Portfolio during the second quarter of 2017 and recognized a gain on the sale of $37.1 million which is reflected within gain on sale of renewable energy facilities in the consolidated statement of operations. |
(2) | The Company entered into a settlement agreement in 2017 with insurers of one of its wind power plants with respect to insurance proceeds related to a battery fire that occurred at the wind power plant in 2012, and the Company received the insurance proceeds in the fourth quarter of 2017. The receipt of the proceeds became probable in the third quarter of 2017, and the Company recognized a $5.3 million gain in other (income) expenses, net. |
(3) | The fourth quarter of 2017 includes a $78.6 million loss on extinguishment of debt comprised of charges related to the Revolver, the Senior Notes due 2023 and the Midco Portfolio Term Loan (as discussed in Note 11. Long-term Debt), $27.0 million of charges recorded within general and administrative expenses related to success fees and advisory fees paid to third party advisers upon the closing of the Merger and a $7.0 million stock-based compensation charge recognized within general and administrative expenses as a result of the vesting of all previously unvested equity awards issued under the TerraForm Power 2014 Second Amended and Restated Long-term Incentive Plan upon the consummation of the Merger. These charges were partially offset by a $6.4 million increase recorded to the income tax benefit in the fourth quarter of 2017 to adjust amounts previously reported in 2016 as discussed in Note 12. Income Taxes and a $4 million gain recognized within general and administrative expenses as a result of the final settlement of the EMEC litigation as discussed in Note 19. Commitments and Contingencies. |
Quarterly results of operations for the year ended December 31, 2016 were as follows:
(In thousands, except per share data) | Q1 | Q2(1) | Q3(2) | Q4(3) | ||||||||||||
Operating revenues, net | $ | 153,917 | $ | 187,301 | $ | 178,118 | $ | 135,220 | ||||||||
Operating income (loss) | 32,505 | 62,558 | 50,708 | (56,794 | ) | |||||||||||
Interest expense, net | 68,994 | 101,299 | 72,818 | 67,225 | ||||||||||||
Net loss | (33,505 | ) | (44,937 | ) | (27,711 | ) | (135,354 | ) | ||||||||
Net loss attributable to Class A common stockholders | (481 | ) | (20,907 | ) | (26,171 | ) | (82,288 | ) | ||||||||
Weighted average Class A common shares outstanding - basic and diluted | 87,833 | 90,809 | 90,860 | 91,658 | ||||||||||||
Net loss per weighted average Class A common share - basic and diluted | $ | (0.01 | ) | $ | (0.23 | ) | $ | (0.29 | ) | $ | (0.94 | ) | ||||
———
(1) | During the second quarter of 2016, the Company discontinued hedge accounting for interest rate swaps related to its U.K. Portfolio. This resulted in the reclassification of $16.9 million of losses from accumulated other comprehensive income into interest expense. Subsequent to the discontinuation of hedge accounting, the Company recognized additional unrealized losses of $13.7 million pertaining to these interest rate swaps during the second quarter that are also reported in interest expense. |
(2) | The third quarter of 2016 includes a $3.3 million impairment charge due to the decision to abandon certain residential construction in progress assets that were not completed by SunEdison as a result of the SunEdison Bankruptcy. This charge is reflected within impairment of renewable energy facilities in the consolidated statement of operations. The third quarter of 2016 also includes $3.2 million of special interest for the Senior Notes due 2023, Senior Notes due 2025 and Revolver per the terms of the fourth supplemental indenture to the 2023 Indenture, third supplemental indenture to the 2025 Indenture and eighth amendment to the Revolver credit and guaranty agreement, respectively, and $5.2 million of unrealized losses pertaining to interest rate swaps for the U.K. Portfolio. |
(3) | The fourth quarter of 2016 includes a $55.9 million goodwill impairment charge, a $15.7 million impairment charge within impairment of renewable energy facilities related to substantially all of the Company's portfolio of residential rooftop solar assets that were held for sale as of December 31, 2016, a $2.5 million loss on related party receivables and a $1.1 million loss on extinguishment of debt driven by a reduction of borrowing capacity for the Revolver and corresponding write-off of a portion of the unamortized deferred financing |
153
costs due to the Company entering into the consent agreement and ninth amendment to the terms of the Revolver and a waiver agreement with the requisite lenders pertaining to third quarter reporting deliverables and compliance. The fourth quarter of 2016 also includes $8.6 million of special interest for the Senior Notes due 2023, Senior Notes due 2025 and Revolver, which was offset by $11.6 million of unrealized gains pertaining to interest rate swaps for the U.K. Portfolio. In addition, as discussed in Note 2. Summary of Significant Accounting Policies, during the fourth quarter of 2016, the Company revised the accretion period for its asset retirement obligations from the term of the related PPA agreement to the remaining useful life of the corresponding renewable energy facility, which resulted in the Company recording a $4.4 million adjustment to reduce previously reported accretion and depreciation expense. The Company also recorded a $5.9 million adjustment in the fourth quarter of 2016 to reduce previously reported cost of operations related to property tax expenses.
24. SUBSEQUENT EVENTS
Irrevocable Agreement to Launch Tender Offer for the Common Shares of Saeta Yield
On February 7, 2018, the Company announced that it intends to launch a voluntary tender offer (the “Tender Offer”) to acquire 100% of the outstanding shares of Saeta Yield, S.A. (“Saeta Yield”), a Spanish corporation and a publicly-listed European owner and operator of wind and solar assets, located primarily in Spain. The Tender Offer will be for 12.20 Euros per share of Saeta Yield. The Tender Offer is expected to be completed in the second quarter of 2018, subject to certain closing conditions.
In connection with this Tender Offer, on February 6, 2018, TERP Spanish HoldCo, S.L., a subsidiary of the Company, entered into an irrevocable undertaking agreement for the launch and acceptance of the takeover bid for the shares of Saeta Yield with Cobra Concesiones, S.L., a company incorporated under the laws of Spain (“Cobra”), and GIP II Helios, S.à r.l., a société à responsabilité limitée organized under the laws of the Grand Duchy of Luxembourg (“GIP”), as well as two separate irrevocable undertaking agreements with Mutuactivos, S.A.U., S.G.I.I.C., a company incorporated under the laws of Spain (“Mutuactivos”), and with Sinergia Advisors 2006, A.V., S.A., a company incorporated under the laws of Spain (“Sinergia” and, together with Cobra, GIP and Mutuactivos, the “Selling Stockholders”). Under the terms of these irrevocable undertaking agreements, the Selling Stockholders have irrevocably and unconditionally agreed to tender their combined 50.338% interest in Saeta Yield in the Tender Offer.
The Company’s acceptance of the shares of Saeta Yield tendered in the Tender Offer is conditioned upon the Company obtaining compulsory authorization required from the European Commission and Cobra and GIP irrevocably accepting the Tender Offer in respect of their shares of Saeta Yield representing no less than 48.222% of Saeta Yield’s voting share capital.
The aggregate value of the shares of Saeta Yield held by the Selling Stockholders is approximately $600 million. If the Company successfully acquires all of the remaining Saeta Yield shares in the Tender Offer, the aggregate purchase price (including the value of the Selling Stockholders shares) will be approximately $1.2 billion. Assuming a $1.2 billion acquisition price, the Company intends to finance the acquisition with a $400 million equity issuance of the Company’s Class A common stock (the “Equity Offering”) and the remaining $800 million will be financed from available liquidity, which the Company expects will include borrowings under the Sponsor Line Agreement and the New Revolver. The Company expects to repay these borrowings with a combination of sources, including new non-recourse financings of the Company’s currently unencumbered wind and solar assets and certain cash released from Saeta Yield’s assets.
In connection with the launch of the Tender Offer, the Company was required to post a bank guarantee (the “Bank Guarantee”) with the Spanish National Securities Market Commission (Comisión Nacional del Mercado de Valores) (the “CNMV”) for the maximum amount payable in the Tender Offer of approximately $1.2 billion. On March 6, 2018, TERP Spanish HoldCo entered into two letter of credit facilities (the “LC Agreements”) pursuant to which two banks posted the Bank Guarantee with the CNMV for the maximum amount payable in the Tender Offer. On March 6, 2018, TerraForm Power entered into two letter agreements (the “Letter Agreements” and together with the LC Agreements, the “Letter of Credit Facilities”) with those banks. The LC Agreements govern TERP Spanish HoldCo’s obligations to reimburse those banks upon any drawing under the Bank Guarantee. The Letter Agreements govern TerraForm Power’s obligation to utilize drawings on its New Revolver and Sponsor Line Agreement or proceeds from an equity offering of its Class A common stock to contribute funds to TERP Spanish HoldCo to enable TERP Spanish HoldCo to satisfy its reimbursement obligations under the LC Agreements. The Letter of Credit Facilities also contain customary fees, representations and warranties, covenants and events of default. Under the terms of the Letter of Credit Facilities, the Company is required to maintain minimum liquidity requirements of $500.0 million under the Sponsor Line Agreement and $400.0 million under the New Revolver. In addition, if any amount is
154
drawn under the Bank Guarantee, or if an event of default occurs under the Letter of Credit Facilities, we may be required to cash collateralize the entire amount of the Bank Guarantee that has not been drawn.
Backstop Agreement with Brookfield
On February 6, 2018, the Company entered into a support agreement with Brookfield. Pursuant to this agreement, Brookfield agreed that, if requested by the Company, Brookfield would provide a back-stop to the Company for up to 100% of the Equity Offering (such agreement, the “Back-Stop”) if the offering price per Class A share of the Company in the Equity Offering equals the five-day volume weighted average price of the Class A shares ending the trading day prior to the Company’s announcement of the Tender Offer, which was $10.66 per share. Brookfield’s obligations in relation to the provision of the Back-Stop under the support agreement are subject to successful commencement of the Tender Offer and to prior effectiveness of a registration statement, if required, that the Company would file in connection with the Equity Offering and such obligation would not apply to any Equity Offering commenced prior to May 1, 2018 or after September 30, 2018.
Information regarding certain other subsequent events have been included within the applicable notes to the Company's consolidated financial statements.
155
EXHIBIT INDEX
Exhibit Number | Description | |
2.1 | ||
2.2 | ||
2.3 | ||
2.4 | ||
3.1 | ||
3.2 | ||
4.1 | ||
4.2 | ||
4.3 | ||
4.4 | ||
4.5 | ||
4.6 | ||
4.7 | ||
4.8 | ||
4.9 | ||
10.1 | ||
10.2 | ||
156
10.3 | ||
10.4 | ||
10.5 | ||
10.6 | ||
10.7 | ||
10.8 | ||
10.9 | ||
10.10 | ||
10.11 | ||
10.12 | ||
10.13 | ||
10.14 | ||
10.15 | ||
10.16 | ||
10.17 | ||
157
10.18 | ||
10.19 | ||
10.20 | ||
10.21 | ||
10.22 | ||
21.1 | ||
23.1 | ||
31.1 | ||
31.2 | ||
32 | ||
101.INS | XBRL Instance Document | |
101.SCH | XBRL Taxonomy Extension Schema Document | |
101.CAL | XBRL Taxonomy Extension Calculation Linkbase Document | |
101.DEF | XBRL Taxonomy Extension Definition Linkbase Document | |
101.LAB | XBRL Taxonomy Extension Label Linkbase Document | |
101.PRE | XBRL Taxonomy Extension Presentation Linkbase Document | |
------
* This information is furnished and not filed for purposes of Sections 11 and 12 of the Securities Act of 1933 and Section 18 of the Securities Exchange Act of 1934.
** Annexes, schedules and exhibits have been omitted pursuant to Item 601(b)(2) of Regulation S-K. Registrant agrees to furnish a copy of any omitted attachment to the Securities and Exchange Commission on a confidential basis upon request.
158
SIGNATURES
Pursuant to the requirements of Section 13 or 15(d) of the Securities Exchange Act of 1934, the registrant has duly caused this report to be signed on its behalf by the undersigned thereunto duly authorized.
TERRAFORM POWER, INC. | |||||
(Registrant) | |||||
Date: | March 7, 2018 | By: | /s/ JOHN STINEBAUGH | ||
John Stinebaugh | |||||
Chief Executive Officer | |||||
Pursuant to the requirements of the Securities Exchange Act of 1934, this report has been signed below by the following persons on behalf of the registrant and in the capacities and on the dates indicated.
Signature | Title | Date | ||
/s/ JOHN STINEBAUGH | Chief Executive Officer | March 7, 2018 | ||
John Stinebaugh | (Principal executive officer) | |||
/s/ MATTHEW BERGER | Chief Financial Officer | March 7, 2018 | ||
Matthew Berger | (Principal financial officer and principal accounting officer) | |||
/s/ BRIAN LAWSON | Director and Chairman | March 7, 2018 | ||
Brian Lawson | ||||
/s/ CHRISTIAN S. FONG | Director | March 7, 2018 | ||
Christian S. Fong | ||||
/s/ HARRY GOLDGUT | Director | March 7, 2018 | ||
Harry Goldgut | ||||
/s/ RICHARD LEGAULT | Director | March 7, 2018 | ||
Richard Legault | ||||
/s/ MARK “MAC” MCFARLAND | Director | March 7, 2018 | ||
Mark ‘‘Mac’’ McFarland | ||||
/s/ SACHIN SHAH | Director | March 7, 2018 | ||
Sachin Shah | ||||
159