Attached files
| file | filename |
|---|---|
| EX-32.2 - EX-32.2 - HCI Group, Inc. | d513672dex322.htm |
| EX-32.1 - EX-32.1 - HCI Group, Inc. | d513672dex321.htm |
| EX-31.2 - EX-31.2 - HCI Group, Inc. | d513672dex312.htm |
| EX-31.1 - EX-31.1 - HCI Group, Inc. | d513672dex311.htm |
| EX-23.1 - EX-23.1 - HCI Group, Inc. | d513672dex231.htm |
| EX-21 - EX-21 - HCI Group, Inc. | d513672dex21.htm |
Table of Contents
UNITED STATES
SECURITIES AND EXCHANGE COMMISSION
WASHINGTON, D.C. 20549
Form 10-K
| ☑ | ANNUAL REPORT PURSUANT TO SECTION 13 OR 15(d) OF THE SECURITIES EXCHANGE ACT OF 1934 |
For the fiscal year ended December 31, 2017
OR
| ☐ | TRANSITION REPORT PURSUANT TO SECTION 13 OR 15(d) OF THE SECURITIES EXCHANGE ACT OF 1934 |
Commission File Number 001-34126
HCI Group, Inc.
(Exact name of Registrant as specified in its charter)
| Florida | 20-5961396 | |
| (State of Incorporation) | (IRS Employer Identification No.) |
5300 West Cypress Street, Suite 100
Tampa, FL 33607
(Address, including zip code, of principal executive offices)
(813) 849-9500
(Registrant’s telephone number, including area code)
Securities registered pursuant to Section 12(b) of the Act:
| Title of Each Class |
Name of Each Exchange on Which Registered | |
| Common Shares, no par value | New York Stock Exchange |
Securities registered pursuant to Section 12(g) of the Act: None
Indicate by check mark if the registrant is a well-known seasoned issuer, as defined in Rule 405 of the Securities Act. Yes ☐ No ☑
Indicate by check mark if the registrant is not required to file reports pursuant to Section 13 or Section 15(d) of the Act. Yes ☐ No ☑
Indicate by check mark whether the registrant (1) has filed all reports required to be filed by Section 13 or 15(d) of the Securities Exchange Act of 1934 during the preceding 12 months (or for such shorter period that the registrant was required to file such reports), and (2) has been subject to such filing requirements for the past 90 days. Yes ☑ No ☐
Indicate by check mark whether the registrant has submitted electronically and posted on its corporate Web site, if any, every Interactive Data File required to be submitted and posted pursuant to Rule 405 of Regulation S-T (§232.405 of this chapter) during the preceding 12 months (or for such shorter period that the registrant was required to submit and post such files). Yes ☑ No ☐
Indicate by check mark if disclosure of delinquent filers pursuant to Item 405 of Regulation S-K is not contained herein, and will not be contained, to the best of registrant’s knowledge, in definitive proxy or information statements incorporated by reference in Part III of this Form 10-K or any amendment to this Form 10-K. ☐
Indicate by check mark whether the registrant is a large accelerated filer, an accelerated filer, a non-accelerated filer, a smaller reporting company, or emerging growth company. See the definitions of “large accelerated filer,” “accelerated filer,” “smaller reporting company,” and “emerging growth company” in Rule 12b-2 of the Exchange Act.
| Large accelerated filer | ☐ | Accelerated filer | ☑ | |||
| Non-accelerated filer | ☐ | Smaller reporting company | ☐ | |||
| Emerging growth company | ☐ | |||||
If an emerging growth company, indicate by check mark if the registrant has elected not to use the extended transition period for complying with any new or revised financial accounting standards provided pursuant to Section 13(a) of the Exchange Act. ☐
Indicate by check mark whether the Registrant is a shell company (as defined in Rule 12b-2 of the Exchange Act). Yes ☐ No ☑
The aggregate market value of the common stock held by non-affiliates of the registrant as of June 30, 2017, computed by reference to the price at which the common stock was last sold on June 30, 2017, was $375,747,684.
The number of shares outstanding of the registrant’s common stock, no par value, on February 27, 2018 was 9,458,442.
DOCUMENTS INCORPORATED BY REFERENCE
The information required by Part III of this Form 10-K is incorporated by reference from the registrant’s definitive proxy statement which will be filed not later than 120 days after the end of the fiscal year covered by this Form 10-K.
Table of Contents
HCI GROUP, INC. AND SUBSIDIARIES
| Page | ||||||
| PART I: | ||||||
| 2-14 | ||||||
| 14-29 | ||||||
| 29 | ||||||
| 29-30 | ||||||
| 31 | ||||||
| 31 | ||||||
| PART II: | ||||||
| 32-35 | ||||||
| 36-37 | ||||||
| Management’s Discussion and Analysis of Financial Condition and Results of Operations |
38-55 | |||||
| 56-57 | ||||||
| 58-140 | ||||||
| Changes in and Disagreements with Accountants on Accounting and Financial Disclosure |
141 | |||||
| 141-142 | ||||||
| 142 | ||||||
| PART III: | ||||||
| 143 | ||||||
| 143 | ||||||
| Security Ownership of Certain Beneficial Owners and Management and Related Stockholder Matters |
143 | |||||
| Certain Relationships and Related Transactions, and Director Independence |
143 | |||||
| 144 | ||||||
| PART IV: | ||||||
| 145-152 | ||||||
| Certifications |
||||||
Table of Contents
PART I
General
HCI Group, Inc. is a Florida-based company that, through its subsidiaries is engaged in a variety of business activities, including property and casualty insurance, reinsurance, real estate and information technology. Its principal business is property and casualty insurance. HCI was incorporated in 2006. References to “we,” “our,” “us,” “the Company,” or “HCI” in this Form 10-K generally refer to HCI Group, Inc. and its subsidiaries. Our principal executive offices are located at 5300 West Cypress Street, Suite 100, Tampa, Florida 33607, and our telephone number is (813) 849-9500.
Based on our organizational structure, revenue sources, and evaluation of financial and operating performances by management, we manage four operating divisions, which includes the following operations:
| a) | Insurance Operations |
| • | Property and casualty insurance |
| • | Reinsurance |
| b) | Other Operations |
| • | Real estate |
| • | Information technology |
Insurance Operations
Property and Casualty Insurance
We sell our property and casualty insurance products through two insurance subsidiaries: Homeowners Choice Property & Casualty Insurance Company, Inc. (“HCPCI”), our principal operating subsidiary, and TypTap Insurance Company (“TypTap”). HCPCI was incorporated and began operations in 2007. TypTap was incorporated and began operations in 2016. We provide various forms of residential insurance products such as homeowners insurance, fire insurance, flood insurance and wind-only insurance. Through HCPCI, we currently provide property and casualty insurance to homeowners, condominium owners and tenants on properties located in Florida. TypTap primarily offers standalone flood policies to Florida homeowners through an online platform that is designed to be accessible by any Internet capable device. HCPCI’s and TypTap’s operations are supported by HCI and the following wholly owned subsidiaries of HCI:
| • | Homeowners Choice Managers, Inc. – a managing general agent providing marketing, underwriting, claims settlement, accounting and financial services to HCPCI; |
2
Table of Contents
| • | Southern Administration, Inc. – provides policy administration services to the policyholders with HCPCI; |
| • | TypTap Management Company – provides managerial and operational services to TypTap; and |
| • | Claddaugh Casualty Insurance Company Ltd. – participates in the reinsurance programs of HCPCI and TypTap. (See Reinsurance below) |
HCPCI began operations by participating in a “take-out program” through which we assumed insurance policies issued by Citizens Property Insurance Corporation (“Citizens”), a Florida state-supported insurer. The take-out program is a legislatively mandated program designed to reduce the State’s risk exposure by encouraging private companies to assume policies from Citizens. We have assumed policies in a series of separate transactions, which took place from July 2007 through December 2017. In addition, we acquired policies from one Florida carrier in November 2011. Substantially all of our premium revenue since inception has come from the policies acquired in these transactions and subsequent renewals.
Citizens requires us to offer renewals on assumed policies for a period of three years subsequent to their initial expiration. We strive to retain assumed policies by offering competitive rates and exceptional service to our policyholders. However, policyholders may cancel their policies at any time and place their coverage with another insurance company. Opportunities to acquire large numbers of policies from Citizens meeting our strict underwriting criteria have diminished in recent years. We may, however, selectively pursue additional assumption transactions with Citizens as opportunities arise, provided the assumed policies meet our underwriting criteria. We also continually explore accretive opportunities to acquire business from other insurance companies.
We plan to seek opportunities to enter the property and casualty insurance market and establish our presence in other states, especially with residential flood insurance. During 2017, HCPCI received regulatory approval to write residential property and casualty insurance in the states of Arkansas, California, Maryland, North Carolina, New Jersey, Ohio, Pennsylvania, South Carolina and Texas. HCPCI has yet to commence operations in these states.
Our operating and growth strategies for our property and casualty insurance business are to continually optimize the existing book of business, manage our costs and expenses, diversify both geographically and with new product offerings, develop and deploy new technologies to streamline operations, including policy underwriting and production, and pursue accretive opportunities to acquire polices when they arise, whether from Citizens or other insurance companies.
We face various challenges to implementing our operating and growth strategies. Since we currently write policies that cover Florida homeowners, condominium owners, and tenants, we cover losses that may arise from, among other things, hurricanes and other catastrophic events. The occurrence of any such catastrophes could have a significant adverse effect on our business, results of operations, and financial condition. To mitigate our risk of such catastrophic losses, we purchase reinsurance from other large insurance companies. Reinsurance is the largest cost to our property
3
Table of Contents
and casualty insurance business. Even without catastrophic events, we may incur losses and loss adjustment expenses that deviate substantially from our estimates and that may exceed our reserves, in which case our net income and capital would decrease. Our operating and growth strategies may also be impacted by regulation of our business by the State of Florida and other states in which we may operate. For example, insurance regulators must approve our policy forms and premium rates as well as monitor our compliance with financial and regulatory requirements. Additionally, we may compete with large, well-established insurance companies, possessing greater financial resources, larger agency networks, and greater name recognition. See Item 1A, “Risk Factors,” below.
Competition
We operate in highly competitive markets where we face competition from national, regional and residual market insurance companies and, in the case of flood insurance, the U.S. government. We believe that we have approximately 11 significant competitors writing homeowners’ property and casualty insurance in the state of Florida. Based on September 30, 2017 annualized premiums written data produced by the Florida Office of Insurance Regulation (“FLOIR”) which excludes State Farm Florida Insurance Company, we are the sixth largest provider of homeowners’ property and casualty insurance in the state.
Our competitors may have larger financial capacities, greater resource availability, and more diversification in terms of insurance coverage. Our competitors include companies which market their products through agents, as well as companies which sell insurance directly to their customers. In addition, large national insurers that left the Florida homeowners’ property and casualty insurance market more than a decade ago after numerous hurricanes impacted the state, may reenter the Florida market and they may have certain competitive advantages such as increased name recognition, increased loyalty of their customer base, and reduced policy acquisition costs. We may also face competition from new or temporary entrants in our markets. In some cases, such entrants may, because of inexperience, desire for new business, or other reasons, price their insurance products below ours. This pricing pressure may lead to overall premium reductions across the Florida market.
Our competitive strategies focus on the following key areas:
| • | Exceptional service – We are committed to maintaining superior service to our policyholders and agents. |
| • | Claims settlement practices – We focus on fair and timely settlement of policyholder claims. |
| • | Disciplined underwriting – We analyze exposures and utilize available underwriting data to ensure policies meet our selective criteria. |
| • | New product offerings – We may cross-sell additional insurance products to our existing policyholders in order to broaden our lines of business and product mix or identify other lines of insurance to offer. |
4
Table of Contents
| • | Effective and efficient use of technology – We strive to add or improve technology that can effectively and efficiently enhance service to our policyholders and agents. For instance, we currently use our internally developed application, Exzeo®, to increase the efficiency of our claims processing and settlement. In addition, our on-line platform for quoting and binding residential flood policies streamlines the underwriting and policy production processes. |
| • | Geographical expansion – We continue to seek opportunities to expand our business within the state of Florida and into other states to increase overall geographic diversification. During 2017, HCPCI was approved to write residential property and casualty insurance in the states of Arkansas, California, Maryland, North Carolina, New Jersey, Ohio, Pennsylvania, South Carolina and Texas. |
| • | Price – In the case of flood insurance, our rates are typically below the rates of the National Flood Insurance Program administered by the Federal Emergency Management Agency, which is the dominant provider of flood insurance in the United States. |
Seasonality of Our Business
Our insurance business is seasonal as hurricanes and tropical storms affecting Florida typically occur during the period from June 1 through November 30 each year. Moreover, with our reinsurance contract years generally effective on June 1 each year, any variation in the cost of our reinsurance, whether due to changes in reinsurance rates or changes in the total insured value of our policy base, will occur and be reflected in our financial results beginning June 1 each year.
Government Regulation
We are subject to the laws and regulations in any state in which we conduct our insurance business. The regulations cover all aspects of our business and are generally designed to protect the interests of insurance policyholders as opposed to the interests of shareholders. Such regulations relate to a wide variety of financial and non-financial matters including:
| • | authorized lines of business; |
| • | capital and surplus requirements; |
| • | approval of allowable rates and forms; |
| • | approval of reinsurance contracts; |
| • | investment parameters; |
| • | underwriting limitations; |
| • | transactions with affiliates; |
| • | dividend limitations; |
| • | changes in control; and |
| • | market conduct. |
5
Table of Contents
Our failure to comply with certain provisions of applicable insurance laws and regulations could have a material, adverse effect on our business, results of operations or financial condition.
Regulatory Uncertainty
Certain states including Florida have adopted laws or are considering proposed legislation which, among other things, limits the ability of insurance companies to effect rate increases or to cancel, reduce or non-renew insurance coverage with respect to existing policies. The Florida legislature continuously considers bills affecting the Florida residential property insurance market. Current law penalizes insurers for noncompliance with the insurance code, establishes a private cause of action relating to claims payment practices, extends the notice period applicable to non-renewals of certain residential policies, prevents non-renewals and cancellation except for material misrepresentation and non-payment of premium and establishes procedures governing rate filings. Any changes in such laws and regulations could have a material, adverse effect on our operations or our ability to expand.
State Licensure and Approval
All states require licensure and regulatory approval prior to the marketing of insurance products. Typically, licensure review is comprehensive and includes a review of a company’s business plan, solvency, reinsurance, rates, and forms, the character of its officers and directors and other of its financial and non-financial aspects. The regulatory authorities may prevent entry into a new market by not granting a license. In addition, regulatory authorities may preclude or delay our entry into markets by disapproving or withholding approval of our product filings.
Statutory Reporting and Examination
All insurance companies must file quarterly and annual statements with certain regulatory agencies in any state in which they are licensed to transact business and are subject to regular and special examinations by those agencies. The National Association of Insurance Commissioners mandates that all insurance companies be examined once every five years. However, the FLOIR has the authority to conduct an examination whenever it is deemed appropriate. With regard to Florida-domiciled insurance companies such as TypTap that have held a certificate of authority for less than three years, the FLOIR will conduct an examination at least once every year during the first three years of business. HCPCI’s latest financial examination by the FLOIR related to the year ended December 31, 2015. TypTap’s latest financial examination by the FLOIR covered the period ending December 31, 2016.
Liability for Losses and Loss Adjustment Expenses
Our liability for losses and loss adjustment expenses represents our estimate of the total cost of (i) claims that have been incurred, but not yet paid (case reserves), (ii) losses that have been “incurred but not yet reported” to us (“IBNR”), and (iii) loss adjustment expenses (“LAE”) which are intended to cover the ultimate cost of adjusting, investigating and settling claims, including investigation and defense of lawsuits resulting from such claims. We base our estimates on various assumptions and actuarial data we believe to be reasonable under the circumstances. The process of estimating the liability is inherently subjective and is influenced by many variables such as past loss experience, current claim trends and the prevailing social, economic and legal environments.
6
Table of Contents
Significant time can elapse between the occurrence of an insured loss, the reporting of the loss to us and our payment of that loss. Our liability for losses and LAE, which we believe represents the best estimate at a given point in time based on facts, circumstances and historical trends then known, may necessarily be adjusted to reflect additional facts that become available during the loss settlement period.
For a discussion and summary of the activity in the liability for losses and LAE for the years ended December 31, 2017, 2016 and 2015, see Note 15 — “Losses and Loss Adjustment Expenses” to our consolidated financial statements under Item 8 of this Annual Report on Form 10-K.
7
Table of Contents
Loss Development
Our liability for losses and LAE represents estimated costs ultimately required to settle all claims for a given period. The following table illustrates development of the estimated liability for losses and LAE as of December 31 for the years 2007 (inception) through 2017 (amounts in thousands):
Schedule of Loss Development
| 2007 | 2008 | 2009 | 2010 | 2011 | 2012 | 2013 | 2014 | 2015 | 2016 | 2017 | ||||||||||||||||||||||||||||||||||
| Original net liability for losses and LAE (a) |
$ | 1,688 | $ | 14,763 | $ | 19,178 | $ | 22,146 | $ | 27,424 | $ | 41,168 | $ | 43,686 | $ | 48,908 | $ | 51,690 | $ | 70,492 | $ | 97,818 | ||||||||||||||||||||||
| Re-estimated net losses and LAE (b) as of: |
||||||||||||||||||||||||||||||||||||||||||||
| 1 year later |
1,412 | 10,879 | 18,399 | 26,776 | 27,309 | 38,712 | 47,344 | 57,807 | 72,229 | 89,199 | ||||||||||||||||||||||||||||||||||
| 2 years later |
1,236 | 10,991 | 19,866 | 26,003 | 28,536 | 40,015 | 50,280 | 65,367 | 78,511 | |||||||||||||||||||||||||||||||||||
| 3 years later |
1,268 | 11,661 | 19,361 | 27,226 | 28,499 | 42,976 | 54,696 | 66,211 | ||||||||||||||||||||||||||||||||||||
| 4 years later |
1,327 | 11,528 | 19,617 | 26,544 | 29,038 | 45,279 | 52,404 | |||||||||||||||||||||||||||||||||||||
| 5 years later |
1,330 | 11,424 | 18,969 | 26,871 | 30,788 | 43,403 | ||||||||||||||||||||||||||||||||||||||
| 6 years later |
1,330 | 11,361 | 19,020 | 27,732 | 29,505 | |||||||||||||||||||||||||||||||||||||||
| 7 years later |
1,330 | 11,302 | 19,426 | 26,838 | ||||||||||||||||||||||||||||||||||||||||
| 8 years later |
1,331 | 11,459 | 18,961 | |||||||||||||||||||||||||||||||||||||||||
| 9 years later |
1,331 | 11,313 | ||||||||||||||||||||||||||||||||||||||||||
| 10 years later |
1,334 | |||||||||||||||||||||||||||||||||||||||||||
| Cumulative net redundancy (deficiency) (c) |
354 | 3,450 | 217 | (4,692 | ) | (2,081 | ) | (2,235 | ) | (8,718 | ) | (17,303 | ) | (26,821 | ) | (18,707 | ) | |||||||||||||||||||||||||||
| Cumulative amount of net liability paid as of: |
||||||||||||||||||||||||||||||||||||||||||||
| 1 year later |
760 | 7,725 | 10,481 | 16,833 | 15,652 | 22,365 | 26,595 | 33,347 | 41,053 | 50,533 | ||||||||||||||||||||||||||||||||||
| 2 years later |
1,108 | 9,229 | 15,336 | 20,708 | 21,707 | 31,824 | 38,695 | 49,122 | 61,947 | |||||||||||||||||||||||||||||||||||
| 3 years later |
1,108 | 10,339 | 17,065 | 23,732 | 25,350 | 37,041 | 45,655 | 58,141 | ||||||||||||||||||||||||||||||||||||
| 4 years later |
1,327 | 10,947 | 17,992 | 25,063 | 26,772 | 40,152 | 49,924 | |||||||||||||||||||||||||||||||||||||
| 5 years later |
1,330 | 11,121 | 18,375 | 25,681 | 28,052 | 42,303 | ||||||||||||||||||||||||||||||||||||||
| 6 years later |
1,330 | 11,167 | 18,465 | 26,238 | 29,967 | |||||||||||||||||||||||||||||||||||||||
| 7 years later |
1,330 | 11,302 | 18,506 | 26,478 | ||||||||||||||||||||||||||||||||||||||||
| 8 years later |
1,331 | 11,305 | 18,653 | |||||||||||||||||||||||||||||||||||||||||
| 9 years later |
1,331 | 11,309 | ||||||||||||||||||||||||||||||||||||||||||
| 10 years later |
1,333 | |||||||||||||||||||||||||||||||||||||||||||
| Gross premiums earned |
$ | 9,546 | $ | 61,925 | $ | 110,011 | $ | 119,757 | $ | 143,606 | $ | 233,607 | $ | 337,113 | $ | 365,488 | $ | 423,120 | $ | 378,678 | $ | 358,253 | ||||||||||||||||||||||
8
Table of Contents
| 2007 | 2008 | 2009 | 2010 | 2011 | 2012 | 2013 | 2014 | 2015 | 2016 | 2017 | ||||||||||||||||||||||||||||||||||
| Gross liability for unpaid losses and LAE |
$ | 1,688 | $ | 14,763 | $ | 19,178 | $ | 22,146 | $ | 27,424 | $ | 41,168 | $ | 43,686 | $ | 48,908 | $ | 51,690 | $ | 70,492 | $ | 198,578 | ||||||||||||||||||||||
| Ceded liability for unpaid losses and LAE |
— | — | — | — | — | — | — | — | — | — | (100,760 | ) | ||||||||||||||||||||||||||||||||
|
|
|
|
|
|
|
|
|
|
|
|
|
|
|
|
|
|
|
|
|
|
|
|||||||||||||||||||||||
| Net liability for unpaid losses and LAE |
$ | 1,688 | $ | 14,763 | $ | 19,178 | $ | 22,146 | $ | 27,424 | $ | 41,168 | $ | 43,686 | $ | 48,908 | $ | 51,690 | $ | 70,492 | $ | 97,818 | ||||||||||||||||||||||
|
|
|
|
|
|
|
|
|
|
|
|
|
|
|
|
|
|
|
|
|
|
|
|||||||||||||||||||||||
| (a) | Represents management’s original net estimated liability for (i) unpaid claims, (ii) IBNR, and (iii) loss adjustment expenses. |
| (b) | Represents the re-estimated net liabilities in later years for unpaid claims, IBNR and loss adjustment expenses for each of the respective years. |
| (c) | Represents the difference between the latest net re-estimate and the original net estimate. A redundancy indicates the original net estimate is higher than the current net estimate whereas a deficiency indicates the original net estimate is lower than the current net estimate. |
9
Table of Contents
Reinsurance
We have a Bermuda domiciled wholly owned reinsurance subsidiary, Claddaugh Casualty Insurance Company Ltd. We selectively retain risk in Claddaugh, displacing the need for HCPCI or TypTap to pay premiums to third party reinsurers. Claddaugh fully collateralizes its exposure to our insurance subsidiaries by depositing funds into a trust account. Claddaugh may mitigate a portion of its risk through retrocession contracts. Currently, Claddaugh does not provide reinsurance to non-affiliates.
For the years ended December 31, 2017, 2016 and 2015, revenues from insurance operations before intracompany elimination represented 96.2%, 95.5% and 97.5%, respectively, of total revenues of all operating segments. At December 31, 2017, 2016 and 2015, insurance operations’ total assets represented 87.1%, 87.9% and 91.8%, respectively, of the combined assets of all operating segments. See Note 16 — “Segment Information” to our consolidated financial statements under Item 8 of this Annual Report on Form 10-K.
Other Operations
Real Estate
Our real estate operations consist of multiple properties we own and operate for investment purposes and also properties we own and use for our own operations.
Properties Used in Operations
Our real estate used in operations consists of our headquarters building which has a gross area of 122,000 square feet in Tampa, Florida, and our secondary insurance operations site with gross area of approximately 16,000 square feet in Ocala, Florida. At our headquarters, we lease available space to non-affiliates at various terms. The Ocala location, in addition to day-to-day operational use, serves as our alternative site in the event we experience any significant disruption at our headquarters building.
Operations at Investment Properties
Our investment properties consist of a combined 24 acres of waterfront properties that include one full-service restaurant and two marinas, two retail shopping centers and one recently acquired office building. The combined marina facilities offer to the general public: a) one dry-stack boat storage facility with capacity for approximately 263 boats; b) approximately 65 wet slips; c) two fuel facilities; and d) open areas for parking and storage. Dry-stack boat storage space is generally rented on a monthly or annual basis while the wet slips are rented on a daily or monthly basis. We acquired the restaurant and marina operations in connection with our purchase of those properties and we continue to operate them to enhance the property values. We also lease available space to non-affiliates at one of these locations.
One retail shopping center with 61,400 square feet of net rentable space is located in Sorrento, Florida and is anchored by a large, well-known grocery retailer. We acquired this property in 2016. See Note 6 — “Business Acquisitions” to our consolidated financial statements under Item 8 of this Annual Report on Form 10-K.
10
Table of Contents
Another retail shopping center with 49,995 square feet of net rentable space is located in Melbourne, Florida and also anchored by a large, well-known grocery retailer. In 2016, we acquired full ownership of the property in which we had a 90% non-controlling interest from our 10% joint venture partner. This property had been developed through a limited liability company treated under U.S. GAAP as a joint venture. See Investment in Unconsolidated Joint Venture in Note 4 — “Investments” to our consolidated financial statements under Item 8 of this Annual Report on Form 10-K.
Our portfolio of real estate investments also includes one commercial property with 68,867 square feet of net rentable space in Tampa, Florida. This property, which includes an office building fully leased to a major financial institution, was acquired in October 2017.
Other Real Estate Investments
In January 2018, we acquired full ownership of one limited liability company which owns commercial real estate in Riverview, Florida. The commercial real estate includes a retail strip center with 8,400 square feet of net rentable space and a parcel of land adjacent to the retail center that is leased to a gas station and convenience store chain. See Consolidated Variable Interest Entity in Note 4 — “Investments” and Note 27 — “Subsequent Events” to our consolidated financial statements under Item 8 of this Annual Report on Form 10-K for additional information.
In addition, Melbourne FMA, LLC, our wholly owned subsidiary, has a 90% interest in a company which owns three outparcels aggregating approximately 3.1 acres for sale or ground lease. See Investment in Unconsolidated Joint Venture in Note 4 — “Investments” to our consolidated financial statements under Item 8 of this Annual Report on Form 10-K for additional information.
Information Technology
Our information technology operations include a team of experienced software developers with extensive knowledge in designing and creating web-based applications and products for mobile devices. The operations, which are located in Tampa, Florida and Noida, India, are focused on developing cloud-based, innovative products and services that support in-house operations as well as our third-party relationships with our agency partners and claim vendors.
PropletTM
Proplet is an online platform for quoting homeowners policies for our subsidiary, HCPCI. This platform offers a map based solution for quoting.
11
Table of Contents
TypTap®
TypTap is an online platform for quoting and binding residential flood policies for our subsidiary, TypTap Insurance Company. This platform focuses on simplifying the user experience, which is entirely online. It is designed to be accessible from a mobile phone or any other internet-capable device.
SAMSTM
SAMS is an online platform for supporting back-office policy and claims management for both of our insurance subsidiaries, HCPCI and TypTap Insurance Company. SAMS processes the full life cycle of a policy from policy quoting and issuance to agency management, cash receipts/disbursements, claims reserving and claim payments.
CasaClueTM
CasaClue is our proprietary database containing residential property data.
Some of the technologies originally developed in-house for our own insurance operations have been launched for use free of charge by third parties. These technologies include the following:
Exzeo®
Exzeo is a cloud-based application available at Exzeo.com which provides a highly customizable environment to support automation and process management to high volume environments. Exzeo.com specifically supports property claim assignments, logistics, and accountability reporting with our third party partners. Exzeo.com has rich system integration through an application program interface (API), which allows hands-free data transfer from any API-capable applications such as SAMS.
AtlasViewerTM
AtlasViewer is our interactive cloud-based data mapping and visualization application. An industry agnostic product, AtlasViewer allows users to combine data from multiple sources and leverage location coordinates to make more informed business decisions. AtlasViewer allows system-to-system integration through an API or allows users to upload documents to view and securely share data on a customized map. AtlasViewer is offered as a subscription-based service.
12
Table of Contents
Financial Highlights
The following table summarizes our financial performance during the years ended December 31, 2017, 2016 and 2015:
| (Amounts in millions except per share amounts) | ||||||||||||
| For the year ended December 31: | 2017 | 2016 | 2015 | |||||||||
| Net premium earned |
$ | 224.6 | $ | 243.6 | $ | 282.5 | ||||||
| Total revenue |
$ | 244.4 | $ | 264.4 | $ | 286.0 | ||||||
| Losses and loss adjustment expenses |
$ | 165.6 | $ | 124.7 | $ | 87.2 | ||||||
| (Loss) income before income taxes |
$ | (15.6 | ) | $ | 46.9 | $ | 106.2 | |||||
| Net (loss) income |
$ | (6.9 | ) | $ | 29.0 | $ | 65.9 | |||||
| (Loss) income available to stockholders |
$ | (6.9 | ) | $ | 29.0 | $ | 65.9 | |||||
| (Loss) earnings per share: |
||||||||||||
| Basic |
$ | (0.75 | ) | $ | 2.95 | $ | 6.51 | |||||
| Diluted |
$ | (0.75 | ) | $ | 2.92 | $ | 5.90 | |||||
| Dividends per share |
$ | 1.40 | $ | 1.20 | $ | 1.20 | ||||||
| Net cash provided by operating activities |
$ | 16.4 | $ | 88.0 | $ | 45.2 | ||||||
| Cash dividends paid on common stock* |
$ | 12.8 | $ | 11.7 | $ | 11.7 | ||||||
| At December 31: |
||||||||||||
| Total investments |
$ | 380.3 | $ | 298.7 | $ | 232.9 | ||||||
| Cash and cash equivalents |
$ | 255.9 | $ | 280.5 | $ | 267.7 | ||||||
| Total assets |
$ | 842.3 | $ | 670.1 | $ | 637.0 | ||||||
| Total stockholders’ equity |
$ | 194.0 | $ | 243.7 | $ | 237.7 | ||||||
| Common shares outstanding (in millions) |
8.8 | 9.7 | 10.3 | |||||||||
| * | Net of cash dividends received under share repurchase forward contract |
Environmental Matters
As a property owner, we are subject to regulations under various federal, state, and local laws concerning the environment, including laws addressing the discharge of pollutants into the air and water and the management and disposal of hazardous substances and wastes and the cleanup of contaminated sites.
Cybersecurity
We rely on digital technology to conduct our businesses and interact with customers, policyholders, agents, and vendors. With this reliance on technology comes the associated security risks from using today’s communication technology and networks.
To defend our computer systems from cyber-attacks, we utilize tools such as firewalls, anti-malware software, multifactor authentication, e-mail security services, virtual private networks, third party security experts, and timely applied software patches, among others. We also engage a third-party consultant to conduct penetration tests to identify any potential security vulnerabilities. Although we believe our defenses against cyber-intrusions are sufficient, we continually monitor our computer networks for new types of threats.
13
Table of Contents
Employees
As of February 23, 2018, we employed a total of 334 full-time individuals. In addition, we had 76 employees leased through a professional employer organization.
Available Information
We file annual, quarterly, and current reports with the U.S. Securities and Exchange Commission (“SEC”). These filings are accessible free of charge on our website, www.hcigroup.com (click “SEC filings” at the “Investor Information” tab), as soon as reasonably practicable after they have been electronically filed with or furnished to the SEC. The SEC maintains an Internet site that contains reports, proxy and information statements, and other information regarding issuers, which can be accessed via the SEC’s website at www.sec.gov. In addition, these filings are accessible at the SEC’s Public Reference Room, which is located at 100 F Street, NE, Washington, DC 20549-0213. Information on the operation of the Public Reference Room may be obtained by calling the SEC at 1-800-SEC-0330.
Our business is subject to a number of risks, including those described below, which could have a material effect on our results of operations, financial condition or liquidity and could cause our operating results to vary significantly from period to period.
Our historical revenue growth was derived primarily through policy assumptions and acquisitions. We cannot guarantee that future policy assumptions and acquisitions will be available to the extent they have in the past.
Substantially all of our historical revenue has been generated from policies assumed from Citizens, our acquisition of policies from one Florida insurance company and subsequent renewals of these policies. Our ability to grow our premium base may depend upon the availability of future policy assumptions and acquisitions upon acceptable terms. Opportunities to acquire large numbers of policies from Citizens meeting our strict underwriting criteria have diminished in recent years. We cannot ensure you that such opportunities will arise in the future.
Although we plan to enter the insurance market in other states, our insurance business is currently in Florida only. Thus, any catastrophic event or other condition affecting losses in Florida could adversely affect our financial condition and results of operations.
Any catastrophic event, a destructive weather pattern, a general economic trend, regulatory developments or other conditions specifically affecting the state of Florida could have a disproportionately adverse impact on our business, financial condition, and results of operations. While we actively manage our exposure to catastrophic events through our underwriting process and the purchase of reinsurance, the fact that our business is concentrated in the state of Florida
14
Table of Contents
subjects it to increased exposure to certain catastrophic events and destructive weather patterns such as hurricanes, tropical storms, and tornados. Changes in the prevailing regulatory, legal, economic, political, demographic and competitive environment, and other conditions in the state of Florida could also make it less attractive for us to do business in Florida and would have a more pronounced effect on our business than it would on other insurance companies that are geographically diversified. Since our business is concentrated in this manner, the occurrence of one or more catastrophic events or other conditions affecting losses in the state of Florida could have an adverse effect on our business, financial condition, and/or results of operations.
Changing climate conditions could have an adverse impact on our business, results of operations or financial condition.
There is an emerging scientific consensus on global warming. Climate change, to the extent it produces rising temperatures and changes in weather patterns, may affect the frequency and severity of storms and other weather events, affect the affordability, availability and underwriting results of homeowners’ and property insurance, and, if frequency and severity patterns increase, negatively affect our business, results of operations, and/or financial condition.
Our results may fluctuate based on many factors including cyclical changes in the insurance industry.
The insurance industry historically has been cyclical, characterized by periods of intense price competition due to excessive underwriting capacity, as well as periods when shortages of capacity permitted an increase in pricing and, thus, more favorable underwriting profits. As premium levels increase, there may be new entrants to the market, which could subsequently lead to a decrease in premium levels. Any of these factors could lead to a significant reduction in premium rates in future periods, less favorable policy terms and fewer opportunities to underwrite insurance risks, which could have a material, adverse effect on our results of operations and cash flows. In addition to these considerations, changes in the frequency and severity of losses suffered by insureds and insurers may affect the cycles of the insurance business significantly.
We cannot predict whether market conditions will improve, remain constant or deteriorate. Negative market conditions may impair our ability to write insurance at rates that we consider appropriate relative to the risk assumed. If we cannot write insurance at appropriate rates, our business would be materially and adversely affected.
Our business could be harmed if we lose the services of our key personnel.
Our operations are highly dependent on the efforts of our senior executive officers, particularly our chief executive officer, Paresh Patel, as well as our chief financial officer, Mark Harmsworth. The loss of their leadership, industry knowledge and experience could negatively impact our operations. However, we have management succession plans to lessen any such negative impact. Apart from Mr. Patel and Mr. Harmsworth, we have no employment agreements with any of our personnel nor do we offer any guarantee of any employee’s ongoing service. We maintain key-man life insurance on Mr. Patel although such policy may be insufficient to cover the damage resulting from the loss of Mr. Patel’s services.
15
Table of Contents
Our information technology systems may fail or be disrupted, which could adversely affect our business.
Our insurance business is highly dependent upon the successful and uninterrupted functioning of our computer and data processing systems. We rely on these systems to perform underwriting and other modeling functions necessary for writing business, as well as to handle our policy administration process (i.e., the printing and mailing of our policies, endorsements, renewal notices, etc.). The failure or disruption of these systems could interrupt our operations and result in a material, adverse effect on our business.
The growth of our insurance business is dependent upon the successful development and implementation of advanced computer and data processing systems as well as the development and deployment of new information technologies to streamline our operations, including policy underwriting, production and administration and claim handling. The failure of these systems to function as planned could slow our growth and adversely affect our future business volume and results of operations.
We conduct our business primarily from offices located in Tampa, Florida where tropical storms could damage our facilities or interrupt our power supply. The loss or significant impairment of functionality in these facilities for any reason could have a material, adverse effect on our business although we believe we have sufficient redundancies to replace our facilities if functionality is impaired. We contract with a third-party vendor to maintain complete daily backups of our systems, which are stored at the vendor’s facility in Atlanta, Georgia. We additionally use industry leading Internet cloud infrastructure providers to host some of our data processing systems. These cloud providers ensure redundancy across geographic regions with additional daily system backups. Access to these databases and hosted environments is strictly controlled and limited to authorized personnel. In the event of a disaster causing a complete loss of functionality at our Tampa location, we plan to temporarily use our secondary office in Ocala, Florida to continue our operations.
An unauthorized disclosure or loss of policyholder or employee information or other sensitive or confidential information, including by cyber-attack or other security breach, could cause a loss of data, give rise to remediation or other expenses, expose us to liability under federal and state laws, and subject us to litigation and investigations, which could have an adverse effect on our business, cash flows, financial condition and results of operations.
As part of our normal operations, we collect, process and retain certain sensitive and confidential information. We are subject to various federal and state privacy laws and rules regarding the use and disclosure of certain sensitive or confidential information, including the Gramm-Leach-Bliley Act and its state-law progeny. Despite the security measures we have implemented to help ensure data security and compliance with applicable laws and rules, which include firewalls, regular penetration testing and other measures, our facilities and systems, and those of our third-party service providers and vendors, may be vulnerable to cyber-attacks, security breaches, acts of vandalism, computer viruses, theft of data, misplaced or lost data, programming and human errors, physical break-ins, or other disruptions. In addition, we cannot ensure that we will be able to identify, prevent or contain the effects of possible cyber-attacks or other cybersecurity risks in the future that may bypass our security measures or disrupt our information technology systems or business.
16
Table of Contents
Noncompliance with any privacy or security laws and regulations, or any security breach, cyber-attack or cybersecurity breach, and any incident involving the misappropriation, loss or other unauthorized disclosure or use of, or access to, sensitive or confidential member information, could require us to expend significant capital and other resources to continue to modify or enhance our protective measures and to remediate any damage caused by such breaches. In addition, this could result in interruptions to our operations and damage to our reputation, and misappropriation of confidential information could also result in regulatory enforcement actions, material fines and penalties, litigation or other liability or actions which could have a material adverse effect on our business, cash flows, financial condition and results of operations. As the regulatory environment related to information security, data collection and use, and privacy becomes increasingly rigorous, with new and constantly changing requirements applicable to our business, compliance with those requirements could also result in additional costs.
We rely on service providers and vendors to provide certain technology, systems and services that we use in connection with various functions of our business, including PCI DSS (Payment Card Industry Data Security Standard) compliant credit card processing, and we may entrust them with confidential information. The information systems of our third-party service providers and vendors are also vulnerable to an increasing threat of continually evolving cybersecurity risks. Unauthorized parties may attempt to gain access to these systems or our information through fraud or other means of deceiving our associates, third-party service providers or vendors. Hardware, software or applications we obtain from third parties may contain defects in design or manufacture or other problems that could unexpectedly compromise information security. The methods used to obtain unauthorized access, disable or degrade service or sabotage systems are also constantly changing and evolving and may be difficult to anticipate or detect for long periods of time. Ever-evolving threats mean our third-party service providers and vendors must continually evaluate and adapt their own respective systems and processes, and there is no assurance that they will be adequate to safeguard against all data security breaches or misuses of data. Any future significant compromise or breach of our data security via a third-party service provider or vendor could result in additional significant costs, lost revenues, fines, lawsuits, and damage to our reputation.
Because insurance rates are heavily regulated by state governments, inflation could adversely affect our financial condition and results of operations
The rates an insurer may charge to its policyholders are controlled by laws and state regulators. Because our ability to raise rates is subject to regulation, our exposure to the risks of price inflation and other economic forces may be more profound than the exposure to which other industries may be subject. Inflation and economic forces could increase our costs (such as the cost to repair a damaged home) and lower our profitability, while we would be unable to respond with higher rates, except with regulatory approval. While we attempt to use new technology to lower our overall costs, increased rates of price inflation could nonetheless have an adverse effect on our business, financial condition and/or results of operations.
17
Table of Contents
Increased competition, competitive pressures, industry developments, and market conditions could affect the growth of our business and adversely impact our financial results.
The property and casualty insurance industry in Florida is cyclical and highly competitive. We compete not only with other stock companies but also with mutual companies, the U.S. government, other underwriting organizations and alternative risk sharing mechanisms. Our principal lines of business are written by numerous other insurance companies. Competition for any one account may come from very large, well-established national companies, smaller regional companies, other specialty insurers in our field, and new entrants to the Florida market. Many of these competitors have greater financial resources, larger agency networks and greater name recognition than our company. We compete for business not only on the basis of price, but also on the basis of financial strength, types of coverage offered, availability of coverage desired by customers, commission structure, and quality of service. We may have difficulty continuing to compete successfully on any of these bases in the future. Competitive pressures coupled with market conditions may affect our rate of premium growth and financial results.
Our ability to compete in the property and casualty insurance industry and our ability to expand our business may be negatively affected by the fact that we are not a long-established company. HCPCI and TypTap have each obtained a Demotech rating of “A Exceptional,” which is accepted by major mortgage companies operating in the state of Florida and many other states. Mortgage companies may require homeowners to obtain property insurance from an insurance company with an acceptable A.M. Best rating, which we do not currently have. Such a requirement could prevent us from expanding our business unless we obtain such rating, which may in turn limit our ability to compete with large, national insurance companies and certain regional insurance companies. A downgrade or loss of our Demotech rating could result in a substantial loss of business in the event insureds move their business to insurers with a sufficient financial strength rating.
There are inherent limitations and risks related to our projections and our estimates of claims and loss reserves. If our actual losses exceed our loss reserves, our financial results, our ability to expand our business, and our ability to compete in the property and casualty insurance industry may be negatively affected. In addition, industry developments could further increase competition in our industry. These developments could include —
| • | an influx of new capital in the marketplace as existing companies attempt to expand their businesses and new companies attempt to enter the insurance business because of better pricing and/or terms; |
| • | new programs or changes to existing programs in which federally or state-sponsored entities provide property insurance in catastrophe-prone areas or other alternative markets; |
| • | changes in Florida’s or any other states’ regulatory climate; and |
| • | the enactment of federal proposals for an optional federal charter that would allow some competing insurers to operate under regulations different or less stringent than those applicable to our insurance subsidiaries. |
These developments and others could make the property and casualty insurance marketplace more competitive by increasing the supply of insurance available.
18
Table of Contents
If competition limits our ability to write new business at adequate rates, our future results of operations would be adversely affected.
If our actual losses from claims exceed our loss reserves, our financial results would be adversely affected.
Our objective is to establish loss reserves that are adequate and represent management’s best estimate of the ultimate cost to investigate and settle a specific claim. However, the process of establishing adequate reserves is complex and inherently uncertain, and the ultimate cost of a claim may vary materially from the amounts reserved. We regularly monitor and evaluate loss and loss adjustment expense reserve development to determine reserve adequacy.
Due to these uncertainties, the ultimate losses may vary materially from current loss reserves which could have a material, adverse effect on our future financial condition, results of operations and cash flows.
Our failure to pay claims accurately could adversely affect our insurance business, financial results and capital requirements.
We rely on our claims personnel to accurately evaluate and pay the claims made under our policies. Many factors could affect our ability to accurately evaluate and pay claims, including the accuracy of our external independent adjusters as they make their assessments and submit their estimates of damages; the training, background, and experience of our claims representatives; the ability of our claims personnel to ensure consistent claims handling given the input by our external independent adjusters; the ability of our claims department to translate the information provided by our external independent adjusters into acceptable claims settlements; and the ability of our claims personnel to maintain and update our claims handling procedures and systems as they evolve over time based on claims and geographical trends in claims reporting. Any failure to pay claims accurately could lead to material litigation, undermine our reputation in the marketplace, impair our corporate image and negatively affect our financial results.
The effects of emerging claim and coverage issues on our business are uncertain.
As industry practices and legal, judicial, social and other environmental conditions change, unexpected and unintended issues related to claims and coverage may emerge. These issues may adversely affect our business by either extending coverage beyond our underwriting intent or by increasing the number or size of claims. In some instances, these changes may not become apparent until sometime after we have issued insurance contracts that are affected by the changes. As a result, the full extent of liability under our insurance contracts may not be known for many years after a contract is issued and renewed, and our financial position and results of operations may be adversely affected as a result of any such unforeseen changes.
19
Table of Contents
If we are unable to expand our business because our capital must be used to pay greater than anticipated claims, our financial results may suffer.
Our future growth will depend on our ability to expand the number of insurance policies we write, to expand the kinds of insurance products we offer, and to expand the geographic markets in which we do business, all balanced by the insurance risks we choose to assume and cede. Our existing sources of funds include operations, investment holdings, and possible sales of our investment securities. Unexpected catastrophic events in our market areas, such as hurricanes, may result in greater claims losses than anticipated, which could require us to limit or halt our growth while we redeploy our capital to pay these unanticipated claims unless we can raise additional capital.
HCI Group, Inc. depends on the ability of its subsidiaries to generate and transfer funds to meet its debt obligations.
HCI Group, Inc. does not have significant revenue generating operations of its own. Our ability to make scheduled payments on our debt obligations depends on the financial condition and operating performance of our subsidiaries. If the funds we receive from our subsidiaries, some of which are subject to regulatory restrictions on the payment of distributions, are insufficient to meet our debt obligations, we may be required to raise funds through the issuance of additional debt or equity securities, reduce or suspend dividend payments, or sell assets.
We may require additional capital in the future which may not be available or may only be available on unfavorable terms.
Our future capital requirements depend on many factors, including our ability to write new business successfully and to establish premium rates and reserves at levels sufficient to cover losses. To the extent that our present capital is insufficient to meet future operating requirements or to cover losses, we may need to raise additional funds through financings or curtail our growth. Based on our current operating plan, we believe current capital together with our anticipated retained income will support our operations. However, we cannot provide any assurance in that regard, since many factors will affect our capital needs and their amount and timing, including our growth and profitability, and the availability of reinsurance, as well as possible acquisition opportunities, market disruptions and other unforeseeable developments. If we require additional capital, it is possible that equity or debt financing may not be available at all or may be available only on terms unfavorable to us. Equity financings could result in dilution to our shareholders, and in any case such securities may have rights, preferences and privileges that are senior to those of existing shareholders. If we cannot obtain adequate capital on favorable terms or at all, our business, financial condition or results of operations could be materially affected.
20
Table of Contents
There may be limited markets for and restrictions on certain holdings in our investment portfolio.
Certain holdings in our investment portfolio include limited partnership interests and real
estate joint ventures. We may increase our holdings in these types of investments as we pursue diversification. These investments may be illiquid in the near term as they are privately placed and are subject to certain restrictions or conditions that may limit our ability to immediately dispose of the investments. If it becomes necessary to sell any of these investments at a time when the fair market value is below our carrying value, we may incur significant losses which could have a material adverse effect on our net income and financial position.
Our financial results may be negatively affected by the fact that a portion of our income is generated by the investment of our available cash.
A portion of our income is, and likely will continue to be, generated by the investment of our available cash. The amount of income so generated is a function of our investment policy, available investment opportunities, and the amount of available cash invested. We may alter our investment policy to accept higher levels of risk with the expectation of higher returns. Fluctuating interest rates and other economic factors make it difficult to estimate accurately the amount of investment income that will be realized. In fact, we have realized and may in the future realize losses on sales of our investments as well as other-than-temporary losses on our investment holdings.
Reinsurance coverage may not be available to us in the future at commercially reasonable rates or at all and we risk non-collectability of reinsurance amounts due us from reinsurers with which we have contracted.
Reinsurance is a method of transferring part of an insurance company’s liability under an insurance policy to another insurance company, or reinsurer. We use reinsurance arrangements to limit and manage the amount of risk we retain, to stabilize our underwriting results and to increase our underwriting capacity. The cost of such reinsurance is subject to prevailing market conditions beyond our control, such as the amount of capital in the reinsurance market and the occurrence of natural and man-made catastrophes. We cannot be assured that reinsurance will remain continuously available to us in the amounts we consider sufficient and at prices acceptable to us. As a result, we may determine to increase the amount of risk we retain or look for other alternatives to reinsurance, which could in turn have a material, adverse effect on our financial position, results of operations and cash flows.
With respect to the reinsurance contracts we currently have in effect, our ability to recover amounts due from reinsurers is subject to such reinsurers’ ability and willingness to pay and to meet their obligations to us. We attempt to select financially strong reinsurers with an A.M. Best rating of “A-” or better or we require the reinsurer to fully collateralize its exposure. While we monitor from time to time the financial condition of our reinsurers, we rely principally on A.M. Best, our reinsurance broker, and other rating agencies in determining their ability to meet their obligations to us. Any failure on the part of any one reinsurance company to meet its obligations to us could have a material, adverse effect on our financial condition or results of operations.
21
Table of Contents
We have exposure to unpredictable catastrophes, which can materially and adversely affect our financial results.
We write insurance policies that cover homeowners, condominium owners, and tenants for losses that result from, among other things, catastrophes. We are therefore subject to losses, including claims under policies we have written, arising out of catastrophes that may have a significant effect on our business, results of operations, and financial condition. A significant catastrophe could also have an adverse effect on our reinsurers. Catastrophes can be caused by various events, including hurricanes, tropical storms, tornadoes, windstorms, earthquakes, hailstorms, explosions, power outages, fires and man-made events. The incidence and severity of catastrophes are inherently unpredictable. The extent of losses from a catastrophe is a function of both the total amount of insured exposure in the area affected by the event and the severity of the event. Our policyholders are currently concentrated in Florida, which is especially subject to adverse weather conditions such as hurricanes and tropical storms. Therefore, although we attempt to manage our exposure to catastrophes through our underwriting process and the purchase of reinsurance protection, an especially severe catastrophe or series of catastrophes could exceed our reinsurance protection and may have a material, adverse impact on our results of operations and financial condition.
Industry trends, such as increased litigation against the insurance industry and individual insurers, the willingness of courts to expand covered causes of loss, rising jury awards, and the escalation of loss severity may contribute to increased costs and to the deterioration of the reserves of our insurance subsidiaries.
Loss severity in the property and casualty insurance industry may increase and may be driven by larger court judgments. In the event legal actions and proceedings are brought on behalf of classes of complainants, this may increase the size of judgments. The propensity of policyholders and third party claimants to litigate and the willingness of courts to expand causes of loss and the size of awards may render our loss reserves inadequate for current and future losses.
The failure of the risk mitigation strategies we utilize could have a material, adverse effect on our financial condition or results of operations.
We utilize a number of strategies to mitigate risk exposure within our insurance business, which include:
| • | engaging in vigorous underwriting; |
| • | carefully evaluating terms and conditions of our policies; |
| • | focusing on our risk aggregations by geographic zones and other bases; and |
| • | ceding insurance risk to reinsurance companies. |
However, there are inherent limitations in these tactics. We cannot provide assurance that an unanticipated event or series of events will not result in loss levels which could have a material, adverse effect on our financial condition or results of operations.
22
Table of Contents
The failure of any of the loss limitation methods we employ could have a material, adverse effect on our financial condition or our results of operations.
Our insurance underwriting process is generally designed to limit our exposure to known and manageable risks. Various provisions of our policies, such as limitations or exclusions from coverage, which have been negotiated to limit our risks, may not be enforceable in the manner we intend.
In addition, the policies we issue contain conditions requiring the prompt reporting of claims to us and our right to decline coverage in the event of a violation of that condition. While our insurance product exclusions and limitations reduce the loss exposure to us and help eliminate known exposures to certain risks, it is possible that a court or regulatory authority could nullify or void an exclusion or legislation could be enacted modifying or barring the use of such endorsements and limitations in a way that would adversely affect our loss experience, which changes could have a material, adverse effect on our financial condition or results of operations.
In the future, we may rely on independent agents to write our insurance policies, and if we are not able to contract with and retain independent agents, our revenues would be negatively affected.
Although voluntary policies comprise a small percentage of our business, we expect to increase the number of voluntary policies (policies not assumed or acquired from another company) we write as our business and product lines expand. An inability to sell our products through independent agents would negatively affect our revenues.
We must compete with other insurers for independent agents’ business. Our competitors may offer a greater variety of insurance products, lower premiums for insurance coverage, or higher commissions to their agents. If our products, pricing and commissions do not remain competitive, we may find it more difficult to attract business from independent agents to sell our products. A material reduction in the amount of our products that independent agents sell could negatively affect our revenues.
Our growth may depend on the success of our residential flood offering.
Currently we offer residential flood insurance solely in Florida. We plan to expand our flood insurance business to other states and eventually establish ourselves as a leading alternative to the National Flood Insurance Program, administered by the Federal Emergency Management Agency, which has been the dominant provider of flood insurance in the United States for over 40 years.
The genesis of our flood insurance business was the enactment in 2012 of The Biggert–Waters Act which mandated that the National Flood Insurance Program establish actuarially sound premium rates. The national program’s rates thereafter soared. Congress reacted in 2014 by enacting the Homeowner Flood Insurance Affordability Act which limits the national
program’s annual rate increases to between 15% and 25% depending on particular circumstances.
23
Table of Contents
We entered the residential flood market based upon our own analysis that in certain states and regions, with selective underwriting, we could profitably compete with the National Flood Insurance Program on the basis of lower rates. We are one of only a few private entrants into the flood insurance market. There is relatively little actuarial or historical data available relating to flood events. We have our own sophisticated underwriting algorithms for accepting flood insurance applications. Our algorithms, however, are untested.
There can be no assurance that future laws and regulations relating to flood insurance will not materially and adversely impact our ability to profitably compete in the residential flood market. Further there can be no assurance that our original analysis regarding residential flood insurance and its risks and costs will be proven correct over time or that our algorithms will deliver the anticipated underwriting results.
Our flood insurance offering features an on-line platform for quoting and binding residential flood policies that is designed to be quick and easy to use and accessible by any Internet capable device, such as a mobile phone. We have only recently begun to explore and develop methods to market our flood insurance and on-line platform. Since the federal flood program has dominated the flood insurance market for over 40 years, the market for private flood insurance is relatively new. There can be no assurance that our marketing efforts will be successful in producing substantial numbers of flood insurance policies for us or that prospective insureds will be receptive to our flood insurance or our on-line platform.
Our success depends on our ability to accurately price the risks we underwrite.
The results of our operations and our financial condition depend on our ability to underwrite and set premium rates accurately for a wide variety of risks, including risks associated with flood insurance and other new product offerings. Rate adequacy is necessary to generate sufficient premiums to pay losses, loss adjustment expenses, and underwriting expenses and to earn a profit. To price our products accurately, we must collect and properly analyze a substantial amount of data; develop, test and apply appropriate rating formulas; closely monitor and timely recognize changes in trends; and project both severity and frequency of losses with reasonable accuracy. Our ability to undertake these efforts successfully, and thus, price our products accurately, is subject to several risks and uncertainties, some of which are outside our control, including —
| • | the availability of sufficient reliable data; |
| • | the uncertainties that inherently characterize estimates and assumptions; |
| • | our selection and application of appropriate rating and pricing techniques; |
| • | changes in legal standards, claim settlement practices, and restoration costs; and |
| • | legislatively imposed consumer initiatives. |
In addition, we could underprice risks, which would negatively affect our profit margins.
We could also overprice risks, which could reduce our retention, sales volume and competitiveness. The foregoing factors could materially and adversely affect our profitability.
24
Table of Contents
Use of current operating resources may be necessary to develop future new insurance products.
We may expand our product offerings by underwriting additional insurance products and programs. Expansion of our product offerings will result in increases in expenses due to additional costs incurred in actuarial rate justifications, software and personnel. Offering additional insurance products will also require regulatory approval, further increasing our costs and potentially affecting the speed with which we will be able to pursue new market opportunities. Claddaugh may offer reinsurance products to unaffiliated insurance companies. We cannot assure you that we will be successful bringing new insurance products to markets.
Use of current operating resources may be necessary to expand our insurance business geographically.
Although we currently conduct our homeowners’ insurance business in Florida, we plan to enter the homeowners’ insurance markets in other states. Geographic expansion of our insurance business will result in increases in expenses due to additional costs incurred in actuarial rate justifications, software, personnel and regulatory compliance. Although we plan to enter other states judiciously with attention to profitability, we cannot assure you that our entry into other states will be successful.
As an insurance holding company, we are currently subject to state regulation and in the future may become subject to federal regulation.
All states regulate insurance holding company systems. State statutes and administrative rules generally require each insurance company in the holding company group to register with the department of insurance in its state of domicile and to furnish information concerning the operations of the companies within the holding company system that may materially affect the operations, management or financial condition of the insurers within the group. As part of its registration, each insurance company must identify material agreements, relationships and transactions with affiliates, including without limitation, loans, investments, asset transfers, transactions outside of the ordinary course of business, certain management, service, and cost sharing agreements, reinsurance transactions, dividends, and consolidated tax allocation agreements.
Insurance holding company regulations generally provide that transactions between an insurance company and its affiliates must be fair and equitable, allocated between the parties in accordance with customary accounting practices, and fully disclosed in the records of the respective parties. Many types of transactions between an insurance company and its affiliates, such as transfers of assets among such affiliated companies, certain dividend payments from insurance subsidiaries and certain material transactions between companies within the system may be subject to prior approval by, or prior notice to, state regulatory authorities. If we are unable to obtain the requisite prior approval for a specific transaction, we would be precluded from taking the action, which could adversely affect our operations. In addition, state insurance regulations also frequently impose notice or approval requirements for the acquisition of specified levels of ownership in the insurance company or insurance holding company.
25
Table of Contents
HCPCI is approved as an admitted carrier in the states of Arkansas, California, Florida, Maryland, North Carolina, New Jersey, Ohio, Pennsylvania, South Carolina and Texas. TypTap is approved as an admitted carrier in Florida only. In addition, HCPCI is approved as a non-admitted carrier in Virginia. We may in the future seek authorization to transact business in other states as well. We will therefore become subject to the laws and regulatory requirements of those states. These regulations may vary from state to state, and states occasionally may have conflicting regulations. Currently, the federal government’s role in regulating or dictating the policies of insurance companies is limited. However, Congress, from time to time, considers proposals that would increase the role of the federal government in insurance regulation, either in addition to or in lieu of state regulation. The impact of any future federal insurance regulation on our insurance operations is unclear and may adversely impact our business or competitive position.
Our insurance subsidiaries are subject to extensive regulation, which may reduce our profitability or limit our growth. Moreover, if we fail to comply with these regulations, we may be subject to penalties, including fines and suspensions, which may adversely affect our financial condition and results of operations.
The insurance industry is highly regulated and supervised. Our insurance subsidiaries are subject to the supervision and regulation of the states in which they are domiciled and the states in which they transact insurance business. Such supervision and regulation is primarily designed to protect our policyholders rather than our shareholders. These regulations are generally administered by a department of insurance in each state and relate to, among other things —
| • | the content and timing of required notices and other policyholder information; |
| • | the amount of premiums the insurer may write in relation to its surplus; |
| • | the amount and nature of reinsurance a company is required to purchase; |
| • | participation in guaranty funds and other statutorily created markets or organizations; |
| • | business operations and claims practices; |
| • | approval of policy forms and premium rates; |
| • | standards of solvency, including risk-based capital measurements; |
| • | licensing of insurers and their products; |
| • | restrictions on the nature, quality and concentration of investments; |
| • | restrictions on the ability of insurance company subsidiaries to pay dividends to their holding companies; |
| • | restrictions on transactions between insurance companies and their affiliates; |
| • | restrictions on the size of risks insurable under a single policy; |
| • | requiring deposits for the benefit of policyholders; |
| • | requiring certain methods of accounting; |
| • | periodic examinations of our operations and finances; |
| • | the form and content of records of financial condition required to be filed; and |
| • | the level of reserves. |
The FLOIR and regulators in other jurisdictions where we may become licensed and offer insurance products conduct periodic examinations of the affairs of insurance companies and require the filing of annual and other reports relating to financial condition, holding company
26
Table of Contents
issues and other matters. These regulatory requirements may adversely affect or inhibit our ability to achieve some or all of our business objectives. These regulatory authorities also conduct periodic examinations into insurers’ business practices. These reviews may reveal deficiencies in our insurance operations or non-compliance with regulatory requirements.
In certain states including Florida, insurance companies are subject to assessments levied by the states where they conduct their business. While we can recover these assessments from Florida policyholders through policy surcharges, our payment of the assessments and our recoveries may not offset each other in the same reporting period in our financial statements and may cause a material, adverse effect on our cash flows and results of operations in a particular reporting period.
In addition, regulatory authorities have relatively broad discretion to deny or revoke licenses for various reasons, including the violation of regulations. In some instances, we follow practices based on our interpretations of regulations or practices that we believe may be generally followed by the industry. These practices may turn out to be different from the interpretations of regulatory authorities. If we do not have the requisite licenses and approvals or do not comply with applicable regulatory requirements, insurance regulatory authorities could preclude or temporarily suspend us from carrying on some or all of our activities or otherwise penalize us. This could adversely affect our ability to operate our business.
Finally, changes in the level of regulation of the insurance industry or changes in laws or regulations themselves or interpretations by regulatory authorities could adversely affect our ability to operate our business, reduce our profitability and limit our growth.
Our revenue from real estate investments may be affected by the success and economic viability of our anchor retail tenants. Our reliance on a single or significant tenant at certain properties may impact our ability to lease vacated space and adversely affect returns on the specific property.
At certain retail centers, we may have tenants, commonly referred to as anchor tenants, occupying all or a large portion of the gross leasable space. In the event an anchor tenant becomes insolvent, suffers a downturn in business, ceases its operations at the retail center, or otherwise determines not to renew its lease, any reduction or cessation of rental payments to us could adversely affect the returns on our real estate investments. A lease termination or cessation of operations by an anchor tenant could also lead to the loss of other tenants at the specific retail location. We may then incur additional expenses to make improvements and prepare the vacated space to be leased to one or more new tenants.
Similarly, the leases of some anchor tenants may permit the anchor tenant to transfer its lease to another retailer. The transfer to a new anchor tenant could cause customer traffic in the retail center to decrease and thereby reduce the income generated by that retail center. A lease transfer to a new anchor tenant could also allow other tenants to make reduced rental payments or to terminate their leases.
27
Table of Contents
Our retail and other real estate properties may be subject to impairment charges which can adversely affect our financial results.
We periodically evaluate our long-lived assets and related intangible assets to determine if there has been any impairment in their carrying values. If we determine an impairment has occurred, we are required to record an impairment charge equal to the excess of the asset’s carrying value over its estimated fair value. As our real estate operations grow, there is an increased potential that the impairment of an asset could have a material adverse effect on our financial results. In addition, our fair value estimates are based on several assumptions that are subject to economic and market uncertainties including, but not limited to, demand for space, competition for tenants, changes in market rental rates and costs to operate each property. As these factors are difficult to predict and are subject to future events that may alter our assumptions, the future cash flows estimated in our impairment analysis may not be achieved.
Our real estate operations are subject to regulation under various federal, state, and local laws concerning the environment.
Our real estate operations own various properties including a restaurant, marina facilities, and commercial buildings. As a result, we are subject to regulation under various federal, state, and local laws concerning the environment, including laws addressing the discharge of pollutants into the air and water and the management and disposal of hazardous substances and wastes and the cleanup of contaminated sites. We could incur substantial costs, including remediation costs, fines and civil or criminal sanctions and third-party damage or personal injury claims, if in the future we were to violate or become liable under environmental laws relating to our real estate operations.
Our real estate operations include owning restaurant operations, which expose us to additional risks, which could negatively impact our operating results and financial condition.
Our restaurant operations expose us to unique business risks. For example, restaurant operations are dependent in large part on food, beverage, and supply costs that are not within our control. In addition, the restaurant industry is affected by changes in consumer preferences and discretionary spending patterns that could adversely affect revenues from restaurant operations. Moreover, the restaurant industry is affected by litigation and publicity concerning food quality, health, alcoholic beverages and other issues which can cause guests to avoid restaurants and that can result in liabilities. Any one of these risks, among others, could negatively impact our operating results and financial condition.
Our operations in India expose us to additional risks, which could negatively impact our business, operating results, and financial condition.
Our India operations expose us to additional risks including income tax risks, currency exchange rate fluctuations and risks related to other challenges caused by distance, language, and compliance with Indian labor laws and other complex foreign and U.S. laws and regulations that apply to our India operations. These numerous and sometimes conflicting laws and regulations
28
Table of Contents
include anti-corruption laws, such as the Foreign Corrupt Practices Act, and other local laws prohibiting corrupt payments to governmental officials, among others. Violations of these laws and regulations could result in fines and penalties, or criminal sanctions against us, our officers, or our employees. Although policies and procedures are designed to ensure compliance with these laws and regulations, there can be no assurance that our employees, contractors, or agents will not violate our policies.
Our ongoing investments in real estate and information technology businesses have inherent risks, and could burden our financial and human resources.
We have invested and expect to continue to invest in real estate and information technology. Despite our due diligence, these investments may still involve significant risks and uncertainties, including distraction of management and employees from current operations, insufficient revenues to offset liabilities assumed and incurred expenses, inadequate return of capital, and failure to realize the anticipated benefits. There can be no assurance that such investments will be successful and will not adversely affect our financial condition and operating results.
ITEM 1B – Unresolved Staff Comments
Not applicable.
Real Estate Owned and Used in Operations
Tampa, Florida. The real estate consists of 3.5 acres of land, a three-story building which has a gross area of 122,000 square feet, and a four-level parking garage. This facility is 57% occupied by us and our U.S. subsidiaries and serves as our headquarters. In addition, we lease approximately 40% to non-affiliates and the remaining space is available for lease.
Ocala, Florida. The real estate consists of 1.6 acres of land and an office building with gross area of approximately 16,000 square feet. The facility is 100% designated for our insurance operations and will be used as an alternative location in the event a catastrophic event impacts our operations in Tampa, Florida.
Investment Real Estate
Treasure Island, Florida. The real estate consists of approximately 10 acres of waterfront property and land improvements, a restaurant and a marina facility. The marina facility and the restaurant are currently owned and operated by us.
Tierra Verde, Florida. The real estate consists of 7.1 acres of waterfront property, a dry rack storage building with gross area of 57,500 square feet, and two buildings with retail space having an aggregate gross area of approximately 23,000 square feet. This marina facility is owned and operated by us. Approximately 5% of the available retail space is occupied by us, 77% of the retail space is leased to non-affiliates, and the remaining space is available for lease.
29
Table of Contents
Riverview, Florida. The real estate consists of 2.57 acres of land, 1.27 acres of which is leased to a gas station and convenience store chain. Our retail structure with 8,400 square feet of net rentable space is situated on the remaining land. Approximately 88% of the rentable space is leased to non-affiliates and the remaining space is available for lease.
Sorrento, Florida. The real estate includes 5.42 acres of outparcel land intended for ground lease or resale and a retail shopping center with 61,400 square feet of net rentable area. Approximately 74% of the rentable space is currently leased to a large, well-known grocery retailer. Approximately 96% of the rentable space is leased to non-affiliates and the remaining space is available for lease.
Melbourne, Florida. The real estate includes 2.26 acres of outparcel land intended for ground lease, resale or future development and a retail shopping center with 49,995 square feet of rentable area. Approximately 42% of the rentable space is currently leased to a large well-known grocery retailer. Approximately 95% of the rentable space is leased to non-affiliates and the remaining space is available for lease.
Tampa, Florida. The real estate consists of 7.86 acres of land and an office building with gross area of 68,867 square feet. The building is 100% leased to a non-affiliated financial institution.
Leased Property
Noida, India. We lease 15,000 square feet of office space for our information technology operations. The lease commenced in 2013 and has an initial term of nine years.
Miami Lakes, Florida. We recently moved to a new location and now lease approximately 5,565 square feet of office space for our claims related administration. The new lease commenced March 1, 2018 and has an initial term of approximately three years.
Rental expense under all facility leases was $336,000, $333,000 and $304,000 during the years ended December 31, 2017, 2016 and 2015, respectively.
30
Table of Contents
We are a party to claims and legal actions arising routinely in the ordinary course of our business. Although we cannot predict with certainty the ultimate resolution of the claims asserted against us, we do not believe that any currently pending legal proceeding to which we are a party will have a material, adverse effect on our consolidated financial position, results of operations or cash flows.
ITEM 4 – Mine Safety Disclosures
Not applicable.
31
Table of Contents
PART II
ITEM 5 – Market for the Registrant’s Common Equity, Related Stockholder Matters and Issuer Purchases of Equity Securities
Markets for Common Stock
Our common stock trades on the New York Stock Exchange under the symbol “HCI.” The following table represents the high and low sales prices for our common stock as reported by the New York Stock Exchange for the periods indicated:
| Common Stock Price |
||||||||
| High | Low | |||||||
| Calendar Quarter—2017 |
||||||||
| First Quarter |
$ | 50.93 | 38.49 | |||||
| Second Quarter |
$ | 49.25 | 43.10 | |||||
| Third Quarter |
$ | 49.12 | 27.11 | |||||
| Fourth Quarter |
$ | 39.69 | 28.70 | |||||
| Calendar Quarter—2016 |
||||||||
| First Quarter |
$ | 35.75 | 29.30 | |||||
| Second Quarter |
$ | 33.95 | 26.82 | |||||
| Third Quarter |
$ | 33.04 | 26.43 | |||||
| Fourth Quarter |
$ | 40.45 | 24.35 | |||||
Holders
As of February 23, 2018, the market price for our common stock was $35.57 and there were 231 holders of record of our common stock.
32
Table of Contents
Dividends
The declaration and payment of dividends is at the discretion of our board of directors. Our ability to pay dividends depends on many factors, including the Company’s operating results, financial condition, capital requirements, the availability of cash from our subsidiaries and legal and regulatory constraints and requirements on the payment of dividends and such other factors as our board of directors deems relevant. The following table represents the frequency and amount of all cash dividends declared on our common stock for the two most recent fiscal years:
| Declaration Date |
Payment Date |
Date of Record |
Per Share Amount |
|||||
| 1/16/2017 |
3/17/2017 | 2/17/2017 | $ | 0.35 | ||||
| 4/17/2017 |
6/16/2017 | 5/19/2017 | $ | 0.35 | ||||
| 7/6/2017 |
9/15/2017 | 8/18/2017 | $ | 0.35 | ||||
| 10/19/2017 |
12/15/2017 | 11/17/2017 | $ | 0.35 | ||||
| 1/8/2016 |
3/18/2016 | 2/19/2016 | $ | 0.30 | ||||
| 4/14/2016 |
6/17/2016 | 5/20/2016 | $ | 0.30 | ||||
| 7/8/2016 |
9/16/2016 | 8/19/2016 | $ | 0.30 | ||||
| 10/13/2016 |
12/16/2016 | 11/18/2016 | $ | 0.30 | ||||
Under Florida law, a domestic insurer may not pay any dividend or distribute cash or other property to its stockholders unless certain requirements, which are discussed in Note 24 — “Regulatory Requirements and Restrictions” to our consolidated financial statements under Item 8 of this Annual Report on Form 10-K, are met. Hence Florida law may limit the availability of cash from our insurance subsidiaries for the payment of dividends to our shareholders.
Securities Authorized for Issuance Under Equity Compensation Plans
The following table summarizes our equity compensation plans as of December 31, 2017. We currently have no equity compensation plans not approved by our stockholders.
| Plan Category | (a) Number of |
(b) Weighted-Average Exercise Price of Outstanding Options |
(c) Number of Securities |
|||||||||
| Equity Compensation Plans Approved by Stockholders |
130,000 | $ | 34.82 | 1,995,655 | ||||||||
|
|
|
|
|
|||||||||
33
Table of Contents
Performance Graph
The following graph compares the 5-year cumulative total dollar return to shareholders on our common stock relative to the cumulative total returns of the Russell 2000 Index and the NASDAQ Insurance Index. An investment of $100 (with reinvestment of all dividends) is assumed to have been made in our common stock and in each index on December 31, 2012 and its relative performance is tracked through December 31, 2017. The returns shown are based on historical results and are not intended to suggest future performance.
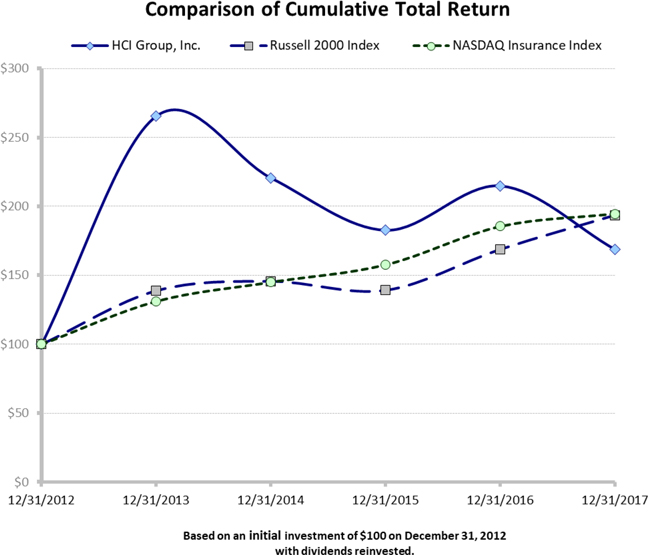
34
Table of Contents
Recent Sales of Unregistered Securities
All information related to sales of unregistered securities has been reported in a current report on Form 8-K.
Issuer Purchases of Equity Securities
The table below summarizes the number of shares of common stock repurchased during the three months ended December 31, 2017 under the repurchase plan approved by our Board of Directors in December 2016 and also the number of shares of common stock surrendered by employees to satisfy minimum federal income tax liabilities associated with the vesting of restricted shares in December 2017 (dollar amounts in thousands, except share and per share amounts):
| For the Month Ended |
Total Number of Shares Purchased |
Average Price Paid Per Share |
Total Number of Shares Purchased as Part of Publicly Announced Plans or Programs |
Approximate Dollar Value of Shares That May Yet Be Purchased Under The Plans or Programs |
||||||||||||
| October 31, 2017 |
77,708 | $ | 38.03 | 77,708 | $ | 10,863 | ||||||||||
| November 30, 2017 |
92,540 | $ | 32.42 | 92,540 | $ | 7,863 | ||||||||||
| December 31, 2017 |
102,397 | $ | 30.09 | 99,662 | $ | 4,863 | ||||||||||
|
|
|
|
|
|||||||||||||
| 272,645 | $ | 33.14 | 269,910 | |||||||||||||
|
|
|
|
|
|||||||||||||
In December 2017, our Board of Directors approved a one-year plan to repurchase up to $20 million of our common shares during 2018. The approved amounts in each year exclude brokerage fees. See Note 19 — “Stockholders’ Equity” to our consolidated financial statements under Item 8 of this Annual Report on Form 10-K.
35
Table of Contents
ITEM 6 – Selected Financial Data
The following selected consolidated financial data should be read in conjunction with Item 7 “Management’s Discussion and Analysis of Financial Condition and Results of Operations” and our consolidated financial statements and the related notes appearing in Item 8 “Financial Statements and Supplementary Data” of this Annual Report on Form 10-K. The consolidated statements of income data for the years ended December 31, 2017, 2016, and 2015 and the consolidated balance sheet data at December 31, 2017 and 2016 are derived from our audited consolidated financial statements appearing in Item 8 of this Annual Report on Form 10-K. The consolidated statements of income data for the years ended December 31, 2014 and 2013, and the consolidated balance sheet data at December 31, 2015, 2014, and 2013, are derived from our audited consolidated financial statements that are not included in this Annual Report on Form 10-K. The historical results are not necessarily indicative of the results to be expected in any future period.
| As of or for the Years Ended December 31, | ||||||||||||||||||||
| 2017 | 2016 | 2015 | 2014 | 2013 | ||||||||||||||||
| (Dollar amounts in thousands, except per share amounts) | ||||||||||||||||||||
| Operating Revenue |
||||||||||||||||||||
| Gross premiums earned |
$ | 358,253 | $ | 378,678 | $ | 423,120 | $ | 365,488 | $ | 337,113 | ||||||||||
| Premiums ceded |
(133,635 | ) | (135,051 | ) | (140,614 | ) | (113,423 | ) | (102,865 | ) | ||||||||||
|
|
|
|
|
|
|
|
|
|
|
|||||||||||
| Net premiums earned |
224,618 | 243,627 | 282,506 | 252,065 | 234,248 | |||||||||||||||
| Net investment income |
11,439 | 9,087 | 3,978 | 4,888 | 1,469 | |||||||||||||||
| Net realized investment gains (losses) |
4,346 | 2,601 | (608 | ) | 4,735 | 80 | ||||||||||||||
| Net unrealized investment gains |
92 | — | — | — | — | |||||||||||||||
| Net other-than-temporary impairment losses recognized in income: |
||||||||||||||||||||
| Total other-than-temporary impairment losses |
(1,116 | ) | (2,252 | ) | (5,275 | ) | (107 | ) | — | |||||||||||
| Portion of loss recognized in other comprehensive income, before taxes |
(351 | ) | (230 | ) | 594 | — | — | |||||||||||||
|
|
|
|
|
|
|
|
|
|
|
|||||||||||
| Net other-than-temporary impairment losses |
(1,467 | ) | (2,482 | ) | (4,681 | ) | (107 | ) | — | |||||||||||
| Policy fee income |
3,622 | 3,914 | 3,496 | 2,820 | 3,098 | |||||||||||||||
| Gain on repurchases of convertible senior notes |
— | 153 | — | — | — | |||||||||||||||
| Gain on bargain purchase |
— | 2,071 | — | — | — | |||||||||||||||
| Gain on remeasurement of previously held interest |
— | 4,005 | — | — | — | |||||||||||||||
| Other income |
1,756 | 1,470 | 1,261 | 1,707 | 2,193 | |||||||||||||||
|
|
|
|
|
|
|
|
|
|
|
|||||||||||
| Total operating revenue |
244,406 | 264,446 | 285,952 | 266,108 | 241,088 | |||||||||||||||
|
|
|
|
|
|
|
|
|
|
|
|||||||||||
| Operating Expenses |
||||||||||||||||||||
| Losses and loss adjustment expenses |
165,629 | 124,667 | 87,224 | 79,468 | 65,123 | |||||||||||||||
| Policy acquisition and other underwriting expenses |
39,663 | 42,642 | 41,984 | 37,952 | 31,619 | |||||||||||||||
| General and administrative personnel expenses* |
25,127 | 26,200 | 28,276 | 26,960 | 21,808 | |||||||||||||||
| Interest expense |
16,767 | 11,079 | 10,754 | 10,453 | 3,607 | |||||||||||||||
| Loss on repurchases of senior notes |
743 | — | — | — | — | |||||||||||||||
| Impairment losses |
38 | 388 | — | — | — | |||||||||||||||
| Other operating expenses |
12,063 | 12,614 | 11,522 | 10,313 | 12,478 | |||||||||||||||
|
|
|
|
|
|
|
|
|
|
|
|||||||||||
| Total operating expenses |
260,030 | 217,590 | 179,760 | 165,146 | 134,635 | |||||||||||||||
|
|
|
|
|
|
|
|
|
|
|
|||||||||||
| (Loss) income before income taxes |
(15,624 | ) | 46,856 | 106,192 | 100,962 | 106,453 | ||||||||||||||
| Income tax (benefit) expense |
(8,731 | ) | 17,835 | 40,331 | 38,298 | 40,891 | ||||||||||||||
|
|
|
|
|
|
|
|
|
|
|
|||||||||||
| Net (loss) income |
$ | (6,893 | ) | $ | 29,021 | $ | 65,861 | $ | 62,664 | $ | 65,562 | |||||||||
| Preferred stock dividends |
— | — | — | 4 | (104 | ) | ||||||||||||||
|
|
|
|
|
|
|
|
|
|
|
|||||||||||
| (Loss) income available to common stockholders |
$ | (6,893 | ) | $ | 29,021 | $ | 65,861 | $ | 62,668 | $ | 65,458 | |||||||||
|
|
|
|
|
|
|
|
|
|
|
|||||||||||
| * | For the years ended December 31, 2016, 2015, 2014 and 2013, we reclassified certain payroll-related costs such as share-based compensation expense, payroll taxes and employee benefits previously reported in other operating expenses to general and administrative personnel expenses to conform with our 2017 presentation. |
36
Table of Contents
37
Table of Contents
ITEM 7 – Management’s Discussion and Analysis of Financial Condition and Results of Operations
The following discussion should be read in conjunction with our consolidated financial statements and related notes included elsewhere in this annual report on Form 10-K.
Forward-Looking Statements
In addition to historical information, this annual report on Form 10-K contains forward-looking statements as defined under federal securities laws. Such statements, including statements about our plans, objectives, expectations, assumptions or future events, involve risks and uncertainties. These statements involve estimates, assumptions, known and unknown risks, uncertainties and other factors that could cause actual results to differ materially from any future results, performances or achievements expressed or implied by the forward-looking statements. Typically, forward-looking statements can be identified by terminology such as “anticipate,” “estimate,” “plan,” “project,” “continuing,” “ongoing,” “expect,” “believe,” “intend,” “may,” “will,” “should,” “could,” and similar expressions. The important factors that could cause actual results to differ materially from those indicated by such forward-looking statements include but are not limited to the effect of governmental regulation; changes in insurance regulations; the frequency and extent of claims; uncertainties inherent in reserve estimates; catastrophic events; changes in the demand for, pricing of, availability of or collectability of reinsurance; restrictions on our ability to change premium rates; increased rate pressure on premiums; and other risks and uncertainties and other factors listed under Item 1A—“Risk Factors” and elsewhere in this annual report on Form 10-K and in our other Securities and Exchange Commission filings.
OVERVIEW
General
HCI Group, Inc. is a Florida-based company which through its subsidiaries is engaged in a variety of business activities, including property and casualty insurance, reinsurance, real estate and information technology. Its principal business is property and casualty insurance.
Based on our organizational structure, revenue sources, and evaluation of financial and operating performances by management, we manage four operating divisions, which includes the following operations:
| a) | Insurance Operations |
| • | Property and casualty insurance |
| • | Reinsurance |
| b) | Other Operations |
| • | Real estate |
| • | Information technology |
38
Table of Contents
We began insurance operations in 2007 by participating in a “take-out program” which is a legislatively mandated program designed to encourage private companies to assume policies from Citizens, a Florida state sponsored insurance carrier. Our growth since inception has resulted primarily from a series of policy assumptions from Citizens and policies assumed from one Florida insurance company. This growth track was beneficial to us in terms of reduced policy acquisition costs and, depending on the timing of the transaction, temporarily lower reinsurance costs.
Our general operating and growth strategies are to continually optimize our existing book of insurance business, manage our costs and expenses, diversify our business operations, develop and deploy new technologies to streamline operational processes, and maintain a strong balance sheet so we can quickly pursue accretive opportunities when they arise.
Recent Developments
On December 22, 2017, the Tax Cuts and Jobs Act (the “2017 Tax Act”) was passed and signed into law. Significant changes in the 2017 Tax Act affecting us include the reduction of the federal corporate tax rate from 35% to 21% for tax years beginning after December 31, 2017 and a limitation on the consolidated basis of the carryback as well as the carryforward of net operating losses (“NOL”) arising after December 31, 2017. In addition, the 2017 Tax Act eliminates the deductibility exception for performance-based executive compensation and expands the definition of covered executives to include the chief financial officer. Under U.S. GAAP, the tax effects of changes in tax laws or rates need to be recognized in the period in which the law is enacted. Because the enactment of the 2017 Tax Act was close to the end of the fiscal year, measurement of certain income tax effects relied on estimates that we believed to be reasonable. Deviation from these estimates may arise as relevant information becomes available and, as a result, we may recognize material adjustments to income tax expense during 2018. See Note 17 — “Income Taxes” to our consolidated financial statements under Item 8 of this Annual Report on Form 10-K.
On January 15, 2018, our Board of Directors declared a quarterly dividend of $0.35 per common share. The dividends are to be paid March 16, 2018 to stockholders of record on February 16, 2018.
On January 26, 2018, we entered into an agreement to lease office space at a new location in Miami Lakes, Florida for our claims related administration. The lease commenced on March 1, 2018 and has an initial term of approximately three years.
On February 8, 2018, we granted 40,000 shares of restricted stock and options to purchase 110,000 of our common shares at an exercise price of $40 per share to our chief executive officer, Paresh Patel. The options will expire on February 8, 2028. These share-based awards were granted pursuant to our 2012 Omnibus Incentive Plan and will vest in equal annual installments over four years, so long as Mr. Patel remains employed by us. The grant date fair values of the restricted stock and options were approximately $1,397,000 and $939,000, respectively.
On February 20, 2018, we entered into a subscription agreement with another limited partnership and committed to provide $5,000,000 of capital for investment. The capital is callable at the discretion of the general partner during a commitment period.
39
Table of Contents
RESULTS OF OPERATIONS
Comparison of the Year Ended December 31, 2017 with the Year Ended December 31, 2016
Our results of operations for the year ended December 31, 2017 reflect net loss of $6,893,000, or $0.75 loss per common share, compared with net income of $29,021,000, or $2.92 earnings per diluted common share, for the year ended December 31, 2016. The year-over-year decline was primarily attributable to a $40,962,000 increase in losses and loss adjustment expenses primarily from Hurricane Irma, a decrease in gross premiums earned of $20,425,000 and an increase in interest expense of $5,688,000 resulting from the issuance of long-term debt in March 2017. These factors contributed to $15,624,000 pre-tax operating losses in 2017 and, as a result, we recognized $8,731,000 of income tax benefit, the amount of which included net positive tax effects of approximately $1,400,000 due to the 2017 Tax Act.
Revenue
Gross Premiums Earned for the years ended December 31, 2017 and 2016 were approximately $358,253,000 and $378,678,000, respectively. The decrease in 2017 was primarily attributable to policy attrition as well as a rate decrease effective on new and renewal policies beginning in January 2016.
Premiums Ceded for the years ended December 31, 2017 and 2016 were approximately $133,635,000 and $135,051,000, respectively, representing 37.3% and 35.7%, respectively, of gross premiums earned. The percentage increase from 2016 was primarily attributable to adjustments related to retrospective provisions under certain reinsurance contracts due to losses incurred by Hurricane Irma. The increase was offset in part by lower reinsurance costs during the first five months of 2017 as compared with the corresponding period in 2016.
Our premiums ceded represent costs of reinsurance to cover losses from catastrophes that exceed the retention levels defined by our catastrophe excess of loss reinsurance contracts or to assume a proportional share of losses defined in a quota share arrangement. The rates we pay for reinsurance are based primarily on policy exposures reflected in gross premiums earned. For the year ended December 31, 2017, premiums ceded included a net increase of approximately $5,740,000 related to retrospective provisions. For the year ended December 31, 2016, premiums ceded reflect a net reduction of approximately $12,677,000. See “Economic Impact of Reinsurance Contracts with Retrospective Provisions” under “Critical Accounting Policies and Estimates.”
Net Premiums Written for the years ended December 31, 2017 and 2016 totaled approximately $213,711,000 and $232,140,000, respectively. Net premiums written represent the premiums charged on policies issued during a fiscal period less any applicable reinsurance costs. We had approximately 139,000 policies in force at December 31, 2017 as compared with approximately 150,000 policies in force at December 31, 2016.
Net Premiums Earned for the years ended December 31, 2017 and 2016 were approximately $224,618,000 and $243,627,000, respectively, and reflect the gross premiums earned less reinsurance costs as described above.
40
Table of Contents
The following is a reconciliation of our Net Premiums Written to Net Premiums Earned for the years ended December 31, 2017 and 2016 (amounts in thousands):
| Years Ended December 31, |
||||||||
| 2017 | 2016 | |||||||
| Net Premiums Written |
$ | 213,711 | $ | 232,140 | ||||
| Decrease in Unearned Premiums* |
10,907 | 11,487 | ||||||
|
|
|
|
|
|||||
| Net Premiums Earned |
$ | 224,618 | $ | 243,627 | ||||
|
|
|
|
|
|||||
| * | Unearned premiums are impacted by the timing and size of any takeout completed during the year net of attrition. |
Net Investment Income for the years ended December 31, 2017 and 2016 was approximately $11,439,000 and $9,087,000, respectively. The increase in 2017 was primarily due to year-over-year increases in income from limited partnership investments and fixed-maturity securities. See Note 4 — “Investments” under Net Investment Income to our consolidated financial statements under Item 8 of this Annual Report on Form 10-K.
Net Realized Investment Gains for the years ended December 31, 2017 and 2016 were approximately $4,346,000 and $2,601,000, respectively. The gains in 2017 resulted primarily from sales intended to take advantage of an upturn in the security market.
Net Other-Than-Temporary Impairment Losses for the years ended December 31, 2017 and 2016 were approximately $1,467,000 and $2,482,000, respectively. During 2017, we recognized impairment losses specific to four fixed-maturity securities and six equity securities. Three of these fixed-maturity securities were written down before being sold. Six equity securities were impaired because each of them had been in an unrealized loss position for a length of time with no near term prospect for recovery.
Expenses
Our Losses and Loss Adjustment Expenses amounted to approximately $165,629,000 and $124,667,000 for the years ended December 31, 2017 and 2016, respectively. Our 2017 losses and loss adjustment expenses included approximately $54,000,000 of net losses related to Hurricane Irma and additional losses of approximately $2,500,000 related to Hurricane Matthew. In addition, our losses and loss adjustment expenses included approximately $16,200,000 of additional losses, which reflected the continuation of reserve strengthening in response to trends involving assignment of insurance benefits and related litigation. Our losses and loss adjustment expenses were also impacted by weather-related events. See “Reserves for Losses and Loss Adjustment Expenses” under “Critical Accounting Policies and Estimates.”
Policy Acquisition and Other Underwriting Expenses for the years ended December 31, 2017 and 2016 were approximately $39,663,000 and $42,642,000, respectively. The decrease from 2016 was primarily attributable to decreased commissions and premium taxes resulting from policy attrition and the effect of the rate decrease.
41
Table of Contents
General and Administrative Personnel Expenses for the years ended December 31, 2017 and 2016 were approximately $25,127,000 and $26,200,000, respectively. The $1,073,000 decrease in 2017 was primarily attributable to the capitalization of payroll costs related to a software development project for internal use.
Loss on repurchases of Senior Notes for the year ended December 31, 2017 was approximately $743,000, resulting from the early extinguishment of our 8% Senior Notes. See Note 13 — “Long-Term Debt” under 8% Senior Notes to our consolidated financial statements under Item 8 of this Annual Report on Form 10-K.
Income Tax Benefit for the year ended December 31, 2017 was approximately $8,731,000 versus approximately $17,835,000 of income tax expense for the year ended December 31, 2016, resulting in an effective tax rate of 55.9% for 2017 and 38.1% for 2016. The year-over-year change was primarily attributable to our 2017 operating losses and the recognition of $1,400,000 in beneficial tax effects on our net deferred tax liabilities due to the lower future corporate income tax rates enacted by the 2017 Tax Act.
Ratios:
The loss ratio applicable to the year ended December 31, 2017 (losses and loss adjustment expenses incurred related to net premiums earned) was 73.8% compared with 51.2% for the year ended December 31, 2016. The increase was primarily attributable to losses related to Hurricane Irma combined with the decrease in net premiums earned which was driven in large part by the increase in ceded premiums due to the aforementioned adjustments.
The expense ratio applicable to the year ended December 31, 2017 (defined as underwriting expenses, general and administrative personnel expenses, interest and other operating expenses related to net premiums earned) was 42.0% compared with 38.1% for the year ended December 31, 2016. The increase in our 2017 expense ratio was primarily attributable to the decrease in 2017 net premiums earned, an increase in interest expense, and the loss on repurchases of our senior notes, as described above.
The combined ratio (total of all expenses in relation to net premiums earned) is the measure of overall underwriting profitability before other income. Our combined ratio for the year ended December 31, 2017 was 115.8% compared with 89.3% for the year ended December 31, 2016. Our combined ratio was negatively impacted by increased expenses for losses and loss adjustment expenses, increased interest expense, the loss on repurchases of our senior notes and a reduction in 2017 net premiums earned.
Due to the impact our reinsurance costs have on net premiums earned from period to period, our management believes the combined ratio measured to gross premiums earned is more relevant in assessing overall performance. The combined ratio to gross premiums earned for the year ended December 31, 2017 was 72.6% compared with 57.5% for the year ended December 31, 2016. The increase in 2017 was primarily attributable to the factors described above.
42
Table of Contents
Comparison of the Year Ended December 31, 2016 with the Year Ended December 31, 2015
Our results of operations for the year ended December 31, 2016 reflect income available to common stockholders of $29,021,000, or $2.92 earnings per diluted common share, compared with income available to common stockholders of $65,861,000, or $5.90 earnings per diluted common share, for the year ended December 31, 2015. The year over year decline in our income available to stockholders was primarily attributable to a $44,442,000 decrease in gross premiums earned, and a $37,443,000 increase in losses and loss adjustment expenses. These factors contributed to a $59,336,000 decrease in pre-tax income and, as a result, our income tax expense decreased $22,496,000 year over year.
Revenue
Gross Premiums Earned for the years ended December 31, 2016 and 2015 were approximately $378,678,000 and $423,120,000, respectively. The decrease in 2016 was primarily attributable to policy attrition as well as a rate decrease effective on new and renewal policies beginning in January 2016.
Premiums Ceded for the years ended December 31, 2016 and 2015 were approximately $135,051,000 and $140,614,000, respectively, representing 35.7% and 33.2%, respectively, of gross premiums earned. The $5,563,000 decrease was primarily attributable to the lower costs of our 2016/17 reinsurance program, which began June 1, 2016, as compared with the costs of the 2015/16 program that began June 1, 2015. In addition, the reduction to our ceded premiums attributable to retrospective provisions under certain reinsurance contracts for calendar year 2016 was lower by approximately $5,645,000 as compared with calendar year 2015.
Our reinsurance program for 2016/17 provides coverage, which according to catastrophe models approved by the FLOIR, is sufficient to cover the probable maximum loss resulting from a 1 in 165 year event. Our reinsurance program for 2015/16 provided coverage for a probable maximum loss resulting from a 1 in 260 year event. As a result of our program and pricing changes, we expect our reinsurance costs for the 2016/17 program year to be approximately $48,000,000 below the cost for 2015/16.
Our premiums ceded represent costs of reinsurance to cover losses from catastrophes that exceed the retention levels defined by our catastrophe excess of loss reinsurance treaties and to assume a proportional share of losses defined in one quota share arrangement, which was cancelled effective May 31, 2016. For the years ended December 31, 2016 and 2015, premiums ceded reflect net reductions of $12,677,000 and $18,322,000, respectively, related to provisions under certain multi-year catastrophe reinsurance contracts. See “Economic Impact of Reinsurance Contracts with Retrospective Provisions” under “Critical Accounting Policies and Estimates.” The rates we pay for reinsurance are based primarily on policy exposures reflected in gross premiums earned.
Net Premiums Written for the years ended December 31, 2016 and 2015 totaled approximately $232,140,000 and $255,724,000, respectively. Net premiums written represent the premiums charged on policies issued during a fiscal period less any applicable reinsurance costs. We had approximately 150,000 policies in force at December 31, 2016 as compared with approximately 160,000 policies in force at December 31, 2015.
43
Table of Contents
Net Premiums Earned for the years ended December 31, 2016 and 2015 were approximately $243,627,000 and $282,506,000, respectively, and reflect the gross premiums earned less reinsurance costs as described above.
The following is a reconciliation of our Net Premiums Written to Net Premiums Earned for the years ended December 31, 2016 and 2015 (amounts in thousands):
| Years Ended December 31, |
||||||||
| 2016 | 2015 | |||||||
| Net Premiums Written |
$ | 232,140 | $ | 255,724 | ||||
| Decrease in Unearned Premiums* |
11,487 | 26,782 | ||||||
|
|
|
|
|
|||||
| Net Premiums Earned |
$ | 243,627 | $ | 282,506 | ||||
|
|
|
|
|
|||||
| * | Unearned premiums are impacted by the timing and size of any takeout completed during the year net of attrition. |
Net Investment Income for the years ended December 31, 2016 and 2015 was approximately $9,087,000 and $3,978,000, respectively. The increase in 2016 was primarily due to $1,207,000 of income from limited partnership investments in 2016 versus losses of $3,244,000 in 2015. See Note 4 — “Investments” under Net Investment Income to our consolidated financial statements under Item 8 of this Annual Report on Form 10-K.
Net Realized Investment Gains for the year ended December 31, 2016 were approximately $2,601,000 as compared with $608,000 of net realized investment losses for the year ended December 31, 2015. The losses in 2015 resulted primarily from sales intended to rebalance the mix of our investment portfolio to meet our long-term investment goals and strategies.
Net Other-Than-Temporary Impairment Losses for the years ended December 31, 2016 and 2015 were approximately $2,482,000 and $4,681,000, respectively. During 2016, we recognized impairment losses specific to four fixed-maturity securities, three of which were subject to credit loss impairment, and 17 equity securities. Three fixed-maturity securities were subject to credit related loss impairments resulting from our analysis of their expected cash flows. Seventeen equity securities were impaired because each of them had been in an unrealized loss position for a length of time with no near term prospect for recovery.
Policy Fee Income for the years ended December 31, 2016 and 2015 was approximately $3,914,000 and $3,496,000, respectively. Beginning in March 2015, we have used actual policy cancellations in our calculation of policy fee income whereas estimated attrition rates were used in this calculation prior to March 2015. In addition, the unearned portion of nonrefundable policy fee income was fully recognized for policies that were cancelled during 2016. As a result, our 2016 policy fee income was higher than in 2015 despite the decline in gross premiums earned.
44
Table of Contents
Expenses
Our Losses and Loss Adjustment Expenses amounted to approximately $124,667,000 and $87,224,000, respectively, for the years ended December 31, 2016 and 2015. Our 2016 losses and loss adjustment expenses were impacted by weather-related events in both years and two hurricanes, Hermine and Matthew, in 2016. Hurricane Matthew accounted for approximately $21,000,000 of our 2016 losses. In addition, trends involving assignment of insurance benefits and related litigation has caused us to continue strengthening our loss reserves. See “Reserves for Losses and Loss Adjustment Expenses” under “Critical Accounting Policies and Estimates.”
Policy Acquisition and Other Underwriting Expenses for the years ended December 31, 2016 and 2015 of approximately $42,642,000 and $41,984,000, respectively, primarily reflect commissions and premium taxes related to the policies that have renewed.
General and Administrative Personnel Expenses for the years ended December 31, 2016 and 2015 were approximately $26,200,000 and $28,276,000, respectively. The $2,076,000 decrease in 2016 was primarily attributable to a decrease in discretionary incentive pay in 2016. The level of discretionary incentive pay in 2016 was influenced in large part by our financial results for the year, which were negatively impacted by Hurricane Matthew in the fourth quarter of 2016. The decrease was offset in part by increased payroll costs resulting from our growing workforce.
Impairment loss for the year ended December 31, 2016 was approximately $388,000. The loss resulted from the write-down of lease intangibles and other assets associated with the unexpected closure of one tenant’s business at one of our retail shopping centers.
Income Tax Expense for the years ended December 31, 2016 and 2015 was approximately $17,835,000 and $40,331,000, respectively, for state, federal and foreign income taxes resulting in an effective tax rate of 38.1% for 2016 and 38.0% for 2015.
Ratios:
The loss ratio applicable to the year ended December 31, 2016 was 51.2% compared with 30.9% for the year ended December 31, 2015. The increase was primarily attributable to losses in October 2016 from Hurricane Matthew as well as reserve strengthening throughout 2016.
The expense ratio applicable to the year ended December 31, 2016 was 38.1% compared with 32.7% for the year ended December 31, 2015. The increase in our expense ratio was primarily attributable to the decrease in 2016 net premiums earned.
Our combined ratio for the year ended December 31, 2016 was 89.3% compared with 63.6% for the year ended December 31, 2015. Our combined ratio was negatively impacted by increased expenses for losses and loss adjustment expenses and a reduction in 2016 net premiums earned.
45
Table of Contents
Due to the impact our reinsurance costs have on net premiums earned from period to period, our management believes the combined ratio measured to gross premiums earned is more relevant in assessing overall performance. The combined ratio to gross premiums earned for the year ended December 31, 2016 was 57.5% compared with 42.5% for the year ended December 31, 2015. The increase in 2016 was primarily attributable to the factors described above.
Seasonality of Our Business
Our insurance business is seasonal as hurricanes and tropical storms affecting Florida typically occur during the period from June 1 through November 30 each year. Also, with our reinsurance treaty year typically effective on June 1 each year, any variation in the cost of our reinsurance, whether due to changes in reinsurance rates or changes in the total insured value of our policy base, will occur and be reflected in our financial results beginning June 1 each year.
LIQUIDITY AND CAPITAL RESOURCES
Throughout our history, our liquidity requirements have been met through issuances of our common and preferred stock, debt offerings and funds from operations. We expect our future liquidity requirements will be met by funds from operations, primarily the cash received by insurance subsidiaries from premiums written and investment income. We may consider raising additional capital through debt and/or equity offerings to support our growth and future investment opportunities.
Our insurance subsidiaries require liquidity and adequate capital to meet ongoing obligations to policyholders and claimants and to fund operating expenses. In addition, we attempt to maintain adequate levels of liquidity and surplus to manage any differences between the duration of our liabilities and invested assets. In the insurance industry, cash collected for premiums from policies written is invested, interest and dividends are earned thereon, and losses and loss adjustment expenses are paid out over a period of years. This period of time varies by the circumstances surrounding each claim. Substantially all of our losses and loss adjustment expenses, excluding litigated claims, are fully settled and paid within approximately 100 days of the claim receipt date. Additional cash outflow occurs through payments of underwriting costs such as commissions, taxes, payroll, and general overhead expenses.
We believe that we maintain sufficient liquidity to pay claims and expenses, as well as to satisfy commitments in the event of unforeseen events such as reinsurer insolvencies, inadequate premium rates, or reserve deficiencies. We maintain a comprehensive reinsurance program at levels management considers adequate to diversify risk and safeguard our financial position.
In the future, we anticipate our primary use of funds will be to pay claims, reinsurance premiums, interest, and dividends and to fund operating expenses. In addition, we intend to continue investing in real estate to maximize returns and diversify our sources of income, pursue acquisition opportunities, or consider other strategic opportunities.
46
Table of Contents
Senior Notes and Promissory Notes
The following table summarizes our principal and interest payment obligations for long-term debt at December 31, 2017:
| Maturity Date |
Interest Payment Due Date | |||
| 3.875% Convertible Senior Notes |
March 2019 | March 15 and September 15 | ||
| 4.25% Convertible Senior Notes |
March 2037 | March 1 and September 1 | ||
| 4% Promissory Note |
Through February 2031 | 1st day of each month | ||
| 3.75% Callable Promissory Note |
Through September 2036 | 1st day of each month | ||
| 3.95% Promissory Note |
Through February 2020 | 17th of each month |
See Note 13 — “Long-Term Debt” to our consolidated financial statements under Item 8 of this Annual Report on Form 10-K.
Share Repurchase Plan
In December 2017, our Board of Directors approved a one-year plan for 2018 under which we may purchase up to $20,000,000 of our common shares in open market purchases, block transactions and privately negotiated transactions in accordance with applicable federal securities laws. The approved amount excludes brokerage fees. See Note 19 — “Stockholders’ Equity” to our consolidated financial statements under Item 8 of this Annual Report on Form 10-K.
Limited Partnership Investments
Our limited partnership investments consist of four private equity funds managed by their general partners. These funds have unexpired capital commitments which are callable at the discretion of the fund’s general partner for funding new investments or expenses of the fund. At December 31, 2017, there was an aggregate unfunded capital balance of $14,328,000. See Limited Partnership Investments under Note 4 — “Investment” to our consolidated financial statements under Item 8 of this Annual Report on Form 10-K.
Real Estate Acquisition
We currently have a 90% equity interest in FMKT Mel JV, LLC, a Florida limited liability company for which we are not the primary beneficiary. FMKT Mel JV’s real estate portfolio consists of outparcels for ground lease or sale, the values of which have increased since the opening of an adjacent retail shopping center which we acquired in December 2016. We have the option to take full ownership of these outparcels by acquiring the remaining 10% interest. Alternatively, we may sell these outparcels and allocate the profits from the sale before liquidating FMKT Mel JV.
47
Table of Contents
Sources and Uses of Cash
Our cash flows from operating, investing and financing activities for the years ended December 31, 2017, 2016 and 2015 are summarized below.
Cash Flows for the Year ended December 31, 2017
Net cash provided by operating activities for the year ended December 31, 2017 was approximately $16,426,000, which consisted primarily of cash received from net premiums written and reinsurance recoveries less cash disbursed for operating expenses, losses and loss adjustment expenses and interest payments. Net cash used in investing activities of $80,164,000 was primarily due to the purchases of available-for-sale and trading securities of $165,196,000, the limited partnership investments of $4,226,000, and the real estate investments of $11,878,000, offset by the proceeds from sales of available-for-sale securities of $74,416,000, the distributions of $11,758,000 from limited partnership investments and the redemptions and repayments of fixed-maturity securities of $14,897,000. Net cash provided by financing activities totaled $39,030,000, which was primarily due to the proceeds from issuance of 4.25% Convertible Senior Notes of $143,750,000, offset by $40,250,000 used in the repurchases of our 8% senior notes, $4,975,000 of related underwriting and issuance costs, $45,872,000 used in our share repurchases and $12,833,000 of net cash dividend payments.
Cash Flows for the Year ended December 31, 2016
Net cash provided by operating activities for the year ended December 31, 2016 was approximately $87,975,000, which consisted primarily of cash received from net premiums written less cash disbursed for operating expenses, losses and loss adjustment expenses and interest payments. Net cash used in investing activities of $49,028,000 was primarily due to the purchases of available-for-sale securities of $107,964,000, $12,056,000 of net cash used in acquiring one business, and the limited partnership investments of $4,670,000, offset by the proceeds from sales of available-for-sale securities of $63,581,000 and the $10,200,000 proceeds from the acquisition, development and construction arrangement. Net cash used in financing activities totaled $26,157,000, which was primarily due to $11,347,000 used in the repurchases of our convertible senior notes, $20,026,000 used in our share repurchase plan and $11,691,000 of net cash dividend payments, offset by $18,200,000 in aggregate proceeds from the issuance of two promissory notes.
Cash Flows for the Year ended December 31, 2015
Net cash provided by operating activities for the year ended December 31, 2015 was approximately $45,282,000, which consisted primarily of cash received from net premiums written less cash disbursed for operating expenses, losses and loss adjustment expenses and interest payments. Net cash used in investing activities of $80,374,000 was primarily due to the funding of the limited partnership investments of $24,636,000, the purchases of available-for-sale securities of $131,379,000, the funding of the acquisition, development and construction arrangement of $6,968,000, and $4,871,000 used to purchase real estate investments, decreased by redemptions and repayments of fixed-maturity securities of $9,344,000, and the proceeds from sales of available-for-sale
48
Table of Contents
securities of $79,406,000. Net cash used in financing activities totaled $11,525,000, which was primarily due to $1,610,000 used in our share repurchase plan and $11,681,000 of net cash dividend payments, offset by $2,295,000 of tax benefits on stock-based compensation.
Investments
The main objective of our investment policy is to maximize our after-tax investment income with a reasonable level of risk given the current financial market. Our excess cash is invested primarily in money market accounts and available-for-sale investments.
At December 31, 2017, we had $297,440,000 of available-for-sale and trading investments, which are carried at fair value. Changes in the general interest rate environment affect the returns available on new fixed-maturity investments. While a rising interest rate environment enhances the returns available on new investments, it reduces the market value of existing fixed-maturity investments and thus the availability of gains on disposition. A decline in interest rates reduces the returns available on new fixed-maturity investments but increases the market value of existing fixed-maturity investments, creating the opportunity for realized investment gains on disposition.
With the exception of large national banks, it is our current policy not to maintain cash deposits of more than an aggregate of $10,000,000 in any one bank at any time. From time to time, we may have in excess of $10,000,000 of cash designated for investment and on deposit at a single national brokerage firm. In the future, we may alter our investment policy as to investments in federal, state and municipal obligations, preferred and common equity securities and real estate mortgages, as permitted by applicable law, including insurance regulations.
OFF-BALANCE SHEET ARRANGEMENTS
As of December 31, 2017, we had unexpired capital commitments for four limited partnership in which we hold interests. Such commitments are not recognized in the financial statements but are required to be disclosed in the notes to the financial statements. See Note 22 — “Commitments and Contingencies” to our consolidated financial statements under Item 8 of this Annual Report on Form 10-K and Contractual Obligations and Commitments below for additional information.
49
Table of Contents
CONTRACTUAL OBLIGATIONS AND COMMITMENTS
The following table summarizes our material contractual obligations and commitments as of December 31, 2017 (amounts in thousands):
| Payment Due by Period | ||||||||||||||||||||
| Total | Less than 1 Year |
1-3 Years | 3-5 Years | More than 5 Years |
||||||||||||||||
| Operating lease (1) |
$ | 596 | 147 | 292 | 157 | — | ||||||||||||||
| Service agreement (1) |
105 | 24 | 53 | 28 | — | |||||||||||||||
| Reinsurance contracts (2) |
25,380 | 21,792 | 2,392 | 1,196 | — | |||||||||||||||
| Unfunded capital commitment (3) |
14,328 | 14,328 | — | — | — | |||||||||||||||
| Long-term debt obligations (4) |
300,129 | 12,163 | 116,665 | 155,828 | 15,473 | |||||||||||||||
|
|
|
|
|
|
|
|
|
|
|
|||||||||||
| Total |
$ | 340,538 | 48,454 | 119,402 | 157,209 | 15,473 | ||||||||||||||
|
|
|
|
|
|
|
|
|
|
|
|||||||||||
| (1) | Represents the lease for office space in Miami, Florida and the lease and maintenance service agreement for office space in Noida, India. Liabilities related to our India operations were converted from India Rupees to U.S. dollars using the January 2, 2018 exchange rate, the first available rate subsequent to December 31, 2017, which was a non-business day. |
| (2) | Represents the minimum payment of reinsurance premiums under multi-year reinsurance contracts. Reinsurance premiums payable after December 31, 2017 under one contract are estimated and subject to subsequent revision as the premiums are determined on a quarterly basis based on the premiums associated with the applicable flood total insured value on the last day of the preceding quarter. |
| (3) | Represents the unfunded balance of capital commitments under the subscription agreements related to four limited partnerships in which we hold interests. |
| (4) | Amounts represent principal and interest payments over the lives of various long-term debt obligations. See Note 13 — “Long-Term Debt” to our consolidated financial statements under Item 8 of this Annual Report on Form 10-K. |
CRITICAL ACCOUNTING POLICIES AND ESTIMATES
We have prepared our consolidated financial statements in accordance with accounting principles generally accepted in the United States of America (“U.S. GAAP”). The preparation of these consolidated financial statements requires us to make estimates and judgments to develop amounts reflected and disclosed in our financial statements. Material estimates that are particularly susceptible to significant change in the near term are related to our losses and loss adjustment expenses, which include amounts estimated for claims incurred but not yet reported. We base our estimates on various assumptions and actuarial data we believe to be reasonable under the circumstances. Actual results may differ materially from these estimates.
We believe our accounting policies specific to losses and loss adjustment expenses, reinsurance recoverable, reinsurance with retrospective provisions, deferred income taxes, and stock-based compensation expense involve our most significant judgments and estimates material to our consolidated financial statements.
Reserves for Losses and Loss Adjustment Expenses. We establish reserves for the estimated total unpaid costs of losses including loss adjustment expenses (LAE). Loss and LAE reserves reflect management’s best estimate of the total cost of (i) claims that have been incurred,
50
Table of Contents
but not yet paid in full, and (ii) claims that have been incurred but not yet reported to us (“IBNR”). Reserves established by us represent an estimate of the outcome of future events and, as such, cannot be considered an exact calculation of our liability. Rather, loss reserves represent, we believe, management’s best estimate of our company’s liability based on the application of actuarial techniques and other projection methodologies and taking into consideration other facts and circumstances known at the balance sheet date. The process of establishing loss reserves is complex and inherently imprecise, as it involves using judgment that is affected by many variables such as past loss experience, current claim trends and the prevailing social changes in our claims adjusting process, economic and legal environments. The impact of both internal and external variables on ultimate losses and LAE costs is difficult to estimate. Our exposure is impacted by both the risk characteristics of the physical locations where we write policies, such as hurricane and tropical storm-related risks, as well as risks associated with varying social, judicial and legislative characteristics in the locations in which we have exposure. In determining loss reserves, we give careful consideration to all available data and actuarial analyses.
Reserves represent estimates of the ultimate unpaid cost of all losses incurred, including losses for claims that have not yet been reported to our insurance companies. The amount of loss reserves for reported claims consist of case reserves established by our claims department (based on a case-by-case evaluation of the kind of risk involved, knowledge of the circumstances surrounding each claim and the insurance policy provisions relating to the type of loss) and bulk reserves for additional growth on carried case reserves on known claims established by senior management (based on historical patterns of development on aggregate claims grouped by loss date). The amounts of reserves for unreported claims and LAE (incurred but not reported claims, or IBNR) are determined using our historical information for each line of business adjusted to reflect current conditions. Inflation is ordinarily implicitly provided for in the reserving function through analysis of costs, trends and reviews of historical reserving results over multiple years.
Reserves are closely monitored and are recalculated periodically using the most recent information on reported claims and a variety of actuarial techniques. Specifically, claims management personnel complete weekly and ongoing reviews of existing case reserves, new claims, changes to existing case reserves, and paid losses with respect to the current and prior years. As we continue to expand historical data regarding paid and incurred losses, we use this data to develop expected ultimate loss and loss adjustment expense ratios. We then apply these expected loss and loss adjustment expense ratios to earned premium to derive a reserve level for each line of business. In connection with the determination of these reserves, we will also consider other specific factors such as recent weather-related losses, trends in historical reported and paid losses, and litigation and judicial trends regarding liability. Therefore, we use the loss ratio method, among other methods, to project an ultimate loss expectation, and then the related loss history must be regularly evaluated and loss expectations updated, with the possibility of variability from the initial estimate of ultimate losses.
When a claim is reported to us, our claims personnel establish a “case reserve” for the estimated amount of the ultimate amount payable to settle the claim. This estimate reflects an informed judgment based upon general insurance reserving practices and on the experience and knowledge of the claims adjuster. The individual estimating the reserve considers the nature and value of the specific claim, the severity of injury or damage, location, and the policy provisions relating to the type of loss. Case reserves are adjusted by us as more information becomes available. It is our policy to settle each claim as expeditiously as possible.
51
Table of Contents
We maintain IBNR reserves to provide for claims that have been incurred but have not been reported and subsequent development on reported claims. The IBNR reserve is determined by estimating our insurance company’s ultimate net liability for both reported and unreported claims and then subtracting the case reserves and payments made to date for reported claims.
Loss Reserve Estimation Methods. We apply the following general methods in projecting reserves for losses and LAE:
| • | Reported loss development; |
| • | Paid loss development; |
| • | Reported Bornhuetter-Ferguson method; |
| • | Paid Bornhuetter-Ferguson method; |
| • | Loss ratio method; and |
| • | Frequency-Severity method. |
Selected reserves are based on a review of the indications from these methods as well as other considerations such as emergence since the most recent evaluation and number of open claims for a given accident period.
Description of Ultimate Loss Estimation Methods. The reported loss development method relies on the assumption that, at any given state of maturity, ultimate losses can be reasonably predicted by multiplying cumulative reported losses (paid losses plus case reserves) by a cumulative development factor derived from development patterns observed in the historical reported data. The validity of the results of this method depends on the stability of claim reporting and settlement rates, as well as the consistency of case reserve levels. Case reserves do not have to be adequately stated for this method to be effective; they only need to have a fairly consistent level of adequacy for the historical experience that is considered. In order to derive loss development patterns that are predictive for our business, we compile and review loss development triangles of our experience on an accident quarter basis, and select loss development factors based on indications from this analysis of our data. We also consider industry data found in SNL Financial – Property/Casualty Insurance as a reasonability measure for these selected development patterns.
The paid loss development method is mechanically identical to the reported loss development method described above, but applied to loss payments only. The paid method does not rely on case reserves or claim reporting patterns in making projections.
The validity of the results from using a loss development approach can be affected by many conditions, such as internal claim department processing changes, a shift between single and multiple claim payments, legal changes, or variations in our mix of business from year to year. Also, since the percentage of losses paid for immature accident quarters is often low, development factors for these maturities can be volatile. A small variation in the number of claims paid can have a leveraging effect that can lead to significant distortions in estimated ultimate losses for these highly leveraged accident quarters. Therefore, ultimate values for immature accident quarters are often based on alternative estimation techniques than more mature accident quarters.
52
Table of Contents
The loss ratio method used by us relies on the assumption that remaining unreported losses are a function of the total expected losses rather than a function of currently reported losses. The expected loss ratio is multiplied by earned premium to produce ultimate losses. Reported incurred losses are then subtracted from this estimate to produce expected unreported losses.
The loss ratio method is most useful as an alternative to other models for immature loss years. For these immature years, the amounts reported or paid may be small and unstable, and therefore, not fully predictive of future development. Therefore, future development is assumed to follow an expected pattern that is supported by more stable historical data or by emerging trends. This method is also useful when variations in reporting or payment patterns distort the historical development of losses.
The paid and reported Bornhuetter-Ferguson methods are a weighting of the loss ratio method and the corresponding development method. Outstanding reserves or IBNR reserves are derived by applying the loss ratio estimate to the estimated unpaid or unreported percent of losses based on the development patterns from the development methods.
Finally, we employ the frequency/severity method for exposures that do not tend to follow historical payment and reported patterns, such as catastrophes. For such exposures, we estimate future development of reported claims and average severities on IBNR claims. We combine this estimate with our open claims in order to derive an estimate of expected unreported losses. Paid losses are added to this estimate in order to derive an estimate of ultimate losses. This method is based on the assumption that future unreported claims and the average severity of open claims and unreported claims can be reasonably estimated from the experience available.
While the property and casualty industry has incurred substantial aggregate losses from claims related to asbestos-related illnesses, environmental remediation, product and mold, and other uncertain or environmental exposures, we have not experienced significant losses from these types of claims. We have experienced material losses associated with sinkholes in past years, but the materiality of this hazard has decreased significantly since the passing of Florida Senate Bill 408. We continue to segregate this data in our derivation of estimated required reserves. While the losses we have experienced from exposures to catastrophes have not historically been material, we have experienced significant losses related to recent catastrophes. These losses have followed materially different development patterns than the balance of our experience. To address this situation, we separate this exposure from the remainder of the business and derive reserves specific to each catastrophe event. Total reserves are determined by adding the reserves related to each line of business.
Currently, our estimated ultimate liability is calculated monthly using the principles and procedures described above, which are applied to the lines of business written. However, because the establishment of loss reserves is an inherently uncertain process, we cannot be certain that ultimate losses will not exceed the established loss reserves and have a material, adverse effect on our results of operations and financial condition. Changes in estimates, or differences between estimates and amounts ultimately paid, are reflected in the operating results of the period during which such adjustments are made.
53
Table of Contents
Our reported results, financial position and liquidity would be affected by likely changes in key assumptions that determine our net loss reserves. Management does not believe that any reasonably likely changes in the frequency of claims would affect our loss reserves. However, management believes that a reasonably likely increase or decrease in the severity of claims could impact our net loss reserves. The table below summarizes the effect on net loss reserves and equity in the event of reasonably likely changes in the severity of claims considered in establishing loss and loss adjustment expense reserves. The range of reasonably likely changes in the severity of our claims was established based on a review of changes in loss year development and applied to loss reserves as a whole. The selected range of changes does not indicate what could be the potential best or worst case or likely scenarios:
| Year Ended December 31, 2017 |
||||||||
|
Change in Reserves |
Reserves | Percentage change in equity, net of tax |
||||||
| -20.0% |
158,862 | 12.58 | % | |||||
| -15.0% |
168,791 | 9.43 | % | |||||
| -10.0% |
178,720 | 6.29 | % | |||||
| -5.0% |
188,649 | 3.14 | % | |||||
| Base |
198,578 | — | ||||||
| 5.0% |
208,507 | - 3.14 | % | |||||
| 10.0% |
218,436 | - 6.29 | % | |||||
| 15.0% |
228,365 | - 9.43 | % | |||||
| 20.0% |
238,294 | - 12.58 | % | |||||
Reinsurance Recoverable. Our reinsurance recoverable balance represents an estimate of the amount of paid and unpaid losses and loss adjustment expenses that is recoverable from reinsurers. This estimate is determined in a manner consistent with the terms of the applicable reinsurance contracts and based on the ultimate losses and loss adjustment expenses we expect to incur. Given the uncertainty of the ultimate amounts of losses and loss adjustment expenses, the estimate may vary significantly from the eventual outcome.
Economic Impact of Reinsurance Contracts with Retrospective Provisions. Certain of our reinsurance contracts include retrospective provisions that adjust premiums, increase the amount of future coverage, or result in profit commissions in the event losses are minimal or zero. In accordance with U.S. GAAP, we will recognize an asset in the period in which the absence of loss experience gives rise to an increase in future coverage or obligates the reinsurer to pay cash or other consideration under the contract. In the event that a loss arises, we will derecognize such asset in the period in which a loss arises. Such adjustments to the asset, which accrue throughout the contract term, will negatively impact our operating results when a catastrophic loss event occurs during the contract term.
As described in Note 14 — “Reinsurance” to our consolidated financial statements under Item 8 of this Annual Report on Form 10-K, we adjusted the balances of accrued benefits and deferred reinsurance premiums during the third quarter of 2017 due to the impact of Hurricane Irma. For the year ended December 31, 2017, we derecognized $3,413,000 of net accrued benefits. We
54
Table of Contents
also recognized ceded premiums of $2,327,000, including the reversal of the majority of previously deferred reinsurance costs. In contrast, for the year ended December 31, 2016, we accrued benefits of $13,610,000 and recognized net ceded premiums of $933,000, representing amortization of $1,219,000 of previously deferred reinsurance costs for increased coverage offset by $2,152,000 of ceded premiums deferred for the period. In combination, for the year ended December 31, 2017, we recognized a net increase in ceded premiums of $5,740,000 as opposed to a net reduction in ceded premiums of $12,677,000 for the year ended December 31, 2016.
In June 2016, we received cash totaling $37,800,000 in connection with the benefits accrued under two retrospective reinsurance contracts that were terminated effective May 31, 2016. In September 2016, we received the final cash payment of $5,716,000 under the terms of the remaining retrospective reinsurance contract which terminated May 31, 2016. As of December 31, 2017, we had $2,393,000 of accrued benefits, the amount that would be charged to earnings in the event we experience a catastrophic loss that exceeds the coverage limits provided under such agreements and in the period that the increased coverage is applicable. As of December 31, 2016, we had $5,810,000 of accrued benefits and $2,152,000 of ceded premiums deferred related to these agreements.
We believe the credit risk associated with the collectability of these accrued benefits is minimal based on available information about the individual reinsurer’s financial position.
Income Taxes. We account for income taxes in accordance with U.S. GAAP, resulting in two components of income tax expense: current and deferred. Current income tax expense reflects taxes to be paid or refunded for the current period by applying the provisions of the enacted tax law to the taxable income or excess of deductions over revenues. We determine deferred income taxes using the liability (or balance sheet) method. Under this method, the net deferred tax asset or liability is based on the tax effects of the differences between the book and tax bases of assets and liabilities, and enacted changes in tax rates and laws are recognized in the period in which they occur. Valuation allowances are provided against assets that are not likely to be realized, if any. We have elected to classify the related interest and penalties, if any, as income tax expense as permitted by current accounting standards.
Stock-Based Compensation. We account for stock-based compensation awards under our shareholder approved incentive plans in accordance with the fair value recognition provisions of U.S. GAAP, which require the measurement, and recognition of compensation for all stock-based awards made to employees and non-employee directors including stock options and restricted stock issuances based on estimated fair values. We recognize stock-based compensation in the consolidated statements of income on a straight-line basis over the vesting period. We use the Black-Scholes option-pricing model, which requires the following variables for input to calculate the fair value of each stock award on the option grant date: 1) expected volatility of our stock price, 2) the risk-free interest rate, 3) expected term of each award, 4) expected dividends, and 5) an expected forfeiture rate. For restricted stock awards with market-based conditions, we estimate their fair values by using a Monte Carlo simulation model, which requires the following variables for input: 1) expected dividends per share, 2) expected volatility, 3) risk-free interest rate, 4) estimated cost of capital, and 5) expected term of each award.
55
Table of Contents
ITEM 7A – Quantitative and Qualitative Disclosures About Market Risk
Our investment portfolio at December 31, 2017 included fixed-maturity and equity securities, the primary purposes of which are for value preservation. Our main objective is to maximize after-tax investment income and maintain sufficient liquidity to meet our obligations while minimizing market risk, which is the potential economic loss from adverse fluctuations in securities prices. We consider many factors including credit ratings, investment concentrations, regulatory requirements, anticipated fluctuation of interest rates, durations and market conditions in developing investment strategies. Our investment securities are managed primarily by outside investment advisors and are overseen by the investment committee appointed by our board of directors.
Our investment portfolios are exposed to interest rate risk, credit risk and equity price risk. Fiscal and economic uncertainties caused by any government action or inaction may exacerbate these risks and potentially have adverse impacts on the value of our investment portfolios.
We classify fixed-maturity securities and the majority of equity securities as available-for-sale and report any unrealized gains or losses, net of deferred income taxes, as a component of other comprehensive income within our stockholders’ equity. As such, any material temporary changes in their fair value can adversely impact the carrying value of our stockholders’ equity.
Interest Rate Risk
Our fixed-maturity securities are sensitive to potential losses resulting from unfavorable changes in interest rates. We manage the risk by analyzing anticipated movement in interest rates and considering our future capital needs.
The following table illustrates the impact of hypothetical changes in interest rates to the fair value of our fixed-maturity securities at December 31, 2017 (amounts in thousands):
| Hypothetical Change in Interest Rates |
Estimated Fair Value |
Change in Estimated Fair Value |
Percentage Increase (Decrease) in Estimated Fair Value |
|||||||||
| 300 basis point increase |
$ | 215,625 | $ | (21,860 | ) | (9.20 | )% | |||||
| 200 basis point increase |
222,908 | (14,577 | ) | (6.14 | )% | |||||||
| 100 basis point increase |
230,195 | (7,290 | ) | (3.07 | )% | |||||||
| 100 basis point decrease |
244,778 | 7,293 | 3.07 | % | ||||||||
| 200 basis point decrease |
251,945 | 14,460 | 6.09 | % | ||||||||
| 300 basis point decrease |
256,229 | 18,744 | 7.89 | % | ||||||||
Credit Risk
Credit risk can expose us to potential losses arising principally from adverse changes in the financial condition of the issuers of our fixed-maturity securities. We mitigate the risk by investing in fixed-maturity securities that are generally investment grade, by diversifying our investment
56
Table of Contents
portfolio to avoid concentrations in any single issuer or business sector, and by continually monitoring each individual security for declines in credit quality. While we emphasize credit quality in our investment selection process, significant downturns in the markets or general economy may impact the credit quality of our portfolio.
The following table presents the composition of our fixed-maturity securities, by rating, at December 31, 2017 (amounts in thousands):
| Comparable Rating |
Amortized Cost |
% of Total Amortized Cost |
Estimated Fair Value |
% of Total Estimated Fair Value |
||||||||||||
| AAA |
$ | 2,520 | 1 | $ | 2,514 | 1 | ||||||||||
| AA+, AA, AA- |
67,387 | 29 | 67,514 | 29 | ||||||||||||
| A+, A, A- |
95,178 | 40 | 95,346 | 40 | ||||||||||||
| BBB+, BBB, BBB- |
57,320 | 24 | 58,561 | 25 | ||||||||||||
| BB+, BB, BB- |
4,466 | 2 | 4,625 | 2 | ||||||||||||
| B+, B, B- |
3,117 | 1 | 3,211 | 1 | ||||||||||||
| CCC+, CC and Not rated |
5,842 | 3 | 5,713 | 2 | ||||||||||||
|
|
|
|
|
|
|
|
|
|||||||||
| Total |
$ | 235,830 | 100 | $ | 237,484 | 100 | ||||||||||
|
|
|
|
|
|
|
|
|
|||||||||
Equity Price Risk
Our equity investment portfolio at December 31, 2017 included common stocks, perpetual preferred stocks, mutual funds and exchange traded funds. We may incur potential losses due to declines in equity security prices. We manage the risk primarily through industry and issuer diversification and asset mix.
The following table illustrates the composition of our equity securities at December 31, 2017 (amounts in thousands):
| Estimated Fair Value |
% of Total Estimated Fair Value |
|||||||
| Stocks by sector: |
||||||||
| Financial |
$ | 25,194 | 42 | |||||
| Industrial |
6,385 | 11 | ||||||
| Consumer |
6,216 | 10 | ||||||
| Other (1) |
7,959 | 14 | ||||||
|
|
|
|
|
|||||
| 45,754 | 77 | |||||||
|
|
|
|
|
|||||
| Mutual funds and Exchange traded funds by type: |
||||||||
| Debt |
12,173 | 20 | ||||||
| Equity |
2,029 | 3 | ||||||
|
|
|
|
|
|||||
| 14,202 | 23 | |||||||
|
|
|
|
|
|||||
| Total |
$ | 59,956 | 100 | |||||
|
|
|
|
|
|||||
| (1) | Represents an aggregate of less than 5% sectors. |
Foreign Currency Exchange Risk
At December 31, 2017, we did not have any material exposure to foreign currency related risk.
57
Table of Contents
ITEM 8 – Financial Statements and Supplementary Data
58
Table of Contents
Report of Independent Registered Public Accounting Firm
To the Board of Directors and Stockholders of
HCI Group, Inc. and Subsidiaries:
Opinion on the Financial Statements
We have audited the accompanying consolidated balance sheets of HCI Group, Inc. and Subsidiaries (the Company) as of December 31, 2017 and 2016, the related consolidated statements of income, comprehensive (loss) income, stockholders’ equity, and cash flows for each of the three years in the period ended December 31, 2017, and the related notes (collectively referred to as the financial statements). In our opinion, the financial statements present fairly, in all material respects, the financial position of the Company as of December 31, 2017 and 2016, and the results of its operations and its cash flows for each of the three years in the period ended December 31, 2017, in conformity with accounting principles generally accepted in the United States of America.
We also have audited, in accordance with the standards of the Public Company Accounting Oversight Board (United States) (PCAOB), the Company’s internal control over financial reporting as of December 31, 2017, based on criteria established in Internal Control—Integrated Framework (2013) issued by the Committee of Sponsoring Organizations of the Treadway Commission (COSO), and our report dated March 7, 2018 expressed an unqualified opinion.
Basis for Opinion
These financial statements are the responsibility of the Company’s management. Our responsibility is to express an opinion on the Company’s financial statements based on our audits. We are a public accounting firm registered with the PCAOB and are required to be independent with respect to the Company in accordance with the U.S. federal securities laws and the applicable rules and regulations of the Securities and Exchange Commission and the PCAOB.
We conducted our audits in accordance with the standards of the PCAOB. Those standards require that we plan and perform the audit to obtain reasonable assurance about whether the financial statements are free of material misstatement, whether due to error or fraud. Our audits included performing procedures to assess the risks of material misstatement of the financial statements, whether due to error or fraud, and performing procedures that respond to those risks. Such procedures included examining, on a test basis, evidence regarding the amounts and disclosures in the financial statements. Our audits also included evaluating the accounting principles used and significant estimates made by management, as well as evaluating the overall presentation of the financial statements. We believe that our audits provide a reasonable basis for our opinion.
| /s/ Dixon Hughes Goodman LLP |
| We have served as the Company’s auditor since 2013. |
| Clearwater, Florida |
| March 7, 2018 |
59
Table of Contents
Report of Independent Registered Public Accounting Firm on Internal Control
To the Board of Directors and Stockholders of
HCI Group, Inc. and Subsidiaries
Opinion on Internal Control Over Financial Reporting
We have audited HCI Group, Inc. and Subsidiaries’ (the Company’s) internal control over financial reporting as of December 31, 2017, based on criteria established in Internal Control—Integrated Framework (2013) issued by the Committee of Sponsoring Organizations of the Treadway Commission (COSO). In our opinion, the Company maintained, in all material respects, effective internal control over financial reporting as of December 31, 2017, based on criteria established in Internal Control—Integrated Framework (2013) issued by COSO.
We also have audited, in accordance with the standards of the Public Company Accounting Oversight Board (United States) (PCAOB), the consolidated financial statements of the Company as of December 31, 2017 and 2016, and for each of the three years in the period ended December 31, 2017, and our report dated March 7, 2018, expressed an unqualified opinion on those consolidated financial statements.
Basis for Opinion
The Company’s management is responsible for maintaining effective internal control over financial reporting, and for its assessment of the effectiveness of internal control over financial reporting, included in the accompanying Management’s Annual Report on Internal Control Over Financial Reporting. Our responsibility is to express an opinion on the Company’s internal control over financial reporting based on our audit. We are a public accounting firm registered with the PCAOB and are required to be independent with respect to the Company in accordance with the U.S. federal securities laws and the applicable rules and regulations of the Securities and Exchange Commission and the PCAOB.
We conducted our audit in accordance with the standards of the PCAOB. Those standards require that we plan and perform the audit to obtain reasonable assurance about whether effective internal control over financial reporting was maintained in all material respects. Our audit included obtaining an understanding of internal control over financial reporting, assessing the risk that a material weakness exists, testing and evaluating the design and operating effectiveness of internal control based on the assessed risk, and performing such other procedures as we considered necessary in the circumstances. We believe that our audit provides a reasonable basis for our opinion.
Definition and Limitations of Internal Control Over Financial Reporting
A company’s internal control over financial reporting is a process designed to provide reasonable assurance regarding the reliability of financial reporting and the preparation of financial statements for external purposes in accordance with generally accepted accounting principles. A company’s internal control over financial reporting includes those policies and procedures that (1) pertain to the maintenance of records that, in reasonable detail, accurately and fairly reflect the transactions and dispositions of the assets of the company; (2) provide reasonable assurance that transactions are recorded as necessary to permit preparation of financial statements in accordance with generally accepted accounting principles, and that receipts and expenditures of the company are being made only in accordance with authorizations of management and directors of the company; and (3) provide reasonable assurance regarding prevention or timely detection of unauthorized acquisition, use, or disposition of the company’s assets that could have a material effect on the financial statements.
Because of its inherent limitations, internal control over financial reporting may not prevent or detect misstatements. Also, projections of any evaluation of effectiveness to future periods are subject to the risk that controls may become inadequate because of changes in conditions, or that the degree of compliance with the policies or procedures may deteriorate.
| /s/ Dixon Hughes Goodman LLP |
| Clearwater, Florida |
| March 7, 2018 |
60
Table of Contents
HCI GROUP, INC. AND SUBSIDIARIES
Consolidated Balance Sheets
(Dollar amounts in thousands)
| December 31, | ||||||||
| 2017 | 2016 | |||||||
| Assets | ||||||||
| Fixed-maturity securities, available for sale, at fair value (amortized cost: $235,830 and $167,231, respectively) |
$ | 237,484 | $ | 166,248 | ||||
| Equity securities, available for sale, at fair value (cost: $53,132 and $47,750, respectively) |
58,911 | 53,035 | ||||||
| Equity securities, trading, at fair value (cost: $953 and $0, respectively) |
1,045 | — | ||||||
| Limited partnership investments, at equity |
23,184 | 29,263 | ||||||
| Investment in unconsolidated joint venture, at equity |
1,304 | 2,102 | ||||||
| Real estate investments (Note 4 — Consolidated Variable Interest Entity) |
58,358 | 48,086 | ||||||
|
|
|
|
|
|||||
| Total investments |
380,286 | 298,734 | ||||||
| Cash and cash equivalents (Note 4 — Consolidated Variable Interest Entity) |
255,884 | 280,531 | ||||||
| Accrued interest and dividends receivable |
1,983 | 1,654 | ||||||
| Income taxes receivable |
16,192 | 2,811 | ||||||
| Premiums receivable |
17,807 | 17,276 | ||||||
| Prepaid reinsurance premiums |
22,286 | 24,554 | ||||||
| Reinsurance recoverable: |
||||||||
| Paid losses and loss adjustment expenses |
2,344 | — | ||||||
| Unpaid losses and loss adjustment expenses |
100,760 | — | ||||||
| Deferred policy acquisition costs |
16,712 | 16,639 | ||||||
| Property and equipment, net |
12,465 | 11,374 | ||||||
| Intangible assets, net |
4,995 | 4,899 | ||||||
| Deferred income taxes, net |
— | 250 | ||||||
| Other assets (Note 4 — Consolidated Variable Interest Entity) |
10,550 | 11,342 | ||||||
|
|
|
|
|
|||||
| Total assets |
$ | 842,264 | $ | 670,064 | ||||
|
|
|
|
|
|||||
(continued)
61
Table of Contents
HCI GROUP, INC. AND SUBSIDIARIES
Consolidated Balance Sheets—continued
(Dollar amounts in thousands)
| December 31, | ||||||||
| 2017 | 2016 | |||||||
| Liabilities and Stockholders’ Equity | ||||||||
| Losses and loss adjustment expenses |
$ | 198,578 | $ | 70,492 | ||||
| Unearned premiums |
164,896 | 175,803 | ||||||
| Advance premiums |
4,948 | 4,651 | ||||||
| Assumed reinsurance balances payable |
15 | 3,294 | ||||||
| Accrued expenses (Note 4 — Consolidated Variable Interest Entity) |
6,035 | 6,513 | ||||||
| Reinsurance recovered in advance on unpaid losses |
13,885 | — | ||||||
| Deferred income taxes, net |
1,890 | — | ||||||
| Long-term debt |
237,835 | 138,863 | ||||||
| Other liabilities (Note 4 — Consolidated Variable Interest Entity) |
20,207 | 26,702 | ||||||
|
|
|
|
|
|||||
| Total liabilities |
648,289 | 426,318 | ||||||
|
|
|
|
|
|||||
| Commitments and contingencies (Note 22) |
||||||||
| Stockholders’ equity: |
||||||||
| 7% Series A cumulative convertible preferred stock (no par value, 1,500,000 shares authorized, no shares issued and outstanding) |
— | — | ||||||
| Series B junior participating preferred stock (no par value, 400,000 shares authorized, no shares issued or outstanding) |
— | — | ||||||
| Preferred stock (no par value, 18,100,000 shares authorized, no shares issued or outstanding) |
— | — | ||||||
| Common stock (no par value, 40,000,000 shares authorized, 8,762,416 and 9,662,761 shares issued and outstanding in 2017 and 2016, respectively) |
— | — | ||||||
| Additional paid-in capital |
— | 8,139 | ||||||
| Retained income |
189,409 | 232,964 | ||||||
| Accumulated other comprehensive income, net of taxes |
4,566 | 2,643 | ||||||
|
|
|
|
|
|||||
| Total stockholders’ equity |
193,975 | 243,746 | ||||||
|
|
|
|
|
|||||
| Total liabilities and stockholders’ equity |
$ | 842,264 | $ | 670,064 | ||||
|
|
|
|
|
|||||
See accompanying Notes to Consolidated Financial Statements.
62
Table of Contents
HCI GROUP, INC. AND SUBSIDIARIES
Consolidated Statements of Income
(Dollar amounts in thousands, except per share amounts)
| Years Ended December 31, | ||||||||||||
| 2017 | 2016 | 2015 | ||||||||||
| Revenue |
||||||||||||
| Gross premiums earned |
$ | 358,253 | $ | 378,678 | $ | 423,120 | ||||||
| Premiums ceded |
(133,635 | ) | (135,051 | ) | (140,614 | ) | ||||||
|
|
|
|
|
|
|
|||||||
| Net premiums earned |
224,618 | 243,627 | 282,506 | |||||||||
| Net investment income |
11,439 | 9,087 | 3,978 | |||||||||
| Net realized investment gains (losses) |
4,346 | 2,601 | (608 | ) | ||||||||
| Net unrealized investment gains |
92 | — | — | |||||||||
| Net other-than-temporary impairment losses recognized in income: |
||||||||||||
| Total other-than-temporary impairment losses |
(1,116 | ) | (2,252 | ) | (5,275 | ) | ||||||
| Portion of loss recognized in other comprehensive income, before taxes |
(351 | ) | (230 | ) | 594 | |||||||
|
|
|
|
|
|
|
|||||||
| Net other-than-temporary impairment losses |
(1,467 | ) | (2,482 | ) | (4,681 | ) | ||||||
| Policy fee income |
3,622 | 3,914 | 3,496 | |||||||||
| Gain on repurchases of convertible senior notes |
— | 153 | — | |||||||||
| Gain on bargain purchase |
— | 2,071 | — | |||||||||
| Gain on remeasurement of previously held interest |
— | 4,005 | — | |||||||||
| Other |
1,756 | 1,470 | 1,261 | |||||||||
|
|
|
|
|
|
|
|||||||
| Total revenue |
244,406 | 264,446 | 285,952 | |||||||||
|
|
|
|
|
|
|
|||||||
| Expenses |
||||||||||||
| Losses and loss adjustment expenses |
165,629 | 124,667 | 87,224 | |||||||||
| Policy acquisition and other underwriting expenses |
39,663 | 42,642 | 41,984 | |||||||||
| General and administrative personnel expenses |
25,127 | 26,200 | 28,276 | |||||||||
| Interest expense |
16,767 | 11,079 | 10,754 | |||||||||
| Loss on repurchases of senior notes |
743 | — | — | |||||||||
| Impairment loss |
38 | 388 | — | |||||||||
| Other operating expenses |
12,063 | 12,614 | 11,522 | |||||||||
|
|
|
|
|
|
|
|||||||
| Total operating expenses |
260,030 | 217,590 | 179,760 | |||||||||
|
|
|
|
|
|
|
|||||||
| (Loss) income before income taxes |
(15,624 | ) | 46,856 | 106,192 | ||||||||
| Income tax (benefit) expense |
(8,731 | ) | 17,835 | 40,331 | ||||||||
|
|
|
|
|
|
|
|||||||
| Net (loss) income |
$ | (6,893 | ) | $ | 29,021 | $ | 65,861 | |||||
|
|
|
|
|
|
|
|||||||
| Basic (loss) earnings per share |
$ | (0.75 | ) | $ | 2.95 | $ | 6.51 | |||||
|
|
|
|
|
|
|
|||||||
| Diluted (loss) earnings per share |
$ | (0.75 | ) | $ | 2.92 | $ | 5.90 | |||||
|
|
|
|
|
|
|
|||||||
| Dividends per share |
$ | 1.40 | $ | 1.20 | $ | 1.20 | ||||||
|
|
|
|
|
|
|
|||||||
See accompanying Notes to Consolidated Financial Statements.
63
Table of Contents
HCI GROUP, INC. AND SUBSIDIARIES
Consolidated Statements of Comprehensive (Loss) Income
(Amounts in thousands)
| Years Ended December 31, | ||||||||||||
| 2017 | 2016 | 2015 | ||||||||||
| Net (loss) income |
$ | (6,893 | ) | $ | 29,021 | $ | 65,861 | |||||
|
|
|
|
|
|
|
|||||||
| Other comprehensive income (loss): |
||||||||||||
| Change in unrealized gain (loss) on investments: |
||||||||||||
| Net unrealized gain (loss) arising during the period |
5,996 | 7,317 | (9,366 | ) | ||||||||
| Other-than-temporary impairment loss charged to investment income |
1,467 | 2,482 | 4,681 | |||||||||
| Call and repayment losses charged to investment income |
14 | 20 | 77 | |||||||||
| Reclassification adjustment for net realized (gain) loss |
(4,346 | ) | (2,601 | ) | 608 | |||||||
|
|
|
|
|
|
|
|||||||
| Net change in unrealized gain (loss) |
3,131 | 7,218 | (4,000 | ) | ||||||||
| Deferred income taxes on above change |
(1,208 | ) | (2,784 | ) | 1,543 | |||||||
|
|
|
|
|
|
|
|||||||
| Total other comprehensive income (loss), net of income taxes |
1,923 | 4,434 | (2,457 | ) | ||||||||
|
|
|
|
|
|
|
|||||||
| Comprehensive (loss) income |
$ | (4,970 | ) | $ | 33,455 | $ | 63,404 | |||||
|
|
|
|
|
|
|
|||||||
See accompanying Notes to Consolidated Financial Statements.
64
Table of Contents
HCI GROUP, INC. AND SUBSIDIARIES
Consolidated Statements of Stockholders’ Equity
For the Year Ended December 31, 2017
(Dollar amounts in thousands)
| Common Stock | Additional Paid-In |
Retained | Accumulated Other Comprehensive Income, |
Total Stockholders’ |
||||||||||||||||||||
| Shares | Amount | Capital | Income | Net of Tax | Equity | |||||||||||||||||||
| Balance at December 31, 2016 |
9,662,761 | $ | — | $ | 8,139 | $ | 232,964 | $ | 2,643 | $ | 243,746 | |||||||||||||
| Net loss |
— | — | — | (6,893 | ) | — | (6,893 | ) | ||||||||||||||||
| Total other comprehensive income, net of income taxes |
— | — | — | — | 1,923 | 1,923 | ||||||||||||||||||
| Issuance of restricted stock |
154,936 | — | — | — | — | — | ||||||||||||||||||
| Exercise of common stock options |
30,000 | — | 75 | — | — | 75 | ||||||||||||||||||
| Forfeiture of restricted stock |
(23,766 | ) | — | — | — | — | — | |||||||||||||||||
| Repurchase and retirement of common stock |
(437,240 | ) | — | (21,318 | ) | — | — | (21,318 | ) | |||||||||||||||
| Repurchase and retirement of common stock under share repurchase plan |
(433,175 | ) | — | (15,154 | ) | — | — | (15,154 | ) | |||||||||||||||
| Repurchase of common stock under prepaid forward contract |
(191,100 | ) | — | (9,400 | ) | — | — | (9,400 | ) | |||||||||||||||
| Equity component on 4.25% convertible senior notes (net of offering costs of $543) |
— | — | 15,151 | — | — | 15,151 | ||||||||||||||||||
| Deferred taxes on debt discount |
— | — | (5,845 | ) | — | — | (5,845 | ) | ||||||||||||||||
| Common stock dividends |
— | — | — | (12,833 | ) | — | (12,833 | ) | ||||||||||||||||
| Stock-based compensation |
— | — | 4,523 | — | — | 4,523 | ||||||||||||||||||
| Additional paid-in capital shortfall allocated to retained income |
— | — | 23,829 | (23,829 | ) | — | — | |||||||||||||||||
|
|
|
|
|
|
|
|
|
|
|
|
|
|||||||||||||
| Balance at December 31, 2017 |
8,762,416 | $ | — | $ | — | $ | 189,409 | $ | 4,566 | $ | 193,975 | |||||||||||||
|
|
|
|
|
|
|
|
|
|
|
|
|
|||||||||||||
65
Table of Contents
HCI GROUP, INC. AND SUBSIDIARIES
Consolidated Statements of Stockholders’ Equity – (Continued)
For the Year Ended December 31, 2016
(Dollar amounts in thousands)
| Additional | Accumulated Other Comprehensive |
Total | ||||||||||||||||||||||
| Common Stock |
Paid-In Capital |
Retained Income |
(Loss) Income, Net of Tax |
Stockholders’ Equity |
||||||||||||||||||||
| Shares | Amount | |||||||||||||||||||||||
| Balance at December 31, 2015 |
10,292,256 | $ | — | $ | 23,879 | $ | 215,634 | $ | (1,791 | ) | $ | 237,722 | ||||||||||||
| Net income |
— | — | — | 29,021 | — | 29,021 | ||||||||||||||||||
| Total other comprehensive income, net of income taxes |
— | — | — | — | 4,434 | 4,434 | ||||||||||||||||||
| Issuance of restricted stock |
142,440 | — | — | — | — | — | ||||||||||||||||||
| Exercise of common stock options |
60,000 | — | 150 | — | — | 150 | ||||||||||||||||||
| Forfeiture of restricted stock |
(13,298 | ) | — | — | — | — | — | |||||||||||||||||
| Cancellation of restricted stock |
(160,000 | ) | — | — | — | — | — | |||||||||||||||||
| Repurchase and retirement of common stock |
(14,934 | ) | — | (464 | ) | — | — | (464 | ) | |||||||||||||||
| Repurchase and retirement of common stock under share repurchase plan |
(643,703 | ) | — | (20,026 | ) | — | — | (20,026 | ) | |||||||||||||||
| Common stock dividends |
— | — | — | (11,691 | ) | — | (11,691 | ) | ||||||||||||||||
| Tax benefits on stock-based compensation |
— | — | 641 | — | — | 641 | ||||||||||||||||||
| Tax shortfalls on stock-based compensation |
— | — | (239 | ) | — | — | (239 | ) | ||||||||||||||||
| Stock-based compensation |
— | — | 4,198 | — | — | 4,198 | ||||||||||||||||||
|
|
|
|
|
|
|
|
|
|
|
|
|
|||||||||||||
| Balance at December 31, 2016 |
9,662,761 | $ | — | $ | 8,139 | $ | 232,964 | $ | 2,643 | $ | 243,746 | |||||||||||||
|
|
|
|
|
|
|
|
|
|
|
|
|
|||||||||||||
66
Table of Contents
HCI GROUP, INC. AND SUBSIDIARIES
Consolidated Statements of Stockholders’ Equity – (Continued)
For the Year Ended December 31, 2015
(Dollar amounts in thousands)
| Additional | Accumulated Other Comprehensive |
Total | ||||||||||||||||||||||
| Common Stock | Paid-In | Retained | Income (Loss), | Stockholders’ | ||||||||||||||||||||
| Shares | Amount | Capital | Income | Net of Tax | Equity | |||||||||||||||||||
| Balance at December 31, 2014 |
10,189,128 | $ | — | $ | 20,465 | $ | 161,454 | $ | 666 | $ | 182,585 | |||||||||||||
| Net income |
— | — | — | 65,861 | — | 65,861 | ||||||||||||||||||
| Total other comprehensive loss, net of income taxes |
— | — | — | — | (2,457 | ) | (2,457 | ) | ||||||||||||||||
| Issuance of restricted stock |
83,260 | — | — | — | — | — | ||||||||||||||||||
| Exercise of common stock options |
120,000 | — | 263 | — | — | 263 | ||||||||||||||||||
| Shares surrendered upon exercising common stock options |
(2,013 | ) | — | — | — | — | — | |||||||||||||||||
| Forfeiture of restricted stock |
(42,757 | ) | — | — | — | — | — | |||||||||||||||||
| Repurchase and retirement of common stock |
(17,493 | ) | — | (792 | ) | — | — | (792 | ) | |||||||||||||||
| Repurchase and retirement of common stock under share repurchase plan |
(37,869 | ) | — | (1,610 | ) | — | — | (1,610 | ) | |||||||||||||||
| Common stock dividends |
— | — | — | (11,681 | ) | — | (11,681 | ) | ||||||||||||||||
| Tax benefits on stock-based compensation |
— | — | 2,295 | — | — | 2,295 | ||||||||||||||||||
| Tax shortfalls on stock-based compensation |
— | — | (1,954 | ) | — | — | (1,954 | ) | ||||||||||||||||
| Stock-based compensation |
— | — | 5,212 | — | — | 5,212 | ||||||||||||||||||
|
|
|
|
|
|
|
|
|
|
|
|
|
|||||||||||||
| Balance at December 31, 2015 |
10,292,256 | $ | — | $ | 23,879 | $ | 215,634 | $ | (1,791 | ) | $ | 237,722 | ||||||||||||
|
|
|
|
|
|
|
|
|
|
|
|
|
|||||||||||||
See accompanying Notes to Consolidated Financial Statements.
67
Table of Contents
HCI GROUP, INC. AND SUBSIDIARIES
Consolidated Statements of Cash Flows
(Amounts in thousands)
| Years Ended December 31, | ||||||||||||
| 2017 | 2016 | 2015 | ||||||||||
| Cash flows from operating activities: |
||||||||||||
| Net (loss) income |
$ | (6,893 | ) | $ | 29,021 | $ | 65,861 | |||||
| Adjustments to reconcile net (loss) income to net cash provided by operating activities: |
||||||||||||
| Stock-based compensation |
4,523 | 4,198 | 5,212 | |||||||||
| Net amortization of premiums on investments in fixed-maturity securities |
1,252 | 726 | 855 | |||||||||
| Depreciation and amortization |
9,591 | 5,408 | 5,251 | |||||||||
| Deferred income tax (benefit) expense |
(4,913 | ) | 155 | (1,101 | ) | |||||||
| Net realized investment (gains) losses |
(4,346 | ) | (2,601 | ) | 608 | |||||||
| Net unrealized investment gains |
(92 | ) | — | — | ||||||||
| Other-than-temporary impairment losses |
1,467 | 2,482 | 4,681 | |||||||||
| Income from real estate investment under acquisition, development and construction arrangement |
— | — | (344 | ) | ||||||||
| Loss from unconsolidated joint venture |
234 | — | 125 | |||||||||
| Distribution received from unconsolidated joint venture |
147 | — | — | |||||||||
| Gain on repurchases of convertible senior notes |
— | (153 | ) | — | ||||||||
| Gain on bargain purchase |
— | (2,071 | ) | — | ||||||||
| Loss on repurchases of senior notes |
743 | — | — | |||||||||
| Gain on remeasurement of previously held investment |
— | (4,005 | ) | — | ||||||||
| Impairment loss |
38 | 388 | — | |||||||||
| Net (income) loss from limited partnership interests |
(2,334 | ) | (1,207 | ) | 3,244 | |||||||
| Distributions received from limited partnership interests |
881 | 544 | 12 | |||||||||
| Foreign currency remeasurement (gain) loss |
(60 | ) | 29 | 66 | ||||||||
| Other |
134 | 18 | 26 | |||||||||
| Changes in operating assets and liabilities: |
||||||||||||
| Accrued interest and dividends receivable |
(329 | ) | (300 | ) | (331 | ) | ||||||
| Income taxes |
(13,381 | ) | (1,192 | ) | 766 | |||||||
| Premiums receivable |
(531 | ) | 2,355 | (3,807 | ) | |||||||
| Prepaid reinsurance premiums |
2,268 | 16,193 | (6,651 | ) | ||||||||
| Reinsurance recoverable |
(103,104 | ) | — | — | ||||||||
| Deferred policy acquisition costs |
(73 | ) | 1,963 | (3,588 | ) | |||||||
| Other assets |
574 | 29,054 | (7,230 | ) | ||||||||
| Losses and loss adjustment expenses |
128,086 | 18,802 | 2,782 | |||||||||
| Unearned premiums |
(10,907 | ) | (11,487 | ) | (26,781 | ) | ||||||
| Advance premiums |
297 | (332 | ) | 603 | ||||||||
| Assumed reinsurance balances payable |
(3,279 | ) | 2,210 | 866 | ||||||||
| Reinsurance recovered in advance on unpaid losses |
13,885 | — | — | |||||||||
| Accrued expenses and other liabilities |
2,548 | (2,223 | ) | 4,157 | ||||||||
|
|
|
|
|
|
|
|||||||
| Net cash provided by operating activities |
16,426 | 87,975 | 45,282 | |||||||||
|
|
|
|
|
|
|
|||||||
(continued)
68
Table of Contents
HCI GROUP, INC. AND SUBSIDIARIES
Consolidated Statements of Cash Flows – (Continued)
(Amounts in thousands)
| Years Ended December 31, | ||||||||||||
| 2017 | 2016 | 2015 | ||||||||||
| Cash flows from investing activities: |
||||||||||||
| Investment in real estate under acquisition, development, and construction arrangement |
— | — | (6,968 | ) | ||||||||
| Proceeds from investment in real estate under acquisition, development and construction arrangement |
— | 10,200 | — | |||||||||
| Acquisition of real estate business, net of cash acquired |
— | (11,651 | ) | — | ||||||||
| Investments in limited partnership interests |
(4,226 | ) | (4,670 | ) | (24,636 | ) | ||||||
| Distributions received from limited partnership interests |
11,758 | — | — | |||||||||
| Investment in unconsolidated joint venture |
— | (90 | ) | (435 | ) | |||||||
| Distribution from unconsolidated joint venture |
417 | — | — | |||||||||
| Purchase of property and equipment |
(2,340 | ) | (865 | ) | (840 | ) | ||||||
| Purchase of intangible assets |
(637 | ) | — | — | ||||||||
| Purchase of real estate investments |
(11,878 | ) | (2,261 | ) | (4,871 | ) | ||||||
| Purchase of fixed-maturity securities |
(114,743 | ) | (85,530 | ) | (98,501 | ) | ||||||
| Purchase of equity securities—available for sale |
(46,909 | ) | (22,434 | ) | (32,878 | ) | ||||||
| Purchase of equity securities—trading |
(3,544 | ) | — | — | ||||||||
| Proceeds from sales of fixed-maturity securities |
31,759 | 40,454 | 53,711 | |||||||||
| Proceeds from calls, repayments and maturities of fixed-maturity securities |
14,897 | 4,692 | 9,344 | |||||||||
| Proceeds from sales of equity securities—available for sale |
42,657 | 23,127 | 25,695 | |||||||||
| Proceeds from sales of equity securities—trading |
2,625 | — | — | |||||||||
| Proceeds from sales of real estate investments |
— | — | 5 | |||||||||
|
|
|
|
|
|
|
|||||||
| Net cash used in investing activities |
(80,164 | ) | (49,028 | ) | (80,374 | ) | ||||||
|
|
|
|
|
|
|
|||||||
| Cash flows from financing activities: |
||||||||||||
| Net borrowing under revolving credit facility |
— | 1,238 | — | |||||||||
| Proceeds from the exercise of common stock options |
75 | 150 | 263 | |||||||||
| Cash dividends paid |
(13,906 | ) | (12,438 | ) | (12,428 | ) | ||||||
| Cash dividends received under share repurchase forward contract |
1,073 | 747 | 747 | |||||||||
| Proceeds from the issuance of long-term debt |
143,859 | 18,200 | — | |||||||||
| Repurchases of convertible senior notes |
— | (11,347 | ) | — | ||||||||
| Repurchases of senior notes |
(40,250 | ) | — | — | ||||||||
| Repayment of long-term debt |
(974 | ) | (455 | ) | — | |||||||
| Repurchases of common stock |
(30,718 | ) | (464 | ) | (792 | ) | ||||||
| Repurchases of common stock under share repurchase plan |
(15,154 | ) | (20,026 | ) | (1,610 | ) | ||||||
| Purchase of non-controlling interest |
— | (2,064 | ) | — | ||||||||
| Debt issuance costs |
(4,975 | ) | (339 | ) | — | |||||||
| Tax benefits on stock-based compensation |
— | 641 | 2,295 | |||||||||
|
|
|
|
|
|
|
|||||||
| Net cash provided by (used in) financing activities |
39,030 | (26,157 | ) | (11,525 | ) | |||||||
|
|
|
|
|
|
|
|||||||
| Effect of exchange rate changes on cash |
61 | 3 | (61 | ) | ||||||||
|
|
|
|
|
|
|
|||||||
| Net (decrease) increase in cash and cash equivalents |
(24,647 | ) | 12,793 | (46,678 | ) | |||||||
| Cash and cash equivalents at beginning of year |
280,531 | 267,738 | 314,416 | |||||||||
|
|
|
|
|
|
|
|||||||
| Cash and cash equivalents at end of year |
$ | 255,884 | $ | 280,531 | $ | 267,738 | ||||||
|
|
|
|
|
|
|
|||||||
(continued)
69
Table of Contents
HCI GROUP, INC. AND SUBSIDIARIES
Consolidated Statements of Cash Flows – (Continued)
(Amounts in thousands)
| Years Ended December 31, | ||||||||||||
| 2017 | 2016 | 2015 | ||||||||||
| Supplemental disclosure of cash flow information: |
||||||||||||
| Cash paid for income taxes |
$ | 11,506 | $ | 18,857 | $ | 38,371 | ||||||
|
|
|
|
|
|
|
|||||||
| Cash paid for interest |
$ | 8,906 | $ | 7,222 | $ | 7,211 | ||||||
|
|
|
|
|
|
|
|||||||
| Non-cash investing and financing activities: |
||||||||||||
| Unrealized gain (loss) on investments in available-for-sale securities, net of tax |
$ | 1,923 | $ | 4,434 | $ | (2,457 | ) | |||||
|
|
|
|
|
|
|
|||||||
| Details of business acquisition: |
||||||||||||
| Fair value of assets acquired |
$ | — | $ | 32,569 | $ | — | ||||||
| Less:Purchase price |
— | (14,514 | ) | — | ||||||||
| Carrying value of previously held interest |
— | (2,859 | ) | — | ||||||||
| Gain on remeasurement of previously held interest |
— | (4,005 | ) | — | ||||||||
| Gain on bargain purchase |
— | (2,071 | ) | — | ||||||||
|
|
|
|
|
|
|
|||||||
| Liabilities assumed |
$ | — | $ | 9,120 | $ | — | ||||||
|
|
|
|
|
|
|
|||||||
| Conversion of revolving credit facility to long-term debt |
$ | 9,441 | $ | — | $ | — | ||||||
|
|
|
|
|
|
|
|||||||
| Receivable from sales of available-for-sale securities |
$ | 255 | $ | 350 | $ | — | ||||||
|
|
|
|
|
|
|
|||||||
| Payable on purchases of available-for-sale securities |
$ | 4 | $ | 50 | $ | 1 | ||||||
|
|
|
|
|
|
|
|||||||
See accompanying Notes to Consolidated Financial Statements.
70
Table of Contents
HCI GROUP, INC. AND SUBSIDIARIES
Notes to Consolidated Financial Statements
(Amounts in thousands, except share and per share amounts, unless otherwise stated)
Note 1 — Nature of Operations
HCI Group, Inc., together with its subsidiaries (“HCI” or the “Company”), is primarily engaged in the property and casualty insurance business through two Florida domiciled insurance companies, Homeowners Choice Property & Casualty Insurance Company, Inc. (“HCPCI”), its principal operating subsidiary, and TypTap Insurance Company (“TypTap”). HCPCI is authorized to underwrite various homeowners’ property and casualty insurance products and allied lines business in the state of Florida. HCPCI also offers flood-endorsed and wind-only policies to Florida customers. During 2017, HCPCI received regulatory approval to write residential property and casualty insurance in the states of Arkansas, California, Maryland, North Carolina, New Jersey, Ohio, Pennsylvania, South Carolina and Texas. HCPCI has yet to commence operations in these states. TypTap, on the other hand, primarily offers standalone flood policies to Florida homeowners. HCPCI’s and TypTap’s operations are supported by HCI Group, Inc. and certain HCI subsidiaries.
In addition, HCI includes various subsidiaries predominantly engaged in the businesses of owning and leasing real estate, operating marina facilities and one restaurant, and developing software products. See Note 16 — “Segment Information.”
The Company obtained a majority of its policies through participation in a “take-out program” with Citizens Property Insurance Corporation (“Citizens”), a Florida state supported insurer. Policies were obtained in separate assumption transactions with Citizens that took place from July 2007 through December 2017. The Company is required to offer renewals on the policies acquired for a period of three years subsequent to the initial expiration of the assumed policies. During the first full year after assumption, such renewals are required to have rates that are equivalent to or less than the rates charged by Citizens. Substantially all of the Company’s premium revenue since inception comes from these assumptions and one additional assumption through which the Company acquired the Florida policies of another Florida insurance carrier.
71
Table of Contents
HCI GROUP, INC. AND SUBSIDIARIES
Notes to Consolidated Financial Statements
(Amounts in thousands, except share and per share amounts, unless otherwise stated)
Note 2 — Summary of Significant Accounting Policies
Basis of Presentation. The accompanying financial statements have been prepared in conformity with accounting principles generally accepted in the United States of America (“U.S. GAAP”).
Adoption of New Accounting Standards.
Effective January 1, 2017, the Company adopted Accounting Standards Update No. 2016-09, Compensation—Stock Compensation (Topic 718), which amends the accounting for share-based payment transactions including the related income taxes, classification of awards as either equity or liabilities, and classification on the statement of cash flows. Amendments related to the timing of when excess tax benefits are recognized, minimum statutory withholding requirements, and forfeitures, which is applied using a modified retrospective transition method, have no impact on the Company’s comparative consolidated financial statements. In addition, the retrospective application of the amendments related to the presentation of employee taxes paid does not have an impact on the Company’s comparative consolidated statement of cash flows. Upon adoption of this standard, the Company elected to account for forfeitures of share-based awards when they occur and apply the amendments related to the presentation of excess tax benefits on the statement of cash flows prospectively. Under the new standard, the Company is required to recognize any excess tax benefits and tax deficiencies in the Company’s consolidated statement of income.
In addition, The Company early adopted Accounting Standards Update No. 2017-01, Business Combinations (Topic 805), which clarifies the definition of business and provides guidance to assist entities with evaluating whether transactions should be accounted for as acquisitions (or disposals) of businesses. The Company applied this standard prospectively. See Real Estate Investments in Note 4 — “Investments” for the application of this standard in the acquisition of a commercial property in Tampa, Florida.
Principles of Consolidation. The accompanying consolidated financial statements include the accounts of HCI Group, Inc. and its majority-owned and controlled subsidiaries. All significant intercompany accounts and transactions have been eliminated in consolidation. In addition, the Company evaluates its relationships or investments for consolidation pursuant to authoritative accounting guidance related to the consolidation of variable interest entities under the Variable Interest Model prescribed by the Financial Accounting Standards Board (“FASB”). A variable interest entity is consolidated when the Company has the power to direct activities that most significantly impact the economic performance of the variable interest entity and has the obligation to absorb losses or the right to receive benefits from the variable interest entity that could potentially be significant to the variable interest entity. When a variable interest entity is not consolidated, the Company uses the equity method to account for the investment. Under this method, the carrying value is generally the Company’s share of the net asset value of the unconsolidated entity, and changes in the Company’s share of the net asset value are recorded in net investment income.
The Company has a 100% equity interest in one venture (treated as a joint venture under U.S. GAAP) that owns a commercial property in Riverview, Florida. The Company consolidates this joint venture as its primary beneficiary (see Consolidated Variable Interest Entity in Note 4 — “Investments”).
72
Table of Contents
HCI GROUP, INC. AND SUBSIDIARIES
Notes to Consolidated Financial Statements
(Amounts in thousands, except share and per share amounts, unless otherwise stated)
Use of Estimates. The preparation of the consolidated financial statements in conformity with U.S. GAAP requires management to make estimates and assumptions that affect the reported amounts of assets and liabilities as well as the disclosure of contingent assets and liabilities at the date of the consolidated financial statements and the reported amounts of revenues and expenses during the reporting period. Actual results may differ materially from these estimates. Material estimates that are particularly susceptible to significant change in the near term are primarily related to losses and loss adjustment expenses, reinsurance with retrospective provisions, reinsurance recoverable, deferred income taxes, and stock-based compensation expense.
Business Acquisitions. The Company accounts for business acquisitions using the acquisition method, which requires it to measure and recognize the assets acquired, liabilities assumed, and any noncontrolling interest in the acquiree at their acquisition date fair values. In the event that the fair value of net assets acquired exceeds the purchase price, a bargain purchase gain is recorded. In a step acquisition in which there is a change in ownership interest and control is obtained when there is a previously held equity interest, a gain or loss from remeasurement of the previously held equity interest to fair value is recorded.
Before the adoption of Accounting Standards Update No. 2017-01, acquisitions of income-producing real properties were typically considered business acquisitions. As such, the Company allocated the purchase price to land, land improvements, buildings, tenant improvements, intangibles such as the value of significant tenant (i.e. anchor tenant) relationships, in-place leases, and assumed liabilities, if any. Tangible assets are presented as real estate investments on the Company’s consolidated balance sheet. Buildings subject to leases are valued as if vacant. The value attributable to in-place leases reflects the costs we would have incurred to lease the property to the occupancy level that existed at the acquisition date. These costs include leasing commissions, tenant improvement allowances, and other direct costs required to lease the property. In addition, the estimated fair value of in-place leases reflects the value of base rental revenues that would have been earned during the assumed periods of vacancy and the related carrying costs that would have been incurred to lease the vacant property to its existing occupancy. The Company also reviews terms of the assumed leases to evaluate whether the terms are favorable or unfavorable relative to the market at the acquisition date. In the event the assumed leases are not at market terms, the Company recognizes an intangible asset for a lease with favorable terms and a liability if the terms of the lease are unfavorable.
After the adoption of the aforementioned guidance, the Company evaluates whether substantially all of the fair value of the gross assets acquired in a real estate transaction is concentrated in a single identifiable asset or group of similar identifiable assets. If such concentration is substantial, the transaction is accounted for as an asset acquisition. As a result, the cost of acquiring real estate is allocated to the individual assets based on the relative fair values of the individual assets. Acquisition related costs are capitalized and allocated among the assets acquired.
Cash and Cash Equivalents. The Company considers all short-term highly liquid investments with original maturities of less than three months to be cash and cash equivalents. At December 31, 2017 and 2016, cash and cash equivalents consisted of cash on deposit with financial institutions and securities brokerage firms and certificates of deposit.
73
Table of Contents
HCI GROUP, INC. AND SUBSIDIARIES
Notes to Consolidated Financial Statements
(Amounts in thousands, except share and per share amounts, unless otherwise stated)
Investments in Available-for-Sale Securities. Available-for-sale investments consist of fixed-maturity and equity securities. Fixed-maturity securities include debt securities and redeemable preferred stock. The Company’s available-for-sale securities are carried at fair value. Temporary changes in the fair value of available-for-sale securities are excluded from net investment income and reported in stockholders’ equity as a component of accumulated other comprehensive income, net of deferred income taxes. Realized investment gains and losses from sales are recorded on the trade date and are determined using the first-in first-out (FIFO) method. Investment income is recognized as earned and discounts or premiums arising from the purchase of debt securities are recognized in investment income using the interest method over the estimated remaining term of the security. Gains and losses from call redemptions and repayments are charged to investment income.
The Company reviews all securities for other-than-temporary impairment on a monthly basis. When the fair value of any investment is lower than its cost, an assessment is made to determine whether the decline is temporary or other-than-temporary. If the decline is determined to be other-than-temporary, the investment is written down to fair value and an impairment loss is recognized in income in the period in which the Company makes such determination.
When reviewing impaired fixed-maturity securities, the Company considers its ability and intent to hold these securities and whether it is probable that the Company will be required to sell these securities prior to their anticipated recovery or maturity. For the fixed-maturity securities that the Company intends to sell or it is probable that the Company will have to sell before recovery or maturity, the unrealized losses are recognized as other-than-temporary losses in income. In instances where there are credit related losses associated with the impaired fixed-maturity securities for which the Company asserts that it does not have the intent to sell, and it is probable that the Company will not be required to sell until a market price recovery or maturity, the amount of the other-than-temporary impairment loss related to credit losses is recognized in income, and the amount of the other-than-temporary impairment loss related to other non-credit factors such as changes in interest rates or market conditions is recorded as a component of accumulated other comprehensive income.
When determining impairment due to a credit related loss, the Company carefully considers factors such as the issuer’s financial ratios and condition, the security’s current ratings and maturity date, and overall market conditions in estimating the cash flows expected to be collected. The expected cash flows discounted at the effective interest rate of the security implicit at the date of acquisition is then compared with the security’s amortized cost at the measurement date. A credit loss is incurred when the present value of the expected cash flows is less than the security’s amortized cost. The Company considers various factors in determining whether an individual security is other-than-temporarily impaired (see Available-for-Sale Securities in Note 4 — “Investments”).
Investments in Trading Securities. The Company holds certain equity securities with the intention of selling them in a short period of time to generate profits. As such, these equity securities are classified as trading and carried at fair value. Realized investment gains and losses from sales are recorded on the trade date and are determined using the FIFO method. Unrealized holding gains and losses from the changes in the fair value are reported in the consolidated statement of income as net unrealized investment gains or losses (see Trading Securities in Note 4 — “Investments”).
74
Table of Contents
HCI GROUP, INC. AND SUBSIDIARIES
Notes to Consolidated Financial Statements
(Amounts in thousands, except share and per share amounts, unless otherwise stated)
Limited Partnership Investments. The Company has interests in limited partnerships that are not registered under the United Stated Securities Act of 1933, as amended, the securities laws of any state or the securities laws of any other jurisdictions. The partnership interests cannot be resold in the public market and any withdrawal is subject to the terms and conditions of the partnership agreement. The Company has no influence over partnership operating and financial policies. The Company did not elect the fair value option and, therefore, uses the equity method to account for these investments (see Limited Partnership Investments in Note 4 — “Investments”). The Company will generally recognize its share of the limited partnership’s earnings or losses on a three-month lag.
Pursuant to U.S. GAAP, these limited partnerships which are private equity funds must measure their investments at fair value and reflect the unrealized gains and losses in the fair value of their investments on their statement of income. As a result, the carrying value of limited partnership investments at each reporting date approximates their estimated fair value.
Investment in Unconsolidated Joint Venture. The Company has a 90% equity interest in a limited liability company (treated as a joint venture under U.S. GAAP) that owns land for lease or for sale and, until December 2016, owned and operated a retail shopping center. The joint venture was determined to be a variable interest entity as it lacks sufficient equity to finance its activities without additional subordinated financial support. Despite having a majority equity interest, the Company does not have the power to direct the activities that most significantly impact the economic performance of the joint venture and, accordingly, is not required to consolidate the joint venture as its primary beneficiary. As a result, the Company uses the equity method to account for this investment.
When evidence indicates an impairment may occur, the Company evaluates whether a decline in value is other than temporary. Evidence may include continuing operating losses of the joint venture, a declining occupancy rate, a decrease in real estate value, and an oversupply of rental property in close vicinity to the investment property. Should available evidence indicate the recovery of the initial investment is less likely, the Company would compare the carrying value of the investment with its expected residual value and recognize an impairment loss in earnings.
Real Estate Investments. Real estate investments include real estate and the related assets purchased for investment purposes (see Note 4 — “Investments”).
Prior to August 16, 2016, the Company was party to an Acquisition, Development and Construction loan agreement (“ADC Arrangement”) whereby the Company provided financing to a property developer for the construction of a retail shopping center. Because the Company expected to receive more than 50% of the residual profit from the ADC Arrangement which had characteristics similar to a real estate investment, the costs of the real estate project were capitalized and interest was recognized in net investment income.
Real estate and the related depreciable assets are carried at cost, net of accumulated depreciation, which is included in net investment income and allocated over the estimated useful life of the asset using the straight-line method of depreciation. Land is not depreciated. Real estate is evaluated for impairment when events or circumstances indicate the carrying value of the real estate may not be recoverable.
75
Table of Contents
HCI GROUP, INC. AND SUBSIDIARIES
Notes to Consolidated Financial Statements
(Amounts in thousands, except share and per share amounts, unless otherwise stated)
Deferred policy acquisition costs. Deferred policy acquisition costs (“DAC”) represent direct costs to acquire insurance contracts and consist of premium taxes and commissions paid to outside agents at the time of collection of the policy premium. DAC is amortized over the life of the related policy in relation to the amount of gross premiums earned.
The method followed in computing DAC limits the amount of such deferred costs to their estimated realizable value, which gives effect to the gross premium earned, related investment income, unpaid losses and loss adjustment expenses and certain other costs expected to be incurred as the premium is earned.
DAC is reviewed to determine if it is recoverable from future premium income, including investment income. If such costs are determined to be unrecoverable, they are expensed at the time of determination. The amount of DAC considered recoverable could be reduced in the near term if the estimates of total revenues discussed above are reduced or permanently impaired as a result of the disposition of a line of business. The amount of amortization of DAC could be revised in the near term if any of the estimates discussed above are revised.
Property and Equipment. Property and equipment is stated at cost less accumulated depreciation and amortization, which is included in other operating expenses. Depreciation is calculated on a straight-line basis over the estimated useful lives as follows: building, 39 years; computer hardware and software, 3 years; and office and furniture equipment, 3 to 7 years. Leasehold improvements are amortized over the shorter of the lease term or the asset’s useful life. Land is not depreciated. Expenditures for improvements are capitalized to the property accounts. Replacements and maintenance and repairs that do not improve or extend the life of the respective assets are expensed as incurred. The Company capitalizes both internal and external costs for internally developed software during the application development stage. During the preliminary project and post-implementation stage, internal-use software development costs are expensed as incurred. Capitalized software costs are depreciated on a straight-line basis over the estimated useful life of 7 years.
Impairment of Long-Lived Assets. Long-lived assets, such as property and equipment, are reviewed for impairment annually or whenever events or changes in circumstances indicate that the carrying amount of the assets may not be recoverable. The Company assesses the recoverability of long-lived assets by determining whether the assets can be recovered from undiscounted future cash flows. Recoverability of long-lived assets is dependent upon, among other things, the Company’s ability to maintain profitability, so as to be able to meet its obligations when they become due. In the opinion of management, based upon current information and projections, long-lived assets will be recovered over the period of benefit.
Intangible Assets. Intangibles consist of the value attributable to the acquired in-place leases and the primary, or anchor, tenant relationships. The value attributable to the anchor tenant relationship represents the economic benefits of having a nationally recognized retailer as the lead tenant, which draws consumer traffic and other tenants to the retail center. These intangibles are amortized to expense over the related lease term. Amortization of the intangibles related to real estate investments is reflected in net investment income in the consolidated statement of income. The Company reviews these intangible assets for impairment annually or when events or changes in circumstances indicate the carrying value may not be recoverable. In the event the Company determines the carrying value is not recoverable, an impairment loss is recorded in the Company’s consolidated statement of income.
76
Table of Contents
HCI GROUP, INC. AND SUBSIDIARIES
Notes to Consolidated Financial Statements
(Amounts in thousands, except share and per share amounts, unless otherwise stated)
Lease Acquisition Costs. Lease acquisition costs represent capitalized costs of finding and acquiring tenants such as leasing commissions, legal, and marketing expenses. The Company amortizes these costs in other operating expenses on a straight-line basis over the term of a lease.
Long-Term Debt. Long-term debt is generally classified as a liability and carried at amortized cost, net of any discount and issuance costs. At issuance, a debt instrument with embedded features such as conversion and redemption options is evaluated to determine whether bifurcation and derivative accounting is applicable. If such instrument is not subject to derivative accounting, it is further evaluated to determine if the Company is required to separately account for the liability and equity components.
To determine the carrying values of the liability and equity components at issuance, the Company measures the fair value of a similar liability, including any embedded features other than the conversion option, and assigns such value to the liability component. The liability component’s fair value is then subtracted from the initial proceeds to determine the carrying value of the debt instrument’s equity component, which is included in additional paid-in capital.
Any embedded feature other than the conversion option is evaluated at issuance to determine if it is probable that such embedded feature will be exercised. If the Company concludes that the exercisability of that embedded feature is not probable, the embedded feature is considered to be non-substantive and would not impact the initial measurement and expected life of the debt instrument’s liability component.
Transaction costs related to issuing a debt instrument that embodies both liability and equity components are allocated to the liability and equity components in proportion to the allocation of the proceeds and accounted for as debt issuance costs and equity issuance costs, respectively. Debt issuance costs are capitalized and presented as a deduction from the carrying value of the debt. Both debt discount and deferred debt issuance costs are amortized to interest expense over the expected life of the debt instrument using the effective interest method. Equity issuance costs are a reduction to the proceeds allocated to the equity component.
Prepaid Share Repurchase Forward Contract. A prepaid share repurchase forward contract is generally a contract that allows the Company to buy from the counterparty a specified number of common shares at a specific time at a given forward price. The Company entered into such a contract and evaluated the characteristics of the forward contract to determine whether it met the definition of a derivative financial instrument pursuant to U.S. GAAP. The Company determined the forward contract is an equity contract on the Company’s common shares requiring physical settlement in common shares of the Company. As such, the transaction is recognized as a component of stockholders’ equity with a charge to additional paid-in capital equal to the prepayment amount, which represents the cash paid to the counterparty. There will be no recognition in earnings for changes in fair value in subsequent periods.
77
Table of Contents
HCI GROUP, INC. AND SUBSIDIARIES
Notes to Consolidated Financial Statements
(Amounts in thousands, except share and per share amounts, unless otherwise stated)
Losses and Loss Adjustment Expenses. Reserves for losses and loss adjustment expenses (“LAE”) are determined by establishing liabilities in amounts estimated to cover incurred losses and LAE. Such reserves are determined based on the assessment of claims reported and the development of pending claims. These reserves are based on individual case estimates for the reported losses and LAE and estimates of such amounts that are incurred but not reported. Changes in the estimated liability are charged or credited to income as the losses and LAE are settled.
The estimates of unpaid losses and LAE are subject to trends in claim severity and frequency and are continually reviewed. As part of the process, the Company reviews historical data and considers various factors, including known and anticipated regulatory and legal developments, changes in social attitudes, inflation and economic conditions. As experience develops and other data becomes available, these estimates are revised, as required, resulting in increases or decreases to the existing unpaid losses and LAE. Adjustments are reflected in the results of operations in the period in which they are made and the liabilities may deviate substantially from prior estimates. Losses and LAE ceded to or recovered from reinsurers are recorded as a reduction to losses and LAE on the consolidated statement of income.
Advance Premiums. Premium payments received prior to the policy effective date are recorded as advance premiums. Once the policy is in force, the premiums are recorded as described under “Premium Revenue” below.
Reinsurance. In the normal course of business, the Company seeks to reduce the loss that may arise from catastrophes or other events by reinsuring certain levels of risk in various areas of exposure with other insurance enterprises or reinsurers. The Company contracts with a number of reinsurers to secure its annual reinsurance coverage, which generally becomes effective June 1st each year. The Company purchases reinsurance each year taking into consideration probable maximum losses and reinsurance market conditions. Amounts recoverable from reinsurers are estimated in a manner consistent with the applicable reinsurance contract or contracts. Reinsurance premiums and reserves related to reinsured business are accounted for on a basis consistent with those used in accounting for the original policies issued and the terms of the reinsurance contracts. Premiums ceded to other companies have been reported as a reduction of gross premiums earned. Prepaid reinsurance premiums represent the unexpired portion of premiums ceded to reinsurers.
Certain of the Company’s current reinsurance contracts contain retrospective provisions including terms and conditions that adjust premiums, increase the amount of future coverage, or result in profit commissions based on the loss experience under the contracts. In such cases, a with-and-without method is used to estimate the asset or liability amount to be recognized at each reporting date. The amount of the estimate is the difference between the net contract costs before and after the loss experience under the contract. Estimates related to premium adjustments, profit commissions and coverage changes are recognized in ceded premiums earned. These estimates are reviewed monthly based on the loss experience to date and as adjustments become necessary. Such adjustments are reflected in the Company’s current operations and recorded in other assets until
received upon the expiration of the contracts.
78
Table of Contents
HCI GROUP, INC. AND SUBSIDIARIES
Notes to Consolidated Financial Statements
(Amounts in thousands, except share and per share amounts, unless otherwise stated)
The Company receives ceding commissions from ceding gross written premiums to a third-party reinsurer under one flood quota share reinsurance contract. The ceding commissions represent the reimbursement of the Company’s policy acquisition, underwriting and other operating expenses. Ceding commissions received cover a portion of premium taxes and agent commissions capitalized by the Company and a portion of non-capitalized acquisition costs and other underwriting expenses. Ceding commissions are recognized to income on a pro-rata basis over the terms of the policies reinsured, the amount of which is included in policy acquisition and other underwriting expenses in the 2017 consolidated statement of income. The unearned portion of ceding commissions that represents recovery of capitalized acquisition costs is classified as a reduction of deferred policy acquisition costs whereas the remaining unearned balance is classified as deferred revenue in other liabilities.
Reinsurance Recovered in Advance on Unpaid Losses. Reinsurance recovered in advance on unpaid losses represents cash received in advance from reinsurers under reinsurance contracts to reimburse the Company’s losses and LAE. The Company is contractually permitted to apply these funds to offset the paid portion of reinsurance recoverable only.
Premium Revenue. Premium revenue is earned on a daily pro-rata basis over the term of the policies and is included in gross premiums earned. Unearned premiums represent the portion of the premiums attributable to the unexpired policy term. The Company reviews its policy detail and establishes an allowance for any amount outstanding for more than 90 days. As of December 31, 2017 and 2016, there was no allowance required.
Policy Fees. Policy fees represent nonrefundable fees for insurance coverage, which are intended to reimburse a portion of the costs incurred to underwrite the policy. Policy fees are recognized ratably over the policy coverage period.
Florida Insurance Guaranty Association Assessments. The Company’s Florida insurance subsidiaries may be assessed by the state guaranty association. The assessments are intended to be used for the payment of covered claims of insolvent insurance entities. The assessments are generally based on a percentage of premiums written during or following the year of insolvency. Liabilities are recognized when the assessments are probable to be imposed on the premiums on which they are expected to be based and the amounts can be reasonably estimated. The insurer is permitted by Florida statutes to recover the entire amount of assessments from in-force and future policyholders through policy surcharges. U.S. GAAP provides that the Company should record an asset based on the amount of written or obligated-to-write premiums and limited to the amounts recoverable over the life of the in-force policies.
Foreign Currency. The functional currency of the Company’s Indian subsidiary is the U.S. dollar. As such, the monetary assets and liabilities of this subsidiary are remeasured into U.S. dollars at the exchange rate in effect on the balance sheet date. Non-monetary assets and liabilities are remeasured using historical rates. Expenses recorded in the local currency are remeasured at the prevailing exchange rate. Exchange gains and losses resulting from these remeasurements are included in other operating expenses.
Income Taxes. The Company files consolidated federal and state income tax returns and allocates taxes among its wholly owned subsidiaries in accordance with a written tax-allocation agreement.
79
Table of Contents
HCI GROUP, INC. AND SUBSIDIARIES
Notes to Consolidated Financial Statements
(Amounts in thousands, except share and per share amounts, unless otherwise stated)
The Company accounts for income taxes in accordance with U.S. GAAP, resulting in two components of income tax expense: current and deferred. Current income tax expense reflects taxes to be paid or refunded for the current period by applying the provisions of the enacted tax law to the taxable income or excess of deductions over revenues. The Company determines deferred income taxes using the liability (or balance sheet) method. Under this method, the net deferred tax asset or liability is based on the tax effects of the differences between the book and tax bases of assets and liabilities, and enacted changes in tax rates and laws are recognized in the period in which they occur.
Deferred income tax expense results from changes in deferred tax assets and liabilities between periods. Deferred tax assets are recognized if it is more likely than not, based on the technical merits, that the tax position will be realized or sustained upon examination. The term “more likely than not” means a likelihood of more than fifty percent; the terms “examined” and “upon examination” also include resolution of the related appeals or litigation processes, if any. A tax position that meets the more-likely-than-not recognition threshold is initially and subsequently measured as the largest amount of tax benefit that has a greater than fifty percent likelihood of being realized upon settlement with a taxing authority that has full knowledge of all relevant information. The determination of whether or not a tax position has met the more-likely-than-not recognition threshold considers the facts, circumstances, and information available at the reporting date and is subject to management’s judgment. Deferred tax assets are reduced by a valuation allowance if, based on the weight of evidence available, it is more likely than not that some portion or all of a deferred tax asset will not be realized. As of December 31, 2017, management is not aware of any uncertain tax positions that would have a material effect on the Company’s consolidated financial statements.
Fair Value of Financial Instruments. The carrying amounts for the Company’s cash and cash equivalents approximate their fair values at December 31, 2017 and 2016. Fair values for securities or financial instruments are based on the framework for measuring fair value established by U.S. GAAP (see Note 7 — “Fair Value Measurements”).
Stock-Based Compensation. The Company accounts for stock-based compensation under the fair value recognition provisions of U.S. GAAP which requires the measurement and recognition of compensation for all stock-based awards made to employees and directors including stock options and restricted stock issuances based on estimated fair values. In accordance with U.S. GAAP, the fair value of stock-based awards to employees is generally recognized as compensation expense over the requisite service period, which is defined as the period during which an employee is required to provide service in exchange for an award. The Company uses a straight-line attribution method for all grants that include only a service condition. The Company’s restricted stock awards include service and market conditions. As a result, restricted stock grants with market conditions are expensed over the derived service period for each separately vesting tranche. Compensation expense related to all awards is included in general and administrative personnel expenses. The Company receives a windfall tax benefit for certain stock option exercises during the period of exercise and for restricted stock awards if these awards vest at a higher value than the value used to recognize compensation expense. In the event the restricted stock awards vest at a lower value than the value used to recognize compensation expense, the Company experiences a tax shortfall. The Company recognizes tax windfalls and shortfalls in the consolidated statement of income. Prior to January 1, 2017, the windfall tax benefit was recognized in additional paid-in-capital in the consolidated statements of stockholders’ equity whereas the shortfall was charged to additional paid-in-capital to the extent of the Company’s pool of windfall tax benefits with any remainder recognized in income tax expense. For 2016, all shortfall amounts were charged to additional paid-in-capital with no additional income tax expense recognized for these shortfalls.
80
Table of Contents
HCI GROUP, INC. AND SUBSIDIARIES
Notes to Consolidated Financial Statements
(Amounts in thousands, except share and per share amounts, unless otherwise stated)
Basic and diluted earnings (loss) per common share. Basic earnings (loss) per common share is computed by dividing net income (loss) attributable to common stockholders by the weighted-average number of common shares outstanding for the period. U.S. GAAP requires the inclusion of restricted stock as participating securities since holders of the Company’s restricted stock have the right to share in dividends, if declared, equally with common stockholders. In addition, the intrinsic value of restricted stock declines when the Company experiences operating losses. As a result, holders of the Company’s restricted stock are allocated a proportional share of net income and loss determined by dividing total weighted-average shares of restricted stock by the sum of total weighted-average common shares and shares of restricted stock (the “two-class method”). Diluted earnings (loss) per common share reflect the potential dilution that could occur if securities or other contracts to issue common stock were exercised or converted as well as participating equities. During loss periods, common stock equivalents such as stock options and convertible debt are excluded from the calculation of diluted loss per share, as the inclusion would have an anti-dilutive effect. See Note 18 — “Earnings Per Share” for potentially dilutive securities at December 31, 2017, 2016 and 2015.
Statutory Accounting Practices. The Company’s U.S. insurance subsidiaries comply with statutory accounting practices prescribed by the National Association of Insurance Commissioners. There are no state prescribed or permitted practices that have been adopted by the Company’s U.S. subsidiaries. In addition, the Company’s Bermuda insurance subsidiary prepares and files financial statements in accordance with the prescribed regulatory accounting practices of the Bermuda Monetary Authority.
Reclassifications. Certain reclassifications of prior year amounts have been made to conform to the current year presentation. For example, certain payroll-related costs such as share-based compensation expense, payroll taxes and employee benefits, which were previously reported in other operating expenses totaling $7,163 and $8,136 for the years ended December 31, 2016 and 2015, respectively, were reclassified to general and administrative personnel expenses to conform with the 2017 presentation.
Note 3 — Recent Accounting Pronouncements
Accounting Standards Update No. 2017-09. In May 2017, the FASB issued Accounting Standards Update No. 2017-09 (“ASU 2017-09”), Compensation-Stock Compensation (Topic 718): Scope of Modification Accounting, which provides guidance about which changes to the terms or conditions of a share-based payment award require an application of modification accounting. ASU 2017-09 is effective for the Company beginning with the first quarter of 2018. Early adoption is permitted. This guidance will impact the Company’s accounting for any future modification of its existing share-based awards.
81
Table of Contents
HCI GROUP, INC. AND SUBSIDIARIES
Notes to Consolidated Financial Statements
(Amounts in thousands, except share and per share amounts, unless otherwise stated)
Accounting Standards Update No. 2017-08. In March 2017, the FASB issued Accounting Standards Update No. 2017-08 (“ASU 2017-08”), Receivables – Nonrefundable Fees and Other Costs (Subtopic 310-20): Premium Amortization on Purchased Callable Debt Securities, which amends guidance on the amortization period of premiums on certain purchased callable debt securities. Specifically, this update shortens the amortization period of certain purchased callable debt securities to the earliest call date. ASU 2017-08 is effective for the Company beginning with the first quarter of 2019. Early adoption is permitted. The Company does not anticipate significant impact from this guidance.
Accounting Standards Update No. 2017-05. In February 2017, the FASB issued Accounting Standards Update No. 2017-05 (“ASU 2017-05”), Other Income—Gains and Losses from the Derecognition of Nonfinancial Assets (Subtopic 610-20), which clarifies the scope of asset derecognition guidance and accounting for partial sales of nonfinancial assets. In addition, ASU 2017-15 eliminates the exception in the financial asset guidance for transfers of investments including equity method investments in real estate entities and supersedes the guidance in the Exchanges of a Nonfinancial Asset for a Noncontrolling Ownership Interest subsection (Topic 845). ASU 2017-05 is effective for the Company beginning with the first quarter of 2018. The Company does not anticipate significant impact from this guidance.
Accounting Standards Update No. 2017-03. In January 2017, the FASB issued Accounting Standards Update No. 2017-03 (“ASU 2017-03”), Accounting Changes and Error Corrections (Topic 250) and Investments—Equity Method and Joint Ventures (Topic 323), which adds and amends SEC paragraphs pursuant to SEC Staff Announcements at the September 22, 2016 and November 17, 2016 Emerging Issues Task Force meetings. The announcement made at the September 22, 2016 meeting provides the SEC staff view on the disclosure of the impact that recently issued accounting standards will have on a public entity’s financial statements when the standards are adopted in a future period. This announcement applies to ASU 2014-09, Revenue from Contracts with Customers (Topic 606); ASU 2016-02, Leases (Topic 842); ASU 2016-13, Financial Instruments—Credit Losses (Topic 326) and any subsequent amendments to guidance in the ASUs that are issued prior to the adoption of the aforementioned ASUs.
Accounting Standards Update No. 2017-01. In January 2017, the FASB issued Accounting Standards Update No. 2017-01 (“ASU 2017-01”), Business Combinations (Topic 805), which clarifies the definition of a business and provides a screen to determine when an integrated set of assets and activities is not a business. If the screen is not met, a set must include, at a minimum, an input and a substantive process that together significantly contribute to the ability to create output to be considered a business. ASU 2017-01 is effective for the Company beginning with the first quarter of 2018. Early adoption is permitted under certain circumstances. When adopted, this guidance will impact how the Company determines whether a transaction should be accounted for as an acquisition (or disposal) of an asset or a business. The Company elected to adopt this standard in the fourth quarter of 2017.
82
Table of Contents
HCI GROUP, INC. AND SUBSIDIARIES
Notes to Consolidated Financial Statements
(Amounts in thousands, except share and per share amounts, unless otherwise stated)
Accounting Standards to be Adopted in Fiscal Year 2018
In February 2018, the FASB issued Accounting Standards Update No. 2018-02 (“ASU 2018-02”), Income Statement – Reporting Comprehensive Income (Topic 220), primarily allowing a reclassification from accumulated other comprehensive income to retained earnings for stranded tax effects resulting from the Tax Cuts and Jobs Act of 2017. Early adoption is permitted. The Company elected to early adopt this standard in the first quarter of 2018, which has no impact to the Company’s financial position.
In January 2016, the FASB issued Accounting Standards Update No. 2016-01 (“ASU 2016-01”), Financial Instruments – Overall (Subtopic 825-10), primarily requiring all equity investments other than those accounted for under the equity method of accounting or those that result in consolidation of the investee to be measured at fair value with changes in the fair value recognized through net income. The application of ASU 2016-01 could cause the Company to experience significant volatility in earnings. Under current accounting policy, the Company recognizes unrealized holding gains and losses on available-for-sale equity securities in stockholders’ equity as a component of accumulated other comprehensive income. In the year of adoption, the unrealized holding gains and losses of available-for-sale equity securities reported in accumulated other comprehensive income at December 31, 2017 will be reclassified to beginning retained income. Any subsequent changes in fair value will be recognized in the consolidated statement of income. In addition, the classification of the Company’s equity securities with readily determinable fair values as “available-for-sale” in the consolidated balance sheet and related disclosures will be eliminated.
In May 2014, the FASB issued Accounting Standards Update No. 2014-09 (“ASU 2014-09”), Revenue from Contracts with Customers (Topic 606). The core principle of the guidance is that an entity should recognize revenue to depict the transfer of promised goods or services to customers in an amount that reflects the consideration to which the entity expects to be entitled in exchange for those goods or services. ASU 2014-09 supersedes the revenue recognition requirements in Topic 605, Revenue Recognition, and most industry-specific guidance throughout the Industry Topics of the Codification. ASU 2014-09 also amends the existing requirements for the recognition of a gain or loss on the transfer of nonfinancial assets that are not in a contract with a customer to be consistent with the guidance in this ASU. ASU 2014-09 permits two methods of adoption: a full retrospective method or a modified retrospective method. The Company has identified and reviewed impacted revenue generating activities in accordance with the five-step revenue recognition model specified by this standard. The Company elects to use a modified retrospective method for transition to the new revenue recognition standard. Based on the Company’s assessment, the impact will be limited to the related disclosures of certain revenue generating activities as its primary source of revenue from insurance premiums is not within the scope of this new standard.
83
Table of Contents
HCI GROUP, INC. AND SUBSIDIARIES
Notes to Consolidated Financial Statements
(Amounts in thousands, except share and per share amounts, unless otherwise stated)
Note 4 — Investments
a) Available-for-Sale Securities
The Company holds investments in fixed-maturity securities and equity securities that are classified as available-for-sale. At December 31, 2017 and 2016, the cost or amortized cost, gross unrealized gains and losses, and estimated fair value of the Company’s available-for-sale securities by security type were as follows:
| Cost or Amortized Cost |
Gross Unrealized Gain |
Gross Unrealized Loss |
Estimated Fair Value |
|||||||||||||
| As of December 31, 2017 |
||||||||||||||||
| Fixed-maturity securities |
||||||||||||||||
| U.S. Treasury and U.S. government agencies |
$ | 42,313 | $ | 1 | $ | (287 | ) | $ | 42,027 | |||||||
| Corporate bonds |
106,897 | 1,110 | (904 | ) | 107,103 | |||||||||||
| State, municipalities, and political subdivisions |
78,954 | 1,816 | (75 | ) | 80,695 | |||||||||||
| Exchange-traded debt |
7,666 | 197 | (204 | ) | 7,659 | |||||||||||
|
|
|
|
|
|
|
|
|
|||||||||
| Total |
235,830 | 3,124 | (1,470 | ) | 237,484 | |||||||||||
| Equity securities |
53,132 | 6,280 | (501 | ) | 58,911 | |||||||||||
|
|
|
|
|
|
|
|
|
|||||||||
| Total available-for-sale securities |
$ | 288,962 | $ | 9,404 | $ | (1,971 | ) | $ | 296,395 | |||||||
|
|
|
|
|
|
|
|
|
|||||||||
| As of December 31, 2016 |
||||||||||||||||
| Fixed-maturity securities |
||||||||||||||||
| U.S. Treasury and U.S. government agencies |
$ | 1,975 | $ | — | $ | (36 | ) | $ | 1,939 | |||||||
| Corporate bonds |
75,538 | 607 | (1,641 | ) | 74,504 | |||||||||||
| State, municipalities, and political subdivisions |
78,018 | 776 | (488 | ) | 78,306 | |||||||||||
| Exchange-traded debt |
11,463 | 36 | (237 | ) | 11,262 | |||||||||||
| Redeemable preferred stock |
237 | 3 | (3 | ) | 237 | |||||||||||
|
|
|
|
|
|
|
|
|
|||||||||
| Total |
167,231 | 1,422 | (2,405 | ) | 166,248 | |||||||||||
| Equity securities |
47,750 | 5,769 | (484 | ) | 53,035 | |||||||||||
|
|
|
|
|
|
|
|
|
|||||||||
| Total available-for-sale securities |
$ | 214,981 | $ | 7,191 | $ | (2,889 | ) | $ | 219,283 | |||||||
|
|
|
|
|
|
|
|
|
|||||||||
At December 31, 2017, fixed-maturity securities included $249 of U.S. Treasury securities related to a statutory deposit held in trust for the South Carolina Director of Insurance.
84
Table of Contents
HCI GROUP, INC. AND SUBSIDIARIES
Notes to Consolidated Financial Statements
(Amounts in thousands, except share and per share amounts, unless otherwise stated)
Expected maturities will differ from contractual maturities as borrowers may have the right to call or prepay obligations with or without penalties. The scheduled contractual maturities of fixed-maturity securities at December 31, 2017 and 2016 are as follows:
| December 31, | ||||||||||||||||
| 2017 | 2016 | |||||||||||||||
| Amortized Cost |
Estimated Fair Value |
Amortized Cost |
Estimated Fair Value |
|||||||||||||
|
Available-for-sale |
||||||||||||||||
| Due in one year or less |
$ | 35,386 | $ | 35,364 | $ | 2,656 | $ | 2,662 | ||||||||
| Due after one year through five years |
116,575 | 115,766 | 49,915 | 50,023 | ||||||||||||
| Due after five years through ten years |
57,415 | 58,984 | 90,360 | 89,332 | ||||||||||||
| Due after ten years |
26,454 | 27,370 | 24,300 | 24,231 | ||||||||||||
|
|
|
|
|
|
|
|
|
|||||||||
| $235,830 | $237,484 | $167,231 | $166,248 | |||||||||||||
|
|
|
|
|
|
|
|
|
|||||||||
Sales of Available-for-Sale Securities
Proceeds received, and the gross realized gains and losses from sales of available-for-sale securities, for the years ended December 31, 2017, 2016 and 2015 were as follows:
| Proceeds | Gross Realized Gains |
Gross Realized Losses |
||||||||||
| Year ended December 31, 2017 |
||||||||||||
| Fixed-maturity securities |
$ | 31,759 | $ | 2,176 | $ | (181 | ) | |||||
|
|
|
|
|
|
|
|||||||
| Equity securities |
$ | 42,657 | $ | 3,882 | $ | (1,565 | ) | |||||
|
|
|
|
|
|
|
|||||||
| Year ended December 31, 2016 |
||||||||||||
| Fixed-maturity securities |
$ | 40,454 | $ | 604 | $ | (79 | ) | |||||
|
|
|
|
|
|
|
|||||||
| Equity securities |
$ | 23,127 | $ | 2,656 | $ | (580 | ) | |||||
|
|
|
|
|
|
|
|||||||
| Year ended December 31, 2015 |
||||||||||||
| Fixed-maturity securities |
$ | 53,711 | $ | 253 | $ | (470 | ) | |||||
|
|
|
|
|
|
|
|||||||
| Equity securities |
$ | 25,695 | $ | 1,327 | $ | (1,718 | ) | |||||
|
|
|
|
|
|
|
|||||||
Other-than-temporary Impairment
The Company regularly reviews its individual investment securities for other-than-temporary impairment. The Company considers various factors in determining whether each individual security is other-than-temporarily impaired, including-
| • | the financial condition and near-term prospects of the issuer, including any specific events that may affect its operations or earnings; |
| • | the length of time and the extent to which the market value of the security has been below its cost or amortized cost; |
| • | general market conditions and industry or sector specific factors and other qualitative factors; |
| • | nonpayment by the issuer of its contractually obligated interest and principal payments; and |
| • | the Company’s intent and ability to hold the investment for a period of time sufficient to allow for the recovery of costs. |
85
Table of Contents
HCI GROUP, INC. AND SUBSIDIARIES
Notes to Consolidated Financial Statements
(Amounts in thousands, except share and per share amounts, unless otherwise stated)
Fixed-maturity Securities
For the year ended December 31, 2017, the Company recognized impairment losses of $428 related to the sale of four intent-to-sell fixed-maturity securities in the consolidated statement of income. For the year ended December 31, 2016, the Company recognized $1,565 of impairment losses on four fixed-maturity securities, representing $1,335 of additional losses recorded during the period and $230 of the net change recorded in other comprehensive income. For the year ended December 31, 2015, the Company recorded $705 of impairment losses on two fixed-maturity securities, of which $111 was considered other-than-temporarily impaired due to credit related losses, with the remaining amount of $594 related to non-credit factors.
The following table presents a rollforward of the cumulative credit losses in other-than-temporary impairments recognized in income for available for sale fixed-maturity securities:
| 2017 | 2016 | 2015 | ||||||||||
| Balance at January 1 |
$ | 475 | $ | 111 | $ | — | ||||||
| Credit impairments on impaired securities |
— | 475 | 111 | |||||||||
| Additional credit impairments on previously impaired securities |
— | 293 | — | |||||||||
| Credit impaired security fully disposed of for which there was no prior intent or requirement to sell |
(475 | ) | (385 | ) | — | |||||||
| Reduction due to increase in expected cash flows recognized over the remaining life of the previously impaired security |
— | (19 | ) | — | ||||||||
|
|
|
|
|
|
|
|||||||
| Balance at December 31 |
$ | — | $ | 475 | $ | 111 | ||||||
|
|
|
|
|
|
|
|||||||
During 2017, the Company sold two fixed-maturity securities with cumulative credit losses totaling $475. The decision to sell these securities before their maturity was primarily driven by the impact of the Tax Cut and Jobs Act signed into law in 2017. Of two fixed-maturity securities with credit related losses existing at December 31, 2015, one matured with full payment of principal and interest and one was sold due to uncertainties surrounding the issuer’s restructuring plan during 2016.
Equity Securities
In determining whether equity securities are other than temporarily impaired, the Company considers its intent and ability to hold a security for a period of time sufficient to allow for the recovery of cost, the length of time each security has been in an unrealized loss position, the extent of the decline and the near term prospect for recovery. At December 31, 2017, the Company had one equity security that was other-than-temporarily impaired. This compared with nine and 17 equity securities that were other-than-temporarily impaired at December 31, 2016 and 2015, respectively. The Company recognized impairment losses of $1,039, $917 and $4,570 in the consolidated statement of income for the years ended December 31, 2017, 2016 and 2015, respectively.
86
Table of Contents
HCI GROUP, INC. AND SUBSIDIARIES
Notes to Consolidated Financial Statements
(Amounts in thousands, except share and per share amounts, unless otherwise stated)
Securities with gross unrealized loss positions at December 31, 2017 and 2016, aggregated by investment category and length of time the individual securities have been in a continuous loss position, are as follows:
| Less Than Twelve Months | Twelve Months or Longer | Total | ||||||||||||||||||||||
| As of December 31, 2017 | Gross Unrealized Loss |
Estimated Fair Value |
Gross Unrealized Loss |
Estimated Fair Value |
Gross Unrealized Loss |
Estimated Fair Value |
||||||||||||||||||
| Fixed-maturity securities |
||||||||||||||||||||||||
| U.S. Treasury and U.S. government agencies |
$ | (246 | ) | $ | 40,587 | $ | (41 | ) | $ | 1,938 | $ | (287 | ) | $ | 42,525 | |||||||||
| Corporate bonds |
(174 | ) | 40,627 | (730 | ) | 30,563 | (904 | ) | 71,190 | |||||||||||||||
| State, municipalities, and political subdivisions |
(30 | ) | 9,775 | (45 | ) | 2,297 | (75 | ) | 12,072 | |||||||||||||||
| Exchange-traded debt |
(203 | ) | 2,481 | (1 | ) | 36 | (204 | ) | 2,517 | |||||||||||||||
|
|
|
|
|
|
|
|
|
|
|
|
|
|||||||||||||
| Total fixed-maturity securities |
(653 | ) | 93,470 | (817 | ) | 34,834 | (1,470 | ) | 128,304 | |||||||||||||||
| Equity securities |
(449 | ) | 12,812 | (52 | ) | 1,440 | (501 | ) | 14,252 | |||||||||||||||
|
|
|
|
|
|
|
|
|
|
|
|
|
|||||||||||||
| Total available-for-sale securities |
$ | (1,102 | ) | $ | 106,282 | $ | (869 | ) | $ | 36,274 | $ | (1,971 | ) | $ | 142,556 | |||||||||
|
|
|
|
|
|
|
|
|
|
|
|
|
|||||||||||||
At December 31, 2017, there were 135 securities in an unrealized loss position. Of these securities, 22 securities had been in an unrealized loss position for 12 months or longer.
| Less Than Twelve Months |
Twelve Months or Longer |
Total | ||||||||||||||||||||||
| As of December 31, 2016 | Gross Unrealized Loss |
Estimated Fair Value |
Gross Unrealized Loss |
Estimated Fair Value |
Gross Unrealized Loss |
Estimated Fair Value |
||||||||||||||||||
| Fixed-maturity securities |
||||||||||||||||||||||||
| U.S. Treasury and U.S. government agencies |
$ | (36 | ) | $ | 1,939 | $ | — | $ | — | $ | (36 | ) | $ | 1,939 | ||||||||||
| Corporate bonds |
(1,546 | ) | 43,859 | (95 | ) | 2,814 | (1,641 | ) | 46,673 | |||||||||||||||
| State, municipalities, and political subdivisions |
(441 | ) | 26,029 | (47 | ) | 3,036 | (488 | ) | 29,065 | |||||||||||||||
| Exchange-traded debt |
(191 | ) | 4,980 | (46 | ) | 1,954 | (237 | ) | 6,934 | |||||||||||||||
| Redeemable preferred stock |
(3 | ) | 47 | — | — | (3 | ) | 47 | ||||||||||||||||
|
|
|
|
|
|
|
|
|
|
|
|
|
|||||||||||||
| Total fixed-maturity securities |
(2,217 | ) | 76,854 | (188 | ) | 7,804 | (2,405 | ) | 84,658 | |||||||||||||||
| Equity securities |
(293 | ) | 10,042 | (191 | ) | 3,209 | (484 | ) | 13,251 | |||||||||||||||
|
|
|
|
|
|
|
|
|
|
|
|
|
|||||||||||||
| Total available-for-sale securities |
$ | (2,510 | ) | $ | 86,896 | $ | (379 | ) | $ | 11,013 | $ | (2,889 | ) | $ | 97,909 | |||||||||
|
|
|
|
|
|
|
|
|
|
|
|
|
|||||||||||||
At December 31, 2016, there were 134 securities in an unrealized loss position. Of these securities, 20 securities had been in an unrealized loss position for 12 months or longer. The gross unrealized loss of corporate bonds in an unrealized loss position for twelve months or more included $76 of other-than-temporary impairment losses related to non-credit factors.
87
Table of Contents
HCI GROUP, INC. AND SUBSIDIARIES
Notes to Consolidated Financial Statements
(Amounts in thousands, except share and per share amounts, unless otherwise stated)
b) Trading Securities
At December 31, 2017, the cost, net unrealized gains, and estimated fair value of the Company’s trading equity securities were $953, $92, and $1,045, respectively. There were no investments in trading equity securities at December 31, 2016.
Sales of Trading Securities
Proceeds received, and the gross realized gains and losses from sales of trading equity securities, for the year ended December 31, 2017 were as follows:
| Proceeds | Gross Realized Gains |
Gross Realized Losses |
||||||||||
| Year ended December 31, 2017 |
||||||||||||
| Equity securities |
$ | 2,625 | $ | 111 | $ | (77 | ) | |||||
|
|
|
|
|
|
|
|||||||
The Company did not hold any trading equity securities during 2016.
88
Table of Contents
HCI GROUP, INC. AND SUBSIDIARIES
Notes to Consolidated Financial Statements
(Amounts in thousands, except share and per share amounts, unless otherwise stated)
c) Limited Partnership Investments
The Company has interests in limited partnerships that are not registered or readily tradeable on a securities exchange. These partnerships are private equity funds managed by general partners who make decisions with regard to financial policies and operations. As such, the Company is not the primary beneficiary and does not consolidate these partnerships. In August 2017, the Company entered into a subscription agreement with another limited partnership. The following table provides information related to the Company’s investments in limited partnerships:
| December 31, 2017 | December 31, 2016 | |||||||||||||||||||||||
| Investment Strategy | Carrying Value |
Unfunded Balance |
(%)(a) | Carrying Value |
Unfunded Balance |
(%)(a) | ||||||||||||||||||
| Primarily in senior secured loans and, to a limited extent, in other debt and equity securities of private U.S. lower-middle-market companies. (b)(c)(e) |
$ | 7,276 | $ | 5,505 | 15.37 | $ | 6,246 | $ | 6,428 | 16.50 | ||||||||||||||
| Value creation through active distressed debt investing primarily in bank loans, public and private corporate bonds, asset-backed securities, and equity securities received in connection with debt restructuring. (b)(d)(e) |
7,951 | 1,745 | 1.76 | 7,358 | 1,360 | 1.76 | ||||||||||||||||||
| Maximum long-term capital appreciation through long and short positions in equity and/or debt securities of publicly traded U.S. and non-U.S. issuers, derivative instruments and certain other financial instruments. (f) |
— | — | — | 11,333 | — | 66.58 | ||||||||||||||||||
| High returns and long-term capital appreciation through investments in the power, utility and energy industries, and in the infrastructure sector. (b)(g)(h) |
7,509 | 2,512 | 0.18 | 4,326 | 5,766 | 0.18 | ||||||||||||||||||
| Value-oriented investments in less liquid and mispriced senior and junior debts of private equity-backed companies. (b)(i)(j) |
448 | 4,566 | 0.47 | — | — | — | ||||||||||||||||||
|
|
|
|
|
|
|
|
|
|||||||||||||||||
| Total |
$ | 23,184 | $ | 14,328 | $ | 29,263 | $ | 13,554 | ||||||||||||||||
|
|
|
|
|
|
|
|
|
|||||||||||||||||
| (a) | Represents the Company’s percentage investment in the fund at each balance sheet date. |
| (b) | Except under certain circumstances, withdrawals from the funds or any assignments are not permitted. Distributions, except income from late admission of a new limited partner, will be received when underlying investments of the funds are liquidated. |
| (c) | Expected to have a 10-year term and the capital commitment is expected to expire on September 3, 2019. |
| (d) | Expected to have a three-year term from the end of the capital commitment period, which is March 31, 2018. |
| (e) | At the fund manager’s discretion, the term of the fund may be extended for up to two additional one-year periods. |
| (f) | The withdrawal was effective on February 15, 2017. As a result, the Company’s investment in this limited partnership was terminated. |
| (g) | Expected to have a 10-year term and the capital commitment is expected to expire on June 30, 2020. |
| (h) | With the consent of a super majority of partners, the term of the fund may be extended for up to three additional one-year periods. |
| (i) | Expected to have a six-year term from the commencement date, which can be extended for up to two additional one-year periods with the consent of either the advisory committee or a majority of limited partners. |
| (j) | Unless extended or terminated for reasons specified in the agreement, the capital commitment is expected to expire on December 1, 2018. |
The following is the aggregated summarized unaudited financial information of limited partnerships included in the investment strategy table above, which in certain cases is presented on a three-month lag due to the unavailability of information at the Company’s respective balance sheet dates. In applying the equity method of accounting, the Company uses the most recently available financial information provided by the general partner of each of these partnerships. The financial statements of these limited partnerships are audited annually.
89
Table of Contents
HCI GROUP, INC. AND SUBSIDIARIES
Notes to Consolidated Financial Statements
(Amounts in thousands, except share and per share amounts, unless otherwise stated)
| Years Ended December 31, | ||||||||||||
| 2017 | 2016 | 2015 | ||||||||||
| Operating results: |
||||||||||||
| Total income |
$ | 409,169 | $ | 310,998 | $ | 4,350 | ||||||
| Total expenses |
105,281 | 185,126 | 77,508 | |||||||||
|
|
|
|
|
|
|
|||||||
| Net income (loss) |
$ | 303,888 | $ | 125,872 | $ | (73,158 | ) | |||||
|
|
|
|
|
|
|
|||||||
| December 31, | ||||||||
| 2017 | 2016 | |||||||
| Balance Sheet: |
||||||||
| Total assets |
$ | 4,381,321 | $ | 2,956,327 | ||||
| Total liabilities |
$ | 382,310 | $ | 63,813 | ||||
For the years ended December 31, 2017 and 2016, the Company recognized net investment income of $2,334 and $1,207, respectively, for these investments. For the year ended December 31, 2015, the Company recognized net investment loss of $3,244. At December 31, 2017 and 2016, the Company’s cumulative contributed capital to the partnerships existing at each respective balance sheet date totaled $21,172 and $31,946, respectively, and the Company’s maximum exposure to loss aggregated $23,184 and $29,263, respectively.
During the year ended December 31, 2017, the Company received total cash distributions of $12,639, representing $11,758 of returned capital and $881 of return on investment. Included in the return of capital was $11,626 from one limited partnership the Company withdrew from in February 2017. During the year ended December 31, 2016, the Company received in cash $544 of return on investment. There was a return on investment of $12 received by the Company during the year ended December 31, 2015.
For the years ended December 31, 2017, 2016 and 2015, the Company recognized its share of earnings or losses based on the respective partnership’s statement of income. The carrying value of these investments approximates the amount the Company expected to recover at December 31, 2017 and 2016.
d) Investment in Unconsolidated Joint Venture
Melbourne FMA, LLC, a wholly owned subsidiary, currently has a 90% equity interest in FMKT Mel JV, LLC (“FMJV”), a Florida limited liability company treated as a joint venture under U.S. GAAP. FMJV is deemed a variable interest entity due to its lack of sufficient equity to finance its operations without direct or indirect additional financial support from parties to the joint venture. Although Melbourne FMA holds a majority interest in FMJV, certain major economic decisions specified in the agreement are not under Melbourne FMA’s control. As a result, Melbourne FMA is not the primary beneficiary and is not required to consolidate FMJV.
In January 2016, FMJV sold a portion of its outparcel land for gross proceeds of $829, of which $515 was used to repay a portion of the construction loan obtained for its real estate development project. FMJV recognized a $404 gain on the outparcel sale of which $383 was allocated to the Company in accordance with the profit allocation specified in the operating agreement. On December 15, 2016, FMJV distributed its entire equity interest in FMKT Mel Manager, LLC (“FMKT MGA”),
90
Table of Contents
HCI GROUP, INC. AND SUBSIDIARIES
Notes to Consolidated Financial Statements
(Amounts in thousands, except share and per share amounts, unless otherwise stated)
its wholly owned subsidiary, to Melbourne FMA and the other member, each of which received 90% and 10%, respectively. In addition to operating a retail shopping center business, FMKT MGA owned land which included two outparcels. Melbourne FMA accounted for this transaction as a business step acquisition using the fair value method and, as a result, recognized a $4,005 gain on remeasurement of previously held interest. The gain represented the difference between the fair value of the 90% equity interest and its carrying value under the equity method. The fair value of the equity interest was comprised of the fair value of FMKT MGA’s underlying assets primarily determined by an independent appraiser offset by the fair value of liabilities assumed on the date of distribution. Inputs used by the appraiser included, but were not limited to, information about market and surrounding environments, demographics, and the sale or rent of similar types of property within the vicinity. Due to their short-term nature, the carrying value of current assets and assumed liabilities, including a variable interest rate revolving credit line, approximated fair value. See Pineda Landings - Melbourne, Florida in Note 6 — “Business Acquisitions” for additional information.
In March 2017, FMJV sold a portion of its outparcel land for gross proceeds of $825 and recognized a $331 gain on sale of which $199 was allocated to the Company in accordance with the profit allocation specified in the operating agreement. During 2017, FMKT MGA was merged with Melbourne FMA, LLC.
At December 31, 2017 and 2016, the Company’s maximum exposure to loss relating to the variable interest entity was $1,304 and $2,102, respectively, representing the carrying value of the investment. At December 31, 2017, there was $0 of undistributed income from this equity method investment as compared with an undistributed loss, after an equity distribution, of $25 at December 31, 2016, the amounts of which were included in the Company’s consolidated retained income.
For the year ended December 31, 2017, the Company received a cash distribution of $564, representing a combined distribution of $147 in earnings and $417 in capital. The limited liability company members received no cash distributions during 2016 and 2015. The following tables provide FMJV’s summarized unaudited financial results and the unaudited financial positions:
| Years Ended December 31, | ||||||||||||
| 2017 | 2016 | 2015 | ||||||||||
| Operating results: |
||||||||||||
| Total revenues |
$ | 331 | $ | — | $ | 118 | ||||||
| Total expenses |
483 | — | 257 | |||||||||
|
|
|
|
|
|
|
|||||||
| Net loss |
$ | (152 | ) | $ | — | $ | (139 | ) | ||||
|
|
|
|
|
|
|
|||||||
| The Company’s share of net loss (a) |
$ | (234 | ) | $ | — | $ | (125 | ) | ||||
| (a) | Included in net investment income in the Company’s consolidated statements of income. Gain from the sale of the outparcel during 2017 was allocated in accordance with the method specified in the operating agreement. |
91
Table of Contents
HCI GROUP, INC. AND SUBSIDIARIES
Notes to Consolidated Financial Statements
(Amounts in thousands, except share and per share amounts, unless otherwise stated)
| December 31, | ||||||||
| 2017 | 2016 | |||||||
| Balance Sheet: |
||||||||
| Construction in progress—real estate |
$ | 27 | $ | 334 | ||||
| Property and equipment, net |
1,199 | 1,654 | ||||||
| Cash |
236 | 179 | ||||||
| Other |
5 | 180 | ||||||
|
|
|
|
|
|||||
| Total assets |
$ | 1,467 | $ | 2,347 | ||||
|
|
|
|
|
|||||
| Accounts payable |
$ | $ | 11 | |||||
| Other liabilities |
18 | — | ||||||
| Members’ capital |
1,449 | 2,336 | ||||||
|
|
|
|
|
|||||
| Total liabilities and members’ capital |
$ | 1,467 | $ | 2,347 | ||||
|
|
|
|
|
|||||
| Investment in unconsolidated joint venture, at equity* |
$ | 1,304 | $ | 2,102 | ||||
| * | Included the 90% share of FMKT Mel JV’s operating results. |
FMJV’s assets at December 31, 2017 and 2016 included primarily three outparcels for sale or lease which have increased in value since the adjacent retail shopping center was completed. The Company determined that there was no impairment loss associated with these assets for the years ended December 31, 2017 and 2016. In the fourth quarter of 2017, FMJV decided to terminate its development plan for nearby land, thereby expensing $382 of deferred costs associated with the land feasibility study. The 2015 results reflected expenses incurred during the initial development stage. Because the Company expected to incur such expenses during development of the property and prior to its occupancy, the Company determined there was no impairment loss for the year ended December 31, 2015.
e) Real Estate Investments
Real estate investments include buildings with office and retail space for lease, outparcels, wet and dry boat storage, one restaurant, and two marinas. Real estate investments consist of the following as of December 31, 2017 and 2016:
| December 31, | ||||||||
| 2017 | 2016 | |||||||
| Land |
$ | 26,315 | $ | 17,592 | ||||
| Land improvements |
9,904 | 9,336 | ||||||
| Building |
21,284 | 16,154 | ||||||
| Tenant and leasehold improvements |
1,204 | 872 | ||||||
| Construction in progress* |
— | 3,404 | ||||||
| Other |
3,050 | 2,683 | ||||||
|
|
|
|
|
|||||
| Total, at cost |
61,757 | 50,041 | ||||||
| Less: accumulated depreciation and amortization |
(3,399 | ) | (1,955 | ) | ||||
|
|
|
|
|
|||||
| Real estate investments |
$ | 58,358 | $ | 48,086 | ||||
|
|
|
|
|
|||||
| * | This project, which was developed by the Company’s consolidated variable interest entity, was completed in July 2017. The capitalized costs were reclassified to land, land improvement, and building. |
92
Table of Contents
HCI GROUP, INC. AND SUBSIDIARIES
Notes to Consolidated Financial Statements
(Amounts in thousands, except share and per share amounts, unless otherwise stated)
On October 17, 2017, the Company, through a wholly owned subsidiary, acquired commercial real estate in Tampa, Florida for a purchase price of $9,100. The acquired assets primarily consisted of land, building and in-place lease agreements. The Company incurred approximately $115 of acquisition-related costs and accounted for this transaction as an asset acquisition in accordance with ASU 2017-01 which the Company early adopted in the fourth quarter of 2017. As a result, all transaction-related costs were allocated among the assets acquired. During 2016, the Company acquired properties through two business acquisitions. See Note 6 — “Business Acquisitions” for additional information. Depreciation and amortization expense related to real estate investments was $1,447, $531 and $370, respectively, for the years ended December 31, 2017, 2016 and 2015.
f) Consolidated Variable Interest Entity
The Company has a commercial property in Riverview, Florida. The development project of this property was completed in July 2017 through a limited liability company treated under U.S. GAAP as a joint venture in which the Company’s subsidiary had a controlling financial interest and, as a result, it was the primary beneficiary (See Note 27 — “Subsequent Events”). The real estate investments of this limited liability company primarily include a retail strip center with 8,400 square feet of net rentable space and an adjacent parcel of land which is currently leased in its entirety to a large gas station and convenience store chain. The following table summarizes the assets and liabilities related to this variable interest entity which are included in the accompanying consolidated balance sheets.
| December 31, | ||||||||
| 2017 | 2016 | |||||||
| Cash and cash equivalents |
$ | — | $ | 65 | ||||
| Construction in progress included in real estate investments |
$ | — | $ | 3,404 | ||||
| Real estate investments |
$ | 4,680 | $ | — | ||||
| Other assets |
$ | 152 | $ | — | ||||
| Accrued expenses |
$ | 21 | $ | 68 | ||||
| Other liabilities |
$ | 160 | $ | 11 | ||||
g) Net Investment Income
Net investment income (loss), by source, is summarized as follows:
| Years Ended December 31, | ||||||||||||
| 2017 | 2016 | 2015 | ||||||||||
| Available-for-sale securities: |
||||||||||||
| Fixed-maturity securities |
$ | 5,689 | $ | 4,589 | $ | 3,935 | ||||||
| Equity securities |
3,318 | 3,452 | 3,710 | |||||||||
| Investment expense |
(726 | ) | (651 | ) | (673 | ) | ||||||
| Limited partnership investments |
2,334 | 1,207 | (3,244 | ) | ||||||||
| Real estate investments |
(1,018 | ) | (592 | ) | (343 | ) | ||||||
| Loss from unconsolidated joint venture |
(234 | ) | — | (125 | ) | |||||||
| Cash and cash equivalents |
2,069 | 1,036 | 661 | |||||||||
| Other |
7 | 46 | 57 | |||||||||
|
|
|
|
|
|
|
|||||||
| Net investment income |
$ | 11,439 | $ | 9,087 | $ | 3,978 | ||||||
|
|
|
|
|
|
|
|||||||
93
Table of Contents
HCI GROUP, INC. AND SUBSIDIARIES
Notes to Consolidated Financial Statements
(Amounts in thousands, except share and per share amounts, unless otherwise stated)
At December 31, 2017, $87,092 or 34.1% of the Company’s cash and cash equivalents were deposited at three national banks and included $38,543 in three custodial accounts. At December 31, 2016, $203,139 or 72.6% of the Company’s cash and cash equivalents were deposited at three national banks and included $28,431 in three custodial accounts. At December 31, 2017 and 2016, the Company’s cash deposits at any one bank generally exceed the Federal Deposit Insurance Corporation’s $250 coverage limit for insured deposit accounts.
Note 5 — Comprehensive Income (Loss)
Comprehensive income (loss) includes net income (loss) and other comprehensive income or loss, which for the Company includes changes in unrealized gains or losses of investments carried at fair value and changes in the unrealized other-than-temporary impairment losses related to these investments. Reclassification adjustments for realized (gains) losses are reflected in net realized investment gains (losses) on the consolidated statements of income. The components of other comprehensive income or loss and the related tax effects allocated to each component were as follows:
| Year Ended December 31, 2017 | ||||||||||||
| Before Tax |
Income Tax Expense (Benefit) |
Net of Tax |
||||||||||
| Unrealized gain arising during the period |
$ | 5,996 | $ | 2,313 | $ | 3,683 | ||||||
| Other-than-temporary impairment loss |
1,467 | 566 | 901 | |||||||||
| Call and repayment losses charged to investment income |
14 | 5 | 9 | |||||||||
| Reclassification adjustment for realized gains |
(4,346 | ) | (1,676 | ) | (2,670 | ) | ||||||
|
|
|
|
|
|
|
|||||||
| Total other comprehensive income |
$ | 3,131 | $ | 1,208 | $ | 1,923 | ||||||
|
|
|
|
|
|
|
|||||||
| Year Ended December 31, 2016 | ||||||||||||
| Before Tax |
Income Tax Expense (Benefit) |
Net of Tax |
||||||||||
| Unrealized gain arising during the period |
$ | 7,317 | $ | 2,823 | $ | 4,494 | ||||||
| Other-than-temporary impairment loss |
2,482 | 957 | 1,525 | |||||||||
| Call and repayment losses charged to investment income |
20 | 8 | 12 | |||||||||
| Reclassification adjustment for realized gains |
(2,601 | ) | (1,004 | ) | (1,597 | ) | ||||||
|
|
|
|
|
|
|
|||||||
| Total other comprehensive income |
$ | 7,218 | $ | 2,784 | $ | 4,434 | ||||||
|
|
|
|
|
|
|
|||||||
| Year Ended December 31, 2015 | ||||||||||||
| Before Tax |
Income Tax Expense (Benefit) |
Net of Tax |
||||||||||
| Unrealized loss arising during the period |
$ | (9,366 | ) | $ | (3,613 | ) | $ | (5,753 | ) | |||
| Other-than-temporary impairment loss |
4,681 | 1,806 | 2,875 | |||||||||
| Call and repayment losses charged to investment income |
77 | 29 | 48 | |||||||||
| Reclassification adjustment for realized losses |
608 | 235 | 373 | |||||||||
|
|
|
|
|
|
|
|||||||
| Total other comprehensive loss |
$ | (4,000 | ) | $ | (1,543 | ) | $ | (2,457 | ) | |||
|
|
|
|
|
|
|
|||||||
94
Table of Contents
HCI GROUP, INC. AND SUBSIDIARIES
Notes to Consolidated Financial Statements
(Amounts in thousands, except share and per share amounts, unless otherwise stated)
Note 6 — Business Acquisitions
Sorrento Hills Village—Sorrento, Florida
On August 16, 2016, the Company’s wholly owned subsidiary, Greenleaf Capital, LLC, assigned the right to purchase the developed property in the ADC Arrangement to its subsidiary, Sorrento PBX, LLC. Sorrento PBX simultaneously exercised the purchase option and acquired the property from Sorrento Retail Investments, LLC. The acquired assets included a retail shopping center and appurtenant facilities in Sorrento, Florida as well as existing tenant lease agreements to use the property. The purchase price was $12,250, which was determined using a predetermined capitalization rate and the projected net operating income of the property. The Company recognized a $2,071 gain on bargain purchase, resulting primarily from a favorable fair value at the date of acquisition as compared with the Company’s purchase price. The Company relied on an independent appraisal report, which is based on the weighted results of two valuation approaches, in determining the estimated fair values of the significant assets acquired. This acquisition was financed in part by the proceeds from the issuance of a 3.75% promissory note. See Note 13 — “Long-Term Debt” for additional information.
The table below presents an allocation of the purchase price to the net assets acquired based on their fair values at the acquisition date:
| Identifiable assets acquired and liabilities assumed: |
||||
| Cash |
$ | 194 | ||
| Land |
1,600 | |||
| Land improvements |
3,045 | |||
| Buildings |
7,120 | |||
| Intangibles |
2,580 | |||
| Tenant improvements |
76 | |||
| Building improvement |
29 | |||
| Other assets |
33 | |||
| Other liabilities |
(356 | ) | ||
|
|
|
|||
| Total net assets acquired |
14,321 | |||
| Less: Gain on bargain purchase |
(2,071 | ) | ||
|
|
|
|||
| Purchase price |
$ | 12,250 | ||
|
|
|
Pineda Landings—Melbourne, Florida
With regard to the 90% equity interest in FMKT MGA distributed by FMJV as described in Investment in Unconsolidated Joint Venture in Note 4 — “Investments,” the transaction was accounted for as a business step acquisition resulting in the assets acquired and liabilities assumed being recorded at fair value. Immediately following FMJV’s distribution of the 90% equity interest, the Company elected to purchase the remaining 10% noncontrolling interest from the other member and pay $2,064 in cash in 2016, plus an additional $200 in January 2017 upon the execution of one lease agreement. The Company funded the consideration paid with $871 of its own cash and $1,193 of additional borrowing from FMKT MGA’s revolving credit facility.
95
Table of Contents
HCI GROUP, INC. AND SUBSIDIARIES
Notes to Consolidated Financial Statements
(Amounts in thousands, except share and per share amounts, unless otherwise stated)
The table below presents the fair values of the net assets acquired at the acquisition date:
| Identifiable assets acquired and liabilities assumed: |
||||
| Cash |
$ | 502 | ||
| Land |
2,857 | |||
| Land improvements |
4,671 | |||
| Buildings |
5,480 | |||
| Intangibles |
2,619 | |||
| Tenant improvements |
403 | |||
| Building improvement |
403 | |||
| Other property and equipment |
17 | |||
| Other assets |
940 | |||
| Construction loan |
(8,214 | ) | ||
| Other liabilities |
(550 | ) | ||
|
|
|
|||
| Total net assets acquired |
9,128 | |||
| Less: Carrying value of 90% equity method investment |
(2,859 | ) | ||
| Gain on remeasurement of previously held interest |
(4,005 | ) | ||
| Payable to the 10% joint venture partner |
(200 | ) | ||
|
|
|
|||
| Cash paid to the 10% joint venture partner |
$ | 2,064 | ||
|
|
|
Subsequent to the acquisition date, the Company incurred an impairment loss of $388 in 2016 resulting from the write-down of lease intangibles and other assets associated with the unexpected closure of one tenant’s business at this property.
The acquired businesses, in aggregate, contributed $426 of rental income and $460 of net loss to the Company for the period from the acquisition date to December 31, 2016. Pro forma results of operations are not presented as the effects of the acquisition were not material to the Company’s consolidated results of operations.
Note 7 — Fair Value Measurements
The Company records and discloses certain financial assets at their estimated fair value. The fair value hierarchy prioritizes the inputs to valuation techniques used to measure fair value into three broad levels as follows:
| Level 1 - | Unadjusted quoted prices in active markets for identical assets. | |
| Level 2 - | Other inputs that are observable for the assets, either directly or indirectly such as quoted prices for identical assets that are not observable throughout the full term of the asset. | |
| Level 3 - | Inputs that are unobservable. | |
96
Table of Contents
HCI GROUP, INC. AND SUBSIDIARIES
Notes to Consolidated Financial Statements
(Amounts in thousands, except share and per share amounts, unless otherwise stated)
Valuation Methodology
Cash and cash equivalents
Cash and cash equivalents primarily consist of money-market funds and certificates of deposit. Their carrying value approximates fair value due to the short maturity and high liquidity of these funds.
Available-for-sale and trading securities
Estimated fair values of the Company’s available-for-sale and trading securities are determined in accordance with U.S. GAAP, using valuation techniques that maximize the use of observable inputs and minimize the use of unobservable inputs. Fair values are generally measured using quoted prices in active markets for identical securities or other inputs that are observable either directly or indirectly, such as quoted prices for similar securities. In those instances where observable inputs are not available, fair values are measured using unobservable inputs. Unobservable inputs reflect the Company’s own assumptions about the assumptions that market participants would use in pricing the security and are developed based on the best information available in the circumstances. Fair value estimates derived from unobservable inputs are significantly affected by the assumptions used, including the discount rates and the estimated amounts and timing of future cash flows. The derived fair value estimates cannot be substantiated by comparison to independent markets and are not necessarily indicative of the amounts that would be realized in a current market exchange.
The estimated fair values for securities that do not trade on a daily basis are determined by management, utilizing prices obtained from an independent pricing service and information provided by brokers, which are level 2 inputs. Management reviews the assumptions and methods utilized by the pricing service and then compares the relevant data and pricing to broker-provided data. The Company gains assurance of the overall reasonableness and consistent application of the assumptions and methodologies and compliance with accounting standards for fair value determination through ongoing monitoring of the reported fair values.
Limited Partnership Investments
As described in Note 4 — “Investments” under Limited Partnership Investments, the Company has interests in limited partnerships which are private equity funds. Pursuant to U.S. GAAP, these funds are required to use fair value accounting; therefore, the estimated fair value approximates the carrying value of these funds.
Revolving Credit Facility
The interest rate on the Company’s revolving credit facility was periodically adjusted based on the London Interbank Offered Rate plus a spread. As a result, its carrying value at December 31, 2016 approximated fair value. In February 2017, this credit facility was converted into a 3.95% three-year promissory note. See Note 13 — “Long-Term Debt” under 3.95% Promissory Note.
97
Table of Contents
HCI GROUP, INC. AND SUBSIDIARIES
Notes to Consolidated Financial Statements
(Amounts in thousands, except share and per share amounts, unless otherwise stated)
Long-term debt
The following table summarizes components of the Company’s long-term debt and methods used in estimating their fair values:
| Maturity Date |
Valuation Methodology | |||
| 8% Senior Notes |
* | Closing price listed on the New York Stock Exchange | ||
| 3.875% Convertible Senior Notes |
2019 | Quoted price at January 3, 2018; Discounted cash flow method/Level 3 inputs at December 31, 2016 | ||
| 4.25% Convertible Senior Notes |
2037 | Quoted price | ||
| 3.95% Promissory Note |
2020 | Discounted cash flow method/Level 3 inputs | ||
| 4% Promissory Note |
2031 | Discounted cash flow method/Level 3 inputs | ||
| 3.75% Promissory Note |
2036 | Discounted cash flow method/Level 3 inputs |
| * | Redeemed on April 3, 2017. |
Assets Measured at Estimated Fair Value on a Recurring Basis:
The following tables present information about the Company’s financial assets measured at estimated fair value on a recurring basis. The table indicates the fair value hierarchy of the valuation techniques utilized by the Company to determine such fair value as of December 31, 2017 and 2016:
| Fair Value Measurements Using | ||||||||||||||||
| (Level 1) | (Level 2) | (Level 3) | Total | |||||||||||||
| As of December 31, 2017 |
||||||||||||||||
| Financial Assets: |
||||||||||||||||
| Cash and cash equivalents |
$ | 255,884 | $ | — | $ | — | $ | 255,884 | ||||||||
|
|
|
|
|
|
|
|
|
|||||||||
| Fixed-maturity securities: |
||||||||||||||||
| U.S. Treasury and U.S. government agencies |
40,527 | 1,500 | — | 42,027 | ||||||||||||
| Corporate bonds |
106,109 | 994 | — | 107,103 | ||||||||||||
| State, municipalities, and political subdivisions |
— | 80,695 | — | 80,695 | ||||||||||||
| Exchange-traded debt |
7,659 | — | — | 7,659 | ||||||||||||
|
|
|
|
|
|
|
|
|
|||||||||
| Total fixed-maturity securities |
154,295 | 83,189 | — | 237,484 | ||||||||||||
| Equity securities |
58,911 | — | — | 58,911 | ||||||||||||
|
|
|
|
|
|
|
|
|
|||||||||
| Total available-for-sale securities |
213,206 | 83,189 | — | 296,395 | ||||||||||||
|
|
|
|
|
|
|
|
|
|||||||||
| Trading equity securities |
1,045 | — | — | 1,045 | ||||||||||||
|
|
|
|
|
|
|
|
|
|||||||||
| Total |
$ | 470,135 | $ | 83,189 | $ | — | $ | 553,324 | ||||||||
|
|
|
|
|
|
|
|
|
|||||||||
98
Table of Contents
HCI GROUP, INC. AND SUBSIDIARIES
Notes to Consolidated Financial Statements
(Amounts in thousands, except share and per share amounts, unless otherwise stated)
| Fair Value Measurements Using | ||||||||||||||||
| (Level 1) | (Level 2) | (Level 3) | Total | |||||||||||||
| As of December 31, 2016 |
||||||||||||||||
| Financial Assets: |
||||||||||||||||
| Cash and cash equivalents |
$ | 280,531 | $ | — | $ | — | $ | 280,531 | ||||||||
|
|
|
|
|
|
|
|
|
|||||||||
| Fixed-maturity securities: |
||||||||||||||||
| U.S. Treasury and U.S. government agencies |
1,939 | — | — | 1,939 | ||||||||||||
| Corporate bonds |
73,519 | 985 | — | 74,504 | ||||||||||||
| State, municipalities, and political subdivisions |
— | 78,306 | — | 78,306 | ||||||||||||
| Exchange-traded debt |
11,262 | — | — | 11,262 | ||||||||||||
| Redeemable preferred stock |
237 | — | — | 237 | ||||||||||||
|
|
|
|
|
|
|
|
|
|||||||||
| Total fixed-maturity securities |
86,957 | 79,291 | — | 166,248 | ||||||||||||
| Equity securities |
53,035 | — | — | 53,035 | ||||||||||||
|
|
|
|
|
|
|
|
|
|||||||||
| Total available-for-sale securities |
139,992 | 79,291 | — | 219,283 | ||||||||||||
|
|
|
|
|
|
|
|
|
|||||||||
| Total |
$ | 420,523 | $ | 79,291 | $ | — | $ | 499,814 | ||||||||
|
|
|
|
|
|
|
|
|
|||||||||
There were no transfers between Level 1, 2 or 3 during the years ended December 31, 2017 and 2016.
Assets and Liabilities Carried at Other Than Fair Value
The following tables present fair value information for assets and liabilities that are carried on the balance sheet at amounts other than fair value as of December 31, 2017 and 2016:
| Carrying | Fair Value Measurements Using | Estimated | ||||||||||||||||||
| Value | (Level 1) | (Level 2) | (Level 3) | Fair Value | ||||||||||||||||
| As of December 31, 2017 |
||||||||||||||||||||
| Financial Assets: |
||||||||||||||||||||
| Limited partnership investments |
$ | 23,184 | $ | — | $ | — | $ | 23,184 | $ | 23,184 | ||||||||||
| Financial Liabilities: |
||||||||||||||||||||
| Long-term debt: |
||||||||||||||||||||
| 3.875% Convertible senior notes |
$ | 85,436 | $ | — | $ | 90,827 | $ | — | $ | 90,827 | ||||||||||
| 4.25% Convertible senior notes |
126,454 | — | 124,444 | — | 124,444 | |||||||||||||||
| 3.95% Promissory note |
9,270 | — | — | 7,894 | 7,894 | |||||||||||||||
| 4% Promissory note |
8,206 | — | — | 7,820 | 7,820 | |||||||||||||||
| 3.75% Promissory note |
8,469 | — | — | 9,227 | 9,227 | |||||||||||||||
|
|
|
|
|
|
|
|
|
|
|
|||||||||||
| Total long-term debt |
$ | 237,835 | $ | — | $ | 215,271 | $ | 24,941 | $ | 240,212 | ||||||||||
|
|
|
|
|
|
|
|
|
|
|
|||||||||||
99
Table of Contents
HCI GROUP, INC. AND SUBSIDIARIES
Notes to Consolidated Financial Statements
(Amounts in thousands, except share and per share amounts, unless otherwise stated)
| Carrying | Fair Value Measurements Using | Estimated | ||||||||||||||||||
| Value | (Level 1) | (Level 2) | (Level 3) | Fair Value | ||||||||||||||||
| As of December 31, 2016 |
||||||||||||||||||||
| Financial Assets: |
||||||||||||||||||||
| Limited partnership investments |
$ | 29,263 | $ | — | $ | — | $ | 29,263 | $ | 29,263 | ||||||||||
| Financial Liabilities: |
||||||||||||||||||||
| Revolving credit facility |
$ | 9,463 | $ | — | $ | — | $ | 9,463 | $ | 9,463 | ||||||||||
| Long-term debt: |
||||||||||||||||||||
| 8% Senior notes |
$ | 39,448 | $ | — | $ | 41,618 | $ | — | $ | 41,618 | ||||||||||
| 3.875% Convertible senior notes |
81,988 | — | — | 84,696 | 84,696 | |||||||||||||||
| 4% Promissory note |
8,660 | — | — | 8,664 | 8,664 | |||||||||||||||
| 3.75% Promissory note |
8,767 | — | — | 8,506 | 8,506 | |||||||||||||||
|
|
|
|
|
|
|
|
|
|
|
|||||||||||
| Total long-term debt |
$ | 138,863 | $ | — | $ | 41,618 | $ | 101,866 | $ | 143,484 | ||||||||||
|
|
|
|
|
|
|
|
|
|
|
|||||||||||
Note 8 — Deferred Policy Acquisition Costs
The following table summarizes the activity with respect to deferred policy acquisition costs:
| December 31, | ||||||||
| 2017 | 2016 | |||||||
| Beginning balance |
$ | 16,639 | $ | 18,602 | ||||
| Policy acquisition costs deferred |
35,736 | 35,905 | ||||||
| Amortization |
(35,663 | ) | (37,868 | ) | ||||
|
|
|
|
|
|||||
| Ending balance |
$ | 16,712 | $ | 16,639 | ||||
|
|
|
|
|
|||||
The amount of policy acquisition costs amortized and included in policy acquisition and other underwriting expenses for the years ended December 31, 2017, 2016 and 2015 was $35,663, $37,868 and $36,224, respectively.
Note 9 — Property and Equipment, net
Property and equipment, net consists of the following:
| December 31, | ||||||||
| 2017 | 2016 | |||||||
| Land |
$ | 1,642 | $ | 1,642 | ||||
| Building |
7,952 | 7,932 | ||||||
| Computer hardware and software |
3,964 | 2,294 | ||||||
| Office furniture and equipment |
2,014 | 1,940 | ||||||
| Tenant and leasehold improvements |
3,320 | 3,250 | ||||||
| Other |
1,387 | 940 | ||||||
|
|
|
|
|
|||||
| Total, at cost |
20,279 | 17,998 | ||||||
| Less:accumulated depreciation and amortization |
(7,814 | ) | (6,624 | ) | ||||
|
|
|
|
|
|||||
| Property and equipment, net |
$ | 12,465 | $ | 11,374 | ||||
|
|
|
|
|
|||||
Depreciation and amortization expense under property and equipment was $1,237, $1,272 and $1,338, respectively, for the years ended December 31, 2017, 2016 and 2015.
100
Table of Contents
HCI GROUP, INC. AND SUBSIDIARIES
Notes to Consolidated Financial Statements
(Amounts in thousands, except share and per share amounts, unless otherwise stated)
Note 10 — Intangible Assets, net
The Company’s intangible assets, net consist of the following:
| December 31, | ||||||||
| 2017 | 2016 | |||||||
| Anchor tenants relationships |
$ | 1,761 | $ | 1,761 | ||||
| In-place leases |
3,806 | 3,214 | ||||||
|
|
|
|
|
|||||
| Total, at cost |
5,567 | 4,975 | ||||||
| Less: accumulated amortization |
(572 | ) | (76 | ) | ||||
|
|
|
|
|
|||||
| Intangible assets, net |
$ | 4,995 | $ | 4,899 | ||||
|
|
|
|
|
|||||
Recognized with the 2017 acquisition of commercial real estate described in Real Estate Investments in Note 4 — “Investments” was $636 of in-place leases. In connection with the 2016 business acquisitions described in Note 6 — “Business Acquisitions,” the Company recognized $5,199 of intangible assets. For the years ended December 31, 2017 and 2016, amortization expense associated with intangible assets was $503 and $77, respectively. The remaining weighted-average amortization period as of December 31, 2017 was 17.3 years and 11.4 years for anchor tenants relationships and in-place leases, respectively, or 13.3 years in aggregate.
Amortization expense for intangible assets after December 31, 2017 is as follows:
| Year |
Amount | |||
| 2018 |
$ | 604 | ||
| 2019 |
604 | |||
| 2020 |
597 | |||
| 2021 |
493 | |||
| 2022 |
419 | |||
| Thereafter |
2,278 | |||
|
|
|
|||
| Total |
$ | 4,995 | ||
|
|
|
|||
Note 11 — Other Assets
The following table summarizes the Company’s other assets:
| December 31, | ||||||||
| 2017 | 2016 | |||||||
| Benefits receivable related to retrospective reinsurance contracts |
$ | 2,393 | $ | 5,810 | ||||
| Prepaid expenses |
1,741 | 1,581 | ||||||
| Lease acquisition costs, net |
723 | 641 | ||||||
| Restricted cash |
809 | 600 | ||||||
| Other |
4,884 | 2,710 | ||||||
|
|
|
|
|
|||||
| Total other assets |
$ | 10,550 | $ | 11,342 | ||||
|
|
|
|
|
|||||
During 2017, benefits receivable related to retrospective reinsurance contracts were adjusted due to the impact from Hurricane Irma. See Note 14 — “Reinsurance.”
101
Table of Contents
HCI GROUP, INC. AND SUBSIDIARIES
Notes to Consolidated Financial Statements
(Amounts in thousands, except share and per share amounts, unless otherwise stated)
Note 12 — Revolving Credit Facility
In connection with FMJV’s December 15, 2016 distribution of its 90% ownership interest in FMKT MGA as described in Investment in Unconsolidated Joint Venture in Note 4 — “Investments,” the Company assumed a liability to repay $8,214 under a secured credit agreement. The agreement provided that the Company could borrow up to $9,550, which was guaranteed by Greenleaf Capital and collateralized primarily by the retail shopping center in Melbourne, Florida. The credit agreement bore interest at a rate equal to LIBOR plus 2.7% per annum and had an initial maturity date of February 27, 2017. The Company had an option to convert the outstanding balance at the initial maturity date into a three-year mortgage loan payable in 36 monthly installments at a fixed interest rate. On December 15, 2016, the Company drew an additional $1,193 from this credit line, which was used towards the purchase of the 10% noncontrolling interest as described in Pineda Landings—Melbourne, Florida in Note 6 — “Business Acquisitions.” At December 31, 2016, the loan balance totaled $9,463, which was included in other liabilities in the Company’s 2016 consolidated balance sheet. For the year ended December 31, 2016, interest expense for this revolving credit facility totaled $235, of which $11 related to the period from December 15 to 31, 2016.
In February 2017, the Company exercised the conversion option under the credit agreement. See 3.95% Promissory Note in Note 13 – “Long-Term Debt” for additional information.
Note 13 — Long-Term Debt
The following table summarizes the Company’s long-term debt:
| December 31, | ||||||||
| 2017 | 2016 | |||||||
| 8% Senior Notes, redeemed in April 2017 |
$ | — | $ | 40,250 | ||||
| 3.875% Convertible Senior Notes, due March 15, 2019 |
89,990 | 89,990 | ||||||
| 4.25% Convertible Senior Notes, due March 1, 2037 |
143,750 | — | ||||||
| 3.95% Promissory note, due through February 17, 2020 |
9,360 | — | ||||||
| 4% Promissory note, due through February 1, 2031 |
8,348 | 8,821 | ||||||
| 3.75% Promissory note, due through September 1, 2036 |
8,613 | 8,924 | ||||||
|
|
|
|
|
|||||
| Total principal amount |
260,061 | 147,985 | ||||||
| Less: unamortized discount and issuance costs |
(22,226 | ) | (9,122 | ) | ||||
|
|
|
|
|
|||||
| Total long-term debt |
$ | 237,835 | $ | 138,863 | ||||
|
|
|
|
|
|||||
102
Table of Contents
HCI GROUP, INC. AND SUBSIDIARIES
Notes to Consolidated Financial Statements
(Amounts in thousands, except share and per share amounts, unless otherwise stated)
The following table summarizes future maturities of long-term debt as of December 31, 2017, which takes into consideration the assumption that the 4.25% Convertible Senior Notes are repurchased at the earliest call date.
| Year |
||||
| 2018 |
$ | 1,049 | ||
| 2019 |
91,081 | |||
| 2020 |
9,761 | |||
| 2021 |
916 | |||
| 2022 |
144,702 | |||
| Thereafter |
12,552 | |||
|
|
|
|||
| Total |
$ | 260,061 | ||
|
|
|
|||
Information with respect to interest expense related to long-term debt is as follows:
| Years Ended December 31, | ||||||||||||
| 2017 | 2016 | 2015 | ||||||||||
| Interest Expense: |
||||||||||||
| Contractual interest |
$ | 10,424 | $ | 7,315 | $ | 7,211 | ||||||
| Non-cash expense (a) |
6,404 | 3,529 | 3,543 | |||||||||
| Capitalized interest (b) |
(61 | ) | — | — | ||||||||
|
|
|
|
|
|
|
|||||||
| Total |
$ | 16,767 | $ | 10,844 | $ | 10,754 | ||||||
|
|
|
|
|
|
|
|||||||
| (a) | Represents amortization of debt discount and issuance costs. |
| (b) | Interest was capitalized for a construction project in Riverview, Florida which is intended for lease. |
Convertible Senior Notes
The Company’s Convertible Senior Notes consist of 3.875% Convertible Senior Notes due 2019 (“3.875% Convertible Notes”) and 4.25% Convertible Senior Notes due 2037 (“4.25% Convertible Notes”). The 3.875% Convertible Notes were issued in late 2013 in a private offering for an aggregate principal amount of $103,000. During the first quarter of 2016, the Company repurchased an aggregate of $13,010 in principal, thereby decreasing the aggregate principal balance of its 3.875% Convertible Notes to $89,990. On March 3, 2017, the Company issued 4.25% Convertible Notes in a private offering for an aggregate principal amount of $143,750. The net proceeds of the 4.25% Convertible Notes were $138,775 after $4,975 in related issuance and transaction costs. The following table summarizes the principal and interest payment terms of these Convertible Senior Notes:
| Convertible Senior Notes |
Interest Payment Terms | |
| 3.875% Convertible Notes, due March 15, 2019 |
Semiannually in arrears: March 15 and September 15 | |
| 4.25% Convertible Notes, due March 1, 2037 |
Semiannually in arrears: March 1 and September 1 |
The Convertible Senior Notes rank equally in right of payment to the Company’s existing and future unsecured and unsubordinated obligations. These Convertible Senior Notes do not contain any financial or operating covenants or restrictions on the payments of dividends, the incurrence of indebtedness or the issuance or repurchase of securities by the Company or any of its subsidiaries. The Convertible Senior Notes provide no protection to the note holders in the event of a fundamental change or other corporate transaction involving the Company except those described in each respective
103
Table of Contents
HCI GROUP, INC. AND SUBSIDIARIES
Notes to Consolidated Financial Statements
(Amounts in thousands, except share and per share amounts, unless otherwise stated)
indenture. These Convertible Senior Notes do not require a sinking fund to be established for the purpose of redemption. In conjunction with the issuances of the Convertible Senior Notes, the Company entered into prepaid share repurchase forward contracts and share repurchase agreements providing for the repurchase of shares of the Company’s common stock. See Note 19 — “Stockholders’ Equity” under Share Repurchase Agreements and Prepaid Share Repurchase Forward Contracts for additional information.
The following table summarizes information regarding the equity and liability components of the Convertible Senior Notes:
| December 31, | ||||||||
| 2017 | 2016 | |||||||
| Principal amount |
$ | 233,740 | $ | 89,990 | ||||
| Unamortized discount |
(17,354 | ) | (6,795 | ) | ||||
|
|
|
|
|
|||||
| Liability component – net carrying value before issuance costs |
$ | 216,386 | $ | 83,195 | ||||
|
|
|
|
|
|||||
| Equity component – conversion, net of offering costs |
$ | 31,051 | $ | 15,900 | ||||
|
|
|
|
|
|||||
Embedded Conversion Feature
The conversion feature of these Convertible Senior Notes is subject to conversion rate adjustments upon the occurrence of specified events (including payment of dividends above a specified amount) but will not be adjusted for any accrued and unpaid interest.
3.875% Convertible Notes. Since January 2015, the Company’s cash dividends on common stock have exceeded $0.275 per share, resulting in adjustments to the conversion rate of the 3.875% Convertible Notes. Accordingly, as of December 31, 2017, the conversion rate of the Company’s 3.875% Convertible Notes was 16.2172 shares of common stock for each $1 in principal amount, which was the equivalent of approximately $61.66 per share.
4.25% Convertible Notes. The conversion rate of the 4.25% Convertible Notes is currently 16.2635 shares of common stock for each $1 in principal amount, which is the equivalent of approximately $61.49 per share.
The holders of the Convertible Senior Notes may convert all or a portion of their Convertible Senior Notes during specified periods as follows: (1) during any calendar quarter commencing after the calendar quarter ending on the dates specified in each respective indenture, if the last reported sale price of the Company’s common stock for at least 20 trading days during the period of 30 consecutive trading days ending on the last trading day of the immediately preceding calendar quarter is greater than 130% of the conversion price on each applicable trading day; (2) during the five business-day period after any ten consecutive trading-day period in which the trading price per $1 principal amount of the Convertible Senior Notes is less than 98% of the product of the last reported sale price and the conversion rate on each such trading day; (3) if specified corporate events, including a change in control, occur; or (4) at any time on or after the dates specified in each respective indenture.
The note holders who elect to convert their Convertible Senior Notes in connection with a fundamental change as described in the indentures will be entitled to a “make-whole” adjustment in the form of an increase in the conversion rate. Upon conversion, the Company has options to satisfy its conversion obligation by paying or delivering cash, shares of its common stock or a combination of cash and shares of its common stock. As of December 31, 2017, none of the conditions allowing the holders of either class of the Convertible Senior Notes to convert had been met.
104
Table of Contents
HCI GROUP, INC. AND SUBSIDIARIES
Notes to Consolidated Financial Statements
(Amounts in thousands, except share and per share amounts, unless otherwise stated)
The Company determined that the Convertible Senior Notes’ embedded conversion feature is not a derivative financial instrument but rather is required to be separately accounted for in equity because the Company may elect to settle the conversion option entirely or partially in cash. At issuance, the Company accounted for the equity component of the embedded conversion feature as a reduction in the carrying amount of the debt and an increase in additional paid-in capital.
Embedded Redemption Feature – Fundamental Change
The note holders have the right to require the Company to repurchase for cash all or any portion of the Convertible Senior Notes at par prior to the maturity date should any of the fundamental change events described in the indentures occur. The Company concluded that this embedded redemption feature is not a derivative financial instrument and that it is not probable at issuance that any of the specified fundamental change events will occur. Therefore, this embedded redemption feature is not substantive and will not affect the expected life of the liability component.
Embedded Redemption Feature – Put Option of the Note Holder
At the option of the holders of the 4.25% Convertible Notes, the Company is required to repurchase for cash all or any portion of the 4.25% Convertible Notes at par on March 1, 2022, March 1, 2027 or March 1, 2032. The Company concluded that this embedded feature is not a derivative financial instrument. In addition, based on economic factors at the time when the 4.25% Convertible Notes were issued, the Company determined it is probable that the note holders will exercise this option. Thus, the Company amortizes the liability component and related issuance costs associated with the 4.25% Convertible Notes over the period from March 3, 2017 to March 1, 2022.
The effective interest rates for the 3.875% Convertible Notes and the 4.25% Convertible Notes, taking into account both cash and non-cash components, approximate 8.3% and 7.6%, respectively. Had a 20-year term been used for the amortization of the liability component and issuance costs of the 4.25% Convertible Notes, the annual effective interest rate charged to earnings would have been decreased to approximately 5.4%. As of December 31, 2017, the remaining amortization periods of the debt discounts were expected to be 1.2 years for the 3.875% Convertible Notes and 4.2 years for the 4.25% Convertible Notes.
8% Senior Notes
On April 3, 2017, the Company redeemed its 8% publicly traded, unsecured senior notes which had unamortized debt issuance costs of $743 at par for $40,805, including accrued and unpaid interest of $555. For the year ended December 31, 2017, the Company recognized a loss of $743 associated with the early extinguishment of this debt. The redemption was funded by the net proceeds from the issuance of the 4.25% Convertible Senior Notes.
105
Table of Contents
HCI GROUP, INC. AND SUBSIDIARIES
Notes to Consolidated Financial Statements
(Amounts in thousands, except share and per share amounts, unless otherwise stated)
3.95% Promissory Note
On February 27, 2017, the Company converted its outstanding revolving credit facility of $9,441 into a three-year mortgage loan primarily collateralized by a retail shopping center in Melbourne, Florida. Shortly after the loan conversion, the Company withdrew an additional amount of $109, thereby increasing the loan amount to $9,550. The loan bears a fixed annual interest rate of 3.95%. Approximately $50 of principal and interest is payable in 35 monthly installments beginning March 17, 2017 plus a final balloon payment of $8,891 including principal and unpaid interest payable on February 17, 2020. The promissory note may be repaid in part or in full at any time without penalty.
3.75% Promissory Note
In connection with the business acquisition described in Note 6 — Business Acquisitions, Sorrento PBX, LLC entered into a 20-year secured loan agreement for gross proceeds of $9,000. The loan proceeds were used to finance the acquisition. The loan bears a fixed annual interest rate of 3.75% and is collateralized by the acquired property and the assignment of associated lease agreements. Approximately $53 of principal and interest is payable in 240 monthly installments. The promissory note may be repaid in full after September 1, 2017 as long as the Company provides at least 60 days’ written notice and pays a prepayment premium as specified in the loan agreement. In addition, the lender may require full payment of the outstanding principal and unpaid interest on September 1, 2031 provided a written notice of its intention to call the note is given at least six months in advance.
4% Promissory Note
On January 14, 2016, HCPCI Holdings, LLC, a subsidiary of the Company, entered into a 15-year secured loan agreement for proceeds of $9,200. The loan is collateralized by the Company’s Tampa, Florida real estate, which is owned by HCPCI Holdings, and the lease agreements associated with this property. The loan bears a fixed annual interest rate of 4%. Approximately $68 of principal and interest is payable in 180 monthly installments. The promissory note may be repaid in full after February 1, 2017 as long as the Company provides at least 60 days’ written notice and pays a prepayment premium as specified in the loan agreement. The proceeds were used for real estate development projects or other general business purposes.
Note 14 — Reinsurance
The Company cedes a portion of its homeowners’ insurance exposure to other entities under catastrophe excess of loss reinsurance treaties and one quota share reinsurance agreement. Under the terms of the quota share reinsurance agreement effective January 1, 2017, the Company was entitled to a 30% ceding commission on ceded premiums written. During the third quarter of 2017, the Company entered into a three-year flood catastrophe excess of loss reinsurance contract effective July 1, 2017. The reinsurance premiums under this three-year contract are generally determined on a quarterly basis based on the premiums associated with the applicable flood total insured value in force on the last day of the preceding quarter. Effective September 1, 2017, the quota share reinsurance agreement was terminated and replaced with a new quota share agreement with revised terms and conditions. Under the new agreement, the Company is also entitled to a 30% ceding commission on ceded premiums written.
106
Table of Contents
HCI GROUP, INC. AND SUBSIDIARIES
Notes to Consolidated Financial Statements
(Amounts in thousands, except share and per share amounts, unless otherwise stated)
The Company remains liable for claims payments in the event that any reinsurer is unable to meet its obligations under the reinsurance agreements. Failure of reinsurers to honor their obligations could result in losses to the Company. The Company evaluates the financial condition of its reinsurers and monitors concentrations of credit risk arising from similar geographic regions, activities or economic characteristics of the reinsurers to minimize its exposure to significant losses from reinsurer insolvencies. The Company contracts with a number of reinsurers to secure its annual reinsurance coverage, which generally becomes effective June 1st each year. The Company purchases reinsurance each year taking into consideration probable maximum losses and reinsurance market conditions.
The impact of the reinsurance treaties on premiums written and earned is as follows:
| Years Ended December 31, | ||||||||||||
| 2017 | 2016 | 2015 | ||||||||||
| Premiums Written: |
||||||||||||
| Direct |
$ | 346,188 | $ | 352,803 | $ | 393,009 | ||||||
| Assumed |
1,158 | 14,388 | 3,329 | |||||||||
|
|
|
|
|
|
|
|||||||
| Gross written |
347,346 | 367,191 | 396,338 | |||||||||
| Ceded |
(133,635 | ) | (135,051 | ) | (140,614 | ) | ||||||
|
|
|
|
|
|
|
|||||||
| Net premiums written |
$ | 213,711 | $ | 232,140 | $ | 255,724 | ||||||
|
|
|
|
|
|
|
|||||||
| Premiums Earned: |
||||||||||||
| Direct |
$ | 347,235 | $ | 372,699 | $ | 360,878 | ||||||
| Assumed |
11,018 | 5,979 | 62,242 | |||||||||
|
|
|
|
|
|
|
|||||||
| Gross earned |
358,253 | 378,678 | 423,120 | |||||||||
| Ceded |
(133,635 | ) | (135,051 | ) | (140,614 | ) | ||||||
|
|
|
|
|
|
|
|||||||
| Net premiums earned |
$ | 224,618 | $ | 243,627 | $ | 282,506 | ||||||
|
|
|
|
|
|
|
|||||||
During the year ended December 31, 2017, ceded losses of $214,082 were recognized as a reduction in losses and LAE, $7,400 of which related to Oxbridge Reinsurance Limited, a related party. The reduction in 2017 was primarily related to Hurricane Irma which made landfall in the Florida peninsula and caused significant property damages across the region. During the years ended December 31, 2016 and 2015, there were no recoveries pertaining to reinsurance contracts that were deducted from losses incurred. At December 31, 2017 and 2016, there were 37 and 35 reinsurers, respectively, participating in the Company’s reinsurance program. Amounts receivable with respect to reinsurers at December 31, 2017 and 2016 were $103,104 and $0, respectively. Approximately 29.7% of the reinsurance recoverable balance at December 31, 2017 was concentrated in two reinsurers. Based on the insurance ratings, the payment history and the financial strength of the reinsurers, management believes there was no significant credit risk associated with its reinsurers’ obligations to perform on any prepaid reinsurance contract and to fund any reinsurance recoverable balance as of December 31, 2017. The ratio of assumed premiums earned to net premiums earned for the years ended December 31, 2017, 2016 and 2015 was 4.9%, 2.5%, and 22.0%, respectively.
Certain of the reinsurance contracts include retrospective provisions that adjust premiums, increase the amount of future coverage, or result in a profit commission in the event losses are minimal or zero. Due to the losses incurred by Hurricane Irma, the balances of previously accrued benefits and deferred reinsurance premiums were adjusted with the changes recognized in the consolidated statement of income as additional ceded premiums.
107
Table of Contents
HCI GROUP, INC. AND SUBSIDIARIES
Notes to Consolidated Financial Statements
(Amounts in thousands, except share and per share amounts, unless otherwise stated)
For the year ended December 31, 2017, the Company recognized net premiums ceded of $5,740, related to these adjustments. Included in these amounts attributable to the Company’s contract with Oxbridge for the year ended December 31, 2017 were $933. In contrast, these adjustments were reflected as a net reduction in premiums ceded of $12,677 and $18,322 for the years ended December 31, 2016 and 2015, respectively, of which $1,929 and $2,797 related to the Company’s contract with Oxbridge. In June 2016, the Company received a total of $37,800 in cash benefits related to two retrospective reinsurance contracts that terminated May 31, 2016 of which $7,560 was received from Oxbridge. In September 2016, the Company received the final cash payment of $5,716 under the terms of the remaining retrospective reinsurance contract which terminated May 31, 2016.
In addition, these adjustments are reflected in other assets and prepaid reinsurance premiums. At December 31, 2017 and 2016, other assets included $2,393 and $5,810, respectively, of which $479 and $1,043 related to the contract with Oxbridge and prepaid reinsurance premiums included $0 and $2,152, respectively, of which $0 and $338 related to the contract with Oxbridge. Management believes the credit risk associated with the collectability of these accrued benefits is minimal as the amount receivable is concentrated with one reinsurer and the Company monitors the creditworthiness of this reinsurer based on available information about the reinsurer’s financial condition.
Note 15 — Losses and Loss Adjustment Expenses
The liability for losses and LAE is determined on an individual case basis for all claims reported. The liability also includes amounts for unallocated expenses, anticipated future claim development and losses incurred, but not reported. See Loss and Loss Adjustment Expenses in Note 2 — “Summary of Significant Accounting Policies.”
The Company currently writes insurance in the state of Florida, which could be exposed to hurricanes or other natural catastrophes. The occurrence of a major catastrophe could have a significant effect on the Company’s quarterly results and cause a temporary disruption of the normal operations of the Company. However, the Company is unable to predict the frequency or severity of any such events that may occur in the near term or thereafter.
108
Table of Contents
HCI GROUP, INC. AND SUBSIDIARIES
Notes to Consolidated Financial Statements
(Amounts in thousands, except share and per share amounts, unless otherwise stated)
Activity in the liability for losses and LAE is summarized as follows:
| Years Ended December 31, | ||||||||||||
| 2017 | 2016 | 2015 | ||||||||||
| Gross balance, beginning of year |
$ | 70,492 | $ | 51,690 | $ | 48,908 | ||||||
|
|
|
|
|
|
|
|||||||
| Incurred, net of reinsurance, related to: |
||||||||||||
| Current year |
146,922 | 104,128 | 78,325 | |||||||||
| Prior years |
18,707 | 20,539 | 8,899 | |||||||||
|
|
|
|
|
|
|
|||||||
| Total incurred, net of reinsurance |
165,629 | 124,667 | 87,224 | |||||||||
|
|
|
|
|
|
|
|||||||
| Paid, net of reinsurance, related to: |
||||||||||||
| Current year |
(87,770 | ) | (64,812 | ) | (51,095 | ) | ||||||
| Prior years |
(50,533 | ) | (41,053 | ) | (33,347 | ) | ||||||
|
|
|
|
|
|
|
|||||||
| Total paid, net of reinsurance |
(138,303 | ) | (105,865 | ) | (84,442 | ) | ||||||
|
|
|
|
|
|
|
|||||||
| Net balance, end of year |
97,818 | 70,492 | 51,690 | |||||||||
| Add: reinsurance recoverable |
100,760 | — | — | |||||||||
|
|
|
|
|
|
|
|||||||
| Gross balance, end of year |
$ | 198,578 | $ | 70,492 | $ | 51,690 | ||||||
|
|
|
|
|
|
|
|||||||
The establishment of loss reserves is an inherently uncertain process and changes in loss reserve estimates are expected as these estimates are subject to the outcome of future events. Changes in estimates, or differences between estimates and amounts ultimately paid, are reflected in the operating results of the period during which such adjustments are adjusted. During the year ended December 31, 2017, the Company incurred $267,000 of estimated gross losses or approximately $54,000 of estimated net losses related to Hurricane Irma and experienced unfavorable development of $18,715, of which $17,869 pertains to claims in the 2015 and 2016 loss years. The 2017 prior year development was driven by approximately $16,200 of continued reserve strengthening in response to trends involving assignment of insurance benefits and litigation and a $2,500 increase in 2016 loss reserves related to Hurricane Matthew.
The following is information about incurred and paid claims development as of December 31, 2017, net of reinsurance, as well as cumulative claim frequency and the total of incurred-but-not-reported liabilities plus expected development on reported claims included within the net incurred claims amounts. The information about incurred and paid claims development for the years ended December 31, 2015 to 2012 is presented as supplementary information and is unaudited.
109
Table of Contents
HCI GROUP, INC. AND SUBSIDIARIES
Notes to Consolidated Financial Statements
(Amounts in thousands, except share and per share amounts, unless otherwise stated)
Homeowners Multi-peril and Dwelling Fire Insurance (a)
| As of December 31, 2017 | ||||||||||||||||||||||||||||||||
| Total of IBNR Plus Expected Development on Reported Claims |
Cumulative Number of Reported Claims (Not in Dollar Amounts)(b) |
|||||||||||||||||||||||||||||||
| Incurred Claims and Allocated Claim Adjustment Expenses, Net of Reinsurance |
||||||||||||||||||||||||||||||||
| Accident Year |
For the Years Ended December 31, | |||||||||||||||||||||||||||||||
| 2012 | 2013 | 2014 | 2015 | 2016 | 2017 | |||||||||||||||||||||||||||
| 2012 |
$ | 66,425 | $ | 62,742 | $ | 64,083 | $ | 66,505 | $ | 67,058 | $ | 66,465 | $ | 155 | 6,617 | |||||||||||||||||
| 2013 |
— | 67,579 | 69,932 | 69,906 | 72,020 | 71,604 | 540 | 7,003 | ||||||||||||||||||||||||
| 2014 |
— | — | 75,810 | 81,773 | 84,917 | 88,054 | 2,350 | 7,649 | ||||||||||||||||||||||||
| 2015 |
— | — | — | 78,017 | 90,902 | 96,173 | 4,398 | 7,627 | ||||||||||||||||||||||||
| 2016 |
— | — | — | — | 81,446 | 90,878 | 12,840 | 6,863 | ||||||||||||||||||||||||
| 2017 |
— | — | — | — | — | 91,443 | 37,388 | 5,325 | ||||||||||||||||||||||||
|
|
|
|||||||||||||||||||||||||||||||
| Total | $ | 504,617 | ||||||||||||||||||||||||||||||
|
|
|
|||||||||||||||||||||||||||||||
| Cumulative Paid Claims and Allocated Claim Adjustment Expenses, Net of Reinsurance |
||||||||||||||||||||||||||||||||
| Accident Year |
For the Years Ended December 31, | |||||||||||||||||||||||||||||||
| 2012 | 2013 | 2014 | 2015 | 2016 | 2017 | |||||||||||||||||||||||||||
| 2012 |
$ | 36,914 | $ | 53,225 | $ | 59,041 | $ | 62,836 | $ | 64,667 | $ | 65,903 | ||||||||||||||||||||
| 2013 |
— | 40,240 | 57,374 | 64,257 | 68,106 | 70,224 | ||||||||||||||||||||||||||
| 2014 |
— | — | 47,650 | 68,897 | 77,712 | 82,463 | ||||||||||||||||||||||||||
| 2015 |
— | — | — | 50,939 | 76,042 | 87,784 | ||||||||||||||||||||||||||
| 2016 |
— | — | — | — | 51,663 | 73,037 | ||||||||||||||||||||||||||
| 2017 |
— | — | — | — | — | 43,039 | ||||||||||||||||||||||||||
|
|
|
|||||||||||||||||||||||||||||||
| Total | $ | 422,450 | ||||||||||||||||||||||||||||||
|
|
|
|||||||||||||||||||||||||||||||
| |
All outstanding liabilities before 2012, net of reinsurance |
|
538 | |||||||||||||||||||||||||||||
|
|
|
|||||||||||||||||||||||||||||||
| |
Liabilities for losses and loss adjustment, net of reinsurance |
|
$ | 82,705 | ||||||||||||||||||||||||||||
|
|
|
|||||||||||||||||||||||||||||||
| (a) | Excludes losses from Wind-only insurance (2012 through 2017), any hurricane event prior to 2017 and Hurricane Irma (2017). |
| (b) | The cumulative number of reported claims is measured as the number of per-policyholder, per-event claims for all coverages regardless of whether the claim results in loss or expense to the Company. |
110
Table of Contents
HCI GROUP, INC. AND SUBSIDIARIES
Notes to Consolidated Financial Statements
(Amounts in thousands, except share and per share amounts, unless otherwise stated)
Homeowners Wind-only Insurance (a)*
| As of December 31, 2017 | ||||||||||||||||||||||||||||||||
| Total of IBNR Plus Expected Development on Reported Claims |
Cumulative Number of Reported Claims (Not in Dollar Amounts)(b) |
|||||||||||||||||||||||||||||||
| Incurred Claims and Allocated Claim Adjustment Expenses, Net of Reinsurance |
||||||||||||||||||||||||||||||||
| Accident Year |
For the Years Ended December 31, | |||||||||||||||||||||||||||||||
| 2012 | 2013 | 2014 | 2015 | 2016 | 2017 | |||||||||||||||||||||||||||
| 2015 |
$ | — | $ | — | $ | — | $ | 308 | $ | 401 | $ | 569 | $ | 2 | 100 | |||||||||||||||||
| 2016 |
— | — | — | — | 1,005 | 1,314 | 41 | 228 | ||||||||||||||||||||||||
| 2017 |
— | — | — | — | — | 1,528 | 866 | 144 | ||||||||||||||||||||||||
|
|
|
|||||||||||||||||||||||||||||||
| Total | $ | 3,411 | ||||||||||||||||||||||||||||||
|
|
|
|||||||||||||||||||||||||||||||
| Cumulative Paid Claims and Allocated Claim Adjustment Expenses, Net of Reinsurance |
||||||||||||||||||||||||||||||||
| Accident Year |
For the Years Ended December 31, | |||||||||||||||||||||||||||||||
| 2012 | 2013 | 2014 | 2015 | 2016 | 2017 | |||||||||||||||||||||||||||
| 2015 |
$ | — | $ | — | $ | — | $ | 156 | $ | 332 | $ | 464 | ||||||||||||||||||||
| 2016 |
— | — | — | — | 689 | 1,155 | ||||||||||||||||||||||||||
| 2017 |
— | — | — | — | — | 484 | ||||||||||||||||||||||||||
|
|
|
|||||||||||||||||||||||||||||||
| Total | $ | 2,103 | ||||||||||||||||||||||||||||||
|
|
|
|||||||||||||||||||||||||||||||
| |
All outstanding liabilities before 2012, net of reinsurance |
|
— | |||||||||||||||||||||||||||||
|
|
|
|||||||||||||||||||||||||||||||
| |
Liabilities for losses and loss adjustment, net of reinsurance |
|
$ | 1,308 | ||||||||||||||||||||||||||||
|
|
|
|||||||||||||||||||||||||||||||
| * | The Company began writing Homeowners Wind-only insurance in 2015. |
| (a) | Excludes losses from multi-peril and dwelling fire insurance (2012 through 2017), any hurricane event prior to 2017 and Hurricane Irma (2017). |
| (b) | The cumulative number of reported claims is measured as the number of per-policyholder, per-event claims for all coverages regardless of whether the claim results in loss or expense to the Company. |
111
Table of Contents
HCI GROUP, INC. AND SUBSIDIARIES
Notes to Consolidated Financial Statements
(Amounts in thousands, except share and per share amounts, unless otherwise stated)
Losses Specific to Any Hurricane Event prior to 2017
| As of December 31, 2017 | ||||||||||||||||||||||||||||||||
| Total of IBNR Plus Expected Development on Reported Claims |
Cumulative Number of Reported Claims (Not in Dollar Amounts)(b) |
|||||||||||||||||||||||||||||||
| Incurred Claims and Allocated Claim Adjustment Expenses, Net of Reinsurance |
||||||||||||||||||||||||||||||||
| Accident Year |
For the Years Ended December 31, | |||||||||||||||||||||||||||||||
| 2012 | 2013 | 2014 | 2015 | 2016 | 2017 | |||||||||||||||||||||||||||
| 2016 |
$ | — | $ | — | $ | — | $ | — | $ | 21,414 | $ | 24,126 | $ | 3,435 | 2,410 | |||||||||||||||||
| 2017 |
— | — | — | — | — | 171 | — | 113 | ||||||||||||||||||||||||
|
|
|
|||||||||||||||||||||||||||||||
| Total | $ | 24,297 | ||||||||||||||||||||||||||||||
|
|
|
|||||||||||||||||||||||||||||||
| Cumulative Paid Claims and Allocated Claim Adjustment Expenses, Net of Reinsurance |
||||||||||||||||||||||||||||||||
| Accident Year |
For the Years Ended December 31, | |||||||||||||||||||||||||||||||
| 2012 | 2013 | 2014 | 2015 | 2016 | 2017 | |||||||||||||||||||||||||||
| 2016 |
$ | — | $ | — | $ | — | $ | — | $ | 12,227 | $ | 20,025 | ||||||||||||||||||||
| 2017 |
— | — | — | — | — | 163 | ||||||||||||||||||||||||||
|
|
|
|||||||||||||||||||||||||||||||
| Total | $ | 20,188 | ||||||||||||||||||||||||||||||
|
|
|
|||||||||||||||||||||||||||||||
| |
All outstanding liabilities before 2012, net of reinsurance |
|
— | |||||||||||||||||||||||||||||
|
|
|
|||||||||||||||||||||||||||||||
| |
Liabilities for losses and loss adjustment, net of reinsurance |
|
$ | 4,109 | ||||||||||||||||||||||||||||
|
|
|
|||||||||||||||||||||||||||||||
| (b) | The cumulative number of reported claims is measured as the number of per-policyholder, per-event claims for all coverages regardless of whether the claim results in loss or expense to the Company. |
112
Table of Contents
HCI GROUP, INC. AND SUBSIDIARIES
Notes to Consolidated Financial Statements
(Amounts in thousands, except share and per share amounts, unless otherwise stated)
Losses Specific to Hurricane Irma (2017)
| As of December 31, 2017 | ||||||||||||||||||||||||||||||||
| Total of IBNR Plus Expected Development on Reported Claims |
Cumulative Number of Reported Claims (Not in Dollar Amounts)(b) |
|||||||||||||||||||||||||||||||
| Incurred Claims and Allocated Claim Adjustment Expenses, Net of Reinsurance |
||||||||||||||||||||||||||||||||
| Accident Year |
For the Years Ended December 31, | |||||||||||||||||||||||||||||||
| 2012 | 2013 | 2014 | 2015 | 2016 | 2017 | |||||||||||||||||||||||||||
| 2017 |
$ | — | $ | — | $ | — | $ | — | $ | — | $ | 53,430 | $ | 9,614 | 17,862 | |||||||||||||||||
|
|
|
|||||||||||||||||||||||||||||||
| Total | $ | 53,430 | ||||||||||||||||||||||||||||||
|
|
|
|||||||||||||||||||||||||||||||
|
Cumulative Paid Claims and Allocated Claim Adjustment Expenses, Net of Reinsurance |
||||||||||||||||||||||||||||||||
| Accident Year |
For the Years Ended December 31, | |||||||||||||||||||||||||||||||
| 2012 | 2013 | 2014 | 2015 | 2016 | 2017 | |||||||||||||||||||||||||||
| 2017 |
$ | — | $ | — | $ | — | $ | — | $ | — | $ | 43,742 | ||||||||||||||||||||
|
|
|
|||||||||||||||||||||||||||||||
| Total | $ | 43,742 | ||||||||||||||||||||||||||||||
|
|
|
|||||||||||||||||||||||||||||||
| |
All outstanding liabilities before 2012, net of reinsurance |
|
— | |||||||||||||||||||||||||||||
|
|
|
|||||||||||||||||||||||||||||||
| |
Liabilities for losses and loss adjustment, net of reinsurance |
|
$ | 9,688 | ||||||||||||||||||||||||||||
|
|
|
|||||||||||||||||||||||||||||||
| (b) | The cumulative number of reported claims is measured as the number of per-policyholder, per-event claims for all coverages regardless of whether the claim results in loss or expense to the Company. |
113
Table of Contents
HCI GROUP, INC. AND SUBSIDIARIES
Notes to Consolidated Financial Statements
(Amounts in thousands, except share and per share amounts, unless otherwise stated)
The reconciliation of the net incurred and paid loss development tables to the liability for losses and loss adjustment expenses is as follows:
| December 31, 2017 |
||||
| Net outstanding liabilities |
||||
| Homeowners multi-peril and dwelling fire insurance |
$ | 82,705 | ||
| Homeowners Wind-only insurance |
1,308 | |||
| Losses specific to any hurricane prior to 2017 |
4,109 | |||
| Losses specific to Hurricane Irma (2017) |
9,688 | |||
| Other short-duration insurance lines |
8 | |||
|
|
|
|||
| Liabilities for unpaid losses and loss adjustment expenses, net of reinsurance |
97,818 | |||
|
|
|
|||
| Reinsurance recoverables |
100,760 | |||
|
|
|
|||
| Total gross liability for unpaid losses and loss adjustment expenses |
$ | 198,578 | ||
|
|
|
|||
The following is supplementary and unaudited information about average historical claims duration as of December 31, 2017:
| Average Annual Percentage Payout of Incurred Losses by Age, Net of Reinsurance |
||||||||||||||||||||||||
| Years |
1 | 2 | 3 | 4 | 5 | 6 | ||||||||||||||||||
| Homeowners multi-peril and dwelling fire insurance |
53.8 | % | 24.4 | % | 10.1 | % | 5.5 | % | 2.9 | % | 1.9 | % | ||||||||||||
| Homeowners Wind-only insurance |
37.2 | % | 33.2 | % | 8.7 | % | * | * | * | |||||||||||||||
| Losses specific to any hurricane prior to 2017 |
51.0 | % | 32.3 | % | — | — | — | — | ||||||||||||||||
| Losses specific to Hurricane Irma (2017) |
81.9 | % | — | — | — | — | — | |||||||||||||||||
| * | The Company began writing Homeowners Wind-only insurance in 2015. |
114
Table of Contents
HCI GROUP, INC. AND SUBSIDIARIES
Notes to Consolidated Financial Statements
(Amounts in thousands, except share and per share amounts, unless otherwise stated)
Note 16 — Segment Information
The Company’s businesses consist of four operating divisions: property and casualty insurance, reinsurance, investment real estate and information technology. The Company’s chief executive officer who serves as the Company’s chief operating decision maker evaluates each division’s financial and operating performances based on revenue and operating income. The Company aggregates its operating divisions into segments based on organizational structure and revenue source.
Due to their economic characteristics, the Company’s property and casualty insurance division and reinsurance division are grouped together into one reportable segment under insurance operations. For the years ended December 31, 2017, 2016 and 2015, revenues from the Company’s insurance operations before intracompany elimination represented 96.2%, 95.5% and 97.5%, respectively, of total revenues of all operating segments. At December 31, 2017, 2016 and 2015, insurance operations’ total assets represented 87.1%, 87.9% and 91.8%, respectively, of the combined assets of all operating segments. See Note 1 — “Nature of Operations” for a description of the Company’s insurance operations. The following tables present segment information reconciled to the Company’s consolidated statements of income. Intersegment transactions are not eliminated from segment results. However, intracompany transactions are eliminated in segment results below.
115
Table of Contents
HCI GROUP, INC. AND SUBSIDIARIES
Notes to Consolidated Financial Statements
(Amounts in thousands, except share and per share amounts, unless otherwise stated)
| For the Year Ended December 31, 2017 | Insurance Operations |
Real Estate(a) |
Corporate/ Other(b) |
Reclassification/ Elimination |
Consolidated | |||||||||||||||
| Revenue: |
||||||||||||||||||||
| Net premiums earned |
$ | 224,618 | $ | — | $ | — | $ | — | $ | 224,618 | ||||||||||
| Net investment income |
9,898 | 6 | 2,974 | (1,439 | ) | 11,439 | ||||||||||||||
| Net realized investment gains |
3,978 | — | 368 | — | 4,346 | |||||||||||||||
| Net unrealized investment gains |
— | — | 92 | — | 92 | |||||||||||||||
| Net other-than-temporary impairment losses |
(1,258 | ) | — | (209 | ) | — | (1,467 | ) | ||||||||||||
| Policy fee income |
3,622 | — | — | — | 3,622 | |||||||||||||||
| Other |
693 | 7,046 | 4,417 | (10,400 | ) | 1,756 | ||||||||||||||
|
|
|
|
|
|
|
|
|
|
|
|||||||||||
| Total revenue |
241,551 | 7,052 | 7,642 | (11,839 | ) | 244,406 | ||||||||||||||
|
|
|
|
|
|
|
|
|
|
|
|||||||||||
| Expenses: |
||||||||||||||||||||
| Losses and loss adjustment expenses |
165,629 | — | — | — | 165,629 | |||||||||||||||
| Amortization of deferred policy acquisition costs |
35,663 | — | — | — | 35,663 | |||||||||||||||
| Interest expense |
— | 1,250 | 15,704 | (187 | ) | 16,767 | ||||||||||||||
| Loss on repurchases of senior notes |
— | — | 743 | — | 743 | |||||||||||||||
| Depreciation and amortization |
128 | 2,121 | 939 | (1,950 | ) | 1,238 | ||||||||||||||
| Other |
27,547 | 4,022 | 18,123 | (9,702 | ) | 39,990 | ||||||||||||||
|
|
|
|
|
|
|
|
|
|
|
|||||||||||
| Total expenses |
228,967 | 7,393 | 35,509 | (11,839 | ) | 260,030 | ||||||||||||||
|
|
|
|
|
|
|
|
|
|
|
|||||||||||
| Income (loss) before income taxes |
$ | 12,584 | $ | (341 | ) | $ | (27,867 | ) | $ | — | $ | (15,624 | ) | |||||||
|
|
|
|
|
|
|
|
|
|
|
|||||||||||
| Total revenue from non-affiliates(c) |
$ | 241,551 | $ | 5,525 | $ | 6,958 | ||||||||||||||
| (a) | Other revenue under real estate primarily consisted of rental income from investment properties. |
| (b) | Other revenue under corporate and other primarily consisted of revenue from restaurant and marina businesses. |
| (c) | Represents amounts before reclassification to conform with an insurance company’s presentation. |
116
Table of Contents
HCI GROUP, INC. AND SUBSIDIARIES
Notes to Consolidated Financial Statements
(Amounts in thousands, except share and per share amounts, unless otherwise stated)
| For the Year Ended December 31, 2016 | Insurance Operations |
Real Estate(a) |
Corporate/ Other(b) |
Reclassification/ Elimination |
Consolidated | |||||||||||||||
| Revenue: |
||||||||||||||||||||
| Net premiums earned |
$ | 243,627 | $ | — | $ | — | $ | — | $ | 243,627 | ||||||||||
| Net investment income (loss) |
8,440 | 18 | 1,162 | (533 | ) | 9,087 | ||||||||||||||
| Net realized investment gains |
2,450 | — | 151 | — | 2,601 | |||||||||||||||
| Net other-than-temporary impairment losses |
(2,467 | ) | — | (15 | ) | — | (2,482 | ) | ||||||||||||
| Policy fee income |
3,914 | — | — | — | 3,914 | |||||||||||||||
| Gain on repurchases of convertible senior notes |
— | — | 153 | — | 153 | |||||||||||||||
| Gain on bargain purchase |
— | 2,071 | — | — | 2,071 | |||||||||||||||
| Gain on remeasurement of previously held interest |
— | 4,005 | — | — | 4,005 | |||||||||||||||
| Other |
684 | 4,505 | 4,104 | (7,823 | ) | 1,470 | ||||||||||||||
|
|
|
|
|
|
|
|
|
|
|
|||||||||||
| Total revenue |
256,648 | 10,599 | 5,555 | (8,356 | ) | 264,446 | ||||||||||||||
|
|
|
|
|
|
|
|
|
|
|
|||||||||||
| Expenses: |
||||||||||||||||||||
| Losses and loss adjustment expenses |
124,667 | — | — | — | 124,667 | |||||||||||||||
| Amortization of deferred policy acquisition costs |
37,868 | — | — | — | 37,868 | |||||||||||||||
| Interest expense |
— | 561 | 10,518 | — | 11,079 | |||||||||||||||
| Depreciation and amortization |
158 | 814 | 908 | (608 | ) | 1,272 | ||||||||||||||
| Other operating expenses |
31,351 | 2,921 | 16,180 | (7,748 | ) | 42,704 | ||||||||||||||
|
|
|
|
|
|
|
|
|
|
|
|||||||||||
| Total expenses |
194,044 | 4,296 | 27,606 | (8,356 | ) | 217,590 | ||||||||||||||
|
|
|
|
|
|
|
|
|
|
|
|||||||||||
| Income (loss) before income taxes |
$ | 62,604 | $ | 6,303 | $ | (22,051 | ) | $ | — | $ | 46,856 | |||||||||
|
|
|
|
|
|
|
|
|
|
|
|||||||||||
| Total revenue from non-affiliates(c) |
$ | 256,648 | $ | 9,072 | $ | 5,470 | ||||||||||||||
| (a) | Other revenue under real estate primarily consisted of rental income from investment properties. |
| (b) | Other revenue under corporate and other primarily consisted of revenue from restaurant and marina businesses. |
| (c) | Represents amounts before reclassification to conform with an insurance company’s presentation. |
117
Table of Contents
HCI GROUP, INC. AND SUBSIDIARIES
Notes to Consolidated Financial Statements
(Amounts in thousands, except share and per share amounts, unless otherwise stated)
| For the Year Ended December 31, 2015 | Insurance Operations |
Real Estate(a) |
Corporate/ Other(a) |
Reclassification/ Elimination |
Consolidated | |||||||||||||||
| Revenue: |
||||||||||||||||||||
| Net premiums earned |
$ | 282,506 | $ | — | $ | — | $ | — | $ | 282,506 | ||||||||||
| Net investment income (loss) |
6,841 | 5 | (1,971 | ) | (897 | ) | 3,978 | |||||||||||||
| Net realized investment (losses) gains |
(716 | ) | — | 108 | — | (608 | ) | |||||||||||||
| Net other-than-temporary impairment losses |
(4,606 | ) | — | (75 | ) | — | (4,681 | ) | ||||||||||||
| Policy fee income |
3,496 | — | — | — | 3,496 | |||||||||||||||
| Other |
564 | 4,095 | 3,209 | (6,607 | ) | 1,261 | ||||||||||||||
|
|
|
|
|
|
|
|
|
|
|
|||||||||||
| Total revenue |
288,085 | 4,100 | 1,271 | (7,504 | ) | 285,952 | ||||||||||||||
|
|
|
|
|
|
|
|
|
|
|
|||||||||||
| Expenses: |
||||||||||||||||||||
| Losses and loss adjustment expenses |
87,224 | — | — | — | 87,224 | |||||||||||||||
| Amortization of deferred policy acquisition costs |
36,224 | — | — | — | 36,224 | |||||||||||||||
| Interest expense |
— | 15 | 10,739 | — | 10,754 | |||||||||||||||
| Depreciation and amortization |
185 | 603 | 920 | (370 | ) | 1,338 | ||||||||||||||
| Other operating expenses |
30,665 | 2,822 | 17,867 | (7,134 | ) | 44,220 | ||||||||||||||
|
|
|
|
|
|
|
|
|
|
|
|||||||||||
| Total expenses |
154,298 | 3,440 | 29,526 | (7,504 | ) | 179,760 | ||||||||||||||
|
|
|
|
|
|
|
|
|
|
|
|||||||||||
| Income (loss) before income taxes |
$ | 133,787 | $ | 660 | $ | (28,255 | ) | $ | — | $ | 106,192 | |||||||||
|
|
|
|
|
|
|
|
|
|
|
|||||||||||
| Total revenue from non-affiliates(c) |
$ | 288,085 | $ | 2,612 | $ | 1,104 | ||||||||||||||
| (a) | Other revenue under real estate primarily consisted of rental income from investment properties. |
| (b) | Other revenue under corporate and other primarily consisted of revenue from restaurant and marina businesses. |
| (c) | Represents amounts before reclassification to conform with an insurance company’s presentation. |
118
Table of Contents
HCI GROUP, INC. AND SUBSIDIARIES
Notes to Consolidated Financial Statements
(Amounts in thousands, except share and per share amounts, unless otherwise stated)
The following table presents segment assets reconciled to the Company’s total assets in the consolidated balance sheets.
| December 31, | ||||||||
| 2017 | 2016 | |||||||
| Segment: |
||||||||
| Insurance Operations |
$ | 652,754 | $ | 651,927 | ||||
| Real Estate Operations |
80,152 | 71,226 | ||||||
| Corporate and Other |
127,822 | 45,623 | ||||||
| Consolidation and Elimination |
(18,464 | ) | (98,712 | ) | ||||
|
|
|
|
|
|||||
| Total assets |
$ | 842,264 | $ | 670,064 | ||||
|
|
|
|
|
|||||
Note 17 — Income Taxes
A summary of income tax expense is as follows:
| Years Ended December 31, | ||||||||||||
| 2017 | 2016 | 2015 | ||||||||||
| Current: |
||||||||||||
| Federal |
$ | (3,933 | ) | $ | 14,918 | $ | 34,768 | |||||
| State |
34 | 2,666 | 5,856 | |||||||||
| Foreign |
81 | 96 | 68 | |||||||||
|
|
|
|
|
|
|
|||||||
| Total current taxes |
(3,818 | ) | 17,680 | 40,692 | ||||||||
|
|
|
|
|
|
|
|||||||
| Deferred: |
||||||||||||
| Federal |
(4,144 | ) | 182 | (275 | ) | |||||||
| State |
(757 | ) | (9 | ) | (46 | ) | ||||||
| Foreign |
(12 | ) | (18 | ) | (40 | ) | ||||||
|
|
|
|
|
|
|
|||||||
| Total deferred taxes |
(4,913 | ) | 155 | (361 | ) | |||||||
|
|
|
|
|
|
|
|||||||
| Income tax (benefit) expense |
$ | (8,731 | ) | $ | 17,835 | $ | 40,331 | |||||
|
|
|
|
|
|
|
|||||||
The reasons for the differences between the statutory Federal income tax rate and the effective tax rate are summarized as follows:
| Years Ended December 31, | ||||||||||||||||||||||||
| 2017 | 2016 | 2015 | ||||||||||||||||||||||
| Amount | % | Amount | % | Amount | % | |||||||||||||||||||
| Income taxes at statutory rate |
$ | (5,468 | ) | 35.0 | $ | 16,395 | 35.0 | $ | 37,167 | 35.0 | ||||||||||||||
| Increase (decrease) in income taxes resulting from: |
||||||||||||||||||||||||
| State income taxes, net of federal tax benefits |
(657 | ) | 4.2 | 1,710 | 3.6 | 3,783 | 3.6 | |||||||||||||||||
| Effects of tax rate changes |
(1,400 | ) | 9.0 | — | — | — | — | |||||||||||||||||
| Share-based compensation |
(705 | ) | 4.5 | — | — | — | — | |||||||||||||||||
| Other |
(501 | ) | 3.2 | (270 | ) | (0.5 | ) | (619 | ) | (0.6 | ) | |||||||||||||
|
|
|
|
|
|
|
|
|
|
|
|
|
|||||||||||||
| Income tax (benefit) expense |
$ | (8,731 | ) | 55.9 | $ | 17,835 | 38.1 | $ | 40,331 | 38.0 | ||||||||||||||
|
|
|
|
|
|
|
|
|
|
|
|
|
|||||||||||||
The Company has no uncertain tax positions or unrecognized tax benefits that, if recognized, would impact the effective income tax rate. The tax returns filed for the years ending December 31, 2016, 2015, and 2014 remain subject to examination by the Company’s major taxing jurisdictions.
119
Table of Contents
HCI GROUP, INC. AND SUBSIDIARIES
Notes to Consolidated Financial Statements
(Amounts in thousands, except share and per share amounts, unless otherwise stated)
The Company elected to classify, if any, interest, and penalties arising from uncertain tax positions as income tax expense as permitted by current accounting standards. There have been no material amounts of interest or penalties for the years ended December 31, 2017, 2016 and 2015.
In July 2017, the Company received notice from the Internal Revenue Service stating the Company’s 2015 federal income tax return would be examined. The examination is currently in the process of gathering information.
On December 22, 2017, the Tax Cuts and Jobs Act (the “2017 Tax Act”) was passed and signed into law. Key components of the 2017 Tax Act are: a permanent reduction to the federal corporate income tax rate from a bracket system with a top tax rate of 35% to a flat rate of 21% beginning on January 1, 2018; implementation of a territorial tax system; an amendment to Internal Revenue Code Section 965 that requires U.S. shareholders (10% or greater) of controlled foreign corporations and other specified foreign corporations to include in income, for the last taxable year of such foreign corporation beginning before January 1, 2018, such U.S. shareholder’s pro rata share of a deemed repatriation amount; and changes to carryback and carryforward rules for net operating losses arising after December 31, 2017. Under U.S. GAAP, the tax effects of changes in tax laws or rates need to be recognized in the period in which the law is enacted. On the same day of the passing and enactment of the 2017 Tax Act, the Securities Exchange Commission staff issued Staff Accounting Bulletin No. 118 to address the application of U.S. GAAP in situations when a registrant does not have the necessary information available, prepared, or analyzed (including computations) in reasonable detail to complete the accounting for certain income tax effects of the 2017 Tax Act. The Company used estimates with regard to several gross temporary book and tax differences, including depreciable assets, deductions for loss reserves and income from limited partnership interests in measuring provisional tax effects. The ultimate outcome may materially differ from these provisional amounts due to, among other things, changes in interpretations and assumptions, and additional regulatory guidance. The Company expects to finalize the accounting for the tax effects when the 2017 U.S. corporate income tax return is filed in October 2018. For the year ended December 31, 2017, the Company recognized a provisional $1,400 tax benefit related to net deferred tax liabilities due to the lower future corporate income tax rates enacted by the 2017 Tax Act in the Company’s consolidated statement of income.
Deferred income taxes reflect the net tax effects of temporary differences between the carrying amounts of assets and liabilities for financial reporting purposes and the amounts used for income tax purposes.
120
Table of Contents
HCI GROUP, INC. AND SUBSIDIARIES
Notes to Consolidated Financial Statements
(Amounts in thousands, except share and per share amounts, unless otherwise stated)
Significant components of the Company’s net deferred income tax assets are as follows:
| December 31, | ||||||||
| 2017 | 2016 | |||||||
| Deferred tax assets: |
||||||||
| Unearned premiums |
$ | 5,753 | $ | 9,331 | ||||
| Other-than-temporary impairment losses |
386 | 1,246 | ||||||
| Losses and loss adjustment expenses |
3,154 | 986 | ||||||
| Organizational costs |
90 | 61 | ||||||
| Stock-based compensation |
2,455 | 3,388 | ||||||
| Accrued expenses |
— | 35 | ||||||
| Unearned revenue |
339 | 489 | ||||||
| State net operating losses |
333 | — | ||||||
| State capital loss carryforwards |
175 | 65 | ||||||
| Bad debt reserve |
2 | 3 | ||||||
|
|
|
|
|
|||||
| Total deferred tax assets |
12,687 | 15,604 | ||||||
|
|
|
|
|
|||||
| Deferred tax liabilities: |
||||||||
| Property and equipment |
(1,517 | ) | (1,857 | ) | ||||
| Intangible assets |
(1,541 | ) | (1,890 | ) | ||||
| Deferred policy acquisition costs |
(4,365 | ) | (6,601 | ) | ||||
| Unrealized net gain on available-for-sale securities |
(1,907 | ) | (1,659 | ) | ||||
| Basis difference related to partnership investments |
(599 | ) | (5 | ) | ||||
| Basis difference related to convertible senior notes |
(4,099 | ) | (2,519 | ) | ||||
| Prepaid expenses |
(312 | ) | (412 | ) | ||||
| Accrued expenses |
(37 | ) | — | |||||
| Other |
(200 | ) | (411 | ) | ||||
|
|
|
|
|
|||||
| Total deferred tax liabilities |
(14,577 | ) | (15,354 | ) | ||||
|
|
|
|
|
|||||
| Net deferred tax (liabilities) assets |
$ | (1,890 | ) | $ | 250 | |||
|
|
|
|
|
|||||
The Company has a state net operating loss carryforward of $7,665 for the 2017 tax year which will expire on December 31, 2037. In addition, the Company has state capital loss carryforwards of $1,926 and $1,826 for the 2016 and 2015 tax years, respectively. The 2015 capital loss carryforward is available for tax years up to and including the 2020 tax year. The 2016 capital loss carryforward is available for tax years up to and including the 2021 tax year.
A valuation allowance is established if, based upon the relevant facts and circumstances, management believes any portion of the deferred tax assets will not be realized. Although realization of deferred income tax assets is not certain, management believes it is more likely than not that deferred tax assets will be realized. Thus, the Company did not have a valuation allowance established as of December 31, 2017 or 2016.
The 2017 Tax Act implemented a mandatory one-time tax of eight percent on illiquid assets and 15.5% percent on cash and cash equivalents attributable to the accumulated earnings of controlled foreign companies and other specified foreign corporations on U.S. shareholders owning ten percent or greater of the foreign company. The Company has included this one-time federal income tax and the corresponding state taxes attributable to this deemed repatriation amount in the net income tax benefit for the year ended December 31, 2017. In addition to this mandatory one-time deemed repatriation, the 2017 Tax Act also implemented a territorial system which exempts U.S. corporations from U.S. taxes on most future foreign profits. Since all accumulated earnings of the Company’s
121
Table of Contents
HCI GROUP, INC. AND SUBSIDIARIES
Notes to Consolidated Financial Statements
(Amounts in thousands, except share and per share amounts, unless otherwise stated)
foreign subsidiary at December 31, 2017 will be subjected to federal and state income taxes as a result of the one-time mandatory deemed repatriation and all earnings of its foreign subsidiaries after December 31, 2017 will not be subject to U.S. income taxes, the Company will no longer be required to consider the establishment of a deferred tax liability related to the undistributed earnings of its foreign subsidiary.
Note 18 — Earnings Per Share
U.S. GAAP requires the Company to use the two-class method in computing basic earnings (loss) per share since holders of the Company’s restricted stock have the right to share in dividends, if declared, equally with common stockholders. These participating securities affect the computation of both basic and diluted (loss) earnings per share during periods of net income (loss).
122
Table of Contents
HCI GROUP, INC. AND SUBSIDIARIES
Notes to Consolidated Financial Statements
(Amounts in thousands, except share and per share amounts, unless otherwise stated)
A summary of the numerator and denominator of the basic and fully diluted (loss) earnings per common share is presented below:
| (Loss) Income (Numerator) |
Shares (a) (Denominator) |
Per Share Amount |
||||||||||
| Year Ended December 31, 2017 | ||||||||||||
| Net loss |
$ | (6,893 | ) | |||||||||
| Less: Loss attributable to participating securities |
481 | |||||||||||
|
|
|
|||||||||||
| Basic and Diluted Loss Per Share: |
||||||||||||
| Loss available to common stockholders* |
$ | (6,412 | ) | 8,558 | $ | (0.75 | ) | |||||
|
|
|
|
|
|
|
|||||||
| * Stock options and convertible senior notes were excluded due to antidilutive effect. |
| |||||||||||
| Year Ended December 31, 2016 | ||||||||||||
| Net income |
$ | 29,021 | ||||||||||
| Less: Income attributable to participating securities |
(1,545 | ) | ||||||||||
|
|
|
|||||||||||
| Basic Earnings Per Share: |
||||||||||||
| Income allocated to common stockholders |
27,476 | 9,326 | $ | 2.95 | ||||||||
|
|
|
|||||||||||
| Effect of Dilutive Securities: |
||||||||||||
| Stock options |
— | 54 | ||||||||||
| Convertible senior notes |
4,244 | 1,493 | ||||||||||
|
|
|
|
|
|||||||||
| Diluted Earnings Per Share: |
||||||||||||
| Income available to common stockholders and assumed conversions |
$ | 31,720 | 10,873 | $ | 2.92 | |||||||
|
|
|
|
|
|
|
|||||||
| Year Ended December 31, 2015 | ||||||||||||
| Net income |
$ | 65,861 | ||||||||||
| Less: Income attributable to participating securities |
(3,398 | ) | ||||||||||
|
|
|
|||||||||||
| Basic Earnings Per Share: |
||||||||||||
| Income allocated to common stockholders |
62,463 | 9,602 | $ | 6.51 | ||||||||
|
|
|
|||||||||||
| Effect of Dilutive Securities: |
||||||||||||
| Stock options |
— | 102 | ||||||||||
| Convertible senior notes |
4,505 | 1,651 | ||||||||||
|
|
|
|
|
|||||||||
| Diluted Earnings Per Share: |
||||||||||||
| Income available to common stockholders and assumed conversions |
$ | 66,968 | 11,355 | $ | 5.90 | |||||||
|
|
|
|
|
|
|
|||||||
| (a) Shares in thousands. |
||||||||||||
123
Table of Contents
HCI GROUP, INC. AND SUBSIDIARIES
Notes to Consolidated Financial Statements
(Amounts in thousands, except share and per share amounts, unless otherwise stated)
Note 19 — Stockholders’ Equity
Common Stock
In December 2017, the Company’s Board of Directors authorized a plan to repurchase up to $20,000 of the Company’s common shares before commissions and fees. The repurchase plan allows the Company to repurchase shares from time to time through December 31, 2018. The shares may be purchased for cash in open market purchases, block transactions and privately negotiated transactions in accordance with applicable federal securities laws. The share repurchase plan may be modified, suspended, terminated or extended by the Company any time without prior notice.
For each of the last two years, the Company’s Board of Directors authorized a one-year plan to repurchase up to $20,000 of the Company’s common shares before commissions and fees. During the years ended December 31, 2017 and 2016, the Company repurchased and retired 433,175 and 643,703 shares, respectively, at weighted average prices per share of $34.94 and $31.07, respectively. The total costs of shares repurchased, inclusive of fees and commissions, during the years ended December 31, 2017 and 2016 were $15,155 and $20,026, respectively, or $34.98 and $31.11 per share, respectively.
Series B Junior Participating Preferred Share Purchase Right
In October 2013, the Company’s Board of Directors declared a dividend of one preferred share purchase right (“Right”) for each outstanding share of the Company’s common stock to shareholders of record at the close of business on November 15, 2013. Each Right entitled the common shareholder to purchase from the Company one one-hundredth of a share of Series B Junior Participating Preferred Stock, no par value, at a price of $125.00 per one one-hundredth of such preferred share, subject to adjustment for certain events. The Right was intended to prevent any unsolicited takeover attempt that is unfair and unfavorable to the Company’s shareholders.
The Right would not be exercisable until ten days following a public announcement that a person or group had acquired beneficial ownership of 10% or more of the Company’s common stock or until ten business days after a person or group began a tender or exchange offer that would result in beneficial ownership of 10% or more of the Company’s common stock. The Right could be redeemed or exchanged by the Company for $0.001 per Right at any time until the Right’s expiration date on October 18, 2018. On April 18, 2017, the Company’s Board of Directors terminated the Company’s shareholder rights plan by amending the Right’s expiration date to April 18, 2017.
Share Repurchase Agreements
In conjunction with the issuance of the 4.25% Convertible Notes as described in Note 13 — “Long-Term Debt” under Convertible Senior Notes, the Company used $20,345 of the net proceeds to repurchase and retire an aggregate of 413,600 shares of its common stock at a price of $49.19 per share from institutional investors.
124
Table of Contents
HCI GROUP, INC. AND SUBSIDIARIES
Notes to Consolidated Financial Statements
(Amounts in thousands, except share and per share amounts, unless otherwise stated)
Prepaid Share Repurchase Forward Contracts
The Company has two outstanding prepaid share repurchase forward contracts, one of which was entered into with Deutsche Bank AG, London Branch in conjunction with the issuance of the 3.875% Convertible Notes. The other was entered into with Societe Generale in conjunction with the issuance of the 4.25% Convertible Notes as described in Note 13 — “Long-Term Debt” under Convertible Senior Notes. Both Deutsche Bank AG, London Branch and Societe Generale are considered forward counterparties. Under these forward contracts, the Company made initial upfront payments in exchange for the future deliveries of the Company’s common stock from the forward counterparties. Pursuant to the forward contract entered into in December 2013 with Deutsche Bank AG, London Branch, the Company prepaid $29,923 to repurchase 622,751 shares of the Company’s common stock, which shares will be delivered over a settlement period in 2019. Pursuant to the forward contract entered into in March 2017 with Societe Generale, the Company prepaid $9,400 of the net proceeds of the offering to repurchase 191,100 shares of the Company’s common stock, which shares will be delivered over a settlement period in 2022.
Each forward contract is subject to early settlement, in whole or in part, at any time prior to the final settlement date at the option of each forward counterparty, as well as early settlement or settlement with alternative consideration in the event of certain corporate transactions. In the event the Company pays any cash dividends on its common shares, each forward counterparty will pay an equivalent amount to the Company. The shares to be purchased under the forward contracts will be treated as retired for financial statement purposes as of the effective date of each forward contract, but will remain outstanding for corporate law purposes, including for purposes of any future stockholders votes.
The Company determined that each forward contract does not meet the characteristics of a derivative instrument and, as such, the transaction resulted in an immediate reduction of the outstanding shares used to calculate the weighted-average common shares outstanding for both basic and diluted (loss) earnings per share.
Preferred Stock
Series A Cumulative Convertible Preferred Stock
As of December 31, 2017 and 2016, there were no Series A Cumulative Convertible Preferred Stock issued or outstanding.
Series B Junior Participating Preferred Stock (“Series B Preferred”)
In connection with the declaration of the Right dividends in 2013, the Company’s Board of Directors established and fixed the rights and preferences of the Series B Preferred. Of the authorized shares, the Company designated 400,000 shares as Series B Preferred. Each Series B Preferred will be entitled to a minimum preferential quarterly dividend payment of $1.00 per share but will be entitled to an aggregate dividend of 100 times the dividend declared per common share of the Company. In the event of liquidation, the holders of the Series B Preferred will be entitled to a minimum preferential
125
Table of Contents
HCI GROUP, INC. AND SUBSIDIARIES
Notes to Consolidated Financial Statements
(Amounts in thousands, except share and per share amounts, unless otherwise stated)
liquidation payment of $100 per share but will be entitled to an aggregate payment of 100 times the payment made per common share. Each Series B Preferred will have 100 votes per share, voting together as one class on all matters submitted to a vote of shareholders of the Company. Finally, in the event of any merger, consolidation or other transaction in which common shares are exchanged, each Series B Preferred will be entitled to receive 100 times the amount received per common share. The aforementioned rights of Series B Preferred are protected by customary anti-dilution provisions. As of December 31, 2017 and 2016, there were no Series B Preferred issued or outstanding.
Undesignated Preferred Stock
The Company is authorized to issue up to an additional 18,100,000 shares of preferred stock, no par value. The authorized but unissued and undesignated preferred stock may be issued in one or more series and the shares of each series shall have such rights as determined by the Company’s Board of Directors subject to the rights of the holders of the Series A Cumulative Convertible Preferred Stock and Series B Preferred.
Note 20 — Stock-Based Compensation
Incentive Plan
The Company currently has outstanding stock-based awards granted under the 2007 Stock Option and Incentive Plan and the 2012 Omnibus Incentive Plan. Only the 2012 Plan is active and available for future grants. With respect to the 2012 Plan, the Company may grant stock-based awards to employees, directors, consultants, and advisors of the Company. On March 17, 2017, the Company’s board of directors amended the 2012 Omnibus Incentive Plan and reduced the number of shares reserved under the plan from 5,000,000 shares to 3,000,000 shares. At December 31, 2017, there were 1,995,655 shares available for grant.
Stock Options
Stock options granted and outstanding under the incentive plans vest over periods ranging from immediately vested to five years and are exercisable over the contractual term of ten years.
126
Table of Contents
HCI GROUP, INC. AND SUBSIDIARIES
Notes to Consolidated Financial Statements
(Amounts in thousands, except share and per share amounts, unless otherwise stated)
A summary of the stock option activity for the years ended December 31, 2017, 2016 and 2015 is as follows (option amounts not in thousands):
| Number of Options |
Weighted Average Exercise Price |
Weighted Average Remaining Contractual Term |
Aggregate Intrinsic Value |
|||||||||||||
| Outstanding at January 1, 2015 |
230,000 | $ | 3.00 | 3.0 years | $ | 9,256 | ||||||||||
|
|
|
|||||||||||||||
| Exercised |
(120,000 | ) | $ | 2.82 | ||||||||||||
|
|
|
|||||||||||||||
| Outstanding at December 31, 2015 |
110,000 | $ | 3.19 | 2.3 years | $ | 3,482 | ||||||||||
|
|
|
|||||||||||||||
| Exercised |
(60,000 | ) | $ | 2.50 | ||||||||||||
|
|
|
|||||||||||||||
| Outstanding at December 31, 2016 |
50,000 | $ | 4.02 | 2.3 years | $ | 1,773 | ||||||||||
|
|
|
|||||||||||||||
| Granted |
110,000 | $ | 40.00 | |||||||||||||
| Exercised |
(30,000 | ) | $ | 2.50 | ||||||||||||
|
|
|
|||||||||||||||
| Outstanding at December 31, 2017 |
130,000 | $ | 34.82 | 8.2 years | $ | 472 | ||||||||||
|
|
|
|||||||||||||||
| Exercisable at December 31, 2017 |
20,000 | $ | 6.30 | 3.7 years | $ | 472 | ||||||||||
|
|
|
|||||||||||||||
The following table summarizes information about options exercised for the years ended December 31, 2017, 2016 and 2015 (option amounts not in thousands):
| 2017 | 2016 | 2015 | ||||||||||
| Options exercised |
30,000 | 60,000 | 120,000 | |||||||||
| Total intrinsic value of exercised options |
$ | 1,319 | $ | 1,376 | $ | 4,551 | ||||||
| Tax benefits realized |
$ | 509 | $ | 501 | $ | 1,697 | ||||||
During the year ended December 31, 2015, a total of 120,000 options were exercised, of which 30,000 options were net settled by surrender of 2,013 shares. For the years ended December 31, 2017, 2016 and 2015, the Company recognized $306, $0 and $0, respectively, of compensation expense which was included in general and administrative personnel expenses. Deferred tax benefits related to stock options were $78, $0 and $0 for the years ended December 31, 2017, 2016 and 2015, respectively. At December 31, 2017 and 2016, there was $941 and $0, respectively, of unrecognized compensation expense related to nonvested stock options. The Company expects to recognize the remaining compensation expense over a weighted-average period of 3.0 years.
The following table provides assumptions used in the Black-Scholes option-pricing model to estimate the fair value of the stock options granted during the year ended December 31, 2017:
| Expected dividend yield |
3.53 | % | ||
| Expected volatility |
42.86 | % | ||
| Risk-free interest rate |
1.92 | % | ||
| Expected life (in years) |
5 |
127
Table of Contents
HCI GROUP, INC. AND SUBSIDIARIES
Notes to Consolidated Financial Statements
(Amounts in thousands, except share and per share amounts, unless otherwise stated)
Restricted Stock Awards
From time to time, the Company has granted and may grant restricted stock awards to certain executive officers, other employees and nonemployee directors in connection with their service to the Company. The terms of the Company’s outstanding restricted stock grants may include service, performance and market-based conditions. The fair value of the awards with market-based conditions is determined using a Monte Carlo simulation method, which calculates many potential outcomes for an award and then establishes fair value based on the most likely outcome. The determination of fair value with respect to the awards with only performance or service-based conditions is based on the market value of the Company’s stock on the grant date.
Information with respect to the activity of unvested restricted stock awards during the years ended December 31, 2017, 2016 and 2015 is as follows:
| Number of Restricted Stock Awards |
Weighted Average Grant Date Fair Value |
|||||||
| Nonvested at January 1, 2015 |
639,705 | $ | 28.33 | |||||
| Granted |
83,260 | $ | 44.46 | |||||
| Vested |
(59,695 | ) | $ | 30.13 | ||||
| Forfeited |
(42,757 | ) | $ | 28.15 | ||||
|
|
|
|||||||
| Nonvested at December 31, 2015 |
620,513 | $ | 30.33 | |||||
|
|
|
|||||||
| Granted |
142,440 | $ | 32.35 | |||||
| Vested |
(47,152 | ) | $ | 42.27 | ||||
| Cancelled |
(160,000 | ) | $ | 26.27 | ||||
| Forfeited |
(13,298 | ) | $ | 39.06 | ||||
|
|
|
|||||||
| Nonvested at December 31, 2016 |
542,503 | $ | 30.81 | |||||
|
|
|
|||||||
| Granted |
154,936 | $ | 42.92 | |||||
| Vested |
(75,983 | ) | $ | 37.95 | ||||
| Forfeited |
(23,766 | ) | $ | 36.32 | ||||
|
|
|
|||||||
| Nonvested at December 31, 2017 |
597,690 | $ | 32.82 | |||||
|
|
|
|||||||
The Company recognized compensation expense related to restricted stock, which is included in general and administrative personnel expenses, of $4,217, $4,198 and $5,212 for the years ended December 31, 2017, 2016 and 2015, respectively. At December 31, 2017 and 2016, there was approximately $9,101 and $7,531, respectively, of total unrecognized compensation expense related to nonvested restricted stock arrangements. The Company expects to recognize the remaining compensation expense over a weighted-average period of 32 months. The following table summarizes information about deferred tax benefits recognized and tax benefits realized related to restricted stock awards and paid dividends, and the fair value of vested restricted stock for the years ended December 31, 2017, 2016 and 2015.
| 2017 | 2016 | 2015 | ||||||||||
| Deferred tax benefits recognized |
$ | 970 | $ | 1,619 | $ | 1,453 | ||||||
| Tax benefits realized for restricted stock and paid dividends |
$ | 1,396 | $ | 140 | $ | 598 | ||||||
| Fair value of vested restricted stock |
$ | 2,884 | $ | 1,993 | $ | 1,798 | ||||||
128
Table of Contents
HCI GROUP, INC. AND SUBSIDIARIES
Notes to Consolidated Financial Statements
(Amounts in thousands, except share and per share amounts, unless otherwise stated)
During the years ended December 31, 2017, 2016 and 2015, no awards were issued with other than time-based vesting conditions.
Note 21 — Employee Benefit Plan
The Company has a 401(k) Safe Harbor Profit Sharing Plan (“401(k) Plan”) that qualifies as a defined contribution plan under Section 401(k) of the Internal Revenue Code. Under the 401(k) Plan, participating employees are eligible for company matching and discretionary profit sharing contributions. Plan participants may elect to defer up to one hundred percent of their pre-tax gross wages, subject to annual limitations. The Company matching contribution is limited to a maximum of four percent of the employee’s annual salary or wage and is fully vested when contributed. Eligibility and vesting of the Company’s discretionary profit sharing contribution is subject to the plan participant’s years of service. During the years ended December 31, 2017, 2016 and 2015, the Company contributed approximately $560, $415 and $371, respectively, in matching contributions, which are included in general and administrative personnel expenses. There has been no discretionary profit sharing contribution since the plan’s inception.
The Company also maintains benefit plans for its employees in India including a statutory post-employment benefit plan, or gratuity plan, providing defined, lump-sum benefits. The Company’s liability for the gratuity plan reflects the undiscounted benefit obligation payable as of the balance sheet date, which was based upon the employees’ salary and years of service. As of December 31, 2017 and 2016, the amounts accrued under the gratuity plan were $58 and $42, respectively. In addition, the Company provides matching contributions with respect to two defined contribution plans; the Provident Fund and the Employees State Insurance Fund, both of which are available to qualifying employees in India. Expense recognized by the Company for all benefit plans in India was $17, $14 and $9, respectively, for the years ended December 31, 2017, 2016 and 2015.
Note 22 — Commitments and Contingencies
Obligations under Multi-Year Reinsurance Contracts
As of December 31, 2017, the Company has contractual obligations related to three multi-year reinsurance contracts. Two of these contracts have effective dates of June 1, 2016 and the other has an effective date of July 1, 2017. These contracts may be cancelled only with the other party’s consent. The table below presents the future minimum aggregate premiums amount payable to the reinsurers.
| Year |
||||
| 2018* |
$ | 21,792 | ||
| 2019* |
2,392 | |||
| 2020* |
1,196 | |||
|
|
|
|||
| Total |
$ | 25,380 | ||
|
|
|
|||
| * | Premiums payable after December 31, 2017 under one contract are estimated. See Note 14 — “Reinsurance” for additional information. |
129
Table of Contents
HCI GROUP, INC. AND SUBSIDIARIES
Notes to Consolidated Financial Statements
(Amounts in thousands, except share and per share amounts, unless otherwise stated)
Lease Commitments
The Company leases 15,000 square feet of office space in Noida, India. The lease has an initial term of nine years. The monthly rental payment, exclusive of applicable service tax, has increased by five percent every year since the end of the first year of the lease term. In addition, the Company had a lease for office space in Miami, Florida which expired February 28, 2018.
Provided the leases are not early terminated, minimum future rental payments under operating leases after December 31, 2017 are as follows:
| Year |
Amount | |||
| 2018 |
$ | 147 | ||
| 2019 |
142 | |||
| 2020 |
150 | |||
| 2021 |
157 | |||
|
|
|
|||
| Total minimum future payments |
$ | 596 | ||
|
|
|
|||
Rental expense under all facility leases was $336, $333 and $304, respectively, during the years ended December 31, 2017, 2016 and 2015.
Service Agreement
In connection with the lease for office space in India as described in the “Lease Commitments” above, the Company signed a long-term contract with the landlord to receive maintenance and facility services. The agreement has the same initial term of nine years. The monthly payment, exclusive of applicable service tax, has also increased by five percent every year since the end of the first year of the lease term.
Provided the agreement is not early terminated, minimum future payments under the service agreement after December 31, 2017 are as follows:
| Year |
Amount | |||
| 2018 |
$ | 24 | ||
| 2019 |
26 | |||
| 2020 |
27 | |||
| 2021 |
28 | |||
|
|
|
|||
| Total minimum future payments |
$ | 105 | ||
|
|
|
|||
Rental Income
The Company leases available space at the Company’s headquarters and at its various investment properties to non-affiliates at various terms. Expected annual rental income due under non-cancellable operating leases for all properties and other investments owned at December 31, 2017 is as follows:
| Year |
Amount | |||
| 2018 |
$ | 4,227 | ||
| 2019 |
4,073 | |||
| 2020 |
3,651 | |||
| 2021 |
3,048 | |||
| 2022 |
2,558 | |||
| Thereafter |
13,786 | |||
|
|
|
|||
| Total |
$ | 31,343 | ||
|
|
|
|||
130
Table of Contents
HCI GROUP, INC. AND SUBSIDIARIES
Notes to Consolidated Financial Statements
(Amounts in thousands, except share and per share amounts, unless otherwise stated)
Capital Commitment
As described in Note 4 — “Investments” under Limited Partnership Investments, the Company is contractually committed to capital contributions for four limited partnership interests. At December 31, 2017, there was an aggregate unfunded balance of $14,328.
Note 23 — Quarterly Results of Operations (Unaudited)
The tables below summarize unaudited quarterly results of operations for 2017, 2016 and 2015.
| Three Months Ended | ||||||||||||||||
| 03/31/17 | 06/30/17 | 09/30/17 | 12/31/17 | |||||||||||||
| Net premiums earned |
$ | 63,036 | $ | 61,847 | $ | 43,964 | $ | 55,771 | ||||||||
| Total revenue |
67,713 | 67,580 | 47,490 | 61,623 | ||||||||||||
| Losses and loss adjustment expenses |
25,529 | 27,665 | 89,231 | 23,204 | ||||||||||||
| Policy acquisition and other underwriting expenses |
9,649 | 10,070 | 9,926 | 10,018 | ||||||||||||
| Interest expense |
3,542 | 4,378 | 4,408 | 4,439 | ||||||||||||
| Total expenses |
48,571 | 53,275 | 113,508 | 44,676 | ||||||||||||
| Income (loss) before income taxes |
19,142 | 14,305 | (66,018 | ) | 16,947 | |||||||||||
| Net income (loss) |
12,020 | 9,542 | (40,546 | ) | 12,091 | |||||||||||
| Comprehensive income (loss) |
12,949 | 8,959 | (38,792 | ) | 11,914 | |||||||||||
| Earnings per share: |
||||||||||||||||
| Basic |
$ | 1.27 | $ | 1.05 | $ | (4.44 | ) | $ | 1.37 | |||||||
| Diluted* |
$ | 1.15 | $ | 0.93 | $ | (4.44 | ) | $ | 1.14 | |||||||
| * | During the quarter ended September 30, 2017, the convertible senior notes and stock options were antidilutive. |
| Three Months Ended | ||||||||||||||||
| 03/31/16 | 06/30/16 | 09/30/16 | 12/31/16 | |||||||||||||
| Net premiums earned |
$ | 58,447 | $ | 58,528 | $ | 63,300 | $ | 63,352 | ||||||||
| Total revenue |
60,747 | 61,520 | 69,808 | 72,371 | ||||||||||||
| Losses and loss adjustment expenses |
27,080 | 26,272 | 25,909 | 45,406 | ||||||||||||
| Policy acquisition and other underwriting expenses |
11,110 | 10,879 | 10,536 | 10,117 | ||||||||||||
| Interest expense |
2,829 | 2,611 | 2,672 | 2,967 | ||||||||||||
| Total expenses |
51,050 | 50,291 | 49,779 | 66,470 | ||||||||||||
| Income before income taxes |
9,697 | 11,229 | 20,029 | 5,901 | ||||||||||||
| Net income |
6,056 | 7,024 | 11,333 | 4,608 | ||||||||||||
| Comprehensive income |
7,846 | 10,742 | 12,487 | 2,380 | ||||||||||||
| Earnings per share: |
||||||||||||||||
| Basic |
$ | 0.60 | $ | 0.71 | $ | 1.17 | $ | 0.47 | ||||||||
| Diluted* |
$ | 0.60 | $ | 0.71 | $ | 1.10 | $ | 0.47 | ||||||||
| * | During the quarters ended March 31, 2016, June 30, 2016 and December 31, 2016, the convertible senior notes were antidilutive. |
131
Table of Contents
HCI GROUP, INC. AND SUBSIDIARIES
Notes to Consolidated Financial Statements
(Amounts in thousands, except share and per share amounts, unless otherwise stated)
| Three Months Ended | ||||||||||||||||
| 03/31/15 | 06/30/15 | 09/30/15 | 12/31/15 | |||||||||||||
| Net premiums earned |
$ | 81,728 | $ | 76,387 | $ | 62,765 | $ | 61,626 | ||||||||
| Total revenue |
82,210 | 79,068 | 61,262 | 63,412 | ||||||||||||
| Losses and loss adjustment expenses |
19,039 | 20,565 | 26,200 | 21,420 | ||||||||||||
| Policy acquisition and other underwriting expenses |
9,799 | 10,443 | 10,675 | 11,067 | ||||||||||||
| Interest expense |
2,661 | 2,679 | 2,698 | 2,716 | ||||||||||||
| Total expenses |
41,164 | 43,485 | 49,324 | 45,787 | ||||||||||||
| Income before income taxes |
41,046 | 35,583 | 11,938 | 17,625 | ||||||||||||
| Net income |
25,378 | 22,022 | 7,371 | 11,090 | ||||||||||||
| Comprehensive income |
27,009 | 19,856 | 5,023 | 11,516 | ||||||||||||
| Earnings per share: |
||||||||||||||||
| Basic |
$ | 2.50 | $ | 2.17 | $ | 0.72 | $ | 1.12 | ||||||||
| Diluted |
$ | 2.21 | $ | 1.93 | $ | 0.71 | $ | 1.05 | ||||||||
Note 24 — Regulatory Requirements and Restrictions
The Company has no restrictions on the payment of dividends to its shareholders except those restrictions imposed by the Florida Business Corporation Act and those restrictions imposed by insurance statutes and regulations applicable to the Company’s insurance subsidiaries. As of December 2017, without prior regulatory approval, $95,310 of the Company’s consolidated retained earnings was free from restriction under the insurance statutes and regulations and available for the payment of dividends in 2018. The following briefly describes certain related and other requirements and restrictions imposed by the states or jurisdiction in which the Company’s insurance subsidiaries are incorporated.
Florida
HCPCI and TypTap, which are domiciled in Florida, prepare their statutory financial statements in accordance with accounting principles and practices prescribed or permitted by the Florida Department of Financial Services, Office of Insurance Regulation, which Florida utilizes for determining solvency under the Florida Insurance Code (the “Code”). The commissioner of the FLOIR has the right to permit other practices that may deviate from prescribed practices. Prescribed statutory accounting practices are those practices that are incorporated directly or by reference in
state laws, regulations, and general administrative rules applicable to all insurance enterprises domiciled in Florida. Permitted statutory accounting practices encompass all accounting practices that are not prescribed; such practices differ from state to state, may differ from entity to entity within a state, and may change in the future.
The Code requires HCPCI to maintain capital and surplus equal to the greater of 10% of their respective liabilities or a statutory minimum as defined in the Code. TypTap, the Company’s insurance subsidiary organized in 2015, is subject to a consent order that requires TypTap to maintain minimum capital and surplus of $20,000 during each of the three years ending December 31, 2018. At December 31, 2017, HCPCI was required to maintain minimum capital and surplus of $25,900. At December 31, 2016, HCPCI was required to maintain minimum capital and surplus of $22,550. TypTap was approved by the FLOIR in January 2016. HCPCI and TypTap were in compliance with these requirements at December 31, 2017 and 2016.
132
Table of Contents
HCI GROUP, INC. AND SUBSIDIARIES
Notes to Consolidated Financial Statements
(Amounts in thousands, except share and per share amounts, unless otherwise stated)
U.S. GAAP differs in certain respects from the accounting practices prescribed or permitted by insurance regulatory authorities (statutory-basis). These entities’ statutory-basis financial statements are presented on the basis of accounting practices prescribed or permitted by the FLOIR. The FLOIR has adopted the National Association of Insurance Commissioner’s (“NAIC”) Accounting Practices and Procedures Manual as the basis of its statutory accounting practices. At December 31, 2017, 2016 and 2015, HCPCI’s statutory-basis capital and surplus was approximately $153,000, $183,000 and $195,000, respectively. For the year ended December 31, 2017, HCPCI had a statutory-basis net loss of approximately $10,500 as compared with statutory-basis net income of approximately $5,900 and $57,400 for the years ended December 31, 2016 and 2015, respectively. At December 31, 2017 and 2016, TypTap’s statutory-basis capital and surplus was approximately $24,000 and $25,000, respectively. TypTap had statutory-basis net losses of approximately $797 and $364 for the years ended December 31, 2017 and 2016. Statutory-basis surplus differs from stockholders’ equity reported in accordance with U.S. GAAP primarily because policy acquisition costs are expensed when incurred. In addition, the recognition of deferred tax assets is based on different recoverability assumptions.
Since inception, HCPCI and TypTap, each has maintained a cash deposit with the Insurance Commissioner of the state of Florida, in the amount of $300, to meet regulatory requirements.
Under Florida law, a domestic insurer may not pay any dividend or distribute cash or other property to its stockholders except out of that part of its available and accumulated capital and surplus funds which is derived from realized net operating profits on its business and net realized capital gains. A Florida domestic insurer may not make dividend payments or distributions to stockholders without prior approval of the FLOIR if the dividend or distribution would exceed the larger of (1) the lesser of (a) 10.0% of its capital surplus or (b) net income, not including realized capital gains, plus a two year carry forward, (2) 10.0% of capital surplus with dividends payable constrained to unassigned funds minus 25% of unrealized capital gains or (3) the lesser of (a) 10.0% of capital surplus or (b) net investment income plus a three year carry forward with dividends payable constrained to unassigned funds minus 25% of unrealized capital gains.
Alternatively, a Florida domestic insurer may pay a dividend or distribution without the prior written approval of the FLOIR if (1) the dividend is equal to or less than the greater of (a) 10.0% of
the insurer’s capital surplus as regards to policyholders derived from realized net operating profits on its business and net realized capital gains or (b) the insurer’s entire net operating profits and realized net capital gains derived during the immediately preceding calendar year, (2) the insurer will have policy holder capital surplus equal to or exceeding 115.0% of the minimum required statutory capital surplus after the dividend or distribution, (3) the insurer files a notice of the dividend or distribution with the FLOIR at least ten business days prior to the dividend payment or distribution and (4) the notice includes a certification by an officer of the insurer attesting that, after the payment of the dividend or distribution, the insurer will have at least 115% of required statutory capital surplus as to policyholders. Except as provided above, a Florida domiciled insurer may only pay a dividend or make a distribution (1) subject to prior approval by the FLOIR or (2) 30 days after the FLOIR has received notice of such dividend or distribution and has not disapproved it within such time.
133
Table of Contents
HCI GROUP, INC. AND SUBSIDIARIES
Notes to Consolidated Financial Statements
(Amounts in thousands, except share and per share amounts, unless otherwise stated)
As a result, HCPCI was qualified to make dividend payments at December 31, 2017, 2016 and 2015.
In addition, Florida property and casualty insurance companies are required to adhere to prescribed premium-to-capital surplus ratios. Florida state law requires that the ratio of 90% of written premiums divided by surplus as to policyholders does not exceed 10 to 1 for gross written premiums or 4 to 1 for net written premiums. The required ratio of gross and net written premium to surplus, which the Company’s insurance companies had exceeded, is summarized below:
| Years Ended December 31, | ||||||
| 2017 | 2016 | 2015 | ||||
| HCPCI: |
||||||
| Gross |
2.01 to 1 | 1.81 to 1 | 1.85 to 1 | |||
| Net |
1.11 to 1 | 1.07 to 1 | 1.00 to 1 | |||
| TypTap: |
||||||
| Gross |
0.33 to 1 | 0.09 to 1 | * | |||
| Net |
0.27 to 1 | 0.07 to 1 | * | |||
| * | TypTap began operations in 2016. |
Bermuda
The Bermuda Monetary Authority requires Claddaugh Casualty Insurance Company, Ltd. (“Claddaugh”), the Company’s Bermuda domiciled reinsurance subsidiary, to maintain minimum capital and surplus of $2,000. At December 31, 2017 and 2016, Claddaugh’s statutory capital and surplus was approximately $63,000 and $88,000, respectively. For the year ended December 31, 2017, Claddaugh reported a statutory net loss of approximately $5,200 in contrast with statutory net profits of approximately $13,200 and $9,900 for the years ended December 31, 2016 and 2015, respectively. During 2017, Claddaugh made a dividend payment of $20,000 to the Company. There were no cash dividends paid by Claddaugh during 2016 and 2015.
HCPCI and TypTap are subject to risk-based capital (“RBC”) requirements as specified by the NAIC. Under those requirements, the amount of minimum capital and surplus maintained by a property and casualty insurance company is to be determined based on the various risks related to it. Pursuant to the RBC requirements, insurers having less statutory capital than required by the RBC calculation will be subject to varying degrees of regulatory action, depending on the level of capital
inadequacy. At December 31, 2017 and 2016, the Company’s insurance subsidiaries individually exceeded any applicable minimum risk-based capital requirements and no corrective actions have been required. As of December 31, 2017, the combined statutory capital and surplus and minimum capital and surplus of the Company’s U.S. insurance subsidiaries were approximately $177,000 and $45,900, respectively.
134
Table of Contents
HCI GROUP, INC. AND SUBSIDIARIES
Notes to Consolidated Financial Statements
(Amounts in thousands, except share and per share amounts, unless otherwise stated)
As of December 31, 2017 and 2016, restricted net assets represented by the Company’s insurance subsidiaries amounted to $180,286 and $148,999, respectively.
Note 25 — Related Party Transactions
Claddaugh has a reinsurance agreement with Oxbridge Reinsurance Limited (“Oxbridge”) whereby a portion of the business assumed from the Company’s insurance subsidiary, HCPCI, is ceded by Claddaugh to Oxbridge. With respect to the period from June 1, 2015 through May 31, 2016, Oxbridge assumed $11,600 of the total covered exposure for $3,340 in premiums. With respect to the period from June 1, 2016 through May 31, 2017, Oxbridge assumed $6,000 of the total covered exposure for approximately $3,400 in premiums. With respect to the period from June 1, 2017 through May 31, 2018, Oxbridge assumed $7,400 of the total covered exposure for approximately $3,400 in premiums. See Note 14 — “Reinsurance” – which includes the amounts due from and paid by Oxbridge during the years ended December 31, 2017 and 2016 with respect to benefits accrued in connection with the Oxbridge agreements. The premiums charged by Oxbridge are at rates which management believes to be competitive with market rates available to Claddaugh. Oxbridge has deposited funds into trust accounts to satisfy certain collateral requirements under its reinsurance contract with Claddaugh. Trust assets may be withdrawn by Claddaugh, the trust beneficiary, in the event amounts are due under the Oxbridge reinsurance agreement. Among the Oxbridge shareholders are Paresh Patel, the Company’s chief executive officer, who is also chairman of the board of directors for Oxbridge, and members of his immediate family and three of the Company’s non-employee directors including Sanjay Madhu who serves as Oxbridge’s president and chief executive officer.
During 2015, 2016 and January 2017, one of the Company’s directors was a partner at a law firm that performs certain of the Company’s corporate legal matters. He retired from the practice of law on January 31, 2017. Fees incurred with respect to this law firm for the month ended January 31, 2017 and years ended December 31, 2016 and 2015 were approximately $6, $32 and $50, respectively.
In connection with the acquisition of Pineda Landings described in Note 6 — “Business Acquisition,” the Company incurred and paid $20 of legal fees in 2016 for services provided by a law firm that specializes in real estate transactions at which one immediate family member of the Company’s directors is employed.
135
Table of Contents
HCI GROUP, INC. AND SUBSIDIARIES
Notes to Consolidated Financial Statements
(Amounts in thousands, except share and per share amounts, unless otherwise stated)
Note 26 — Condensed Financial Information of HCI Group, Inc.
Condensed financial information of HCI Group, Inc. is as follows:
Balance Sheets
| December 31, | ||||||||
| 2017 | 2016 | |||||||
| Assets | ||||||||
| Cash and cash equivalents |
$ | 53,755 | $ | 2,297 | ||||
| Fixed-maturity securities, available for sale, at fair value |
34,529 | 4,483 | ||||||
| Equity securities, available for sale, at fair value |
10,238 | 7,289 | ||||||
| Equity securities, trading, at fair value |
1,045 | — | ||||||
| Limited partnership investments, at equity |
15,232 | 21,906 | ||||||
| Note receivable – related party |
7,280 | — | ||||||
| Investment in subsidiaries |
310,779 | 411,398 | ||||||
| Property and equipment, net |
617 | 664 | ||||||
| Income tax receivable |
3,023 | 1,563 | ||||||
| Other assets |
1,019 | 940 | ||||||
|
|
|
|
|
|||||
| Total assets |
$ | 437,517 | $ | 450,540 | ||||
|
|
|
|
|
|||||
| Liabilities and Stockholders’ Equity | ||||||||
| Accrued expenses and other liabilities |
$ | 4,499 | $ | 2,952 | ||||
| Deferred income taxes, net |
2,511 | 949 | ||||||
| Long-term debt |
211,890 | 121,436 | ||||||
| Due to related parties |
24,642 | 81,457 | ||||||
|
|
|
|
|
|||||
| Total liabilities |
243,542 | 206,794 | ||||||
| Total stockholders’ equity |
193,975 | 243,746 | ||||||
|
|
|
|
|
|||||
| Total liabilities and stockholders’ equity |
$ | 437,517 | $ | 450,540 | ||||
|
|
|
|
|
|||||
136
Table of Contents
HCI GROUP, INC. AND SUBSIDIARIES
Notes to Consolidated Financial Statements
(Amounts in thousands, except share and per share amounts, unless otherwise stated)
Statements of Income
| Years Ended December 31, | ||||||||||||
| 2017 | 2016 | 2015 | ||||||||||
| Net investment income (loss) |
$ | 2,799 | $ | 1,204 | $ | (2,401 | ) | |||||
| Net realized gains |
367 | 151 | 108 | |||||||||
| Net unrealized gains |
92 | — | — | |||||||||
| Other-than-temporary impairment losses |
(209 | ) | (15 | ) | (75 | ) | ||||||
| Gain on repurchases of convertible senior notes |
— | 153 | — | |||||||||
| Other income |
— | — | 30 | |||||||||
| Loss on repurchases of senior notes |
(743 | ) | — | — | ||||||||
| Interest expense |
(15,704 | ) | (10,346 | ) | (10,754 | ) | ||||||
| Operating expenses |
(5,489 | ) | (5,158 | ) | (7,346 | ) | ||||||
|
|
|
|
|
|
|
|||||||
| Loss before income tax benefit and equity in income of subsidiaries |
(18,887 | ) | (14,011 | ) | (20,438 | ) | ||||||
| Income tax benefit |
9,605 | 4,878 | 7,835 | |||||||||
|
|
|
|
|
|
|
|||||||
| Net loss before equity in income of subsidiaries |
(9,282 | ) | (9,133 | ) | (12,603 | ) | ||||||
| Equity in income of subsidiaries |
2,389 | 38,154 | 78,464 | |||||||||
|
|
|
|
|
|
|
|||||||
| Net (loss) income |
$ | (6,893 | ) | $ | 29,021 | $ | 65,861 | |||||
|
|
|
|
|
|
|
|||||||
137
Table of Contents
HCI GROUP, INC. AND SUBSIDIARIES
Notes to Consolidated Financial Statements
(Amounts in thousands, except share and per share amounts, unless otherwise stated)
Statements of Cash Flows
| Years Ended December 31, | ||||||||||||
| 2017 | 2016 | 2015 | ||||||||||
| Cash flows from operating activities: |
||||||||||||
| Net (loss) income |
$ | (6,893 | ) | $ | 29,021 | $ | 65,861 | |||||
| Adjustments to reconcile net (loss) income to net cash (used in) provided by operating activities: |
||||||||||||
| Stock-based compensation |
2,630 | 2,878 | 4,341 | |||||||||
| Net realized investment gains |
(367 | ) | (151 | ) | (108 | ) | ||||||
| Net unrealized investment gains |
(92 | ) | — | — | ||||||||
| Amortization of premiums on investments in fixed-maturity securities |
51 | — | 1 | |||||||||
| Depreciation and amortization |
6,673 | 3,899 | 3,996 | |||||||||
| (Income) loss from limited partnership investments |
(1,354 | ) | (523 | ) | 3,277 | |||||||
| Distributions from limited partnership interests |
881 | 544 | 12 | |||||||||
| Other-than-temporary impairment losses |
209 | 15 | 75 | |||||||||
| Gain on repurchases of convertible senior notes |
— | (153 | ) | — | ||||||||
| Loss on repurchases of senior notes |
743 | — | — | |||||||||
| Loss from disposal of property and equipment |
17 | — | — | |||||||||
| Equity in income of subsidiaries |
(2,389 | ) | (38,154 | ) | (78,464 | ) | ||||||
| Deferred income taxes |
(4,224 | ) | (1,542 | ) | (3,218 | ) | ||||||
| Changes in operating assets and liabilities: |
||||||||||||
| Income taxes receivable |
(1,461 | ) | (1,563 | ) | 2,596 | |||||||
| Other assets |
(106 | ) | (129 | ) | 228 | |||||||
| Accrued expenses and other liabilities |
1,544 | (716 | ) | 689 | ||||||||
| Income taxes payable |
— | (1,518 | ) | 1,279 | ||||||||
| Due to related parties |
(54,896 | ) | 60,075 | (14,831 | ) | |||||||
|
|
|
|
|
|
|
|||||||
| Net cash (used in) provided by operating activities |
(59,034 | ) | 51,983 | (14,266 | ) | |||||||
|
|
|
|
|
|
|
|||||||
| Cash flows from investing activities: |
||||||||||||
| Investment in limited partnership interest |
(4,611 | ) | (2,710 | ) | (19,956 | ) | ||||||
| Investment in note receivable – related party |
(7,280 | ) | — | — | ||||||||
| Purchase of fixed-maturity securities |
(31,034 | ) | (371 | ) | (384 | ) | ||||||
| Purchase of equity securities, available for sale |
(8,939 | ) | (2,853 | ) | (3,196 | ) | ||||||
| Purchase of equity securities, trading |
(3,544 | ) | — | — | ||||||||
| Purchase of property and equipment |
(306 | ) | (202 | ) | (371 | ) | ||||||
| Proceeds from sales of fixed-maturity securities |
667 | 423 | 259 | |||||||||
| Proceeds from calls, repayments and maturities of fixed-maturity securities |
— | 130 | — | |||||||||
| Proceeds from sales of equity securities, available for sale |
6,262 | 2,602 | 5,475 | |||||||||
| Proceeds from sales of equity securities, trading |
2,624 | — | — | |||||||||
| Distributions from limited partnership interests |
11,758 | — | — | |||||||||
| Dividends received from subsidiary |
105,000 | 19,000 | 92,700 | |||||||||
| Investment in subsidiaries |
— | (25,250 | ) | (78,536 | ) | |||||||
|
|
|
|
|
|
|
|||||||
| Net cash provided by (used in) investing activities |
70,597 | (9,231 | ) | (4,009 | ) | |||||||
|
|
|
|
|
|
|
|||||||
138
Table of Contents
HCI GROUP, INC. AND SUBSIDIARIES
Notes to Consolidated Financial Statements
(Amounts in thousands, except share and per share amounts, unless otherwise stated)
Statements of Cash Flows (Continued)
| Years Ended December 31, | ||||||||||||
| 2017 | 2016 | 2015 | ||||||||||
| Cash flows from financing activities: |
||||||||||||
| Repurchases of common stock |
(30,718 | ) | (464 | ) | (792 | ) | ||||||
| Repurchases of common stock under share repurchase plan |
(15,154 | ) | (20,026 | ) | (1,610 | ) | ||||||
| Repurchases of convertible senior notes |
— | (11,347 | ) | — | ||||||||
| Repurchases of senior notes |
(40,250 | ) | — | — | ||||||||
| Debt issuance costs paid |
(4,975 | ) | — | — | ||||||||
| Cash dividends paid to stockholders |
(13,906 | ) | (12,438 | ) | (12,428 | ) | ||||||
| Cash dividends received under share repurchase forward contract |
1,073 | 747 | 747 | |||||||||
| Proceeds from exercise of stock options |
75 | 150 | 263 | |||||||||
| Proceeds from issuance of long-term debt |
143,750 | — | — | |||||||||
| Tax benefits on stock-based compensation |
— | 641 | 2,295 | |||||||||
|
|
|
|
|
|
|
|||||||
| Net cash provided by (used in) financing activities |
39,895 | (42,737 | ) | (11,525 | ) | |||||||
|
|
|
|
|
|
|
|||||||
| Net increase (decrease) in cash and cash equivalents |
51,458 | 15 | (29,800 | ) | ||||||||
| Cash and cash equivalents at beginning of year |
2,297 | 2,282 | 32,082 | |||||||||
|
|
|
|
|
|
|
|||||||
| Cash and cash equivalents at end of year |
$ | 53,755 | $ | 2,297 | $ | 2,282 | ||||||
|
|
|
|
|
|
|
|||||||
139
Table of Contents
HCI GROUP, INC. AND SUBSIDIARIES
Notes to Consolidated Financial Statements
(Amounts in thousands, except share and per share amounts, unless otherwise stated)
Note 27 — Subsequent Events
On January 15, 2018, the Company’s Board of Directors declared a quarterly dividend of $0.35 per common share. The dividends are scheduled for payment on March 16, 2018 to stockholders of record on February 16, 2018.
On January 26, 2018, Greenleaf Essence, LLC, a wholly own subsidiary and party to a joint venture which the Company consolidated as the primary beneficiary to its operations, purchased the interest of the noncontrolling member for $539. See Consolidated Variable Interest Entity in Note 4 — “Investment.” The transaction was accounted for as an equity transaction. As a result, there was no gain or loss recognized. On the same day, the Company entered into an agreement to lease office space at a new location in Miami Lakes, Florida for its claims related administration. The lease commenced on March 1, 2018 and has an initial term of approximately three years. Rent expense will be recorded on a straight-line basis over the lease term. Future minimum lease payments, inclusive of sales tax, are as follows:
| Year |
Amount | |||
| 2018 |
$ | 116 | ||
| 2019 |
158 | |||
| 2020 |
163 | |||
| 2021 |
41 | |||
|
|
|
|||
| Total minimum future payments |
$ | 478 | ||
|
|
|
|||
On February 8, 2018, the Company granted 40,000 shares of restricted stock and options to purchase 110,000 of the Company’s common shares at an exercise price of $40 per share to its chief executive officer, Paresh Patel. The options will expire on February 8, 2028. These share-based awards were granted pursuant to the 2012 Plan and will vest in equal annual installments over four years, so long as Mr. Patel remains employed by the Company. The grant date fair values of the restricted stock and options were $1,397 and $939, respectively.
On February 20, 2018, the Company entered into a subscription agreement with another limited partnership and committed to provide $5,000 of capital for investment. The capital is callable at the discretion of the general partner during a commitment period.
140
Table of Contents
ITEM 9 – Changes in and Disagreements with Accountants on Accounting and Financial Disclosure
None.
| ITEM 9A | – Controls and Procedures |
Evaluation of Disclosure Controls and Procedures
Our management, under the supervision and with the participation of our principal executive officer and principal financial officer, conducted an evaluation of the effectiveness of our disclosure controls and procedures (as defined in Rule 13a-15(e) promulgated under the Securities Exchange Act of 1934, as amended (the “Exchange Act”)) as of the end of the period covered by this Annual Report (December 31, 2017). Our disclosure controls and procedures are intended to ensure that the information we are required to disclose in the reports that we file or submit under the Exchange Act is (i) recorded, processed, summarized and reported within the time periods specified in the Securities and Exchange Commission’s rules and forms and (ii) accumulated and communicated to our management, including the principal executive officer and principal financial officer to allow timely decisions regarding required disclosures.
Based on that evaluation, our principal executive officer and principal financial officer concluded that, as of the end of the period covered by this Annual Report, our disclosure controls and procedures were effective.
It should be noted that any system of controls, however well designed and operated, can provide only reasonable, and not absolute, assurance that the objectives of the system will be met. In addition, the design of any control system is based in part upon certain assumptions about the likelihood of future events.
Management’s Report on Internal Control Over Financial Reporting
Management is responsible for establishing and maintaining adequate internal control over our financial reporting (as defined in Rule 13a-15(f) and 15d-15(f) of the Exchange Act). Internal control over financial reporting is a process designed to provide reasonable assurance regarding the reliability of financial reporting and the preparation of financial statements for external purposes in accordance with accounting principles generally accepted in the United States of America.
Our internal control over financial reporting includes those policies and procedures that (i) pertain to the maintenance of records that, in reasonable detail, accurately and fairly reflect the transactions and dispositions of our assets, (ii) provide reasonable assurance that transactions are recorded as necessary to permit preparation of financial statements in accordance with accounting principles generally accepted in the United States of America, and that our receipts and expenditures are being made only in accordance with authorizations of our management and directors, and (iii) provide reasonable assurance regarding prevention or timely detection of unauthorized acquisition, use or disposition of our assets that could have a material effect on the financial statements.
141
Table of Contents
Because of its inherent limitations, internal control over financial reporting may not prevent or detect misstatements. Also, projections of any evaluation of effectiveness to future periods are subject to the risk that controls may become inadequate because of changes in conditions, or that the degree of compliance with the policies or procedures may deteriorate. Our management, with the participation of our principal executive officer and principal financial officer, conducted an evaluation of the effectiveness of our internal control over financial reporting based on the framework in Internal Control – Integrated Framework (2013) issued by the Committee of Sponsoring Organizations of the Treadway Commission. Based on this evaluation, our principal executive officer and principal financial officer concluded that, as of December 31, 2017, our internal control over financial reporting was effective.
Dixon Hughes Goodman, LLP, an independent registered public accounting firm, has audited the 2017 consolidated financial statements included in this Annual Report on Form 10-K and, as part of their audit, has issued an attestation report, included herein, on our internal control over financial reporting.
Changes in Internal Control Over Financial Reporting
During our most recent fiscal quarter, there have been no changes in our internal control over financial reporting that have materially affected or are reasonably likely to materially affect our internal control over financial reporting.
None.
142
Table of Contents
PART III
ITEM 10 – Directors, Executive Officers and Corporate Governance
Code of Ethics
We have adopted a code of ethics applicable to all of our employees and directors, including our Chief Executive Officer (principal executive officer) and Chief Financial Officer (principal financial officer). We have posted the text of our code of ethics to our Internet web site: www.hcigroup.com. Select “Investor Information” on the top and then select “Corporate Governance” and then “Code of Conduct.” We intend to disclose any change to or waiver from our code of ethics by posting such change or waiver to our Internet web site within the same section as described above.
The other information required under this item is incorporated by reference from our definitive proxy statement relating to our annual meeting of shareholders, which will be filed with the Securities and Exchange Commission within 120 days after the end of our fiscal year ended December 31, 2017.
ITEM 11 – Executive Compensation
The information required under this item is incorporated by reference from our definitive proxy statement relating to our annual meeting of shareholders, which will be filed with the Securities and Exchange Commission within 120 days after the end of our fiscal year ended December 31, 2017.
ITEM 12 – Security Ownership of Certain Beneficial Owners and Management and Related Stockholder Matters
The information required under this item is incorporated by reference from our definitive proxy statement relating to our annual meeting of shareholders, which will be filed with the Securities and Exchange Commission within 120 days after the end of our fiscal year ended December 31, 2017.
Securities authorized for issuance under equity compensation plans are summarized under Part II – Item 5 of this Form 10-K.
ITEM 13 – Certain Relationships and Related Transactions, and Director Independence
The information required under this item is incorporated by reference from our definitive proxy statement relating to our annual meeting of shareholders, which will be filed with the Securities and Exchange Commission within 120 days after the end of our fiscal year ended December 31, 2017.
143
Table of Contents
ITEM 14 – Principal Accounting Fees and Services
The following table sets forth the aggregate fees for services related to the years ended December 31, 2017 and 2016 provided by Dixon Hughes Goodman, LLP, our principal accountant:
| 2017 | 2016 | |||||||
| Audit fees (a) |
$ | 370 | $ | 388 | ||||
| All other fees (b) |
75 | — | ||||||
|
|
|
|
|
|||||
| $445 | $388 | |||||||
|
|
|
|
|
|||||
| (a) | Audit Fees represent fees billed for professional services rendered for the audit of our annual financial statements, review of our quarterly financial statements included in our quarterly reports on Form 10-Q, and audit services provided in connection with other statutory and regulatory filings. |
| (b) | All Other Fees represent fees billed for services provided to us not otherwise included in the category above. |
The Audit Committee pre-approved all 2017 engagements and fees for services provided by our principal accountant.
Other information required under this item is incorporated by reference from our definitive proxy statement relating to our annual meeting of shareholders, which will be filed with the Securities and Exchange Commission within 120 days after the end of our fiscal year ended December 31, 2017.
144
Table of Contents
PART IV
ITEM 15 – Exhibits, Financial Statement Schedules
| (a) | Financial Statements, Financial Statement Schedules and Exhibits |
| (1) | Consolidated Financial Statements: See Index to Consolidated Financial Statements in Part II, Item 8 of this Form 10-K. |
| (2) | Financial Statement Schedules: |
Any supplemental information we are required to file with respect to our property and casualty insurance operations is included in Part II, Item 8 of this Form 10-K or is not applicable.
| (3) | Exhibits: See the exhibit listing set forth below: |
The following documents are filed as part of this report:
145
Table of Contents
146
Table of Contents
147
Table of Contents
148
Table of Contents
149
Table of Contents
150
Table of Contents
151
Table of Contents
| ** | Management contract or compensatory plan. |
152
Table of Contents
Pursuant to the requirements of Section 13 or 15(d) of the Securities Exchange Act of 1934, the Company has duly caused this report to be signed on its behalf by the undersigned thereunto duly authorized.
| HCI GROUP, INC. | ||||
| March 7, 2018 | By | /s/ Paresh Patel | ||
| Paresh Patel, Chief Executive Officer and Chairman of The Board of Directors (Principal Executive Officer) | ||||
Pursuant to the requirements of the Securities Exchange Act of 1934, this report has been signed below by the following persons on behalf of the registrant and in the capacities and on the dates indicated.
| March 7, 2018 | By | /s/ Paresh Patel | ||
| Paresh Patel, Chief Executive Officer and Chairman of The Board of Directors (Principal Executive Officer) | ||||
| March 7, 2018 | By | /s/ James Mark Harmsworth | ||
| James Mark Harmsworth, Chief Financial Officer (Principal Financial and Accounting Officer) | ||||
| March 7, 2018 | By | /s/ George Apostolou | ||
| George Apostolou, Director | ||||
| March 7, 2018 | By | /s/ Wayne Burks | ||
| Wayne Burks, Director | ||||
| March 7, 2018 | By | /s/ James Macchiarola | ||
| James Macchiarola, Director | ||||
| March 7, 2018 | By | /s/ Sanjay Madhu | ||
| Sanjay Madhu, Director | ||||
| March 7, 2018 | By | /s/ Harish M. Patel | ||
| Harish M. Patel, Director | ||||
| March 7, 2018 | By | /s/ Gregory Politis | ||
| Gregory Politis, Director | ||||
| March 7, 2018 | By | /s/ Anthony Saravanos | ||
| Anthony Saravanos, Director | ||||
| March 7, 2018 | By | /s/ Martin A. Traber | ||
| Martin A. Traber, Director | ||||
A signed original of this document has been provided to HCI Group, Inc. and will be retained by HCI Group, Inc. and furnished to the Securities and Exchange Commission or its staff upon request.