Attached files
| file | filename |
|---|---|
| EX-95 - EXHIBIT 95 - Tronox Holdings plc | s002093x1_ex95.htm |
| EX-32.2 - EXHIBIT 32.2 - Tronox Holdings plc | s002093x1_ex32-2.htm |
| EX-32.1 - EXHIBIT 32.1 - Tronox Holdings plc | s002093x1_ex32-1.htm |
| EX-31.2 - EXHIBIT 31.2 - Tronox Holdings plc | s002093x1_ex31-2.htm |
| EX-31.1 - EXHIBIT 31.1 - Tronox Holdings plc | s002093x1_ex31-1.htm |
| EX-23.1 - EXHIBIT 23.1 - Tronox Holdings plc | s002093x1_ex23-1.htm |
| EX-21.1 - EXHIBIT 21.1 - Tronox Holdings plc | s002093x1_ex21-1.htm |
| EX-12.1 - EXHIBIT 12.1 - Tronox Holdings plc | s002093x1_ex12-1.htm |
| EX-10.41 - EXHIBIT 10.41 - Tronox Holdings plc | s002093x1_ex10-41.htm |
UNITED STATES
SECURITIES AND EXCHANGE COMMISSION
Washington, D.C. 20549
Form 10-K
(Mark One)
| ☒ | ANNUAL REPORT PURSUANT TO SECTION 13 OR 15(d) OF THE SECURITIES EXCHANGE ACT OF 1934 |
For the Year ended December 31, 2017
OR
| o | TRANSITION REPORT PURSUANT TO SECTION 13 OR 15(d) OF THE SECURITIES EXCHANGE ACT OF 1934 |
For the transition period from to
1-35573
(Commission file number)
TRONOX LIMITED
(ACN 153 348 111)
(Exact name of registrant as specified in its charter)
|
Western Australia, Australia
|
98-1026700
|
|
(State or other jurisdiction of incorporation or organization)
|
(I.R.S. Employer Identification No.)
|
|
|
|
|
263 Tresser Boulevard, Suite 1100
Stamford, Connecticut 06901 |
Lot 22 Mason Road
Kwinana Beach WA 6167 Australia |
Registrant’s telephone number, including area code: (203) 705-3800
Securities registered pursuant to Section 12(b) of the Act:
|
Title of each class
|
Name of each exchange on which registered
|
|
Class A Ordinary Shares, par value $0.01 per share
|
New York Stock Exchange
|
Securities registered pursuant to Section 12(g) of the Act: None
Indicate by check mark if the registrant is a well-known seasoned issuer, as defined in Rule 405 of the Securities Act. Yes ☒ No o
Indicate by check mark if the registrant is not required to file reports pursuant to Section 13 or 15(d) of the Act. Yes o No ☒
Indicate by check mark whether the registrant (1) has filed all reports required to be filed by Section 13 or 15(d) of the Securities Exchange Act of 1934 during the preceding 12 months (or for such shorter period that the registrant was required to file such reports), and (2) has been subject to such filing requirements for the past 90 days. Yes ☒ No o
Indicate by check mark whether the registrant has submitted electronically and posted on its corporate Web site, if any, every Interactive Data File required to be submitted and posted pursuant to Rule 405 of Regulation S-T (§232.405 of this chapter) during the preceding 12 months (or for such shorter period that the registrant was required to submit and post such files). Yes ☒ No o
Indicate by check mark if disclosure of delinquent filers pursuant to Item 405 of Regulation S-K (§229.405 of this chapter) is not contained herein, and will not be contained, to the best of registrant’s knowledge, in definitive proxy or information statements incorporated by reference in Part III of this Form 10-K or any amendment to this Form 10-K. o
Indicate by check mark whether the registrant is a large accelerated filer, an accelerated filer, a non-accelerated filer, a smaller reporting company, or an emerging growth company. See the definitions of “large accelerated filer,” “accelerated filer,” “smaller reporting company” and “emerging growth company” in Rule 12b-2 of the Exchange Act. (Check one):
|
Large accelerated filer
|
☒
|
Accelerated filer
|
o
|
|
Non-accelerated filer
|
o
|
Smaller reporting company
|
o
|
|
Emerging growth company
|
o
|
|
|
If an emerging growth company, indicate by check mark if the registrant has elected not to use the extended transition period for complying with any new or revised financial accounting standards provided pursuant to Section 13(a) of the Exchange Act. o
Indicate by check mark whether the registrant is a shell company (as defined in Rule 12b-2 of the Exchange Act). Yes o No ☒
The aggregate market value of the ordinary shares held by non-affiliates of the registrant as of June 30, 2017 was approximately $1,797,488,386.
Indicate by check mark whether the registrant has filed all documents and reports required to be filed by Section 12, 13 or 15(d) of the Securities Exchange Act of 1934 subsequent to the distribution of securities under a plan confirmed by a court. Yes ☒ No o
As of January 31, 2018, the registrant had 92,660,776 shares of Class A ordinary shares and 28,729,280 shares of Class B ordinary shares outstanding.
DOCUMENTS INCORPORATED BY REFERENCE
Portions of the registrant’s proxy statement for its 2018 annual general meeting of shareholders are incorporated by reference in this Form 10-K in response to Part III Items 10, 11, 12, 13 and 14.
TRONOX LIMITED
ANNUAL REPORT ON FORM 10-K
FOR THE FISCAL YEAR ENDED DECEMBER 31, 2017
INDEX
|
Form 10-K Item Number
|
Page
|
|||
|
PART I
|
|
|
|
|
|
|
|
|||
|
|
|
|||
|
|
|
|||
|
|
|
|||
|
|
|
|||
|
|
|
|||
|
PART II
|
|
|
|
|
|
|
|
|||
|
|
|
|||
|
|
|
|||
|
|
|
|||
|
|
|
|||
|
|
|
|||
|
|
|
|||
|
|
|
|||
|
PART III
|
|
|
|
|
|
|
|
|||
|
|
|
|||
|
|
|
|||
|
|
|
|||
|
|
|
|||
|
PART IV
|
|
|
|
|
|
|
|
|||
|
|
|
|||
|
|
|
|||
i
SPECIAL NOTE REGARDING FORWARD-LOOKING STATEMENTS
We have made statements under the captions “Business,” “Risk Factors,” “Management’s Discussion and Analysis of Financial Condition and Results of Operations”, and in other sections of this Form 10-K that are forward-looking statements. Forward-looking statements also can be identified by words such as “future,” “anticipates,” “believes,” “estimates,” “expects,” “intends,” “plans,” “predicts,” “will,” “would,” “could,” “can,” “may,” and similar terms. These forward-looking statements, which are subject to known and unknown risks, uncertainties and assumptions about us, may include projections of our future financial performance based on our growth strategies and anticipated trends in our business. These statements are only predictions based on our current expectations and projections about future events. There are important factors that could cause our actual results, level of activity, performance or achievements to differ materially from the results, level of activity, performance or achievements expressed or implied by the forward-looking statements. In particular, you should consider the numerous risks and uncertainties outlined in “Risk Factors.”
These risks and uncertainties are not exhaustive. Other sections of this Form 10-K may include additional factors, which could adversely impact our business and financial performance. Moreover, we operate in a very competitive and rapidly changing environment. New risks and uncertainties emerge from time to time, and it is not possible for our management to predict all risks and uncertainties, nor can management assess the impact of all factors on our business or the extent to which any factor, or combination of factors, may cause actual results to differ materially from those contained in any forward-looking statements.
Although we believe the expectations reflected in the forward-looking statements are reasonable, we cannot guarantee future results, level of activity, performance or achievements. Moreover, neither we nor any other person assumes responsibility for the accuracy or completeness of any of these forward-looking statements. You should not rely upon forward-looking statements as predictions of future events. We are under no duty to update any of these forward-looking statements after the date of this Form 10-K to conform our prior statements to actual results or revised expectations and we do not intend to do so.
We are committed to providing timely and accurate information to the investing public, consistent with our legal and regulatory obligations. To that end, we use our website to convey information about our businesses, including the anticipated release of quarterly financial results, quarterly financial and statistical and business-related information. Investors can link to the Tronox Limited website through http://www.tronox.com. Our website and the information contained therein or connected thereto shall not be deemed to be incorporated into this Form 10-K.
ii
PART I
For the purposes of this discussion, references to “we,” “us,” and, “our” refer to Tronox Limited, together with its consolidated subsidiaries (collectively referred to as “Tronox”), when discussing the business following the completion of the Exxaro Transaction, and to Tronox Incorporated, together with its consolidated subsidiaries (collectively referred to as “Tronox Incorporated”), when discussing the business prior to the completion of the Exxaro Transaction.
Tronox is a public limited company registered under the laws of the State of Western Australia. We are a global leader in the mining of titanium bearing mineral sands and the production of titanium dioxide (“TiO2”) pigment. Our TiO2 products are critical components of everyday applications such as paint and other coatings, plastics, paper, and other uses. Products we derive from mineral sands include titanium feedstock, zircon, and pig iron. Zircon, a hard, glossy mineral, is used for the manufacture of ceramics, refractories, TV screen glass, and a range of other industrial and chemical products. Pig iron is a metal material used in the steel and metal casting industries to create wrought iron, cast iron, and steel. Titanium feedstock is primarily used to manufacture TiO2 pigment.
On February 21, 2017, Tronox Limited, The National Titanium Dioxide Company Ltd., a limited company organized under the laws of the Kingdom of Saudi Arabia (“Cristal”), and Cristal Inorganic Chemicals Netherlands Coöperatief W.A., a cooperative organized under the laws of the Netherlands and a wholly owned subsidiary of Cristal (“Seller”), entered into a Transaction Agreement (the “Transaction Agreement”), pursuant to which we agreed to acquire Cristal’s titanium dioxide business for $1.673 billion in cash, subject to a working capital adjustment at closing (the “Cash Consideration”), plus 37,580,000 Class A ordinary shares (“Class A Shares”), par value $0.01 per share, of Tronox Limited (the “Cristal Transaction”). Following the closing of the Cristal Transaction, the Seller will own approximately 24% of the outstanding ordinary shares (including both Class A and Class B) of Tronox Limited. On March 1, 2018, Tronox, Cristal and Seller entered into an Amendment to the Transaction Agreement (the “Amendment”) that extends the termination date under the Transaction Agreement to June 30, 2018, with automatic 3-month extensions to March 31, 2019, if necessary based on the status of outstanding regulatory approvals.
In 2012, our Class B ordinary shares (“Class B Shares”) were issued to Exxaro Resources Limited (“Exxaro”) and one of its subsidiaries in consideration for 74% of Exxaro’s South African mineral sands business (the “Exxaro Transaction”). On March 8, 2017, Exxaro announced its intention to begin pursuing a path to monetize its ownership stake in Tronox over time. On October 10, 2017, Exxaro sold 22,425,000 Class A ordinary shares (“Class A Shares”) in an underwritten registered offering (the “Exxaro Share Transaction”). At December 31, 2017 and December 31, 2016, Exxaro held approximately 24% and 44%, respectively, of the voting securities of Tronox Limited. Presently, Exxaro intends to sell the remainder of its Tronox shares in a staged process over time pursuant to the existing registration statement, subject to market conditions. Exxaro’s sale of Class A Shares does not impact its 26% ownership interest in each of our Tronox KZN Sands (Pty) Ltd. and Tronox Mineral Sands (Pty) Ltd. subsidiaries. See Notes 1 and 21 of notes to the consolidated financial statements for additional information regarding Exxaro transactions.
Principal Business Segment
On September 1, 2017, we completed the previously announced sale of our wholly owned subsidiary Tronox Alkali Corporation (“Alkali”) to Genesis Energy, L.P. for proceeds of $1.325 billion in cash (the “Alkali Sale”). As a result of the Alkali Sale, Alkali’s results of operations have been reported as discontinued operations and we now operate under one operating and reportable segment, TiO2. See Notes 3 and 22 of notes to consolidated financial statements for additional information.
TiO2 is used in a wide range of products due to its ability to impart whiteness, brightness, and opacity. TiO2 is used extensively in the manufacture of paint and other coatings, plastics and paper, and in a wide range of other applications, including inks, fibers, rubber, food, cosmetics, and pharmaceuticals. Moreover, it is a critical component of everyday consumer applications due to its superior ability to cover or mask other materials effectively and efficiently relative to alternative white pigments and extenders. TiO2 is considered to be a quality
1
of life product, and some research indicates that consumption generally increases as disposable income increases. At present, it is our belief that there is no effective mineral substitute for TiO2 because no other white pigment has the physical properties for achieving comparable opacity and brightness, or can be incorporated as cost effectively.
Our TiO2 business includes the following:
| • | exploration, mining, and beneficiation of mineral sands deposits; |
| • | production of titanium feedstock (including chloride slag, slag fines, rutile, synthetic rutile and leucoxene), pig iron, and zircon; |
| • | production and marketing of TiO2; and |
| • | electrolytic manganese dioxide manufacturing and marketing, which is primarily focused on advanced battery materials and specialty boron products. |
Exploration, Mining and Beneficiation of Mineral Sands Deposits
“Mineral sands” refers to concentrations of heavy minerals in an alluvial environment (sandy or sedimentary deposits near a sea, river or other water source). Mineral sands are the most important source of raw material for manufacture of pigment-grade TiO2. Our exploration, mining and beneficiation of mineral sands deposits are comprised of the following:
| • | Our KwaZulu-Natal (“KZN”) Sands operations located in South Africa consist of the Fairbreeze mine, a concentration plant, a mineral separation plant, and a smelter complex with two furnaces; |
| • | Our Namakwa Sands operations located in South Africa include the Namakwa Sands mine, a primary concentration plant, a secondary concentration plant, a mineral separation plant, and a smelter complex with two furnaces; and |
| • | Our Western Australia operations, which consist of the Cooljarloo mine and concentration plant and the Chandala processing plant, which includes a mineral separation plant, and a synthetic rutile plant. |
Exploration
Ilmenite - Ilmenite is the most abundant titanium mineral, with naturally occurring ilmenite having a titanium dioxide content ranging from approximately 45% to 65%, depending on its geological history. The weathering of ilmenite in its natural environment results in oxidation of the iron, which increases titanium content.
Rutile - Rutile is essentially composed of crystalline titanium dioxide and, in its pure state, would contain close to 100% titanium dioxide. Naturally occurring rutile, however, usually contains minor impurities and therefore, commercial concentrates of this mineral typically contain approximately 94% to 96% titanium dioxide.
Leucoxene - Leucoxene is a natural alteration of ilmenite with a titanium dioxide content ranging from approximately 65% to 90%. The weathering process is responsible for the alteration of ilmenite to leucoxene, which results in the removal of iron, leading to an upgrade in titanium dioxide content.
Titanium Slag - The production of titanium slag involves smelting ilmenite in an electric arc furnace under reducing conditions, normally with anthracite (coal) used as a reducing agent. Slag, containing the bulk of the titanium and impurities other than iron, and a high purity pig iron are both produced in this process. The final quality of the slag is highly dependent on the quality of the original ilmenite and the ash composition of the anthracite used in the furnace. Titanium slag has a titanium dioxide content of approximately 75% to 91%. Our slag typically contains 86% to 89% titanium dioxide.
Titanium Slag Fines - For titanium slag to be suitable for use in the chloride process, it needs to be milled down to a particle size range, which allows it to be processed effectively during the chlorination step of the chloride process. The milling of titanium slag results in the generation of a smaller size than can readily be used by chloride producers, which is separated and sold as a separate product, mostly to pigment producers who operate the sulfate process.
2
Synthetic Rutile - A number of processes have been developed for the beneficiation of ilmenite into products containing between approximately 90% and 95% titanium dioxide. These products are known as synthetic rutile or upgraded ilmenite. The processes employed vary in terms of the extent to which the ilmenite grain is reduced, and the precise nature of the reducing reaction and the conditions used in the subsequent removal of iron. All of the existing commercial processes are based on the reduction of ilmenite in a rotary kiln, followed by leaching under various conditions to remove the iron from the reduced ilmenite grains. Our synthetic rutile has a titanium dioxide content of approximately 90% to 93%.
Zircon - Zircon is often, but not always, found in the mineral sands deposits containing ilmenite. It is extracted, alongside ilmenite and rutile, as part of the initial mineral sands beneficiation process.
Mining
The mining of mineral sands deposits is conducted either “wet,” by dredging or hydraulic water jets, or “dry,” using earth-moving equipment to excavate and transport the sands. Dredging, as used at the Cooljarloo mine, is generally the favored method of mining mineral sands, provided that the ground conditions are suitable and water is readily available. In situations involving hard ground, discontinuous ore bodies, small tonnage, high slimes contents or very high grades, dry mining techniques are generally preferred.
Dredge Mining - Dredge mining, or wet mining, is best suited to ore reserves located below the water table. A floating dredge removes the ore from the bottom of an artificial pond through a large suction pipe. The bulk sand material is fed as slurry through a primary, or “wet,” concentrator that is typically towed behind the dredge unit. The dredge slowly advances across the pond and deposits clean sand tailings behind the pond for subsequent revegetation and rehabilitation. Because of the high capital cost involved in the manufacturing and location, dredge mining is most suitable for large, long-life deposits. The dredging operations at Cooljarloo use two large floating dredges in a purpose-built pond. The slurry is pumped to a floating concentrator, which recovers heavy minerals from the sand and clay.
Hydraulic Mining - At our Fairbreeze mine in KZN, we employ a hydraulic mining method for mineral sands due to the topography of the ore body and the ore characteristics. A jet of high-pressure water is aimed at the mining face, thereby cutting into and loosening the sand so that it collapses on the floor. The water acts as a carrier medium for the sand, due to the high fines (mineral particles that are too fine to be economically extracted and other materials that remain after the valuable fraction of an ore has been separated from the uneconomic fraction) content contained in the ore body. The slurry generated by the hydraulic monitors flows to a collection sump where oversize material is removed and the slurry is then pumped to the primary concentration plant.
Dry Mining - Dry mining is suitable where mineral deposits are shallow, contain hard bands of rock, or are in a series of unconnected ore bodies. Dry mining is performed at Namakwa Sands, which is located in an arid region on the west coast of South Africa. The ore is mined with front end loaders in a load and carry operation, dumping the mineral bearing sands onto a conveyor belt system that follows behind the mining face. The harder layers are mined using hydraulic excavators in a backhoe configuration or by bulldozer. Namakwa Sands does not use blasting in its operations. The mined material is transported by trucks to the mineral sizers where primary reduction takes place.
Processing and Mineral Separation
Processing - Both wet and dry mining techniques utilize wet concentrator plants to produce a high grade of heavy mineral concentrate (typically approximately 90% to 98% heavy mineral content). Screened ore is first deslimed, a process by which slimes are separated from larger particles of minerals, and then washed through a series of spiral separators that use gravity to separate the heavy mineral sands from lighter materials, such as quartz. Residue from the concentration process is pumped back into either the open pits or slimes dams for rehabilitation and water recovery. Water used in the process is recycled into a clean water dam with any additional water requirements made up from pit dewatering or rainfall.
Mineral Separation - The non-magnetic (zircon and rutile) and magnetic (ilmenite) concentrates are passed through a dry separation process, known as the “dry mill” to separate out the minerals. Electrostatic and dry magnetic methods are used to further separate the ilmenite, rutile and zircon. Electrostatic separation relies on the difference in surface conductivity of the materials to be separated. Conductive minerals (such as ilmenite, rutile
3
and leucoxene) behave differently from non-conductive minerals (such as zircon) when subjected to electrical forces. Magnetic separation techniques are dependent on the iron content of a mineral. Magnetic minerals (such as ilmenite) will separate from non-magnetic minerals (such as rutile and leucoxene) when subjected to a magnetic field. A combination of gravity and magnetic separation is used to separate zircon from the non-magnetic portion of the heavy mineral concentrate. The heavy mineral concentrate at KZN Sands and Namakwa Sands is passed through wet high-intensity magnetic separation to produce a non-magnetic fraction and a magnetic fraction.
Production of titanium feedstock, pig iron, and zircon
Our TiO2 operations have a combined annual production capacity of approximately 721,000 metric tons (“MT”) of titanium feedstock, which is comprised of 91,000 MT of rutile and leucoxene, 220,000 MT of synthetic rutile, and 410,000 MT of titanium slag. Our TiO2 operations also have the capability to produce approximately 220,000 MT of zircon and 221,000 MT of pig iron.
Synthetic Rutile Production - Ilmenite may also be upgraded into synthetic rutile. Synthetic rutile, or upgraded ilmenite, is a chemically modified form of ilmenite that has the majority of the ferrous, non-titanium components removed, and is also suitable for use in the production of titanium metal or TiO2 using the chloride process. Ilmenite is converted to synthetic rutile in a two-stage pyrometallurgical and chemical process. The first stage involves heating ilmenite in a large rotary kiln. Coal is used as a heat source and, when burned in an oxygen deficient environment, it produces carbon monoxide, which promotes a reducing environment that converts the iron oxide contained in the ilmenite to metallic iron. The intermediate product, called reduced ilmenite, is a highly magnetic sand grain due to the presence of the metallic iron. The second stage involves the conversion of reduced ilmenite to synthetic rutile by removing the metallic iron from the reduced ilmenite grain. This conversion is achieved through aeration (oxidation), accelerated through the use of ammonium chloride as a catalyst, and acid leaching of the iron to dissolve it out of the reduced ilmenite. Activated carbon is also produced as a co-product of the synthetic rutile production process.
Titanium Feedstock - Ilmenite, rutile, leucoxene, titanium slag and synthetic rutile are all used primarily as feedstock for the production of TiO2. Titanium feedstock can be segmented based on the level of titanium contained within the feedstock, with substantial overlap between each segment. Different grades of titanium feedstock have similar characteristics. As such, TiO2 producers generally source and supply a variety of feedstock grades, and often blend them into one feedstock. The lower amount of titanium used in the TiO2 manufacturing process, the more feedstock required and waste material produced. Naturally occurring high-grade titanium minerals required for the production of TiO2 are limited in supply. Two processes have been developed commercially: one for the production of titanium slag and the other for the production of synthetic rutile. Both processes use ilmenite as a raw material, and involve the removal of iron oxides and other non-titanium material.
Titanium Slag - Ilmenite at KZN Sands and Namakwa Sands is processed further through direct current arc furnaces to produce titanium slag with a titanium content of approximately 86% to 89%. The smelting process comprises the reduction of ilmenite to produce titanium slag and pig iron. Ilmenite and anthracite are fed in a tightly controlled ratio into an operating furnace where the endothermic reduction of ilmenite occurs. The resultant titanium slag has a lower density than the iron, and separation of the two liquid products occurs inside the furnace. The slag and iron are tapped periodically from separate sets of tapholes located around the circumference of the furnace. Slag is tapped into steel pots and cooled for several hours in the pots before the slag blocks are tipped out. The blocks are subsequently transported to the blockyard where they are cooled under water sprays for a number of days. They are then crushed, milled, and separated according to size fractions, as required by the customers. The tapped pig iron is re-carburized, de-sulfurized, and cast into ingots or “pigs”.
High Purity Pig Iron - The process by which ilmenite is converted into titanium slag results in the production of high purity iron containing low levels of manganese. When iron is produced in this manner, the molten iron is tapped from the ilmenite furnace during the smelting process, alloyed by adding carbon and silicon and treated to reduce the sulfur content, and is then cast into pigs. The pig iron produced as a co-product of our titanium slag production is known as low manganese pig iron.
Zircon - Zircon (ZrSiO4) is a co-product of mining mineral sands deposits for titanium feedstock. Zircon is primarily used as an additive in ceramic glazes to add hardness, which makes the ceramic glaze more water, chemical and abrasion resistant. It is also used for the production of zirconium metal and zirconium chemicals, in refractories, as molding sand in foundries, and for TV screen glass, where it is noted for its structural stability at
4
high temperatures and resistance to abrasive and corrosive conditions. Zircon typically represents a relatively low proportion of the in-situ heavy mineral sands deposits, but has a relatively higher value compared to other heavy mineral products. Refractories containing zircon are expensive and are only used in demanding, high-wear and corrosive applications in the glass, steel and cement industries. Foundry applications use zircon when casting articles of high quality and value where accurate sizing is crucial, such as aerospace, automotive, medical, and other high-end applications.
Competitive Conditions
Globally, there are a small number of large mining companies or groups that are involved in the production of titanium feedstock and these are dominated by close relationships between miners and consumers (predominately pigment producers).
Production and Marketing of TiO2
We operate three TiO2 pigment facilities at the following locations: Hamilton, Mississippi; Botlek, the Netherlands; and Kwinana, Western Australia, representing an aggregate annual TiO2 production capacity of 465,000 MT.
Production
TiO2 is produced using a combination of processes involving the manufacture of base pigment particles followed by surface treatment, drying and milling (collectively known as finishing). Two commercial production processes are used by manufacturers: the chloride process and the sulphate process. All of our TiO2 is produced using the chloride process. We are one of a limited number of TiO2 producers in the world with chloride production technology. We believe that we are one of the largest global producers and marketers of TiO2 manufactured via chloride technology. TiO2 produced using the chloride process is preferred for some of the largest end-use applications.
In the chloride process, high quality feedstock (slag, synthetic rutile, natural rutile or, in limited cases, high titanium content ilmenite ores) are reacted with chlorine (the chlorination step) and carbon to form titanium tetrachloride (“TiCl4”) in a continuous fluid bed reactor. Purification of TiCl4 to remove other chlorinated products is accomplished using a distillation process. The purified TiCl4 is then oxidized in a vapor phase form to produce raw pigment particles and chlorine gas. The latter is recycled back to the chlorination step for reuse. Raw pigment is then typically slurried with water and dispersants prior to entering the finishing step. The chloride process currently accounts for substantially all of the industry-wide TiO2 production capacity in North America, and approximately 46% of industry-wide capacity globally.
Commercial production of TiO2 results in one of two different crystal forms: rutile, which is manufactured using either the chloride process or the sulphate process, or anatase, which is only produced using the sulfate process. All of our global production capacity utilizes the chloride process to produce rutile TiO2. Rutile TiO2 is preferred over anatase TiO2 for many of the largest end-use applications, such as coatings and plastics, because its higher refractive index imparts better hiding power at lower quantities than the anatase crystal form and it is more suitable for outdoor use because it is more durable. Although rutile TiO2 can be produced using either the chloride process or the sulphate process, some customers prefer rutile produced using the chloride process because it typically has a bluer undertone and greater durability.
The primary raw materials used in the production of TiO2 include titanium feedstock, chlorine and coke. Chemicals used in the production of TiO2 include oxygen and nitrogen. Other chemicals used in the production of TiO2 are purchased from various companies under long-term supply contracts. In the past, we have been, and we expect that we will continue to be, successful in obtaining short-term and long-term extensions to these and other existing supply contracts prior to their expiration. We expect the raw materials purchased under these contracts, and contracts that we may enter into in the near term, to meet our requirements over the next several years.
Marketing
We supply and market TiO2 under the brand name TRONOX® to approximately 700 customers in approximately 100 countries, including market leaders in each of the key end-use markets for TiO2, and we have supplied each of our top ten customers with TiO2 for more than 10 years. For information regarding 2017 sales volume by geography and end-use market, see section “Segment and Geographic Revenue Information”.
5
In addition to price and product quality, we compete on the basis of technical support and customer service. Our direct sales and technical service organizations execute our sales and marketing strategy, and work together to provide quality customer service. Our direct sales staff is trained in all of our products and applications. Due to the technical requirements of TiO2 applications, our technical service organization and direct sales offices are supported by a regional customer service staff located in each of our major geographic markets.
Our three TiO2 production facilities are strategically positioned in key geographies. The Hamilton facility located in Mississippi USA, is one of the largest TiO2 production facilities in the world, and has the size and scale to service customers in North America and around the globe. Our Kwinana plant, located in Australia, is well positioned to service the growing demand from Asia. Our Botlek facility, located in the Netherlands, services our European customers and certain specialized applications globally.
Our sales and marketing strategy focuses on effective customer management through the development of strong relationships. We develop customer relationships and manage customer contact through our sales team, technical service organization, research and development team, customer service team, plant operations personnel, supply chain specialists, and senior management visits. We believe that multiple points of customer contact facilitate efficient problem solving, supply chain support, formula optimization and co-development of products.
The global market in which our TiO2 business operates is highly competitive. Competition is based on a number of factors such as price, product quality, and service. We face competition not only from chloride process pigment producers, but from sulfate process pigment producers as well. Moreover, because transportation costs are minor relative to the cost of our product, there is also competition between products produced in one region versus products produced in another region.
We face competition from competitors with facilities in multiple regions, including Chemours, Cristal Global, Venator and Kronos Worldwide Inc. In addition to the major competitors discussed above, we compete with numerous regional producers, including producers in China such as Lomon Billions, CNNC and Blue Star.
Electrolytic Manganese Dioxide Manufacturing and Marketing
Our electrolytic and other chemical products operations are primarily focused on advanced battery materials and specialty boron products.
Electrolytic manganese dioxide (“EMD”) - EMD is the active cathode material for alkaline batteries used in flashlights, electronic games, and medical and industrial devices. We believe that we are one of the largest producers of EMD for the global alkaline battery industry. EMD quality requirements for alkaline technology are much more demanding than for zinc carbon technology and, as a result, alkaline-grade EMD commands a higher price than zinc carbon-grade EMD. The United States (“U.S.”) primary battery market, predominantly based on alkaline-grade EMD, is the largest in the world followed by China and Japan according to publicly available industry reports. As such, we expect demand for alkaline-grade EMD to be flat as the demand stabilizes for devices using primary batteries.
Boron - Specialty boron product end-use applications include semiconductors, pharmaceuticals, high-performance fibers, specialty ceramics and epoxies, as well as igniter formulations. According to publicly available industry reports, we are one of the leading suppliers of boron trichloride, along with JSC Aviabor, Sigma-Aldrich Corporation, and several Asian manufacturers. We anticipate demand for boron trichloride will remain positive, driven primarily by the growth of the semiconductor industry.
Research and Development
We have research and development facilities that service our products, and focus on applied research and development of both new and existing processes. Our research and development facilities supporting our mineral sands business are located in South Africa, while the majority of scientists supporting our pigment and electrolytic research and development efforts are located in Oklahoma City, Oklahoma, USA.
New process developments are focused on increased throughput, efficiency gains and general processing equipment-related improvements. Ongoing development of process technology contributes to cost reduction, enhanced production flexibility, increased capacity, and improved consistency of product quality. In 2017, our product development and commercialization efforts were focused on several TiO2 products that deliver added value to customers across all end use segments by way of enhanced properties of the pigment.
6
Patents, Trademarks, Trade Secrets and Other Intellectual Property Rights
Protection of our proprietary intellectual property is important to our business. At December 31, 2017, we held 38 U.S. patents, 6 patent applications, and approximately 217 in foreign counterparts, including both issued patents and pending patent applications. Our U.S. patents have expiration dates ranging through 2035. Additionally, we have 5 trademark registrations in the U.S., as well as 54 trademark counterpart registrations in foreign jurisdictions.
We rely upon, and have taken steps to secure our unpatented proprietary technology, know-how and other trade secrets. The substantial majority of business patents relate to our chloride products and production technology. Our proprietary chloride production technology is an important part of our overall technology position. However, much of the fundamental intellectual property associated with both chloride and sulfate pigment production is no longer subject to patent protection. At Namakwa Sands, we rely on intellectual property for our smelting technology, which was granted to us in perpetuity by Anglo American South Africa Limited for use on a worldwide basis, pursuant to a non-exclusive license.
We protect the trademarks that we use in connection with the products we manufacture and sell, and have developed value in connection with our long-term use of our trademarks; however, there can be no assurance that the trademark registrations will provide meaningful protection against the use of similar trademarks by competitors, or that the value of our trademarks will not be diluted. The same can be said for our patents and patent applications, which may in the future be the subject of a challenge regarding validity as well as ownership, requiring a defense of the patent/application through legal proceedings, which inherently introduce a degree of business uncertainty and risk. We also use and rely upon unpatented proprietary knowledge, continuing technological innovation and other trade secrets to develop and maintain our competitive position. We conduct research activities and protect the confidentiality of our trade secrets through reasonable measures, including confidentiality agreements and security procedures. While certain patents held for our products and production processes are important to our long-term success, more important is the operational knowledge we possess.
Employees
As of December 31, 2017, Tronox had approximately 3,400 employees worldwide, of which 700 are located in the U.S., 600 in Australia, 1,800 in South Africa, and 300 in the Netherlands and other international locations. Our TiO2 segment employees in the U.S. are not represented by a union or collective bargaining agreement. In South Africa, approximately 73% of our workforce belongs to a union. In Australia, most employees are not currently represented by a union, but approximately 46% are represented by a collective bargaining agreement. In the Netherlands, approximately 49% of our employees are represented by a collective bargaining agreement and 27% are members of a union. We consider relations with our employees and labor organizations to be good.
Environmental, Health and Safety Authorizations
Mining
Our facilities and operations are subject to extensive general and industry-specific environmental, health and safety regulations in South Africa and Australia. These regulations include those relating to mine rehabilitation, liability provision, water management, the handling and disposal of hazardous and non-hazardous materials, and occupational health and safety. The various legislation and regulations are subject to a number of internal and external audits. We believe our mineral sands operations are in compliance, in all material respects, with existing health, safety and environmental legislation and regulations.
Regulation of the Mining Industry in South Africa
There are numerous mining-related laws and regulatory authorizations that may impact the performance of our business. These include but are not limited to: the Mineral and Petroleum Resources Royalty Act, which imposes a royalty on refined and unrefined minerals payable to the South African government; the Mineral and Petroleum Resources Development ACT (the “MPRDA”), which governs the acquisition, use and disposal of mineral rights; the South African Minerals Act, which requires each new mine to prepare an Environmental Management Program Report for approval by the South African Department of Mineral Reserves (DMR); the Revised South African Mining Charter, effective September 2010, which requires, among other conditions, that mining entities achieve a 26% historically disadvantaged persons ownership of mining assets and the Black
7
Economic Empowerment (“BEE”) legislation in South Africa. The DMR has proposed changes to the mining charter that would make requirements more stringent. These changes are being challenged by the Chamber of Mines, an industry employers’ organization representing South African mining companies, the outcome of which is uncertain. See Item 1A. Risk Factors.
Regulation of the Mining Industry in Australia
Mining operations in Western Australia are subject to a variety of environmental protection regulations including but not limited to: the Environmental Protection Act (the “EPA”), the primary source of environmental regulation in Western Australia, and, the Environment Protection and Biodiversity Conservation Act 1999 (Cth), which established the federal environment protection regime and prohibits the carrying out of a “controlled action” that may have a significant impact on a “matter of national environmental significance.”
Prescriptive legislation regulates health and safety at mining workplaces in Western Australia. The principal general occupational health and safety legislation and regulations are the Occupational Safety and Health Act 1984 (WA), the Occupational Health and Safety Regulations 1996 (WA) and the guidelines. The Mines Safety and Inspection Act 1994 (WA) and Mines Safety and Inspection Regulations 1995 (WA) and guidelines provide the relevant legislation for mining operations in Western Australia. The Dangerous Goods Act 2004 (WA) applies to the safe storage, handling and transport of dangerous goods.
Each Australian state and territory has its own legislation regulating the exploration for and mining of minerals. Our operations are principally regulated by the Western Australian Mining Act 1978 (WA) and the Mining Regulations 1981 (WA).
State Agreements are contracts between the State of Western Australia and the proponents of major resources projects, and are intended to foster resource development and related infrastructure investments. These agreements are approved and ratified by the Parliament of Western Australia. The State Agreement relevant to our Australian operations and our production of mineral sands is the agreement authorized by the Mineral Sands (Cooljarloo) Mining and Processing Agreement Act 1988 (WA). State Agreements may only be amended by mutual consent, which reduces the sovereign risk and increases the security of tenure, however Parliament may enact legislation that overrules or amends the particular State Agreement.
Regulation of Finished Product Manufacturing
Our business is subject to extensive regulation by federal, state, local and foreign governments. Governmental authorities regulate the generation and treatment of waste and air emissions at our operations and facilities. At many of our operations, we also comply with worldwide, voluntary standards developed by the International Organization for Standardization (“ISO”), a nongovernmental organization that promotes the development of standards and serves as a bridging organization for quality and environmental standards, such as ISO 9002 for quality management and ISO 14001 for environmental management.
Chemical Registration
The European Union (the “EU”) adopted a regulatory framework for chemicals in 2006 known as Registration, Evaluation and Authorization of Chemicals (“REACH”). Manufacturers and importers of chemical substances must register information regarding the properties of their existing chemical substances with the European Chemicals Agency. The timeline for existing chemical substances to be registered is based on volume and toxicity. The first group of chemical substances was required to be registered in 2010, with additional registrations due in 2013 and 2018. We registered those products requiring registration by the 2010 and 2013 deadlines. The REACH regulations also require chemical substances, which are newly imported or manufactured in the EU to be registered before being placed on the market. We are now focused on the authorization phase of the REACH process, and are making efforts to address “Substances of Very High Concern” and evaluating potential business implications. As a chemical manufacturer with global operations, we are also actively monitoring and addressing analogous regulatory regimes being considered or implemented outside of the EU, for example, in Korea and Taiwan.
8
In May 2016, France’s competent authority under REACH submitted a proposal to the European Chemicals Agency (“ECHA”) that would classify TiO2 as carcinogenic to humans by inhalation. The Company together with other companies and trade associations representing the TiO2 industry and industries consuming our products, submitted comments opposing the classification, based on evidence from epidemiological and other scientific studies. On October 12, 2017, ECHA’s Committee for Risk Assessment (“RAC”) released a written opinion dated September 14, 2017 stating that based on the scientific evidence it reviewed, there is sufficient grounds to classify TiO2 under the EU’s Classification, Labelling and Packaging Regulation (“CLP”) as a Category 2 Carcinogen, but only with a hazard statement describing the risk by inhalation. The European Commission will review the RAC’s formal recommendation to determine what regulatory measures, if any, should be taken. If the European Commission decides to adopt this classification, it could require that products manufactured with TiO2 be classified as containing carcinogenic materials, which could impact our business by inhibiting the marketing of products containing TiO2 to consumers, and subject our manufacturing operations to new regulations that could increase costs. Any classification, use restriction or authorized requirement for use imposed by the ECHA could have additional effects under other EU laws (e.g., those affecting medical and pharmaceutical applications, cosmetics, food packaging and food additives) and/or trigger heightened regulatory scrutiny in countries and local jurisdictions outside the EU based on health and safety grounds. It is also possible that heightened regulatory scrutiny would lead to claims by consumers or those involved in the production of such products alleging adverse health impacts. See Item 1A. Risk Factors.
Greenhouse Gas Regulation
Globally, our operations are subject to regulations that seek to reduce emissions of “greenhouse gases” (“GHGs”). We currently report and manage GHG emissions as required by law for sites located in areas requiring such managing and reporting (EU/Australia). While the U.S. has not adopted any federal climate change legislation, the U.S. Environmental Protection Agency (“EPA”) has introduced some GHG programs. For example, under the EPA’s GHG “Tailoring Rule,” expansions or new construction could be subject to the Clean Air Act’s Prevention of Significant Deterioration requirements. Some of our facilities are currently subject to GHG emissions monitoring and reporting. Changes or additional requirements due to GHG regulations could impact our capital and operating costs; however, it is not possible at the present time to estimate any financial impact to these U.S. operating sites. Also, some in the scientific community believe that increasing concentrations of GHGs in the atmosphere may result in climatic changes. Depending on the severity of climatic changes, our operations could be adversely affected. See Item 1A. Risk Factors.
Segment and Geographic Revenue Information
The tables below summarize Tronox Limited 2017 sales volume by geography and end-use market:
|
2017 Sales Volume by Geography
|
|
|
|
|
North America
|
|
40
|
%
|
|
Latin America
|
|
5
|
%
|
|
Europe
|
|
28
|
%
|
|
Asia-Pacific
|
|
27
|
%
|
|
|
|
|
|
|
2017 Sales Volume by End-Use Market
|
|
|
|
|
Paints and Coatings
|
|
79
|
%
|
|
Plastics
|
|
17
|
%
|
|
Paper and Specialty
|
|
4
|
%
|
Financial information by segment and geographic region is set forth in Item 7. Management’s Discussion and Analysis of Financial Condition and Results of Operations and Note 22 of Notes to consolidated financial statements.
Available Information
Our public internet site is http://www.tronox.com. The content of our internet site is available for information purposes only. It should not be relied upon for investment purposes, nor is it incorporated by reference into this annual report unless expressly noted. We make available, free of charge, on or through the investor relations section of our internet site, our annual reports on Form 10-K, quarterly reports on Form 10-Q, current reports on
9
Form 8-K, proxy statements and Forms 3, 4 and 5 filed on behalf of directors and executive officers, as well as any amendments to those reports filed or furnished pursuant to the Exchange Act as soon as reasonably practicable after we electronically file such material with, or furnish it to, the U.S. Securities and Exchange Commission (the “SEC”).
We file current, annual and quarterly reports, proxy statements and other information required by the Exchange Act with the SEC. You may read and copy any document we file at the SEC’s public reference room located at 100 F Street, N.E., Washington, D.C. 20549, USA, or by calling +1-800-SEC-0330. Our SEC filings are also available to the public from the SEC’s internet site at http://www.sec.gov.
10
You should carefully consider the risk factors set forth below, as well as the other information contained in this Form 10-K, including our consolidated financial statements and related notes. This Form 10-K contains forward-looking statements that involve risks and uncertainties. Any of the following risks could materially and adversely affect our business, financial condition or results of operations. Additional risks and uncertainties not currently known to us or those we currently view to be immaterial may also materially and adversely affect our business, financial condition or results of operations.
Our pending acquisition of the Cristal TiO2 Business may not be consummated, and failure to complete the Cristal TiO2 Business acquisition could impact our stock price and financial results.
On February 21, 2017, we entered into a transaction agreement to acquire the titanium dioxide business of The National Titanium Dioxide Co. Limited (“Cristal”) and on March 1, 2018, we amended the Transaction Agreement to provide for revised terms with respect to such acquisition in certain respects (the “Cristal Transaction”). Completion of the Cristal Transaction is subject to certain closing conditions, including certain regulatory approvals.
On December 5, 2017, the U.S. Federal Trade Commission (“FTC”) announced that it would not approve the Cristal Transaction as proposed and filed an administrative action to prevent the parties from consummating the transaction. On December 21, 2017, the European Commission announced that after its initial review, it would pursue a more in-depth investigation (commonly called a “Phase II investigation”) of the Cristal Transaction before reaching a decision to approve it, with or without conditions. The transaction agreement provides for customary representations, warranties and covenants that are subject, in some cases, to specified exceptions and qualifications contained in the transaction agreement. There can be no assurance, however, that all closing conditions for the Cristal Transaction will be satisfied and, if they are satisfied, that they will be satisfied in time for the closing to occur by June 30, 2018 (subject to automatic 3-month extensions to March 31, 2019 if necessary based on the status of outstanding regulatory approvals), at which time either party to the transaction agreement may mutually agree to extend the closing date or terminate the transaction agreement if the Cristal Transaction has not closed by such time.
The Cristal Transaction is conditioned on the Company obtaining financing sufficient to fund the cash consideration, and the transaction agreement provides that the Company must pay to Cristal a termination fee of $100 million if all conditions to closing, other than the financing condition, have been satisfied and the transaction agreement is terminated because closing of the Cristal Transaction has not occurred by June 30, 2018 (subject to automatic 3-month extensions to March 31, 2019 if necessary based on the status of outstanding regulatory approvals). In the event that such termination by Tronox is (i) on or after January 1, 2019, and Tronox elects to terminate the Transaction Agreement if it determines that the outstanding regulatory approvals are not reasonably likely to be obtained; or (ii) if regulatory approval has not been obtained by March 31, 2019 and Tronox or Cristal elects to terminate the Transaction Agreement; then Tronox is required to pay Cristal a $60 million termination fee. Tronox completed its refinancing during the third quarter of 2017. See Note 15 of notes of consolidated financial statements.
The cash portion of the consideration in the Cristal Transaction will be funded through a combination of proceeds from the Alkali Sale, which was completed on September 1, 2017, the refinancing of our debt, including the Blocked Term Loan and cash on hand. See Note 15 of notes to the consolidated financial statements.
If the acquisition of the Cristal TiO2 business is not completed, our ongoing business and financial results may be adversely affected and we will be subject to a number of risks, including the following:
| • | depending on the reasons for the failure to complete the Cristal Transaction we could be liable to Cristal for a termination fee or other damages in connection with the termination or breach of the transaction agreement; |
| • | we have dedicated and we expect we will continue to commit significant time and resources, financial and otherwise, in planning for the acquisition and the associated integration; and |
| • | while the transaction agreement is in effect prior to closing the Cristal Transaction, we are subject to certain restrictions on the conduct of our business, which may adversely affect our ability to execute certain of our business strategies. |
11
In addition, if the Cristal Transaction is not completed or is completed subject to conditions or remedies, we may experience negative reactions from the financial markets and from our customers and employees and/or lose the anticipated benefits of owning all or portions of Cristal’s TiO2 business. If the acquisition is not completed, these risks may materialize and may adversely affect our business, results of operations, cash flows, as well as the price of our Class A Shares.
Concentrated ownership of our ordinary shares by Cristal and Exxaro may prevent minority shareholders from influencing significant corporate decisions and may result in conflicts of interest.
Following the closing of the Cristal Transaction, Cristal Inorganic Chemicals Netherlands Coöperatief W.A. (“Cristal Inorganic”), a wholly-owned subsidiary of Cristal, will own approximately 24% of the outstanding ordinary shares (including both our Class A Shares and Class B Shares) of the Company. Following the closing of the Cristal Transaction and assuming that Exxaro does not engage in additional sales of its Class B Shares, Exxaro will own approximately 18% of the Company’s outstanding ordinary shares (including both our Class A Shares and Class B Shares).
Cristal Inorganic and Exxaro may be able to influence fundamental corporate matters and transactions, including mergers or acquisitions (subject to prior board approval); the sale of all or substantially all of our assets; in certain circumstances, the amendment of our Constitution; and our winding up and dissolution. This concentration of ownership, may delay, deter or prevent acts that would be favored by our other shareholders. The interests of Cristal Inorganic and Exxaro may not always coincide with our interests or the interests of our other shareholders. Also, Cristal Inorganic and Exxaro may seek to cause us to take courses of action that, in its judgment, could enhance its investment in us, but which might involve risks to our other shareholders or adversely affect us or our other shareholders.
In addition, under the shareholders agreement, to be entered into upon the closing of the Cristal Transaction (the “Cristal Shareholders Agreement”), among the Company, on the one hand, and Cristal, Cristal Inorganic and the three shareholders of Cristal, on the other hand (collectively, the “Cristal Shareholders”), as long as the Cristal Shareholders, collectively, beneficially own at least 24,900,000 or more of Class A Shares, they will have the right to designate for nomination two Class A Directors of the Board (defined below) and, as long as they beneficially own at least 12,450,000 Class A Shares but less than 24,900,000 Class A Shares, they will have the right to designate for nomination one Class A director of the Board. The Cristal Shareholders Agreement also will provide that as long as the Cristal Shareholders own at least 11,743,750 Class A Shares, they will be granted certain preemptive rights. Also under the Cristal Shareholders Agreement, the Company has agreed to file promptly after the closing of the acquisition a registration statement covering approximately four percent of the then-outstanding ordinary shares of the Company, which may be sold as soon as such registration statement is effective. Other than with respect to those shares, the Cristal Shareholders Agreement will include restrictions on Cristal Inorganic’s ability to transfer any of its Class A Shares for a period of two years after the closing of the acquisition other than to certain permitted transferees after the later of eighteen months and the resolution of all indemnification claims under the Transaction Agreement subject to certain further limitations. The Cristal Shareholders Agreement will also contain certain demand and piggyback registration rights, which commence after the transfer restriction period expires. Exxaro’s rights under our Constitution and Shareholder’s Deed will remain unchanged following the Cristal Transaction.
As a result of these or other factors, the market price of our Class A Shares could decline. In addition, this concentration of share ownership may adversely affect the trading price of our Class A Shares because investors may perceive disadvantages in owning shares in a company with significant shareholders.
We may not be able to realize anticipated benefits of the Cristal Transaction, including expected synergies, earnings per share accretion or earnings before interest, taxes, depreciation and amortization (“EBITDA”) and free cash flow growth and we will be subject to business uncertainties that could adversely affect our business.
The success of the pending Cristal Transaction will depend, in part, on our ability to realize anticipated cost synergies, earnings per share accretion or EBITDA and free cash flow growth. Our success in realizing these benefits, and the timing of this realization, depends on the successful integration of our business and operations with the acquired business and operations. Even if we are able to integrate the acquired businesses and operations successfully, this integration may not result in the realization of the full benefits of the pending Cristal Transaction that we currently expect within the anticipated time frame or at all.
12
There is also the possibility that:
| • | the acquisition may result in our assuming unexpected liabilities; |
| • | we may experience difficulties integrating operations and systems, as well as company policies and cultures; |
| • | we may fail to retain and assimilate employees of the acquired business; and |
| • | problems may arise in entering new markets in which we have little or no experience. |
Uncertainty about the effect of the Cristal Transaction on employees, customers and suppliers may have an adverse effect on our business. These uncertainties may impair our ability to attract, retain and motivate key personnel until the Cristal Transaction is consummated and for a period of time thereafter, and could cause our customers, suppliers and other business partners to delay or defer certain business decisions or to seek to change existing business relationships with us. The occurrence of any of these events could have a material adverse effect on our operating results, particularly during the period immediately following the closing of the Cristal Transaction.
Market conditions, as well as global and regional economic downturns that adversely affect the demand for our end-use products could adversely affect the profitability of our operations and the prices at which we can sell our products, negatively impacting our financial results.
Our TiO2 revenue and profitability is dependent on direct sales of TiO2 to end user customers and sales of TiO2 feedstock to TiO2 producers. TiO2 is a chemical used in many “quality of life” products for which demand historically has been linked to global, regional and local GDP and discretionary spending, which can be negatively impacted by regional and world events or economic and market conditions. Such events can cause a decrease in demand for our products and market prices to fall, which may have an adverse effect on our results of operations and financial condition. A substantial portion of our products and raw materials are commodities that reprice as market supply and demand fundamentals change. Accordingly, product margins and the level of our profitability tend to vary with changes in the business cycle. Our TiO2 prices may do so in the near term as ore prices and pigment prices are expected to fluctuate in the short term and over the next few years.
A significant portion of the demand for our products comes from manufacturers of paint and plastics, and other industrial customers. Companies that operate in the industries that these industries serve, including the automotive and construction, may experience significant fluctuations in demand for their own end products because of economic conditions, changes in consumer demand, or increases in raw material and energy costs. In addition, many large end users of our products depend upon the availability of credit on favorable terms to make purchases of raw materials such as TiO2. As interest rates increase or if our customers’ creditworthiness deteriorates, this credit may be expensive or difficult to obtain. If these customers cannot obtain credit on favorable terms, they may be forced to reduce their purchases. These and other factors may lead some customers to seek renegotiation or cancellation of their arrangements with our businesses, which could have a material adverse effect on our results of operations. Additionally, Chinese producers are significant participants in the TiO2 market and Chinese exports can also affect demand and the price for our products.
TiO2 pigment and feedstock prices have been and in the future may be volatile. Price declines for our products will negatively affect our financial position and results of operations.
Additionally, historically, the global market and, to a lesser extent, the domestic market for TiO2 pigment and feedstock have been volatile, and those markets are likely to remain volatile in the future. Prices for TiO2 pigment and feedstock may fluctuate in response to relatively minor changes in the supply of and demand for these products, market uncertainty and other factors beyond our control.
Factors that affect the price of our products include, among other things:
| • | overall economic conditions; |
| • | the level of customer demand, including in the paint, paper and plastics industries; |
| • | the level of production and exports of our products globally; |
| • | the level of production and cost of materials used to produce TiO2, including synthetic materials, globally; |
13
| • | the cost of energy consumed in the production of TiO2, including the price of natural gas, electricity and coal; |
| • | the impact of competitors increasing their capacity and exports; |
| • | domestic and foreign governmental relations, regulations and taxes; and |
| • | political conditions or hostilities and unrest in regions where we export our TiO2 products. |
TiO2 pigment pricing pressure can make it difficult to predict the cash we may have on hand at any given time, and a prolonged period of price declines may materially and adversely affect our financial position, liquidity, ability to finance planned capital expenditures and results of operations.
The markets for many of our TiO2 products have seasonally affected sales patterns.
The demand for TiO2 during a given year is subject to seasonal fluctuations. Because TiO2 is widely used in paint and other coatings, titanium feedstocks are in higher demand prior to the painting season in the Northern Hemisphere (spring and summer), and pig iron is in lower demand during the European summer holidays, when many steel plants and foundries undergo maintenance. Zircon generally is a non-seasonal product; however, it is negatively impacted by the winter and Chinese New Year celebrations due to reduced zircon demand from China. We may be adversely affected by existing or future cyclical changes, and such conditions may be sustained or further aggravated by anticipated or unanticipated changes in regional weather conditions. For example, poor weather conditions in a region can lead to an abbreviated painting season, which can depress consumer sales of paint products that use TiO2.
Our results of operations may be adversely affected by fluctuations in currency exchange rates.
The financial condition and results of operations of our operating entities outside the U.S. are reported in various foreign currencies, primarily the South African Rand, Australian Dollars and Euros, and then converted into U.S. dollars at the applicable exchange rate for inclusion in the financial statements. As a result, any volatility of the U.S. dollar against these foreign currencies creates uncertainty for and may have a negative impact on reported sales and operating margin. We have made a U.S. dollar functional currency election for both Australian financial reporting and federal income tax purposes. On this basis, our Australian entities report their results of operations on a U.S. dollar basis. In addition, our operating entities often need to convert currencies they receive for their products into currencies in which they purchase raw materials or pay for services, which could result in a gain or loss depending on fluctuations in exchange rates.
In order to manage this risk, we may, from time to time, enter into forward contracts to buy and sell foreign currencies.
Our operations may be negatively impacted by inflation.
Our profits and financial condition could be adversely affected when cost inflation is not offset by devaluation in operating currencies or an increase in the price of our products. Our operations have been affected by inflation in the countries in which they have operated in recent years. Working costs and wages in South Africa and Australia have increased in recent years, resulting in significant cost pressures for the mining industry.
As an emerging market, South Africa poses a challenging array of long-term political, economic, financial and operational risks.
South Africa has continued undergoing political and economic challenges. Changes to or instability in the economic or political environment in South Africa, especially if such changes create political instability, actual or potential shortages of production materials or labor unrest, could result in production delays and production shortfalls, and materially impact our production and results of operations.
In South Africa, our mining and smelting operations depend on electrical power generated by Eskom, the state-owned sole energy supplier. South African electricity prices have risen during the past few years, and future increases are likely. Additionally, our KZN Sands operations currently use approximately 328,000 gigajoules of Sasol gas, which is available only from Sasol Limited; however, we could replace approximately 30% to 44% of our current Sasol gas usage with furnace off-gas produced by KZN Sands, if necessary.
14
We use significant amounts of water in our operations, which could impose significant costs. Use of water in South Africa is governed by water-use licenses. Our KZN mining operation in South Africa uses water to transport the slimes or sand from reclaimed areas to the processing plant and to the tailings facilities. Additionally, South Africa is currently experiencing a drought resulting in water restrictions being imposed in certain areas, most notably recently in the Western Cape where our Namakwa Sands operations are located. A prolonged drought in a region of South Africa may lead to continued, or more severe water restrictions, either of which could have a material adverse effect on our business, financial condition or results of operations. Under South African law, our South African mining operations are subject to water-use licenses that govern each operation. These licenses require, among other conditions, that mining operations achieve and maintain certain water quality limits for all water discharges, where applicable. Our South African operations that came into existence after the adoption of the National Water Act, No. 36 of 1998 have applied for and been issued the required water-use licenses. However, changes to water-use licenses could affect our operational results and financial condition. On May 13, 2016, the Department of Water and Sanitation of the Republic of South Africa announced water restrictions affecting users of the fresh water supply to our Namakwa Sands operations. On December 12, 2017 the Department of Water and Sanitation published a notice in terms of the National Water Act (1998) curtailing water usage by 45% for residential and commercial users and 60% for agricultural users. Saldanha Bay Municipality, where our Namakwa Sands Smelter is located, is currently on Level 5 water restrictions and tariffs. While these restrictions have not curtailed our mining or processing operations to date, the reservoirs that store water for the system, which also supplies fresh water to the residents of the City of Cape Town, are at historically low levels and there can be no assurance that further use restrictions or supply curtailments may have a materially adverse impact on our operations at Namakwa Sands and as a result the financial condition and results of operations of our business. Namakwa Sands operations continues to implement freshwater consumption reduction initiatives and finding alternative sources of water to reduce reliance on the city’s water system.
The South African government may intervene in mining through various means including increased taxation, greater control and conditions on the distribution of mineral rights, poverty alleviation, and job creation. Such measures have not yet been defined, and the impact the measures may have on our business remains uncertain.
Changes to the revised MPRDA have been incorporated into the 2013 MPRDA amendment, and are awaiting consideration by the South African Parliament before being promulgated. Some of the proposed changes may have an adverse effect on our business, operating results and financial condition. Although we expect the bulk of the original act to remain intact, there could be substantial changes, based on the current draft. This could have adverse effects on our business, operating results and financial condition.
South Africa’s exchange control regulations require resident companies to obtain the prior approval of the South African Reserve Bank to raise capital in any currency other than the Rand, and restrict the export of capital from South Africa. While the South African government has relaxed exchange controls in recent years, it is difficult to predict whether or how it will further change or abolish exchange control measures in the future. These exchange control restrictions could hinder our financial and strategic flexibility, particularly our ability to use South African capital to fund acquisitions, capital expenditures, and new projects outside of South Africa.
Our operations in South Africa are reliant on services provided by the state agency, Transnet, for limited rail transport services at Namakwa Sands. Furthermore, they provide extensive dockside services at both the ports of Richards Bay and Saldanha Bay. Delays, particularly those caused by industrial actions, could have a negative impact on our business, operating results and financial condition.
South African law governs the payment of compensation and medical costs to a compensation fund against which mining employees and other people at sites where ancillary mining activities are conducted can claim for mining activity-related illnesses or injuries. Should claims against the compensation fund rise significantly due to our mining activity or if claims against us are not covered by the compensation fund, the amount of our contribution or liability to claimants may increase, which could adversely impact our financial condition. In addition, the HIV/AIDS epidemic in South Africa poses risks to our South African operations in terms of potentially reduced productivity, and increased medical and other costs. If there is a significant increase in the incidence of HIV/AIDS infection and related diseases among the South African workforce over the next several years, our operations, projects and financial condition may be adversely affected.
15
Our flexibility in managing our labor force may be adversely affected by labor and employment laws in the jurisdictions in which we operate, many of which are more onerous than those of the U.S.; and some of our labor force has substantial workers' council or trade union participation, which creates a risk of disruption from labor disputes and new laws affecting employment policies.
Labor costs constituted approximately 29% of our production costs in 2017. The majority of our employees are located outside the U.S. In most of those countries, labor and employment laws are more onerous than in the U.S. and, in many cases, grant significant job protection to employees, including rights on termination of employment.
In South Africa, over 73% of our workforce belongs to a union. In Australia, most employees are not currently represented by a union, but approximately 46% are represented by a collective bargaining agreement. In the Netherlands, approximately 49% of our employees are represented by a collective bargaining agreement and 27% are members of a union.
Our South African operations have entered into various agreements regulating wages and working conditions at our mines. There have been periods when various stakeholders have been unable to agree on dispute resolution processes, leading to threats of disruptive labor disputes, although only two strikes have ever occurred in the history of these operations. Due to the high level of employee union membership, our South African operations are at risk of production stoppages for indefinite periods due to strikes and other labor disputes. Although we believe that we have good labor relations with our South African employees, we may experience labor disputes in the future.
South African employment law, which is based on the minimum standard set by the International Labour Organization, sets out minimum terms and conditions of employment for employees. Although these may be improved by agreements between an employer and the trade unions, prescribed minimum terms and conditions form the benchmark for all employment contracts. Our South African operations are required to submit a report to the South African Department of Labour under South African employment law detailing the progress made towards achieving employment equity in the workplace. Failing to submit this report in a timely manner could result in substantial penalties. In addition, future legislative developments that affect South African employment policies may increase production costs or negatively impact relationships with employees and trade unions, which may have an adverse effect on our business, operating results and financial condition.
We are required to consult with, and seek the consent or advice of, various employee groups or works’ councils that represent our employees for any changes to our activities or employee benefits. This requirement could have a significant impact on our flexibility in managing costs and responding to market changes.
Given the nature of our chemical, mining and smelting operations, we face a material risk of liability, delays and increased cash costs of production from environmental and industrial accidents and operational breakdowns.
Our business involves significant risks and hazards, including environmental hazards, industrial accidents, and breakdowns of equipment and machinery. Our business is exposed to hazards associated with chemical process manufacturing and the related storage, handling and transportation of raw materials, products and wastes, and our furnace operations that are subject to explosions, water ingress and refractory failure, and our open pit and dredge mining operations that are subject to flooding and accidents associated with rock transportation equipment and conveyor belts. Furthermore, during operational breakdowns, the relevant facility may not be fully operational within the anticipated timeframe, which could result in further business losses. The occurrence of any of these or other hazards could delay production, suspend operations, increase repair, maintenance or medical costs and, due to the integration of our facilities, could have an adverse effect on the productivity and profitability of a particular manufacturing facility or on our business as a whole. Over our operating history, we have incurred incidents of this nature. Although insurance policies provide limited coverage for these risks, such policies will not fully cover some of these risks.
There is also a risk that our key raw materials or our products may be found to have currently unrecognized toxicological or health-related impact on the environment or on our customers or employees. Such hazards may cause personal injury and loss of life, damage to property and contamination of the environment, which could lead to government fines or work stoppage injunctions and lawsuits by injured persons. If such actions are required, we may have inadequate insurance to cover such claims, or insufficient cash flow to pay for such claims. Such outcomes could adversely affect our financial condition and results of operations.
16
Equipment upgrades, equipment failures and deterioration of assets may lead to production curtailments, shutdowns or additional expenditures.
Our operations depend upon critical equipment that require scheduled upgrades and maintenance and, may suffer unanticipated breakdowns or failures. As a result, our mining operations and processing may be interrupted or curtailed, which could have a material adverse effect on our results of operations.
In addition, assets critical to our mining and chemical processing operations may deteriorate due to wear and tear or otherwise sooner than we currently estimate. Such deterioration may result in additional maintenance spending and additional capital expenditures. If these assets do not generate the amount of future cash flows that we expect, and we are not able to refurbish them or procure replacement assets in an economically feasible manner, our future results of operations may be materially and adversely affected.
If any of the equipment on which we depend were severely damaged or were destroyed by fire, abnormal wear and tear, flooding, or otherwise, we may be unable to replace or repair it in a timely manner or at a reasonable cost, which would impact our ability to produce and ship our products, which would have a material adverse effect on our business, financial condition or results of operations.
We are a holding company that is dependent on cash flows from our operating subsidiaries to fund our debt obligations, capital expenditures and ongoing operations.
All of our operations are conducted and all of our assets are owned by our operating companies, which are our subsidiaries. We intend to continue to conduct our operations at the operating companies and any future subsidiaries. Consequently, our cash flow and our ability to meet our obligations or make cash distributions depends upon the cash flow of our operating companies and any future subsidiaries, and the payment of funds by our operating companies and any future subsidiaries in the form of dividends or otherwise. The ability of our operating companies and any future subsidiaries to make any payments to us depends on their earnings, the terms of their indebtedness, including the terms of any credit facilities, or indentures, and legal restrictions regarding the transfer of funds.
Our ability to service our debt and fund our planned capital expenditures and ongoing operations will depend on our ability to generate and increase cash flow, and our access to additional liquidity sources. Our ability to generate and increase cash flow is dependent on many factors, including:
| • | the transfer of funds from subsidiaries in the U.S. to certain foreign subsidiaries; |
| • | our ability to obtain raw materials at reasonable prices or to raise prices to offset, in whole or in part, the effects of higher raw material costs; |
| • | the selling price of our products; |
| • | our ability to adequately deliver customer service and competitive product quality; |
| • | the impact of competition from other chemical and materials manufacturers and diversified companies; |
| • | general world business conditions, economic uncertainty or downturn and the significant downturn in housing construction and overall economies; |
| • | the effects of governmental regulation on our business; |
| • | tariffs, trade duties and other trade barriers; and |
| • | political and social instability. |
Many of these factors are beyond our control. A general economic downturn can result in reduced spending by customers, which will impact our revenues and cash flows from operating activities. At reduced performance, if we are unable to generate sufficient cash flow or access additional liquidity sources, we may not be able to service and repay our existing debt, operate our business, respond to competitive challenges, or fund our other liquidity and capital needs.
Our industry and the end-use markets in which we compete are highly competitive. This competition may adversely affect our results of operations and operating cash flows.
Each of our markets is highly competitive. Competition in the TiO2 segment industry is based on a number of factors such as price, product quality, and service. We face significant competition from major international
17
and smaller regional competitors. Our most significant competitors include major chemical and materials manufacturers and diversified companies, a number of which have substantially larger financial resources, greater personnel, and larger facilities than we do. We also compete with numerous smaller, regional producers as well as Chinese producers that have significantly expanded their sulphate TiO2 production capacity in recent years and have also commenced the commercial production of TiO2 via chloride technology.
Zircon producers generally compete on the basis of price, quality, logistics, delivery, and payment terms and consistency of supply. Although we believe we have competitive quality, long-term relationships with customers and product range, our primary competitive disadvantage relative to our major competitors is our distance from our main consumers (i.e., Asia and Europe).
Within the end-use markets in which we compete, competition between products is intense. We face substantial risk that certain events, such as new product development by competitors, changing customer needs, the commercial production of TiO2 via chloride technology, production advances for competing products, or price changes in raw materials, could cause our customers to switch to our competitors’ products. If we are unable to develop and produce or market our products to compete effectively against our competitors following such events, our results of operations and operating cash flows may suffer.
An increase in the price of energy or other raw materials, or an interruption in our energy or other raw material supply, could have a material adverse effect on our business, financial condition or results of operations.
Our mining and production processes consume significant amounts of energy and raw materials, the costs of which can be subject to worldwide, as well as, local supply and demand, as well as other factors beyond our control. In 2017, raw materials used in the production of TiO2 constituted approximately 44% of our operating expenses. Fuel and energy linked to commodities, such as diesel, heavy fuel oil and coal, and other consumables, such as chlorine, illuminating paraffin, electrodes, and anthracite, consumed in our TiO2 manufacturing and mining operations form an important part of our TiO2 operating costs. We have no control over the costs of these consumables, many of which are linked to some degree to the price of oil and coal, and the costs of many of these raw materials may fluctuate widely for a variety of reasons, including changes in availability, major capacity additions or reductions, or significant facility operating problems. These fluctuations could negatively affect our TiO2 operating margins, our profitability or planned capital expenditures. As these costs rise, our operating expenses will increase and could adversely affect our business, especially if we are unable to pass price increases in raw materials through to our customers.
The agreements and instruments governing our debt contain restrictions and limitations that could affect our ability to operate our business, as well as impact our liquidity.
As of December 31, 2017, our total principal amount of debt was approximately $3.2 billion. Our credit facilities contain covenants that could adversely affect our ability to operate our business, our liquidity, and our results of operations. These covenants restrict, among other things, our and our subsidiaries’ ability to:
| • | incur or guarantee additional indebtedness; |
| • | complete asset sales, acquisitions or mergers; |
| • | make investments and capital expenditures; |
| • | prepay other indebtedness; |
| • | enter into transactions with affiliates; and |
| • | fund additional dividends or repurchase shares. |
Certain of our facilities, including our $550 million Wells Fargo Revolver and, together with the $2.15 billion New Term Loan Facility, $584 million aggregate principal amount of our Senior Notes due 2022 and our $450 million aggregate principal amount of our Senior Notes due 2025, all defined below, include requirements relating to the ratio of adjusted EBITDA to indebtedness or certain fixed charges. The breach of any covenants or obligations in our credit facilities, not otherwise waived or amended, could result in a default under the applicable debt obligations (and cross-defaults to certain other debt obligations) and could trigger acceleration of those obligations, which in turn could trigger other cross defaults under other future agreements
18
governing our long-term indebtedness. In addition, the secured lenders under the credit facilities could foreclose on their collateral, which includes equity interests in our subsidiaries, and exercise other rights of secured creditors. Any default under those credit facilities could adversely affect our growth, our financial condition, our results of operations and our ability to make payments on our credit facilities, and could force us to seek the protection of bankruptcy laws.
A large portion of our shares is owned by a single shareholder, Exxaro.
At December 31, 2017, Exxaro held approximately 24% of the voting securities of Tronox Limited, and had two representatives serving as Directors on our nine-member board. On March 8, 2017, Exxaro announced its intention to begin pursuing a path to monetize its ownership stake in Tronox over time. On October 10, 2017, Exxaro sold 22,425,000 Class A ordinary shares in an underwritten registered offering (the “Exxaro Share Transaction”) reducing its ownership percentage of voting securities from 44% at December 31, 2016. Further sales by Exxaro will result in additional Class B Shares converting to Class A Shares and an increase in the number of Class A Shares outstanding could cause the market price of shares to decline.
Due to Exxaro’s significant ownership interest, it is entitled to certain rights under the Constitution and the Shareholder’s Deed of Tronox Limited. For example, the Constitution provides that, for as long as the Class B voting interest is at least 10% of the total voting interest in Tronox Limited, there must be nine directors on our board; of which the holders of Class A Shares will be entitled to vote separately to elect a certain number of directors to our board (which we refer to as Class A Directors), and the holders of Class B Shares will be entitled to vote separately to elect a certain number of directors to our board (which we refer to as Class B Directors). If the Class B voting interest is greater than or equal to 20% but less than 30%, our board of directors will consist of seven Class A Directors and two Class B Directors. If the Class B voting interest is greater than or equal to 10% but less than 20%, our board will consist of eight Class A Directors and one Class B Director.
The Constitution also provides that, subject to certain limitations, for as long as the Class B voting interest is at least 20%, a separate vote by holders of Class A Shares and Class B Shares is required to approve certain types of merger or similar transactions that will result in a change in control or a sale of all or substantially all of our assets or any reorganization or transaction that does not treat Class A and Class B Shares equally.
Under the terms of the Shareholder’s Deed entered into upon completion of the Exxaro Transaction, Exxaro has agreed not to acquire any voting shares of Tronox Limited if, following such acquisition, Exxaro will have a voting interest in Tronox Limited of 50% or more unless Exxaro brings any proposal to make such an acquisition to the board of directors of Tronox Limited on a confidential basis. In the event an agreement regarding the proposal is not reached, Exxaro is permitted to make a takeover offer for all the shares of Tronox Limited not held by affiliates of Exxaro provided that binding acceptances are received from a majority of the shares not held by affiliates of Exxaro. Additionally, Exxaro is not contractually obligated to maintain its 26% share ownership in our South African subsidiaries. Although Exxaro is required to comply with applicable law and our constituent documents (including our Shareholders’ Agreement which sets forth the requirements by which Exxaro is obligated to continue to empower our two South African subsidiaries under BEE legislation), there is no assurance that Exxaro will not reduce its 26% stake in the future through a sale, disposition or other permissible transfer. Moreover, in the future, Exxaro may exchange its 26% interest in the mineral sands business for additional Class B Shares.
As a result of Exxaro’s significant ownership interest and its governance rights, Exxaro may be able to exert substantial influence over our management, operations and potential significant corporate transactions, including a change in control or the sale of all or substantially all of our assets. Exxaro’s influence may have an adverse effect on the trading price of our ordinary shares. See also Risk Factor “Risks of Cristal Transaction” for additional considerations related to ownership by Cristal of a significant minority interest in the Company upon closing of the Cristal Transaction.
Our South African operations may lose the benefit of the BEE status under South African legislation, resulting in the need to implement a remedial solution or introduce a new minority shareholder, which could negatively impact our South African operations.
BEE legislation was introduced into South Africa as a means to seek to redress the inequalities of the previous Apartheid system by requiring the inclusion of historically disadvantaged South Africans in the mainstream economy. Under BEE legislation, South African businesses are required to become “empowered”.
19
South African mining companies are required to comply with a “sector charter” in order to be deemed “empowered”. The South African Mining Charter specifies certain requirements that all mining companies must satisfy, including a requirement that at least 26% of the shares in such companies are held by BEE “empowered” entities. Exxaro takes the position that it is a BEE “empowered” company under the so-called “once empowered always empowered” principle that emerges from the joint reading of the original Mining Charter (promulgated in 2004) and the amendment thereto promulgated in 2010.
Exxaro retains a 26% direct ownership interest in each of Tronox KZN Sands (Pty) Ltd and Tronox Mineral Sands (Pty) Ltd in order for these two entities to comply with the requirements of the Mineral and Petroleum Resources Development Act (“MPRDA”) and the South African Mining Charter ownership requirements.
Pursuant to our Shareholders’ Agreement with Exxaro, Exxaro has agreed to maintain its direct ownership for a period of the shorter of the date on which the requirement to maintain a direct ownership stake in each of Tronox KZN Sands (Pty) Ltd and Tronox Mineral Sands (Pty) Ltd no longer applies or June 2022 (unless it transfers the direct ownership interests to another qualified buyer under the MPRDA and the Mining Charter). If either Tronox KZN Sands (Pty) Ltd or Tronox Mineral Sands (Pty) Ltd ceases to qualify under the Mining Charter, Tronox Limited and Exxaro have agreed to jointly seek a remedial solution. If Tronox Limited and Exxaro cannot successfully implement a solution and the reason for this failure is due to anything other than a change in law, then we may dispose of Exxaro’s shares in the non-qualifying company to another BEE compliant, qualifying purchaser. During any period of any non-qualification, our South African operations may be in violation of their mining or prospecting rights, as well as the requirements of the MPRDA and the South African Mining Charter, which could result in a suspension or revocation of the non-qualifying company’s mining and prospecting rights (after providing the non-compliant company with an opportunity to remedy the defect complained of) and could expose us to operating restrictions, lost business opportunities and delays in receiving further regulatory approvals for our South African operations and expansion activities. In addition, if Exxaro’s direct ownership in Tronox KZN Sands (Pty) Ltd and Tronox Mineral Sands (Pty) Ltd is sold to another purchaser, we could be required to share control of our South African operations with a minority shareholder, which may impact our operational and financial flexibility and could impact profitability, expansion opportunities and our results of operations.
There are two concurrent legal challenges in South Africa that could be material to us. First, the question of whether the “once empowered always empowered” principle applies in the mining industry in South Africa is subject to current litigation between the South Africa Chamber of Mines (an industry body that represents approximately 90% of the South African Mining Industry) and the South African Department of Mineral Resources. The “once empowered always empowered” principle asserts that a South African company that has had the requisite shareholding base consisting of historically disadvantaged South Africans for a minimum period of ten years will always qualify as an “empowered” entity. In the mining sector, the requisite shareholding base is 26%. An adverse outcome in connection with such litigation could adversely affect our business, financial condition and results of operations.
Second, on June 15, 2017, the Department of Mineral Resources issued a substantially revised South African Mining Charter. The revised charter sets forth new requirements with regard to continuing ownership of mining rights by BEE entities, the form and percentage of that ownership by BEE entities, procurement from BEE compliant entities, race and gender ownership and employment quotas, and workers’ housing and living conditions. The new charter was immediately challenged by the Chamber of Mines. As a result of such legal challenge, the application of the new charter has been consensually suspended pending the conclusion of the legal process. We are uncertain as to whether the new charter will be ultimately implemented in its current form, but a new mining charter with stricter requirements similar to those described above could adversely affect our business, financial condition or results of operations.
Our ore resources and reserve estimates are based on a number of assumptions, including mining and recovery factors, future cash costs of production and ore demand and pricing. As a result, ore resources and reserve quantities actually produced may differ from current estimates.
The mineral resource and reserve estimates are estimates of the quantity and ore grades in our mines based on the interpretation of geological data obtained from drill holes and other sampling techniques, as well as from feasibility studies. The accuracy of these estimates is dependent on the assumptions and judgments made in interpreting the geological data. The assessment of geographical characteristics, such as location, quantity, quality, continuity of geology and grade, is made with varying degrees of confidence in accordance with
20
established guidelines and standards. We use various exploration techniques, including geophysical surveys and sampling through drilling and trenching, to investigate resources and implement applicable quality assurance and quality control criteria to ensure that data is representative. Our mineral reserves represent the amount of ore that we believe can be economically mined and processed, and are estimated based on a number of factors, which have been stated in accordance with SEC Industry Guide 7 (“Industry Guide 7”), the South African Code for Reporting of Exploration Results, Mineral Resources and Mineral Reserves 2007 version, as amended 2009 (SAMREC) and the Australian code for Reporting of Exploration Results, Mineral Resources the Joint Ore Reserves Committee Code (2012) (JORC).
There is significant uncertainty in any mineral reserve or mineral resource estimate. Factors that are beyond our control, such as the ability to secure mineral rights, the sufficiency of mineralization to support mining and beneficiation practices and the suitability of the market may significantly impact mineral resource and reserve estimates. The actual deposits encountered and the economic viability of mining a deposit may differ materially from our estimates. Since these mineral resources and reserves are estimates based on assumptions related to factors discussed above, we may revise these estimates in the future as we become aware of new developments. To maintain TiO2 feedstock production beyond the expected lives of our existing mines or to increase production materially above projected levels, we will need to access additional reserves through exploration or discovery.
If we are unable to innovate and successfully introduce new products, or new technologies or processes reduce the demand for our products or the price at which we can sell products, our profitability could be adversely affected.
Our industries and the end-use markets into which we sell our products experience periodic technological change and product improvement. Our future growth will depend on our ability to gauge the direction of commercial and technological progress in key end-use markets and on our ability to fund and successfully develop, manufacture and market products in such changing end-use markets. We must continue to identify, develop and market innovative products or enhance existing products on a timely basis to maintain our profit margins and our competitive position. We may be unable to develop new products or technology, either alone or with third parties, or license intellectual property rights from third parties on a commercially competitive basis. If we fail to keep pace with the evolving technological innovations in our end-use markets on a competitive basis, our financial condition and results of operations could be adversely affected.
In addition, new technologies or processes have the potential to replace or provide lower-cost alternatives to our products, such as new processes that reduce TiO2 in consumer products or the use of chloride slag in the production of TiO2, which could result in TiO2 producers using less chloride slag, or to reduce the need for TiO2 in consumer products, which could depress the demand and pricing for TiO2. We cannot predict whether technological innovations will, in the future, result in a lower demand for our products or affect the competitiveness of our business. We may be required to invest significant resources to adapt to changing technologies, markets and competitive environments.
We are subject to many environmental, health and safety regulations that may result in unanticipated costs or liabilities, which could reduce our profitability.
Our operations and production facilities are subject to extensive environmental and health and safety laws and regulations at national, international and local levels in numerous jurisdictions relating to use of natural resources, pollution, protection of the environment, mine site remediation, transporting and storing raw materials and finished products, and storing and disposing of hazardous wastes among other materials. Such laws include, in the U.S., the Clean Air Act and the Clean Water Act, protecting of air and water resources, the Toxic Substances Control Act (TSCA), and in the EU, the Registration, Evaluation, Authorization and Restrictions of Chemicals (“REACH”), REACH regulation, requiring registration of chemicals in commerce and reporting of potential known adverse effects, and numerous other local, state and federal laws and regulations governing materials transport and packaging. Analogous regimes exist in other parts of the world, including Australia and China and there are rules to conform chemical labeling in accordance with the globally harmonized system. Additional new laws and regulations may be enacted or adopted by various regulatory agencies globally. For example, TSCA reform was enacted in June 2016, and the U.S. EPA is in the process of developing new chemical control regulations.
The costs of compliance with the extensive environmental, health and safety laws and regulations or the inability to obtain, update or renew permits required for operation or expansion of our business could reduce our
21
profitability or otherwise adversely affect our business. If we fail to comply with the conditions of our permits governing the production and management of regulated materials, mineral sands mining licenses or leases or the provisions of the applicable U.S., South African or Australian law, these permits, mining licenses or leases and mining rights could be canceled or suspended, and we could be prevented from obtaining new mining and prospecting rights, which could materially and adversely affect our business, operating results and financial condition. Additionally, we could incur substantial costs, including fines, damages, criminal or civil sanctions and remediation costs, or experience interruptions in our operations, for violations arising under these laws and regulations. In the event of a catastrophic incident involving any of the raw materials we use, or chemicals or mineral products we produce, we could incur material costs as a result of addressing the consequences of such event.
Changes to existing laws governing operations, especially changes in laws relating to transportation of mineral resources, the treatment of land and infrastructure, contaminated land, the remediation of mines, tax royalties, exchange control restrictions, environmental remediation, mineral rights, ownership of mining assets, or the rights to prospect and mine may have a material adverse effect on our future business operations and financial performance. There is risk that onerous conditions may be attached to authorizations in the form of mining rights, water-use licenses, miscellaneous licenses and environmental approvals, or that the grant of these approvals may be delayed or not granted.
Our current operations involve the production and management of regulated materials that are subject to various environmental laws and regulations and are dependent on obtaining and the periodic renewal of permits from various governmental agencies. The inability to obtain, update or renew permits related to the operation of our businesses, or the costs required in order to comply with permit standards, could have a material adverse effect on us.
Moreover, certain environmental laws impose joint and several and/or strict liability for costs to clean up and restore sites where pollutants have been disposed or otherwise spilled or released. We are currently addressing certain areas of known contamination on our own properties, none of which we presently anticipate will result in any material costs or adverse impacts on our business or operations. However, we cannot be certain that we will not incur significant costs and liabilities for remediation or damage to property, natural resources or persons as a result of spills or releases from our operations or those of a third party.
The classification of TiO2 as a Category 2 Carcinogen in the European Union could result in more stringent regulatory control with respect to TiO2.
In May 2016, France’s competent authority under the EU’s REACH regulation submitted a proposal to the European Chemicals Agency (“ECHA”) that would classify TiO2 as carcinogenic in humans by inhalation. The Company together with other companies and trade associations representing the TiO2 industry and industries consuming our products, submitted comments opposing the classification, based on evidence from epidemiological and other scientific studies. On October 12, 2017, ECHA’s Committee for Risk Assessment (“RAC”) released a written opinion dated September 14, 2017 stating that based on the scientific evidence it reviewed, there is sufficient grounds to classify TiO2 under the EU’s Classification, Labelling and Packaging Regulation (“CLP”) as a Category 2 Carcinogen, but only with a hazard statement describing the risk by inhalation. The European Commission will review the RAC’s formal recommendation to determine what regulatory measures, if any, should be taken. If the European Commission decides to adopt this classification, it could require that products manufactured with TiO2 be classified as containing carcinogenic materials, which could impact our business by inhibiting the marketing of products containing TiO2 to consumers, and subject our manufacturing operations to new regulations that could increase costs. Any classification, use restriction or authorized requirement for use imposed by the ECHA could have additional effects under other EU laws (e.g., those affecting medical and pharmaceutical applications, cosmetics, food packaging and food additives) and/or trigger heightened regulatory scrutiny in countries and local jurisdictions outside the EU based on health and safety grounds. It is also possible that heightened regulatory scrutiny would lead to claims by consumers or those involved in the production of such products alleging adverse health impacts.
22
Our dependence on burning natural gas to generate electrical energy and steam and our manufacturing practices that release CO2 to the atmosphere could mean that governmental initiatives to limit the emission of GHG could have an adverse effect in the future on our costs and therefore our results of operations.
Our U.S.-based operations are also subject to EPA’s regulations regarding GHG emissions and, depending upon the nature and scope of any future regulations, could become subject to additional costs or limitations. Current requirements include an obligation to monitor and report the GHG emissions from our facilities and to comply with the Clean Air Act’s Prevention of Significant Deterioration requirements in connection with any new or modified major sources of GHG emissions. Although we believe our operations are currently in compliance with these obligations, EPA has continued to pursue additional GHG regulations, including the currently proposed Clean Power Plan for existing sources of GHGs in the power generating sector. In addition, several states have taken legal measures to reduce emissions of GHGs, including through the planned development of GHG emission inventories and/or regional GHG “cap and trade” programs. Although our facilities are not currently subject to any such program, the expansion or further adoption of such programs in jurisdictions where we operate could impose additional compliance obligations on our facilities. As a result, such programs could result in an increase in fuel or energy costs for our businesses or, if we are directly regulated, an additional cost to acquire necessary allowances. Future costs of compliance with either the existing or future federal or State regulations could materially and adversely affect our business, operating results and financial condition.
We may be subject to litigation, the disposition of which could have a material adverse effect on our results of operations.
The nature of our operations exposes us to possible litigation claims, including disputes with competitors, customers, equipment vendors, environmental groups and other non-governmental organizations or NGOs, and providers of shipping services. Some of the lawsuits may seek fines or penalties and damages in large amounts, or seek to restrict our business activities. Because of the uncertain nature of litigation and coverage decisions, we cannot predict the outcome of these matters or whether insurance claims may mitigate any damages to us. Litigation is very costly, and the costs associated with prosecuting and defending litigation matters could have a material adverse effect on our results of operations and financial condition.
Expansion or improvement of our existing facilities may not result in revenue increases and will be subject to regulatory, environmental, political, legal and economic risks, which could adversely affect our results of operations and financial condition.
One of the ways we may grow our business is through the expansion or improvement of our existing facilities. The construction of additions or modifications to our existing facilities involve numerous regulatory, environmental, political, legal and economic uncertainties that are beyond our control. Such expansion or improvement projects may also require the expenditure of significant amounts of capital, and financing may not be available on economically acceptable terms or at all. If we undertake these projects, they may not be completed on schedule, at the budgeted cost, or at all. Moreover, our revenue may not increase immediately upon the expenditure of funds on a particular project. As a result, we may not be able to realize our expected investment return, which could adversely affect our results of operations and financial condition.
We compete with other mining and chemical businesses for key human resources in the countries in which we operate, and our business will suffer if we are unable to hire highly skilled employees or if our key officers or employees discontinue employment with us.
We compete with other chemical and mining companies, and other companies generally, in the countries in which we operate to attract and retain key human resources at all levels with the appropriate technical skills and operating and managerial experience necessary to continue operating and expanding our businesses. These operations use modern techniques and equipment and accordingly require various types of skilled workers. The success of our business will be materially dependent upon the skills, experience and efforts of our key officers and skilled employees. Competition for skilled employees is particularly severe in Western Australia and at Namakwa Sands, which may cost us in terms of higher labor costs or reduced productivity. As a result, we may not be able to attract and retain skilled and experienced employees. Should we lose any of our key personnel or fail to attract and retain key qualified personnel or other skilled employees, our business may be harmed and our operational results and financial condition could be affected.
23
There may be difficulty in effecting service of legal process and enforcing judgments against us and our directors and management.
We are registered under the laws of Western Australia, Australia, and substantial portions of our assets are located outside of the U.S. In addition, certain members of our board of directors reside outside the U.S. As a result, it may be difficult for investors to effect service of process within the U.S. upon Tronox Limited or such other persons residing outside the U.S., or to enforce judgments outside the U.S. obtained against such persons in U.S. courts in any action, including actions predicated upon the civil liability provisions of the U.S. federal securities laws. In addition, it may be difficult for investors to enforce rights predicated upon the U.S. federal securities laws in original actions brought in courts in jurisdictions located outside the United States.
Third parties may develop new intellectual property rights for processes and/or products that we would want to use, but would be unable to do so; or, third parties may claim that the products we make or the processes that we use infringe their intellectual property rights, which may cause us to pay unexpected litigation costs or damages or prevent us from making, using or selling products we make or require alteration of the processes we use.
Results of our operations may also be negatively impacted if a competitor develops or has the right to use intellectual property rights for new processes or products and we cannot obtain similar rights on favorable terms or are unable to independently develop non-infringing competitive alternatives.
Although there are currently no known pending or threatened proceedings or claims that are material relating to alleged infringement, misappropriation or violation of the intellectual property rights of others, we may be subject to legal proceedings and claims in the future in which third parties allege that their patents or other intellectual property rights are infringed, misappropriated or otherwise violated by us or our products or processes. In the event that any such infringement, misappropriation or violation of the intellectual property rights of others is found, we may need to obtain licenses from those parties or substantially re-engineer our products or processes to avoid such infringement, misappropriation or violation. We might not be able to obtain the necessary licenses on acceptable terms or be able to re-engineer our products or processes successfully. Moreover, if we are found by a court of law to infringe, misappropriate or otherwise violate the intellectual property rights of others, we could be required to pay substantial damages or be enjoined from making, using or selling the infringing products or technology. We also could be enjoined from making, using or selling the allegedly infringing products or technology pending the final outcome of the suit. Any of the foregoing could adversely affect our financial condition and results of operations.
If our intellectual property were compromised or copied by competitors, or if competitors were to develop similar intellectual property independently, our results of operations could be negatively affected.
Our success depends to a significant degree upon our ability to protect and preserve our intellectual property rights. Although we own and have applied for numerous patents and trademarks throughout the world, we may have to rely on judicial enforcement of our patents and other proprietary rights. Our patents and other intellectual property rights may be challenged, invalidated, circumvented, and rendered unenforceable or otherwise compromised. A failure to protect, defend or enforce our intellectual property could have an adverse effect on our financial condition and results of operations.
We also rely upon unpatented proprietary technology, expertise and other trade secrets to maintain our competitive position. While we maintain policies to enter into confidentiality agreements with our employees and third parties to protect our proprietary expertise and other trade secrets, these agreements may not be enforceable or, even if legally enforceable, we may not have adequate remedies for breaches of such agreements. We also may not be able to readily detect breaches of such agreements. The failure of our patents or confidentiality agreements to protect our proprietary technology, expertise or trade secrets could result in significantly lower revenues, reduced profit margins or loss of market share.
In addition, we may be unable to determine when third parties are using our intellectual property rights without our authorization. We also have licensed certain of our intellectual property rights to third parties, and we cannot be certain that our licensees are using our intellectual property only as authorized by the applicable license agreement. The undetected or unremedied unauthorized use of our intellectual property rights or the legitimate development or acquisition of intellectual property related to our industry by third parties could reduce or eliminate any competitive advantage we have as a result of our intellectual property, adversely affecting our
24
financial condition and results of operations. If we must take legal action to protect, defend or enforce our intellectual property rights, any suits or proceedings could result in significant costs and diversion of our resources and our management’s attention, and we may not prevail in any such suits or proceedings. A failure to protect, defend or enforce our intellectual property rights could have an adverse effect on our financial condition and results of operations.
If our intangible assets or other long-lived assets become impaired, we may be required to record a significant noncash charge to earnings.
We have a significant amount of intangible assets and other long-lived assets on our consolidated balance sheets. Under generally accepted accounting principles in the United States (“U.S. GAAP”), we review our intangible assets and other long-lived assets for impairment when events or changes in circumstances indicate the carrying value may not be recoverable. Factors that may be considered a change in circumstances, indicating that the carrying value of our intangible assets and other long-lived assets may not be recoverable, include, but are not limited to, a significant decline in share price and market capitalization, changes in the industries in which we operate, particularly the impact of a downturn in the global economy, as well as competition or other factors leading to reduction in expected long-term sales or profitability. We may be required to record a significant noncash charge in our financial statements during the period in which any impairment of our intangible assets and other long-lived assets is determined, negatively impacting our results of operations.
Our ability to use NOLs to offset future income may be limited.
Our ability to use any net operating losses (“NOLs”) and section 163(j) interest expense carryforwards (which are now subject to Section 382 limitations per the new recently enacted U.S. major tax reform legislation) generated by it could be substantially limited if we were to experience an “ownership change” as defined under Section 382 of the Code. In general, an “ownership change” would occur if our “5-percent shareholders,” as defined under Section 382 of the Code, including certain groups of persons treated as “5-percent shareholders,” collectively increased their ownership in us by more than 50 percentage points over a rolling three-year period. The Exxaro Share Transaction and the issuance of the Class A ordinary shares to Cristal Netherlands in connection with the Cristal Transaction may result in an “ownership change” for U.S. federal and applicable state income tax purposes. Should Exxaro decide to sell a significant portion of their remaining ownership in the future, an “ownership change” will most likely occur. A corporation that experiences an ownership change will generally be subject to an annual limitation on the use of its pre-ownership change NOLs (and certain other losses and/or credits) equal to the equity value of the corporation immediately before the ownership change, multiplied by the long-term tax-exempt rate for the month in which the ownership change occurs. Although our NOLs continue to have full valuation allowances, such a limitation could, for any given year, have the effect of increasing the amount of our U.S. federal income tax liability, which would negatively impact our financial condition and the amount of after-tax cash available for distribution to holders of our ordinary shares.
We could be subject to changes in tax rates, adoption of new tax laws or additional tax liabilities.
We are subject to taxation in the United States, Australia and various other foreign jurisdictions. Our future effective tax rate could be affected by changes in statutory rates and other legislative changes, or changes in determinations regarding the jurisdictions in which we are subject to tax. From time to time, the U.S. federal, state and local and foreign governments make substantive changes to tax rules and their application, which could result in higher corporate taxes than would be incurred under existing tax law and could have an adverse effect on our results of operations or financial condition. From time to time, we are also subject to tax audits by various taxing authorities, including the Internal Revenue Service in the United States and the Australian Tax Office in Australia. Although we believe our tax positions are appropriate, the final determination of any tax audits could be materially different from our income tax provisions, accruals and reserves and any such unfavorable outcome from a tax audit could have a material adverse effect on our results of operations or financial condition.
Our results of operations and financial condition could be seriously impacted by security breaches, including cybersecurity incidents.
Failure to effectively prevent, detect and recover from security breaches, including attacks on information technology and infrastructure by hackers; viruses; breaches due to employee error or actions; or other disruptions could result in misuse of our assets, business disruptions, loss of property including trade secrets and confidential
25
business information, legal claims or proceedings, reporting errors, processing inefficiencies, negative media attention, loss of sales and interference with regulatory compliance. We have determined that such attacks could result in unauthorized parties gaining access to at least certain confidential business information. However, to date, we have not experienced any material financial impact, changes in the competitive environment or business operations that we attribute to these attacks. Although management does not believe that we have experienced any material losses to date related to security breaches, including cybersecurity incidents, there can be no assurance that we will not suffer such losses in the future. We actively manage the risks within our control that could lead to business disruptions and security breaches. As these threats continue to evolve, particularly around cybersecurity, we may be required to expend significant resources to enhance our control environment, processes, practices and other protective measures. Despite these efforts, such events could materially adversely affect our business, financial condition or results of operations.
We may need additional capital in the future and may not be able to obtain it on favorable terms.
Our businesses are capital intensive, and our success depends to a significant degree on our ability to develop and market innovative products and to update our facilities and process technology. We may require additional capital in the future to finance our growth and development, implement further marketing and sales activities, fund ongoing research and development activities and meet general working capital needs. Our capital requirements will depend on many factors, including acceptance of, and demand for our products, the extent to which we invest in new technology and research and development projects, and the status and timing of these developments, as well as general availability of capital from debt and/or equity markets. Additional financing may not be available when needed on terms favorable to us, or at all. Further, the terms of our debt may limit our ability to incur additional indebtedness or issue additional equity. If we are unable to obtain adequate funds on acceptable terms, we may be unable to develop or enhance our products, take advantage of future opportunities or respond to competitive pressures, which could harm our results of operations, financial condition and business prospects.
26
| Item 1B. | Unresolved Staff Comments |
There are no unresolved comments that were received from the SEC staff.
| Item 2. | Properties |
Below are our primary offices and facilities at December 31, 2017. We believe our properties are in good operating condition, and are well maintained. Pursuant to separate financing agreements, substantially all of our U.S. properties are pledged or encumbered to support or otherwise provide security for our indebtedness.
Corporate
Our corporate offices consisted of the following:
|
Location
|
Owned/Leased
|
Offices
|
|
Stamford, Connecticut
|
Leased
|
263 Tresser Boulevard, Suite 1100
|
|
Kwinana Beach, Western Australia
|
Owned
|
Lot 22 Mason Road, Kwinana Beach WA 6167, Australia
|
|
London, United Kingdom
|
Leased
|
25 Bury Street, 3rd Floor
|
TiO2 Segment
Mining Operations
Our KZN Sands operations consist of the Fairbreeze mine, a concentration plant, a mineral separation plant and a smelter complex with two furnaces.
Our Namakwa Sands operations include the Namakwa Sands mine, a primary concentration plant, a secondary concentration plant, a separation plant, and a smelter complex with two furnaces.
Our Western Australia operations consist of the Cooljarloo dredge mine and floating heavy mineral concentration plant and the Chandala metallurgical complex, which includes a mineral separation plant and a synthetic rutile plant.
Pigment Operations
Our owned office at 3301 NW 150th Street in Oklahoma City, Oklahoma is used for our pigment management operations and research and development.
Our pigment facilities consist of the physical assets necessary and appropriate to produce, distribute and supply our TiO2, and consist mainly of manufacturing and distribution facilities. The following table summarizes our TiO2 production facilities and production facilities and capacity (in gross MT per year), by location:
|
Facility
|
Production
|
TiO2
Capacity |
Process
|
Property
Owned/Leased |
Facility
Owned/Leased |
||||||||||
|
Hamilton, Mississippi
|
|
TiO2
|
|
|
225,000
|
|
|
Chloride
|
|
|
Owned
|
|
|
Owned
|
|
|
Kwinana, Western Australia
|
|
TiO2
|
|
|
150,000
|
|
|
Chloride
|
|
|
Owned
|
|
|
Owned
|
|
|
Botlek, the Netherlands
|
|
TiO2
|
|
|
90,000
|
|
|
Chloride
|
|
|
Leased
|
|
|
Owned
|
|
Electrolytic Operations
We have an electrolytic manufacturing and distribution facility as follows:
|
Facility
|
Product
|
Property
Owned/Leased |
Facility
Owned/Leased |
||||
|
Henderson, Nevada
|
EMD, Boron products
|
|
Leased
|
|
|
Owned
|
|
27
Mineral Properties
As of December 31, 2017, we owned mining rights to ore reserves described herein at our three mineral sands operations in South Africa and Western Australia, where we mine heavy mineral sands to supply titanium mineral feedstock to our TiO2 manufacturing business and co- products for external sale.
Each mining operation maintains a Life-of-Mine Plan (“LOMP”), which is a strategic business plan for short and long-term mine planning and decision-making. A LOMP is based, in part, on estimated mineral reserves and can serve as a road map for mine development and planning, resource development, production targets, marketing, and financial management.
Reporting of Ore Reserve and Mineral Resources
U.S. registrants are required to report ore reserves under Industry Guide 7, “Description of Property by Issuers Engaged or To Be Engaged in Significant Mining Operations”. Industry Guide 7 requires that sufficient technical and economic studies have been completed to reasonably assure economic extraction of the declared reserves, based on the parameters and assumptions current to the end of the reporting period.
The mineral reserve estimates are based on detailed geological, geotechnical, mine engineering and mineral processing inputs, into financial models developed and reviewed by Tronox employees and management in South Africa, Australia and the U.S., including senior personnel who have been involved with each of our active mining and mineral processing operations since the operations commenced.
Our heavy minerals reserves estimates have evolved from years of in-house reserve estimates, reconciliations and revised economic analyses and are routinely reviewed by third party consultants to comply with Industry Guide 7. Mineral reserve estimates are developed using conventional methods used in the mining industry, guided by the mineral resource reporting standards of the South African Code for the Reporting of Exploration Results, Mineral Resources and Mineral Reserves, also known as the SAMREC code (“SAMREC”), or the Australasian Code for Reporting of Exploration Results, Mineral Resources and Ore Reserves, also known as the JORC code (“JORC”). Definitions and determination of Proven and Probable Reserve estimates under Industry Guide 7 are equivalent in all material respects to the ore reserve classifications under SAMREC and JORC, both internationally recognized guidelines for disclosures of mineral resources and reserves designed to ensure transparency, data validity and standardized methodologies for estimating the size and grades of mineral deposits. Both SAMREC and JORC require technical resource reports, written or supervised by a professional certified as a Competent Person by one or more of the organizations responsible for development and maintenance of their respective reporting standards. Annual Mineral Resource and Ore Reserve Statements are prepared by experienced Tronox resource professionals for each of our three heavy mineral sand operating units, and reviewed by qualified experts who are certified by the professional organizations sanctioned under their respective country codes for disclosures of mineral resources and reserves.
Our heavy mineral reserve estimates under SAMREC and JORC follow similar prescribed methodologies to classify portions of a mineral deposit as measured, indicated or inferred resources according to the level of geological confidence. Portions of those categories determined to be economic by more rigorous modeling at the time of the evaluation may be upgraded to “proved” or “probable” ore reserves.
Despite differences between Industry Guide 7 and SAMREC or JORC the methodologies for determination of mineral reserves, or “ore reserves,” and definitions of reserve classifications are essentially equivalent. The Proven and Probable heavy mineral (“HM”) reserves stated in the tables in this report are unmodified from the Proved and Probable HM reserves declared in the Mineral Resources and Reserves Statements submitted by our South African and Australian operations. Under Industry Guide 7, SAMREC and JORC, Proven (or “Proved”) reserves have a higher confidence level than Probable reserves.
Mining and Mineral Tenure
Industry Guide 7 requires us to describe our rights to access and mine the minerals we report as ore reserves and to disclose any change in mineral tenure of material significance. Our heavy mineral exploration and mining activities in South Africa and Australia are regulated by the South African Department of Mineral Resources and the Western Australia Department of Mines, Industry Regulation and Safety, respectively. All of our exploration and mining operations are subject to multiple levels of environmental regulatory review, that include approvals of environmental programs and public comment periods as pre-conditions to granting of
28
mineral tenure. The rights and regulatory framework for minerals of relevance to Tronox are generally described below, followed by additional details of our three major mineral extraction and processing operations.
Mineral Tenure - South Africa
The South African Department of Mineral Resources (“DMR”) is the regulatory administrator of mineral rights in South Africa, subject to the provisions of the Mineral and Petroleum Resources Development Act (“MPRDA”), of 2004, amended 2009. The MPRDA vests all mineral rights in South Africa in the national government and establishes conditions for the acquisition and maintenance of prospecting and mining rights. Prospecting rights are initially granted for a maximum period of five years and can be renewed once for an extension of up to three years. Mining rights are granted by the DMR, subject to approvals by the Department of Environmental Affairs (“DEA”) of an Environmental Management Program (“EMP”) and an Integrated Water and Waste Use License.
Mining rights are valid for up to 30 years and may be extended by 30-year renewals. They may be revoked if the conditions of the EMP are breached or for other contraventions of the MPRDA. Environmental permitting and compliance are co-administered by the Western Cape DEA and Development Planning (Namakwa Sands) and the KZN DEA (KZN Sands). All rights, licenses and permits for Namakwa Sands and KZN Sands are in good standing.
Through Tronox Mineral Sands (Pty) Ltd, Namakwa Sands holds mining and prospecting rights, mostly at the active mining site near Brand-se-Baai.
Tronox also controls mining and prospecting rights in KwaZulu-Natal Province, on South Africa’s Indian Ocean coast, through our majority ownership of KZN Sands. Much of the surface access rights at the Fairbreeze mine are secured through an agreement with Mondi Ltd.
Mineral Tenure - Australia
Mining tenements in Western Australia include Prospecting Licenses, Exploration Licenses, Retention Licenses, Mining Leases, and other instruments set forth by the Western Australia Mining Act of 1978. Mining activities are governed by various laws and regulations administered by State and National agencies, particularly the Western Australia Department of Mines, Industry Regulation and Safety (DMIRS) and the Western Australia Department of Water and Environmental Regulation.
In Western Australia, Tronox controls mining leases, exploration and other licenses and rights. Mining and Public Environmental Review plans are approved for the Cooljarloo mine and the planned Dongara mine. Environmental Protection Agency approval of Cooljarloo West is anticipated during 2018.
Mining of the main Cooljarloo deposits are authorized by the Mineral Sands (Cooljarloo) Mining and Processing Agreement Act 1988 (WA), under Mineral Sands Agreement 268 (MSA 268), covering 9,745 hectares (24,080 acres). The remainder of our heavy mineral ore reserves are held by mining leases granted by the DMIRS. We hold 15 mining and attendant environmental approvals at the Dongara project. Three older mining leases are held at our Jurien property, the site of a former heavy mineral open pit mine operated by WMC in the 1970’s.
Mineral Sands - South Africa and Western Australia
HM sands are naturally concentrated granular minerals of high densities (conventionally above about 2.9 gm/cm3), formed by erosion, transport and concentration. Not all of the HM has commercial value, and a distinction is made between the Total Heavy Minerals (“THM”) and the portion of the THM composed of Valuable Heavy Minerals (“VHM”). VHM can be recovered at relatively low cost by gravity, magnetic and electrostatic separation techniques. In our disclosures, we express grade in terms of percentage of THM by weight in the ore, and express individual VHM as percentages of the total heavy minerals unless otherwise stated.
29
Our TiO2 business explores, acquires, mines and processes HMs to produce, commercial grades of VHM co-products, and upgrades the titanium mineral, ilmenite, into high-grade feedstock for our TiO2 manufacturing facilities. A diagram of our heavy mineral sand mining and processing — TiO2 pigment value chain is as follows:
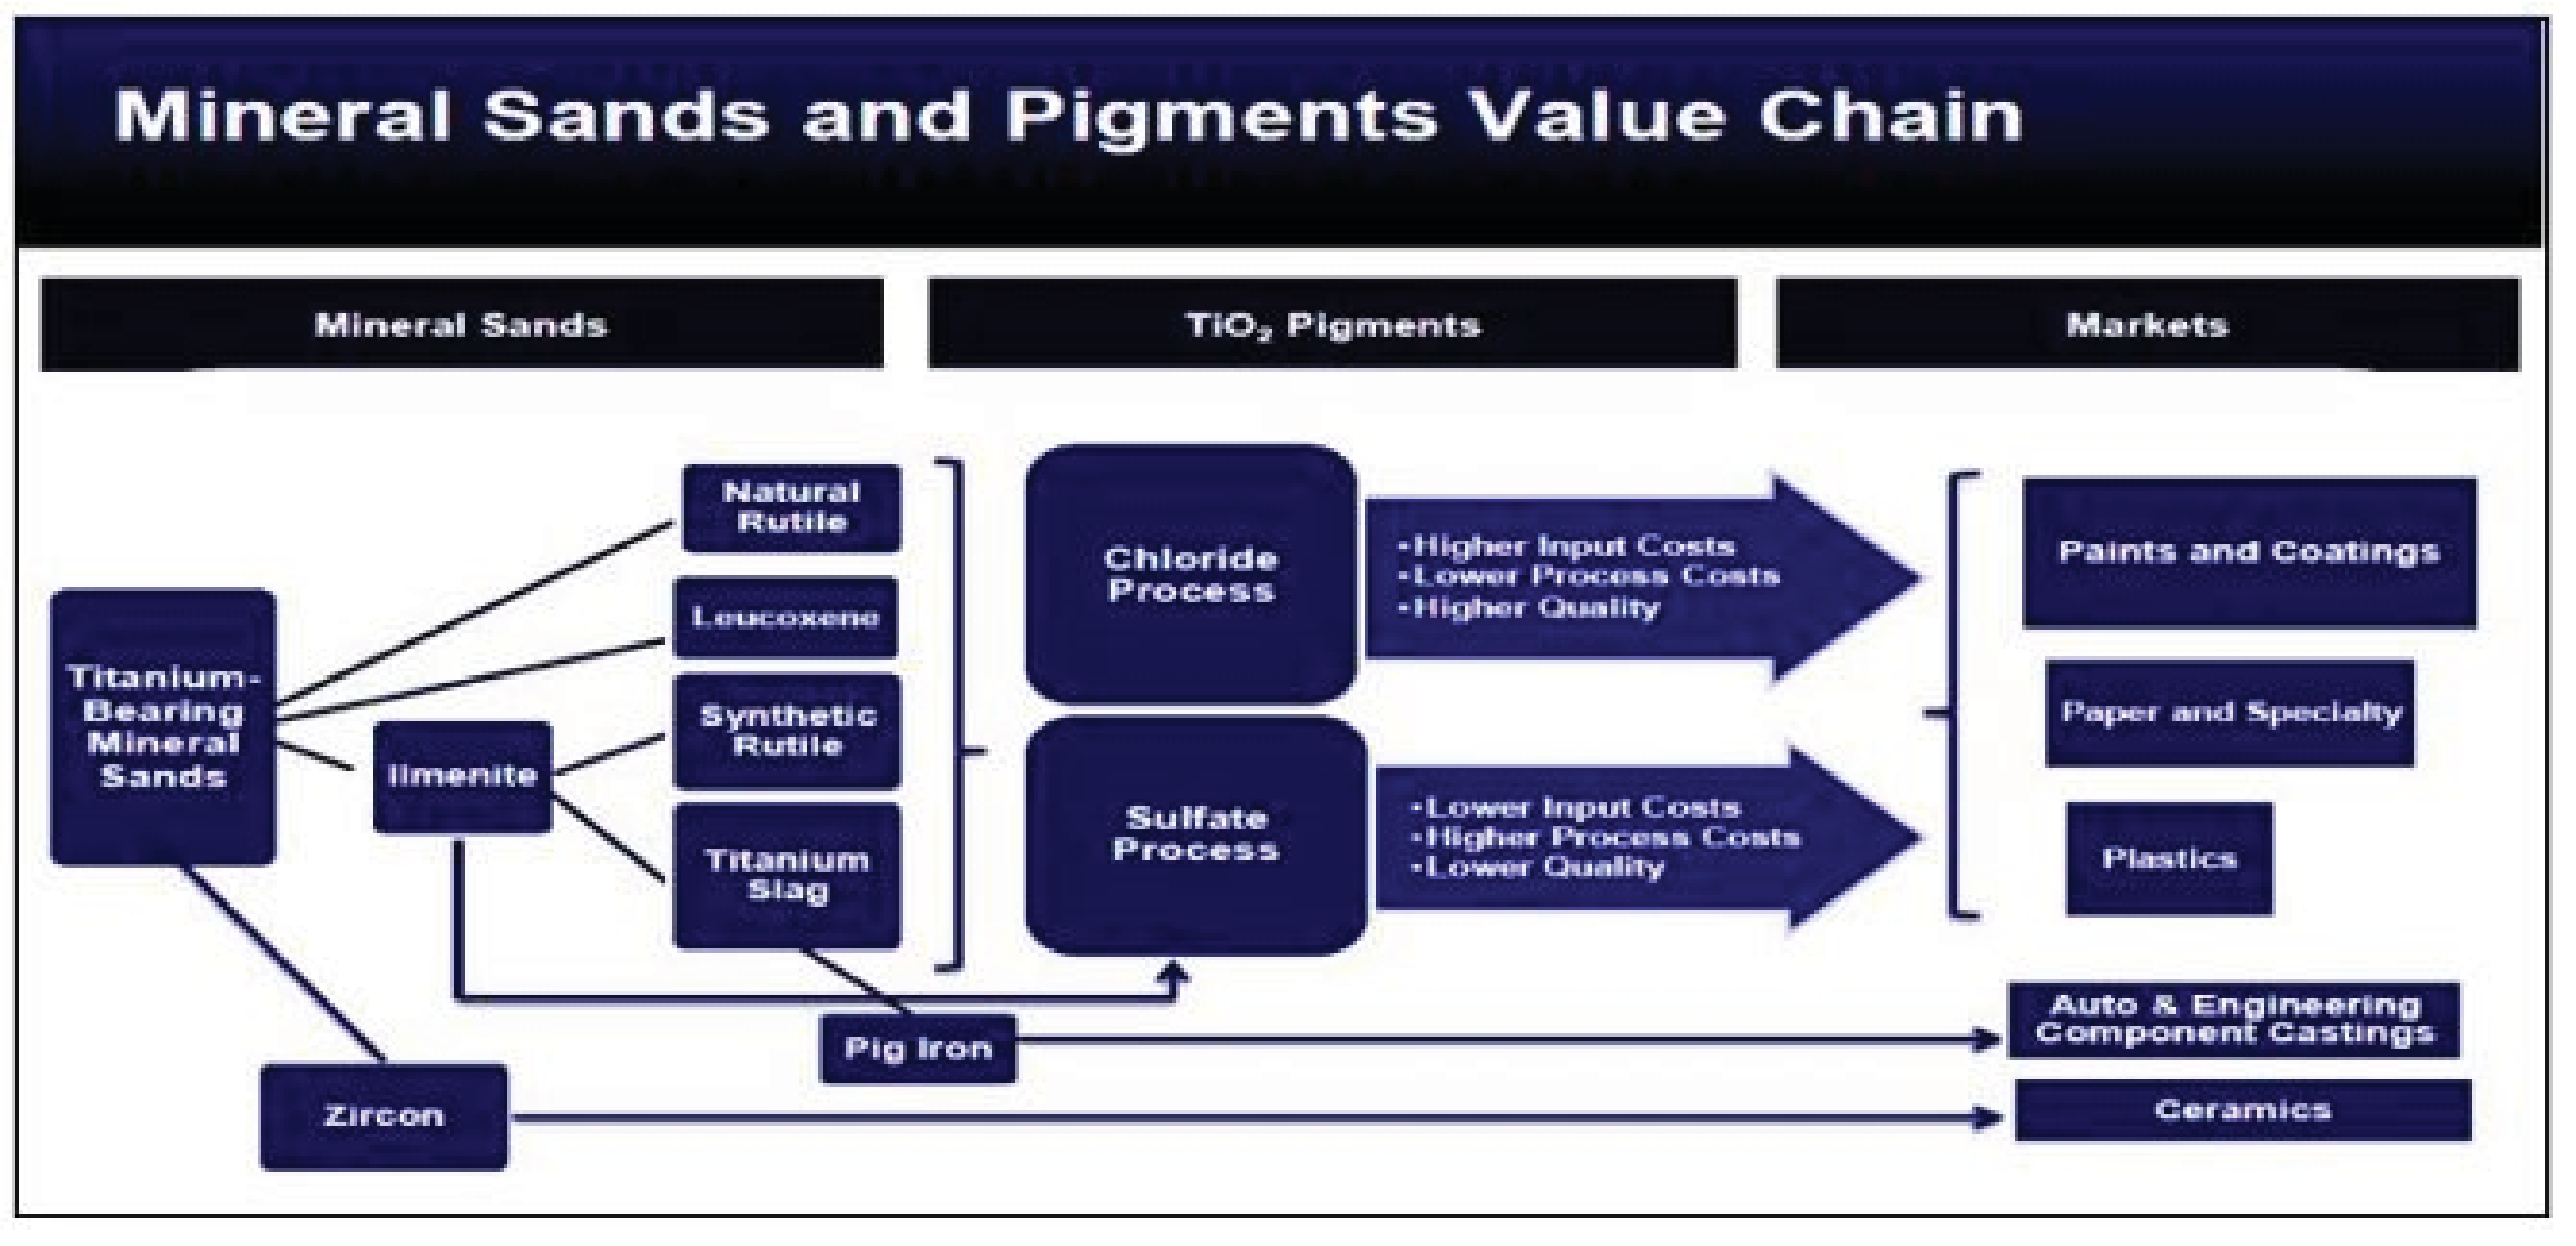
All of our HM mining operations extract ilmenite, a titanium-iron oxide mineral, rutile, a premium TiO2 mineral feedstock and zircon, a zirconium silicate (ZrSiO4) mineral valuable for its application in a diverse range of industrial and construction end-uses. Leucoxene is a naturally upgraded form of ilmenite. Other heavy minerals present in our heavy mineral assemblages may have commercial value, subject to their recovery from heavy mineral concentrate (“HMC”) feed to our mineral separation plants. We recover and market staurolite, an aluminum silicate mineral used in sandblasting and other applications, at our Chandala mineral separation plant from the HMC feed from our Cooljarloo mine HMC. Other mineral constituents of potential value include garnet and monazite. Our reserve estimates are based solely upon the value of extractable and recoverable zircon, rutile, ilmenite and leucoxene.
In 2017, we mined VHM, including ilmenite, rutile, leucoxene, and zircon at three integrated operations: Namakwa Sands, Western Cape, South Africa, KZN and Tronox Northern Operations in, Western Australia. Our three TiO2 feedstock operating centers integrate ilmenite with metallurgical beneficiation. Ilmenite is converted to synthetic rutile (SR) in our Northern Operations in Western Australia, to provide SR feedstock to our Southern Operations TiO2 pigment manufacturing. Ilmenite is converted to titanium slag and pig iron in our integrated Namakwa and KZN smelter facilities in South Africa.
TRONOX MINERAL SAND PRODUCT CAPACITIES
|
Capacity (metric tons per year)
|
Namakwa
Sands |
KZN
Sands |
Western
Australia |
Total
|
|
Rutile(1)
|
31,000
|
25,000
|
35,000
|
91,000
|
|
Synthetic rutile
|
—
|
—
|
220,000
|
220,000
|
|
Titanium slag
|
190,000
|
220,000
|
—
|
410,000
|
|
Zircon(2)
|
125,000
|
55,000
|
40,000
|
220,000
|
|
Pig iron
|
100,000
|
121,000
|
—
|
221,000
|
|
Reserve life
|
25+ Years
|
12+ Years
|
20+ Years
|
|
|
Exploration rights & undeveloped reserves
|
Yes
|
Yes
|
Yes
|
|
| (1) | Rutile includes natural rutile and leucoxene. |
| (2) | Includes all commercial grades of zircon |
30
Namakwa Sands, Western Cape and KZN, South Africa
Our heavy mineral sand operations in South Africa include similar material flows from integrated mine-mineral separation-smelter value chains on the west and east coasts of South Africa. Both Namakwa and KZN Sands produce smelter products of titanium slag and pig iron, plus commercial grades of zircon and high-grade titanium mineral concentrates. In the Western Cape Province, we mine the large Namakwa heavy mineral deposit at Brand-se-Baai from two open-cut shovel-and-truck dry mines, each with a dedicated primary wet concentration plant. Primary concentrate is separated into magnetic and non-magnetic fractions at a secondary concentration plant at the mine, and the secondary concentrates are further processed at a mineral separation plant (“dry mill”) 52 km south of the mine at Koekenaap. Ilmenite, rutile and zircon are transported by rail to Saldanha Bay, where ilmenite is smelted in a two-furnace complex into titanium slag and pig iron. Chloride-grade slag, slag fines, pig iron, rutile and zircon are exported from our proprietary facilities at the Saldanha Bay deep-water port, about 150 km north of Cape Town.
Reserve estimates as of December 31, 2017, in accordance with SAMREC (2009) reporting standards, are: 43.8 million tonnes in-place HM, containing about 19.6 million metric tonnes ilmenite, 4.5 million tonnes zircon, and 4.0 million tonnes rutile and leucoxene from 687 million tonnes of ore. These reserves are sufficient to sustain the current rate of mining for over 25 years without any new reserve additions.
The Namakwa heavy mineral assemblage is diverse and heterogeneous, creating challenges to efficient recovery of valuable heavy minerals. Significant amounts of low-value heavy minerals in the Namakwa HM assemblage include: garnet, pyroxene, hematite, magnetite, and kyanite. Most of the ore reserves are hosted by a complex dune sand sequence over 40 meters thick, known as the Orange Feldspathic Sand, or “OFS.”. The OFS is significantly affected by the formation of hard duricrust layers and lenses, interpreted to be a chemical precipitate of variable amounts of silicon (Si), calcium (Ca), magnesium (Mg), iron (Fe), aluminum (Al) and other constituents from alkaline groundwater. The duricrust is superposed upon HM-bearing strata and adversely affects VHM recoveries. Additional reserves are hosted at the surface by a sheet-like layer of iron oxide-stained, wind-blown sand known as the red aeolian sand (RAS). No overburden is present.
Adjustments to our geotechnical-economic modelling and a comprehensive metallurgical program have enabled division of the West and East deposits into blocks of discrete geological domains with distinctive mineralogical and processing characteristics. Our improved understanding of Namakwa ore has led to improvements in liberation and recoveries of VHM.
The KZN Sands integrated mining-processing operation consists of the Fairbreeze mine, south of the coastal town of Mtunzini, 45 kilometers SSW of Richards Bay, a Central Processing Complex (“CPC”) at Empangeni, where ilmenite is fed to a dual electric arc furnace smelter for conversion into slag and pig iron, and storage and export facilities at the port of Richards Bay. Smelter products, rutile and zircon are exported from Richards Bay. The Fairbreeze deposit is hosted by deeply weathered “Berea-type” sands which are mined using a hydraulic mining technique that was pioneered at the now-depleted Hillendale mine from 2001-2013. High-pressure water jets disaggregate the fine-grained ore sand into a slurry that is pumped to a semi-mobile primary wet plant for the production of heavy mineral concentrate. HMC is hauled by truck 40 km to the Empangeni CPC, 18 km west of Richards Bay, for separation into rutile, zircon and ilmenite. Ilmenite is fed to an adjoining two-furnace smelter for production of titanium slag and pig iron. All products are exported from Richards Bay.
The Fairbreeze deposit is hosted by a complex of strandline/paleo-dune couplets, about two kilometers inland from the modern coastline, forming an elongate ridge extending about 12 km south-southwesterly from the town of Mtunzini with a maximum width of about two kilometers. No overburden is present. Modern erosion has dissected the deposit into five discrete ore bodies, named Fairbreeze A, B, C, C-Extension and D. The Fairbreeze dune complex is part of a regional, coast-parallel corridor of terraces and dunes collectively known as the Berea Red Sand that formed along the southeastern coast of Africa from Durban to Mombasa, in response to static sea levels of the Pliocene-Pleistocene. As with all heavy mineral sand deposits, iron-titanium oxides, rutile, zircon and other minerals in the HM assemblage at Fairbreeze are inherited from their source rock provenance and modified by selective sorting during deposition. Probable source rocks for the HM are the Natal Metamorphic Province and younger rift-related basalts.
Reserve estimates for KZN as of December 31, 2017, in accordance with SAMREC (2009) reporting standards, are: 177 million tonnes ore averaging 6.2% total heavy minerals. According to the Fairbreeze LOMP, our reserves are sufficient to sustain production for over 12 years.
31
Tronox Western Australia
Our Cooljarloo mine and Chandala metallurgical complex are the key components of our Northern Operations in Western Australia. Since the commencement of mining in December 1989, when ore reserves were manually calculated at a 2% THM cut-off grade, to December 31, 2017, cumulative production during 28 years of continuous mining at Cooljarloo totals over 18 million tonnes HMC. At the Cooljarloo mine, approximately 170 km north of Perth, two dredges in a single pond feed an ore slurry to a floating concentrator. HMC is hauled 110 km south by truck to our Chandala metallurgical complex near Muchea, 60 km north of Perth, for the recovery of ilmenite, rutile, leucoxene and zircon. Ilmenite is upgraded at Chandala to synthetic rutile (SR), a high-TiO2 feedstock for our integrated TiO2 pigment plant at Kwinana, south of Perth. The Kwinana pigment plant and other components of our Southern Operations in Western Australia are described in Part 1, Item 1.
Our Western Australia ore reserves of over 11.1 million tonnes of in-place total heavy minerals, including 5.8 million tonnes from Cooljarloo, 2.1 million tonnes from Cooljarloo West, and 3.2 million tonnes from Dongara, are sufficient to sustain our current value chain of HMC, multiple commercial grades of rutile, leucoxene and zircon, and SR feed to the Kwinana pigment plant for over 20 years.
Ore reserves from three-ore bodies at Cooljarloo West (Kestrel, Harrier and Woolka) will be dredge-mined as an extension to the life of our Cooljarloo mining operations. Since our 2006 acquisition of the Dongara project, 370 kilometers north of Perth, we have completed several feasibility studies and obtained all long lead-time approvals for mining of the Dongara deposits, including environmental licenses and permits.
The economic disadvantage of mining low-grade ore at Cooljarloo is offset by economies of scale, low-cost dredging, a high-quality VHM suite that constitutes nearly 80% of THM, and good processing characteristics of the ilmenite in its conversion to SR. Over our nearly three decades of operations, our professional staff in Western Australia has exploited opportunities to extract value from the integrated mine-to-pigment chain, allowing us to create one of the most efficient operations in the global mineral sands industry.
Heavy minerals at Cooljarloo and Cooljarloo West occur in multiple, NNW-trending strands and elongate tabular bodies parallel to the modern coastline. A swarm of HM bodies in the Cooljarloo district span an area 40 km NNW by a width of over 5 km, bounded on the east by the “Gingin” scarp. Shoreline and shallow off-shore HM placers accumulated on the Swan Coastal Plain during static sea levels of the Pleistocene, or “Ice Age”. Heavy minerals were derived from the granitic and gneissic “basement” of the Yilgarn craton east of the scarp and recycled from underlying Mesozoic sediments of the northern Perth Basin. Most of the economically extractible HM deposits in the Cooljarloo district are overlain by younger overburden. Shoreline HM placers of slightly younger ages than Cooljarloo are also overlain by variable overburden at Jurien and Dongara.
In 2017, 23 million tonnes of ore were mined from Cooljarloo ore reserves. New drilling, reevaluation of certain reserves and resources, and optimizations of the mine model resulted in a net decrease of our reserve base by 10 million tonnes. Further reviews of ore exploitation options are planned during 2018.
Our total heavy mineral reserves at December 31, 2017 in Western Australia, including Cooljarloo, Cooljarloo West and Dongara are 481 million tonnes of ore containing 11.1 million tonnes of heavy minerals, representing a 4.3% decrease in THM from our year-end 2016 estimate. Included in the in-ground heavy mineral reserves are approximately 6.5 million tonnes ilmenite, 1.2 million tonnes zircon, and 900,000 combined tonnes of rutile and leucoxene.
32
Our 2017 combined production from the three HM mining-processing centers are shown in the table below.
Tronox 2017 Production of TiO2, Feedstock and Co-Products
|
Tronox Operation
|
Rutile(1)
|
Zircon(2)
|
Synthetic
Rutile |
Titanium
Slag |
Pig Iron
|
||||||||||
|
|
(Thousands of metric tonnes)
|
||||||||||||||
|
Namakwa Sands
|
|
30
|
|
|
121
|
|
|
—
|
|
|
180
|
|
|
101
|
|
|
KZN Sands
|
|
19
|
|
|
46
|
|
|
—
|
|
|
179
|
|
|
104
|
|
|
Tronox Western Australia
|
|
28
|
|
|
34
|
|
|
243
|
|
|
—
|
|
|
—
|
|
|
2017 Total
|
|
77
|
|
|
201
|
|
|
243
|
|
|
359
|
|
|
205
|
|
| (1) | Natural rutile and leucoxene |
| (2) | Includes all commercial grades of zircon |
Our South African and Australian mineral sands resource development strategy is guided by an in-house a resource development group comprised of key personnel with complementary expertise and experience. Our primary goal is to assure a long-term supply of titanium feedstocks to our vertically-integrated TiO2 value chain.
We believe our combined integrated titanium mining-to-titanium dioxide operations constitute the largest fully-integrated TiO2 value chain in the world, and the TiO2 business of Tronox is the world’s only mining-mineral processing chain with production of both titanium slag and synthetic rutile. Our captive slag from South Africa, synthetic rutile from Western Australia, and natural rutile from our three operations satisfy over 100% of our TiO2 feedstock requirements. Excess TiO2 feedstock can be marketed externally or stockpiled for future internal consumption.
Natural rutile, synthetic rutile, and titanium slag are to a certain extent fungible as titanium feedstocks for chloride pigment production. However, each titanium mineral and beneficiated mineral product has a discreet commercial market, and the commercial value of titanium feedstock is a function not only of TiO2 content and supply and demand balances, but also particle size, trace element geochemistry, logistics and other factors. The global TiO2 industry is a valued-added supply chain, with final product prices for TiO2 pigment, typically higher than that of ilmenite, the base load titanium mineral the industry. The revenue assumptions for titanium feedstocks applied in the determination of heavy mineral ore reserve estimates are based on our sales contracts, pricing assumptions in our integrated TiO2 value chain, and market intelligence.
Our LOMP and reserve estimates are derived from detailed techno-economic models created from extensive geological, mining and analytical databases, and optimized with respect to anticipated revenues, and costs. Cost assumptions are developed from our extensive experience and include mining parameters, processing recoveries, foreign exchange, and rehabilitation. Each of our operations reconcile predicted mining and processing metrics with actual production and recovery data on a monthly basis. Our models are updated as necessary and used to determine the ultimate ore boundaries, rather than a simple grade cut-off. To satisfy the disclosure rules in Industry Guide 7, our nominal cut-off grades are: 0.2% zircon at Namakwa Sands; 1.5% ilmenite at KZN Sands; and 1.3% THM (approximately 1% VHM) at Tronox Northern Operations, Western Australia.
Heavy Mineral Reserves
Ore reserves are those portions of mineral deposits that are economically and legally exploitable at December 31, 2017. All of our heavy mineral reserves are reported on the basis of in-place, economically extractable ore determined from comprehensive geological, mining and economic models and include dilution and mining losses. Ore is classified as either Proven or Probable, based on the level of confidence in the reserve estimates and cost/revenue assumptions.
33
The following table summarizes our heavy mineral ore reserves and their contained in situ THM and heavy mineral assemblages as of December 31, 2017. Increases or decreases in our reserves estimates from December 31, 2016 to December 31, 2017 are indicated as a percent of in-place THM reserves.
|
MINE / DEPOSIT
|
Reserve
Category |
Ore
(million MT) |
Average
Grade (% THM) |
In-Place
THM (million MT) |
VHM Assemblage (% of THM)
|
Change
from 2016 (+ (-) %) |
||||||||||||||||||
|
Ilmenite
|
Rutile and
Leucoxene |
Zircon
|
||||||||||||||||||||||
|
Namakwa Sands Open Pit Dry Mine – Western Cape RSA
|
|
|
|
|
|
|
|
|
|
|
|
|
|
|
|
|
|
|
|
|
|
|
|
|
|
|
Proven
|
|
195
|
|
|
8.6
|
|
|
16.7
|
|
|
35.7
|
|
|
7.8
|
|
|
9.1
|
|
|
|
|
||
|
|
Probable
|
|
492
|
|
|
5.5
|
|
|
27.1
|
|
|
50.2
|
|
|
9.8
|
|
|
10.9
|
|
|
|
|
||
|
|
Total Reserves
|
|
687
|
|
|
6.4
|
|
|
43.8
|
|
|
44.7
|
|
|
9.1
|
|
|
10.3
|
|
|
(5.6
|
)%
|
||
|
KZN Sands Open Pit Hydraulic Mine – KZN RSA
|
|
|
|
|
|
|
|
|
|
|
|
|
|
|
|
|
|
|
|
|
|
|
||
|
|
Proven
|
|
131
|
|
|
6.7
|
|
|
8.8
|
|
|
61.9
|
|
|
5.2
|
|
|
8.4
|
|
|
|
|
||
|
|
Probable
|
|
46
|
|
|
4.6
|
|
|
2.1
|
|
|
53.3
|
|
|
5.0
|
|
|
7.2
|
|
|
|
|
||
|
|
Total Reserves
|
|
177
|
|
|
6.2
|
|
|
10.9
|
|
|
60.2
|
|
|
5.2
|
|
|
8.1
|
|
|
(6.8
|
)%
|
||
|
South Africa
|
Total Reserves
|
|
864
|
|
|
|
|
|
54.7
|
|
|
|
|
|
|
|
|
|
|
|
(5.9
|
)%
|
||
|
Cooljarloo – Dredge Mine Western Australia
|
|
|
|
|
|
|
|
|
|
|
|
|
|
|
|
|
|
|
|
|
|
|
||
|
|
Proven
|
|
294
|
|
|
1.8
|
|
|
5.4
|
|
|
60.5
|
|
|
7.7
|
|
|
10.2
|
|
|
|
|
||
|
|
Probable
|
|
20
|
|
|
2.1
|
|
|
0.4
|
|
|
61.6
|
|
|
7.8
|
|
|
9.3
|
|
|
|
|
||
|
|
Total Reserves
|
|
314
|
|
|
1.9
|
|
|
5.8
|
|
|
60.6
|
|
|
7.7
|
|
|
10.1
|
|
|
(7.9
|
)%
|
||
|
Cooljarloo West Planned Dredge Mine – Western Australia
|
|
|
|
|
|
|
|
|
|
|
|
|
|
|
|
|
|
|
|
|
|
|
||
|
|
Proven
|
|
—
|
|
|
—
|
|
|
—
|
|
|
—
|
|
|
—
|
|
|
—
|
|
|
|
|
||
|
|
Probable
|
|
105
|
|
|
2.0
|
|
|
2.1
|
|
|
60.5
|
|
|
7.9
|
|
|
12.2
|
|
|
|
|
||
|
|
Total Reserves
|
|
105
|
|
|
2.0
|
|
|
2.1
|
|
|
60.5
|
|
|
7.9
|
|
|
12.2
|
|
|
|
|
||
|
Dongara Planned Dry Mine – Western Australia
|
|
|
|
|
|
|
|
|
|
|
|
|
|
|
|
|
|
|
|
|
|
|
||
|
|
Proven
|
|
62
|
|
|
5.2
|
|
|
3.2
|
|
|
48.7
|
|
|
8.9
|
|
|
10.9
|
|
|
|
|
||
|
|
Probable
|
|
—
|
|
|
—
|
|
|
—
|
|
|
—
|
|
|
—
|
|
|
—
|
|
|
|
|
||
|
|
Total Reserves
|
|
62
|
|
|
5.2
|
|
|
3.2
|
|
|
48.7
|
|
|
8.9
|
|
|
10.9
|
|
|
|
|
||
|
Western Australia
|
Total Reserves
|
|
481
|
|
|
|
|
|
11.1
|
|
|
|
|
|
|
|
|
|
|
|
(4.3
|
)%
|
||
|
Global
|
Total Reserves
|
|
1,345
|
|
|
|
|
|
65.8
|
|
|
|
|
|
|
|
|
|
|
|
(5.6
|
)%
|
||
Abbreviations and definitions:
MT —metric tonnes (1 metric ton = 1.10231 short tons)
Ore Reserves —the portions of our inventories of mineralized material inclusive of dilution, determined to be economically and legally exploitable as of December 31, 2017, classified as either Probable Reserves or Proven Reserves, based on level of confidence.
THM — total heavy minerals, with densities >2.9 g/cm3 regardless of commercial value
VHM — valuable heavy minerals, including Ilmenite, Rutile, Leucoxene & Zircon reported as percentage of THM.
Change from 2016 — Increase or decrease of estimated in-place THM in reserves, expressed as + or – percent change from 2016.
Key Assumptions — economic viability is determined by techno-economic modeling constructed from geological, analytical and geotechnical databases, mining parameters, metallurgical recovery assumptions, pit optimizations, and economic assumptions based on current operating costs, foreign exchange rates, and projected product sales prices at time of production. Historical sales prices by themselves are unreliable predictors of future prices, and our revenue forecasts are based on multiple factors, including market research, existing private contracts, and external consultant opinions. Nominal cut-off grades are 0.2% zircon at Namakwa Sands, 1.5% ilmenite at KZN Sands, and 1.3% THM (1% VHM) at Cooljarloo and Cooljarloo West.
34
Our forecast production of commercial-quality titanium mineral and zircon concentrates from reserves is based on mining rates, the heavy mineral assemblage and grade distributions, our experience in valuable mineral recoveries, and other inputs to our techno-economic models. Mining recoveries are typically 99-100%. Metallurgical recoveries vary widely as a function of mineral characteristics. Processing efficiencies are affected by many factors, including mineralogical diversity, grain size, morphology and surface coatings of the heavy minerals. To a practical extent, mineral separation technology is customized for the physical characteristics of each mining operation. Cumulative recovery factors for VHM in our mine concentrates, inclusive of HM concentration at the mine and production of mineral concentrates at the separation plant, are generally in the range of 70% to 95%. Actual recoveries are applied in our techno-economic models to determine economic viability. Unrecovered VHM in certain dry mill tailings streams are stockpiled, but their hypothetical value is not considered in our revenue assumptions.
Mineral reserve estimates, life-of mine projections, and revenue assumptions are inherently forward-looking and subject to market conditions, uncertainties and unanticipated events beyond our control. Our revenue assumptions are anchored by in-house and external forecasts of the prevailing sales prices for our mineral concentrates and beneficiated mineral products at the time of their anticipated sale, or consumption in our vertically-integrated TiO2 supply chain. In our experience, historical prices for commercial mineral concentrates and titanium feedstocks are not by themselves a reliable guide to future prices.
The following table compares the heavy mineral reserves reported for the three years ending December 31, 2017, 2016 and 2015:
3-Year Reserves (Mt In-Place THM)
|
|
Reserve
Life-Of-Mine |
December 31,
|
||||||||
|
|
2017
|
2016
|
2015
|
|||||||
|
|
|
(In millions of MT)
|
||||||||
|
Namakwa Sands
|
>25 years
|
|
43.8
|
|
|
46.4
|
|
|
47.8
|
|
|
KZN Sands
|
>12 years
|
|
10.9
|
|
|
11.7
|
|
|
12.0
|
|
|
Total South Africa
|
|
|
54.7
|
|
|
58.1
|
|
|
59.8
|
|
|
Cooljarloo and Cooljarloo West
|
|
|
7.9
|
|
|
8.4
|
|
|
8.2
|
|
|
Dongara
|
|
|
3.2
|
|
|
3.2
|
|
|
3.3
|
|
|
Total Western Australia
|
>20 years
|
|
11.1
|
|
|
11.6
|
|
|
11.5
|
|
|
Total Tronox
|
|
|
65.8
|
|
|
69.7
|
|
|
71.3
|
|
The above three -year total heavy mineral reserves for the Tronox Mineral Sands Division are expressed as millions of MT in-place THM for the years ended 2015 through 2017. LOMPs for each operation may include some non-reserve mineralized material not currently classified as reserves under SAMREC and JORC the guidelines, and the mine lives in the LOMPs may be longer than what can be supported by the reserves. Our LOMP’s and ore reserves support operational lives of over 25 years at Namakwa Sands, over 12 years at KZN Sands, and over 20 years at our Western Australia Northern Operations.
| Item 3. | Legal Proceedings |
Information required by this item is incorporated herein by reference to the section captioned “Notes to Consolidated Financial Statements, Note 17- Commitments and Contingencies” of this Form 10-K.
| Item 4. | Mine Safety Disclosures |
Information regarding mine safety and other regulatory actions at our mine in Green River, Wyoming, operated in conjunction with the Alkali business (which was sold on September 1, 2017), is included in Exhibit 95 of this Form 10-K.
35
PART II
| Item 5. | Market for Registrant’s Common Equity, Related Shareholder Matters and Issuer Purchases of Equity Securities |
Market for our Class A ordinary shares
Our Class A Shares began trading on the New York Stock Exchange on June 18, 2012 under the symbol “TROX.” There is no public trading market for our Class B Shares, which are held by Exxaro.
The following table sets forth, for the fiscal quarters indicated, the high and low sales prices per share of our Class A Shares, and the dividends declared during 2017 and 2016.
|
|
Sales Price
|
Dividends
per Share |
|||||||
|
|
High
|
Low
|
|||||||
|
2017
|
|
|
|
|
|
|
|
|
|
|
Fourth quarter
|
$
|
28.40
|
|
$
|
18.50
|
|
$
|
0.045
|
|
|
Third quarter
|
$
|
23.52
|
|
$
|
14.83
|
|
$
|
0.045
|
|
|
Second quarter
|
$
|
19.53
|
|
$
|
12.88
|
|
$
|
0.045
|
|
|
First quarter
|
$
|
19.99
|
|
$
|
10.41
|
|
$
|
0.045
|
|
|
2016
|
|
|
|
|
|
|
|
|
|
|
Fourth quarter
|
$
|
12.03
|
|
$
|
7.40
|
|
$
|
0.045
|
|
|
Third quarter
|
$
|
9.92
|
|
$
|
4.17
|
|
$
|
0.045
|
|
|
Second quarter
|
$
|
8.20
|
|
$
|
3.84
|
|
$
|
0.045
|
|
|
First quarter
|
$
|
6.87
|
|
$
|
2.79
|
|
$
|
0.25
|
|
Holders of Record
As of January 26, 2018, there were approximately 426 holders of record of Class A Shares. This does not include the shareholders that held shares of our Class A Shares in a nominee or “street-name” accounts through banks or broker-dealers. See Item 12, Security Ownership of Certain Beneficial Owners and Management and Related Shareholder Matters.
36
| Item 6. | Selected Financial Data |
The following table sets forth selected historical financial data for the periods indicated. In connection with the Alkali Sale, we recognized a loss of $233 million, net of tax, during the year ended December 31, 2017. As a result of the Alkali Sale, Alkali’s results of operations have been reported as discontinued operations (see Note 3 of notes to consolidated financial statements for additional information). This information should be read in conjunction with our Consolidated Financial Statements (including the notes thereto) and our “Management’s Discussion and Analysis of Financial Condition and Results of Operations.”
|
|
Year Ended December 31,
|
||||||||||||||
|
|
2017
|
2016(1)
|
2015(1)
|
2014(1)
|
2013(1)
|
||||||||||
|
Statement of Operations Data:
|
|
|
|
|
|
|
|
|
|
|
|
|
|
|
|
|
Net sales
|
$
|
1,698
|
|
$
|
1,309
|
|
$
|
1,510
|
|
$
|
1,737
|
|
$
|
1,922
|
|
|
Gross profit
|
|
388
|
|
|
134
|
|
|
19
|
|
|
206
|
|
|
197
|
|
|
Selling, general and administrative expenses
|
|
(251
|
)
|
|
(189
|
)
|
|
(199
|
)
|
|
(191
|
)
|
|
(188
|
)
|
|
Restructuring income (expense)
|
|
1
|
|
|
(1
|
)
|
|
(21
|
)
|
|
(15
|
)
|
|
—
|
|
|
Income (loss) from operations
|
|
138
|
|
|
(56
|
)
|
|
(201
|
)
|
|
—
|
|
|
9
|
|
|
Interest and debt expense, net
|
|
(188
|
)
|
|
(185
|
)
|
|
(176
|
)
|
|
(133
|
)
|
|
(130
|
)
|
|
Net gain (loss) on liquidation of non-operating subsidiaries
|
|
—
|
|
|
—
|
|
|
—
|
|
|
(35
|
)
|
|
24
|
|
|
Gain (loss) on extinguishment of debt
|
|
(28
|
)
|
|
4
|
|
|
—
|
|
|
(8
|
)
|
|
(4
|
)
|
|
Other income (expense), net
|
|
(9
|
)
|
|
(27
|
)
|
|
28
|
|
|
27
|
|
|
46
|
|
|
Income (loss) from continuing operations before income taxes
|
|
(87
|
)
|
|
(264
|
)
|
|
(349
|
)
|
|
(149
|
)
|
|
(55
|
)
|
|
Income tax (provision) benefit
|
|
(6
|
)
|
|
125
|
|
|
(23
|
)
|
|
(268
|
)
|
|
(31
|
)
|
|
Net income (loss) from continuing operations
|
$
|
(93
|
)
|
$
|
(139
|
)
|
$
|
(372
|
)
|
$
|
(417
|
)
|
$
|
(86
|
)
|
|
Net income (loss) from discontinued operations
|
|
(179
|
)
|
|
79
|
|
|
55
|
|
|
—
|
|
|
—
|
|
|
Net income (loss)
|
|
(272
|
)
|
|
(60
|
)
|
|
(317
|
)
|
|
(417
|
)
|
|
(86
|
)
|
|
Income (loss) attributable to noncontrolling interest
|
|
13
|
|
|
1
|
|
|
12
|
|
|
10
|
|
|
35
|
|
|
Net income (loss) attributable to Tronox Limited
|
$
|
(285
|
)
|
$
|
(61
|
)
|
$
|
(329
|
)
|
$
|
(427
|
)
|
$
|
(121
|
)
|
|
(Loss) per share from continuing operations
|
|
|
|
|
|
|
|
|
|
|
|
|
|
|
|
|
Basic
|
$
|
(0.89
|
)
|
$
|
(1.20
|
)
|
$
|
(3.31
|
)
|
$
|
(3.74
|
)
|
$
|
(1.06
|
)
|
|
Diluted
|
$
|
(0.89
|
)
|
$
|
(1.20
|
)
|
$
|
(3.31
|
)
|
$
|
(3.74
|
)
|
$
|
(1.06
|
)
|
|
Income (loss) per share from discontinued operations(2)
|
|
|
|
|
|
|
|
|
|
|
|
|
|
|
|
|
Basic
|
$
|
(1.50
|
)
|
$
|
0.68
|
|
$
|
0.47
|
|
$
|
—
|
|
$
|
—
|
|
|
Diluted
|
$
|
(1.50
|
)
|
$
|
0.68
|
|
$
|
0.47
|
|
$
|
—
|
|
$
|
—
|
|
|
Balance Sheet Data (continuing operations):
|
|
|
|
|
|
|
|
|
|
|
|
|
|
|
|
|
Working capital (3)
|
$
|
2,291
|
|
$
|
614
|
|
$
|
654
|
|
$
|
2,019
|
|
$
|
2,288
|
|
|
Total assets continuing operations
|
$
|
4,864
|
|
$
|
3,293
|
|
$
|
3,337
|
|
$
|
5,024
|
|
$
|
5,653
|
|
|
Total debt, net
|
$
|
3,147
|
|
$
|
3,054
|
|
$
|
3,076
|
|
$
|
2,353
|
|
$
|
2,362
|
|
|
Total equity
|
$
|
1,015
|
|
$
|
1,153
|
|
$
|
1,103
|
|
$
|
1,790
|
|
$
|
2,440
|
|
|
Total assets discontinued operations
|
$
|
—
|
|
$
|
1,671
|
|
$
|
1,690
|
|
$
|
—
|
|
$
|
—
|
|
|
Supplemental Information (continuing operations):
|
|
|
|
|
|
|
|
|
|
|
|
|
|
|
|
|
Depreciation, depletion and amortization expense
|
$
|
182
|
|
$
|
177
|
|
$
|
253
|
|
$
|
302
|
|
$
|
322
|
|
|
Capital expenditures
|
$
|
91
|
|
$
|
86
|
|
$
|
165
|
|
$
|
187
|
|
$
|
165
|
|
|
Dividends per share
|
$
|
0.18
|
|
$
|
0.385
|
|
$
|
1.00
|
|
$
|
1.00
|
|
$
|
1.00
|
|
| (1) | Reflects the impact of the revisions to our previously issued consolidated financial statements. See Note 1 of notes to consolidated financial statements. |
| (2) | Reflects the sale of the Alkali business. See Note 3 of notes to consolidated financial statements for additional information. |
| (3) | Working capital is defined as the excess (deficit) of current assets over current liabilities of continuing operations. |
37
| Item 7. | Management’s Discussion and Analysis of Financial Condition and Results of Operations |
The following discussion should be read in conjunction with Tronox Limited’s consolidated financial statements and the related notes included elsewhere in this Annual Report on Form 10-K. This discussion and other sections in this Annual Report on Form 10-K contain forward-looking statements, within the meaning of the Private Securities Litigation Reform Act of 1995, that involve risks and uncertainties, and actual results could differ materially from those discussed in the forward-looking statements as a result of numerous factors. Forward-looking statements provide current expectations of future events based on certain assumptions and include any statement that does not directly relate to any historical or current fact. Forward-looking statements also can be identified by words such as “future,” “anticipates,” “believes,” “estimates,” “expects,” “intends,” “plans,” “predicts,” “will,” “would,” “could,” “can,” “may,” and similar terms. There are important factors that could cause our actual results, level of activity, performance or achievements to differ materially from the results, level of activity, performance or achievements expressed or implied by the forward-looking statements. In particular, you should consider the numerous risks and uncertainties outlined in Item 1A. “Risk Factors.”
This Management’s Discussion and Analysis of Financial Condition and Results of Operations contains certain financial measures, in particular the presentation of earnings before interest, taxes, depreciation and amortization (“EBITDA”) and Adjusted EBITDA, which are not presented in accordance with accounting principles generally accepted in the United States (“U.S. GAAP”). We are presenting these non-U.S. GAAP financial measures because we believe they provide us and readers of this Form 10-K with additional insight into our operational performance relative to earlier periods and relative to our competitors. We do not intend for these non-U.S. GAAP financial measures to be a substitute for any U.S. GAAP financial information. Readers of these statements should use these non-U.S. GAAP financial measures only in conjunction with the comparable U.S. GAAP financial measures. A reconciliation of net income (loss) to EBITDA and Adjusted EBITDA is also provided herein.
Executive Overview
We are a global leader in the production and marketing of titanium bearing mineral sands and titanium dioxide (“TiO2”) pigment.
We operate three TiO2 pigment facilities at the following locations: Hamilton, Mississippi; Botlek, the Netherlands; and Kwinana, Western Australia, representing an aggregate annual TiO2 production capacity of approximately 465,000 metric tons (“MT”). TiO2 is used extensively in the manufacture of paint and other coatings, plastics and paper, and in a wide range of other applications, including inks, fibers, rubber, food, cosmetics, and pharmaceuticals. Moreover, it is a critical component of everyday consumer applications due to its superior ability to cover or mask other materials effectively and efficiently relative to alternative white pigments and extenders. TiO2 is considered a quality of life product, and some research indicates that consumption generally increases as disposable income increases. At present, it is our belief that there is no effective mineral substitute for TiO2 because no other white pigment has the physical properties for achieving comparable opacity and brightness, or can be incorporated as cost effectively. We also operate three separate mining operations: KwaZulu-Natal (“KZN”) Sands located in South Africa, Namakwa Sands located in South Africa and Cooljarloo located in Western Australia.
Our TiO2 business includes the following:
| • | Exploration, mining, and beneficiation of mineral sands deposits; |
| • | Production of titanium feedstock and its co-products (including chloride slag, slag fines, rutile, synthetic rutile and leucoxene), pig iron, and zircon; |
| • | Production and marketing of TiO2; and |
| • | Electrolytic manganese dioxide manufacturing and marketing, which is primarily focused on advanced battery materials and specialty boron products. |
Recent Developments
On February 21, 2017, Tronox Limited, The National Titanium Dioxide Company Ltd., a limited company organized under the laws of the Kingdom of Saudi Arabia (“Cristal”), and Cristal Inorganic Chemicals Netherlands Coöperatief W.A., a cooperative organized under the laws of the Netherlands and a wholly owned
38
subsidiary of Cristal (“Seller”), entered into a Transaction Agreement (the “Transaction Agreement”), pursuant to which we agreed to acquire Cristal’s titanium dioxide business for $1.673 billion in cash, subject to a working capital adjustment at closing (the “Cash Consideration”), plus 37,580,000 Class A ordinary shares (“Class A Shares”), par value $0.01 per share, of Tronox Limited (the “Cristal Transaction”). Following the closing of the Cristal Transaction, the Seller will own approximately 24% of the outstanding ordinary shares (including both Class A and Class B) of Tronox Limited. On March 1, 2018, Tronox, Cristal and Seller entered into an Amendment to the Transaction Agreement (the “Amendment”) that extends the termination date under the Transaction Agreement to June 30, 2018, with automatic 3-month extensions to March 31, 2019, if necessary based on the status of outstanding regulatory approvals. The Amendment also provides that Tronox has the right to terminate the Transaction Agreement if it determines that the outstanding regulatory approvals are not reasonably likely to be obtained. In the event that such termination by Tronox is (i) on or after January 1, 2019, and Tronox elects to terminate the Transaction Agreement if it determines that the outstanding regulatory approvals are not reasonably likely to be obtained; or (ii) if regulatory approval has not been obtained by March 31, 2019 and Tronox or Cristal elects to terminate the Transaction Agreement; then Tronox is required to pay Cristal a $60 million termination fee. The Transaction Agreement also provides that we must pay to Cristal a termination fee of $100 million if all conditions to closing, other than the financing condition, have been satisfied and the Transaction Agreement is terminated because closing of the Cristal Transaction has not occurred by June 30, 2018 (subject to automatic 3-month extensions to March 31, 2019 if necessary based on the status of outstanding regulatory approvals).
The Cristal Transaction is conditioned upon the receipt of various regulatory approvals, including antitrust clearance in numerous jurisdictions. On April 13, 2017, the FTC issued a request for additional information (“Second Request”) to the Company and Cristal in connection with its filing under the Hart-Scott-Rodino Antitrust Improvements Act of 1976, as amended, and Tronox believes it has fully complied with the Second Request. On December 5, 2017, the FTC announced that it would not approve the Cristal Transaction as proposed and filed an administrative action to prevent the parties from consummating the transaction. On January 23, 2018, Tronox filed suit against the FTC in the U.S. District Court for the Northern District of Mississippi seeking a declaration that the Cristal Transaction is lawful under applicable law, among other things. On December 21, 2017, the European Commission announced that after its initial review, it would pursue Phase II investigation of the Cristal Transaction before reaching a decision to approve it, with or without conditions. The transaction agreement provides for customary representations, warranties and covenants that are subject, in some cases, to specified exceptions and qualifications contained in the transaction agreement. There can be no assurance, however, that all closing conditions for the Cristal Transaction will be satisfied and, if they are satisfied, that they will be satisfied in time for the closing to occur by June 30, 2018 (subject to automatic 3-month extensions to March 31, 2019 if necessary based on the status of outstanding regulatory approvals), at which time either party to the transaction agreement may mutually agree to extend the closing date or terminate the transaction agreement if the Cristal Transaction has not closed by such time. We have received approval for the Cristal Transaction from seven of the nine regulatory jurisdictions whose approvals are required to close Cristal Transaction.
On October 2, 2017, at a special meeting of shareholders of the Company held pursuant to the Transaction Agreement, the Company’s shareholders approved a resolution to issue 37,580,000 Class A Shares to the Seller in connection with the acquisition of Cristal’s TiO2 business, and the resulting acquisition of interests in such Class A Shares by the Seller and certain other persons and entities, at the closing of such acquisition.
On September 1, 2017, we completed the Alkali Sale and in connection therewith, we recognized a loss of $233 million, net of tax, during the year ended December 31, 2017. See Note 3 of notes to consolidated financial statements for additional information. As a result of the Alkali Sale, Alkali’s results of operations have been reported as discontinued operations (see Note 3). Both Tronox Holdings and Genesis Energy, L.P. have agreed, following the closing, to indemnify the other party for losses arising from certain breaches of the Purchase Agreement and for certain other liabilities, subject to certain limitations. As a result of the Alkali Sale, we now operate under one operating and reportable segment, TiO2.
On March 8, 2017, Exxaro announced its intention to begin pursuing a path to monetize its ownership stake in Tronox over time. On October 10, 2017, Exxaro sold 22,425,000 Class A Shares in an underwritten registered offering (the “Exxaro Share Transaction”). At December 31, 2017 and December 31, 2016, Exxaro held approximately 24% and 44%, respectively, of the voting securities of Tronox Limited. See Notes 1 and 21 of
39
notes to consolidated financial statements for additional information regarding Exxaro transactions. Presently, Exxaro intends to sell the remainder of its Tronox shares in a staged process over time pursuant to the existing registration statement, subject to market conditions. Exxaro’s sale of Class A Shares does not impact its 26% ownership interest in each of our Tronox KZN Sands (Pty) Ltd. and Tronox Mineral Sands (Pty) Ltd subsidiaries.
Beginning in the fourth quarter of 2016, we implemented various steps of an internal corporate reorganization plan to simplify our corporate structure and thereby improve operational, administrative, and commercial synergies within each of our operating segments (the “Corporate Reorganization”). As a result of the Corporate Reorganization, we reduced our cross-jurisdictional financing arrangements, eliminated administrative activities and reversed the deferred tax assets related to intercompany interest deductions. The related withholding tax accrual amounts were also reversed as a result of the Corporate Reorganization. Additionally, we reduced our deferred tax assets related to loss carryforwards, which will no longer be available to utilize. In connection with the Corporate Reorganization during the first quarter of 2017, Tronox Limited became managed and controlled in the U.K., with no additional impacts to the consolidated provision for income taxes due to the valuation allowances in various jurisdictions. See Note 6 of notes to our consolidated financial statements for additional information.
Business Environment
The following discussion includes trends and factors that may affect future operating results:
Our pigment business benefited from a global industry recovery that began in the first quarter of 2016. To meet healthy demand, we operated our pigment plants at high utilization rates while matching pigment production volumes to sales volumes and keeping inventory at or below normal levels. Global pigment pricing has rebounded with successive gains in each quarter since the first quarter of 2016. We believe pigment inventories, in the aggregate, are at or below normal levels at both customer and producer locations globally resulting in a continued tight supply-demand balance. We continue to use a significant majority of our high-grade titanium feedstock for our pigment production. We expect moderate cost increases related to other raw material inputs such as electrodes, coke, and electricity as commodity markets strengthen. The zircon market has stabilized but remains in a tight supply-demand balance and we expect modest price gains to continue in 2018.
We continue to be uniquely tax-advantaged by favorable tax loss carry forwards and other favorable tax positions. While we believe these tax-advantaged factors will continue to offer benefits for years to come, if Exxaro sells their remaining shareholdings in 2018, these favorable tax positions may no longer be available. See Note 6 of notes to our consolidated financial statements for additional information.
Consolidated Results of Operations from Continuing Operations
Year Ended December 31, 2017 Compared to the Year Ended December 31, 2016
|
|
Year Ended December 31,
|
||||||||
|
|
2017
|
2016
|
Variance
|
||||||
|
|
(Millions of U.S. dollars)
|
||||||||
|
Net sales
|
$
|
1,698
|
|
$
|
1,309
|
|
$
|
389
|
|
|
Cost of goods sold
|
|
1,310
|
|
|
1,175
|
|
|
135
|
|
|
Gross profit
|
|
388
|
|
|
134
|
|
|
254
|
|
|
Selling, general and administrative expenses
|
|
(251
|
)
|
|
(189
|
)
|
|
(62
|
)
|
|
Restructuring income (expense)
|
|
1
|
|
|
(1
|
)
|
|
2
|
|
|
Income (loss) from operations
|
|
138
|
|
|
(56
|
)
|
|
194
|
|
|
Interest and debt expense, net
|
|
(188
|
)
|
|
(185
|
)
|
|
(3
|
)
|
|
Gain (loss) on extinguishment of debt
|
|
(28
|
)
|
|
4
|
|
|
(32
|
)
|
|
Other income (expense), net
|
|
(9
|
)
|
|
(27
|
)
|
|
18
|
|
|
Income (loss) from continuing operations before income taxes
|
|
(87
|
)
|
|
(264
|
)
|
|
177
|
|
|
Income tax (provision) benefit
|
|
(6
|
)
|
|
125
|
|
|
(131
|
)
|
|
Net income (loss) from continuing operations
|
$
|
(93
|
)
|
$
|
(139
|
)
|
$
|
46
|
|
40
Net sales in 2017 increased by 30% compared to 2016 primarily due to the impact of higher selling prices for Pigment of $200 million, Zircon of $28 million, Pig iron of $16 million, Slag Fines of $5 million and Natural Rutile of $2 million. Higher volume and product mix for Pigment of $38 million, CP Slag of $35 million, Zircon of $18 million, Pig Iron of $13 million, Ilmenite of $13 million, Synthetic Rutile of $8 million, Slag Fines of $3 million and Natural Rutile of $2 million also contributed to the increase in net sales for the year ended 2017. The impact from foreign currency translation versus 2016 was $7 million favorable.
Our gross profit margin in 2017 was 23% of net sales compared to 10% in the prior year. The increase of $254 million in our gross margin was primarily due to higher selling prices of $254 million, higher volumes and product mix of $28 million, the impact of lower production costs of $16 million due primarily to a higher facility utilization, partially offset by unfavorable changes in foreign currency translation of $44 million primarily from the South African Rand and Australian dollar.
Selling, general and administrative expenses increased by 33% in 2017 compared to 2016. Included in SG&A are $124 million and $63 million of corporate expenses for 2017 and 2016, respectively. The $61 million increase in corporate expenses was due to higher professional fees of $46 million related to the Cristal Transaction, higher employee share-based and other compensation costs of $11 million and higher other general and administrative costs of $4 million. SG&A costs associated with our TiO2 activities increased $1 million from the prior year period primarily due to higher employee stock-based and other compensation costs and unfavorable changes in foreign currency translation.
Restructuring costs were $2 million lower than 2016. TiO2 and corporate restructuring costs were each $1 million lower in 2017 compared to 2016. See Note 4 of notes to consolidated financial statements.
Income from operations for 2017 was $138 million, $261 million from our TiO2 activities offset by $123 million of corporate expenses, which includes $124 million of SG&A and a $1 million reversal of restructuring expense. Loss from operations for 2016 was $56 million, $6 million income from operations from our TiO2 activities and $62 million of corporate expenses. Income from operations for our TiO2 activities increased by $255 million compared to 2016 primarily due to an increase in gross profit of $254 million, $2 million decrease in restructuring costs, offset by a $1 million increase in selling, general and administrative expenses. Corporate general and administrative expenses for 2017 increased for the reasons noted above in the discussion of the SG&A expenses.
Interest and debt expense, net - See Note 15 of notes to consolidated financial statements.
Gain (loss) on debt extinguishment in 2017 was a loss of $28 million compared to a gain $4 million in 2016 due to the refinancing of our term loan and notes in the third quarter of 2017. See Note 15 of notes to consolidated financial statements.
Other expense, net in 2017 primarily consisted of a net realized and unrealized foreign currency loss of $20 million, offset by interest income of $10 million. Other expense, net in 2016 primarily consisted of a net realized and unrealized foreign currency loss of $31 million, offset by interest income of $3 million. The change in the net realized and unrealized foreign currency is primarily driven by the strengthening of the South African Rand as of December 31, 2017 used in the remeasurement of our U.S. dollar denominated open trade and notes receivable positions.
The effective tax rates in 2017 and 2016 differ from the United Kingdom statutory rate of 19% and the Australian statutory rate of 30% primarily due to valuation allowances and income in foreign jurisdictions taxed at rates different than the statutory rates. Additionally, the net income impact of the Corporate Reorganization was a benefit of $137 million in the fourth quarter of 2016, reflecting the reversal of $139 million of withholding tax accruals, offset by a foreign currency loss of $2 million. For the year ended December 31, 2016, the net income impact was $107 million, reflecting a net reduction in withholding tax accruals of $110 million, offset by a foreign currency loss of $3 million.
41
Year Ended December 31, 2016 Compared to the Year Ended December 31, 2015
|
|
Year Ended December 31,
|
||||||||
|
|
2016
|
2015
|
Variance
|
||||||
|
|
(Millions of U.S. dollars)
|
||||||||
|
Net sales
|
$
|
1,309
|
|
$
|
1,510
|
|
$
|
(201
|
)
|
|
Cost of goods sold
|
|
1,175
|
|
|
1,491
|
|
|
(316
|
)
|
|
Gross profit
|
|
134
|
|
|
19
|
|
|
115
|
|
|
Selling, general and administrative expense
|
|
(189
|
)
|
|
(199
|
)
|
|
10
|
|
|
Restructuring expense
|
|
(1
|
)
|
|
(21
|
)
|
|
20
|
|
|
Income (loss) from operations
|
|
(56
|
)
|
|
(201
|
)
|
|
145
|
|
|
Interest and debt expense, net
|
|
(185
|
)
|
|
(176
|
)
|
|
(9
|
)
|
|
Gain on extinguishment of debt
|
|
4
|
|
|
—
|
|
|
4
|
|
|
Other income (expense), net
|
|
(27
|
)
|
|
28
|
|
|
(55
|
)
|
|
Income (loss) from continuing operations before income taxes
|
|
(264
|
)
|
|
(349
|
)
|
|
85
|
|
|
Income tax (provision) benefit
|
|
125
|
|
|
(23
|
)
|
|
148
|
|
|
Net income (loss) from continuing operations
|
$
|
(139
|
)
|
$
|
(372
|
)
|
$
|
233
|
|
Net sales in 2016 decreased by 13% compared to 2015 primarily due to the impact of lower selling prices and product mix of $117 million, lower volumes of $83 million and unfavorable foreign currency translation of $1 million. The lower selling prices and selling mix impacted both feedstock and pigment products to a relatively equal extent. The impact of lower volumes primarily reflects $52 million related to the closure of our sodium chlorate plant in Hamilton, Mississippi in 2015, $83 million lower demand during 2016 for feedstock, partially offset by $52 million higher demand for pigment products.
Gross profit margin in 2016 was 10% of net sales compared to 1% in the prior year. The gross profit improvement highlights the cost reduction benefits from our operational excellence program and our operating strategy that focuses on matching TiO2 pigment production to market demand while keeping finished pigment inventories at or below normal levels. For the majority of 2016, our average pigment capacity utilization rate was in excess of 90% with all lines at all pigment plants in operations.
Selling, general and administrative expenses in 2016 decreased by 5% compared to 2015. Included in SG&A are $63 million and $73 million of corporate expenses for the years ended December 31, 2016 and 2015, respectively. The decrease in corporate expenses compared to 2015 is primarily due to $29 million of additional professional fees related to the 2015 Alkali Transaction, partially offset by an $11 million transfer tax benefit from 2015 that did not recur, higher bad debt expense and employee related costs in 2016.
Restructuring income (expense) - See Note 4 of notes to consolidated financial statements.
Loss from continuing operations for the year ended December 31, 2016 was $56 million, $62 million of Corporate expenses offset by income of $6 million from our TiO2 activities. Loss from continuing operations for the year ended December 31, 2015 was $201 million, $127 million of losses from our TiO2 activities and $74 million of Corporate expenses including $1 million in restructuring costs. The improvement in results for our TiO2 activities was primarily due to the gross profit improvement noted above. Corporate expenses for the year ended December 31, 2016 decreased for the reasons noted above in the discussion of the SG&A expenses.
Interest and debt expense, net - See Note 15 of notes to consolidated financial statements.
Gain (loss) on debt extinguishment - See Note 15 of notes to consolidated financial statements.
Other expense, net in 2016 primarily consisted of a net realized and unrealized foreign currency loss of $31 million, offset by interest income of $3 million. Other income, net during 2015, primarily consisted of a net realized and unrealized foreign currency gain of $21 million and interest income of $7 million. The change in the net realized and unrealized foreign currency is primarily driven by the strengthening of the South African Rand as of December 31, 2016 used in the remeasurement of our U.S. dollar denominated open trade and notes receivable positions.
The effective tax rate in 2016 and 2015 differs from the Australian statutory rate of 30% primarily due to valuation allowances, income in foreign jurisdictions taxed at rates lower than 30%, and withholding tax accruals
42
on interest income. The net income impact of the Corporate Reorganization was a benefit of $137 million in the fourth quarter of 2016, reflecting the reversal of $139 million of withholding tax accruals, offset by a foreign currency loss of $2 million. For the year ended December 31, 2016, the net income impact was $107 million, reflecting a net reduction in withholding tax accruals of $110 million, offset by a foreign currency loss of $3 million.
Liquidity and Capital Resources
During 2017, our liquidity improved by $876 million to $1.4 billion.
The table below presents our liquidity as of the following dates:
|
|
December 31,
2017 |
December 31,
2016 |
||||
|
Cash and cash equivalents
|
$
|
1,116
|
|
$
|
248
|
|
|
Available under the Wells Fargo Revolver
|
|
232
|
|
|
—
|
|
|
Available under the UBS Revolver
|
|
—
|
|
|
190
|
|
|
Available under the ABSA Revolver
|
|
—
|
|
|
95
|
|
|
Available under the New ABSA Revolver
|
|
61
|
|
|
—
|
|
|
Total
|
$
|
1,409
|
|
$
|
533
|
|
Our New Term Loan Facility, defined below, consists of (i) a U.S. dollar term facility in an aggregate principal amount of $1.5 billion (the “New Term Loans”) and (ii) a U.S. dollar term facility in an aggregate principal amount of $650 million (the “Blocked Term Loan”) which was included in restricted cash as of December 31, 2017. In connection with the Cristal Transaction, we refinanced and increased our credit facilities lowering our cost of debt and extended the portfolio’s weighted average years to maturity. Additionally, we improved our mix of secured and unsecured debt and achieved more favorable covenants. See Note 15 of notes to consolidated financial statements. Historically, we have funded our operations and met our commitments through cash generated by operations. During 2012, 2015 and 2017, we issued a $900 million aggregate principal, 6.375% senior notes due 2020 at par value (the “Senior Notes due 2020”) which were redeemed during the third quarter of 2017, a $600 million aggregate principal, 7.50% senior notes due 2022 (the “Senior Notes due 2022”) and a $450 million aggregate principal, 5.75% senior notes due 2025 (the “Senior Notes due 2025”), respectively. Also, during 2013 and 2017 we obtained a $1.5 billion senior secured term loan (the “ Prior Term Loan”) which was repaid during the third quarter of 2017 and a $2.15 billion new senior secured first lien term loan facility (the “New Term Loan Facility”), respectively.
As of and for the year ended December 31, 2017, the non-guarantor subsidiaries of our Senior Notes due 2025 represented approximately 24% of our total consolidated liabilities, approximately 40% of our total consolidated assets, approximately 21% of our total consolidated net sales and approximately 36% of our Consolidated EBITDA (as such term is defined in the 2025 Indenture). In addition, as of December 31, 2017, our non-guarantor subsidiaries had $935 million of total consolidated liabilities (including trade payables but excluding intercompany liabilities), all of which would have been structurally senior to the 2025 Notes. See Note 15 of notes to consolidated financial statements for additional information.
At December 31, 2017, we had outstanding letters of credit, bank guarantees, and performance bonds, see Note 15 of notes to consolidated financial statements.
In the next twelve months, we expect that our operations and available borrowings under our debt refinancing and revolving credit agreements (see Note 15 of notes to consolidated financial statements) will provide sufficient cash to fund the Cristal Transaction, our operating expenses, capital expenditures, interest payments, debt repayments, and dividends. Working capital (calculated as current assets from continuing operations less current liabilities from continuing operations) was $2.3 billion at December 31, 2017, compared to $614 million at December 31, 2016, an increase of $1.7 billion, which is primarily due to proceeds from the sale of the Alkali business, debt refinancing and cash provided by continuing operations of $166 million, partially offset by dividends paid of $23 million and capital expenditures of $91 million.
Principal factors that could affect our ability to obtain cash from external sources include (i) debt covenants that limit our total borrowing capacity; (ii) increasing interest rates applicable to our floating rate debt;
43
(iii) increasing demands from third parties for financial assurance or credit enhancement; (iv) credit rating downgrades, which could limit our access to additional debt; (v) a decrease in the market price of our common stock and debt obligations; or (vi) volatility in public debt and equity markets.
As of December 31, 2017, our credit rating with Moody’s and Standard & Poor’s was B1 stable outlook and B stable outlook, respectively. On August 24, 2017, Standard & Poor’s upgraded our outlook to B stable outlook from B negative outlook. On September 7, 2017, Moody’s upgraded our corporate credit rating to B1 stable outlook from B2 negative outlook. At December 31, 2017, we have sufficient borrowings available and have no significant principal payments on debt due until 2022.
Cash and Cash Equivalents
We consider all investments with original maturities of three months or less to be cash equivalents. As of December 31, 2017, our cash and cash equivalents were primarily invested in money market funds. We maintain cash and cash equivalents in bank deposit and money market accounts that may exceed federally insured limits. The financial institutions where our cash and cash equivalents are held are generally highly rated and geographically dispersed, and we have a policy to limit the amount of credit exposure with any one institution. We have not experienced any losses in such accounts and believe we are not exposed to significant credit risk.
The use of our cash includes servicing our interest and debt repayment obligations, making pension contributions and making quarterly dividend payments.
Repatriation of Cash
At December 31, 2017, we held $1.8 billion in cash and cash equivalents and restricted cash in these respective jurisdictions: $42 million in Europe, $117 million in Australia, $110 million in South Africa, and $1.5 billion in the United States. Our credit facilities contain restrictions that limit our ability to move assets between guarantors and non-guarantors.
Tronox Limited has foreign subsidiaries with positive undistributed earnings at December 31, 2017. We have made no provision for deferred taxes related to these undistributed earnings because they are considered to be indefinitely reinvested in the foreign jurisdictions.
Cash Dividends on Class A and Class B Shares
During 2017, we declared and paid quarterly dividends to holders of our Class A ordinary shares (“Class A Shares”) and Class B ordinary shares (“Class B Shares”) as follows:
|
|
Q1 2017
|
Q2 2017
|
Q3 2017
|
Q4 2017
|
||||||||
|
Dividend per share
|
$
|
0.045
|
|
$
|
0.045
|
|
$
|
0.045
|
|
$
|
0.045
|
|
|
Total dividend
|
$
|
6
|
|
$
|
6
|
|
$
|
5
|
|
$
|
6
|
|
|
Record date (close of business)
|
March 6
|
May 15
|
August 21
|
November 20
|
||||||||
On February 20, 2018, the Board of Directors declared a quarterly dividend of $0.045 per share to holders of our Class A Shares and Class B Shares at the close of business on March 12, 2018, totaling $5 million, which will be paid on or before March 26, 2018.
Debt Obligations
At December 31, 2017 and 2016, our net debt (the excess of our debt over cash and cash equivalents) was $2.0 billion and $2.8 billion, respectively, excluding the $650 million of cash related to the Blocked Term Loan at December 31, 2017.
Our short-term debt at December 31, 2016 consisted of the UBS Revolver with an outstanding balance of $150 million. We repaid the $150 million outstanding balance of the UBS Revolver during the third quarter of 2017 (See Note 15 of notes to consolidated financial statements for additional information). The average effective interest rate of our UBS Revolver was 4.7% and 4.2% during 2017 and 2016, respectively. Our short-term debt at December 31, 2017 consisted of the Wells Fargo Revolver and the New ABSA Revolver with no outstanding balance.
44
Long-term debt, net of an unamortized discount and debt issuance costs, consisted of the following:
|
|
Original
Principal |
Annual
Interest Rate |
Maturity
Date |
December 31,
2017 |
December 31,
2016 |
||||||||||
|
Prior Term Loan, net of unamortized discount(1)
|
$
|
1,500
|
|
|
Variable
|
|
|
—
|
|
$
|
—
|
|
$
|
1,441
|
|
|
New Term Loan Facility, net of unamortized discount(2)
|
$
|
2,150
|
|
|
Variable
|
|
|
9/22/2024
|
|
|
2,138
|
|
|
—
|
|
|
Senior Notes due 2020
|
$
|
900
|
|
|
6.375
|
%
|
|
—
|
|
|
—
|
|
|
896
|
|
|
Senior Notes due 2022
|
$
|
600
|
|
|
7.50
|
%
|
|
3/15/2022
|
|
|
584
|
|
|
584
|
|
|
Senior Notes due 2025
|
$
|
450
|
|
|
5.75
|
%
|
|
9/22/2025
|
|
|
450
|
|
|
—
|
|
|
Lease financing
|
|
|
|
|
|
|
|
|
|
|
19
|
|
|
19
|
|
|
Long-term debt
|
|
|
|
|
|
|
|
|
|
|
3,191
|
|
|
2,940
|
|
|
Less: Long-term debt due within one year
|
|
|
|
|
|
|
|
|
|
|
(17
|
)
|
|
(16
|
)
|
|
Debt issuance costs
|
|
|
|
|
|
|
|
|
|
|
(44
|
)
|
|
(36
|
)
|
|
Long-term debt, net
|
|
|
|
|
|
|
|
|
|
$
|
3,130
|
|
$
|
2,888
|
|
| (1) | Average effective interest rate of 5.1% and 4.9% during 2017 and 2016, respectively. |
| (2) | Average effective interest rate of 4.9% during 2017 which includes the impact of the Blocked Term Loan. |
At December 31, 2017, we had no financial covenants in the Wells Fargo Revolver, the New ABSA Revolver and the New Term Loan Facility, however, only the New ABSA Revolver had a financial maintenance covenant that applies to local operations and only when the New ABSA Revolver is drawn upon. We were in compliance with all of our reporting covenants as of and for the year ended December 31, 2017. See Note 15 of notes to financial statements.
Cash Flows
Years Ended December 31, 2017 and 2016
The following table presents cash flow from continuing operations for the periods indicated:
|
|
Year Ended December 31,
|
|||||
|
2017
|
2016
|
|||||
|
(Millions of U.S. dollars)
|
||||||
|
Net cash provided by operating activities
|
$
|
166
|
|
$
|
86
|
|
|
Net cash provided by (used in) investing activities
|
|
583
|
|
|
(84
|
)
|
|
Net cash provided by (used in) financing activities
|
|
24
|
|
|
(78
|
)
|
|
Net cash provided by discontinued operations
|
|
82
|
|
|
93
|
|
|
Effect of exchange rate changes on cash
|
|
13
|
|
|
2
|
|
|
Net increase in cash and cash equivalents
|
$
|
868
|
|
$
|
19
|
|
|
Cash and cash equivalents — end of year
|
$
|
1,116
|
|
$
|
248
|
|
Cash Flows provided by Operating Activities - Net cash provided by operating activities during 2017 of $166 million increased by $80 million compared to 2016. This increase was primarily due to higher cash earnings in 2017, partially offset by higher working capital reductions in 2016.
Cash Flows provided by (used in) Investing Activities - Net cash flows provided by investing activities in 2017 was $583 million compared to cash used in investing activities of $84 million in 2016. The increase was primarily due to proceeds of $1.325 billion from the Alkali Sale, offset by the $650 million proceeds from the Blocked Term Loan, and related interest of $1 million, under the New Term Loan Facility, which is included in “Restricted cash” in the Consolidated Balance Sheets at December 31, 2017. Capital expenditures were $5 million higher in 2017 compared to 2016.
Cash Flows provided by (used in) Financing Activities - Net cash provided by financing activities during 2017 was primarily attributable to proceeds from long-term debt of $2.6 billion, partially offset by repayments of
45
short-term and long-term debt of $2.5 billion, debt issuance costs of $37 million and call premium of $14 million. In addition, in 2017, dividends paid were $23 million, restricted stock and performance-based shares settled in cash for taxes were $12 million and proceeds received from the exercise of warrants and options were $13 million. These compare to net cash used in financing activities during 2016 of $78 million, which was primarily attributable to dividends paid of $46 million and principal repayments on long-term debt of $31 million.
Years Ended December 31, 2016 and 2015
The following table presents cash flow from continuing operations for the periods indicated:
|
|
Year Ended December 31,
|
|||||
|
|
2016
|
2015
|
||||
|
|
(Millions of U.S. dollars)
|
|||||
|
Net cash provided by operating activities
|
$
|
86
|
|
$
|
67
|
|
|
Net cash used in investing activities
|
|
(84
|
)
|
|
(1,814
|
)
|
|
Net cash provided by (used in) financing activities
|
|
(78
|
)
|
|
602
|
|
|
Net cash provided by discontinued operations
|
|
93
|
|
|
124
|
|
|
Effect of exchange rate changes on cash
|
|
2
|
|
|
(26
|
)
|
|
Net increase (decrease) in cash and cash equivalents
|
$
|
19
|
|
$
|
(1,047
|
)
|
|
Cash and cash equivalents — end of year
|
$
|
248
|
|
$
|
229
|
|
Cash Flows provided by Operating Activities - Net cash provided by operating activities during 2016 of $86 million increased by $19 million compared to 2015. The increase was primarily due to higher cash earnings in 2016, partially offset by higher working capital reductions in 2015.
Cash Flows used in Investing Activities - Net cash used in investing activities in 2016 was $84 million compared to $1.814 billion in 2015. The decrease was primarily due to the acquisition of Alkali for $1.65 billion in 2015. Capital expenditures were $86 million and $165 million in 2016 and 2015, respectively. The reduction in capital spending was due to the completion of the new Fairbreeze mine in South Africa.
Cash Flows provided by (used in) Financing Activities - Net cash used in financing activities during 2016 was primarily attributable to dividends paid of $46 million and principal repayments on long-term debt of $31 million. This compares to net cash provided by financing activities during 2015 which was primarily attributable to cash received from the issuance of the Senior Notes due 2022 of $600 million and cash received on the drawdown of the UBS Revolver of $150 million, partially offset by dividends paid of $117 million, debt issuance costs paid of $15 million and principal repayments on long-term debt of $18 million.
Contractual Obligations
The following table sets forth information relating to our contractual obligations as of December 31, 2017:
|
|
Contractual Obligation Payments Due by Period(3)(4)
|
||||||||||||||
|
|
Total
|
Less than
1 year |
1-3
years |
3-5
years |
More than
5 years |
||||||||||
|
|
(Millions of U.S. dollars)
|
||||||||||||||
|
Long-term debt and lease financing (including interest)(1)
|
$
|
4,277
|
|
$
|
191
|
|
$
|
390
|
|
$
|
936
|
|
$
|
2,760
|
|
|
Purchase obligations(2)
|
|
408
|
|
|
149
|
|
|
98
|
|
|
58
|
|
|
103
|
|
|
Operating leases
|
|
44
|
|
|
19
|
|
|
12
|
|
|
7
|
|
|
6
|
|
|
Asset retirement obligations
|
|
82
|
|
|
3
|
|
|
6
|
|
|
5
|
|
|
68
|
|
|
Total
|
$
|
4,811
|
|
$
|
362
|
|
$
|
506
|
|
$
|
1,006
|
|
$
|
2,937
|
|
| (1) | We calculated the Term Loan interest at a base rate of 1.7% plus a margin of 3.0%. See Note 15 of notes to our consolidated financial statements. |
| (2) | Includes obligations to purchase requirements of process chemicals, supplies, utilities and services. We have various purchase commitments for materials, supplies, and services entered into in the ordinary course of business. Included in the purchase commitments table above are contracts, which require minimum volume purchases that extend beyond one year or are renewable annually and have been renewed for 2018. Certain contracts allow for changes in minimum required purchase volumes in the event of a temporary or permanent shutdown of a facility. We believe that all of our purchase obligations will be utilized in our normal operations. |
46
| (3) | The table excludes contingent obligations, as well as any possible payments for uncertain tax positions given the inability to estimate the possible amounts and timing of any such payments. |
| (4) | The table excludes commitments pertaining to our pension and other postretirement obligations. |
Non-U.S. GAAP Financial Measures
EBITDA and Adjusted EBITDA, which are used by management to measure performance, are not presented in accordance with U.S. GAAP. Management believes that EBITDA is useful to investors, as it is commonly used in the industry as a means of evaluating operating performance. We do not intend for these non-U.S GAAP financial measures to be a substitute for any U.S. GAAP financial information. Readers of these statements should use these non-U.S. GAAP financial measures only in conjunction with the comparable U.S. GAAP financial measures. Since other companies may calculate EBITDA and Adjusted EBITDA differently than we do, EBITDA and Adjusted EBITDA, as presented herein, may not be comparable to similarly titled measures reported by other companies.
Management believes these non-U.S. GAAP financial measures:
| • | Reflect our ongoing business in a manner that allows for meaningful period-to-period comparison and analysis of trends in our business, as they exclude income and expense that are not reflective of ongoing operating results; |
| • | Provide useful information in understanding and evaluating our operating results and comparing financial results across periods; |
| • | Provide a normalized view of our operating performance by excluding items that are either noncash or infrequently occurring in nature; and |
| • | Assist investors in assessing our compliance with financial covenants under our debt instruments. |
Adjusted EBITDA is one of the primary measures management uses for planning and budgeting processes, and to monitor and evaluate financial and operating results. In addition, Adjusted EBITDA is a factor in evaluating management’s performance when determining incentive compensation.
The following table reconciles net income (loss) to EBITDA and Adjusted EBITDA for the periods presented:
|
|
Year Ended December 31,
|
||||||||
|
|
2017
|
2016
|
2015
|
||||||
|
Net income (loss), (U.S. GAAP)
|
$
|
(272
|
)
|
$
|
(60
|
)
|
$
|
(317
|
)
|
|
Income (loss) from discontinued operations, net of tax (see Note 3), (U.S. GAAP)
|
|
(179
|
)
|
|
79
|
|
|
55
|
|
|
Net income (loss) from continuing operations, (U.S. GAAP)
|
|
(93
|
)
|
|
(139
|
)
|
|
(372
|
)
|
|
Interest and debt expense, net
|
|
188
|
|
|
185
|
|
|
176
|
|
|
Interest income
|
|
(10
|
)
|
|
(3
|
)
|
|
(7
|
)
|
|
Income tax provision (benefit)
|
|
6
|
|
|
(125
|
)
|
|
23
|
|
|
Depreciation, depletion and amortization expense
|
|
182
|
|
|
177
|
|
|
253
|
|
|
EBITDA (non-U.S. GAAP)
|
|
273
|
|
|
95
|
|
|
73
|
|
|
Transaction costs(a)
|
|
48
|
|
|
—
|
|
|
29
|
|
|
Share-based compensation(b)
|
|
31
|
|
|
24
|
|
|
22
|
|
|
Restructuring (income) expense(c)
|
|
(1
|
)
|
|
1
|
|
|
21
|
|
|
(Gain) loss on extinguishment of debt(d)
|
|
28
|
|
|
(4
|
)
|
|
—
|
|
|
Foreign currency remeasurement (gain) loss(e)
|
|
25
|
|
|
32
|
|
|
(20
|
)
|
|
Other items(f)
|
|
16
|
|
|
18
|
|
|
14
|
|
|
Adjusted EBITDA (non-U.S. GAAP)(g)
|
$
|
420
|
|
$
|
166
|
|
$
|
139
|
|
| (a) | Represents transaction costs associated with the Cristal Transaction which were recorded in “Selling, general and administrative expenses” in the Consolidated Statements of Operations. During 2015, the $29 million of transaction costs were associated with the one-time non-operating items and the effect of the Alkali acquisition which is included in “Selling, general and administrative expenses” in the Consolidated Statements of Operations. |
47
| (b) | Represents non-cash share-based compensation. See Note 19 of notes to Consolidated Financial Statements for additional information. |
| (c) | Represents severance and other costs associated with the shutdown of our sodium chlorate plant, and other global restructuring efforts, which was recorded in “Restructuring income (expense)” in the Consolidated Statements of Operations. See Note 4 of notes to Consolidated Financial Statements. |
| (d) | Represents $28 million of loss, which includes a $22 million loss associated with the redemption of the outstanding balance of the Senior Notes due 2020, $1 million of unamortized original debt issuance costs from the repayment of the UBS Revolver, and $5 million of debt issuance costs from the refinancing activities associated with the term loans. During 2016, the $4 million gain was associated with the repurchase of $20 million face value of our Senior Notes due 2020 and Senior Notes 2022, which was recorded in “Gain (loss) on extinguishment of debt” in the Consolidated Statements of Operations. See Note 15 of notes to Consolidated Financial Statements. |
| (e) | Represents foreign currency remeasurement, which is included in “Other income (expense), net” in the Consolidated Statements of Operations. |
| (f) | Includes noncash pension and postretirement costs, severance expense, adjustment of transfer tax related to the Exxaro Transaction, insurance settlement gain and other items included in “Selling general and administrative expenses” and “Cost of goods sold” in the Consolidated Statements of Operations. |
| (g) | No income tax impact given full valuation allowance except for South Africa related restructuring costs. See Note 6 of notes to Consolidated Financial Statements for additional information. |
The following table reconciles net income (loss) from continuing operations, our comparable measure for segment reporting under U.S. GAAP, to Adjusted EBITDA by segment for the periods presented:
|
|
Year Ended December 31,
|
||||||||
|
|
2017
|
2016
|
2015
|
||||||
|
TiO2 segment
|
$
|
261
|
|
$
|
6
|
|
$
|
(127
|
)
|
|
Corporate
|
|
(123
|
)
|
|
(62
|
)
|
|
(74
|
)
|
|
Income (loss) from operations (U.S. GAAP)
|
|
138
|
|
|
(56
|
)
|
|
(201
|
)
|
|
TiO2 segment
|
|
177
|
|
|
171
|
|
|
247
|
|
|
Corporate
|
|
5
|
|
|
6
|
|
|
6
|
|
|
Depreciation, depletion and amortization expense
|
|
182
|
|
|
177
|
|
|
253
|
|
|
TiO2 segment
|
|
62
|
|
|
59
|
|
|
92
|
|
|
Corporate
|
|
38
|
|
|
(14
|
)
|
|
(5
|
)
|
|
Other
|
|
100
|
|
|
45
|
|
|
87
|
|
|
TiO2 segment
|
|
500
|
|
|
236
|
|
|
212
|
|
|
Corporate
|
|
(80
|
)
|
|
(70
|
)
|
|
(73
|
)
|
|
Adjusted EBITDA (non-U.S. GAAP)
|
$
|
420
|
|
$
|
166
|
|
$
|
139
|
|
Critical Accounting Policies and Estimates
The preparation of financial statements in conformity with U.S. GAAP requires management to make certain estimates and assumptions regarding matters that are inherently uncertain and that ultimately affect the reported amounts of assets, liabilities, revenues and expenses, and the disclosure of contingent assets and liabilities. The estimates and assumptions are based on management’s experience and understanding of current facts and circumstances. These estimates may differ from actual results. Certain of our accounting policies are considered critical, as they are both important to reflect our financial position and results of operations and require significant or complex judgment on the part of management. The following is a summary of certain accounting policies considered critical by management.
Inventories, net
Pigment inventories are stated at the lower of actual cost or net realizable value, net of allowances for obsolete and slow-moving inventory. The cost of finished goods pigment inventories is determined using the first-in, first-out method. Carrying values include material costs, labor, and associated indirect manufacturing expenses. Costs for materials and supplies, excluding ore, are determined by average cost to acquire. Raw materials are carried at actual cost. Mineral Sands inventories are stated at the lower of the weighted-average cost of production or market. We periodically review the cost of our inventory in comparison to its net realizable value. We also periodically review our inventory for obsolescence (inventory that is no longer marketable for its intended use). In either case, we record any write-down equal to the difference between the cost of inventory and its estimated net realizable value based on assumptions about alternative uses, market conditions and other
48
factors. Inventories expected to be sold or consumed within twelve months after the balance sheet date are classified as current assets and all other inventories are classified as non-current assets.
Business Combinations
Business acquisitions are accounted for using the acquisition method under Accounting Standards Codification (“ASC”) 805, Business Combinations, which requires recording assets acquired and liabilities assumed at fair value as of the acquisition date. Under the acquisition method of accounting, each tangible and separately identifiable intangible asset acquired and liability assumed is recorded based on their estimated fair values on the acquisition date. Acquisition related costs are expensed as incurred and are included in “Selling, general and administrative expenses” in the Consolidated Statements of Operations.
Long-Lived Assets
Key estimates related to long-lived assets (property, plant and equipment, mineral leaseholds, and intangible assets) include useful lives, recoverability of carrying values, and the existence of any retirement obligations. As a result of future decisions, such estimates could be significantly modified. The estimated useful lives of property, plant and equipment range from three to forty years, and depreciation is recognized on a straight-line basis. Useful lives are estimated based upon our historical experience, engineering estimates, and industry information. These estimates include an assumption regarding periodic maintenance and an appropriate level of annual capital expenditures to maintain the assets. Mineral leaseholds are depreciated over their useful lives as determined under the units of production method. Intangible assets with finite useful lives are amortized on the straight-line basis over their estimated useful lives. The amortization methods and remaining useful lives are reviewed quarterly.
We evaluate the recoverability of the carrying value of long-lived assets that are held and used whenever events or changes in circumstances indicate that the carrying value may not be recoverable. Under such circumstances, we assess whether the projected undiscounted cash flows of our long-lived assets are sufficient to recover the carrying amount of the asset group being assessed. If the undiscounted projected cash flows are not sufficient, we calculate the impairment amount by discounting the projected cash flows using our weighted-average cost of capital. For assets that satisfy the criteria to be classified as held for sale, an impairment loss, if any, is recognized to the extent the carrying amount exceeds fair value, less cost to sell. The amount of the impairment of long-lived assets is written off against earnings in the period in which the impairment is determined.
Asset Retirement Obligations
To the extent a legal obligation exists, an asset retirement obligation (“ARO”) is recorded at its estimated fair value and accretion expense is recognized over time as the discounted liability is accreted to its expected settlement value. Fair value is measured using expected future cash outflows discounted at our credit-adjusted risk-free interest rate. No market-risk premium has been included in our calculation of ARO balances since we can make no reliable estimate. Our consolidated financial statements classify accretion expense related to asset retirement obligations as a production cost, which is included in “Cost of goods sold” in the Consolidated Statements of Operations.
We used the following assumptions in determining asset retirement obligations at December 31, 2017: inflation rates between 2.5% - 4.2% per year; credit adjusted risk-free interest rates between 7.0% - 17.1%; the life of mines between 12 - 27 years and the useful life of assets of between 5 - 33 years.
Income Taxes
We have operations in several countries around the world and are subject to income and similar taxes in these countries. The estimation of the amounts of income tax involves the interpretation of complex tax laws and regulations and how foreign taxes affect domestic taxes, as well as the analysis of the realizability of deferred tax assets, tax audit findings and uncertain tax positions. Although we believe our tax accruals are adequate, differences may occur in the future, depending on the resolution of pending and new tax matters.
Deferred tax assets and liabilities are determined based on temporary differences between the financial reporting and tax bases of assets and liabilities using enacted tax rates expected to apply to taxable income in the
49
years in which those temporary differences are expected to be recovered or settled. A valuation allowance is provided against a deferred tax asset when it is more likely than not that all or some portion of the deferred tax asset will not be realized. We periodically assess the likelihood that we will be able to recover our deferred tax assets, and reflect any changes in our estimates in the valuation allowance, with a corresponding adjustment to earnings or other comprehensive income (loss) as appropriate. ASC 740, Income Taxes, requires that all available positive and negative evidence be weighted to determine whether a valuation allowance should be recorded.
The amount of income taxes we pay are subject to ongoing audits by federal, state and foreign tax authorities, which may result in proposed assessments. Our estimate for the potential outcome for any uncertain tax issue is highly judgmental. We assess our income tax positions, and record tax benefits for all years subject to examination based upon our evaluation of the facts, circumstances and information available at the reporting date. For those tax positions for which it is more likely than not that a tax benefit will be sustained, we record the amount that has a greater than 50% likelihood of being realized upon settlement with a taxing authority that has full knowledge of all relevant information. Interest and penalties are accrued as part of tax expense, where applicable. If we do not believe that it is more likely than not that a tax benefit will be sustained, no tax benefit is recognized.
Pension and Postretirement Benefits
We provide pension and postretirement healthcare benefits for qualifying employees worldwide. These plans are accounted for and disclosed in accordance with ASC 715, Compensation — Retirement Benefits.
Expected Return on Plan Assets - In forming the assumption of the U.S. long-term rate of return on plan assets, we took into account the expected earnings on funds already invested, earnings on contributions expected to be received in the current year, and earnings on reinvested returns. The long-term rate of return estimation methodology for U.S. plans is based on a capital asset pricing model using historical data and a forecasted earnings model. An expected return on plan assets analysis is performed which incorporates the current portfolio allocation, historical asset-class returns, and an assessment of expected future performance using asset-class risk factors. Our assumption of the long-term rate of return for the Netherlands Plan was developed considering the portfolio mix and country-specific economic data that includes the rates of return on local government and corporate bonds.
Discount Rate - The discount rates selected for estimation of the actuarial present value of the benefit obligations of the U.S. Qualified Plan were 3.71% and 4.25% at December 31, 2017 and 2016, respectively. The 2017 and 2016 rates were selected based on the results of a cash flow matching analysis, which projected the expected cash flows of the plans using a yield curves model developed from a universe of Aa-graded U.S. currency corporate bonds (obtained from Bloomberg) with at least $50 million outstanding. Bonds with features that imply unreliable pricing, a less than certain cash flow, or other indicators of optionality are filtered out of the universe. The remaining universe is categorized into maturity groups, and within each of the maturity groups yields are ranked into percentiles.
The discount rates selected for estimating the actuarial present value of the benefit obligations of the Netherlands Plan was 1.50% as of November 1, 2016. This rate was based on the long-term Euro corporate bond index rates that correlate with anticipated cash flows associated with future benefit payments.
Recent Accounting Pronouncements
See Note 2 of notes to Consolidated Financial Statements for recently issued accounting pronouncements.
Environmental Matters
We are subject to a broad array of international, federal, state, and local laws and regulations relating to safety, pollution, protection of the environment, and the generation, storage, handling, transportation, treatment, disposal, and remediation of hazardous substances and waste materials. In the ordinary course of business, we are subject to frequent environmental inspections and monitoring, and occasional investigations by governmental enforcement authorities. Under these laws, we are or may be required to obtain or maintain permits or licenses in connection with our operations. In addition, under these laws, we are or may be required to remove or mitigate the effects on the environment of the disposal or release of chemical, petroleum, low-level radioactive and other substances at our facilities. We may incur future costs for capital improvements and general compliance under
50
environmental, health, and safety laws, including costs to acquire, maintain, and repair pollution control equipment. Environmental laws and regulations are becoming increasingly stringent, and compliance costs are significant and will continue to be significant in the foreseeable future. There can be no assurance that such laws and regulations or any environmental law or regulation enacted in the future is not likely to have a material effect on our business. We believe we are in compliance with applicable environmental rules and regulations in all material respects.
| Item 7A. | Quantitative and Qualitative Disclosures About Market Risk |
We are exposed to various market, credit, operational, and liquidity risks in the normal course of business, which are discussed below. We manage these risks through normal operating and financing activities and, when appropriate, with derivative instruments. We do not invest in derivative instruments for speculative purposes, but historically have entered into, and may enter into, derivative instruments for hedging purposes in order to reduce the exposure to fluctuations in interest rates, natural gas prices and exchange rates.
Market Risk
A substantial portion of our products and raw materials are commodities that reprice as market supply and demand fundamentals change. Accordingly, product margins and the level of our profitability tend to vary with changes in the business cycle. Our TiO2 prices may do so in the near term as ore prices and pigment prices are expected to fluctuate over the next few years. We try to protect against such instability through various business strategies. These include provisions in sales contracts allowing us to pass on higher raw material costs through timely price increases and formula price contracts to transfer or share commodity price risk, as well as using varying contract term lengths and selling to a diverse mix of customers by geography and industry to reap the benefits of a diverse portfolio.
Credit Risk
Credit risk is the risk that a borrower or a counterparty will fail to meet their obligations. A significant portion of our liquidity is concentrated in trade accounts receivable that arise from sales of our products to customers. In the case of TiO2, the high level of industry concentration has the potential to impact our overall exposure to credit risk, either positively or negatively, in that our customers may be similarly affected by changes in economic, industry or other conditions. We have significant exposure to credit risk in industries that are affected by cyclical economic fluctuations such as mining. We perform ongoing credit evaluations of our customers and use credit risk insurance policies from time to time, as deemed appropriate, to mitigate credit risk but generally do not require collateral. Our contracts typically enable us to tighten credit terms if we perceive additional credit risk and historic losses due to write offs of bad debt have been relatively low. In addition, due to our international operations in our TiO2 segment, we are subject to potential trade restrictions and sovereign risk in certain countries in which we operate. We maintain allowances for potential credit losses based on specific customer review and current financial conditions. During 2017, 2016 and 2015, our ten largest third-party TiO2 customers represented 35%, 36% and 40%, respectively, of our consolidated net sales. During 2017, no single customer accounted for 10% of our consolidated net sales. During both 2016 and 2015, one pigment customer accounted for 10% of our consolidated net sales.
Interest Rate Risk
Interest rate risk arises from the probability that changes in interest rates will impact our financial results. Our exposure to interest rate risk is associated with our $2.15 billion of floating rate New Term Loan Facility. Using a sensitivity analysis as of December 31, 2017, a hypothetical 1% increase in interest rates would result in an increase to pre-tax loss of approximately $4 million on an annualized basis. This is due to the fact that earnings on our floating rate financial assets of $1.8 billion at December 31, 2017 would increase by the full 1%, offsetting the impact of a 1% increase in interest expense on our $2.15 billion New Term Loan Facility balance.
Currency Risk
Currency risk arises from the possibility that fluctuations in foreign exchange rates will impact the value of our assets and liabilities denominated in foreign currencies, as well as our earnings due to the translation of our balance sheets and remeasurement of our statements of operations from local currencies to U.S. dollars. We
51
manufacture and market our products in a number of countries throughout the world and, as a result, are exposed to changes in foreign currency exchange rates, particularly in Australia, South Africa, and the Netherlands. The exposure is more prevalent in South Africa and Australia as the majority of revenues are earned in U.S. dollars while expenses are primarily incurred in local currencies. Since we are exposed to movements in the South African Rand and the Australian Dollar versus the U.S. dollar, we may enter into forward contracts to buy and sell foreign currencies as “economic hedges” for these foreign currency transactions.
52
| Item 8. | Financial Statements and Supplementary Data |
|
|
Page No.
|
||
|
Tronox Limited Audited Annual Financial Statements
|
|
|
|
|
|
|
||
|
|
|
||
|
|
|
||
|
|
|
||
|
|
|
||
|
|
|
||
|
|
|
||
53
Report of Independent Registered Public Accounting Firm
To the Board of Directors and Shareholders of Tronox Limited
Opinions on the Financial Statements and Internal Control over Financial Reporting
We have audited the accompanying consolidated balance sheets of Tronox Limited and its subsidiaries as of December 31, 2017 and 2016 and the related consolidated statements of operations, comprehensive income (loss), changes in shareholders’ equity, and cash flows for each of the three years in the period ended December 31, 2017, including the related notes (collectively referred to as the “consolidated financial statements”). We also have audited the Company’s internal control over financial reporting as of December 31, 2017, based on criteria established in Internal Control – Integrated Framework (2013) issued by the Committee of Sponsoring Organizations of the Treadway Commission (COSO).
In our opinion, the consolidated financial statements referred to above present fairly, in all material respects, the financial position of the Company as of December 31, 2017 and 2016, and the results of their operations and their cash flows for each of the three years in the period ended December 31, 2017 in conformity with accounting principles generally accepted in the United States of America. Also in our opinion, the Company maintained, in all material respects, effective internal control over financial reporting as of December 31, 2017, based on criteria established in Internal Control - Integrated Framework (2013) issued by the COSO.
Basis for Opinions
The Company's management is responsible for these consolidated financial statements, for maintaining effective internal control over financial reporting, and for its assessment of the effectiveness of internal control over financial reporting, included in Management’s Report on Internal Controls over Financial Reporting appearing under Item 9A. Our responsibility is to express opinions on the Company’s consolidated financial statements and on the Company's internal control over financial reporting based on our audits. We are a public accounting firm registered with the Public Company Accounting Oversight Board (United States) (“PCAOB”) and are required to be independent with respect to the Company in accordance with the U.S. federal securities laws and the applicable rules and regulations of the Securities and Exchange Commission and the PCAOB.
We conducted our audits in accordance with the standards of the PCAOB. Those standards require that we plan and perform the audits to obtain reasonable assurance about whether the consolidated financial statements are free of material misstatement, whether due to error or fraud, and whether effective internal control over financial reporting was maintained in all material respects.
Our audits of the consolidated financial statements included performing procedures to assess the risks of material misstatement of the consolidated financial statements, whether due to error or fraud, and performing procedures that respond to those risks. Such procedures included examining, on a test basis, evidence regarding the amounts and disclosures in the consolidated financial statements. Our audits also included evaluating the accounting principles used and significant estimates made by management, as well as evaluating the overall presentation of the consolidated financial statements. Our audit of internal control over financial reporting included obtaining an understanding of internal control over financial reporting, assessing the risk that a material weakness exists, and testing and evaluating the design and operating effectiveness of internal control based on the assessed risk. Our audits also included performing such other procedures as we considered necessary in the circumstances. We believe that our audits provide a reasonable basis for our opinions.
54
Definition and Limitations of Internal Control over Financial Reporting
A company’s internal control over financial reporting is a process designed to provide reasonable assurance regarding the reliability of financial reporting and the preparation of financial statements for external purposes in accordance with generally accepted accounting principles. A company’s internal control over financial reporting includes those policies and procedures that (i) pertain to the maintenance of records that, in reasonable detail, accurately and fairly reflect the transactions and dispositions of the assets of the company; (ii) provide reasonable assurance that transactions are recorded as necessary to permit preparation of financial statements in accordance with generally accepted accounting principles, and that receipts and expenditures of the company are being made only in accordance with authorizations of management and directors of the company; and (iii) provide reasonable assurance regarding prevention or timely detection of unauthorized acquisition, use, or disposition of the company’s assets that could have a material effect on the financial statements.
Because of its inherent limitations, internal control over financial reporting may not prevent or detect misstatements. Also, projections of any evaluation of effectiveness to future periods are subject to the risk that controls may become inadequate because of changes in conditions, or that the degree of compliance with the policies or procedures may deteriorate.
/s/ PricewaterhouseCoopers LLP
Stamford, Connecticut
March 1, 2018
We have served as the Company’s auditor since 2014.
55
TRONOX LIMITED
CONSOLIDATED STATEMENTS OF OPERATIONS
(Millions of U.S. dollars, except share and per share data)
|
|
Year Ended December 31,
|
||||||||
|
|
2017
|
2016
|
2015
|
||||||
|
Net sales
|
$
|
1,698
|
|
$
|
1,309
|
|
$
|
1,510
|
|
|
Cost of goods sold
|
|
1,310
|
|
|
1,175
|
|
|
1,491
|
|
|
|
|
|
|
|
|
|
|
|
|
|
Gross profit
|
|
388
|
|
|
134
|
|
|
19
|
|
|
Selling, general and administrative expenses
|
|
(251
|
)
|
|
(189
|
)
|
|
(199
|
)
|
|
Restructuring income (expense)
|
|
1
|
|
|
(1
|
)
|
|
(21
|
)
|
|
|
|
|
|
|
|
|
|
|
|
|
Income (loss) from operations
|
|
138
|
|
|
(56
|
)
|
|
(201
|
)
|
|
Interest and debt expense, net
|
|
(188
|
)
|
|
(185
|
)
|
|
(176
|
)
|
|
Gain (loss) on extinguishment of debt
|
|
(28
|
)
|
|
4
|
|
|
—
|
|
|
Other income (expense), net
|
|
(9
|
)
|
|
(27
|
)
|
|
28
|
|
|
|
|
|
|
|
|
|
|
|
|
|
Income (loss) from continuing operations before income taxes
|
|
(87
|
)
|
|
(264
|
)
|
|
(349
|
)
|
|
Income tax (provision) benefit
|
|
(6
|
)
|
|
125
|
|
|
(23
|
)
|
|
|
|
|
|
|
|
|
|
|
|
|
Net income (loss) from continuing operations
|
|
(93
|
)
|
|
(139
|
)
|
|
(372
|
)
|
|
Net income (loss) from discontinued operations, net of tax
|
|
(179
|
)
|
|
79
|
|
|
55
|
|
|
Net income (loss)
|
|
(272
|
)
|
|
(60
|
)
|
|
(317
|
)
|
|
Net income (loss) attributable to noncontrolling interest
|
|
13
|
|
|
1
|
|
|
12
|
|
|
|
|
|
|
|
|
|
|
|
|
|
Net income (loss) attributable to Tronox Limited
|
$
|
(285
|
)
|
$
|
(61
|
)
|
$
|
(329
|
)
|
|
|
|
|
|
|
|
|
|
|
|
|
Net income (loss) per share, basic and diluted:
|
|
|
|
|
|
|
|
|
|
|
Continuing operations
|
|
(0.89
|
)
|
|
(1.20
|
)
|
|
(3.31
|
)
|
|
Discontinued operations
|
|
(1.50
|
)
|
|
0.68
|
|
|
0.47
|
|
|
Net income (loss) per share, basic and diluted
|
$
|
(2.39
|
)
|
$
|
(0.52
|
)
|
$
|
(2.84
|
)
|
|
|
|
|
|
|
|
|
|
|
|
|
Weighted average shares outstanding, basic and diluted (in thousands)
|
|
119,502
|
|
|
116,161
|
|
|
115,566
|
|
See notes to consolidated financial statements.
56
TRONOX LIMITED
CONSOLIDATED STATEMENTS OF COMPREHENSIVE INCOME (LOSS)
(Millions of U.S. dollars)
|
|
Year Ended December 31,
|
||||||||
|
|
2017
|
2016
|
2015
|
||||||
|
Net income (loss)
|
$
|
(272
|
)
|
$
|
(60
|
)
|
$
|
(317
|
)
|
|
Other comprehensive income (loss):
|
|
|
|
|
|
|
|
|
|
|
Foreign currency translation adjustments
|
|
125
|
|
|
119
|
|
|
(292
|
)
|
|
Pension and postretirement plans:
|
|
|
|
|
|
|
|
|
|
|
Actuarial gains (losses), net of taxes of less than $1 million in 2017, 2016, and 2015
|
|
(6
|
)
|
|
(18
|
)
|
|
12
|
|
|
Amortization of unrecognized actuarial losses, net of taxes of less than $1 million in 2017, 2016 and 2015
|
|
3
|
|
|
2
|
|
|
3
|
|
|
Removal of Alkali qualified plan actuarial losses due to Sale
|
|
5
|
|
|
—
|
|
|
—
|
|
|
Prior service credit (no tax impact, see Note 6)
|
|
—
|
|
|
(4
|
)
|
|
—
|
|
|
Pension and postretirement benefit curtailments gain (loss) (no tax impact, see Note 6)
|
|
—
|
|
|
(1
|
)
|
|
—
|
|
|
Settlement gain on the Netherlands Pension Plan, (no tax impact; See Note 6)
|
|
—
|
|
|
31
|
|
|
—
|
|
|
Unrealized gains (losses) on derivative financial instruments, (no tax impact; See Note 6)
|
|
(4
|
)
|
|
3
|
|
|
—
|
|
|
|
|
|
|
|
|
|
|
|
|
|
Other comprehensive income (loss)
|
|
123
|
|
|
132
|
|
|
(277
|
)
|
|
|
|
|
|
|
|
|
|
|
|
|
Total comprehensive income (loss)
|
$
|
(149
|
)
|
$
|
72
|
|
$
|
(594
|
)
|
|
|
|
|
|
|
|
|
|
|
|
|
Comprehensive income (loss) attributable to noncontrolling interest:
|
|
|
|
|
|
|
|
|
|
|
Net income
|
|
13
|
|
|
1
|
|
|
12
|
|
|
Foreign currency translation adjustments
|
|
29
|
|
|
31
|
|
|
(77
|
)
|
|
|
|
|
|
|
|
|
|
|
|
|
Comprehensive income (loss) attributable to noncontrolling interest
|
|
42
|
|
|
32
|
|
|
(65
|
)
|
|
|
|
|
|
|
|
|
|
|
|
|
Comprehensive income (loss) attributable to Tronox Limited
|
$
|
(191
|
)
|
$
|
40
|
|
$
|
(529
|
)
|
See notes to consolidated financial statements.
57
TRONOX LIMITED
CONSOLIDATED BALANCE SHEETS
(Millions of U.S. dollars, except share and per share data)
|
|
December 31,
|
|||||
|
|
2017
|
2016
|
||||
|
ASSETS
|
|
|
|
|
|
|
|
Current Assets
|
|
|
|
|
|
|
|
Cash and cash equivalents
|
$
|
1,116
|
|
$
|
248
|
|
|
Restricted cash
|
|
653
|
|
|
3
|
|
|
Accounts receivable, net of allowance for doubtful accounts
|
|
336
|
|
|
278
|
|
|
Inventories, net
|
|
473
|
|
|
499
|
|
|
Prepaid and other assets
|
|
53
|
|
|
28
|
|
|
Income taxes receivable
|
|
8
|
|
|
11
|
|
|
Total assets of discontinued operations
|
|
—
|
|
|
1,671
|
|
|
Total current assets
|
|
2,639
|
|
|
2,738
|
|
|
Noncurrent Assets
|
|
|
|
|
|
|
|
Property, plant and equipment, net
|
|
1,115
|
|
|
1,092
|
|
|
Mineral leaseholds, net
|
|
885
|
|
|
877
|
|
|
Intangible assets, net
|
|
198
|
|
|
223
|
|
|
Inventories, net
|
|
3
|
|
|
14
|
|
|
Other long-term assets
|
|
24
|
|
|
20
|
|
|
Total assets
|
$
|
4,864
|
|
$
|
4,964
|
|
|
|
|
|
|
|
|
|
|
LIABILITIES AND EQUITY
|
|
|
|
|
|
|
|
Current Liabilities
|
|
|
|
|
|
|
|
Accounts payable
|
$
|
165
|
|
$
|
136
|
|
|
Accrued liabilities
|
|
163
|
|
|
150
|
|
|
Short-term debt
|
|
—
|
|
|
150
|
|
|
Long-term debt due within one year
|
|
17
|
|
|
16
|
|
|
Income taxes payable
|
|
3
|
|
|
1
|
|
|
Total liabilities of discontinued operations
|
|
—
|
|
|
111
|
|
|
Total current liabilities
|
|
348
|
|
|
564
|
|
|
Noncurrent Liabilities
|
|
|
|
|
|
|
|
Long-term debt, net
|
|
3,130
|
|
|
2,888
|
|
|
Pension and postretirement healthcare benefits
|
|
103
|
|
|
115
|
|
|
Asset retirement obligations
|
|
79
|
|
|
73
|
|
|
Long-term deferred tax liabilities
|
|
171
|
|
|
151
|
|
|
Other long-term liabilities
|
|
18
|
|
|
20
|
|
|
Total liabilities
|
|
3,849
|
|
|
3,811
|
|
|
|
|
|
|
|
|
|
|
Commitments and Contingencies
|
|
|
|
|
|
|
|
Shareholders’ Equity
|
|
|
|
|
|
|
|
Tronox Limited Class A ordinary shares, par value $0.01 — 92,717,935 shares issued and 92,541,463 shares outstanding at December 31, 2017 and 65,998,306 shares issued and 65,165,672 shares outstanding at December 31, 2016
|
|
1
|
|
|
1
|
|
|
Tronox Limited Class B ordinary shares, par value $0.01 — 28,729,280 and 51,154,280 shares issued and outstanding at December 31, 2017 and 2016, respectively
|
|
—
|
|
|
—
|
|
|
Capital in excess of par value
|
|
1,558
|
|
|
1,524
|
|
|
Accumulated deficit
|
|
(327
|
)
|
|
(19
|
)
|
|
Accumulated other comprehensive loss
|
|
(403
|
)
|
|
(497
|
)
|
|
Total Tronox Limited shareholders’ equity
|
|
829
|
|
|
1,009
|
|
|
Noncontrolling interest
|
|
186
|
|
|
144
|
|
|
Total equity
|
|
1,015
|
|
|
1,153
|
|
|
Total liabilities and equity
|
$
|
4,864
|
|
$
|
4,964
|
|
See notes to consolidated financial statements.
58
TRONOX LIMITED
CONSOLIDATED STATEMENTS OF CASH FLOWS
(Millions of U.S. dollars)
|
|
Year Ended December 31,
|
||||||||
|
|
2017
|
2016
|
2015
|
||||||
|
Cash Flows from Operating Activities:
|
|
|
|
|
|
|
|
|
|
|
Net income (loss)
|
$
|
(272
|
)
|
$
|
(60
|
)
|
$
|
(317
|
)
|
|
Net income (loss) from discontinued operations, net of tax
|
|
(179
|
)
|
|
79
|
|
|
55
|
|
|
Net income (loss) from continuing operations
|
|
(93
|
)
|
|
(139
|
)
|
|
(372
|
)
|
|
Adjustments to reconcile net loss from continuing operations to net cash provided by operating activities, continuing operations:
|
|
|
|
|
|
|
|
|
|
|
Depreciation, depletion and amortization
|
|
182
|
|
|
177
|
|
|
253
|
|
|
Corporate Reorganization
|
|
—
|
|
|
(107
|
)
|
|
—
|
|
|
Deferred income taxes
|
|
2
|
|
|
(9
|
)
|
|
(1
|
)
|
|
Share-based compensation expense
|
|
31
|
|
|
24
|
|
|
22
|
|
|
Amortization of deferred debt issuance costs and discount on debt
|
|
15
|
|
|
11
|
|
|
11
|
|
|
Pension and postretirement healthcare benefit (income) expense
|
|
3
|
|
|
2
|
|
|
1
|
|
|
(Gain) loss on extinguishment of debt
|
|
28
|
|
|
(4
|
)
|
|
—
|
|
|
Other, net
|
|
37
|
|
|
50
|
|
|
(3
|
)
|
|
Contributions to employee pension and postretirement plans
|
|
(23
|
)
|
|
(19
|
)
|
|
(15
|
)
|
|
Changes in assets and liabilities:
|
|
|
|
|
|
|
|
|
|
|
(Increase) decrease in accounts receivable, net
|
|
(50
|
)
|
|
(21
|
)
|
|
10
|
|
|
(Increase) decrease in inventories, net
|
|
60
|
|
|
107
|
|
|
154
|
|
|
(Increase) decrease in prepaid and other assets
|
|
(28
|
)
|
|
(5
|
)
|
|
3
|
|
|
Increase (decrease) in accounts payable and accrued liabilities
|
|
1
|
|
|
17
|
|
|
—
|
|
|
Increase (decrease) in taxes payable
|
|
1
|
|
|
2
|
|
|
4
|
|
|
Cash provided by operating activities-continuing operations
|
|
166
|
|
|
86
|
|
|
67
|
|
|
|
|
|
|
|
|
|
|
|
|
|
Cash Flows from Investing Activities:
|
|
|
|
|
|
|
|
|
|
|
Capital expenditures
|
|
(91
|
)
|
|
(86
|
)
|
|
(165
|
)
|
|
Debt proceeds restricted for Cristal acquisition
|
|
(651
|
)
|
|
—
|
|
|
—
|
|
|
Proceeds from the sale of business
|
|
1,325
|
|
|
—
|
|
|
—
|
|
|
Proceeds from the sale of assets
|
|
—
|
|
|
2
|
|
|
1
|
|
|
Acquisition of business
|
|
—
|
|
|
—
|
|
|
(1,650
|
)
|
|
Cash provided by (used in) investing activities – continuing operations
|
|
583
|
|
|
(84
|
)
|
|
(1,814
|
)
|
|
|
|
|
|
|
|
|
|
|
|
|
Cash Flows from Financing Activities:
|
|
|
|
|
|
|
|
|
|
|
Repayments of short-term debt
|
|
(150
|
)
|
|
—
|
|
|
—
|
|
|
Repayments of long-term debt
|
|
(2,342
|
)
|
|
(31
|
)
|
|
(18
|
)
|
|
Proceeds from long-term debt
|
|
2,589
|
|
|
—
|
|
|
750
|
|
|
Debt issuance costs
|
|
(37
|
)
|
|
—
|
|
|
(15
|
)
|
|
Call premium paid
|
|
(14
|
)
|
|
—
|
|
|
—
|
|
|
Dividends paid
|
|
(23
|
)
|
|
(46
|
)
|
|
(117
|
)
|
|
Restricted stock and performance-based shares settled in cash for taxes
|
|
(12
|
)
|
|
(1
|
)
|
|
(1
|
)
|
|
Proceeds from the exercise of warrants and options
|
|
13
|
|
|
—
|
|
|
3
|
|
|
Cash provided by (used in) financing activities – continuing operations
|
|
24
|
|
|
(78
|
)
|
|
602
|
|
|
|
|
|
|
|
|
|
|
|
|
|
Discontinued Operations:
|
|
|
|
|
|
|
|
|
|
|
Cash provided by operating activities
|
|
107
|
|
|
126
|
|
|
150
|
|
|
Cash used in investing activities
|
|
(25
|
)
|
|
(33
|
)
|
|
(26
|
)
|
|
Net cash flows provided by discontinued operations
|
|
82
|
|
|
93
|
|
|
124
|
|
|
|
|
|
|
|
|
|
|
|
|
|
Effects of exchange rate changes on cash and cash equivalents
|
|
13
|
|
|
2
|
|
|
(26
|
)
|
|
|
|
|
|
|
|
|
|
|
|
|
Net increase (decrease) in cash and cash equivalents
|
|
868
|
|
|
19
|
|
|
(1,047
|
)
|
|
Cash and cash equivalents at beginning of period
|
|
248
|
|
|
229
|
|
|
1,276
|
|
|
Cash and cash equivalents at end of period - continuing operations
|
$
|
1,116
|
|
$
|
248
|
|
$
|
229
|
|
|
|
|
|
|
|
|
|
|
|
|
|
Supplemental cash flow information - continuing operations:
|
|
|
|
|
|
|
|
|
|
|
Interest paid, net
|
$
|
186
|
|
$
|
171
|
|
$
|
152
|
|
|
|
|
|
|
|
|
|
|
|
|
|
Income taxes paid
|
$
|
10
|
|
$
|
2
|
|
$
|
23
|
|
See notes to consolidated financial statements.
59
TRONOX LIMITED
CONSOLIDATED STATEMENTS OF CHANGES IN SHAREHOLDERS’ EQUITY
(Millions of U.S. dollars)
|
|
Tronox
Limited Class A Ordinary Shares |
Tronox
Limited Class B Ordinary Shares |
Capital
in Excess of par Value |
(Accumulated
Deficit) Retained Earnings |
Accumulated
Other Comprehensive Loss |
Total
Tronox Limited Shareholders’ Equity |
Non-
controlling Interest |
Total
Equity |
||||||||||||||||
|
Balance at January 1, 2015
|
$
|
1
|
|
$
|
—
|
|
$
|
1,476
|
|
$
|
536
|
|
$
|
(398
|
)
|
$
|
1,615
|
|
$
|
177
|
|
$
|
1,792
|
|
|
Net income (loss)
|
|
—
|
|
|
—
|
|
|
—
|
|
|
(329
|
)
|
|
—
|
|
|
(329
|
)
|
|
12
|
|
|
(317
|
)
|
|
Other comprehensive loss
|
|
—
|
|
|
—
|
|
|
—
|
|
|
—
|
|
|
(200
|
)
|
|
(200
|
)
|
|
(77
|
)
|
|
(277
|
)
|
|
Shares-based compensation
|
|
—
|
|
|
—
|
|
|
21
|
|
|
—
|
|
|
—
|
|
|
21
|
|
|
—
|
|
|
21
|
|
|
Class A and Class B share dividends
|
|
—
|
|
|
—
|
|
|
—
|
|
|
(118
|
)
|
|
—
|
|
|
(118
|
)
|
|
—
|
|
|
(118
|
)
|
|
Warrants and options exercised
|
|
—
|
|
|
—
|
|
|
3
|
|
|
—
|
|
|
—
|
|
|
3
|
|
|
—
|
|
|
3
|
|
|
|
|
|
|
|
|
|
|
|
|
|
|
|
|
|
|
|
|
|
|
|
|
|
|
|
|
Balance at December 31, 2015
|
$
|
1
|
|
$
|
—
|
|
$
|
1,500
|
|
$
|
89
|
|
$
|
(598
|
)
|
$
|
992
|
|
$
|
112
|
|
$
|
1,104
|
|
|
Net income (loss)
|
|
—
|
|
|
—
|
|
|
—
|
|
|
(61
|
)
|
|
—
|
|
|
(61
|
)
|
|
1
|
|
|
(60
|
)
|
|
Other comprehensive loss
|
|
—
|
|
|
—
|
|
|
—
|
|
|
—
|
|
|
101
|
|
|
101
|
|
|
31
|
|
|
132
|
|
|
Shares-based compensation
|
|
—
|
|
|
—
|
|
|
25
|
|
|
—
|
|
|
—
|
|
|
25
|
|
|
—
|
|
|
25
|
|
|
Class A and Class B share dividends
|
|
—
|
|
|
—
|
|
|
—
|
|
|
(47
|
)
|
|
—
|
|
|
(47
|
)
|
|
—
|
|
|
(47
|
)
|
|
Shares cancelled
|
|
—
|
|
|
—
|
|
|
(1
|
)
|
|
—
|
|
|
—
|
|
|
(1
|
)
|
|
—
|
|
|
(1
|
)
|
|
|
|
|
|
|
|
|
|
|
|
|
|
|
|
|
|
|
|
|
|
|
|
|
|
|
|
Balance at December 31, 2016
|
$
|
1
|
|
$
|
—
|
|
$
|
1,524
|
|
$
|
(19
|
)
|
$
|
(497
|
)
|
$
|
1,009
|
|
$
|
144
|
|
$
|
1,153
|
|
|
Net income (loss)
|
|
—
|
|
|
—
|
|
|
—
|
|
|
(285
|
)
|
|
—
|
|
|
(285
|
)
|
|
13
|
|
|
(272
|
)
|
|
Other comprehensive income
|
|
—
|
|
|
—
|
|
|
—
|
|
|
—
|
|
|
94
|
|
|
94
|
|
|
29
|
|
|
123
|
|
|
Shares-based compensation
|
|
—
|
|
|
—
|
|
|
33
|
|
|
—
|
|
|
—
|
|
|
33
|
|
|
—
|
|
|
33
|
|
|
Shares cancelled
|
|
—
|
|
|
—
|
|
|
(12
|
)
|
|
—
|
|
|
—
|
|
|
(12
|
)
|
|
—
|
|
|
(12
|
)
|
|
Warrants and options exercised
|
|
—
|
|
|
—
|
|
|
13
|
|
|
—
|
|
|
—
|
|
|
13
|
|
|
—
|
|
|
13
|
|
|
Class A and Class B share dividends
|
|
—
|
|
|
—
|
|
|
—
|
|
|
(23
|
)
|
|
—
|
|
|
(23
|
)
|
|
—
|
|
|
(23
|
)
|
|
|
|
|
|
|
|
|
|
|
|
|
|
|
|
|
|
|
|
|
|
|
|
|
|
|
|
Balance at December 31, 2017
|
$
|
1
|
|
$
|
—
|
|
$
|
1,558
|
|
$
|
(327
|
)
|
$
|
(403
|
)
|
$
|
829
|
|
$
|
186
|
|
$
|
1,015
|
|
See notes to consolidated financial statements.
60
TRONOX LIMITED
NOTES TO CONSOLIDATED FINANCIAL STATEMENTS
(Millions of U.S. dollars, except share, per share and metric tons data or unless otherwise noted)
1. The Company
Tronox Limited and its subsidiaries (collectively referred to as “Tronox,” “we,” “us,” or “our”) is a public limited company registered under the laws of the State of Western Australia. We are a global leader in the production and marketing of titanium bearing mineral sands and titanium dioxide (“TiO2”) pigment. Titanium feedstock is primarily used to manufacture TiO2. Zircon, a hard, glossy mineral, is used for the manufacture of ceramics, refractories, TV screen glass, and a range of other industrial and chemical products. Pig iron is a metal material used in the steel and metal casting industries to create wrought iron, cast iron, and steel. Our TiO2 products are critical components of everyday applications such as paint and other coatings, plastics, paper, and other uses and our related mineral sands product streams include titanium feedstock, zircon, and pig iron.
We have global operations in North America, Europe, South Africa, and the Asia-Pacific region. We classify our business into one reportable segment, TiO2, in which we operate three pigment production facilities at the following locations: Hamilton, Mississippi; Botlek, the Netherlands; and Kwinana, Western Australia. We also operate three separate mining operations: KwaZulu-Natal (“KZN”) Sands and Namakwa Sands both located in South Africa and Cooljarloo located in Western Australia.
On February 21, 2017, Tronox Limited, The National Titanium Dioxide Company Ltd., a limited company organized under the laws of the Kingdom of Saudi Arabia (“Cristal”), and Cristal Inorganic Chemicals Netherlands Coöperatief W.A., a cooperative organized under the laws of the Netherlands and a wholly owned subsidiary of Cristal (“Seller”), entered into a Transaction Agreement (the “Transaction Agreement”), pursuant to which we agreed to acquire Cristal’s titanium dioxide business for $1.673 billion in cash, subject to a working capital adjustment at closing (the “Cash Consideration”), plus 37,580,000 Class A ordinary shares (“Class A Shares”), par value $0.01 per share, of Tronox Limited (the “Cristal Transaction”). Following the closing of the Cristal Transaction, the Seller will own approximately 24% of the outstanding ordinary shares (including both Class A and Class B) of Tronox Limited. On March 1, 2018, Tronox, Cristal and Seller entered into an Amendment to the Transaction Agreement (the “Amendment”) that extends the termination date under the Transaction Agreement to June 30, 2018, with automatic 3-month extensions to March 31, 2019, if necessary based on the status of outstanding regulatory approvals. The Amendment also provides that Tronox has the right to terminate the Transaction Agreement if it determines that the outstanding regulatory approvals are not reasonably likely to be obtained. In the event that such termination by Tronox is (i) on or after January 1, 2019, and Tronox elects to terminate the Transaction Agreement if it determines that the outstanding regulatory approvals are not reasonably likely to be obtained; or (ii) if regulatory approval has not been obtained by March 31, 2019 and Tronox or Cristal elects to terminate the Transaction Agreement; then Tronox is required to pay Cristal a $60 million termination fee. The Transaction Agreement also provides that we must pay to Cristal a termination fee of $100 million if all conditions to closing, other than the financing condition, have been satisfied and the Transaction Agreement is terminated because closing has not occurred by June 30, 2018 (subject to automatic 3-month extensions to March 31, 2019 if necessary based on the status of outstanding regulatory approvals).
The Cristal Transaction is conditioned upon the receipt of various regulatory approvals, including antitrust clearance in numerous jurisdictions. On April 13, 2017, the FTC issued a request for additional information (“Second Request”) to the Company and Cristal in connection with its filing under the Hart-Scott-Rodino Antitrust Improvements Act of 1976, as amended, and Tronox believes it has fully complied with the Second Request. On December 5, 2017, the FTC announced that it would not approve the Cristal Transaction as proposed and filed an administrative action to prevent the parties from consummating the transaction. On January 23, 2018, Tronox filed suit against the FTC in the U.S. District Court for the Northern District of Mississippi seeking a declaration that the Cristal Transaction is lawful under applicable law, among other things. On December 21, 2017, the European Commission announced that after its initial review, it would pursue a Phase II investigation of the Cristal Transaction before reaching a decision to approve it, with or without conditions. The Transaction Agreement provides for customary representations, warranties and covenants that are subject, in some cases, to specified exceptions and qualifications contained in the Transaction Agreement. There can be no assurance, however, that all closing conditions for the Cristal Transaction will be satisfied and, if they are satisfied, that they will be satisfied in time for the closing to occur by June 30, 2018 (subject to automatic
61
3-month extensions to March 31, 2019 if necessary based on the status of outstanding regulatory approvals), at which time either party to the Transaction Agreement may mutually agree to extend the closing date or terminate the Transaction Agreement if the Cristal Transaction has not closed by such time. We have received approval for the Cristal Transaction from seven of the nine regulatory jurisdictions whose approvals are required to close the Cristal Transaction.
On October 2, 2017, at a special meeting of shareholders of the Company held pursuant to the Transaction Agreement, the Company’s shareholders approved a resolution to issue 37,580,000 Class A Shares to the Seller in connection with the acquisition of Cristal’s TiO2 business, and the resulting acquisition of interests in such Class A Shares by the Seller and certain other persons and entities, at the closing of such acquisition.
On September 1, 2017, we completed the previously announced sale of our wholly owned subsidiary Tronox Alkali Corporation (“Alkali”) to Genesis Energy, L.P. for proceeds of $1.325 billion in cash (the “Sale”).
During the year ended December 31, 2017, we recognized a pre-tax loss of $233 million on the Alkali disposal. For all periods presented, sales, costs and expenses and income taxes attributable to Alkali together with the loss on disposal have been aggregated in a single caption entitled “Income (loss) from discontinued operations, net of tax” in our Consolidated Statement of Operations. Included in the calculation of the loss noted above, were approximately $21 million of transaction fees related to the sale of Alkali. For cash flow presentation purposes, these transaction costs are included in “Cash provided by operating activities, continuing operations” on the Consolidated Statements of Cash Flows. See Note 3 – Discontinued Operations for additional information.
In 2012, our Class B ordinary shares (“Class B Shares”) were issued to Exxaro Resources Limited (“Exxaro”) and one of its subsidiaries in consideration for 74% of Exxaro’s South African mineral sands business. Exxaro has agreed not to acquire any voting shares of Tronox Limited if, following such acquisition, Exxaro will have a voting interest in Tronox Limited of 50% or more unless Exxaro brings any proposal to make such an acquisition to the Tronox Board of Directors on a confidential basis. In the event an agreement regarding the proposal is not reached, Exxaro is permitted to make a takeover offer for all the shares of Tronox Limited not held by affiliates of Exxaro, subject to certain non-waivable conditions. On March 8, 2017, Exxaro announced its intention to begin pursuing a path to monetize its ownership stake in Tronox over time. On October 10, 2017, Exxaro sold 22,425,000 Class A ordinary shares (“Class A Shares”) in an underwritten registered offering (the “Exxaro Share Transaction”). At December 31, 2017 and December 31, 2016, Exxaro held approximately 24% and 44%, respectively, of the voting securities of Tronox Limited. See Note 21 for additional information regarding Exxaro transactions. Presently, Exxaro intends to sell the remainder of its Tronox shares in a staged process over time pursuant to the existing registration statement, subject to market conditions. Exxaro’s sale of Class A Shares did not impact their 26% ownership interest in each of our Tronox KZN Sands (Pty) Ltd. and Tronox Mineral Sands (Pty) Ltd subsidiaries. Exxaro is entitled to exchange this interest for approximately 3.2% in additional Class B Shares under certain circumstances. Exxaro also has a 26% ownership interest in certain of our other non-operating subsidiaries.
Basis of Presentation
We are considered a domestic company in Australia and, as such, are required to report in Australia under International Financial Reporting Standards (“IFRS”). Additionally, as we are not considered a “foreign private issuer” in the U.S., we are required to comply with the reporting and other requirements imposed by the U.S. securities law on U.S. domestic issuers, which, among other things, requires reporting under accounting principles generally accepted in the United States of America (“U.S. GAAP”). The consolidated financial statements included in this Form 10-K are prepared in conformity with U.S. GAAP. We publish our consolidated financial statements, in both U.S. GAAP and IFRS, in U.S. dollars.
Exxaro has a 26% ownership interest in each of our Tronox KZN Sands (Pty) Ltd. and Tronox Mineral Sands (Pty) Ltd. subsidiaries in order to comply with the ownership requirements of the Black Economic Empowerment (“BEE”) legislation in South Africa. We account for such ownership interest as “Noncontrolling interest” in our consolidated financial statements.
Our consolidated financial statements include the accounts of all majority-owned subsidiary companies. All intercompany balances and transactions have been eliminated in consolidation. Certain prior period amounts have been reclassified to conform to the manner and presentation in the current period.
62
Revision of Previously Issued Consolidated Financial Statements
During the three months ended March 31, 2017, we identified a misstatement in our selling, general, and administrative expense for certain prior periods related to a liability resulting from a non-timely filing with a statutory authority. The aggregate misstatement is $11 million, which impacts our previously issued consolidated statements of operations, comprehensive loss, balance sheets and cash flows as of and for the years ended December 31, 2015 and 2016, and the unaudited condensed consolidated financial statements for the third and fourth quarters and corresponding year-to-date periods of 2015, and each quarter and corresponding year-to-date periods of 2016.
In accordance with Staff Accounting Bulletin (“SAB”) No. 99, Materiality, and SAB No. 108, Considering the Effects of Prior Year Misstatements when Quantifying Misstatements in Current Year Financial Statements, management evaluated the materiality of the misstatement from qualitative and quantitative perspectives, and concluded that the misstatement was not material to our previously issued annual and interim financial statements. The cumulative amount of the prior period adjustments would have been material to our current statement of operations and comprehensive loss had we made the correction in the three months ended March 31, 2017 and accordingly we have revised our previously issued financial statements to correct this misstatement. We also corrected the timing of other previously recorded immaterial out-of-period adjustments and reflected them in the revised prior period financial statements. The previously recorded immaterial out-of-period adjustments include a $6 million decrease to cost of goods sold due to an overstated depreciation expense and a $7 million increase to cost of goods sold related to royalty tax both originating in 2013 and previously recorded as out-of-period corrections in 2014; a $5 million decrease to cost of goods sold that originated in 2012 and was previously recorded as an out-of-period correction in 2014 due to overstated depletion expense; and other miscellaneous immaterial corrections.
The effects on our consolidated financial statements are as follows:
Consolidated Statement of Operations
|
|
Year Ended December 31, 2016
|
Year Ended December 31, 2015
|
||||||||||||||||
|
|
As
Reported(1) |
Adjustment
|
Revised
|
As
Reported(1) |
Adjustment
|
Revised
|
||||||||||||
|
Net sales
|
$
|
1,309
|
|
$
|
—
|
|
$
|
1,309
|
|
$
|
1,510
|
|
$
|
—
|
|
$
|
1,510
|
|
|
Cost of goods sold
|
|
1,175
|
|
|
—
|
|
|
1,175
|
|
|
1,487
|
|
|
4
|
|
|
1,491
|
|
|
Gross profit
|
|
134
|
|
|
—
|
|
|
134
|
|
|
23
|
|
|
(4
|
)
|
|
19
|
|
|
Selling, general and administrative expenses
|
|
(185
|
)
|
|
(4
|
)
|
|
(189
|
)
|
|
(192
|
)
|
|
(7
|
)
|
|
(199
|
)
|
|
Income (loss) from operations
|
|
(52
|
)
|
|
(4
|
)
|
|
(56
|
)
|
|
(190
|
)
|
|
(11
|
)
|
|
(201
|
)
|
|
Other income (expense), net
|
|
(27
|
)
|
|
—
|
|
|
(27
|
)
|
|
28
|
|
|
—
|
|
|
28
|
|
|
Income (loss) from continuing operations before income taxes
|
|
(260
|
)
|
|
(4
|
)
|
|
(264
|
)
|
|
(338
|
)
|
|
(11
|
)
|
|
(349
|
)
|
|
Net income (loss) from continuing operations
|
|
(135
|
)
|
|
(4
|
)
|
|
(139
|
)
|
|
(362
|
)
|
|
(10
|
)
|
|
(372
|
)
|
|
Income (loss) from discontinued operations, net of tax
|
|
77
|
|
|
2
|
|
|
79
|
|
|
55
|
|
|
—
|
|
|
55
|
|
|
Net loss attributable to Tronox Limited
|
|
(59
|
)
|
|
(2
|
)
|
|
(61
|
)
|
|
(318
|
)
|
|
(11
|
)
|
|
(329
|
)
|
|
Net income (loss) per share from continuing operations, basic and diluted
|
|
(1.17
|
)
|
|
(0.03
|
)
|
|
(1.20
|
)
|
|
(3.22
|
)
|
|
(0.09
|
)
|
|
(3.31
|
)
|
|
Net income (loss) per share from discontinued operations, basic and diluted
|
|
0.67
|
|
|
0.01
|
|
|
0.68
|
|
|
0.47
|
|
|
—
|
|
|
0.47
|
|
|
Weighted average shares outstanding, basic and diluted (in thousands)
|
|
116,161
|
|
|
116,161
|
|
|
116,161
|
|
|
115,566
|
|
|
115,566
|
|
|
115,566
|
|
63
Consolidated Statements of Comprehensive Income (Loss)
|
|
Year Ended December 31, 2016
|
Year Ended December 31, 2015
|
||||||||||||||||
|
|
As
Reported |
Adjustment
|
Revised
|
As Reported
|
Adjustment
|
Revised
|
||||||||||||
|
|
|
|
|
|
|
|
|
|
|
|
|
|
|
|
|
|
|
|
|
Net loss
|
$
|
(58
|
)
|
$
|
(2
|
)
|
$
|
(60
|
)
|
$
|
(307
|
)
|
$
|
(10
|
)
|
$
|
(317
|
)
|
|
Total comprehensive income (loss)
|
|
74
|
|
|
(2
|
)
|
|
72
|
|
|
(584
|
)
|
|
(10
|
)
|
|
(594
|
)
|
|
Comprehensive income (loss) attributable to Tronox Limited
|
|
42
|
|
|
(2
|
)
|
|
40
|
|
|
(518
|
)
|
|
(11
|
)
|
|
(529
|
)
|
Consolidated Balance Sheet
|
|
Year Ended December 31, 2016
|
||||||||
|
|
As Reported (1)
|
Adjustment
|
Revised
|
||||||
|
Current assets of continuing operations
|
$
|
1,067
|
|
$
|
—
|
|
$
|
1,067
|
|
|
Total assets of discontinued operations
|
|
1,668
|
|
|
3
|
|
|
1,671
|
|
|
Total current assets
|
|
2,735
|
|
|
3
|
|
|
2,738
|
|
|
Total assets
|
|
4,961
|
|
|
3
|
|
|
4,964
|
|
|
Accrued liabilities
|
|
138
|
|
|
11
|
|
|
149
|
|
|
Current liabilities of continuing operations
|
|
443
|
|
|
10
|
|
|
453
|
|
|
Total liabilities of discontinued operations
|
|
110
|
|
|
1
|
|
|
111
|
|
|
Total current liabilities
|
|
553
|
|
|
11
|
|
|
564
|
|
|
Total liabilities
|
|
3,800
|
|
|
11
|
|
|
3,811
|
|
|
Accumulated deficit
|
|
(13
|
)
|
|
(6
|
)
|
|
(19
|
)
|
|
Accumulated other comprehensive loss
|
|
(495
|
)
|
|
(2
|
)
|
|
(497
|
)
|
|
Total Tronox Limited shareholders’ equity
|
|
1,017
|
|
|
(8
|
)
|
|
1,009
|
|
|
Total equity
|
|
1,161
|
|
|
(8
|
)
|
|
1,153
|
|
|
Total liabilities and equity
|
|
4,961
|
|
|
3
|
|
|
4,964
|
|
| (1) | Amounts reflect the results of Alkali as discontinued operations. |
Consolidated Statement of Cash Flows
There was no net impact to operating, investing and financing cash flows from the revisions for continuing operations for the years ended December 31, 2016 and 2015.
Use of Estimates
The preparation of financial statements in conformity with U.S. GAAP requires management to make estimates and assumptions that affect the reported amounts of assets and liabilities, the disclosure of contingent assets and liabilities at the date of the financial statements, and the reported amounts of revenues and expenses during the reporting periods. It is at least reasonably possible that the effect on the financial statements of a change in estimate due to one or more future confirming events could have a material effect on the financial statements.
2. Significant Accounting Policies
Foreign Currency
The U.S. dollar is the functional currency for our operations, except for our South African operations, whose functional currency is the Rand, and our European operations, whose functional currency is the Euro. We determine the functional currency of each subsidiary based on a number of factors, including the predominant currency for revenues, expenditures and borrowings. Adjustments from the remeasurement of non-functional currency monetary assets and liabilities are recorded in “Other income (expense), net” in the Consolidated Statements of Operations. When the subsidiary’s functional currency is not the U.S. dollar, translation adjustments resulting from translating the functional currency financial statements into U.S. dollar equivalents are recorded in “Accumulated other comprehensive loss” in the Consolidated Balance Sheets.
64
Gains and losses on intercompany foreign currency transactions that are not expected to be settled in the foreseeable future are reported in the same manner as translation adjustments.
Revenue Recognition
Revenue is recognized when risk of loss and title to the product is transferred to the customer, pricing is fixed or determinable, and collection is reasonably assured. All amounts billed to a customer in a sales transaction related to shipping and handling represent revenues earned and are reported as “Net sales” in the Consolidated Statements of Operations. Accruals are made for sales returns, rebates and other allowances, which are recorded in “Net sales” in the Consolidated Statements of Operations, and are based on our historical experience and current business conditions.
Cost of Goods Sold
Cost of goods sold includes costs for purchasing, receiving, manufacturing, and distributing products, including raw materials, energy, labor, depreciation, depletion, shipping and handling, freight, warehousing, and other production costs.
Research and Development
Research and development costs, included in “Selling, general and administrative expenses” in the Consolidated Statements of Operation comprising of salaries, building costs, utilities, administrative expenses, and allocations of corporate costs, were $8 million, $9 million, and $11 million during 2017, 2016, and 2015, respectively, and were expensed as incurred.
Selling, General and Administrative Expenses
Selling, general and administrative expenses include costs related to marketing, agent commissions, and legal and administrative functions such as corporate management, human resources, information technology, investor relations, accounting, treasury, and tax compliance.
Income Taxes
We use the asset and liability method of accounting for income taxes. The estimation of the amounts of income taxes involves the interpretation of complex tax laws and regulations and how foreign taxes affect domestic taxes, as well as the analysis of the realizability of deferred tax assets, tax audit findings, and uncertain tax positions.
Deferred tax assets and liabilities are determined based on temporary differences between the financial reporting and tax bases of assets and liabilities using enacted tax rates expected to apply to taxable income in the years in which those temporary differences are expected to be recovered or settled. A valuation allowance is provided against a deferred tax asset when it is more likely than not that all or some portion of the deferred tax asset will not be realized. We periodically assess the likelihood that we will be able to recover our deferred tax assets, and reflect any changes in our estimates in the valuation allowance, with a corresponding adjustment to earnings or other comprehensive income (loss), as appropriate. All available positive and negative evidence is weighted to determine whether a valuation allowance should be recorded.
The amount of income taxes we pay is subject to ongoing audits by federal, state, and foreign tax authorities, which may result in proposed assessments. Our estimate for the potential outcome for any uncertain tax issue is highly judgmental. We assess our income tax positions, and record tax benefits for all years subject to examination based upon our evaluation of the facts, circumstances, and information available at the reporting date. For those tax positions for which it is more likely than not that a tax benefit will be sustained, we record the amount that has a greater than 50% likelihood of being realized upon settlement with a taxing authority that has full knowledge of all relevant information. Interest and penalties are accrued as part of tax expense, where applicable. If we do not believe that it is more likely than not that a tax benefit will be sustained, no tax benefit is recognized. See Note 6.
Earnings per Share
Basic and diluted earnings per share are calculated using the two-class method. Under the two-class method, earnings used to determine basic earnings per share are reduced by an amount allocated to participating securities. Participating securities include restricted shares issued under the Tronox Management Equity Incentive
65
Plan (the “MEIP”) (see Note 19) and the T-Bucks Employee Participation Plan (“T-Bucks EPP”) (see Note 19), both of which contain non-forfeitable dividend rights. Our unexercised options, unexercised Series A and Series B Warrants (see Note 18), and unvested restricted share units do not contain non-forfeitable rights to dividends and, as such, are not considered in the calculation of basic earnings per share. Our unvested restricted shares do not have a contractual obligation to share in losses; therefore, when we record a net loss, none of the loss is allocated to participating securities. Consequently, in periods of net loss, the two-class method does not have an effect on basic loss per share.
Diluted earnings per share is calculated by dividing net earnings allocable to ordinary shares by the weighted-average number of ordinary shares outstanding for the period, as adjusted for the potential dilutive effect of non-participating restricted share units, options, and Series A and Series B Warrants. The options and Series A and Series B Warrants are included in the calculation of diluted earnings per ordinary share utilizing the treasury stock method. See Note 7.
Fair Value Measurement
We measure fair value on a recurring basis utilizing valuation techniques that maximize the use of observable inputs and minimize the use of unobservable inputs, to the extent possible, and consider counterparty credit risk in our assessment of fair value. The fair value hierarchy is as follows:
| • | Level 1 – Quoted prices in active markets for identical assets and liabilities; |
| • | Level 2 – Quoted prices for similar assets and liabilities in active markets, quoted prices for identical or similar assets and liabilities in markets that are not active or other inputs that are observable or can be corroborated by observable market data; and, |
| • | Level 3 – Unobservable inputs that are supported by little or no market activity and that are significant to the fair value of the assets and liabilities |
See Note 8.
Cash and Cash Equivalents
We consider all investments with original maturities of three months or less to be cash equivalents. We maintain cash and cash equivalents in bank deposit and money market accounts that may exceed federally insured limits. The financial institutions where our cash and cash equivalents are held are generally highly rated and geographically dispersed, and we have a policy to limit the amount of credit exposure with any one institution. We have not experienced any losses in such accounts and believe we are not exposed to significant credit risk.
At December 31, 2017, included in restricted cash was $651 million related to our Blocked Term Loan (defined below) See Note 15. Upon consummation of the Cristal acquisition, the Blocked Term Loan will become available to Tronox Finance. See Note 15. At December 31, 2017, 2016 and 2015, we had restricted cash in Australia related to outstanding performance bonds of $2 million, $3 million and $5 million, respectively.
Accounts Receivable, net of allowance for doubtful accounts
We perform credit evaluations of our customers, and take actions deemed appropriate to mitigate credit risk. Only in certain specific occasions do we require collateral in the form of bank or parental guarantees or guarantee payments. We maintain allowances for potential credit losses based on specific customer review and current financial conditions. See Note 9.
Inventories, net
Pigment inventories are stated at the lower of actual cost and net realizable value, net of allowances for obsolete and slow-moving inventory. The cost of inventories is determined using the first-in, first-out method. Carrying values include material costs, labor, and associated indirect manufacturing expenses. Costs for materials and supplies, excluding titanium ore, are determined by average cost to acquire. Mineral Sands inventories including titanium ore are stated at the lower of the weighted-average cost of production or market. Inventory costs include those costs directly attributable to products, including all manufacturing overhead but excluding distribution costs. Raw materials are carried at actual cost.
66
We review, annually and at the end of each quarter, the cost of our inventory in comparison to its net realizable value. We also periodically review our inventory for obsolescence. In either case, we record any write-down equal to the difference between the cost of inventory and its estimated net realizable value based on assumptions about alternative uses, market conditions and other factors. Inventories expected to be sold or consumed within twelve months after the balance sheet date are classified as current assets and all other inventories are classified as non-current assets. See Note 10.
Long Lived Assets
Property, plant and equipment, net is stated at cost less accumulated depreciation, and is depreciated over its estimated useful life using the straight-line method as follows:
|
Land improvements
|
10 — 20 years
|
|
Buildings
|
10 — 40 years
|
|
Machinery and equipment
|
3 — 25 years
|
|
Furniture and fixtures
|
10 years
|
Maintenance and repairs are expensed as incurred, except for costs of replacements or renewals that improve or extend the lives of existing properties, which are capitalized. Upon retirement or sale, the cost and related accumulated depreciation are removed from the respective account, and any resulting gain or loss is included in “Cost of goods sold” or “Selling, general, and administrative expenses” in the Consolidated Statements of Operations. See Note 11.
We capitalize interest costs on major projects that require an extended period of time to complete. See Note 15.
Mineral property acquisition costs are capitalized as tangible assets when management determines that probable future benefits consisting of a contribution to future cash inflows have been identified and adequate financial resources are available or are expected to be available as required to meet the terms of property acquisition and anticipated exploration and development expenditures. Mineral leaseholds are depleted over their useful lives as determined under the units of production method. Mineral property exploration costs are expensed as incurred. When it has been determined that a mineral property can be economically developed as a result of establishing proven and probable reserves, the costs incurred to develop such property through the commencement of production are capitalized. See Note 12.
Intangible assets are stated at cost less accumulated amortization, and are amortized on a straight-line basis over their estimated useful lives, which range from 3 to 20 years. See Note 13.
We evaluate the recoverability of the carrying value of long-lived assets that are held and used whenever events or changes in circumstances indicate that the carrying value may not be recoverable. Under such circumstances, we assess whether the projected undiscounted cash flows of our long-lived assets are sufficient to recover the carrying amount of the asset group being assessed. If the undiscounted projected cash flows are not sufficient, we calculate the impairment amount by discounting the projected cash flows using our weighted-average cost of capital. For assets that satisfy the criteria to be classified as held for sale, an impairment loss, if any, is recognized to the extent the carrying amount exceeds fair value, less cost to sell. The amount of the impairment of long-lived assets is written off against earnings in the period in which the impairment is determined.
Business Acquisitions
Business acquisitions are accounted for using the acquisition method under Accounting Standards Codification (“ASC”) 805, Business Combinations (“ASC 805”), which requires recording assets acquired and liabilities assumed at fair value as of the acquisition date. Under the acquisition method of accounting, each tangible and separately identifiable intangible asset acquired and liabilities assumed is recorded based on their preliminary estimated fair values on the acquisition date. The initial valuations are derived from estimated fair value assessments and assumptions used by management. Acquisition related costs are expensed as incurred and are included in “Selling, general and administrative expenses” in the Consolidated Statements of Operations.
67
Long-term Debt
Long-term debt is stated net of unamortized original issue premium or discount. Premiums or discounts are amortized using the effective interest method with amortization expense recorded in “Interest and debt expense, net” in the Consolidated Statements of Operations. Deferred debt issuance costs related to a recognized debt liability are presented in the Consolidated Balance Sheets as a direct deduction from the carrying amount of that debt liability, consistent with debt discounts and are amortized using the effective interest method with amortization expense recorded in “Interest and debt expense, net” in the Consolidated Statements of Operations. See Note 15.
Asset Retirement Obligations
Asset retirement obligations are recorded at their estimated fair value, and accretion expense is recognized over time as the discounted liability is accreted to its expected settlement value. Fair value is measured using expected future cash outflows discounted at our credit-adjusted risk-free interest rate, which are considered Level 3 inputs. We classify accretion expense related to asset retirement obligations as a production cost, which is included in “Cost of goods sold” in the Consolidated Statements of Operations. See Note 16.
Environmental Remediation and Other Contingencies
We recognize a loss and record an undiscounted liability when litigation has commenced or a claim or assessment has been asserted, or, based on available information, commencement of litigation or assertion of a claim or assessment is probable, and the associated costs can be reasonably estimated. See Note 16.
Self-Insurance
We are self-insured for certain levels of general and vehicle liability, property, workers’ compensation and health care coverage. The cost of these self-insurance programs is accrued based upon estimated fully developed settlements for known and anticipated claims. Any resulting adjustments to previously recorded reserves are reflected in current operating results. We do not accrue for general or unspecific business risks.
Share-based Compensation
Equity Restricted Share and Restricted Share Unit Awards - The fair value of equity instruments is measured based on the share price on the grant date and is recognized over the vesting period. These awards contain service, market, and/or performance conditions. For awards containing only a service or a market condition, we have elected to recognize compensation costs using the straight-line method over the requisite service period for the entire award. For awards containing a market condition, the fair value of the award is measured using the Monte Carlo simulation under a lattice model approach. For awards containing a performance condition, the fair value is the grant date close price and compensation expense is not recognized until we conclude that it is probable that the performance condition will be met. We reassess the probability at least quarterly. See Note 19.
Liability Restricted Share Awards - Restricted share awards classified as liability awards contain only a service condition, and have graded vesting provisions. Liability awards are re-measured to fair value at each reporting date. See Note 19, Long-Term Incentive Plan.
Option Awards - The Black-Scholes option pricing model is utilized to measure the fair value of options on the grant date. The options contain only service conditions, and have graded vesting provisions. We have elected to recognize compensation costs using the straight-line method over the requisite service period for the entire award. See Note 19.
Defined Benefit Pension and Postretirement Benefit Plans
We recognize the funded status of our defined benefit pension plans and postretirement benefit plans in the Consolidated Balance Sheet. The funded status is measured as the difference between the fair value of plan assets and the benefit obligation at the measurement date. The benefit obligation for the defined benefit plans is the projected benefit obligation (PBO), which represents the actuarial present value of benefits expected to be paid upon retirement based on employee services already rendered and estimated future compensation levels. The benefit obligation for our postretirement benefit plans is the accumulated postretirement benefit obligation
68
(APBO), which represents the actuarial present value of postretirement benefits attributed to employee services already rendered. The fair value of plan assets related to our defined benefit plan represents the current market value of assets held in a trust fund, which is established for the sole benefit of plan participants.
If the fair value of plan assets exceeds the benefit obligation, the plan is overfunded, and the excess is recorded as a prepaid pension asset. On the other hand, if the benefit obligation exceeds the fair value of plan assets, the plan is underfunded, and the deficit is recorded as pension and postretirement healthcare benefits obligation in the Consolidated Balance Sheet. The portion of the pension and postretirement healthcare obligations payable within the next 12 months is recorded in accrued liabilities in the Consolidated Balance Sheet.
Net periodic pension and postretirement benefit cost represents the aggregation of service cost, interest cost, expected return on plan assets, amortization of prior service costs or credits and actuarial gains or losses previously recognized as a component of OCI and it is recorded in the Consolidated Statement of Operations. Net periodic cost is recorded in cost of goods sold and selling, general and administrative expenses in the Consolidated Statement of Operations based on the employees’ respective functions.
Actuarial gains or losses represents the effect of remeasurement on the benefit obligation principally driven by changes in the plan actuarial assumptions. Prior service costs or credits arise from plan amendments. The actuarial gains or losses and prior service costs or credits are initially recognized as a component of Other Comprehensive income in the Consolidated Statement of Comprehensive Income (Loss). Those gains or losses and prior service costs or credits are subsequently recognized as a component of net periodic cost.
The measurement of benefit obligations and net periodic cost is based on estimates and assumptions approved by management. These valuations reflect the terms of the plans and use participant-specific information such as compensation, age and years of service, as well as certain assumptions, including estimates of discount rates, expected return on plan assets, rate of compensation increases and mortality rates.
Defined Contribution Plans - We recognize our contribution as expense when they are due. The expense is recorded in cost of goods sold or selling, general and administrative expenses the Consolidated Statement of Operations based on the employees’ respective functions.
Multiemployer Plan - We treat our multiemployer plan like a defined contribution plan. A pension plan to which two or more unrelated employers contribute is generally considered to be a multiemployer plan. As a defined contribution plan, we recognize the contribution for the period as a net benefit cost and any contributions due and unpaid as a liability.
Recently Adopted Accounting Pronouncements
In February 2018, the FASB issued ASU 2018-02, “Reclassification of Certain Tax Effects From Accumulated Other Comprehensive Income” (ASU 2018-02), which amends ASC 220, Income Statement — Reporting Comprehensive Income, to allow a reclassification from accumulated other comprehensive income to retained earnings for stranded tax effects resulting from the Tax Cuts and Jobs Act. In addition, under ASU 2018-02, an entity will be required to provide certain disclosures regarding stranded tax effects. ASU 2018-02 is effective for all entities for fiscal years beginning after December 15, 2018, and interim periods within those fiscal years. Early adoption is permitted. We do not expect the adoption of ASU 2018-02 to have a material impact on our consolidated financial statements.
In March 2016, the Financial Accounting Standards Board (“FASB”) issued Accounting Standards Update (“ASU”) 2016-09, Improvements to Employee Share-Based Payment Accounting (“ASU 2016-09”), which amends ASC Topic 718, Compensation – Stock Compensation. ASU 2016-09 simplifies various aspects related to how share-based payments are accounted for and presented in the financial statements including income taxes and forfeitures of awards. We adopted ASU 2016-09 during the first quarter of 2017. Its adoption did not have a material impact on our consolidated financial statements.
In March 2016, the FASB issued ASU 2016-05, Derivatives and Hedging: Effect of Derivative Contract Novations on Existing Hedge Accounting Relationships (“ASU 2016-05”), which clarifies that a change in the counterparty to a derivative instrument that has been designated as the hedging instrument in an existing hedging relationship would not, in and of itself, be considered a termination of the derivative instrument or a change in a critical term of the hedging relationship. As long as all other hedge accounting criteria in ASC 815, Derivatives
69
and Hedging (“ASC 815”) are met, a hedging relationship in which the hedging derivative instrument is novated would not be discontinued or require redesignation. This clarification applies to both cash flow and fair value hedging relationships. We adopted ASU 2016-05 during the first quarter of 2017. Its adoption did not have an impact on our consolidated financial statements.
In July 2015, as part of its simplification initiative, the FASB issued ASU 2015-11, Simplifying the Measurement of Inventory (“ASU 2015-11”). ASU 2015-11 simplifies the subsequent measurement of inventory by requiring entities to remeasure inventory at the lower of cost and net realizable value, which is defined as the estimated selling price in the ordinary course of business, less reasonably predictable costs of completion, disposal, and transportation. We adopted ASU 2015-11 during the first quarter of 2017. The adoption of ASU 2015-11 did not have an impact on our consolidated financial statements.
Recently Issued Accounting Pronouncements
In August 2017, the FASB issued ASU 2017-12, Derivatives and Hedging (Topic 815): Targeted Improvements to Accounting for Hedging Activities (“ASU 2017-12”), which will make more financial and nonfinancial hedging strategies eligible for hedge accounting. It also amends the presentation and disclosure requirements and changes how companies assess effectiveness. It is intended to more closely align hedge accounting with companies’ risk management strategies, simplify the application of hedge accounting, and increase transparency as to the scope and results of hedging programs. ASU 2017-12 is effective for annual periods beginning on or after December 15, 2018, including interim periods within those periods. Early adoption is permitted which we are considering. We do not expect the adoption of ASU 2017-12 to have a material impact on our consolidated financial statements.
In May 2017, the FASB issued ASU 2017-09, Compensation—Stock Compensation (Topic 718): Scope of Modification Accounting (“ASU 2017-09”), which clarifies when to account for a change to the terms or conditions of a share-based payment award as a modification. Under ASU 2017-09, modification accounting is required only if the fair value, the vesting conditions, or the classification of the award (as equity or liability) changes as a result of the change in terms or conditions. ASU 2017-09 is effective prospectively for annual periods beginning on or after December 15, 2017, including interim periods within those periods. Early adoption is permitted. The impact, if any, that ASU 2017-09 will have on our consolidated financial statements will depend on any future award modification.
In March 2017, the FASB issued ASU 2017-07, Compensation-Retirement Benefits: Improving the Presentation of Net Periodic Pension Cost and Net Periodic Postretirement Benefit Cost (“ASU 2017-07”) which amends the requirements in ASC 715, Compensation — Retirement Benefits, which requires employers that sponsor defined benefit pension and/or other postretirement plans to aggregate the various components of net periodic benefit cost for presentation purposes but does not prescribe where they should be presented in the income statement. ASU 2017-07 requires employers to present the service cost component of the net periodic benefit cost in the same income statement line item(s) as other employee compensation costs arising from service rendered during the period. In addition, only the service cost component will be eligible for capitalization in assets. Employers will present the other components separately from the line item(s) that includes the service cost and outside of any subtotal of operating income, if one is presented. Employers will have to disclose the line item(s) used to present the other components of net periodic benefit cost, if the components are not presented separately in the income statement. ASU 2017-07 is effective for fiscal years beginning after December 15, 2017, and interim periods within those years. Early adoption is permitted as of the beginning of an annual period for which an entity’s financial statements (interim or annual) have not been issued. ASU 2017-07 requires the presentation of the components of net periodic benefit cost in the income statement retrospectively while the guidance limiting the capitalization of net periodic benefit cost in assets to the service component will be applied prospectively. The adoption of ASU 2017-07 will result in the reclassification of pension costs of $4 million, $3 million and $1 million, in 2017, 2016 and 2015, respectively, from “Income (loss) from operations” to “Other income (expense), net” in our Consolidated Statements of Operations.
In January 2017, the FASB issued ASU 2017-01, Business Combinations (Topic 805): Clarifying the Definition of a Business (“ASU 2017-01”), which clarifies the definition of a business with the objective of adding guidance to assist companies and other reporting organizations with evaluating whether transactions should be accounted for as acquisitions (or disposals) of assets or businesses. ASU 2017-01 is effective for annual periods beginning after December 15, 2017, including interim periods within those periods. Early
70
application of the amendments in ASU 2017-01 is allowed under certain circumstances. The amendments in ASU 2017-01 should be applied prospectively on or after the effective date. The impact, if any, that ASU 2017-01 will have on our consolidated financial statements will depend on the nature of future acquisitions of assets or businesses.
In November 2016, the FASB issued ASU 2016-18, Statement of Cash Flows (Topic 230): Restricted Cash (“ASU 2016-18”), which requires that the reconciliation of the beginning-of-period and end-of period amounts shown in the statement of cash flows include restricted cash and restricted cash equivalents. ASU 2016-18 does not define restricted cash or restricted cash equivalents, but an entity will need to disclose the nature of the restrictions. ASU 2016-18 is effective for fiscal years beginning after December 15, 2017, and interim periods within those fiscal years. We adopted ASU 2016-18 in January 2018. The guidance should be applied retrospectively to all periods presented. The adoption of ASU 2016-18 will require us to include and reconcile the amount of “Restricted cash”, in addition to “Cash and cash equivalents”, for cash flow purposes for all periods presented commencing with the three months ending March 31, 2018.
In October 2016, the FASB issued ASU 2016-16, Income Taxes (Topic 740): Intra-Entity Transfers of Assets Other Than Inventory (“ASU 2016-16”), which reduces the complexity in the accounting standards by allowing the recognition of current and deferred income taxes for an intra-entity asset transfer, other than inventory, when the transfer occurs. Historically, recognition of the income tax consequence was not recognized until the asset was sold to an outside party. This amendment should be applied on a modified retrospective basis through a cumulative-effect adjustment directly to retained earnings as of the beginning of the period of adoption. ASU 2016-16 is effective for annual periods beginning after December 15, 2017, including interim reporting periods within those annual reporting periods. Early adoption is permitted for all entities as of the beginning of an annual reporting period for which financial statements (interim or annual) have not been issued or made available for issuance. The impact, if any, that ASU 2016-16 will have on our consolidated financial statements will depend upon future intra-entity transfers of assets other than inventory.
In August 2016, the FASB issued ASU 2016-15, Statement of Cash Flows (Topic 230): Classification of Certain Cash Receipts and Cash Payments (“ASU 2016-15”) which provides guidance intended to reduce diversity in practice in how certain cash receipts and cash payments are presented and classified in the statement of cash flows. ASU 2016-15 is effective for financial statements issued for fiscal years beginning after December 15, 2017, and interim periods within those fiscal years with early adoption permitted, provided that all of the amendments are adopted in the same period. The guidance requires application using a retrospective transition method. We have not yet determined the impact, if any, that ASU 2016-15 will have on our consolidated financial statements as it will depend on the nature of future cash flow transactions impacted by the new guidance.
In February 2016, the FASB issued ASU 2016-02, Leases (“ASU 2016-02”) which includes a lessee accounting model that recognizes two types of leases - finance leases and operating leases. The standard requires that a lessee recognize on the balance sheet assets and liabilities for leases with lease terms of more than 12 months. The recognition, measurement, and presentation of expenses and cash flows arising from a lease by a lessee will depend on its classification as a finance or an operating lease. The standard is effective for fiscal years, and interim periods within those fiscal years, beginning after December 15, 2018. Early adoption is permitted. The new standard, as originally issued would have required adoption using a modified retrospective transition and provided for certain practical expedients. Transition would have required application of the new guidance at the beginning of the earliest comparative period presented. On January 5, 2018, the FASB issued a proposed ASU for comment that would allow entities the option to instead apply the provisions of the new leases guidance at the effective date (e.g., January 1, 2019), without adjusting the comparative periods presented. Comments on the proposed update are due to the FASB by February 5, 2018 and we will assess our method of adoption if the FASB approves this transition option. We have developed an implementation plan for adopting ASU 2016-02, which includes utilizing a software program to manage our lease obligations. We are evaluating the impact that ASU 2016-02 will have on our consolidated financial statements and have concluded that we will not early adopt ASU 2016-02. We continue to monitor the FASB’s actions and will consider the impact of any changes made to the guidance prior to its effective date. Refer to Notes 15 and 17 regarding current obligations under lease agreements.
In May 2014, the FASB issued ASU 2014-09, Revenue from Contracts with Customers (Topic 606) which states that an entity should recognize revenue to depict the transfer of promised goods or services to customers in
71
an amount that reflects the consideration to which the entity expects to be entitled in exchange for those goods or services. ASU 2014-09 also requires additional disclosures about the nature, amount, timing and uncertainty of revenue and cash flows arising from customer contracts. This guidance is effective for interim and annual periods beginning after December 15, 2017, with early adoption permitted. The two permitted transition methods under the new standard are the full retrospective method, in which case the standard would be applied to each prior reporting period presented, or the modified retrospective method, in which case the cumulative effect of applying the standard would be recognized at the date of initial application. Subsequent to the issuance of the May 2014 guidance, several clarifications and updates have been issued on this topic, the most recent of which was issued in May 2017.
We are substantially complete with our implementation plan for adopting ASU 2014-09 including the evaluation of differences between the existing accounting guidance and Topic 606. Based on the results of our evaluation, we did not identify any changes which will have a material impact to our consolidated financial statements. Similarly, we did not identify any significant impact on our business processes, controls and systems. We are in the process of finalizing the documentation of our accounting policies. We adopted the new standard using the modified retrospective approach effective January 1, 2018.
3. Discontinued Operations
Concurrent with the announcement of the Cristal Transaction, we expressed intent to begin a process to market our Alkali soda ash business, which met the criteria as held for sale in the third quarter of 2017 and was sold on September 1, 2017. The sale of Alkali is an important step in positioning us as a global leader in the TiO2 industry. The proceeds will be used to fund the majority of the cash consideration for the Cristal acquisition and a portion was also used in the refinancing of our debt. See Notes 1 and 15. The criteria for presentation of Alkali as a discontinued operation in accordance with ASU 2014-08, Reporting Discontinued Operations and Disclosures of Disposals of Components of an Entity was met in the third quarter of 2017. This disposal is considered a strategic shift that has and will have a major effect on our operations and financial results; therefore, the results of Alkali have been classified as discontinued operations for all periods presented. Alkali’s assets as of December 31, 2016 have been segregated from continuing operations and presented as current assets or current liabilities from discontinued operations.
Alkali, which was previously one of our two operating and reportable segments, included certain allocated corporate costs, which have been reallocated to Corporate. The amount of allocated corporate costs was $3 million, $4 million and $3 million respectively, for the years ended December 31, 2017, 2016 and 2015. After the Alkali Sale, we now operate in a single operating and reportable segment, TiO2.
The following table presents the major classes of Alkali’s line items constituting the “Income (loss) from discontinued operations, net of tax” in our Consolidated Statements of Operations:
|
|
Year Ended December 31,
|
||||||||
|
|
2017
|
2016
|
2015
|
||||||
|
Net sales
|
$
|
521
|
|
$
|
786
|
|
$
|
602
|
|
|
Cost of goods sold
|
|
448
|
|
|
671
|
|
|
505
|
|
|
Selling, general and administrative expenses
|
|
(18
|
)
|
|
(25
|
)
|
|
(25
|
)
|
|
Income before income taxes
|
|
55
|
|
|
89
|
|
|
72
|
|
|
Income tax provision
|
|
(1
|
)
|
|
(10
|
)
|
|
(17
|
)
|
|
Loss on sale of discontinued operations, no tax impact
|
|
(233
|
)
|
|
—
|
|
|
—
|
|
|
Net income (loss) from discontinued operations, net of tax
|
$
|
(179
|
)
|
$
|
79
|
|
$
|
55
|
|
72
The following table is a summary of the carrying amounts of Alkali’s assets and liabilities included as “Total assets of discontinued operations” and “Total liabilities of discontinued operations” of December 31, 2016:
|
|
December 31,
2016 |
||
|
Assets
|
|
|
|
|
Current Assets
|
|
|
|
|
Accounts receivable, net of allowance for doubtful accounts
|
$
|
146
|
|
|
Inventories, net
|
|
33
|
|
|
All other current assets
|
|
21
|
|
|
Total current assets of discontinued operations
|
|
200
|
|
|
Noncurrent Assets
|
|
|
|
|
Property, plant and equipment, net
|
|
739
|
|
|
Mineral leaseholds, net
|
|
730
|
|
|
Other long-term assets
|
|
2
|
|
|
Total assets of discontinued operations
|
$
|
1,671
|
|
|
|
|
|
|
|
Liabilities
|
|
|
|
|
Current Liabilities
|
|
|
|
|
Accounts payable
|
$
|
44
|
|
|
Accrued liabilities
|
|
36
|
|
|
All other current liabilities
|
|
11
|
|
|
Total current liabilities of discontinued operations
|
|
91
|
|
|
All other long-term liabilities
|
|
20
|
|
|
Total liabilities of discontinued operations
|
$
|
111
|
|
4. Restructuring Expense
Restructuring income (expense) in our Consolidated Statements of Operations consists of charges related to employee severance and associated costs recorded in connection with the global restructuring of our TiO2 segment, cost improvement initiative and the alignment of our production output to market requirements (the “TiO2 Restructuring Initiatives”) which were recorded in “Restructuring income (expense)” in the Consolidated Statements of Operations. The TiO2 Restructuring Initiatives were completed in 2016 and resulted in a reduction in workforce of approximately 580 employees and outside contractors, the cessation of production of our sodium chlorate plant in Hamilton, Mississippi and the suspension of the operation of our Cooljarloo North Mine in Western Australia. Restructuring income (expense) in our Consolidated Statements of Operations also includes the reversal of restructuring expense pursuant to the settlement of claims previously filed relating to a prior restructure (“Restructuring Settlement”).
Restructuring income (expense) during 2017, 2016 and 2015 is as follows:
|
|
Year Ended December 31,
|
||||||||
|
|
2017
|
2016
|
2015
|
||||||
|
TiO2 Restructuring Initiatives
|
$
|
—
|
|
$
|
(1
|
)
|
$
|
(21
|
)
|
|
Restructuring Settlement
|
|
1
|
|
|
—
|
|
|
—
|
|
|
|
$
|
1
|
|
$
|
(1
|
)
|
$
|
(21
|
)
|
The cumulative amount incurred relating to our TiO2 Restructuring Initiatives completed in 2016 was $22 million.
73
Restructuring income (expense) by segment during 2017, 2016 and 2015 was as follows:
|
|
Year Ended December 31,
|
||||||||
|
|
2017
|
2016
|
2015
|
||||||
|
TiO2 segment
|
$
|
—
|
|
$
|
(1
|
)
|
$
|
(20
|
)
|
|
Corporate
|
|
1
|
|
|
—
|
|
|
(1
|
)
|
|
Total
|
$
|
1
|
|
$
|
(1
|
)
|
$
|
(21
|
)
|
A summary in the changes in the liability established for restructuring, which is included in “Accrued liabilities” in the Consolidated Balance Sheets, is as follows:
|
|
2017
|
2016
|
||||
|
Balance, January 1,
|
$
|
—
|
|
$
|
15
|
|
|
Additional provision, net
|
|
—
|
|
|
1
|
|
|
Cash payments
|
|
—
|
|
|
(16
|
)
|
|
Balance, December 31,
|
$
|
—
|
|
$
|
—
|
|
|
|
|
|
|
|
|
|
5. Other Income (Expense), Net
Other income (expense), net is comprised of the following:
|
|
Year Ended December 31,
|
||||||||
|
|
2017
|
2016
|
2015
|
||||||
|
Net realized and unrealized foreign currency gains (losses)
|
$
|
(20
|
)
|
$
|
(31
|
)
|
$
|
21
|
|
|
Interest income
|
|
10
|
|
|
3
|
|
|
7
|
|
|
Pension and postretirement benefit curtailment gains/(settlement losses)(1)
|
|
—
|
|
|
(1
|
)
|
|
—
|
|
|
Other, net
|
|
1
|
|
|
2
|
|
|
—
|
|
|
Total
|
$
|
(9
|
)
|
$
|
(27
|
)
|
$
|
28
|
|
| (1) | Losses related to our Netherlands pension plan. See Note 20. |
6. Income Taxes
Our operations are conducted through various subsidiaries in a number of countries throughout the world. We have provided for income taxes based upon the tax laws and rates in the countries in which operations are conducted and income is earned.
Income (loss) from continuing operations before income taxes is comprised of the following:
|
|
Year Ended December 31,
|
||||||||
|
|
2017
|
2016
|
2015
|
||||||
|
United Kingdom
|
$
|
(74
|
)
|
$
|
362
|
|
|
330
|
|
|
Australia
|
|
(143
|
)
|
|
(145
|
)
|
|
(359
|
)
|
|
International
|
|
130
|
|
|
(481
|
)
|
|
(320
|
)
|
|
Income (loss) from continuing operations before income taxes
|
$
|
(87
|
)
|
$
|
(264
|
)
|
$
|
(349
|
)
|
The income tax (provision) benefit is summarized below:
|
|
Year Ended December 31,
|
||||||||
|
|
2017
|
2016
|
2015
|
||||||
|
United Kingdom:
|
|
|
|
|
|
|
|
|
|
|
Current
|
$
|
(2
|
)
|
$
|
(1
|
)
|
$
|
(1
|
)
|
|
Deferred
|
|
1
|
|
|
—
|
|
|
—
|
|
|
Australian:
|
|
|
|
|
|
|
|
|
|
|
Current
|
|
—
|
|
|
65
|
|
|
(17
|
)
|
|
International:
|
|
|
|
|
|
|
|
|
|
|
Current
|
|
(2
|
)
|
|
52
|
|
|
(6
|
)
|
|
Deferred
|
|
(3
|
)
|
|
9
|
|
|
1
|
|
|
Income tax (provision) benefit
|
$
|
(6
|
)
|
$
|
125
|
|
$
|
(23
|
)
|
74
The following table reconciles the applicable statutory income tax rates to our effective income tax rates for “Income tax (provision) benefit” as reflected in the Consolidated Statements of Operations.
|
|
Year Ended December 31,
|
||||||||
|
|
2017
|
2016
|
2015
|
||||||
|
Statutory tax rate
|
|
19
|
%
|
|
30
|
%
|
|
30
|
%
|
|
Increases (decreases) resulting from:
|
|
|
|
|
|
|
|
|
|
|
Tax rate differences
|
|
53
|
|
|
44
|
|
|
30
|
|
|
U.S. federal tax reform (including rate change)
|
|
(1,166
|
)
|
|
—
|
|
|
—
|
|
|
Disallowable expenditures
|
|
33
|
|
|
(17
|
)
|
|
(4
|
)
|
|
Valuation allowances
|
|
675
|
|
|
80
|
|
|
(68
|
)
|
|
Corporate Reorganization
|
|
375
|
|
|
(123
|
)
|
|
—
|
|
|
State rate changes
|
|
3
|
|
|
(4
|
)
|
|
13
|
|
|
Withholding taxes
|
|
—
|
|
|
42
|
|
|
(11
|
)
|
|
Prior year accruals
|
|
(1
|
)
|
|
(3
|
)
|
|
—
|
|
|
Branch taxation
|
|
—
|
|
|
(3
|
)
|
|
1
|
|
|
Other, net
|
|
2
|
|
|
1
|
|
|
2
|
|
|
Effective tax rate
|
|
(7
|
)%
|
|
47
|
%
|
|
(7
|
)%
|
During the year ended December 31, 2017, Tronox Limited, the public parent which is registered under the laws of the State of Western Australia, became managed and controlled in the U.K. The statutory tax rate in the U.K. at December 31, 2017 was 19%. During 2016 and 2015, Tronox Limited was managed and controlled in Australia which has a statutory tax rate of 30%.
On December 22, 2017, the U.S. enacted major tax reform legislation. Our deferred tax impact of that legislation has been included in the effective income tax rate table above as a separate line item. It is almost entirely offset in the Valuation allowances line. The gross deferred tax impacts were primarily from our large deferred tax assets being revalued from the previous U.S. statutory rate of 35% down to the newly enacted rate of 21%, compensation accruals and deferred interest amounts which are no longer expected to be deductible under the new legislation, and a change to the portion of an indefinite lived deferred tax liability we could realize based on the new net operating loss indefinite carryforward period and usage limitation.
The effective tax rate for 2017 differs from the United Kingdom statutory rate of 19% primarily due to U.S. tax reform legislation, valuation allowances, and rates different than the United Kingdom statutory rate of 19%. For 2016 and 2015 it differs from the Australian statutory rate of 30% primarily due to valuation allowances, rates different than the Australian statutory rate of 30%, and withholding tax accruals on interest income.
During the fourth quarter of 2016, we implemented various steps of an internal corporate restructuring plan to simplify our corporate structure and thereby improve operational, administrative, and commercial synergies within each of our operating segments (the “Corporate Reorganization”). As a result of the Corporate Reorganization, we reduced our cross jurisdictional financing arrangements and consequently reversed the deferred tax assets related to intercompany interest deductions. The related withholding tax amounts were also reversed as a result of the Corporate Reorganization. Additionally, we reduced our deferred tax assets related to loss carryforwards which will no longer be available to utilize. The changes to deferred taxes are offset by valuation allowances and result in no impact to the consolidated provision for income taxes for the year ended December 31, 2016. The net income impact of the Corporate Reorganization was a benefit of $137 million in the fourth quarter of 2016, reflecting the reversal of $139 million of withholding tax accruals, offset by a foreign currency loss of $2 million. For the year ended December 31, 2016, the net income impact was $107 million, reflecting a net reduction in withholding tax accruals of $110 million, offset by of a foreign currency loss of $3 million.
Changes in our state apportionment factors and state statutory rate changes caused our overall effective state tax rates to change. Due to the large deferred tax asset created by the Anadarko litigation settlement in 2014, these state rate changes have a material impact on deferred taxes for 2015, 2016 and 2017. These are reflected within the State rate changes line above. The changes to deferred tax are offset by valuation allowances.
75
During 2017, the statutory tax rates on income earned in Australia (30%), the United States (35%), South Africa (28%), and the Netherlands (25%) are higher than the United Kingdom statutory rate of 19%. The statutory tax rate on income earned in Switzerland (8%) and Jersey (0%) are lower than the United Kingdom statutory rate of 19%. Also, we continue to maintain a full valuation allowance in Australia, the Netherlands, and the U.S.
Net deferred tax assets (liabilities) at December 31, 2017 and 2016 were comprised of the following:
|
|
December 31,
|
|||||
|
|
2017
|
2016
|
||||
|
Deferred tax assets:
|
|
|
|
|
|
|
|
Net operating loss and other carryforwards
|
$
|
1,834
|
|
$
|
1,899
|
|
|
Property, plant and equipment, net
|
|
81
|
|
|
106
|
|
|
Reserves for environmental remediation and restoration
|
|
28
|
|
|
25
|
|
|
Obligations for pension and other employee benefits
|
|
49
|
|
|
69
|
|
|
Investments
|
|
29
|
|
|
25
|
|
|
Grantor trusts
|
|
669
|
|
|
1,055
|
|
|
Inventories, net
|
|
7
|
|
|
11
|
|
|
Interest
|
|
245
|
|
|
326
|
|
|
Other accrued liabilities
|
|
2
|
|
|
6
|
|
|
Other
|
|
14
|
|
|
14
|
|
|
Total deferred tax assets
|
|
2,958
|
|
|
3,536
|
|
|
Valuation allowance associated with deferred tax assets
|
|
(2,825
|
)
|
|
(3,357
|
)
|
|
Net deferred tax assets
|
|
133
|
|
|
179
|
|
|
|
|
|
|
|
|
|
|
Deferred tax liabilities:
|
|
|
|
|
|
|
|
Property, plant and equipment, net
|
|
(244
|
)
|
|
(237
|
)
|
|
Intangible assets, net
|
|
(52
|
)
|
|
(86
|
)
|
|
Other
|
|
(7
|
)
|
|
(7
|
)
|
|
Total deferred tax liabilities
|
|
(303
|
)
|
|
(330
|
)
|
|
Net deferred tax liability
|
$
|
(170
|
)
|
$
|
(151
|
)
|
|
|
|
|
|
|
|
|
|
Balance sheet classifications:
|
|
|
|
|
|
|
|
Deferred tax assets — long-term
|
$
|
1
|
|
$
|
—
|
|
|
Deferred tax liabilities — long-term
|
$
|
(171
|
)
|
$
|
(151
|
)
|
|
Net deferred tax liability
|
$
|
(170
|
)
|
$
|
(151
|
)
|
The net deferred tax liabilities reflected in the above table include deferred tax assets related to grantor trusts, which were established as Tronox Incorporated emerged from bankruptcy during 2011. The balances relate to the assets contributed to such grantor trusts by Tronox Incorporated and the proceeds from the resolution of previous litigation of $5.2 billion during 2014, which resulted in additional deferred tax assets of $2.0 billion. This increase was fully offset by valuation allowances. During 2016 and 2017, the U.S. net operating loss increased as the grantor trusts spent a portion of the funds received from the litigation.
Both the Grantor trusts amount and the Net operating loss and other carryforwards amount above were significantly reduced during 2017 as a result of the U.S. tax reform federal rate change from 35% down to 21%. The reduction to the Net operating loss and other carryforwards line was offset by current year tax losses and by additional net capital losses resulting from the final steps in completing our 2016 Corporate Reorganization.
76
There was a decrease to our valuation allowance of $532 million during 2017, a decrease of $218 million in 2016, and an increase of $229 million in 2015. The table below sets forth the changes, by jurisdiction:
|
|
December 31,
|
||||||||
|
|
2017
|
2016
|
2015
|
||||||
|
Australia
|
$
|
359
|
|
$
|
(258
|
)
|
$
|
111
|
|
|
United Kingdom
|
|
10
|
|
|
—
|
|
|
—
|
|
|
United States
|
|
(899
|
)
|
|
40
|
|
|
113
|
|
|
The Netherlands
|
|
(1
|
)
|
|
—
|
|
|
6
|
|
|
South Africa
|
|
(1
|
)
|
|
—
|
|
|
(1
|
)
|
|
Total increase (decrease) in valuation allowances
|
$
|
(532
|
)
|
$
|
(218
|
)
|
$
|
229
|
|
The decrease to our valuation allowance in the United States in 2017 was primarily the result of the tax reform legislation impacts. The increase to our valuation allowances in both Australia and the United Kingdom during 2017 was to offset deferred tax assets generated from book losses and Corporate Reorganization net capital losses. The decrease to the valuation allowance in The Netherlands is due to $12 million NOL utilization, offset by the effect of foreign currency exchange rates changes between 2016 and 2017 of $11 million. The decrease to our valuation allowance in Australia during 2016 is primarily the result of the Corporate Reorganization. When we reduced our deferred tax assets related to intercompany interest deductions and loss carryforwards which will no longer be available to utilize, it caused a corresponding reduction to the valuation allowance and resulted in no impact to the consolidated provision for income taxes for the year ended December 31, 2016. The increase to our valuation allowance in the United States during 2016 is primarily the result of an increase to our net operating loss partially offset by a reduction to our deferred tax assets caused by a lower effective state income tax rate. The increases to our valuation allowance in Australia and the United States during 2015 are primarily the result of book losses during that year.
At December 31, 2017, we maintain full valuation allowances related to the total net deferred tax assets in Australia, the United States, and the Netherlands, as we cannot objectively assert that these deferred tax assets are more likely than not to be realized. It is reasonably possible that a portion of these valuation allowances could be reversed within the next year due to increased book profitability levels and our pending acquisition of the Cristal TiO2 Business. Future provisions for income taxes will include no tax benefits with respect to losses incurred and tax expense only to the extent of current state tax payments until the valuation allowances are eliminated. Additionally, we have valuation allowances against specific tax assets in South Africa and the United Kingdom.
These conclusions were reached by the application of ASC 740, Income Taxes, and require that all available positive and negative evidence be weighted to determine whether a valuation allowance should be recorded. The more significant evidential matter in Australia, the United States, the Netherlands, and the United Kingdom relates to recent book losses and the lack of sufficient projected taxable income. The more significant evidential matter for South Africa relates to capital losses and assets that cannot be depleted or depreciated for tax purposes.
An ownership change occurred during 2012, as a result of the Exxaro Transaction. These ownership changes resulted in a limitation under IRC Sections 382 and 383 related to U.S. net operating losses. We do not expect that the application of these net limitations related to the 2012 ownership change will have any material effect on our U.S. federal income tax liabilities. The Company did not have any transactions during 2017 that triggered an ownership change under IRC Sections 382 and 383.
The Company’s ability to use any net operating losses and section 163(j) interest expense carryforwards (which are now subject to Section 382 limitations per the new recently enacted U.S. major tax reform legislation) generated by it could be substantially limited if the Company were to experience another ownership change as defined under IRC Section 382. In general, an ownership change would occur if the Company’s “5-percent shareholders,” as defined under IRC Section 382, including certain groups of persons treated as “5-percent shareholders,” collectively increased their ownership in the Company by more than 50 percentage points over a
77
rolling three-year period. If an ownership change does occur during 2018, the resulting impact could be a limitation of up to $5.2 billion composed of both U.S. net operating losses and interest limitation carryforwards. There would be minimal impact on the $2.5 billion future Grantor Trust deductions from an IRC Sections 382 change.
The deferred tax assets generated by tax loss carryforwards in Australia, the United States, and the Netherlands have been fully offset by valuation allowances. The expiration of these carryforwards at December 31, 2017 is shown below. The Australian and South African tax loss carryforwards do not expire.
|
|
United Kingdom
|
Australia
|
The Netherlands
|
U.S. Federal
|
U.S. State
|
Tax Loss
Carryforwards Total |
||||||||||||
|
2018
|
$
|
—
|
|
$
|
—
|
|
$
|
—
|
|
$
|
—
|
|
$
|
21
|
|
$
|
21
|
|
|
2019
|
|
—
|
|
|
—
|
|
|
—
|
|
|
—
|
|
|
1
|
|
|
1
|
|
|
2020
|
|
—
|
|
|
—
|
|
|
—
|
|
|
—
|
|
|
16
|
|
|
16
|
|
|
2021
|
|
—
|
|
|
—
|
|
|
17
|
|
|
—
|
|
|
2
|
|
|
19
|
|
|
2022
|
|
—
|
|
|
—
|
|
|
34
|
|
|
—
|
|
|
60
|
|
|
94
|
|
|
Thereafter
|
|
—
|
|
|
—
|
|
|
143
|
|
|
4,114
|
|
|
4,015
|
|
|
8,272
|
|
|
No Expiration
|
|
55
|
|
|
636
|
|
|
—
|
|
|
—
|
|
|
—
|
|
|
691
|
|
|
Total tax loss carryforwards
|
$
|
55
|
|
$
|
636
|
|
$
|
194
|
|
$
|
4,114
|
|
$
|
4,115
|
|
$
|
9,114
|
|
At December 31, 2017, Tronox Limited had foreign subsidiaries with undistributed earnings. Although we would not be subject to income tax on these earnings, amounts totaling $150 million could be subject to withholding tax if distributed. We have made no provision for deferred taxes for Tronox Limited related to these undistributed earnings because they are considered to be indefinitely reinvested outside of the parents’ taxing jurisdictions.
The noncurrent liabilities section of our Consolidated Balance Sheet does not reflect any reserves for uncertain tax positions for either 2017 or 2016.
Our Australian returns are closed through 2011. However, under Australian tax laws, transfer pricing issues have no limitation period. Our U.S. returns are closed for years through 2012, with the exception of an amendment filed for the 2007 tax year. Our Netherlands returns are closed through 2014. Our South African returns are closed through 2012.
We believe that we have made adequate provision for income taxes that may be payable with respect to years open for examination; however, the ultimate outcome is not presently known and, accordingly, additional provisions may be necessary and/or reclassifications of noncurrent tax liabilities to current may occur in the future.
On December 22, 2017 the U.S. government enacted the Tax Cuts and Jobs Act (H.R. 1), which creates sweeping tax reform, and the SEC issued Staff Accounting Bulletin 118 (SAB 118), which provides guidance on accounting for tax effects of H.R. 1 under ASC 740. As listed above these acts passed late in the Company’s fiscal year significantly impacted the effective tax rate disclosure for the year ended December 31, 2017.
H.R. 1 includes a number of broad and complex changes to the U.S. tax code. The most significant of these changes to the Company is the reduction of the federal corporate tax rate from 35% down to 21%. This change represents the most substantial portion of the amount presented in the effective tax rate as U.S. federal tax reform. The effect of this rate change on the U.S. deferred tax assets and liabilities as well as their associated valuation allowance is considered to be complete. Other provisions of this tax reform have been reasonably estimated but are not yet deemed complete.
SAB 118 provides for a measurement period to complete the accounting for income taxes from H.R. 1 that should not extend beyond one year from the enactment date, or December 22, 2018. To the extent that the Company’s accounting for the income tax effects of any provisions in H.R. 1 is incomplete, a reasonable estimate was determinable and this provisional estimate is included in the financial statements. While we are able to make reasonable estimates of the impacts of H.R. 1 on the year ended December 31, 2017, the final impacts may differ from these estimates, due to, among other things, changes in our interpretations and assumptions, additional guidance that may be issued by the IRS or state taxing authorities, and actions not yet taken.
78
7. Loss Per Share
The computation of basic and diluted loss per share for the periods indicated is as follows:
|
|
Year Ended December 31,
|
||||||||
|
|
2017
|
2016
|
2015
|
||||||
|
Numerator – Basic and Diluted:
|
|
|
|
|
|
|
|
|
|
|
Net income (loss) from continuing operations
|
$
|
(93
|
)
|
$
|
(139
|
)
|
$
|
(372
|
)
|
|
Less: Net income (loss) from continuing operations attributable to noncontrolling interest
|
|
13
|
|
|
1
|
|
|
12
|
|
|
Undistributed net income (loss) from continuing operations attributable to Tronox Limited
|
|
(106
|
)
|
|
(140
|
)
|
|
(384
|
)
|
|
Percentage allocated to ordinary shares (1)
|
|
100
|
%
|
|
100
|
%
|
|
100
|
%
|
|
Net income (loss) from continuing operations available to ordinary shares
|
|
(106
|
)
|
|
(140
|
)
|
|
(384
|
)
|
|
Net income (loss) from discontinued operations available to ordinary shares
|
|
(179
|
)
|
|
79
|
|
|
55
|
|
|
Net income (loss) available to ordinary shares
|
$
|
(285
|
)
|
$
|
(61
|
)
|
$
|
(329
|
)
|
|
Denominator – Basic and Diluted:
|
|
|
|
|
|
|
|
|
|
|
Weighted-average ordinary shares (in thousands)
|
|
119,502
|
|
|
116,161
|
|
|
115,566
|
|
|
Net income (loss) per Ordinary Share(2):
|
|
|
|
|
|
|
|
|
|
|
Basic and diluted net income (loss) from continuing operations per ordinary share
|
$
|
(0.89
|
)
|
$
|
(1.20
|
)
|
$
|
(3.31
|
)
|
|
Basic and diluted net income (loss) from discontinued operations per ordinary share
|
|
(1.50
|
)
|
|
0.68
|
|
|
0.47
|
|
|
Basic and diluted net loss per ordinary share
|
$
|
(2.39
|
)
|
$
|
(0.52
|
)
|
$
|
(2.84
|
)
|
| (1) | Our participating securities do not have a contractual obligation to share in losses; therefore, when we have a net loss, none of the loss is allocated to participating securities. Consequently, for 2017, 2016, and 2015, the two-class method did not have an effect on our net loss per ordinary share calculation, and as such, dividends paid during the year did not impact this calculation. |
| (2) | Net loss per ordinary share amounts were calculated from exact, not rounded net loss and share information. |
In computing diluted net loss per share under the two-class method, we considered potentially dilutive shares. Anti-dilutive shares not recognized in the diluted net loss per share calculation were as follows:
|
|
December 31, 2017
|
December 31, 2016
|
December 31, 2015
|
|||||||||||||||
|
|
Shares
|
Average
Exercise Price |
Shares
|
Average
Exercise Price |
Shares
|
Average
Exercise Price |
||||||||||||
|
Options
|
|
1,707,133
|
|
$
|
21.27
|
|
|
1,970,481
|
|
$
|
21.19
|
|
|
2,189,967
|
|
$
|
21.15
|
|
|
Series A Warrants
|
|
222,939
|
|
$
|
8.51
|
|
|
1,440,662
|
|
$
|
8.51
|
|
|
1,354,529
|
|
$
|
9.63
|
|
|
Series B Warrants
|
|
328,563
|
|
$
|
9.37
|
|
|
1,953,207
|
|
$
|
9.37
|
|
|
1,833,834
|
|
$
|
10.63
|
|
|
Restricted share units
|
|
5,478,269
|
|
$
|
11.33
|
|
|
5,587,331
|
|
$
|
7.19
|
|
|
1,494,027
|
|
$
|
23.04
|
|
8. Fair Value Measurement
For financial instruments that are subsequently measured at fair value, the fair value measurement is grouped into levels. See Note 2.
At both December 31, 2017 and 2016, our financial instrument measured at fair value was our environmental rehabilitation trust, which amounted to $13 million and was categorized as Level 2. See Note 16.
The carrying amounts for cash and cash equivalents, restricted cash, accounts receivable, other current assets, accounts payable, short-term debt, and other current liabilities approximate their fair value because of the short-term nature of these instruments.
Our debt is recorded at historical amounts. At December 31, 2017, the fair value of our New Term Loan Facility (defined below) was $2.17 billion and at December 31, 2016, the fair value of the Prior Term Loan (defined below) was $1.5 billion. At December 31, 2016 the fair value of the Senior Notes due 2020, defined below, was $841 million. At December 31, 2017 and 2016, the fair value of the Senior Notes due 2022, defined below, was $609 million and $544 million, respectively. At December 31, 2017 the fair value of the Senior Notes
79
due 2025, defined below, was $463 million. We determined the fair value of the New Term Loan Facility, Prior Term Loan, the Senior Notes due 2020, the Senior Notes due 2022 and the Senior Notes due 2025 using quoted market prices. The fair value hierarchy for the New Term Loan Facility, Prior Term Loan, the Senior Notes due 2020, the Senior Notes due 2022 and the Senior Notes due 2025 is a Level 1 input. The balance outstanding under our UBS Revolver at December 31, 2016 is carried at contracted amounts, which approximates fair value based on the short-term nature of the borrowing and the variable interest rate. The fair value hierarchy for our UBS Revolver is a Level 2 input. See Note 15.
9. Accounts Receivable, Net of Allowance for Doubtful Accounts
Accounts receivable, net of allowance for doubtful accounts, consisted of the following:
|
|
December 31,
|
|||||
|
|
2017
|
2016
|
||||
|
Trade receivables
|
$
|
324
|
|
$
|
271
|
|
|
Other
|
|
13
|
|
|
8
|
|
|
Subtotal
|
|
337
|
|
|
279
|
|
|
Allowance for doubtful accounts
|
|
(1
|
)
|
|
(1
|
)
|
|
Accounts receivable, net of allowance for doubtful accounts
|
$
|
336
|
|
$
|
278
|
|
Bad debt expense was less than $1 million for each of the years ended 2017, 2016 and 2015. Bad debt expense was recorded in “Selling, general and administrative expenses” in the Consolidated Statements of Operations.
10. Inventories, net
Inventories, net consisted of the following:
|
|
December 31,
|
|||||
|
|
2017
|
2016
|
||||
|
Raw materials
|
$
|
137
|
|
$
|
191
|
|
|
Work-in-process
|
|
35
|
|
|
35
|
|
|
Finished goods, net
|
|
194
|
|
|
190
|
|
|
Materials and supplies, net(1)
|
|
110
|
|
|
97
|
|
|
Total
|
|
476
|
|
|
513
|
|
|
Less: Inventories, net – non-current
|
|
(3
|
)
|
|
(14
|
)
|
|
Inventories, net – current
|
$
|
473
|
|
$
|
499
|
|
| (1) | Consists of processing chemicals, maintenance supplies, and spare parts, which will be consumed directly and indirectly in the production of our products. |
Finished goods includes inventory on consignment of $28 million and $24 million at December 31, 2017 and 2016, respectively. At December 31, 2017 and 2016, inventory obsolescence reserves were $14 million and $17 million, respectively. At December 31, 2017 and December 31, 2016, reserves for lower of cost and net realizable value were $27 million and $26 million, respectively.
80
11. Property, Plant and Equipment
Property, plant and equipment, net of accumulated depreciation, consisted of the following:
|
|
December 31,
|
|||||
|
|
2017
|
2016
|
||||
|
Land and land improvements
|
$
|
95
|
|
$
|
94
|
|
|
Buildings
|
|
267
|
|
|
237
|
|
|
Machinery and equipment
|
|
1,387
|
|
|
1,275
|
|
|
Construction-in-progress
|
|
103
|
|
|
82
|
|
|
Other
|
|
41
|
|
|
38
|
|
|
Total
|
|
1,893
|
|
|
1,726
|
|
|
Less: accumulated depreciation
|
|
(778
|
)
|
|
(634
|
)
|
|
Property, plant and equipment, net(1)
|
$
|
1,115
|
|
$
|
1,092
|
|
| (1) | Substantially all of these assets are pledged as collateral for our debt. See Note 15. |
Depreciation expense related to property, plant and equipment during 2017, 2016, and 2015 was $125 million, $117 million, and $150 million, respectively, of which $122 million, $114 million, and $146 million, respectively, was recorded in “Cost of goods sold” in the Consolidated Statements of Operations. Depreciation expense of $3 million each for 2017 and 2016 and $4 million for 2015 was recorded in “Selling, general and administrative expenses” in the Consolidated Statements of Operations.
12. Mineral Leaseholds, net
Mineral leaseholds, net of accumulated depletion, consisted of the following:
|
|
December 31,
|
|||||
|
|
2017
|
2016
|
||||
|
Mineral leaseholds
|
$
|
1,303
|
|
$
|
1,257
|
|
|
Less accumulated depletion
|
|
(418
|
)
|
|
(380
|
)
|
|
Mineral leaseholds, net
|
$
|
885
|
|
$
|
877
|
|
Depletion expense related to mineral leaseholds during 2017, 2016, and 2015 was $32 million, $35 million, and $77 million, respectively, and was recorded in “Cost of goods sold” in the Consolidated Statements of Operations.
13. Intangible Assets, net
|
|
December 31, 2017
|
December 31, 2016
|
||||||||||||||||
|
|
Gross
Cost |
Accumulated
Amortization |
Net Carrying
Amount |
Gross
Cost |
Accumulated
Amortization |
Net Carrying
Amount |
||||||||||||
|
Customer relationships
|
$
|
291
|
|
$
|
(134
|
)
|
$
|
157
|
|
$
|
291
|
|
$
|
(115
|
)
|
$
|
176
|
|
|
TiO2 technology
|
|
32
|
|
|
(11
|
)
|
|
21
|
|
|
32
|
|
|
(9
|
)
|
|
23
|
|
|
Internal-use software
|
|
45
|
|
|
(25
|
)
|
|
20
|
|
|
45
|
|
|
(21
|
)
|
|
24
|
|
|
Intangible assets, net
|
$
|
368
|
|
$
|
(170
|
)
|
$
|
198
|
|
$
|
368
|
|
$
|
(145
|
)
|
$
|
223
|
|
Amortization expense related to intangible assets was $25 million each for 2017 and 2016 and $26 million during 2015, respectively, of which $24 million each was recorded during 2017 and 2016 and $25 million was recorded during 2015 in “Selling general and administrative expenses” in the Consolidated Statements of Operations. During 2017, 2016 and 2015, $1 million each of amortization expense was recorded in “Cost of goods sold” in the Consolidated Statements of Operations. Estimated future amortization expense related to intangible assets is $25 million for each of the years from 2018 through 2021, $23 million for 2022 and $75 million thereafter.
81
14. Accrued Liabilities
Accrued liabilities consisted of the following:
|
|
December 31,
|
|||||
|
|
2017
|
2016
|
||||
|
Employee-related costs and benefits
|
$
|
72
|
|
$
|
61
|
|
|
Interest
|
|
21
|
|
|
35
|
|
|
Sales rebates
|
|
19
|
|
|
20
|
|
|
Taxes other than income taxes
|
|
7
|
|
|
9
|
|
|
Other
|
|
44
|
|
|
25
|
|
|
Accrued liabilities
|
$
|
163
|
|
$
|
150
|
|
15. Debt
Debt Refinancing
On September 22, 2017, we completed our offering of our Senior Notes due 2025 for an aggregate principal amount of $450 million, the net proceeds of which together with borrowings under our $2.150 billion New Term Loan Facility and the proceeds from the Alkali sale, funded the redemption of the remaining outstanding balance of our Senior Notes due 2020 and we paid off the remaining outstanding balance of our $1.5 billion Prior Term Loan. In addition, we paid off the outstanding short-term borrowings under our UBS Revolver and entered into a new asset-based revolving syndicated facility with Wells Fargo (all defined below).
The refinancing of our Senior Notes due 2020 was considered a debt extinguishment in accordance with ASC 470, Debt (“ASC 470”). However, for refinancing of both the UBS Revolver and the Prior Term Loan, a portion of each of these refinancing arrangements were considered modifications and a portion considered extinguishments in accordance with the requirements of ASC 470 as some of the original lenders in the original syndications were part of the new lender base.
Short-term Debt
During the third quarter of 2017, we repaid the $150 million outstanding balance under the global senior secured asset-based syndicated revolving credit facility with UBS AG (the “UBS Revolver”). Concurrent with entering into the Wells Fargo Revolver, described below, the UBS Revolver was terminated. Unamortized original debt issuance costs of $1 million relating to the UBS Revolver were included in “Gain (loss) on extinguishment of debt” in the Consolidated Statements of Operations for the year ended December 31, 2017. The remaining unamortized balance of original debt issuance costs of $2 million relating to the UBS Revolver will be amortized over the life of the Wells Fargo Revolver.
Wells Fargo Revolver
On September 22, 2017, we entered into a new global senior secured asset-based syndicated revolving credit facility with Wells Fargo Bank, N.A. (the “Wells Fargo Revolver”). The Wells Fargo Revolver provides us with up to $550 million of revolving credit lines, with an $85 million sublimit for letters of credit, and has a maturity date of September 22, 2022. Our availability of revolving credit loans and letters of credit is subject to a borrowing base. Borrowings bear interest at our option, at either an adjusted London Interbank Offered Rate (“LIBOR”) plus an applicable margin that ranges from 1.25% to 1.75%, or a base rate, which is defined to mean the greatest of (a) the administrative agent’s prime rate, (b) the Federal funds effective rate plus 0.50% and (c) the adjusted LIBOR for a one-month period plus 1.00% plus a margin that ranges from 0.25% to 0.75%, in each case, based on the average daily borrowing availability. At December 31, 2017, there were no outstanding revolving credit loans under the Wells Fargo Revolver, excluding $19 million of issued and undrawn letters of credit under the Wells Fargo Revolver. Debt issuance costs associated with the Wells Fargo Revolver of $7 million ($2 million remaining from the UBS Revolver and $5 million incurred for the Wells Fargo Revolver) were included in “Other long-term assets” in the Consolidated Balance Sheets at December 31, 2017 and is amortized over the life of the Wells Fargo Revolver.
ABSA Revolving Credit Facility
On December 13, 2017, we entered into an agreement for a revolving credit facility with ABSA Bank Limited (“ABSA”) acting through its ABSA Capital Division for an amount up to R750 million (approximately
82
$61 million at December 31, 2017 exchange rate) maturing on December 13, 2020 (the “New ABSA Revolver”). The New ABSA Revolver replaces our R1.3 billion revolving credit facility (approximately $105 million at December 31, 2017 exchange rate) with ABSA that matured on June 14, 2017 (the “ABSA Revolver”). The New ABSA Revolver bears interest at (i) the base rate (defined as one month Johannesburg Interbank Agreed Rate, which is the mid-market rate for deposits in South African Rand for a period equal to the relevant period which appears on the Reuters Screen SAFEY Page alongside the caption YLD) as of 11h00 Johannesburg time on the first day of the applicable period, plus (ii) the Margin, which ranges from 3.45% to 3.85%, in each case, based on the aggregate loan amount outstanding as a percentage of the total commitments of the ABSA Facility. During 2017 we had no drawdowns or repayments on the New ABSA Revolver. During 2017, 2016 and 2015, we had no drawdowns or repayments on the ABSA Revolver. At December 31, 2016, there was no outstanding borrowings on the ABSA Revolver.
Long-term debt, net of an unamortized discount and debt issuance costs, consisted of the following:
|
|
Original
Principal |
Annual
Interest Rate |
Maturity
Date |
December 31,
2017 |
December 31,
2016 |
||||||||||
|
Prior Term Loan, net of unamortized discount(1)
|
$
|
1,500
|
|
Variable
|
|
—
|
|
$
|
—
|
|
$
|
1,441
|
|
||
|
New Term Loan Facility, net of unamortized discount(2)
|
|
2,150
|
|
Variable
|
|
9/22/2024
|
|
|
2,138
|
|
|
—
|
|
||
|
Senior Notes due 2020
|
|
900
|
|
|
6.375
|
%
|
|
—
|
|
|
—
|
|
|
896
|
|
|
Senior Notes due 2022
|
|
600
|
|
|
7.50
|
%
|
|
3/15/2022
|
|
|
584
|
|
|
584
|
|
|
Senior Notes due 2025
|
|
450
|
|
|
5.75
|
%
|
|
9/22/2025
|
|
|
450
|
|
|
—
|
|
|
Lease financing
|
|
|
|
|
|
|
|
|
|
|
19
|
|
|
19
|
|
|
Long-term debt
|
|
|
|
|
|
|
|
|
|
|
3,191
|
|
|
2,940
|
|
|
Less: Long-term debt due within one year
|
|
|
|
|
|
|
|
|
|
|
(17
|
)
|
|
(16
|
)
|
|
Debt issuance costs
|
|
|
|
|
|
|
|
|
|
|
(44
|
)
|
|
(36
|
)
|
|
Long-term debt, net
|
|
|
|
|
|
|
|
|
|
$
|
3,130
|
|
$
|
2,888
|
|
| (1) | Average effective interest rate of 5.1% and 4.9% during 2017 and 2016, respectively. |
| (2) | Average effective interest rate of 4.9% during 2017. |
At December 31, 2017, the scheduled maturities of our long-term debt were as follows:
|
|
Total Borrowings
|
||
|
2018
|
|
17
|
|
|
2019
|
|
22
|
|
|
2020
|
|
22
|
|
|
2021
|
|
23
|
|
|
2022
|
|
607
|
|
|
Thereafter
|
|
2,512
|
|
|
Total
|
|
3,203
|
|
|
Remaining accretion associated with the New Term Loan Facility
|
|
(12
|
)
|
|
Total borrowings
|
$
|
3,191
|
|
Prior Term Loan
On April 23, 2014, we, along with our wholly owned subsidiary, Tronox Pigments (Netherlands) B.V., and certain named guarantor subsidiaries, entered into a Third Amended and Restated Credit and Guaranty Agreement (the “Third Agreement”) with the lender party thereto and Goldman Sachs Bank USA, as administrative agent. Pursuant to the Third Agreement, we obtained a $1.5 billion senior secured term loan (the “Prior Term Loan”) with a maturity date of March 19, 2020. As mentioned above, on September 22, 2017, we repaid the remaining $1.4 billion outstanding balance of the $1.5 billion Prior Term Loan and entered into the New Term Loan Facility described below. Unamortized original debt discount and issuance costs of $1 million relating to the Prior Term Loan were included in “Gain (loss) on extinguishment of debt” in the Consolidated Statements of Operations for the year ended December 31, 2017. The remaining balance of unamortized original debt discount
83
and issuance costs of $3 million and $13 million, respectively, relating to the Prior Term Loan will continue to be amortized over the life of the New Term Loan Facility.
New Term Loan Facility
On September 22, 2017, we entered into a new senior secured first lien term loan facility (the “New Term Loan Facility”) with the lenders party thereto and Bank of America, N.A., as administrative agent, with a maturity date of September 22, 2024. The New Term Loan Facility consists of (i) a U.S. dollar term facility in an aggregate principal amount of $1.5 billion (the “New Term Loans”) with our subsidiary, Tronox Finance LLC (“Tronox Finance”) as the borrower and (ii) a U.S. dollar term facility in an aggregate principal amount of $650 million (the “Blocked Term Loan”) with our unrestricted subsidiary, Tronox Blocked Borrower LLC (the “Blocked Borrower”) as the borrower, which Blocked Term Loan was funded into a blocked account. Upon consummation of the Cristal Transaction, the Blocked Borrower will merge with and into Tronox Finance, and the Blocked New Term Loan will become available to Tronox Finance. If the Cristal Transaction is terminated, the Blocked Term Loan will be repaid to the lenders of such Blocked Term Loan. The proceeds from the Blocked Term Loan are included in “Restricted cash” in the Consolidated Balance Sheets at December 31, 2017. The Blocked Term Loan under the New Term Loan Facility bear interest at the “Applicable Rate” defined by reference to a grid-pricing matrix that relates to our first lien net leverage ratio. Based upon our first lien net leverage ratio the Applicable Rate under the New Term Loan Facility as of December 31, 2017 was 300 basis points plus LIBOR. The New Term Loan Facility was issued net of an original issue discount of $11 million. At December 31, 2017, the unamortized discount was $12 million which includes $3 million relating to the Prior Term Loan. Debt issuance costs of $4 million relating to the New Term Loan Facility were included in “Gain (loss) on extinguishment of debt” in the Consolidated Statements of Operations for the year ended December 31, 2017. Debt issuance costs of $30 million associated with the New Term Loan Facility ($13 million remaining from the Prior Term Loan and $17 million incurred for the New Term Loan Facility) were recorded as a direct reduction of the carrying value of the long-term debt as described below and will be amortized over the life of the New Term Loan Facility.
Senior Notes due 2020
On September 25, 2017, we redeemed (the “Redemption”) the $896 million outstanding balance of our $900 million aggregate principal, 6.375% senior notes due 2020 issued by Tronox Finance (the “Senior Notes due 2020”). The total cash payment made in connection with the Redemption was approximately $917 million, and included accrued interest of $7 million and a call premium of $14 million (the “Call Premium”) included in “Gain (loss) on extinguishment of debt” in the Consolidated Statements of Operations. During the year ended December 31, 2016, we repurchased $4 million of face value of the Senior Notes due 2020 at a price of 77% of par, resulting in a net gain of approximately $1 million, which was included in “Gain (loss) on extinguishment of debt” in the Consolidated Statements of Operations. The Senior Notes due 2020 were fully and unconditionally guaranteed on a senior and unsecured basis by us and certain of our subsidiaries. As a result of the Redemption, we are no longer required to present guarantor consolidating financial statements in this Form 10-K for the year ended December 31, 2017. In connection with the Redemption, we recorded a loss on extinguishment of debt of $22 million included in “Gain (loss) on extinguishment of debt” in the Consolidated Statements of Operations, of which $8 million related to unamortized debt issuance costs and $14 million related to the Call Premium.
Senior Notes due 2022
We have $600 million aggregate principal amount, 7.50% Senior Notes due 2022 (the “Senior Notes due 2022”) which notes were issued pursuant to an indenture dated March 19, 2015 (the “2022 Indenture”). The Senior Notes due 2022 have not been registered under the Securities Act, and may not be offered or sold in the U.S. absent registration or an applicable exemption from registration requirements. There were no repayments during the year ended December 31, 2017. During the year ended December 31, 2016, we repurchased $16 million of face value of notes at a weighted average price of 76% of par, resulting in a net gain of approximately $3 million, which was included in “Gain (loss) on extinguishment of debt” in the Consolidated Statements of Operations.
The Indenture and the Senior Notes due 2022 provide, among other things, that the Senior Notes due 2022 are senior unsecured obligations of Tronox Finance and are guaranteed on a senior and unsecured basis by us
84
and certain of our other subsidiaries. Interest is payable on March 15 and September 15 of each year until their maturity date of March 15, 2022. The terms of the 2022 Indenture, among other things, limit, in certain circumstances, the ability of us to: incur certain additional indebtedness and issue preferred stock; make certain dividends, distributions, investments and other restricted payments; sell certain assets; incur liens; agree to any restrictions on the ability of certain subsidiaries to make payments to us; consolidate or merge with or into, or sell substantially all of our assets to, another person; enter into transactions with affiliates; and enter into new lines of business. At December 31, 2017 and December 31, 2016, debt issuance costs related to the Senior Notes due 2022 of $8 million and $10 million, respectively, were recorded as a direct reduction of the carrying value of the long-term debt as described below.
Senior Notes due 2025
On September 22, 2017, Tronox Finance plc, issued 5.75% senior notes due 2025 for an aggregate principal amount of $450 million (the “Senior Notes due 2025”), which notes were issued under an indenture dated September 22, 2017 (the “2025 Indenture”). The 2025 Indenture and the Senior Notes due 2025 provide among other things, that the Senior Notes due 2025 are senior unsecured obligations of Tronox Finance plc and are guaranteed on a senior and unsecured basis by us and certain of our other subsidiaries. The Senior Notes due 2025 have not been registered under the Securities Act, and may not be offered or sold in the U.S. absent registration or an applicable exemption from registration requirements. Interest is payable on April 1 and October 1 of each year beginning on April 1, 2018 until their maturity date of October 1, 2025. The terms of the 2025 Indenture, among other things, limit, in certain circumstances, the ability of us and certain of our subsidiaries to: incur secured indebtedness, engage in certain sale-leaseback transactions and merge, consolidate or sell substantially all of our assets. The terms of the 2025 Indenture also include certain limitations on our non-guarantor subsidiaries incurring indebtedness. Debt issuance costs of $9 million relating to the Senior Notes due 2025 were recorded as a direct reduction of the carrying value of the long-term debt as described below and will be amortized over the life of the Senior Notes due 2025.
Liquidity and Capital Resources
As of December 31, 2017, we had $232 million available under the $550 million Wells Fargo Revolver, $61 million under the New ABSA Revolver and $1.1 billion in cash and cash equivalents. In addition, as of December 31, 2017 we had restricted cash of $653 million, which included the $650 million of proceeds from the Blocked Term Loan discussed above and $1 million of related interest.
Lease Financing
We have capital lease obligations in South Africa, which are payable through 2031 at a weighted average interest rate of approximately 14%. At December 31, 2017 and 2016, assets recorded under capital lease obligations were $23 million and $21 million, respectively. Related accumulated amortization was $8 million and $6 million at December 31, 2017 and 2016, respectively. During 2017, 2016, and 2015 we made principal payments of less than $1 million for all periods.
At December 31, 2017, future minimum lease payments, including interest, were as follows:
|
|
Principal
Repayments |
Interest
|
Total
Payments |
||||||
|
2018
|
$
|
1
|
|
$
|
3
|
|
$
|
4
|
|
|
2019
|
|
1
|
|
|
3
|
|
|
4
|
|
|
2020
|
|
1
|
|
|
2
|
|
|
3
|
|
|
2021
|
|
1
|
|
|
2
|
|
|
3
|
|
|
2022
|
|
1
|
|
|
2
|
|
|
3
|
|
|
Thereafter
|
|
14
|
|
|
10
|
|
|
24
|
|
|
Total
|
$
|
19
|
|
$
|
22
|
|
$
|
41
|
|
Bridge Facility
In connection with our acquisition of Alkali in 2015, we entered into a $600 million senior unsecured bridge facility (the “Bridge Facility”). The Bridge Facility was not utilized and terminated with the completion of the purchase of Alkali. During 2015, we incurred $8 million of financing fees related to the Bridge Facility, which were included in “Interest and debt expense, net” in the Consolidated Statements of Operations.
85
Debt Covenants
At December 31, 2017, we had no financial covenants in the Wells Fargo Revolver, the New ABSA Revolver and the New Term Loan Facility, however, only the New ABSA Revolver had a financial maintenance covenant that applies to local operations and only when the New ABSA Revolver is drawn upon.
Interest and Debt Expense, Net
Interest and debt expense, net of capitalized interest in the Consolidated Statements of Operations consisted of the following:
|
|
Year Ended December 31,
|
||||||||
|
|
2017
|
2016
|
2015
|
||||||
|
Interest on Prior Term Loan
|
$
|
49
|
|
$
|
67
|
|
$
|
63
|
|
|
Interest on New Term Loan Facility
|
|
26
|
|
|
—
|
|
|
—
|
|
|
Interest on Senior Notes due 2020
|
|
42
|
|
|
57
|
|
|
57
|
|
|
Interest on Senior Notes due 2022
|
|
44
|
|
|
44
|
|
|
35
|
|
|
Interest on Senior Notes due 2025
|
|
7
|
|
|
—
|
|
|
—
|
|
|
Amortization of deferred debt issuance costs and discounts on debt
|
|
15
|
|
|
11
|
|
|
11
|
|
|
Bridge facility
|
|
—
|
|
|
—
|
|
|
8
|
|
|
Capitalized interest
|
|
(2
|
)
|
|
(3
|
)
|
|
(6
|
)
|
|
Other
|
|
7
|
|
|
9
|
|
|
8
|
|
|
Total interest and debt expense, net
|
$
|
188
|
|
$
|
185
|
|
$
|
176
|
|
In connection with obtaining debt, we incurred debt issuance costs, which are being amortized through the respective maturity dates using the effective interest method for our long-term debt and on a straight line basis for our Wells Fargo Revolver. At December 31, 2017, we had deferred debt issuance costs of $7 million related to the Wells Fargo Revolver, which is recorded in “Other long-term assets” in the Consolidated Balance Sheets. At December 31, 2017, we had $12 million and $27 million of debt discount and debt issuance costs, respectively, related to the New Term Loan Facility, which was recorded as a direct reduction of the carrying value of the long-term debt in the Consolidated Balance Sheets. At December 31, 2017, we had $9 million of debt issuance costs, related to the Senior Notes due 2025, which was recorded as a direct reduction of the carrying value of the long-term debt in the Consolidated Balance Sheets. At December 31, 2017 and December 31, 2016, we had $8 million and $10 million, respectively, of debt issuance costs related to the Senior Notes 2022, which were recorded as a direct reduction of the carrying value of the long-term debt in the Consolidated Balance Sheets.
16. Asset Retirement Obligations
Asset retirement obligations consist primarily of rehabilitation and restoration costs, landfill capping costs, decommissioning costs, and closure and post-closure costs. Activity related to asset retirement obligations was as follows:
|
|
Year Ended December 31,
|
|||||
|
|
2017
|
2016
|
||||
|
Balance, January 1,
|
$
|
76
|
|
$
|
81
|
|
|
Additions
|
|
1
|
|
|
1
|
|
|
Accretion expense
|
|
5
|
|
|
5
|
|
|
Remeasurement/translation
|
|
5
|
|
|
1
|
|
|
Changes in estimates, including cost and timing of cash flows
|
|
—
|
|
|
(11
|
)
|
|
Settlements/payments
|
|
(5
|
)
|
|
(1
|
)
|
|
Balance, December 31,
|
$
|
82
|
|
$
|
76
|
|
86
|
|
December 31,
|
|||||
|
|
2017
|
2016
|
||||
|
Asset retirement obligations were classified as follows:
|
|
|
|
|
|
|
|
Current portion included in “Accrued liabilities”
|
$
|
3
|
|
$
|
3
|
|
|
Noncurrent portion included in “Asset retirement obligations”
|
|
79
|
|
|
73
|
|
|
Asset retirement obligations
|
$
|
82
|
|
$
|
76
|
|
We used the following assumptions in determining asset retirement obligations at December 31, 2017: inflation rates between 2.5% - 4.2% per year; credit adjusted risk-free interest rates between 7.0% -17.1%; the life of mines between 12-27 years and the useful life of assets between 4-33 years.
During 2016, we amended our lease agreement for our TiO2 pigment facility in Botlek, the Netherlands, which included an option to extend the lease term for an additional 25 years. This amendment increased the estimated useful life used in determining the asset retirement obligation and consequently, we recognized a $10 million reduction to this liability.
Environmental Rehabilitation Trust
In accordance with applicable regulations, we have established an environmental rehabilitation trust for the prospecting and mining operations in South Africa, which receives, holds, and invests funds for the rehabilitation or management of asset retirement obligations. The trustees of the fund are appointed by us, and consist of sufficiently qualified employees capable of fulfilling their fiduciary duties. At both December 31, 2017 and 2016, the environmental rehabilitation trust assets were $13 million, which were recorded in “Other long-term assets” in the Consolidated Balance Sheets.
17. Commitments and Contingencies
Leases—We lease office space, railcars, storage, and equipment under non-cancelable lease agreements, which expire on various dates through 2030. Total rental expense related to operating leases recorded in “Cost of goods sold” in the Consolidated Statements of Operations was $22 million, $21 million and $25 million during 2017, 2016 and 2015, respectively. Total rental expense related to operating leases recorded in “Selling, general and administrative expense” in the Consolidated Statements of Operations, was $2 million each during 2017, 2016 and 2015.
At December 31, 2017, minimum rental commitments under non-cancelable operating leases were as follows:
|
|
Operating
|
||
|
2018
|
$
|
19
|
|
|
2019
|
|
8
|
|
|
2020
|
|
4
|
|
|
2021
|
|
4
|
|
|
2022
|
|
3
|
|
|
Thereafter
|
|
6
|
|
|
Total
|
$
|
44
|
|
Purchase and Capital Commitments—At December 31, 2017, purchase commitments were $149 million for 2018, $55 million for 2019, $43 million for 2020, $34 million for 2021, $24 million for 2022, and $103 million thereafter.
Letters of Credit—At December 31, 2017, we had outstanding letters of credit, bank guarantees, and performance bonds of $46 million, of which $19 million were letters of credit issued under the Wells Fargo Revolver, $20 million were bank guarantees issued by ABSA Bank Limited (“ABSA”), $5 million were bank guarantees issued by Standard Bank and $2 million were performance bonds issued by Westpac Banking Corporation.
Other Matters—From time to time, we may be party to a number of legal and administrative proceedings involving legal, environmental, and/or other matters in various courts or agencies. These proceedings,
87
individually and in the aggregate, may have a material adverse effect on us. These proceedings may be associated with facilities currently or previously owned, operated or used by us and/or our predecessors, some of which may include claims for personal injuries, property damages, cleanup costs, and other environmental matters. Current and former operations may also involve management of regulated materials that are subject to various environmental laws and regulations including the Comprehensive Environmental Response Compensation and Liability Act, the Resource Conservation and Recovery Act or state equivalents. Similar environmental laws and regulations and other requirements exist in foreign countries in which we operate.
On December 5, 2017, the U.S. Federal Trade Commission (FTC) filed an administrative complaint against Tronox Limited, the National Industrialization Company of Saudi Arabia (“TASNEE”), National Titanium Dioxide Company Limited (Cristal) and Cristal USA Inc. The complaint alleges that the proposed acquisition by Tronox of the TiO2 business of Cristal would violate Section 7 of the Clayton Antitrust Act and Section 5 of the FTC Act. The administrative complaint seeks, among other things, a permanent injunction to prevent the transaction from being completed.
On January 23, 2018, Tronox Limited filed suit against the FTC in the U.S. District Court for the Northern District of Mississippi. The complaint seeks a declaration that Tronox’s proposed acquisition of the TiO2 business of Cristal is lawful under Section 7 of the Clayton Antitrust Act and Section 5 of the FTC Act or, in the alternative, an injunction barring the FTC from seeking to prevent the acquisition at a later date.
18. Shareholders’ Equity
The changes in outstanding Class A ordinary shares (“Class A Shares”) and Class B Shares for 2016 and 2017 were as follows:
|
Class A Shares:
|
|
|
|
|
Balance, January 1, 2016
|
|
64,521,851
|
|
|
Shares issued for share-based compensation
|
|
732,724
|
|
|
Shares cancelled for share-based compensation
|
|
(89,062
|
)
|
|
Shares issued upon warrants exercised
|
|
159
|
|
|
Balance, December 31, 2016
|
|
65,165,672
|
|
|
Shares issued for share-based compensation
|
|
3,048,824
|
|
|
Shares cancelled for share-based compensation
|
|
(623,920
|
)
|
|
Shares issued upon options exercised
|
|
165,974
|
|
|
Shares issued upon warrants exercised
|
|
2,359,913
|
|
|
Exxaro Share Transaction
|
|
22,425,000
|
|
|
Balance, December 31, 2017
|
|
92,541,463
|
|
|
Class B Shares:
|
|
|
|
|
Balance, December 31, 2016
|
|
51,154,280
|
|
|
Exxaro Share Transaction
|
|
(22,425,000
|
)
|
|
Balance, December 31, 2017
|
|
28,729,280
|
|
Warrants
We have outstanding Series A Warrants (the “Series A Warrants”) and Series B Warrants (the “Series B Warrants”), together (the “Warrants”). At December 31, 2017, holders of the Series A Warrants and the Series B Warrants were entitled to purchase 6.02 and 6.03 of Class A Shares, respectively, and receive $12.50 in cash at an exercise price of $51.21 for each Series A Warrant and $56.51 for each Series B Warrant. The Warrants have a seven-year term from the date initially issued and expired on February 14, 2018. A holder may exercise the Warrants by paying the applicable exercise price in cash or exercising on a cashless basis. The Warrants are freely transferable by the holder. At December 31, 2017 and 2016, there were 37,033 and 239,306 Series A Warrants outstanding, respectively, and 54,488 and 323,915 Series B Warrants outstanding, respectively.
88
Dividends
During 2017 and 2016, we declared and paid quarterly dividends to holders of our Class A Shares and Class B Shares as follows:
|
|
Q1 2017
|
Q2 2017
|
Q3 2017
|
Q4 2017
|
||||||||
|
Dividend per share
|
$
|
0.045
|
|
$
|
0.045
|
|
$
|
0.045
|
|
$
|
0.045
|
|
|
Total dividend
|
$
|
6
|
|
$
|
6
|
|
$
|
5
|
|
$
|
6
|
|
|
Record date (close of business)
|
March 6
|
May 15
|
August 21
|
November 20
|
||||||||
|
|
Q1 2016
|
Q2 2016
|
Q3 2016
|
Q4 2016
|
||||||||
|
Dividend per share
|
$
|
0.25
|
|
$
|
0.045
|
|
$
|
0.045
|
|
$
|
0.045
|
|
|
Total dividend
|
$
|
30
|
|
$
|
5
|
|
$
|
5
|
|
$
|
6
|
|
|
Record date (close of business)
|
March 4
|
May 16
|
August 17
|
November 16
|
||||||||
Accumulated Other Comprehensive Income (Loss) Attributable to Tronox Limited
The tables below present changes in accumulated other comprehensive income (loss) by component for 2017, 2016 and 2015.
|
|
Cumulative
Translation Adjustment |
Pension
Liability Adjustment |
Unrealized
Gains (losses) on Derivatives |
Total
|
||||||||
|
Balance, January 1, 2015
|
$
|
(281
|
)
|
$
|
(117
|
)
|
$
|
—
|
|
$
|
(398
|
)
|
|
Other comprehensive income (loss)
|
|
(215
|
)
|
|
12
|
|
|
—
|
|
|
(203
|
)
|
|
Amounts reclassified from accumulated other comprehensive income (loss)
|
|
—
|
|
|
3
|
|
|
—
|
|
|
3
|
|
|
Balance, December 31, 2015
|
$
|
(496
|
)
|
$
|
(102
|
)
|
$
|
—
|
|
$
|
(598
|
)
|
|
Other comprehensive income (loss)
|
|
88
|
|
|
8
|
|
|
4
|
|
|
100
|
|
|
Amounts reclassified from accumulated other comprehensive income (loss)
|
|
—
|
|
|
2
|
|
|
(1
|
)
|
|
1
|
|
|
Balance, December 31, 2016
|
$
|
(408
|
)
|
$
|
(92
|
)
|
$
|
3
|
|
$
|
(497
|
)
|
|
Other comprehensive income (loss)
|
|
96
|
|
|
(6
|
)
|
|
(3
|
)
|
|
87
|
|
|
Amounts reclassified from accumulated other comprehensive income (loss)
|
|
—
|
|
|
8
|
|
|
(1
|
)
|
|
7
|
|
|
Balance, December 31, 2017
|
$
|
(312
|
)
|
$
|
(90
|
)
|
$
|
(1
|
)
|
$
|
(403
|
)
|
19. Share-based Compensation
Share-based compensation expense consisted of the following:
|
|
Year Ended December 31,
|
||||||||
|
|
2017
|
2016
|
2015
|
||||||
|
Restricted shares and restricted share units
|
$
|
30
|
|
$
|
20
|
|
$
|
15
|
|
|
Options
|
|
—
|
|
|
2
|
|
|
5
|
|
|
T-Bucks Employee Participation Plan
|
|
1
|
|
|
2
|
|
|
2
|
|
|
Total share-based compensation expense (continuing operations)(1)
|
$
|
31
|
|
$
|
24
|
|
$
|
22
|
|
| (1) | Excludes $2 million, $1 million and less than $1 million of share-based compensation relating to discontinued operations. See Note 3. |
Tronox Limited Management Equity Incentive Plan
On June 15, 2012, we adopted the MEIP, which permits the grant of awards that are comprised of incentive options, nonqualified options, share appreciation rights, restricted shares, restricted share units, performance awards, and other share-based awards, cash payments, and other forms as the compensation committee of the Board of Directors (the “Board”) in its discretion deems appropriate, including any combination of the above. Subject to further adjustment, the maximum number of shares which may be the subject of awards (inclusive of incentive options) is 20,781,225 Class A Shares. These shares were increased by 8,000,000 on the affirmative vote of our shareholders on May 25, 2016.
89
Restricted Shares
We did not grant any restricted shares during 2017.
The following table presents a summary of activity for 2017:
|
|
Number
of Shares |
Weighted Average
Grant Date Fair Value |
||||
|
Outstanding, January 1, 2017
|
|
284,400
|
|
$
|
6.09
|
|
|
Vested
|
|
(107,928
|
)
|
|
8.00
|
|
|
Outstanding, December 31, 2017
|
|
176,472
|
|
$
|
4.92
|
|
|
Expected to vest, December 31, 2017
|
|
176,472
|
|
$
|
4.92
|
|
At December 31, 2017, there was less than $1 million of unrecognized compensation expense related to nonvested restricted shares, which is expected to be recognized over a weighted-average period of 1.0 years. Since the restricted shares were granted to certain members of our Board, the unrecognized compensation expense was not adjusted for estimated forfeitures. The weighted-average grant-date fair value of restricted shares granted during 2016 and 2015 was $4.16 per share and $22.60 per share, respectively. The total fair value of restricted shares that vested during 2017, 2016 and 2015 was $1 million, $3 million, and $4 million, respectively.
Restricted Share Units (“RSUs”)
During 2017, we granted RSUs, which have time and/or performance conditions. Both the time-based awards and the performance-based awards are classified as equity awards. For the time-based awards, 1,075 RSUs vested immediately, 14,053 RSUs vest ratably over a six-month period, 100,160 RSUs vest ratably over a one-year period, 1,951 RSUs vest ratably over a twenty-eight month period, 12,869 RSUs vest ratably over a thirty-one month period and 773,774 RSUs vest ratably over a three-year period, and are valued at the weighted average grant date fair value. For the performance-based awards, 1,949 RSUs cliff vest at the end of twenty-eight months, 154,639 RSUs cliff vest at the end of thirty-one months, 1,145,933 cliff vest at the end of the three years and 883,538 RSUs cliff vest at the end of the forty months. Included in the performance-based awards are 788,588 RSUs for which vesting is determined based on a relative Total Stockholder Return (“TSR”) calculation over the applicable measurement period. The TSR metric is considered a market condition for which we use a Monte Carlo simulation to determine the grant date fair value. A total of 1,397,471 RSUs were granted, pursuant to an Integration Incentive Award program (“Integration Incentive Award”) established in connection with the Cristal Transaction, to certain executive officers and managers with significant integration accountability. If the Cristal Transaction does not close by July 1, 2018, then the Integration Incentive Award granted will be cancelled.
The following table presents a summary of activity for 2017:
|
|
Number
of Shares |
Weighted Average
Grant Date Fair Value |
||||
|
Outstanding, January 1, 2017
|
|
5,587,331
|
|
$
|
7.19
|
|
|
Granted
|
|
3,089,941
|
|
|
17.55
|
|
|
Vested
|
|
(2,392,662
|
)
|
|
9.55
|
|
|
Forfeited
|
|
(806,341
|
)
|
|
11.83
|
|
|
Outstanding, December 31, 2017
|
|
5,478,269
|
|
$
|
11.33
|
|
|
Expected to vest, December 31, 2017
|
|
5,849,495
|
|
$
|
10.27
|
|
At December 31, 2017, there was $33 million of unrecognized compensation expense related to nonvested RSUs, adjusted for estimated forfeitures, which is expected to be recognized over a weighted-average period of 2.0 years. The weighted-average grant-date fair value of RSUs granted during 2017, 2016 and 2015 was $17.55 per unit, $4.07 per unit, and $23.47 per unit, respectively. The total fair value of RSUs that vested during 2017, 2016 and 2015 was $23 million, $10 million and $6 million, respectively.
90
Options
The following table presents a summary of activity for 2017:
|
|
Number of
Options |
Weighted
Average Exercise Price |
Weighted
Average Contractual Life (years) |
Intrinsic
Value |
||||||||
|
Outstanding, January 1, 2017
|
|
1,970,481
|
|
$
|
21.19
|
|
|
6.38
|
|
$
|
—
|
|
|
Exercised
|
|
(165,974
|
)
|
|
20.10
|
|
|
|
|
|
|
|
|
Forfeited
|
|
(4,273
|
)
|
|
21.98
|
|
|
|
|
|
|
|
|
Expired
|
|
(93,101
|
)
|
|
21.58
|
|
|
|
|
|
|
|
|
Outstanding, December 31, 2017
|
|
1,707,133
|
|
$
|
21.27
|
|
|
4.29
|
|
$
|
1
|
|
|
Expected to vest, December 31, 2017
|
|
794
|
|
$
|
22.69
|
|
|
7.01
|
|
$
|
—
|
|
|
Exercisable, December 31, 2017
|
|
1,706,339
|
|
$
|
21.27
|
|
|
4.29
|
|
$
|
1
|
|
The aggregate intrinsic values in the table represent the total pre-tax intrinsic value (the difference between our share price at the indicated dates and the options’ exercise price, multiplied by the number of in-the-money options) that would have been received by the option holders had all option holders exercised their in-the-money options at the end of the year. The amount will change based on the fair market value of our stock. Total intrinsic value of options exercised during 2017 was $1 million. No options were exercised during 2016 and consequently, there was no related intrinsic value. Total intrinsic value of options exercised during 2015 was less than $1 million. We issue new shares upon the exercise of options. During 2017, we received $3 million in cash for the exercise of stock options. Since no stock options were exercised during 2016, no cash was received. During 2015, we received $3 in cash for the exercise of stock options.
At December 31, 2017 and 2016, unrecognized compensation expense related to options, adjusted for estimated forfeitures, was nil and less than $1 million, respectively.
We did not issue any options during 2017 and 2016. During 2015, we granted 2,380 with a weighted average grant date fair value of $7.04.
Fair value of options granted is determined on the grant date using the Black-Scholes option-pricing model and is recognized in earnings on a straight-line basis over the employee service period of three years, which is the vesting period. The assumptions used in the Black-Scholes option-pricing model on the grant date were as follows:
The fair value is based on the closing price of our Class A Shares on the grant date. The risk-free interest rate is based on U.S. Treasury Strips available with a maturity period consistent with the expected life assumption. The expected volatility assumption is based on historical price movements of our peer group. Dividend yield is determined based on the Company’s expected dividend payouts.
T-Bucks EPP
During 2012, we established the T-Bucks EPP for the benefit of certain qualifying employees of our South African subsidiaries. We funded a T-Bucks Trust (the “Trust”) with R124 million (approximately $15 million), which was used to acquire Class A Shares. On May 31, 2017, the shares held by the Trust became fully vested. The Trust sold 546,403 shares in June 2017 on behalf of the participants who elected to receive cash. The remaining participants elected to receive shares.
Long-Term Incentive Plan
We have a long-term incentive plan (the “LTIP”) for the benefit of certain qualifying employees of Tronox subsidiaries in South Africa and Australia. The LTIP is classified as a cash settled compensation plan, and is re-measured to fair value at each reporting date. At December 31, 2017 and 2016, the LTIP plan liability was nil and less than $1 million, respectively.
91
20. Pension and Other Postretirement Healthcare Benefits
We sponsor a noncontributory defined benefit retirement plans, the qualified retirement plan in the United States, a collective defined contribution plan in the Netherlands, and a South Africa postretirement healthcare plan. We previously sponsored a defined benefit retirement plan in the Netherlands until it was settled in 2016 as described below.
We sponsored a noncontributory defined benefit plan that covered eligible employees of Alkali, which became effective from the acquisition date of Alkali, on April 1, 2015 (the “Alkali Qualified Plan”). Our obligations under the Alkali Qualified Plan transferred with the Alkali Sale and $5 million in actuarial losses and prior service costs previously included in “Accumulated other comprehensive loss” were recognized as a loss within “Income (loss) from discontinued operations, net of tax” on the Statement of Operations for the year ended December 31, 2017.
U.S. Plans
Qualified Retirement Plan — We sponsor a noncontributory qualified defined benefit plan (funded) (the “U.S. Qualified Plan”) in accordance with the Employee Retirement Income Security Act of 1974 (“ERISA”) and the Internal Revenue Code. We made contributions into funds managed by a third party, and those funds are held exclusively for the benefit of the plan participants. Benefits under the U.S. Qualified Plan were generally calculated based on years of service and final average pay. The U.S. Qualified Plan was frozen and closed to new participants on June 1, 2009.
Postretirement Healthcare Plan — We sponsored an unfunded U.S. postretirement healthcare plan. Effective January 1, 2015, we eliminated the pre-65 retiree medical programs. Participants who retired prior to January 1, 2015 received a one-time subsidy aggregating to less than $1 million towards medical cost through a health reimbursement arrangement that we established for them. Benefits under this plan for participants who have not retired by January 1, 2015 were eliminated.
Foreign Plans
The Netherlands Plan — On January 1, 2007, we established the TDF-Botlek Pension Fund Foundation (the “Netherlands Plan”) to provide defined pension benefits to qualifying employees of Tronox Pigments (Holland) B.V. and its related companies. During the fourth quarter of 2014, in response to the tax and pension legislation changes in the Netherlands, our benefit committee approved to end future benefit accruals under the Netherlands Plan and replaced it with a multiemployer plan effective January 1, 2015 (the “Netherlands Collective Contribution Plan”). As a result of this decision, effective from January 1, 2015, benefit contributions commenced under the multiemployer plan while the Netherlands Plan became effectively “frozen”.
In August 2016, we agreed with the Board of Trustees of the Netherlands Pension Plan to settle the VPL portion of the plan. The VPL Plan was a small transition arrangement established in 2005 for the benefit of certain of our Botlek employees, which was added to the Netherlands Pension Plan when it was established in 2007. Under the settlement agreement, we transferred $1 million into accounts established with industrywide Pension Fund for the Graphical Industry (“PGB”) for the benefit of the participants as a full settlement of our obligation under the VPL Plan. Accordingly, during 2016, we recognized a curtailment gain of $1 million included in “Other income (expense), net” in the Consolidated Statement of Operations. This amount had previously been recognized in “Accumulated other comprehensive loss” in the Consolidated Balance Sheet as prior service credits. Consequently, as of August 31, 2016, we remeasured the plan assets and the projected benefit obligation of the Netherlands Pension Plan which resulted in €19 million (approximately $21 million) of actuarial losses which was recognized in “Accumulated other comprehensive loss” during 2016.
On November 1, 2016 (the “Settlement Date”), we agreed with the Board of Trustees to settle the remaining portion of the Netherlands Pension Plan. Under the settlement agreement, we transferred the Netherlands Botlek Pension Plan assets of $126 million to the PGB for the benefit of the participants as a full settlement of our obligation under the Pension Plan. Consequently, we derecognized the pension liability from our Consolidated Balance Sheet, resulting in a settlement gain of $31 million, which was recorded in “Accumulated other comprehensive loss” in the Consolidated Balance Sheet at December 31, 2016 and a settlement loss of $2 million, which was recorded in the “Other income (expense) in the Consolidated Statement of Operations for the year ended December 31, 2016.
92
Netherlands Collective Contribution Plan — Effective January 1, 2015, we ceased offering benefits under the Netherlands Plan to qualifying employees and established a multiemployer plan, the collective contribution plan (“CDC Plan”). Under the CDC plan, employees earn benefits based on their pensionable salaries each year determined using a career average benefit formula. The collective bargaining agreement between us and the participants require us to contribute 20.6% of the participants’ pensionable salaries into a pooled fund administered by the industrywide PGB. The pensionable salary is the annual income of employees subject to a cap, which is adjusted each year to reflect the current requirements of the Netherlands’ Wages and Salaries Tax Act of 1964. Our obligation under this plan is limited to the fixed percentage contribution we make each year. That is, investment risks, mortality risks and other actuarial risks typically associated with a defined benefit plan are borne by the employees. Additionally, the employees are entitled to any returns generated from the investment activities of the fund.
The following table outlines the details of our participation in the CDC Plan for the year ended December 31, 2017. The CDC disclosures provided herein are based on the fund’s 2016 annual report, which is the most recently available public information. Based on the total plan assets and accumulated benefit obligation information in the plan’s annual report, the zone status was green as of December 31, 2016. A green zone status indicates that the plan was at least 80 percent funded. The “FIP/RP Status Pending/Implemented” column indicates whether a financial improvement plan (FIP) or a rehabilitation plan (RP) is either pending or has been implemented. As of December 31, 2017, we are not aware of any financial improvement or rehabilitation plan being implemented or pending. The last column lists the expiration date of the collective-bargaining agreement to which the plan is subject.
|
|
|
Pension Protection Act
Zone Status |
|
Tronox Contributions
|
|
|
||
|
Pension
Fund |
EIN/Pension
Plan Number |
2017
|
2016
|
FIP/RP
Pending/ Implemented |
2017
|
2016
|
Surcharge
Imposed |
Expiration
date of Collective- Bargaining Agreement |
|
PGB
|
NA
|
N/A
|
Green
|
No
|
4
|
4
|
No
|
12/31/2019
|
On the basis of the information available in the CDC Plan 2016 annual report, our contribution does not constitute more than 5 percent of the total contribution to the plan by all participants. During 2017, the fund did not impose any surcharge on us.
South Africa Postretirement Healthcare Plan — As part of the Exxaro Transaction, we established a post-employment healthcare plan, which provides medical and dental benefits to certain Namakwa Sands employees, retired employees and their registered dependents (the “South African Plan”). The South African Plan provides benefits as follows: (i) members employed before March 1, 1994 receive 100% post-retirement and death-in-service benefits; (ii) members employed on or after March 1, 1994 but before January 1, 2002 receive 2% per year of completed service subject to a maximum of 50% post-retirement and death-in-service benefits; and, (iii) members employed on or after January 1, 2002 receive no post-retirement and death-in-service benefits.
Benefit Obligations and Funded Status — The following provides a reconciliation of beginning and ending benefit obligations, beginning and ending plan assets, funded status, and balance sheet classification of our pension and postretirement healthcare plans as of and for the years ended December 31, 2017 and 2016. The benefit obligations and plan assets associated with our principal benefit plans are measured on December 31.
93
|
|
Retirement Plans
|
Postretirement Healthcare
Plans |
||||||||||
|
|
Year Ended December
|
Year Ended December
|
||||||||||
|
|
2017
|
2016
|
2017
|
2016
|
||||||||
|
Change in benefit obligations:
|
|
|
|
|
|
|
|
|
|
|
|
|
|
Benefit obligation, beginning of year
|
$
|
369
|
|
$
|
506
|
|
$
|
8
|
|
$
|
7
|
|
|
Service cost
|
|
—
|
|
|
—
|
|
|
—
|
|
|
—
|
|
|
Interest cost
|
|
15
|
|
|
19
|
|
|
1
|
|
|
1
|
|
|
Net actuarial (gains) losses
|
|
25
|
|
|
43
|
|
|
(1
|
)
|
|
—
|
|
|
Foreign currency rate changes
|
|
—
|
|
|
(5
|
)
|
|
—
|
|
|
—
|
|
|
Contributions by plan participants
|
|
—
|
|
|
—
|
|
|
—
|
|
|
—
|
|
|
Curtailment
|
|
—
|
|
|
—
|
|
|
—
|
|
|
—
|
|
|
Settlement
|
|
—
|
|
|
(155
|
)
|
|
—
|
|
|
—
|
|
|
Plan amendments
|
|
—
|
|
|
—
|
|
|
—
|
|
|
—
|
|
|
Benefits paid
|
|
(26
|
)
|
|
(34
|
)
|
|
—
|
|
|
—
|
|
|
Administrative expenses
|
|
(6
|
)
|
|
(5
|
)
|
|
—
|
|
|
—
|
|
|
Benefit obligation, end of year
|
|
377
|
|
|
369
|
|
|
8
|
|
|
8
|
|
|
Change in plan assets:
|
|
|
|
|
|
|
|
|
|
|
|
|
|
Fair value of plan assets, beginning of year
|
|
262
|
|
|
375
|
|
|
—
|
|
|
—
|
|
|
Actual return on plan assets
|
|
33
|
|
|
41
|
|
|
—
|
|
|
—
|
|
|
Employer contributions(1)
|
|
19
|
|
|
15
|
|
|
—
|
|
|
—
|
|
|
Settlement
|
|
—
|
|
|
(126
|
)
|
|
—
|
|
|
—
|
|
|
Foreign currency rate changes
|
|
—
|
|
|
(4
|
)
|
|
—
|
|
|
—
|
|
|
Benefits paid
|
|
(26
|
)
|
|
(34
|
)
|
|
—
|
|
|
—
|
|
|
Administrative expenses
|
|
(6
|
)
|
|
(5
|
)
|
|
—
|
|
|
—
|
|
|
Fair value of plan assets, end of year
|
|
282
|
|
|
262
|
|
|
—
|
|
|
—
|
|
|
Net over (under) funded status of plans
|
$
|
(95
|
)
|
$
|
(107
|
)
|
$
|
(8
|
)
|
$
|
(8
|
)
|
|
Classification of amounts recognized in the Consolidated Balance Sheets:
|
|
|
|
|
|
|
|
|
|
|
|
|
|
Accrued liabilities
|
$
|
—
|
|
$
|
—
|
|
$
|
—
|
|
$
|
—
|
|
|
Pension and postretirement healthcare benefits
|
|
(95
|
)
|
|
(107
|
)
|
$
|
(8
|
)
|
|
(8
|
)
|
|
Total liabilities
|
|
(95
|
)
|
|
(107
|
)
|
|
(8
|
)
|
|
(8
|
)
|
|
Accumulated other comprehensive (income) loss
|
|
92
|
|
|
87
|
|
|
(2
|
)
|
|
(2
|
)
|
|
Total
|
$
|
(3
|
)
|
$
|
(20
|
)
|
$
|
(10
|
)
|
$
|
(10
|
)
|
| (1) | We expect 2018 contributions to be $21 million for the qualified retirement plan. |
At December 31, 2017, our qualified retirement plan was in an underfunded status of $95 million. As a result, we have a projected minimum funding requirement of $11 million for 2017, which will be payable in 2018.
|
|
US Qualified Plan
|
|||||
|
|
Year Ended December 31,
|
|||||
|
|
2017
|
2016
|
||||
|
Accumulated Benefit Obligation
|
$
|
377
|
|
$
|
369
|
|
|
Projected Benefit Obligation
|
|
(377
|
)
|
|
(369
|
)
|
|
Fair value of plan assets
|
|
282
|
|
|
262
|
|
|
Funded status-underfunded
|
$
|
(95
|
)
|
$
|
(107
|
)
|
94
Expected Benefit Payments — The following table shows the expected cash benefit payments for the next five years and in the aggregate for the years 2023 through 2027:
|
|
2018
|
2019
|
2020
|
2021
|
2022
|
2023-2027
|
||||||||||||
|
Retirement Plans
|
$
|
28
|
|
$
|
28
|
|
$
|
27
|
|
$
|
27
|
|
$
|
27
|
|
$
|
119
|
|
|
Postretirement Healthcare Plan
|
$
|
—
|
|
$
|
—
|
|
$
|
—
|
|
$
|
—
|
|
$
|
—
|
|
$
|
2
|
|
Retirement and Postretirement Healthcare Expense — The table below presents the components of net periodic cost associated with the U.S. and foreign plans recognized in the Consolidated Statements of Operations for 2017, 2016, and 2015:
|
|
Retirement Plans
|
Postretirement Healthcare Plans
|
||||||||||||||||
|
|
Year Ended December 31,
|
Year Ended December 31,
|
||||||||||||||||
|
|
2017
|
2016
|
2015
|
2017
|
2016
|
2015
|
||||||||||||
|
Net periodic cost:
|
|
|
|
|
|
|
|
|
|
|
|
|
|
|
|
|
|
|
|
Service cost
|
$
|
—
|
|
$
|
—
|
|
$
|
—
|
|
$
|
—
|
|
$
|
—
|
|
$
|
—
|
|
|
Interest cost
|
|
15
|
|
|
19
|
|
|
19
|
|
|
1
|
|
|
1
|
|
|
1
|
|
|
Expected return on plan assets
|
|
(15
|
)
|
|
(19
|
)
|
|
(22
|
)
|
|
—
|
|
|
—
|
|
|
—
|
|
|
Net amortization of actuarial loss
|
|
3
|
|
|
2
|
|
|
3
|
|
|
—
|
|
|
—
|
|
|
—
|
|
|
Curtailment gains
|
|
—
|
|
|
(1
|
)
|
|
—
|
|
|
—
|
|
|
—
|
|
|
—
|
|
|
Settlement losses
|
|
—
|
|
|
2
|
|
|
—
|
|
|
—
|
|
|
—
|
|
|
—
|
|
|
Total net periodic cost - continuing operations
|
$
|
3
|
|
$
|
3
|
|
$
|
—
|
|
$
|
1
|
|
$
|
1
|
|
$
|
1
|
|
Pretax amounts that are expected to be reclassified from “Accumulated other comprehensive loss” in the Consolidated Balance Sheets to retirement expense during 2018 related to unrecognized actuarial losses are $3 million for the U.S. retirement plans and unrecognized settlement gain of $3 million for the U.S. postretirement healthcare plan.
Assumptions — The following weighted average assumptions were used to determine net periodic cost:
|
|
2017
|
2016
|
2015
|
|||||||||||||||
|
|
US Qualified
Plan |
Netherlands
Plan |
US Qualified
Plan |
Netherlands
Plan |
US Qualified
Plan |
Netherlands
Plan |
||||||||||||
|
Discount rate
|
|
4.25
|
%
|
|
—
|
%
|
|
4.75
|
%
|
|
2.25
|
%
|
|
3.75
|
%
|
|
2.25
|
%
|
|
Expected return on plan assets
|
|
5.64
|
%
|
|
—
|
%
|
|
5.64
|
%
|
|
4.25
|
%
|
|
5.95
|
%
|
|
4.75
|
%
|
The following weighted average assumptions were used in estimating the actuarial present value of the plans’ benefit obligations:
|
|
2017
|
2016
|
2015
|
|||||||||||||||
|
|
US Qualified
Plan |
Netherlands
Plan |
US Qualified
Plan |
Netherlands
Plan(1) |
US Qualified
Plan |
Netherlands
Plan |
||||||||||||
|
Discount rate
|
|
3.71
|
%
|
|
—
|
%
|
|
4.25
|
%
|
|
1.50
|
%
|
|
4.75
|
%
|
|
2.25
|
%
|
| (1) | This reflects the rate used to calculate the final Netherlands Plan benefit obligation immediately before the Settlement Date. |
During 2014, the Society of Actuaries issued an updated mortality table and improvement scale that indicated significant mortality improvement over the prior table. We concluded that the updated table represented our best estimate of mortality. In 2017, the mortality improvement scale that had been used in the 2016 was updated by the Society of Actuaries to reflect actual experience in mortality rates. We updated our mortality assumption accordingly resulting in a decrease of $3 million to our projected benefit obligation as compared to December 31, 2016.
95
The following weighted-average assumptions were used in determining the actuarial present value of the South African Plan:
|
|
2017
|
2016
|
2015
|
||||||
|
Discount rate
|
|
11.54
|
%
|
|
10.87
|
%
|
|
10.94
|
%
|
Expected Return on Plan Assets — In forming the assumption of the U.S. long-term rate of return on plan assets, we considered the expected earnings on funds already invested, earnings on contributions expected to be received in the current year, and earnings on reinvested returns. The long-term rate of return estimation methodology for the U.S. Qualified Plan is based on a capital asset pricing model using historical data and a forecasted earnings model. An expected return on plan assets analysis is performed which incorporates the current portfolio allocation, historical asset-class returns, and an assessment of expected future performance using asset-class risk factors. Our assumption of the long-term rate of return for the Netherlands Plan was developed considering the portfolio mix and country-specific economic data that includes the rates of return on local government and corporate bonds.
Discount Rate — The discount rates selected for estimation of the actuarial present value of the benefit obligations of the U.S. Qualified Plan were 3.71% and 4.25% at December 31, 2017 and 2016, respectively. The 2017 and 2016 rates were selected based on the results of a cash flow matching analysis, which projected the expected cash flows of the plans using a yield curves model developed from a universe of Aa-graded U.S. currency corporate bonds (obtained from Bloomberg) with at least $50 million outstanding. Bonds with features that imply unreliable pricing, a less than certain cash flow, or other indicators of optionality are filtered out of the universe. The remaining universe is categorized into maturity groups, and within each of the maturity groups yields are ranked into percentiles.
The discount rates selected for estimating the actuarial present value of the benefit obligations of the Netherlands Plan was 1.50% as of the Settlement Date. This rate was based on the long-term Euro corporate bond index rates that correlate with anticipated cash flows associated with future benefit payments.
Plan Assets — Asset categories and associated asset allocations for our funded retirement plans at December 31, 2017 and 2016:
|
|
December 31,
|
|||||||||||
|
|
2017
|
2016
|
||||||||||
|
|
Actual
|
Target
|
Actual
|
Target
|
||||||||
|
Qualified Plan:
|
|
|
|
|
|
|
|
|
|
|
|
|
|
Equity securities
|
|
50
|
%
|
|
50
|
%
|
|
36
|
%
|
|
38
|
%
|
|
Debt securities
|
|
48
|
|
|
48
|
|
|
61
|
|
|
62
|
|
|
Cash and cash equivalents
|
|
2
|
|
|
2
|
|
|
3
|
|
|
—
|
|
|
Total
|
|
100
|
%
|
|
100
|
%
|
|
100
|
%
|
|
100
|
%
|
The U.S. Qualified Plan is administered by a board-appointed committee that has fiduciary responsibility for the plan’s management. The committee maintains an investment policy stating the guidelines for the performance and allocation of plan assets, performance review procedures and updating of the policy. At least annually, the U.S. plan’s asset allocation guidelines are reviewed in light of evolving risk and return expectations.
Substantially all of the plan’s assets are invested with nine mutual fund managers, eight separately managed equity accounts, one fixed-income fund manager and one money-market fund manager. To control risk, equity fund managers are prohibited from entering into the following transactions, (i) investing in commodities, including all futures contracts, (ii) purchasing letter stock, (iii) short selling, and (iv) option trading. In addition, equity fund managers are prohibited from purchasing on margin and are prohibited from purchasing Tronox securities. Equity managers are monitored to ensure investments are in line with their style and are generally permitted to invest in U.S. common stock, U.S. preferred stock, U.S. securities convertible into common stock, common stock of foreign companies listed on major U.S. exchanges, common stock of foreign companies listed on foreign exchanges, covered call writing, and cash and cash equivalents.
Fixed-income fund managers are prohibited from investing in (i) direct real estate mortgages or commingled real estate funds, (ii) private placements above certain portfolio thresholds, (iii) tax exempt debt of state and
96
local governments above certain portfolio thresholds, (iv) fixed income derivatives that would cause leverage, (v) guaranteed investment contracts, and (vi) Tronox securities. They are permitted to invest in debt securities issued by the U.S. government, its agencies or instrumentalities, commercial paper rated A3/P3, Federal Deposit Insurance Corporation insured certificates of deposit or bankers’ acceptances and corporate debt obligations. Each fund manager’s portfolio has an average credit rating of A or better.
The fair values of pension investments as of December 31, 2017 are summarized below:
|
|
U.S. Qualified Plan
|
|||||||||||
|
|
Fair Value Measurement at December 31, 2017, Using:
|
|||||||||||
|
|
Quoted Prices
in Active Markets for Identical Assets (Level 1) |
Significant
Other Observable Inputs (Level 2) |
Significant
Unobservable Inputs (Level 3) |
Total
|
||||||||
|
Asset category:
|
|
|
|
|
|
|
|
|
|
|
|
|
|
Commingled Equity Funds
|
$
|
94(1
|
)
|
$
|
—
|
|
$
|
—
|
|
$
|
94
|
|
|
Equity Securities
|
|
47(2
|
)
|
|
—
|
|
|
—
|
|
|
47
|
|
|
Debt securities:
|
|
|
|
|
|
|
|
|
|
|
|
|
|
Corporate
|
|
—
|
|
|
66(3
|
)
|
|
—
|
|
|
66
|
|
|
Government
|
|
68(4
|
)
|
|
—
|
|
|
—
|
|
|
68
|
|
|
Cash & cash equivalents:
|
|
|
|
|
|
|
|
|
|
|
|
|
|
Commingled cash equivalents fund
|
|
7(5
|
)
|
|
—
|
|
|
—
|
|
|
7
|
|
|
Total at fair value
|
$
|
216
|
|
$
|
66
|
|
$
|
—
|
|
$
|
282
|
|
| (1) | For commingled equity funds owned by the funds, fair value is based on observable quoted prices on active exchanges, which are level 1 inputs. |
| (2) | For equity securities, fair value is based on observable quoted prices on active exchanges, which are level 1 inputs. |
| (3) | For corporate related debt securities, the fair value is based on observable inputs of comparable market transactions, which are level 2 inputs. |
| (4) | For government related debt securities, the fair value is based on observable quoted prices on active exchanges, which are level 1 inputs. |
| (5) | For commingled cash equivalents funds, fair value is based on observable quoted prices on active exchanges, which are level 1 inputs. |
The fair values of pension investments as of December 31, 2016 are summarized below:
|
|
U.S. Qualified Plan
|
|||||||||||
|
|
Fair Value Measurement at December 31, 2016, Using:
|
|||||||||||
|
|
Quoted Prices
in Active Markets for Identical Assets (Level 1) |
Significant
Other Observable Inputs (Level 2) |
Significant
Unobservable Inputs (Level 3) |
Total
|
||||||||
|
Asset category:
|
|
|
|
|
|
|
|
|
|
|
|
|
|
Commingled Equity Funds
|
$
|
95(1
|
)
|
$
|
—
|
|
$
|
—
|
|
$
|
95
|
|
|
Debt securities:
|
|
|
|
|
|
|
|
|
|
|
|
|
|
Corporate
|
|
—
|
|
|
78(2
|
)
|
|
—
|
|
|
78
|
|
|
Government
|
|
81(3
|
)
|
|
—
|
|
|
—
|
|
|
81
|
|
|
Cash & cash equivalents:
|
|
|
|
|
|
|
|
|
|
|
|
|
|
Commingled cash equivalents fund
|
|
8(4
|
)
|
|
—
|
|
|
—
|
|
|
8
|
|
|
Total at fair value
|
$
|
184
|
|
$
|
78
|
|
$
|
—
|
|
$
|
262
|
|
| (1) | For commingled equity funds owned by the funds, fair value is based on observable quoted prices on active exchanges, which are level 1 inputs. |
| (2) | For corporate related debt securities, the fair value is based on observable inputs of comparable market transactions, which are level 2 inputs. |
| (3) | For government related debt securities, the fair value is based on observable quoted prices on active exchanges, which are level 1 inputs. |
| (4) | For commingled cash equivalents funds, fair value is based on observable quoted prices on active exchanges, which are level 1 inputs. |
97
Defined Contribution Plans
U.S. Savings Investment Plan
In 2006, we established the U.S. Savings Investment Plan (the “SIP”), a qualified defined contribution plan under section 401(k) of the Internal Revenue Code. Under the SIP, our regular full-time and part-time employees contribute a portion of their earnings, and we match these contributions up to a predefined threshold. Our matching contribution is 100% of the first 6% of employee contributions. Effective January 1, 2013, we established a profit sharing contribution at 6% of employees’ pay (“discretionary contribution”). The discretionary contribution is subject to our Board of Directors’ approval each year. The Board approved discretionary contribution of 6% of pay for 2017, 2016 and 2015. Our matching contribution to the SIP vests immediately; however, our discretionary contribution is subject to vesting conditions that must be satisfied over a three-year vesting period. Contributions under the SIP, including our match, are invested in accordance with the investment options elected by plan participants. Compensation expenses associated with our matching contribution to the SIP was $4 million, $3 million and $4 million during 2017, 2016 and 2015, respectively, which was included in “Selling, general and administrative expenses” in the Consolidated Statements of Operations. Compensation expense associated with our discretionary contribution was $5 million in 2017 and $4 million each in 2016 and 2015, which was included in “Selling, general and administrative expenses” in the Consolidated Statements of Operations.
U.S. Benefit Restoration Plan
In 2006, we established the U.S. Benefit Restoration Plan (the “BRP”), a nonqualified defined contribution plan, for employees whose eligible compensation is expected to exceed the IRS compensation limits for qualified plans. Under the BRP, participants can contribute up to 20% of their annual compensation and incentive. Our matching contribution under the BRP is the same as the SIP. Our matching contribution under this plan vests immediately to plan participants. Contributions under the BRP, including our match, are invested in accordance with the investment options elected by plan participants. Compensation expense associated with our matching contribution to the BRP was $1 million each during 2017, 2016 and 2015 which was included in “Selling, general and administrative expenses” in the Consolidated Statements of Operations.
21. Related Party Transactions
Exxaro
We had service level agreements with Exxaro for research and development that expired during the third quarter of 2017. We also had service level agreements with Exxaro for services such as tax preparation and information technology, which expired during 2015. Such service level agreements amounted to expenses of $1 million each during 2017 and 2016 and $2 million during 2015 which was included in “Selling general and administrative expense” in the Consolidated Statements of Operations. Additionally, we had a professional service agreement with Exxaro related to the Fairbreeze construction project, which ended in January 2017. We made payments to Exxaro of less than $1 million during 2017, $2 million during 2016 and $3 million during 2015, which were capitalized in “Property, plant and equipment, net” in our Consolidated Balance Sheets. At both December 31, 2017 and 2016, we had less than $1 million of related party payables, which were recorded in “Accounts payable” in our Consolidated Balance Sheets.
22. Segment Information
Segment performance is evaluated based on segment operating income (loss), which represents the results of segment operations before unallocated costs, such as general corporate expenses not identified to a specific segment, interest expense, other income (expense), net and income tax expense or benefit.
98
Net sales and income (loss) from operations were as follows:
|
|
Year Ended December 31,
|
||||||||
|
|
2017
|
2016
|
2015
|
||||||
|
Net sales (TiO2)
|
$
|
1,698
|
|
$
|
1,309
|
|
$
|
1,510
|
|
|
TiO2 segment
|
$
|
261
|
|
$
|
6
|
|
$
|
(127
|
)
|
|
Corporate
|
|
(123
|
)
|
|
(62
|
)
|
|
(74
|
)
|
|
Income (loss) from operations
|
|
138
|
|
|
(56
|
)
|
|
(201
|
)
|
|
Interest and debt expense, net
|
|
(188
|
)
|
|
(185
|
)
|
|
(176
|
)
|
|
Gain (loss) on extinguishment of debt
|
|
(28
|
)
|
|
4
|
|
|
—
|
|
|
Other income (expense), net
|
|
(9
|
)
|
|
(27
|
)
|
|
28
|
|
|
Income (loss) from continuing operations before income taxes
|
$
|
(87
|
)
|
$
|
(264
|
)
|
$
|
(349
|
)
|
Net sales to external customers, by geographic region, based on country of production, were as follows:
|
|
Year Ended December 31,
|
||||||||
|
|
2017
|
2016
|
2015
|
||||||
|
U.S. operations
|
$
|
663
|
|
$
|
570
|
|
$
|
621
|
|
|
International operations:
|
|
|
|
|
|
|
|
|
|
|
Australia
|
|
452
|
|
|
352
|
|
|
380
|
|
|
South Africa
|
|
350
|
|
|
200
|
|
|
313
|
|
|
The Netherlands
|
|
233
|
|
|
187
|
|
|
196
|
|
|
Total net sales
|
$
|
1,698
|
|
$
|
1,309
|
|
$
|
1,510
|
|
|
|
|
|
|
|
|
|
|
|
|
Net sales from external customers for each similar product were as follows:
|
|
Year Ended December 31,
|
||||||||
|
|
2017
|
2016
|
2015
|
||||||
|
Pigment
|
$
|
1,211
|
|
$
|
966
|
|
$
|
976
|
|
|
Titanium feedstock and co-products
|
|
434
|
|
|
286
|
|
|
426
|
|
|
Electrolytic
|
|
53
|
|
|
57
|
|
|
108
|
|
|
Total net sales
|
$
|
1,698
|
|
$
|
1,309
|
|
$
|
1,510
|
|
During 2017, 2016 and 2015 our ten largest third-party TiO2 customers represented 35%, 36% and 40%, respectively, of our consolidated net sales. During 2017, no single customer accounted for 10% of our consolidated net sales. During both 2016 and 2015, one pigment customer accounted for 10% of our consolidated net sales.
Depreciation, amortization and depletion were as follows:
|
|
Year Ended December 31,
|
||||||||
|
|
2017
|
2016
|
2015
|
||||||
|
TiO2 segment
|
$
|
177
|
|
$
|
171
|
|
$
|
247
|
|
|
Corporate
|
|
5
|
|
|
6
|
|
|
6
|
|
|
Total depreciation, amortization and depletion
|
$
|
182
|
|
$
|
177
|
|
$
|
253
|
|
Capital expenditures were as follows:
|
|
Year Ended December 31,
|
||||||||
|
|
2017
|
2016
|
2015
|
||||||
|
TiO2 segment
|
$
|
89
|
|
$
|
84
|
|
$
|
164
|
|
|
Corporate
|
|
2
|
|
|
2
|
|
|
1
|
|
|
Total capital expenditures
|
$
|
91
|
|
$
|
86
|
|
$
|
165
|
|
99
Total assets of continuing operations were as follows:
|
|
December 31,
|
|||||
|
|
2017
|
2016
|
||||
|
TiO2 segment
|
$
|
3,058
|
|
$
|
2,991
|
|
|
Corporate
|
|
1,806
|
|
|
302
|
|
|
Total
|
$
|
4,864
|
|
$
|
3,293
|
|
Property, plant and equipment, net and mineral leaseholds, net, by geographic region, were as follows:
|
|
December 31,
|
|||||
|
|
2017
|
2016
|
||||
|
U.S. operations
|
$
|
193
|
|
$
|
194
|
|
|
International operations:
|
|
|
|
|
|
|
|
South Africa
|
|
919
|
|
|
844
|
|
|
Australia
|
|
849
|
|
|
896
|
|
|
The Netherlands
|
|
39
|
|
|
35
|
|
|
Total
|
$
|
2,000
|
|
$
|
1,969
|
|
23. Quarterly Results of Operations (Unaudited)
The following represents our unaudited quarterly results for the years ended December 31, 2017 and 2016. These quarterly results were prepared in conformity with generally accepted accounting principles and reflect all adjustments that are, in the opinion of management, necessary for a fair statement of the results, and were of a normal recurring nature.
Unaudited quarterly results for 2017:
|
|
1st Quarter
|
2nd Quarter
|
3rd Quarter
|
4th Quarter
|
||||||||
|
Net sales
|
$
|
378
|
|
$
|
421
|
|
$
|
435
|
|
$
|
464
|
|
|
Cost of goods sold
|
|
315
|
|
|
327
|
|
|
329
|
|
|
339
|
|
|
Gross profit
|
|
63
|
|
|
94
|
|
|
106
|
|
|
125
|
|
|
Net income (loss) from continuing operations
|
|
(53
|
)
|
|
(17
|
)
|
|
(25
|
)
|
|
2
|
|
|
Net income (loss) from discontinued operations, net of tax
|
|
15
|
|
|
22
|
|
|
(216
|
)(1)
|
|
—
|
|
|
Net income (loss)(2)
|
|
(38
|
)
|
|
5
|
|
|
(241
|
)
|
|
2
|
|
|
Net income (loss) attributable to noncontrolling interest
|
|
3
|
|
|
2
|
|
|
6
|
|
|
2
|
|
|
Net income (loss) attributable to Tronox Limited(2)
|
$
|
(41
|
)
|
$
|
3
|
|
$
|
(247
|
)
|
$
|
—
|
|
|
Income (loss) from continuing operations per share, basic and diluted
|
$
|
(0.48
|
)
|
$
|
(0.16
|
)
|
$
|
(0.26
|
)
|
$
|
—
|
|
|
Income (loss) from discontinued operations per share, basic and diluted
|
$
|
0.13
|
|
$
|
0.18
|
|
$
|
(1.81
|
)
|
$
|
—
|
|
| (1) | Includes a loss of $233 million on the Alkali Sale. |
| (2) | During the fourth quarter of 2017, we recorded out-of-period adjustments that should have been recorded previously that decreased net income (loss) from continuing operations by $2 million and decreased income from continuing operations per share by $0.01. After evaluating the quantitative and qualitative aspects of the adjustments, we concluded the effect of these adjustments, individually and in the aggregate, was not material to our previously issued interim and annual consolidated financial statements and is not material to our 2017 consolidated financial statements. |
100
Unaudited quarterly results for 2016:
|
|
1st Quarter
|
2nd Quarter
|
3rd Quarter
|
4th Quarter
|
||||||||
|
Net sales
|
$
|
285
|
|
$
|
333
|
|
$
|
339
|
|
$
|
352
|
|
|
Cost of goods sold
|
|
291
|
|
|
295
|
|
|
291
|
|
|
298
|
|
|
Gross profit (loss)
|
|
(6
|
)
|
|
38
|
|
|
48
|
|
|
54
|
|
|
Net income (loss) from continuing operations
|
|
(114
|
)
|
|
(62
|
)
|
|
(62
|
)
|
|
99
|
|
|
Net income (loss) from discontinued operations, net of tax
|
|
20
|
|
|
12
|
|
|
23
|
|
|
24
|
|
|
Net income (loss)
|
|
(94
|
)
|
|
(50
|
)
|
|
(39
|
)
|
|
123
|
|
|
Net income (loss) attributable to noncontrolling interest
|
|
(1
|
)
|
|
2
|
|
|
(2
|
)
|
|
2
|
|
|
Net income (loss) attributable to Tronox Limited
|
$
|
(93
|
)
|
$
|
(52
|
)
|
$
|
(37
|
)
|
$
|
121
|
|
|
Income (loss) from continuing operations per share, basic
|
$
|
(0.97
|
)
|
$
|
(0.55
|
)
|
$
|
(0.53
|
)
|
$
|
0.84
|
|
|
Income (loss) from continuing operations per share, diluted
|
$
|
(0.97
|
)
|
$
|
(0.55
|
)
|
$
|
(0.53
|
)
|
$
|
0.81
|
|
|
Income (loss) from discontinued operations per share, basic
|
$
|
0.17
|
|
$
|
0.11
|
|
$
|
0.20
|
|
$
|
0.21
|
|
|
Income (loss) from discontinued operations per share, diluted
|
$
|
0.17
|
|
$
|
0.11
|
|
$
|
0.20
|
|
$
|
0.20
|
|
101
| Item 9. | Changes in and Disagreements with Accountants on Accounting and Financial Disclosure |
None.
| Item 9A. | Controls and Procedures |
Evaluation of Disclosure Controls and Procedures
As of December 31, 2017, our management, with the participation of our Chief Executive Officer (“CEO”) and Chief Financial Officer (“CFO”), has conducted an evaluation of our disclosure controls and procedures. Based on that evaluation, our CEO and CFO concluded that our disclosure controls and procedures were effective as of December 31, 2017.
Management’s Report on Internal Controls Over Financial Reporting
Management of Tronox Limited and its subsidiaries is responsible for establishing and maintaining adequate internal controls over financial reporting. Internal controls over financial reporting is a process designed under the supervision of our principal executive and principal financial officers to provide reasonable assurance regarding the reliability of financial reporting and the preparation of the Company’s financial statements for external purposes in accordance with U.S. generally accepted accounting principles.
Our internal controls over financial reporting include those policies and procedures that:
| • | pertain to the maintenance of records that, in reasonable detail, accurately and fairly reflect the transactions and dispositions of the assets of the Company; |
| • | provide reasonable assurance that transactions are recorded as necessary to permit preparation of financial statements in accordance with U.S. generally accepted accounting principles, and that our receipts and expenditures are being made only in accordance with authorizations of the Company’s management and directors; and |
| • | provide reasonable assurance regarding prevention or timely detection of unauthorized acquisition, use or disposition of our assets that could have a material effect on the financial statements. |
Management assessed the effectiveness of our internal controls over financial reporting as of December 31, 2017. In making this assessment, management used the criteria in Internal Control-Integrated Framework (2013) set forth by the Committee of Sponsoring Organizations of the Treadway Commission (COSO). Based on our assessment using those criteria, management concluded that our internal control over financial reporting as of December 31, 2017 was effective.
Because of its inherent limitations, internal controls over financial reporting may not prevent or detect misstatements. Projections of any evaluation of effectiveness to future periods are subject to the risk that controls may become inadequate because of changes in conditions, or that the degree of compliance with the policies or procedures may deteriorate.
The effectiveness of the Company’s internal control over financial reporting as of December 31, 2017 has been audited by PricewaterhouseCoopers LLP, an independent registered public accounting firm, as stated in their report, which appears herein.
Changes in Internal Control Over Financial Reporting
There have been no changes to our internal control over financial reporting during the quarter ended December 31, 2017 that have materially affected, or are reasonably likely to materially affect, our internal control over financial reporting.
| Item 9B. | Other Information |
Not Applicable.
PART III
| Item 10. | Directors, Executive Officers and Corporate Governance |
Information regarding our executive officers, members of the Board of Directors, including its audit committee and audit committee financial experts, as well as information regarding our Code of Business Conduct
102
and Ethics that applies to our Chief Executive Officer and senior financial officers, will be presented in Tronox Limited’s definitive proxy statement for its 2018 annual general meeting of shareholders, which will be filed not later than 120 days after the end of the fiscal year covered by this Annual Report on Form 10-K, and is incorporated herein by reference.
The information required to be furnished pursuant to this item with respect to compliance with Section 16(a) of the Exchange Act will be set forth under the caption “Section 16(a) Beneficial Ownership Reporting Compliance” in Tronox Limited’s definitive proxy statement for its 2018 annual general meeting of shareholders, and is incorporated herein by reference.
| Item 11. | Executive Compensation |
Information regarding executive officer and director compensation will be presented in Tronox Limited’s definitive proxy statement for its 2018 annual general meeting of shareholders, filed not later than 120 days after the end of the fiscal year covered by this Annual Report on Form 10-K, and is incorporated herein by reference.
| Item 12. | Security Ownership of Certain Beneficial Owners and Management and Related Shareholder Matters |
Information regarding security ownership of certain beneficial owners and management and related shareholder matters will be presented in Tronox Limited’s definitive proxy statement for its 2017 annual general meeting of shareholders, filed not later than 120 days after the end of the fiscal year covered by this Annual Report on Form 10-K, and is incorporated herein by reference.
Equity Compensation Plan Information
The following table provides information as of December 31, 2017 regarding securities issued under the Tronox Limited Management Equity Incentive Plan (the “Tronox Limited MEIP”).
|
|
Number of securities
to be issued upon exercise of outstanding restricted shares, restricted share units and options(2) |
Weighted-average
exercise price of outstanding restricted shares, restricted share units and options |
Number of securities
remaining available for future issuance under equity compensation plans (excluding securities reflected in the second column)(1) |
||||||
|
Equity compensation plans approved by security holders
|
|
7,361,874
|
|
$
|
13.48
|
|
|
8,531,623
|
|
|
Equity compensation plans not approved by security holders
|
|
—
|
|
|
—
|
|
|
—
|
|
|
Total
|
|
7,361,874
|
|
$
|
13.48
|
|
|
8,531,623
|
|
| (1) | Each restricted share unit awarded under the Tronox Limited MEIP was granted at no cost to the persons receiving them and represents the contingent right to receive the equivalent number of Class A Shares. |
| (2) | Excludes Warrants, as they were not issued under the Tronox Limited MEIP. |
| Item 13. | Certain Relationships and Related Transactions, and Director Independence. |
Information regarding certain relationships and related transactions and director independence will be presented in Tronox Limited’s definitive proxy statement for its 2018 annual general meeting of shareholders, filed not later than 120 days after the end of the fiscal year covered by this Annual Report on Form 10-K, and is incorporated herein by reference.
| Item 14. | Principal Accounting Fees and Services. |
Information regarding principal accounting fees and services will be presented in Tronox Limited’s definitive proxy statement for its 2018 annual general meeting of shareholders, filed not later than 120 days after the end of the fiscal year covered by this Annual Report on Form 10-K, and is incorporated herein by reference.
103
PART IV
| Item 15. | Exhibits, Financial Statement Schedules. |
| (a) | The following documents are filed as part of this Annual Report on Form 10-K: |
| 1. | Consolidated Financial Statements |
Reference is made to the Index to Consolidated Financial Statements and Consolidated Financial Statement Schedules appearing at “Item 8. Financial Statements and Supplementary Data” in this report.
| 2. | Consolidated Financial Statement Schedules |
All financial statement schedules are omitted as they are inapplicable, or the required information has been included in the consolidated financial statements or notes thereto.
|
Amended and Restated Transaction Agreement by and among Tronox Incorporated, Tronox Limited, Concordia Acquisition Corporation, Concordia Merger Corporation, Exxaro Resources Limited, Exxaro Holdings Sands (Proprietary) Limited and Exxaro International BV, dated as of April 20, 2012 (incorporated by reference to Annex A to the proxy statement/prospectus which forms a part of the Registration Statement on Form S-4 filed by Tronox Limited and Tronox Incorporated on May 4, 2012).
|
|
|
|
|
|
Stock and Asset Purchase Agreement, dated as of February 3, 2015, by and among FMC Corporation, Tronox US Holdings Inc. and Tronox Limited (incorporated by reference to Exhibit 2.1 of the Current Report on Form 8-K filed by Tronox Limited on February 4, 2015).
|
|
|
|
|
|
Transaction Agreement, dated as of February 21, 2017, by and between Cristal, Tronox Limited and Cristal Inorganic Chemicals Netherlands Coöperatief W.A. (incorporated by reference to Exhibit 2.1 of the Current Report on Form 8-K filed by Tronox Limited on February 21, 2017).
|
|
|
|
|
|
Amendment No. 1 to Transaction Agreement, dated as of March 1, 2018, by and among The National Titanium Dioxide Company Limited, Tronox Limited and Cristal Inorganic Chemicals Netherlands Coöperatief W.A. (incorporated by reference to Exhibit 2.1 of the Current Report on Form 8-K filed by Tronox Limited on March 1, 2018).
|
|
|
|
|
|
Constitution of Tronox Limited, as amended on November 3, 2016 (incorporated by reference to Exhibit 3.1 of the Annual Report on Form 10-K for the Fiscal Year Ended December 31, 2016 filed by Tronox Limited on February 24, 2017).
|
|
|
|
|
|
Indenture, dated as of August, 20, 2012, among Tronox Finance LLC, Tronox Limited, the other guarantors named therein and Wilmington Trust, National Association, as Trustee (incorporated by reference to Exhibit 4.1 of the Quarterly Report on Form 10-Q filed by Tronox Limited on November 14, 2012).
|
|
|
|
|
|
First Supplemental Indenture, dated August 29, 2012, to the Indenture, dated as of August, 20, 2012 among Tronox Finance LLC, Tronox Limited, the other guarantors named therein and Wilmington Trust, National Association, as Trustee (incorporated by reference to Exhibit 4.3 of the Quarterly Report on Form 10-Q filed by Tronox Limited on November 14, 2012).
|
|
|
|
|
|
Fifth Supplemental Indenture, dated as of April 1, 2015, to the Indenture dated as of August 20, 2012 among Tronox Finance LLC, the guarantors named therein and Wilmington Trust, National Association, as trustee (incorporated by reference to Exhibit 4.3 to the Company’s Report on Form 8-K filed on April 7, 2015).
|
104
|
Sixth Supplemental Indenture, dated as of January 31, 2017, to the Indenture, dated August 20, 2012 among Tronox Finance LLC, as Issuer, Tronox Limited as Parent, the guarantors named therein and Wilmington Trust, National Association, as trustee (incorporated by reference to Exhibit 4.8 of the Annual Report on Form 10-K for the Fiscal Year Ended December 31, 2016 filed by Tronox Limited on February 24, 2017).
|
|
|
|
|
|
Seventh Supplemental Indenture, dated as of February 14, 2017, to the Indenture, dated August 20, 2012 among Tronox Finance LLC, as Issuer, Tronox Limited as Parent, the guarantors named therein and Wilmington Trust, National Association, as trustee (incorporated by reference to Exhibit 4.9 of the Annual Report on Form 10-K for the Fiscal Year Ended December 31, 2016 filed by Tronox Limited on February 24, 2017).
|
|
|
|
|
|
Eighth Supplemental Indenture, dated as of March 22, 2017, to the Indenture, dated August 20, 2012 among Tronox Finance LLC, as Issuer, Tronox Limited as Parent, the guarantors named therein and Wilmington Trust, National Association, as trustee (incorporated by reference to Exhibit 4.1 to the Company’s Report on Form 10-Q filed on May 4, 2017).
|
|
|
|
|
|
Ninth Supplemental Indenture, dated as of September 1, 2017, to the Indenture, dated August 20, 2012 among Tronox Finance LLC, as Issuer, Tronox Limited as Parent, the guarantors named therein and Wilmington Trust, National Association, as trustee (incorporated by reference to Exhibit 4.1 of the Current Report on Form 8-K filed by Tronox Limited on September 7, 2017).
|
|
|
|
|
|
Indenture dated as of March 19, 2015 between Evolution Escrow Issuer LLC to be merged into Tronox Finance LLC and Wilmington Trust, National Association, as trustee (incorporated by reference to Exhibit 4.1 to the Company’s Report on Form 8-K filed on April 7, 2015).
|
|
|
|
|
|
First Supplemental Indenture dated as of April 1, 2015 among Tronox Finance LLC (as successor to Evolution Escrow Issuer LLC), the parties named in Schedule I thereto and Wilmington Trust, National Association, as trustee (incorporated by reference to Exhibit 4.2 to the Company’s Report on Form 8-K filed on April 7, 2015).
|
|
|
|
|
|
Second Supplemental Indenture, dated as of January 31, 2017, to the Indenture, dated March 19, 2015 among Tronox Finance LLC, as Issuer, Tronox Limited as Parent, the guarantors named therein and Wilmington Trust, National Association, as trustee (incorporated by reference to Exhibit 4.7 of the Annual Report on Form 10-K for the Fiscal Year Ended December 31, 2016 filed by Tronox Limited on February 24, 2017).
|
|
|
|
|
|
Third Supplemental Indenture, dated as of February 14, 2017, to the Indenture, dated March 19, 2015 among Tronox Finance LLC, as Issuer, Tronox Limited as Parent, the guarantors named therein and Wilmington Trust, National Association, as trustee (incorporated by reference to Exhibit 4.10 of the Annual Report on Form 10-K for the Fiscal Year Ended December 31, 2016 filed by Tronox Limited on February 24, 2017).
|
|
|
|
|
|
Fourth Supplemental Indenture, dated as of March 22, 2017, to the Indenture, dated March 19, 2015 among Tronox Finance LLC, as Issuer, Tronox Limited as Parent, the guarantors named therein and Wilmington Trust, National Association, as trustee (incorporated by reference to Exhibit 4.2 to the Company’s Report on Form 10-Q filed on May 4, 2017).
|
|
|
|
|
|
Fifth Supplemental Indenture, dated as of September 1, 2017, to the Indenture, dated March 19, 2015 among Tronox Finance LLC, as Issuer, Tronox Limited as Parent, the guarantors named therein and Wilmington Trust, National Association, as trustee (incorporated by reference to Exhibit 4.2 of the Current Report on Form 8-K filed by Tronox Limited on September 7, 2017).
|
105
|
Fourth Amendment to Credit and Guaranty Agreement dated July 28, 2017, by and among, inter alia, Tronox Limited, Tronox Australia Holdings PTY Limited, Tronox Management PTY Limited, Tronox Holdings Cooperatief U.A., Tronox Pigments (Netherlands) B.V. and Goldman Sachs Bank USA (incorporated by reference to Exhibit 10.1 of the Current Report on Form 8-K filed by Tronox Limited on August 7, 2017).
|
|
|
|
|
|
Consent to Amended and Restated Revolving Syndicated Facility Agreement dated July 28, 2017, by and among, inter alia, Tronox Limited, Tronox Australia Holdings PTY Limited, Tronox Management PTY Limited, Tronox Holdings Cooperatief U.A., Tronox Pigments (Netherlands) B.V. and UB AG, Stamford Branch (incorporated by reference to Exhibit 10.2 of the Current Report on Form 8-K filed by Tronox Limited on August 7, 2017).
|
|
|
|
|
|
Indenture, dated as of September 22, 2017 among Tronox Finance plc, the Company and the other guarantors named therein and Wilmington Trust, National Association, as trustee (incorporated by reference to Exhibit 4.1 of the Current Report on Form 8-K filed by Tronox Limited on September 25, 2017).
|
|
|
|
|
|
Amended and Restated Warrant Agreement, dated as of June 15, 2012, by and between Tronox Incorporated, Tronox Limited, Computershare Inc. and its wholly owned subsidiary, Computershare Trust Company, N.A. (incorporated by reference to Exhibit 10.6 of the Current Report on Form 8-K filed by Tronox Limited on June 20, 2012).
|
|
|
|
|
|
Employment Agreement entered into as of February 14, 2011 by and between Tronox LLC and John D. Romano (incorporated by reference to Exhibit 10.7 of the Registration Statement on Form S-4 filed by Tronox Limited and Tronox Incorporated on December 30, 2011).
|
|
|
|
|
|
Shareholders’ Agreement by and between Tronox Sands Holdings PTY Limited, Tronox Limited, Exxaro Resources Limited, Exxaro Sands (Proprietary) Limited and Exxaro TSA Sands Proprietary Limited (incorporated by reference to Exhibit 10.2 of the Current Report on Form 8-K filed by Tronox Limited on June 20, 2012).
|
|
|
|
|
|
Shareholder’s Deed dated June 15, 2012 by and between Tronox Limited, Thomas Casey, and Exxaro Resources Limited (incorporated by reference to Exhibit 10.1 of the Current Report on Form 8-K filed by Tronox Limited on June 20, 2012).
|
|
|
|
|
|
Credit and Guaranty Agreement, dated February 8, 2012, by and among Tronox Pigments (Netherlands) B.V., Tronox Incorporated, the guarantors listed therein, the lenders listed therein, and Goldman Sachs Bank USA (incorporated by reference to Exhibit 10.14 of the Registration Statement on Form S-4 filed by Tronox Limited and Tronox Incorporated on March 22, 2012).
|
|
|
|
|
|
Employment Agreement entered into as of April 19, 2012 by and between Tronox LLC and Thomas J. Casey (incorporated by reference to Exhibit 10.15 of the Registration Statement on Form S-4 filed by Tronox Limited and Tronox Incorporated on April 23, 2012).
|
|
|
|
|
|
Tronox Limited Management Equity Incentive Plan (incorporated by reference to Exhibit 10.16 of the Registration Statement on Form S-4 filed by Tronox Limited and Tronox Incorporated on April 23, 2012).
|
|
|
|
|
|
First Amendment to the Credit and Guaranty Agreement, dated May 11, 2012, by and among Tronox Pigments (Netherlands) B.V., Tronox Incorporated, Goldman Sachs Bank USA, the requisite lenders party thereto and the guarantors party thereto (incorporated by reference to Exhibit 10.12 of the Annual Report on Form 10-K for the Fiscal Year Ended December 31, 2012 filed by Tronox Limited on February 28, 2013).
|
106
|
Technical Amendment to the Credit and Guaranty Agreement, dated June 12, 2012, by and among Goldman Sachs Bank USA and Tronox Pigments (Netherlands) B.V. (incorporated by reference to Exhibit 10.13 of the Annual Report on Form 10-K for the Fiscal Year Ended December 31, 2012 filed by Tronox Limited on February 28, 2013).
|
|
|
|
|
|
Transition Services Agreement, dated June 15, 2012, by and between Tronox Limited, Exxaro Resources Limited, Exxaro TSA Sands Proprietary Limited and Exxaro Sands (Proprietary) Limited (incorporated by reference to Exhibit 10.3 of the Current Report on Form 8-K filed by Tronox Limited on June 20, 2012).
|
|
|
|
|
|
Template Project Services Agreement, dated June 15, 2012, by and between Tronox Limited and Exxaro Resources Limited (incorporated by reference to Exhibit 10.5 of the Current Report on Form 8-K filed by Tronox Limited on June 20, 2012).
|
|
|
|
|
|
Revolving Syndicated Facility Agreement, dated June 18, 2012, among Tronox Incorporated, Tronox Limited, Guarantors named therein, Lenders named therein, UBS Securities LLC, as Arranger, Bookmanager, Documentation Agent and Syndication Agent, UBS AG, Stamford Branch, as Issuing Bank, Administrative Agent and Collateral Agent, UBS Loan Finance LLC, as Swingline Lender, and UBS AG, Stamford Branch, as Australian Security Trustee (incorporated by reference to Exhibit 10.7 of the Current Report on Form 8-K filed by Tronox Limited on June 20, 2012).
|
|
|
|
|
|
First Amendment to Revolving Syndicated Facility Agreement, dated August 8, 2012, among Tronox Limited, the other borrowers and the guarantors party thereto, the lenders party thereto and UBS AG, Stamford Branch (incorporated by reference to Exhibit 10.18 of the Annual Report on Form 10-K for the Fiscal Year Ended December 31, 2012 filed by Tronox Limited on February 28, 2013).
|
|
|
|
|
|
First Amendment to that Certain Employment Agreement entered into as of February 22, 2013, by and between Tronox LLC and Thomas J. Casey (incorporated by reference to Exhibit 10.21 of the Annual Report on Form 10-K for the Fiscal Year Ended December 31, 2012 filed by Tronox Limited on February 28, 2013).
|
|
|
|
|
|
Single Tenant Industrial Lease by and between Le Petomane XXVII, Inc., not individually but solely in the representative capacity as the Trustee of the Nevada Environmental Response Trust, and Tronox LLC dated February 14, 2011 (incorporated by reference to Exhibit 10.3 of the Annual Report on Form 10-K filed by Tronox Limited on February 27, 2014).
|
|
|
|
|
|
Tronox Limited Annual Performance Bonus Plan (incorporated by reference to Exhibit B of the Definitive Proxy Statement of Tronox Limited filed on Form DEF 14A on April 15, 2013).
|
|
|
|
|
|
Employment Agreement entered into as of July 25, 2013 by and between Tronox LLC and Jean Francois Turgeon (incorporated by reference to Exhibit 10.1 of the Current Report on Form 8-K filed by Tronox Limited on August 7, 2013).
|
|
|
|
|
|
Employment Agreement entered into as of March 1, 2014 by and between Tronox LLC and Richard L. Muglia (incorporated by reference to Exhibit 10.1 of the Quarterly Report on Form 10-Q filed by Tronox Limited on May 8, 2014).
|
|
|
|
|
|
Third Amendment to Credit and Guaranty Agreement, dated as of April 23, 2014, among Tronox Pigments (Netherlands) B.V., Tronox Limited, the guarantors listed therein, the lender parties thereto and Goldman Sachs Bank USA (incorporated by reference to Exhibit 10.1 of the Current Report on Form 8-K filed by Tronox Limited on April 29, 2014).
|
107
|
Amended and Restated Employment Agreement dated as of August 14, 2014 by and between Tronox Limited, Tronox LLC and Thomas Casey (incorporated by reference to Exhibit 10.1 to the Company’s Current Report on Form 8-K filed on August 20, 2014).
|
|
|
|
|
|
Amendment to Certain Equity-Based Award Agreements, dated as of August 14, 2014, between Tronox Limited and Thomas Casey (incorporated by reference to Exhibit 10.2 to the Company’s Current Report on Form 8-K filed on August 20, 2014).
|
|
|
|
|
|
Amended and Restated Employment Agreement dated as of December 23, 2014 by and between Tronox LLC and John Romano (incorporated by reference to Exhibit 10.1 to the Company’s Current Report on Form 8-K filed on December 23, 2014).
|
|
|
|
|
|
Employment Agreement dated as of June 15, 2012 by and between Tronox LLC and Willem Van Niekerk (incorporated by reference to Exhibit 10.29 of the Annual Report on Form 10-K filed by Tronox Limited on February 26, 2015).
|
|
|
|
|
|
Amended and Restated Revolving Syndicated Facility Agreement dated as of April 1, 2015, among Tronox Incorporated, Tronox Limited, Tronox Pigments (Holland) B.V., Guarantors named therein, Lenders named therein, UBS Securities LLC, as Lead Arranger and Bookmanager, Goldman Sachs Bank USA and Royal Bank of Canada, as Co-Syndication Agents, Credit Suisse AG, Cayman Islands Branch and Wells Fargo Bank, N.A., as Co-Documentation Agents, UBS AG, Stamford Branch, as Issuing Bank, Swingline Lender, Administrative Agent and Collateral Agent, and UBS AG, Stamford Branch, as Australian Security Trustee (incorporated by reference to Exhibit 10.1 to the Company’s Report on Form 8-K filed on April 7, 2015).
|
|
|
|
|
|
Separation Agreement, General Release and Waiver of Claims entered into as of July 14, 2016 by and between Tronox Limited and Katherine C. Harper (incorporated by reference to Exhibit 10.1 to the Company’s Current Report on Form 8-K filed on July 15, 2016).
|
|
|
|
|
|
Employment Agreement Extension entered into as of July 13, 2016 by and between Tronox LLC and Jean-Francois Turgeon (incorporated by reference to Exhibit 10.2 to the Company’s Current Report on Form 8-K filed on July 15, 2016).
|
|
|
|
|
|
Amendment No. 2 to Tronox Limited Management Equity Incentive Plan (incorporated by reference to Exhibit 10.1 to the Company’s Current Report on Form 8-K filed on September 9, 2016).
|
|
|
|
|
|
Employment Agreement entered into as of October 17, 2016 by and between Tronox LLC and Timothy Carlson (incorporated by reference to Exhibit 10.1 to the Company’s Current Report on Form 8-K filed on October 17, 2016).
|
|
|
|
|
|
Amendment No. 1 to Tronox Limited Management Equity Incentive Plan (incorporated by reference to Exhibit A of the Definitive Proxy Statement of Tronox Limited filed on Form DEF 14A on April 8, 2016).
|
|
|
|
|
|
General form of executive officer Time-Based Restricted Share Unit Agreement (incorporated by reference to Exhibit 10.1 to the Company’s Report on Form 10-Q filed on May 4, 2017).
|
|
|
|
|
|
General form of executive officer Performance-Based Restricted Share Unit Agreement (incorporated by reference to Exhibit 10.2 to the Company’s Report on Form 10-Q filed on May 4, 2017).
|
|
|
|
|
|
General form of Director Grant Restricted Share Unit Agreement (incorporated by reference to Exhibit 10.3 to the Company’s Report on Form 10-Q filed on May 4, 2017).
|
108
|
General form of Cristal Transaction Integration Synergy Savings Performance-Based Restricted Share Unit Agreement (incorporated by reference to Exhibit 10.4 to the Company’s Report on Form 10-Q filed on May 4, 2017).
|
|
|
|
|
|
Stock Purchase Agreement, dated as of August 2, 2017, by and among Tronox Limited, Tronox US Holdings Inc., Tronox Alkali Corporation, and Genesis Energy, L.P. (incorporated by reference to Exhibit 2.1 of the Current Report on Form 8-K filed by Tronox Limited on August 2, 2017).
|
|
|
|
|
|
Interim CEO Agreement dated as of May 15, 2017 by and between Tronox LLC and Peter Johnston (incorporated by reference to Exhibit 10.1 of the Amended Current Report on Form 8-K/A filed by Tronox Limited on May 18, 2017).
|
|
|
|
|
|
10.36*
|
First Amendment to Amended and Restated Employment Agreement dated as of May 15, 2017 by and between Tronox Limited, Tronox LLC and Thomas Casey (incorporated by reference to Exhibit 10.2 of the Amended Current Report on Form 8-K/A filed by Tronox Limited on May 18, 2017).
|
|
|
|
|
10.37*
|
Retirement Agreement dated as of May 15, 2017 by and between Tronox Limited, Tronox LLC and Thomas Casey (incorporated by reference to Exhibit 10.3 of the Amended Current Report on Form 8-K/A filed by Tronox Limited on May 18, 2017).
|
|
|
|
|
Revolving Syndicated Facility Agreement, dated as of September 22, 2017 among the Company, Tronox US Holdings Inc. and certain of the Company’s other subsidiaries along with a syndicate of lenders and Wells Fargo Bank, National Association, as issuing bank, swingline lender, administrative agent, and collateral agent (incorporated by reference to Exhibit 10.1 of the Current Report on Form 8-K filed by Tronox Limited on September 25, 2017).
|
|
|
|
|
|
First Lien Term Loan Credit Agreement, dated as of September 22, 2017 among Tronox Finance LLC and its unrestricted subsidiary Tronox Blocked Borrower LLC, and certain of the Company’s other subsidiaries, along with a syndicate of lenders and Bank of America, N.A. as administrative agent and collateral agent (incorporated by reference to Exhibit 10.2 of the Current Report on Form 8-K filed by Tronox Limited on September 25, 2017).
|
|
|
|
|
|
Employment Agreement by and between Tronox LLC and Jeffry N. Quinn (incorporated by reference to Exhibit 10.1 of the Current Report on Form 8-K/A filed by Tronox Limited on November 28, 2017).
|
|
|
|
|
|
General form of executive officer Performance-Based Restricted Share Unit Agreement for grants dated on or after February 8, 2018 (filed herewith).
|
|
|
|
|
|
Ratio of Earnings to Fixed Charges.
|
|
|
|
|
|
Tronox Code of Business Conduct, Code of Ethics (incorporated by reference to Exhibit 14.1 to the Company’s Annual Report on Form 10-K filed on February 27, 2014).
|
|
|
|
|
|
Subsidiaries of Tronox Limited.
|
|
|
|
|
|
Consent of PricewaterhouseCoopers LLP, Independent Registered Public Accounting Firm for Tronox Limited.
|
|
|
|
|
|
Rule 13a-14(a) Certification of Jeffry N. Quinn.
|
|
|
|
|
|
Rule 13a-14(a) Certification of Timothy Carlson.
|
109
|
Section 1350 Certification for Jeffry N. Quinn.
|
|
|
|
|
|
Section 1350 Certification for Timothy Carlson.
|
|
|
|
|
|
Mine Safety Disclosures.
|
|
|
|
|
|
101.INS
|
XBRL Instance Document
|
|
|
|
|
101.SCH
|
XBRL Taxonomy Extension Schema Document.
|
|
|
|
|
101.CAL
|
XBRL Taxonomy Extension Calculation Linkbase Document
|
|
|
|
|
101.LAB
|
XBRL Taxonomy Extension Label Linkbase Document
|
|
|
|
|
101.DEF
|
XBRL Taxonomy Extension Definition Linkbase Document
|
|
|
|
|
101.PRE
|
XBRL Taxonomy Extension Presentation Linkbase Document
|
| * | Indicates management contract or compensatory plan or arrangement. |
| Item 16. | Form 10-K Summary. |
None.
110
Pursuant to the requirements of Section 13 or 15(d) of the Securities Exchange Act of 1934, the registrant has duly caused this report to be signed on its behalf by the undersigned, thereunto duly authorized, on this 1st day of March 2018.
|
|
TRONOX LIMITED
(Registrant) |
|
|
|
|
|
|
|
By:
|
/s/ Timothy Carlson
|
|
|
Name:
|
Timothy Carlson
|
|
|
Title:
|
Senior Vice President and Chief
Financial Officer |
Pursuant to the requirements of the Securities Exchange Act of 1934, this report has been signed by the following persons on behalf of the registrant and in the capacities and on the dates indicated.
|
Signature
|
Title
|
Date
|
|
/s/ Jeffry N. Quinn
|
President,
Chief Executive Officer and Director (Principal Executive Officer) |
March 1, 2018
|
|
Jeffry N. Quinn
|
||
|
|
|
|
|
/s/ Timothy Carlson
|
Senior Vice President, Chief
Financial Officer and Director (Principal Financial Officer) |
March 1, 2018
|
|
Timothy Carlson
|
||
|
|
|
|
|
/s/ James T. Bagley
|
Vice President and Controller
(Principal Accounting Officer) |
March 1, 2018
|
|
James Bagley
|
||
|
|
|
|
|
/s/ Ilan Kaufthal
|
Non-executive Chairman of the Board
|
March 1, 2018
|
|
Ilan Kaufthal
|
|
|
|
|
|
|
|
/s/ Daniel Blue
|
Director
|
March 1, 2018
|
|
Daniel Blue
|
||
|
|
|
|
|
/s/ Mxolisi Mgojo
|
Director
|
March 1, 2018
|
|
Mxolisi Mgojo
|
||
|
|
|
|
|
/s/ Andrew P. Hines
|
Director
|
March 1, 2018
|
|
Andrew P. Hines
|
||
|
|
|
|
|
/s/ Wayne A. Hinman
|
Director
|
March 1, 2018
|
|
Wayne A. Hinman
|
||
|
|
|
|
|
/s/ Peter Johnston
|
Director
|
March 1, 2018
|
|
Peter Johnston
|
||
|
|
|
|
|
/s/ Sipho Nkosi
|
Director
|
March 1, 2018
|
|
Sipho Nkosi
|
111