Attached files
| file | filename |
|---|---|
| EX-32.2 - EXHIBIT 32.2 - PUBLIX SUPER MARKETS INC | publix-fy17q4xex322.htm |
| EX-32.1 - EXHIBIT 32.1 - PUBLIX SUPER MARKETS INC | publix-fy17q4xex321.htm |
| EX-31.2 - EXHIBIT 31.2 - PUBLIX SUPER MARKETS INC | publix-fy17q4xex312.htm |
| EX-31.1 - EXHIBIT 31.1 - PUBLIX SUPER MARKETS INC | publix-fy17q4xex311.htm |
| EX-23 - EXHIBIT 23 - PUBLIX SUPER MARKETS INC | publix-fy17q4xex23.htm |
| EX-21 - EXHIBIT 21 - PUBLIX SUPER MARKETS INC | publix-fy17q4xex21.htm |
UNITED STATES
SECURITIES AND EXCHANGE COMMISSION
Washington, D.C. 20549
FORM 10-K
ANNUAL REPORT PURSUANT TO SECTION 13 OR 15(d)
OF THE SECURITIES EXCHANGE ACT OF 1934
For the fiscal year ended December 30, 2017
Commission File Number 0-00981

PUBLIX SUPER MARKETS, INC.
(Exact name of Registrant as specified in its charter)
Florida | 59-0324412 | |
(State of Incorporation) | (I.R.S. Employer Identification No.) | |
3300 Publix Corporate Parkway, Lakeland, Florida | 33811 | |
(Address of principal executive offices) | (Zip code) | |
Registrant’s telephone number, including area code: (863) 688-1188
Securities registered pursuant to Section 12(b) of the Act: None
Securities registered pursuant to Section 12(g) of the Act: Common Stock $1.00 Par Value
Indicate by check mark if the Registrant is a well-known seasoned issuer, as defined in Rule 405 of the Securities Act.
Yes No X
Indicate by check mark if the Registrant is not required to file reports pursuant to Section 13 or Section 15(d) of the Act.
Yes No X
Indicate by check mark whether the Registrant (1) has filed all reports required to be filed by Section 13 or 15(d) of the Securities Exchange Act of 1934 during the preceding 12 months and (2) has been subject to such filing requirements for the past 90 days.
Yes X No
Indicate by check mark whether the Registrant has submitted electronically and posted on its corporate Web site, if any, every Interactive Data File required to be submitted and posted pursuant to Rule 405 of Regulation S-T during the preceding 12 months.
Yes X No
Indicate by check mark if disclosure of delinquent filers pursuant to Item 405 of Regulation S-K is not contained herein, and will not be contained, to the best of Registrant’s knowledge, in definitive proxy or information statements incorporated by reference in Part III of this Form 10-K or any amendment to this Form 10-K. (X)
Indicate by check mark whether the Registrant is a large accelerated filer, an accelerated filer, a non-accelerated filer, a smaller reporting company or an emerging growth company. See the definitions of “large accelerated filer,” “accelerated filer,” “smaller reporting company” and "emerging growth company" in Rule 12b-2 of the Exchange Act.
Large accelerated filer Accelerated filer Non-accelerated filer X
Smaller reporting company Emerging growth company
If an emerging growth company, indicate by check mark if the Registrant has elected not to use the extended transition period for complying with any new or revised financial accounting standards provided pursuant to Section 13(a) of the Exchange Act.
Indicate by check mark whether the Registrant is a shell company (as defined in Rule 12b-2 of the Act).
Yes No X
The aggregate market value of the common stock held by non-affiliates of the Registrant was approximately $15,854,394,000 as of June 30, 2017, the last business day of the Registrant’s most recently completed second fiscal quarter.
The number of shares of the Registrant’s common stock outstanding as of February 6, 2018 was 732,238,000.
Documents Incorporated By Reference
The information required by Part III of this report, to the extent not set forth herein, is incorporated by reference from the Proxy Statement solicited for the 2018 Annual Meeting of Stockholders to be held on April 17, 2018.
TABLE OF CONTENTS
Page | |||
Item 1. | |||
Item 1A. | |||
Item 1B. | |||
Item 2. | |||
Item 3. | |||
Item 4. | |||
Item 5. | |||
Item 6. | |||
Item 7. | |||
Item 7A. | |||
Item 8. | |||
Item 9. | |||
Item 9A. | |||
Item 9B. | |||
Item 10. | |||
Item 11. | |||
Item 12. | |||
Item 13. | |||
Item 14. | |||
Item 15. | |||
PART I
Item 1. Business
Publix Super Markets, Inc. and its wholly owned subsidiaries (the Company) are in the business of operating retail food supermarkets in Florida, Georgia, Alabama, South Carolina, Tennessee, North Carolina and Virginia. The Company was founded in 1930 and later merged into another corporation that was originally incorporated in 1921. The Company has no other significant lines of business or industry segments.
Merchandising and manufacturing
The Company sells grocery (including dairy, produce, deli, bakery, meat and seafood), health and beauty care, general merchandise, pharmacy, floral and other products and services. The percentage of consolidated sales by merchandise category for 2017, 2016 and 2015 was as follows:
2017 | 2016 | 2015 | |||||||
Grocery | 84 | % | 84 | % | 85 | % | |||
Other | 16 | % | 16 | % | 15 | % | |||
100 | % | 100 | % | 100 | % | ||||
The Company’s lines of merchandise include a variety of nationally advertised and private label brands as well as unbranded products such as produce, meat and seafood. The Company receives the food and nonfood products it distributes from many sources. These products are delivered to the supermarkets through Company distribution centers or directly from the suppliers and are generally available in sufficient quantities to enable the Company to adequately satisfy its customers. The Company believes that its sources of supply of these products and raw materials used in manufacturing are adequate for its needs and that it is not dependent upon a single supplier or relatively few suppliers. Approximately 77% of the total cost of products purchased is delivered to the supermarkets through the Company’s distribution centers. Private label items are produced in the Company’s dairy, bakery and deli manufacturing facilities or are manufactured for the Company by suppliers. The Company has experienced no significant changes in the kinds of products sold or in its methods of distribution since the beginning of the fiscal year.
Store operations
The Company operated 1,167 supermarkets at the end of 2017, compared with 1,136 at the beginning of the year. In 2017, 44 supermarkets were opened (including nine replacement supermarkets) and 132 supermarkets were remodeled. Thirteen supermarkets were closed during the period. The nine replacement supermarkets that opened in 2017 replaced five of the supermarkets closed in 2017 and four supermarkets closed in 2016. The eight remaining supermarkets closed in 2017 will be replaced on site in subsequent periods. New supermarkets added 1.5 million square feet in 2017, an increase of 2.9%. At the end of 2017, the Company had 779 supermarkets located in Florida, 186 in Georgia, 65 in Alabama, 58 in South Carolina, 41 in Tennessee, 30 in North Carolina and eight in Virginia. Also, at the end of 2017, the Company had 15 supermarkets under construction in Florida, nine in North Carolina, four in Alabama, two in Georgia, two in Tennessee and two in Virginia.
Competition
The Company is engaged in the highly competitive retail food industry. The Company’s competitors include traditional supermarkets, such as national and regional supermarket chains and independent supermarkets, as well as nontraditional competitors, such as supercenters, membership warehouse clubs, mass merchandisers, dollar stores, drug stores, specialty food stores, restaurants, convenience stores and online retailers. The Company’s ability to attract and retain customers is based primarily on quality of goods and service, price, convenience, product mix and store location.
Working capital
The Company’s working capital at the end of 2017 consisted of $4,084.9 million in current assets and $3,142.3 million in current liabilities. Normal operating fluctuations in these balances can result in changes to cash flows from operating activities presented in the consolidated statements of cash flows that are not necessarily indicative of long-term operating trends. There are no unusual industry practices or requirements relating to working capital items.
Seasonality
The historical influx of winter residents to Florida and increased purchases of products during the traditional Thanksgiving, Christmas and Easter holidays typically result in seasonal sales increases from November to April of each year.
1
Employees
The Company had 193,000 employees at the end of 2017. The Company considers its employee relations to be good.
Intellectual property
The Company’s trademarks, trade names, copyrights and similar intellectual property are important to the success of the Company’s business. Numerous trademarks, including “Publix” and “Where Shopping is a Pleasure,” have been registered with the U.S. Patent and Trademark Office. Due to the importance of its intellectual property to its business, the Company actively defends and enforces its rights to such property.
Environmental matters
The Company’s operations are subject to regulation under federal, state and local environmental protection laws and regulations. The Company may be subject to liability under applicable environmental laws for cleanup of contamination at its facilities. Compliance with these laws had no material effect on capital expenditures, results of operations or the competitive position of the Company.
Company information
The Company’s Annual Reports on Form 10-K, Proxy Statements, Quarterly Reports on Form 10-Q, Current Reports on Form 8-K and any amendments to those reports may be obtained electronically, free of charge, through the Company’s website at corporate.publix.com/stock.
Item 1A. Risk Factors
In addition to the other information contained in this Annual Report on Form 10-K, the following risk factors should be considered carefully in evaluating the Company’s business. The Company’s financial condition and results of operations could be materially and adversely affected by any of these risks.
Increased competition could adversely affect the Company.
The Company is engaged in the highly competitive retail food industry. The Company’s competitors include traditional supermarkets, such as national and regional supermarket chains and independent supermarkets, as well as nontraditional competitors, such as supercenters, membership warehouse clubs, mass merchandisers, dollar stores, drug stores, specialty food stores, restaurants, convenience stores and online retailers. There has been a trend for traditional supermarkets to lose market share to nontraditional competitors. The Company’s ability to attract and retain customers is based primarily on quality of goods and service, price, convenience, product mix and store location. The Company believes it will face increased competition in the future from existing and potentially new competitors and its financial condition and results of operations could be impacted by the pricing, purchasing, advertising or promotional decisions made by its competitors as well as competitor format innovation and location additions.
General economic and other conditions that impact consumer spending could adversely affect the Company.
The Company’s results of operations are sensitive to changes in general economic conditions that impact consumer spending. Adverse economic conditions, including high unemployment, home foreclosures and weakness in the housing market, declines in the stock market and the instability of the credit markets, could cause a reduction in consumer spending. While there has been a trend toward lower unemployment and fuel prices in recent periods which has contributed to a better economic climate, there is uncertainty about the continued strength of the economy. If the economy weakens, or if fuel prices increase, consumers may reduce consumer spending. Other conditions that could affect consumer spending include increases in tax, interest and inflation rates, increases in energy costs, increases in health care costs, the impact of natural disasters or acts of terrorism, and other factors. This reduction in the level of consumer spending could cause customers to purchase lower margin items or to shift spending to lower priced competitors, which could adversely affect the Company’s financial condition and results of operations.
Increased operating costs could adversely affect the Company.
The Company’s operations tend to be more labor intensive than some of its competitors primarily due to the additional customer service offered in its supermarkets. Consequently, uncertain labor markets, government mandated increases in the minimum wage or other benefits, increased wage rates by retailers and other labor market competitors, an increased proportion of full-time employees, increased costs of health care due to health insurance reform or other factors could result in an increase in labor costs. In addition, the inability to improve or manage operating costs, including payroll, facilities or other non-product related costs, could adversely affect the Company’s financial condition and results of operations.
2
Failure to execute the Company’s core strategies could adversely affect the Company.
The Company’s core strategies focus on customer service, product quality, shopping environment, competitive pricing and convenient locations. The Company has implemented several strategic business and technology initiatives as part of the execution of these core strategies. The Company believes these core strategies and related strategic initiatives differentiate it from its competition and present opportunities for sustained market share and financial growth. Failure to execute these core strategies, or failure to execute the core strategies in a cost effective manner, could adversely affect the Company’s financial condition and results of operations.
Failure to identify and obtain or retain suitable supermarket sites could adversely affect the Company.
The Company’s ability to obtain sites for new supermarkets is dependent on identifying and entering into lease or purchase agreements on commercially reasonable terms for properties that are suitable for its needs. If the Company fails to identify suitable sites and enter into lease or purchase agreements on a timely basis for any reason, including competition from other companies seeking similar sites, the Company’s growth could be adversely affected because it may be unable to open new supermarkets as anticipated. Similarly, its business could be adversely affected if it is unable to renew the leases on its existing leased supermarkets on commercially reasonable terms.
Failure to maintain the privacy and security of confidential customer and business information and the resulting unfavorable publicity could adversely affect the Company.
The Company receives, retains and transmits confidential information about its customers, employees and suppliers and entrusts certain of that information to third party service providers. The Company depends upon the secure transmission of confidential information, including customer payments, over external networks. Additionally, the use of individually identifiable data by the Company and its third party service providers is subject to federal, state and local laws and regulations. An intrusion into or compromise of the Company’s information technology systems, or those of its third party service providers, that results in customer, employee or supplier information being obtained by unauthorized persons could adversely affect the Company’s reputation with existing and potential customers, employees and others. Such an intrusion or compromise could require expending significant resources related to remediation, lead to legal proceedings and regulatory actions, result in a disruption of operations and adversely affect the Company’s financial condition and results of operations.
Disruptions in information technology systems could adversely affect the Company.
The Company is dependent on complex information technology systems to operate its business, enhance customer service, improve the efficiency of its supply chain and increase employee efficiency. Certain of these information technology systems are hosted by third party service providers. The Company’s information technology systems, as well as those of the Company’s third party service providers, are subject to damage or interruption from power outages, computer and telecommunications failures, computer viruses, malicious service disruptions, catastrophic events and user errors. Significant disruptions in the information technology systems of the Company or its third party service providers could adversely affect the Company’s financial condition and results of operations.
Unexpected changes in the insurance market or factors affecting self-insurance reserve estimates could adversely affect the Company.
The Company uses a combination of insurance coverage and self-insurance to provide for potential liability for employee benefits, workers’ compensation, general liability, fleet liability and directors and officers liability. The Company is self-insured for property, plant and equipment losses. There is no assurance that the Company will be able to continue to maintain its insurance coverage or obtain comparable insurance coverage on commercially reasonable terms. Self-insurance reserves are determined based on actual claims experience and an estimate of claims incurred but not reported including, where necessary, actuarial studies. Actuarial projections of losses are subject to variability caused by, but not limited to, such factors as future interest and inflation rates, future economic conditions, claims experience, litigation trends and benefit level changes. An increase in the frequency or costs of claims, changes in actuarial assumptions or catastrophic events involving property, plant and equipment losses could adversely affect the Company’s financial condition and results of operations.
Product liability claims, product recalls and the resulting unfavorable publicity could adversely affect the Company.
The distribution and sale of grocery, drug and other products purchased from suppliers or manufactured by the Company entails an inherent risk of product liability claims, product recalls and the resulting adverse publicity. Such products may contain contaminants that may be inadvertently sold by the Company. These contaminants may, in certain cases, result in illness, injury or death if processing at the consumer level, if applicable, does not eliminate the contaminants. Even an inadvertent shipment of adulterated products may be a violation of law and may lead to a product recall and/or an increased risk of exposure to product liability claims. There can be no assurance that such claims will not be asserted against the Company or that the Company will not be obligated to perform product recalls in the future. If a product liability claim is successful, the Company’s insurance coverage may not be adequate to pay all liabilities, and the Company may not be able to continue to maintain such insurance coverage or obtain comparable insurance coverage on commercially reasonable terms. If the Company does not have adequate insurance coverage or contractual indemnification available, product liability claims could have an adverse effect on the Company’s ability
3
to successfully market its products and on the Company’s financial condition and results of operations. In addition, even if a product liability claim is not successful or is not fully pursued, the adverse publicity surrounding any assertion that the Company’s products caused illness or injury could have an adverse effect on the Company’s reputation with existing and potential customers and on the Company’s financial condition and results of operations.
Unfavorable changes in, failure to comply with or increased costs to comply with environmental laws and regulations could adversely affect the Company.
The Company is subject to federal, state and local laws and regulations that govern activities that may have adverse environmental effects and impose liabilities for the costs of contamination cleanup and damages arising from sites of past spills, disposals or other releases of hazardous materials. Under current environmental laws, the Company may be held responsible for the remediation of environmental conditions regardless of whether the Company leases, subleases or owns the supermarkets or other facilities and regardless of whether such environmental conditions were created by the Company or a prior owner or tenant. The costs of investigation, remediation or removal of environmental conditions may be substantial. In addition, the increased focus on climate change, waste management and other environmental issues may result in new environmental laws or regulations that could adversely affect the Company directly or indirectly through increased costs on its suppliers. There can be no assurance that environmental conditions relating to prior, existing or future sites or other environmental changes will not adversely affect the Company’s financial condition and results of operations through, for instance, business interruption, cost of remediation or adverse publicity.
Unfavorable changes in, failure to comply with or increased costs to comply with laws and regulations could adversely affect the Company.
In addition to environmental laws and regulations, the Company is subject to federal, state and local laws and regulations relating to, among other things, product labeling and safety, zoning, land use, workplace safety, public health, accessibility and restrictions on the sale of various products, including alcoholic beverages, tobacco and drugs. The Company is also subject to laws governing its relationship with employees, including minimum wage requirements, overtime, working conditions, disabled access and work permit requirements. Compliance with, or changes in, these laws, the passage of new laws and increased government regulation could adversely affect the Company’s financial condition and results of operations.
Unfavorable results of legal proceedings could adversely affect the Company.
The Company is subject from time to time to various lawsuits, claims and charges arising in the normal course of business, including employment, personal injury, commercial and other matters. Some lawsuits also contain class action allegations. The Company estimates its exposure to these legal proceedings and establishes reserves for the estimated liabilities. Assessing and predicting the outcome of these matters involves substantial uncertainties. Although not currently anticipated by the Company, differences in actual outcomes or changes in the Company’s evaluation could adversely affect the Company’s financial condition and results of operations.
Item 1B. Unresolved Staff Comments
None
Item 2. Properties
At year end, the Company operated 54.9 million square feet of supermarket space. The Company’s supermarkets vary in size. Current supermarket prototypes range from 28,000 to 61,000 square feet. Supermarkets are often located in shopping centers where the Company is the anchor tenant. The majority of the Company’s supermarkets are leased. Substantially all of these leases will expire during the next 20 years. However, in the normal course of business, it is expected that the leases will be renewed or replaced by new leases. Both the building and land are owned at 302 locations. The building is owned while the land is leased at 69 other locations.
The Company supplies its supermarkets from nine primary distribution centers located in Lakeland, Miami, Jacksonville, Sarasota, Orlando, Deerfield Beach and Boynton Beach, Florida, Lawrenceville, Georgia and McCalla, Alabama. The Company operates six manufacturing facilities, including three dairy plants located in Lakeland and Deerfield Beach, Florida and Lawrenceville, Georgia, two bakery plants located in Lakeland, Florida and Atlanta, Georgia and a deli plant located in Lakeland, Florida.
The Company’s corporate offices, primary distribution centers and manufacturing facilities are owned with no outstanding debt. The Company’s properties are well maintained, in good operating condition and suitable for operating its business.
4
Item 3. Legal Proceedings
The Company is subject from time to time to various lawsuits, claims and charges arising in the normal course of business. The Company believes its recorded reserves are adequate in light of the probable and estimable liabilities. The estimated amount of reasonably possible losses for lawsuits, claims and charges, individually and in the aggregate, is considered to be immaterial. In the opinion of management, the ultimate resolution of these legal proceedings will not have a material adverse effect on the Company’s financial condition, results of operations or cash flows.
Item 4. Mine Safety Disclosures
Not applicable
PART II
Item 5. Market for the Registrant’s Common Equity, Related Stockholder Matters and Issuer Purchases of Equity Securities
(a) | Market Information |
The Company’s common stock is not traded on an established securities market. Substantially all transactions of the Company’s common stock have been among the Company, its employees, former employees, their families and the benefit plans established for the Company’s employees. Common stock is made available for sale by the Company only to its current employees and members of its Board of Directors through the Company’s Employee Stock Purchase Plan (ESPP) and Non-Employee Directors Stock Purchase Plan (Directors Plan) and to participants of the Company’s 401(k) Plan. In addition, common stock is provided to employees through the Employee Stock Ownership Plan (ESOP). The Company currently repurchases common stock subject to certain terms and conditions. The ESPP, Directors Plan, 401(k) Plan and ESOP each contain provisions prohibiting any transfer for value without the owner first offering the common stock to the Company. The Company serves as the registrar and stock transfer agent for its common stock.
Because there is no trading of the Company’s common stock on an established securities market, the market price of the Company’s common stock is determined by its Board of Directors. As part of the process to determine the market price, an independent valuation is obtained. The process includes comparing the Company’s financial results to those of comparable companies that are publicly traded (comparable publicly traded companies). The purpose of the process is to determine a value for the Company’s common stock that is comparable to the stock value of comparable publicly traded companies by considering both the results of the stock market and the relative financial results of comparable publicly traded companies. The market prices for the Company’s common stock for 2017 and 2016 were as follows:
2017 | 2016 | ||||||
January - February | $ | 40.15 | 41.80 | ||||
March - April | 40.90 | 45.20 | |||||
May - July | 39.15 | 43.95 | |||||
August - October | 36.05 | 41.90 | |||||
November - December | 36.85 | 40.15 | |||||
(b) | Approximate Number of Equity Security Holders |
As of February 6, 2018, the approximate number of holders of record of the Company’s common stock was 184,000.
(c) | Dividends |
The Company paid quarterly dividends per share on its common stock in 2017 and 2016 as follows:
Quarter | 2017 | 2016 | |||||
First | $ | 0.2225 | 0.2000 | ||||
Second | 0.2300 | 0.2225 | |||||
Third | 0.2300 | 0.2225 | |||||
Fourth | 0.2300 | 0.2225 | |||||
$ | 0.9125 | 0.8675 | |||||
Payment of dividends is within the discretion of the Board of Directors and depends on, among other factors, net earnings, capital requirements and the financial condition of the Company. However, the Company intends to continue to pay comparable dividends to stockholders in the future.
5
(d) | Purchases of Equity Securities by the Issuer |
Issuer Purchases of Equity Securities
Shares of common stock repurchased by the Company during the three months ended December 30, 2017 were as follows (amounts are in thousands, except per share amounts):
Period | Total Number of Shares Purchased | Average Price Paid per Share | Total Number of Shares Purchased as Part of Publicly Announced Plans or Programs (1) | Approximate Dollar Value of Shares That May Yet Be Purchased Under the Plans or Programs (1) | ||||||||||||
October 1, 2017 through November 4, 2017 | 5,384 | $ | 36.38 | N/A | N/A | |||||||||||
November 5, 2017 through December 2, 2017 | 1,961 | 36.85 | N/A | N/A | ||||||||||||
December 3, 2017 through December 30, 2017 | 1,224 | 36.85 | N/A | N/A | ||||||||||||
Total | 8,569 | $ | 36.55 | N/A | N/A | |||||||||||
____________________________
(1) | Common stock is made available for sale by the Company only to its current employees and members of its Board of Directors through the ESPP and Directors Plan and to participants of the 401(k) Plan. In addition, common stock is provided to employees through the ESOP. The Company currently repurchases common stock subject to certain terms and conditions. The ESPP, Directors Plan, 401(k) Plan and ESOP each contain provisions prohibiting any transfer for value without the owner first offering the common stock to the Company. |
The Company’s common stock is not traded on an established securities market. The amount of common stock offered to the Company for repurchase is not within the control of the Company, but is at the discretion of the stockholders. The Company does not believe that these repurchases of its common stock are within the scope of a publicly announced plan or program (although the terms of the plans discussed above have been communicated to the participants). Thus, the Company does not believe that it has made any repurchases during the three months ended December 30, 2017 required to be disclosed in the last two columns of the table.
6
(e) | Performance Graph |
The following performance graph sets forth the Company’s cumulative total stockholder return during the five years ended December 30, 2017, compared to the cumulative total return on the S&P 500 Index and a custom Peer Group Index including retail food supermarket companies.(1) The Peer Group Index is weighted based on the various companies’ market capitalization. The comparison assumes $100 was invested at the end of 2012 in the Company’s common stock and in each of the related indices and assumes reinvestment of dividends.
The Company’s common stock is valued as of the end of each fiscal quarter. After the end of a quarter, however, shares continue to be traded at the prior valuation until the new valuation is received. The cumulative total return for the companies represented in the S&P 500 Index and the custom Peer Group Index is based on those companies’ trading price as of the Company’s fiscal year end. The following performance graph is based on the Company’s trading price at fiscal year end based on its market price as of the prior fiscal quarter. For comparative purposes, a performance graph based on the fiscal year end valuation (market price as of March 1, 2018) is provided in the 2018 Proxy Statement. Past stock performance shown below is no guarantee of future performance.
Comparison of Five-Year Cumulative Return Based Upon Fiscal Year End Trading Price
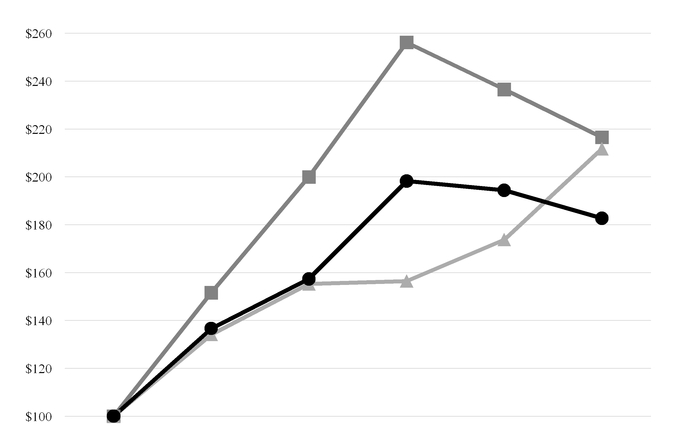
2012 | 2013 | 2014 | 2015 | 2016 | 2017 | ||||||||||
 | Publix | $100.00 | 136.62 | 157.37 | 198.27 | 194.39 | 182.70 | ||||||||
 | S&P 500 | 100.00 | 134.12 | 155.27 | 156.46 | 173.78 | 211.72 | ||||||||
 | Peer Group (1) | 100.00 | 151.61 | 200.00 | 256.20 | 236.54 | 216.57 | ||||||||
___________________________
(1) | Companies included in the Peer Group are Ahold Delhaize, Kroger, Supervalu and Weis Markets. Ahold and Delhaize Group merged into Ahold Delhaize in 2016. The Peer Group includes Ahold Delhaize for 2016 and 2017 and Ahold and Delhaize Group in prior years. |
7
Item 6. Selected Financial Data
2017 | 2016 (1) | 2015 | 2014 | 2013 | |||||||||||||||||||||||||||
(Amounts are in thousands, except per share amounts and number of supermarkets) | |||||||||||||||||||||||||||||||
Sales: | |||||||||||||||||||||||||||||||
Sales | $ | 34,558,286 | 33,999,921 | 32,362,579 | 30,559,505 | 28,917,439 | |||||||||||||||||||||||||
Percent change | 1.6 | % | 5.1 | % | 5.9 | % | 5.7 | % | 5.2 | % | |||||||||||||||||||||
Comparable store sales percent change | 1.7 | % | 1.9 | % | 4.2 | % | 5.4 | % | 3.6 | % | |||||||||||||||||||||
Earnings: | |||||||||||||||||||||||||||||||
Gross profit (2) | $ | 9,428,569 | 9,265,616 | 8,902,969 | 8,326,855 | 7,980,120 | |||||||||||||||||||||||||
Earnings before income tax expense | $ | 3,027,506 | 2,940,376 | 2,869,261 | 2,570,121 | 2,465,689 | |||||||||||||||||||||||||
Net earnings | $ 2,291,894 (3) | 2,025,688 | 1,965,048 | 1,735,308 | 1,653,954 | ||||||||||||||||||||||||||
Net earnings as a percent of sales | 6.6% (3) | 6.0 | % | 6.1 | % | 5.7 | % | 5.7 | % | ||||||||||||||||||||||
Common stock: | |||||||||||||||||||||||||||||||
Weighted average shares outstanding | 753,483 | 769,267 | 774,428 | 778,708 | 780,188 | ||||||||||||||||||||||||||
Basic and diluted earnings per share | $ 3.04 (3) | 2.63 | 2.54 | 2.23 | 2.12 | ||||||||||||||||||||||||||
Dividends per share | $ | 0.9125 | 0.8675 | 0.79 | 0.74 | 0.70 | |||||||||||||||||||||||||
Financial data: | |||||||||||||||||||||||||||||||
Capital expenditures | $ | 1,429,059 | 1,443,827 | 1,235,648 | 1,374,124 | 668,485 | |||||||||||||||||||||||||
Working capital | $ | 942,607 | 1,574,464 | 1,411,744 | 1,035,758 | 881,222 | |||||||||||||||||||||||||
Current ratio | 1.30 | 1.53 | 1.49 | 1.38 | 1.37 | ||||||||||||||||||||||||||
Total assets | $ | 18,183,506 | 17,386,458 | 16,359,278 | 15,083,480 | 13,546,641 | |||||||||||||||||||||||||
Long-term debt (including current portion) | $ | 193,074 | 250,584 | 236,446 | 217,638 | 162,154 | |||||||||||||||||||||||||
Common stock related to ESOP | $ | 3,053,138 | 3,068,097 | 2,953,878 | 2,680,528 | 2,322,903 | |||||||||||||||||||||||||
Total equity | $ | 14,108,619 | 13,497,437 | 12,431,262 | 11,345,223 | 10,267,796 | |||||||||||||||||||||||||
Supermarkets | 1,167 | 1,136 | 1,114 | 1,095 | 1,079 | ||||||||||||||||||||||||||
___________________________
(1) | Fiscal year 2016 includes 53 weeks. All other years include 52 weeks. |
(2) | Gross profit represents sales less cost of merchandise sold as reported in the consolidated statements of earnings. |
(3) | During 2017, the Company recorded the remeasurement of deferred income taxes due to the Tax Cuts and Jobs Act of 2017 (Tax Act). Excluding the impact of the Tax Act, net earnings would have been $2,067,699,000 or $2.74 per share and 6.0% as a percent of sales. |
8
Item 7. Management’s Discussion and Analysis of Financial Condition and Results of Operations
Overview
The Company is engaged in the retail food industry, operating supermarkets in Florida, Georgia, Alabama, South Carolina, Tennessee, North Carolina and Virginia. The Company has no other significant lines of business or industry segments. As of December 30, 2017, the Company operated 1,167 supermarkets including 779 located in Florida, 186 in Georgia, 65 in Alabama, 58 in South Carolina, 41 in Tennessee, 30 in North Carolina and eight in Virginia. In 2017, 44 supermarkets were opened (including nine replacement supermarkets) and 132 supermarkets were remodeled. During 2017, the Company opened 17 supermarkets in Florida, 11 in North Carolina, eight in Virginia, two in Georgia, two in Alabama, two in South Carolina and two in Tennessee. Thirteen supermarkets were closed during the period. The nine replacement supermarkets that opened in 2017 replaced five of the supermarkets closed in 2017 and four supermarkets closed in 2016. The eight remaining supermarkets closed in 2017 will be replaced on site in subsequent periods. In the normal course of operations, the Company replaces supermarkets and closes supermarkets that are not meeting performance expectations. The impact of future supermarket closings is not expected to be material.
The Company’s revenues are earned and cash is generated as merchandise is sold to customers. Income is earned by selling merchandise at price levels that produce sales in excess of the cost of merchandise sold and operating and administrative expenses. The Company has generally been able to increase revenues and net earnings from year to year. Further, the Company has been able to meet its cash requirements from internally generated funds without the need for debt financing. The Company’s year end cash balances are impacted by its operating results as well as by capital expenditures, investment transactions, common stock repurchases and dividend payments.
The Company sells a variety of merchandise to generate revenues. This merchandise includes grocery (including dairy, produce, deli, bakery, meat and seafood), health and beauty care, general merchandise and other products and services. Most of the Company’s supermarkets also have pharmacy and floral departments. Merchandise includes a variety of nationally advertised and private label brands as well as unbranded products such as produce, meat and seafood. The Company’s private label brands play an important role in its merchandising strategy.
Operating Environment
The Company is engaged in the highly competitive retail food industry. The Company’s competitors include traditional supermarkets, such as national and regional supermarket chains and independent supermarkets, as well as nontraditional competitors, such as supercenters, membership warehouse clubs, mass merchandisers, dollar stores, drug stores, specialty food stores, restaurants, convenience stores and online retailers. The Company’s ability to attract and retain customers is based primarily on quality of goods and service, price, convenience, product mix and store location. In addition, the Company competes with other companies for additional retail site locations. The Company also competes with retailers and other labor market competitors in attracting and retaining quality employees. As a result of the highly competitive environment, traditional supermarkets, including the Company, face business challenges. There has been a trend for traditional supermarkets to lose market share to nontraditional competitors. The Company’s ability to retain its customers depends on its ability to meet the business challenges created by this highly competitive environment.
In order to meet its competitive challenges, the Company continues to focus on its core strategies, including customer service, product quality, shopping environment, competitive pricing and convenient locations. The Company has implemented several strategic business and technology initiatives as part of the execution of these core strategies. The Company believes these core strategies and related strategic initiatives differentiate it from its competition and present opportunities for sustained market share and financial growth.
Hurricane Impact
In September 2017, the Company was impacted by Hurricane Irma. Temporary supermarket closings occurred primarily in Florida due to weather conditions and evacuations of certain areas. Almost all affected supermarkets were reopened within two days following the passing of Hurricane Irma, operating on generator power if normal power had not been restored. All supermarkets were reopened within six days except one supermarket in Key West, Florida, which reopened the following week.
The Company estimates that its sales increased $250 million due to the impact of Hurricane Irma. The Company incurred additional costs for inventory losses due to power outages, fuel for generators and facility repairs and clean-up totaling an estimated $25 million. The Company is self-insured for these losses. The Company estimates the profit on the incremental sales resulting from customers stocking up and replenishing, as well as sales of hurricane supplies, more than offset the losses incurred.
9
Results of Operations
The Company’s fiscal year ends on the last Saturday in December. Fiscal years 2017 and 2015 include 52 weeks and fiscal year 2016 includes 53 weeks.
Sales
Sales for 2017 were $34.6 billion as compared with $34.0 billion in 2016, an increase of $558.4 million or 1.6%. Excluding the effect of the additional week in 2016, sales for 2017 as compared with 2016 would have increased 3.5%. After excluding the effect of the additional week in 2016, the increase in sales for 2017 as compared with 2016 was primarily due to a 1.7% increase in comparable store sales (supermarkets open for the same weeks in both periods, including replacement supermarkets) and new supermarket sales. Comparable store sales for 2017 increased primarily due to increased product costs and the impact of Hurricane Irma. The Company estimates that its sales increased $250 million or 0.7% due to the hurricane. Sales for supermarkets that are replaced on site are classified as new supermarket sales since the replacement period for the supermarket is generally 9 to 12 months.
Sales for 2016 were $34.0 billion as compared with $32.4 billion in 2015, an increase of $1,637.3 million or 5.1%. The increase in sales for 2016 as compared with 2015 was primarily due to a 1.9% increase in sales from the additional week in 2016 and a 1.9% increase in comparable store sales. Comparable store sales for 2016 increased primarily due to increased product costs and customer counts.
Gross profit
Gross profit (sales less cost of merchandise sold) as a percentage of sales was 27.3% in 2017 and 2016 and 27.5% in 2015. Excluding the last-in, first-out (LIFO) reserve effect of $23.0 million, $(4.6) million and $26.0 million in 2017, 2016 and 2015, respectively, gross profit as a percentage of sales would have been 27.3%, 27.2% and 27.6% in 2017, 2016 and 2015, respectively. After excluding the LIFO reserve effect, gross profit as a percentage of sales for 2017 as compared with 2016 remained relatively unchanged. After excluding the LIFO reserve effect, the decrease in gross profit as a percentage of sales for 2016 as compared with 2015 was primarily due to an increase in promotional activities.
Operating and administrative expenses
Operating and administrative expenses as a percentage of sales were 20.2% in 2017 and 20.0% in 2016 and 2015. The increase in operating and administrative expenses as a percentage of sales for 2017 as compared with 2016 was primarily due to increases in facility costs as a percentage of sales. Operating and administrative expenses as a percentage of sales for 2016 as compared with 2015 remained unchanged primarily due to a decrease in rent as a percentage of sales due to the acquisition of shopping centers with the Company as the anchor tenant offset by an increase in payroll as a percentage of sales.
Investment income
Investment income was $226.6 million, $133.1 million and $156.0 million in 2017, 2016 and 2015, respectively. The increase in investment income for 2017 as compared with 2016 was primarily due to an increase in realized gains on the sale of equity securities. The decrease in investment income for 2016 as compared with 2015 was primarily due to a decrease in realized gains on the sale of equity securities partially offset by an increase in interest income.
Income tax expense
On December 22, 2017, the Tax Cuts and Jobs Act of 2017 (Tax Act) was signed into law making significant changes to the Internal Revenue Code. Changes include, among others, a decrease in the federal statutory income tax rate from 35% to 21% beginning in 2018. The impact of the reduction of the federal statutory income tax rate decreased the Company’s income tax expense for 2017 by $224.2 million due to the remeasurement of deferred income taxes.
The effective income tax rate was 24.3%, 31.1% and 31.5% in 2017, 2016 and 2015, respectively. The decrease in the effective income tax rate for 2017 as compared with 2016 was primarily due to the impact of the Tax Act partially offset by a decrease in investment related tax credits. Excluding the impact of the Tax Act, the effective income tax rate would have been 31.7% in 2017. The decrease in the effective income tax rate for 2016 as compared with 2015 was primarily due to increases in qualified inventory donations, deductions for manufacturing production costs and investment related tax credits partially offset by the effect of a state income tax settlement in 2015.
Net earnings
Net earnings were $2,291.9 million or $3.04 per share, $2,025.7 million or $2.63 per share and $1,965.0 million or $2.54 per share for 2017, 2016 and 2015, respectively. Net earnings as a percentage of sales were 6.6%, 6.0% and 6.1% for 2017, 2016 and 2015, respectively. The increase in net earnings as a percentage of sales for 2017 as compared with 2016 was primarily due to the impact of the Tax Act. Excluding the impact of the Tax Act, net earnings would have been $2,067.7 million or $2.74 per share and 6.0% as a percentage of sales for 2017. The decrease in net earnings as a percentage of sales for 2016 as compared with 2015 was primarily due to the decrease in gross profit as a percentage of sales partially offset by the incremental profit from the additional week in 2016.
10
Liquidity and Capital Resources
Cash and cash equivalents, short-term investments and long-term investments totaled $7,013.2 million as of December 30, 2017, as compared with $7,176.9 million as of December 31, 2016. The decrease was primarily due to the increase in common stock repurchases, partially offset by the extension of the September 15, 2017 and December 15, 2017 federal income tax payments until January 31, 2018 due to Hurricane Irma.
Net cash provided by operating activities
Net cash provided by operating activities was $3,580.3 million, $3,253.0 million and $2,941.4 million in 2017, 2016 and 2015, respectively. The increase in net cash provided by operating activities for 2017 as compared with 2016 was primarily due to the extension of the federal income tax payments due to Hurricane Irma. The increase in net cash provided by operating activities for 2016 as compared with 2015 was primarily due to the timing of the Company’s fiscal year end relative to the Christmas holiday.
Net cash used in investing activities
Net cash used in investing activities was $1,236.1 million, $1,806.1 million and $1,846.5 million in 2017, 2016 and 2015, respectively. The primary use of net cash in investing activities for 2017 was funding capital expenditures, partially offset by net decreases in investment securities. Capital expenditures for 2017 totaled $1,429.1 million. These expenditures were incurred in connection with the opening of 44 new supermarkets (including nine replacement supermarkets) and remodeling 132 supermarkets. Expenditures were also incurred for supermarkets and remodels in progress, new or enhanced information technology hardware and applications and the acquisition of shopping centers with the Company as the anchor tenant. In 2017, the proceeds from the sale and maturity of investments, net of the payment for such investments, were $186.7 million. The primary use of net cash in investing activities for 2016 was funding capital expenditures and net increases in investment securities. Capital expenditures for 2016 totaled $1,443.8 million. These expenditures were incurred in connection with the opening of 32 new supermarkets (including seven replacement supermarkets) and remodeling 156 supermarkets. Expenditures were also incurred for supermarkets and remodels in progress, new or enhanced information technology hardware and applications and the acquisition of shopping centers with the Company as the anchor tenant. In 2016, the payment for investments, net of the proceeds from the sale and maturity of such investments, was $368.5 million.
Net cash used in financing activities
Net cash used in financing activities was $2,202.6 million, $1,360.7 million and $1,150.2 million in 2017, 2016 and 2015, respectively. The primary use of net cash in financing activities was funding net common stock repurchases and dividend payments. Net common stock repurchases totaled $1,468.6 million, $630.2 million and $510.5 million in 2017, 2016 and 2015, respectively. The Company currently repurchases common stock at the stockholders’ request in accordance with the terms of the ESPP, Directors Plan, 401(k) Plan and ESOP. The amount of common stock offered to the Company for repurchase is not within the control of the Company, but is at the discretion of the stockholders. The Company expects to continue to repurchase its common stock, as offered by its stockholders from time to time, at its then current value. However, with the exception of certain shares distributed from the ESOP, such purchases are not required and the Company retains the right to discontinue them at any time.
Dividends
The Company paid quarterly dividends on its common stock totaling $0.9125 per share or $689.7 million, $0.8675 per share or $667.9 million and $0.79 per share or $612.8 million in 2017, 2016 and 2015, respectively.
Capital expenditure projection
Capital expenditures expected to use cash in 2018 are approximately $1,530 million, primarily consisting of new supermarkets, remodeling existing supermarkets, new or enhanced information technology hardware and applications and the acquisition of shopping centers with the Company as the anchor tenant. The shopping center acquisitions are financed with internally generated funds and assumed debt, if prepayment penalties for the debt are determined to be significant. This capital program is subject to continuing change and review.
Cash requirements
In 2018, the cash requirements for operations, capital expenditures, common stock repurchases and dividend payments are expected to be financed by internally generated funds or liquid assets. Based on the Company’s financial position, it is expected that short-term and long-term borrowings would be available to support the Company’s liquidity requirements, if needed.
11
Contractual Obligations
Following is a summary of contractual obligations as of December 30, 2017:
Payments Due by Period | ||||||||||||||||
Total | 2018 | 2019- 2020 | 2021- 2022 | There- after | ||||||||||||
(Amounts are in thousands) | ||||||||||||||||
Contractual obligations: | ||||||||||||||||
Operating leases (1) | $ | 3,647,842 | 432,173 | 773,891 | 626,880 | 1,814,898 | ||||||||||
Purchase obligations (2)(3)(4) | 2,134,067 | 1,152,225 | 339,280 | 192,454 | 450,108 | |||||||||||
Other long-term liabilities: | ||||||||||||||||
Self-insurance reserves (5) | 355,698 | 137,100 | 99,724 | 42,625 | 76,249 | |||||||||||
Accrued postretirement benefit cost | 118,889 | 5,428 | 11,374 | 12,066 | 90,021 | |||||||||||
Long-term debt (6) | 193,074 | 37,873 | 47,120 | 52,267 | 55,814 | |||||||||||
Other | 41,702 | 23,123 | 1,075 | 838 | 16,666 | |||||||||||
Total | $ | 6,491,272 | 1,787,922 | 1,272,464 | 927,130 | 2,503,756 | ||||||||||
Off-Balance Sheet Arrangements
The Company is not a party to any off-balance sheet arrangements that have, or are reasonably likely to have, a current or future effect on the Company’s financial condition, results of operations or cash flows.
____________________________
(1) | For a more detailed description of the operating lease obligations, refer to Note 8(a) Commitments and Contingencies - Operating Leases in the Notes to Consolidated Financial Statements. |
(2) | Purchase obligations include agreements to purchase goods or services that are enforceable and legally binding on the Company and that specify all significant terms, including fixed or minimum quantities to be purchased, fixed, minimum or variable price provisions and the approximate timing of the transaction. Purchase obligations exclude agreements that are cancelable within 30 days without penalty. |
(3) | As of December 30, 2017, the Company had outstanding $6.7 million in trade letters of credit and $13.8 million in standby letters of credit to support certain of these purchase obligations. |
(4) | Purchase obligations include $936.3 million in real estate taxes, insurance and maintenance commitments related to operating leases. The actual amounts to be paid are variable and have been estimated based on current costs. |
(5) | As of December 30, 2017, the Company had a restricted trust account in the amount of $164.1 million for the benefit of the Company’s insurance carrier related to self-insurance reserves. |
(6) | For a more detailed description of the long-term debt obligations, refer to Note 4 Consolidation of Joint Ventures and Long-Term Debt in the Notes to Consolidated Financial Statements. |
12
Recently Issued Accounting Standards
In February 2018, the Financial Accounting Standards Board (FASB) issued an Accounting Standards Update (ASU) in response to the Tax Act. The ASU permits companies to reclassify stranded tax effects due to the reduction of the federal statutory income tax rate from accumulated other comprehensive earnings to retained earnings. The ASU is effective for reporting periods beginning after December 15, 2018 with early adoption permitted. The Company elected to adopt the ASU early and reclassified $27.1 million from accumulated other comprehensive earnings to retained earnings as of December 30, 2017.
In June 2016, the FASB issued an ASU requiring companies to change the methodology used to measure credit losses on financial instruments. The ASU is effective for reporting periods beginning after December 15, 2019 with early adoption permitted only for reporting periods beginning after December 15, 2018. The Company does not expect the adoption of the ASU to have a material effect on the Company’s financial condition or results of operations. The adoption of the ASU will have no effect on the Company’s cash flows.
In February 2016, the FASB issued an ASU on lease accounting. The ASU requires the lease rights and obligations arising from lease contracts, including existing and new arrangements, to be recognized as assets and liabilities on the balance sheet. The ASU is effective for reporting periods beginning after December 15, 2018 with early adoption permitted. While the Company is still evaluating the ASU, the Company expects the adoption of the ASU to have a material effect on the Company’s financial condition due to the recognition of approximately $3 billion of lease rights and obligations as assets and liabilities on the consolidated balance sheets. The Company does not expect the adoption of the ASU to have a material effect on the Company’s results of operations. The adoption of the ASU will have no effect on the Company’s cash flows.
In January 2016, the FASB issued an ASU requiring companies to measure equity securities at fair value with changes in fair value recognized in net earnings as opposed to other comprehensive earnings. The ASU is effective for reporting periods beginning after December 15, 2017. The adoption of the ASU will have an effect on the Company’s results of operations. The extent of the effect on results of operations will vary with the changes in the fair value of equity securities. The adoption of the ASU will have no effect on the Company’s financial condition or cash flows.
In November 2015, the FASB issued an ASU requiring companies to classify deferred tax assets and liabilities in the noncurrent section of the balance sheet effective for reporting periods beginning after December 15, 2016. In 2017, the Company retrospectively adopted the ASU and reclassified $77.5 million from current deferred tax assets to noncurrent deferred income taxes as of December 31, 2016.
In May 2014, the FASB issued an ASU on the recognition of revenue from contracts with customers. The ASU requires additional disclosures about the nature, amount, timing and uncertainty of revenue and cash flows arising from customer contracts. The ASU is effective for reporting periods beginning after December 15, 2017. The Company does not expect the adoption of the ASU to have a material effect on the Company’s financial condition, results of operations or cash flows.
Critical Accounting Estimates
The Company’s discussion and analysis of its financial condition and results of operations are based upon the Company’s consolidated financial statements, which have been prepared in accordance with U.S. generally accepted accounting principles. The preparation of these consolidated financial statements requires management to make estimates and assumptions that affect the reported amounts of assets and liabilities and disclosure of contingent assets and liabilities as of the date of the consolidated financial statements and the reported amounts of revenues and expenses during the reporting period. Actual results could differ from those estimates. The Company’s significant accounting policies are described in Note 1 in the Notes to Consolidated Financial Statements. The Company believes the following involves significant estimates and judgments in the preparation of its consolidated financial statements.
Self-Insurance Reserves
Self-insurance reserves are established for health care, workers’ compensation, general liability and fleet liability claims. These reserves are determined based on actual claims experience and an estimate of claims incurred but not reported including, where necessary, actuarial studies. The Company believes that the use of actuarial studies to determine self-insurance reserves represents a consistent method of measuring these subjective estimates. Actuarial projections of losses for general liability and workers’ compensation claims are discounted and subject to variability. The causes of variability include, but are not limited to, such factors as future interest and inflation rates, future economic conditions, claims experience, litigation trends and benefit level changes. Historically, there have not been significant changes in the factors and assumptions used in the valuation of the self-insurance reserves. However, significant changes in such factors and assumptions could materially impact the valuation of the self-insurance reserves.
13
Forward-Looking Statements
From time to time, certain information provided by the Company, including written or oral statements made by its representatives, may contain forward-looking information as defined in Section 21E of the Securities Exchange Act of 1934. Forward-looking information includes statements about the future performance of the Company, which is based on management’s assumptions and beliefs in light of the information currently available to them. When used, the words “plan,” “estimate,” “project,” “intend,” “expect,” “believe” and other similar expressions, as they relate to the Company, are intended to identify such forward-looking statements. These forward-looking statements are subject to uncertainties and other factors that could cause actual results to differ materially from those statements including, but not limited to, the following: competitive practices and pricing in the food and drug industries generally and particularly in the Company’s principal markets; results of programs to increase sales, including private label sales; results of programs to control or reduce costs; changes in buying, pricing and promotional practices; changes in shrink management; changes in the general economy; changes in consumer spending; changes in population, employment and job growth in the Company’s principal markets; and other factors affecting the Company’s business within or beyond the Company’s control. These factors include changes in the rate of inflation, changes in federal, state and local laws and regulations, adverse determinations with respect to litigation or other claims, ability to recruit and retain employees, increases in operating costs including, but not limited to, labor costs, credit card fees and utility costs, particularly electric rates, ability to construct new supermarkets or complete remodels as rapidly as planned and stability of product costs. Other factors and assumptions not identified above could also cause the actual results to differ materially from those set forth in the forward-looking statements. Except as may be required by applicable law, the Company assumes no obligation to publicly update these forward-looking statements.
14
Item 7A. Quantitative and Qualitative Disclosures About Market Risk
The Company does not utilize financial instruments for trading or other speculative purposes, nor does it utilize leveraged financial instruments.
Cash equivalents and short-term investments are subject to three market risks, namely interest rate risk, credit risk and secondary market risk. Most of the cash equivalents and short-term investments are held in money market investments and debt securities that mature in less than one year. Due to the quality of the short-term investments held, the Company does not expect the valuation of these investments to be significantly impacted by future market conditions.
Debt securities are subject to both interest rate risk and credit risk. Debt securities held by the Company at year end primarily consisted of corporate, state and municipal bonds with high credit ratings; therefore, the Company believes the credit risk is low. The Company believes a 100 basis point increase in interest rates would result in an immaterial unrealized loss on its debt securities. Since the Company does not intend to sell its debt securities or will likely not be required to sell its debt securities prior to any anticipated recovery, such a hypothetical temporary unrealized loss would impact comprehensive earnings, but not net earnings or cash flows.
Equity securities are subject to equity price risk that results from fluctuations in quoted market prices as of the balance sheet date. Market price fluctuations may result from perceived changes in the underlying economic characteristics of the issuer, the relative price of alternative investments and general market conditions. A hypothetical decrease of 5% in the value of the Company’s equity securities would result in an immaterial decrease in the value of such long-term investments.
15
Item 8. Financial Statements and Supplementary Data
Index to Consolidated Financial Statements and Schedule | ||
Page | ||
Consolidated Financial Statements: | ||
The following consolidated financial statement schedule of the Company for the years ended December 30, 2017, December 31, 2016 and December 26, 2015 is submitted herewith: | ||
All other schedules are omitted as the required information is inapplicable or the information is presented in the consolidated financial statements or related notes. | ||
16
Report of Independent Registered Public Accounting Firm
The Stockholders and Board of Directors
Publix Super Markets, Inc.:
Opinion on the Consolidated Financial Statements
We have audited the accompanying consolidated balance sheets of Publix Super Markets, Inc. and subsidiaries (the Company) as of December 30, 2017 and December 31, 2016, the related consolidated statements of earnings, comprehensive earnings, cash flows and stockholders’ equity for each of the years in the three-year period ended December 30, 2017, and the related notes and the financial statement schedule listed in the accompanying index (collectively, the consolidated financial statements). In our opinion, the consolidated financial statements present fairly, in all material respects, the financial position of the Company as of December 30, 2017 and December 31, 2016, and the results of its operations and its cash flows for each of the years in the three-year period ended December 30, 2017, in conformity with U.S. generally accepted accounting principles.
Basis for Opinion
These consolidated financial statements are the responsibility of the Company’s management. Our responsibility is to express an opinion on these consolidated financial statements based on our audits. We are a public accounting firm registered with the Public Company Accounting Oversight Board (United States) (PCAOB) and are required to be independent with respect to the Company in accordance with the U.S. federal securities laws and the applicable rules and regulations of the Securities and Exchange Commission and the PCAOB.
We conducted our audits in accordance with the standards of the PCAOB. Those standards require that we plan and perform the audit to obtain reasonable assurance about whether the consolidated financial statements are free of material misstatement, whether due to error or fraud. The Company is not required to have, nor were we engaged to perform, an audit of its internal control over financial reporting. As part of our audits, we are required to obtain an understanding of internal control over financial reporting but not for the purpose of expressing an opinion on the effectiveness of the Company’s internal control over financial reporting. Accordingly, we express no such opinion.
Our audits included performing procedures to assess the risks of material misstatement of the consolidated financial statements, whether due to error or fraud, and performing procedures that respond to those risks. Such procedures included examining, on a test basis, evidence regarding the amounts and disclosures in the consolidated financial statements. Our audits also included evaluating the accounting principles used and significant estimates made by management, as well as evaluating the overall presentation of the consolidated financial statements. We believe that our audits provide a reasonable basis for our opinion.
/s/ KPMG LLP
We have not been able to determine the specific year that we began serving as the Company’s auditor, however we are aware that we have served as the Company’s auditor since at least 1965.
Tampa, Florida
March 1, 2018
Certified Public Accountants
17
PUBLIX SUPER MARKETS, INC.
Consolidated Balance Sheets
December 30, 2017 and
December 31, 2016
2017 | 2016 | |||||||
ASSETS | (Amounts are in thousands) | |||||||
Current assets: | ||||||||
Cash and cash equivalents | $ | 579,925 | 438,319 | |||||
Short-term investments | 915,579 | 1,591,740 | ||||||
Trade receivables | 671,414 | 715,292 | ||||||
Inventories | 1,876,519 | 1,722,392 | ||||||
Prepaid expenses | 41,484 | 50,434 | ||||||
Total current assets | 4,084,921 | 4,518,177 | ||||||
Long-term investments | 5,517,732 | 5,146,878 | ||||||
Other noncurrent assets | 583,149 | 434,280 | ||||||
Property, plant and equipment: | ||||||||
Land | 1,621,230 | 1,415,565 | ||||||
Buildings and improvements | 4,723,213 | 4,066,743 | ||||||
Furniture, fixtures and equipment | 4,844,804 | 4,581,924 | ||||||
Leasehold improvements | 1,741,703 | 1,727,952 | ||||||
Construction in progress | 154,542 | 189,448 | ||||||
13,085,492 | 11,981,632 | |||||||
Accumulated depreciation | (5,087,788 | ) | (4,694,509 | ) | ||||
Net property, plant and equipment | 7,997,704 | 7,287,123 | ||||||
$ | 18,183,506 | 17,386,458 | ||||||
See accompanying notes to consolidated financial statements.
18
2017 | 2016 | |||||||
LIABILITIES AND EQUITY | (Amounts are in thousands, except par value) | |||||||
Current liabilities: | ||||||||
Accounts payable | $ | 1,754,706 | 1,609,652 | |||||
Accrued expenses: | ||||||||
Contributions to retirement plans | 517,493 | 525,668 | ||||||
Self-insurance reserves | 137,100 | 139,554 | ||||||
Salaries and wages | 124,423 | 127,856 | ||||||
Other | 329,420 | 414,197 | ||||||
Current portion of long-term debt | 37,873 | 113,999 | ||||||
Federal and state income taxes | 241,299 | 12,787 | ||||||
Total current liabilities | 3,142,314 | 2,943,713 | ||||||
Deferred income taxes | 360,952 | 396,484 | ||||||
Self-insurance reserves | 218,598 | 216,125 | ||||||
Accrued postretirement benefit cost | 113,461 | 102,540 | ||||||
Long-term debt | 155,201 | 136,585 | ||||||
Other noncurrent liabilities | 84,361 | 93,574 | ||||||
Total liabilities | 4,074,887 | 3,889,021 | ||||||
Common stock related to Employee Stock Ownership Plan (ESOP) | 3,053,138 | 3,068,097 | ||||||
Stockholders’ equity: | ||||||||
Common stock of $1 par value. Authorized 1,000,000 shares; issued and outstanding 733,440 shares in 2017 and 763,198 shares in 2016 | 733,440 | 763,198 | ||||||
Additional paid-in capital | 3,139,647 | 2,849,947 | ||||||
Retained earnings | 10,044,564 | 9,836,696 | ||||||
Accumulated other comprehensive earnings | 152,636 | 23,427 | ||||||
Common stock related to ESOP | (3,053,138 | ) | (3,068,097 | ) | ||||
Total stockholders’ equity | 11,017,149 | 10,405,171 | ||||||
Noncontrolling interests | 38,332 | 24,169 | ||||||
Total equity | 14,108,619 | 13,497,437 | ||||||
Commitments and contingencies | — | — | ||||||
$ | 18,183,506 | 17,386,458 | ||||||
19
PUBLIX SUPER MARKETS, INC.
Consolidated Statements of Earnings
Years ended December 30, 2017, December 31, 2016
and December 26, 2015
2017 | 2016 | 2015 | |||||||||
(Amounts are in thousands, except per share amounts) | |||||||||||
Revenues: | |||||||||||
Sales | $ | 34,558,286 | 33,999,921 | 32,362,579 | |||||||
Other operating income | 278,552 | 274,188 | 256,180 | ||||||||
Total revenues | 34,836,838 | 34,274,109 | 32,618,759 | ||||||||
Costs and expenses: | |||||||||||
Cost of merchandise sold | 25,129,717 | 24,734,305 | 23,459,610 | ||||||||
Operating and administrative expenses | 6,974,297 | 6,788,153 | 6,480,908 | ||||||||
Total costs and expenses | 32,104,014 | 31,522,458 | 29,940,518 | ||||||||
Operating profit | 2,732,824 | 2,751,651 | 2,678,241 | ||||||||
Investment income | 226,626 | 133,067 | 156,026 | ||||||||
Other nonoperating income, net | 68,056 | 55,658 | 34,994 | ||||||||
Earnings before income tax expense | 3,027,506 | 2,940,376 | 2,869,261 | ||||||||
Income tax expense | 735,612 | 914,688 | 904,213 | ||||||||
Net earnings | $ | 2,291,894 | 2,025,688 | 1,965,048 | |||||||
Weighted average shares outstanding | 753,483 | 769,267 | 774,428 | ||||||||
Basic and diluted earnings per share | $ | 3.04 | 2.63 | 2.54 | |||||||
See accompanying notes to consolidated financial statements.
20
PUBLIX SUPER MARKETS, INC.
Consolidated Statements of Comprehensive Earnings
Years ended December 30, 2017, December 31, 2016
and December 26, 2015
2017 | 2016 | 2015 | |||||||||
(Amounts are in thousands) | |||||||||||
Net earnings | $ | 2,291,894 | 2,025,688 | 1,965,048 | |||||||
Other comprehensive earnings: | |||||||||||
Unrealized gain (loss) on available-for-sale (AFS) securities net of income taxes of $110,818, $11,093 and $(27,605) in 2017, 2016 and 2015, respectively | 175,978 | 17,615 | (43,838 | ) | |||||||
Reclassification adjustment for net realized gain on AFS securities net of income taxes of $(42,088), $(12,464) and $(26,972) in 2017, 2016 and 2015, respectively | (66,836 | ) | (19,792 | ) | (42,829 | ) | |||||
Adjustment to postretirement benefit obligation net of income taxes of $(4,406), $(418) and $2,394 in 2017, 2016 and 2015, respectively | (6,997 | ) | (664 | ) | 3,801 | ||||||
Comprehensive earnings | $ | 2,394,039 | 2,022,847 | 1,882,182 | |||||||
See accompanying notes to consolidated financial statements.
21
PUBLIX SUPER MARKETS, INC.
Consolidated Statements of Cash Flows
Years ended December 30, 2017, December 31, 2016
and December 26, 2015
2017 | 2016 | 2015 | |||||||||
(Amounts are in thousands) | |||||||||||
Cash flows from operating activities: | |||||||||||
Cash received from customers | $ | 34,729,287 | 34,088,337 | 32,249,651 | |||||||
Cash paid to employees and suppliers | (30,821,593 | ) | (30,291,186 | ) | (28,718,224 | ) | |||||
Income taxes paid | (478,457 | ) | (683,464 | ) | (721,226 | ) | |||||
Self-insured claims paid | (344,905 | ) | (338,010 | ) | (315,624 | ) | |||||
Dividends and interest received | 241,773 | 246,202 | 219,589 | ||||||||
Other operating cash receipts | 273,435 | 268,347 | 249,588 | ||||||||
Other operating cash payments | (19,259 | ) | (37,271 | ) | (22,389 | ) | |||||
Net cash provided by operating activities | 3,580,281 | 3,252,955 | 2,941,365 | ||||||||
Cash flows from investing activities: | |||||||||||
Payment for capital expenditures | (1,429,059 | ) | (1,443,827 | ) | (1,235,648 | ) | |||||
Proceeds from sale of property, plant and equipment | 6,300 | 6,268 | 4,350 | ||||||||
Payment for investments | (3,069,417 | ) | (2,526,973 | ) | (2,764,436 | ) | |||||
Proceeds from sale and maturity of investments | 3,256,077 | 2,158,434 | 2,149,233 | ||||||||
Net cash used in investing activities | (1,236,099 | ) | (1,806,098 | ) | (1,846,501 | ) | |||||
Cash flows from financing activities: | |||||||||||
Payment for acquisition of common stock | (1,751,864 | ) | (960,262 | ) | (855,801 | ) | |||||
Proceeds from sale of common stock | 283,222 | 330,040 | 345,319 | ||||||||
Dividends paid | (689,660 | ) | (667,902 | ) | (612,766 | ) | |||||
Repayment of long-term debt | (75,325 | ) | (49,828 | ) | (30,164 | ) | |||||
Other, net | 31,051 | (12,762 | ) | 3,231 | |||||||
Net cash used in financing activities | (2,202,576 | ) | (1,360,714 | ) | (1,150,181 | ) | |||||
Net increase (decrease) in cash and cash equivalents | 141,606 | 86,143 | (55,317 | ) | |||||||
Cash and cash equivalents at beginning of year | 438,319 | 352,176 | 407,493 | ||||||||
Cash and cash equivalents at end of year | $ | 579,925 | 438,319 | 352,176 | |||||||
See accompanying notes to consolidated financial statements.
22
2017 | 2016 | 2015 | |||||||||
(Amounts are in thousands) | |||||||||||
Reconciliation of net earnings to net cash provided by operating activities: | |||||||||||
Net earnings | $ | 2,291,894 | 2,025,688 | 1,965,048 | |||||||
Adjustments to reconcile net earnings to net cash provided by operating activities: | |||||||||||
Depreciation and amortization | 664,009 | 624,203 | 581,892 | ||||||||
Increase (decrease) in last-in, first out (LIFO) reserve | 23,028 | (4,643 | ) | 25,996 | |||||||
Retirement contributions paid or payable in common stock | 353,659 | 365,936 | 369,017 | ||||||||
Deferred income taxes | (99,856 | ) | 24,357 | 108,574 | |||||||
Loss on disposal and impairment of property, plant and equipment | 15,231 | 11,035 | 49,596 | ||||||||
Gain on AFS securities | (108,924 | ) | (32,256 | ) | (69,801 | ) | |||||
Net amortization of investments | 109,240 | 141,869 | 137,883 | ||||||||
Change in operating assets and liabilities providing (requiring) cash: | |||||||||||
Trade receivables | 43,870 | 8,306 | (174,610 | ) | |||||||
Inventories | (177,155 | ) | 22,764 | (168,826 | ) | ||||||
Prepaid expenses and other noncurrent assets | 82,089 | (14,307 | ) | (12,571 | ) | ||||||
Accounts payable and accrued expenses | 151,186 | (74,917 | ) | 114,811 | |||||||
Self-insurance reserves | 19 | 5,340 | (14,027 | ) | |||||||
Federal and state income taxes | 241,686 | 159,426 | 38,920 | ||||||||
Other noncurrent liabilities | (9,695 | ) | (9,846 | ) | (10,537 | ) | |||||
Total adjustments | 1,288,387 | 1,227,267 | 976,317 | ||||||||
Net cash provided by operating activities | $ | 3,580,281 | 3,252,955 | 2,941,365 | |||||||
23
PUBLIX SUPER MARKETS, INC.
Consolidated Statements of Stockholders’ Equity
Years ended December 30, 2017, December 31, 2016
and December 26, 2015
Common Stock | Additional Paid-in Capital | Retained Earnings | Common Stock (Acquired from) Sold to Stock- holders | Accumu- lated Other Compre- hensive Earnings | Common Stock Related to ESOP | Total Stock- holders’ Equity | |||||||||||||||||||
(Amounts are in thousands, except per share amounts) | |||||||||||||||||||||||||
Balances at December 27, 2014 | $ | 774,472 | 2,200,892 | 8,218,340 | — | 109,134 | (2,680,528 | ) | 8,622,310 | ||||||||||||||||
Comprehensive earnings | — | — | 1,965,048 | — | (82,866 | ) | — | 1,882,182 | |||||||||||||||||
Dividends, $0.79 per share | — | — | (612,766 | ) | — | — | — | (612,766 | ) | ||||||||||||||||
Contribution of 8,516 shares to retirement plans | 6,172 | 247,139 | — | 79,248 | — | — | 332,559 | ||||||||||||||||||
Acquisition of 21,276 shares from stockholders | — | — | — | (855,801 | ) | — | — | (855,801 | ) | ||||||||||||||||
Sale of 8,463 shares to stockholders | 2,756 | 108,360 | — | 234,203 | — | — | 345,319 | ||||||||||||||||||
Retirement of 13,225 shares | (13,225 | ) | — | (529,125 | ) | 542,350 | — | — | — | ||||||||||||||||
Change for ESOP related shares | — | — | — | — | — | (273,350 | ) | (273,350 | ) | ||||||||||||||||
Balances at December 26, 2015 | 770,175 | 2,556,391 | 9,041,497 | — | 26,268 | (2,953,878 | ) | 9,440,453 | |||||||||||||||||
Comprehensive earnings | — | — | 2,025,688 | — | (2,841 | ) | — | 2,022,847 | |||||||||||||||||
Dividends, $0.8675 per share | — | — | (667,902 | ) | — | — | — | (667,902 | ) | ||||||||||||||||
Contribution of 7,837 shares to retirement plans | 5,216 | 239,436 | — | 109,562 | — | — | 354,214 | ||||||||||||||||||
Acquisition of 22,500 shares from stockholders | — | — | — | (960,262 | ) | — | — | (960,262 | ) | ||||||||||||||||
Sale of 7,686 shares to stockholders | 1,283 | 54,120 | — | 274,637 | — | — | 330,040 | ||||||||||||||||||
Retirement of 13,476 shares | (13,476 | ) | — | (562,587 | ) | 576,063 | — | — | — | ||||||||||||||||
Change for ESOP related shares | — | — | — | — | — | (114,219 | ) | (114,219 | ) | ||||||||||||||||
Balances at December 31, 2016 | 763,198 | 2,849,947 | 9,836,696 | — | 23,427 | (3,068,097 | ) | 10,405,171 | |||||||||||||||||
Comprehensive earnings | — | — | 2,291,894 | — | 102,145 | — | 2,394,039 | ||||||||||||||||||
Dividends, $0.9125 per share | — | — | (689,660 | ) | — | — | — | (689,660 | ) | ||||||||||||||||
Contribution of 8,833 shares to retirement plans | 6,540 | 262,684 | — | 92,058 | — | — | 361,282 | ||||||||||||||||||
Acquisition of 45,952 shares from stockholders | — | — | — | (1,751,864 | ) | — | — | (1,751,864 | ) | ||||||||||||||||
Sale of 7,361 shares to stockholders | 677 | 27,016 | — | 255,529 | — | — | 283,222 | ||||||||||||||||||
Retirement of 36,975 shares | (36,975 | ) | — | (1,367,302 | ) | 1,404,277 | — | — | — | ||||||||||||||||
Change for ESOP related shares | — | — | — | — | — | 14,959 | 14,959 | ||||||||||||||||||
Remeasurement of deferred income taxes reclassified to retained earnings | — | — | (27,064 | ) | — | 27,064 | — | — | |||||||||||||||||
Balances at December 30, 2017 | $ | 733,440 | 3,139,647 | 10,044,564 | — | 152,636 | (3,053,138 | ) | 11,017,149 | ||||||||||||||||
See accompanying notes to consolidated financial statements.
24
PUBLIX SUPER MARKETS, INC.
Notes to Consolidated Financial Statements
(1) Summary of Significant Accounting Policies
(a) | Business |
Publix Super Markets, Inc. and its wholly owned subsidiaries (the Company) are in the business of operating retail food supermarkets in Florida, Georgia, Alabama, South Carolina, Tennessee, North Carolina and Virginia. The Company was founded in 1930 and later merged into another corporation that was originally incorporated in 1921. The Company has no other significant lines of business or industry segments. See percentage of consolidated sales by merchandise category on page 1.
(b) | Principles of Consolidation |
The consolidated financial statements include the accounts of the Company, its wholly owned subsidiaries and certain joint ventures in which the Company has a controlling financial interest. All significant intercompany balances and transactions are eliminated in consolidation.
(c) | Fiscal Year |
The Company’s fiscal year ends on the last Saturday in December. Fiscal years 2017 and 2015 include 52 weeks and fiscal year 2016 includes 53 weeks.
(d) | Cash Equivalents |
The Company considers all liquid investments with maturities of three months or less to be cash equivalents.
(e) | Trade Receivables |
Trade receivables primarily include amounts due from vendor allowances, debit and credit card sales and third party insurance pharmacy billings.
(f) | Inventories |
Inventories are valued at the lower of cost or market. The dollar value last-in, first-out (LIFO) method was used to determine the cost for 85% and 83% of inventories as of December 30, 2017 and December 31, 2016, respectively. Under this method, inventory is stated at cost, which is determined by applying a cost-to-retail ratio to each similar merchandise category’s ending retail value. The cost of the remaining inventories was determined using the first-in, first-out (FIFO) method. The FIFO cost of inventory approximates replacement or current cost. The FIFO method is used to value manufactured, seasonal, certain perishable and other miscellaneous inventory items because of fluctuating costs and inconsistent product availability. The Company also reduces inventory for estimated losses related to shrink. If all inventories were valued using the FIFO method, inventories and current assets would have been higher than reported by $464,888,000 and $441,860,000 as of December 30, 2017 and December 31, 2016, respectively.
(g) | Investments |
Debt and equity securities are classified as available-for-sale (AFS) and carried at fair value. The Company evaluates whether AFS securities are other-than-temporarily impaired (OTTI) based on criteria that include the extent to which cost exceeds market value, the duration of the market value decline, the credit rating of the issuer or security, the failure of the issuer to make scheduled principal or interest payments and the financial health and prospects of the issuer or security.
Declines in the value of AFS securities determined to be OTTI are recognized in earnings and reported as OTTI losses. Debt securities with unrealized losses are considered OTTI if the Company intends to sell the debt security or if the Company will be required to sell the debt security prior to any anticipated recovery. If the Company determines that a debt security is OTTI under these circumstances, the impairment recognized in earnings is measured as the difference between the amortized cost and the current fair value. A debt security is also determined to be OTTI if the Company does not expect to recover the amortized cost of the debt security. However, in this circumstance, if the Company does not intend to sell the debt security and will not be required to sell the debt security, the impairment recognized in earnings equals the estimated credit loss as measured by the difference between the present value of expected cash flows and the amortized cost of the debt security. Expected cash flows are discounted using the debt security’s effective interest rate. An equity security is determined to be OTTI if the Company does not expect to recover the cost of the equity security. Declines in the value of AFS securities determined to be temporary are reported net of income taxes as other comprehensive losses and included as a component of stockholders’ equity.
Interest and dividend income, amortization of premiums, accretion of discounts and realized gains and losses on AFS securities are included in investment income. Interest income is accrued as earned. Dividend income is recognized as income on the ex-dividend date of the security. The cost of AFS securities sold is based on the FIFO method.
25
PUBLIX SUPER MARKETS, INC.
Notes to Consolidated Financial Statements
(h) | Property, Plant and Equipment and Depreciation |
Assets are recorded at cost and depreciated using the straight-line method over their estimated useful lives or the terms of the related leases, if shorter, as follows:
Buildings and improvements | 10–40 years | |
Furniture, fixtures and equipment | 3–20 years | |
Leasehold improvements | 10–20 years | |
Maintenance and repairs are expensed as incurred. Expenditures for renewals and betterments are capitalized. The gain or loss realized on disposed assets or assets to be disposed of is recorded as operating and administrative expenses.
(i) | Long-Lived Assets |
The Company reviews its long-lived assets for impairment whenever events or changes in circumstances indicate that the net book value of an asset may not be recoverable. Recoverability of assets to be held and used is measured by a comparison of the net book value of an asset to the future net undiscounted cash flows expected to be generated by the asset. An impairment loss is recorded for the excess of the net book value over the fair value of the asset. The fair value is estimated based on expected discounted future cash flows. Assets to be disposed of are reported at the lower of the carrying amount or fair value less cost to sell and are no longer depreciated. Long-lived assets, including buildings and improvements, leasehold improvements, and furniture, fixtures and equipment, are evaluated for impairment at the supermarket level.
(j) | Self-Insurance |
The Company is self-insured for health care claims and property, plant and equipment losses. The Company has insurance coverage for losses in excess of self-insurance limits for workers’ compensation, general liability and fleet liability claims. Self-insurance reserves are established for health care, workers’ compensation, general liability and fleet liability claims. These reserves are determined based on actual claims experience and an estimate of claims incurred but not reported including, where necessary, actuarial studies. Actuarial projections of losses for general liability and workers’ compensation claims are discounted.
(k) | Postretirement Benefit |
The Company provides a postretirement life insurance benefit for certain salaried and hourly full-time employees who meet the eligibility requirements. Effective January 1, 2002, the Company amended the postretirement life insurance benefit under its Group Life Insurance Plan. To receive the postretirement life insurance benefit after the amendment, an employee must have had at least five years of full-time service and the employee’s age plus years of credited service must have equaled 65 or greater as of October 1, 2001. At retirement, such employees also must be at least age 55 with at least 10 years of full-time service to be eligible to receive the postretirement life insurance benefit.
Actuarial projections are used to calculate the year end postretirement benefit obligation, discounted using a yield curve methodology based on high quality bonds with a rating of AA or better. Actuarial losses are amortized from accumulated other comprehensive earnings into net periodic postretirement benefit cost over future years when the accumulation of such losses exceeds 10% of the year end postretirement benefit obligation.
(l) | Comprehensive Earnings |
Comprehensive earnings include net earnings and other comprehensive earnings. Other comprehensive earnings include revenues, expenses, gains and losses that have been excluded from net earnings and recorded directly to stockholders’ equity. Included in other comprehensive earnings for the Company are unrealized gains and losses on AFS securities and adjustments to the postretirement benefit obligation.
(m) | Revenue Recognition |
Revenue is recognized at the point of sale for retail sales. Customer returns are immaterial. Vendor coupons that are reimbursed are accounted for as sales. Coupons and other sales incentives offered by the Company that are not reimbursed are recorded as a reduction of sales.
(n) | Sales Taxes |
The Company records sales net of applicable sales taxes.
26
PUBLIX SUPER MARKETS, INC.
Notes to Consolidated Financial Statements
(o) | Other Operating Income |
Other operating income is recognized on a net revenue basis as earned. Other operating income includes income generated from other activities, primarily lottery commissions, licensee sales commissions, mall gift card commissions, automated teller transaction fees, money transfer fees, vending machine commissions and coupon redemption income.
(p) | Cost of Merchandise Sold |
Cost of merchandise sold includes costs of inventory and costs related to in-store production. Cost of merchandise sold also includes inbound freight charges, purchasing and receiving costs, warehousing costs and other costs of the Company’s distribution network.
Allowances and credits, including cooperative advertising allowances, received from a vendor in connection with the purchase or promotion of the vendor’s products are recognized as a reduction of cost of merchandise sold as earned. These allowances and credits are recognized as earned in accordance with the underlying agreement with the vendor and completion of the earnings process. Short-term vendor agreements with advance payment provisions are recorded as a current liability and recognized over the appropriate period as earned according to the underlying agreements. Long-term vendor agreements with advance payment provisions are recorded as a noncurrent liability and recognized over the appropriate period as earned according to the underlying agreements.
(q) | Advertising Costs |
Advertising costs are expensed as incurred and were $251,933,000, $260,367,000 and $248,454,000 for 2017, 2016 and 2015, respectively.
(r) | Other Nonoperating Income, net |
Other nonoperating income, net includes rent received from tenants in owned shopping centers, net of related expenses, and other miscellaneous nonoperating income.
(s) | Income Taxes |
Deferred income taxes are established for temporary differences between financial and tax reporting bases and are subsequently adjusted to reflect changes in income tax rates expected to be in effect when the temporary differences reverse. In 2017, the Company retrospectively adopted an Accounting Standards Update (ASU) requiring companies to classify deferred tax assets and liabilities in the noncurrent section of the consolidated balance sheet and reclassified $77,496,000 from current deferred tax assets to noncurrent deferred income taxes as of December 31, 2016. The Company recognizes accrued interest and penalties related to income tax liabilities as a component of income tax expense. The Company invests in certain investment related tax credits that promote affordable housing and renewable energy. These investments generate a return primarily through the realization of federal and state tax credits and other tax benefits. The Company accounts for its affordable housing investments using the proportional amortization method. Under this method, the investment is amortized into income tax expense in proportion to the tax credits received and the investment tax credits are recognized as a reduction of income tax expense. The Company accounts for its renewable energy investments using the deferral method. Under this method, the investment tax credits are recognized as a reduction of the renewable energy investments.
(t) | Common Stock and Earnings Per Share |
Basic and diluted earnings per share are calculated by dividing net earnings by the weighted average shares outstanding. Basic and diluted earnings per share are the same because the Company does not have options or other stock compensation programs that impact the calculation of diluted earnings per share. All shares owned by the Employee Stock Ownership Plan (ESOP) are included in the earnings per share calculations. Dividends paid to the ESOP, as well as dividends on all other common stock shares, are reflected as a reduction of retained earnings. All common stock shares, including ESOP and 401(k) Plan shares, receive one vote per share and have the same dividend rights. The voting rights for ESOP shares allocated to participants’ accounts are passed through to the participants. The Trustee of the Company’s common stock in the 401(k) Plan votes the shares held in that plan.
(u) | Use of Estimates |
The preparation of financial statements in conformity with U.S. generally accepted accounting principles requires management to make estimates and assumptions that affect the reported amounts of assets and liabilities and disclosure of contingent assets and liabilities as of the date of the financial statements and the reported amounts of revenues and expenses during the reporting period. Actual results could differ from those estimates.
27
PUBLIX SUPER MARKETS, INC.
Notes to Consolidated Financial Statements
(2) Fair Value of Financial Instruments
The fair value of certain of the Company’s financial instruments, including cash and cash equivalents, trade receivables and accounts payable, approximates their respective carrying amounts due to their short-term maturity.
The fair value of AFS securities is based on market prices using the following measurement categories:
Level 1 – Fair value is determined by using quoted prices in active markets for identical investments. AFS securities that are included in this category are primarily mutual funds, exchange traded funds and equity securities.
Level 2 – Fair value is determined by using other than quoted prices. By using observable inputs (for example, benchmark yields, interest rates, reported trades and broker dealer quotes), the fair value is determined through processes such as benchmark curves, benchmarking of like securities and matrix pricing of corporate, state and municipal bonds by using pricing of similar bonds based on coupons, ratings and maturities. AFS securities that are included in this category are primarily debt securities (tax exempt and taxable bonds).
Level 3 – Fair value is determined by using other than observable inputs. Fair value is determined by using the best information available in the circumstances and requires significant management judgment or estimation. No AFS securities are currently included in this category.
Following is a summary of fair value measurements for AFS securities as of December 30, 2017 and December 31, 2016:
Fair Value | Level 1 | Level 2 | Level 3 | ||||||||||
(Amounts are in thousands) | |||||||||||||
December 30, 2017 | $ | 6,433,311 | 2,545,320 | 3,887,991 | — | ||||||||
December 31, 2016 | 6,738,618 | 1,286,625 | 5,451,993 | — | |||||||||
(3) Investments
Following is a summary of AFS securities as of December 30, 2017 and December 31, 2016:
Amortized Cost | Gross Unrealized Gains | Gross Unrealized Losses | Fair Value | |||||||||||||
(Amounts are in thousands) | ||||||||||||||||
2017 | ||||||||||||||||
Tax exempt bonds | $ | 1,811,523 | 602 | 16,420 | 1,795,705 | |||||||||||
Taxable bonds | 2,115,174 | 695 | 25,443 | 2,090,426 | ||||||||||||
Restricted investments | 164,548 | — | 463 | 164,085 | ||||||||||||
Equity securities | 2,116,716 | 267,828 | 1,449 | 2,383,095 | ||||||||||||
$ | 6,207,961 | 269,125 | 43,775 | 6,433,311 | ||||||||||||
2016 | ||||||||||||||||
Tax exempt bonds | $ | 3,036,060 | 2,211 | 24,649 | 3,013,622 | |||||||||||
Taxable bonds | 2,469,192 | 1,359 | 33,903 | 2,436,648 | ||||||||||||
Restricted investments | 164,548 | — | 463 | 164,085 | ||||||||||||
Equity securities | 1,021,340 | 110,879 | 7,956 | 1,124,263 | ||||||||||||
$ | 6,691,140 | 114,449 | 66,971 | 6,738,618 | ||||||||||||
Realized gains on sales of AFS securities totaled $114,547,000 for 2017. Realized losses on sales of AFS securities totaled $5,623,000 for 2017.
Realized gains on sales of AFS securities totaled $47,633,000 for 2016. Realized losses on sales of AFS securities totaled $15,377,000 for 2016.
Realized gains on sales of AFS securities totaled $94,778,000 for 2015. Realized losses on sales of AFS securities totaled $24,977,000 for 2015.
28
PUBLIX SUPER MARKETS, INC.
Notes to Consolidated Financial Statements
The amortized cost and fair value of AFS securities by expected maturity as of December 30, 2017 and December 31, 2016 are as follows:
2017 | 2016 | ||||||||||||
Amortized Cost | Fair Value | Amortized Cost | Fair Value | ||||||||||
(Amounts are in thousands) | |||||||||||||
Due in one year or less | $ | 917,576 | 915,579 | 1,592,144 | 1,591,740 | ||||||||
Due after one year through five years | 2,794,099 | 2,757,504 | 3,218,371 | 3,187,739 | |||||||||
Due after five years through ten years | 205,792 | 203,533 | 680,641 | 656,162 | |||||||||
Due after ten years | 9,230 | 9,515 | 14,096 | 14,629 | |||||||||
3,926,697 | 3,886,131 | 5,505,252 | 5,450,270 | ||||||||||
Restricted investments | 164,548 | 164,085 | 164,548 | 164,085 | |||||||||
Equity securities | 2,116,716 | 2,383,095 | 1,021,340 | 1,124,263 | |||||||||
$ | 6,207,961 | 6,433,311 | 6,691,140 | 6,738,618 | |||||||||
Following is a summary of temporarily impaired AFS securities by the time period impaired as of December 30, 2017 and December 31, 2016:
Less Than 12 Months | 12 Months or Longer | Total | |||||||||||||||||||||||
Fair Value | Unrealized Losses | Fair Value | Unrealized Losses | Fair Value | Unrealized Losses | ||||||||||||||||||||
(Amounts are in thousands) | |||||||||||||||||||||||||
2017 | |||||||||||||||||||||||||
Tax exempt bonds | $ | 1,543,151 | 13,827 | 136,217 | 2,593 | 1,679,368 | 16,420 | ||||||||||||||||||
Taxable bonds | 811,886 | 4,908 | 1,153,645 | 20,535 | 1,965,531 | 25,443 | |||||||||||||||||||
Restricted investments | 164,085 | 463 | — | — | 164,085 | 463 | |||||||||||||||||||
Equity securities | 5,210 | 819 | 2,998 | 630 | 8,208 | 1,449 | |||||||||||||||||||
Total temporarily impaired AFS securities | $ | 2,524,332 | 20,017 | 1,292,860 | 23,758 | 3,817,192 | 43,775 | ||||||||||||||||||
2016 | |||||||||||||||||||||||||
Tax exempt bonds | $ | 2,360,143 | 24,416 | 6,099 | 233 | 2,366,242 | 24,649 | ||||||||||||||||||
Taxable bonds | 1,921,367 | 33,354 | 51,769 | 549 | 1,973,136 | 33,903 | |||||||||||||||||||
Restricted investments | 164,085 | 463 | — | — | 164,085 | 463 | |||||||||||||||||||
Equity securities | 61,625 | 3,924 | 38,141 | 4,032 | 99,766 | 7,956 | |||||||||||||||||||
Total temporarily impaired AFS securities | $ | 4,507,220 | 62,157 | 96,009 | 4,814 | 4,603,229 | 66,971 | ||||||||||||||||||
There are 498 AFS securities contributing to the total unrealized loss of $43,775,000 as of December 30, 2017. Unrealized losses related to debt securities are primarily due to interest rate volatility impacting the market value of certain bonds. The Company continues to receive scheduled principal and interest payments on these debt securities. Unrealized losses related to equity securities are primarily due to temporary equity market fluctuations that are expected to recover.
29
PUBLIX SUPER MARKETS, INC.
Notes to Consolidated Financial Statements
(4) Consolidation of Joint Ventures and Long-Term Debt
From time to time, the Company enters into Joint Ventures (JV), in the legal form of limited liability companies, with certain real estate developers to partner in the development of shopping centers with the Company as the anchor tenant. The Company consolidates certain of these JVs in which it has a controlling financial interest. The Company is considered to have a controlling financial interest in a JV when it has (1) the power to direct the activities of the JV that most significantly impact the JV’s economic performance and (2) the obligation to absorb losses or the right to receive benefits from the JV that could potentially be significant to such JV.
The Company evaluates a JV using specific criteria to determine whether the Company has a controlling financial interest and is the primary beneficiary of the JV. Factors considered in determining whether the Company is the primary beneficiary include risk and reward sharing, experience and financial condition of the other JV members, voting rights, involvement in routine capital and operating decisions and each member’s influence over the JV owned shopping center’s economic performance.
Generally, most major JV decision making is shared between all members. In particular, the use and sale of JV assets, business plans and budgets are generally required to be approved by all members. However, the Company, through its anchor tenant operating lease agreement, has the power to direct the activities that most significantly influence the economic performance of the JV owned shopping center. Additionally, through its member equity interest in the JV, the Company will receive a significant portion of the JV’s benefits or is obligated to absorb a significant portion of the JV’s losses.
As of December 30, 2017, the carrying amounts of the assets and liabilities of the consolidated JVs were $144,559,000 and $67,631,000, respectively. As of December 31, 2016, the carrying amounts of the assets and liabilities of the consolidated JVs were $102,254,000 and $53,278,000, respectively. The assets are owned by and the liabilities are obligations of the JVs, not the Company, except for a portion of the long-term debt of certain JVs guaranteed by the Company. The JVs are financed with capital contributions from the members, loans and/or the cash flows generated by the JV owned shopping centers once in operation. Total earnings attributable to noncontrolling interests for 2017, 2016 and 2015 were immaterial. The Company’s involvement with these JVs does not have a significant effect on the Company’s financial condition, results of operations or cash flows.
The Company’s long-term debt results primarily from the consolidation of loans of certain JVs and loans assumed in connection with the acquisition of certain shopping centers with the Company as the anchor tenant. No loans were assumed during 2017. The Company assumed loans totaling $63,966,000 during 2016. Maturities of JV loans range from June 2020 through April 2027 and have variable interest rates based on a LIBOR index plus 175 to 250 basis points. Maturities of assumed shopping center loans range from March 2018 through January 2027 and have fixed interest rates ranging from 3.7% to 7.5%.
As of December 30, 2017, the aggregate annual maturities and scheduled payments of long-term debt are as follows:
Year | |||
(Amounts are in thousands) | |||
2018 | $ | 37,873 | |
2019 | 4,649 | ||
2020 | 42,471 | ||
2021 | 30,527 | ||
2022 | 21,740 | ||
Thereafter | 55,814 | ||
$ | 193,074 | ||
30
PUBLIX SUPER MARKETS, INC.
Notes to Consolidated Financial Statements
(5) Retirement Plans
The Company has a trusteed, noncontributory ESOP for the benefit of eligible employees. The Company recognizes an expense related to the Company’s discretionary contribution to the ESOP based on a percent of net earnings before taxes that is approved by the Board of Directors each year. ESOP contributions can be made in Company common stock or cash. Compensation expense recorded for contributions to this plan was $319,470,000, $334,422,000 and $337,703,000 for 2017, 2016 and 2015, respectively.
Since the Company’s common stock is not traded on an established securities market, the ESOP includes a put option for shares of the Company’s common stock distributed from the ESOP. Shares are distributed from the ESOP primarily to separated vested participants and certain eligible participants who elect to diversify their account balances. Under the Company’s administration of the ESOP’s put option, if the owners of distributed shares desire to sell their shares, the Company is required to purchase the shares at fair value for a specified time period after distribution of the shares from the ESOP. The fair value of distributed shares subject to the put option totaled $311,315,000 and $425,514,000 as of December 30, 2017 and December 31, 2016, respectively. The cost of the shares held by the ESOP totaled $2,741,823,000 and $2,642,583,000 as of December 30, 2017 and December 31, 2016, respectively. Due to the Company’s obligation under the put option, the distributed shares subject to the put option and the shares held by the ESOP are classified as temporary equity in the mezzanine section of the consolidated balance sheets and totaled $3,053,138,000 and $3,068,097,000 as of December 30, 2017 and December 31, 2016, respectively. The fair value of the shares held by the ESOP totaled $7,252,657,000 and $8,356,659,000 as of December 30, 2017 and December 31, 2016, respectively.
The Company has a 401(k) Plan for the benefit of eligible employees. The 401(k) Plan is a voluntary defined contribution plan. Eligible employees may contribute up to 10% of their eligible annual compensation, subject to the maximum contribution limits established by federal law. The Company may make a discretionary annual matching contribution to eligible participants of this plan as determined by the Board of Directors. During 2017, 2016 and 2015, the Board of Directors approved a match of 50% of eligible annual contributions up to 3% of eligible annual compensation, not to exceed a maximum match of $750 per employee. The match, which is determined as of the last day of the plan year and paid in the subsequent plan year, is in common stock of the Company. Compensation expense recorded for the Company’s match to the 401(k) Plan was $33,636,000, $30,899,000 and $30,775,000 for 2017, 2016 and 2015, respectively.
The Company intends to continue its retirement plans; however, the right to modify, amend, terminate or merge these plans has been reserved. In the event of termination, all amounts contributed under the plans must be paid to the participants or their beneficiaries.
31
PUBLIX SUPER MARKETS, INC.
Notes to Consolidated Financial Statements
(6) Income Taxes
On December 22, 2017, the Tax Cuts and Jobs Act of 2017 (Tax Act) was signed into law making significant changes to the Internal Revenue Code. Changes include, among others, a decrease in the federal statutory income tax rate from 35% to 21% beginning in 2018. The impact of the reduction of the federal statutory income tax rate decreased the Company’s income tax expense for 2017 by $224,195,000 due to the remeasurement of deferred income taxes. The Company had no incomplete or provisional amounts in the remeasurement of deferred income taxes.
Total income taxes for 2017, 2016 and 2015 were allocated as follows:
2017 | 2016 | 2015 | ||||||||
(Amounts are in thousands) | ||||||||||
Earnings | $ | 735,612 | 914,688 | 904,213 | ||||||
Other comprehensive earnings (losses) | 64,324 | (1,789 | ) | (52,183 | ) | |||||
$ | 799,936 | 912,899 | 852,030 | |||||||
The provision for income taxes consists of the following:
Current | Deferred | Total | ||||||||
(Amounts are in thousands) | ||||||||||
2017 | ||||||||||
Federal | $ | 771,355 | (113,620 | ) | 657,735 | |||||
State | 64,113 | 13,764 | 77,877 | |||||||
$ | 835,468 | (99,856 | ) | 735,612 | ||||||
2016 | ||||||||||
Federal | $ | 820,989 | 20,697 | 841,686 | ||||||
State | 69,342 | 3,660 | 73,002 | |||||||
$ | 890,331 | 24,357 | 914,688 | |||||||
2015 | ||||||||||
Federal | $ | 758,084 | 97,586 | 855,670 | ||||||
State | 37,555 | 10,988 | 48,543 | |||||||
$ | 795,639 | 108,574 | 904,213 | |||||||
A reconciliation of the provision for income taxes at the federal statutory income tax rate of 35% to earnings before income taxes compared to the Company’s actual income tax expense is as follows:
2017 | 2016 | 2015 | ||||||||
(Amounts are in thousands) | ||||||||||
Federal tax at statutory income tax rate | $ | 1,059,627 | 1,029,132 | 1,004,241 | ||||||
State income taxes (net of federal tax benefit) | 50,621 | 47,451 | 31,553 | |||||||
ESOP dividend | (65,111 | ) | (65,232 | ) | (62,630 | ) | ||||
Other, net | (85,330 | ) | (96,663 | ) | (68,951 | ) | ||||
Remeasurement of deferred income taxes | (224,195 | ) | — | — | ||||||
$ | 735,612 | 914,688 | 904,213 | |||||||
32
PUBLIX SUPER MARKETS, INC.
Notes to Consolidated Financial Statements
The tax effects of temporary differences that give rise to significant portions of deferred income taxes as of December 30, 2017 and December 31, 2016 are as follows:
2017 | 2016 | ||||||
(Amounts are in thousands) | |||||||
Deferred tax liabilities and (assets): | |||||||
Property, plant and equipment | $ | 487,026 | 704,233 | ||||
Investments | 30,090 | (34,554 | ) | ||||
Inventories | 23,784 | 5,275 | |||||
Self-insurance reserves | (77,783 | ) | (119,613 | ) | |||
Retirement plan contributions | (42,547 | ) | (63,432 | ) | |||
Postretirement benefit cost | (30,226 | ) | (41,362 | ) | |||
Purchase allowances | (9,967 | ) | (18,005 | ) | |||
Lease accounting | (8,576 | ) | (15,903 | ) | |||
Other | (10,849 | ) | (20,155 | ) | |||
$ | 360,952 | 396,484 | |||||
The Company expects the results of future operations and the reversal of deferred tax liabilities to generate sufficient taxable income to allow utilization of deferred tax assets; therefore, no valuation allowance has been recorded as of December 30, 2017 and December 31, 2016.
The Company has analyzed filing positions in all of the federal and state jurisdictions where it is required to file income tax returns as well as all open tax years in these jurisdictions. The periods subject to examination for the Company’s federal income tax returns are the 2014 through 2016 tax years. The periods subject to examination for the Company’s state income tax returns are the 2011 through 2016 tax years. The Company believes that the outcome of any examinations will not have a material effect on its financial condition, results of operations or cash flows.
The Company had no unrecognized tax benefits in 2017 and 2016. As a result, there will be no effect on the Company’s effective income tax rate in future periods due to the recognition of unrecognized tax benefits.
33
PUBLIX SUPER MARKETS, INC.
Notes to Consolidated Financial Statements
(7) | Accumulated Other Comprehensive Earnings |
A reconciliation of the changes in accumulated other comprehensive earnings net of income taxes for 2017, 2016 and 2015 is as follows:
AFS Securities | Postretirement Benefit | Accumulated Other Comprehensive Earnings | ||||||||||||||
(Amounts are in thousands) | ||||||||||||||||
Balances at December 27, 2014 | $ | 117,962 | (8,828 | ) | 109,134 | |||||||||||
Unrealized loss on AFS securities | (43,838 | ) | — | (43,838 | ) | |||||||||||
Net realized gain on AFS securities reclassified to investment income | (42,829 | ) | — | (42,829 | ) | |||||||||||
Amortization of actuarial gain reclassified to operating and administrative expenses | — | 3,801 | 3,801 | |||||||||||||
Net other comprehensive (losses) earnings | (86,667 | ) | 3,801 | (82,866 | ) | |||||||||||
Balances at December 26, 2015 | 31,295 | (5,027 | ) | 26,268 | ||||||||||||
Unrealized gain on AFS securities | 17,615 | — | 17,615 | |||||||||||||
Net realized gain on AFS securities reclassified to investment income | (19,792 | ) | — | (19,792 | ) | |||||||||||
Amortization of actuarial loss reclassified to operating and administrative expenses | — | (664 | ) | (664 | ) | |||||||||||
Net other comprehensive losses | (2,177 | ) | (664 | ) | (2,841 | ) | ||||||||||
Balances at December 31, 2016 | 29,118 | (5,691 | ) | 23,427 | ||||||||||||
Unrealized gain on AFS securities | 175,978 | — | 175,978 | |||||||||||||
Net realized gain on AFS securities reclassified to investment income | (66,836 | ) | — | (66,836 | ) | |||||||||||
Amortization of actuarial loss reclassified to operating and administrative expenses | — | (6,997 | ) | (6,997 | ) | |||||||||||
Net other comprehensive earnings (losses) | 109,142 | (6,997 | ) | 102,145 | ||||||||||||
Remeasurement of deferred income taxes reclassified to retained earnings | 29,797 | (2,733 | ) | 27,064 | ||||||||||||
Balances at December 30, 2017 | $ | 168,057 | (15,421 | ) | 152,636 | |||||||||||
In February 2018, an ASU was issued in response to the Tax Act. The ASU permits companies to reclassify stranded tax effects due to the reduction of the federal statutory income tax rate from accumulated other comprehensive earnings to retained earnings. The Company elected to adopt the ASU early and reclassified $27,064,000 from accumulated other comprehensive earnings to retained earnings.
34
PUBLIX SUPER MARKETS, INC.
Notes to Consolidated Financial Statements
(8) Commitments and Contingencies
(a)Operating Leases
The Company conducts a major portion of its retail operations from leased premises. Initial terms of the leases are typically 20 years, followed by renewal options at five year intervals, and may include rent escalation clauses. Minimum rentals represent fixed lease obligations, including insurance and maintenance to the extent they are fixed in the lease. Contingent rentals represent variable lease obligations, including real estate taxes, insurance, maintenance and, for certain premises, additional rentals based on a percentage of sales in excess of stipulated minimums (excess rent). The payment of variable real estate taxes, insurance and maintenance is generally based on the Company’s pro-rata share of total shopping center square footage. The Company recognizes rent expense for operating leases with rent escalation clauses on a straight-line basis over the applicable lease term. The Company estimates excess rent, where applicable, based on annual sales projections and uses the straight-line method to amortize the cost to rent expense. The annual sales projections are reviewed periodically and adjusted if necessary. Additionally, the Company has operating leases for certain transportation and other equipment.
Total rental expense for 2017, 2016 and 2015 is as follows:
2017 | 2016 | 2015 | ||||||||
(Amounts are in thousands) | ||||||||||
Minimum rentals | $ | 437,403 | 419,032 | 426,703 | ||||||
Contingent rentals | 126,855 | 125,406 | 123,152 | |||||||
Sublease rental income | (4,617 | ) | (4,577 | ) | (4,979 | ) | ||||
$ | 559,641 | 539,861 | 544,876 | |||||||
As of December 30, 2017, future minimum rentals for all noncancelable operating leases and related subleases are as follows:
Year | Minimum Rental Commitments | Sublease Rental Income | Net | ||||||||||||
(Amounts are in thousands) | |||||||||||||||
2018 | $ | 432,173 | 4,703 | 427,470 | |||||||||||
2019 | 404,783 | 3,220 | 401,563 | ||||||||||||
2020 | 369,108 | 425 | 368,683 | ||||||||||||
2021 | 333,046 | 230 | 332,816 | ||||||||||||
2022 | 293,834 | 188 | 293,646 | ||||||||||||
Thereafter | 1,814,898 | 878 | 1,814,020 | ||||||||||||
$ | 3,647,842 | 9,644 | 3,638,198 | ||||||||||||
In 2019, the Company will adopt an ASU that requires the lease rights and obligations arising from lease contracts, including existing and new arrangements, to be recognized as assets and liabilities on the consolidated balance sheet. While the Company is still evaluating the ASU, the Company estimates it will recognize approximately $3 billion of lease rights and obligations.
The Company also owns shopping centers which are leased to tenants for minimum rentals plus contingent rentals. Minimum rentals represent fixed lease obligations, including insurance and maintenance. Contingent rentals represent variable lease obligations, including real estate taxes, insurance, maintenance and, for certain premises, excess rent. Rental income was $158,121,000, $133,656,000 and $95,519,000 for 2017, 2016 and 2015, respectively.
35
PUBLIX SUPER MARKETS, INC.
Notes to Consolidated Financial Statements
As of December 30, 2017, future minimum rentals to be received for all noncancelable operating leases are as follows:
Year | |||
(Amounts are in thousands) | |||
2018 | $ | 123,792 | |
2019 | 102,880 | ||
2020 | 82,321 | ||
2021 | 59,645 | ||
2022 | 40,203 | ||
Thereafter | 163,280 | ||
$ | 572,121 | ||
(b)Letters of Credit
As of December 30, 2017, the Company had outstanding $6,690,000 in trade letters of credit and $13,770,000 in standby letters of credit to support certain purchase obligations.
(c)Litigation
The Company is subject from time to time to various lawsuits, claims and charges arising in the normal course of business. The Company believes its recorded reserves are adequate in light of the probable and estimable liabilities. The estimated amount of reasonably possible losses for lawsuits, claims and charges, individually and in the aggregate, is considered to be immaterial. In the opinion of management, the ultimate resolution of these legal proceedings will not have a material adverse effect on the Company’s financial condition, results of operations or cash flows.
(9) Subsequent Event
On January 2, 2018, the Company declared a quarterly dividend on its common stock of $0.23 per share or $168,600,000, payable February 1, 2018 to stockholders of record as of the close of business January 15, 2018.
(10) Quarterly Information (unaudited)
Following is a summary of the quarterly results of operations for 2017 and 2016. All quarters have 13 weeks, except the fourth quarter of 2016 which has 14 weeks.
Quarter | ||||||||||||||
First | Second | Third | Fourth | |||||||||||
(Amounts are in thousands, except per share amounts) | ||||||||||||||
2017 | ||||||||||||||
Revenues | $ | 8,752,946 | 8,482,827 | 8,586,080 | 9,014,985 | |||||||||
Costs and expenses | 8,012,934 | 7,869,524 | 7,951,286 | 8,270,270 | ||||||||||
Net earnings | 555,271 | 495,072 | 474,927 | 766,624 | ||||||||||
Basic and diluted earnings per share | 0.73 | 0.65 | 0.63 | 1.04 | ||||||||||
2016 | ||||||||||||||
Revenues | $ | 8,790,561 | 8,190,537 | 8,090,649 | 9,202,362 | |||||||||
Costs and expenses | 7,963,774 | 7,531,186 | 7,555,012 | 8,472,486 | ||||||||||
Net earnings | 581,889 | 478,187 | 421,135 | 544,477 | ||||||||||
Basic and diluted earnings per share | 0.75 | 0.62 | 0.55 | 0.71 | ||||||||||
During the fourth quarter of 2017, the Company recorded the remeasurement of deferred income taxes due to the Tax Act. Excluding the impact of the remeasurement, net earnings would have been $542,429,000 or $0.74 per share.
36
Schedule II
PUBLIX SUPER MARKETS, INC.
Valuation and Qualifying Accounts
Years ended December 30, 2017, December 31, 2016
and December 26, 2015
Balance at Beginning of Year | Additions Charged to Income | Deductions From Reserves | Balance at End of Year | ||||||||||||||||||
(Amounts are in thousands) | |||||||||||||||||||||
Year Ended December 30, 2017 | |||||||||||||||||||||
Reserves not deducted from assets: | |||||||||||||||||||||
Self-insurance reserves: | |||||||||||||||||||||
Current | $ | 139,554 | 342,451 | 344,905 | 137,100 | ||||||||||||||||
Noncurrent | 216,125 | 2,473 | — | 218,598 | |||||||||||||||||
$ | 355,679 | 344,924 | 344,905 | 355,698 | |||||||||||||||||
Year Ended December 31, 2016 | |||||||||||||||||||||
Reserves not deducted from assets: | |||||||||||||||||||||
Self-insurance reserves: | |||||||||||||||||||||
Current | $ | 135,865 | 341,699 | 338,010 | 139,554 | ||||||||||||||||
Noncurrent | 214,474 | 1,651 | — | 216,125 | |||||||||||||||||
$ | 350,339 | 343,350 | 338,010 | 355,679 | |||||||||||||||||
Year Ended December 26, 2015 | |||||||||||||||||||||
Reserves not deducted from assets: | |||||||||||||||||||||
Self-insurance reserves: | |||||||||||||||||||||
Current | $ | 151,153 | 300,336 | 315,624 | 135,865 | ||||||||||||||||
Noncurrent | 213,213 | 1,261 | — | 214,474 | |||||||||||||||||
$ | 364,366 | 301,597 | 315,624 | 350,339 | |||||||||||||||||
37
Item 9. Changes in and Disagreements with Accountants on Accounting and Financial Disclosure
None
Item 9A. Controls and Procedures
Disclosure Controls and Procedures
As of the end of the period covered by this Annual Report on Form 10-K, the Company carried out an evaluation, under the supervision and with the participation of the Company’s management, including the Company’s Chief Executive Officer and Chief Financial Officer, of the effectiveness of the design and operation of the Company’s disclosure controls and procedures pursuant to Exchange Act Rule 13a-15. Based upon this evaluation, the Chief Executive Officer and Chief Financial Officer each concluded that the Company’s disclosure controls and procedures are effective to provide reasonable assurance that information required to be disclosed by the Company in the reports that it files or submits under the Exchange Act is recorded, processed, summarized and reported within the time periods specified by the SEC’s rules and forms, and that such information has been accumulated and communicated to the Company’s management, including the Company’s Chief Executive Officer and Chief Financial Officer, in a manner that allows timely decisions regarding required disclosure.
Internal Control over Financial Reporting
There have been no changes in the Company’s internal control over financial reporting identified in connection with the evaluation that occurred during the quarter ended December 30, 2017 that have materially affected, or are reasonably likely to materially affect, the internal control over financial reporting.
Management’s Report on Internal Control over Financial Reporting
Management of the Company is responsible for establishing and maintaining adequate internal control over financial reporting (as defined in Rule 13a-15(f) and Rule 15d-15(f) under the Securities Exchange Act of 1934). The Company’s internal control over financial reporting is designed to provide reasonable assurance regarding the reliability of financial reporting and the preparation of financial statements for external purposes in accordance with U.S. generally accepted accounting principles. Because of inherent limitations, internal control over financial reporting may not prevent or detect misstatements. Also, projections of any evaluation of effectiveness to future periods are subject to the risk that controls may become inadequate because of changes in conditions or that the degree of compliance with the policies or procedures may deteriorate.
Management assessed the effectiveness of the Company’s internal control over financial reporting as of December 30, 2017. In making this assessment, management used the criteria set forth by the Committee of Sponsoring Organizations of the Treadway Commission in Internal Control – Integrated Framework (2013). Based on this assessment and these criteria, management believes that the Company’s internal control over financial reporting was effective as of December 30, 2017.
Item 9B. Other Information
None
PART III
Item 10. Directors, Executive Officers and Corporate Governance
Certain information concerning the executive officers of the Company is set forth on the following page. All other information regarding this item is incorporated by reference from the Proxy Statement of the Company (2018 Proxy Statement), which the Company intends to file no later than 120 days after its fiscal year end.
The Company has adopted a Code of Ethical Conduct for Financial Managers that applies to the Company’s principal executive officer, principal financial officer, principal accounting officer or controller and all persons performing similar functions. A copy of the Code of Ethical Conduct for Financial Managers was filed as Exhibit 14 to the Annual Report on Form 10-K for the year ended December 28, 2002.
Item 11. Executive Compensation
Information regarding this item is incorporated by reference from the 2018 Proxy Statement.
Item 12. Security Ownership of Certain Beneficial Owners and Management and Related Stockholder Matters
Information regarding this item is incorporated by reference from the 2018 Proxy Statement.
Item 13. Certain Relationships, Related Transactions and Director Independence
Information regarding this item is incorporated by reference from the 2018 Proxy Statement.
Item 14. Principal Accounting Fees and Services
Information regarding this item is incorporated by reference from the 2018 Proxy Statement.
38
Name | Age | Business Experience During Last Five Years | Served as Officer of Company Since | |||
Executive Officers of the Company | ||||||
John A. Attaway, Jr. | 59 | Senior Vice President, General Counsel and Secretary of the Company. | 2000 | |||
Hoyt R. Barnett | 74 | Vice Chairman of the Company and Trustee of the ESOP to July 2015, Vice Chairman and Trustee on the Committee of Trustees of the ESOP thereafter. | 1977 | |||
David E. Bornmann | 60 | Vice President of the Company to March 2013, Senior Vice President thereafter. | 1998 | |||
Jeffrey G. Chamberlain | 61 | Vice President of the Company to January 2017, Senior Vice President thereafter. | 2011 | |||
Laurie Z. Douglas | 54 | Senior Vice President and Chief Information Officer of the Company. | 2006 | |||
Randall T. Jones, Sr. | 55 | President of the Company to May 2016, Chief Executive Officer and President thereafter. | 2003 | |||
Kevin S. Murphy | 47 | Regional Director of Retail Operations of the Company to March 2014, Vice President to May 2016, Senior Vice President thereafter. | 2014 | |||
David P. Phillips | 58 | Chief Financial Officer and Treasurer of the Company to July 2015, Chief Financial Officer, Treasurer and Trustee on the Committee of Trustees of the ESOP to May 2016, Executive Vice President, Chief Financial Officer, Treasurer and Trustee on the Committee of Trustees of the ESOP thereafter. | 1990 | |||
Alison Midili Smith | 47 | Vice President of the Company to September 2017, Senior Vice President thereafter. | 2013 | |||
Michael R. Smith | 58 | Vice President of the Company to March 2013, Senior Vice President thereafter. | 2005 | |||
Officers of the Company | ||||||
Robert S. Balcerak, Jr. | 57 | Director of Real Estate Strategy of the Company to April 2017, Vice President thereafter. | 2017 | |||
Randolph L. Barber | 55 | Lakeland Dairy Plant General Manager of the Company to June 2013, Director of Industrial Maintenance to January 2018, Vice President thereafter. | 2018 | |||
Robert J. Bechtel | 54 | Regional Director of Retail Operations of the Company to May 2016, Vice President thereafter. | 2016 | |||
Marcy P. Benton | 49 | Director of Retail Associate Relations of the Company to September 2017, Vice President thereafter. | 2017 | |||
Scott E. Brubaker | 59 | Vice President of the Company. | 2005 | |||
Joseph DiBenedetto, Jr. | 58 | Vice President of the Company. | 2011 | |||
G. Gino DiGrazia | 55 | Vice President of the Company. | 2002 | |||
Sandra J. Estep | 58 | Vice President of the Company. | 2002 | |||
Linda S. Hall | 58 | Vice President of the Company. | 2002 | |||
Mark R. Irby | 62 | Vice President of the Company. | 1989 | |||
Linda S. Kane | 52 | Vice President and Assistant Secretary of the Company. | 2000 | |||
Erik J. Katenkamp | 46 | Vice President of the Company. | 2013 | |||
L. Renee Kelly | 56 | Vice President of the Company. | 2013 | |||
Christopher M. Litz | 54 | Regional Director of Retail Operations of the Company to January 2016, Vice President thereafter. | 2016 | |||
Robert J. McGarrity | 56 | Director of Construction of the Company to January 2017, Vice President thereafter. | 2017 | |||
Merriann M. Metz | 42 | Assistant General Counsel of the Company to May 2016, Assistant General Counsel and Assistant Secretary thereafter. | 2016 | |||
39
Name | Age | Business Experience During Last Five Years | Served as Officer of Company Since | |||
Officers of the Company (Continued) | ||||||
Peter M. Mowitt | 58 | Business Development Director of Grocery Retail Support of the Company to March 2013, Vice President thereafter. | 2013 | |||
Dale S. Myers | 65 | Vice President of the Company. | 2001 | |||
Brad E. Oliver | 44 | Grocery Technical Coordinator of the Company to June 2013, Business Development Director of Grocery Retail Support to March 2017, Business Development Director of DSD Products to January 2018, Vice President thereafter. | 2018 | |||
Samuel J. Pero | 55 | Regional Director of Retail Operations of the Company to May 2016, Vice President thereafter. | 2016 | |||
John F. Provenzano | 44 | Government Affairs Director of Delta Air Lines to September 2014, Executive Director of the National Association of State Treasurers to June 2017, Vice President of the Company thereafter. | 2017 | |||
William W. Rayburn, IV | 55 | Director of Real Estate Assets of the Company to September 2017, Vice President thereafter. | 2017 | |||
Charles B. Roskovich, Jr. | 56 | Vice President of the Company. | 2008 | |||
Marc H. Salm | 57 | Vice President of the Company. | 2008 | |||
Jeffrey D. Stephens | 62 | Director of Manufacturing Operations of the Company to March 2013, Vice President thereafter. | 2013 | |||
Casey D. Suarez, Sr. | 58 | Director of Warehousing of the Company to May 2014, Vice President thereafter. | 2014 | |||
Steven B. Wellslager | 51 | Vice President of the Company. | 2013 | |||
The terms of all officers expire in May 2018 or upon the election of their successors.
40
PART IV
Item 15. Exhibits, Financial Statement Schedules
(a)Consolidated Financial Statements and Schedule
The consolidated financial statements and schedule listed in the accompanying Index to Consolidated Financial Statements and Schedule are filed as part of this Annual Report on Form 10-K.
(b)Exhibits
3.1 | |
3.2 | |
10 | |
10.2 | |
10.5 | |
10.6 | |
10.7 | |
14 | |
21 | |
23 | |
31.1 | |
31.2 | |
32.1 | |
32.2 | |
101 | The following financial information from the Annual Report on Form 10-K for the year ended December 30, 2017 is formatted in Extensible Business Reporting Language: (i) Consolidated Balance Sheets, (ii) Consolidated Statements of Earnings, (iii) Consolidated Statements of Comprehensive Earnings, (iv) Consolidated Statements of Cash Flows, (v) Consolidated Statements of Stockholders’ Equity and (vi) Notes to Consolidated Financial Statements. |
41
SIGNATURES
Pursuant to the requirements of Section 13 or 15(d) of the Securities Exchange Act of 1934, the registrant has duly caused this report to be signed on its behalf by the undersigned, thereunto duly authorized.
PUBLIX SUPER MARKETS, INC. | |||
March 1, 2018 | By: | /s/ John A. Attaway, Jr. | |
John A. Attaway, Jr. | |||
Secretary | |||
Pursuant to the requirements of the Securities Exchange Act of 1934, this report has been signed below by the following persons on behalf of the registrant and in the capacities and on the dates indicated.
/s/ Hoyt R. Barnett | Vice Chairman and Director | March 1, 2018 | |
Hoyt R. Barnett | |||
/s/ Jessica L. Blume | Director | March 1, 2018 | |
Jessica L. Blume | |||
/s/ William E. Crenshaw | Chairman of the Board and Director | March 1, 2018 | |
William E. Crenshaw | |||
/s/ Jane B. Finley | Director | March 1, 2018 | |
Jane B. Finley | |||
/s/ G. Thomas Hough | Director | March 1, 2018 | |
G. Thomas Hough | |||
/s/ Charles H. Jenkins, Jr. | Chairman Emeritus and Director | March 1, 2018 | |
Charles H. Jenkins, Jr. | |||
/s/ Howard M. Jenkins | Director | March 1, 2018 | |
Howard M. Jenkins | |||
/s/ Randall T. Jones, Sr. | Chief Executive Officer, President and Director | March 1, 2018 | |
Randall T. Jones, Sr. | (Principal Executive Officer) | ||
/s/ Stephen M. Knopik | Director | March 1, 2018 | |
Stephen M. Knopik | |||
/s/ David P. Phillips | Executive Vice President, Chief Financial Officer and Director | March 1, 2018 | |
David P. Phillips | (Principal Financial and Accounting Officer) | ||
42