Attached files
| file | filename |
|---|---|
| EX-32.2 - EX-32.2 - MAGELLAN HEALTH INC | mgln-20171231ex322891b45.htm |
| EX-32.1 - EX-32.1 - MAGELLAN HEALTH INC | mgln-20171231ex3210ac2f9.htm |
| EX-31.2 - EX-31.2 - MAGELLAN HEALTH INC | mgln-20171231ex31254c2fd.htm |
| EX-31.1 - EX-31.1 - MAGELLAN HEALTH INC | mgln-20171231ex31107bb58.htm |
| EX-23 - EX-23 - MAGELLAN HEALTH INC | mgln-20171231xex23.htm |
| EX-21 - EX-21 - MAGELLAN HEALTH INC | mgln-20171231ex213eabf57.htm |
| EX-12.1 - EX-12.1 - MAGELLAN HEALTH INC | mgln-20171231ex121653e7b.htm |
UNITED STATES
SECURITIES AND EXCHANGE COMMISSION
Washington, D.C. 20549
FORM 10‑K
|
☒ |
ANNUAL REPORT PURSUANT TO SECTION 13 OR 15(d) OF THE SECURITIES EXCHANGE ACT OF 1934 |
|
For the fiscal year ended December 31, 2017 |
|
|
☐ |
TRANSITION REPORT PURSUANT TO SECTION 13 or 15(d) OF THE SECURITIES EXCHANGE ACT OF 1934 |
|
For the transition period from to |
|
Commission File No. 1‑6639
MAGELLAN HEALTH, INC.
(Exact name of registrant as specified in its charter)
|
Delaware |
58‑1076937 |
|
4800 Scottsdale Rd, Suite 4400 |
85251 |
Registrant’s telephone number, including area code: (602) 572‑6050
Securities registered pursuant to Section 12(b) of the Act: None.
|
Title of Each Class |
|
Name of Each Exchange on which Registered |
|
Ordinary Common Stock, par value $0.01 per share |
|
The NASDAQ Global Market |
Securities registered pursuant to Section 12(g) of the Act: None.
Indicate by check mark if the registrant is a well‑known seasoned issuer, as defined in Rule 405 of the Securities Act. Yes ☒ No ☐
Indicate by check mark if the registrant is not required to file reports pursuant to Section 13 or 15(d) of the Act. Yes ☐ No ☒
Indicate by check mark whether the registrant (1) has filed all reports required to be filed by Section 13 or 15(d) of the Securities Exchange Act of 1934 during the preceding twelve months (or for such shorter period that the registrant was required to file such reports), and (2) has been subject to such filing requirements for the past 90 days. Yes ☒ No ☐
Indicate by check mark whether the registrant has submitted electronically and posted on its corporate Web site, if any, every Interactive Data File required to be submitted and posted pursuant to Rule 405 of Regulation S‑T (§232.405 of this chapter) during the preceding 12 months (or for such shorter period that the registrant was required to submit and post such files). Yes ☒ No ☐
Indicate by check mark if disclosure of delinquent filers pursuant to Item 405 of Regulation S‑K is not contained herein, and will not be contained, to the best of registrant’s knowledge, in definitive proxy or information statements incorporated by reference in Part III of this Form 10‑K or any amendment to this Form 10‑K. ☒
Indicate by check mark whether the registrant is a large accelerated filer, an accelerated filer, or a non‑accelerated filer. See definition of “accelerated filer and large accelerated filer” in Rule 12b‑2 of the Exchange Act. (Check one):
|
Large accelerated filer ☒ |
Accelerated filer ☐ |
Non-accelerated filer ☐ |
Smaller reporting company ☐ Emerging growth company ☐
|
If an emerging growth company, indicate by check mark if the registrant has elected not to use the extended transition period for complying with any new or revised financial accounting standards provided pursuant to Section 13(a) of the Exchange Act. ☐
Indicate by check mark whether the registrant is a shell company (as defined in Rule 12b‑2 of the Exchange Act). Yes ☐ No ☒
The aggregate market value of the Ordinary Common Stock (“common stock”) held by non‑affiliates of the registrant based on the closing price on June 30, 2017 (the last business day of the registrant’s most recently completed second fiscal quarter) was approximately $1.7 billion.
The number of shares of Magellan Health, Inc.’s common stock outstanding as of February 23, 2018 was 24,324,140.
DOCUMENTS INCORPORATED BY REFERENCE
Portions of the definitive proxy statement for the 2017 Annual Meeting of Shareholders are incorporated by reference into Part III of this Form 10‑K.
MAGELLAN HEALTH, INC.
REPORT ON FORM 10‑K
For the Fiscal Year Ended December 31, 2017
|
|
|
|
|
Page |
|
|
|
|
|
|
|
|
|
1 | ||
|
|
|
13 | ||
|
|
|
25 | ||
|
|
|
25 | ||
|
|
|
25 | ||
|
|
|
26 | ||
|
|
|
|
|
|
|
|
|
27 | ||
|
|
|
29 | ||
|
|
Management’s Discussion and Analysis of Financial Condition and Results of Operations |
|
30 | |
|
|
|
47 | ||
|
|
|
47 | ||
|
|
Changes in and Disagreements with Accountants on Accounting and Financial Disclosure |
|
47 | |
|
|
|
47 | ||
|
|
|
52 | ||
|
|
|
|
|
|
|
Item 10. |
|
Directors and Executive Officers of the Registrant |
|
53 |
|
Item 11. |
|
Executive Compensation |
|
53 |
|
Item 12. |
|
Security Ownership of Certain Beneficial Owners and Management and Related Stockholder Matters |
|
53 |
|
Item 13. |
|
Certain Relationships and Related Transactions and Director Independence |
|
53 |
|
Item 14. |
|
Principal Accounting Fees and Services |
|
53 |
|
|
|
|
|
|
|
|
Exhibits, Financial Statement Schedule and Additional Information |
|
54 | |
|
|
|
59 |
Cautionary Statement Concerning Forward‑Looking Statements
This Form 10‑K includes “forward‑looking statements” within the meaning of Section 27A of the Securities Act of 1933, as amended (the “Securities Act”), and Section 21E of the Securities Exchange Act of 1934, as amended (the “Exchange Act”). Examples of forward‑looking statements include, but are not limited to, statements the Company (as defined below) makes regarding our future operating results and liquidity needs. Although the Company believes that its plans, intentions and expectations reflected in such forward‑looking statements are reasonable, it can give no assurance that such plans, intentions or expectations will be achieved. Prospective investors are cautioned that any such forward‑looking statements are not guarantees of future performance and involve risks and uncertainties, and that actual results may differ materially from those contemplated by such forward‑looking statements. Important factors currently known to management that could cause actual results to differ materially from those in forward‑looking statements are set forth under the heading “Risk Factors” in Item 1A and elsewhere in this Form 10‑K. When used in this Form 10‑K, the words “estimate,” “anticipate,” “expect,” “believe,” “should” and similar expressions are intended to be forward‑looking statements.
Any forward‑looking statement made by the Company in this Form 10‑K speaks only as of the date on which it is made. Factors or events that could cause our actual results to differ may emerge from time to time, and it is not possible for the Company to predict all of them. The Company undertakes no obligation to publicly update any forward‑looking statement, whether as a result of new information, future developments or otherwise, except as may be required by law.
You should also be aware that while the Company from time to time communicates with securities analysts, the Company does not disclose to them any material non‑public information, internal forecasts or other confidential business information. Therefore, to the extent that reports issued by securities analysts contain projections, forecasts or opinions, those reports are not the Company’s responsibility and are not endorsed by the Company. You should not assume that the Company agrees with any statement or report issued by any analyst, irrespective of the content of the statement or report.
Magellan Health, Inc. (“Magellan”) is a leader within the healthcare management business, and is focused on delivering innovative specialty solutions for the fastest growing, most complex areas of health, including special populations, complete pharmacy benefits, and other specialty carve-out areas of healthcare. The Company develops innovative solutions that combine advanced analytics, agile technology and clinical excellence to drive better decision making, positively impact members’ health outcomes and optimize the cost of care for the customers we serve. The Company provides services to health plans and other managed care organizations (“MCOs”), employers, labor unions, various military and governmental agencies and third party administrators (“TPAs”). Magellan operates three segments: Healthcare, Pharmacy Management and Corporate. In this report, references to the “Company” include Magellan and its subsidiaries. Magellan was incorporated in 1969 under the laws of the State of Delaware.
Healthcare
The Healthcare segment (“Healthcare”) is broken down into two reporting units – Commercial and Government.
The Commercial reporting unit’s customers include health plans, accountable care organizations (“ACOs”), and employers for whom Magellan provides carve-out management services for behavioral health, employee assistance plans (“EAP”), and other areas of specialty healthcare including diagnostic imaging, musculoskeletal management, cardiac, and physical medicine. These management services are applied to a health plan’s or ACO’s entire book of business including commercial, Medicaid and Medicare members or targeted complex populations basis.
The Government reporting unit contracts with local, state and federal governmental agencies to provide services to recipients under Medicaid, Medicare and other government programs. Currently these management services include behavioral health and EAP. The management of total medical cost, as well as long term support services, for special populations is delivered through Magellan Complete Care (“MCC”). These special populations include individuals with
1
serious mental illness (“SMI”), dual eligibles, aged, blind and disabled (“ABD”) and other populations with unique and often complex healthcare needs.
Magellan’s coordination and management of these healthcare and long term support services are provided through its comprehensive network of medical and behavioral health professionals, clinics, hospitals, skilled nursing facilities, home care agencies and ancillary service providers. This network of credentialed providers is integrated with clinical and quality improvement programs to improve access to care and enhance the healthcare experience for individuals in need of care, while at the same time making the cost of these services more affordable for our customers. The Company generally does not directly provide or own any provider of treatment services, although it does employ licensed behavioral health counselors to deliver non‑medical counseling under certain government contracts.
The Company provides its Healthcare management services primarily through: (i) risk‑based products, where the Company assumes all or a substantial portion of the responsibility for the cost of providing treatment services in exchange for a fixed per member per month fee, or (ii) administrative services only (“ASO”) products, where the Company provides services such as utilization review, claims administration and/or provider network management, but does not assume full responsibility for the cost of the treatment services, in exchange for an administrative fee and, in some instances, a gain share.
Pharmacy Management
The Pharmacy Management segment (“Pharmacy Management”) is comprised of products and solutions that provide clinical and financial management of pharmaceuticals paid under both the medical and the pharmacy benefit. Pharmacy Management’s services include: (i) pharmacy benefit management (“PBM”) services; (ii) pharmacy benefit administration (“PBA”) for state Medicaid and other government sponsored programs; (iii) pharmaceutical dispensing operations; (iv) clinical and formulary management programs; (v) medical pharmacy management programs; and (vi) programs for the integrated management of specialty drugs across both the medical and pharmacy benefit that treat complex conditions, regardless of site of service, method of delivery, or benefit reimbursement.
These services are available individually, in combination, or in a fully integrated manner. The Company markets its pharmacy management services to health plans, employers, third party administrators, managed care organizations, state governments, Medicare Part D, and other government agencies, exchanges, brokers and consultants. In addition, the Company will continue to upsell its pharmacy products to its existing customers and market its pharmacy solutions to the Healthcare customer base.
Pharmacy Management contracts with its customers for services using risk‑based, gain share or ASO arrangements. In addition, Pharmacy Management provides services to the Healthcare segment for its MCC business.
Corporate
This segment of the Company is comprised primarily of amounts not allocated to the Healthcare and Pharmacy Management segments that are largely associated with costs related to being a publicly traded company.
See Note 10—“Business Segment Information” to the consolidated financial statements for certain segment financial data relating to our business set forth elsewhere herein.
Recent Acquisitions
Healthcare Acquisitions
In recent years, the Company has expanded its Healthcare segment with various acquisitions. The acquisitions of AlphaCare Holdings, Inc. (“AlphaCare Holdings”) in 2013, The Management Group, LLC (“TMG”) in 2016, Armed Forces Services Corporation (“AFSC”) in 2016 and SWH Holdings, Inc. (“SWH”) in 2017 expanded the Company’s government reporting unit.
Pharmacy Management Acquisitions
In recent years, the Company has expanded its Pharmacy Management segment with various acquisitions. The acquisitions of Partners Rx Management, LLC (“Partners Rx”) in 2013, 4D Pharmacy Management Systems, Inc. (“4D”) in 2015 and Veridicus Holdings, LLC (“Veridicus”) in 2016 expanded the Company’s presence in the PBM market. The Company expanded its formulary management programs with the acquisition of CDMI, LLC (“CDMI”) in 2014.
Industry
According to the Centers for Medicare and Medicaid Services (“CMS”), total U.S. healthcare spending was projected to have increased 5.4 percent to nearly $3.5 trillion in 2017, representing approximately 18.3 percent of the gross domestic product. With the uncertain economic environment, rising healthcare costs, increased fiscal pressures on federal and state governments and the uncertainty around the full implementation of healthcare reform, healthcare spending will continue to be one of the greatest pressing issues for the American public and government agencies. The rapidly evolving clinical and technological environment demands the expertise of specialized healthcare management services to provide both high‑quality and affordable care.
Business Strategy
The Company is focused on delivering innovative specialty management solutions for the fastest growing, most complex health areas. Magellan seeks to grow its business through the following strategic initiatives:
Expanding integrated management services provided to special populations through Magellan Complete Care. The Company, through Magellan Complete Care, will grow the clinically integrated management of complex special populations. Magellan believes its significant Medicaid, behavioral health and pharmacy experience will enable it to further develop and market programs to manage these special populations, utilizing the Company’s unique expertise to improve health outcomes for members served and lower costs for our customers. The Company continues to invest in special population management capabilities and may enter into partnerships, joint ventures or acquisitions that facilitate this effort.
Continuous innovation and opportunistic expansion upon the current suite of carve-out management services for our Commercial Healthcare customers. Magellan will continue to be a consultative partner with our customers to provide quality outcomes and appropriate care by leveraging our clinical expertise, provider networks, claims and customer service.
Expanding the Pharmacy Management business with continued focus on specialty drugs. With advances in specialty drugs driving the majority of pharmaceutical cost increases, our foundation as an industry leader in specialty drug management uniquely positions us to deliver programs across all aspects of drug spend – traditional drugs, as well as specialty drugs paid under both the medical and pharmacy benefits. Our value based strategies are designed to support the 2-3% of patients driving the majority of spend through advanced analytics, high-touch clinical programs and comprehensive specialty drug solutions centered around complex conditions.
The Company’s pharmacy management programs seek to grow through both new customer acquisition and expansion of services to existing customers. We seek to continue growing our comprehensive PBM client base. In addition, we will leverage our specialty drug management expertise to grow our carve-out pharmacy programs, including formulary management and medical pharmacy, targeting health plans and employers. We also remain focused on retention and expansion of state Medicaid PBA business.
Customer Contracts
The Company’s contracts with customers typically have terms of one to three years, and in certain cases contain renewal provisions (at the customer’s option) for successive terms of between one and two years (unless terminated earlier). Substantially all of these contracts may be immediately terminated with cause and many of the Company’s contracts are terminable without cause by the customer or the Company either upon the giving of requisite notice and the passage of a specified period of time (typically between 30 and 180 days) or upon the occurrence of other specified events. In addition, the Company’s contracts with federal, state and local governmental agencies generally are conditioned on legislative appropriations. These contracts generally can be terminated or modified by the customer if such appropriations are not made. The Company’s contracts for managed healthcare and specialty solutions services generally provide for payment of a per member per month fee to the Company. See “Risk Factors—Risk‑Based Products” and “—Reliance on Customer Contracts.”
The Company provides behavioral healthcare management and other related services to members in the state of Florida pursuant to contracts with the State of Florida (the “Florida Contracts”). The Florida Contracts generated net revenues that exceeded, in aggregate, ten percent of net revenues for the consolidated Company for the years ended December 31, 2016 and 2017, respectively.
The Company also has significant concentrations of business with various counties in the State of Pennsylvania (the “Pennsylvania Counties”) which are part of the Pennsylvania Medicaid Program, with members under its contract with CMS, and with various agencies and departments of the United States federal government. See further discussion related to these significant customers in “Risk Factors—Reliance on Customer Contracts.” In addition, see “Risk Factors—Dependence on Government Spending” for discussion of risks to the Company related to government contracts.
Provider Network
The Company’s managed behavioral healthcare services, integrated healthcare services and EAP treatment services are provided by a contracted network of third‑party providers, including physicians, psychiatrists, psychologists, other behavioral and physical health professionals, psychiatric hospitals, general medical facilities with psychiatric beds, residential treatment centers and other treatment facilities. The number and type of providers in a particular area depend upon customer preference, site, geographic concentration and demographic composition of the beneficiary population in that area. The Company’s network consists of approximately 190,000 healthcare providers, including facility locations, providing various levels of care nationwide. The Company’s network providers are almost exclusively independent contractors located throughout the local areas in which the Company’s customers’ beneficiary populations reside. Outpatient network providers work out of their own offices, although the Company’s personnel are available to assist them with consultation and other needs.
Non‑facility network providers include both individual practitioners, as well as individuals who are members of group practices or other licensed centers or programs. Non‑facility network providers typically execute standard contracts with the Company under which they are generally paid on a fee‑for‑service basis.
Third‑party network facilities include inpatient psychiatric and substance abuse hospitals, intensive outpatient facilities, partial hospitalization facilities, community health centers and other community‑based facilities, rehabilitative and support facilities and other intermediate care and alternative care facilities or programs. This variety of facilities enables the Company to offer patients a full continuum of care and to refer patients to the most appropriate facility or program within that continuum. Typically, the Company contracts with facilities on a per diem or fee‑for‑service basis and, in some limited cases, on a “case rate” or capitated basis. The contracts between the Company and inpatient and other facilities typically are for one‑year terms and are terminable by the Company or the facility upon 30 to 120 days notice.
The Company’s radiology benefits management (“RBM”) services are provided by a network of providers including diagnostic imaging centers, radiology departments of hospitals that provide advanced imaging services on an outpatient basis, and individual physicians or physician groups that own advanced imaging equipment and specialize in certain specific areas of care. Certain providers belong to the Company’s network, while others are members of networks belonging to the Company’s customers. These providers are paid on a fee‑for‑service basis.
The Company also has a national network of contracted retail pharmacies which is offered to its pharmacy benefit management customers. We contract with and manage these pharmacies to optimize drug cost and member access to fill covered prescriptions. Pharmacies can work with us both electronically and telephonically at the point of service for member eligibility, claim adjudication and member cost share, if applicable.
Competition
The Company’s business is highly competitive. The Company competes with other healthcare organizations as well as with insurance companies, including health maintenance organizations (“HMOs”), preferred provider organizations (“PPOs”), TPAs, independent practitioner associations (“IPAs”), multi‑disciplinary medical groups, PBMs, healthcare information technology companies, and other specialty healthcare and managed care companies. Many of the Company’s competitors, particularly certain insurance companies, HMOs, technology companies, and PBMs are significantly larger and have greater financial, marketing and other resources than the Company, and some of the Company’s competitors provide a broader range of services. The Company competes based upon quality and reliability of its services, a focus on clinical excellence, product and service innovation and proven expertise across its business lines. The Company may also encounter competition in the future from new market entrants. In addition, some of the Company’s customers that are managed care companies may seek to provide specialty managed healthcare services directly to their subscribers, rather than by contracting with the Company for such services. Because of these factors, the Company does not expect to be able to rely to a significant degree on price increases to achieve revenue growth, and expects to continue experiencing pricing pressures.
Insurance
The Company maintains a program of insurance coverage for a broad range of risks in its business. The Company has renewed its general, professional and managed care liability insurance policies with unaffiliated insurers for a one‑year period from June 17, 2017 to June 17, 2018. The general liability policy is written on an “occurrence” basis, subject to a $0.05 million per claim un‑aggregated self‑insured retention. The professional liability and managed care errors and omissions liability policies are written on a “claims‑made” basis, subject to a $1.0 million per claim ($10.0 million per class action claim) un‑aggregated self‑insured retention for managed care errors and omissions liability, and a $0.05 million per claim un‑aggregated self‑insured retention for professional liability.
The Company maintains a separate general and professional liability insurance policy with an unaffiliated insurer for its specialty pharmaceutical dispensing operations. The specialty pharmaceutical dispensing operations insurance policy has a one‑year term for the period June 17, 2017 to June 17, 2018. The general liability policy is written on an “occurrence” basis and the professional liability policy is written on a “claims‑made” basis, subject to a $0.05 million per claim and $0.25 million aggregated self‑insured retention.
The Company is responsible for claims within its self‑insured retentions, and for portions of claims reported after the expiration date of the policies if they are not renewed, or if policy limits are exceeded. The Company also purchases excess liability coverage in an amount that management believes to be reasonable for the size and profile of the organization.
See “Risk Factors—Professional Liability and Other Insurance,” for a discussion of the risks associated with the Company’s insurance coverage.
Regulation
General
The Company’s operations are subject to extensive and evolving state and federal laws and regulation in the jurisdictions in which we do business. This includes applicable federal and state laws and regulations in connection with its role in providing pharmacy benefit management; behavioral health benefit management; radiology benefit management; utilization review; customer employee benefit plan services; pharmacy; healthcare services; Medicaid; Medicare; health insurance, and laws and regulations impacting its federal government contracts. Regulation of the healthcare industry as well as government contracting is constantly evolving, with new legislative enactments and regulatory initiatives at the state and federal levels being implemented on a regular basis. Consequently, it is possible that a court or regulatory agency may take a position under existing or future laws or regulations, or as a result of a change in the interpretation thereof that such laws or regulations apply to the Company in a different manner than the Company believes such laws or regulations apply. In addition, existing laws and regulations may be repealed or modified. Such changes may require significant alterations to the Company’s business operations in order to comply with such laws or regulations, or interpretations thereof. Expansion of the Company’s business to cover additional geographic areas, to serve different types of customers, to provide new services or to commence new operations could also subject the Company to additional licensure requirements and/or regulation. Failure to comply with applicable regulatory requirements could have a material adverse effect on the Company.
State Licensure and Regulation
The Company is subject to certain state laws and regulations governing the licensing of insurance companies, HMOs, PPOs, TPAs, PBMs, pharmacies and companies engaged in utilization review. In addition, the Company is subject to state laws and regulations concerning the licensing of healthcare professionals, including restrictions on business corporations from providing, controlling or exercising excessive influence over healthcare services through the direct employment of physicians, psychiatrists or, in certain states, psychologists and other healthcare professionals. These laws and regulations vary considerably among states, and the Company may be subject to different types of laws and regulations depending on the specific regulatory approach adopted by each state to regulate the managed care and pharmaceutical management businesses and the provision of healthcare treatment services.
Further, certain regulatory agencies having jurisdiction over the Company possess discretionary powers when issuing or renewing licenses or granting approval of proposed actions such as mergers, a change in ownership, and certain intra‑corporate transactions. One or multiple agencies may require as a condition of such license or approval that the Company cease or modify certain of its operations or modify the way it operates in order to comply with applicable regulatory requirements or policies. In addition, the time necessary to obtain a license or approval varies from state to state, and difficulties in obtaining a necessary license or approval may result in delays in the Company’s plans to expand operations in a particular state and, in some cases, lost business opportunities.
The Company has sought and obtained licenses as a utilization review agent, single service HMO, TPA, PBM, Pharmacy, PPO, HMO and Health Insurance Company in one or more jurisdictions. Numerous states in which the Company does business have adopted regulations governing entities engaging in utilization review. Utilization review regulations typically impose requirements with respect to the qualifications of personnel reviewing proposed treatment, timeliness and notice of the review of proposed treatment and other matters. Many states also license TPA activities. These regulations typically impose requirements regarding claims processing and payments and the handling of customer funds. Some states require TPA licensure for PBM entities as a way to regulate the PBM lines of business.
Other states regulate PBMs through a PBM specific license. The Company has obtained these licenses as required to support the PBM business. Certain insurance licenses are required for the Company to pursue Medicare Part D business; this is discussed further in the pharmacy section of this document. In some cases, single purpose HMO licenses are required for the Company to take risk on business in that state. Some states require PPO or other network licenses to offer a network of providers in the state. Almost all states require licensure for pharmacies dispensing or shipping medications into the state. The Company has obtained all of these necessary licenses.
To the extent that the Company operates or is deemed to operate in some states as an insurance company, HMO, PPO or similar entity, it may be required to comply with certain laws and regulations that, among other things, may require the Company to maintain certain types of assets and minimum levels of deposits, capital, surplus, reserves or net worth. Being licensed as an insurance company, HMO or similar entity could also subject the Company to regulations governing reporting and disclosure, coverage, mandated benefits, rate setting, grievances and appeals, prompt pay laws and other traditional insurance regulatory requirements.
Regulators in a few states have adopted policies that require HMOs or, in some instances, insurance companies, to contract directly with licensed healthcare providers, entities or provider groups, such as IPAs, for the provision of treatment services, rather than with unlicensed intermediary companies. In such states, the Company’s customary model of contracting directly is modified so that, for example, the IPAs (rather than the Company) contract directly with the HMO or insurance company, as appropriate, for the provision of treatment services.
The National Association of Insurance Commissioners (“NAIC”) has developed a “health organizations risk‑based capital” formula, designed specifically for managed care organizations, that establishes a minimum amount of capital necessary for a managed care organization to support its overall operations, allowing consideration for the organization’s size and risk profile. The NAIC also adopted a model regulation in the area of health plan standards, which could be adopted by individual states in whole or in part, and could result in the Company being required to meet additional or new standards in connection with its existing operations. Certain states, for example, have adopted regulations based on the NAIC initiative, and as a result, the Company has been subject to certain minimum capital requirements in those states. Certain other states, such as Maryland, Texas, New York, Florida and New Jersey, have also adopted their own regulatory initiatives that subject entities, such as certain of the Company’s subsidiaries, to regulation under state insurance laws. This includes, but is not limited to, requiring adherence to specific financial solvency standards. State insurance laws and regulations may limit the Company’s ability to pay dividends, make certain investments and repay certain indebtedness.
Regulators may impose operational restrictions on entities granted licenses to operate as insurance companies or HMOs. For example, the California Department of Managed Health Care has imposed certain restrictions on the ability of the Company’s California subsidiaries to fund the Company’s operations in other states, to guarantee or cosign for the Company’s financial obligations, or to pledge or hypothecate the stock of these subsidiaries and on the Company’s ability to make certain operational changes with respect to these subsidiaries. In addition, regulators of certain of the Company’s subsidiaries may exercise certain discretionary rights under regulations including, without limitation, increasing its supervision of such entities or requiring additional restricted cash or other security.
Failure to obtain and maintain required licenses typically also constitutes an event of default under the Company’s contracts with its customers. The loss of business from one or more of the Company’s major customers as a result of an event of default or otherwise could have a material adverse effect on the Company. Licensure requirements may increase the Company’s cost of doing business in the event that compliance requires the Company to retain additional personnel to meet the regulatory requirements and to take other required actions and make necessary filings. Although compliance with licensure regulations has not had a material adverse effect on the Company, there can be no assurance that specific laws or regulations adopted in the future would not have such a result.
The provision of healthcare treatment services by physicians, psychiatrists, psychologists, pharmacists and other providers is subject to state regulation with respect to the licensing of healthcare professionals. The Company believes that the healthcare professionals, who provide healthcare treatment on behalf of or under contracts with the Company, and the case managers and other personnel of the health services business, are in compliance with the applicable state licensing requirements and current interpretations thereof. Regulations imposed upon healthcare providers include but are not limited to, provisions relating to the conduct of, and ethical considerations involved in, the practice of medicine, psychiatry, psychology, social work and related behavioral healthcare professions, radiology, pharmacy, privacy, accreditation, government healthcare program participation requirements, reimbursements for patient services, Medicare, Medicaid, federal and state laws governing fraud, waste and abuse and, in certain cases, the common law or statutory duty to warn others of danger or to prevent patient self‑injury or the statutory duties to report matters of abuse or neglect of individuals. However, there can be no assurance that changes in such requirements or interpretations thereof will not adversely affect the Company’s existing operations or limit expansion.
In California, the Company’s employee assistance programs are regulated by the California Department of Managed Health Care. This subjects the Company to regulations governing reporting and disclosure, coverage, mandated benefits, grievances and appeals and other traditional insurance regulatory requirements. With respect to the Company’s employee assistance crisis intervention program, additional licensing of clinicians who provide telephonic assessment or stabilization services to individuals who are calling from out‑of‑state may be required if such assessment or stabilization services are deemed by regulatory agencies to be treatment provided in the state of such individual’s residence. The Company believes that any such additional licenses could be obtained.
The laws of some states limit the ability of a business corporation to directly provide, control or exercise excessive influence over healthcare services through the direct employment of physicians, psychiatrists, psychologists, or other healthcare professionals, who are providing direct clinical services. In addition, the laws of some states prohibit physicians, psychiatrists, psychologists, or other healthcare professionals from splitting fees with other persons or entities. These laws and their interpretations vary from state to state and enforcement by the courts and regulatory authorities may vary from state to state and may change over time. There can be no assurance that the Company’s existing operations and its contractual arrangements with physicians, psychiatrists, psychologists and other healthcare professionals will not be successfully challenged under state laws prohibiting fee splitting or the practice of a profession by an unlicensed entity, or that the enforceability of such contractual arrangements will not be limited. The Company believes that it could, if necessary, restructure its operations to comply with changes in the interpretation or enforcement of such laws and regulations, and that such restructuring would not have a material adverse effect on its operations.
The Company has a group practice providing case management services to certain customers. The clinicians in the practice are licensed where they are practicing.
Employee Retirement Income Security Act (“ERISA”)
Certain of the Company’s services are subject to the provisions of ERISA. ERISA governs certain aspects of the relationship between employer‑sponsored healthcare benefit plans and certain providers of services to such plans through a series of complex laws and regulations that are subject to periodic interpretation by the Internal Revenue Service (“IRS”) and the U.S. Department of Labor (“DOL”). In some circumstances, and under certain customer contracts, the Company may be expressly named as a “fiduciary” under ERISA, or be deemed to have assumed duties that make it an ERISA fiduciary, and thus be required to carry out its operations in a manner that complies with ERISA in all material respects. In other circumstances, particularly in the administration of pharmacy benefits, the Company does not believe that its services are subject to the fiduciary obligations and requirements of ERISA. In addition, the DOL has not yet finalized guidance regarding whether discounts and other forms of remuneration from pharmaceutical manufacturers are required to be reported to ERISA‑governed plans in connection with ERISA reporting requirements.
Numerous states require the licensing or certification of entities performing TPA activities; however, certain federal courts have held that such licensing requirements are preempted by ERISA. ERISA preempts state laws that mandate employee benefit structures or their administration, as well as those that provide alternative enforcement mechanisms. The Company believes that its TPA activities performed for its self‑insured employee benefit plan customers are exempt from otherwise applicable state licensing or registration requirements based upon federal preemption under ERISA and have relied on this general principle in determining not to seek licenses for certain of the Company’s activities in some states. Existing case law is not uniform on the applicability of ERISA preemption with respect to state regulation of PBM or TPA activities. In some states, the Company has licensed its self‑funded pharmacy related business as a TPA or PBM after a review of state regulatory requirements and case law. There can be no assurance that additional licenses will not be required with respect to utilization review or TPA activities in certain states.
Some of the state regulatory requirements described herein may be preempted in whole or in part by ERISA, which provides for comprehensive federal regulation of employee benefit plans. However, the scope of ERISA preemption is uncertain and is subject to conflicting court rulings. As a result, the Company could be subject to overlapping federal and state regulatory requirements with respect to certain of its operations and may need to implement compliance programs that satisfy multiple regulatory regimes. There can be no assurance that continuing ERISA compliance efforts or any future changes to ERISA will not have a material adverse effect on the Company.
The Health Insurance Portability and Accountability Act of 1996 (“HIPAA”) and Other Privacy Regulation
HIPAA promulgated standards relating to the transmission, privacy and security of health information by healthcare providers and healthcare plans. Confidentiality and patient privacy requirements are particularly strict in the Company’s behavioral managed care business.
The Health Information Technology for Economic and Clinical Health Act (“HITECH Act”), passed as part of the American Recovery and Reinvestment Act of 2009, represented a significant expansion of the HIPAA privacy and security laws.
HIPAA generally does not preempt state law. Therefore, because many states have privacy laws that either provide more stringent privacy protections than those imposed by HIPAA, the Company must address privacy issues under those state laws as well.
In addition to HIPAA and the HITECH Act, the Company is also subject to federal laws and regulations governing patient records involving substance abuse treatment, as well as other federal privacy laws and regulations.
There can be no assurance that compliance with such future laws and regulations would not have a material adverse effect on its operations.
Fraud, Waste and Abuse Laws
The Company is subject to federal and state laws and regulations protecting against fraud, waste and abuse. Fraud, waste and abuse prohibitions cover a wide range of activities, including kickbacks and other inducements for referral of members or the coverage of products, billing for unnecessary services by a healthcare provider and improper marketing. Companies involved in public healthcare programs such as Medicare and Medicaid are required to maintain compliance programs to detect and deter fraud, waste and abuse, and are often subject to audits. The regulations and contractual requirements applicable to the Company in relation to these programs are complex and subject to change.
The federal healthcare Anti‑Kickback Statute (the “Anti‑Kickback Statute”) prohibits, among other things, an entity from paying or receiving, subject to certain exceptions and “safe harbors,” any remuneration, directly or indirectly, to induce the referral of individuals covered by federally funded healthcare programs, or the purchase, or the arranging for or recommending of the purchase, of items or services for which payment may be made in whole, or in part, under Medicare, Medicaid, TRICARE or other federally funded healthcare programs. Sanctions for violating the Anti‑Kickback Statute may include imprisonment, criminal and civil fines and exclusion from participation in the federally funded healthcare programs. The Anti‑Kickback Statute has been interpreted broadly by courts, the Office of Inspector General (“OIG”), the Department of Health and Human Services (“DHHS”) and other administrative bodies.
It also is a crime under the Public Contracts Anti‑Kickback Statute, for any person to knowingly and willfully offer or provide any remuneration to a prime contractor to the United States, including a contractor servicing federally funded health programs, in order to obtain favorable treatment in a subcontract. Violators of this law also may be subject to civil monetary penalties. There have been a series of substantial civil and criminal investigations and settlements, at the state and federal level, by pharmacy benefit managers over the last several years in connection with alleged kickback schemes.
The federal civil monetary penalty (“CMP”) statute provides for civil monetary penalties for any person who provides something of value to a beneficiary covered under a federal healthcare program, such as Medicare or Medicaid, in order to influence the beneficiary’s choice of a provider. ERISA, to which certain of our customers’ services are subject, generally prohibits any person from providing to a plan fiduciary a remuneration in order to affect the fiduciary’s selection of or decisions with respect to service providers. Unlike the federal healthcare Anti‑Kickback Statute, ERISA regulations do not provide specific safe harbors and its application may be unclear.
The Federal Civil False Claims Act imposes civil penalties for knowingly making or causing to be made false claims with respect to governmental programs, such as Medicare and Medicaid, for services not rendered, or for misrepresenting actual services rendered, in order to obtain higher reimbursement. Private individuals may bring qui tam or whistleblower suits under the Federal Civil False Claims Act, which authorizes the payment of a portion of any recovery to the individual bringing suit. Further, pursuant to the Patient Protection and Affordable Care Act (“ACA”), a violation of the Anti‑Kickback Statute is also a per se violation of the Federal Civil False Claims Act. The Federal Civil False Claims Act generally provides for the imposition of civil penalties and for treble damages, resulting in the possibility of substantial financial penalties for small billing discrepancies. Criminal provisions that are similar to the Federal Civil False Claims Act provide that a corporation may be fined if it is convicted of presenting to any federal agency a claim or making a statement that it knows to be false, fictitious or fraudulent. Even in situations where the Company does not directly provide services to beneficiaries of federally funded health programs and, accordingly, does not directly submit claims to the federal government, it is possible that the Company could nevertheless become involved in a situation where false claim issues are raised based on allegations that it caused or assisted a government contractor in making a false claim.
The Company is subject to certain provisions of the Deficit Reduction Act of 2005 (the “Act”). The Act requires entities that receive $5 million or more in annual Medicaid payments to establish written policies that provide detailed information about the Federal Civil False Claims Act and the remedies thereunder, as well as any state laws pertaining to civil or criminal penalties for false claims and statements, the “whistleblower” protections afforded under such laws, and the role of such laws in preventing and detecting fraud, waste and abuse. The Company is also subject to The Dodd‑Frank Wall Street Reform and Consumer Protection Act (“Dodd‑Frank”). Under the law, those with independent knowledge of a financial fraud committed by a business required to report to the U.S. Securities and Exchange Commission (“SEC”) or the U.S. Commodity Futures Trading Commission (“CFTC”) may be entitled to a percentage of the money recovered. Included in Dodd‑Frank are provisions which protect employees of publicly traded companies from retaliation for reporting securities fraud, fraud against shareholders and violation of the SEC rules/regulations. Dodd‑Frank also amends the Sarbanes‑Oxley Act (“SOX”) and Federal Civil False Claims Act to expand their whistleblower protections.
Many states have laws and/or regulations similar to the federal fraud, waste and abuse laws described above. Sanctions for violating these laws may include injunction, imprisonment, criminal and civil fines and exclusion from participation in the state Medicaid programs. The Company has a corporate compliance and ethics program, policies and procedures and internal controls in place designed to ensure that the Company conducts business appropriately. However, there can be no assurance that the Company will not be subject to scrutiny or challenge under such laws or regulations and that any such challenge would not have a material adverse effect on the Company’s business, results of operations, financial condition or cash flows.
Mental Health Parity
The Paul Wellstone and Pete Domenici Mental Health Parity Act of 2008 (“MHPAEA”) establishes parity in financial requirements (e.g., co‑pays, deductibles, etc.) and treatment limitations (e.g., limits on the number of visits) between mental health and substance abuse benefits and medical/surgical benefits for health plan members. This law does not require coverage for mental health or substance abuse disorders, but if coverage is provided it must be provided at parity. No specific disorders are mandated for coverage; health plans are able to define mental health and substance abuse to determine what they are going to cover. Under the ACA, non‑grandfathered individual and small group plans (both on and off of the Health Insurance Exchange) are required to provide mental health and substance abuse disorder benefits as essential health benefits. These mandated benefits under the ACA must be provided at parity in these plans. Under the ACA, grandfathered individual plans are required to comply with parity if they offer behavioral health benefits. Grandfathered small group plans are exempt from requirements to provide essential health benefits and parity requirements. State mandated benefits laws are not preempted. The law applies to ERISA plans, Medicaid managed care plans and State Children’s Health Insurance Program (“SCHIP”) plans. On November 13, 2013 the Department of the Treasury, the Department of Labor and the Department of Health and Human Services issued Final Rules on the MHPAEA (“Final Rules”). The Final Rules include some concepts not included under the statute including the requirement to conduct the parity review at the category level within the plan, introducing the concept of non‑quantitative treatment limitations, and prohibiting separate but equal deductibles. The Company believes it is in compliance with these requirements. In March 2016, CMS promulgated a final rule on the application of parity to Medicaid Managed Care Plans, CHIP, and alternative benefit plans. Compliance with this rule was required on or after October 2, 2017. The Company has been working with our state Medicaid customers on compliance with these rules. On December 7, 2016, the Congress adopted the Twenty-First Century Cures Act, which codified some concepts in the Final Rules. The Company’s risk contracts allow for repricing to occur effective the same date that any legislation/regulation becomes effective if that legislation/regulation is projected to have a material effect on cost of care.
Health Care Reform
The ACA is a broad and sweeping piece of legislation creating numerous changes in the healthcare regulatory environment. Some of the regulations interpreting the ACA, most notably the Medical Loss Ratio regulations, the Internal Claims and Appeals and External Review Processes Regulations, and Health Insurance Exchanges have an impact on the Company and its business. Others, such as the regulation on dependent coverage to age 26 and coverage of preventative health services, could impact the nature of the members that we serve and the utilization rates. Medicaid expansion under the ACA has had some impact on the Company’s Medicaid business. The Company has customers that are participating in the state and federal Health Insurance Exchanges. The Company has taken necessary steps to support our customers in their administration of these plans.
The ACA also contains provisions related to fees that impact the Company’s direct public sector contracts and provisions regarding the non‑deductibility of those fees. Our state public sector customers have made rate adjustments to cover the direct costs of these fees and a majority of the impact from non‑deductibility of such fees for federal income tax purposes. There may be some impact due to taxes paid for non‑renewing customers where the timing and amount of recoupment of these additional costs is uncertain. There can be no guarantees regarding this adjustment from our state public sector customers and these taxes and fees may have a material impact on the Company.
Federal and State Medicaid Laws and Regulations
The Company directly contracts with various states to provide Medicaid services to states. In addition, the Company directly contracts with various states to provide Medicaid managed care services to state Medicaid beneficiaries. As such, it is subject to certain federal and state laws and regulations affecting Medicaid as well as state contractual requirements. In addition to state regulation, certain Medicaid contracts require the Company to maintain Medicare Advantage special needs plan status, which is regulated by CMS.
The Company also is a sub‑contractor to health plans that provide Medicaid managed care services to state Medicaid beneficiaries. In the Company’s capacity as a subcontractor with these health plans, the Company is indirectly subject to certain federal and state laws and regulations as well as contractual requirements pertaining to the operation of this business. If a state or a health plan customer determines that the Company has not performed satisfactorily as a subcontractor, the state or the health plan customer may require the Company to cease these activities or responsibilities under the subcontract. While the Company believes that it provides satisfactory levels of service under its respective subcontracts, the Company can give no assurances that a state or health plan will not terminate the Company’s business relationships insofar as they pertain to these services.
On May 6, 2016, CMS published final regulations that significantly modified the existing federal Medicaid Managed Care and the SCHIP regulations. On June 30, 2017, CMS issued an Informational Bulletin regarding the applicable effective/compliance dates for the new Medicaid Managed Care and the SCHIP regulations. Magellan is working respectively with state Medicaid agencies and Medicaid Managed Care Plans (our Medicaid customers) to ensure ongoing compliance with those sections of the regulations that are specified as effective based on the determination made by the applicable state Medicaid agency.
In connection with its PBM business, the Company negotiates rebates with and provides services for drug manufacturers. The manufacturers are subject to Medicaid “best price” regulations requiring essentially that the manufacturer provide its deepest level of discounts to the Medicaid program. In some instances, the government has challenged a manufacturer’s calculation of best price and we cannot be certain what effect, if any, the outcome of any such investigation or proceeding will have on our ability to negotiate favorable terms.
Medicare Laws and Regulations
The Company is contracted with CMS as a Medicare Advantage Organization (“MAO”) and Prescription Drug Plan (“PDP”) to provide health services and prescription drug benefits to Medicare beneficiaries. The regulations and contractual requirements applicable to the Company and other participants in Medicare programs are complex and subject to change. CMS regularly audits its contractors’ performance to determine compliance with contracts and CMS regulations, and to assess the quality of services provided to Medicare beneficiaries. CMS penalties for noncompliance include premium refunds, civil monetary penalties, prohibiting a company from continuing to market and/or enroll members in the company’s Medicare products, exclusion from participation in federally funded healthcare programs and other sanctions. In July 2017 CMS issued a civil monetary penalty against one of the Company’s subsidiaries for non-compliance with a contractual standard outlined in its Part D contract. In February 2018 CMS issued civil monetary penalties against this subsidiary for deficiencies cited as a result of CMS audits conducted in the 2nd and 3rd quarters of 2017. These penalties do not have a material impact on the Company nor its Part D business. The Company is also subcontractor to health plans that are MAOs and PDPs. In the Company’s capacity as a subcontractor with these health plans, the Company administers benefits to Medicare beneficiaries and is indirectly subject to certain federal laws and regulations as well as contractual requirements pertaining to the operation of this business. If the CMS or a health plan customer determines that the Company has not performed satisfactorily as a subcontractor, CMS or the health plan customer may require the Company to cease these activities or responsibilities under the subcontract. While the Company believes that it provides satisfactory levels of service under its respective subcontracts, the Company can give no assurances that CMS or a health plan will not terminate the Company’s business relationships insofar as they pertain to these services.
CMS requires Part D Plans to report all price concessions received for PBM services. The applicable CMS guidance requires Part D Plans to contractually require the right to audit their PBMs as well as require full transparency as to manufacturer rebates and administrative fees paid for drugs or services provided in connection with the sponsor’s plan, including the portion of such rebates retained by the PBM. Additionally, CMS requires Part D Plans to ensure through their contractual arrangements with first tier, downstream and related entities (which would include PBMs) that CMS has access to such entities’ books and records pertaining to services performed in connection with Part D Plans. The CMS regulations also suggests that Part D Plans should contractually require their first tier, downstream and related entities to comply with certain elements of the Part D Plan’s compliance program. The Company has not experienced, and does not anticipate, that such disclosure and auditing requirements, to the extent required by its Part D Plan partners, will have a materially adverse effect on the Company’s business.
The Company expects CMS and the U.S. Congress to continue to closely scrutinize each component of the Medicare program, modify the terms and requirements of the program and possibly seek to modify private insurers’ role. Therefore, it is not possible to predict the outcome of any Congressional or regulatory activity, either of which could have a material adverse effect on the Company.
Other Federal and State Laws and Regulations
Federal Laws and Regulations affecting Procurement. The Company is subject to certain federal laws and regulations in connection with its contracts with the federal government. These laws and regulations affect how the Company conducts business with its federal agency customers and may impose added costs on its business. The Company’s failure to comply with federal procurement laws and regulations could cause it to lose business, incur additional costs and subject it to a variety of civil and criminal penalties and administrative sanctions, including termination of contracts, forfeiture of profits, harm to reputation, suspension of payments, fines, and suspension or debarment from doing business with federal government agencies. The Company’s wholly owned subsidiary, AFSC, conducts business with federal agency customers and federal contractors to such agencies. The Company is currently in the process of conducting an investigation into matters relating to compliance by AFSC with Small Business Administration (“SBA”) regulations and other federal laws applicable to government contractors, and the Company intends to make its findings available to the SBA during and upon concluding the investigation. The results of this investigation may give rise to contingencies, if any, that could require us to record balance sheet liabilities or accrue expenses, the amounts of which we are not able to currently estimate. For 2017 AFSC’s total revenue comprised approximately 3% of the total revenues of the Company.
The Company also provides services to various state Medicaid programs. Services procurement related to Medicaid programs is governed in part by federal regulations because the federal government provides a substantial amount of funding for the services. The Company’s state customers risk loss of federal funding if the Company is not in compliance with federal regulations. The Company’s non‑compliance may also lead to unanticipated, negative financial consequences including corrective action plans or contract default risks.
FDA Regulation. The U.S. Food and Drug Administration (“FDA”) generally has authority to regulate drug promotional activities that are performed “by or on behalf of” a drug manufacturer. The Company provides certain consulting and related services to drug manufacturers and there can be no assurance that the FDA will not attempt to assert jurisdiction over certain aspects of the Company’s activities. The impact of future FDA regulation could materially adversely affect the Company’s business, results of operations, financial condition or cash flows.
State PBM Regulation. States continue to introduce broad legislation to regulate PBM activities. This legislation encompasses some of the services offered by the Company’s PBM business. Legislation in this area is varied and encompasses licensing, audit provisions, network access, recoupment of funds, submission of claims data to state all payor claims databases, potential fiduciary duties, pass through of cost savings and disclosure obligations, including the disclosure of information regarding the company’s maximum allowable cost pricing with pharmacies. In some circumstances, claims or inquiries against PBMs have been asserted under state consumer protection laws, which exist in most states. The Company has obtained licenses as necessary to support current business and future opportunities. The various state laws do not appear to have a material adverse effect on the Company’s pharmaceutical management business. However, the Company can give no assurance that these and other states will not enact legislation with more adverse consequences in the near future; nor can the Company be certain that future regulations or interpretations of existing laws will not adversely affect its business.
State Legislation Affecting Plan or Benefit Design. Some states have enacted legislation that prohibits certain types of managed care plan sponsors from implementing certain restrictive formulary and network design features, and many states have legislation regulating various aspects of managed care plans, including provisions relating to pharmacy benefits. Other states mandate coverage of certain benefits or conditions and require health plan coverage of specific drugs, if deemed medically necessary by the prescribing physician. Such legislation does not generally apply to the Company directly, but may apply to certain clients of the Company, such as HMOs and health insurers. These types of laws would generally have an adverse effect on the ability of a PBM to reduce cost for its plan sponsor customers.
Prompt Pay Laws. Under Medicare Part D and some state laws, the Company or customer may be required to pay network pharmacies within certain time periods and/or by electronic transfer instead of by check. The shorter time periods may negatively impact our cash flow. We cannot predict whether additional states will enact some form of prompt pay legislation.
Legislation and Regulation Affecting Drug Prices. Specialty pharmaceutical manufacturers generally report various price metrics to the federal government, including “average sales price” (“ASP”), “average manufacturer price” (“AMP”) and “best price” (“BP”). The Company does not calculate these price metrics, but the Company notes that the ASP, AMP and BP methodologies may create incentives for some drug manufacturers to reduce the levels of discounts or rebates available to purchasers, including the Company, or their clients with respect to specialty drugs. Any changes in the guidance affecting pharmaceutical manufacturer price metric calculations could materially adversely affect the Company’s business.
Additionally, most of the Company’s pharmacy benefit management and dispensing contracts with its customers use “average wholesale price” (“AWP”) as a benchmark for establishing pricing. At least one major third party publisher of AWP pricing data has ceased to publish such data in the past few years, and there can be no guarantee that AWP will continue to be an available pricing metric in the future. The discontinuance of AWP reporting by one data source has not had a material adverse effect on the Company’s results of operations and the Company expects that were AWP data to no longer be available, other equitable pricing measures would be available to avoid a material adverse impact on the Company’s business. Separately, on a monthly basis CMS publishes the National Average Drug Acquisition Cost (“NADAC”), a data set that purports to provide the average acquisition cost of retail drugs based on a nationwide voluntary survey of retail pharmacies. At this time, the Company does not anticipate that NADAC will materially adversely impact its operations, but it is too early to speculate what impact, if any, such a reimbursement shift might have in pharmacy reimbursement and/or costs in the future.
Regulations Affecting the Company’s Pharmacies. The Company owns five pharmacies that provide services primarily to members of certain of the Company’s health plan customers. The activities undertaken by the Company’s pharmacies subject the pharmacies to state and federal statutes and regulations governing, among other things, the licensure and operation of mail order and nonresident pharmacies, repackaging of drug products, stocking of prescription drug products and dispensing of prescription drug products, including controlled substances. The Company’s pharmacy facilities are located in Florida, Utah and New York and are duly licensed to conduct business in those states. Many states, however, require out‑of‑state mail order pharmacies to register with or be licensed by the state board of pharmacy or similar governing body when pharmaceuticals are delivered by mail into the state, and some states require that an out‑of‑state pharmacy employ a pharmacist that is licensed in the state into which pharmaceuticals are shipped. The Company holds mail order and nonresident pharmacy licenses where required. The Company also maintains Medicare and Medicaid provider licenses where required for the pharmacies to provide services to these plans. In some states the Company is not able to obtain Medicaid licenses to dispense because those states require that the pharmacy have a physical location in the state to participate in the Medicaid network.
Regulation of Controlled Substances. The Company’s pharmacies must register with the United States Drug Enforcement Administration (the “DEA”) and individual state controlled substance authorities in order to dispense controlled substances. Federal law requires the Company to comply with the DEA’s security, recordkeeping, inventory control and labeling standards in order to dispense controlled substances. State controlled substance law requires registration and compliance with state pharmacy licensure, registration or permit standards promulgated by the state pharmacy licensing authority and in some states drug database reporting requirements.
Employees of the Registrant
At December 31, 2017, the Company had approximately 10,700 full‑time and part‑time employees.
Available Information
The Company makes its annual reports on Form 10‑K, quarterly reports on Form 10‑Q, current reports on Form 8‑K, amendments to those reports filed or furnished pursuant to Section 13(a) or 15(d) of the Securities Exchange Act of 1934, and Section 16 filings available, free of charge, on the Company’s website at www.magellanhealth.com as soon as practicable after the Company has electronically filed such material with, or furnished it to, the SEC. The information on the Company’s website is not part of or incorporated by reference in this report on Form 10‑K.
Reliance on Customer Contracts—The Company’s inability to renew, extend or replace expiring or terminated contracts could adversely affect the Company’s liquidity, profitability and financial condition.
Substantially all of the Company’s net revenue is derived from contracts that may be terminated immediately with cause and many, including some of the Company’s most significant contracts, are terminable without cause by the customer upon notice and the passage of a specified period of time (typically between 60 and 180 days), or upon the occurrence of certain other specified events. The Company’s ten largest customers accounted for approximately 50.0 percent, 43.9 percent and 40.3 percent of the Company’s net revenue in the years ended December 31, 2015, 2016 and 2017, respectively. Loss of all of these contracts or customers would, and loss of any one of these contracts or customers could, materially reduce the Company’s net revenue and have a material adverse effect on the Company’s liquidity, profitability and financial condition. See Note 2—“Summary of Significant Accounting Policies—Significant Customers” to the consolidated financial statements set forth elsewhere herein for a discussion of the Company’s significant customers.
Integration of Companies Acquired by Magellan—The Company’s profitability could be adversely affected if the integration of companies acquired by Magellan is not completed in a timely and effective manner.
One of the Company’s growth strategies is to make strategic acquisitions which are complementary to its existing operations. After Magellan closes on an acquisition, it must integrate the acquired company into Magellan’s policies, procedures and systems. Failure to effectively integrate an acquired business or the failure of the acquired business to perform as anticipated could result in excessive costs being incurred, a delay in obtaining targeted synergies, decreased customer performance (which could result in contract penalties and/or terminations), increased employee turnover, and lost sales opportunities. Finally, difficulties assimilating acquired operations and services could result in the diversion of capital and management’s attention away from other business issues and opportunities.
Changes in the Medical Managed Care Carve‑Out Industry—Certain changes in the business practices of this industry could negatively impact the Company’s resources, profitability and results of operations.
A portion of the Company’s Healthcare and Pharmacy Management segments’ net revenues are derived from customers in the medical managed healthcare industry, including managed care companies, health insurers and other health plans. Some types of changes in this industry’s business practices could negatively impact the Company. For example, if the Company’s managed care customers seek to provide services directly to their subscribers, instead of contracting with the Company for such services, the Company could be adversely affected. In this regard, certain of the Company’s major customers in the past have not renewed all or part of their contracts with the Company, and instead provided managed healthcare services directly to their subscribers. In addition, the Company has a significant number of contracts with Blue Cross Blue Shield plans and other regional health plans. Consolidation of the healthcare industry through acquisitions and mergers could potentially result in the loss of contracts for the Company. Any of these changes could reduce the Company’s net revenue, and adversely affect the Company’s profitability and financial condition.
Changes in the Contracting Model for Medicaid Contracts—Certain changes in the contracting model used by states for managed healthcare services contracts relating to Medicaid lives could negatively impact the Company’s resources, profitability and results of operations.
A portion of the Company’s Healthcare segment net revenue is derived from direct contracts that it has with state or county governments for the provision of services to Medicaid enrollees. Certain states have recently contracted with managed care companies to manage both the behavioral and physical medical care of their Medicaid enrollees. If other governmental entities change the method for contracting for Medicaid business to a fully integrated model, the Company will attempt to subcontract with the managed care organizations to provide behavioral healthcare management for such Medicaid business; however, there is no assurance that the Company would be able to secure such arrangements. Alternatively, the Company may choose to pursue licensure as a health plan to bid on this integrated business. Accordingly, if such a change in the contracting model were to occur, it is possible that the Company could lose current contracted revenues, as well as be unable to bid on potential new business opportunities, thus negatively impacting the Company’s profitability and financial condition.
Risk‑Based Products—Because the Company provides services at a fixed fee, if the Company is unable to maintain historical margins, or is unable to accurately predict and control healthcare costs, the Company’s profitability could decline.
The Company derives its net revenue primarily from arrangements under which the Company assumes responsibility for costs of treatment in exchange for a fixed fee. The Company refers to such arrangements as “risk‑based contracts” or “risk‑based products,” which include EAP services. These arrangements provided 58.8 percent, 49.1 percent and 49.6 percent of the Company’s net revenue in the years ended December 31, 2015, 2016 and 2017, respectively.
The profitability of the Company’s risk contracts could be reduced if the Company is unable to maintain its historical margins. The competitive environment for the Company’s risk products could result in pricing pressures which cause the Company to reduce its rates. In addition, customer demands or expectations as to margin levels could cause the Company to reduce its rates. A reduction in risk rates which are not accompanied by a reduction in services covered or expected underlying care trend could result in a decrease in the Company’s operating margins.
Profitability of the Company’s risk contracts could also be reduced if the Company is unable to accurately estimate the rate of service utilization by members or the cost of such services when the Company prices its services. The Company’s assumptions of utilization and costs when the Company prices its services may not ultimately reflect actual utilization rates and costs, many aspects of which are beyond the Company’s control. If the cost of services provided to members under a contract together with the administrative costs exceeds the aggregate fees received by the Company under such contract, the Company will incur a loss on the contract.
The Company’s profitability could also be reduced if the Company is required to make adjustments to estimates made in reporting historical financial results regarding cost of care, reflected in the Company’s financial statements as medical claims payable. Medical claims payable includes reserves for incurred but not reported (“IBNR”) claims, which are claims for covered services rendered by the Company’s providers which have not yet been submitted to the Company for payment. The Company estimates and reserves for IBNR claims based on past claims payment experience, including the average interval between the date services are rendered and the date the claims are received and between the date services are rendered and the date claims are paid, enrollment data, utilization statistics, adjudication decisions, authorized healthcare services and other factors. This data is incorporated into contract‑specific reserve models. The estimates for submitted claims and IBNR claims are made on an accrual basis and adjusted in future periods as required. If such risk‑based products are not correctly underwritten, the Company’s profitability and financial condition could be adversely affected.
Factors that affect the Company’s ability to price the Company’s services, or accurately make estimates of IBNR claims and other expenses for which the Company creates reserves may include differences between the Company’s assumptions and actual results arising from, among other things:
|
· |
changes in the delivery system; |
|
· |
changes in utilization patterns; |
|
· |
changes in the number of members seeking treatment; |
|
· |
unforeseen fluctuations in claims backlogs; |
|
· |
unforeseen increases in the costs of the services; |
|
· |
the occurrence of catastrophes; |
|
· |
regulatory changes; and |
|
· |
changes in benefit plan design. |
Some of these factors could impact the ability of the Company to manage and control the medical costs to the extent assumed in the pricing of its services.
If the Company’s membership in risk‑based business continues to grow (which is a major focus of the Company’s strategy), the Company’s exposure to potential losses from risk‑based products will also increase.
Expansion of Risk‑Based Products—Because the Company intends to continue its expansion into clinically integrated management of special populations eligible for Medicaid and Medicare including individuals with SMI, and other unique high‑cost populations, if the Company is unable to accurately underwrite the healthcare cost risk for this new business and control associated costs, the Company’s profitability could decline.
The Company believes that it can leverage its information systems, call center, claims and network infrastructure as well as its financial strength and underwriting expertise to facilitate the development of risk product offerings to states that include behavioral healthcare and physical medical care for their special Medicaid and dual eligible populations, particularly individuals with SMI. As the Company expands into new markets, the Company will incur start‑up costs to develop and grow this business. The Company’s profitability may be negatively impacted until such time that sufficient business is generated to offset these start‑up costs.
Furthermore, as the Company expands into new markets, there is an increased risk associated with the underwriting and implementation for this business. Profitability of any such business could be adversely affected if the Company is unable to accurately estimate the rate of service utilization or the cost of such services when the Company prices its services. The Company’s assumptions of utilization and costs when the Company prices its services may not ultimately reflect actual utilization rates and costs, many aspects of which are beyond the Company’s control. If the cost of services provided to members under a contract together with the administrative costs exceeds the aggregate fees received by the Company under such contract, the Company will incur a loss on the contract.
The Company may partner with managed care organizations to create joint ventures in some states. Conflicts or disagreements between the Company and any joint venture partner may negatively impact the benefits to be achieved by the relevant joint venture or may ultimately threaten the ability of any such joint venture to continue. The Company is also subject to additional risks and uncertainties because the Company may be dependent upon, and subject to, liability, losses or reputational damage relating to systems, controls and personnel that are not entirely under the Company’s control.
Provider Agreements—Failure to maintain or to secure cost‑effective healthcare provider contracts may result in a loss of membership or higher medical costs.
The Company’s profitability depends, to an extent, upon the ability to contract favorably with certain healthcare providers. The Company may be unable to enter into agreements with providers in new markets on a timely basis or under favorable terms. If the Company is unable to retain its current provider contracts or enter into new provider contracts timely or on favorable terms, the Company’s profitability could be reduced. The Company cannot provide any assurance that it will be able to continue to renew its existing provider contracts or enter into new contracts.
Pharmacy Management—Loss of Relationship with Providers—If we lose our relationship, or our relationship otherwise changes in an unfavorable manner, with one or more key pharmacy providers or if significant changes occur within the pharmacy provider marketplace, or if other issues arise with respect to our pharmacy networks, our business could be adversely affected.
Our operations are dependent to a significant extent on our ability to obtain discounts on prescription purchases from retail pharmacies that can be utilized by our clients and their members. Our contracts with retail pharmacies, which are non‑exclusive, are generally terminable by either party on short notice. If one or more of our top pharmacy chains elects to terminate its relationship with us, or if we are only able to continue our relationship on terms less favorable to us, access to retail pharmacies by our clients and their health plan members, and consequently our business, results of operations, financial condition or cash flows could be adversely affected.
Pharmacy Management—Loss of Relationship with Vendors—Our specialty pharmacies, pharmacy claims processing, and mail processing are dependent on our relationships with a limited number of vendors and suppliers and the loss of any of these relationships could significantly impact our ability to sustain our financial performance.
We acquire a substantial percentage of our specialty pharmacies prescription drug supply from a limited number of suppliers. Our agreements with these suppliers may be short‑term and cancelable by either party without cause with a relatively short time‑frame of prior notice. These agreements may limit our ability to provide services for competing drugs during the term of the agreement and allow the supplier to dispense through channels other than us. Further, certain of these agreements allow pricing and other terms of these relationships to be periodically adjusted for changing market conditions or required service levels. A termination or modification to any of these relationships could have an adverse effect on our business, financial condition and results of operations. An additional risk related to supply is that many products dispensed by our specialty pharmacy business are manufactured with ingredients that are susceptible to supply shortages. If any products we dispense are in short supply for long periods of time, this could result in a material adverse effect on our business, financial condition and results of operations. Further, we source from a limited number of vendors certain aspects of our pharmacy claims and mail processing capabilities. An interruption of service, termination or modification to the terms to any of these agreements may adversely affect our business and financial condition.
Pharmacy Management—Loss of Relationship with Manufacturers—If we lose relationships with one or more key pharmaceutical manufacturers or third party rebate administrators or if rebate payments we receive from pharmaceutical manufacturers and rebate processing service providers decline, our business, results of operations, financial condition or cash flows could be adversely affected.
We receive fees from our clients for administering rebate programs with pharmaceutical manufacturers based on the use of selected drugs by members of health plans sponsored by our clients, as well as fees for other programs and services. Our business, results of operations, financial condition or cash flows could be adversely affected if:
|
· |
we lose relationships with one or more key pharmaceutical manufacturers or third party rebate administrators; |
|
· |
we are unable to renew or finalize rebate contracts with one or more key pharmaceutical manufacturers in the future, or are unable to negotiate interim arrangements; |
|
· |
rebates decline due to the failure of our health plan sponsors to meet market share or other thresholds; |
|
· |
legal restrictions are imposed on the ability of pharmaceutical manufacturers to offer rebates or purchase our programs or services; |
|
· |
pharmaceutical manufacturers choose not to offer rebates or purchase our programs or services; or |
|
· |
rebates decline due to contract branded products losing their patients. |
Fluctuation in Operating Results—The Company experiences fluctuations in quarterly operating results and, as a consequence, the Company may fail to meet or exceed market expectations, which could cause the Company’s stock price to decline.
The Company’s quarterly operating results have varied in the past and may fluctuate significantly in the future due to seasonal and other factors, including:
|
· |
changes in utilization levels by enrolled members of the Company’s risk‑based contracts, including seasonal utilization patterns (for example, members generally tend to seek services less during the third and fourth quarters of the year than in the first and second quarters of the year); |
|
· |
performance‑based contractual adjustments to net revenue, reflecting utilization results or other performance measures; |
|
· |
changes in estimates for contractual adjustments under commercial contracts; |
|
· |
retrospective membership adjustments; |
|
· |
the timing of implementation of new contracts, enrollment changes and contract terminations; |
|
· |
pricing adjustments upon contract renewals; |
|
· |
the timing of acquisitions; |
|
· |
changes in estimates regarding medical costs and IBNR claims; |
|
· |
the timing of recognition of pharmacy revenues, including rebates and Medicare Part D; and |
|
· |
changes in estimates of contingent consideration. |
These factors may affect the Company’s quarterly and annual net revenue, expenses and profitability in the future and, accordingly, the Company may fail to meet market expectations, which could cause the Company’s stock price to decline.
Dependence on Government Spending—The Company can be adversely affected by changes in federal, state and local healthcare policies, programs, funding and enrollments.
A portion of the Company’s net revenues are derived, directly or indirectly, from governmental agencies, including state Medicaid programs. Contract rates vary from state to state, are subject to periodic negotiation and may limit the Company’s ability to maintain or increase rates. The Company is unable to predict the impact on the Company’s operations of future regulations or legislation affecting Medicaid programs, or the healthcare industry in general. Future regulations or legislation may have a material adverse effect on the Company. Moreover, any reduction in government spending for such programs could also have a material adverse effect on the Company (See “Reliance on Customer Contracts”). In addition, the Company’s contracts with federal, state and local governmental agencies, under both direct contract and subcontract arrangements, generally are conditioned upon financial appropriations by one or more governmental agencies, especially in the case of state Medicaid programs. These contracts generally can be terminated or modified by the customer if such appropriations are not made. The Company faces increased risks in this regard as state budgets have come under increasing pressure. Finally, some of the Company’s contracts with federal, state and local governmental agencies, under both direct contract and subcontract arrangements, require the Company to perform additional services if federal, state or local laws or regulations imposed after the contract is signed so require, in exchange for additional compensation, to be negotiated by the parties in good faith. Government and other third‑party payors generally seek to impose lower contract rates and to renegotiate reduced contract rates with service providers in a trend toward cost control.
Restrictive Covenants in the Company’s Debt Instruments—Restrictions imposed by the Company’s debt agreements limit the Company’s operating and financial flexibility. These restrictions may adversely affect the Company’s ability to finance the Company’s future operations or capital needs or engage in other business activities that may be in the Company’s interest.
On September 22, 2017, the Company completed the public offering of $400.0 million aggregate principal amount of its 4.400% Senior Notes due 2024 (the “Notes”). The Notes are governed by an indenture, dated as of September 22, 2017 (the “Base Indenture”), between the Company, as issuer and U.S. Bank National Association, as trustee, as supplemented by a first supplemental indenture, dated as of September 22, 2017 (the “First Supplemental Indenture” together, with the Base Indenture, the “Indenture”), between the Company, as issuer, and U.S. Bank National Association, as trustee.
The Indenture contains certain covenants which restrict the Company’s ability to, among other things, create liens on its and its subsidiaries’ assets; engage in sale and lease-back transactions; and engage in a consolidation, merger or sale of assets.
On September 22, 2017, the Company entered into a credit agreement with various lenders that provides for a $400.0 million senior unsecured revolving credit facility and a $350.0 million senior unsecured term loan facility to the Company, as the borrower (the “2017 Credit Agreement”). The 2017 Credit Agreement is scheduled to mature on September 22, 2022.
The 2017 Credit Agreement contains covenants that limit management’s discretion in operating the Company’s business by restricting or limiting the Company’s ability, among other things, to:
|
· |
incur or guarantee additional indebtedness or issue preferred or redeemable stock; |
|
· |
pay dividends and make other distributions; |
|
· |
repurchase equity interests; |
|
· |
make certain advances, investments and loans; |
|
· |
enter into sale and leaseback transactions; |
|
· |
create liens; |
|
· |
sell and otherwise dispose of assets; |
|
· |
acquire or merge or consolidate with another company; and |
|
· |
enter into some types of transactions with affiliates. |
These restrictions could adversely affect the Company’s ability to finance future operations or capital needs or engage in other business activities that may be in the Company’s interest. The 2017 Credit Agreement also requires the Company to comply with specified financial ratios and tests. Failure to do so, unless waived by the lenders under the 2017 Credit Agreement, pursuant to its terms, would result in an event of default.
Required Assurances of Financial Resources—The Company’s liquidity, financial condition, prospects and profitability can be adversely affected by present or future state regulations and contractual requirements that the Company provide financial assurance of the Company’s ability to meet the Company’s obligations.
Some of the Company’s contracts and certain state regulations require the Company or certain of the Company’s subsidiaries to maintain specified cash reserves or letters of credit and/or to maintain certain minimum tangible net equity in certain of the Company’s subsidiaries as assurance that the Company has financial resources to meet the Company’s contractual obligations. Many of these state regulations also restrict the investment activity of certain of the Company’s subsidiaries. Some state regulations also restrict the ability of certain of the Company’s subsidiaries to pay dividends to Magellan. Additional state regulations could be promulgated that would increase the cash or other security the Company would be required to maintain. In addition, the Company’s customers may require additional restricted cash or other security with respect to the Company’s obligations under the Company’s contracts, including the Company’s obligation to pay IBNR claims and other medical claims not yet processed and paid. In addition, certain of the Company’s contracts and state regulations limit the profits that the Company may earn on risk‑based business. The Company’s liquidity, financial condition, prospects and profitability could be adversely affected by the effects of such regulations and contractual provisions. See Note 2—“Summary of Significant Accounting Policies—Restricted Assets” to the consolidated financial statements set forth elsewhere herein for a discussion of the Company’s restricted assets.
Competition—The competitive environment in the managed healthcare industry may limit the Company’s ability to maintain or increase the Company’s rates, which would limit or adversely affect the Company’s profitability, and any failure in the Company’s ability to respond adequately may adversely affect the Company’s ability to maintain contracts or obtain new contracts.
The Company’s business is highly competitive. The Company competes with other healthcare organizations as well as with insurance companies, including HMOs, PPOs, TPAs, IPAs, multi‑disciplinary medical groups, PBMs, specialty pharmacy companies, RBM companies and other specialty healthcare and managed care companies. Many of the Company’s competitors, particularly certain insurance companies, HMOs and PBMs are significantly larger and have greater financial, marketing and other resources than the Company, which can create downward pressure on prices through economies of scale. The entrance or expansion of these larger companies in the managed healthcare industry (including the Company’s customers who have in‑sourced or who may choose to in‑source healthcare services) could increase the competitive pressures the Company faces and could limit the Company’s ability to maintain or increase the Company’s rates. If this happens, the Company’s profitability could be adversely affected. In addition, if the Company does not adequately respond to these competitive pressures, it could cause the Company to not be able to maintain its current contracts or to not be able to obtain new contracts.
Possible Impact of Federal Healthcare Reform Law—can significantly impact the Company’s revenues or profitability.
The ACA is a comprehensive piece of legislation intended to make significant changes to the healthcare system in the United States. The ACA contains various effective dates extending through 2020. Numerous regulations have been promulgated related to the ACA with hundreds more expected in the future.
Significant provisions in the ACA include requiring individuals to purchase health insurance, minimum medical loss ratios for health insurance issuers, significant changes to the Medicare and Medicaid programs and many other changes that affect healthcare insurance and managed care. See “Regulation” above for more information. Therefore, it is uncertain at this time what the financial impact of healthcare reform will be to the Company. The Company cannot predict the effect of this legislation or other legislation that may be adopted by the United States Congress or by the states, and such legislation, if implemented, could have an adverse effect on the Company.
The ACA also contains provisions related to fees that impact the Company’s direct public sector contracts and provisions regarding the non‑deductibility of those fees. We believe that our state public sector customers will make rate adjustments to cover the direct costs of these fees and a majority of the impact from non‑deductibility of such fees for federal income tax purposes. There may be some impact due to taxes paid for non‑renewing customers where the timing and amount of recoupment of these additional costs is uncertain. There can be no guarantees regarding this adjustment from our state public sector customers and these taxes and fees may have a material impact on the Company.
Possible Impact of Federal Mental Health Parity—can significantly impact the Company’s revenues or profitability.
In October 2008, the United States Congress passed the Paul Wellstone and Pete Dominici Mental Health Parity Act of 2008 (“MHPAEA”) establishing parity in financial requirements (e.g. co‑pays, deductibles, etc.) and treatment limitations (e.g., limits on the number of visits) between mental health and substance abuse benefits and medical/surgical benefits for health plan members. This law does not require coverage for mental health or substance abuse disorders but if coverage is provided it must be provided at parity. No specific disorders are mandated for coverage; health plans are able to define mental health and substance abuse to determine what they are going to cover. Under the ACA non‑grandfathered individual and small group plans (both on and off of the exchange) are required to provide mental health and substance use disorder benefits as essential health benefits. These mandated benefits under the ACA must be provided at parity in these plans. Under the ACA, grandfathered individual plans are required to comply with parity if they offer behavioral health benefits. Grandfathered small group plans are exempt from requirements to provide essential health benefits and parity requirements. State mandated benefits laws are not preempted. The law applies to ERISA plans, Medicaid managed care plans and SCHIP plans. On February 2, 2010, the Department of the Treasury, the Department of Labor and the Department of Health and Human Services issued Interim Final Rules interpreting the MHPAEA (“IFR”). The IFR applies to ERISA plans and insured business. A State Medicaid Director Letter was issued in January 2013 discussing applicability of parity to Medicaid managed care plans, SCHIP plans and Alternative Benefit (Benchmark) Plans. It is possible that some states will change their behavioral health plan benefits or management techniques as a result of this letter. On November 13, 2013 the Department of the Treasury, the Department of Labor and the Department of Health and Human Services issued Final Rules on the MHPAEA (“Final Rules”). The IFR included some concepts not included under the statute including the requirement to conduct the parity review at the category level within the plan, introducing the concept of non‑quantitative treatment limitations, and prohibiting separate but equal deductibles. While some of the regulatory requirements in the IFR were not anticipated, the Company believes it is in compliance with the requirements of the IFR. The Company does not anticipate any significant impacts from the Final Rules however it is still reviewing and assessing the Final Rules with customers. The Company’s risk contracts do allow for repricing to occur effective the same date that any legislation/regulation becomes effective if that legislation/regulation is projected to have a material effect on cost of care.
Government Regulation—The Company is subject to substantial government regulation and scrutiny, which increase the Company’s costs of doing business and could adversely affect the Company’s profitability.
The managed healthcare industry is subject to extensive and evolving federal and state regulation. Such laws and regulations cover, but are not limited to, matters such as licensure, accreditation, government healthcare program participation requirements, information privacy and security, reimbursement for patient services, and Medicare and Medicaid fraud and abuse. The Company’s pharmaceutical management business is also the subject of substantial federal and state governmental regulation and scrutiny.
The Company is subject to certain state laws and regulations and federal laws as a result of the Company’s role in management of customers’ employee benefit plans.
Regulatory issues may also affect the Company’s operations including, but not limited to:
|
· |
additional state licenses that may be required to conduct the Company’s businesses, including utilization review, PBM, pharmacy, HMO and TPA activities; |
|
· |
limits imposed by state authorities upon corporations’ control or excessive influence over managed healthcare services through the direct employment of physicians, psychiatrists, psychologists or other professionals, and prohibiting fee splitting; |
|
· |
laws that impose financial terms and requirements on the Company due to the Company’s assumption of risk under contracts with licensed insurance companies or HMOs; |
|
· |
laws in certain states that impose an obligation to contract with any healthcare provider willing to meet the terms of the Company’s contracts with similar providers; |
|
· |
compliance with HIPAA (including the federal HITECH Act, which strengthens and expands HIPAA) and other federal and state laws impacting the confidentiality of member information; |
|
· |
state legislation regulating PBMs or imposing fiduciary status on PBMs; |
|
· |
pharmacy laws and regulation; |
|
· |
legislation imposing benefit plan design restrictions, which limit how our clients can design their drug benefit plans; and |
|
· |
network pharmacy access laws, including “any willing provider” and “due process” legislation, that affect aspects of our pharmacy network contracts. |
The imposition of additional licensing and other regulatory requirements may, among other things, increase the Company’s equity requirements, increase the cost of doing business or force significant changes in the Company’s operations to comply with these requirements.
The costs associated with compliance with government regulation as discussed above may adversely affect the Company’s financial condition and results of operation.
Noncompliance With Regulations—Noncompliance with regulations may have a material adverse effect on the Company’s business, financial condition and results of operations, including from monetary or criminal liabilities and penalties, investigations or regulatory actions, additional compliance requirements, heightened governmental scrutiny, or exclusion from participating in government programs.
Extensive laws and regulation are applicable to all of our business operations. Noncompliance by the Company with these laws and regulations may have a material adverse effect on the Company’s business, financial condition and results of operations.
Government investigations and allegations have become more frequent concerning possible violations of statutes and regulations by healthcare organizations. The Company also conducts its own investigations into these matters and may choose to self-report its findings to governmental agencies. Violations by the Company with certain laws and regulations may result in it being excluded from participating in government healthcare programs, subject to fines or penalties or required to repay amounts received from the government for previously billed services. In addition, alleged violations may result in litigation or regulatory action. A subsequent legal liability or a significant regulatory action against the Company could have a material adverse effect on the Company’s business, financial condition and results of operations. Moreover, even if the Company ultimately prevails in any litigation, regulatory action or investigation, such litigation, regulatory action or investigation could have a material adverse effect on the Company’s business, financial condition and results of operations.
The Company also receives notifications from and engages in discussions with various government agencies concerning the Company’s businesses and operations. As a result of these contacts with regulators, the Company may, as appropriate, be required to implement changes to the Company’s operations, revise the Company’s filings with such agencies and/or seek additional licenses to conduct the Company’s business. The Company’s inability to comply with the various regulatory requirements may have a material adverse effect on the Company’s business.
Reference is made to information set forth under “Regulation—Other Federal and State Laws and Regulations” under Item 1 of this Report.
Medicare Part D—The Company’s participation in Medicare Part D is subject to government regulation and failure to comply with regulatory requirements could adversely impact the Company’s profitability.
There are many uncertainties about the financial and regulatory risks of participating in the Medicare Part D program, and we can give no assurance these risks will not materially adversely impact the Company’s results. Certain of the Company’s subsidiaries have been approved by CMS to offer Medicare Part D prescription drug plans to individual beneficiaries and employer groups. Such subsidiaries are required to comply with Medicare Part D laws and regulations and, because CMS requires that Medicare Part D sponsors be licensed as risk‑bearing entities, also with applicable state laws and regulations regarding the business of insurance. The Company also provides services in support of our clients’ Medicare Part D plans and must be able to deliver such services in a manner that complies with applicable regulatory requirements. We have made substantial investments in both human resources and the technology required to administer Medicare Part D benefits. The adoption of new or more complex regulatory requirements or changes in the interpretation of existing regulatory requirements associated with Medicare Part D may require us to incur significant costs or otherwise impact our ability to earn a profit on such business. In addition, the Company’s receipt of federal funds made available through the Medicare Part D program is subject to compliance with the laws and regulations governing the federal government’s payment for healthcare goods and services, including the federal anti‑kickback law and false claims acts. If we fail to comply materially with applicable regulatory or contractual requirements, whether identified through CMS or other government audits, client audits, or otherwise, we may be subject to certain sanctions, penalties, or other remedies, including, but not limited to, suspension of marketing or enrollment activities, restrictions on expanding our service area, civil monetary penalties or other monetary amounts, termination of our contract(s) with CMS or Part D clients, and exclusion from federal healthcare programs.
The Company faces risks related to unauthorized disclosure of sensitive or confidential member and other information.
As part of its normal operations, the Company collects, processes and retains confidential member information making the Company subject to various federal and state laws and rules regarding the use and disclosure of confidential member information, including HIPAA. The Company also maintains other confidential information related to its business and operations. Despite appropriate security measures, the Company may be vulnerable to security breaches, acts of vandalism, computer viruses, misplaced or lost data, programming and/or human errors or other similar events. Noncompliance with any privacy or security laws and regulations or any security breach, whether by the Company or by its vendors, could result in enforcement actions, material fines and penalties and could also subject the Company to litigation.
Cyber‑Security—The Company faces risks related to a breach or failure in our operational security systems or infrastructure, or those of third parties with which we do business.
Our business requires us to securely store, process and transmit confidential, proprietary and other information in our operations. Security breaches may arise from computer hackers penetrating our systems to obtain personal information for financial gain, attempting to cause harm to our operations, or intending to obtain competitive information. Our systems are also subject to the attack of viruses, worms, and other malicious software programs. We maintain a comprehensive system of preventive and detective controls through our security programs; however, our prevention and detection controls may not prevent or identify all such attacks. The costs to update our security protocols to mitigate a security breach could be significant. A breach or failure in our operational security systems may result in loss of data or an unauthorized disclosure of sensitive or confidential member or employee information and could result in significant penalties or fines, litigation, loss of customers, or significant damage to our reputation and business, which could adversely impact the Company’s financial condition and results of operations.
The Company faces additional regulatory risks associated with its Pharmacy Management segment which could subject it to additional regulatory scrutiny and liability and which could adversely affect the profitability of the Pharmacy Management segment in the future.
Various aspects of the Company’s Pharmacy Management segment are governed by federal and state laws and regulations. Pharmaceutical management services are provided by the Company to Medicaid and Medicare plans as well as commercial insurance plans. There has been enhanced scrutiny on federal programs and the Company must remain vigilant in ensuring compliance with the requirements of these programs. In addition, there are provisions of the ACA which may impact the Company’s business. For example, the ACA imposes transparency requirements on PBMs. PBMs have also increasingly become the target of federal and state litigation over alleged practices relating to prescription drug switching, soliciting, and receiving unlawful remuneration, handling rebates, and fiduciary duties, among others. Significant sanctions may be imposed for violations of these laws and compliance programs are a significant operational requirement of the Company’s business. There are significant uncertainties involving the application of many of these legal requirements to the Company. Accordingly, the Company may be required to incur additional administrative and compliance expenses in determining the applicable requirements and in adapting its compliance practices, or modifying its business practices, in order to satisfy changing interpretations and regulatory policies. In addition, there are numerous proposed healthcare laws and regulations at the federal and state levels, many of which, if adopted, could adversely affect the Company’s business. See “Regulation” above.
Risks Related to Realization of Goodwill and Intangible Assets—The Company’s profitability could be adversely affected if the value of intangible assets is not fully realized.
The Company’s total assets at December 31, 2017 reflect goodwill of approximately $1.0 billion, representing approximately 34.0 percent of total assets. The Company completed its annual impairment analysis of goodwill as of October 1, 2017, noting that no impairment was identified.
At December 31, 2017, identifiable intangible assets (customer lists, contracts, provider networks and trade names) totaled approximately $268.3 million. Intangible assets are generally amortized over their estimated useful lives, which range from approximately one to eighteen years. The amortization periods used may differ from those used by other entities. In addition, the Company may be required to shorten the amortization period for intangible assets in future periods based on changes in the Company’s business. There can be no assurance that such goodwill or intangible assets will be realizable.
The Company evaluates, on a regular basis, whether for any reason the carrying value of the Company’s intangible assets and other long‑lived assets may no longer be completely recoverable, in which case a charge to earnings for impairment losses could become necessary. When events or changes in circumstances occur that indicate the carrying amount of long‑lived assets may not be recoverable, the Company assesses the recoverability of long‑lived assets other than goodwill by determining whether the carrying value of such assets will be recovered through the future cash flows expected from the use of the asset and its eventual disposition.
Any event or change in circumstances leading to a future determination requiring write‑off of a significant portion of unamortized intangible assets or goodwill would adversely affect the Company’s profitability.
Claims for Professional Liability—Pending or future actions or claims for professional liability (including any associated judgments, settlements, legal fees and other costs) could require the Company to make significant cash expenditures and consume significant management time and resources, which could have a material adverse effect on the Company’s profitability and financial condition.
The Company’s operating activities entail significant risks of liability. In recent years, participants in the healthcare industry generally, as well as the managed healthcare industry, have become subject to an increasing number of lawsuits. From time to time, the Company is subject to various actions and claims of professional liability alleging negligence in performing utilization review and other managed healthcare activities, as well as for the acts or omissions of the Company’s employees, including employed physicians and other clinicians, network providers, pharmacists, or others. In the normal course of business, the Company receives reports relating to deaths and other serious incidents involving patients whose care is being managed by the Company. Such incidents occasionally give rise to malpractice, professional negligence and other related actions and claims against the Company, the Company’s employees or the Company’s network providers. The Company is also subject to actions and claims for the costs of services for which payment was denied. Many of these actions and claims seek substantial damages and require the Company to incur significant fees and costs related to the Company’s defense and consume significant management time and resources. While the Company maintains professional liability insurance, there can be no assurance that future actions or claims for professional liability (including any judgments, settlements or costs associated therewith) will not have a material adverse effect on the Company’s profitability and financial condition.
Professional Liability and Other Insurance—Claims brought against the Company that exceed the scope of the Company’s liability coverage or denial of coverage could materially and adversely affect the Company’s profitability and financial condition.
The Company maintains a program of insurance coverage against a broad range of risks in the Company’s business. As part of this program of insurance, the Company carries professional liability insurance, subject to certain deductibles and self‑insured retentions. The Company also is sometimes required by customer contracts to post surety bonds with respect to the Company’s potential liability on professional responsibility claims that may be asserted in connection with services the Company provides. As of December 31, 2017, the Company had approximately $67.7 million of such bonds outstanding. The Company’s insurance may not be sufficient to cover any judgments, settlements or costs relating to present or future claims, suits or complaints. Upon expiration of the Company’s insurance policies, sufficient insurance may not be available on favorable terms, if at all. To the extent the Company’s customers are entitled to indemnification under their contracts with the Company relating to liabilities they incur arising from the operation of the Company’s programs, such indemnification may not be covered under the Company’s insurance policies. To the extent that certain actions and claims seek punitive and compensatory damages arising from the Company’s alleged intentional misconduct, such damages, if awarded, may not be covered, in whole or in part, by the Company’s insurance policies. If the Company is unable to secure adequate insurance in the future, or if the insurance the Company carries is not sufficient to cover any judgments, settlements or costs relating to any present or future actions or claims, such judgments, settlements or costs may have a material adverse effect on the Company’s profitability and financial condition. If the Company is unable to obtain needed surety bonds in adequate amounts or make alternative arrangements to satisfy the requirements for such bonds, the Company may no longer be able to operate in those states, which would have a material adverse effect on the Company.
Class Action Suits and Other Legal Proceedings—The Company is subject to class action and other lawsuits that could result in material liabilities to the Company or cause the Company to incur material costs, to change the Company’s operating procedures in ways that increase costs or to comply with additional regulatory requirements.
Managed healthcare companies and PBM companies have been targeted as defendants in national class action lawsuits regarding their business practices. The Company has in the past been subject to such national class actions as defendants and is also subject to or a party to other class actions, lawsuits and legal proceedings in conducting the Company’s business. In addition, certain of the Company’s customers are parties to pending class action lawsuits regarding the customers’ business practices for which the customers could seek indemnification from the Company. These lawsuits may take years to resolve and cause the Company to incur substantial litigation expense, and the outcomes could have a material adverse effect on the Company’s profitability and financial condition. In addition to potential damage awards, depending upon the outcomes of such cases, these lawsuits may cause or force changes in practices of the Company’s industry and may also cause additional regulation of the industry through new federal or state laws or new applications of existing laws or regulations. Such changes could increase the Company’s operating costs.
Negative Publicity—The Company may be subject to negative publicity which may adversely affect the Company’s business, financial position, results of operations or cash flows.
From time to time, the managed healthcare industry has received negative publicity. This publicity has led to increased legislation, regulation, review of industry practices and private litigation. These factors may adversely affect the Company’s ability to market our services, require the Company to change its services, or increase the overall regulatory burden under which the Company operates. Any of these factors may increase the costs of doing business and adversely affect the Company’s business, financial position, results of operations or cash flows.
Investment Portfolio—The value of the Company’s investments is influenced by varying economic and market conditions, and a decrease in value may result in a loss charged to income.
All of the Company’s investments are classified as “available‑for‑sale” and are carried at fair value. The Company’s available‑for‑sale investment securities were $327.9 million and represented 11.1 percent of the Company’s total assets at December 31, 2017.
The current economic environment and recent volatility of securities markets increase the difficulty of assessing investment impairment and the same influences tend to increase the risk of potential impairment of these assets. The Company believes it has adequately reviewed its investment securities for impairment and that its investment securities are carried at fair value. However, over time, the economic and market environment may provide additional insight regarding the fair value of certain securities, which could change the Company’s judgment regarding impairment. This could result in realized losses relating to other‑than‑temporary declines being charged against future income. Given the current market conditions and the significant judgments involved, there is a risk that declines in fair value may occur and material other‑than‑temporary impairments may be charged to income in future periods, resulting in realized losses. In addition, if it became necessary for the Company to liquidate its investment portfolio on an accelerated basis, it could have an adverse effect on the Company’s results of operations.
Adverse Economic Conditions—Adverse changes in national economic conditions could adversely affect the Company’s business and results of operations.
Changes in national economic conditions could adversely affect the Company’s reimbursement from state Medicaid programs in its Healthcare segment. Adverse economic conditions could also adversely affect the Company’s customers in the Healthcare and Pharmacy Management segments resulting in increased pressures on the Company’s operating margins. In addition, economic conditions may result in decreased membership in the Healthcare and Pharmacy Management segments, thereby adversely affecting the revenues to the Company from such customers as well as the Company’s operating profitability.
Adverse economic conditions in the debt markets could affect the Company’s ability to refinance the Company’s existing Credit Agreement upon its maturity on acceptable terms, or at all.
Item 1B. Unresolved Staff Comments
None.
The Company currently leases approximately 1.1 million square feet of office space comprising 71 offices in 28 states and the District of Columbia with terms expiring between February 28, 2018 and November 30, 2025. The Company’s principal executive offices are located in Scottsdale, Arizona, which lease expires in October 2019. The Company believes that its current facilities are suitable for and adequate to support the level of its present operations.
The Company’s operating activities entail significant risks of liability. From time to time, the Company is subject to various actions and claims arising from the acts or omissions of its employees, network providers or other parties. In the normal course of business, the Company receives reports relating to deaths and other serious incidents involving patients whose care is being managed by the Company. Such incidents occasionally give rise to malpractice, professional negligence and other related actions and claims against the Company or its network providers. Many of these actions and claims received by the Company seek substantial damages and therefore require the Company to incur significant fees and costs related to their defense.
The Company is also subject to or party to certain class actions and other litigation and claims relating to its operations or business practices. The Company has recorded reserves that, in the opinion of management, are adequate to cover litigation, claims or assessments that have been or may be asserted against the Company, and for which the outcome is probable and reasonably estimable. Management believes that the resolution of such litigation and claims will not have a material adverse effect on the Company’s financial condition or results of operations; however, there can be no assurance in this regard.
Item 4. Mine Safety Disclosures
Not applicable.
Item 5. Market for Registrant’s Common Equity, Related Stockholder Matters and Issuer Purchases of Equity Securities
Shares of the Company’s Ordinary Common Stock, $0.01 par value per share (“common stock”) have traded on the NASDAQ Stock Market under the symbol “MGLN.” For further information regarding the Company’s common stock, see Note 6—“Stockholders’ Equity” to the consolidated financial statements set forth elsewhere herein. The following tables set forth the high and low closing bid prices of the Company’s common stock as reported by the NASDAQ Stock Market for the years ended December 31, 2016 and 2017, as follows:
|
|
|
Common Stock |
|
||
|
|
|
Sales Prices |
|
||
|
|
|
High |
|
Low |
|
|
2016 |
|
|
|
|
|
|
First Quarter |
$ |
68.31 |
$ |
52.57 |
|
|
Second Quarter |
|
71.57 |
|
62.42 |
|
|
Third Quarter |
|
71.25 |
|
52.34 |
|
|
Fourth Quarter |
|
76.80 |
|
49.90 |
|
|
2017 |
|
|
|
|
|
|
First Quarter |
|
80.10 |
|
64.63 |
|
|
Second Quarter |
|
73.90 |
|
66.50 |
|
|
Third Quarter |
|
86.30 |
|
71.95 |
|
|
Fourth Quarter |
|
98.90 |
|
81.10 |
|
As of December 31, 2017, there were approximately 236 stockholders of record of the Company’s common stock. The stockholders of record data for common stock does not reflect persons whose stock was held on that date by the Depository Trust Company or other intermediaries.
Comparison of Cumulative Total Return
The following graph compares the change in the cumulative total return on the Company’s common stock to (a) the change in the cumulative total return on the stocks included in the Standard & Poor’s (“S&P”) 500 Stock Index and (b) the change in the cumulative total return on the stocks included in the S&P 500 Managed Health Care Index, assuming an investment of $100 made at the close of trading on December 31, 2012, and comparing relative values on December 31, 2013, 2014, 2015, 2016 and 2017. The Company did not pay any dividends during the period reflected in the graph. The common stock price performance shown below should not be viewed as being indicative of future performance.
Comparison of Cumulative Total Return
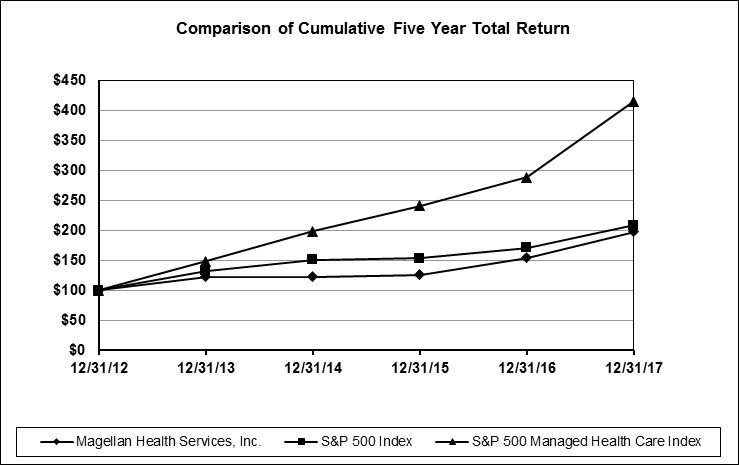
|
|
|
December 31, |
|
||||||||||||||||
|
|
|
2012 |
|
2013 |
|
2014 |
|
2015 |
|
2016 |
|
2017 |
|
||||||
|
Magellan Health, Inc. |
|
$ |
100 |
|
$ |
122.27 |
|
$ |
122.51 |
|
$ |
125.84 |
|
$ |
153.57 |
|
$ |
197.04 |
|
|
S&P 500 Index |
|
|
100 |
|
|
132.39 |
|
|
150.51 |
|
|
152.59 |
|
|
170.84 |
|
|
208.14 |
|
|
S&P 500 Managed Health Care Index(1) |
|
|
100 |
|
|
147.87 |
|
|
197.56 |
|
|
240.77 |
|
|
287.75 |
|
|
414.57 |
|
|
(1) |
The S&P 500 Managed Health Care Index consists of Aetna, Inc., Anthem, Inc., Centene Corporation, Cigna Corporation, Humana, Inc. and UnitedHealth Group, Inc. |
The information set forth above under the “Comparison of Cumulative Total Return” does not constitute soliciting material and should not be deemed filed or incorporated by reference into any other of the Company’s filings under the Securities Act or the Exchange Act, except to the extent the filing specifically incorporates such information by reference therein.
Stock Repurchases
The Company’s board of directors has previously authorized a series of stock repurchase plans. Stock repurchases for each such plan could be executed through open market repurchases, privately negotiated transactions, accelerated share repurchases or other means. The board of directors authorized management to execute stock repurchase transactions from time to time and in such amounts and via such methods as management deemed appropriate. Each stock repurchase program could be limited or terminated at any time without prior notice.
On October 26, 2015, the Company’s board of directors approved a stock repurchase plan which authorized the Company to purchase up to $200 million of its outstanding common stock through October 26, 2017 (the “2015 Repurchase Program”). On July 26, 2017, the Company’s board of directors approved an extension of the 2015 Repurchase Program through October 26, 2018. Pursuant to the 2015 Repurchase Program, the Company made purchases during the three months ended December 31, 2017 as follows (aggregate cost excludes broker commissions and is reflected in millions):
|
|
|
Total number |
|
Average |
|
Total Number of Shares |
|
Approximate Dollar Value of |
|
||
|
|
|
of Shares |
|
Price Paid |
|
Purchased as Part of Publicly |
|
Shares that May Yet Be |
|
||
|
Period |
|
Purchased |
|
per Share(1) |
|
Announced Plans or Programs |
|
Purchased Under the Plans(1)(2) |
|
||
|
October 1 - 31, 2017 |
|
25,708 |
|
$ |
84.61 |
|
25,708 |
|
$ |
57.2 |
|
|
November 1-30, 2017 |
|
49,551 |
|
|
83.37 |
|
49,551 |
|
|
53.0 |
|
|
December 1-31, 2017 |
|
— |
|
|
— |
|
— |
|
|
53.0 |
|
|
|
|
75,259 |
|
|
|
|
75,259 |
|
|
|
|
|
(1) |
Excludes amounts that could be used to repurchase shares acquired under the Company’s equity incentive plans to satisfy withholding tax obligations of employees and non-employee directors upon the vesting of restricted stock units. |
|
(2) |
Excludes broker commissions |
The Company made no share repurchases from January 1, 2018 through February 23, 2018.
Dividends
The Company did not declare any dividends during either of the years ended December 31, 2016 or 2017 and does not expect to pay a dividend in 2018. The Company is prohibited from paying dividends on its common stock under the terms of the 2017 Credit Agreement, except in limited circumstances. The declaration and payment of any dividends in the future by the Company will be subject to the sole discretion of the Company’s board of directors and will depend upon many factors, including the Company’s financial condition, earnings, covenants associated with the Company’s 2017 Credit Agreement and any similar future agreement, legal requirements, regulatory constraints and other factors deemed relevant by the Company’s board of directors. Moreover, should the Company pay any dividends in the future, there can be no assurance that the Company will continue to pay such dividends.
Recent Sales of Unregistered Securities
During the quarter ended December 31, 2017, the Company had no sales of unregistered securities.
Item 6. Selected Financial Data
The following table sets forth selected historical consolidated financial information of the Company as of and for the years ended December 31, 2013, 2014, 2015, 2016 and 2017.
Selected consolidated financial information for the years ended December 31, 2015, 2016 and 2017 and as of December 31, 2016 and 2017 presented below, have been derived from, and should be read in conjunction with, the audited consolidated financial statements and the notes thereto included elsewhere herein. Selected consolidated financial information for the years ended December 31, 2013 and 2014 has been derived from the Company’s audited consolidated financial statements not included in this Form 10‑K. The selected financial data set forth below also should be read in conjunction with the Company’s financial statements and accompanying notes and “Management’s Discussion and Analysis of Financial Condition and Results of Operations” appearing elsewhere herein.
MAGELLAN HEALTH, INC. AND SUBSIDIARIES
(In thousands, except per share amounts)
|
|
|
Year Ended December 31, |
|
|||||||||||||
|
|
|
2013 |
|
2014 |
|
2015 |
|
2016 |
|
2017 |
|
|||||
|
Statement of Operations Data: |
|
|
|
|
|
|
|
|
|
|
|
|
|
|
|
|
|
Net revenue |
|
$ |
3,546,317 |
|
$ |
3,760,118 |
|
$ |
4,597,400 |
|
$ |
4,836,884 |
|
$ |
5,838,583 |
|
|
Cost of care |
|
|
2,232,976 |
|
|
2,088,595 |
|
|
2,274,755 |
|
|
1,882,614 |
|
|
2,413,770 |
|
|
Cost of goods sold |
|
|
455,601 |
|
|
732,949 |
|
|
1,321,877 |
|
|
1,818,720 |
|
|
2,211,910 |
|
|
Direct service costs and other operating expenses(1)(2) |
|
|
619,546 |
|
|
723,498 |
|
|
822,392 |
|
|
876,612 |
|
|
941,883 |
|
|
Depreciation and amortization |
|
|
71,994 |
|
|
91,070 |
|
|
102,844 |
|
|
106,046 |
|
|
115,706 |
|
|
Interest expense |
|
|
3,000 |
|
|
7,387 |
|
|
6,581 |
|
|
10,193 |
|
|
25,977 |
|
|
Interest and other income |
|
|
(1,985) |
|
|
(1,301) |
|
|
(2,165) |
|
|
(2,818) |
|
|
(5,887) |
|
|
Income before income taxes |
|
|
165,185 |
|
|
117,920 |
|
|
71,116 |
|
|
145,517 |
|
|
135,224 |
|
|
Provision for income taxes |
|
|
39,924 |
|
|
43,689 |
|
|
42,409 |
|
|
69,728 |
|
|
25,083 |
|
|
Net income |
|
|
125,261 |
|
|
74,231 |
|
|
28,707 |
|
|
75,789 |
|
|
110,141 |
|
|
Less: net loss attributable to non-controlling interest |
|
|
— |
|
|
(5,173) |
|
|
(2,706) |
|
|
(2,090) |
|
|
(66) |
|
|
Net income attributable to Magellan |
|
$ |
125,261 |
|
$ |
79,404 |
|
$ |
31,413 |
|
$ |
77,879 |
|
$ |
110,207 |
|
|
Net income per common share attributable to Magellan: |
|
|
|
|
|
|
|
|
|
|
|
|
|
|
|
|
|
Basic |
|
$ |
4.63 |
|
$ |
2.98 |
|
$ |
1.26 |
|
$ |
3.36 |
|
$ |
4.72 |
|
|
Diluted |
|
$ |
4.53 |
|
$ |
2.90 |
|
$ |
1.21 |
|
$ |
3.22 |
|
$ |
4.51 |
|
|
|
|
December 31, |
|
|||||||||||||
|
|
|
2013 |
|
2014 |
|
2015 |
|
2016 |
|
2017 |
|
|||||
|
Balance Sheet Data: |
|
|
|
|
|
|
|
|
|
|
|
|
|
|
|
|
|
Current assets |
|
$ |
989,358 |
|
$ |
1,140,323 |
|
$ |
1,097,682 |
|
$ |
1,319,267 |
|
$ |
1,483,353 |
|
|
Current liabilities |
|
|
476,267 |
|
|
585,840 |
|
|
724,235 |
|
|
1,092,850 |
|
|
892,303 |
|
|
Property and equipment, net |
|
|
172,333 |
|
|
171,916 |
|
|
174,745 |
|
|
172,524 |
|
|
158,638 |
|
|
Total assets |
|
|
1,759,218 |
|
|
2,068,943 |
|
|
2,069,060 |
|
|
2,443,687 |
|
|
2,957,234 |
|
|
Total debt and capital lease obligations |
|
|
26,725 |
|
|
269,841 |
|
|
257,309 |
|
|
618,379 |
|
|
853,737 |
|
|
Stockholders’ equity |
|
|
1,156,485 |
|
|
1,133,558 |
|
|
1,066,183 |
|
|
1,099,719 |
|
|
1,276,494 |
|
|
(1) |
Includes stock compensation expense of $21.3 million, $40.6 million, $50.4 million, $37.4 million and $39.1 million in 2013, 2014, 2015, 2016 and 2017, respectively. |
|
(2) |
Includes changes in fair value of contingent consideration of $6.2 million, $44.3 million, $(0.1) million and $0.7 million in 2014, 2015, 2016 and 2017, respectively. |
Item 7. Management’s Discussion and Analysis of Financial Condition and Results of Operations
The following discussion and analysis of the Company’s financial condition and results of operations should be read in conjunction with the Company’s selected financial data and the Company’s financial statements and the accompanying notes included herein. The following discussion may contain “forward‑looking statements” within the meaning of the Securities Act and the Exchange Act. When used in this Form 10‑K, the words “estimate,” “anticipate,” “expect,” “believe,” “should” and similar expressions are intended to be forward‑looking statements. Although the Company believes that its plans, intentions and expectations reflected in such forward‑looking statements are reasonable, it can give no assurance that such plans, intentions or expectations will be achieved. Prospective investors are cautioned that any such forward‑looking statements are not guarantees of future performance and involve risks and uncertainties, and that actual results may differ materially from those contemplated by such forward‑looking statements. Important factors currently known to management that could cause actual results to differ materially from those in forward‑looking statements are set forth under the heading “Risk Factors” in Item 1A and elsewhere in this Form 10‑K. Capitalized or defined terms included in this Item 7 have the meanings set forth in Item 1 of this Form 10‑K.
Business Overview
The Company is engaged in the healthcare management business, and is focused on meeting needs in areas of healthcare that are fast growing, highly complex and high cost, with an emphasis on special population management. The Company provides services to health plans and other MCOs, employers, labor unions, various military and governmental agencies, TPAs, consultants and brokers. The Company’s business is divided into three segments, based on the services it provides and/or the customers that it serves. See Item 1—“Business” for more information on the Company’s business segments.
The following tables summarize, for the periods indicated, revenues and covered lives for Healthcare by product classification and customer type (in thousands):
|
|
|
Covered lives as of |
|
||
|
|
|
December 31, 2017 |
|
||
|
|
|
Risk-based |
|
ASO |
|
|
Commercial |
|
|
|
|
|
|
Behavioral(1) |
|
14,521 |
|
11,176 |
|
|
Specialty |
|
8,890 |
|
15,583 |
|
|
Government(2) |
|
4,210 |
|
1,086 |
|
|
|
|
Revenue for the year ended |
|
|||||||
|
|
|
December 31, 2017 |
|
|||||||
|
|
|
Risk-based |
|
ASO |
|
Total |
|
|||
|
Commercial |
|
|
|
|
|
|
|
|
|
|
|
Behavioral(1) |
|
$ |
421,323 |
|
$ |
132,383 |
|
$ |
553,706 |
|
|
Specialty |
|
|
592,685 |
|
|
79,560 |
|
|
672,245 |
|
|
Government(2) |
|
|
1,883,113 |
|
|
97,213 |
|
|
1,980,326 |
|
|
Total |
|
$ |
2,897,121 |
|
$ |
309,156 |
|
$ |
3,206,277 |
|
|
(1) |
Includes revenues of $49.4 million from EAP services provided on a risk basis to health plans and employers with 10.8 million covered lives. |
|
(2) |
Includes revenues of $332.6 million from EAP services provided on a risk basis to federal governmental entities with 3.7 million covered lives. |
During 2017, Pharmacy Management paid 29.1 million adjusted commercial network claims in its PBM business, 80.7 million adjusted PBA claims and 0.1 million specialty dispensing claims. Adjusted claim totals apply a multiple of three for each 90‑day and traditional mail claim. As of December 31, 2017, Pharmacy Management had a generic dispensing rate of 87.3 percent within its commercial PBM business and served 1.9 million commercial PBM members, 13.1 million members in its medical pharmacy management programs, and 27 states and the District of Columbia in its PBA business.
Critical Accounting Policies and Estimates
The preparation of financial statements in conformity with accounting principles generally accepted in the United States requires management to make estimates and assumptions that affect the reported amounts of assets and liabilities and the disclosure of contingent assets and liabilities at the date of the financial statements and the reported amounts of revenue and expenses during the reporting period. Actual results could differ from those estimates. The Company considers the following to be its critical accounting policies and estimates:
Cost of Care, Medical Claims Payable and Other Medical Liabilities
Cost of care is recognized in the period in which members receive managed healthcare services. In addition to actual benefits paid, cost of care in a period also includes the impact of accruals for estimates of medical claims payable. Medical claims payable represents the liability for healthcare claims reported but not yet paid and claims IBNR related to the Company’s managed healthcare businesses. Such liabilities are determined by employing actuarial methods that are commonly used by health insurance actuaries and that meet actuarial standards of practice. Cost of care for the Company’s EAP contracts, which are mainly with the United States federal government, pertain to the costs to employ licensed behavioral health counselors to deliver non-medical counseling for these contracts.
The IBNR portion of medical claims payable is estimated based on past claims payment experience for member groups, enrollment data, utilization statistics, authorized healthcare services and other factors. This data is incorporated into contract‑specific actuarial reserve models and is further analyzed to create “completion factors” that represent the average percentage of total incurred claims that have been paid through a given date after being incurred. Factors that affect estimated completion factors include benefit changes, enrollment changes, shifts in product mix, seasonality influences, provider reimbursement changes, changes in claims inventory levels, the speed of claims processing and changes in paid claim levels. Completion factors are applied to claims paid through the financial statement date to estimate the ultimate claim expense incurred for the current period. Actuarial estimates of claim liabilities are then determined by subtracting the actual paid claims from the estimate of the ultimate incurred claims. For the most recent incurred months (generally the most recent two months), the percentage of claims paid for claims incurred in those months is generally low. This makes the completion factor methodology less reliable for such months. Therefore, incurred claims for any month with a completion factor that is less than 70 percent are generally not projected from historical completion and payment patterns; rather they are projected by estimating claims expense based on recent monthly estimated cost incurred per member per month times membership, taking into account seasonality influences, benefit changes and healthcare trend levels, collectively considered to be “trend factors.” For new contracts, the Company estimates IBNR based on underwriting data until it has sufficient data to utilize these methodologies.
Medical claims payable balances are continually monitored and reviewed. If it is determined that the Company’s assumptions in estimating such liabilities are significantly different than actual results, the Company’s results of operations and financial position could be impacted in future periods. Adjustments of prior period estimates may result in additional cost of care or a reduction of cost of care in the period an adjustment is made. Further, due to the considerable variability of healthcare costs, adjustments to claim liabilities occur each period and are sometimes significant as compared to the net income recorded in that period. Prior period development is recognized immediately upon the actuary’s judgment that a portion of the prior period liability is no longer needed or that additional liability should have been accrued. The following table presents the components of the change in medical claims payable for the years ended December 31, 2015, 2016 and 2017 (in thousands):
|
|
|
2015 |
|
2016 |
|
2017 |
|
|||
|
Claims payable and IBNR, beginning of period |
|
$ |
278,803 |
|
$ |
253,299 |
|
$ |
188,618 |
|
|
Cost of care: |
|
|
|
|
|
|
|
|
|
|
|
Current year |
|
|
2,297,255 |
|
|
1,892,914 |
|
|
2,421,270 |
|
|
Prior years(3) |
|
|
(22,500) |
|
|
(10,300) |
|
|
(7,500) |
|
|
Total cost of care |
|
|
2,274,755 |
|
|
1,882,614 |
|
|
2,413,770 |
|
|
Claim payments and transfers to other medical liabilities(1): |
|
|
|
|
|
|
|
|
|
|
|
Current year |
|
|
2,077,729 |
|
|
1,733,310 |
|
|
2,210,346 |
|
|
Prior years |
|
|
222,530 |
|
|
213,985 |
|
|
161,798 |
|
|
Total claim payments and transfers to other medical liabilities |
|
|
2,300,259 |
|
|
1,947,295 |
|
|
2,372,144 |
|
|
Acquisition of SWH |
|
|
— |
|
|
— |
|
|
96,398 |
|
|
Claims payable and IBNR, end of period |
|
|
253,299 |
|
|
188,618 |
|
|
326,642 |
|
|
Withhold (receivables) payable, end of period(2) |
|
|
(2,850) |
|
|
(4,482) |
|
|
983 |
|
|
Medical claims payable, end of period |
|
$ |
250,449 |
|
$ |
184,136 |
|
$ |
327,625 |
|
|
(1) |
For any given period, a portion of unpaid medical claims payable could be covered by reinvestment liability (discussed below) and may not impact the Company’s results of operations for such periods. |
|
(2) |
Medical claims payable is offset by customer withholds from capitation payments in situations in which the customer has the contractual requirement to pay providers for care incurred. |
|
(3) |
Favorable development in 2015, 2016 and 2017 was $22.5 million, $10.3 million and $7.5 million, respectively, and was mainly related to lower medical trends and faster claims completion than originally assumed. |
Actuarial standards of practice require that the claim liabilities be adequate under moderately adverse circumstances. Adverse circumstances are situations in which the actual claims experience could be higher than the otherwise estimated value of such claims. In many situations, the claims paid amount experienced will be less than the estimate that satisfies the actuarial standards of practice. Any prior period favorable cost of care development related to a lack of moderately adverse conditions is excluded from “Cost of Care—Prior Years” adjustments, as a similar provision for moderately adverse conditions is established for current year cost of care liabilities and therefore does not generally impact net income.
Care trend factors and completion factors can have a significant impact on the medical claims payable liability. The following example provides the estimated impact to the Company’s December 31, 2017 unpaid medical claims payable liability assuming hypothetical changes in care trend factors and completion factors:
|
Care Trend Factor(1) |
|
Completion Factor(2) |
|
||||||
|
(Decrease) Increase |
|
(Decrease) Increase |
|
||||||
|
Trend Factor |
|
Medical Claims Payable |
|
Completion Factor |
|
Medical Claims Payable |
|
||
|
|
|
|
(in thousands) |
|
|
|
|
(in thousands) |
|
|
−4 |
% |
$ |
(20,500) |
|
−2 |
% |
$ |
(45,000) |
|
|
−3 |
% |
|
(15,500) |
|
−1.5 |
% |
|
(34,000) |
|
|
−2 |
% |
|
(10,500) |
|
−1 |
% |
|
(22,500) |
|
|
−1 |
% |
|
(5,000) |
|
−0.5 |
% |
|
(11,500) |
|
| 1 |
% |
|
5,000 |
|
0.5 |
% |
|
11,500 |
|
| 2 |
% |
|
10,500 |
|
1 |
% |
|
23,000 |
|
| 3 |
% |
|
15,500 |
|
1.5 |
% |
|
35,000 |
|
| 4 |
% |
|
20,500 |
|
2 |
% |
|
46,500 |
|
Approximately 70 percent of IBNR dollars is based on care trend factors.
|
(1) |
Assumes a change in the care trend factor for any month that a completion factor is not used to estimate incurred claims (which is generally any month that is less than 70 percent complete). |
|
(2) |
Assumes a change in the completion factor for any month for which completion factors are used to estimate IBNR (which is generally any month that is 70 percent or more complete). |
Due to the existence of risk sharing and reinvestment provisions in certain customer contracts, a change in the estimate for medical claims payable does not necessarily result in an equivalent impact on cost of care.
The Company believes that the amount of medical claims payable is adequate to cover its ultimate liability for unpaid claims as of December 31, 2017; however, actual claims payments may differ from established estimates.
Other medical liabilities consist primarily of amounts payable to pharmacies for claims that have been adjudicated by the Company but not yet paid. Other medical liabilities also include “reinvestment” payables under certain managed healthcare contracts with Medicaid customers and “profit share” payables under certain risk‑based contracts. Under a contract with reinvestment features, if the cost of care is less than certain minimum amounts specified in the contract (usually as a percentage of revenue), the Company is required to “reinvest” such difference in behavioral healthcare programs when and as specified by the customer or to pay the difference to the customer for their use in funding such programs. Under a contract with profit share provisions, if the cost of care is below certain specified levels, the Company will “share” the cost savings with the customer at the percentages set forth in the contract. In addition, certain contracts include provisions to provide the Company additional funding if the cost of care is above the specified levels.
Goodwill
The Company is required to test its goodwill for impairment on at least an annual basis. The Company has selected October 1 as the date of its annual impairment test. The goodwill impairment test is a two‑step process that requires management to make judgments in determining what assumptions to use in the calculation. The first step of the process consists of estimating the fair value of each reporting unit with goodwill based on various valuation techniques, with the primary technique being a discounted cash flow analysis, which requires the input of various assumptions with respect to revenues, operating margins, growth rates and discount rates. The estimated fair value for each reporting unit is compared to the carrying value of the reporting unit, which includes goodwill. If the estimated fair value is less than the carrying value, a second step is performed to compute the amount of the impairment by determining an “implied fair value” of goodwill. The determination of a reporting unit’s “implied fair value” of goodwill requires the Company to allocate the estimated fair value of the reporting unit to the assets and liabilities of the reporting unit. Any unallocated fair value represents the “implied fair value” of goodwill, which is compared to its corresponding carrying value.
Goodwill is tested for impairment at a level referred to as a reporting unit, with the Company’s reporting units with goodwill as of December 31, 2017 comprised of Commercial, Government and Pharmacy Management.
The fair value of the Commercial (a component of the Healthcare segment), Government (a component of the Healthcare segment) and Pharmacy Management reporting units were determined using a discounted cash flow method. This method involves estimating the present value of estimated future cash flows utilizing a risk adjusted discount rate. Key assumptions for this method include cash flow projections, terminal growth rates and discount rates.
Goodwill for each of the Company’s reporting units with goodwill at December 31, 2016 and 2017 were as follows (in thousands):
|
|
|
|
|
|
|
||
|
|
|
2016 |
|
2017 |
|
||
|
Commercial |
|
$ |
242,255 |
|
$ |
242,255 |
|
|
Government |
|
|
108,321 |
|
|
368,612 |
|
|
Pharmacy Management |
|
|
391,478 |
|
|
395,421 |
|
|
Total |
|
$ |
742,054 |
|
$ |
1,006,288 |
|
The changes in the carrying amount of goodwill for the years ended December 31, 2016 and 2017 are reflected in the table below (in thousands):
|
|
|
|
|
|
|
||
|
|
|
2016 |
|
2017 |
|
||
|
Balance as of beginning of period |
|
$ |
621,390 |
|
$ |
742,054 |
|
|
Acquisition of AFSC |
|
|
76,736 |
|
|
— |
|
|
Acquisition of Veridicus |
|
|
30,705 |
|
|
1,647 |
|
|
Acquisition of SWH |
|
|
— |
|
|
260,139 |
|
|
Other acquisitions and measurement period adjustments |
|
|
13,223 |
|
|
2,448 |
|
|
Balance as of end of period |
|
$ |
742,054 |
|
$ |
1,006,288 |
|
Income Taxes
The Company estimates income taxes for each of the jurisdictions in which it operates. This process involves determining both permanent and temporary differences resulting from differing treatment for tax and book purposes. Deferred tax assets and/or liabilities are determined by multiplying the temporary differences between the financial reporting and tax reporting bases for assets and liabilities by the enacted tax rates expected to be in effect when such differences are recovered or settled. The Company then assesses the likelihood that the deferred tax assets will be recovered from the reversal of temporary differences, the implementation of feasible and prudent tax planning strategies, and future taxable income. To the extent the Company cannot conclude that recovery is more likely than not, it establishes a valuation allowance. The effect of a change in tax rates on deferred taxes is recognized in income in the period that includes the enactment date.
Determination of the amount of deferred tax assets considered realizable requires significant judgment and estimation regarding the forecasts of future taxable income which are consistent with the plans and estimates the Company uses to manage the underlying businesses. Although consideration is also given to potential tax planning strategies which might be available to improve the realization of deferred tax assets, none were identified which were both prudent and reasonable. Future changes in the estimated realizable portion of deferred tax assets could materially affect the Company’s financial condition and results of operations.
On December 22, 2017, the President of the United States signed into law the “Tax Cuts and Jobs Act” (the “Tax Act”). The legislation includes a number of changes to existing U.S. tax laws that impact the Company, most notably a reduction of the U.S. corporate income tax rate from 35 percent to 21 percent, effective January 1, 2018. The legislation also provides for the acceleration of depreciation on certain assets placed in service after September 27, 2017, as well as prospective changes beginning in 2018, including additional limitations on the deduction of executive compensation.
The SEC staff issued Staff Accounting Bulletin No. 118 (“SAB 118”) on December 22, 2017 to address the application of U.S. GAAP in situations when a registrant does not have the necessary information available, prepared, or analyzed (including computations) in reasonable detail to complete the accounting for certain income tax effects of the Tax Act. SAB 118 allows registrants to determine a reasonable estimate to be included as provisional amounts and provides a measurement period by which the accounting must be completed.
The measurement period ends when a registrant has obtained, prepared, and analyzed the information that was needed in order to complete the accounting requirements under ASC Topic 740 but under no circumstances is the measurement period to extend beyond one year from the enactment date (i.e. December 22, 2018). The Company has recognized the provisional tax impacts related to the re-measurement of deferred tax assets and liabilities and included these amounts in its consolidated financial statements for the year ended December 31, 2017. The Company will continue to analyze the Tax Act and additional technical and interpretive guidance on the Tax Act from the government and will complete its accounting no later than December 22, 2018.
The Company did not identify any items for which a reasonable estimate of the income tax effects of the Tax Act could not be determined as of December 31, 2017. However, the Company has recognized the provisional tax impacts related to the remeasurement of deferred tax assets and liabilities and included these amounts in its consolidated financial statements for the year ended December 31, 2017. The ultimate impact may differ from these provisional amounts, possibly materially, due to, among other things, additional analysis, changes in interpretations and assumptions the Company has made, additional regulatory guidance that may be issued, and actions the Company may take as a result of the Tax Act. Additionally, any changes to the tax basis for temporary differences between the estimates in these statements and the 2017 federal return filed by the Company will result in a corresponding adjustment to the remeasurement of deferred taxes as of the enactment date of the Tax Act. Any such adjustments will be recorded to tax expense in the quarter of 2018 when the analysis is complete.
The tax benefit from an uncertain tax position is recognized when it is more likely than not that, based on the technical merits, the position will be sustained by the taxing authorities upon examination, including resolution of related appeals or litigation processes. Significant judgment is required in determining the Company’s uncertain tax positions. Accruals for uncertain tax positions are established using the Company’s best judgment and adjustments are made, as warranted, due to changing facts and circumstances. The ultimate resolution of a disputed tax position following an examination by a taxing authority could result in a payment that is materially different from that accrued by the Company.
Results of Operations
The accounting policies of the Company’s segments are the same as those described in Note 1—“General.” The Company evaluates performance of its segments based on profit or loss from operations before stock compensation expense, depreciation and amortization, interest expense, interest and other income, changes in the fair value of contingent consideration recorded in relation to acquisitions, gain on sale of assets, special charges or benefits, and income taxes (“Segment Profit”). Management uses Segment Profit information for internal reporting and control purposes and considers it important in making decisions regarding the allocation of capital and other resources, risk assessment and employee compensation, among other matters. Healthcare subcontracts with Pharmacy Management to provide pharmacy benefits management services for certain of Healthcare’s customers. In addition, Pharmacy Management provides pharmacy benefits management for the Company’s employees covered under its medical plan. As such, revenue, cost of goods sold and direct service costs and other related to these arrangements are eliminated.
The following tables summarize, for the periods indicated, operating results by business segment (in thousands):
|
|
|
|
|
|
|
|
|
Corporate |
|
|
|
|
|
|
|
|
|
|
|
Pharmacy |
|
and |
|
|
|
|
||
|
|
|
Healthcare |
|
Management |
|
Elimination |
|
Consolidated |
|
||||
|
Year Ended December 31, 2015 |
|
|
|
|
|
|
|
|
|
|
|
|
|
|
Managed care and other revenue |
|
$ |
2,959,252 |
|
$ |
238,456 |
|
$ |
(63) |
|
$ |
3,197,645 |
|
|
PBM and dispensing revenue |
|
|
— |
|
|
1,510,180 |
|
|
(110,425) |
|
|
1,399,755 |
|
|
Cost of care |
|
|
(2,274,755) |
|
|
— |
|
|
— |
|
|
(2,274,755) |
|
|
Cost of goods sold |
|
|
— |
|
|
(1,427,680) |
|
|
105,803 |
|
|
(1,321,877) |
|
|
Direct service costs and other (1) |
|
|
(510,811) |
|
|
(284,968) |
|
|
(26,613) |
|
|
(822,392) |
|
|
Stock compensation expense (1) |
|
|
8,502 |
|
|
36,351 |
|
|
5,531 |
|
|
50,384 |
|
|
Changes in fair value of contingent consideration (1) |
|
|
(1,404) |
|
|
45,661 |
|
|
— |
|
|
44,257 |
|
|
Less: non-controlling interest segment profit (loss) (2) |
|
|
(2,439) |
|
|
— |
|
|
(195) |
|
|
(2,634) |
|
|
Segment profit (loss) |
|
$ |
183,223 |
|
$ |
118,000 |
|
$ |
(25,572) |
|
$ |
275,651 |
|
|
|
|
|
|
|
|
|
|
Corporate |
|
|
|
|
|
|
|
|
|
|
|
Pharmacy |
|
and |
|
|
|
|
||
|
|
|
Healthcare |
|
Management |
|
Elimination |
|
Consolidated |
|
||||
|
Year Ended December 31, 2016 |
|
|
|
|
|
|
|
|
|
|
|
|
|
|
Managed care and other revenue |
|
$ |
2,659,685 |
|
$ |
243,561 |
|
$ |
(304) |
|
$ |
2,902,942 |
|
|
PBM and dispensing revenue |
|
|
— |
|
|
2,053,188 |
|
|
(119,246) |
|
|
1,933,942 |
|
|
Cost of care |
|
|
(1,882,614) |
|
|
— |
|
|
— |
|
|
(1,882,614) |
|
|
Cost of goods sold |
|
|
— |
|
|
(1,933,086) |
|
|
114,366 |
|
|
(1,818,720) |
|
|
Direct service costs and other (1) |
|
|
(573,706) |
|
|
(261,570) |
|
|
(41,336) |
|
|
(876,612) |
|
|
Stock compensation expense (1) |
|
|
4,440 |
|
|
20,509 |
|
|
12,473 |
|
|
37,422 |
|
|
Changes in fair value of contingent consideration (1) |
|
|
(231) |
|
|
127 |
|
|
— |
|
|
(104) |
|
|
Impairment of intangible assets (1) |
|
|
4,800 |
|
|
— |
|
|
— |
|
|
4,800 |
|
|
Less: non-controlling interest segment profit (loss) (2) |
|
|
(567) |
|
|
— |
|
|
(170) |
|
|
(737) |
|
|
Segment profit (loss) |
|
$ |
212,941 |
|
$ |
122,729 |
|
$ |
(33,877) |
|
$ |
301,793 |
|
|
|
|
|
|
|
|
|
|
Corporate |
|
|
|
|
|
|
|
|
|
|
|
Pharmacy |
|
and |
|
|
|
|
||
|
|
|
Healthcare |
|
Management |
|
Elimination |
|
Consolidated |
|
||||
|
Year Ended December 31, 2017 |
|
|
|
|
|
|
|
|
|
|
|
|
|
|
Managed care and other revenue |
|
$ |
3,206,277 |
|
$ |
273,489 |
|
$ |
(584) |
|
$ |
3,479,182 |
|
|
PBM and dispensing revenue |
|
|
— |
|
|
2,491,044 |
|
|
(131,643) |
|
|
2,359,401 |
|
|
Cost of care |
|
|
(2,413,770) |
|
|
— |
|
|
— |
|
|
(2,413,770) |
|
|
Cost of goods sold |
|
|
— |
|
|
(2,341,979) |
|
|
130,069 |
|
|
(2,211,910) |
|
|
Direct service costs and other (1) |
|
|
(601,201) |
|
|
(302,525) |
|
|
(38,157) |
|
|
(941,883) |
|
|
Stock compensation expense (1) |
|
|
10,689 |
|
|
19,881 |
|
|
8,546 |
|
|
39,116 |
|
|
Changes in fair value of contingent consideration (1) |
|
|
696 |
|
|
— |
|
|
— |
|
|
696 |
|
|
Less: non-controlling interest segment profit (loss) (2) |
|
|
(56) |
|
|
— |
|
|
(3) |
|
|
(59) |
|
|
Segment profit (loss) |
|
$ |
202,747 |
|
$ |
139,910 |
|
$ |
(31,766) |
|
$ |
310,891 |
|
|
(1) |
Stock compensation expense, changes in the fair value of contingent consideration recorded in relation to the acquisitions and impairment of intangible assets are included in direct service costs and other operating expenses; however, these amounts are excluded from the computation of Segment Profit. |
|
(2) |
The non‑controlling interest portion of AlphaCare’s segment profit (loss) is excluded from the computation of Segment Profit. |
The following table reconciles consolidated income before income taxes to Segment Profit for the years ended December 31, 2015, 2016 and 2017 (in thousands):
|
|
|
2015 |
|
2016 |
|
2017 |
|
|||
|
Income before income taxes |
|
$ |
71,116 |
|
$ |
145,517 |
|
$ |
135,224 |
|
|
Stock compensation expense |
|
|
50,384 |
|
|
37,422 |
|
|
39,116 |
|
|
Changes in fair value of contingent consideration |
|
|
44,257 |
|
|
(104) |
|
|
696 |
|
|
Impairment of intangible assets |
|
|
— |
|
|
4,800 |
|
|
— |
|
|
Non-controlling interest segment profit (loss) |
|
|
2,634 |
|
|
737 |
|
|
59 |
|
|
Depreciation and amortization |
|
|
102,844 |
|
|
106,046 |
|
|
115,706 |
|
|
Interest expense |
|
|
6,581 |
|
|
10,193 |
|
|
25,977 |
|
|
Interest and other income |
|
|
(2,165) |
|
|
(2,818) |
|
|
(5,887) |
|
|
Segment Profit |
|
$ |
275,651 |
|
$ |
301,793 |
|
$ |
310,891 |
|
Year ended December 31, 2017 (“2017”) compared to the year ended December 31, 2016 (“2016”)
Healthcare
Net Revenue
Net revenue related to Healthcare increased by 20.6 percent or $546.6 million from 2016 to 2017. The increase in revenue is mainly due to higher membership and net favorable rate changes of $220.5 million, contracts implemented after (or during) 2016 of $210.8 million, revenue for Senior Whole Health acquired on October 31, 2017 of $186.6 million, revenue for AFSC acquired on July 1, 2016 of $92.3 million, net retroactive program changes recorded in 2017 of $23.3 million, revenue for TMG acquired February 29, 2016 of $8.5 million, retroactive profit share in 2017 of $2.6 million, customer settlements in 2017 of $2.0 million and retroactive rate adjustments in 2017 of $1.5 million. These increases were partially offset by terminated contracts of $139.9 million, net revenue recorded for the Patient Protection and Affordable Care Act health insurer fee (“HIF”) in 2016 of $44.0 million, program changes of $5.5 million, performance penalty in 2017 of $4.6 million, the revenue impact of net favorable prior period medical claims development recorded in 2017 of $4.1 million, favorable retroactive rate adjustments recorded in 2016 of $3.3 million and other net decreases of $0.1 million.
Cost of Care
Cost of care increased by 28.2 percent or $531.2 million from 2016 to 2017. The increase in cost of care is primarily due to new contracts implemented after (or during) 2016 of $197.2 million, increased membership and higher care associated with net favorable rate changes of $187.6 million, care cost for Senior Whole Health acquired on October 31, 2017 of $158.9 million, care cost for AFSC acquired on July 1, 2016 of $77.5 million, net retroactive program changes recorded in 2017 of $21.2 million, net favorable prior period medical claims development recorded in 2016 of $10.3 million, litigation settlements in 2017 of $3.0 million and other net unfavorable variances of $15.3 million. These increases were partially offset by terminated contracts of $109.1 million, favorable customer settlements of $11.1 million, net favorable prior period medical claims development recorded in 2017 of $7.5 million, program changes of $6.4 million and favorable 2016 medical claims development recorded after 2016 of $5.7 million. For our commercial contracts, cost of care as a percentage of risk revenue (excluding EAP business) increased from 82.1 percent in 2016 to 86.1 percent in 2017, mainly due to unfavorable care trends. For our government contracts, cost of care increased as a percentage of risk revenue (excluding EAP business) from 81.8 percent in 2016 to 85.2 percent in 2017, mainly due to business mix and increased revenue due to HIF fees in 2016.
Direct Service Costs
Direct service costs increased by 4.8 percent or $27.5 million from 2016 to 2017 primarily due to costs related to TMG, AFSC, and Senior Whole Health, new business and contract implementation costs, partially offset by terminated contracts, an impairment of intangible assets in 2016 and HIF fees in 2016. Direct service costs decreased as a percentage of revenue from 21.6 percent in 2016 to 18.8 percent in 2017, mainly due to an increase in revenue from business growth and acquisition activity, partially offset by terminated contracts and the acquisitions of TMG, AFSC and Senior Whole Health.
Pharmacy Management
Managed Care and Other Revenue
Managed care and other revenue related to Pharmacy Management increased by 12.3 percent or $29.9 million from 2016 to 2017. This increase is primarily due to Medical pharmacy revenue of $11.7 million, new contracts implemented after (or during) 2016 of $8.3 million, increased rebate revenue of $6.2 million, revenue for Veridicus acquired on December 13, 2016 of $4.8 million and other net favorable variances of $2.1 million. These increases were partially offset by terminated contracts of $3.2 million.
PBM and Dispensing Revenue
PBM and dispensing revenue related to Pharmacy Management increased by 21.3 percent or $437.9 million from 2016 to 2017. This increase is primarily due to Medicare revenue of $238.5 million, new contracts implemented after (or during) 2016 of $210.2 million, revenue for Veridicus acquired on December 13, 2016 of $173.9 million, pharmacy employer revenue of $49.7 million, pharmacy MCO revenue of $25.1 million, government pharmacy revenue of $11.1 million and other net favorable variances of $1.2 million. These increases were partially offset by terminated contracts of $252.9 million and net decreased dispensing activity from existing customers of $18.9 million.
Cost of Goods Sold
Cost of goods sold increased by 21.2 percent or $408.9 million from 2016 to 2017. This increase is primarily due to an increase in Medicare of $233.8 million, new contracts implemented after (or during) 2016 of $207.5 million, Veridicus acquired on December 13, 2016 of $159.8 million, an increase in pharmacy employer of $40.5 million, an increase in pharmacy MCO of $21.1 million, government pharmacy of $10.9 million and other net unfavorable variances of $3.9 million. These increases were partially offset by terminated contracts of $247.3 million and net decreased dispensing activity from existing customers of $21.3 million. As a percentage of the portion of net revenue that relates to PBM and dispensing activity, cost of goods sold decreased from 94.2 percent in 2016 to 94.0 percent in 2017, mainly due to increases in rebate and medical pharmacy revenue.
Direct Service Costs
Direct service costs increased by 15.7 percent or $41.0 million from 2016 to 2017. This increase is mainly due to the acquisition of Veridicus, contract implementation costs and ongoing costs to support new business. As a percentage of revenue, direct service costs decreased from 11.4 percent in 2016 to 10.9 percent in 2017, mainly due to an increase in revenue from business growth and acquisitions and a decrease in stock compensation expense.
Corporate and Elimination
Net expenses related to Corporate, which includes eliminations, decreased by 13.3 percent or $6.2 million, primarily due to lower stock compensation expense and discretionary benefits in 2017, partially offset by a litigation settlement in 2017. As a percentage of revenue, corporate and elimination decreased from 1.0 percent in 2016 to 0.7 percent in 2017, mainly due to higher revenue due to acquisitions and new business, lower discretionary benefits and stock compensation expenses.
Depreciation and Amortization
Depreciation and amortization expense increased by 9.1 percent or $9.7 million from 2016 to 2017, primarily due to asset additions after 2016 and acquisition activity.
Interest Expense
Interest expense increased by $15.8 million from 2016 to 2017 mainly due to an increase in interest rates, an increase in the amount of outstanding debt and higher amortization cost related to debt financing.
Interest and Other Income
Interest and other income increased by $3.1 million from 2016 to 2017 primarily due to higher yields and invested balances.
Income Taxes
The Company’s effective income tax rate was 47.9 percent in 2016 and 18.6 percent in 2017. These rates differ from the 2017 federal statutory income tax rate primarily due to state income taxes, remeasurement of deferred tax balances due to the Tax Act, permanent differences between book and tax income, and changes to the valuation allowances. The Company also accrues interest and penalties related to uncertain tax positions in its provision for income taxes. The effective income tax rate for 2017 was lower than 2016 mainly due to suspension for 2017 of the non-deductible HIF fees, reversal of valuation allowances in 2017 of AlphaCare net operating loss carryforwards (“NOLs”) as a result of a change in judgment about their realizability due to planned internal restructuring as a result of the acquisition of SWH, re-measurement of deferred tax balances as a result of the Tax Act, and more significant excess tax deductions from equity compensation in 2017.
The statutes of limitations regarding the assessment of federal and most state and local income taxes for 2013 expired during 2017. As a result, $3.0 million of tax contingency reserves recorded as of December 31, 2016 were reversed in 2017, of which $2.0 million was reflected as a reduction to income tax expense and $1.0 million as a decrease to deferred tax assets. Additionally, $0.2 million of accrued interest was reversed in 2017 and reflected as a reduction to income tax expense due to the closing of statutes of limitations on tax assessments.
The statutes of limitations regarding the assessment of federal and most state and local income taxes for 2012 expired during 2016. As a result, $2.2 million of tax contingency reserves recorded as of December 31, 2015 were reversed in 2016, of which $1.5 million was reflected as a reduction to income tax expense and $0.7 million as a decrease to deferred tax assets. Additionally, $0.1 million of accrued interest was reversed in 2016 and reflected as a reduction to income tax expense due to the closing of statutes of limitations on tax assessments.
2016 compared to the year ended December 31, 2015 (“2015”)
Healthcare
Net Revenue
Net revenue related to Healthcare decreased by 10.1 percent or $299.6 million from 2015 to 2016. The decrease in revenue is mainly due to terminated contracts of $665.8 million, unfavorable rate changes of $58.8 million, program changes of $54.3 million, profit share of $8.0 million and other net decreases of $0.3 million. These decreases were partially offset by increased membership from existing customers of $311.4 million, revenue for AFSC acquired on July 1, 2016 of $88.0 million, contracts implemented after (or during) 2015 of $43.1 million, revenue for TMG acquired February 29, 2016 of $41.8 million and favorable retroactive rate adjustments recorded in 2016 of $3.3 million.
Cost of Care
Cost of care decreased by 17.2 percent or $392.1 million from 2015 to 2016. The decrease in cost of care is primarily due to terminated contracts of $571.9 million, lower care associated with unfavorable rate changes of $64.2 million, program changes of $47.5 million, favorable 2015 medical claims development recorded after 2015 of $16.7 million, net favorable prior period medical claims development recorded in 2016 of $10.3 million and care trends and other net favorable variances of $69.1 million. These decreases were partially offset by increased membership from existing customers of $282.5 million, care costs for AFSC acquired on July 1, 2016 of $56.2 million, new contracts implemented after (or during) 2015 of $26.4 million and favorable prior period medical claims development recorded in 2015 of $22.5 million. For our commercial contracts, cost of care as a percentage of risk revenue (excluding EAP business) was 82.1 percent in 2016 which was consistent with 2015. For our government contracts, cost of care decreased as a percentage of risk revenue (excluding EAP business) from 88.1 percent in 2015 to 81.8 percent in 2016, mainly due to business mix, favorable care development and favorable care trends.
Direct Service Costs
Direct service costs increased by 12.3 percent or $62.9 million from 2015 to 2016 primarily due to costs related to TMG and AFSC and a $4.8 million impairment of intangible assets, partially offset by the impact of terminated contracts, as well as severance and other contract termination cost of $3.8 million recorded in 2015. Direct service costs increased as a percentage of revenue from 17.3 percent in 2015 to 21.6 percent in 2016, mainly due to acquisitions and new business, partially offset by terminated contracts.
Pharmacy Management
Managed Care and Other Revenue
Managed care and other revenue related to Pharmacy Management increased by 2.1 percent or $5.1 million from 2015 to 2016. This increase is primarily due to new contracts implemented after (or during) 2015 of $5.9 million, government pharmacy revenue of $3.8 million and other net favorable variances of $3.2 million. These increases were partially offset by decreased rebate revenue of $6.7 million and terminated contracts of $1.1 million.
PBM and Dispensing Revenue
PBM and dispensing revenue related to Pharmacy Management increased by 36.0 percent or $543.0 million from 2015 to 2016. This increase is primarily due to new contracts implemented after (or during) 2015 of $457.5 million, revenue for 4D acquired on April 1, 2015 of $107.5 million, pharmacy employer revenue of $89.4 million, revenue for Veridicus acquired on December 13, 2016 of $7.5 million and other net favorable variances of $2.4 million. These increases were partially offset by terminated contracts of $108.5 million and net decreased dispensing activity from existing customers of $12.8 million.
Cost of Goods Sold
Cost of goods sold increased by 35.4 percent or $505.4 million from 2015 to 2016. This increase is primarily due to new contracts implemented after (or during) 2015 of $451.3 million, 4D acquired April 1, 2015 of $103.9 million, an increase in pharmacy employer of $60.4 million, Veridicus acquired on December 13, 2016 of $6.9 million and other net unfavorable variances of $5.6 million. These increases were partially offset by terminated contracts of $107.9 million and net decreased dispensing activity from existing customers of $14.8 million. As a percentage of the portion of net revenue that relates to PBM and dispensing activity, cost of goods sold decreased from 94.5 percent in 2015 to 94.2 percent in 2016, mainly due to business mix.
Direct Service Costs
Direct service costs decreased by 8.2 percent or $23.4 million from 2015 to 2016. This decrease mainly relates to changes in the fair value of contingent consideration related to the CDMI and 4D acquisitions of $45.5 million in 2015 and lower stock compensation expense of $14.6 million, which decreases were partially offset by additional costs from the acquisitions of 4D and Veridicus, contract implementation costs and ongoing costs to support new business. As a percentage of revenue, direct service costs decreased from 16.3 percent in 2015 to 11.4 percent in 2016, mainly due to an increase in revenue from business growth and acquisitions and the decrease in expense for fair value of contingent consideration and stock compensation expense.
Corporate and Elimination
Net expenses related to Corporate, which includes eliminations, increased by 48.6 percent or $15.2 million, primarily due to higher project costs, stock compensation expense and discretionary benefits in 2016. As a percentage of revenue, corporate and elimination increased from 0.7 percent in 2015 to 1.0 percent in 2016, mainly due to higher project cost and discretionary benefits, partially offset by higher revenue due to acquisitions and new business.
Depreciation and Amortization
Depreciation and amortization expense increased by 3.1 percent or $3.2 million from 2015 to 2016, primarily due to asset additions after 2015 and acquisition activity.
Interest Expense
Interest expense increased by $3.6 million from 2015 to 2016 mainly due to an increase in interest rates and the amount of outstanding debt.
Interest and Other Income
Interest and other income increased by $0.7 million from 2015 to 2016 primarily due to higher yields.
Income Taxes
The Company’s effective income tax rate was 59.6 percent in 2015 and 47.9 percent in 2016. These rates differ from the federal statutory income tax rate primarily due to state income taxes, permanent differences between book and tax income, and changes to recorded tax contingencies and valuation allowances. The Company also accrues interest and penalties related to uncertain tax positions in its provision for income taxes. The effective income tax rate for 2016 was lower than 2015 mainly due to (i) improved results at AlphaCare which reduced the valuation allowance added in 2016 compared to 2015, and (ii) a less significant impact in 2016 from the non‑deductible HIF fees due to greater overall income.
The statutes of limitations regarding the assessment of federal and most state and local income taxes for 2012 expired during 2016. As a result, $2.2 million of tax contingency reserves recorded as of December 31, 2015 were reversed in 2016, of which $1.5 million was reflected as a reduction to income tax expense and $0.7 million as a decrease to deferred tax assets. Additionally, $0.1 million of accrued interest was reversed in 2016 and reflected as a reduction to income tax expense due to the closing of statutes of limitations on tax assessments.
The statutes of limitations regarding the assessment of federal and most state and local income taxes for 2011 expired during 2015. As a result, $3.1 million of tax contingency reserves recorded as of December 31, 2014 were reversed in 2015, of which $2.0 million was reflected as a reduction to income tax expense, $1.0 million as a decrease to deferred tax assets, and the remainder as an increase to additional paid‑in capital. Additionally, $0.4 million of accrued interest and $0.7 million of state tax contingency reserves were reversed in 2015 and reflected as reductions to income tax expense due to the closing of statutes of limitations on tax assessments and the favorable settlement of state income tax examinations.
Non‑GAAP Measures
The Company reports its financial results in accordance with GAAP, however the Company’s management also assesses business performance and makes business decisions regarding the Company’s operations using certain non‑GAAP measures. In addition to Segment Profit, as defined above, the Company also uses adjusted net income attributable to Magellan (“Adjusted Net Income”) and adjusted net income per common share attributable to Magellan on a diluted basis (“Adjusted EPS”). Adjusted Net Income and Adjusted EPS reflect certain adjustments made for acquisitions completed after January 1, 2013 to exclude non‑cash stock compensation expense resulting from restricted stock purchases by sellers, changes in the fair value of contingent consideration, amortization of identified acquisition intangibles, as well as impairment of identified acquisition intangibles. The Company believes these non‑GAAP measures provide a more useful comparison of the Company’s underlying business performance from period to period and are more representative of the earnings capacity of the Company. Non‑GAAP financial measures we disclose, such as Segment Profit, Adjusted Net Income and Adjusted EPS, should not be considered a substitute for, or superior to, financial measures determined or calculated in accordance with GAAP.
The following table reconciles net income attributable to Magellan. to Adjusted Net Income for the years ended December 31, 2015, 2016, and 2017 (in thousands):
|
|
|
|
|
|
|
|
|
|
|
|
|
|
|
|
|
|
|
|
|
|
|
|
|
|
|
2015 |
|
2016 |
|
2017 |
|
|||
|
Net income attributable to Magellan |
|
$ |
31,413 |
|
$ |
77,879 |
|
$ |
110,207 |
|
|
Adjusted for acquisitions starting in 2013 |
|
|
|
|
|
|
|
|
|
|
|
Stock compensation expense relating to acquisitions |
|
|
32,235 |
|
|
19,181 |
|
|
16,215 |
|
|
Changes in fair value of contingent consideration |
|
|
44,257 |
|
|
(104) |
|
|
696 |
|
|
Amortization of acquired intangibles |
|
|
21,371 |
|
|
25,324 |
|
|
37,265 |
|
|
Impairment of intangible assets, net of non-controlling interest |
|
|
— |
|
|
3,936 |
|
|
— |
|
|
Tax impact |
|
|
(37,501) |
|
|
(16,676) |
|
|
(19,558) |
|
|
Adjusted Net Income |
|
$ |
91,775 |
|
$ |
109,540 |
|
$ |
144,825 |
|
The following table reconciles net income per common share attributable to Magellan—diluted to Adjusted EPS for the years ended December 31, 2015, 2016, and 2017:
|
|
|
|
|
|
|
|
|
|
|
|
|
|
|
|
|
|
|
|
|
|
|
|
|
|
|
2015 |
|
2016 |
|
2017 |
|
|||
|
Net income per common share attributable to Magellan—diluted |
|
$ |
1.21 |
|
$ |
3.22 |
|
$ |
4.51 |
|
|
Adjusted for acquisitions starting in 2013 |
|
|
|
|
|
|
|
|
|
|
|
Stock compensation expense relating to acquisitions |
|
|
1.25 |
|
|
0.79 |
|
|
0.66 |
|
|
Changes in fair value of contingent consideration |
|
|
1.71 |
|
|
— |
|
|
0.03 |
|
|
Amortization of acquired intangibles |
|
|
0.83 |
|
|
1.05 |
|
|
1.52 |
|
|
Impairment of intangible assets, net of non-controlling interest |
|
|
— |
|
|
0.16 |
|
|
— |
|
|
Tax impact |
|
|
(1.45) |
|
|
(0.69) |
|
|
(0.80) |
|
|
Adjusted EPS |
|
$ |
3.55 |
|
$ |
4.53 |
|
$ |
5.92 |
|
Outlook—Results of Operations
The Company’s Segment Profit and net income are subject to significant fluctuations from period to period. These fluctuations may result from a variety of factors such as those set forth under Item 1A—“Risk Factors” as well as a variety of other factors including: (i) changes in utilization levels by enrolled members of the Company’s risk‑based contracts, including seasonal utilization patterns; (ii) contractual adjustments and settlements; (iii) retrospective membership adjustments; (iv) timing of implementation of new contracts, enrollment changes and contract terminations; (v) pricing adjustments upon contract renewals (and price competition in general); (vi) the timing of acquisitions; (vii) changes in estimates regarding medical costs and IBNR; (viii) the timing of recognition of pharmacy revenues, including rebates and Medicare Part D; and (ix) changes in the estimates of contingent consideration.
A portion of the Company’s business is subject to rising care costs due to an increase in the number and frequency of covered members seeking healthcare services and higher costs of such services. Many of these factors are beyond the Company’s control. Future results of operations will be heavily dependent on management’s ability to obtain customer rate increases that are consistent with care cost increases and/or to reduce operating expenses.
Care Trends. The Company expects that same‑store normalized cost of care trend for the 12 month forward outlook to be 3 to 7 percent for commercial products and 0 to 2 percent for government business.
Interest Rate Risk. Changes in interest rates affect interest income earned on the Company’s cash equivalents and investments, as well as interest expense on variable interest rate borrowings under the 2017 Credit Agreement. In addition, interest rates on the Notes are subject to adjustment upon the occurrence of certain credit rating events. Based on the amount of cash equivalents and investments and the borrowing levels under the 2017 Credit Agreement and the principal amount of the Notes as of December 31, 2017, a hypothetical 10 percent increase or decrease in the interest rate associated with these instruments, with all other variables held constant, would not materially affect the Company’s future earnings and cash outflows.
Historical—Liquidity and Capital Resources
2017 compared to 2016
Operating Activities. The Company reported net cash provided by operating activities of $66.7 million and $162.3 million for 2016 and 2017, respectively. The $95.6 million increase in operating cash flows from 2016 to 2017 is mainly attributable to favorable working capital changes and an increase in Segment Profit partially offset by increased tax payments between years.
The net favorable impact of working capital changes between periods totaled $91.5 million. For 2016, operating cash flows were impacted by net unfavorable working capital changes of $180.7 million, which were largely attributable to contingent consideration payments of $91.7 million, of which $51.1 million is reflected as operating activities, working capital changes of approximately $113.8 million related to our Medicare Part D business, primarily receivables, and other net unfavorable working capital changes due to timing related to receivables and payables. For 2017, operating cash flows were impacted by net unfavorable working capital changes of $89.2 million, which were largely attributable to timing related to receivables and payables.
Segment Profit for 2017 increased $9.1 million from 2016. Tax payments for 2017 increased $5.0 million from 2016.
Investing Activities. The Company utilized $60.9 million and $57.2 million during 2016 and 2017, respectively, for capital expenditures. The additions related to hard assets (equipment, furniture, and leaseholds) and capitalized software for 2016 were $15.2 million and $45.7 million, respectively, as compared to additions for 2017 related to hard assets and capitalized software of $16.0 million and $41.2 million, respectively.
During 2016 the Company received net cash of $15.8 million from the net maturity of "available-for-sale" securities, with the Company using $26.8 million during 2017 for the net purchase of "available-for-sale" securities. During 2016, the Company used net cash of $16.0 million, $110.9 million and $72.8 million for the acquisition of TMG, AFSC and Veridicus, respectively, partially offset by a working capital adjustment of $0.5 million related to the acquisition of 4D Pharmacy Management Systems, Inc. During 2017, the Company used net cash of $232.4 million related to investments in businesses and the acquisition of Veridicus and SWH.
Financing Activities. During 2016, the Company paid $106.8 million for the repurchase of treasury stock under the Company’s share repurchase program, $15.6 million on debt obligations and $5.3 million on capital lease obligations. The Company made a contingent consideration payment totaling $91.7 million, of which $40.6 million was related to financing activities. In addition, the Company received $375.0 million from the issuance of debt, $25.2 million from exercise of stock options, and had other net favorable items of $1.2 million.
During 2017, the Company paid $798.1 million on debt obligations, $21.8 million for the repurchase of treasury stock under the Company's share repurchase program, $9.9 million in debt issuance fees, $5.3 million on capital lease obligations and had other net unfavorable items of $2.7 million. In addition, the Company received $1,041.7 million from the issuance of debt and $44.4 million from the exercise of stock options.
2016 compared to 2015
Operating Activities. The Company reported net cash provided by operating activities of $157.5 million and $66.7 million for 2015 and 2016, respectively. The $90.8 million decrease in operating cash flows from 2015 to 2016 is attributable to unfavorable working capital changes offset by an increase in Segment Profit and lower tax payments between years.
The net unfavorable impact of working capital changes between years totaled $126.4 million. For 2015, operating cash flows were impacted by net unfavorable working capital changes of $54.3 million, which were largely attributable to timing related to receivables and payables. For 2016, operating cash flows were impacted by net unfavorable working capital changes of $180.7 million, which were largely attributable to contingent consideration payments of $91.7 million, of which $51.1 million is reflected as operating activities, working capital changes of approximately $113.8 million related to our Medicare Part D business, primarily receivables, and other net unfavorable working capital changes due to timing related to receivables and payables.
Segment Profit for 2016 increased $26.1 million from 2015. Tax payments from 2016 totaled $54.4 million, which represents a decrease of $9.5 million from 2015.
Investing Activities. The Company utilized $71.6 million and $60.9 million during 2015 and 2016, respectively, for capital expenditures. The additions related to hard assets (equipment, furniture, and leaseholds) and capitalized software for 2015 were $27.3 million and $44.3 million, respectively, as compared to additions for 2016 related to hard assets and capitalized software of $15.2 million and $45.7 million, respectively.
The Company used net cash of $65.8 million during 2015 for the net purchase of "available-for-sale" securities, with the Company receiving net cash of $15.8 million during 2016 from the net maturity of "available-for-sale" securities. In 2015, the Company used net cash of $13.6 million and $42.2 million for the acquisition of HSM and 4D, respectively. In 2016, the Company used net cash of $16.0 million, $110.9 million and $72.8 million for the acquisition of TMG, AFSC and Veridicus, respectively, partially offset by a working capital adjustment of $0.5 million related to the acquisition of 4D.
Financing Activities. During 2015, the Company paid $206.0 million for the repurchase of treasury stock under the Company’s share repurchase program, $12.5 million on debt obligations, and $4.5 million on capital lease obligations. The Company made contingent consideration payments totaling $29.3 million of which $20.8 million was related to financing activities. In addition, the Company received $53.5 million from the exercise of stock options and had other net favorable items of $4.4 million.
During 2016, the Company paid $106.8 million for the repurchase of treasury stock under the Company's share repurchase program, $15.6 million on debt obligations, and $5.3 million on capital lease obligations. The Company made contingent consideration payments totaling $91.7 million of which $40.6 million was related to financing activities. In addition, the Company received $375.0 million from the issuance of debt, $25.2 million from the exercise of stock options, and other net favorable items of $1.2 million.
Outlook—Liquidity and Capital Resources
Liquidity
The Company may draw on the 2017 Credit Agreement as required to meet working capital needs associated with the timing of receivables and payables, fund share repurchases or support acquisition activities. The Company currently expects to have adequate liquidity to satisfy its existing financial commitments over the periods in which they will become due. The Company plans to maintain its current investment strategy of investing in a diversified, high quality, liquid portfolio of investments and continues to closely monitor the situation in the financial markets. The Company estimates that it has no risk of any material permanent loss on its investment portfolio; however, there can be no assurance the Company will not experience any such losses in the future.
Income Taxes
The Company estimates its future free cash flow will meaningfully benefit from the Tax Act, primarily due to the lower U.S. federal tax rate of 21 percent, although such benefit will be partially offset by the additional limitations imposed on the deduction of executive compensation.
Contractual Obligations and Commitments
The following table sets forth the future financial commitments of the Company as of December 31, 2017 (in thousands):
|
|
|
Payments due by period |
|
|||||||||||||
|
|
|
|
|
|
Less than |
|
1‑3 |
|
3‑5 |
|
More than |
|
||||
|
Contractual Obligations |
|
Total |
|
1 year |
|
years |
|
years |
|
5 years |
|
|||||
|
Senior Notes |
|
$ |
400,000 |
|
$ |
— |
|
$ |
— |
|
$ |
— |
|
$ |
400,000 |
|
|
Term loan |
|
|
345,625 |
|
|
17,500 |
|
|
35,000 |
|
|
293,125 |
|
|
— |
|
|
Operating leases(1) |
|
|
83,783 |
|
|
20,814 |
|
|
33,123 |
|
|
19,991 |
|
|
9,855 |
|
|
Letters of credit(2) |
|
|
26,471 |
|
|
— |
|
|
— |
|
|
— |
|
|
— |
|
|
Capital lease obligations(3) |
|
|
26,512 |
|
|
4,875 |
|
|
6,723 |
|
|
7,290 |
|
|
7,624 |
|
|
Purchase commitments(4) |
|
|
969 |
|
|
969 |
|
|
— |
|
|
— |
|
|
— |
|
|
Income tax contingencies(5) |
|
|
13,580 |
|
|
— |
|
|
— |
|
|
— |
|
|
— |
|
|
|
|
$ |
896,940 |
|
$ |
44,158 |
|
$ |
74,846 |
|
$ |
320,406 |
|
$ |
417,479 |
|
|
(1) |
Operating lease obligations include estimated future lease payments for both open and closed offices. |
|
(2) |
These letters of credit typically act as a guarantee of payment to certain third parties in accordance with specified terms and conditions. |
|
(3) |
Capital lease obligations include imputed interest of $3.6 million and are net of leasehold improvement allowances. |
|
(4) |
Purchase commitments include open purchase orders as of December 31, 2017 relating to ongoing capital expenditure and operational activities. |
|
(5) |
The Company is unable to make a reasonably reliable estimate of the period of the cash settlement (if any) with the respective taxing authorities for these contingencies. However, settlement of such amounts could require the utilization of working capital. See further discussion in Note 7—“Income Taxes” to the consolidated financial statements set forth elsewhere herein. |
The Company also has a variety of other contractual agreements related to acquiring materials and services used in the Company’s operations. However, the Company does not believe these other agreements contain material noncancelable commitments.
Stock Repurchases
The Company’s board of directors has previously authorized a series of stock repurchase plans. Stock repurchases for each such plan could be executed through open market repurchases, privately negotiated transactions, accelerated share repurchases or other means. The board of directors authorized management to execute stock repurchase transactions from time to time and in such amounts and via such methods as management deemed appropriate. Each stock repurchase program could be limited or terminated at any time without prior notice. See Note 6—“Stockholders’ Equity” to the consolidated financial statements for more information on the Company’s share repurchase program.
Off‑Balance Sheet Arrangements
As of December 31, 2017, the Company has no material off‑balance sheet arrangements.
Senior Notes
On September 22, 2017, the Company completed the public offering of $400.0 million aggregate principal amount of its 4.400% Senior Notes due 2024 (the “Notes”). The Notes are governed by an indenture, dated as of September 22, 2017 (the “Base Indenture”), between the Company, as issuer and U.S. Bank National Association, as trustee, as supplemented by a first supplemental indenture, dated as of September 22, 2017 (the “First Supplemental Indenture” together, with the Base Indenture, the “Indenture”), between the Company, as issuer, and U.S. Bank National Association, as trustee.
For more information on the Company’s Senior Notes see Note 5—“Long‑Term Debt and Capital Lease Obligations” to the consolidated financial statements set forth elsewhere herein.
Credit Agreements
On July 23, 2014, the Company entered into a $500.0 million Credit Agreement with various lenders that provided for Magellan Rx Management, Inc. (a wholly owned subsidiary of Magellan) to borrow up to $250.0 million of revolving loans, with a sublimit of up to $70.0 million for the issuance of letters of credit for the account of the Company, and a term loan in an original aggregate principal amount of $250.0 million (the “2014 Credit Facility”). On December 2, 2015, the Company entered into an amendment to the 2014 Credit Facility under which Magellan Pharmacy Services, Inc. (a wholly owned subsidiary of Magellan) became a party to the $500.0 million Credit Agreement as the borrower and assumed all of the obligations of Magellan Rx Management, Inc. Under the 2014 Credit Facility, on September 30, 2014, the Company completed a draw-down of the $250.0 million term loan (the “2014 Term Loan”). The 2014 Credit Facility was scheduled to mature on July 23, 2019. Upon consummation of the Refinancing (as defined below) on September 22, 2017, the 2014 Credit Facility was terminated.
On June 27, 2016, the Company entered into a $200.0 million Credit Agreement with various lenders that provided for a $200.0 million term loan (the “2016 Term Loan”) to Magellan Pharmacy Services, Inc. (the “2016 Credit Facility”). The 2016 Credit Facility was guaranteed by substantially all of the non-regulated subsidiaries of the Company and was scheduled to mature on December 29, 2017. Upon consummation of the Refinancing (as defined below) on September 22, 2017, the 2016 Credit Facility was terminated.
On January 10, 2017, the Company entered into a Credit Agreement with various lenders that provided for a $200.0 million delayed draw term loan (the “2017 Term Loan”) to Magellan Pharmacy Services, Inc. (the “2017 Credit Facility”). The 2017 Credit Facility was guaranteed by substantially all of the non-regulated subsidiaries of the Company and was scheduled to mature on December 29, 2017. Upon consummation of the Refinancing (as defined below) on September 22, 2017, the 2017 Credit Facility was terminated.
On September 22, 2017, the Company entered into a Credit Agreement with various lenders that provides for a $400.0 million senior unsecured revolving credit facility and a $350.0 million senior unsecured term loan facility to the Company, as the borrower (the “2017 Credit Agreement”). The 2017 Credit Agreement is scheduled to mature on September 22, 2022.
The proceeds from the 2017 Credit Agreement were and will be used for (a) working capital and general corporate purposes of the Company and its subsidiaries, including investments and the funding of acquisitions, (b) the repayment of all outstanding loans and other obligations (and the termination of all commitments) under the 2014 Credit Facility, 2016 Credit Facility and 2017 Credit Facility (collectively, the “Previous Credit Agreements”) (the termination and repayment of the obligations under the Previous Credit Agreements, collectively, the “Refinancing”) and (c) payment of fees and expenses incurred in connection with (i) the entering into the 2017 Credit Agreement and related documents and the incurrence of loans and issuance of letters of credit thereunder and (ii) the consummation of the Refinancing. Upon consummation of the Refinancing, the Previous Credit Agreements were terminated.
For more information on the Company’s Credit Agreements see Note 5—“Long‑Term Debt and Capital Lease Obligations” to the consolidated financial statements set forth elsewhere herein.
Restrictive Covenants in Debt Agreements
The 2017 Credit Agreement contains covenants that limit management’s discretion in operating the Company’s business by restricting or limiting the Company’s ability, among other things, to:
|
· |
incur or guarantee additional indebtedness or issue preferred or redeemable stock; |
|
· |
pay dividends and make other distributions; |
|
· |
repurchase equity interests; |
|
· |
make certain advances, investments and loans; |
|
· |
enter into sale and leaseback transactions; |
|
· |
create liens; |
|
· |
sell and otherwise dispose of assets; |
|
· |
acquire, merge or consolidate with another company; and |
|
· |
enter into some types of transactions with affiliates. |
These restrictions could adversely affect the Company’s ability to finance future operations or capital needs or engage in other business activities that may be in the Company’s interest.
The 2017 Credit Agreement also requires the Company to comply with specified financial ratios and tests. Failure to do so, unless waived by the lenders under the 2017 Credit Agreement, pursuant to its terms, would result in an event of default under the 2017 Credit Agreement. As of December 31, 2017, the Company was in compliance with all covenants, including financial covenants, under the 2017 Credit Agreement.
Item 7A. Quantitative and Qualitative Disclosures about Market Risk
Changes in interest rates affect interest income earned on the Company’s cash equivalents and investments, as well as interest expense on variable interest rate borrowings under the 2017 Credit Agreement. In addition, interest rates on the Notes are subject to adjustment upon the occurrence of certain credit rating events. Based on the amount of cash equivalents and investments and the borrowing levels under the 2017 Credit Agreement and the principal amount of the Notes as of December 31, 2017, a hypothetical 10 percent increase or decrease in the interest rate associated with these instruments, with all other variables held constant, would not materially affect the Company’s future earnings and cash outflows.
Item 8. Financial Statements and Supplementary Data
Information with respect to this item is contained in the Company’s consolidated financial statements, including the reports of independent accountants, set forth elsewhere herein and financial statement schedule indicated in the Index on Page F‑1 of this Report on Form 10‑K, and is included herein.
Item 9. Changes in and Disagreements with Accountants on Accounting and Financial Disclosure
None.
Item 9A. Controls and Procedures
EVALUATION OF DISCLOSURE CONTROLS AND PROCEDURES
The Company’s management evaluated, with the participation of the Company’s principal executive and principal financial officers, the effectiveness of the Company’s disclosure controls and procedures (as defined in Rules 13a‑15(e) and 15d‑15(e) under the Securities Exchange Act of 1934, as amended (the “Exchange Act”)), as of December 31, 2017. Based on their evaluation, the CEO and CFO concluded that our controls and procedures were not effective due to a material weakness in internal control over financial reporting at AFSC which we acquired on July 1, 2016, and which operates as a component of our Healthcare segment.
Notwithstanding the identified material weakness, management, including our CEO (principal executive officer) and CFO (principal financial officer), believes the consolidated financial statements included in this annual report on Form 10-K fairly represent in all material respects our financial condition, results of operations and cash flows at and for the periods presented in accordance with U.S. GAAP.
CHANGES IN INTERNAL CONTROL OVER FINANCIAL REPORTING
Except as noted in the preceding paragraph, there has been no change in our internal control over financial reporting that occurred during the quarter ended December 31, 2017 that has materially affected, or is reasonably likely to materially affect, our internal control over financial reporting.
MANAGEMENT’S REPORT ON INTERNAL CONTROL OVER FINANCIAL REPORTING
The Company’s management is responsible for establishing and maintaining adequate internal control over financial reporting (as defined in Rule 13a‑15(f) under the Securities Exchange Act of 1934, as amended). The Company’s internal control system was designed to provide reasonable assurance regarding the preparation and fair presentation of published financial statements. Because of its inherent limitations, internal control over financial reporting may not prevent or detect misstatements. Also, projections of any evaluation of effectiveness to future periods are subject to the risk that controls may become inadequate because of changes in conditions, or that the degree of compliance with the policies or procedures may deteriorate. Under the supervision and with the participation of management, including the Company’s Chief Executive Officer and Chief Financial Officer, the Company assessed the effectiveness of internal control over financial reporting as of December 31, 2017. In making this assessment, management used the criteria set forth by the Committee of Sponsoring Organizations of the Treadway Commission (“COSO”) in its statement “Internal Control‑Integrated Framework (2013).”
AFSC was acquired on July 1, 2016 and generated about 3% of our total net revenues for the year ended December 31, 2017. Prior to 2017, AFSC was not included in assessments of the effectiveness of our internal control over financial reporting as the Securities and Exchange Commission (“SEC”) rules provide companies one year to assess controls at an acquired entity. Accordingly, within this period, we performed our first comprehensive assessment of the design and effectiveness of internal controls at AFSC and determined that AFSC’s internal control over financial reporting was ineffective as of December 31, 2017. Specifically, AFSC did not adequately identify, design and implement appropriate process-level controls for its processes, including AFSC’s contract accounting and information technology general controls. There were no material errors in the financial results or balances identified as a result of the control deficiencies, and there was no restatement of prior period financial statements and no change in previously released financial results were required as the result of these control deficiencies.
Management’s assessment of the effectiveness of internal control over financial reporting excludes the evaluation of the internal controls over reporting of SWH, which was acquired on October 31, 2017. SWH’s operations represent 6.8 percent and 4.2 percent of total and net assets of the Company as of December 31, 2017, and 3.2 percent and 4.1 percent of revenues and income before income taxes, respectively, of the Company for the year then ended.
Based on this assessment, which excluded an assessment of internal control of the acquired operations of SWH, management has concluded that, as of December 31, 2017, internal control over financial reporting is not effective due to the material weakness described above.
The Company’s independent registered public accounting firm has issued an audit report on the Company’s internal control over financial reporting. This report dated March 1, 2018 appears on pages 50 and 51 of this Form 10‑K.
Remediation Plan for Material Weakness
We are actively engaged in developing a remediation plan to address the material weakness reported as of December 31, 2017. The remediation efforts we expect to implement include the enhanced and revised design of existing financial reporting controls related to contract accounting and information technology general controls at AFSC.
We believe these measures will remediate the material weakness identified above and will strengthen our internal control over financial reporting for the AFSC operations. We currently are targeting to complete the implementation of the control enhancements during 2018. We will test the ongoing operating effectiveness of the new controls subsequent to implementation, and consider the material weakness remediated after the applicable remedial controls and information technology general controls operate effectively for a sufficient period of time.
If the remedial measures described above are insufficient to address the material weakness described above, or are not implemented timely, or additional deficiencies arise in the future, material misstatements in our interim or annual financial statements may occur in the future.
Report of Independent Registered Public Accounting Firm
To the Shareholders and Board of Directors of Magellan Health, Inc.
Opinion on Internal Control over Financial Reporting
We have audited Magellan Health, Inc. and subsidiaries’ internal control over financial reporting as of December 31, 2017, based on criteria established in Internal Control—Integrated Framework issued by the Committee of Sponsoring Organizations of the Treadway Commission (2013 framework) (the COSO criteria). In our opinion, because of the effect of the material weakness described below on the achievement of the objectives of the control criteria, Magellan Health, Inc. and subsidiaries (the Company) has not maintained effective internal control over financial reporting as of December 31, 2017, based on the COSO criteria.
As indicated in the accompanying Management’s Report on Internal Control over Financial Reporting, management’s assessment of and conclusion on the effectiveness of internal control over financial reporting did not include the internal controls of SWH Holdings, Inc., which is included in the 2017 consolidated financial statements of Magellan Health, Inc. and subsidiaries and which constituted 6.8% and 4.2% of total and net assets, respectively, as of December 31, 2017 and 3.2% and 4.1% of revenues and income before income taxes, respectively, for the year then ended. Our audit of internal control over financial reporting of Magellan Health, Inc. and subsidiaries also did not include an evaluation of the internal control over financial reporting of SWH Holdings, Inc.
A material weakness is a deficiency, or combination of deficiencies, in internal control over financial reporting, such that there is a reasonable possibility that a material misstatement of the company’s annual or interim financial statements will not be prevented or detected on a timely basis. The following material weakness has been identified and included in management’s assessment. Management identified a material weakness in the design and operation of internal controls within AFSC’s processes (including contract accounting and information technology general controls).
We also have audited in accordance with the standards of the Public Company Accounting Oversight Board (United States) (PCAOB), the accompanying consolidated balance sheets of Magellan Health, Inc. and subsidiaries as of December 31, 2016 and 2017, and the related consolidated statements of income, comprehensive income, changes in stockholders’ equity and cash flows for each of the three years in the period ended December 31, 2017, and the related notes and financial statement schedules listed in the Index at Item 15 (a) 1 and 2 (collectively referred to as the “financial statements”) of the Company. This material weakness was considered in determining the nature, timing and extent of audit tests applied in our audit of the 2017 consolidated financial statements, and this report does not affect our report dated March 1, 2018, which expressed an unqualified opinion thereon.
Basis for Opinion
The Company’s management is responsible for maintaining effective internal control over financial reporting, and for its assessment of the effectiveness of internal control over financial reporting included in the accompanying Management’s Report on Internal Control over Financial Reporting. Our responsibility is to express an opinion on the Company’s internal control over financial reporting based on our audit. We are a public accounting firm registered with the PCAOB and are required to independent with respect to the Company in accordance with the U.S. federal securities laws and the applicable rules and regulations of the Securities and Exchange Commission and the PCAOB.
We conducted our audit in accordance with the standards of the PCAOB. Those standards require that we plan and perform the audit to obtain reasonable assurance about whether effective internal control over financial reporting was maintained in all material respects. Our audit included obtaining an understanding of internal control over financial reporting, assessing the risk that a material weakness exists, testing and evaluating the design and operating effectiveness of internal control based on the assessed risk, and performing such other procedures as we considered necessary in the circumstances. We believe that our audit provides a reasonable basis for our opinion.
Definitions and Limitation of Internal Control Over Financial Reporting
A company’s internal control over financial reporting is a process designed to provide reasonable assurance regarding the reliability of financial reporting and the preparation of financial statements for external purposes in accordance with generally accepted accounting principles. A company’s internal control over financial reporting includes those policies and procedures that (1) pertain to the maintenance of records that, in reasonable detail, accurately and fairly reflect the transactions and dispositions of the assets of the company; (2) provide reasonable assurance that transactions are recorded as necessary to permit preparation of financial statements in accordance with generally accepted accounting principles, and that receipts and expenditures of the company are being made only in accordance with authorizations of management and directors of the company; and (3) provide reasonable assurance regarding prevention or timely detection of unauthorized acquisition, use, or disposition of the company’s assets that could have a material effect on the financial statements.
Because of its inherent limitations, internal control over financial reporting may not prevent or detect misstatements. Also, projections of any evaluation of effectiveness to future periods are subject to the risk that controls may become inadequate because of changes in conditions, or that the degree of compliance with the policies or procedures may deteriorate.
|
|
/s/ ERNST & YOUNG LLP |
|
|
|
|
Baltimore, Maryland |
|
|
March 1, 2018 |
|
None.
The information required by Items 10 through 14 is incorporated by reference to the Registrant’s definitive proxy statement to be filed pursuant to Regulation 14A under the Securities Exchange Act of 1934, as amended, within 120 days after December 31, 2017, except for the following information required by Item 12 of this Part III.
Securities Authorized for Issuance under Equity Compensation Plans
The following table sets forth certain information as of December 31, 2017 with respect to the Company’s compensation plans under which equity securities are authorized for issuance:
|
|
|
|
|
|
|
|
Number of securities |
|
|
|
|
|
|
|
|
|
remaining available |
|
|
|
|
|
|
|
|
|
for future issuance |
|
|
|
|
Number of securities |
|
|
|
|
under equity |
|
|
|
|
to be issued upon |
|
Weighted average |
|
compensation plans |
|
|
|
|
|
exercise of |
|
exercise price of |
|
(excluding securities |
|
|
|
|
|
outstanding options, |
|
outstanding options, |
|
reflected in |
|
|
|
Plan category |
|
warrants and rights |
|
warrants and rights |
|
column(a)) |
|
|
|
|
|
(a) |
|
|
|
|
|
|
|
Equity compensation plans approved by security holders |
|
2,823,841 |
(1) |
$ |
61.50 |
(2) |
3,724,939 |
(3) |
|
Equity compensation plans not approved by security holders |
|
— |
|
|
— |
|
— |
|
|
Total |
|
2,823,841 |
|
$ |
61.50 |
|
3,724,939 |
(3) |
|
(1) |
Consists of outstanding stock options and unvested restricted stock units and performance-based restricted stock units as of December 31, 2017. |
|
(2) |
Weighted average exercise price of outstanding stock options as of December 31, 2017. |
|
(3) |
Consists of shares remaining available for issuance as of December 31, 2017 under the Company’s equity compensation plans (pursuant to which the Company may issue stock options, restricted stock awards, stock bonuses, stock purchase rights and other equity incentives), after giving effect to the shares issuable upon the exercise of outstanding options and the shares of restricted stock. |
For further discussion, see Note 6—“Stockholders’ Equity” to the consolidated financial statements set forth elsewhere herein.
Item 15. Exhibits, Financial Statement Schedule and Additional Information
|
(a) |
Documents furnished as part of the Report: |
1.Financial Statements
Information with respect to this item is contained on Pages F‑1 to F‑44 of this Report on Form 10‑K.
2.Financial Statement Schedules
Information with respect to this item is contained on page S‑1 to S-5 of this Report on Form 10‑K.
3.Exhibit Index
|
Exhibit No. |
|
Description of Exhibit |
|
|
| 1.1 |
|
|
||
| 2.1 |
|
|
||
| 3.1 |
|
|
||
| 3.2 |
|
|
||
| 4.1 |
|
|
||
| 4.2 |
|
|
||
| 4.3 |
|
|
||
| 4.4 |
|
|
||
| 4.5 |
|
|
||
| 4.6 |
|
|
||
| 4.7 |
|
|
||
| 4.8 |
|
|
||
|
*10.1 |
|
|
||
|
*10.2 |
|
|
||
|
*10.3 |
|
|
||
|
*10.4 |
|
|
||
|
*10.5 |
|
|
||
|
*10.6 |
|
|
||
|
*10.7 |
|
|
||
|
*10.8 |
|
|
||
|
*10.9 |
|
|
||
|
*10.10 |
|
|
||
|
*10.11 |
|
|
||
|
*10.12 |
|
|
||
|
*10.13 |
|
|
||
|
*10.14 |
|
|
||
|
*10.15 |
|
|
||
|
*10.16 |
|
|
||
|
*10.17 |
|
|
||
|
*10.18 |
|
|
||
|
*10.19 |
|
|
||
|
*10.20 |
|
|
||
|
*10.21 |
|
|
||
|
*10.22 |
|
|
||
|
*10.23 |
|
|
||
|
*10.24 |
|
|
||
|
*10.25 |
|
|
||
|
*10.26 |
|
|
||
|
*10.27 |
|
|
||
|
*10.28 |
|
|
||
|
*10.29 |
|
|
||
|
*10.30 |
|
|
||
|
*10.31 |
|
|
||
|
*10.32 |
|
|
||
|
*10.33 |
|
|
||
|
*10.34 |
|
|
||
|
*10.35 |
|
|
||
|
*10.36 |
|
|
||
|
*10.37 |
|
|
||
|
*10.38 |
|
|
||
|
*10.39 |
|
|
||
|
*10.40 |
|
|
||
|
*10.41 |
|
|
||
|
*10.42 |
|
|
||
| 10.43 |
|
|
||
| 10.44 |
|
|
||
|
*10.45 |
|
|
||
|
*10.46 |
|
|
||
|
*10.47 |
|
|
||
|
*10.48 |
|
|
||
|
#12.1 |
|
|
||
|
#21 |
|
|
||
|
#23 |
|
|
||
|
#31.1 |
|
Certification of Chief Executive Officer pursuant to Section 302 of the Sarbanes‑Oxley Act of 2002. |
|
|
|
#31.2 |
|
Certification of Chief Financial Officer pursuant to Section 302 of the Sarbanes‑Oxley Act of 2002. |
|
|
|
†32.1 |
|
Certification of Chief Executive Officer pursuant to Section 906 of the Sarbanes‑Oxley Act of 2002. |
|
|
|
†32.2 |
|
Certification of Chief Financial Officer pursuant to Section 906 of the Sarbanes‑Oxley Act of 2002. |
|
|
|
#101 |
|
The following materials from the Company’s Annual Report on Form 10‑K for the fiscal year ended December 31, 2017 formatted in Extensible Business Reporting Language (XBRL): (i) the Consolidated Statements of Income, (ii) the Consolidated Balance Sheets, (iii) the Consolidated Statements of Changes in Shareholders’ Equity (iv) the Consolidated Statements of Cash Flows and (v) related notes. |
|
|
*Constitutes a management contract, compensatory plan or arrangement.
#Filed herewith.
†Furnished herewith.
(b)Exhibits Required by Item 601 of Regulation S‑K:
Exhibits required to be filed by the Company pursuant to Item 601 of Regulation S‑K are contained in a separate volume.
(c)Financial statements and schedules required by Regulation S‑X Rule 12-09:
|
(1) |
Not applicable. |
|
(2) |
Not applicable. |
|
(3) |
Information with respect to this item is contained on page S‑1 of this Report on Form 10‑K. |
4.Additional Information
The Company will provide to any person without charge, upon request, a copy of its annual Report on Form 10‑K (without exhibits) for the year ended December 31, 2017, as filed with the Securities and Exchange Commission. The Company will also provide to any person without charge, upon request, copies of its Code of Ethics for Directors, Code of Ethics for Covered Officers, and Corporate Compliance Handbook for all employees (hereinafter referred to as the “Codes of Ethics”). Any such requests should be made in writing to the Investor Relations Department, Magellan Health, Inc., 55 Nod Road, Avon, Connecticut 06001. The documents referred to above and other Securities and Exchange Commission filings of the Company are available on the Company’s website at www.magellanhealth.com. The Company intends to disclose any future amendments to the provisions of the Codes of Ethics and waivers from such Codes of Ethics, if any, made with respect to any of its directors and executive officers, on its internet site.
None.
SIGNATURES
Pursuant to the requirements of Section 13 or 15(d) of the Securities Exchange Act of 1934, the Registrant has duly caused this Report to be signed on its behalf by the undersigned thereunto duly authorized.
|
|
MAGELLAN HEALTH, INC. |
|
|
|
|
Date: March 1, 2018 |
/s/ JONATHAN N. RUBIN |
|
|
Jonathan N. Rubin |
|
|
Chief Financial Officer |
|
|
(Principal Financial Officer) |
|
|
|
|
Date: March 1, 2018 |
/s/ JEFFREY N. WEST |
|
|
Jeffrey N. West |
|
|
Senior Vice President and Controller |
|
|
(Principal Accounting Officer) |
Pursuant to the requirements of the Securities Exchange Act of 1934, the following persons on behalf of the Registrant and in the capacities and on the dates indicated have signed this Report below.
|
Signature |
|
Title |
|
Date |
|
|
|
|
|
|
|
/s/ BARRY SMITH |
|
Chief Executive Officer and Chairman of the Board of Directors |
|
March 1, 2018 |
|
Barry Smith |
|
|
||
|
|
|
|
|
|
|
/s/ Dr. John O. Agwunobi |
|
Director |
|
March 1, 2018 |
|
Dr. John O. Agwunobi |
|
|
|
|
|
|
|
|
|
|
|
/s/ Eran Broshy |
|
Director |
|
March 1, 2018 |
|
Eran Broshy |
|
|
|
|
|
|
|
|
|
|
|
/s/ Michael Diament |
|
Director |
|
March 1, 2018 |
|
Michael Diament |
|
|
|
|
|
|
|
|
|
|
|
/s/ Dr. Perry Fine |
|
Director |
|
March 1, 2018 |
|
Dr. Perry Fine |
|
|
|
|
|
|
|
|
|
|
|
/s/ Kay Coles James |
|
Director |
|
March 1, 2018 |
|
Kay Coles James |
|
|
|
|
|
|
|
|
|
|
|
/s/ G. Scott MacKenzie |
|
Director |
|
March 1, 2018 |
|
G. Scott MacKenzie |
|
|
|
|
|
|
|
|
|
|
|
/s/ William J. McBride |
|
Director |
|
March 1, 2018 |
|
William J. McBride |
|
|
|
|
|
|
|
|
|
|
|
/s/ Mary Sammons |
|
Director |
|
March 1, 2018 |
|
Mary Sammons |
|
|
|
|
|
|
|
|
|
|
|
/s/ JONATHAN N. RUBIN |
|
Chief Financial Officer |
|
March 1, 2018 |
|
Jonathan N. Rubin |
|
|
||
|
|
|
|
|
|
|
/s/ JEFFREY N. WEST |
|
Senior Vice President and Controller |
|
March 1, 2018 |
|
Jeffrey N. West |
|
|
MAGELLAN HEALTH, INC. AND SUBSIDIARIES
INDEX TO FINANCIAL STATEMENTS
The following consolidated financial statements of the registrant and its subsidiaries are submitted herewith in response to Item 8 and Item 15(a)1:
|
|
|
Page(s) |
|
Magellan Health, Inc. |
|
|
|
Audited Consolidated Financial Statements |
|
|
|
|
F‑2 |
|
|
Consolidated balance sheets as of December 31, 2016 and 2017 |
|
F‑3 |
|
Consolidated statements of income for the years ended December 31, 2015, 2016 and 2017 |
|
F‑4 |
|
Consolidated statements of comprehensive income for the years ended December 31, 2015, 2016 and 2017 |
|
F‑5 |
|
|
F‑6 |
|
|
Consolidated statements of cash flows for the years ended December 31, 2015, 2016 and 2017 |
|
F‑7 |
|
|
F‑8 |
|
|
The following financial statement schedule of the registrant and its subsidiaries is submitted herewith in response to Item 15(a)2: |
|
|
|
|
S‑1 |
|
|
|
S‑5 |
All other schedules for which provision is made in the applicable accounting regulation of the Securities and Exchange Commission are not required under the related instructions or are inapplicable and therefore have been omitted.
Report of Independent Registered Public Accounting Firm
To the Shareholders and Board of Directors of Magellan Health, Inc.
Opinion on the Financial Statements
We have audited the accompanying consolidated balance sheets of Magellan Health, Inc. and subsidiaries as of December 31, 2016 and 2017, and the related consolidated statements of income, comprehensive income, changes in stockholders’ equity and cash flows for each of the three years in the period ended December 31, 2017, and the related notes and financial statement schedules listed in the Index at Item 15 (a) 1 and 2 (collectively referred to as the “financial statements”). In our opinion, the financial statements present fairly, in all material respects, the consolidated financial position of the Company at December 31, 2017 and 2016, and the consolidated results of its operations and its cash flows for each of the three years in the period ended December 31, 2017, in conformity with U.S. generally accepted accounting principles.
We also have audited, in accordance with the standards of the Public Company Accounting Oversight Board (United States), the Company’s internal control over financial reporting as of December 31, 2017, based on the criteria established in Internal Control-Integrated Framework issued by the Committee of Sponsoring Organizations of the Treadway Commission (2013 framework), and our report dated March 1, 2018 expressed an adverse opinion thereon.
Basis for Opinion
These financial statements and schedule are the responsibility of the Company’s management. Our responsibility is to express an opinion on these financial statements and schedule based on our audits. We are a public accounting firm registered with the PCAOB and are required to be independent with respect to the Company in accordance with the U.S. federal securities laws and the applicable rules and regulations of the Securities and Exchange Commission and the PCAOB.
We conducted our audits in accordance with the standards of the PCAOB. Those standards require that we plan and perform the audit to obtain reasonable assurance about whether the financial statements are free of material misstatement, whether due to error or fraud. Our audit included performing procedures to assess the risks of material misstatement of the financial statements, whether due to error or fraud, and performing procedures that respond to those risks. Such procedures included examining, on a test basis, evidence regarding the amounts and disclosures in the financial statements. Our audits also included evaluating the accounting principles used and significant estimates made by management, as well as evaluating the overall financial statement presentation. We believe that our audits provide a reasonable basis for our opinion.
|
|
|
/s/ Ernst & Young LLP |
|
We have served as the Company’s auditor since 2002. |
|
|
|
Baltimore, Maryland |
|
|
|
March 1, 2018 |
|
|
MAGELLAN HEALTH, INC. AND SUBSIDIARIES
CONSOLIDATED BALANCE SHEETS AS OF DECEMBER 31,
(In thousands, except per share amounts)
|
|
|
2016 |
|
2017 |
|
||
|
ASSETS |
|
|
|
|
|
|
|
|
Current Assets: |
|
|
|
|
|
|
|
|
Cash and cash equivalents ($81,776 and $229,013 restricted at December 31, 2016 and December 31, 2017, respectively) |
|
$ |
304,508 |
|
$ |
398,732 |
|
|
Accounts receivable, less allowance of $5,644 and $8,622 at December 31, 2016 and December 31, 2017, respectively |
|
|
606,764 |
|
|
660,775 |
|
|
Short-term investments ($227,795 and $219,111 restricted at December 31, 2016 and December 31, 2017, respectively) |
|
|
297,493 |
|
|
310,578 |
|
|
Pharmaceutical inventory |
|
|
58,995 |
|
|
40,945 |
|
|
Other current assets ($38,785 and $41,121 restricted at December 31, 2016 and December 31, 2017, respectively) |
|
|
51,507 |
|
|
72,323 |
|
|
Total Current Assets |
|
|
1,319,267 |
|
|
1,483,353 |
|
|
Property and equipment, net |
|
|
172,524 |
|
|
158,638 |
|
|
Long-term investments ($6,306 and $17,287 restricted at December 31, 2016 and December 31, 2017, respectively) |
|
|
7,760 |
|
|
17,287 |
|
|
Deferred income taxes |
|
|
3,125 |
|
|
813 |
|
|
Other long-term assets |
|
|
12,725 |
|
|
22,567 |
|
|
Goodwill |
|
|
742,054 |
|
|
1,006,288 |
|
|
Other intangible assets, net |
|
|
186,232 |
|
|
268,288 |
|
|
Total Assets |
|
$ |
2,443,687 |
|
$ |
2,957,234 |
|
|
LIABILITIES, REDEEMABLE NON-CONTROLLING INTEREST AND STOCKHOLDERS’ EQUITY |
|
|
|
|
|
|
|
|
Current Liabilities: |
|
|
|
|
|
|
|
|
Accounts payable |
|
$ |
95,635 |
|
$ |
74,300 |
|
|
Accrued liabilities |
|
|
202,176 |
|
|
193,635 |
|
|
Short-term contingent consideration |
|
|
9,354 |
|
|
6,892 |
|
|
Medical claims payable |
|
|
184,136 |
|
|
327,625 |
|
|
Other medical liabilities |
|
|
197,856 |
|
|
177,002 |
|
|
Current debt and capital lease obligations |
|
|
403,693 |
|
|
112,849 |
|
|
Total Current Liabilities |
|
|
1,092,850 |
|
|
892,303 |
|
|
Long-term debt and capital lease obligations |
|
|
214,686 |
|
|
740,888 |
|
|
Deferred income taxes |
|
|
— |
|
|
12,298 |
|
|
Tax contingencies |
|
|
13,981 |
|
|
14,226 |
|
|
Long-term contingent consideration |
|
|
1,799 |
|
|
1,925 |
|
|
Deferred credits and other long-term liabilities |
|
|
15,882 |
|
|
19,100 |
|
|
Total Liabilities |
|
|
1,339,198 |
|
|
1,680,740 |
|
|
Redeemable non-controlling interest |
|
|
4,770 |
|
|
— |
|
|
Preferred stock, par value $.01 per share |
|
|
|
|
|
|
|
|
Authorized—10,000 shares at December 31, 2016 and December 31, 2017-Issued and outstanding-none |
|
|
— |
|
|
— |
|
|
Ordinary common stock, par value $.01 per share |
|
|
|
|
|
|
|
|
Authorized—100,000 shares at December 31, 2016 and December 31, 2017-Issued and outstanding-51,993 and 23,517 shares at December 31, 2016, respectively, and 52,973 and 24,202 shares at December 31, 2017, respectively |
|
|
520 |
|
|
530 |
|
|
Other Stockholders’ Equity: |
|
|
|
|
|
|
|
|
Additional paid-in capital |
|
|
1,186,283 |
|
|
1,274,811 |
|
|
Retained earnings |
|
|
1,289,288 |
|
|
1,399,495 |
|
|
Accumulated other comprehensive loss |
|
|
(175) |
|
|
(380) |
|
|
Treasury stock, at cost, 28,476 and 28,771 shares at December 31, 2016 and December 31, 2017, respectively |
|
|
(1,376,197) |
|
|
(1,397,962) |
|
|
Total Stockholders’ Equity |
|
|
1,099,719 |
|
|
1,276,494 |
|
|
Total Liabilities, Redeemable Non-Controlling Interest and Stockholders’ Equity |
|
$ |
2,443,687 |
|
$ |
2,957,234 |
|
See accompanying notes to consolidated financial statements.
MAGELLAN HEALTH, INC. AND SUBSIDIARIES
CONSOLIDATED STATEMENTS OF INCOME
FOR THE YEARS ENDED DECEMBER 31,
(In thousands, except per share amounts)
|
|
|
|
|
|
|
|
|
|
|
|
|
|
|
|
|
|
|
|
|
|
|
|
|
|
|
|
|
|
2015 |
|
2016 |
|
2017 |
|
|||
|
Net revenue: |
|
|
|
|
|
|
|
|
|
|
|
|
Managed care and other |
|
|
$ |
3,197,645 |
|
$ |
2,902,942 |
|
$ |
3,479,182 |
|
|
PBM and dispensing |
|
|
|
1,399,755 |
|
|
1,933,942 |
|
|
2,359,401 |
|
|
Total net revenue |
|
|
|
4,597,400 |
|
|
4,836,884 |
|
|
5,838,583 |
|
|
Costs and expenses: |
|
|
|
|
|
|
|
|
|
|
|
|
Cost of care |
|
|
|
2,274,755 |
|
|
1,882,614 |
|
|
2,413,770 |
|
|
Cost of goods sold |
|
|
|
1,321,877 |
|
|
1,818,720 |
|
|
2,211,910 |
|
|
Direct service costs and other operating expenses (1)(2)(3) |
|
|
|
822,392 |
|
|
876,612 |
|
|
941,883 |
|
|
Depreciation and amortization |
|
|
|
102,844 |
|
|
106,046 |
|
|
115,706 |
|
|
Interest expense |
|
|
|
6,581 |
|
|
10,193 |
|
|
25,977 |
|
|
Interest and other income |
|
|
|
(2,165) |
|
|
(2,818) |
|
|
(5,887) |
|
|
Total costs and expenses |
|
|
|
4,526,284 |
|
|
4,691,367 |
|
|
5,703,359 |
|
|
Income before income taxes |
|
|
|
71,116 |
|
|
145,517 |
|
|
135,224 |
|
|
Provision for income taxes |
|
|
|
42,409 |
|
|
69,728 |
|
|
25,083 |
|
|
Net income |
|
|
|
28,707 |
|
|
75,789 |
|
|
110,141 |
|
|
Less: net loss attributable to non-controlling interest |
|
|
|
(2,706) |
|
|
(2,090) |
|
|
(66) |
|
|
Net income attributable to Magellan |
|
|
$ |
31,413 |
|
$ |
77,879 |
|
$ |
110,207 |
|
|
Net income attributable to Magellan per common share: |
|
|
|
|
|
|
|
|
|
|
|
|
Basic (See Note 6—"Stockholders' Equity") |
|
|
$ |
1.26 |
|
$ |
3.36 |
|
$ |
4.72 |
|
|
Diluted (See Note 6—"Stockholders' Equity") |
|
|
$ |
1.21 |
|
$ |
3.22 |
|
$ |
4.51 |
|
|
(1) |
Includes stock compensation expense of $50,384, $37,422 and $39,116 for the years ended December 31, 2015, 2016 and 2017, respectively. |
|
(2) |
Includes changes in fair value of contingent consideration of $44,257, $(104) and $696 for the years ended December 31, 2015, 2016 and 2017, respectively. |
|
(3) |
Includes impairment of intangible assets of $4,800 for the year ended December 31, 2016. |
See accompanying notes to consolidated financial statements.
MAGELLAN HEALTH, INC. AND SUBSIDIARIES
CONSOLIDATED STATEMENTS OF COMPREHENSIVE INCOME
FOR THE YEARS ENDED DECEMBER 31,
(In thousands)
|
|
|
|
|
|
|
|
|
|
|
|
|
|
|
|
|
|
|
|
|
|
|
|
|
|
|
2015 |
|
2016 |
|
2017 |
|
|||
|
Net income |
|
$ |
28,707 |
|
$ |
75,789 |
|
$ |
110,141 |
|
|
Other comprehensive income: |
|
|
|
|
|
|
|
|
|
|
|
Unrealized (loss) gain on available-for-sale securities (1) |
|
|
(119) |
|
|
87 |
|
|
(205) |
|
|
Comprehensive income |
|
|
28,588 |
|
|
75,876 |
|
|
109,936 |
|
|
Less: comprehensive loss attributable to non-controlling interest |
|
|
(2,706) |
|
|
(2,090) |
|
|
(66) |
|
|
Comprehensive income attributable to Magellan |
|
$ |
31,294 |
|
$ |
77,966 |
|
$ |
110,002 |
|
|
(1) |
Net of income tax (benefit) expense of $(68), $51 and $(8) for the years ended December 31, 2015, 2016 and 2017, respectively. |
See accompanying notes to consolidated financial statements.
MAGELLAN HEALTH, INC. AND SUBSIDIARIES
CONSOLIDATED STATEMENTS OF CHANGES IN STOCKHOLDERS’ EQUITY
(In thousands)
|
|
|
|
|
|
|
|
|
|
|
|
Accumulated |
|
|
|
||||||||||
|
|
|
|
|
Common Stock |
|
Additional |
|
|
|
Other |
|
Total |
|
|||||||||||
|
|
|
Common Stock |
|
|
In Treasury |
|
Paid in |
|
Retained |
|
Comprehensive |
|
Stockholders’ |
|
||||||||||
|
|
|
Shares |
|
Amount |
|
Shares |
|
Amount |
|
Capital |
|
Earnings |
|
Income (Loss) |
|
Equity |
|
|||||||
|
Balance at December 31, 2014 |
|
50,085 |
|
$ |
501 |
|
|
(23,150) |
|
$ |
(1,064,963) |
|
$ |
1,018,266 |
|
$ |
1,179,897 |
|
$ |
(143) |
|
$ |
1,133,558 |
|
|
Stock compensation expense |
|
— |
|
|
— |
|
|
— |
|
|
— |
|
|
50,384 |
|
|
— |
|
|
— |
|
|
50,384 |
|
|
Exercise of stock options |
|
1,140 |
|
|
11 |
|
|
— |
|
|
— |
|
|
54,079 |
|
|
— |
|
|
— |
|
|
54,090 |
|
|
Tax benefit from exercise of stock options and vesting of stock awards |
|
— |
|
|
— |
|
|
— |
|
|
— |
|
|
3,530 |
|
|
— |
|
|
— |
|
|
3,530 |
|
|
Issuance of equity |
|
115 |
|
|
1 |
|
|
— |
|
|
— |
|
|
408 |
|
|
— |
|
|
— |
|
|
409 |
|
|
Repurchase of stock |
|
— |
|
|
— |
|
|
(3,498) |
|
|
(204,428) |
|
|
— |
|
|
— |
|
|
— |
|
|
(204,428) |
|
|
Adjustment to additional paid in capital due to reversal of tax contingency |
|
— |
|
|
— |
|
|
— |
|
|
— |
|
|
32 |
|
|
— |
|
|
— |
|
|
32 |
|
|
Adjustment to non-controlling interest |
|
— |
|
|
— |
|
|
— |
|
|
— |
|
|
(2,686) |
|
|
— |
|
|
— |
|
|
(2,686) |
|
|
Net income attributable to Magellan |
|
— |
|
|
— |
|
|
— |
|
|
— |
|
|
— |
|
|
31,413 |
|
|
— |
|
|
31,413 |
|
|
Other comprehensive loss—other |
|
— |
|
|
— |
|
|
— |
|
|
— |
|
|
— |
|
|
— |
|
|
(119) |
|
|
(119) |
|
|
Balance at December 31, 2015 |
|
51,340 |
|
|
513 |
|
|
(26,648) |
|
|
(1,269,391) |
|
|
1,124,013 |
|
|
1,211,310 |
|
|
(262) |
|
|
1,066,183 |
|
|
Stock compensation expense |
|
— |
|
|
— |
|
|
— |
|
|
— |
|
|
37,422 |
|
|
— |
|
|
— |
|
|
37,422 |
|
|
Exercise of stock options |
|
494 |
|
|
6 |
|
|
— |
|
|
— |
|
|
24,542 |
|
|
— |
|
|
— |
|
|
24,548 |
|
|
Adjustment due to adoption of ASU 2016-09 |
|
— |
|
|
— |
|
|
— |
|
|
— |
|
|
— |
|
|
99 |
|
|
— |
|
|
99 |
|
|
Issuance of equity |
|
159 |
|
|
1 |
|
|
— |
|
|
— |
|
|
1,229 |
|
|
— |
|
|
— |
|
|
1,230 |
|
|
Repurchase of stock |
|
— |
|
|
— |
|
|
(1,828) |
|
|
(106,806) |
|
|
— |
|
|
— |
|
|
— |
|
|
(106,806) |
|
|
Adjustment to non-controlling interest |
|
— |
|
|
— |
|
|
— |
|
|
— |
|
|
(923) |
|
|
— |
|
|
— |
|
|
(923) |
|
|
Net income attributable to Magellan |
|
— |
|
|
— |
|
|
— |
|
|
— |
|
|
— |
|
|
77,879 |
|
|
— |
|
|
77,879 |
|
|
Other comprehensive income—other |
|
— |
|
|
— |
|
|
— |
|
|
— |
|
|
— |
|
|
— |
|
|
87 |
|
|
87 |
|
|
Balance at December 31, 2016 |
|
51,993 |
|
|
520 |
|
|
(28,476) |
|
|
(1,376,197) |
|
|
1,186,283 |
|
|
1,289,288 |
|
|
(175) |
|
|
1,099,719 |
|
|
Stock compensation expense |
|
— |
|
|
— |
|
|
— |
|
|
— |
|
|
39,116 |
|
|
— |
|
|
— |
|
|
39,116 |
|
|
Exercise of stock options |
|
831 |
|
|
8 |
|
|
— |
|
|
— |
|
|
44,347 |
|
|
— |
|
|
— |
|
|
44,355 |
|
|
Issuance of equity |
|
149 |
|
|
2 |
|
|
— |
|
|
— |
|
|
361 |
|
|
— |
|
|
— |
|
|
363 |
|
|
Repurchase of stock |
|
— |
|
|
— |
|
|
(295) |
|
|
(21,765) |
|
|
— |
|
|
— |
|
|
— |
|
|
(21,765) |
|
|
Adjustment to non-controlling interest |
|
— |
|
|
— |
|
|
— |
|
|
— |
|
|
4,704 |
|
|
— |
|
|
— |
|
|
4,704 |
|
|
Net income attributable to Magellan |
|
— |
|
|
— |
|
|
— |
|
|
— |
|
|
— |
|
|
110,207 |
|
|
— |
|
|
110,207 |
|
|
Other comprehensive loss—other |
|
— |
|
|
— |
|
|
— |
|
|
— |
|
|
— |
|
|
— |
|
|
(205) |
|
|
(205) |
|
|
Balance at December 31, 2017 |
|
52,973 |
|
$ |
530 |
|
|
(28,771) |
|
$ |
(1,397,962) |
|
$ |
1,274,811 |
|
$ |
1,399,495 |
|
$ |
(380) |
|
$ |
1,276,494 |
|
See accompanying notes to consolidated financial statements.
MAGELLAN HEALTH, INC. AND SUBSIDIARIES
CONSOLIDATED STATEMENTS OF CASH FLOWS FOR THE YEARS ENDED DECEMBER 31,
(In thousands)
|
|
|
2015 |
|
2016 |
|
2017 |
|
|||
|
Cash flows from operating activities: |
|
|
|
|
|
|
|
|
|
|
|
Net income |
|
$ |
28,707 |
|
$ |
75,789 |
|
$ |
110,141 |
|
|
Adjustments to reconcile net income to net cash from operating activities: |
|
|
|
|
|
|
|
|
|
|
|
Depreciation and amortization |
|
|
102,844 |
|
|
106,046 |
|
|
115,706 |
|
|
Non-cash impairment of intangible assets |
|
|
— |
|
|
4,800 |
|
|
— |
|
|
Non-cash interest expense |
|
|
399 |
|
|
565 |
|
|
4,757 |
|
|
Non-cash stock compensation expense |
|
|
50,384 |
|
|
37,422 |
|
|
39,116 |
|
|
Non-cash income tax (benefit) provision |
|
|
(26,999) |
|
|
4,710 |
|
|
(30,981) |
|
|
Non-cash amortization on investments |
|
|
7,118 |
|
|
5,238 |
|
|
3,924 |
|
|
Changes in assets and liabilities, net of effects from acquisitions of businesses: |
|
|
|
|
|
|
|
|
|
|
|
Accounts receivable, net |
|
|
(52,394) |
|
|
(134,089) |
|
|
(40,910) |
|
|
Pharmaceutical inventory |
|
|
(11,374) |
|
|
(8,246) |
|
|
17,605 |
|
|
Other assets |
|
|
4,149 |
|
|
(13,900) |
|
|
(4,565) |
|
|
Accounts payable and accrued liabilities |
|
|
(36,043) |
|
|
52,470 |
|
|
(84,445) |
|
|
Medical claims payable and other medical liabilities |
|
|
36,187 |
|
|
(8,042) |
|
|
26,235 |
|
|
Contingent consideration |
|
|
55,035 |
|
|
(51,205) |
|
|
696 |
|
|
Tax contingencies |
|
|
(1,021) |
|
|
673 |
|
|
1,681 |
|
|
Deferred credits and other long-term liabilities |
|
|
294 |
|
|
(5,584) |
|
|
3,218 |
|
|
Other |
|
|
171 |
|
|
52 |
|
|
95 |
|
|
Net cash provided by operating activities |
|
|
157,457 |
|
|
66,699 |
|
|
162,273 |
|
|
Cash flows from investing activities: |
|
|
|
|
|
|
|
|
|
|
|
Capital expenditures |
|
|
(71,584) |
|
|
(60,881) |
|
|
(57,232) |
|
|
Acquisitions and investments in businesses, net of cash acquired |
|
|
(55,818) |
|
|
(199,237) |
|
|
(232,403) |
|
|
Purchase of investments |
|
|
(470,093) |
|
|
(478,477) |
|
|
(449,873) |
|
|
Maturity of investments |
|
|
404,308 |
|
|
494,256 |
|
|
423,118 |
|
|
Net cash used in investing activities |
|
|
(193,187) |
|
|
(244,339) |
|
|
(316,390) |
|
|
Cash flows from financing activities: |
|
|
|
|
|
|
|
|
|
|
|
Proceeds from issuance of debt |
|
|
— |
|
|
375,000 |
|
|
1,041,736 |
|
|
Payments to acquire treasury stock |
|
|
(206,044) |
|
|
(106,806) |
|
|
(21,765) |
|
|
Proceeds from exercise of stock options and warrants |
|
|
53,493 |
|
|
25,145 |
|
|
44,355 |
|
|
Payments on debt and capital lease obligations |
|
|
(17,038) |
|
|
(20,891) |
|
|
(803,393) |
|
|
Payments on contingent consideration |
|
|
(20,762) |
|
|
(40,559) |
|
|
(3,032) |
|
|
Tax benefit from exercise of stock options and vesting of stock awards |
|
|
4,073 |
|
|
— |
|
|
— |
|
|
Other |
|
|
409 |
|
|
1,230 |
|
|
(9,560) |
|
|
Net cash (used in) provided by financing activities |
|
|
(185,869) |
|
|
233,119 |
|
|
248,341 |
|
|
Net (decrease) increase in cash and cash equivalents |
|
|
(221,599) |
|
|
55,479 |
|
|
94,224 |
|
|
Cash and cash equivalents at beginning of period |
|
|
470,628 |
|
|
249,029 |
|
|
304,508 |
|
|
Cash and cash equivalents at end of period |
|
$ |
249,029 |
|
$ |
304,508 |
|
$ |
398,732 |
|
|
|
|
|
|
|
|
|
|
|
|
|
See accompanying notes to consolidated financial statements.
MAGELLAN HEALTH, INC. AND SUBSIDIARIES
NOTES TO CONSOLIDATED FINANCIAL STATEMENTS
December 31, 2017
1. General
Basis of Presentation
The consolidated financial statements of Magellan Health, Inc., a Delaware corporation (“Magellan”), include Magellan and its subsidiaries (together with Magellan, the “Company”). All significant intercompany accounts and transactions have been eliminated in consolidation.
Business Overview
The Company is a leader within the healthcare management business, and is focused on delivering innovative specialty solutions for the fastest growing, most complex areas of health, including special populations, complete pharmacy benefits, and other specialty carve-out areas of healthcare. The Company develops innovative solutions that combine advanced analytics, agile technology and clinical excellence to drive better decision making, positively impact members’ health outcomes and optimize the cost of care for the customers we serve. The Company provides services to health plans and other managed care organizations (“MCOs”), employers, labor unions, various military and governmental agencies and third party administrators (“TPAs”). Magellan operates three segments: Healthcare, Pharmacy Management and Corporate.
Healthcare
The Healthcare segment is comprised of two reporting units – Commercial and Government.
The Commercial reporting unit’s customers include health plans, accountable care organizations (“ACOs”), and employers for whom Magellan provides carve-out management services for behavioral health, employee assistance plans (“EAP”), and other areas of specialty healthcare including diagnostic imaging, musculoskeletal management, cardiac, and physical medicine. These management services are applied to a health plan’s or ACO’s entire book of business including commercial, Medicaid and Medicare members or targeted complex populations basis.
The Government reporting unit contracts with local, state and federal governmental agencies to provide services to recipients under Medicaid, Medicare and other government programs. Currently these management services include behavioral health and EAP. The management of total medical cost, as well as long term support services, for special populations is delivered through Magellan Complete Care (“MCC”). These special populations include individuals with serious mental illness (“SMI”), dual eligibles, aged, blind and disabled (“ABD”) and other populations with unique and often complex healthcare needs.
Magellan’s coordination and management of these healthcare and long term support services are provided through its comprehensive network of medical and behavioral health professionals, clinics, hospitals, skilled nursing facilities, home care agencies and ancillary service providers. This network of credentialed providers is integrated with clinical and quality improvement programs to improve access to care and enhance the healthcare experience for individuals in need of care, while at the same time making the cost of these services more affordable for our customers. The Company generally does not directly provide or own any provider of treatment services, although it does employ licensed behavioral health counselors to deliver non‑medical counseling under certain government contracts.
The Company provides its Healthcare management services primarily through: (i) risk‑based products, where the Company assumes all or a substantial portion of the responsibility for the cost of providing treatment services in exchange for a fixed per member per month fee, or (ii) administrative services only (“ASO”) products, where the Company provides services such as utilization review, claims administration and/or provider network management, but does not assume full responsibility for the cost of the treatment services, in exchange for an administrative fee and, in some instances, a gain share.
Pharmacy Management
The Pharmacy Management segment (“Pharmacy Management”) is comprised of products and solutions that provide clinical and financial management of pharmaceuticals paid under both the medical and the pharmacy benefit. Pharmacy Management’s services include: (i) pharmacy benefit management (“PBM”) services; (ii) pharmacy benefit administration (“PBA”) for state Medicaid and other government sponsored programs; (iii) pharmaceutical dispensing operations; (iv) clinical and formulary management programs; (v) medical pharmacy management programs; and (vi) programs for the integrated management of specialty drugs across both the medical and pharmacy benefit that treat complex conditions, regardless of site of service, method of delivery, or benefit reimbursement.
These services are available individually, in combination, or in a fully integrated manner. The Company markets its pharmacy management services to health plans, employers, third party administrators, managed care organizations, state governments, Medicare Part D, and other government agencies, exchanges, brokers and consultants. In addition, the Company will continue to upsell its pharmacy products to its existing customers and market its pharmacy solutions to the Healthcare customer base.
Pharmacy Management contracts with its customers for services using risk‑based, gain share or ASO arrangements. In addition, Pharmacy Management provides services to the Healthcare segment for its MCC business.
Corporate
This segment of the Company is comprised primarily of amounts not allocated to the Healthcare and Pharmacy Management segments that are largely associated with costs related to being a publicly traded company.
2. Summary of Significant Accounting Policies
Recent Accounting Pronouncements
In May 2014, the Financial Accounting Standards Board (“FASB”) issued Accounting Standards Update (“ASU”) No. 2014-09, “Revenue from Contracts with Customers (Topic 606)” (“ASU 2014-09”), which is a new comprehensive revenue recognition standard that will supersede virtually all existing revenue guidance under GAAP. In March 2016, the FASB issued ASU 2016-08, “Revenue from Contracts with Customers (Topic 606): Principal versus Agent Considerations (Reporting Revenue Gross versus Net)” (“ASU 2016-08”), which clarifies the implementation guidance on principal versus agent considerations. In April 2016, the FASB issued ASU No. 2016-10, “Revenue from Contracts with Customers (Topic 606): Identifying Performance Obligations and Licensing” (“ASU 2016-10”), which clarifies the performance obligations and licensing implementation guidance of ASU 2014-09. In July 2015, the FASB deferred the effective date of ASU 2014-09. In December 2016, the FASB issued ASU No. 2016-20, “Technical Corrections and Improvements to Topic 606, Revenue from Contracts with Customers” (“ASU 2016-20”), which amends various aspects of ASU 2014-09. The amendments of ASU 2014-09, along with the subsequent updates and clarifications collectively known as Accounting Standard Codification 606 (“ASC 606”), are effective for annual and interim reporting periods of public entities beginning after December 15, 2017. The Company intends to adopt ASC 606 on a modified retrospective basis. The Company has completed preliminary reviews of each revenue stream and is assessing the impact of adoption under ASC 606. Within the PBM and dispensing revenue streams, exclusive of Medicare Part D, the Company has substantially completed its review under the new standard and determined that ASC 606 will not have a material impact on the Company’s consolidated results of operations, financial position and cash flows. Within the managed care and other revenue streams, the Company continues to assess the potential impact. At this time, the Company has not identified a material impact of adoption, however, the Company has also not completed its review of the impact on interim reporting. Based on further analysis, the Company determined there will be no impact to the recognition of the Patient Protection and Affordable Care Act health insurer fee (“HIF”) revenue under ASC 606 and it will not have a cumulative effect adjustment related to HIF upon the adoption of ASC 606.
In July 2015, the FASB issued ASU No. 2015‑11, “Inventory (Topic 330): Simplifying the Measurement of Inventory” (“ASU 2015‑11”). The amendment under this ASU requires that an entity measure inventory at the lower of cost or net realizable value. This guidance is effective for annual and interim reporting periods of public entities beginning after December 15, 2016 and was adopted by the Company in the quarter ended March 31, 2017. The effect of this guidance was immaterial to the Company’s consolidated results of operations, financial position and cash flows.
In February 2016, the FASB issued ASU No. 2016‑02, “Leases” (“ASU 2016‑02”). This ASU amends the existing accounting standards for lease accounting, including requiring lessees to recognize most leases on their balance sheets. This guidance is effective for annual and interim reporting periods of public entities beginning after December 15, 2018, with early adoption permitted. The Company is currently assessing the impact of adoption, but believes the effect of this ASU will have a material effect on the Company’s consolidated balance sheets. The Company is currently assessing the potential impact this ASU will have on the Company’s consolidated results of operations, financial position and cash flows.
In June 2016, the FASB issued ASU No. 2016-13, “Financial Instruments-Credit Losses (Topic 326): Measurement of Credit Losses on Financial Instruments” (“ASU 2016-13”). This ASU amends the accounting on reporting credit losses for assets held at amortized cost basis and available for sale debt securities. This guidance is effective for annual and interim periods of public entities beginning after December 15, 2019, with early adoption permitted for fiscal years beginning after December 31, 2018. The Company is currently assessing the potential impact this ASU will have on the Company’s consolidated results of operation, financial position and cash flows.
In August 2016, the FASB issued ASU No. 2016-15, “Statement of Cash Flows (Topic 230): Classification of Certain Cash Receipts and Cash Payments” (“ASU 2016-15”). This ASU makes eight targeted changes to how cash receipts and cash payments are presented and classified in the statement of cash flows. This guidance is effective for annual and interim periods of public entities beginning after December 15, 2017, with early adoption permitted. The Company is currently assessing the potential impact this ASU will have on the Company’s consolidated results of operation, financial positions and cash flows.
In October 2016, the FASB issued ASU 2016-16, “Income Taxes (Topic 740): Intra-Entity Transfers of Assets Other Than Inventory” (“ASU 2016-16”). The amendments in this ASU require that entities recognize the income tax consequences of an intra-entity transfer of an asset other than inventory when the transfer occurs. This guidance is effective for annual and interim periods of public entities beginning after December 15, 2017, with early adoption permitted. The Company does not anticipate this ASU will have a material impact on the Company’s consolidated results of operation, financial positions and cash flows.
In December 2016, the FASB issued ASU 2016-19, “Technical Corrections and Improvements” (“ASU 2016-19”). The amendments in this ASU cover a wide range of Topics in the Accounting Standard Codification, including internal use software covered under Subtopic 350-40. This guidance is effective for annual and interim periods of public entities beginning after December 15, 2016 and was adopted by the Company in the quarter ended March 31, 2017. The effect of this guidance was immaterial to the Company’s consolidated results of operations, financial position and cash flows.
In January 2017, the FASB issued ASU No. 2017-01, “Business Combinations (Topic 805): Clarifying the Definition of a Business” (“ASU 2017-01”). The amendments in this ASU clarify whether transactions should be accounted for as acquisitions (or disposals) of assets or businesses. This guidance is effective for annual and interim periods of public entities beginning after December 15, 2017, with early adoption permitted. The Company does not anticipate this ASU will have a material impact on the Company’s consolidated results of operation, financial positions and cash flows.
In January 2017, the FASB issued ASU No. 2017-04, “Intangibles-Goodwill and Other (Topic 350): Simplifying the Test for Goodwill Impairment” (“ASU 2017-04”). The amendments in this ASU eliminate the requirement to calculate the implied fair value of goodwill to measure a goodwill impairment charge. This guidance is effective for annual and interim periods of public entities beginning after December 15, 2019, with early adoption permitted. The Company is currently assessing the potential impact this ASU will have on the Company’s consolidated results of operations, financial position and cash flows.
In May 2017, the FASB issued ASU No. 2017-09, “Compensation-Stock Compensation (Topic 718): Scope of Modification Accounting” (“ASU 2017-09”). The amendments in this ASU include guidance on determining which changes to the terms and conditions of share-based payment awards require an entity to apply modification accounting under Topic 718. This guidance is effective for annual and interim periods of public entities beginning after December 15, 2017, with early adoption permitted. The Company does not anticipate this ASU will have a material impact on the Company’s consolidated results of operation, financial positions and cash flows.
Use of Estimates
The preparation of financial statements in conformity with accounting principles generally accepted in the United States requires management to make estimates and assumptions that affect the reported amounts of assets and liabilities and the disclosure of contingent assets and liabilities at the date of the financial statements and the reported amounts of revenue and expenses during the reporting period. Significant estimates of the Company include, among other things, accounts receivable realization, valuation allowances for deferred tax assets, valuation of goodwill and intangible assets, medical claims payable, other medical liabilities, contingent consideration, stock compensation assumptions, tax contingencies and legal liabilities. Actual results could differ from those estimates.
Managed Care and Other Revenue
Managed Care Revenue. Managed care revenue, inclusive of revenue from the Company’s risk, EAP and ASO contracts, is recognized over the applicable coverage period on a per member basis for covered members. The Company is paid a per member fee for all enrolled members, and this fee is recorded as revenue in the month in which members are entitled to service. The Company adjusts its revenue for retroactive membership terminations, additions and other changes, when such adjustments are identified, with the exception of retroactivity that can be reasonably estimated. The impact of retroactive rate amendments is generally recorded in the accounting period in which terms to the amendment are finalized, and that the amendment is executed. Any fees paid prior to the month of service are recorded as deferred revenue. Managed care revenues approximated $2.7 billion, $2.3 billion and $2.7 billion for the years ended December 31, 2015, 2016 and 2017, respectively.
Fee‑For‑Service, Fixed Fee and Cost‑Plus Contracts. The Company has certain contracts with customers under which the Company recognizes revenue as services are performed and as costs are incurred. This includes revenues received in relation to the HIF fee billed on a cost reimbursement basis. The Consolidated Appropriations Act of 2016 imposed a one-year moratorium on the HIF fee, suspending its application for 2017. Revenues from these contracts approximated $342.0 million, $503.2 million and $604.3 million for the years ended December 31, 2015, 2016 and 2017, respectively.
Rebate Revenue. The Company administers a rebate program for certain clients through which the Company coordinates the achievement, calculation and collection of rebates and administrative fees from pharmaceutical manufacturers on behalf of clients. Each period, the Company estimates the total rebates earned based on actual volumes of pharmaceutical purchases by the Company’s clients, as well as historical and/or anticipated sharing percentages. The Company earns fees based upon the volume of rebates generated for its clients. The Company does not record as rebate revenue any rebates that are passed through to its clients. Total rebate revenues for the years ended December 31, 2015, 2016 and 2017 approximated $88.7 million, $85.4 million and $91.9 million, respectively.
In relation to the Company’s PBM business, the Company administers rebate programs through which it receives rebates from pharmaceutical manufacturers that are shared with its customers. The Company recognizes rebates when the Company is entitled to them and when the amounts of the rebates are determinable. The amount recorded for rebates earned by the Company from the pharmaceutical manufacturers is recorded as a reduction of cost of goods sold.
PBM and Dispensing Revenue
Pharmacy Benefit Management Revenue. The Company recognizes PBM revenue, which consists of a negotiated prescription price (ingredient cost plus dispensing fee), co‑payments collected by the pharmacy and any associated administrative fees, when claims are adjudicated. The Company recognizes PBM revenue on a gross basis (i.e. including drug costs and co‑payments) as it is acting as the principal in the arrangement and is contractually obligated to its clients and network pharmacies, which is a primary indicator of gross reporting. In addition, the Company is solely responsible for the claims adjudication process, negotiating the prescription price for the pharmacy, collection of payments from the client for drugs dispensed by the pharmacy, and managing the total prescription drug relationship with the client’s members. If the Company enters into a contract where it is only an administrator, and does not assume any of the risks previously noted, revenue will be recognized on a net basis. PBM revenues approximated $1.2 billion, $1.5 billion and $1.7 billion for the years ended December 31, 2015, 2016 and 2017, respectively.
Dispensing Revenue. The Company recognizes dispensing revenue, which includes the co‑payments received from members of the health plans the Company serves, when the specialty pharmaceutical drugs are shipped. At the time of shipment, the earnings process is complete; the obligation of the Company’s customer to pay for the specialty pharmaceutical drugs is fixed, and, due to the nature of the product, the member may neither return the specialty pharmaceutical drugs nor receive a refund. Revenues from the dispensing of specialty pharmaceutical drugs on behalf of health plans approximated $211.6 million, $221.8 million and $206.0 million for the years ended December 31, 2015, 2016 and 2017, respectively.
Medicare Part D. The Company is contracted with the Centers for Medicare and Medicaid (“CMS”) as a Prescription Drug Plan (“PDP”) to provide prescription drug benefits to Medicare beneficiaries. Net revenues include premiums earned by the PDP, which includes a direct premium paid by CMS and a beneficiary premium paid by the PDP member. In cases of low-income members, the beneficiary premium may be subsidized by CMS. The Company recognizes premium revenues on a monthly basis on a per member basis for covered members. In addition to these premiums, net revenue includes certain payments from the members based on the members’ actual prescription claims, including co-payments, coverage gap benefits, deductibles and co-insurance (collectively, “Member Responsibilities”). The Company receives a prospective subsidy payment from CMS each month to subsidize a portion of the Member Responsibilities for low-income members. If the prospective subsidy differs from actual prescription claims, the difference is recorded as either a receivable or payable on the consolidated balance sheets. The Company assumes no risk for the Member Responsibilities, including the portion subsidized by CMS. The Company recognizes revenues for Member Responsibilities, including the portion subsidized by CMS, on a gross basis as claims are adjudicated. CMS also provides an annual risk corridor adjustment which compares the Company’s actual drug costs incurred to the premiums received. Based on the risk corridor adjustment, the Company may receive additional premiums from CMS or may be required to refund CMS a portion of previously received premiums. The Company calculates the risk corridor adjustment on a quarterly basis and the amount is included in net revenues with a corresponding receivable or payable on the consolidated balance sheets. Medicare Part D revenues approximated $272.8 million and $511.0 million for the years ended December 31, 2016 and 2017, respectively, including co-payments, which are included in PBM revenues above, of $31.0 million and $70.6 million for the years ended December 31, 2016 and 2017, respectively. As of December 31, 2016 and 2017, the Company had $117.5 million and $131.5 million, respectively, in net receivables associated with Medicare Part D from CMS and other parties related to this business.
Significant Customers
Customers exceeding ten percent of the consolidated Company’s net revenues
The Company has a contract with the State of Florida to provide integrated healthcare services to Medicaid enrollees in the state of Florida (“the Florida Contract”). The Florida Contract began on February 4, 2014 and extends through December 31, 2018, unless sooner terminated by the parties. The State of Florida has the right to terminate the Florida Contract with cause, as defined, upon 24 hour notice and upon 30 days notice for any reason or no reason at all. The Florida Contracts generated net revenues of $439.5 million, $548.7 million and $605.9 million for the years ended December 31, 2015, 2016 and 2017, respectively.
Through December 31, 2015, the Company provided behavioral healthcare management and other related services to members in the state of Iowa pursuant to contracts with the State of Iowa (the “Iowa Contracts”). The Iowa Contracts terminated on December 31, 2015. The Iowa Contracts generated net revenues of $530.3 million and $13.5 million for the years ended December 31, 2015 and 2016, respectively.
Customers exceeding ten percent of segment net revenues
In addition to the Florida Contract and Iowa Contracts previously discussed, the following customers generated in excess of ten percent of net revenues for the respective segment for the years ended December 31, 2015, 2016 and 2017 (in thousands):
|
Segment |
|
Term Date |
|
2015 |
|
2016 |
|
2017 |
|
|||
|
|
|
|
|
|
|
|
|
|
|
|
|
|
|
Healthcare |
|
|
|
|
|
|
|
|
|
|
|
|
|
None |
|
|
|
|
|
|
|
|
|
|
|
|
|
|
|
|
|
|
|
|
|
|
|
|
|
|
|
Pharmacy Management |
|
|
|
|
|
|
|
|
|
|
|
|
|
Customer A |
|
December 31, 2016 (1) |
|
$ |
324,809 |
|
$ |
264,152 |
|
$ |
4,764 |
* |
|
Customer B |
|
March 31, 2019 |
|
|
— |
|
|
152,218 |
* |
|
346,405 |
|
* Revenue amount did not exceed 10 percent of net revenues for the respective segment for the year presented. Amount is shown for comparative purposes only.
|
(1) |
A vast majority of this customer’s revenues were generated from drug acquisition costs related to PBM services which terminated on September 1, 2016. The Company continues to provide specialty drug formulary management services to the customer and is in negotiations with the customer to extend this contract. |
Concentration of Business
The Company also has a significant concentration of business with various counties in the State of Pennsylvania (the “Pennsylvania Counties”) which are part of the Pennsylvania Medicaid program, with members under its contract with CMS and with various agencies and departments of the United States federal government. Net revenues from the Pennsylvania Counties in the aggregate totaled $395.7 million, $461.6 million and $490.0 million for the years ended December 31, 2015, 2016 and 2017, respectively. Net revenues from members in relation to its contract with CMS in aggregate totaled $272.8 million and $511.0 million for the years ended December 31, 2016 and 2017, respectively. Net revenues from contracts with various agencies and departments of the United States federal government in aggregate totaled $164.3 million, $252.5 million, and $341.5 million for the years ended December 31, 2015, 2016 and 2017, respectively.
The Company’s contracts with customers typically have terms of one to three years, and in certain cases contain renewal provisions (at the customer’s option) for successive terms of between one and two years (unless terminated earlier). Substantially all of these contracts may be immediately terminated with cause and many of the Company’s contracts are terminable without cause by the customer or the Company either upon the giving of requisite notice and the passage of a specified period of time (typically between 60 and 180 days) or upon the occurrence of other specified events. In addition, the Company’s contracts with federal, state and local governmental agencies generally are conditioned on legislative appropriations. These contracts generally can be terminated or modified by the customer if such appropriations are not made.
Income Taxes
The Company files a consolidated federal income tax return with most of its eighty-percent or more controlled subsidiaries. The Company previously filed separate consolidated federal income tax returns for AlphaCare of New York, Inc. (“AlphaCare”) and its parent, AlphaCare Holdings, Inc. (“AlphaCare Holdings”). During 2017, AlphaCare and AlphaCare Holdings became members of the Magellan federal consolidated group. The Company and its subsidiaries also file income tax returns in various state and local jurisdictions.
The Company estimates income taxes for each of the jurisdictions in which it operates. This process involves determining both permanent and temporary differences resulting from differing treatment for tax and book purposes. Deferred tax assets and/or liabilities are determined by multiplying the temporary differences between the financial reporting and tax reporting bases for assets and liabilities by the enacted tax rates expected to be in effect when such differences are recovered or settled. The Company then assesses the likelihood that the deferred tax assets will be recovered from the reversal of temporary differences, the implementation of feasible and prudent tax planning strategies, and future taxable income. To the extent the Company cannot conclude that recovery is more likely than not, it establishes a valuation allowance. The effect of a change in tax rates on deferred taxes is recognized in income in the period that includes the enactment date.
Reversals of both valuation allowances and unrecognized tax benefits are recorded in the period they occur, typically as reductions to income tax expense. However, reversals of unrecognized tax benefits related to deductions for stock compensation in excess of the related book expense are recorded as reductions to deferred tax assets, although prior to the adoption of ASU 2016-09 in 2016 were recorded as increases in additional paid‑in capital.
The Company recognizes interim period income taxes by estimating an annual effective tax rate and applying it to year‑to‑date results. The estimated annual effective tax rate is periodically updated throughout the year based on actual results to date and an updated projection of full year income. Although the effective tax rate approach is generally used for interim periods, taxes on significant, unusual and infrequent items are recognized at the statutory tax rate entirely in the period the amounts are realized.
Health Care Reform
The Patient Protection and the Affordable Care Act, as amended by the Health Care and Education Reconciliation Act of 2010 (collectively, the “Health Reform Law”), imposes a mandatory annual fee on health insurers for each calendar year beginning on or after January 1, 2014. The Company has obtained rate adjustments from customers which the Company expects will cover the direct costs of these fees and the impact from non‑deductibility of such fees for federal and state income tax purposes. To the extent the Company has such a customer that does not renew, there may be some impact due to taxes paid where the timing and amount of recoupment of these additional costs is uncertain. In the event the Company is unable to obtain rate adjustments to cover the financial impact of the annual fee, the fee may have a material impact on the Company. The Consolidated Appropriations Act of 2016 imposed a one-year moratorium on the HIF fee, suspending its application for 2017. The HIF fee went back into effect for 2018, however, on January 23, 2018 the United States Congress passed the Continuing Resolution which imposed another one-year moratorium on the HIF fee, suspending its application for 2019. For 2015 and 2016, the HIF fees were $26.5 million and $26.5 million, respectively, which have been paid and which are included in direct service costs and other operating expenses in the consolidated statements of income.
Cash and Cash Equivalents
Cash equivalents are short‑term, highly liquid interest‑bearing investments with maturity dates of three months or less when purchased, consisting primarily of money market instruments. At December 31, 2017, the Company’s excess capital and undistributed earnings for the Company’s regulated subsidiaries of $143.9 million are included in cash and cash equivalents.
Restricted Assets
The Company has certain assets which are considered restricted for: (i) the payment of claims under the terms of certain managed care contracts; (ii) regulatory purposes related to the payment of claims in certain jurisdictions; and (iii) the maintenance of minimum required tangible net equity levels for certain of the Company’s subsidiaries. Significant restricted assets of the Company as of December 31, 2016 and 2017 were as follows (in thousands):
|
|
|
2016 |
|
2017 |
|
||
|
Restricted cash and cash equivalents |
|
$ |
81,776 |
|
$ |
229,013 |
|
|
Restricted short-term investments |
|
|
227,795 |
|
|
219,111 |
|
|
Restricted deposits (included in other current assets) |
|
|
38,785 |
|
|
41,121 |
|
|
Restricted long-term investments |
|
|
6,306 |
|
|
17,287 |
|
|
Total |
|
$ |
354,662 |
|
$ |
506,532 |
|
The Company’s equity in restricted net assets of consolidated subsidiaries represented approximately 27% of the Company’s consolidated stockholder’s equity as of December 31, 2017 and consisted of net assets of the Company which were restricted as to transfer to Magellan in the form of cash dividends, loans or advances under regulatory restrictions.
Fair Value Measurements
The Company has certain assets and liabilities that are required to be measured at fair value on a recurring basis. These assets and liabilities are to be measured using inputs from the three levels of the fair value hierarchy, which are as follows:
Level 1—Inputs are unadjusted quoted prices in active markets for identical assets or liabilities that the Company has the ability to access at the measurement date.
Level 2—Inputs include quoted prices for similar assets and liabilities in active markets, quoted prices for identical or similar assets or liabilities in markets that are not active, inputs other than quoted prices that are observable for the asset or liability (i.e., interest rates, yield curves, etc.), and inputs that are derived principally from or corroborated by observable market data by correlation or other means (market corroborated inputs).
Level 3—Unobservable inputs that reflect the Company’s assumptions about the assumptions that market participants would use in pricing the asset or liability. The Company develops these inputs based on the best information available, including the Company’s data.
In accordance with the fair value hierarchy described above, the following table shows the fair value of the Company’s financial assets and liabilities that are required to be measured at fair value as of December 31, 2016 and 2017 (in thousands):
|
|
|
December 31, 2016 |
|
||||||||||
|
|
|
Level 1 |
|
Level 2 |
|
Level 3 |
|
Total |
|
||||
|
Assets |
|
|
|
|
|
|
|
|
|
|
|
|
|
|
Cash and cash equivalents (1) |
|
$ |
— |
|
$ |
177,495 |
|
$ |
— |
|
$ |
177,495 |
|
|
Investments: |
|
|
|
|
|
|
|
|
|
|
|
|
|
|
U.S. Government and agency securities |
|
|
5,817 |
|
|
— |
|
|
— |
|
|
5,817 |
|
|
Obligations of government-sponsored enterprises (2) |
|
|
— |
|
|
25,767 |
|
|
— |
|
|
25,767 |
|
|
Corporate debt securities |
|
|
— |
|
|
272,219 |
|
|
— |
|
|
272,219 |
|
|
Certificates of deposit |
|
|
— |
|
|
1,450 |
|
|
— |
|
|
1,450 |
|
|
Total assets held at fair value |
|
$ |
5,817 |
|
$ |
476,931 |
|
$ |
— |
|
$ |
482,748 |
|
|
|
|
|
|
|
|
|
|
|
|
|
|
|
|
|
Liabilities |
|
|
|
|
|
|
|
|
|
|
|
|
|
|
Contingent consideration |
|
$ |
— |
|
$ |
— |
|
$ |
11,153 |
|
$ |
11,153 |
|
|
Total liabilities held at fair value |
|
$ |
— |
|
$ |
— |
|
$ |
11,153 |
|
$ |
11,153 |
|
|
|
|
December 31, 2017 |
|
||||||||||
|
|
|
Level 1 |
|
Level 2 |
|
Level 3 |
|
Total |
|
||||
|
Assets |
|
|
|
|
|
|
|
|
|
|
|
|
|
|
Cash and cash equivalents (3) |
|
$ |
— |
|
$ |
284,064 |
|
$ |
— |
|
$ |
284,064 |
|
|
Investments: |
|
|
|
|
|
|
|
|
|
|
|
|
|
|
U.S. Government and agency securities |
|
|
28,231 |
|
|
— |
|
|
— |
|
|
28,231 |
|
|
Obligations of government-sponsored enterprises (2) |
|
|
— |
|
|
22,088 |
|
|
— |
|
|
22,088 |
|
|
Corporate debt securities |
|
|
— |
|
|
269,788 |
|
|
— |
|
|
269,788 |
|
|
Taxable municipal bonds |
|
|
— |
|
|
5,000 |
|
|
— |
|
|
5,000 |
|
|
Certificates of deposit |
|
|
— |
|
|
2,758 |
|
|
— |
|
|
2,758 |
|
|
Total assets held at fair value |
|
$ |
28,231 |
|
$ |
583,698 |
|
$ |
— |
|
$ |
611,929 |
|
|
|
|
|
|
|
|
|
|
|
|
|
|
|
|
|
Liabilities |
|
|
|
|
|
|
|
|
|
|
|
|
|
|
Contingent consideration |
|
$ |
— |
|
$ |
— |
|
$ |
8,817 |
|
$ |
8,817 |
|
|
Total liabilities held at fair value |
|
$ |
— |
|
$ |
— |
|
$ |
8,817 |
|
$ |
8,817 |
|
|
(1) |
Excludes $127.0 million of cash held in bank accounts by the Company. |
|
(2) |
Includes investments in notes issued by the Federal Home Loan Bank, Federal Farm Credit Banks and Federal National Mortgage Association. |
|
(3) |
Excludes $114.7 million of cash held in bank accounts by the Company. |
For the years ended December 31, 2016 and 2017, the Company did not transfer any assets between fair value measurement levels.
The carrying values of financial instruments, including accounts receivable and accounts payable, approximate their fair values due to their short-term maturities. The fair value of the Notes (as defined below) of $409.2 million as of December 31, 2017 was determined based on quoted market prices and would be classified within Level 1 of the fair value hierarchy. The estimated fair value of the Company’s term loan of $345.6 million as of December 31, 2017 was based on current interest rates for similar types of borrowings and is in Level 2 of the fair value hierarchy. The estimated fair values may not represent actual values of the financial instruments that could be realized as of the balance sheet date or that will be realized in the future.
All of the Company’s investments are classified as “available-for-sale” and are carried at fair value.
As of the balance sheet date, the fair value of contingent consideration is determined based on probabilities of payment, projected payment dates, discount rates, projected operating income, member engagement and new contract execution. The Company used a probability weighted discounted cash flow method to arrive at the fair value of the contingent consideration. As the fair value measurement for the contingent consideration is based on inputs not observed in the market, these measurements are classified as Level 3 measurements as defined by fair value measurement guidance. The unobservable inputs used in the fair value measurement include the discount rate, probabilities of payment and projected payment dates.
As of December 31, 2016 and 2017, the Company estimated undiscounted future contingent payments of $12.7 million and $9.9 million, respectively. The net decrease was mainly due to payments made in 2017 and changes in operational forecasts and probabilities of payment. As of December 31, 2017, the aggregate amounts and projected dates of future potential contingent consideration payments were $7.2 million in 2018 and $2.7 million in 2020.
As of December 31, 2016, the fair value of the short-term and long-term contingent consideration was $9.4 million and $1.8 million, respectively, and is included in short-term contingent consideration and long-term contingent consideration, respectively, in the consolidated balance sheets. As of December 31, 2017, the fair value of the short-term and long-term contingent consideration was $6.9 million and $1.9 million, respectively, and is included in short-term contingent consideration and long-term contingent consideration, respectively, in the consolidated balance sheets.
The change in the fair value of the contingent consideration was $(0.1) million and $0.7 million for the years ended December 31, 2016 and 2017, respectively, which were recorded as direct service costs and other operating expenses in the consolidated statements of income. The increases during 2017 were mainly a result of changes in present value and the estimated undiscounted liability.
The following table summarizes the Company’s liability for contingent consideration (in thousands):
|
|
|
December 31, |
|
December 31, |
|
||
|
|
|
2016 |
|
2017 |
|
||
|
Balance as of beginning of period |
|
$ |
92,426 |
|
$ |
11,153 |
|
|
Acquisition of TMG |
|
|
2,244 |
|
|
— |
|
|
Acquisition of AFSC |
|
|
8,247 |
|
|
— |
|
|
Changes in fair value |
|
|
(104) |
|
|
696 |
|
|
Payments |
|
|
(91,660) |
|
|
(3,032) |
|
|
Balance as of end of period |
|
$ |
11,153 |
|
$ |
8,817 |
|
Investments
All of the Company’s investments are classified as “available‑for‑sale” and are carried at fair value. Securities which have been classified as Level 1 are measured using quoted market prices in active markets for identical assets or liabilities while those which have been classified as Level 2 are measured using quoted prices for identical assets and liabilities in markets that are not active. The Company’s policy is to classify all investments with contractual maturities within one year as current. Investment income is recognized when earned and reported net of investment expenses. Net unrealized holding gains or losses are excluded from earnings and are reported, net of tax, as “accumulated other comprehensive income (loss)” in the accompanying consolidated balance sheets and consolidated statements of comprehensive income until realized, unless the losses are deemed to be other‑than‑temporary. Realized gains or losses, including any provision for other‑than‑temporary declines in value, are included in the consolidated statements of income.
If a debt security is in an unrealized loss position and the Company has the intent to sell the debt security, or it is more likely than not that the Company will have to sell the debt security before recovery of its amortized cost basis, the decline in value is deemed to be other‑than‑temporary and is recorded to other‑than‑temporary impairment losses recognized in income in the consolidated statements of income. For impaired debt securities that the Company does not intend to sell or it is more likely than not that the Company will not have to sell such securities, but the Company expects that it will not fully recover the amortized cost basis, the credit component of the other‑than‑temporary impairment is recognized in other‑than‑temporary impairment losses recognized in income in the consolidated statements of income and the non‑credit component of the other‑than‑temporary impairment is recognized in other comprehensive income.
The credit component of an other‑than‑temporary impairment is determined by comparing the net present value of projected future cash flows with the amortized cost basis of the debt security. The net present value is calculated by discounting the best estimate of projected future cash flows at the effective interest rate implicit in the debt security at the date of acquisition. Cash flow estimates are driven by assumptions regarding probability of default, including changes in credit ratings, and estimates regarding timing and amount of recoveries associated with a default. Furthermore, unrealized losses entirely caused by non‑credit related factors related to debt securities for which the Company expects to fully recover the amortized cost basis continue to be recognized in accumulated other comprehensive income.
As of December 31, 2016 and 2017, there were no material unrealized losses that the Company believed to be other‑than‑temporary. No realized gains or losses were recorded for the years ended December 31, 2015, 2016, or 2017. The following is a summary of short-term and long-term investments at December 31, 2016 and 2017 (in thousands):
|
|
|
December 31, 2016 |
|
||||||||||
|
|
|
|
|
|
Gross |
|
Gross |
|
|
|
|||
|
|
|
Amortized |
|
Unrealized |
|
Unrealized |
|
Estimated |
|
||||
|
|
|
Cost |
|
Gains |
|
Losses |
|
Fair Value |
|
||||
|
U.S. Government and agency securities |
|
$ |
5,832 |
|
$ |
— |
|
$ |
(15) |
|
$ |
5,817 |
|
|
Obligations of government-sponsored enterprises (1) |
|
|
25,779 |
|
|
2 |
|
|
(14) |
|
|
25,767 |
|
|
Corporate debt securities |
|
|
272,479 |
|
|
1 |
|
|
(261) |
|
|
272,219 |
|
|
Certificates of deposit |
|
|
1,450 |
|
|
— |
|
|
— |
|
|
1,450 |
|
|
Total investments at December 31, 2016 |
|
$ |
305,540 |
|
$ |
3 |
|
$ |
(290) |
|
$ |
305,253 |
|
|
|
|
December 31, 2017 |
|
||||||||||
|
|
|
|
|
|
Gross |
|
Gross |
|
|
|
|||
|
|
|
Amortized |
|
Unrealized |
|
Unrealized |
|
Estimated |
|
||||
|
|
|
Cost |
|
Gains |
|
Losses |
|
Fair Value |
|
||||
|
U.S. Government and agency securities |
|
$ |
28,313 |
|
$ |
— |
|
$ |
(82) |
|
$ |
28,231 |
|
|
Obligations of government-sponsored enterprises (1) |
|
|
22,139 |
|
|
— |
|
|
(51) |
|
|
22,088 |
|
|
Corporate debt securities |
|
|
270,154 |
|
|
1 |
|
|
(367) |
|
|
269,788 |
|
|
Taxable municipal bonds |
|
|
5,000 |
|
|
— |
|
|
— |
|
|
5,000 |
|
|
Certificates of deposit |
|
|
2,758 |
|
|
— |
|
|
— |
|
|
2,758 |
|
|
Total investments at December 31, 2017 |
|
$ |
328,364 |
|
$ |
1 |
|
$ |
(500) |
|
$ |
327,865 |
|
|
(1) |
Includes investments in notes issued by the Federal Home Loan Bank, Federal National Mortgage Association and Federal Farm Credit Banks. |
The maturity dates of the Company’s investments as of December 31, 2017 are summarized below (in thousands):
|
|
|
Amortized |
|
Estimated |
|
||
|
|
|
Cost |
|
Fair Value |
|
||
|
2018 |
|
$ |
310,989 |
|
$ |
310,578 |
|
|
2019 |
|
|
17,375 |
|
|
17,287 |
|
|
Total investments at December 31, 2017 |
|
$ |
328,364 |
|
$ |
327,865 |
|
Accounts Receivable
The Company’s accounts receivable consists of amounts due from customers throughout the United States. Collateral is generally not required. The Company establishes an allowance for doubtful accounts based upon factors surrounding the credit risk of specific customers, historical trends and other information. Management believes the allowance for doubtful accounts is adequate to provide for normal credit losses.
Concentration of Credit Risk
Accounts receivable subjects the Company to a concentration of credit risk with third party payors that include health insurance companies, managed healthcare organizations, healthcare providers and governmental entities.
The Company maintains cash and cash equivalents balances at financial institutions which are insured by the Federal Deposit Insurance Corporation (“FDIC”). At times, balances in certain bank accounts may exceed the FDIC insured limits.
Pharmaceutical Inventory
Pharmaceutical inventory consists solely of finished goods (primarily prescription drugs) and is stated at the lower of first‑in first‑out, cost, or market.
Long‑lived Assets
Long‑lived assets, including property and equipment and intangible assets to be held and used, are currently reviewed for impairment whenever events or changes in circumstances indicate that the carrying amount of an asset may not be recoverable. We group and evaluate these long-lived assets for impairment at the lowest level at which individual cash flows can be identified. Impairment is determined by comparing the carrying value of these long‑lived assets to management’s best estimate of the future undiscounted cash flows expected to result from the use of the assets and their eventual disposition. The cash flow projections used to make this assessment are consistent with the cash flow projections that management uses internally in making key decisions. In the event an impairment exists, a loss is recognized based on the amount by which the carrying value exceeds the fair value of the asset, which is generally determined by using quoted market prices or the discounted present value of expected future cash flows.
Property and Equipment
Property and equipment is stated at cost, except for assets that have been impaired, for which the carrying amount has been reduced to estimated fair value. Expenditures for renewals and improvements are capitalized to the property accounts. Replacements and maintenance and repairs that do not improve or extend the life of the respective assets are expensed as incurred. The Company capitalizes costs incurred to develop internal‑use software during the application development stage. Capitalization of software development costs occurs after the preliminary project stage is complete, management authorizes the project, and it is probable that the project will be completed and the software will be used for the function intended. Amortization of capital lease assets is included in depreciation expense and is included in accumulated depreciation as reflected in the table below. Depreciation is provided on a straight‑line basis over the estimated useful lives of the assets, which is generally two to ten years for building improvements (or the lease term, if shorter), three to fifteen years for equipment and three to five years for capitalized internal‑use software. The net capitalized internal use software as of December 31, 2016 and 2017 was $88.2 million and $79.6 million, respectively. Depreciation expense was $73.4 million, $75.3 million and $76.5 million for the years ended December 31, 2015, 2016 and 2017, respectively. Included in depreciation expense for the years ended December 31, 2015, 2016 and 2017 was $45.6 million, $47.6 million and $49.5 million, respectively, related to capitalized internal-use software.
Property and equipment, net, consisted of the following at December 31, 2016 and 2017 (in thousands):
|
|
|
2016 |
|
2017 |
|
||
|
Building improvements |
|
$ |
16,817 |
|
$ |
17,974 |
|
|
Equipment |
|
|
204,743 |
|
|
204,632 |
|
|
Capital leases - property |
|
|
26,945 |
|
|
26,945 |
|
|
Capital leases - equipment |
|
|
14,729 |
|
|
18,183 |
|
|
Capitalized internal-use software |
|
|
446,619 |
|
|
486,013 |
|
|
|
|
|
709,853 |
|
|
753,747 |
|
|
Accumulated depreciation |
|
|
(537,329) |
|
|
(595,109) |
|
|
Property and equipment, net |
|
$ |
172,524 |
|
$ |
158,638 |
|
Goodwill
The Company is required to test its goodwill for impairment on at least an annual basis. The Company has selected October 1 as the date of its annual impairment test. The goodwill impairment test is a two‑step process that requires management to make judgments in determining what assumptions to use in the calculation. The first step of the process consists of estimating the fair value of each reporting unit with goodwill based on various valuation techniques, with the primary technique being a discounted cash flow analysis, which requires the input of various assumptions with respect to revenues, operating margins, growth rates and discount rates. The estimated fair value for each reporting unit is compared to the carrying value of the reporting unit, which includes goodwill. If the estimated fair value is less than the carrying value, a second step is performed to compute the amount of the impairment by determining an “implied fair value” of goodwill. The determination of a reporting unit’s “implied fair value” of goodwill requires the Company to allocate the estimated fair value of the reporting unit to the assets and liabilities of the reporting unit. Any unallocated fair value represents the “implied fair value” of goodwill, which is compared to its corresponding carrying value.
Goodwill is tested for impairment at a level referred to as a reporting unit, with the Company’s reporting units with goodwill as of December 31, 2017 comprised of Commercial, Government and Pharmacy Management.
The fair values of the Commercial (a component of the Healthcare segment), Government (a component of the Healthcare segment) and Pharmacy Management reporting units were determined using a discounted cash flow method. This method involves estimating the present value of estimated future cash flows utilizing a risk adjusted discount rate. Key assumptions for this method include cash flow projections, terminal growth rates and discount rates.
Goodwill for each of the Company’s reporting units with goodwill at December 31, 2016 and 2017 was as follows (in thousands):
|
|
|
|
|
|
|
||
|
|
|
2016 |
|
2017 |
|
||
|
Commercial |
|
$ |
242,255 |
|
$ |
242,255 |
|
|
Government |
|
|
108,321 |
|
|
368,612 |
|
|
Pharmacy Management |
|
|
391,478 |
|
|
395,421 |
|
|
Total |
|
$ |
742,054 |
|
$ |
1,006,288 |
|
The changes in the carrying amount of goodwill for the years ended December 31, 2016 and 2017 are reflected in the table below (in thousands):
|
|
|
|
|
|
|
||
|
|
|
2016 |
|
2017 |
|
||
|
Balance as of beginning of period |
|
$ |
621,390 |
|
$ |
742,054 |
|
|
Acquisition of AFSC |
|
|
76,736 |
|
|
— |
|
|
Acquisition of Veridicus |
|
|
30,705 |
|
|
1,647 |
|
|
Acquisition of SWH |
|
|
— |
|
|
260,139 |
|
|
Other acquisitions and measurement period adjustments |
|
|
13,223 |
|
|
2,448 |
|
|
Balance as of end of period |
|
$ |
742,054 |
|
$ |
1,006,288 |
|
Intangible Assets
The Company reviews other intangible assets for impairment when events or changes in circumstances occur which may potentially impact the estimated useful life of the intangible assets. During the second quarter of 2016, the Company recognized $4.8 million in impairment charges, which are reflected in direct service costs and other operating expenses in the consolidated statements of income and reported within the Healthcare segment. The fair value of the impairment was determined using the income method, which resulted in the full impairment of the customer agreement intangible asset recorded in conjunction with the AlphaCare acquisition.
The following is a summary of intangible assets at December 31, 2016 and 2017, and the estimated useful lives for such assets (in thousands, except useful lives):
|
|
|
December 31, 2016 |
|
|||||||||||||||||
|
|
|
|
|
|
|
|
|
|
Weighted Avg |
|
Gross |
|
|
|
|
Net |
|
|||
|
|
|
Original |
|
Remaining |
|
Carrying |
|
Accumulated |
|
Carrying |
|
|||||||||
|
Asset |
|
Useful Life |
|
Useful Life |
|
Amount |
|
Amortization |
|
Amount |
|
|||||||||
|
Customer agreements and lists |
|
2.5 |
|
to |
18 |
|
years |
|
6.4 |
years |
|
$ |
357,708 |
|
$ |
(181,588) |
|
$ |
176,120 |
|
|
Provider networks and other |
|
1 |
|
to |
16 |
|
years |
|
4.3 |
years |
|
|
18,240 |
|
|
(12,008) |
|
|
6,232 |
|
|
Trade names |
|
indefinite |
|
indefinite |
|
|
3,880 |
|
|
— |
|
|
3,880 |
|
||||||
|
|
|
|
|
|
|
|
|
|
|
|
|
$ |
379,828 |
|
$ |
(193,596) |
|
$ |
186,232 |
|
|
|
|
December 31, 2017 |
|
|||||||||||||||||
|
|
|
|
|
|
|
|
|
|
Weighted Avg |
|
Gross |
|
|
|
|
Net |
|
|||
|
|
|
Original |
|
Remaining |
|
Carrying |
|
Accumulated |
|
Carrying |
|
|||||||||
|
Asset |
|
Useful Life |
|
Useful Life |
|
Amount |
|
Amortization |
|
Amount |
|
|||||||||
|
Customer agreements and lists |
|
2.5 |
|
to |
18 |
|
years |
|
5.3 |
years |
|
$ |
441,346 |
|
$ |
(218,335) |
|
$ |
223,011 |
|
|
Provider networks and other |
|
1 |
|
to |
16 |
|
years |
|
3.0 |
years |
|
|
25,410 |
|
|
(14,433) |
|
|
10,977 |
|
|
Trade names and licenses |
|
indefinite |
|
indefinite |
|
|
34,300 |
|
|
— |
|
|
34,300 |
|
||||||
|
|
|
|
|
|
|
|
|
|
|
|
|
$ |
501,056 |
|
$ |
(232,768) |
|
$ |
268,288 |
|
Amortization expense was $29.4 million, $30.7 million and $39.2 million for the years ended December 31, 2015, 2016 and 2017, respectively. The Company estimates amortization expense will be $48.6 million, $48.3 million, $46.8 million, $43.7 million and $25.2 million for the years ending December 31, 2018, 2019, 2020, 2021 and 2022, respectively.
Cost of Care, Medical Claims Payable and Other Medical Liabilities
Cost of care is recognized in the period in which members receive managed healthcare services. In addition to actual benefits paid, cost of care in a period also includes the impact of accruals for estimates of medical claims payable. Medical claims payable represents the liability for healthcare claims reported but not yet paid and claims incurred but not yet reported (“IBNR”) related to the Company’s managed healthcare businesses. Such liabilities are determined by employing actuarial methods that are commonly used by health insurance actuaries and that meet actuarial standards of practice. Cost of care for the Company’s EAP contracts, which are mainly with the United States federal government, pertain to the costs to employ licensed behavioral health counselors to deliver non-medical counseling for these contracts.
The IBNR portion of medical claims payable is estimated based on past claims payment experience for member groups, enrollment data, utilization statistics, authorized healthcare services and other factors. This data is incorporated into contract‑specific actuarial reserve models and is further analyzed to create “completion factors” that represent the average percentage of total incurred claims that have been paid through a given date after being incurred. Factors that affect estimated completion factors include benefit changes, enrollment changes, shifts in product mix, seasonality influences, provider reimbursement changes, changes in claims inventory levels, the speed of claims processing and changes in paid claim levels. Completion factors are applied to claims paid through the financial statement date to estimate the ultimate claim expense incurred for the current period. Actuarial estimates of claim liabilities are then determined by subtracting the actual paid claims from the estimate of the ultimate incurred claims. For the most recent incurred months (generally the most recent two months), the percentage of claims paid for claims incurred in those months is generally low. This makes the completion factor methodology less reliable for such months. Therefore, incurred claims for any month with a completion factor that is less than 70 percent are generally not projected from historical completion and payment patterns; rather they are projected by estimating claims expense based on recent monthly estimated cost incurred per member per month times membership, taking into account seasonality influences, benefit changes and healthcare trend levels, collectively considered to be “trend factors.” For new contracts, the Company estimates IBNR based on underwriting data until it has sufficient data to utilize these methodologies.
Medical claims payable balances are continually monitored and reviewed. If it is determined that the Company’s assumptions in estimating such liabilities are significantly different than actual results, the Company’s results of operations and financial position could be impacted in future periods. Adjustments of prior period estimates may result in additional cost of care or a reduction of cost of care in the period an adjustment is made. Further, due to the considerable variability of healthcare costs, adjustments to claim liabilities occur each period and are sometimes significant as compared to the net income recorded in that period. Prior period development is recognized immediately upon the actuary’s judgment that a portion of the prior period liability is no longer needed or that additional liability should have been accrued. The following table presents the components of the change in medical claims payable for the years ended December 31, 2015, 2016 and 2017 (in thousands):
|
|
|
2015 |
|
2016 |
|
2017 |
|
|||
|
Claims payable and IBNR, beginning of period |
|
$ |
278,803 |
|
$ |
253,299 |
|
$ |
188,618 |
|
|
Cost of care: |
|
|
|
|
|
|
|
|
|
|
|
Current year |
|
|
2,297,255 |
|
|
1,892,914 |
|
|
2,421,270 |
|
|
Prior years(3) |
|
|
(22,500) |
|
|
(10,300) |
|
|
(7,500) |
|
|
Total cost of care |
|
|
2,274,755 |
|
|
1,882,614 |
|
|
2,413,770 |
|
|
Claim payments and transfers to other medical liabilities(1): |
|
|
|
|
|
|
|
|
|
|
|
Current year |
|
|
2,077,729 |
|
|
1,733,310 |
|
|
2,210,346 |
|
|
Prior years |
|
|
222,530 |
|
|
213,985 |
|
|
161,798 |
|
|
Total claim payments and transfers to other medical liabilities |
|
|
2,300,259 |
|
|
1,947,295 |
|
|
2,372,144 |
|
|
Acquisition of SWH |
|
|
— |
|
|
— |
|
|
96,398 |
|
|
Claims payable and IBNR, end of period |
|
|
253,299 |
|
|
188,618 |
|
|
326,642 |
|
|
Withhold (receivables) payable, end of period(2) |
|
|
(2,850) |
|
|
(4,482) |
|
|
983 |
|
|
Medical claims payable, end of period |
|
$ |
250,449 |
|
$ |
184,136 |
|
$ |
327,625 |
|
|
(1) |
For any given period, a portion of unpaid medical claims payable could be covered by reinvestment liability (discussed below) and may not impact the Company’s results of operations for such periods. |
|
(2) |
Medical claims payable is offset by customer withholds from capitation payments in situations in which the customer has the contractual requirement to pay providers for care incurred. |
|
(3) |
Favorable development in 2015, 2016 and 2017 was $22.5 million, $10.3 million and $7.5 million, respectively, and was mainly related to lower medical trends and faster claims completion than originally assumed. |
Actuarial standards of practice require that claim liabilities be adequate under moderately adverse circumstances. Adverse circumstances are situations in which the actual claims experience could be higher than the otherwise estimated value of such claims. In many situations, the claims paid amount experienced will be less than the estimate that satisfies the actuarial standards of practice. Any prior period favorable cost of care development related to a lack of moderately adverse conditions is excluded from “Cost of Care – Prior Years” adjustments, as a similar provision for moderately adverse conditions is established for current year cost of care liabilities and therefore does not generally impact net income.
Due to the existence of risk sharing and reinvestment provisions in certain customer contracts, principally in the Government contracts, a change in the estimate for medical claims payable does not necessarily result in an equivalent impact on cost of care.
The Company believes that the amount of medical claims payable is adequate to cover its ultimate liability for unpaid claims as of December 31, 2017; however, actual claims payments may differ from established estimates.
Other medical liabilities consist primarily of amounts payable to pharmacies for claims that have been adjudicated by the Company but not yet paid and “profit share” payables under certain risk-based contracts. Under a contract with profit share provisions, if the cost of care is below certain specified levels, the Company will “share” the cost savings with the customer at the percentages set forth in the contract. In addition, certain contracts include provisions to provide the Company additional funding if the cost of care is above the specified levels. Other medical liabilities also include “reinvestment” payables under certain managed healthcare contracts with Medicaid customers. Under a contract with reinvestment features, if the cost of care is less than certain minimum amounts specified in the contract (usually as a percentage of revenue), the Company is required to “reinvest” such difference in behavioral healthcare programs when and as specified by the customer or to pay the difference to the customer for their use in funding such programs.
Accrued Liabilities
As of December 31, 2016 and 2017, the only individual current liability that exceeded five percent of total current liabilities related to accrued employee compensation liabilities of $76.1 million and $45.6 million, respectively.
Net Income per Common Share attributable to Magellan
Net income per common share attributable to Magellan is computed based on the weighted average number of shares of common stock and common stock equivalents outstanding during the period (see Note 6—“Stockholders’ Equity”).
Redeemable Non‑Controlling Interest
As of December 31, 2016 the Company held an equity interest of approximately 84% in AlphaCare Holdings. The other shareholders of AlphaCare Holdings had the right to exercise put options requiring the Company to purchase all or any portion of the remaining shares. In addition, the Company had the right to purchase all remaining shares. Non‑controlling interests with redemption features, such as put options, that are not solely within the Company’s control are considered redeemable non‑controlling interests. Redeemable non‑controlling interest is considered to be temporary and is therefore reported in a mezzanine level between liabilities and stockholders’ equity on the Company’s consolidated balance sheet at the greater of the initial carrying amount adjusted for the non‑controlling interest’s share of net income or loss, or at its redemption value. The carrying value of the non-controlling interests as of December 31, 2016 was $4.8 million. During 2017, the Company exercised its right to acquire the remaining shares. The redemption value for the remaining shares at the time of exercise was zero. The carrying value at the time of exercise was $4.7 million, which was reclassified to additional paid-in capital.
Stock Compensation
At December 31, 2016 and 2017, the Company had equity-based employee incentive plans, which are described more fully in Note 6—“Stockholders’ Equity”. In addition, the Company issued restricted stock awards associated with the Armed Forces Services Corporation (“AFSC”) acquisition, which are also described more fully in Note 6—“Stockholders’ Equity”. The Company uses the Black‑Scholes‑Merton formula to estimate the fair value of substantially all stock options granted to employees, and recorded stock compensation expense of $50.4 million, $37.4 million and $39.1 million for the years ended December 31, 2015, 2016 and 2017, respectively. As stock compensation expense recognized in the consolidated statements of income for the years ended December 31, 2015, 2016 and 2017 is based on awards ultimately expected to vest, it has been reduced for annual estimated forfeitures of zero to four percent. If the actual number of forfeitures differs from those estimated, additional adjustments to compensation expense may be required in future periods. If vesting of an award is conditioned upon the achievement of performance goals, compensation expense during the performance period is estimated using the most probable outcome of the performance goals, and adjusted as the expected outcome changes. The Company recognizes compensation costs for awards that do not contain performance conditions on a straight‑line basis over the requisite service period, which is generally the vesting term of three years. For restricted stock units that include performance conditions, stock compensation is recognized using an accelerated method over the vesting period.
3. Acquisitions
Acquisition of SWH Holdings, Inc.
Pursuant to the July 13, 2017 Agreement and Plan of Merger (“the SWH Agreement”), on October 31, 2017 the Company acquired (the “SWH Acquisition”) all of the outstanding equity interests of SWH Holdings, Inc. (“SWH”). SWH is a healthcare company focused on serving complex, high-risk populations, providing Medicare and Medicaid dual-eligible benefits to members in Massachusetts and New York.
As consideration for the Acquisition, Magellan Healthcare paid $400.0 million in cash, inclusive of a $10.0 million payment based on SWH’s Medicare plan in Massachusetts receiving a Centers for Medicare & Medicaid Services 2018 Star Rating of at least 4, subject to adjustments as provided in the SWH Agreement.
The Company will report the results of operations of SWH in its Healthcare segment. The consolidated statements of income include total revenues and Segment Profit for SWH of $186.6 million and $9.5 million, respectively, for the two months subsequent to the acquisition.
The purchase price has been allocated based upon the estimated fair value of net assets acquired at the date of acquisition. A portion of the excess purchase price over tangible net assets acquired has been allocated to identified intangible assets totaling $124.1 million, consisting of customer contracts in the amount of $86.5 million, which is being amortized over four to six years, trade name in the amount of $30.0 million, which has an indefinite life, provider networks in the amount of $7.2 million, which is being amortized over three years, and licenses of $0.4 million, which have an indefinite life. The acquisition resulted in $260.1 million in goodwill related primarily to anticipated synergies and the expanded presence in the managed long-term care (“MLTC”) market. The goodwill is included in the Company’s Government reporting unit. None of the goodwill or identified intangible assets are deductible for tax purposes.
The estimated fair value of SWH assets acquired and liabilities assumed at the date of the acquisition are summarized as follows (in thousands):
|
Assets acquired: |
|
|
|
|
Current assets (includes $169,397 and $12,669 of cash and accounts receivable, respectively) |
|
$ |
193,542 |
|
Property and equipment, net |
|
|
3,395 |
|
Other assets |
|
|
2,789 |
|
Identified intangible assets |
|
|
124,140 |
|
Goodwill |
|
|
260,139 |
|
Total assets acquired |
|
|
584,005 |
|
Liabilities assumed: |
|
|
|
|
Current liabilities (includes $96,398 of medical claims payable) |
|
|
139,769 |
|
Deferred tax liabilities |
|
|
45,913 |
|
Total liabilities assumed |
|
|
185,682 |
|
Net assets acquired |
|
$ |
398,323 |
The Company’s estimated fair values of SWH’s assets acquired and liabilities assumed at the date of acquisition are determined based on certain valuations and analyses that have yet to be finalized, and accordingly, the assets acquired and liabilities assumed, as detailed above, are subject to adjustment once the analyses are completed. In addition, the amount recognized for deferred tax liabilities may be impacted by the determination of these items. The Company will make appropriate adjustments to the purchase price allocation prior to the completion of the measurement period as required.
As of December 31, 2017, the Company established a working capital receivable of $0.3 million that was reflected as a reduction to the transaction price.
In connection with the SWH acquisition, the Company incurred $1.0 million of acquisition related costs that were expensed during the year ended December 31, 2017. These costs are included within direct service costs and other operating expenses in the accompanying consolidated statements of income.
Acquisition of Veridicus Holdings, LLC and Granite Alliance Insurance Company
Pursuant to the November 19, 2016 purchase agreements (the “Veridicus Agreements”) with Veridicus Holdings, LLC and Granite Alliance Insurance Company (collectively “Veridicus”) and Veridicus Health, LLC, on December 13, 2016 and February 7, 2017 the Company acquired all of the outstanding equity interests of Veridicus (the “Veridicus Acquisition”). Veridicus is a PBM with a unique set of clinical services and capabilities.
The base purchase price for the Veridicus Acquisition per the Veridicus Agreements was $74.5 million, subject to working capital adjustments. The Company reports the results of operations of Veridicus within its Pharmacy Management segment.
During the year ended December 31, 2017, the Company made net measurement period adjustments of $2.3 million to increase the goodwill related to the Veridicus acquisition. The measurement period adjustments included a decrease to the customer contracts identified intangible assets of $2.9 million, partially offset by other measurement period adjustments of $0.6 million.
Acquisition of AFSC
Pursuant to the May 15, 2016 share purchase agreement (the “AFSC Agreement”) with AFSC, on July 1, 2016 the Company acquired all of the outstanding equity interests of AFSC (the “AFSC Acquisition”). AFSC has extensive experience providing and managing behavioral health and specialty services to various agencies of the federal government, including all five branches of the U.S. Armed Forces.
The base purchase price for the AFSC Acquisition per the AFSC Agreement was $117.5 million, subject to working capital adjustments. The Company reports the results of operations of AFSC within its Healthcare segment. Pursuant to the AFSC Agreement, certain members of AFSC’s management, who were also shareholders of AFSC, purchased a total of $4.0 million in Magellan restricted common stock, which will vest over a two-year period, conditioned upon continued employment with the Company. Consideration for the AFSC Acquisition includes a net payment for the net base purchase price of $113.5 million in cash, subject to working capital adjustments, including adjustments for cash acquired. Proceeds from the sale of restricted common stock are recorded as stock compensation expense over the requisite service period.
In addition to the base purchase price, the AFSC Agreement provides for potential contingent payments up to a maximum aggregate amount of $10.0 million. The potential contingent payments are based on the retention of certain core business by AFSC.
As of December 31, 2017, the Company had a working capital receivable of $3.9 million.
Acquisition of 4D Pharmacy Management Systems, Inc.
Pursuant to the March 17, 2015 Purchase Agreement (the “4D Agreement”) with 4D, on April 1, 2015 the Company acquired (the “4D Acquisition”) all of the outstanding equity interests of 4D. 4D was a privately held, full-service PBM serving managed care organizations, employers and government-sponsored benefit programs, such as Medicare Part D plans.
As consideration for the 4D Acquisition, the Company paid a base price of $54.7 million, including net receipts of $0.3 million for working capital adjustments. In addition to the base purchase price, the Company made additional contingent payments of $20.0 million. The contingent payments were based on the achievement of certain growth targets in the underlying dual eligible membership served by 4D during calendar year 2015 and for the retention of certain business. The Company reports the results of operations of 4D within its Pharmacy Management segment.
Other Acquisitions
Pursuant to the February 9, 2016 purchase agreement (the “TMG Agreement”) with The Management Group, LLC (“TMG”), on February 29, 2016 the Company acquired all of the outstanding equity interests of TMG. TMG is a company with 30 years of expertise in community-based long-term care services and supports. As consideration for the transaction, the Company paid a base price of $14.8 million in cash, including net receipts of $0.2 million for working capital adjustments. In addition to the base purchase price, the TMG agreement provides for potential contingent payments up to a maximum aggregate of $15.0 million. The potential future payments are contingent upon the Company being awarded additional managed long-term services and supports contracts. The Company reports the results of operations of TMG within its Healthcare segment.
Pursuant to the January 15, 2015 purchase agreement (the “HSM Agreement”) with HSM Physical Health, Inc. (“HSM”) and HSM Companies Inc., on January 31, 2015 the Company acquired all of the outstanding equity interests of HSM. HSM provides cost containment and utilization management services focused on physical and musculoskeletal health specialties. As consideration for the transaction, the Company paid a base price of $13.6 million in cash, including net payments of $0.1 million for working capital adjustments. The Company reports the results of operations of HSM within its Healthcare segment.
Pro Forma Financial Information
The following unaudited supplemental pro forma financial information represents the Company’s consolidated results of operations for the year ended December 31, 2016 as if the acquisition of Senior Whole Health had occurred on January 1, 2016, and for the year ended December 31, 2017, as if the acquisition of Senior Whole Health had occurred on January 1, 2017, in all cases after giving effect to certain adjustments including interest income, depreciation, and amortization.
Such pro forma information does not purport to be indicative of operating results that would have been reported had the acquisition of Senior Whole Health occurred on January 1, 2016 and 2017 (in thousands, expect per share amount):
|
|
|
|
Year Ended |
|||
|
|
|
|
December 31, |
|||
|
|
|
|
2016 |
|
|
2017 |
|
|
|
|
(unaudited) |
|
|
(unaudited) |
|
|
|
|
|
|
|
|
|
Net revenue |
|
$ |
5,617 |
|
$ |
6,685 |
|
Net income attributable to Magellan |
|
$ |
86 |
|
$ |
117 |
|
Income per common share attributable to Magellan |
|
|
|
|
|
|
|
Basic |
|
$ |
3.72 |
|
$ |
5.02 |
|
Diluted |
|
$ |
3.57 |
|
$ |
4.79 |
4. Benefit Plans
The Company has a defined contribution retirement plan (the “401(k) Plan”). Employee participants can elect to contribute up to 75 percent of their compensation, subject to Internal Revenue Service (“IRS”) deferral limitations. The Company makes contributions to the 401(k) Plan based on employee compensation and contributions. The Company matches 50 percent of each employee’s contribution up to 6 percent of their annual compensation. The Company recognized $9.6 million, $11.1 million and $12.7 million of expense for the years ended December 31, 2015, 2016 and 2017, respectively, for matching contributions to the 401(k) Plan.
5. Long‑Term Debt and Capital Lease Obligations
Senior Notes
On September 22, 2017, the Company completed the public offering of $400.0 million aggregate principal amount of its 4.400% Senior Notes due 2024 (the “Notes”). The Notes are governed by an indenture, dated as of September 22, 2017 (the “Base Indenture”), between the Company, as issuer and U.S. Bank National Association, as trustee, as supplemented by a first supplemental indenture, dated as of September 22, 2017 (the “First Supplemental Indenture” together, with the Base Indenture, the “Indenture”), between the Company, as issuer, and U.S. Bank National Association, as trustee.
The Notes bear interest payable semiannually in cash in arrears on March 22 and September 22 of each year, commencing on March 22, 2018, which rate is subject to an interest rate adjustment upon the occurrence of certain credit rating events. The Notes mature on September 22, 2024. The Indenture provides that the Notes are redeemable at the Company’s option, in whole or in part, at any time on or after July 22, 2024, at a redemption price equal to 100% of the principal amount of the Notes being redeemed plus accrued and unpaid interest thereon to, but excluding, the redemption date.
The Indenture also contains certain covenants which restrict the Company’s ability to, among other things, create liens on its and its subsidiaries’ assets; engage in sale and lease-back transactions; and engage in a consolidation, merger or sale of assets.
The net proceeds from the issuance and sale of the Notes were approximately $394.7 million after deducting the underwriting discounts and commissions and offering expenses. The net proceeds from this offering were and will be used for working capital and general corporate purposes, and the termination and repayment of the obligations under its Previous Credit Agreements (as defined below) which were scheduled to expire on July 23, 2019 and December 29, 2017.
Terminated Credit Agreements
On July 23, 2014, the Company entered into a $500.0 million Credit Agreement with various lenders that provided for Magellan Rx Management, Inc. (a wholly owned subsidiary of Magellan) to borrow up to $250.0 million of revolving loans, with a sublimit of up to $70.0 million for the issuance of letters of credit for the account of the Company, and a term loan in an original aggregate principal amount of $250.0 million (the “2014 Credit Facility”). On December 2, 2015, the Company entered into an amendment to the 2014 Credit Facility under which Magellan Pharmacy Services, Inc. (a wholly owned subsidiary of Magellan) became a party to the $500.0 million Credit Agreement as the borrower and assumed all of the obligations of Magellan Rx Management, Inc. Under the 2014 Credit Facility, on September 30, 2014, the Company completed a draw-down of the $250.0 million term loan (the “2014 Term Loan”). The 2014 Credit Facility was scheduled to mature on July 23, 2019. Upon consummation of the Refinancing (as defined below) on September 22, 2017, the 2014 Credit Facility was terminated. During the period the 2014 Term Loan was outstanding, from January 1, 2017 through September 22, 2017, the weighted average interest rate was approximately 2.634 percent.
On June 27, 2016, the Company entered into a $200.0 million Credit Agreement with various lenders that provided for a $200.0 million term loan (the “2016 Term Loan”) to Magellan Pharmacy Services, Inc. (the “2016 Credit Facility”). The 2016 Credit Facility was guaranteed by substantially all of the non-regulated subsidiaries of the Company and was scheduled to mature on December 29, 2017. Upon consummation of the Refinancing (as defined below) on September 22, 2017, the 2016 Credit Facility was terminated. During the period the 2016 Term Loan was outstanding, from January 1, 2017 through September 22, 2017, the weighted average interest rate was approximately 2.390 percent.
On January 10, 2017, the Company entered into a Credit Agreement with various lenders that provided for a $200.0 million delayed draw term loan (the “2017 Term Loan”) to Magellan Pharmacy Services, Inc. (the “2017 Credit Facility”). The 2017 Credit Facility was guaranteed by substantially all of the non-regulated subsidiaries of the Company and was scheduled to mature on December 29, 2017. Upon consummation of the Refinancing (as defined below) on September 22, 2017, the 2017 Credit Facility was terminated. During the period the 2017 Term Loan was outstanding, from January 10, 2017 through September 22, 2017, the weighted average interest rate was approximately 2.691 percent.
Active Credit Agreements
On September 22, 2017, the Company entered into a credit agreement with various lenders that provides for a $400.0 million senior unsecured revolving credit facility and a $350.0 million senior unsecured term loan facility to the Company, as the borrower (the “2017 Credit Agreement”). The 2017 Credit Agreement is scheduled to mature on September 22, 2022.
The proceeds from the 2017 Credit Agreement were and will be used for (a) working capital and general corporate purposes of the Company and its subsidiaries, including investments and the funding of acquisitions, (b) the repayment of all outstanding loans and other obligations (and the termination of all commitments) under the 2014 Credit Facility, 2016 Credit Facility and 2017 Credit Facility (collectively, the “Previous Credit Agreements”) (the termination and repayment of the obligations under the Previous Credit Agreements, collectively, the “Refinancing”) and (c) payment of fees and expenses incurred in connection with (i) the entering into the 2017 Credit Agreement and related documents and the incurrence of loans and issuance of letters of credit thereunder and (ii) the consummation of the Refinancing. Upon consummation of the Refinancing, the Previous Credit Agreements were terminated.
Under the 2017 Credit Agreement, the annual interest rate on the loan borrowing is equal to (i) in the case of base rate loans, the sum of an initial borrowing margin of 0.500 percent plus the higher of the prime rate, one-half of one percent in excess of the overnight “federal funds” rate, or the Eurodollar rate for one month plus 1.000 percent, or (ii) in the case of Eurodollar rate loans, the sum of an initial borrowing margin of 1.500 percent plus the Eurodollar rate for the selected interest period. The borrowing margin is subject to adjustment based on the Company’s debt rating as provided by certain rating agencies. The Company has the option to borrow in base rate loans or Eurodollar rate loans at its discretion. The commitment commission on the revolving credit facility under the 2017 Credit Agreement is 0.200 percent of the unused revolving credit commitment, which rate shall be subject to adjustment based on the Company’s debt rating as provided by certain rating agencies. During the period the term loan was outstanding, from September 22, 2017 through December 31, 2017, the weighted average interest rate was approximately 2.827 percent.
As of December 31, 2017, the contractual maturities of the term loan under the 2017 Credit Agreement were as follows: 2018—$17.5 million; 2019—$17.5 million; 2020—$17.5 million; 2021—$17.5 million; and 2022—$275.6 million. The Company had $33.7 million letters of credit outstanding issued under credit facilities at December 31, 2016. Beginning in April 2016, due to the timing of working capital needs, the Company had periodically borrowed from the revolving loan under the 2014 Credit Facility. The revolving loan borrowings had been in the form of Eurodollar rate loans and totaled $175.0 million at December 31, 2016, which were settled during the period from January 1, 2017 through September 22, 2017. At December 31, 2017, the Company had no revolving loan borrowings, resulting in a borrowing capacity of $400.0 million under the 2017 Credit Agreement. Included in long-term debt and capital lease obligations as of December 31, 2016 and December 31, 2017 are deferred loan issuance costs of $1.4 million and $6.6 million, respectively.
The 2017 Credit Agreement contains covenants that limit management’s discretion in operating the Company’s business by restricting or limiting the Company’s ability, among other things, to:
|
· |
incur or guarantee additional indebtedness or issue preferred or redeemable stock; |
|
· |
pay dividends and make other distributions; |
|
· |
repurchase equity interests; |
|
· |
make certain advances, investments and loans; |
|
· |
enter into sale and leaseback transactions; |
|
· |
create liens; |
|
· |
sell and otherwise dispose of assets; |
|
· |
acquire or merge or consolidate with another company; and |
|
· |
enter into some types of transactions with affiliates. |
Letter of Credit Agreement
On August 22, 2017, the Company entered into a Continuing Agreement for Standby Letters of Credit with The Bank of Tokyo-Mitsubishi UFJ, Ltd. (“BTMU”), as issuer (the “L/C Agreement”), under which BTMU, at its sole discretion, may provide stand-by letter of credit to the Company. The Company had $26.5 million of letters of credit outstanding at December 31, 2017 under the L/C Agreement.
Capital Lease Obligations
There were $26.0 million and $22.9 million of capital lease obligations at December 31, 2016 and December 31, 2017, respectively. The Company’s capital lease obligations represent amounts due under leases for certain properties, computer software (acquired prior to the prospective adoption of ASU 2015-05 on January 1, 2016) and equipment. The recorded gross cost of capital leased assets was $41.7 million and $45.1 million at December 31, 2016 and 2017, respectively.
6. Stockholders’ Equity
Stock Compensation
At December 31, 2016 and 2017, the Company had equity-based employee incentive plans. Prior to May 18, 2016, the Company utilized the 2011 Management Incentive Plan (the “2011 MIP”), 2008 Management Incentive Plan (the “2008 MIP”) and 2006 Directors’ Equity Compensation Plan (collectively the “Preexisting Plans”) for grants of stock options, restricted stock awards (“RSAs”), restricted stock units (“RSUs”), and stock appreciation rights, to provide incentives to officers, employees and non-employee directors.
On February 25, 2016, the board of directors of the Company approved the 2016 Management Incentive Plan (“2016 MIP”), and the 2016 MIP was approved by the Company’s shareholders at the 2016 Annual Meeting of Shareholders on May 18, 2016. The 2016 MIP provides for the delivery of up to a number of shares equal to (i) 4,000,000 shares of common stock, plus (ii) the number of shares subject to outstanding awards under the 2011 MIP and Preexisting Plans which become available after shareholder approval of the 2016 MIP as a result of forfeitures, expirations, and in other permitted ways under the share recapture provisions of the 2016 MIP. Delivery of shares under “full-value” awards (awards other than options or stock appreciation rights) will be counted for each share delivered as 1.60 shares against the total number of shares reserved under the 2016 MIP.
The 2016 MIP provides for awards of stock options, RSAs, RSUs, performance-based restricted stock units (“PSUs”), stock appreciation rights, cash‑denominated awards and any combination of the foregoing. A RSU is a notional account representing the right to receive a share of the Company’s Common Stock (or, at the Company’s option, cash in lieu thereof) at some future date. In general, stock options vest ratably on each anniversary over the three years subsequent to grant, and have a ten year life. With the exception of the shares received by the principal owners of Partners Rx, CDMI and AFSC, RSAs generally vest on the anniversary of the grant. In general, RSUs vest ratably on each anniversary over the three years subsequent to grant. The PSUs vest over three years and are subject to market-based conditions. At December 31, 2017, 3,724,939 shares of the Company’s common stock remain available for future grant under the Company’s 2016 MIP.
On February 27, 2014 the board of directors of the Company approved the 2014 Employee Stock Purchase Plan (“2014 ESPP”), and the 2014 ESPP was approved by the Company’s shareholders at the 2014 Annual Meeting of Shareholders on May 21, 2014. The 2014 ESPP provides for up to 200,000 shares of the Company’s ordinary common stock, plus the number of shares remaining under the 2011 Employee Stock Purchase Plan, to be issued. During the years ended December 31, 2016 and 2017, 48,815 and 56,426 shares of the Company’s common stock were issued under the employee stock purchase plans, respectively. At December 31, 2017, 72,187 shares of the Company’s common stock remain available for future grant under the Company’s 2014 ESPP.
Stock Options
Summarized information related to the Company’s stock options for the years ended December 31, 2015, 2016 and 2017 is as follows:
|
|
|
2015 |
|
2016 |
|
||||||
|
|
|
|
|
Weighted |
|
|
|
Weighted |
|
||
|
|
|
|
|
Average |
|
|
|
Average |
|
||
|
|
|
|
|
Exercise |
|
|
|
Exercise |
|
||
|
|
|
Options |
|
Price |
|
Options |
|
Price |
|
||
|
Outstanding, beginning of period |
|
3,321,063 |
|
$ |
50.58 |
|
2,939,840 |
|
$ |
55.13 |
|
|
Granted |
|
1,004,321 |
|
|
62.65 |
|
501,960 |
|
|
64.10 |
|
|
Forfeited |
|
(244,658) |
|
|
60.25 |
|
(104,680) |
|
|
57.23 |
|
|
Exercised |
|
(1,140,886) |
|
|
47.41 |
|
(493,943) |
|
|
50.60 |
|
|
Outstanding, end of period |
|
2,939,840 |
|
|
55.13 |
|
2,843,177 |
|
|
57.42 |
|
|
|
|
2017 |
|
||||||||
|
|
|
|
|
|
|
Weighted |
|
|
|
||
|
|
|
|
|
|
|
Average |
|
|
|
||
|
|
|
|
|
Weighted |
|
Remaining |
|
Aggregate |
|
||
|
|
|
|
|
Average |
|
Contractual |
|
Intrinsic |
|
||
|
|
|
|
|
Exercise |
|
Term |
|
Value |
|
||
|
|
|
Options |
|
Price |
|
(in years) |
|
(in thousands) |
|
||
|
Outstanding, beginning of period |
|
2,843,177 |
|
$ |
57.42 |
|
|
|
|
|
|
|
Granted |
|
525,596 |
|
|
71.35 |
|
|
|
|
|
|
|
Forfeited |
|
(79,350) |
|
|
61.39 |
|
|
|
|
|
|
|
Exercised |
|
(831,186) |
|
|
53.79 |
|
|
|
|
|
|
|
Outstanding, end of period |
|
2,458,237 |
|
$ |
61.50 |
|
7.04 |
|
$ |
86,158 |
|
|
Vested and expected to vest at end of period |
|
2,441,446 |
|
$ |
61.45 |
|
7.04 |
|
$ |
85,706 |
|
|
Exercisable, end of period |
|
1,403,228 |
|
$ |
57.22 |
|
5.92 |
|
$ |
55,195 |
|
The aggregate intrinsic value in the table above represents the total pre‑tax intrinsic value (based upon the difference between the Company’s closing stock price on the last trading day of 2017 of $96.55 and the exercise price) for all in‑the‑money options as of December 31, 2017. This amount changes based on the fair market value of the Company’s common stock.
The total pre‑tax intrinsic value of options exercised during the years ended December 31, 2015, 2016 and 2017 was $21.8 million, $9.3 million, and $23.8 million, respectively.
The weighted average grant date fair value per share of substantially all stock options granted during the years ended December 31, 2015, 2016 and 2017 was $13.69, $15.05 and $17.64, respectively, as estimated using the Black‑Scholes‑Merton option pricing model based on the following weighted average assumptions:
|
|
|
2015 |
|
2016 |
|
2017 |
|
|
Risk-free interest rate |
|
1.28 |
% |
1.16 |
% |
1.79 |
% |
|
Expected life |
|
4 |
years |
4 |
years |
4 |
years |
|
Expected volatility |
|
25.03 |
% |
27.75 |
% |
27.75 |
% |
|
Expected dividend yield |
|
0.00 |
% |
0.00 |
% |
0.00 |
% |
For the years ended December 31, 2015, 2016 and 2017, expected volatility was based on the historical volatility of the Company’s stock price.
As of December 31, 2017, there was $10.0 million of total unrecognized compensation expense related to nonvested stock options that is expected to be recognized over a weighted average remaining recognition period of 1.68 years. The total fair value of options vested during the year ended December 31, 2017 was $8.8 million.
In the year ended December 31, 2015, $4.1 million of benefits of tax deductions in excess of recognized stock compensation expense were realized and as such were reported as financing cash flows. The net change to additional paid‑in capital related to tax benefits (deficiencies) was $3.5 million which primarily consists of the $4.1 million of excess tax benefits offset by $0.6 million of tax deficiencies.
In the year ended December 31, 2016, the net tax benefit from excess tax deductions was $0.8 million, which consists of $1.0 million of excess tax benefits offset by $0.2 million of tax deficiencies. In the year ended December 31, 2017, the net tax benefit from excess tax deductions was $5.6 million, which consists of $5.7 million of excess tax benefits offset by $0.1 million of tax deficiencies. Due to the adoption of ASU 2016-09 in 2016, the net tax benefits reduced income tax expense rather than being recorded as a change in additional paid-in-capital. Consistent with the adoption of this provision, the net tax benefit for the years ended December 31, 2016 and 2017 is reported as an operating cash flow, rather than a financing cash flow.
Restricted Stock Awards
Summarized information related to the Company’s nonvested RSAs for the years ended December 31, 2015, 2016 and 2017 is as follows:
|
|
|
2015 |
|
2016 |
|
2017 |
|
|||||||||
|
|
|
|
|
Weighted |
|
|
|
Weighted |
|
|
|
Weighted |
|
|||
|
|
|
|
|
Average |
|
|
|
Average |
|
|
|
Average |
|
|||
|
|
|
|
|
Grant Date |
|
|
|
Grant Date |
|
|
|
Grant Date |
|
|||
|
|
|
Shares |
|
Fair Value |
|
Shares |
|
Fair Value |
|
Shares |
|
Fair Value |
|
|||
|
Outstanding, beginning of period |
|
1,626,827 |
|
$ |
57.66 |
|
1,109,622 |
|
$ |
57.88 |
|
615,472 |
|
$ |
58.71 |
|
|
Awarded (1) |
|
20,115 |
|
|
67.12 |
|
77,744 |
|
|
65.52 |
|
14,959 |
|
|
70.20 |
|
|
Vested |
|
(537,320) |
|
|
57.56 |
|
(571,894) |
|
|
58.03 |
|
(585,438) |
|
|
58.33 |
|
|
Forfeited |
|
— |
|
|
— |
|
— |
|
|
— |
|
(13,891) |
|
|
65.97 |
|
|
Outstanding, ending of period |
|
1,109,622 |
|
|
57.88 |
|
615,472 |
|
|
58.71 |
|
31,102 |
|
|
68.00 |
|
|
(1) |
December 31, 2016 includes 60,069 shares associated with the AFSC acquisition. |
As of December 31, 2017, there was $1.0 million of unrecognized stock compensation expense related to nonvested restricted stock awards. This cost is expected to be recognized over a weighted‑average period of 0.45 years.
Restricted Stock Units
Summarized information related to the Company’s nonvested RSUs for the years ended December 31, 2015, 2016 and 2017 is as follows:
|
|
|
2015 |
|
2016 |
|
2017 |
|
|||||||||
|
|
|
|
|
Weighted |
|
|
|
Weighted |
|
|
|
Weighted |
|
|||
|
|
|
|
|
Average |
|
|
|
Average |
|
|
|
Average |
|
|||
|
|
|
|
|
Grant Date |
|
|
|
Grant Date |
|
|
|
Grant Date |
|
|||
|
|
|
Shares |
|
Fair Value |
|
Shares |
|
Fair Value |
|
Shares |
|
Fair Value |
|
|||
|
Outstanding, beginning of period |
|
156,695 |
|
$ |
54.88 |
|
231,088 |
|
$ |
61.53 |
|
200,178 |
|
$ |
61.65 |
|
|
Awarded |
|
187,272 |
|
|
63.42 |
|
51,521 |
|
|
64.87 |
|
107,417 |
|
|
68.53 |
|
|
Vested |
|
(79,036) |
|
|
52.82 |
|
(53,839) |
|
|
63.32 |
|
(119,489) |
|
|
60.38 |
|
|
Forfeited |
|
(33,843) |
|
|
61.54 |
|
(28,592) |
|
|
63.34 |
|
(24,817) |
|
|
65.87 |
|
|
Outstanding, ending of period |
|
231,088 |
|
|
61.53 |
|
200,178 |
|
|
61.65 |
|
163,289 |
|
|
66.46 |
|
As of December 31, 2017, there was $6.0 million of unrecognized stock compensation expense related to nonvested restricted stock units. This cost is expected to be recognized over a weighted-average period of 1.80 years.
Performance-Based Restricted Stock Units
Summarized information related to the Company’s nonvested PSUs for the years ended December 31, 2015, 2016 and 2017 is as follows:
|
|
|
|
2015 |
|
|
2016 |
|
|
2017 |
|
|||||||||
|
|
|
|
|
|
Weighted |
|
|
|
|
Weighted |
|
|
|
|
Weighted |
|
|||
|
|
|
|
|
|
Average |
|
|
|
|
Average |
|
|
|
|
Average |
|
|||
|
|
|
|
|
|
Grant Date |
|
|
|
|
Grant Date |
|
|
|
|
Grant Date |
|
|||
|
|
|
|
Shares |
|
Fair Value |
|
|
Shares |
|
Fair Value |
|
|
Shares |
|
Fair Value |
|
|||
|
Outstanding, beginning of period |
|
|
— |
|
$ |
— |
|
|
36,938 |
|
$ |
85.00 |
|
|
102,977 |
|
$ |
93.03 |
|
|
Awarded |
|
|
43,900 |
|
|
85.00 |
|
|
69,691 |
|
|
97.22 |
|
|
101,989 |
|
|
76.24 |
|
|
Vested |
|
|
— |
|
|
— |
|
|
— |
|
|
— |
|
|
— |
|
|
— |
|
|
Forfeited |
|
|
(6,962) |
|
|
85.00 |
|
|
(3,652) |
|
|
91.89 |
|
|
(2,651) |
|
|
87.75 |
|
|
Outstanding, end of period |
|
|
36,938 |
|
|
85.00 |
|
|
102,977 |
|
|
93.03 |
|
|
202,315 |
|
|
84.63 |
|
The PSUs will entitle the grantee to receive a number of shares of the Company’s Common Stock determined over a three-year performance period ending on December 31 of the year prior to the settlement date of the awards, provided the grantee remains in the service of the Company on the settlement date. The Company expenses the cost of PSU awards ratably over the requisite service period. The number of shares for which the PSUs will be settled will be a percentage of shares for which the award is targeted and will depend on the Company’s total shareholder return (as defined below), expressed as a percentile ranking of the Company’s total shareholder return as compared to the Company’s peer group (as defined below). The number of shares for which the PSUs will be settled vary from zero to 200 percent of the shares specified in the grant. Total shareholder return is determined by dividing the average share value of the Company’s Common Stock over the 30 trading days preceding January 1 of the year the awards are scheduled to vest by the average share value of the Company’s Common Stock over the 30 trading days beginning on January 1 of the year the awards were granted, with a deemed reinvestment of any dividends declared during the performance period. The Company’s peer group includes companies which comprise the S&P Health Care Services Industry Index, which was selected by the Compensation Committee of the Company’s Board of Directors and includes a range of healthcare companies operating in several business segments.
The weighted average estimated fair value of the PSUs granted in year ended December 31, 2015 was $85.00, which was derived from a Monte Carlo simulation. Significant assumptions utilized in estimating the value of the awards granted include an expected dividend yield of 0%, a risk free rate of 1%, and expected volatility of 15% to 52% (average of 28%). Based on the total shareholder return, the PSUs granted in 2015 will be settled at 180 percent of the shares specified in the grant.
The weighted average estimated fair value of the PSUs granted in the year ended December 31, 2016 was $97.22, which was derived from a Monte Carlo simulation. Significant assumptions utilized in estimating the value of the awards granted include an expected dividend yield of 0%, a risk free rate of 1%, and expected volatility of 16% to 81% (average of 32%).
The weighted average estimated fair value of the PSUs granted in the year ended December 31, 2017 was $76.24, which was derived from a Monte Carlo simulation. Significant assumptions utilized in estimating the value of the awards granted include an expected dividend yield of 0%, a risk free rate of 1.54%, and expected volatility of 18% to 61% (average of 33%).
As of December 31, 2017, there was $7.7 million of unrecognized stock compensation expense related to nonvested PSUs. This cost is expected to be recognized over a weighted‑average period of 1.42 years.
Net Income per Common Share Attributable to Magellan
The following table reconciles income (numerator) and shares (denominator) used in the Company’s computations of net income per share for the years ended December 31, 2015, 2016 and 2017 (in thousands, except per share data):
|
|
|
2015 |
|
2016 |
|
2017 |
|
|||
|
Numerator: |
|
|
|
|
|
|
|
|
|
|
|
Net income attributable to Magellan |
|
$ |
31,413 |
|
$ |
77,879 |
|
$ |
110,207 |
|
|
Denominator: |
|
|
|
|
|
|
|
|
|
|
|
Weighted average number of common shares outstanding—basic |
|
|
24,865 |
|
|
23,181 |
|
|
23,333 |
|
|
Common stock equivalents—stock options |
|
|
316 |
|
|
289 |
|
|
530 |
|
|
Common stock equivalents—RSAs |
|
|
626 |
|
|
593 |
|
|
376 |
|
|
Common stock equivalents—RSUs |
|
|
33 |
|
|
45 |
|
|
64 |
|
|
Common stock equivalents—PSUs |
|
|
35 |
|
|
45 |
|
|
134 |
|
|
Common stock equivalents—employee stock purchase plan |
|
|
2 |
|
|
3 |
|
|
3 |
|
|
Weighted average number of common shares outstanding—diluted |
|
|
25,877 |
|
|
24,156 |
|
|
24,440 |
|
|
Net income attributable to Magellan per common share—basic |
|
$ |
1.26 |
|
$ |
3.36 |
|
$ |
4.72 |
|
|
Net income attributable to Magellan per common share—diluted |
|
$ |
1.21 |
|
$ |
3.22 |
|
$ |
4.51 |
|
The weighted average number of common shares outstanding for the years ended December 31, 2015, 2016 and 2017 was calculated using outstanding shares of the Company’s common stock. Common stock equivalents included in the calculation of diluted weighted average common shares outstanding for the years ended December 31, 2015, 2016 and 2017 represent stock options to purchase shares of the Company’s common stock, restricted stock awards, restricted stock units and stock purchased under the ESPP.
For the years ended December 31, 2015, 2016 and 2017, the Company had additional potential dilutive securities outstanding representing 1.3 million, 1.5 million and 0.4 million options, respectively, that were not included in the computation of dilutive securities because they were anti‑dilutive for such periods. Had these shares not been anti‑dilutive, all of these shares would not have been included in the net income per common share calculation as the Company uses the treasury stock method of calculating diluted shares.
Stock Repurchases
The Company’s board of directors has previously authorized a series of stock repurchase plans. Stock repurchases for each such plan could be executed through open market repurchases, privately negotiated transactions, accelerated share repurchases or other means. The board of directors authorized management to execute stock repurchase transactions from time to time and in such amounts and via such methods as management deemed appropriate. Each stock repurchase program could be limited or terminated at any time without prior notice.
On October 22, 2014, the Company’s board of directors approved a stock repurchase plan which authorized the Company to purchase up to $200 million of its outstanding common stock through October 22, 2016. On October 21, 2015, the Company reached aggregate purchases of $200 million and the program was completed. Pursuant to this program, the Company made purchases as follows (aggregate cost excludes broker commissions and is reflected in millions):
|
|
|
Total Number |
|
Average |
|
|
|
|
|
|
|
|
of Shares |
|
Price Paid |
|
Aggregate |
|
||
|
Period |
|
Purchased |
|
per Share |
|
Cost |
|
||
|
November 24, 2014 - December 31, 2014 |
|
232,170 |
|
$ |
60.65 |
|
$ |
14.1 |
|
|
January 1, 2015 - October 21, 2015 |
|
3,153,156 |
|
|
58.96 |
|
|
185.9 |
|
|
|
|
3,385,326 |
|
|
|
|
$ |
200.0 |
|
On October 26, 2015, the Company’s board of directors approved a stock repurchase plan which authorized the Company to purchase up to $200 million of its outstanding common stock through October 26, 2017. On July 26, 2017, the Company’s board of directors approved an extension of the 2015 Repurchase Program through October 26, 2018. Pursuant to this program, the Company made purchases as follows (aggregate cost excludes broker commissions and is reflected in millions):
|
|
|
Total Number |
|
Average |
|
|
|
|
|
|
|
|
of Shares |
|
Price Paid |
|
Aggregate |
|
||
|
Period |
|
Purchased |
|
per Share |
|
Cost |
|
||
|
October 26, 2015 - December 31, 2015 |
|
345,044 |
|
$ |
53.46 |
|
$ |
18.4 |
|
|
January 1, 2016 - December 31, 2016 |
|
1,828,183 |
|
|
58.40 |
|
|
106.8 |
|
|
January 1, 2017 - December 31, 2017 |
|
280,140 |
|
|
77.67 |
|
|
21.8 |
|
|
|
|
2,453,367 |
|
|
|
|
$ |
147.0 |
|
The Company made no share repurchases from January 1, 2018 through February 23, 2018.
Recent Sales of Unregistered Securities
On May 15, 2016, the Company and AFSC entered into a purchase agreement pursuant to which on July 1, 2016 the sellers and key management of AFSC purchased 60,069 shares of the Company’s restricted stock for a total purchase price of $4.0 million. The aggregate number of shares issued was determined by dividing $4.0 million by the average trading prices per share of Magellan’s ordinary common stock on the NASDAQ over the five trading days ended on the trading day prior to the execution of the purchase agreement. The shares received by such sellers and key management of AFSC are subject to vesting over two years with 50% vesting on the first anniversary of the acquisition and 50% vesting on the second anniversary of the acquisition, conditioned on continued employment with the Company on the applicable vesting dates. The shares were issued to the sellers and key management of AFSC in a private placement pursuant to Section 4(a)(2) of the Securities Act.
7. Income Taxes
Income Tax Expense
The components of income tax expense (benefit) for the following years ended December 31 were as follows (in thousands):
|
|
|
2015 |
|
2016 |
|
2017 |
|
|||
|
Income taxes currently payable: |
|
|
|
|
|
|
|
|
|
|
|
Federal |
|
$ |
64,227 |
|
$ |
59,343 |
|
$ |
49,944 |
|
|
State |
|
|
5,181 |
|
|
5,675 |
|
|
6,120 |
|
|
|
|
|
69,408 |
|
|
65,018 |
|
|
56,064 |
|
|
Deferred income taxes (benefits): |
|
|
|
|
|
|
|
|
|
|
|
Federal |
|
|
(26,573) |
|
|
3,830 |
|
|
(31,941) |
|
|
State |
|
|
(426) |
|
|
880 |
|
|
960 |
|
|
|
|
|
(26,999) |
|
|
4,710 |
|
|
(30,981) |
|
|
Total income tax expense |
|
$ |
42,409 |
|
$ |
69,728 |
|
$ |
25,083 |
|
Total income tax expense for the years ended December 31 was different from the amount computed using the statutory federal income tax rate of 35 percent for the following reasons (in thousands):
|
|
|
2015 |
|
2016 |
|
2017 |
|
|||
|
Income tax expense at federal statutory rate |
|
$ |
24,891 |
|
$ |
50,931 |
|
$ |
47,328 |
|
|
State income taxes, net of federal income tax benefit |
|
|
2,158 |
|
|
5,799 |
|
|
4,993 |
|
|
Tax contingencies reversed due to statute closings |
|
|
(2,223) |
|
|
(1,632) |
|
|
(2,044) |
|
|
Change in valuation allowances |
|
|
5,174 |
|
|
2,130 |
|
|
(14,973) |
|
|
Adjustments for Tax Act |
|
|
— |
|
|
— |
|
|
(8,677) |
|
|
Share-based compensation |
|
|
165 |
|
|
(232) |
|
|
(4,724) |
|
|
Non-deductible HIF fees |
|
|
9,953 |
|
|
10,204 |
|
|
— |
|
|
Other-net |
|
|
2,291 |
|
|
2,528 |
|
|
3,180 |
|
|
Total income tax expense |
|
$ |
42,409 |
|
$ |
69,728 |
|
$ |
25,083 |
|
On December 22, 2017, the President of the United States signed into law the “Tax Cuts and Jobs Act” (the “Tax Act”). The legislation includes a number of changes to existing U.S. tax laws that impact the Company, most notably a reduction of the U.S. corporate income tax rate from 35 percent to 21 percent, effective January 1, 2018. The legislation also provides for the acceleration of depreciation on certain assets placed in service after September 27, 2017, as well as prospective changes beginning in 2018, including additional limitations on the deduction of executive compensation.
On December 22, 2017, the SEC staff issued Staff Accounting Bulletin No. 118 (“SAB 118”) to address the application of U.S. GAAP in situations when a registrant does not have the necessary information available, prepared, or analyzed (including computations) in reasonable detail to complete the accounting for certain income tax effects of the Tax Act. SAB 118 allows registrants to determine a reasonable estimate to be included as provisional amounts and provides a measurement period by which the accounting must be completed. The measurement period ends when a registrant has obtained, prepared, and analyzed the information that was needed in order to complete the accounting requirements under ASC Topic 740 but under no circumstances is the measurement period extend beyond one year from the enactment date (i.e. December 22, 2018).
Deferred Income Taxes
The significant components of deferred tax assets and liabilities at December 31 were as follows (in thousands):
|
|
|
2016 |
|
2017 |
|
||
|
Deferred tax assets: |
|
|
|
|
|
|
|
|
Net operating loss carryforwards |
|
$ |
19,727 |
|
$ |
13,384 |
|
|
Share-based compensation |
|
|
14,704 |
|
|
9,639 |
|
|
Other accrued compensation |
|
|
9,313 |
|
|
6,195 |
|
|
Claims reserves |
|
|
6,251 |
|
|
4,527 |
|
|
Deferred revenue |
|
|
4,986 |
|
|
2,606 |
|
|
Other non-deductible accrued liabilities |
|
|
3,460 |
|
|
5,362 |
|
|
Amortization of goodwill and intangible assets |
|
|
444 |
|
|
— |
|
|
Indirect tax benefits |
|
|
4,396 |
|
|
2,847 |
|
|
Other deferred tax assets |
|
|
3,858 |
|
|
2,051 |
|
|
Total deferred tax assets |
|
|
67,139 |
|
|
46,611 |
|
|
Valuation allowances |
|
|
(17,117) |
|
|
(2,368) |
|
|
Deferred tax assets after valuation allowances |
|
|
50,022 |
|
|
44,243 |
|
|
Deferred tax liabilities: |
|
|
|
|
|
|
|
|
Depreciation |
|
|
(41,311) |
|
|
(22,906) |
|
|
Amortization of goodwill and intangible assets |
|
|
— |
|
|
(29,501) |
|
|
Other deferred tax liabilities |
|
|
(5,586) |
|
|
(3,321) |
|
|
Total deferred tax liabilities |
|
|
(46,897) |
|
|
(55,728) |
|
|
Net deferred tax assets (liabilities) |
|
$ |
3,125 |
|
$ |
(11,485) |
|
The Company did not identify any items for which a reasonable estimate of the income tax effects of the Tax Act could not be determined as of December 31, 2017. However, as a result of the reduction in the U.S. corporate income tax rate from 35% to 21% under the Tax Act, the Company re-measured its ending net deferred tax liabilities at December 31, 2017 and recorded a provisional tax benefit of $8.2 million. The Company will continue to analyze the Tax Act and additional technical and interpretive guidance on the Tax Act from the government and will complete its accounting no later than December 22, 2018. Any changes to the tax basis for temporary differences between the estimates in these statements and the 2017 federal return filed by the Company will also result in a corresponding adjustment to the remeasurement of deferred taxes as of the enactment date of the Tax Act.
The Company has $38.8 million of federal net operating loss carryforwards (“NOLs”) available to reduce consolidated taxable income in 2018 and subsequent years. These NOLs (including $37.6 million incurred by AlphaCare prior to its membership in the Magellan consolidated group) will expire in 2018 through 2036 if not used and are subject to examination and adjustment by the IRS. In addition, the Company’s utilization of these NOLs is subject to limitations under the Internal Revenue Code as to the timing and use. At this time, the Company does not believe these limitations will restrict the Company’s ability to use any federal NOLs before they expire. The Company and its subsidiaries also have $93.7 million of NOLs available to reduce state and local taxable income at certain subsidiaries in 2018 and subsequent years. These NOLs will expire in 2018 through 2037 if not used and are subject to examination and adjustment by the respective tax authorities. In addition, the Company’s utilization of certain of these NOLs is subject to limitations as to the timing and use. At this time, the Company does not believe these limitations will restrict the Company’s ability to use any of these state and local NOLs before they expire.
The Company’s valuation allowances against deferred tax assets were $17.1 million and $2.4 million as of December 31, 2016 and 2017, respectively. The allowances at December 31, 2016 mostly related to uncertainties regarding the eventual realization of the AlphaCare federal NOLs and certain state NOLs. The significant decrease in 2017 was due to the reversal of AlphaCare federal NOL allowances as a result of planned restructuring of the Company’s New York operations as a result of the acquisition of SWH. The combined results are projected to provide sufficient taxable income to utilize AlphaCare’s NOL unrestricted carryforwards. At December 31, 2017, the Company’s remaining valuation allowances primarily related to uncertainties regarding the eventual realization of certain state NOLs.
Reversals of valuation allowances are recorded in the period they occur, typically as reductions to income tax expense. Determination of the amount of deferred tax assets considered realizable requires significant judgment and estimation regarding the forecasts of future taxable income which are consistent with the plans and estimates the Company uses to manage the underlying businesses. Although consideration is also given to potential tax planning strategies which might be available to improve the realization of deferred tax assets, none were identified which were both prudent and reasonable. The Company believes taxable income expected to be generated in the future will be sufficient to support realization of the Company’s deferred tax assets, as reduced by valuation allowances. This determination is based upon earnings history and future earnings expectations.
Other than deferred tax benefits attributable to operating loss carryforwards, there are no time constraints within which the Company’s deferred tax assets must be realized. Future changes in the estimated realizability of deferred tax assets could materially affect the Company’s financial condition and results of operations.
Uncertain Tax Positions
A reconciliation of the beginning and ending amount of gross unrecognized tax benefits is as follows (in thousands):
|
|
|
2015 |
|
2016 |
|
2017 |
|
|||
|
Balance as of beginning of period |
|
$ |
13,528 |
|
$ |
12,597 |
|
$ |
13,604 |
|
|
Additions for current year tax positions |
|
|
3,371 |
|
|
3,274 |
|
|
3,243 |
|
|
Additions for tax positions of prior years |
|
|
949 |
|
|
141 |
|
|
342 |
|
|
Reductions for tax positions of prior years |
|
|
(1,807) |
|
|
(173) |
|
|
(114) |
|
|
Reductions due to lapses of applicable statutes of limitations |
|
|
(3,071) |
|
|
(2,235) |
|
|
(2,693) |
|
|
Reductions due to Tax Act |
|
|
— |
|
|
— |
|
|
(509) |
|
|
Reductions due to settlements with taxing authorities |
|
|
(373) |
|
|
— |
|
|
(293) |
|
|
Balance as of end of period |
|
$ |
12,597 |
|
$ |
13,604 |
|
$ |
13,580 |
|
If these unrecognized tax benefits had been realized as of December 31, 2016 and 2017, $9.1 million and $10.7 million, respectively, would have reduced income tax expense.
The Company continually performs a comprehensive review of its tax positions and accrues amounts for tax contingencies related to uncertain tax positions. Based upon these reviews, the status of ongoing tax audits and the expiration of applicable statutes of limitations, accruals are adjusted as necessary. The tax benefit from an uncertain tax position is recognized when it is more likely than not that, based on the technical merits, the position will be sustained upon examination, including resolution of any related appeals or litigation processes.
The Company also adjusts these liabilities for unrecognized tax benefits when its judgment changes as a result of the evaluation of new information not previously available. However, the ultimate resolution of a disputed tax position following an examination by a taxing authority could result in a payment that is materially different from that accrued by the Company. These differences are reflected as increases or decreases to income tax expense in the period in which they are determined. However, reversals of unrecognized tax benefits related to deductions for stock compensation in excess of the related book expense are recorded as reductions to deferred tax assets, although prior to the adoption of ASU 2016-09 in 2016 these were recorded as increases in additional paid‑in capital.
The statutes of limitations regarding the assessment of federal and most state and local income taxes for 2013 expired during 2017. As a result, $3.0 million of tax contingency reserves recorded as of December 31, 2016 were reversed in the current year, of which $2.0 million was reflected as a reduction to income tax expense and $1.0 million as a decrease to deferred tax assets. Additionally, $0.2 million of accrued interest was reversed in 2017 and reflected as a reduction to income tax expense due to the closing of statutes of limitations on tax assessments.
The statutes of limitations regarding the assessment of federal and most state and local income taxes for 2012 expired during 2016. As a result, $2.2 million of tax contingency reserves recorded as of December 31, 2015 were reversed in 2016, of which $1.5 million was reflected as a reduction to income tax expense and $0.7 million as a decrease to deferred tax assets. Additionally, $0.1 million of accrued interest was reversed in 2016 and reflected as reductions to income tax expense due to the closing of statutes of limitations on tax assessments.
The statutes of limitations regarding the assessment of federal and most state and local income taxes for 2011 expired during 2015. As a result, $3.1 million of tax contingency reserves recorded as of December 31, 2014 were reversed in 2015, of which $2.0 million was reflected as a reduction to income tax expense, $1.0 million as a decrease to deferred tax assets, and the remainder as an increase to additional paid-in capital. Additionally, $0.4 million of accrued interest and $0.7 million of unrecognized state tax benefits were reversed in 2015 and reflected as reductions to income tax expense due to the closing of statutes of limitations on tax assessments and the favorable settlement of state income tax examinations.
With few exceptions, the Company is no longer subject to income tax assessments by tax authorities for years ended prior to 2014. Further, it is reasonably possible the statutes of limitations regarding the assessment of federal and most state and local income taxes for 2014 could expire during 2018. Up to $2.9 million of unrecognized tax benefits recorded as of December 31, 2017 could be reversed during 2018 as a result of statute expirations, of which $2.3 million would be reflected as a reduction to income tax expense and $0.6 million as a decrease to deferred tax assets. All reversals from statute expirations would be reflected as discrete adjustments during the quarter in which the respective event occurs. As of December 31, 2016 and 2017, the Company had accrued approximately $0.3 million and $0.5 million, respectively, for the potential payment of interest and penalties. The Company accrues interest and penalties related to unrecognized tax benefits in its provision for income taxes. During the years ended December 31, 2015, 2016 and 2017, the Company recorded approximately $(0.4) million, $0.1 million and $0.2 million, respectively, in interest and penalties.
8. Supplemental Cash Flow Information
Supplemental cash flow information for the years ended December 31, 2015, 2016 and 2017 is as follows (in thousands):
|
|
|
2015 |
|
2016 |
|
2017 |
|
|||
|
Income taxes paid, net of refunds |
|
$ |
63,899 |
|
$ |
54,442 |
|
$ |
59,474 |
|
|
Interest paid |
|
$ |
6,181 |
|
$ |
9,378 |
|
$ |
15,415 |
|
|
Assets acquired through capital leases |
|
$ |
4,212 |
|
$ |
4,491 |
|
$ |
2,418 |
|
9. Commitments and Contingencies
Insurance
The Company maintains a program of insurance coverage for a broad range of risks in its business. The Company has renewed its general, professional and managed care liability insurance policies with unaffiliated insurers for a one-year period from June 17, 2017 to June 17, 2018. The general liability policy is written on an “occurrence” basis, subject to a $0.05 million per claim un‑aggregated self‑insured retention. The professional liability and managed care errors and omissions liability policies are written on a “claims‑made” basis, subject to a $1.0 million per claim ($10.0 million per class action claim) un‑aggregated self‑insured retention for managed care errors and omissions liability, and a $0.05 million per claim un‑aggregated self‑insured retention for professional liability.
The Company maintains a separate general and professional liability insurance policy with an unaffiliated insurer for its specialty pharmaceutical dispensing operations. The specialty pharmaceutical dispensing operations insurance policy has a one-year term for the period June 17, 2017 to June 17, 2018. The general liability policy is written on an “occurrence” basis and the professional liability policy is written on a “claims‑made” basis, subject to a $0.05 million per claim and $0.25 million aggregated self‑insured retention.
The Company is responsible for claims within its self-insured retentions, and for portions of claims reported after the expiration date of the policies if they are not renewed, or if policy limits are exceeded. The Company also purchases excess liability coverage in an amount that management believes to be reasonable for the size and profile of the organization.
Regulatory Issues
The managed healthcare industry is subject to numerous laws and regulations. The subjects of such laws and regulations cover, but are not limited to, matters such as licensure, accreditation, government healthcare program participation requirements, information privacy and security, reimbursement for patient services, and Medicare and Medicaid fraud and abuse. Over the past several years, government activity has increased with respect to investigations and/or allegations concerning possible violations of fraud and abuse and false claims statutes and/or regulations by healthcare organizations and insurers. Entities that are found to have violated these laws and regulations may be excluded from participating in government healthcare programs, subjected to fines or penalties or required to repay amounts received from the government for previously billed patient services. Compliance with such laws and regulations can be subject to future government review and interpretation, as well as regulatory actions unknown or unasserted at this time.
In addition, regulators of certain of the Company’s subsidiaries may exercise certain discretionary rights under regulations including increasing their supervision of such entities, requiring additional restricted cash or other security or seizing or otherwise taking control of the assets and operations of such subsidiaries.
The Company is subject to certain federal laws and regulations in connection with its contracts with the federal government. These laws and regulations affect how the Company conducts business with its federal agency customers and may impose added costs on its business. The Company’s failure to comply with federal procurement laws and regulations could cause it to lose business, incur additional costs and subject it to a variety of civil and criminal penalties and administrative sanctions, including termination of contracts, forfeiture of profits, harm to reputation, suspension of payments, fines, and suspension or debarment from doing business with federal government agencies. The Company’s wholly owned subsidiary, AFSC, conducts business with federal agency customers and federal contractors to such agencies. The Company is currently in the process of conducting an investigation into matters relating to compliance by AFSC with Small Business Administration (“SBA”) regulations and other federal laws applicable to government contractors, and the Company intends to make its findings available to the SBA during and upon concluding the investigation. The results of this investigation may give rise to contingencies, if any, that could require us to record balance sheet liabilities or accrue expenses, the amounts of which we are not able to currently estimate. For 2017 AFSC’s total revenue comprised approximately 3% of the total revenues of the Company.
Legal
The Company’s operating activities entail significant risks of liability. From time to time, the Company is subject to various actions and claims arising from the acts or omissions of its employees, network providers or other parties. In the normal course of business, the Company receives reports relating to deaths and other serious incidents involving patients whose care is being managed by the Company. Such incidents occasionally give rise to malpractice, professional negligence and other related actions and claims against the Company or its network providers. Many of these actions and claims received by the Company seek substantial damages and therefore require the Company to incur significant fees and costs related to their defense.
The Company is also subject to or party to certain class actions and other litigation and claims relating to its operations or business practices. The Company has recorded reserves that, in the opinion of management, are adequate to cover litigation, claims or assessments that have been or may be asserted against the Company, and for which the outcome is probable and reasonably estimable. Management believes that the resolution of such litigation and claims will not have a material adverse effect on the Company’s financial condition or results of operations; however, there can be no assurance in this regard.
Operating Leases
The Company leases certain of its operating facilities and equipment. The leases, which expire at various dates through November 2025, generally require the Company to pay all maintenance, property tax and insurance costs.
At December 31, 2017, aggregate amounts of future minimum payments under operating leases were as follows: 2018—$20.8 million; 2019—$18.8 million; 2020—$14.3 million; 2021—$10.9 million; 2022—$9.1 million; 2023 and beyond—$9.9 million. Operating lease obligations include estimated future lease payments for both open and closed offices.
At December 31, 2017, aggregate amounts of future minimum rentals to be received under operating subleases were as follows: 2018—$0.3 million; and 2019—$0.1 million. Operating sublease rentals to be received mainly relate to a portion of the Company’s former headquarters.
Rent expense is recognized on a straight‑line basis over the terms of the leases. Rent expense was $15.2 million, $16.2 million and $19.0 million for the years ended December 31, 2015, 2016 and 2017, respectively.
Capital Leases
At December 31, 2017, aggregate future amounts of minimum payments under capital leases, net of leasehold improvement allowances, were as follows: 2018—$4.9 million; 2019—$3.1 million; 2020—$3.6 million; 2021—$3.6 million; 2022—$3.7 million; 2023 and beyond—$7.6 million. Included in the future amounts payable under capital lease commitments is imputed interest of $3.6 million.
10. Business Segment Information
The accounting policies of the Company’s segments are the same as those described in Note 2—“Summary of Significant Accounting Policies.” The Company evaluates performance of its segments based on profit or loss from operations before stock compensation expense, depreciation and amortization, interest expense, interest and other income, changes in the fair value of contingent consideration recorded in relation to acquisitions, gain on sale of assets, special charges or benefits, and income taxes (“Segment Profit”). Management uses Segment Profit information for internal reporting and control purposes and considers it important in making decisions regarding the allocation of capital and other resources, risk assessment and employee compensation, among other matters. Healthcare subcontracts with Pharmacy Management to provide pharmacy benefits management services for certain of Healthcare’s customers. In addition, Pharmacy Management provides pharmacy benefits management for the Company’s employees covered under its medical plan. As such, revenue, cost of goods sold and direct service costs and other related to these arrangements are eliminated. The Company’s segments are defined in Note 1—“General.”.
The following tables summarize, for the periods indicated, operating results by business segment (in thousands):
|
|
|
|
|
|
|
|
|
Corporate |
|
|
|
|
|
|
|
|
|
|
|
Pharmacy |
|
and |
|
|
|
|
||
|
|
|
Healthcare |
|
Management |
|
Elimination |
|
Consolidated |
|
||||
|
Year Ended December 31, 2015 |
|
|
|
|
|
|
|
|
|
|
|
|
|
|
Managed care and other revenue |
|
$ |
2,959,252 |
|
$ |
238,456 |
|
$ |
(63) |
|
$ |
3,197,645 |
|
|
PBM and dispensing revenue |
|
|
— |
|
|
1,510,180 |
|
|
(110,425) |
|
|
1,399,755 |
|
|
Cost of care |
|
|
(2,274,755) |
|
|
— |
|
|
— |
|
|
(2,274,755) |
|
|
Cost of goods sold |
|
|
— |
|
|
(1,427,680) |
|
|
105,803 |
|
|
(1,321,877) |
|
|
Direct service costs and other |
|
|
(510,811) |
|
|
(284,968) |
|
|
(26,613) |
|
|
(822,392) |
|
|
Stock compensation expense (1) |
|
|
8,502 |
|
|
36,351 |
|
|
5,531 |
|
|
50,384 |
|
|
Changes in fair value of contingent consideration (1) |
|
|
(1,404) |
|
|
45,661 |
|
|
— |
|
|
44,257 |
|
|
Less: non-controlling interest segment profit (loss) (2) |
|
|
(2,439) |
|
|
— |
|
|
(195) |
|
|
(2,634) |
|
|
Segment profit (loss) |
|
$ |
183,223 |
|
$ |
118,000 |
|
$ |
(25,572) |
|
$ |
275,651 |
|
|
Identifiable assets by business segment (3) |
|
|
|
|
|
|
|
|
|
|
|
|
|
|
Restricted cash |
|
$ |
133,597 |
|
$ |
— |
|
$ |
— |
|
$ |
133,597 |
|
|
Net accounts receivable |
|
|
153,036 |
|
|
270,975 |
|
|
4,633 |
|
|
428,644 |
|
|
Investments |
|
|
313,045 |
|
|
— |
|
|
13,120 |
|
|
326,165 |
|
|
Pharmaceutical inventory |
|
|
— |
|
|
50,749 |
|
|
— |
|
|
50,749 |
|
|
Goodwill |
|
|
260,618 |
|
|
360,772 |
|
|
— |
|
|
621,390 |
|
|
Other intangible assets, net |
|
|
12,227 |
|
|
121,147 |
|
|
— |
|
|
133,374 |
|
|
|
|
|
|
|
|
|
|
Corporate |
|
|
|
|
|
|
|
|
|
|
|
Pharmacy |
|
and |
|
|
|
|
||
|
|
|
Healthcare |
|
Management |
|
Elimination |
|
Consolidated |
|
||||
|
Year Ended December 31, 2016 |
|
|
|
|
|
|
|
|
|
|
|
|
|
|
Managed care and other revenue |
|
$ |
2,659,685 |
|
$ |
243,561 |
|
$ |
(304) |
|
$ |
2,902,942 |
|
|
PBM and dispensing revenue |
|
|
— |
|
|
2,053,188 |
|
|
(119,246) |
|
|
1,933,942 |
|
|
Cost of care |
|
|
(1,882,614) |
|
|
— |
|
|
— |
|
|
(1,882,614) |
|
|
Cost of goods sold |
|
|
— |
|
|
(1,933,086) |
|
|
114,366 |
|
|
(1,818,720) |
|
|
Direct service costs and other |
|
|
(573,706) |
|
|
(261,570) |
|
|
(41,336) |
|
|
(876,612) |
|
|
Stock compensation expense (1) |
|
|
4,440 |
|
|
20,509 |
|
|
12,473 |
|
|
37,422 |
|
|
Changes in fair value of contingent consideration (1) |
|
|
(231) |
|
|
127 |
|
|
— |
|
|
(104) |
|
|
Impairment of intangible assets (1) |
|
|
4,800 |
|
|
— |
|
|
— |
|
|
4,800 |
|
|
Less: non-controlling interest segment profit (loss) (2) |
|
|
(567) |
|
|
— |
|
|
(170) |
|
|
(737) |
|
|
Segment profit (loss) |
|
$ |
212,941 |
|
$ |
122,729 |
|
$ |
(33,877) |
|
$ |
301,793 |
|
|
Identifiable assets by business segment (3) |
|
|
|
|
|
|
|
|
|
|
|
|
|
|
Restricted cash |
|
$ |
81,608 |
|
$ |
1 |
|
$ |
167 |
|
$ |
81,776 |
|
|
Net accounts receivable |
|
|
191,058 |
|
|
405,611 |
|
|
10,095 |
|
|
606,764 |
|
|
Investments |
|
|
293,034 |
|
|
10,703 |
|
|
1,516 |
|
|
305,253 |
|
|
Pharmaceutical inventory |
|
|
— |
|
|
58,995 |
|
|
— |
|
|
58,995 |
|
|
Goodwill |
|
|
350,576 |
|
|
391,478 |
|
|
— |
|
|
742,054 |
|
|
Other intangible assets, net |
|
|
55,756 |
|
|
130,476 |
|
|
— |
|
|
186,232 |
|
|
|
|
|
|
|
|
|
|
Corporate |
|
|
|
|
|
|
|
|
|
|
|
Pharmacy |
|
and |
|
|
|
|
||
|
|
|
Healthcare |
|
Management |
|
Elimination |
|
Consolidated |
|
||||
|
Year Ended December 31, 2017 |
|
|
|
|
|
|
|
|
|
|
|
|
|
|
Managed care and other revenue |
|
$ |
3,206,277 |
|
$ |
273,489 |
|
$ |
(584) |
|
$ |
3,479,182 |
|
|
PBM and dispensing revenue |
|
|
— |
|
|
2,491,044 |
|
|
(131,643) |
|
|
2,359,401 |
|
|
Cost of care |
|
|
(2,413,770) |
|
|
— |
|
|
— |
|
|
(2,413,770) |
|
|
Cost of goods sold |
|
|
— |
|
|
(2,341,979) |
|
|
130,069 |
|
|
(2,211,910) |
|
|
Direct service costs and other |
|
|
(601,201) |
|
|
(302,525) |
|
|
(38,157) |
|
|
(941,883) |
|
|
Stock compensation expense (1) |
|
|
10,689 |
|
|
19,881 |
|
|
8,546 |
|
|
39,116 |
|
|
Changes in fair value of contingent consideration (1) |
|
|
696 |
|
|
— |
|
|
— |
|
|
696 |
|
|
Less: non-controlling interest segment profit (loss) (2) |
|
|
(56) |
|
|
— |
|
|
(3) |
|
|
(59) |
|
|
Segment profit (loss) |
|
$ |
202,747 |
|
$ |
139,910 |
|
$ |
(31,766) |
|
$ |
310,891 |
|
|
Identifiable assets by business segment (3) |
|
|
|
|
|
|
|
|
|
|
|
|
|
|
Restricted cash |
|
$ |
220,786 |
|
$ |
8,059 |
|
$ |
168 |
|
$ |
229,013 |
|
|
Net accounts receivable |
|
|
244,486 |
|
|
403,880 |
|
|
12,409 |
|
|
660,775 |
|
|
Investments |
|
|
327,865 |
|
|
— |
|
|
— |
|
|
327,865 |
|
|
Pharmaceutical inventory |
|
|
— |
|
|
40,945 |
|
|
— |
|
|
40,945 |
|
|
Goodwill |
|
|
610,867 |
|
|
395,421 |
|
|
— |
|
|
1,006,288 |
|
|
Other intangible assets, net |
|
|
165,159 |
|
|
103,129 |
|
|
— |
|
|
268,288 |
|
|
(1) |
Stock compensation expense, changes in the fair value of contingent consideration recorded in relation to the acquisitions and impairment of intangible assets are included in direct service costs and other operating expenses; however, these amounts are excluded from the computation of Segment Profit. |
|
(2) |
The non-controlling interest portion of AlphaCare’s segment profit (loss) is excluded from the computation of Segment Profit. |
|
(3) |
Identifiable assets by business segment are those assets that are used in the operations of each segment. The remainder of the Company’s assets cannot be specifically identified by segment. |
The following table reconciles consolidated income before income taxes to Segment Profit for the years ended December 31, 2015, 2016 and 2017 (in thousands):
|
|
|
|
|
|
|
|
|
|
|
|
|
|
|
|
|
|
|
|
|
|
|
|
|
|
|
2015 |
|
2016 |
|
2017 |
|
|||
|
Income before income taxes |
|
$ |
71,116 |
|
$ |
145,517 |
|
$ |
135,224 |
|
|
Stock compensation expense |
|
|
50,384 |
|
|
37,422 |
|
|
39,116 |
|
|
Changes in fair value of contingent consideration |
|
|
44,257 |
|
|
(104) |
|
|
696 |
|
|
Impairment of intangible assets |
|
|
— |
|
|
4,800 |
|
|
— |
|
|
Non-controlling interest segment (profit) loss |
|
|
2,634 |
|
|
737 |
|
|
59 |
|
|
Depreciation and amortization |
|
|
102,844 |
|
|
106,046 |
|
|
115,706 |
|
|
Interest expense |
|
|
6,581 |
|
|
10,193 |
|
|
25,977 |
|
|
Interest and other income |
|
|
(2,165) |
|
|
(2,818) |
|
|
(5,887) |
|
|
Segment Profit |
|
$ |
275,651 |
|
$ |
301,793 |
|
$ |
310,891 |
|
11. Selected Quarterly Financial Data (Unaudited)
The following is a summary of the unaudited quarterly results of operations for the years ended December 31, 2016 and 2017 (in thousands, except per share amounts):
|
|
|
For the Quarter Ended |
|
||||||||||
|
|
|
March 31, |
|
June 30, |
|
September 30, |
|
December 31, |
|
||||
|
|
|
2016 |
|
2016 |
|
2016 |
|
2016 |
|
||||
|
Year Ended December 31, 2016 |
|
|
|
|
|
|
|
|
|
|
|
|
|
|
Net revenue: |
|
|
|
|
|
|
|
|
|
|
|
|
|
|
Managed care and other |
|
$ |
676,461 |
|
$ |
699,861 |
|
$ |
751,589 |
|
$ |
775,031 |
|
|
PBM and dispensing |
|
|
440,561 |
|
|
464,484 |
|
|
540,543 |
|
|
488,354 |
|
|
Total net revenue |
|
|
1,117,022 |
|
|
1,164,345 |
|
|
1,292,132 |
|
|
1,263,385 |
|
|
Costs and expenses: |
|
|
|
|
|
|
|
|
|
|
|
|
|
|
Cost of care |
|
|
457,631 |
|
|
472,529 |
|
|
480,243 |
|
|
472,211 |
|
|
Cost of goods sold |
|
|
415,459 |
|
|
436,930 |
|
|
509,673 |
|
|
456,658 |
|
|
Direct service costs and other operating expenses (1) (2) (3) |
|
|
192,456 |
|
|
214,077 |
|
|
229,094 |
|
|
240,985 |
|
|
Depreciation and amortization |
|
|
25,007 |
|
|
25,580 |
|
|
26,885 |
|
|
28,574 |
|
|
Interest expense |
|
|
1,748 |
|
|
1,994 |
|
|
3,038 |
|
|
3,413 |
|
|
Interest and other income |
|
|
(683) |
|
|
(692) |
|
|
(741) |
|
|
(702) |
|
|
Total costs and expenses |
|
|
1,091,618 |
|
|
1,150,418 |
|
|
1,248,192 |
|
|
1,201,139 |
|
|
Income before income taxes |
|
|
25,404 |
|
|
13,927 |
|
|
43,940 |
|
|
62,246 |
|
|
Provision for income taxes |
|
|
12,013 |
|
|
12,615 |
|
|
18,631 |
|
|
26,469 |
|
|
Net income |
|
|
13,391 |
|
|
1,312 |
|
|
25,309 |
|
|
35,777 |
|
|
Less: net income (loss) attributable to non-controlling interest |
|
|
154 |
|
|
(2,646) |
|
|
(200) |
|
|
602 |
|
|
Net income attributable to Magellan |
|
$ |
13,237 |
|
$ |
3,958 |
|
$ |
25,509 |
|
$ |
35,175 |
|
|
Weighted average number of common shares outstanding—basic |
|
|
23,631 |
|
|
23,516 |
|
|
23,052 |
|
|
22,556 |
|
|
Weighted average number of common shares outstanding—diluted |
|
|
24,511 |
|
|
24,643 |
|
|
24,009 |
|
|
23,493 |
|
|
Net income per common share attributable to Magellan: |
|
|
|
|
|
|
|
|
|
|
|
|
|
|
Net income per common share—basic: |
|
$ |
0.56 |
|
$ |
0.17 |
|
$ |
1.11 |
|
$ |
1.56 |
|
|
Net income per common share—diluted: |
|
$ |
0.54 |
|
$ |
0.16 |
|
$ |
1.06 |
|
$ |
1.50 |
|
|
|
|
For the Quarter Ended |
|
||||||||||
|
|
|
March 31, |
|
June 30, |
|
September 30, |
|
December 31, |
|
||||
|
|
|
2017 |
|
2017 |
|
2017 |
|
2017 |
|
||||
|
Year Ended December 31, 2017 |
|
|
|
|
|
|
|
|
|
|
|
|
|
|
Net revenue: |
|
|
|
|
|
|
|
|
|
|
|
|
|
|
Managed care and other |
|
$ |
729,340 |
|
$ |
821,699 |
|
$ |
834,358 |
|
$ |
1,093,785 |
|
|
PBM and dispensing |
|
|
576,283 |
|
|
597,440 |
|
|
585,048 |
|
|
600,630 |
|
|
Total net revenue |
|
|
1,305,623 |
|
|
1,419,139 |
|
|
1,419,406 |
|
|
1,694,415 |
|
|
Costs and expenses: |
|
|
|
|
|
|
|
|
|
|
|
|
|
|
Cost of care |
|
|
482,054 |
|
|
583,264 |
|
|
569,306 |
|
|
779,146 |
|
|
Cost of goods sold |
|
|
542,633 |
|
|
562,355 |
|
|
543,682 |
|
|
563,240 |
|
|
Direct service costs and other operating expenses (4) (5) |
|
|
221,486 |
|
|
231,372 |
|
|
227,372 |
|
|
261,653 |
|
|
Depreciation and amortization |
|
|
26,976 |
|
|
27,731 |
|
|
28,189 |
|
|
32,810 |
|
|
Interest expense |
|
|
4,148 |
|
|
4,900 |
|
|
7,663 |
|
|
9,266 |
|
|
Interest and other income |
|
|
(949) |
|
|
(1,071) |
|
|
(1,781) |
|
|
(2,086) |
|
|
Total costs and expenses |
|
|
1,276,348 |
|
|
1,408,551 |
|
|
1,374,431 |
|
|
1,644,029 |
|
|
Income before income taxes |
|
|
29,275 |
|
|
10,588 |
|
|
44,975 |
|
|
50,386 |
|
|
Provision (benefit) for income taxes |
|
|
11,806 |
|
|
5,661 |
|
|
11,739 |
|
|
(4,123) |
|
|
Net income |
|
|
17,469 |
|
|
4,927 |
|
|
33,236 |
|
|
54,509 |
|
|
Less: net income (loss) attributable to non-controlling interest |
|
|
(278) |
|
|
(573) |
|
|
785 |
|
|
— |
|
|
Net income attributable to Magellan |
|
$ |
17,747 |
|
$ |
5,500 |
|
$ |
32,451 |
|
$ |
54,509 |
|
|
Weighted average number of common shares outstanding—basic |
|
|
23,012 |
|
|
23,108 |
|
|
23,282 |
|
|
23,921 |
|
|
Weighted average number of common shares outstanding—diluted |
|
|
24,038 |
|
|
24,038 |
|
|
24,563 |
|
|
25,113 |
|
|
Net income per common share attributable to Magellan: |
|
|
|
|
|
|
|
|
|
|
|
|
|
|
Net income per common share—basic: |
|
$ |
0.77 |
|
$ |
0.24 |
|
$ |
1.39 |
|
$ |
2.28 |
|
|
Net income per common share—diluted: |
|
$ |
0.74 |
|
$ |
0.23 |
|
$ |
1.32 |
|
$ |
2.17 |
|
|
(1) |
Includes stock compensation expense of $8,887, $9,510, $9,176 and $9,849 for the quarters ended March 31, June 30, September 30 and December 31, 2016, respectively. |
|
(2) |
Includes changes in fair value of contingent consideration of $(266), $463, $313 and $(614) for the quarters ended March 31, June 30, September 30 and December 31, 2016, respectively. |
|
(3) |
Includes impairment of intangible assets of $4,800 for the quarter ended June 30, 2016. |
|
(4) |
Includes stock compensation expense of $10,140, $11,371, $10,323 and $7,282 for the quarters ended March 31, June 30, September 30 and December 31, 2017, respectively. |
|
(5) |
Includes changes in fair value of contingent consideration of $(49), $252, $(834) and $1,327 for the quarters ended March 31, June 30, September 30 and December 31, 2017, respectively. |
SCHEDULE I—CONDENSED FINANCIAL INFORMATION OF REGISTRANT
MAGELLAN HEALTH, INC. (Parent Company Only)
CONDENSED BALANCE SHEETS AS OF DECEMBER 31,
(In thousands)
|
|
2016 |
|
2017 |
||
|
ASSETS |
|
|
|
|
|
|
Current Assets: |
|
|
|
|
|
|
Cash and cash equivalents |
$ |
2 |
|
$ |
2 |
|
Accounts receivable |
|
— |
|
|
157 |
|
Due from affiliates, net |
|
— |
|
|
283,802 |
|
Other current assets |
|
— |
|
|
32 |
|
Total Current Assets |
|
2 |
|
|
283,993 |
|
Investment in subsidiaries |
|
1,206,555 |
|
|
1,830,555 |
|
Total Assets |
$ |
1,206,557 |
|
$ |
2,114,548 |
|
LIABILITIES AND STOCKHOLDERS’ EQUITY |
|
|
|
|
|
|
Accrued liabilities |
$ |
496 |
|
$ |
7,227 |
|
Due to affiliates, net |
|
106,342 |
|
|
— |
|
Current debt |
|
— |
|
|
108,881 |
|
Total Current Liabilities |
|
106,838 |
|
|
116,108 |
|
Long-term debt |
|
— |
|
|
721,946 |
|
Total Liabilities |
|
106,838 |
|
|
838,054 |
|
Preferred stock, par value $.01 per share |
|
|
|
|
|
|
Authorized—10,000 shares at December 31, 2016 and December 31, 2017-Issued and outstanding-none |
|
— |
|
|
— |
|
Ordinary common stock, par value $.01 per share |
|
|
|
|
|
|
Authorized—100,000 shares at December 31, 2016 and December 31, 2017-Issued and outstanding-51,993 and 23,517 shares at December 31, 2016, respectively, and 52,973 and 24,202 shares at December 31, 2017, respectively |
|
520 |
|
|
530 |
|
Other Stockholders’ Equity: |
|
|
|
|
|
|
Additional paid-in capital |
|
1,186,283 |
|
|
1,274,811 |
|
Retained earnings |
|
1,289,288 |
|
|
1,399,495 |
|
Accumulated other comprehensive loss |
|
(175) |
|
|
(380) |
|
Treasury stock, at cost, 28,476 and 28,771 shares at December 31, 2016 and December 31, 2017, respectively |
|
(1,376,197) |
|
|
(1,397,962) |
|
Total Stockholders’ Equity |
|
1,099,719 |
|
|
1,276,494 |
|
Total Liabilities, Redeemable Non-Controlling Interest and Stockholders’ Equity |
$ |
1,206,557 |
|
$ |
2,114,548 |
See accompanying notes to condensed financial statements.
SCHEDULE I—CONDENSED FINANCIAL INFORMATION OF REGISTRANT
MAGELLAN HEALTH, INC. (Parent Company Only)
CONDENSED STATEMENTS OF COMPREHENSIVE INCOME
FOR THE YEARS ENDED DECEMBER 31,
(In thousands, except per share amounts)
|
|
2015 |
|
2016 |
|
2017 |
|||
|
Costs and expenses: |
|
|
|
|
|
|
|
|
|
Direct service costs and other operating expenses |
$ |
26,613 |
|
$ |
41,336 |
|
$ |
38,157 |
|
Interest expense |
|
— |
|
|
— |
|
|
8,343 |
|
Interest and other income |
|
— |
|
|
— |
|
|
(157) |
|
Total costs and expenses |
|
26,613 |
|
|
41,336 |
|
|
46,343 |
|
Loss before income taxes |
|
(26,613) |
|
|
(41,336) |
|
|
(46,343) |
|
Benefit for income taxes |
|
10,045 |
|
|
16,072 |
|
|
17,918 |
|
Net loss before equity in subsidiaries |
|
(16,568) |
|
|
(25,264) |
|
|
(28,425) |
|
Equity in earnings from subsidiaries |
|
47,981 |
|
|
103,143 |
|
|
138,632 |
|
Net income |
|
31,413 |
|
|
77,879 |
|
|
110,207 |
|
Other comprehensive income: |
|
|
|
|
|
|
|
|
|
Unrealized (loss) gain on available-for-sale securities |
|
(119) |
|
|
87 |
|
|
(205) |
|
Comprehensive income |
$ |
31,294 |
|
$ |
77,966 |
|
$ |
110,002 |
|
|
|
|
|
|
|
|
|
|
See accompanying notes to condensed financial statements.
SCHEDULE I—CONDENSED FINANCIAL INFORMATION OF REGISTRANT
MAGELLAN HEALTH, INC. (Parent Company Only)
CONDENSED STATEMENTS OF CASH FLOWS
FOR THE YEARS ENDED DECEMBER 31,
(In thousands)
|
|
2015 |
|
2016 |
|
2017 |
|||
|
Cash flows from operating activities: |
|
|
|
|
|
|
|
|
|
Net cash used in operating activities |
$ |
(17,390) |
|
$ |
(24,283) |
|
$ |
(21,778) |
|
Cash flows from investing activities: |
|
|
|
|
|
|
|
|
|
Dividends received from/(capital contributions to) subsidiaries, net |
|
166,442 |
|
|
106,235 |
|
|
(836,396) |
|
Net cash provided by (used in) investing activities |
|
166,442 |
|
|
106,235 |
|
|
(836,396) |
|
Cash flows from financing activities: |
|
|
|
|
|
|
|
|
|
Proceeds from issuance of debt |
|
— |
|
|
— |
|
|
841,736 |
|
Proceeds from exercise of stock options |
|
54,091 |
|
|
24,547 |
|
|
44,355 |
|
Payments to acquire treasury stock |
|
(204,427) |
|
|
(106,806) |
|
|
(21,765) |
|
Payments on debt |
|
— |
|
|
— |
|
|
(4,375) |
|
Other |
|
1,284 |
|
|
307 |
|
|
(1,777) |
|
Net cash (used in) provided by financing activities |
|
(149,052) |
|
|
(81,952) |
|
|
858,174 |
|
Net increase (decrease) in cash and cash equivalents |
|
— |
|
|
— |
|
|
— |
|
Cash and cash equivalents at beginning of period |
|
2 |
|
|
2 |
|
|
2 |
|
Cash and cash equivalents at end of period |
$ |
2 |
|
$ |
2 |
|
$ |
2 |
|
|
|
|
|
|
|
|
|
|
See accompanying notes to condensed financial statements.
|
|
|
|
|
|
|
|
|
|
SCHEDULE I—CONDENSED FINANCIAL INFORMATION OF REGISTRANT
MAGELLAN HEALTH, INC. (Parent Company Only)
NOTES TO CONDENSED FINANCIAL STATEMENTS
DECEMBER 31, 2017
1. Basis of Presentation
Magellan’s parent company condensed financial statements should be read in conjunction with its consolidated financial statements, and the accompanying notes thereto, included in this Form 10-K.
2. Subsidiary Transactions
Magellan’s investment in subsidiaries is stated at cost plus equity in undistributed earnings of subsidiaries. When Magellan receives dividends from its subsidiaries, such amounts are recorded as a reduction to the investments in the respective subsidiaries. Magellan made capital contributions to certain subsidiaries primarily to comply with minimum net worth requirements and to fund acquisitions. During 2015, 2016 and 2017, Magellan received cash dividends from its subsidiaries of $32.3 million, $29.3 million and $34.7 million, respectively.
3. Long Term Debt
See Note 5—“Long Term Debt and Capital Lease Obligations” to the consolidated financial statements for discussion of Magellan’s long-term debt obligations set forth elsewhere herein.
As of December 31, 2017, the contractual maturities of the term loan under the 2017 Credit Agreement were as follows: 2018—$17.5 million; 2019—$17.5 million; 2020—$17.5 million; 2021—$17.5 million; and 2022—$275.6 million. In 2024, Magellan’s $400.0 million aggregate principal amount of its 4.400% Senior Notes will mature.
MAGELLAN HEALTH, INC.
SCHEDULE II—VALUATION AND QUALIFYING ACCOUNTS
(In thousands)
|
|
|
Balance at |
|
Charged to |
|
Charged to |
|
|
|
|
|
|
|
Balance |
|
||||
|
|
|
Beginning |
|
Costs and |
|
Other |
|
|
|
|
|
|
|
at End |
|
||||
|
Classification |
|
of Period |
|
Expenses |
|
Accounts |
|
Addition |
|
Deduction |
|
of Period |
|
||||||
|
Year Ended December 31, 2015 |
|
|
|
|
|
|
|
|
|
|
|
|
|
|
|
|
|
|
|
|
Allowance for doubtful accounts |
|
$ |
4,047 |
|
$ |
(150) |
(1) |
$ |
(11) |
(2) |
$ |
— |
|
$ |
(640) |
(4) |
$ |
3,246 |
|
|
Year Ended December 31, 2016 |
|
|
|
|
|
|
|
|
|
|
|
|
|
|
|
|
|
|
|
|
Allowance for doubtful accounts |
|
|
3,246 |
|
|
2,498 |
(1) |
|
(67) |
(2) |
|
— |
|
|
(33) |
(4) |
|
5,644 |
|
|
Year Ended December 31, 2017 |
|
|
|
|
|
|
|
|
|
|
|
|
|
|
|
|
|
|
|
|
Allowance for doubtful accounts |
|
|
5,644 |
|
|
4,557 |
(1) |
|
(1,248) |
(2) |
|
424 |
(3) |
|
(755) |
(4) |
|
8,622 |
|
|
(1) |
Bad debt expense. |
|
(2) |
Recoveries of accounts receivable previously written off. |
|
(3) |
Acquisition of SWH. |
|
(4) |
Accounts written off. |
2