Attached files
| file | filename |
|---|---|
| EX-32.1 - EXHIBIT 32.1 SECTION 906 CEO AND CFO CERTIFICATIONS - ITRON, INC. | itriex-32112312017.htm |
| EX-31.2 - EXHIBIT 31.2 SECTION 302 CFO CERTIFICATION - ITRON, INC. | itriex-31212312017.htm |
| EX-31.1 - EXHIBIT 31.1 SECTION 302 CEO CERTIFICATION - ITRON, INC. | itriex-31112312017.htm |
| EX-23.2 - EXHIBIT 23.2 CONSENT OF INDEPENDENT REGISTERED PUBLIC ACCOUNTING FIRM - ITRON, INC. | itriex-23212312017.htm |
| EX-23.1 - EXHIBIT 23.1 CONSENT OF INDEPENDENT REGISTERED PUBLIC ACCOUNTING FIRM - ITRON, INC. | itriex-23112312017.htm |
| EX-21.1 - EXHIBIT 21.1 SUBSIDIARIES OF THE REGISTRANT - ITRON, INC. | itriex-21112312017.htm |
| EX-12.1 - EXHIBIT 12.1 RATIO OF EARNINGS TO FIXED CHARGES - ITRON, INC. | itriex-12112312017.htm |
| EX-10.4 - EXHIBIT 10.4 INDEMNIFICATION AGREEMENTS - ITRON, INC. | itriex-10412312017.htm |
| EX-10.2 - EXHIBIT 10.2 CHANGE IN CONTROL AGREEMENTS - ITRON, INC. | itriex-10212312017.htm |
UNITED STATES
SECURITIES AND EXCHANGE COMMISSION
Washington, D.C. 20549
FORM 10-K
x | ANNUAL REPORT PURSUANT TO SECTION 13 OR 15(d) OF THE SECURITIES EXCHANGE ACT OF 1934 |
For the fiscal year ended December 31, 2017
OR
o | TRANSITION REPORT PURSUANT TO SECTION 13 OR 15(d) OF THE SECURITIES EXCHANGE ACT OF 1934 |
For the transition period from to
Commission file number 000-22418
ITRON, INC.
(Exact name of registrant as specified in its charter)
Washington | 91-1011792 | |
(State of Incorporation) | (I.R.S. Employer Identification Number) | |
2111 N Molter Road, Liberty Lake, Washington 99019
(509) 924-9900
(Address and telephone number of registrant’s principal executive offices)
Securities registered pursuant to Section 12(b) of the Act:
Title of each class | Name of each exchange on which registered | |
Common stock, no par value | NASDAQ Global Select Market | |
Securities registered pursuant to Section 12(g) of the Act: None
Indicate by check mark if the registrant is a well-known seasoned issuer, as defined in Rule 405 of the Securities Act. Yes ¨ No x
Indicate by check mark if the registrant is not required to file reports pursuant to Section 13 or Section 15(d) of the Act. Yes ¨ No x
Indicate by check mark whether the registrant (1) has filed all reports required to be filed by Section 13 or 15(d) of the Securities Exchange Act of 1934 during the preceding 12 months (or for such shorter period that the registrant was required to file such reports), and (2) has been subject to such filing requirements for the past 90 days. Yes x No ¨
Indicate by check mark whether the registrant has submitted electronically and posted on its corporate Website, if any, every Interactive Data File required to be submitted and posted pursuant to Rule 405 of Regulation S-T (§ 232.405 of this chapter) during the preceding 12 months (or for such shorter period that the registrant was required to submit and post such files). Yes x No ¨
Indicate by check mark if disclosure of delinquent filers pursuant to Item 405 of Regulation S-K (§ 229.405 of this chapter) is not contained herein, and will not be contained, to the best of registrant’s knowledge, in definitive proxy or information statements incorporated by reference in Part III of this Form 10-K or any amendment to this Form 10-K. x
Indicate by check mark whether the registrant is a large accelerated filer, an accelerated filer, a non-accelerated filer, or a smaller reporting company. See the definitions of “large accelerated filer,” “accelerated filer” and “smaller reporting company” in Rule 12b-2 of the Exchange Act.
Large accelerated filer | x | Accelerated filer | ¨ | ||
Non-accelerated filer | o (Do not check if a smaller reporting company) | Smaller reporting company | ¨ | ||
Emerging growth company | ¨ | ||||
If an emerging growth company, indicate by check mark if the registrant has elected not to use the extended transition period for complying with any new or revised financial accounting standards provided pursuant to Section 13(a) of the Exchange Act. ¨
Indicate by check mark whether the registrant is a shell company (as defined in Rule 12b-2 of the Act). Yes ¨ No x
As of June 30, 2017 (the last business day of the registrant’s most recently completed second fiscal quarter), the aggregate market value of the shares of common stock held by non-affiliates of the registrant (based on the closing price for the common stock on the NASDAQ Global Select Market) was $2,598,397,322.
As of January 31, 2018, there were outstanding 38,784,060 shares of the registrant’s common stock, no par value, which is the only class of common stock of the registrant.
DOCUMENTS INCORPORATED BY REFERENCE
The information called for by Part III is incorporated by reference to the definitive Proxy Statement for the Annual Meeting of Shareholders of the Company to be held on May 10, 2018.
Itron, Inc.
Table of Contents
Page | |||
PART I | |||
ITEM 1: | |||
ITEM 1A: | |||
ITEM 1B: | |||
ITEM 2: | |||
ITEM 3: | |||
ITEM 4: | |||
PART II | |||
ITEM 5: | |||
ITEM 6: | |||
ITEM 7: | |||
ITEM 7A: | |||
ITEM 8: | |||
ITEM 9: | |||
ITEM 9A: | |||
ITEM 9B: | |||
PART III | |||
ITEM 10: | |||
ITEM 11: | |||
ITEM 12: | |||
ITEM 13: | |||
ITEM 14: | |||
PART IV | |||
ITEM 15: | |||
In this Annual Report on Form 10-K, the terms “we,” “us,” “our,” “Itron,” and the “Company” refer to Itron, Inc.
Certain Forward-Looking Statements
This document contains forward-looking statements concerning our operations, financial performance, revenues, earnings growth, liquidity, and other items. This document reflects our current plans and expectations and is based on information currently available as of the date of this Annual Report on Form 10-K. When we use the words “expect,” “intend,” “anticipate,” “believe,” “plan,” “project,” “estimate,” “future,” “objective,” “may,” “will,” “will continue,” and similar expressions, they are intended to identify forward-looking statements. Forward-looking statements rely on a number of assumptions and estimates. These assumptions and estimates could be inaccurate and cause our actual results to vary materially from expected results. You should not solely rely on these forward-looking statements as they are only valid as of the date of this Annual Report on Form 10-K. We do not have any obligation to publicly update or revise any forward-looking statement in this document. For a complete description of risks and uncertainties, refer to Item 1A: “Risk Factors” included in this Annual Report on Form 10-K.
PART I
ITEM 1: BUSINESS
Available Information
Documents we provide to the Securities and Exchange Commission (SEC) are available free of charge under the Investors section of our website at www.itron.com as soon as practicable after they are filed with or furnished to the SEC. In addition, these documents are available at the SEC’s website (http://www.sec.gov) and at the SEC’s Headquarters at 100 F Street, NE, Washington, DC 20549, or by calling 1-800-SEC-0330.
General
Itron is among the leading technology and services companies dedicated to the resourceful use of electricity, natural gas, and water. We provide comprehensive solutions that measure, manage, and analyze energy and water use. Our broad product portfolio helps utilities responsibly and efficiently manage resources.
With increasing populations and resource consumption, there continues to be growing demand for electricity, natural gas, and water. This demand comes at a time when utilities are challenged by cost constraints, regulatory requirements, environmental concerns and water scarcity. Our solution is to provide utilities with the knowledge they need to optimize their resources, improve their efficiency and to better understand and serve their customers - knowledge that gives their customers control over their energy and water needs and allows for better management and conservation of valuable resources.
We were incorporated in 1977 with a focus on meter reading technology. In 2004, we entered the electricity meter manufacturing business with the acquisition of Schlumberger Electricity Metering. In 2007, we expanded our presence in global meter manufacturing and systems with the acquisition of Actaris Metering Systems SA. In 2017, we completed our acquisition of Comverge by purchasing the stock of its parent, Peak Holding Corp. (Comverge), which enabled us to offer integrated cloud-based demand response, energy efficiency and customer engagement solutions. In 2018, we will strengthen our ability to deliver a broader set of solutions, increase the pace of growth and innovation in the smart city and industrial Internet of Important ThingsTM markets with the acquisition of Silver Spring Networks, Inc. (SSNI).
The following is a discussion of our major products, our markets, and our operating segments. Refer to Item 8: “Financial Statements and Supplementary Data” included in this Annual Report on Form 10-K for specific segment results.
Our Business
We offer solutions that enable electric and natural gas utilities to build smart grids to manage assets, secure revenue, lower operational costs, improve customer service, and enable demand response. Our solutions include standard meters and next-generation smart metering products, metering systems, software and services, which ultimately empower and benefit consumers.
We supply comprehensive solutions to address the unique challenges facing the water industry, including increasing demand and resource scarcity. We offer a complete product portfolio, including standard meters and smart metering products, systems, and services, for applications in the residential and commercial industrial markets for water and heat.
1
We offer a portfolio of services to our customers from standalone services to end-to-end solutions. These include licensing meter data management and analytics software, managed services, software-as-a-service (SaaS), technical support services, licensing hardware technology, and consulting services.
We classify metering systems into two categories: standard metering systems and smart metering solutions. These categories are described in more detail below:
Standard Metering Systems
Standard metering systems employ a standard meter, which measures electricity, natural gas, water, or thermal energy by mechanical, electromechanical, or electronic means, with no built-in remote-reading communication capability. Standard meters require manual reading, which is typically performed by a utility representative or meter reading service provider. Worldwide, we produce standard residential, commercial and industrial (C&I), and transmission and distribution (T&D) electricity, natural gas, water, and heat meters.
Smart Metering Solutions
Smart metering solutions employ meters or modules with one-way or two-way communication capability embedded in or attached to a meter to collect and store meter data, which is transmitted to handheld computers, mobile units, telephone, radio frequency (RF), cellular, power line carrier (PLC), fixed networks, or through adaptive communication technology (ACT). ACT enables dynamic selection of the optimal communications path, utilizing RF or PLC, based on network operating conditions, data attributes and application requirements. This allows utilities to collect and analyze meter data to optimize operations, store interval data, remotely connect and disconnect service to the meter, send data, receive commands, and interface with other devices, such as in-home displays, smart thermostats and appliances, home area networks, and advanced control systems.
Our Operating Segments
We operate under the Itron brand worldwide and manage and report under three operating segments: Electricity, Gas, and Water. Our Water operating segment includes both our global water, and heat and allocation solutions. This structure allows each segment to develop its own go-to-market strategy, prioritize its marketing and product development requirements, and focus on its strategic investments. Our sales and marketing functions are managed under each segment. Our product development and manufacturing operations are managed on a worldwide basis to promote a global perspective in our operations and processes while serving the needs of our segments.
Comverge's technologies have been integrated into our Electricity segment's increasing software and services offerings. We completed the acquisition of SSNI on January 5, 2018 and SSNI became our wholly-owned subsidiary, changing its name to Itron Networked Solutions, Inc. This entity will operate and be managed as a separate operating segment, allowing it to maintain focus, ensure business continuity and successfully deliver on customer commitments established by SSNI. Product, solution and service branding used under the Itron brand will be reviewed as part of integrating Itron Networked Solutions Inc.
Bookings and Backlog of Orders
Bookings for a reported period represent customer contracts and purchase orders received during the period for hardware, software, and services that have met certain conditions, such as regulatory and/or contractual approval. Total backlog represents committed but undelivered contracts and purchase orders at period-end. Twelve-month backlog represents the portion of total backlog that we estimate will be recognized as revenue over the next 12 months. Backlog is not a complete measure of our future revenues as we also receive significant book-and-ship orders as well as Frame Contracts. Bookings and backlog may fluctuate significantly due to the timing of large project awards. In addition, annual or multi-year contracts are subject to rescheduling and cancellation by customers due to the long-term nature of the contracts. Beginning total backlog, plus bookings, minus revenues, will not equal ending total backlog due to miscellaneous contract adjustments, foreign currency fluctuations, and other factors.
Year Ended | Total Bookings | Total Backlog (1) | 12-Month Backlog (2) | |||||||||
(in millions) | ||||||||||||
December 31, 2017 | $ | 1,993 | $ | 1,750 | $ | 931 | ||||||
December 31, 2016 | 2,066 | 1,652 | 761 | |||||||||
December 31, 2015 | 1,981 | 1,575 | 836 | |||||||||
(1) | Backlog includes $116.3 million related to Comverge as of December 31, 2017. |
(2) | 12-month backlog includes $35.1 million related to Comverge as of December 31, 2017. |
2
Information on bookings by our operating segments is as follows:
Year Ended | Total Bookings | Electricity | Gas | Water | ||||||||||||
(in millions) | ||||||||||||||||
December 31, 2017 | $ | 1,993 | $ | 997 | $ | 502 | $ | 494 | ||||||||
December 31, 2016 | 2,066 | 1,013 | 567 | 486 | ||||||||||||
December 31, 2015 | 1,981 | 958 | 577 | 446 | ||||||||||||
Sales and Distribution
We use a combination of direct and indirect sales channels in our operating segments. A direct sales force is utilized for large electric, natural gas, and water utilities, with which we have long-established relationships. For smaller utilities, we typically use an indirect sales force that consists of distributors, sales representatives, partners, and meter manufacturer representatives.
No single customer represented more than 10% of total revenues for the years ended December 31, 2017, 2016, and 2015. Our 10 largest customers in each of the years ended December 31, 2017, 2016, and 2015, accounted for approximately 33%, 31%, and 22% of total revenues, respectively.
Manufacturing
Our products require a wide variety of components and materials, which are subject to price and supply fluctuations. We enter into standard purchase orders in the ordinary course of business, which can include purchase orders for specific quantities based on market prices, as well as open-ended agreements that provide for estimated quantities over an extended shipment period, typically up to one year at an established unit cost. Although we have multiple sources of supply for many of our material requirements, certain components and raw materials are supplied by limited or sole-source vendors, and our ability to perform certain contracts depends on the availability of these materials. Refer to Item 1A: “Risk Factors,” included in this Annual Report on Form 10-K, for further discussion related to supply risks.
Our manufacturing facilities are located throughout the world, an overview of which is presented in Item 2: “Properties,” included in this Annual Report on Form 10-K. While we manufacture and assemble the majority of our products, we outsource the manufacturing of certain products to various manufacturing partners. This approach allows us to reduce our costs as it reduces our manufacturing overhead and inventory and also allows us to adjust more quickly to changing end-customer demand. These partners assemble our products using design specifications, quality assurance programs, and standards that we establish, and procure components and assemble our products based on demand forecasts. These forecasts represent our estimates of future demand for our products based upon historical trends and analysis from our sales and product management functions, as adjusted for overall market conditions.
Partners
In connection with delivering products and systems to our customers, we may partner with third party vendors to provide hardware, software, or services, e.g., meter installation and communication network equipment and infrastructure. Our ability to perform on our contractual obligations with our customers is dependent on these partners meeting their obligations to us.
Product Development
Our product development is focused on both improving existing technology and developing innovative new technology for electricity, natural gas, water and heat meters, sensing and control devices, data collection software, communication technologies, data warehousing, and software applications. We invested approximately $170 million, $168 million, and $162 million in product development in 2017, 2016 and 2015, which represented 8% of total revenues for 2017, 8% of total revenues for 2016 and 9% of total revenues in 2015.
Workforce
As of December 31, 2017, we had approximately 7,800 people in our workforce, including 6,500 permanent employees. We have not experienced significant employee work stoppages and consider our employee relations to be good.
3
Competition
We provide a broad portfolio of products, solutions, software, and services to electric, gas, and water utility customers globally. Consequently, we operate within a large and complex competitive landscape. Some of our competitors have diversified product portfolios and participate in multiple geographic markets, while others focus on specific regional markets and/or certain types of products, including some low-cost suppliers based in China and India. Our competitors in China have an increasing presence in other markets around the world, however, excluding the Asia Pacific region this competition does not represent a major market share in our global operating regions. Our competitors range from small to large established companies. Our primary competitors for each operating segment are discussed below.
We believe that our competitive advantage is based on our in-depth knowledge of the utility industries, our capacity to innovate, our ability to provide complete end-to-end integrated solutions (including metering, network communications, data collection systems, meter data management software, and other metering software applications), our established customer relationships, and our track record of delivering reliable, accurate, and long-lived products and services. Refer to Item 1A: “Risk Factors” included in this Annual Report on Form 10-K for a discussion of the competitive pressures we face.
Electricity
We are among the leading global suppliers of electricity metering solutions, including standard meters and smart metering solutions. Within the electricity business line, our primary global competitors include Aclara (Hubbell Inc.), Elster (Honeywell International Inc.), Landis+Gyr, Hexing Electrical Co., Ltd, and historically SSNI. On a regional basis, other major competitors include Sagemcom Energy & Telecom (Charterhouse Capital Partners), Sensus (Xylem, Inc.), Endesa (Enel SpA), and ELO Electronic Systems.
Gas
We are among the leading global suppliers of gas metering solutions, including standard meters and smart metering solutions. Our primary global competitor is Elster (Honeywell International Inc.). On a regional basis, other major competitors include Aclara, Apator, Landis+Gyr, LAO Industria, Pietro Fiorentini, and Sensus (Xylem, Inc.).
Water
We are among the leading global suppliers of standard and smart water meters and communication modules. Our primary global competitors include Diehl Metering (Diehl Stiftung & Co. KG), Elster (Honeywell International Inc.), Sensus (Xylem, Inc.), and Zenner Performance (Zenner International GmbH & Co. KG). On a regional basis, other major competitors include Badger Meter, LAO Industria, Kamstrup Water Metering L.L.C., Neptune Technologies (Roper Technologies, Inc.), Master Meter, Mueller Water Products, and Aclara.
Strategic Alliances
We pursue strategic alliances with other companies in areas where collaboration can produce product advancement and acceleration of entry into new markets. The objectives and goals of a strategic alliance can include one or more of the following: technology exchange, product development, joint sales and marketing, or access to new geographic markets. Refer to Item 1A: “Risk Factors” included in this Annual Report on Form 10-K for a discussion of risks associated with strategic alliances.
Intellectual Property
Our patents and patent applications cover a range of technologies, which relate to standard metering, smart metering solutions and technology, meter data management software, and knowledge application solutions. We also rely on a combination of copyrights, patents, and trade secrets to protect our products and technologies. Disputes over the ownership, registration, and enforcement of intellectual property rights arise in the ordinary course of our business. While we believe patents and trademarks are important to our operations and, in aggregate, constitute valuable assets, no single patent or trademark, or group of patents or trademarks, is critical to the success of our business. We license some of our technology to other companies, some of which are our competitors.
Environmental Regulations
In the ordinary course of our business we use metals, solvents, and similar materials that are stored on-site. We believe we are in compliance with environmental laws, rules, and regulations applicable to the operation of our business.
4
EXECUTIVE OFFICERS
Set forth below are the names, ages, and titles of our executive officers as of February 28, 2018.
Name | Age | Position | ||
Philip C. Mezey | 58 | President and Chief Executive Officer | ||
Joan S. Hooper | 60 | Senior Vice President and Chief Financial Officer | ||
Thomas L. Deitrich | 51 | Executive Vice President and Chief Operating Officer | ||
Michel C. Cadieux | 60 | Senior Vice President, Human Resources | ||
Shannon M. Votava | 57 | Senior Vice President, General Counsel and Corporate Secretary | ||
Philip C. Mezey is President and Chief Executive Officer and a member of our Board of Directors. Mr. Mezey was appointed to his current position and to the Board of Directors in January 2013. Mr. Mezey joined Itron in March 2003, and in 2007 Mr. Mezey became Senior Vice President and Chief Operating Officer, Itron North America. Mr. Mezey served as President and Chief Operating Officer, Energy from March 2011 through December 2012.
Joan S. Hooper is Senior Vice President and Chief Financial Officer. Ms. Hooper was appointed to this role in June 2017. Prior to joining Itron, Ms. Hooper was Chief Financial Officer of CHC Helicopter from 2011 to July 2015. Following Ms. Hooper's departure from CHC, CHC filed a voluntary petition of relief under Chapter 11 of the U.S. Bankruptcy Code in May 2016, and CHC emerged from bankruptcy in March 2017. Prior to CHC, she held several finance executive positions at Dell, Inc. from 2003 to 2010, including vice president and CFO for its Global Public and Americas business units, vice president of corporate finance and chief accounting officer.
Thomas L. Deitrich is Executive Vice President and Chief Operating Officer. Mr. Deitrich joined Itron in October 2015. From 2012 to September 2015, Mr. Deitrich was Senior Vice President and General Manager for Digital Networking at Freescale Semiconductor, Inc. (Freescale), and he served as the Senior Vice President and General Manager of Freescale's RF, Analog, Sensor, and Cellular Products Group from 2009 to 2012. Mr. Deitrich had other roles of increasing responsibility at Freescale from 2006 to 2009. Prior to Freescale, Mr. Deitrich worked for Flextronics, Sony-Ericsson/Ericsson, and GE.
Michel C. Cadieux is Senior Vice President, Human Resources and has been so since joining Itron in February 2014. From 2008 to 2012, Mr. Cadieux was Senior Vice President of Human Resources and Security at Freescale Semiconductor, Inc.
Shannon M. Votava is Senior Vice President, General Counsel and Corporate Secretary. Ms. Votava was promoted to this role in March 2016. Ms. Votava joined Itron in May 2010 as Assistant General Counsel and was promoted to Vice President and General Counsel in January 2012. She assumed the responsibilities of Corporate Secretary in January 2013. Before joining Itron, Ms. Votava served as Associate General Counsel, Commercial at Cooper Industries plc from October 2008 to April 2010, and as General Counsel for Honeywell's Electronic Materials business from 2003 to 2008.
5
ITEM 1A: RISK FACTORS
We are dependent on the utility industry, which has experienced volatility in capital spending.
We derive the majority of our revenues from sales of products and services to utilities. Purchases of our products may be deferred as a result of many factors, including economic downturns, slowdowns in new residential and commercial construction, customers’ access to capital upon acceptable terms, the timing and availability of government subsidies or other incentives, utility specific financial circumstances, mergers and acquisitions, regulatory decisions, weather conditions, and fluctuating interest rates. We have experienced, and may in the future experience, variability in operating results on an annual and a quarterly basis as a result of these factors.
We depend on our ability to develop competitive products.
Our future success will depend, in part, on our ability to continue to design and manufacture competitive products, and to enhance and sustain our existing products, keep pace with technological advances and changing customer requirements, gain international market acceptance, and manage other factors in the markets in which we sell our products. Product development will require continued investment in order to maintain our competitive position, and the periods in which we incur significant product development costs may drive variability in our quarterly results. We may not have the necessary capital, or access to capital at acceptable terms, to make these investments. We have made, and expect to continue to make, substantial investments in technology development. However, we may experience unforeseen problems in the development or performance of our technologies or products, which can prevent us from meeting our product development schedules. New products often require certifications or regulatory approvals before the products can be used and we cannot be certain that our new products will be approved in a timely manner. Finally, we may not achieve market acceptance of our new products and services.
Utility industry sales cycles can be lengthy and unpredictable.
The utility industry is subject to substantial government regulation. Regulations have often influenced the frequency of meter replacements. Sales cycles for standalone meter products have typically been based on annual or biennial bid-based agreements. Utilities place purchase orders against these agreements as their inventories decline, which can create fluctuations in our sales volumes.
Sales cycles for smart metering solutions are generally long and unpredictable due to several factors, including budgeting, purchasing, and regulatory approval processes that can take several years to complete. Our utility customers typically issue requests for quotes and proposals, establish evaluation processes, review different technical options with vendors, analyze performance and cost/benefit justifications, and perform a regulatory review, in addition to applying the normal budget approval process. Today, governments around the world are implementing new laws and regulations to promote increased energy efficiency, slow or reverse growth in the consumption of scarce resources, reduce carbon dioxide emissions, and protect the environment. Many of the legislative and regulatory initiatives encourage utilities to develop a smart grid infrastructure, and some of these initiatives provide for government subsidies, grants, or other incentives to utilities and other participants in their industry to promote transition to smart grid technologies. If government regulations regarding the smart grid and smart metering are delayed, revised to permit lower or different investment levels in metering infrastructure, or terminated altogether, this could have a material adverse effect on our results of operation, cash flow, and financial condition.
Our customer contracts are complex and contain provisions that could cause us to incur penalties, be liable for damages, and/or incur unanticipated expenses with respect to the functionality, deployment, operation, and availability of our products and services.
In addition to the risk of unanticipated warranty or recall expenses, our customer contracts may contain provisions that could cause us to incur penalties, be liable for damages, including liquidated damages, or incur other expenses if we experience difficulties with respect to the functionality, deployment, operation, and availability of our products and services. Some of these contracts contain long-term commitments to a set schedule of delivery or performance. If we failed in our estimated schedule or we fail in our management of the project, this may cause delays in completion. In the event of late deliveries, late or improper installations or operations, failure to meet product or performance specifications or other product defects, or interruptions or delays in our managed service offerings, our customer contracts may expose us to penalties, liquidated damages, and other liabilities. In the event we were to incur contractual penalties, such as liquidated damages or other related costs that exceed our expectations, our business, financial condition, and operating results could be materially and adversely affected. Further, we could be required to recognize a current-period reduction of revenue related to a specific component of a customer contract at the time we determine the products and/or services to be delivered under that component would result in a loss due to expected revenues estimated to be less than expected costs. Depending on the amounts of the associated revenues (if any) and the costs, this charge could be material to our results of operations in the period it is recognized.
6
We depend on certain key vendors, strategic partners, and other third parties.
Certain of our products, subassemblies, and system components including most of our circuit boards are procured from limited or sole sources. We cannot be certain that we will not experience operational difficulties with these sources, including reductions in the availability of production capacity, errors in complying with product specifications, insufficient quality control, failures to meet production deadlines, increases in manufacturing costs, vendors’ access to capital and increased lead times. Additionally, our manufacturers may experience disruptions in their manufacturing operations due to equipment breakdowns, labor strikes or shortages, natural disasters, component or material shortages, cost increases or other similar problems. Further, in order to minimize their inventory risk, our manufacturers might not order components from third-party suppliers with adequate lead time, thereby impacting our ability to meet our demand forecast. Therefore, if we fail to manage our relationship with our manufacturers effectively, or if they experience operational difficulties, our ability to ship products to our customers and distributors could be impaired and our competitive position and reputation could be harmed. In the event that we receive shipments of products that fail to comply with our technical specifications or that fail to conform to our quality control standards, and we are not able to obtain replacement products in a timely manner, we risk revenue losses from the inability to sell those products, increased administrative and shipping costs, and lower profitability. Additionally, if defects are not discovered until after consumers purchase our products, they could lose confidence in the technical attributes of our products and our business could be harmed. Although arrangements with these partners may contain provisions for warranty expense reimbursement, we may remain responsible to the consumer for warranty service in the event of product defects and could experience an unanticipated product defect or warranty liability. While the Company relies on its partners to adhere to its supplier code of conduct, material violations of the supplier code of conduct could occur.
We face increasing competition.
We face competitive pressures from a variety of companies in each of the markets we serve. Some of our present and potential future competitors have, or may have, substantially greater financial, marketing, technical, or manufacturing resources and, in some cases, have greater name recognition, customer relationships, and experience. Some competitors may enter markets we serve and sell products at lower prices in order to gain or grow market share. Our competitors may be able to respond more quickly to new or emerging technologies and changes in customer requirements. They may also be able to devote greater resources to the development, promotion, and sale of their products and services than we can. Some competitors have made, and others may make, strategic acquisitions or establish cooperative relationships among themselves or with third parties that enhance their ability to address the needs of our prospective customers. It is possible that new competitors or alliances among current and new competitors may emerge and rapidly gain significant market share. Other companies may also drive technological innovation and develop products that are equal in quality and performance or superior to our products, which could put pressure on our market position, reduce our overall sales, and require us to invest additional funds in new technology development. In addition, there is a risk that low-cost providers will expand their presence in our markets, improve their quality, or form alliances or cooperative relationships with our competitors, thereby contributing to future price erosion. Some of our products and services may become commoditized, and we may have to adjust the prices of some of our products to stay competitive. Further, some utilities may purchase meters separately from the communication devices. The specifications for such meters may require interchangeability, which could lead to further commoditization of the meter, driving prices lower and reducing margins. Should we fail to compete successfully with current or future competitors, we could experience material adverse effects on our business, financial condition, results of operations, and cash flows.
Our current and expected level and terms of indebtedness could adversely affect our ability to raise additional capital to fund our operations and take advantage of new business opportunities and prevent us from meeting our obligations under our debt instruments, and our ability to service our indebtedness is dependent on our ability to generate cash, which is influenced by many factors beyond our control.
On December 22, 2017, we issued $300 million aggregate principal amount of 5.00% senior notes due 2026 (December Notes). The December Notes were issued pursuant to an indenture, dated as of December 22, 2017 (Indenture), among Itron, the guarantors from time to time party thereto and U.S. Bank National Association, as trustee. The December Notes formed part of the financing of the merger consideration for the acquisition of Silver Spring Networks, Inc. (SSNI) by Itron (SSNI Acquisition). On January 19, 2018, we issued an additional $100 million aggregate principal amount of 5.00% senior notes due 2026 pursuant to the Indenture (January Notes). The proceeds from the January Notes were used to refinance existing indebtedness related to the SSNI Acquisition, pay related fees and expenses, and for general corporate purposes.
On January 5, 2018, we entered into a credit agreement providing for committed credit facilities in the amount of $1.15 billion (the 2018 credit facility). The 2018 credit facility consists of a U.S. dollar term loan in the amount of $650 million and a multicurrency revolving credit facility in the committed amount of $500 million. The 2018 credit facility amended and restated
7
in its entirety our amended and restated credit agreement dated June 23, 2015 and replaced committed facilities in the amount of $725 million.
The substantial indebtedness incurred in December and January could have important consequences to us, including:
• | increasing our vulnerability to general economic and industry conditions; |
• | requiring a substantial portion of our cash flow used in operations to be dedicated to the payment of principal and interest on our indebtedness, therefore reducing our liquidity and our ability to use our cash flow to fund our operations, capital expenditures and future business opportunities; |
• | exposing us to the risk of increased interest rates, and corresponding increased interest expense, as borrowings under the 2018 credit facility would be at variable rates of interest; |
• | limiting our ability to obtain additional financing for working capital, capital expenditures, debt service requirements, acquisitions, and general corporate or other purposes; and |
• | limiting our ability to adjust to changing marketplace conditions and placing us at a competitive disadvantage compared with our competitors who may have less debt. |
Our ability to make scheduled payments on and to refinance our indebtedness depends on and is subject to our financial and operating performance, which is influenced, in part, by general economic, financial, competitive, legislative, regulatory, counterparty business and other risks that are beyond our control, including the availability of financing in the U.S. banking and capital markets. We cannot assure you that our business will generate sufficient cash flow from operations or that future borrowings will be available to us in an amount sufficient to enable us to service our debt to refinance our debt or to fund our other liquidity needs on commercially reasonable terms or at all.
If we are unable to meet our debt service obligations or to fund our other liquidity needs, we will need to restructure or refinance all or a portion of our debt which could cause us to default on our debt obligations and impair our liquidity. Our ability to restructure or refinance our debt will depend on the condition of the capital markets and our financial condition at such time. Even if refinancing indebtedness is available, any refinancing of our indebtedness could be at higher interest rates and may require us to comply with more onerous covenants that could further restrict our business operations.
Moreover, in the event of a default under any of our indebtedness the holders of the defaulted debt could elect to declare all the funds borrowed to be due and payable, together with accrued and unpaid interest, which in turn could result in cross defaults under our other indebtedness. The lenders under the 2018 credit facility could also elect to terminate their commitments thereunder and cease making further loans, and such lenders could institute foreclosure proceedings against their collateral, and we could be forced into bankruptcy or liquidation. If we breach our covenants under the 2018 credit facility, we would be in default thereunder. Such lenders could exercise their rights, as described above, and we could be forced into bankruptcy or liquidation.
Our variable rate indebtedness subjects us to interest rate risk, which could cause our debt service obligations to increase significantly.
The 2018 credit facility will bear, and other indebtedness we may incur in the future may bear, interest at a variable rate. As a result, at any given time interest rates on the 2018 credit facility and any other variable rate debt could be higher or lower than current levels. If interest rates increase, our debt service obligations on our variable rate indebtedness may increase even though the amount borrowed remains the same, and therefore net income and associated cash flows, including cash available for servicing our indebtedness, may correspondingly decrease. While we continually monitor and assess our interest rate risk and may institute derivative instruments to manage such risk in the future, these instruments could be ineffective at mitigating all or a part of our risk, including changes to the applicable margin under our 2018 credit facility.
Our 2018 credit facility and Senior Notes limit our ability and the ability of many of our subsidiaries to take certain actions.
Our 2018 credit facility and Senior Notes place restrictions on our ability, and the ability of many of our subsidiaries, dependent on meeting specified financial ratios, to, among other things:
• incur more debt; | • pay dividends, make distributions, and repurchase capital stock; | |
• make certain investments; | • create liens; | |
• enter into transactions with affiliates; | • enter into sale lease-back transactions; | |
• merge or consolidate; | • transfer or sell assets. | |
8
Our 2018 credit facility contain other customary covenants, including the requirement to meet specified financial ratios and provide periodic financial reporting. Our ability to borrow will depend on the satisfaction of these covenants. Events beyond our control can affect our ability to meet those covenants. Our failure to comply with obligations under our borrowing arrangements may result in declaration of an event of default. An event of default, if not cured or waived, may permit acceleration of required payments against such indebtedness. We cannot be certain we will be able to remedy any such defaults. If our required payments are accelerated, we cannot be certain that we will have sufficient funds available to pay the indebtedness or that we will have the ability to raise sufficient capital to replace the indebtedness on terms favorable to us or at all. In addition, in the case of an event of default under our secured indebtedness such as our 2018 credit facility, the lenders may be permitted to foreclose on our assets securing that indebtedness. As a result of these restrictions, we will be limited as to how we conduct our business and we may be unable to raise additional debt or equity financing to compete effectively or to take advantage of new business opportunities. The terms of any future indebtedness we may incur could include more restrictive covenants. We cannot assure you that we will be able to maintain compliance with these covenants in the future and, if we fail to do so that we will be able to obtain waivers from the lenders and/or amend the covenants.
Despite our current level of indebtedness, we may be able to incur substantially more debt and enter into other transactions which could further exacerbate the risks to our financial condition described above.
We may be able to incur significant additional indebtedness in the future. Although the credit agreement that currently governs our 2018 credit facility, the Senior Notes, and other debt instruments contain restrictions on the incurrence of additional indebtedness and entering into certain types of other transactions, these restrictions are subject to a number of qualifications and exceptions. Additional indebtedness incurred in compliance with these restrictions could be substantial. These restrictions also do not prevent us from incurring obligations, such as certain trade payables that do not constitute indebtedness as defined under our debt instruments. To the extent we incur additional indebtedness or other obligations, the risks described in the immediately preceding risk factor and others described herein may increase.
Our acquisitions of and investments in third parties have risks.
We may complete acquisitions or make investments in the future, both within and outside of the United States. Acquisitions and investments involve numerous risks such as the diversion of senior management’s attention; unsuccessful integration of the acquired entity’s personnel, operations, technologies, and products; incurrence of significant expenses to meet an acquiree's customer contractual commitments; lack of market acceptance of new services and technologies; or difficulties in operating businesses in international legal jurisdictions. Failure to adequately address these issues could result in the diversion of resources and adversely impact our ability to manage our business. In addition, acquisitions and investments in third parties may involve the assumption of obligations, significant write-offs, or other charges associated with the acquisition. Impairment of an investment, goodwill, or an intangible asset may result if these risks were to materialize. For investments in entities that are not wholly owned by Itron, such as joint ventures, a loss of control as defined by U.S. generally accepted accounting principles (GAAP) could result in a significant change in accounting treatment and a change in the carrying value of the entity. There can be no assurances that an acquired business will perform as expected, accomplish our strategic objectives, or generate significant revenues, profits, or cash flows.
We may face adverse publicity, consumer or political opposition, or liability associated with our products.
The safety and security of the power grid and natural gas and water supply systems, the accuracy and protection of the data collected by meters and transmitted via the smart grid, concerns about the safety and perceived health risks of using radio frequency communications, and privacy concerns of monitoring home appliance energy usage have been the focus of recent adverse publicity. Unfavorable publicity and consumer opposition may cause utilities or their regulators to delay or modify planned smart grid initiatives. Smart grid projects may be, or may be perceived as, unsuccessful.
Our products are complex and may contain defects or experience failures due to any number of issues in design, materials, deployment, and/or use. If any of our products contain a defect, a compatibility or interoperability issue, or other types of errors, we may have to devote significant time and resources to identify and correct the issue. We provide product warranties for varying lengths of time and establish allowances in anticipation of warranty expenses. In addition, we recognize contingent liabilities for additional product-failure related costs. These warranty and related product-failure allowances may be inadequate due to product defects and unanticipated component failures, as well as higher than anticipated material, labor, and other costs we may incur to replace projected product failures. A product recall or a significant number of product returns could be expensive; damage our reputation and relationships with utilities, meter and communication vendors, and other third-party vendors; result in the loss of business to competitors; or result in litigation. We may incur additional warranty expenses in the future with respect to new or established products, which could materially and adversely affect our operations and financial position.
9
We may be subject to claims that there are adverse health effects from the radio frequencies utilized in connection with our products. If these claims prevail, our customers could suspend implementation or purchase substitute products, which could cause a loss of sales.
Changes in tax laws, valuation allowances, and unanticipated tax liabilities could adversely affect our effective income tax rate and profitability.
We are subject to income tax in the United States and numerous foreign jurisdictions. Significant judgment is required in evaluating our tax positions and determining our provision for income taxes. During the ordinary course of business, there are many transactions and calculations for which the ultimate tax determination is uncertain. We establish reserves for tax-related uncertainties based on estimates of whether, and the extent to which, additional taxes will be due. These reserves may be established when we believe that certain positions might be challenged despite our belief that our tax return positions are fully supportable. We adjust these reserves in light of changing facts and circumstances. The provision for income taxes includes the impact of reserve positions and changes to reserves that are considered appropriate, as well as valuation allowances when we determine it is more likely than not that a deferred tax asset cannot be realized. In addition, future changes in tax laws in the jurisdictions in which we operate could have a material impact on our effective income tax rate and profitability. We regularly assess all of these matters to determine the adequacy of our tax provision, which is subject to significant judgment.
The Organization for Economic Cooperation and Development guidance under the Base Erosion and Profit Shifting (BEPS) initiatives aim to minimize perceived tax abuses and modernize global tax policy. More countries are beginning to implement legislative changes based on these BEPS recommendations.
On December 22, 2017, the United States enacted comprehensive tax reform commonly referred to as the Tax Cuts and Jobs Act (Tax Act). The Tax Act makes significant changes to the way the U.S. taxes corporations. Although we are currently evaluating the impact of the Tax Act on our business, significant uncertainty exists with respect to how the Tax Act will affect our business. Some of this uncertainty will not be resolved until clarifying Treasury regulations are promulgated or other relevant authoritative guidance is published. These include modifying the rules regarding limitations on certain deductions for executive compensation, introducing a capital investment deduction in certain circumstances, placing certain limitations on the interest deduction, modifying the rules regarding the usability of certain net operating losses, implementing a minimum tax on the global intangible low-taxed income of a “United States shareholder” of a “controlled foreign corporation,” modifying certain rules applicable to United States shareholders of controlled foreign corporations, imposing a deemed repatriation tax on certain earnings and adding certain anti-base erosion rules. It is possible that the application of these new rules may have a material and adverse impact on our consolidated results of operations, financial position, cash flows, and related financial statement disclosures.
Disruption and turmoil in global credit and financial markets, which may be exacerbated by the inability of certain countries to continue to service their sovereign debt obligations, and the possible unfavorable implications of such events for the global economy, may unfavorably impact our business, liquidity, operating results, and financial condition.
The current economic conditions, including volatility in the availability of credit and foreign exchange rates and extended economic slowdowns, have contributed to the instability in some global credit and financial markets. Additionally, at-risk financial institutions in certain countries may, without forewarning, seize a portion of depositors' account balances. The seized funds would be used to recapitalize the at-risk financial institution and would no longer be available for the depositors' use. If such seizure were to occur at financial institutions where we have funds on deposit, it could have a significant impact on our overall liquidity. While the ultimate outcome of these events cannot be predicted, it is possible that such events may have an unfavorable impact on the global economy and our business, liquidity, operating results, and financial condition.
We are subject to international business uncertainties, obstacles to the repatriation of earnings, and foreign currency fluctuations.
A substantial portion of our revenues is derived from operations conducted outside the United States. International sales and operations may be subjected to risks such as the imposition of government controls, government expropriation of facilities, lack of a well-established system of laws and enforcement of those laws, access to a legal system free of undue influence or corruption, political instability, terrorist activities, restrictions on the import or export of critical technology, currency exchange rate fluctuations, and adverse tax burdens. Lack of availability of qualified third-party financing, generally longer receivable collection periods than those commonly practiced in the United States, trade restrictions, changes in tariffs, labor disruptions, difficulties in staffing and managing international operations, difficulties in imposing and enforcing operational and financial controls at international locations, potential insolvency of international distributors, preference for local vendors, burdens of complying with different permitting standards and a wide variety of foreign laws, and obstacles to the repatriation of earnings and cash all present additional risk to our international operations. Fluctuations in the value of international currencies may impact our operating results due to the translation to the U.S. dollar as well as our ability to compete in international markets. International expansion and market
10
acceptance depend on our ability to modify our technology to take into account such factors as the applicable regulatory and business environment, labor costs, and other economic conditions. In addition, the laws of certain countries do not protect our products or technologies in the same manner as the laws of the United States. Further, foreign regulations or restrictions, e.g., opposition from unions or works councils, could delay, limit, or disallow significant operating decisions made by our management, including decisions to exit certain businesses, close certain manufacturing locations, or other restructuring actions. There can be no assurance that these factors will not have a material adverse effect on our future international sales and, consequently, on our business, financial condition, and results of operations.
We may engage in future restructuring activities and incur additional charges in our efforts to improve profitability. We also may not achieve the anticipated savings and benefits from current or any future restructuring projects.
We have implemented multiple restructuring projects to adjust our cost structure, and we may engage in similar restructuring activities in the future. These restructuring activities reduce our available employee talent, assets, and other resources, which could slow product development, impact ability to respond to customers, increase quality issues, temporarily reduce manufacturing efficiencies, and limit our ability to increase production quickly. In addition, delays in implementing restructuring projects, unexpected costs, unfavorable negotiations with works councils, changes in governmental policies, or failure to meet targeted improvements could change the timing or reduce the overall savings realized from the restructuring project.
Business interruptions could adversely affect our business.
Our worldwide operations could be subject to hurricanes, tornadoes, earthquakes, floods, fires, extreme weather conditions, medical epidemics or pandemics, or other natural or man-made disasters or business interruptions. The occurrence of any of these business disruptions could seriously harm our business, financial condition, and results of operations.
Our key manufacturing facilities are concentrated, and, in the event of a significant interruption in production at any of our manufacturing facilities, considerable expense, time, and effort could be required to establish alternative production lines to meet contractual obligations, which would have a material adverse effect on our business, financial condition, and results of operations.
We may encounter strikes or other labor disruptions that could adversely affect our financial condition and results of operations.
We have significant operations throughout the world. In a number of countries outside the U.S., our employees are covered by collective bargaining agreements. As the result of various corporate or operational actions, which our management has undertaken or may be made in the future, we could encounter labor disruptions. These disruptions may be subject to local media coverage, which could damage our reputation. Additionally, the disruptions could delay our ability to meet customer orders and could adversely affect our results of operations. Any labor disruptions could also have an impact on our other employees. Employee morale and productivity could suffer, and we may lose valued employees whom we wish to retain.
Asset impairment could result in significant changes that would adversely impact our future operating results.
We have significant inventory, intangible assets, long-lived assets, and goodwill that are susceptible to valuation adjustments as a result of changes in various factors or conditions, which could impact our results of operations or and financial condition. Factors that could trigger an impairment of such assets include the following:
• | reduction in the net realizable value of inventory which becomes obsolete or exceeds anticipated demand; |
• | changes in our organization or management reporting structure, which could result in additional reporting units, requiring greater aggregation or disaggregation in our analysis by reporting unit and potentially alternative methods/assumptions of estimating fair values; |
• | underperformance relative to projected future operating results; |
• | changes in the manner or use of the acquired assets or the strategy for our overall business; |
• | unfavorable industry or economic trends; and |
• | decline in our stock price for a sustained period or decline in our market capitalization below net book value. |
We are subject to a variety of litigation that could adversely affect our results of operations, financial condition, and cash flows.
From time to time, we are involved in litigation that arises from our business. In addition, these entities may bring claims against our customers, which, in some instances, could result in an indemnification of the customer. Litigation may also relate to, among other things, product failure or product liability claims, contractual disputes, employment matters, or securities litigation. Litigation can be expensive to defend and can divert the attention of management and other personnel for long periods of time, regardless of the ultimate outcome. We may be required to pay damage awards or settlements or become subject to equitable remedies that
11
could adversely affect our financial condition and results of operations. While we currently maintain insurance coverage, such insurance may not provide adequate coverage against potential claims.
We may face losses associated with alleged unauthorized use of third party intellectual property.
We may be subject to claims or inquiries regarding alleged unauthorized use of a third party’s intellectual property. An adverse outcome in any intellectual property litigation or negotiation could subject us to significant liabilities to third parties, require us to license technology or other intellectual property rights from others, require us to comply with injunctions to cease marketing or the use of certain products or brands, or require us to redesign, re-engineer, or rebrand certain products or packaging, any of which could affect our business, financial condition, and results of operations. If we are required to seek licenses under patents or other intellectual property rights of others, we may not be able to acquire these licenses at acceptable terms, if at all. In addition, the cost of responding to an intellectual property infringement claim, in terms of legal fees, expenses, and the diversion of management resources, whether or not the claim is valid, could have a material adverse effect on our business, financial condition, and results of operations.
If our products infringe the intellectual property rights of others, we may be required to indemnify our customers for any damages they suffer. We generally indemnify our customers with respect to infringement by our products of the proprietary rights of third parties. Third parties may assert infringement claims against our customers. These claims may require us to initiate or defend protracted and costly litigation on behalf of our customers, regardless of the merits of these claims. If any of these claims succeed, we may be forced to pay damages on behalf of our customers or may be required to obtain licenses for the products they use. If we cannot obtain all necessary licenses on commercially reasonable terms, our customers may be forced to stop using our products.
We are affected by the availability and regulation of radio spectrum and interference with the radio spectrum that we use.
A significant number of our products use radio spectrum, which are subject to regulation by the Federal Communications Commission (FCC) in the United States. The FCC may adopt changes to the rules for our licensed and unlicensed frequency bands that are incompatible with our business. In the past, the FCC has adopted changes to the requirements for equipment using radio spectrum, and it is possible that the FCC or the U.S. Congress will adopt additional changes.
Although radio licenses are generally required for radio stations, Part 15 of the FCC’s rules permits certain low-power radio devices (Part 15 devices) to operate on an unlicensed basis. Part 15 devices are designed for use on frequencies used by others. These other users may include licensed users, which have priority over Part 15 users. Part 15 devices cannot cause harmful interference to licensed users and must be designed to accept interference from licensed radio devices. In the United States, our smart metering solutions are typically Part 15 devices that transmit information to (and receive information from, if applicable) handheld, mobile, or fixed network systems pursuant to these rules.
We depend upon sufficient radio spectrum to be allocated by the FCC for our intended uses. As to the licensed frequencies, there is some risk that there may be insufficient available frequencies in some markets to sustain our planned operations. The unlicensed frequencies are available for a wide variety of uses and may not be entitled to protection from interference by other users who operate in accordance with FCC rules. The unlicensed frequencies are also often the subject of proposals to the FCC requesting a change in the rules under which such frequencies may be used. If the unlicensed frequencies become crowded to unacceptable levels, restrictive, or subject to changed rules governing their use, our business could be materially adversely affected.
We have committed, and will continue to commit, significant resources to the development of products that use particular radio frequencies. Action by the FCC could require modifications to our products. The inability to modify our products to meet such requirements, the possible delays in completing such modifications, and the cost of such modifications all could have a material adverse effect on our future business, financial condition, and results of operations.
Outside of the United States, certain of our products require the use of RF and are subject to regulations in those jurisdictions where we have deployed such equipment. In some jurisdictions, radio station licensees are generally required to operate a radio transmitter and such licenses may be granted for a fixed term and must be periodically renewed. In other jurisdictions, the rules permit certain low power devices to operate on an unlicensed basis. Our smart metering solutions typically transmit to (and receive information from, if applicable) handheld, mobile, or fixed network reading devices in license-exempt bands pursuant to rules regulating such use. In Europe, we generally use the 169 megahertz (MHz), 433/4 MHz, and 868 MHz bands. In the rest of the world, we primarily use the 433/4 MHz, 920 MHz and 2.4000-2.4835 gigahertz (GHz) bands, as well as other local license-exempt bands. To the extent we introduce new products designed for use in the United States or another country into a new market, such products may require significant modification or redesign in order to meet frequency requirements and other regulatory specifications. In some countries, limitations on frequency availability or the cost of making necessary modifications may preclude
12
us from selling our products in those countries. In addition, new consumer products may create interference with the performance of our products, which could lead to claims against us.
We may be unable to adequately protect our intellectual property.
While we believe that our patents and other intellectual property have significant value, it is uncertain that this intellectual property or any intellectual property acquired or developed by us in the future will provide meaningful competitive advantages. There can be no assurance that our patents or pending applications will not be challenged, invalidated, or circumvented by competitors or that rights granted thereunder will provide meaningful proprietary protection. Moreover, competitors may infringe our patents or successfully avoid them through design innovation. To combat infringement or unauthorized use of our intellectual property, we may need to commence litigation, which can be expensive and time-consuming. In addition, in an infringement proceeding a court may decide that a patent or other intellectual property right of ours is not valid or is unenforceable, or may refuse to stop the other party from using the technology or other intellectual property right at issue on the grounds that it is non-infringing or the legal requirements for an injunction have not been met. Policing unauthorized use of our intellectual property is difficult and expensive, and we cannot provide assurance that we will be able to prevent misappropriation of our proprietary rights, particularly in countries that do not protect such rights in the same manner as in the United States.
We have pension benefit obligations, which could have a material impact on our earnings, liabilities, and shareholders' equity and could have significant adverse impacts in future periods.
We sponsor both funded and unfunded defined benefit pension plans for our international employees, primarily in Germany, France, Italy, Indonesia, Brazil, and Spain. Our general funding policy for these qualified pension plans is to contribute amounts sufficient to satisfy regulatory funding standards of the respective countries for each plan.
The determination of pension plan expense, benefit obligation, and future contributions depends heavily on market factors such as the discount rate and the actual return on plan assets. We estimate pension plan expense, benefit obligation, and future contributions to these plans using assumptions with respect to these and other items. Changes to those assumptions could have a significant effect on future contributions as well as on our annual pension costs and/or result in a significant change to shareholders' equity.
A number of key personnel are critical to the success of our business.
Our success depends in large part on the efforts of our highly qualified technical and management personnel and highly skilled individuals in all disciplines. The loss of one or more of these employees and the inability to attract and retain qualified replacements could have a material adverse effect on our business. Specifically, uncertainty among Itron's employees about their future roles after the completion of the SSNI Acquisition may impair Itron's ability to attract, retain and motivate key personnel. In addition, some of SSNI's key employees may consider career changes due to uncertainty about their employment, distracting them from performing their duties to Itron.
If we are unable to protect our information technology infrastructure and network against data corruption, cyber-based attacks or network security breaches, we could be exposed to customer liability and reputational risk.
We rely on various information technology systems to capture, process, store, and report data and interact with customers, vendors, and employees. Despite security steps we have taken to secure all information and transactions, our information technology systems, and those of our third-party providers, may be subject to cyber attacks. Any data breaches could result in misappropriation of data or disruption of operations. In addition, hardware and operating system software and applications that we procure from third parties may contain defects in design or manufacture that could interfere with the operation of the systems. Misuse of internal applications; theft of intellectual property, trade secrets, or other corporate assets; and inappropriate disclosure of confidential information could stem from such incidents.
In addition, we have designed products and services that connect to and are part of the “Internet of Things.” While we attempt to provide adequate security measures to safeguard our products from cyber attacks, the potential for an attack remains. A successful attack may result in inappropriate access to information or an inability for our products to function properly.
Any such operational disruption and/or misappropriation of information could result in lost sales, unfavorable publicity, or business delays and could have a material adverse effect on our business.
13
We may not realize the expected benefits from strategic alliances.
We have several strategic alliances with large and complex organizations and other companies with which we work to offer complementary products and services. There can be no assurance we will realize the expected benefits from these strategic alliances. If successful, these relationships may be mutually beneficial and result in shared growth. However, alliances carry an element of risk because, in most cases, we must both compete and collaborate with the same company from one market to the next. Should our strategic partnerships fail to perform, we could experience delays in product development or experience other operational difficulties.
We rely on information technology systems.
Our industry requires the continued operation of sophisticated information technology systems and network infrastructures, which may be subject to disruptions arising from events that are beyond our control. We are dependent on information technology systems, including, but not limited to, networks, applications, and outsourced services. We continually enhance and implement new systems and processes throughout our global operations.
We offer managed services and software utilizing several data center facilities located worldwide. Any damage to, or failure of, these systems could result in interruptions in the services we provide to our utility customers. As we continue to add capacity to our existing and future data centers, we may move or transfer data. Despite precautions taken during this process, any delayed or unsuccessful data transfers may impair the delivery of our services to our utility customers. We also sell vending and pre-payment systems with security features that, if compromised, may lead to claims against us.
We are completing a phased upgrade of our primary enterprise resource planning (ERP) systems to allow for greater depth and breadth of functionality worldwide. System conversions are expensive and time consuming undertakings that impact all areas of the Company. While successful implementations of each phase will provide many benefits to us, an unsuccessful or delayed implementation of any particular phase may cost us significant time and resources.
The failure of these systems to operate effectively, problems with transitioning to upgraded or replacement systems, or a breach in security of these systems due to computer viruses, hacking, acts of terrorism, and other causes could materially and adversely affect our business, financial condition, and results of operations by harming our ability to accurately forecast sales demand, manage our supply chain and production facilities, achieve accuracy in the conversion of electronic data and records, and report financial and management information on a timely and accurate basis. In addition, due to the systemic internal control features within ERP systems, we may experience difficulties that could affect our internal control over financial reporting.
Changes in environmental regulations, violations of such regulations, or future environmental liabilities could cause us to incur significant costs and could adversely affect our operations.
Our business and our facilities are subject to numerous laws, regulations, and ordinances governing, among other things, the storage, discharge, handling, emission, generation, manufacture, disposal, remediation of, and exposure to toxic or other hazardous substances, and certain waste products. Many of these environmental laws and regulations subject current or previous owners or operators of land to liability for the costs of investigation, removal, or remediation of hazardous materials. In addition, these laws and regulations typically impose liability regardless of whether the owner or operator knew of, or was responsible for, the presence of any hazardous materials and regardless of whether the actions that led to the presence were conducted in compliance with the law. In the ordinary course of our business, we use metals, solvents, and similar materials, which are stored on-site. The waste created by the use of these materials is transported off-site on a regular basis by unaffiliated waste haulers. Many environmental laws and regulations require generators of waste to take remedial actions at, or in relation to, the off-site disposal location even if the disposal was conducted in compliance with the law. The requirements of these laws and regulations are complex, change frequently, and could become more stringent in the future. Failure to comply with current or future environmental regulations could result in the imposition of substantial fines, suspension of production, alteration of our production processes, cessation of operations, or other actions, which could materially and adversely affect our business, financial condition, and results of operations. There can be no assurance that a claim, investigation, or liability will not arise with respect to these activities, or that the cost of complying with governmental regulations in the future will not have a material adverse effect on us.
We are exposed to counterparty default risks with our financial institutions and insurance providers.
If one or more of the depository institutions in which we maintain significant cash balances were to fail, our ability to access these funds might be temporarily or permanently limited, and we could face material liquidity problems and financial losses.
14
The lenders of our 2018 facility consist of several participating financial institutions. Our revolving line of credit allows us to provide letters of credit in support of our obligations for customer contracts and provides additional liquidity. If our lenders are not able to honor their line of credit commitments due to the loss of a participating financial institution or other circumstance, we would need to seek alternative financing, which may not be under acceptable terms, and therefore could adversely impact our ability to successfully bid on future sales contracts and adversely impact our liquidity and ability to fund some of our internal initiatives or future acquisitions.
Our international sales and operations are subject to complex laws relating to foreign corrupt practices and anti-bribery laws, among many others, and a violation of, or change in, these laws could adversely affect our operations.
The Foreign Corrupt Practices Act in the United States requires United States companies to comply with an extensive legal framework to prevent bribery of foreign officials. The laws are complex and require that we closely monitor local practices of our overseas offices. The United States Department of Justice has recently heightened enforcement of these laws. In addition, other countries continue to implement similar laws that may have extra-territorial effect. In the United Kingdom, where we have operations, the U.K. Bribery Act imposes significant oversight obligations on us and could impact our operations outside of the United Kingdom. The costs for complying with these and similar laws may be significant and could require significant management time and focus. Any violation of these or similar laws, intentional or unintentional, could have a material adverse effect on our business, financial condition, or results of operations.
Changes in accounting principles and guidance could result in unfavorable accounting charges or effects.
We prepare our consolidated financial statements in accordance with GAAP. These principles are subject to interpretation by the Securities and Exchange Commission (SEC) and various bodies formed to create and interpret appropriate accounting principles and guidance. A change in these principles or guidance, or in their interpretations, may have a material effect on our reported results, as well as our processes and related controls, and may retroactively affect previously reported results. For example, in May 2014, the Financial Accounting Standards Board (FASB) issued Accounting Standards Update (ASU) 2014-09, Revenue from Contracts with Customers: Topic 606 (ASU 2014-09), to supersede nearly all existing revenue recognition guidance under GAAP. We adopted this standard effective January 1, 2018 using the cumulative catch-up transition method, and therefore, will recognize the cumulative effect of initially applying the revenue standard as an adjustment to the opening balance of retained earnings in the period of initial application. While we are finalizing the assessment of the impact of adoption we currently believe the most significant impact relates to our accounting for software and software-related elements, and the increased financial statement disclosures, but are continuing to evaluate the effect that the updated standard will have on our consolidated results of operations, financial position, cash flows, and related financial statement disclosures. Depending on the outcome of these evaluations for us and acquisition targets and the potential issuance of further accounting pronouncements, implementation guidelines, and interpretations, we may be required to modify our reported results, revenue recognition policies, or business practices, which could have a material adverse effect on our business, financial condition, or results of operations.
If we fail to maintain an effective system of internal controls, we may not be able to accurately report our financial results, prevent fraud, or maintain investor confidence.
Effective internal controls are necessary for us to provide reliable and accurate financial reports and effectively prevent fraud. We have devoted significant resources and time to comply with the internal control over financial reporting requirements of the Sarbanes-Oxley Act. In addition, Section 404 under the Sarbanes-Oxley Act requires that our auditors attest to the design and operating effectiveness of our controls over financial reporting. Our compliance with the annual internal control report requirement for each fiscal year will depend on the effectiveness of our financial reporting, data systems, and controls across our operating subsidiaries. Furthermore, an important part of our growth strategy has been, and will likely continue to be, the acquisition of complementary businesses, and we expect these systems and controls to become increasingly complex to the extent that we integrate acquisitions and our business grows. Likewise, the complexity of our transactions, systems, and controls may become more difficult to manage. In addition, new accounting standards may have a significant impact on our financial statements in future periods, requiring new or enhanced controls. We cannot be certain that we will ensure that we design, implement, and maintain adequate controls over our financial processes and reporting in the future, especially for acquisition targets that may not have been required to be in compliance with Section 404 of the Sarbanes-Oxley Act at the date of acquisition. Our acquisition of SSNI will be subject to this risk as they are an emerging growth company, as defined in the Jumpstart Our Business Startups Act of 2012, and have chosen to be exempt from complying with the internal control over financial reporting auditor attestation requirements of Section 404(b) of the Sarbanes-Oxley Act.
Failure to implement new controls or enhancements to controls, difficulties encountered in control implementation or operation, or difficulties in the assimilation of acquired businesses into our control system could result in additional errors, material misstatements, or delays in our financial reporting obligations. Inadequate internal controls could also cause investors to lose
15
confidence in our reported financial information, which could have an unfavorable effect on the trading price of our stock and our access to capital.
SSNI had identified a material weakness in their internal control over financial reporting. If this material weakness is not deemed to be remediated or if additional SSNI related material weaknesses are identified in the future, our business, results of operations and investors’ confidence in us could be materially affected.
SSNI identified a material weakness in internal control over financial reporting, as reported in their consolidated financial statements for the period ended December 31, 2016, which was not remediated as of their last filed Form 10-Q related to September 30, 2017. Specifically, they determined that the design and operation of controls related to revenue recognition were inadequate. Although SSNI management has implemented a remediation plan to address this material weakness, they provide no assurance that testing of the remediation efforts will conclude they were successful and their controls are effective. If we are required to continue remediation efforts, or if additional SSNI related material weaknesses are identified in the future this could result in financial reporting delays, increased costs, cause investors to lose confidence, require us to divert substantial resources, and have a material adverse effect on our business, financial condition, or results of operations.
We are subject to regulatory compliance.
We are subject to various governmental regulations in all of the jurisdictions in which we conduct business. Failure to comply with current or future regulations could result in the imposition of substantial fines, suspension of production, alteration of our production processes, cessation of operations, or other actions, which could materially and adversely affect our business, financial condition, and results of operations.
Regulations related to “conflict minerals” may force us to incur additional expenses, may result in damage to our business reputation, and may adversely impact our ability to conduct our business.
In August 2012, under the Dodd-Frank Wall Street Reform and Consumer Protection Act of 2010, the SEC adopted requirements for companies that use certain minerals and derivative metals (referred to as “conflict minerals,” regardless of their actual country of origin) in their products. Some of these metals are commonly used in electronic equipment and devices, including our products. These requirements require companies to investigate, disclose and report whether or not such metals originated from the Democratic Republic of Congo or adjoining countries and required due diligence efforts. There may be increased costs associated with complying with these disclosure requirements, including for diligence to determine the sources of conflict minerals used in our products and related components, and other potential changes to products, processes or sources of supply as a consequence of such verification activities. Further interpretation and implementation of these rules could adversely affect the sourcing, supply, and pricing of materials used in our products.
ITEM 1B: UNRESOLVED STAFF COMMENTS
None.
16
ITEM 2: PROPERTIES
We own our headquarters facility, which is located in Liberty Lake, Washington.
The following table lists our major manufacturing facilities by the location and product line.
Product Line | ||||
Region | Electricity | Gas | Water | Multiple Product Lines |
North America | None | None | None | Waseca, MN - G,W (L) Oconee, SC - E, G (O) |
Europe, Middle East, and Africa | Chasseneuil, France (O) | Argenteuil, France (L) Reims, France (O) Karlsruhe, Germany (O) | Massy, France (L) Macon, France (O) Oldenburg, Germany (O) Asti, Italy (O) | Godollo, Hungary - E, G, W (O) |
Asia/Pacific | None | Wujiang, China (L) | Suzhou, China (L) Dehradun, India (L) | Bekasi, Indonesia - E,W (O) |
Latin America | None | None | Americana, Brazil (O) | None |
(O) - Manufacturing facility is owned
(L) - Manufacturing facility is leased
E - Electricity manufacturing facility, G - Gas manufacturing facility, W - Water manufacturing facility
Our principal properties are in good condition, and we believe our current facilities are sufficient to support our operations. Our major manufacturing facilities are owned, while smaller factories are typically leased.
In addition to our manufacturing facilities, we have numerous sales offices, product development facilities, and distribution centers, which are located throughout the world.
ITEM 3: LEGAL PROCEEDINGS
None.
ITEM 4: MINE SAFETY DISCLOSURES
Not applicable.
17
PART II
ITEM 5: | MARKET FOR REGISTRANT’S COMMON EQUITY, RELATED STOCKHOLDER MATTERS AND ISSUER PURCHASES OF EQUITY SECURITIES |
Market Information for Common Stock
Our common stock is traded on the NASDAQ Global Select Market. The following table reflects the range of high and low common stock sales prices for the four quarters of 2017 and 2016 as reported by the NASDAQ Global Select Market.
2017 | 2016 | ||||||||||||||
High | Low | High | Low | ||||||||||||
First Quarter | $ | 66.20 | $ | 58.70 | $ | 43.00 | $ | 30.31 | |||||||
Second Quarter | $ | 71.10 | $ | 59.15 | $ | 45.51 | $ | 39.78 | |||||||
Third Quarter | $ | 77.45 | $ | 67.20 | $ | 56.23 | $ | 42.34 | |||||||
Fourth Quarter | $ | 79.40 | $ | 63.90 | $ | 65.75 | $ | 51.90 | |||||||
Performance Graph
The following graph compares the five-year cumulative total return to shareholders on our common stock with the five-year cumulative total return of our peer group of companies used for the year ended December 31, 2017 and the NASDAQ Composite Index.
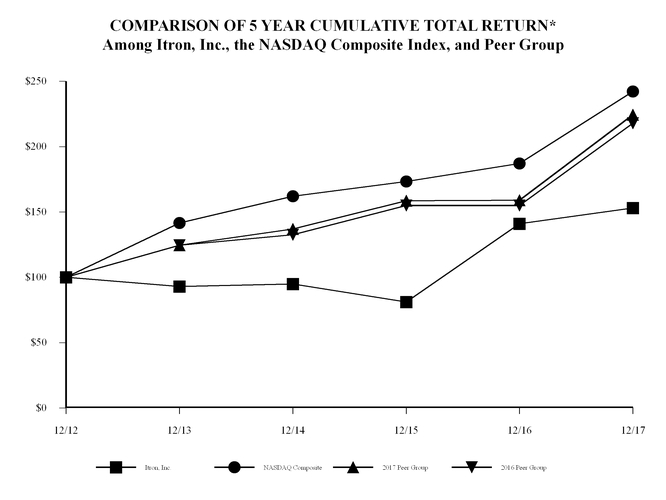
* $100 invested on 12/31/12 in stock or index, including reinvestment of dividends.
Fiscal years ending December 31.
18
The performance graph above is being furnished solely to accompany this Report pursuant to Item 201(e) of Regulation S-K, and is not being filed for purposes of Section 18 of the Securities Exchange Act of 1934, as amended, and is not to be incorporated by reference into any of our filings, whether made before or after the date hereof, regardless of any general incorporation language in such filing.
The above presentation assumes $100 invested on December 31, 2012 in the common stock of Itron, Inc., the peer group, and the NASDAQ Composite Index, with all dividends reinvested. With respect to companies in the peer group, the returns of each such corporation have been weighted to reflect relative stock market capitalization at the beginning of each annual period plotted. The stock prices shown above for our common stock are historical and not necessarily indicative of future price performance.
Each year, we reassess our peer group to identify global companies that are either direct competitors or have similar industry and business operating characteristics. Our 2016 peer group includes the following publicly traded companies: Badger Meter, Inc., Echelon Corporation, National Instruments Corporation, Roper Technologies, Inc., and Silver Spring Networks, Inc. (SSNI). Our 2017 peer group includes the following publicly traded companies: Badger Meter, Inc., Echelon Corporation, Landis+Gyr, National Instruments Corporation, and Roper Technologies, Inc. The 2017 peer group was created as a result of our acquisition of SSNI and to add Landis+Gyr as a peer after they became publicly traded in 2017.
Issuer Repurchase of Equity Securities
No shares of our common stock were repurchased during the quarter ended December 31, 2017.
Holders
At January 31, 2018, there were 203 holders of record of our common stock.
Dividends
Since the inception of the Company, we have not declared or paid cash dividends. We intend to retain future earnings for the development of our business and do not anticipate paying cash dividends in the foreseeable future.
19
ITEM 6: SELECTED CONSOLIDATED FINANCIAL DATA
The selected consolidated financial data below is derived from our consolidated financial statements. Information included in the table below from fiscal years 2015 through 2017 Consolidated Statements of Operations and Consolidated Statements of Cash Flows, and the Consolidated Balance Sheets for 2016 and 2017, have been audited by an independent registered public accounting firm.
These selected consolidated financial and other data represent portions of our financial statements. You should read this information together with Item 7: “Management’s Discussion and Analysis of Financial Condition and Results of Operations” and Item 8: “Financial Statements and Supplementary Data” included in this Annual Report on Form 10-K. Historical results are not necessarily indicative of future performance.
Year Ended December 31, | |||||||||||||||||||
2017(6) | 2016(4) | 2015 | 2014(3) | 2013(2) | |||||||||||||||
(in thousands, except per share data) | |||||||||||||||||||
Consolidated Statements of Operations Data | |||||||||||||||||||
Revenues | $ | 2,018,197 | $ | 2,013,186 | $ | 1,883,533 | $ | 1,947,616 | $ | 1,938,025 | |||||||||
Cost of revenues | 1,343,043 | 1,352,866 | 1,326,848 | 1,333,566 | 1,323,257 | ||||||||||||||
Gross profit | 675,154 | 660,320 | 556,685 | 614,050 | 614,768 | ||||||||||||||
Operating income (loss) | 151,426 | 96,211 | 52,846 | 480 | (139,863 | ) | |||||||||||||
Net income (loss) attributable to Itron, Inc. | 57,298 | 31,770 | 12,678 | (23,670 | ) | (153,153 | ) | ||||||||||||
Earnings (loss) per common share - Basic | $ | 1.48 | $ | 0.83 | $ | 0.33 | $ | (0.60 | ) | $ | (3.90 | ) | |||||||
Earnings (loss) per common share - Diluted | $ | 1.45 | $ | 0.82 | $ | 0.33 | $ | (0.60 | ) | $ | (3.90 | ) | |||||||
Weighted average common shares outstanding - Basic | 38,655 | 38,207 | 38,224 | 39,184 | 39,281 | ||||||||||||||
Weighted average common shares outstanding - Diluted | 39,387 | 38,643 | 38,506 | 39,184 | 39,281 | ||||||||||||||
Consolidated Balance Sheets Data | |||||||||||||||||||
Working capital(1) | $ | 341,959 | $ | 319,420 | $ | 281,166 | $ | 262,393 | $ | 338,476 | |||||||||
Total assets (5) | 2,106,147 | 1,577,811 | 1,680,316 | 1,751,085 | 1,906,025 | ||||||||||||||
Total debt, net (5) | 613,260 | 304,523 | 370,165 | 323,307 | 377,596 | ||||||||||||||
Total Itron, Inc. shareholders' equity | 786,416 | 631,604 | 604,758 | 681,001 | 839,011 | ||||||||||||||
Other Financial Data | |||||||||||||||||||
Cash provided by operating activities | $ | 191,354 | $ | 115,842 | $ | 73,350 | $ | 132,973 | $ | 105,421 | |||||||||
Cash used in investing activities | (148,179 | ) | (47,528 | ) | (48,951 | ) | (41,496 | ) | (56,771 | ) | |||||||||
Cash provided by (used in) financing activities | 301,959 | (63,023 | ) | 7,740 | (91,877 | ) | (57,438 | ) | |||||||||||
Capital expenditures | (49,495 | ) | (43,543 | ) | (43,918 | ) | (44,495 | ) | (60,020 | ) | |||||||||
(1) | Working capital represents current assets less current liabilities. |
(2) | During 2013, we incurred a goodwill impairment charge of $174.2 million. In addition, we incurred costs of $36.3 million in 2013 related to restructuring projects to increase efficiency. |
(3) | During 2014, we incurred costs of $49.5 million related to restructuring projects to improve operational efficiencies and reduce expenses. |
(4) | During 2016, we incurred costs of $49.1 million related to restructuring projects to restructure various company activities in order to improve operational efficiencies, reduce expenses and improve competiveness. Refer to Item 8: “Financial Statements and Supplementary Data, Note 13: Restructuring” included in this Annual Report on Form 10-K for further disclosures regarding the restructuring charges. |
(5) | Total assets and total debt for all periods presented were adjusted for the adoption of Accounting Standards Update 2015-03, Interest - Imputation of Interest. |
(6) | During 2017, cash used in investing activities included $100 million paid for the acquisition of Comverge by purchasing the stock of its parent, Peak Holding Corp. In addition, cash provided by financing activities included the issuance of $300 million of senior notes as part of the financing of the acquisition of Silver Spring Networks, Inc. |
20
ITEM 7: | MANAGEMENT'S DISCUSSION AND ANALYSIS OF FINANCIAL CONDITION AND RESULTS OF OPERATIONS |
The following discussion and analysis should be read in conjunction with Item 8: “Financial Statements and Supplementary Data” included in this Annual Report on Form 10-K.
Overview
We are a technology company, offering end-to-end solutions to enhance productivity and efficiency, primarily focused on utilities and municipalities around the globe. Our solutions generally include robust industrial grade networks, smart meters, meter data management software, and knowledge application solutions, which bring additional value to the customer. Our professional services help our customers project-manage, install, implement, operate, and maintain their systems. We operate under the Itron brand worldwide and manage and report under three operating segments: Electricity, Gas, and Water. Our Water operating segment includes our global water, and heat and allocation solutions. This structure allows each segment to develop its own go-to-market strategy, prioritize its marketing and product development requirements, and focus on its strategic investments. Our sales and marketing functions are managed under each segment. Our product development and manufacturing operations are managed on a worldwide basis to promote a global perspective in our operations and processes while serving the needs of our segments.
We have three measures of segment performance: revenues, gross profit (margin), and operating income (margin). Intersegment revenues are minimal. Certain operating expenses are allocated to the operating segments based upon internally established allocation methodologies. Interest income, interest expense, other income (expense), income tax provision, and certain corporate operating expenses are neither allocated to the segments nor included in the measures of segment performance.
The following discussion includes financial information prepared in accordance with accounting principles generally accepted in the United States (GAAP), as well as certain adjusted or non-GAAP financial measures such as constant currency, free cash flow, non-GAAP operating expenses, non-GAAP operating income, non-GAAP net income, adjusted EBITDA, and non-GAAP diluted earnings per share (EPS). We believe that non-GAAP financial measures, when reviewed in conjunction with GAAP financial measures, can provide more information to assist investors in evaluating current period performance and in assessing future performance. For these reasons, our internal management reporting also includes non-GAAP measures. We strongly encourage investors and shareholders to review our financial statements and publicly-filed reports in their entirety and not to rely on any single financial measure. Non-GAAP measures as presented herein may not be comparable to similarly titled measures used by other companies.
In our discussions of the operating results below, we sometimes refer to the impact of foreign currency exchange rate fluctuations, which are references to the differences between the foreign currency exchange rates we use to convert operating results from local currencies into U.S. dollars for reporting purposes. We also use the term “constant currency,” which represents results adjusted to exclude foreign currency exchange rate impacts. We calculate the constant currency change as the difference between the current period results translated using the current period currency exchange rates and the comparable prior period’s results restated using current period currency exchange rates. We believe the reconciliations of changes in constant currency provide useful supplementary information to investors in light of fluctuations in foreign currency exchange rates.
Refer to the Non-GAAP Measures section below on pages 40-42 for information about these non-GAAP measures and the detailed reconciliation of items that impacted free cash flow, non-GAAP operating expenses, non-GAAP operating income, non-GAAP net income, adjusted EBITDA, and non-GAAP diluted EPS in the presented periods.
21
Total Company Highlights
Highlights and significant developments for the twelve months ended December 31, 2017
• | Revenues were $2.0 billion for the year ended December 31, 2017, an increase of $5.0 million. |
• | Gross margin was 33.5% compared with 32.8% in the same period last year. The increase of 70 basis points was due to improvements in our Electricity and Water segments. |
• | Operating expenses were $40.4 million lower compared with the same period last year, primarily due to decreased restructuring expense. |
• | Net income attributable to Itron, Inc. was $57.3 million compared with $31.8 million in 2016. |
• | Adjusted EBITDA increased $19.2 million, or 9% compared with the same period in 2016. |
• | GAAP diluted EPS improved $0.63 to $1.45 compared with the same period in 2016. |
• | Non-GAAP diluted EPS improved $0.52 to $3.06 compared with the same period last year. |
• | Total backlog was $1.8 billion and twelve-month backlog was $931 million at December 31, 2017. |
Comverge Acquisition
On June 1, 2017, we completed the acquisition of Comverge by purchasing the stock of its parent, Peak Holding Corp. (Comverge). Comverge is an industry leading provider of integrated cloud-based demand response, energy efficiency and customer engagement solutions that allow electric utilities to improve grid reliability, lower energy costs, meet regulatory demands, and enhance customer experience. This acquisition provides opportunities to combine our technologies and continues our focus on transitioning from a hardware manufacturer into a total solutions provider, delivering even more value to our customers.
The acquisition resulted in the recognition of $36.5 million of intangible assets that will be amortized over 8-15 years, and goodwill in our Electricity reporting unit of $59.7 million. We anticipate this acquisition will be accretive for the year ended December 31, 2018. Comverge contributed $32.4 million in revenues from the acquisition on June 1, 2017 through the year ended December 31, 2017. For further discussion of the Comverge acquisition, refer to Item 8: “Financial Statements, Note 17: Business Combinations.”
Silver Spring Networks, Inc. Acquisition
On January 5, 2018, we completed our acquisition of Silver Spring Networks, Inc. (SSNI) by purchasing all outstanding shares for $16.25 per share, resulting in a total purchase price, net of cash, of approximately $810 million. SSNI provided Internet of Important ThingsTM connectivity platforms and solutions to utilities and cities. The acquisition continues our focus on expanding management services and software-as-a-service solutions, which allows us to provide more value to our customers by optimizing devices, network technologies, outcomes and analytics. This entity will operate and be managed as a separate operating segment.
As a part of the acquisition of SSNI, we entered into a $1.15 billion senior secured credit facility (the 2018 credit facility), which amended and restated the senior secured credit facility we entered into in 2015. The 2018 credit facility consists of a $650 million U.S. dollar term loan and a multicurrency revolving line of credit with a principal amount of up to $500 million.
On December 22, 2017 and January 19, 2018, we issued $300 million and $100 million of 5.00% senior notes, respectively (Notes). The Notes were issued pursuant to an indenture dated December 22, 2017, mature in 2026, and are guaranteed by all of our subsidiaries that guarantee our borrowings under the 2018 credit facility. For further discussion of the Notes, refer to Item 1: "Financial Statements, Note 6: Debt and Note 19: Subsequent Events."
2018 Restructuring Projects
On February 22, 2018, our Board approved a restructuring plan (2018 Projects). The 2018 Projects will include activities that continue our efforts to optimize our global supply chain and manufacturing operations, product development, and sales and marketing organizations. We expect to substantially complete the plan by the end of 2020. We estimate pre-tax restructuring charges of $100 million to $110 million with approximately $45 million to $50 million of annualized savings when substantially complete.
22
Total Company GAAP and Non-GAAP Highlights and Unit Shipments
Year Ended December 31, | |||||||||||||||
2017 | % Change | 2016 | % Change | 2015 | |||||||||||
(in thousands, except margin and per share data) | |||||||||||||||
GAAP | |||||||||||||||
Revenues | |||||||||||||||
Product revenues | $ | 1,813,925 | (1)% | $ | 1,830,070 | 8% | $ | 1,699,534 | |||||||
Service revenues | 204,272 | 12% | 183,116 | —% | 183,999 | ||||||||||
Total revenues | 2,018,197 | —% | 2,013,186 | 7% | 1,883,533 | ||||||||||
Gross profit | 675,154 | 2% | 660,320 | 19% | 556,685 | ||||||||||
Operating expenses | 523,728 | (7)% | 564,109 | 12% | 503,839 | ||||||||||
Operating income | 151,426 | 57% | 96,211 | 82% | 52,846 | ||||||||||
Other income (expense) | (16,851 | ) | 45% | (11,584 | ) | (26)% | (15,744 | ) | |||||||
Income tax provision | (74,326 | ) | 50% | (49,574 | ) | 124% | (22,099 | ) | |||||||
Net income attributable to Itron, Inc. | 57,298 | 80% | 31,770 | 151% | 12,678 | ||||||||||
Non-GAAP(1) | |||||||||||||||
Non-GAAP operating expenses | $ | 479,386 | (2)% | $ | 490,104 | 1% | $ | 484,967 | |||||||
Non-GAAP operating income | 195,768 | 15% | 170,216 | 137% | 71,718 | ||||||||||
Non-GAAP net income attributable to Itron, Inc. | 120,486 | 23% | 98,284 | 251% | 27,981 | ||||||||||
Adjusted EBITDA | 227,851 | 9% | 208,638 | 91% | 109,497 | ||||||||||
GAAP Margins and Earnings Per Share | |||||||||||||||
Gross margin | |||||||||||||||
Product gross margin | 33.5 | % | 32.3 | % | 28.4 | % | |||||||||
Service gross margin | 32.7 | % | 37.9 | % | 40.1 | % | |||||||||
Total gross margin | 33.5 | % | 32.8 | % | 29.6 | % | |||||||||
Operating margin | 7.5 | % | 4.8 | % | 2.8 | % | |||||||||
Basic EPS | $ | 1.48 | $ | 0.83 | $ | 0.33 | |||||||||
Diluted EPS | $ | 1.45 | $ | 0.82 | $ | 0.33 | |||||||||
Non-GAAP Earnings Per Share(1) | |||||||||||||||
Non-GAAP diluted EPS | $ | 3.06 | $ | 2.54 | $ | 0.73 | |||||||||
(1) | These measures exclude certain expenses that we do not believe are indicative of our core operating results. See pages 40-42 for information about these non-GAAP measures and reconciliations to the most comparable GAAP measures. |
23
Meter and Communication Module Summary
We classify meters into two categories:
• | Standard metering – no built-in remote reading communication technology |
• | Smart metering – one-way communication of meter data or two-way communication including remote meter configuration and upgrade (consisting primarily of our OpenWay technology) |
In addition, smart meter communication modules can be sold separately from the meter.
Our revenue is driven significantly by sales of meters and communication modules. A summary of our meter and communication module shipments is as follows:
Year Ended December 31, | ||||||||
2017 | 2016 | 2015 | ||||||
(units in thousands) | ||||||||
Meters | ||||||||
Standard | 15,740 | 15,540 | 17,560 | |||||
Smart | 10,390 | 9,340 | 7,290 | |||||
Total meters | 26,130 | 24,880 | 24,850 | |||||
Stand-alone communication modules | ||||||||
Smart | 6,250 | 5,980 | 5,840 | |||||
Results of Operations
Revenues and Gross Margin
The actual results and effects of changes in foreign currency exchange rates in revenues and gross profit were as follows:
Effect of Changes in Foreign Currency Exchange Rates | Constant Currency Change(1) | Total Change | ||||||||||||||||||
Year Ended December 31, | ||||||||||||||||||||
2017 | 2016 | |||||||||||||||||||
(in thousands) | ||||||||||||||||||||
Total Company | ||||||||||||||||||||
Revenues | $ | 2,018,197 | $ | 2,013,186 | $ | 11,639 | $ | (6,628 | ) | $ | 5,011 | |||||||||
Gross Profit | 675,154 | 660,320 | 923 | 13,911 | 14,834 | |||||||||||||||
Effect of Changes in Foreign Currency Exchange Rates | Constant Currency Change(1) | Total Change | ||||||||||||||||||
Year Ended December 31, | ||||||||||||||||||||
2016 | 2015 | |||||||||||||||||||
(in thousands) | ||||||||||||||||||||
Total Company | ||||||||||||||||||||
Revenues | $ | 2,013,186 | $ | 1,883,533 | $ | (34,781 | ) | $ | 164,434 | $ | 129,653 | |||||||||
Gross Profit | 660,320 | 556,685 | (9,381 | ) | 113,016 | 103,635 | ||||||||||||||
(1) | Constant currency change is a non-GAAP financial measure and represents the total change between periods excluding the effect of changes in foreign currency exchange rates. |
Revenues
Revenues increased $5.0 million in 2017, compared with 2016. Product revenues decreased $16.1 million in 2017 primarily in our North America and Europe, Middle East, and Africa (EMEA) regions. This was partially offset by improved product revenues in our Latin America and Asia Pacific regions during 2017. Service revenues increased $21.2 million in 2017 as compared with 2016, which was primarily driven by Comverge service revenues of $19.6 million. Changes in currency exchange rates favorably impacted revenues by $11.6 million in 2017.
24
Revenues increased $129.7 million, or 7%, in 2016 compared with 2015 primarily due to an increase in product revenues, which increased $130.5 million in 2016 as compared with 2015. The growth was driven primarily by increased smart metering volumes
in our North America region, as well as growth in our EMEA and Asia Pacific regions. These increases were partially offset by reduced product revenues in our Latin America region. Service revenues decreased $0.9 million in 2016 as compared with 2015. The decrease resulted from a reduction in EMEA service revenues in 2016, mostly offset by an increase in service revenues in North America. Changes in currency exchange rates unfavorably impacted revenues by $34.8 million. A more detailed analysis of these fluctuations, including analysis by segment, is provided in Operating Segment Results.
No single customer represented more than 10% of total revenues for the years ended December 31, 2017, 2016, and 2015. Our 10 largest customers accounted for 33%, 31%, and 22% of total revenues in 2017, 2016, and 2015, respectively.
Gross Margin
Gross margin was 33.5% for 2017, compared with 32.8% in 2016. Our gross margin associated with product sales improved to 33.5% in 2017 from 32.3% in 2016 due to improved product mix, particularly in our Electricity segment, and an $8.0 million insurance recovery in 2017 associated with warranty expenses previously recognized as a result of our 2015 communication module product replacement notification to customers in our Water segment. This recovery contributed 40 basis points to the gross margin improvement. Gross margin associated with our service revenues declined to 32.7% from 37.9% in 2016 due to lower margin sales in our EMEA region.
Gross margin was 32.8% in 2016, compared with 29.6% in 2015. The increase was primarily driven by the $29.4 million warranty charge recognized in 2015 previously discussed. Product gross margins increased to 32.3% in 2016 from 28.4% in 2015 as a result of the warranty charge in 2015. Service gross margin decreased to 37.9% in 2016 from 40.1% in 2015 as a result of the closure of a services business in our EMEA region.
Operating Expenses
The following table shows the components of operating expense:
Effect of Changes in Foreign Currency Exchange Rates | Constant Currency Change(1) | Total Change | ||||||||||||||||||
Year Ended December 31, | ||||||||||||||||||||
2017 | 2016 | |||||||||||||||||||
(in thousands) | ||||||||||||||||||||
Total Company | ||||||||||||||||||||
Sales and marketing | $ | 170,008 | $ | 158,883 | $ | 1,548 | $ | 9,577 | $ | 11,125 | ||||||||||
Product development | 169,977 | 168,209 | (1,531 | ) | 3,299 | 1,768 | ||||||||||||||
General and administrative | 156,540 | 162,815 | 2,831 | (9,106 | ) | (6,275 | ) | |||||||||||||
Amortization of intangible assets | 20,785 | 25,112 | 261 | (4,588 | ) | (4,327 | ) | |||||||||||||
Restructuring | 6,418 | 49,090 | 1,925 | (44,597 | ) | (42,672 | ) | |||||||||||||
Total Operating expenses | $ | 523,728 | $ | 564,109 | $ | 5,034 | $ | (45,415 | ) | $ | (40,381 | ) | ||||||||
Effect of Changes in Foreign Currency Exchange Rates | Constant Currency Change(1) | Total Change | ||||||||||||||||||
Year Ended December 31, | ||||||||||||||||||||
2016 | 2015 | |||||||||||||||||||
(in thousands) | ||||||||||||||||||||
Total Company | ||||||||||||||||||||
Sales and marketing | $ | 158,883 | $ | 161,380 | $ | (2,883 | ) | $ | 386 | $ | (2,497 | ) | ||||||||
Product development | 168,209 | 162,334 | (1,273 | ) | 7,148 | 5,875 | ||||||||||||||
General and administrative | 162,815 | 155,715 | (2,047 | ) | 9,147 | 7,100 | ||||||||||||||
Amortization of intangible assets | 25,112 | 31,673 | (705 | ) | (5,856 | ) | (6,561 | ) | ||||||||||||
Restructuring | 49,090 | (7,263 | ) | (412 | ) | 56,765 | 56,353 | |||||||||||||
Total Operating expenses | $ | 564,109 | $ | 503,839 | $ | (7,320 | ) | $ | 67,590 | $ | 60,270 | |||||||||
(1) | Constant currency change is a non-GAAP financial measure and represents the total change between periods excluding the effect of changes in foreign currency exchange rates. |
25
Operating expenses decreased $40.4 million for the year ended December 31, 2017 as compared with the same period in 2016. This was primarily related to decreases in restructuring and general and administrative expense, partially offset by an increase in sales and marketing expenses.
For the year ended December 31, 2016, operating expenses increased $60.3 million as compared with the same period in 2015. This was primarily related to increased restructuring expense related to the 2016 Projects. The increases in general and administrative and product development expenses were related to variable compensation, professional service, and temporary worker expenses. This was partially offset by a decrease in amortization of intangible asset expense.
Other Income (Expense)
The following table shows the components of other income (expense):
Year Ended December 31, | |||||||||||||||
2017 | % Change | 2016 | % Change | 2015 | |||||||||||
(in thousands) | (in thousands) | (in thousands) | |||||||||||||
Interest income | $ | 2,126 | 146% | $ | 865 | 14% | $ | 761 | |||||||
Interest expense | (10,514 | ) | 7% | (9,872 | ) | (3)% | (10,161 | ) | |||||||
Amortization of prepaid debt fees | (1,067 | ) | (1)% | (1,076 | ) | (49)% | (2,128 | ) | |||||||
Other income (expense), net | (7,396 | ) | 393% | (1,501 | ) | (64)% | (4,216 | ) | |||||||
Total other income (expense) | $ | (16,851 | ) | 45% | $ | (11,584 | ) | (26)% | $ | (15,744 | ) | ||||
Total other income (expense) for the year ended December 31, 2017 was a net expense of $16.9 million compared with $11.6 million in 2016. The change for the year ended December 31, 2017 as compared with 2016 was due to fluctuations in the recognized foreign currency exchange gains and losses due to transactions denominated in a currency other than an entity's functional currency.
Total other income (expense) for the year ended December 31, 2016 was a net expense of $11.6 million compared with $15.7 million in 2015. The change for the year ended December 31, 2016 as compared with 2015 was due to fluctuations in the recognized foreign currency exchange gains and losses due to transactions denominated in a currency other than an entity's functional currency. The decreased expense in 2016 was also due to the write off of unamortized prepaid debt fees in 2015.
Income Tax Provision
Our income tax provision was $74.3 million, $49.6 million, and $22.1 million for the years ended December 31, 2017, 2016, and 2015, respectively. Our tax rates of 55%, 59%, and 60% for the years ended December 31, 2017, 2016, and 2015 differ from the 35% U.S. federal statutory tax rate due to the level of profit or losses in domestic and foreign jurisdictions, new or revised tax legislation and accounting pronouncements, tax credits (including research and development and foreign tax), state income taxes, adjustments to valuation allowances, and uncertain tax positions, among other items.
The tax provision for the year ended December 31, 2017 was significantly impacted by the inclusion of $30.4 million of expense for the provisional determination of the impact to our deferred tax positions of the Tax Cut and Jobs Act. We will continue to review any additional guidance issued by the U.S. Department of the Treasury, Internal Revenue Service, Financial Accounting Standards Board, or other regulatory bodies and adjust our provisional amount during the measurement period, which should not extend beyond one year from the enactment date of December 22, 2017.
For additional discussion related to income taxes, see Item 8: “Financial Statements and Supplementary Data, Note 11: Income Taxes.”
26
Operating Segment Results
For a description of our operating segments, refer to Item 8: “Financial Statements and Supplementary Data, Note 16: Segment Information” in this Annual Report on Form 10-K. The following tables and discussion highlight significant changes in trends or components of each operating segment.
Year Ended December 31, | |||||||||||||||||
2017 | % Change | 2016 | % Change | 2015 | |||||||||||||
Segment Revenues | (in thousands) | (in thousands) | (in thousands) | ||||||||||||||
Electricity | $ | 1,022,939 | 9% | $ | 938,374 | 14% | $ | 820,306 | |||||||||
Gas | 533,624 | (6)% | 569,476 | 5% | 543,805 | ||||||||||||
Water | 461,634 | (9)% | 505,336 | (3)% | 519,422 | ||||||||||||
Total revenues | $ | 2,018,197 | —% | $ | 2,013,186 | 7% | $ | 1,883,533 | |||||||||
Year Ended December 31, | |||||||||||||||||
2017 | 2016 | 2015 | |||||||||||||||
Gross Profit | Gross Margin | Gross Profit | Gross Margin | Gross Profit | Gross Margin | ||||||||||||
Segment Gross Profit and Margin | (in thousands) | (in thousands) | (in thousands) | ||||||||||||||
Electricity | $ | 318,953 | 31.2% | $ | 282,677 | 30.1% | $ | 225,446 | 27.5% | ||||||||
Gas | 191,303 | 35.8% | 205,063 | 36.0% | 185,559 | 34.1% | |||||||||||
Water | 164,898 | 35.7% | 172,580 | 34.2% | 145,680 | 28.0% | |||||||||||
Total gross profit and margin | $ | 675,154 | 33.5% | $ | 660,320 | 32.8% | $ | 556,685 | 29.6% | ||||||||
Year Ended December 31, | |||||||||||||||||
2017 | % Change | 2016 | % Change | 2015 | |||||||||||||
Segment Operating Expenses | (in thousands) | (in thousands) | (in thousands) | ||||||||||||||
Electricity | $ | 225,387 | 5% | $ | 214,390 | 10% | $ | 194,342 | |||||||||
Gas | 117,097 | (15)% | 138,250 | 17% | 118,088 | ||||||||||||
Water | 120,404 | (11)% | 135,314 | 8% | 125,816 | ||||||||||||
Corporate unallocated | 60,840 | (20)% | 76,155 | 16% | 65,593 | ||||||||||||
Total operating expenses | $ | 523,728 | (7)% | $ | 564,109 | 12% | $ | 503,839 | |||||||||
Year Ended December 31, | |||||||||||||||||
2017 | 2016 | 2015 | |||||||||||||||
Operating Income (Loss) | Operating Margin | Operating Income (Loss) | Operating Margin | Operating Income (Loss) | Operating Margin | ||||||||||||
Segment Operating Income (Loss) and Operating Margin | (in thousands) | (in thousands) | (in thousands) | ||||||||||||||
Electricity | $ | 93,566 | 9.1% | $ | 68,287 | 7.3% | $ | 31,104 | 3.8% | ||||||||
Gas | 74,206 | 13.9% | 66,813 | 11.7% | 67,471 | 12.4% | |||||||||||
Water | 44,494 | 9.6% | 37,266 | 7.4% | 19,864 | 3.8% | |||||||||||
Corporate unallocated | (60,840 | ) | (76,155 | ) | (65,593 | ) | |||||||||||
Total operating income | $ | 151,426 | 7.5% | $ | 96,211 | 4.8% | $ | 52,846 | 2.8% | ||||||||
27
Electricity:
The effects of changes in foreign currency exchange rates and the constant currency changes in certain Electricity segment financial results were as follows:
Effect of Changes in Foreign Currency Exchange Rates | Constant Currency Change(1) | Total Change | ||||||||||||||||||
Year Ended December 31, | ||||||||||||||||||||
2017 | 2016 | |||||||||||||||||||
(in thousands) | ||||||||||||||||||||
Electricity Segment | ||||||||||||||||||||
Revenues | $ | 1,022,939 | $ | 938,374 | $ | 4,152 | $ | 80,413 | $ | 84,565 | ||||||||||
Gross Profit | 318,953 | 282,677 | 70 | 36,206 | 36,276 | |||||||||||||||
Operating Expenses | 225,387 | 214,390 | 1,144 | 9,853 | 10,997 | |||||||||||||||
Effect of Changes in Foreign Currency Exchange Rates | Constant Currency Change(1) | Total Change | ||||||||||||||||||
Year Ended December 31, | ||||||||||||||||||||
2016 | 2015 | |||||||||||||||||||
(in thousands) | ||||||||||||||||||||
Electricity Segment | ||||||||||||||||||||
Revenues | $ | 938,374 | $ | 820,306 | $ | (17,643 | ) | $ | 135,711 | $ | 118,068 | |||||||||
Gross Profit | 282,677 | 225,446 | (5,606 | ) | 62,837 | 57,231 | ||||||||||||||
Operating Expenses | 214,390 | 194,342 | (3,368 | ) | 23,416 | 20,048 | ||||||||||||||
(1) | Constant currency change is a non-GAAP financial measure and represents the total change between periods excluding the effect of changes in foreign currency exchange rates. |
Revenues - 2017 vs. 2016
Electricity revenues for 2017 increased by $84.6 million, or 9%, compared with 2016. This was a result of increased smart metering revenues in North America and EMEA regions, higher volumes of prepaid smart metering solutions in our Asia Pacific region, and improved service revenues in North America. This also included product revenues of $12.8 million and service revenues of $19.6 million associated with Comverge. These improvements were partially offset by a decline in service revenues in EMEA, and a decline in product revenues in Latin America.
Revenues - 2016 vs. 2015
Electricity revenues for 2016 increased by $118.1 million, or 14%, compared with 2015. This increase was primarily driven by increased smart metering revenues in North America and EMEA, higher volumes of prepaid smart metering solutions in our Asia Pacific region, and improved service revenue in North America. These improvements were partially offset by a decline in service revenues in EMEA, and a decline in product revenues in our Latin America region. The total change in Electricity revenues was unfavorably impacted by $17.6 million due to the effect of changes in foreign currency exchange rates.
For the year ended December 31, 2017, one customer represented 19% and two additional customers each represented 11% of the Electricity operating segment revenues. Two customers represented 12% and 10% of total Electricity operating segment revenues, respectively, for the year ended December 31, 2016. No customer represented more than 10% of total Electricity operating segment revenues in 2015.
Gross Margin - 2017 vs. 2016
Gross margin was 31.2% in 2017, compared with 30.1% in 2016. The 110 basis point improvement over the prior year was primarily the result of higher volumes and favorable product mix.
Gross Margin - 2016 vs. 2015
Gross margin was 30.1% in 2016, compared with 27.5% in 2015. The 260 basis point improvement over the prior year was primarily the result of increased sales of higher margin smart metering solutions in North America and planned reduction of lower margin product sales.
28
Operating Expenses - 2017 vs. 2016
Operating expenses increased $11.0 million, or 5%. The increase was primarily due to acquisition and integration related expenses associated with the acquisition of Comverge, which are included in general and administrative expense. This was partially offset by a decrease in restructuring expenses in 2017 as compared with 2016.
Operating Expenses - 2016 vs. 2015
Operating expenses increased by $20.0 million, or 10%. The increase was primarily due to higher restructuring expenses. In addition, general and administrative expenses for the year ended December 31, 2015 included a recovery of $8.2 million related to the settlement of litigation arising from the SmartSynch acquisition. These increases were partially offset by a decrease in amortization of intangible assets expense.
Gas:
The effects of changes in foreign currency exchange rates and the constant currency changes in certain Gas segment financial results were as follows:
Effect of Changes in Foreign Currency Exchange Rates | Constant Currency Change(1) | Total Change | ||||||||||||||||||
Year Ended December 31, | ||||||||||||||||||||
2017 | 2016 | |||||||||||||||||||
(in thousands) | ||||||||||||||||||||
Gas Segment | ||||||||||||||||||||
Revenues | $ | 533,624 | $ | 569,476 | $ | 3,426 | $ | (39,278 | ) | $ | (35,852 | ) | ||||||||
Gross Profit | 191,303 | 205,063 | 329 | (14,089 | ) | (13,760 | ) | |||||||||||||
Operating Expenses | 117,097 | 138,250 | 1,113 | (22,266 | ) | (21,153 | ) | |||||||||||||
Effect of Changes in Foreign Currency Exchange Rates | Constant Currency Change(1) | Total Change | ||||||||||||||||||
Year Ended December 31, | ||||||||||||||||||||
2016 | 2015 | |||||||||||||||||||
(in thousands) | ||||||||||||||||||||
Gas Segment | ||||||||||||||||||||
Revenues | $ | 569,476 | $ | 543,805 | $ | (6,990 | ) | $ | 32,661 | $ | 25,671 | |||||||||
Gross Profit | 205,063 | 185,559 | (982 | ) | 20,486 | 19,504 | ||||||||||||||
Operating Expenses | 138,250 | 118,088 | (1,336 | ) | 21,498 | 20,162 | ||||||||||||||
(1) | Constant currency change is a non-GAAP financial measure and represents the total change between periods excluding the effect of changes in foreign currency exchange rates. |
Revenues - 2017 vs. 2016
Revenues decreased by $35.9 million, or 6%, in 2017 compared with 2016. This was due to a decrease in product revenues in EMEA and North America due to the completion of significant projects in the prior year, partially offset by an increase in module revenues in North America and product revenues in Latin America.
Revenues - 2016 vs. 2015
Revenues increased by $25.7 million, or 5%, in 2016 compared with 2015. This was due to an increase in product revenues in North America, EMEA, and Asia Pacific. The total change in Gas revenues was unfavorably impacted by $7.0 million due to the effect of changes in foreign currency exchange rates.
No single customer represented more than 10% of the Gas operating segment revenues in 2017, 2016, or 2015.
Gross Margin - 2017 vs. 2016
Gross margin was 35.8% in 2017, compared with 36.0% in 2016. The decrease of 20 basis points was related to higher warranty expenses and lower volumes, mostly offset by improved product mix.
Gross Margin - 2016 vs. 2015
Gross margin was 36.0% in 2016, compared with 34.1% in 2015. The increase of 190 basis points was related to improved product mix and increased volumes.
29
Operating Expenses - 2017 vs. 2016
Operating expenses decreased by $21.2 million, or 15%, in 2017. The decrease was primarily due to higher restructuring expenses in 2016.
Operating Expenses - 2016 vs. 2015
Operating expenses increased by $20.2 million, or 17% in 2016. The increase was primarily due to higher restructuring expenses as a result of the announcement of the 2016 Projects, partially offset by a decrease in general and administrative expense.
Water:
The effects of changes in foreign currency exchange rates and the constant currency changes in certain Water segment financial results were as follows:
Effect of Changes in Foreign Currency Exchange Rates | Constant Currency Change(1) | Total Change | ||||||||||||||||||
Year Ended December 31, | ||||||||||||||||||||
2017 | 2016 | |||||||||||||||||||
(in thousands) | ||||||||||||||||||||
Water Segment | ||||||||||||||||||||
Revenues | $ | 461,634 | $ | 505,336 | $ | 4,061 | $ | (47,763 | ) | $ | (43,702 | ) | ||||||||
Gross Profit | 164,898 | 172,580 | 524 | (8,206 | ) | (7,682 | ) | |||||||||||||
Operating Expenses | 120,404 | 135,314 | 2,223 | (17,133 | ) | (14,910 | ) | |||||||||||||
Effect of Changes in Foreign Currency Exchange Rates | Constant Currency Change(1) | Total Change | ||||||||||||||||||
Year Ended December 31, | ||||||||||||||||||||
2016 | 2015 | |||||||||||||||||||
(in thousands) | ||||||||||||||||||||
Water Segment | ||||||||||||||||||||
Revenues | $ | 505,336 | $ | 519,422 | $ | (10,148 | ) | $ | (3,938 | ) | $ | (14,086 | ) | |||||||
Gross Profit | 172,580 | 145,680 | (2,793 | ) | 29,693 | 26,900 | ||||||||||||||
Operating Expenses | 135,314 | 125,816 | (1,003 | ) | 10,501 | 9,498 | ||||||||||||||
(1) | Constant currency change is a non-GAAP financial measure and represents the total change between periods excluding the effect of changes in foreign currency exchange rates. |
Revenues - 2017 vs. 2016
Revenues decreased $43.7 million, or 9%, in 2017. This decrease was primarily due to lower product revenues in North America and EMEA. This was partially offset by improved product revenues in Latin America.
Revenues - 2016 vs. 2015
Revenues decreased $14.1 million, or 3%, in 2016. This decrease was primarily due to the effects of changes in foreign currency exchange rates, along with lower meter volumes in EMEA. This was partially offset by improved product and service revenues in North America and Asia Pacific.
No single customer represented more than 10% of the Water operating segment revenues in 2017, 2016, or 2015.
Gross Margin - 2017 vs. 2016
Gross margin increased to 35.7% in 2017, compared with 34.2% in 2016. The 150 basis point increase was driven by lower warranty expense in 2017, including an $8.0 million insurance recovery in North America associated with warranty expenses previously recognized as a result of our 2015 product replacement notification to customers who had purchased certain communication modules. This insurance recovery increased gross margin by 170 basis points in 2017.
Gross Margin - 2016 vs. 2015
Gross margin increased to 34.2% in 2016, compared with 28.0% in 2015, driven by reduced warranty expenses in 2016. Gross margin in 2015 was unfavorably impacted 570 basis points by the 2015 product replacement discussed above.
30
Operating Expenses - 2017 vs. 2016
Operating expenses decreased $14.9 million, or 11%, in 2017. The decrease was primarily due to higher restructuring expenses in 2016.
Operating Expenses - 2016 vs. 2015
Operating expenses increased by $9.5 million, or 8% in 2016. The increase was primarily due to higher restructuring expenses as a result of the announcement of the 2016 Projects.
Corporate unallocated:
Operating expenses not directly associated with an operating segment are classified as “Corporate unallocated.” These expenses decreased $15.3 million, or 20%, in 2017 as compared with 2016. The decrease was primarily due to lower professional service fees associated with audit, accounting, and legal services, partially offset by an increase in acquisition and integration related expenses.
Corporate unallocated expenses increased $10.6 million, or 16%, in 2016 as compared with 2015. The increase was primarily in general and administrative expense due to higher professional service fees and variable compensation.
Financial Condition
Cash Flow Information:
Year Ended December 31, | |||||||||||
2017 | 2016 | 2015 | |||||||||
(in thousands) | |||||||||||
Operating activities | $ | 191,354 | $ | 115,842 | $ | 73,350 | |||||
Investing activities | (148,179 | ) | (47,528 | ) | (48,951 | ) | |||||
Financing activities | 301,959 | (63,023 | ) | 7,740 | |||||||
Effect of exchange rates on cash, cash equivalents, and restricted cash | 8,636 | (2,744 | ) | (13,492 | ) | ||||||
Increase in cash, cash equivalents, and restricted cash | $ | 353,770 | $ | 2,547 | $ | 18,647 | |||||
Cash, cash equivalents, and restricted cash at December 31, 2017 were $487.3 million, compared with $133.6 million at December 31, 2016. The $353.8 million increase in cash, cash equivalents, and restricted cash was primarily the result of our net financing and investing activities related to our acquisitions of Comverge and SSNI, as well as an increase in cash flow provided by operating activities.
Cash, cash equivalents, and restricted cash at December 31, 2016 were $2.5 million higher compared with the prior year, as the increase in cash flow provided by provided by operating activities was substantially offset by an increase in cash used in financing activities.
Operating activities
Net cash provided by operating activities in 2017 was $75.5 million higher than in 2016. This increase was due to an improvement in net income adjusted for non-cash items and changes in operating asset and liabilities. Favorable adjustments include a $115.8 million reduction in cash used for accounts payable, other current liabilities, and taxes payable primarily due to the timing of payments and a litigation payment made during the year ended December 31, 2016. Unfavorable adjustments include a $38.6 million increased use of cash for inventory primarily related to our strategic sourcing projects and related manufacturing and supplier transitions during the year ended December 31, 2017.
Net cash provided by operating activities in 2016 was $42.5 million higher than 2015. This increase was due to an improvement in net income adjusted for non-cash items and changes in operating asset and liabilities. These adjustments include a $75.1 million decreased use of cash for inventory caused by a prior year buildup for expected demand. In addition, $49.1 million of restructuring expense was recognized related to the 2016 Projects, much of which will be paid in future periods or relates to non-cash items. These improvements were partially offset by the $29.4 million warranty charge recognized during the year ended December 31, 2015 related to a product replacement notification to customers of our Water business line for which many replacements have been processed during 2016. In addition, there was a $37.8 million net reduction for unearned revenue recognized during the year for which cash was collected in previous years.
31
Investing activities
Net cash used in investing activities in 2017 was $100.7 million higher than in 2016. This increased use of cash was primarily related to our acquisition of Comverge during the year ended December 31, 2017.
Net cash used in investing activities in 2016 was $1.4 million lower than in 2015.
Financing activities
Net cash provided by financing activities in 2017 was $302.0 million, compared with a net use of cash of $63.0 million in 2016. The increase in cash provided by financing activities was primarily caused by the issuance of $300.0 million of senior notes to finance the acquisition of SSNI. In addition, net debt repayments for the year ended December 31, 2016 were $54.9 million greater than in 2017, as cash provided from operating activities in 2017 was retained and used for the acquisitions of Comverge and SSNI.
Net cash provided by financing activities in 2016 was $70.8 million greater than in 2015, primarily a result of the net repayment of $63.2 million of borrowings in 2016, compared with utilizing $50.5 million of net proceeds during the same period in 2015. This was partially offset by a $38.3 million reduction in cash used for repurchases of common stock during the year ended December 31, 2016, compared with the same period in 2015.
Effect of exchange rates on cash and cash equivalents
Changes in exchange rates on the cash balances of currencies held in foreign denominations resulted in an increase of $8.6 million, a decrease of $2.7 million, and a decrease of $13.5 million in 2017, 2016, and 2015, respectively. Our foreign currency exposure relates to non-U.S. dollar denominated balances in our international subsidiary operations, the most significant of which is the euro.
Free cash flow (Non-GAAP)
To supplement our Consolidated Statements of Cash Flows presented on a GAAP basis, we use the non-GAAP measure of free cash flow to analyze cash flows generated from our operations. The presentation of non-GAAP free cash flow is not meant to be considered in isolation or as an alternative to net income as an indicator of our performance, or as an alternative to cash flows from operating activities as a measure of liquidity. We calculate free cash flows, using amounts from our Consolidated Statements of Cash Flows, as follows:
Year Ended December 31, | ||||||||||||
2017 | 2016 | 2015 | ||||||||||
(in thousands) | ||||||||||||
Net cash provided by operating activities | $ | 191,354 | $ | 115,842 | $ | 73,350 | ||||||
Acquisitions of property, plant, and equipment | (49,495 | ) | (43,543 | ) | (43,918 | ) | ||||||
Free cash flow | $ | 141,859 | $ | 72,299 | $ | 29,432 | ||||||
Free cash flow fluctuated primarily as a result of changes in cash provided by operating activities. See the cash flow discussion of operating activities above.
Off-balance sheet arrangements:
We have no off-balance sheet financing agreements or guarantees as defined by Item 303 of Regulation S-K at December 31, 2017 and December 31, 2016 that we believe are reasonably likely to have a current or future effect on our financial condition, results of operations, or cash flows.
32
Disclosures about contractual obligations and commitments:
The following table summarizes our known obligations to make future payments pursuant to certain contracts as of December 31, 2017, as well as an estimate of the timing in which these obligations are expected to be satisfied.
Total | Less than 1 year | 1-3 years | 3-5 years | Beyond 5 years | ||||||||||||||||
(in thousands) | ||||||||||||||||||||
Credit Facilities(1) | ||||||||||||||||||||
USD denominated term loan | $ | 207,959 | $ | 25,412 | $ | 182,547 | $ | — | $ | — | ||||||||||
Multicurrency revolving line of credit | 132,388 | 2,664 | 129,724 | — | — | |||||||||||||||
Senior notes | 420,958 | 8,458 | 30,000 | 30,000 | 352,500 | |||||||||||||||
Operating lease obligations(2) | 48,602 | 15,353 | 16,830 | 6,620 | 9,799 | |||||||||||||||
Purchase and service commitments(3) | 156,549 | 155,642 | 815 | 92 | — | |||||||||||||||
Other long-term liabilities reflected on the balance sheet under generally accepted accounting principles(4) | 84,597 | — | 41,858 | 12,755 | 29,984 | |||||||||||||||
Total | $ | 1,051,053 | $ | 207,529 | $ | 401,774 | $ | 49,467 | $ | 392,283 | ||||||||||
(1) | Borrowings are disclosed within Item 8: “Financial Statements and Supplementary Data, Note 6: Debt” included in this Annual Report on Form 10-K. |
(2) | Operating lease obligations are disclosed in Item 8: “Financial Statements and Supplementary Data, Note 12: Commitments and Contingencies” included in this Annual Report on Form 10-K and do not include common area maintenance charges, real estate taxes, and insurance charges for which we are obligated. |
(3) | We enter into standard purchase orders in the ordinary course of business that typically obligate us to purchase materials and other items. Purchase orders can include open-ended agreements that provide for estimated quantities over an extended shipment period, typically up to one year at an established unit cost. Our long-term executory purchase agreements that contain termination clauses have been classified as less than one year, as the commitments are the estimated amounts we would be required to pay at December 31, 2017 if the commitments were canceled. |
(4) | Other long-term liabilities consist of warranty obligations, estimated pension benefit payments, and other obligations. Estimated pension benefit payments include amounts from 2019-2027. Long-term unrecognized tax benefits totaling $25.4 million (net of pre-payments), which include accrued interest and penalties, are not included in the above contractual obligations and commitments table as we cannot reliably estimate the period of cash settlement with the respective taxing authorities. Additionally, because the amount and timing of the future cash outflows are uncertain, deferred revenue totaling $35.6 million, which includes deferred revenue related to extended warranty guarantees, is not included in the table. For further information on defined benefit pension plans, income taxes, and warranty obligations and deferred revenue for extended warranties, see Item 8: “Financial Statements and Supplementary Data, Notes 8, 11, and 12,” respectively, included in this Annual Report on Form 10-K. |
Liquidity and Capital Resources:
Our principal sources of liquidity are cash flows from operations, borrowings, and sales of common stock. Cash flows may fluctuate and are sensitive to many factors including changes in working capital and the timing and magnitude of capital expenditures and payments of debt. Working capital, which represents current assets less current liabilities, was $342.0 million at December 31, 2017.
Borrowings
On June 23, 2015, we entered into an amended and restated credit agreement providing for committed credit facilities in the amount of $725 million U.S. dollars (the 2015 credit facility). The 2015 credit facility consists of a $225 million U.S. dollar term loan and a multicurrency revolving line of credit (the revolver) with a principal amount of up to $500 million. At December 31, 2017, $125.4 million was outstanding under the revolver, and $342.7 million was available for additional borrowings or standby letters of credit. At December 31, 2017, $31.9 million was utilized by outstanding standby letters of credit, resulting in $218.1 million available for additional letters of credit.
On January 5, 2018, we entered into a credit agreement (the 2018 credit facility) which amended and restated the 2015 credit facility in its entirety. The 2018 credit facility provides for a $650 million term loan and a $500 million revolver, including a $300 million letter of credit sub-facility and $50 million swingline loan sub-facility. Both the term loan and the revolver mature on January 5, 2023, and amounts borrowed under the revolver may be repaid and reborrowed until the revolver's maturity, at which time the revolver will terminate, and all outstanding loans, together with all accrued and unpaid interest, must be repaid.
33
On December 22, 2017, we issued $300 million aggregate principal amount of 5.00% senior notes due 2026 (December Notes). The December Notes were issued pursuant to an indenture, dated as of December 22, 2017 (Indenture), among Itron, the guarantors from time to time party thereto and U.S. Bank National Association, as trustee. The December Notes formed a part of the financing of SSNI. On January 19, 2018, we issued an additional $100 million aggregate principal amount of 5.00% senior notes due 2026 pursuant to the Indenture (January Notes). The proceeds from the sale of the January Notes were used to refinance existing indebtedness related to the acquisition of SSNI, pay related fees and expenses and for general corporate purposes.
For further description of our borrowings, refer to Item 8: “Financial Statements and Supplementary Data, Note 6: Debt, and Note 19: Subsequent Events” included in this Annual Report on Form 10-K.
For a description of our letters of credit and performance bonds, and the amounts available for additional borrowings or letters of credit under our lines of credit, including the revolver that is part of our credit facility, refer to Item 8: “Financial Statements and Supplementary Data, Note 12: Commitments and Contingencies” included in this Annual Report on Form 10-K.
Acquisitions
We acquired SSNI on January 5, 2018 for approximately $810 million in consideration, which was comprised of cash on hand, the net proceeds from our private offering of December and January Notes and the refinancing of our existing 2015 facility. We will be implementing an integration plan to obtain approximately $50 million of annualized savings by the end of 2020. We anticipate the cost to obtain these savings will be approximately $60 million, of which 95% will result in cash outlays.
Restructuring
We expect pre-tax restructuring charges associated with the 2016 Projects of approximately $60 million, with expected annualized savings of approximately $40 million upon completion. As of December 31, 2017, $40.1 million was accrued for the restructuring projects, of which $32.5 million is expected to be paid over the next 12 months.
On February 22, 2018, our Board of Directors approved the 2018 Projects. The 2018 Projects will include activities that continue our efforts to optimize our global supply chain and manufacturing operations, product development, and sales and marketing organizations. We expect to substantially complete the plan by the end of 2020. We estimate pre-tax restructuring charges of $100 million to $110 million with approximately 20% related to closing or consolidating facilities and non-manufacturing operations and approximately 80% associated with severance and other one-time termination benefits. Of the total estimated charge, approximately 95% will result in cash expenditures. We expect to record the majority of the charges in the first quarter of 2018. The 2018 Projects are expected to result in approximately $45 million to $50 million of annualized savings when substantially complete.
Many of our employees are represented by unions or works councils, which requires consultation, and potential restructuring projects may be subject to regulatory approval, both of which could impact the timing of planned savings in certain jurisdictions.
For further details regarding our restructuring activities, refer to Item 8: “Financial Statements and Supplementary Data, Note 13: Restructuring.”
Income Tax
Our tax provision as a percentage of income before tax typically differs from the U.S. federal statutory rate of 35%. Changes in our actual tax rate are subject to several factors, including fluctuations in operating results, new or revised tax legislation and accounting pronouncements, changes in the level of business in domestic and foreign jurisdictions, tax credits (including research and development and foreign tax), state income taxes, adjustments to valuation allowances, and uncertain tax positions, among other items. Changes in tax laws, valuation allowances, and unanticipated tax liabilities could significantly impact our tax rate.
Our cash income tax payments were as follows:
Year Ended December 31, | |||||||||||
2017 | 2016 | 2015 | |||||||||
(in thousands) | |||||||||||
U.S. federal taxes paid | $ | 17,500 | $ | 9,000 | $ | 15,700 | |||||
State income taxes paid | 4,636 | 4,526 | 1,543 | ||||||||
Foreign and local income taxes paid | 6,833 | 10,761 | 11,946 | ||||||||
Total income taxes paid | $ | 28,969 | $ | 24,287 | $ | 29,189 | |||||
34
Based on current projections, we expect to pay, net of refunds, approximately $13 million in federal taxes, $8 million in state taxes and $14 million in foreign and local income taxes in 2018. These estimates exclude the impact of the acquisition of SSNI.
We have not provided U.S. deferred taxes related to the cash in certain foreign subsidiaries because our investment is considered permanent in duration. As of December 31, 2017, there was $46.8 million of cash and short-term investments held by certain foreign subsidiaries in which we are permanently reinvested for tax purposes. If this cash were repatriated to fund U.S. operations, additional tax costs may be incurred. Tax is one of many factors that we consider in the management of global cash. Included in the determination of the tax costs in repatriating foreign cash into the United States are the amount of earnings and profits in a particular jurisdiction, withholding taxes that would be imposed, and available foreign tax credits. Accordingly, the amount of taxes that we would need to accrue and pay to repatriate foreign cash could vary significantly.
Other Liquidity Considerations
In several of our consolidated international subsidiaries, we have joint venture partners, who are minority shareholders. Although these entities are not wholly-owned by Itron, Inc., we consolidate them because we have a greater than 50% ownership interest and/or because we exercise control over the operations. The noncontrolling interest balance in our Consolidated Balance Sheets represents the proportional share of the equity of the joint venture entities which is attributable to the minority shareholders. At December 31, 2017, $12.6 million of our consolidated cash balance is held in our joint venture entities. As a result, the minority shareholders of these entities have rights to their proportional share of this cash balance, and there may be limitations on our ability to repatriate cash to the United States from these entities.
At December 31, 2017, we have accrued $19.6 million of bonus and profit sharing plans expense for the expected achievement of financial and nonfinancial targets, which we expect to pay in cash during the first quarter of 2018.
General Liquidity Overview
We expect to grow through a combination of internal new product development, licensing technology from and to others, distribution agreements, partnering arrangements, and acquisitions of technology or other companies. We expect these activities to be funded with existing cash, cash flow from operations, borrowings, or the sale of common stock or other securities. We believe existing sources of liquidity will be sufficient to fund our existing operations and obligations for the next 12 months and into the foreseeable future, but offer no assurances. Our liquidity could be affected by the stability of the electricity, gas, and water industries, competitive pressures, our dependence on certain key vendors and components, changes in estimated liabilities for product warranties and/or litigation, future business combinations, capital market fluctuations, international risks, and other factors described under Item 1A: “Risk Factors,” as well as Item 7A: “Quantitative and Qualitative Disclosures About Market Risk,” both included in this Annual Report on Form 10-K.
Contingencies
Refer to Item 8: “Financial Statements and Supplementary Data, Note 12: Commitments and Contingencies” included in this Annual Report on Form 10-K.
Critical Accounting Estimates and Policies
Our consolidated financial statements and accompanying notes are prepared in accordance with GAAP. Preparing consolidated financial statements requires management to make estimates and assumptions that affect the reported amounts of assets, liabilities, revenue, and expenses. These estimates and assumptions are affected by management’s application of accounting policies. Critical accounting policies for us include revenue recognition, warranty, restructuring, income taxes, business combinations, goodwill and intangible assets, defined benefit pension plans, contingencies, and stock-based compensation. Refer to Item 8: “Financial Statements and Supplementary Data, Note 1: Summary of Significant Accounting Policies” included in this Annual Report on Form 10-K for further disclosures regarding accounting policies and new accounting pronouncements.
Revenue Recognition
Many of our revenue arrangements involve multiple deliverables, which require us to determine the fair value of each deliverable and then allocate the total arrangement consideration among the separate deliverables based on the relative fair value percentages. Revenues for each deliverable are then recognized based on the type of deliverable, such as 1) when the products are shipped, 2) services are delivered, 3) percentage-of-completion for implementation services, 4) upon receipt of customer acceptance, or 5) transfer of title and risk of loss. The majority of our revenue is recognized when products are shipped to or received by a customer or when services are provided.
For implementation services, revenue is recognized using the percentage-of-completion method of contract accounting if project costs can be reliably estimated, or the completed contract method if project costs cannot be reliably estimated. The estimation of
35
costs through completion of a project is subject to many variables such as the length of time to complete, changes in wages, subcontractor performance, supplier information, and business volume assumptions. Changes in underlying assumptions and estimates may adversely or favorably affect financial performance.
Under contract accounting, if we estimate that the completion of a contract component (unit of accounting) will result in a loss, the loss is recognized in the period in which the loss becomes evident. We reevaluate the estimated loss through the completion of the contract component, and adjust the estimated loss for changes in facts and circumstances.
A few of our larger customer arrangements contain clauses for liquidated damages, related to delays in delivery or milestone accomplishments, which could become material in an event of failure to meet the contractual deadlines. At the inception of the arrangement and on an ongoing basis, we evaluate if the liquidated damages represent contingent revenue and, if so, we reduce the amount of consideration allocated to the delivered products and services and recognize it as a reduction in revenue in the period of default. If the arrangement is subject to contract accounting, liquidated damages resulting from failure or expected failure to meet milestones are estimated and are accounted for as a reduction in revenue in the period in which the liquidated damages are deemed probable of occurrence and are reasonably estimable.
Certain of our revenue arrangements include an extended or noncustomary warranty provision that covers all or a portion of a customer's replacement or repair costs beyond the standard or customary warranty period. Whether or not the extended warranty is separately priced in the arrangement, a portion of the arrangement's total consideration is allocated to this extended warranty deliverable. This revenue is deferred and recognized over the extended warranty coverage period. Extended or noncustomary warranties do not represent a significant portion of our revenue.
We allocate consideration to each deliverable in an arrangement based on its relative selling price. We determine selling price using vendor specific objective evidence (VSOE), if it exists, otherwise we use third-party evidence (TPE). We define VSOE as a median price of recent standalone transactions that are priced within a narrow range. TPE is determined based on the prices charged by our competitors for a similar deliverable when sold separately. If neither VSOE nor TPE of selling price exists for a unit of accounting, we use estimated selling price (ESP). The objective of ESP is to determine the price, or fair value, at which we would transact if the product or service were regularly sold by us on a standalone basis. Our determination of ESP involves a weighting of several factors based on the specific facts and circumstances of the arrangement. The factors considered include historical contractual sales, market conditions and entity specific factors, the cost to produce the deliverable, the anticipated margin on that deliverable, our ongoing pricing strategy and policies, and the characteristics of the varying markets in which the deliverable is sold.
Fair value represents the estimated price charged if an element were sold separately. If the fair value of any undelivered element included in a multiple deliverable arrangement cannot be objectively determined, revenue is deferred until all elements are delivered and services have been performed, or until the fair value can be objectively determined for any remaining undelivered elements. We review our fair values on an annual basis or more frequently if a significant trend is noted.
We analyze the selling prices used in our allocation of arrangement consideration on an annual basis. Selling prices are analyzed on a more frequent basis if a significant change in our business necessitates a more timely analysis or if we experience significant variances in our selling prices.
Warranty
We offer standard warranties on our hardware products and large application software products. We accrue the estimated cost of new product warranties based on historical and projected product performance trends and costs during the warranty period. Testing of new products in the development stage helps identify and correct potential warranty issues prior to manufacturing. Quality control efforts during manufacturing reduce our exposure to warranty claims. When testing or quality control efforts fail to detect a fault in one of our products, we may experience an increase in warranty claims. We track warranty claims to identify potential warranty trends. If an unusual trend is noted, an additional warranty accrual would be recognized if a failure event is probable and the cost can be reasonably estimated. When new products are introduced, our process relies on historical averages of similar products until sufficient data are available. As actual experience on new products becomes available, it is used to modify the historical averages to ensure the expected warranty costs are within a range of likely outcomes. Management regularly evaluates the sufficiency of the warranty provisions and makes adjustments when necessary. The warranty allowances may fluctuate due to changes in estimates for material, labor, and other costs we may incur to repair or replace projected product failures, and we may incur additional warranty and related expenses in the future with respect to new or established products, which could adversely affect our financial position and results of operations.
36
Restructuring
We recognize a liability for costs associated with an exit or disposal activity under a restructuring project at its fair value in the period in which the liability is incurred. Employee termination benefits considered post-employment benefits are accrued when the obligation is probable and estimable, such as benefits stipulated by human resource policies and practices or statutory requirements. One-time termination benefits are recognized at the date the employee is notified. If the employee must provide future service greater than 60 days, such benefits are recognized ratably over the future service period. For contract termination costs, we recognize a liability upon the later of when we terminate a contract in accordance with the contract terms or when we cease using the rights conveyed by the contract.
Asset impairments associated with a restructuring project are determined at the asset group level. An impairment may be recognized for assets that are to be abandoned, are to be sold for less than net book value, or are held for sale in which the estimated proceeds are less than the net book value less costs to sell. We may also recognize impairment on an asset group, which is held and used, when the carrying value is not recoverable and exceeds the asset group's fair value. If an asset group is considered a business, a portion of our goodwill balance is allocated to it based on relative fair value. If the sale of an asset group under a restructuring project results in proceeds that exceed the net book value of the asset group, the resulting gain is recognized within restructuring expense in the Consolidated Statements of Operations.
In determining restructuring charges, we analyze our future operating requirements, including the required headcount by business functions and facility space requirements. Our restructuring costs and any resulting accruals involve significant estimates using the best information available at the time the estimates are made. Our estimates involve a number of risks and uncertainties, some of which are beyond our control, including real estate market conditions and local labor and employment laws, rules, and regulations. If the amounts and timing of cash flows from restructuring activities are significantly different from what we have estimated, the actual amount of restructuring and asset impairment charges could be materially different, either higher or lower, than those we have recognized.
Income Taxes
We estimate income tax expense in each of the taxing jurisdictions in which we operate. Changes in our actual tax rate are subject to several factors, including fluctuations in operating results, new or revised tax legislation and accounting pronouncements, changes in the level of business in domestic and foreign jurisdictions, tax credits (including research and development and foreign tax), state income taxes, adjustments to valuation allowances, and uncertain tax positions, among other items. Changes in tax laws, valuation allowances, and unanticipated tax liabilities could significantly impact our tax rate.
We recognize valuation allowances to reduce deferred tax assets to the extent we believe it is more likely than not that a portion of such assets will not be realized. In making such determinations, we consider all available favorable and unfavorable evidence, including scheduled reversals of deferred tax liabilities, projected future taxable income, tax planning strategies, and our ability to carry back losses to prior years. We are required to make assumptions and judgments about potential outcomes that lie outside our control. Our most sensitive and critical factors are the projection, source, and character of future taxable income. Although realization is not assured, management believes it is more likely than not that deferred tax assets, net of valuation allowance, will be realized. The amount of deferred tax assets considered realizable, however, could be reduced in the near term if estimates of future taxable income during the carryforward periods are reduced or current tax planning strategies are not implemented.
We are subject to audits in multiple taxing jurisdictions in which we operate. These audits may involve complex issues, which may require an extended period of time to resolve. We believe we have recognized adequate income tax provisions and reserves for uncertain tax positions.
In evaluating uncertain tax positions, we consider the relative risks and merits of positions taken in tax returns filed and to be filed, considering statutory, judicial, and regulatory guidance applicable to those positions. We make assumptions and judgments about potential outcomes that lie outside management’s control. To the extent the tax authorities disagree with our conclusions and depending on the final resolution of those disagreements, our actual tax rate may be materially affected in the period of final settlement with the tax authorities.
Business Combinations
On the date of acquisition, the assets acquired, liabilities assumed, and any noncontrolling interests in the acquiree are recognized at their fair values. The acquiree's results of operations are also included as of the date of acquisition in our consolidated results. Intangible assets that arise from contractual/legal rights, or are capable of being separated, as well as in-process research and development (IPR&D), are measured and recognized at fair value, and amortized over the estimated useful life. IPR&D is not amortized until such time as the associated development projects are completed or terminated. If a development project is completed, the IPR&D is reclassified as a core technology intangible asset and amortized over its estimated useful life. If the development project is terminated, the recognized value of the associated IPR&D is immediately recognized. If practicable, assets acquired and
37
liabilities assumed arising from contingencies are measured and recognized at fair value. If not practicable, such assets and liabilities are measured and recognized when it is probable that a gain or loss has occurred, and the amount can be reasonably estimated. The residual balance of the purchase price, after fair value allocations to all identified assets and liabilities, represents goodwill. Acquisition-related costs are recognized as incurred. Integration costs associated with an acquisition are generally recognized in periods subsequent to the acquisition date, and changes in deferred tax asset valuation allowances and acquired income tax uncertainties, including penalties and interest, after the measurement period are recognized as a component of the provision for income taxes. Our acquisitions may include contingent consideration, which require us to recognize the fair value of the estimated liability at the time of the acquisition. Subsequent changes in the estimate of the amount to be paid under the contingent consideration arrangement are recognized in the Consolidated Statements of Operations.
We estimate the preliminary fair value of acquired assets and liabilities as of the date of acquisition based on information available at that time utilizing either a cost or income approach. Contingent consideration is recorded at fair value as of the date of the acquisition with adjustments occurring after the purchase price allocation period, which could be up to one year, recorded in earnings. Changes to valuation allowances on acquired deferred tax assets that occur after the acquisition date are recognized in the provision for, or benefit from, income taxes. The valuation of these tangible and identifiable intangible assets and liabilities is subject to further management review and may change materially between the preliminary allocation and end of the purchase price allocation period. Any changes in these estimates may have a material effect on our consolidated operating results or financial position.
Goodwill and Intangible Assets
Goodwill and intangible assets may result from our business acquisitions. Intangible assets may also result from the purchase of assets and intellectual property where we do not acquire a business. We use estimates, including estimates of useful lives of intangible assets, the amount and timing of related future cash flows, and fair values of the related operations, in determining the value assigned to goodwill and intangible assets. Our finite-lived intangible assets are amortized over their estimated useful lives based on estimated discounted cash flows. In-process research and development (IPR&D) is considered an indefinite-lived intangible asset and is not subject to amortization until the associated projects are completed or terminated. Finite-lived intangible assets are tested for impairment at the asset group level when events or changes in circumstances indicate the carrying value may not be recoverable. Indefinite-lived intangible assets are tested for impairment annually, when events or changes in circumstances indicate the asset may be impaired, or at the time when their useful lives are determined to be no longer indefinite.
Goodwill is assigned to our reporting units based on the expected benefit from the synergies arising from each business combination, determined by using certain financial metrics, including the forecast discounted cash flows associated with each reporting unit. Each reporting unit corresponds with its respective operating segment.
We test goodwill for impairment each year as of October 1, or more frequently should a significant impairment indicator occur. As part of the impairment test, we may elect to perform an assessment of qualitative factors. If this qualitative assessment indicates that it is more likely than not that the fair value of a reporting unit, including goodwill, is less than its carrying amount, or if we elect to bypass the qualitative assessment, we would then proceed with the impairment test. The impairment test involves comparing the fair values of the reporting units to their carrying amounts. If the carrying amount of a reporting unit exceeds its fair value an impairment loss is recognized in an amount equal to the excess.
Determining the fair value of a reporting unit is judgmental in nature and involves the use of significant estimates and assumptions. We forecast discounted future cash flows at the reporting unit level using risk-adjusted discount rates and estimated future revenues and operating costs, which take into consideration factors such as existing backlog, expected future orders, supplier contracts, and expectations of competitive and economic environments. We also identify similar publicly traded companies and develop a correlation, referred to as a multiple, to apply to the operating results of the reporting units. These combined fair values are then reconciled to the aggregate market value of our common stock on the date of valuation, while considering a reasonable control premium.
Based on our analysis as of October 1, 2017, it is not more likely than not that the fair value of our reporting units is less than their carrying amounts. Changes in market demand, fluctuations in the economies in which we operate, the volatility and decline in the worldwide equity markets, and a decline in our market capitalization could unfavorably impact the remaining carrying value of our goodwill, which could have a significant effect on our current and future results of operations and financial condition.
Defined Benefit Pension Plans
We sponsor both funded and unfunded defined benefit pension plans for our international employees, primarily in Germany, France, Italy, Indonesia, Brazil, and Spain. We recognize a liability for the projected benefit obligation in excess of plan assets or an asset for plan assets in excess of the projected benefit obligation. We also recognize the funded status of our defined benefit pension plans on our Consolidated Balance Sheets and recognize as a component of other comprehensive income (loss) (OCI),
38
net of tax, the actuarial gains or losses and prior service costs or credits, if any that arise during the period but are not recognized as components of net periodic benefit cost.
Several economic assumptions and actuarial data are used in calculating the expense and obligations related to these plans. The assumptions are updated annually at December 31 and include the discount rate, the expected remaining service life, the expected rate of return on plan assets, and the rate of future compensation increase. The discount rate is a significant assumption used to value our pension benefit obligation. We determine a discount rate for our plans based on the estimated duration of each plan’s liabilities. For our euro denominated defined benefit pension plans, which represent 93% of our benefit obligation, we use two discount rates with consideration of the duration of the plans, using a hypothetical yield curve developed from euro-denominated AA-rated corporate bond issues. These bond issues are partially weighted for market value, with minimum amounts outstanding of €500 million for bonds with less than 10 years to maturity and €50 million for bonds with 10 or more years to maturity, and excluding the highest and lowest yielding 10% of bonds within each maturity group. The discount rates used, depending on the duration of the plans, were 1.00% and 1.75%, respectively. The weighted average discount rate used to measure the projected benefit obligation for all of the plans at December 31, 2017 was 2.21%. A change of 25 basis points in the discount rate would change our projected benefit obligation by approximately $5 million. The financial and actuarial assumptions used at December 31, 2017 may differ materially from actual results due to changing market and economic conditions and other factors. These differences could result in a significant change in the amount of pension expense recognized in future periods.
Contingencies
A loss contingency is recognized if it is probable that an asset has been impaired or a liability has been incurred and the amount of the loss can be reasonably estimated. We evaluate, among other factors, the degree of probability of an unfavorable outcome and our ability to make a reasonable estimate of the amount of the ultimate loss. Loss contingencies that we determine to be reasonably possible, but not probable, are disclosed but not recognized. Changes in these factors and related estimates could materially affect our financial position and results of operations. Legal costs to defend against contingent liabilities are recognized as incurred.
Stock-Based Compensation
We grant various stock-based compensation awards to our officers, employees and Board of Directors with service, performance, and market vesting conditions, including stock options, restricted stock units, phantom stock units, and unrestricted stock units (awards). We measure and recognize compensation expense for all awards based on estimated fair values. For awards with only a service condition, we expense stock-based compensation using the straight-line method over the requisite service period for the entire award. For awards with service and performance conditions, if vesting is probable, we expense the stock-based compensation on a straight-line basis over the requisite service period for each separately vesting portion of the award. For awards with a market condition, we expense the fair value over the requisite service period.
We measure and recognize compensation expense for all stock-based compensation based on estimated fair values. The fair value of stock options is estimated at the date of grant using the Black-Scholes option-pricing model, which includes assumptions for the dividend yield, expected volatility, risk-free interest rate, and expected term. For unrestricted stock awards with no market conditions, the fair value is the market close price of our common stock on the date of grant. For restricted stock units with market conditions, the fair value is estimated at the date of award using a Monte Carlo simulation model, which includes assumptions for dividend yield and expected volatility for our common stock and the common stock for companies within the Russell 3000 index, as well as the risk-free interest rate and expected term of the awards. For phantom stock units, fair value is the market close price of our common stock at the end of each reporting period.
In valuing our stock options and restricted stock units with a market condition, significant judgment is required in determining the expected volatility of our common stock and the expected life that individuals will hold their stock options prior to exercising. Expected volatility for stock options is based on the historical and implied volatility of our own common stock while the volatility for our restricted stock units with a market condition is based on the historical volatility of our own stock and the stock for companies comprising the market index within the market condition. The expected life of stock option grants is derived from the historical actual term of option grants and an estimate of future exercises during the remaining contractual period of the option. While volatility and estimated life are assumptions that do not bear the risk of change subsequent to the grant date, these assumptions may be difficult to measure as they represent future expectations based on historical experience. Further, our expected volatility and expected life may change in the future, which could substantially change the grant-date fair value of future awards and ultimately the expense we recognize. Actual results and future estimates may differ substantially from our current estimates.
Non-GAAP Measures
39
Our consolidated financial statements are prepared in accordance with GAAP, which we supplement with certain non-GAAP financial information. These non-GAAP measures should not be considered in isolation or as a substitute for the related GAAP measures, and other companies may define such measures differently. We encourage investors to review our financial statements and publicly-filed reports in their entirety and not to rely on any single financial measure. These non-GAAP measures exclude the impact of certain expenses that we do not believe are indicative of our core operating results. We use these non-GAAP financial measures for financial and operational decision making and/or as a means for determining executive compensation. These non-GAAP financial measures facilitate management's internal comparisons to our historical performance as well as comparisons to our competitors' operating results. Our executive compensation plans exclude non-cash charges related to amortization of intangibles and certain discrete cash and non-cash charges such as purchase accounting adjustments, restructuring charges or goodwill impairment charges. We believe that both management and investors benefit from referring to these non-GAAP financial measures in assessing our performance and when planning, forecasting and analyzing future periods. We believe these non-GAAP financial measures are useful to investors because they provide greater transparency with respect to key metrics used by management in its financial and operational decision making and because they are used by our institutional investors and the analyst community to analyze the health of our business.
Non-GAAP operating expenses and non-GAAP operating income – We define non-GAAP operating expenses as operating expenses excluding certain expenses related to the amortization of intangible assets, restructuring, acquisition and integration, and goodwill impairment. We define non-GAAP operating income as operating income excluding the expenses related to the amortization of intangible assets, restructuring, acquisition and integration, and goodwill impairment. Acquisition and integration related expenses include costs which are incurred to affect and integrate business combinations, such as professional fees, certain employee retention and salaries related to integration, severances, contract terminations, travel costs related to knowledge transfer, system conversion costs, and asset impairment charges. We consider these non-GAAP financial measures to be useful metrics for management and investors because they exclude the effect of expenses that are related to acquisitions and restructuring projects. By excluding these expenses, we believe that it is easier for management and investors to compare our financial results over multiple periods and analyze trends in our operations. For example, in certain periods expenses related to amortization of intangible assets may decrease, which would improve GAAP operating margins, yet the improvement in GAAP operating margins due to this lower expense is not necessarily reflective of an improvement in our core business. There are some limitations related to the use of non-GAAP operating expenses and non-GAAP operating income versus operating expenses and operating income calculated in accordance with GAAP. We compensate for these limitations by providing specific information about the GAAP amounts excluded from non-GAAP operating expense and non-GAAP operating income and evaluating non-GAAP operating expense and non-GAAP operating income together with GAAP operating expense and operating income.
Non-GAAP net income and non-GAAP diluted EPS – We define non-GAAP net income as net income attributable to Itron, Inc. excluding the expenses associated with amortization of intangible assets, restructuring, acquisition and integration, goodwill impairment, amortization of debt placement fees, the impact of the Tax Cuts and Jobs Act (Tax Act), and the tax effect of excluding these expenses. We define non-GAAP diluted EPS as non-GAAP net income divided by the weighted average shares, on a diluted basis, outstanding during each period. We consider these financial measures to be useful metrics for management and investors for the same reasons that we use non-GAAP operating income. The same limitations described above regarding our use of non-GAAP operating income apply to our use of non-GAAP net income and non-GAAP diluted EPS. We compensate for these limitations by providing specific information regarding the GAAP amounts excluded from these non-GAAP measures and evaluating non-GAAP net income and non-GAAP diluted EPS together with GAAP net income attributable to Itron, Inc. and GAAP diluted EPS.
Adjusted EBITDA – We define adjusted EBITDA as net income (a) minus interest income, (b) plus interest expense, depreciation, and amortization, restructuring, acquisition and integration related expense, goodwill impairment and (c) excluding income tax provision or benefit. Management uses adjusted EBITDA as a performance measure for executive compensation. A limitation to using adjusted EBITDA is that it does not represent the total increase or decrease in the cash balance for the period and the measure includes some non-cash items and excludes other non-cash items. Additionally, the items that we exclude in our calculation of adjusted EBITDA may differ from the items that our peer companies exclude when they report their results. We compensate for these limitations by providing a reconciliation of this measure to GAAP net income.
Free cash flow - We define free cash flow as net cash provided by operating activities less cash used for acquisitions of property, plant and equipment. We believe free cash flow provides investors with a relevant measure of liquidity and a useful basis for assessing our ability to fund our operations and repay our debt. The same limitations described above regarding our use of adjusted EBITDA apply to our use of free cash flow. We compensate for these limitations by providing specific information regarding the GAAP amounts and reconciling to free cash flow.
40
Constant currency - We refer to the impact of foreign currency exchange rate fluctuations in our discussions of financial results, which references the differences between the foreign currency exchange rates used to translate operating results from local currencies into U.S. dollars for financial reporting purposes. We also use the term “constant currency,” which represents financial results adjusted to exclude changes in foreign currency exchange rates as compared with the rates in the comparable prior year period. We calculate the constant currency change as the difference between the current period results and the comparable prior period’s results restated using current period foreign currency exchange rates.
Reconciliation of GAAP Measures to Non-GAAP Measures
The tables below reconcile the non-GAAP financial measures of operating expenses, operating income, net income, diluted EPS, adjusted EBITDA, free cash flow, and operating income by segment with the most directly comparable GAAP financial measures.
(Unaudited; in thousands, except per share data) | ||||||||||||||
TOTAL COMPANY RECONCILIATIONS | Year Ended December 31, | |||||||||||||
2017 | 2016 | 2015 | ||||||||||||
NON-GAAP OPERATING EXPENSES | ||||||||||||||
GAAP operating expenses | $ | 523,728 | $ | 564,109 | $ | 503,839 | ||||||||
Amortization of intangible assets | (20,785 | ) | (25,112 | ) | (31,673 | ) | ||||||||
Restructuring | (6,418 | ) | (49,090 | ) | 7,263 | |||||||||
Acquisition and integration related recovery (expense) | (17,139 | ) | 197 | 5,538 | ||||||||||
Non-GAAP operating expenses | $ | 479,386 | $ | 490,104 | $ | 484,967 | ||||||||
NON-GAAP OPERATING INCOME | ||||||||||||||
GAAP operating income | $ | 151,426 | $ | 96,211 | $ | 52,846 | ||||||||
Amortization of intangible assets | 20,785 | 25,112 | 31,673 | |||||||||||
Restructuring | 6,418 | 49,090 | (7,263 | ) | ||||||||||
Acquisition and integration related (recovery) expense | 17,139 | (197 | ) | (5,538 | ) | |||||||||
Non-GAAP operating income | $ | 195,768 | $ | 170,216 | $ | 71,718 | ||||||||
NON-GAAP NET INCOME & DILUTED EPS | ||||||||||||||
GAAP net income attributable to Itron, Inc. | $ | 57,298 | $ | 31,770 | $ | 12,678 | ||||||||
Amortization of intangible assets | 20,785 | 25,112 | 31,673 | |||||||||||
Amortization of debt placement fees | 966 | 987 | 2,021 | |||||||||||
Restructuring | 6,418 | 49,090 | (7,263 | ) | ||||||||||
Acquisition and integration related (recovery) expense | 17,139 | (197 | ) | (5,538 | ) | |||||||||
Tax Cuts and Jobs Act Adjustment | 30,424 | — | — | |||||||||||
Income tax effect of non-GAAP adjustments(1) | (12,544 | ) | (8,478 | ) | (5,590 | ) | ||||||||
Non-GAAP net income attributable to Itron, Inc. | $ | 120,486 | $ | 98,284 | $ | 27,981 | ||||||||
Non-GAAP diluted EPS | $ | 3.06 | $ | 2.54 | $ | 0.73 | ||||||||
Weighted average common shares outstanding - Diluted | 39,387 | 38,643 | 38,506 | |||||||||||
ADJUSTED EBITDA | ||||||||||||||
GAAP net income attributable to Itron, Inc. | $ | 57,298 | $ | 31,770 | $ | 12,678 | ||||||||
Interest income | (2,126 | ) | (865 | ) | (761 | ) | ||||||||
Interest expense | 11,581 | 10,948 | 12,289 | |||||||||||
Income tax provision | 74,326 | 49,574 | 22,099 | |||||||||||
Depreciation and amortization | 63,215 | 68,318 | 75,993 | |||||||||||
Restructuring | 6,418 | 49,090 | (7,263 | ) | ||||||||||
Acquisition and integration related (recovery) expense | 17,139 | (197 | ) | (5,538 | ) | |||||||||
Adjusted EBITDA | $ | 227,851 | $ | 208,638 | $ | 109,497 | ||||||||
FREE CASH FLOW | ||||||||||||||
Net cash provided by operating activities | $ | 191,354 | $ | 115,842 | $ | 73,350 | ||||||||
Acquisitions of property, plant, and equipment | (49,495 | ) | (43,543 | ) | (43,918 | ) | ||||||||
Free Cash Flow | $ | 141,859 | $ | 72,299 | $ | 29,432 | ||||||||
(1) | The income tax effect of non-GAAP adjustments is calculated using the statutory tax rates for the relevant jurisdictions if no valuation allowance exists. If a valuation allowance exists, there is no tax impact to the non-GAAP adjustment. |
41
(Unaudited; in thousands) | ||||||||||||||
SEGMENT RECONCILIATIONS | Year Ended December 31, | |||||||||||||
2017 | 2016 | 2015 | ||||||||||||
NON-GAAP OPERATING INCOME - ELECTRICITY | ||||||||||||||
Electricity - GAAP operating income | $ | 93,566 | $ | 68,287 | $ | 31,104 | ||||||||
Amortization of intangible assets | 11,618 | 13,273 | 17,663 | |||||||||||
Restructuring | 198 | 7,694 | (7,253 | ) | ||||||||||
Acquisition and integration related (recovery) expense | 10,258 | (197 | ) | (5,655 | ) | |||||||||
Electricity - Non-GAAP operating income | $ | 115,640 | $ | 89,057 | $ | 35,859 | ||||||||
NON-GAAP OPERATING INCOME - GAS | ||||||||||||||
Gas - GAAP operating income | $ | 74,206 | $ | 66,813 | $ | 67,471 | ||||||||
Amortization of intangible assets | 5,349 | 6,456 | 7,787 | |||||||||||
Restructuring | 5,213 | 25,744 | (287 | ) | ||||||||||
Gas - Non-GAAP operating income | $ | 84,768 | $ | 99,013 | $ | 74,971 | ||||||||
NON-GAAP OPERATING INCOME - WATER | ||||||||||||||
Water - GAAP operating income | $ | 44,494 | $ | 37,266 | $ | 19,864 | ||||||||
Amortization of intangible assets | 3,818 | 5,383 | 6,223 | |||||||||||
Restructuring | 700 | 13,116 | 778 | |||||||||||
Acquisition and integration related expense | — | — | 104 | |||||||||||
Water - Non-GAAP operating income | $ | 49,012 | $ | 55,765 | $ | 26,969 | ||||||||
NON-GAAP OPERATING INCOME - CORPORATE UNALLOCATED | ||||||||||||||
Corporate unallocated - GAAP operating loss | $ | (60,840 | ) | $ | (76,155 | ) | $ | (65,593 | ) | |||||
Restructuring | 307 | 2,536 | (501 | ) | ||||||||||
Acquisition and integration related expense | 6,881 | — | 13 | |||||||||||
Corporate unallocated - Non-GAAP operating loss | $ | (53,652 | ) | $ | (73,619 | ) | $ | (66,081 | ) | |||||
ITEM 7A: QUANTITATIVE AND QUALITATIVE DISCLOSURES ABOUT MARKET RISK
In the normal course of business, we are exposed to interest rate and foreign currency exchange rate risks that could impact our financial position and results of operations. As part of our risk management strategy, we may use derivative financial instruments to hedge certain foreign currency and interest rate exposures. Our objective is to offset gains and losses resulting from these exposures with losses and gains on the derivative contracts used to hedge them, therefore reducing the impact of volatility on earnings or protecting the fair values of assets and liabilities. We use derivative contracts only to manage existing underlying exposures. Accordingly, we do not use derivative contracts for trading or speculative purposes.
Interest Rate Risk
We are exposed to interest rate risk through our variable rate debt instruments. On June 23, 2015, we entered into an amended and restated credit agreement providing for committed credit facilities in the amount of $725 million U.S. dollars (the 2015 credit facility). The 2015 credit facility consists of a $225 million U.S. dollar term loan and a multicurrency revolving line of credit (the revolver) with a principal amount of up to $500 million. The revolver also contains a $250 million letter of credit sub-facility and a $50 million swingline sub-facility (available for immediate cash needs at a higher interest rate). Under the 2015 credit facility, we elect applicable market interest rates for both the term loan and any outstanding revolving loans. We also pay an applicable margin, which is based on our total leverage ratio (as defined in the credit agreement). The applicable rates per annum may be based on either: (1) the LIBOR rate or EURIBOR rate (floor of 0%), plus an applicable margin, or (2) the Alternate Base Rate, plus an applicable margin. The Alternate Base Rate election is equal to the greatest of three rates: (i) the prime rate, (ii) the Federal Reserve effective rate plus 1/2 of 1%, or (iii) one month LIBOR plus 1%. At December 31, 2017 the interest rates for both the term loan and the USD revolver was 2.82%, which includes the LIBOR rate plus a margin of 1.25%. At December 31, 2017, the interest rates for the EUR revolver was 1.25%, which includes the EURIBOR floor rate plus a margin of 1.25%.
In October 2015, we entered into an interest rate swap, which is effective from August 31, 2016 to June 23, 2020, and converts $214 million of our LIBOR-based debt from a floating LIBOR interest rate to a fixed interest rate of 1.42% (excluding the applicable margin on the debt). The notional balance will amortize to maturity at the same rate as required minimum payments on our term loan. At December 31, 2017, our LIBOR-based debt balance was $254.1 million.
In November 2015, we entered into three interest rate cap contracts with a total notional amount of $100 million at a cost of $1.7 million. The interest rate cap contracts expire on June 23, 2020 and were entered into in order to limit our interest rate exposure on $100 million of our variable LIBOR based debt up to 2.00%. In the event LIBOR is higher than 2.00%, we will pay interest
42
at the capped rate of 2.00% with respect to the $100 million notional amount of such agreements. The interest rate cap contracts do not include the effect of the applicable margin.
The table below provides information about our financial instruments that are sensitive to changes in interest rates and the scheduled minimum repayment of principal and the weighted average interest rates at December 31, 2017. Weighted average variable rates in the table are based on implied forward rates in the Reuters U.S. dollar yield curve as of December 31, 2017 and our estimated leverage ratio, which determines our additional interest rate margin at December 31, 2017.
2018 | 2019 | 2020 | 2021 | 2022 | Total | Fair Value | |||||||||||||||||||||
(in thousands) | |||||||||||||||||||||||||||
Variable Rate Debt | |||||||||||||||||||||||||||
Principal: U.S. dollar term loan | $ | 19,688 | $ | 22,500 | $ | 151,875 | $ | — | $ | — | $ | 194,063 | $ | 192,295 | |||||||||||||
Average interest rate | 3.02 | % | 3.38 | % | 3.44 | % | — | % | — | % | |||||||||||||||||
Principal: Multicurrency revolving line of credit | $ | — | $ | — | $ | 125,414 | $ | — | $ | — | $ | 125,414 | $ | 124,100 | |||||||||||||
Average interest rate | 2.10 | % | 2.27 | % | 2.35 | % | — | % | — | % | |||||||||||||||||
Interest rate swap on LIBOR based debt | |||||||||||||||||||||||||||
Average interest rate (pay) | 1.42 | % | 1.42 | % | 1.42 | % | — | % | — | % | |||||||||||||||||
Average interest rate (receive) | 1.77 | % | 2.13 | % | 2.19 | % | — | % | — | % | |||||||||||||||||
Net/spread | 0.35 | % | 0.71 | % | 0.77 | % | — | % | — | % | |||||||||||||||||
Based on a sensitivity analysis as of December 31, 2017, we estimate that, if market interest rates average one percentage point higher in 2018 than in the table above, our financial results in 2018 would not be materially impacted.
On January 5, 2018, we entered into a $1.15 billion senior secured credit facility (the 2018 credit facility), which amended and restated the 2015 credit facility. The 2018 credit facility consists of a $650 million U.S. dollar term loan and a multicurrency revolving line of credit with a principal amount of up to $500 million. At January 5, 2018, the interest rate for both the term loan and the USD revolver was 3.56% (the LIBOR rate plus a margin of 2.00%), and the interest rate for the EUR revolver was 2.00% (the EURIBOR floor rate plus a margin of 2.00%). With this additional variable rate debt, our sensitivity to changes in interest rates has moderately increased, but would also not be materially impacted by a one percentage point increase in market interest rates.
We continually monitor and assess our interest rate risk and may institute additional interest rate swaps or other derivative instruments to manage such risk in the future.
Foreign Currency Exchange Rate Risk
We conduct business in a number of countries. As a result, approximately half of our revenues and operating expenses are denominated in foreign currencies, which expose our account balances to movements in foreign currency exchange rates that could have a material effect on our financial results. Our primary foreign currency exposure relates to non-U.S. dollar denominated transactions in our international subsidiary operations, the most significant of which is the euro. Revenues denominated in functional currencies other than the U.S. dollar were 47% of total revenues for the year ended December 31, 2017, compared with 47% and 51% for the years ended December 31, 2016 and 2015.
We are also exposed to foreign exchange risk when we enter into non-functional currency transactions, both intercompany and third-party. At each period-end, non-functional currency monetary assets and liabilities are revalued with the change recognized to other income and expense. We enter into monthly foreign exchange forward contracts, which are not designated for hedge accounting, with the intent to reduce earnings volatility associated with currency exposures. As of December 31, 2017, a total of 54 contracts were offsetting our exposures from the euro, Canadian dollar, Indonesian Rupiah, Chinese Yuan, Saudi Riyal and various other currencies, with notional amounts ranging from $158,000 to $39.5 million. Based on a sensitivity analysis as of December 31, 2017, we estimate that, if foreign currency exchange rates average ten percentage points higher in 2018 for these financial instruments, our financial results in 2018 would not be materially impacted.
In future periods, we may use additional derivative contracts to protect against foreign currency exchange rate risks.
43
ITEM 8: FINANCIAL STATEMENTS AND SUPPLEMENTARY DATA
REPORT OF INDEPENDENT REGISTERED PUBLIC ACCOUNTING FIRM
To the Board of Directors and Shareholders of Itron, Inc.
Opinion on the Financial Statements
We have audited the accompanying consolidated balance sheets of Itron, Inc. and subsidiaries (the "Company") as of December 31, 2017 and 2016, the related consolidated statements of operations, comprehensive income (loss), equity, and cash flows, for each of the two years in the period ended December 31, 2017, and the related notes (collectively referred to as the "financial statements"). In our opinion, the financial statements present fairly, in all material respects, the financial position of the Company as of December 31, 2017 and 2016, and the results of its operations and its cash flows for each of the two years in the period ended December 31, 2017, in conformity with accounting principles generally accepted in the United States of America.
We have also audited, in accordance with the standards of the Public Company Accounting Oversight Board (United States) (PCAOB), the Company's internal control over financial reporting as of December 31, 2017, based on criteria established in Internal Control - Integrated Framework (2013) issued by the Committee of Sponsoring Organizations of the Treadway Commission and our report dated February 28, 2018, expressed an unqualified opinion on the Company's internal control over financial reporting.
Basis for Opinion
These financial statements are the responsibility of the Company's management. Our responsibility is to express an opinion on the Company's financial statements based on our audits. We are a public accounting firm registered with the PCAOB and are required to be independent with respect to the Company in accordance with the U.S. federal securities laws and the applicable rules and regulations of the Securities and Exchange Commission and the PCAOB.
We conducted our audits in accordance with the standards of the PCAOB. Those standards require that we plan and perform the audit to obtain reasonable assurance about whether the financial statements are free of material misstatement, whether due to error or fraud. Our audits included performing procedures to assess the risks of material misstatement of the financial statements, whether due to error or fraud, and performing procedures that respond to those risks. Such procedures included examining, on a test basis, evidence regarding the amounts and disclosures in the financial statements. Our audits also included evaluating the accounting principles used and significant estimates made by management, as well as evaluating the overall presentation of the financial statements. We believe that our audits provide a reasonable basis for our opinion.
/s/ DELOITTE & TOUCHE LLP
Seattle, Washington
February 28, 2018
We have served as the Company's auditor since 2016.
44
Report of Ernst & Young LLP, Independent Registered Public Accounting Firm
The Board of Directors and Shareholders of Itron, Inc.
We have audited the accompanying consolidated statements of operations, comprehensive income (loss), equity and cash flows for the year ended December 31, 2015. These financial statements are the responsibility of the Company's management. Our responsibility is to express an opinion on these financial statements based on our audit.
We conducted our audit in accordance with the standards of the Public Company Accounting Oversight Board (United States). Those standards require that we plan and perform the audit to obtain reasonable assurance about whether the financial statements are free of material misstatement. An audit includes examining, on a test basis, evidence supporting the amounts and disclosures in the financial statements. An audit also includes assessing the accounting principles used and significant estimates made by management, as well as evaluating the overall financial statement presentation. We believe that our audit provides a reasonable basis for our opinion.
In our opinion, the financial statements referred to above present fairly, in all material respects, the consolidated results of operations and cash flows of Itron, Inc. for the year ended December 31, 2015, in conformity with U.S. generally accepted accounting principles.
/s/ Ernst & Young LLP
Seattle, Washington
June 29, 2016
45
ITRON, INC.
CONSOLIDATED STATEMENTS OF OPERATIONS
Year Ended December 31, | |||||||||||
2017 | 2016 | 2015 | |||||||||
(in thousands, except per share data) | |||||||||||
Revenues | |||||||||||
Product revenues | $ | 1,813,925 | $ | 1,830,070 | $ | 1,699,534 | |||||
Service revenues | 204,272 | 183,116 | 183,999 | ||||||||
Total revenues | 2,018,197 | 2,013,186 | 1,883,533 | ||||||||
Cost of revenues | |||||||||||
Product cost of revenues | 1,205,548 | 1,239,152 | 1,216,709 | ||||||||
Service cost of revenues | 137,495 | 113,714 | 110,139 | ||||||||
Total cost of revenues | 1,343,043 | 1,352,866 | 1,326,848 | ||||||||
Gross profit | 675,154 | 660,320 | 556,685 | ||||||||
Operating expenses | |||||||||||
Sales and marketing | 170,008 | 158,883 | 161,380 | ||||||||
Product development | 169,977 | 168,209 | 162,334 | ||||||||
General and administrative | 156,540 | 162,815 | 155,715 | ||||||||
Amortization of intangible assets | 20,785 | 25,112 | 31,673 | ||||||||
Restructuring | 6,418 | 49,090 | (7,263 | ) | |||||||
Total operating expenses | 523,728 | 564,109 | 503,839 | ||||||||
Operating income | 151,426 | 96,211 | 52,846 | ||||||||
Other income (expense) | |||||||||||
Interest income | 2,126 | 865 | 761 | ||||||||
Interest expense | (11,581 | ) | (10,948 | ) | (12,289 | ) | |||||
Other income (expense), net | (7,396 | ) | (1,501 | ) | (4,216 | ) | |||||
Total other income (expense) | (16,851 | ) | (11,584 | ) | (15,744 | ) | |||||
Income before income taxes | 134,575 | 84,627 | 37,102 | ||||||||
Income tax provision | (74,326 | ) | (49,574 | ) | (22,099 | ) | |||||
Net income | 60,249 | 35,053 | 15,003 | ||||||||
Net income attributable to noncontrolling interests | 2,951 | 3,283 | 2,325 | ||||||||
Net income attributable to Itron, Inc. | $ | 57,298 | $ | 31,770 | $ | 12,678 | |||||
Earnings per common share - Basic | $ | 1.48 | $ | 0.83 | $ | 0.33 | |||||
Earnings per common share - Diluted | $ | 1.45 | $ | 0.82 | $ | 0.33 | |||||
Weighted average common shares outstanding - Basic | 38,655 | 38,207 | 38,224 | ||||||||
Weighted average common shares outstanding - Diluted | 39,387 | 38,643 | 38,506 | ||||||||
The accompanying notes are an integral part of these consolidated financial statements.
46
ITRON, INC.
CONSOLIDATED STATEMENTS OF COMPREHENSIVE INCOME (LOSS)
Year Ended December 31, | |||||||||||
2017 | 2016 | 2015 | |||||||||
(in thousands) | |||||||||||
Net income | $ | 60,249 | $ | 35,053 | $ | 15,003 | |||||
Other comprehensive income (loss), net of tax: | |||||||||||
Foreign currency translation adjustments | 54,338 | (24,977 | ) | (72,929 | ) | ||||||
Net unrealized gain (loss) on derivative instruments designated as cash flow hedges | 923 | (275 | ) | 1,086 | |||||||
Pension benefit obligation adjustment | 3,588 | (3,468 | ) | 6,296 | |||||||
Total other comprehensive income (loss), net of tax | 58,849 | (28,720 | ) | (65,547 | ) | ||||||
Total comprehensive income (loss), net of tax | 119,098 | 6,333 | (50,544 | ) | |||||||
Comprehensive income (loss) attributable to noncontrolling interest, net of tax: | 2,951 | 3,283 | 2,325 | ||||||||
Comprehensive income (loss) attributable to Itron, Inc. | $ | 116,147 | $ | 3,050 | $ | (52,869 | ) | ||||
The accompanying notes are an integral part of these consolidated financial statements.
47
ITRON, INC.
CONSOLIDATED BALANCE SHEETS
December 31, 2017 | December 31, 2016 | ||||||
(in thousands) | |||||||
ASSETS | |||||||
Current assets | |||||||
Cash and cash equivalents | $ | 176,274 | $ | 133,565 | |||
Accounts receivable, net | 398,029 | 351,506 | |||||
Inventories | 193,835 | 163,049 | |||||
Other current assets | 81,604 | 84,346 | |||||
Total current assets | 849,742 | 732,466 | |||||
Property, plant, and equipment, net | 200,768 | 176,458 | |||||
Deferred tax assets, net | 49,971 | 94,113 | |||||
Restricted cash | 311,010 | — | |||||
Other long-term assets | 43,666 | 50,129 | |||||
Intangible assets, net | 95,228 | 72,151 | |||||
Goodwill | 555,762 | 452,494 | |||||
Total assets | $ | 2,106,147 | $ | 1,577,811 | |||
LIABILITIES AND EQUITY | |||||||
Current liabilities | |||||||
Accounts payable | $ | 262,166 | $ | 172,711 | |||
Other current liabilities | 56,736 | 43,625 | |||||
Wages and benefits payable | 90,505 | 82,346 | |||||
Taxes payable | 16,100 | 10,451 | |||||
Current portion of debt | 19,688 | 14,063 | |||||
Current portion of warranty | 21,150 | 24,874 | |||||
Unearned revenue | 41,438 | 64,976 | |||||
Total current liabilities | 507,783 | 413,046 | |||||
Long-term debt | 593,572 | 290,460 | |||||
Long-term warranty | 13,712 | 18,428 | |||||
Pension benefit obligation | 95,717 | 84,498 | |||||
Deferred tax liabilities, net | 1,525 | 3,073 | |||||
Other long-term obligations | 88,206 | 117,953 | |||||
Total liabilities | 1,300,515 | 927,458 | |||||
Commitments and contingencies (Note 12) | |||||||
Equity | |||||||
Preferred stock, no par value, 10 million shares authorized, no shares issued or outstanding | — | — | |||||
Common stock, no par value, 75 million shares authorized, 38,771 and 38,317 shares issued and outstanding | 1,294,767 | 1,270,467 | |||||
Accumulated other comprehensive loss, net | (170,478 | ) | (229,327 | ) | |||
Accumulated deficit | (337,873 | ) | (409,536 | ) | |||
Total Itron, Inc. shareholders' equity | 786,416 | 631,604 | |||||
Noncontrolling interests | 19,216 | 18,749 | |||||
Total equity | 805,632 | 650,353 | |||||
Total liabilities and equity | $ | 2,106,147 | $ | 1,577,811 | |||
The accompanying notes are an integral part of these consolidated financial statements.
48
ITRON, INC.
CONSOLIDATED STATEMENTS OF EQUITY
(in thousands)
Common Stock | Accumulated Other Comprehensive Loss | Accumulated Deficit | Total Itron, Inc. Shareholders' Equity | Noncontrolling Interests | Total Equity | |||||||||||||||||||||
Shares | Amount | |||||||||||||||||||||||||
Balances at January 1, 2015 | 38,591 | $ | 1,270,045 | $ | (135,060 | ) | $ | (453,984 | ) | $ | 681,001 | $ | 17,541 | $ | 698,542 | |||||||||||
Net income | 12,678 | 12,678 | 2,325 | 15,003 | ||||||||||||||||||||||
Other comprehensive income (loss), net of tax | (65,547 | ) | (65,547 | ) | — | (65,547 | ) | |||||||||||||||||||
Distributions to noncontrolling interests | (1,921 | ) | (1,921 | ) | ||||||||||||||||||||||
Stock issues and repurchases: | ||||||||||||||||||||||||||
Options exercised | 24 | 853 | 853 | 853 | ||||||||||||||||||||||
Restricted stock awards released | 296 | — | — | — | ||||||||||||||||||||||
Issuance of stock-based compensation awards | 20 | 706 | 706 | 706 | ||||||||||||||||||||||
Employee stock purchase plan | 54 | 1,819 | 1,819 | 1,819 | ||||||||||||||||||||||
Stock-based compensation expense | 13,384 | 13,384 | 13,384 | |||||||||||||||||||||||
Employee stock plans income tax deficiencies | (1,853 | ) | (1,853 | ) | (1,853 | ) | ||||||||||||||||||||
Repurchase of common stock | (1,079 | ) | (38,283 | ) | (38,283 | ) | (38,283 | ) | ||||||||||||||||||
Balances at December 31, 2015 | 37,906 | $ | 1,246,671 | $ | (200,607 | ) | $ | (441,306 | ) | $ | 604,758 | $ | 17,945 | $ | 622,703 | |||||||||||
Net income | 31,770 | 31,770 | 3,283 | 35,053 | ||||||||||||||||||||||
Other comprehensive income (loss), net of tax | (28,720 | ) | (28,720 | ) | — | (28,720 | ) | |||||||||||||||||||
Distributions to noncontrolling interests | (2,479 | ) | (2,479 | ) | ||||||||||||||||||||||
Stock issues and repurchases: | ||||||||||||||||||||||||||
Options exercised | 58 | 2,144 | 2,144 | 2,144 | ||||||||||||||||||||||
Restricted stock awards released | 312 | — | — | — | ||||||||||||||||||||||
Issuance of stock-based compensation awards | 21 | 955 | 955 | 955 | ||||||||||||||||||||||
Employee stock purchase plan | 20 | 747 | 747 | 747 | ||||||||||||||||||||||
Stock-based compensation expense | 17,080 | 17,080 | 17,080 | |||||||||||||||||||||||
Employee stock plans income tax deficiencies | 2,870 | 2,870 | 2,870 | |||||||||||||||||||||||
Balances at December 31, 2016 | 38,317 | $ | 1,270,467 | $ | (229,327 | ) | $ | (409,536 | ) | $ | 631,604 | $ | 18,749 | $ | 650,353 | |||||||||||
Net income | 57,298 | 57,298 | 2,951 | 60,249 | ||||||||||||||||||||||
Cumulative effect of accounting change | 215 | 14,365 | 14,580 | 14,580 | ||||||||||||||||||||||
Other comprehensive income (loss), net of tax | 58,849 | 58,849 | — | 58,849 | ||||||||||||||||||||||
Distributions to noncontrolling interests | (2,171 | ) | (2,171 | ) | ||||||||||||||||||||||
Stock issues and repurchases: | ||||||||||||||||||||||||||
Options exercised | 41 | 1,631 | 1,631 | 1,631 | ||||||||||||||||||||||
Restricted stock awards released | 372 | — | — | — | ||||||||||||||||||||||
Issuance of stock-based compensation awards | 10 | 974 | 974 | 974 | ||||||||||||||||||||||
Employee stock purchase plan | 31 | 1,978 | 1,978 | 1,978 | ||||||||||||||||||||||
Stock-based compensation expense | 20,433 | 20,433 | 20,433 | |||||||||||||||||||||||
Repurchase of noncontrolling interest | (906 | ) | (906 | ) | (313 | ) | (1,219 | ) | ||||||||||||||||||
Registration fee | (25 | ) | (25 | ) | (25 | ) | ||||||||||||||||||||
Balances at December 31, 2017 | 38,771 | $ | 1,294,767 | $ | (170,478 | ) | $ | (337,873 | ) | $ | 786,416 | $ | 19,216 | $ | 805,632 | |||||||||||
The accompanying notes are an integral part of these consolidated financial statements.
49
ITRON, INC.
CONSOLIDATED STATEMENTS OF CASH FLOWS
Year Ended December 31, | |||||||||||
2017 | 2016 | 2015 | |||||||||
(in thousands) | |||||||||||
Operating activities | |||||||||||
Net income | $ | 60,249 | $ | 35,053 | $ | 15,003 | |||||
Adjustments to reconcile net income to net cash provided by operating activities: | |||||||||||
Depreciation and amortization | 63,215 | 68,318 | 75,993 | ||||||||
Stock-based compensation | 21,407 | 18,035 | 14,089 | ||||||||
Amortization of prepaid debt fees | 1,067 | 1,076 | 2,128 | ||||||||
Deferred taxes, net | 50,667 | 13,790 | 1,488 | ||||||||
Restructuring, non-cash | (2,297 | ) | 7,188 | 976 | |||||||
Other adjustments, net | 3,673 | 4,309 | 2,003 | ||||||||
Changes in operating assets and liabilities, net of acquisitions: | |||||||||||
Accounts receivable | (17,573 | ) | (27,162 | ) | (9,009 | ) | |||||
Inventories | (16,242 | ) | 22,343 | (52,737 | ) | ||||||
Other current assets | 8,112 | 20,705 | 12,512 | ||||||||
Other long-term assets | 11,230 | (339 | ) | (3,721 | ) | ||||||
Accounts payables, other current liabilities, and taxes payable | 78,463 | (37,312 | ) | (7,060 | ) | ||||||
Wages and benefits payable | 1,926 | 7,808 | (10,866 | ) | |||||||
Unearned revenue | (41,309 | ) | (25,810 | ) | 11,943 | ||||||
Warranty | (10,554 | ) | (10,246 | ) | 20,161 | ||||||
Other operating, net | (20,680 | ) | 18,086 | 447 | |||||||
Net cash provided by operating activities | 191,354 | 115,842 | 73,350 | ||||||||
Investing activities | |||||||||||
Acquisitions of property, plant, and equipment | (49,495 | ) | (43,543 | ) | (43,918 | ) | |||||
Business acquisitions, net of cash equivalents acquired | (99,386 | ) | (951 | ) | (5,754 | ) | |||||
Other investing, net | 702 | (3,034 | ) | 721 | |||||||
Net cash used in investing activities | (148,179 | ) | (47,528 | ) | (48,951 | ) | |||||
Financing activities | |||||||||||
Proceeds from borrowings | 335,000 | 15,877 | 113,467 | ||||||||
Payments on debt | (29,063 | ) | (79,119 | ) | (62,998 | ) | |||||
Issuance of common stock | 3,609 | 2,891 | 2,663 | ||||||||
Repurchase of common stock | — | — | (38,283 | ) | |||||||
Other financing, net | (7,587 | ) | (2,672 | ) | (7,109 | ) | |||||
Net cash provided by (used in) financing activities | 301,959 | (63,023 | ) | 7,740 | |||||||
Effect of foreign exchange rate changes on cash, cash equivalents, and restricted cash | 8,636 | (2,744 | ) | (13,492 | ) | ||||||
Increase in cash, cash equivalents, and restricted cash | 353,770 | 2,547 | 18,647 | ||||||||
Cash, cash equivalents, and restricted cash at beginning of period | 133,565 | 131,018 | 112,371 | ||||||||
Cash, cash equivalents, and restricted cash at end of period | $ | 487,335 | $ | 133,565 | $ | 131,018 | |||||
Supplemental disclosure of cash flow information: | |||||||||||
Cash paid during the period for: | |||||||||||
Income taxes, net | $ | 28,969 | $ | 24,287 | $ | 29,189 | |||||
Interest | 10,106 | 9,921 | 10,198 | ||||||||
The accompanying notes are an integral part of these consolidated financial statements.
50
ITRON, INC.
NOTES TO CONSOLIDATED FINANCIAL STATEMENTS
DECEMBER 31, 2017
In this Annual Report, the terms “we,” “us,” “our,” “Itron,” and the “Company” refer to Itron, Inc.
Note 1: Summary of Significant Accounting Policies
We were incorporated in the state of Washington in 1977, and are a technology company, offering end-to-end solutions to enhance productivity and efficiency, primarily focused on utilities and municipalities around the globe. Our solutions generally include robust industrial grade networks, smart meters, meter data management software, and knowledge application solutions, which bring additional value to the customer. Our professional services help our customers project-manage, install, implement, operate, and maintain their systems. We operate under the Itron brand worldwide and manage and report under three operating segments: Electricity, Gas, and Water.
Financial Statement Preparation
The consolidated financial statements presented in this Annual Report include the Consolidated Statements of Operations, Comprehensive Income (Loss), Equity, and Cash Flows for the years ended December 31, 2017, 2016, and 2015 and the Consolidated Balance Sheets as of December 31, 2017 and 2016 of Itron, Inc. and its subsidiaries, prepared in accordance with U.S. generally accepted accounting principles (GAAP).
Use of Estimates
The preparation of financial statements in conformity with GAAP requires management to make estimates and assumptions. These estimates and assumptions affect the reported amounts of assets and liabilities at the date of the financial statements and the reported amounts of revenues and expenses during the reporting period. Examples of significant estimates include revenue recognition, warranty, restructuring, income taxes, business combinations, goodwill and intangible assets, defined benefit pension plans, contingencies, and stock-based compensation. Due to various factors affecting future costs and operations, actual results could differ materially from these estimates.
Basis of Consolidation
We consolidate all entities in which we have a greater than 50% ownership interest or in which we exercise control over the operations. We use the equity method of accounting for entities in which we have a 50% or less investment and exercise significant influence. Entities in which we have less than a 20% investment and where we do not exercise significant influence are accounted for under the cost method. Intercompany transactions and balances are eliminated upon consolidation.
Noncontrolling Interests
In several of our consolidated international subsidiaries, we have joint venture partners, who are minority shareholders. Although these entities are not wholly-owned by Itron, we consolidate them because we have a greater than 50% ownership interest or because we exercise control over the operations. The noncontrolling interest balance is adjusted each period to reflect the allocation of net income (loss) and other comprehensive income (loss) attributable to the noncontrolling interests, as shown in our Consolidated Statements of Operations and our Consolidated Statements of Comprehensive Income (Loss) as well as contributions from and distributions to the owners. The noncontrolling interest balance in our Consolidated Balance Sheets represents the proportional share of the equity of the joint venture entities which is attributable to the minority shareholders.
Cash and Cash Equivalents
We consider all highly liquid instruments with remaining maturities of three months or less at the date of acquisition to be cash equivalents.
Restricted Cash and Cash Equivalents
Cash and cash equivalents that are contractually restricted from operating use are classified as restricted cash and cash equivalents. On December 22, 2017, we issued $300 million aggregate principal amount of 5.00% senior unsecured notes due in 2026 (Notes). The proceeds of the Notes plus payments for prepaid interest and a premium for a special mandatory redemption option were deposited into escrow, where the funds remained until all the escrow release conditions were satisfied, specifically the closing of the acquisition of Silver Spring Networks, Inc. (SSNI) on January 5, 2018. Had the acquisition agreement been terminated, the funds in escrow would have been returned to the investors of the Notes plus accrued and unpaid interest up to the date of release, with any remaining balance from prepaid interest returned to the Company. We have recognized the balance in escrow as restricted cash in our consolidated financial statements. See Note 6 - Debt and Note 19 - Subsequent Events for further details.
51
The following table provides a reconciliation of cash, cash equivalents, and restricted cash reported within the Consolidated Balance Sheets that sum to the total of the same such amounts shown in the Consolidated Statements of Cash Flows:
Year Ended December 31, | |||||||||||
2017 | 2016 | 2015 | |||||||||
(in thousands) | |||||||||||
Cash and cash equivalents | $ | 176,274 | $ | 133,565 | $ | 131,018 | |||||
Current restricted cash included in other current assets | 51 | — | — | ||||||||
Long-term restricted cash | 311,010 | — | — | ||||||||
Total cash, cash equivalents, and restricted cash: | $ | 487,335 | $ | 133,565 | $ | 131,018 | |||||
Accounts Receivable, net
Accounts receivable are recognized for invoices issued to customers in accordance with our contractual arrangements. Interest and late payment fees are minimal. Unbilled receivables are recognized when revenues are recognized upon product shipment or service delivery and invoicing occurs at a later date. We recognize an allowance for doubtful accounts representing our estimate of the probable losses in accounts receivable at the date of the balance sheet based on our historical experience of bad debts and our specific review of outstanding receivables. Accounts receivable are written-off against the allowance when we believe an account, or a portion thereof, is no longer collectible.
Inventories
Inventories are stated at the lower of cost or net realizable value using the first-in, first-out method. Cost includes raw materials and labor, plus applied direct and indirect costs. Net realizable value is the estimated selling price in the normal course of business, minus the cost of completion, disposal and transportation.
Derivative Instruments
All derivative instruments, whether designated in hedging relationships or not, are recognized on the Consolidated Balance Sheets at fair value as either assets or liabilities. The components and fair values of our derivative instruments are determined using the fair value measurements of significant other observable inputs (Level 2), as defined by GAAP. The fair value of our derivative instruments may switch between an asset and a liability depending on market circumstances at the end of the period. We include the effect of our counterparty credit risk based on current published credit default swap rates when the net fair value of our derivative instruments are in a net asset position and the effect of our own nonperformance risk when the net fair value of our derivative instruments are in a net liability position.
For any derivative designated as a fair value hedge, the changes in the fair value of the derivative and of the hedged item attributable to the hedged risk are recognized in earnings. For any derivative designated as a cash flow hedge, the effective portions of changes in the fair value of the derivative are recognized as a component of other comprehensive income (loss) (OCI) and are recognized in earnings when the hedged item affects earnings. Ineffective portions of cash flow hedges are recognized in other income (expense) in the Consolidated Statements of Operations. For a hedge of a net investment, the effective portion of any unrealized gain or loss from the foreign currency revaluation of the hedging instrument is reported in OCI as a net unrealized gain or loss on derivative instruments. Upon termination of a net investment hedge, the net derivative gain/loss will remain in accumulated other comprehensive income (loss) (AOCI) until such time when earnings are impacted by a sale or liquidation of the associated operations. Ineffective portions of fair value changes or the changes in fair value of derivative instruments that do not qualify for hedging activities are recognized in other income (expense) in the Consolidated Statements of Operations. We classify cash flows from our derivative programs as cash flows from operating activities in the Consolidated Statements of Cash Flows.
Derivatives are not used for trading or speculative purposes. Our derivatives are with credit worthy multinational commercial banks, with whom we have master netting agreements; however, our derivative positions are not recognized on a net basis in the Consolidated Balance Sheets. There are no credit-risk-related contingent features within our derivative instruments. Refer to Note 7 and Note 14 for further disclosures of our derivative instruments and their impact on OCI.
Property, Plant, and Equipment
Property, plant, and equipment are stated at cost less accumulated depreciation. Depreciation is computed using the straight-line method over the estimated useful lives of the assets, generally 30 years for buildings and improvements and three to ten years for machinery and equipment, computers and software, and furniture. Leasehold improvements are capitalized and depreciated over the term of the applicable lease, including renewable periods if reasonably assured, or over the useful lives, whichever is shorter. Construction in process represents capital expenditures incurred for assets not yet placed in service. Costs related to internally
52
developed software and software purchased for internal uses are capitalized and are amortized over the estimated useful lives of the assets. Repair and maintenance costs are recognized as incurred. We have no major planned maintenance activities.
We review long-lived assets for impairment whenever events or circumstances indicate the carrying amount of an asset group may not be recoverable. Assets held for sale are classified within other current assets in the Consolidated Balance Sheets, are reported at the lower of the carrying amount or fair value less costs to sell, and are no longer depreciated. Gains and losses from asset disposals and impairment losses are classified within the Consolidated Statement of Operations according to the use of the asset, except those gains and losses recognized in conjunction with our restructuring activities, which are classified within restructuring expense.
Prepaid Debt Fees
Prepaid debt fees for term debt represent the capitalized direct costs incurred related to the issuance of debt and are recognized as a direct deduction from the carrying amount of the corresponding debt liability. We have elected to present prepaid debt fees for revolving debt within other long-term assets in the Consolidated Balance Sheets. These costs are amortized to interest expense over the terms of the respective borrowings, including contingent maturity or call features, using the effective interest method, or straight-line method when associated with a revolving credit facility. When debt is repaid early, the related portion of unamortized prepaid debt fees is written off and included in interest expense.
Business Combinations
On the date of acquisition, the assets acquired, liabilities assumed, and any noncontrolling interests in the acquiree are recognized at their fair values. The acquiree's results of operations are also included as of the date of acquisition in our consolidated results. Intangible assets that arise from contractual/legal rights, or are capable of being separated, as well as in-process research and development (IPR&D), are measured and recognized at fair value, and amortized over the estimated useful life. IPR&D is not amortized until such time as the associated development projects are completed or terminated. If a development project is completed, the IPR&D is reclassified as a core technology intangible asset and amortized over its estimated useful life. If the development project is terminated, the recognized value of the associated IPR&D is immediately recognized. If practicable, assets acquired and liabilities assumed arising from contingencies are measured and recognized at fair value. If not practicable, such assets and liabilities are measured and recognized when it is probable that a gain or loss has occurred, and the amount can be reasonably estimated. The residual balance of the purchase price, after fair value allocations to all identified assets and liabilities, represents goodwill. Acquisition-related costs are recognized as incurred. Integration costs associated with an acquisition are generally recognized in periods subsequent to the acquisition date, and changes in deferred tax asset valuation allowances and acquired income tax uncertainties, including penalties and interest, after the measurement period are recognized as a component of the provision for income taxes. Our acquisitions may include contingent consideration, which require us to recognize the fair value of the estimated liability at the time of the acquisition. Subsequent changes in the estimate of the amount to be paid under the contingent consideration arrangement are recognized in the Consolidated Statements of Operations.
We estimate the preliminary fair value of acquired assets and liabilities as of the date of acquisition based on information available at that time utilizing either a cost or income approach. The determination of the fair value is judgmental in nature and involves the use of significant estimates and assumptions. Contingent consideration is recorded at fair value as of the date of the acquisition with adjustments occurring after the purchase price allocation period, which could be up to one year, recorded in earnings. Changes to valuation allowances on acquired deferred tax assets that occur after the acquisition date are recognized in the provision for, or benefit from, income taxes. The valuation of these tangible and identifiable intangible assets and liabilities is subject to further management review and may change materially between the preliminary allocation and end of the purchase price allocation period. Any changes in these estimates may have a material effect on our consolidated operating results or financial position.
Goodwill and Intangible Assets
Goodwill and intangible assets may result from our business acquisitions. Intangible assets may also result from the purchase of assets and intellectual property in a transaction that does not qualify as a business combination. We use estimates, including estimates of useful lives of intangible assets, the amount and timing of related future cash flows, and fair values of the related operations, in determining the value assigned to goodwill and intangible assets. Our finite-lived intangible assets are amortized over their estimated useful lives based on estimated discounted cash flows, generally three years to ten years for core-developed technology and customer contracts and relationships. Finite-lived intangible assets are tested for impairment at the asset group level when events or changes in circumstances indicate the carrying value may not be recoverable. Indefinite-lived intangible assets are tested for impairment annually, when events or changes in circumstances indicate the asset may be impaired, or at the time when their useful lives are determined to be no longer indefinite.
Goodwill is assigned to our reporting units based on the expected benefit from the synergies arising from each business combination, determined by using certain financial metrics, including the forecasted discounted cash flows associated with each reporting unit. Each reporting unit corresponds with its respective operating segment.
53
We test goodwill for impairment each year as of October 1, or more frequently should a significant impairment indicator occur. As part of the impairment test, we may elect to perform an assessment of qualitative factors. If this qualitative assessment indicates that it is more likely than not that the fair value of a reporting unit, including goodwill, is less than its carrying amount, or if we elect to bypass the qualitative assessment, we would then proceed with the impairment test. The impairment test involves comparing the fair values of the reporting units to their carrying amounts. If the carrying amount of the reporting unit's goodwill exceeds the fair value of the reporting unit, an impairment loss is recognized in an amount equal to the excess.
Determining the fair value of a reporting unit is judgmental in nature and involves the use of significant estimates and assumptions. We forecast discounted future cash flows at the reporting unit level using risk-adjusted discount rates and estimated future revenues and operating costs, which take into consideration factors such as existing backlog, expected future orders, supplier contracts, and expectations of competitive and economic environments. We also identify similar publicly traded companies and develop a correlation, referred to as a multiple, to apply to the operating results of the reporting units. These combined fair values are then reconciled to the aggregate market value of our common stock on the date of valuation, while considering a reasonable control premium.
Contingencies
A loss contingency is recognized if it is probable that an asset has been impaired, or a liability has been incurred and the amount of the loss can be reasonably estimated. We evaluate, among other factors, the degree of probability of an unfavorable outcome and our ability to make a reasonable estimate of the amount of the ultimate loss. Loss contingencies that we determine to be reasonably possible, but not probable, are disclosed but not recognized. Changes in these factors and related estimates could materially affect our financial position and results of operations. Legal costs to defend against contingent liabilities are recognized as incurred.
Bonus and Profit Sharing
We have various employee bonus and profit sharing plans, which provide award amounts for the achievement of financial and nonfinancial targets. If management determines it is probable that the targets will be achieved, and the amounts can be reasonably estimated, a compensation accrual is recognized based on the proportional achievement of the financial and nonfinancial targets. Although we monitor and accrue expenses quarterly based on our progress toward the achievement of the targets, the actual results may result in awards that are significantly greater or less than the estimates made in earlier quarters.
Warranty
We offer standard warranties on our hardware products and large application software products. We accrue the estimated cost of new product warranties based on historical and projected product performance trends and costs during the warranty period. Testing of new products in the development stage helps identify and correct potential warranty issues prior to manufacturing. Quality control efforts during manufacturing reduce our exposure to warranty claims. When testing or quality control efforts fail to detect a fault in one of our products, we may experience an increase in warranty claims. We track warranty claims to identify potential warranty trends. If an unusual trend is noted, an additional warranty accrual would be recognized if a failure event is probable and the cost can be reasonably estimated. When new products are introduced, our process relies on historical averages of similar products until sufficient data is available. As actual experience on new products becomes available, it is used to modify the historical averages to ensure the expected warranty costs are within a range of likely outcomes. Management regularly evaluates the sufficiency of the warranty provisions and makes adjustments when necessary. The warranty allowances may fluctuate due to changes in estimates for material, labor, and other costs we may incur to repair or replace projected product failures, and we may incur additional warranty and related expenses in the future with respect to new or established products, which could adversely affect our financial position and results of operations. The long-term warranty balance includes estimated warranty claims beyond one year. Warranty expense is classified within cost of revenues.
Restructuring
We recognize a liability for costs associated with an exit or disposal activity under a restructuring project in the period in which the liability is incurred. Employee termination benefits considered postemployment benefits are accrued when the obligation is probable and estimable, such as benefits stipulated by human resource policies and practices or statutory requirements. One-time termination benefits are recognized at the date the employee is notified. If the employee must provide future service greater than 60 days, such benefits are recognized ratably over the future service period. For contract termination costs, we recognize a liability upon the termination of a contract in accordance with the contract terms or the cessation of the use of the rights conveyed by the contract, whichever occurs later.
Asset impairments associated with a restructuring project are determined at the asset group level. An impairment may be recognized for assets that are to be abandoned, are to be sold for less than net book value, or are held for sale in which the estimated proceeds less costs to sell are less than the net book value. We may also recognize impairment on an asset group, which is held and used,
54
when the carrying value is not recoverable and exceeds the asset group's fair value. If an asset group is considered a business, a portion of our goodwill balance is allocated to it based on relative fair value. If the sale of an asset group under a restructuring project results in proceeds that exceed the net book value of the asset group, the resulting gain is recognized within restructuring expense in the Consolidated Statements of Operations.
Defined Benefit Pension Plans
We sponsor both funded and unfunded defined benefit pension plans for certain international employees. We recognize a liability for the projected benefit obligation in excess of plan assets or an asset for plan assets in excess of the projected benefit obligation. We also recognize the funded status of our defined benefit pension plans on our Consolidated Balance Sheets and recognize as a component of OCI, net of tax, the actuarial gains or losses and prior service costs or credits, if any that arise during the period but that are not recognized as components of net periodic benefit cost. If actuarial gains and losses exceed ten percent of the greater of plan assets or plan liabilities, we amortize them over the employees' average future service period.
Share Repurchase Plan
From time to time, we may repurchase shares of Itron common stock under programs authorized by our Board of Directors. Share repurchases are made in the open market or in privately negotiated transactions and in accordance with applicable securities laws. Under applicable Washington State law, shares repurchased are retired and not displayed separately as treasury stock on the financial statements; the value of the repurchased shares is deducted from common stock.
Product Revenues and Service Revenues
Product revenues include sales from standard and smart meters, systems or software, and any associated implementation and installation revenue. Service revenues include sales from post-sale maintenance support, consulting, outsourcing, and managed services.
Revenue Recognition
Revenues consist primarily of hardware sales, software license fees, software implementation, project management services, installation, consulting, and post-sale maintenance support. Revenues are recognized when (1) persuasive evidence of an arrangement exists, (2) delivery has occurred or services have been rendered, (3) the sales price is fixed or determinable, and (4) collectability is reasonably assured.
Many of our revenue arrangements involve multiple deliverables, which combine two or more of the following: hardware, meter reading system software, installation, and/or project management services. Separate contracts entered into with the same customer that meet certain criteria such as those that are entered into at or near the same time are evaluated as one single arrangement for purposes of applying multiple element arrangement revenue recognition. Revenue arrangements with multiple deliverables are divided into separate units of accounting at the inception of the arrangement and as each item in the arrangement is delivered. If the delivered item(s) has value to the customer on a standalone basis and delivery/performance of the undelivered item(s) is probable the total arrangement consideration is allocated among the separate units of accounting based on their relative fair values and the applicable revenue recognition criteria are then considered for each unit of accounting. The amount allocable to a delivered item is limited to the amount that we are entitled to collect and that is not contingent upon the delivery/performance of additional items. Revenues for each deliverable are then recognized based on the type of deliverable, such as 1) when the products are shipped, 2) services are delivered, 3) percentage-of-completion for implementation services, 4) upon receipt of customer acceptance, or 5) transfer of title and risk of loss. The majority of our revenue is recognized when products are shipped to or received by a customer or when services are provided.
Hardware revenues are generally recognized at the time of shipment, receipt by the customer, or, if applicable, upon completion of customer acceptance provisions.
Under contract accounting where revenue is recognized using percentage of completion, the cost to cost method is used to measure progress to completion. Revenue from OpenWay network software and services are recognized using the units-of-delivery method of contract accounting, as network design services and network software are essential to the functionality of the related hardware (network) for certain contracts. This methodology results in the deferral of costs and revenues as professional services and software implementation commence prior to deployment of hardware.
In the unusual instances when we are unable to reliably estimate the cost to complete a contract at its inception, we use the completed contract method of contract accounting. Revenues and costs are recognized upon substantial completion when remaining costs are insignificant and potential risks are minimal.
55
Change orders and contract modifications entered into after inception of the original contract are analyzed to determine if change orders or modifications are extensions of an existing agreement or are accounted for as a separate arrangement for purposes of applying contract accounting.
If we estimate that the completion of a contract component (unit of accounting) will result in a loss, the loss is recognized in the period in which the loss becomes evident. We reevaluate the estimated loss through the completion of the contract component and adjust the estimated loss for changes in facts and circumstances.
A few of our larger customer arrangements contain clauses for liquidated damages, related to delays in delivery or milestone accomplishments, which could become material in an event of failure to meet the contractual deadlines. At the inception of the arrangement and on an ongoing basis, we evaluate if the liquidated damages represent contingent revenue and, if so, we reduce the amount of consideration allocated to the delivered products and services and recognize it as a reduction in revenue in the period of default. If the arrangement is subject to contract accounting, liquidated damages resulting from failure or expected failure to meet milestones are estimated and are accounted for as a reduction of revenue in the period in which the liquidated damages are deemed probable of occurrence and are reasonably estimable.
Our software customers often purchase a combination of software, software-related services, and post contract customer support (PCS). PCS includes telephone support services and updates or upgrades for software as part of a maintenance program. For these types of arrangements, revenue recognition is dependent upon the availability of vendor specific objective evidence (VSOE) of fair value for any undelivered element. We determine VSOE by reference to the range of comparable standalone sales or stated renewals. We review these standalone sales or renewals on at least an annual basis. If VSOE is established for all undelivered elements in the contract, revenue is recognized for delivered elements when all other revenue recognition criteria are met. Arrangements in which VSOE for all undelivered elements is not established, we recognize revenue under the combined services approach where revenue for software and software related elements is deferred until all software products have been delivered, all software related services have commenced, and undelivered services do not include significant production, customization or modification. This will also result in the deferral of costs for software and software implementation services until the undelivered element commence. Revenue would be recognized over the longest period that services would be provided, which is typically the PCS period.
Cloud services and software as a service (SaaS) arrangements where customers have access to certain of our software within a cloud-based IT environment that we manage, host and support are offered to customers on a subscription basis. Revenue for the cloud services and SaaS offerings are generally recognized ratably over the contact term commencing with the date the services is made available to customers and all other revenue recognition criteria have been satisfied. For arrangements where cloud services and SaaS is provided on a per meter basis, revenue is recognized based on actual meters read during the period.
Certain of our revenue arrangements include an extended or noncustomary warranty provision that covers all or a portion of a customer's replacement or repair costs beyond the standard or customary warranty period. Whether or not the extended warranty is separately priced in the arrangement, a portion of the arrangement's total consideration is allocated to this extended warranty deliverable. This revenue is deferred and recognized over the extended warranty coverage period. Extended or noncustomary warranties do not represent a significant portion of our revenue.
We allocate consideration to each deliverable in an arrangement based on its relative selling price. We determine selling price using VSOE, if it exists, otherwise we use third-party evidence (TPE). We define VSOE as a median price of recent standalone transactions that are priced within a narrow range. TPE is determined based on the prices charged by our competitors for a similar deliverable when sold separately. If neither VSOE nor TPE of selling price exists for a unit of accounting, we use estimated selling price (ESP) to determine the price at which we would transact if the product or service were regularly sold by us on a standalone basis. Our determination of ESP involves a weighting of several factors based on the specific facts and circumstances of the arrangement. The factors considered include historical contractual sales, market conditions and entity specific factors, the cost to produce the deliverable, the anticipated margin on that deliverable, our ongoing pricing strategy and policies, and the characteristics of the varying markets in which the deliverable is sold.
We analyze the selling prices used in our allocation of arrangement consideration on an annual basis. Selling prices are analyzed on a more frequent basis if a significant change in our business necessitates a more timely analysis or if we experience significant variances in our selling prices.
Unearned revenue is recognized when a customer pays for products or services, but the criteria for revenue recognition have not been met as of the balance sheet date. Unearned revenue of $77.0 million and $114.3 million at December 31, 2017 and 2016 related primarily to professional services and software associated with our smart metering contracts, extended or noncustomary warranty, and prepaid post-contract support. Deferred costs are recognized for products or services for which ownership (typically
56
defined as title and risk of loss) has transferred to the customer, but the criteria for revenue recognition have not been met as of the balance sheet date. Deferred costs were $14.4 million and $34.4 million at December 31, 2017 and 2016 and are recognized within other assets in the Consolidated Balance Sheets.
Hardware and software post-sale maintenance support fees, such as post contract support or extended warranty are recognized ratably over the life of the related service contract. Shipping and handling costs and incidental expenses billed to customers are recognized as revenue, with the associated cost charged to cost of revenues. We recognize sales, use, and value added taxes billed to our customers on a net basis.
Product and Software Development Costs
Product and software development costs primarily include employee compensation and third party contracting fees. We do not capitalize product development costs, and we do not generally capitalize development expenses for computer software to be sold, leased, or otherwise marketed as the costs incurred are immaterial for the relatively short period of time between technological feasibility and the completion of software development.
Stock-Based Compensation
We grant various stock-based compensation awards to our officers, employees and Board of Directors with service, performance, and market vesting conditions, including stock options, restricted stock units, phantom stock units, and unrestricted stock units (awards). We measure and recognize compensation expense for all awards based on estimated fair values. For awards with only a service condition, we expense stock-based compensation using the straight-line method over the requisite service period for the entire award. For awards with service and performance conditions, if vesting is probable, we expense the stock-based compensation on a straight-line basis over the requisite service period for each separately vesting portion of the award. For awards with a market condition, we expense the fair value over the requisite service period. We have elected to account for forfeitures of any awards in stock-based compensation expense prospectively as they occur.
The fair value of stock options is estimated at the date of grant using the Black-Scholes option-pricing model. Options to purchase our common stock are granted with an exercise price equal to the market close price of the stock on the date the Board of Directors approves the grant. Options generally become exercisable in three equal annual installments beginning one year from the date of grant and expire 10 years from the date of grant. Expected volatility is based on a combination of the historical volatility of our common stock and the implied volatility of our traded options for the related expected term. We believe this combined approach is reflective of current and historical market conditions and is an appropriate indicator of expected volatility. The risk-free interest rate is the rate available as of the award date on zero-coupon U.S. government issues with a term equal to the expected term of the award. The expected term is the weighted average expected term of an award based on the period of time between the date the award is granted and the estimated date the award will be fully exercised. Factors considered in estimating the expected term include historical experience of similar awards, contractual terms, vesting schedules, and expectations of future employee behavior. We have not paid dividends in the past and do not plan to pay dividends in the foreseeable future.
The fair value of a restricted stock unit is the market close price of our common stock on the date of grant. Restricted stock units vest over a maximum period of three years. After vesting, the restricted stock units are converted into shares of our common stock on a one-for-one basis and issued to employees. Certain restricted stock units are issued under the Long-Term Performance Restricted Stock Unit Award Agreement and include performance and market conditions. The final number of shares issued will be based on the achievement of financial targets and our total shareholder return relative to the Russell 3000 Index during the performance periods. Due to the presence of a market condition, we utilize a Monte Carlo valuation model to determine the fair value of the awards at the grant date. Expected volatility is based on the historical volatility of our common stock for the related expected term. We believe this approach is reflective of current and historical market conditions and is an appropriate indicator of expected volatility. The risk-free interest rate is the rate available as of the award date on zero-coupon U.S. government issues with a term equal to the expected term of the award. The expected term is the term of an award based on the period of time between the date of the award and the date the award is expected to vest. The expected term assumption is based upon the plan's performance period as of the date of the award. We have not paid dividends in the past and do not plan to pay dividends in the foreseeable future.
Phantom stock units are a form of share-based award that are indexed to our stock price and are settled in cash upon vesting and accounted for as liability-based awards. Fair value is remeasured at the end of each reporting period based on the market close price of our common stock. Phantom stock units vest over a maximum period of three years. Since phantom stock units are settled in cash, compensation expense recognized over the vesting period will vary based on changes in fair value.
The fair value of unrestricted stock awards is the market close price of our common stock on the date of grant, and awards are fully vested. We expense stock-based compensation at the date of grant for unrestricted stock awards.
57
Excess tax benefits and deficiencies resulting from employee share-based payment are recognized as income tax provision or benefit in the Consolidated Statement of Operations, and as an operating activity on the Consolidated Statement of Cash Flows.
We also maintain an Employee Stock Purchase Plan (ESPP) for our employees. Under the terms of the ESPP, employees can deduct up to 10% of their regular cash compensation to purchase our common stock at a 5% discount from the fair market value of the stock at the end of each fiscal quarter, subject to other limitations under the plan. The sale of the stock to the employees occurs at the beginning of the subsequent quarter. The ESPP is not considered compensatory, and no compensation expense is recognized for sales of our common stock to employees.
Income Taxes
We account for income taxes using the asset and liability method of accounting. Deferred tax assets and liabilities are recognized based upon anticipated future tax consequences, in each of the jurisdictions that we operate, attributable to: (1) the differences between the financial statement carrying amounts of existing assets and liabilities and their respective income tax bases; and (2) net operating loss and tax credit carryforwards. Deferred tax assets and liabilities are measured annually using enacted tax rates expected to apply to taxable income in the years in which those temporary differences are expected to be recovered or settled. The calculation of our tax liabilities involves applying complex tax regulations in different tax jurisdictions to our tax positions. The effect on deferred tax assets and liabilities of a change in tax legislation and/or rates is recognized in the period that includes the enactment date. A valuation allowance is recognized to reduce the carrying amounts of deferred tax assets if it is not more likely than not that such assets will be realized. We do not recognize tax liabilities on undistributed earnings of international subsidiaries that are permanently reinvested.
Foreign Exchange
Our consolidated financial statements are reported in U.S. dollars. Assets and liabilities of international subsidiaries with non-U.S. dollar functional currencies are translated to U.S. dollars at the exchange rates in effect on the balance sheet date, or the last business day of the period, if applicable. Revenues and expenses for each subsidiary are translated to U.S. dollars using a weighted average rate for the relevant reporting period. Translation adjustments resulting from this process are included, net of tax, in OCI. Gains and losses that arise from exchange rate fluctuations for monetary asset and liability balances that are not denominated in an entity’s functional currency are included within other income (expense), net in the Consolidated Statements of Operations. Currency gains and losses of intercompany balances deemed to be long-term in nature or designated as a hedge of the net investment in international subsidiaries are included, net of tax, in OCI. Foreign currency losses, net of hedging, of $5.1 million, $0.3 million, and $3.0 million were included in other expenses, net, for the years ended December 31, 2017, 2016 and 2015, respectively.
Fair Value Measurements
For assets and liabilities measured at fair value, the GAAP fair value hierarchy prioritizes the inputs used in different valuation methodologies, assigning the highest priority to unadjusted quoted prices for identical assets and liabilities in actively traded markets (Level 1) and the lowest priority to unobservable inputs (Level 3). Level 2 inputs consist of quoted prices for similar assets and liabilities in active markets; quoted prices for identical or similar assets and liabilities in non-active markets; and model-derived valuations in which significant inputs are corroborated by observable market data either directly or indirectly through correlation or other means. Inputs may include yield curves, volatility, credit risks, and default rates.
New Accounting Pronouncements
In May 2014, the Financial Accounting Standards Board (FASB) issued Accounting Standards Update (ASU) 2014-09, Revenue from Contracts with Customers: Topic 606 (ASU 2014-09), to supersede nearly all existing revenue recognition guidance under U.S. GAAP. The core principle of ASU 2014-09 is to recognize revenues when promised goods or services are transferred to customers in an amount that reflects the consideration that is expected to be received for those goods or services. In August 2015, the FASB issued ASU 2015-14, Revenue from Contracts with Customers: Deferral of the Effective Date, which deferred the effective date for implementation of ASU 2014-09 by one year and is now effective for annual reporting periods beginning after December 15, 2017, with early adoption permitted but not earlier than the original effective date. In March 2016, the FASB issued ASU 2016-08, Principal versus Agent Considerations (Reporting Revenue Gross versus Net) (ASU 2016-08), which clarifies the implementation guidance of principal versus agent considerations. In April 2016, the FASB issued ASU 2016-10, Identifying Performance Obligations and Licensing (ASU 2016-10), which clarifies the identification of performance obligations and licensing implementation guidance. In May 2016, the FASB issued ASU 2016-12, Narrow-Scope Improvements and Practical Expedients (ASU 2016-12), to improve guidance on assessing collectability, presentation of sales taxes, noncash consideration, and completed contracts and contract modifications at transition. The effective date and transition requirements in ASU 2016-08, ASU 2016-10, and ASU 2016-12 are the same as the effective date and transition requirements of ASU 2015-14.
The revenue guidance permits two methods of adoption: retrospectively to each prior reporting period presented (full retrospective method), or retrospectively with the cumulative effect of initially applying the guidance recognized at the date of initial application (the cumulative catch-up transition method). We adopted this standard effective January 1, 2018 using the cumulative catch-up
58
transition method. While we are finalizing the assessment of the impact of adoption, which includes additional disclosures, we currently anticipate the cumulative effect of adoption to amount to a $5 million to $15 million reduction in accumulated deficit as a result of adjustments to deferred revenue and deferred costs of revenue and the related income tax effects. The impact from adoption primarily relates to multiple element arrangements that contain software and software related elements. As we have not established VSOE of fair value for certain of our software and software related elements, we combined them as one unit of account and recognized the combined unit of account using the combined services approach. Under ASU 2014-09, these software and software related elements are generally determined to be distinct performance obligations. As such we are able to recognize revenue as we satisfy the performance obligations, either at a point in time, or over time. This impact, which may vary materially from the cumulative effect upon adoption, and the increased financial statement disclosures, are the most significant impacts the updated standard will have on our consolidated results of operations, financial position, cash flows, and related financial statement disclosures.
In July 2015, the FASB issued ASU 2015-11, Inventory (Topic 330) - Simplifying the Measurement of Inventory (ASU 2015-11). The amendments in ASU 2015-11 apply to inventory measured using first-in, first-out (FIFO) or average cost and will require entities to measure inventory at the lower of cost and net realizable value. Net realizable value is the estimated selling price in the normal course of business, minus the cost of completion, disposal and transportation. Replacement cost and net realizable value less a normal profit margin are no longer considered. We adopted this standard on January 1, 2017 and it did not materially impact our consolidated results of operations, financial position, cash flows, or related financial statement disclosures.
In February 2016, the FASB issued ASU 2016-02, Leases (Topic 842), which requires substantially all leases be recognized by lessees on their balance sheet as a right-of-use asset and corresponding lease liability, including leases currently accounted for as operating leases. The new standard also will result in enhanced quantitative and qualitative disclosures, including significant judgments made by management, to provide greater insight into the extent of revenue and expense recognized and expected to be recognized from existing leases. The standard requires modified retrospective adoption and will be effective for annual reporting periods beginning after December 15, 2018, with early adoption permitted. We are currently assessing the impact of adoption on our consolidated results of operations, financial position, cash flows, and related financial statement disclosures.
In March 2016, the FASB issued ASU 2016-09, Improvements to Employee Share-Based Payment Accounting (Topic 718) (ASU 2016-09), which simplifies several areas within Topic 718. These include income tax consequences, classification of awards as either equity or liabilities, forfeitures, and classification on the statement of cash flows. The amendments in this ASU becomes effective on a modified retrospective basis for accounting for income tax benefits recognized and forfeitures, retrospectively for accounting related to the presentation of employee taxes paid, prospectively for accounting related to recognition of excess tax benefits, and either prospectively or retrospectively for accounting related to presentation of excess employee tax benefits for annual periods, and interim periods within those annual periods, beginning after December 15, 2016.
We adopted this standard effective January 1, 2017 using a modified retrospective transition method. We recognized a $14.6 million one-time reduction in accumulated deficit and increase in deferred tax assets related to cumulative unrecognized excess tax benefits. All future excess tax benefits and tax deficiencies will be recognized prospectively as income tax provision or benefit in the Consolidated Statement of Operations, and as an operating activity on the Consolidated Statement of Cash Flows. We also recognized a $0.2 million one-time increase in accumulated deficit and common stock related to our policy election to prospectively recognize forfeitures as they occur.
In November 2016, the FASB issued ASU 2016-18, Statement of Cash Flows (Topic 230) (ASU 2016-18), which clarifies the presentation requirements of restricted cash within the statement of cash flows. The changes in restricted cash and restricted cash equivalents during the period should be included in the beginning and ending cash and cash equivalents balance reconciliation on the statement of cash flows. When cash, cash equivalents, restricted cash or restricted cash equivalents are presented in more than one line item within the statement of financial position, an entity shall calculate a total cash amount in a narrative or tabular format that agrees to the amount shown on the statement of cash flows. ASU 2016-18 is effective for fiscal years, and interim periods within those fiscal years, beginning after December 15, 2017. Early adoption is permitted, including adoption in an interim period. If adopted during an interim period, any adjustments are reflected as of the beginning of the fiscal year that includes the interim period. The amendments are applied using a retrospective transition method to each period presented.
We adopted this standard effective January 1, 2017 as a result of the private offering of the Notes, for which $310.3 million was deposited into escrow and recognized as restricted cash until the closing of the acquisition of SSNI. Given the size of the increase and length of restriction relative to period end and historical activity, management believes early adopting enhanced the consistency and comparability of financial information included in the consolidated financial statements. The impact of adoption is shown in the reconciliation of cash, cash equivalents, and restricted cash above. The impact of retrospective application of ASU 2016-18 is immaterial, as restricted cash activity for the years ended December 31, 2016 and 2015 was not significant.
59
In January 2017, the FASB issued ASU 2017-01, Clarifying the Definition of a Business (ASU 2017-01), which narrows the definition of a business and provides a framework that gives entities a basis for making reasonable judgments about whether a transaction involves an asset or a business. ASU 2017-01 states that when substantially all of the fair value of the gross assets acquired (or disposed of) is concentrated in a single identifiable asset or group of similar identifiable assets, the set is not a business. If this initial test is not met, a set cannot be considered a business unless it includes an input and a substantive process that together significantly contribute to the ability to create output. ASU 2017-01 is effective for fiscal years beginning after December 15, 2019 with early adoption permitted. We adopted this standard on January 1, 2017, and it did not materially impact our consolidated results of operations, financial position, cash flows, and related financial statement disclosures.
In January 2017, the FASB issued ASU 2017-04, Simplifying the Test for Goodwill Impairment (ASU 2017-04), which simplifies the measurement of goodwill impairment by removing step two of the goodwill impairment test that requires the determination of the fair value of individual assets and liabilities of a reporting unit. ASU 2017-04 requires goodwill impairment to be measured as the amount by which a reporting unit’s carrying value exceeds its fair value; however, the loss recognized should not exceed the total amount of goodwill allocated to that reporting unit. ASU 2017-04 is effective for fiscal years beginning after December 15, 2019 with early adoption permitted for interim or annual goodwill impairment tests performed after January 1, 2017. We adopted this standard on January 1, 2017, and it did not materially impact our consolidated results of operations, financial position, cash flows, and related financial statement disclosures.
In March 2017, the FASB issued ASU 2017-07, Improving the Presentation of Net Periodic Pension Cost and Net Periodic Postretirement Benefit Cost (ASU 2017-07), which provides additional guidance on the presentation of net benefit costs in the income statement. ASU 2017-07 requires an employer disaggregate the service cost component from the other components of net benefit cost and to disclose other components outside of a subtotal of income from operations. It also allows only the service cost component of net benefit costs to be eligible for capitalization. ASU 2017-07 is effective for fiscal years beginning after December 15, 2017 with early adoption permitted.
We adopted this standard on January 1, 2018 retrospectively for the presentation of the service cost component of net periodic pension cost in the statement of operations and prospectively, on and after the effective date, for the capitalization of the service cost component of net periodic pension cost in assets. This will result in a reclassification of an immaterial amount of net periodic pension benefit costs from operating income to interest expense for all years presented on the Consolidated Statements of Operations.
Note 2: Earnings Per Share
The following table sets forth the computation of basic and diluted earnings per share (EPS):
Year Ended December 31, | |||||||||||
2017 | 2016 | 2015 | |||||||||
(in thousands, except per share data) | |||||||||||
Net income available to common shareholders | $ | 57,298 | $ | 31,770 | $ | 12,678 | |||||
Weighted average common shares outstanding - Basic | 38,655 | 38,207 | 38,224 | ||||||||
Dilutive effect of stock-based awards | 732 | 436 | 282 | ||||||||
Weighted average common shares outstanding - Diluted | 39,387 | 38,643 | 38,506 | ||||||||
Earnings per common share - Basic | $ | 1.48 | $ | 0.83 | $ | 0.33 | |||||
Earnings per common share - Diluted | $ | 1.45 | $ | 0.82 | $ | 0.33 | |||||
Stock-based Awards
For stock-based awards, the dilutive effect is calculated using the treasury stock method. Under this method, the dilutive effect is computed as if the awards were exercised at the beginning of the period (or at time of issuance, if later) and assumes the related proceeds were used to repurchase common stock at the average market price during the period. Related proceeds include the amount the employee must pay upon exercise and future compensation cost associated with the stock award. Approximately 0.2 million, 0.7 million, and 1.2 million stock-based awards were excluded from the calculation of diluted EPS for the years ended December 31, 2017, 2016, and 2015, respectively, because they were anti-dilutive. These stock-based awards could be dilutive in future periods.
60
Note 3: Certain Balance Sheet Components
Accounts receivable, net | December 31, 2017 | December 31, 2016 | |||||
(in thousands) | |||||||
Trade receivables (net of allowance of $3,957 and $3,320) | $ | 369,047 | $ | 299,870 | |||
Unbilled receivables | 28,982 | 51,636 | |||||
Total accounts receivable, net | $ | 398,029 | $ | 351,506 | |||
Allowance for doubtful account activity | Year Ended December 31, | ||||||||||
2017 | 2016 | 2015 | |||||||||
(in thousands) | |||||||||||
Beginning balance | $ | 3,320 | $ | 5,949 | $ | 6,195 | |||||
Provision for doubtful accounts, net | 1,656 | 60 | 1,025 | ||||||||
Accounts written-off | (1,351 | ) | (2,422 | ) | (549 | ) | |||||
Effects of change in exchange rates | 332 | (267 | ) | (722 | ) | ||||||
Ending balance | $ | 3,957 | $ | 3,320 | $ | 5,949 | |||||
Inventories | December 31, 2017 | December 31, 2016 | |||||
(in thousands) | |||||||
Materials | $ | 126,656 | $ | 103,274 | |||
Work in process | 9,863 | 7,925 | |||||
Finished goods | 57,316 | 51,850 | |||||
Total inventories | $ | 193,835 | $ | 163,049 | |||
Property, plant, and equipment, net | December 31, 2017 | December 31, 2016 | |||||
(in thousands) | |||||||
Machinery and equipment | $ | 310,753 | $ | 279,746 | |||
Computers and software | 104,384 | 98,125 | |||||
Buildings, furniture, and improvements | 135,566 | 122,680 | |||||
Land | 18,433 | 17,179 | |||||
Construction in progress, including purchased equipment | 39,946 | 29,358 | |||||
Total cost | 609,082 | 547,088 | |||||
Accumulated depreciation | (408,314 | ) | (370,630 | ) | |||
Property, plant, and equipment, net | $ | 200,768 | $ | 176,458 | |||
Depreciation expense | Year Ended December 31, | ||||||||||
2017 | 2016 | 2015 | |||||||||
(in thousands) | |||||||||||
Depreciation expense | $ | 42,430 | $ | 43,206 | $ | 44,320 | |||||
Note 4: Intangible Assets
The gross carrying amount and accumulated amortization of our intangible assets, other than goodwill, are as follows:
December 31, 2017 | December 31, 2016 | ||||||||||||||||||||||
Gross Assets | Accumulated Amortization | Net | Gross Assets | Accumulated Amortization | Net | ||||||||||||||||||
(in thousands) | |||||||||||||||||||||||
Core-developed technology | $ | 429,548 | $ | (399,969 | ) | $ | 29,579 | $ | 372,568 | $ | (354,878 | ) | $ | 17,690 | |||||||||
Customer contracts and relationships | 258,586 | (197,582 | ) | 61,004 | 224,467 | (170,056 | ) | 54,411 | |||||||||||||||
Trademarks and trade names | 70,056 | (66,004 | ) | 4,052 | 61,785 | (61,766 | ) | 19 | |||||||||||||||
Other | 11,661 | (11,068 | ) | 593 | 11,076 | (11,045 | ) | 31 | |||||||||||||||
Total intangible assets | $ | 769,851 | $ | (674,623 | ) | $ | 95,228 | $ | 669,896 | $ | (597,745 | ) | $ | 72,151 | |||||||||
61
A summary of the intangible asset account activity is as follows:
Year Ended December 31, | |||||||
2017 | 2016 | ||||||
(in thousands) | |||||||
Beginning balance, intangible assets, gross | $ | 669,896 | $ | 702,507 | |||
Intangible assets acquired | 36,500 | — | |||||
Effect of change in exchange rates | 63,455 | (32,611 | ) | ||||
Ending balance, intangible assets, gross | $ | 769,851 | $ | 669,896 | |||
A summary of intangible asset amortization expense is as follows:
Year Ended December 31, | |||||||||||
2017 | 2016 | 2015 | |||||||||
(in thousands) | |||||||||||
Amortization expense | $ | 20,785 | $ | 25,112 | $ | 31,673 | |||||
Estimated future annual amortization expense is as follows:
Year Ending December 31, | Estimated Annual Amortization | |||
(in thousands) | ||||
2018 | $ | 19,380 | ||
2019 | 16,553 | |||
2020 | 14,208 | |||
2021 | 12,162 | |||
2022 | 9,961 | |||
Beyond 2022 | 22,964 | |||
Total intangible assets subject to amortization | $ | 95,228 | ||
62
Note 5: Goodwill
The following table reflects goodwill allocated to each reporting segment at December 31, 2017 and 2016:
Electricity | Gas | Water | Total Company | ||||||||||||
(in thousands) | |||||||||||||||
Goodwill balance at January 1, 2016 | |||||||||||||||
Goodwill before impairment | $ | 414,910 | $ | 331,436 | $ | 350,314 | $ | 1,096,660 | |||||||
Accumulated impairment losses | (362,177 | ) | — | (266,361 | ) | (628,538 | ) | ||||||||
Goodwill, net | 52,733 | 331,436 | 83,953 | 468,122 | |||||||||||
Effect of change in exchange rates | (1,360 | ) | (11,523 | ) | (2,745 | ) | (15,628 | ) | |||||||
Goodwill balance at December 31, 2016 | |||||||||||||||
Goodwill before impairment | 400,299 | 319,913 | 334,505 | 1,054,717 | |||||||||||
Accumulated impairment losses | (348,926 | ) | — | (253,297 | ) | (602,223 | ) | ||||||||
Goodwill, net | 51,373 | 319,913 | 81,208 | 452,494 | |||||||||||
Goodwill acquired | 59,675 | — | — | 59,675 | |||||||||||
Effect of change in exchange rates | 3,193 | 32,790 | 7,610 | 43,593 | |||||||||||
Goodwill balance at December 31, 2017 | |||||||||||||||
Goodwill before impairment | 500,625 | 352,703 | 378,901 | 1,232,229 | |||||||||||
Accumulated impairment losses | (386,384 | ) | — | (290,083 | ) | (676,467 | ) | ||||||||
Goodwill, net | $ | 114,241 | $ | 352,703 | $ | 88,818 | $ | 555,762 | |||||||
During our 2017 annual goodwill impairment test, performed as of October 1, 2017, we performed a qualitative assessment and determined it is not more likely than not that the fair value of our reporting units is less than their carrying amounts.
Note 6: Debt
The components of our borrowings are as follows:
December 31, 2017 | December 31, 2016 | ||||||
(in thousands) | |||||||
Credit Facilities | |||||||
USD denominated term loan | $ | 194,063 | $ | 208,125 | |||
Multicurrency revolving line of credit | 125,414 | 97,167 | |||||
Senior notes | 300,000 | — | |||||
Total debt | 619,477 | 305,292 | |||||
Less: current portion of debt | 19,688 | 14,063 | |||||
Less: unamortized prepaid debt fees - term loan | 629 | 769 | |||||
Less: unamortized prepaid debt fees - senior notes | 5,588 | — | |||||
Long-term debt | $ | 593,572 | $ | 290,460 | |||
Credit Facilities
On June 23, 2015, we entered into an amended and restated credit agreement providing for committed credit facilities in the amount of $725 million U.S. dollars (the 2015 credit facility). The 2015 credit facility consists of a $225 million U.S. dollar term loan (the term loan) and a multicurrency revolving line of credit (the revolver) with a principal amount of up to $500 million. The revolver also contains a $250 million standby letter of credit sub-facility and a $50 million swingline sub-facility (available for immediate cash needs at a higher interest rate). Both the term loan and the revolver mature on June 23, 2020, and amounts borrowed under the revolver are classified as long-term and, during the credit facility term, may be repaid and reborrowed until the revolver's maturity, at which time the revolver will terminate, and all outstanding loans, together with all accrued and unpaid interest, must be repaid. Amounts not borrowed under the revolver are subject to a commitment fee, which is paid in arrears on the last day of each fiscal quarter, ranging from 0.18% to 0.30% per annum depending on our total leverage ratio as of the most recently ended fiscal quarter. Amounts repaid on the term loan may not be reborrowed. The 2015 credit facility permits us and certain of our foreign subsidiaries to borrow in U.S. dollars, euros, British pounds, or, with lender approval, other currencies readily convertible
63
into U.S. dollars. All obligations under the 2015 credit facility are guaranteed by Itron, Inc. and material U.S. domestic subsidiaries and are secured by a pledge of substantially all of the assets of Itron, Inc. and material U.S. domestic subsidiaries, including a pledge of 100% of the capital stock of material U.S. domestic subsidiaries and up to 66% of the voting stock (100% of the non-voting stock) of their first-tier foreign subsidiaries. In addition, the obligations of any foreign subsidiary who is a foreign borrower, as defined by the 2015 credit facility, are guaranteed by the foreign subsidiary and by its direct and indirect foreign parents. The 2015 credit facility includes debt covenants, which contain certain financial thresholds and place certain restrictions on the incurrence of debt, investments, and the issuance of dividends. We were in compliance with the debt covenants under the 2015 credit facility at December 31, 2017.
On June 13, 2016, we entered into an amendment to the 2015 credit facility, which reduced our $300 million standby letter of credit sub-facility to $250 million.
Scheduled principal repayments for the term loan are due quarterly in the amount of $4.2 million through June 2018, $5.6 million from September 2018 through March 2020, and the remainder due at maturity on June 23, 2020. The term loan may be repaid early in whole or in part, subject to certain minimum thresholds, without penalty.
Required minimum principal payments on our outstanding credit facilities are as follows:
Year Ending December 31, | Minimum Payments | |||
(in thousands) | ||||
2018 | $ | 19,688 | ||
2019 | 22,500 | |||
2020 | 277,289 | |||
2021 | — | |||
2022 | — | |||
Total minimum payments on debt | $ | 319,477 | ||
Under the 2015 credit facility, we elect applicable market interest rates for both the term loan and any outstanding revolving loans. We also pay an applicable margin, which is based on our total leverage ratio (as defined in the credit agreement). The applicable rates per annum may be based on either: (1) the LIBOR rate or EURIBOR rate (floor of 0%), plus an applicable margin, or (2) the Alternate Base Rate, plus an applicable margin. The Alternate Base Rate election is equal to the greatest of three rates: (i) the prime rate, (ii) the Federal Reserve effective rate plus 1/2 of 1%, or (iii) one month LIBOR plus 1%. At December 31, 2017 and 2016,
the interest rates for both the term loan and the USD revolver was 2.82% and 2.02%, which includes the LIBOR rate plus a margin of 1.25% and 1.25%, respectively. At December 31, 2017 and 2016, the interest rates for the EUR revolver was 1.25% and 1.25%, which includes the EURIBOR floor rate plus a margin of 1.25% and 1.25%, respectively.
Total credit facility repayments were as follows:
Year Ended December 31, | |||||||||||
2017 | 2016 | 2015 | |||||||||
(in thousands) | |||||||||||
Term loan | $ | 14,063 | $ | 11,250 | $ | 13,125 | |||||
Multicurrency revolving line of credit | 15,000 | 67,869 | 49,873 | ||||||||
Total credit facility repayments | $ | 29,063 | $ | 79,119 | $ | 62,998 | |||||
At December 31, 2017, $125.4 million was outstanding under the 2015 credit facility revolver, and $31.9 million was utilized by outstanding standby letters of credit, resulting in $342.7 million available for additional borrowings or standby letters of credit. At December 31, 2017, $218.1 million was available for additional standby letters of credit under the letter of credit sub-facility and no amounts were outstanding under the swingline sub-facility.
Debt Refinancing
On January 5, 2018, we entered into a credit agreement (the 2018 credit facility) which amended and restated the 2015 credit facility in its entirety. The 2018 credit facility provides for a $650 million term loan and a $500 million revolving credit facility, including a $300 million letter of credit sub-facility and $50 million swingline loan sub-facility. Both the term loan and the revolver mature on January 5, 2023, and amounts borrowed under the revolver may be repaid and reborrowed until the revolver's maturity, at which time the revolver will terminate, and all outstanding loans, together with all accrued and unpaid interest, must be repaid. For additional details see Note 19: Subsequent Events.
64
Senior Notes
On December 22, 2017, we issued $300 million aggregate principal amount of 5.00% senior notes due 2026 (Notes). The December Notes were issued pursuant to an indenture, dated as of December 22, 2017 (Indenture), among Itron, the guarantors from time to time party thereto and U.S. Bank National Association, as trustee. Interest on the Notes will accrue at 5% per annum and will be payable semi-annually in arrears on January 15 and July 15 commencing on July 15, 2018. The Notes will be jointly and severally guaranteed by each of our subsidiaries that guarantees obligations under our senior credit facilities. The Notes were not guaranteed until the release of the escrow, but once released, the Notes were fully and unconditionally guaranteed, jointly and severally, on a senior unsecured basis by each of our subsidiaries that guarantee the senior credit facilities.
The Notes will mature on January 15, 2026. However, prior to January 15, 2021, we may redeem some or all of the Notes at a redemption price equal to 100% of the principal amount of the Notes, together with accrued and unpaid interest, if any, plus a “make- whole” premium. On or after January 15, 2021, we may redeem some or all of the Notes at any time at declining redemption prices equal to 102.50% beginning on January 15, 2021, 101.25% beginning on January 15, 2022 and 100.00% beginning on January 15, 2023 and thereafter, plus, in each case, accrued and unpaid interest, if any, to the applicable redemption date. In addition, before January 15, 2021, and subject to certain conditions, we may redeem up to 35% of the aggregate principal amount of Notes with the net proceeds of certain equity offerings at 105.00% of the principal amount thereof, plus accrued and unpaid interest, if any, to the date of redemption; provided that (i) at least 65% of the aggregate principal amount of Notes remains outstanding after such redemption and (ii) the redemption occurs within 60 days of the closing of any such equity offering.
Note 7: Derivative Financial Instruments
As part of our risk management strategy, we use derivative instruments to hedge certain foreign currency and interest rate exposures. Refer to Note 1, Note 14, and Note 15 for additional disclosures on our derivative instruments.
The fair values of our derivative instruments are determined using the income approach and significant other observable inputs (also known as “Level 2”). We have used observable market inputs based on the type of derivative and the nature of the underlying instrument. The key inputs include interest rate yield curves (swap rates and futures) and foreign exchange spot and forward rates, all of which are available in an active market. We have utilized the mid-market pricing convention for these inputs. We include, as a discount to the derivative asset, the effect of our counterparty credit risk based on current published credit default swap rates when the net fair value of our derivative instruments is in a net asset position. We consider our own nonperformance risk when the net fair value of our derivative instruments is in a net liability position by discounting our derivative liabilities to reflect the potential credit risk to our counterparty through applying a current market indicative credit spread to all cash flows.
The fair values of our derivative instruments are as follows:
Fair Value | ||||||||||
Balance Sheet Location | December 31, 2017 | December 31, 2016 | ||||||||
(in thousands) | ||||||||||
Asset Derivatives | ||||||||||
Derivatives designated as hedging instruments under ASC 815-20 | ||||||||||
Interest rate swap contracts | Other current assets | $ | 658 | $ | — | |||||
Interest rate cap contracts | Other current assets | 17 | 3 | |||||||
Interest rate swap contracts | Other long-term assets | 1,712 | 1,830 | |||||||
Interest rate cap contracts | Other long-term assets | 179 | 376 | |||||||
Derivatives not designated as hedging instruments under ASC 815-20 | ||||||||||
Foreign exchange forward contracts | Other current assets | 41 | 169 | |||||||
Interest rate cap contracts | Other current assets | 25 | 4 | |||||||
Interest rate cap contracts | Other long-term assets | 268 | 563 | |||||||
Total asset derivatives | $ | 2,900 | $ | 2,945 | ||||||
Liability Derivatives | ||||||||||
Derivatives designated as hedging instruments under ASC 815-20 | ||||||||||
Interest rate swap contracts | Other current liabilities | $ | — | $ | 934 | |||||
Derivatives not designated as hedging instruments under ASC 815-20 | ||||||||||
Foreign exchange forward contracts | Other current liabilities | 289 | 449 | |||||||
Total liability derivatives | $ | 289 | $ | 1,383 | ||||||
65
OCI during the reporting period for our derivative and nonderivative instruments designated as hedging instruments, net of tax, was as follows:
2017 | 2016 | 2015 | |||||||||
(in thousands) | |||||||||||
Net unrealized gain (loss) on hedging instruments at January 1, | $ | (14,337 | ) | $ | (14,062 | ) | $ | (15,148 | ) | ||
Unrealized gain (loss) on derivative instruments | 360 | (1,087 | ) | 76 | |||||||
Realized (gains) losses reclassified into net income (loss) | 563 | 812 | 1,010 | ||||||||
Net unrealized gain (loss) on hedging instruments at December 31, | $ | (13,414 | ) | $ | (14,337 | ) | $ | (14,062 | ) | ||
Reclassification of amounts related to hedging instruments are included in interest expense in the Consolidated Statements of Operations. Included in the net unrealized loss on hedging instruments at December 31, 2017 and 2016 is a loss of $14.4 million, net of tax, related to our nonderivative net investment hedge, which terminated in 2011. This loss on our net investment hedge will remain in AOCI until such time when earnings are impacted by a sale or liquidation of the associated foreign operation.
A summary of the potential effect of netting arrangements on our financial position related to the offsetting of our recognized derivative assets and liabilities under master netting arrangements or similar agreements is as follows:
Offsetting of Derivative Assets | |||||||||||||||
Gross Amounts Not Offset in the Consolidated Balance Sheets | |||||||||||||||
Gross Amounts of Recognized Assets Presented in the Consolidated Balance Sheets | Derivative Financial Instruments | Cash Collateral Received | Net Amount | ||||||||||||
(in thousands) | |||||||||||||||
December 31, 2017 | $ | 2,900 | $ | (90 | ) | $ | — | $ | 2,810 | ||||||
December 31, 2016 | $ | 2,945 | $ | (1,322 | ) | $ | — | $ | 1,623 | ||||||
Offsetting of Derivative Liabilities | |||||||||||||||
Gross Amounts Not Offset in the Consolidated Balance Sheets | |||||||||||||||
Gross Amounts of Recognized Liabilities Presented in the Consolidated Balance Sheets | Derivative Financial Instruments | Cash Collateral Pledged | Net Amount | ||||||||||||
(in thousands) | |||||||||||||||
December 31, 2017 | $ | 289 | $ | (90 | ) | $ | — | $ | 199 | ||||||
December 31, 2016 | $ | 1,383 | $ | (1,322 | ) | $ | — | $ | 61 | ||||||
Our derivative assets and liabilities subject to netting arrangements consist of foreign exchange forward and interest rate contracts with three counterparties at December 31, 2017 and three counterparties at December 31, 2016. No derivative asset or liability balance with any of our counterparties was individually significant at December 31, 2017 or 2016. Our derivative contracts with each of these counterparties exist under agreements that provide for the net settlement of all contracts through a single payment in a single currency in the event of default. We have no pledges of cash collateral against our obligations nor have we received pledges of cash collateral from our counterparties under the associated derivative contracts.
Cash Flow Hedges
As a result of our floating rate debt, we are exposed to variability in our cash flows from changes in the applicable interest rate index. We enter into swaps to achieve a fixed rate of interest on the hedged portion of debt in order to decrease this variability in our cash flows. The objective of these swaps is to reduce the variability of cash flows from increases in the LIBOR-based borrowing rates on our floating rate credit facility. The swaps do not protect us from changes to the applicable margin under our credit facility.
66
In May 2012, we entered into six interest rate swaps, which were effective July 31, 2013 and expired on August 8, 2016, to convert $200 million of our LIBOR based debt from a floating LIBOR interest rate to a fixed interest rate of 1.00% (excluding the applicable margin on the debt). The cash flow hedges were expected to be highly effective in achieving offsetting cash flows attributable to the hedged risk through the term of the hedge. Consequently, effective changes in the fair value of the interest rate swaps were recognized as a component of OCI and recognized in earnings when the hedged item affected earnings. The amounts paid on the hedges were recognized as adjustments to interest expense.
In October 2015, we entered into an interest rate swap, which is effective from August 31, 2016 to June 23, 2020, and converts $214 million of our LIBOR based debt from a floating LIBOR interest rate to a fixed interest rate of 1.42% (excluding the applicable margin on the debt). The notional balance will amortize to maturity at the same rate as required minimum payments on our term loan. The cash flow hedge is expected to be highly effective in achieving offsetting cash flows attributable to the hedged risk through the term of the hedge. Consequently, effective changes in the fair value of the interest rate swap is recognized as a component of OCI and will be recognized in earnings when the hedged item affects earnings. The amounts paid or received on the hedge are recognized as an adjustment to interest expense. The amount of net losses expected to be reclassified into earnings in the next 12 months is $0.7 million. At December 31, 2017, our LIBOR-based debt balance was $254.1 million.
In November 2015, we entered into three interest rate cap contracts with a total notional amount of $100 million at a cost of $1.7 million. The interest rate cap contracts expire on June 23, 2020 and were entered into in order to limit our interest rate exposure on $100 million of our variable LIBOR based debt up to 2.00%. In the event LIBOR is higher than 2.00%, we will pay interest at the capped rate of 2.00% with respect to the $100 million notional amount of such agreements. The interest rate cap contracts do not include the effect of the applicable margin. As of December 31, 2016, due to the accelerated revolver payments from surplus cash, we have elected to de-designate two of the interest rate cap contracts as cash flow hedges and discontinue the use of cash flow hedge accounting. The amounts recognized in AOCI from de-designated interest rate cap contracts will continue to be reported in AOCI unless it is not probable that the forecasted transactions will occur. As a result of the discontinuance of cash flow hedge accounting, all subsequent changes in fair value of the de-designated derivative instruments are recognized within interest expense instead of OCI. The amount of net losses expected to be reclassified into earnings for all interest rate cap contracts in the next 12 months is $0.3 million.
The before-tax effects of our derivative instruments designated as hedges on the Consolidated Balance Sheets and the Consolidated Statements of Operations were as follows:
Derivatives in ASC 815-20 Cash Flow Hedging Relationships | Amount of Gain (Loss) Recognized in OCI on Derivative (Effective Portion) | Loss Reclassified from AOCI into Income (Effective Portion) | Loss Recognized in Income on Derivative (Ineffective Portion) | |||||||||||||||||||||||||||||||||||||
Location | Amount | Location | Amount | |||||||||||||||||||||||||||||||||||||
2017 | 2016 | 2015 | 2017 | 2016 | 2015 | 2017 | 2016 | 2015 | ||||||||||||||||||||||||||||||||
(in thousands) | (in thousands) | (in thousands) | ||||||||||||||||||||||||||||||||||||||
Interest rate swap contracts | $ | 768 | $ | (1,163 | ) | $ | 367 | Interest expense | $ | (706 | ) | $ | (1,296 | ) | $ | (1,639 | ) | Interest expense | $ | — | $ | — | $ | — | ||||||||||||||||
Interest rate cap contracts | $ | (183 | ) | $ | (605 | ) | $ | (244 | ) | Interest expense | $ | (210 | ) | $ | (27 | ) | $ | — | Interest expense | $ | — | $ | (1 | ) | $ | — | ||||||||||||||
Derivatives Not Designated as Hedging Relationships
We are also exposed to foreign exchange risk when we enter into non-functional currency transactions, both intercompany and third-party. At each period-end, non-functional currency monetary assets and liabilities are revalued with the change recognized to other income and expense. We enter into monthly foreign exchange forward contracts, which are not designated for hedge accounting, with the intent to reduce earnings volatility associated with currency exposures. As of December 31, 2017, a total of 54 contracts were offsetting our exposures from the euro, Canadian dollar, Indonesian Rupiah, Chinese Yuan, Saudi Riyal and various other currencies, with notional amounts ranging from $158,000 to $39.5 million.
67
The effect of our derivative instruments not designated as hedges on the Consolidated Statements of Operations was as follows:
Derivatives Not Designated as Hedging Instrument under ASC 815-20 | Location | Gain (Loss) Recognized in Income on Derivative | ||||||||||||
2017 | 2016 | 2015 | ||||||||||||
(in thousands) | ||||||||||||||
Foreign exchange forward contracts | Other income (expense), net | $ | (6,281 | ) | $ | 537 | $ | (3,145 | ) | |||||
Interest rate cap contracts | Interest expense | $ | (274 | ) | $ | 129 | $ | — | ||||||
We will continue to monitor and assess our interest rate and foreign exchange risk and may institute additional derivative instruments to manage such risk in the future.
Note 8: Defined Benefit Pension Plans
We sponsor both funded and unfunded defined benefit pension plans offering death and disability, retirement, and special termination benefits for our international employees, primarily in Germany, France, Italy, Indonesia, Brazil, and Spain. The defined benefit obligation is calculated annually by using the projected unit credit method. The measurement date for the pension plans was December 31, 2017.
The following tables set forth the components of the changes in benefit obligations and fair value of plan assets:
Year Ended December 31, | |||||||
2017 | 2016 | ||||||
(in thousands) | |||||||
Change in benefit obligation: | |||||||
Benefit obligation at January 1, | $ | 97,261 | $ | 98,767 | |||
Service cost | 3,968 | 3,472 | |||||
Interest cost | 2,264 | 2,573 | |||||
Actuarial (gain) loss | (2,351 | ) | 7,733 | ||||
Benefits paid | (3,136 | ) | (9,481 | ) | |||
Foreign currency exchange rate changes | 13,014 | (4,386 | ) | ||||
Curtailment | (858 | ) | 14 | ||||
Settlement | (175 | ) | (1,431 | ) | |||
Other | 833 | — | |||||
Benefit obligation at December 31, | $ | 110,820 | $ | 97,261 | |||
Change in plan assets: | |||||||
Fair value of plan assets at January 1, | $ | 10,215 | $ | 9,662 | |||
Actual return on plan assets | 786 | 604 | |||||
Company contributions | 399 | 348 | |||||
Benefits paid | (383 | ) | (370 | ) | |||
Foreign currency exchange rate changes | 984 | (29 | ) | ||||
Other | 833 | — | |||||
Fair value of plan assets at December 31, | 12,834 | 10,215 | |||||
Net pension benefit obligation at fair value | $ | 97,986 | $ | 87,046 | |||
68
Amounts recognized on the Consolidated Balance Sheets consist of:
At December 31, | |||||||
2017 | 2016 | ||||||
(in thousands) | |||||||
Assets | |||||||
Plan assets in other long-term assets | $ | 991 | $ | 654 | |||
Liabilities | |||||||
Current portion of pension benefit obligation in wages and benefits payable | 3,260 | 3,202 | |||||
Long-term portion of pension benefit obligation | 95,717 | 84,498 | |||||
Pension benefit obligation, net | $ | 97,986 | $ | 87,046 | |||
Amounts in AOCI (pre-tax) that have not yet been recognized as components of net periodic benefit costs consist of:
At December 31, | |||||||
2017 | 2016 | ||||||
(in thousands) | |||||||
Net actuarial loss | $ | 25,379 | $ | 26,767 | |||
Net prior service cost | 641 | 619 | |||||
Amount included in AOCI | $ | 26,020 | $ | 27,386 | |||
Amounts recognized in OCI (pre-tax) are as follows:
Year Ended December 31, | |||||||||||
2017 | 2016 | 2015 | |||||||||
(in thousands) | |||||||||||
Net actuarial (gain) loss | $ | (3,209 | ) | $ | 6,316 | $ | (6,894 | ) | |||
Settlement (gain) loss | 2 | (1,343 | ) | (336 | ) | ||||||
Curtailment (gain) loss | 586 | — | — | ||||||||
Plan asset (gain) loss | (192 | ) | (64 | ) | 343 | ||||||
Amortization of net actuarial loss | (2,308 | ) | (1,351 | ) | (1,979 | ) | |||||
Amortization of prior service cost | (62 | ) | (58 | ) | (59 | ) | |||||
Other | — | 4 | (46 | ) | |||||||
Other comprehensive (income) loss | $ | (5,183 | ) | $ | 3,504 | $ | (8,971 | ) | |||
If actuarial gains and losses exceed ten percent of the greater of plan assets or plan liabilities, we amortize them over the employees' average future service period. The estimated net actuarial loss and prior service cost that will be amortized from AOCI into net periodic benefit cost during 2018 is $1.6 million.
Net periodic pension benefit costs for our plans include the following components:
Year Ended December 31, | |||||||||||
2017 | 2016 | 2015 | |||||||||
(in thousands) | |||||||||||
Service cost | $ | 3,968 | $ | 3,472 | $ | 4,572 | |||||
Interest cost | 2,264 | 2,573 | 2,380 | ||||||||
Expected return on plan assets | (594 | ) | (540 | ) | (502 | ) | |||||
Amortization of prior service costs | 62 | 58 | 59 | ||||||||
Amortization of actuarial net loss | 2,308 | 1,351 | 1,979 | ||||||||
Settlement | (2 | ) | 1,343 | 375 | |||||||
Curtailment | (586 | ) | — | 46 | |||||||
Other | — | (3 | ) | (1 | ) | ||||||
Net periodic pension benefit costs | $ | 7,420 | $ | 8,254 | $ | 8,908 | |||||
69
The significant actuarial weighted average assumptions used in determining the benefit obligations and net periodic benefit cost for our benefit plans are as follows:
At and For The Year Ended December 31, | ||||||||
2017 | 2016 | 2015 | ||||||
Actuarial assumptions used to determine benefit obligations at end of period: | ||||||||
Discount rate | 2.21 | % | 2.18 | % | 2.59 | % | ||
Expected annual rate of compensation increase | 3.64 | % | 3.65 | % | 3.60 | % | ||
Actuarial assumptions used to determine net periodic benefit cost for the period: | ||||||||
Discount rate | 2.18 | % | 2.59 | % | 2.36 | % | ||
Expected rate of return on plan assets | 5.58 | % | 5.29 | % | 5.45 | % | ||
Expected annual rate of compensation increase | 3.65 | % | 3.60 | % | 3.37 | % | ||
We determine a discount rate for our plans based on the estimated duration of each plan’s liabilities. For our euro denominated defined benefit pension plans, which represent 93% of our benefit obligation, we use two discount rates with consideration of the duration of the plans, using a hypothetical yield curve developed from euro-denominated AA-rated corporate bond issues. These bond issues are partially weighted for market value, with minimum amounts outstanding of €500 million for bonds with less than 10 years to maturity and €50 million for bonds with 10 or more years to maturity, and excluding the highest and lowest yielding 10% of bonds within each maturity group. The discount rates used, depending on the duration of the plans, were 1.00% and 1.75%.
Our expected rate of return on plan assets is derived from a study of actual historic returns achieved and anticipated future long-term performance of plan assets, specific to plan investment asset category. While the study primarily gives consideration to recent insurers’ performance and historical returns, the assumption represents a long-term prospective return.
The total accumulated benefit obligation for our defined benefit pension plans was $101.4 million and $87.2 million at December 31, 2017 and 2016, respectively.
The total obligations and fair value of plan assets for plans with projected benefit obligations and accumulated benefit obligations exceeding the fair value of plan assets are as follows:
At December 31, | |||||||
2017 | 2016 | ||||||
(in thousands) | |||||||
Projected benefit obligation | $ | 106,486 | $ | 94,110 | |||
Accumulated benefit obligation | 97,546 | 84,448 | |||||
Fair value of plan assets | 7,509 | 6,410 | |||||
Our asset investment strategy focuses on maintaining a portfolio using primarily insurance funds, which are accounted for as investments and measured at fair value, in order to achieve our long-term investment objectives on a risk adjusted basis. Our general funding policy for these qualified pension plans is to contribute amounts sufficient to satisfy regulatory funding standards of the respective countries for each plan.
70
The fair values of our plan investments by asset category are as follows:
Total | Quoted Prices in Active Markets for Identical Assets (Level 1) | Significant Unobservable Inputs (Level 3) | |||||||||
(in thousands) | |||||||||||
December 31, 2017 | |||||||||||
Cash | $ | 789 | $ | 789 | $ | — | |||||
Insurance funds | 8,384 | — | 8,384 | ||||||||
Other securities | 3,661 | — | 3,661 | ||||||||
Total fair value of plan assets | $ | 12,834 | $ | 789 | $ | 12,045 | |||||
December 31, 2016 | |||||||||||
Cash | $ | 783 | $ | 783 | $ | — | |||||
Insurance funds | 7,011 | — | 7,011 | ||||||||
Other securities | 2,421 | — | 2,421 | ||||||||
Total fair value of plan assets | $ | 10,215 | $ | 783 | $ | 9,432 | |||||
The following tables present a reconciliation of Level 3 assets held during the years ended December 31, 2017 and 2016.
Balance at January 1, 2017 | Net Realized and Unrealized Gains | Net Purchases, Issuances, Settlements, and Other | Net Transfers Into Level 3 | Effect of Foreign Currency | Balance at December 31, 2017 | ||||||||||||||||||
(in thousands) | |||||||||||||||||||||||
Insurance funds | $ | 7,011 | $ | 257 | $ | 102 | $ | — | $ | 1,014 | $ | 8,384 | |||||||||||
Other securities | 2,421 | 523 | (93 | ) | 833 | (23 | ) | 3,661 | |||||||||||||||
Total | $ | 9,432 | $ | 780 | $ | 9 | $ | 833 | $ | 991 | $ | 12,045 | |||||||||||
Balance at January 1, 2016 | Net Realized and Unrealized Gains | Net Purchases, Issuances, Settlements, and Other | Net Transfers Into Level 3 | Effect of Foreign Currency | Balance at December 31, 2016 | ||||||||||||||||||
(in thousands) | |||||||||||||||||||||||
Insurance funds | $ | 7,089 | $ | 235 | $ | 54 | $ | — | $ | (367 | ) | $ | 7,011 | ||||||||||
Other securities | 1,778 | 405 | (84 | ) | — | 322 | 2,421 | ||||||||||||||||
Total | $ | 8,867 | $ | 640 | $ | (30 | ) | $ | — | $ | (45 | ) | $ | 9,432 | |||||||||
As the plan assets and contributions are not significant to our total company assets, no further disclosures are considered material.
Annual benefit payments for the next 10 years, including amounts to be paid from our assets for unfunded plans and reflecting expected future service, as appropriate, are expected to be paid as follows:
Year Ending December 31, | Estimated Annual Benefit Payments | ||||
(in thousands) | |||||
2018 | $ | 3,801 | |||
2019 | 3,124 | ||||
2020 | 3,744 | ||||
2021 | 4,329 | ||||
2022 | 4,511 | ||||
2023-2027 | 28,121 | ||||
71
Note 9: Stock-Based Compensation
We maintain the Second Amended and Restated 2010 Stock Incentive Plan (Stock Incentive Plan), which allows us to grant stock-based compensation awards, including stock options, restricted stock units, phantom stock, and unrestricted stock units. Under the Stock Incentive Plan, we have 10,473,956 shares of common stock reserved and authorized for issuance subject to stock splits, dividends, and other similar events. At December 31, 2017, 4,656,327 shares were available for grant under the Stock Incentive Plan. We issue new shares of common stock upon the exercise of stock options or when vesting conditions on restricted stock units are fully satisfied. These shares are subject to a fungible share provision such that the authorized share reserve is reduced by (i) one share for every one share subject to a stock option or share appreciation right granted under the Plan and (ii) 1.7 shares for every one share of common stock that was subject to an award other than an option or share appreciation right.
We also periodically award phantom stock units, which are settled in cash upon vesting and accounted for as liability-based awards with no impact to the shares available for grant.
In addition, we maintain the ESPP, for which approximately 340,000 shares of common stock were available for future issuance at December 31, 2017.
Unrestricted stock and ESPP activity for the years ended December 31, 2017, 2016, and 2015 was not significant.
Stock-Based Compensation Expense
Total stock-based compensation expense and the related tax benefit were as follows:
2017 | 2016 | 2015 | |||||||||
(in thousands) | |||||||||||
Stock options | $ | 2,695 | $ | 2,357 | $ | 2,648 | |||||
Restricted stock units | 17,738 | 14,723 | 10,735 | ||||||||
Unrestricted stock awards | 974 | 955 | 706 | ||||||||
Phantom stock units | 1,747 | 1,077 | — | ||||||||
Total stock-based compensation | $ | 23,154 | $ | 19,112 | $ | 14,089 | |||||
Related tax benefit | $ | 5,034 | $ | 4,927 | $ | 4,228 | |||||
72
Stock Options
A summary of our stock option activity is as follows:
Shares | Weighted Average Exercise Price per Share | Weighted Average Remaining Contractual Life | Aggregate Intrinsic Value | Weighted Average Grant Date Fair Value | ||||||||||||
(in thousands) | (years) | (in thousands) | ||||||||||||||
Outstanding, January 1, 2015 | 1,123 | $ | 51.90 | 4.4 | $ | 1,676 | ||||||||||
Granted | 291 | 35.25 | $ | 12.09 | ||||||||||||
Exercised | (24 | ) | 36.05 | 26 | ||||||||||||
Forfeited | (17 | ) | 37.47 | |||||||||||||
Expired | (193 | ) | 52.17 | |||||||||||||
Outstanding, December 31, 2015 | 1,180 | $ | 48.31 | 5.7 | $ | 405 | ||||||||||
Granted | 191 | $ | 40.40 | $ | 13.27 | |||||||||||
Exercised | (58 | ) | 37.00 | $ | 742 | |||||||||||
Forfeited | (36 | ) | 35.29 | |||||||||||||
Expired | (318 | ) | 55.13 | |||||||||||||
Outstanding, December 31, 2016 | 959 | $ | 45.64 | 6.6 | $ | 19,125 | ||||||||||
Granted | 135 | $ | 65.94 | $ | 21.99 | |||||||||||
Exercised | (41 | ) | 39.92 | $ | 1,071 | |||||||||||
Forfeited | (35 | ) | 47.38 | |||||||||||||
Expired | (62 | ) | 70.12 | |||||||||||||
Outstanding, December 31, 2017 | 956 | $ | 47.10 | 6.3 | $ | 21,965 | ||||||||||
Exercisable, December 31, 2017 | 640 | $ | 46.08 | 5.3 | $ | 15,934 | ||||||||||
Expected to vest, December 31, 2017 | 316 | $ | 49.17 | 8.4 | $ | 6,031 | ||||||||||
At December 31, 2017, total unrecognized stock-based compensation expense related to nonvested stock options was $2.9 million, which is expected to be recognized over a weighted average period of approximately 1.5 years.
The weighted-average assumptions used to estimate the fair value of stock options granted and the resulting weighted average fair value are as follows:
Year Ended December 31, | ||||||||
2017 | 2016 | 2015 | ||||||
Expected volatility | 32.5 | % | 33.5 | % | 34.3 | % | ||
Risk-free interest rate | 2.0 | % | 1.3 | % | 1.7 | % | ||
Expected term (years) | 5.5 | 5.5 | 5.5 | |||||
73
Restricted Stock Units
The following table summarizes restricted stock unit activity:
Number of Restricted Stock Units | Weighted Average Grant Date Fair Value | Aggregate Intrinsic Value | ||||||||
(in thousands) | (in thousands) | |||||||||
Outstanding, January 1, 2015 | 682 | |||||||||
Granted | 434 | $ | 35.09 | |||||||
Released | (296 | ) | $ | 12,204 | ||||||
Forfeited | (64 | ) | ||||||||
Outstanding, December 31, 2015 | 756 | |||||||||
Granted | 306 | $ | 41.58 | |||||||
Released | (312 | ) | $ | 11,944 | ||||||
Forfeited | (49 | ) | ||||||||
Outstanding, December 31, 2016 | 701 | $ | 38.04 | |||||||
Granted | 273 | $ | 50.95 | |||||||
Released | (372 | ) | 36.93 | $ | 14,219 | |||||
Forfeited | (46 | ) | 48.56 | |||||||
Outstanding, December 31, 2017 | 556 | $ | 47.68 | |||||||
Vested but not released, December 31, 2017 | 142 | $ | 9,650 | |||||||
Expected to vest, December 31, 2017 | 350 | $ | 23,877 | |||||||
At December 31, 2017, total unrecognized compensation expense on restricted stock units was $21.7 million, which is expected to be recognized over a weighted average period of approximately 1.6 years.
The weighted-average assumptions used to estimate the fair value of performance-based restricted stock units granted and the resulting weighted average fair value are as follows:
Year Ended December 31, | |||||||||||
2017 | 2016 | 2015 | |||||||||
Expected volatility | 28.0 | % | 30.0 | % | 30.1 | % | |||||
Risk-free interest rate | 1.0 | % | 0.7 | % | 0.7 | % | |||||
Expected term (years) | 1.7 | 1.8 | 2.1 | ||||||||
Weighted average grant date fair value | $ | 77.75 | $ | 44.92 | $ | 33.48 | |||||
74
Phantom Stock Units
The following table summarizes phantom stock unit activity:
Number of Phantom Stock Units | Weighted Average Grant Date Fair Value | |||||
(in thousands) | ||||||
Outstanding, January 1, 2016 | — | |||||
Granted | 63 | $ | 40.11 | |||
Forfeited | (1 | ) | ||||
Outstanding, December 31, 2016 | 62 | |||||
Expected to vest, December 31, 2016 | 57 | |||||
Outstanding, January 1, 2017 | 62 | $ | 40.11 | |||
Granted | 32 | 65.55 | ||||
Released | (20 | ) | 47.02 | |||
Forfeited | (11 | ) | 40.11 | |||
Outstanding, December 31, 2017 | 63 | $ | 47.28 | |||
Expected to vest, December 31, 2017 | 63 | |||||
At December 31, 2017, total unrecognized compensation expense on phantom stock units was $2.8 million, which is expected to be recognized over a weighted average period of approximately 1.7 years. As of December 31, 2017 and 2016, we have recognized a phantom stock liability of $1.7 million and $1.0 million, respectively, within wages and benefits payable in the Consolidated Balance Sheets.
Note 10: Defined Contribution, Bonus, and Profit Sharing Plans
Defined Contribution Plans
In the United States, United Kingdom, and certain other countries, we make contributions to defined contribution plans. For our U.S. employee savings plan, which represents a majority of our contribution expense, we provide a 75% match on the first 6% of the employee salary deferral, subject to statutory limitations. For our international defined contribution plans, we provide various levels of contributions, based on salary, subject to stipulated or statutory limitations. The expense for our defined contribution plans was as follows:
Year Ended December 31, | |||||||||||
2017 | 2016 | 2015 | |||||||||
(in thousands) | |||||||||||
Defined contribution plans expense | $ | 11,709 | $ | 7,941 | $ | 6,579 | |||||
Bonus and Profit Sharing Plans and Awards
We have employee bonus and profit sharing plans in which many of our employees participate, as well as an award program, which allows for recognition of individual employees' achievements. The bonus and profit sharing plans provide award amounts for the achievement of performance and financial targets. As the bonuses are being earned during the year, we estimate a compensation accrual each quarter based on the progress towards achieving the goals, the estimated financial forecast for the year, and the probability of achieving results. Bonus and profit sharing plans and award expense was as follows:
Year Ended December 31, | |||||||||||
2017 | 2016 | 2015 | |||||||||
(in thousands) | |||||||||||
Bonus and profit sharing plans and award expense | $ | 40,005 | $ | 43,377 | $ | 14,192 | |||||
75
Note 11: Income Taxes
On December 22, 2017, H.R.1, commonly referred to as the Tax Cuts and Jobs Act (Tax Act) was enacted into law in the United States. This new tax legislation represents one of the most significant overhauls to the U.S. federal tax code since 1986. The Tax Act lowered the U.S. corporate income tax rate from 35% to 21% effective January 1, 2018. It also includes numerous provisions that accelerate tax recovery for fixed assets and impacts business-related exclusions, deductions, and credits.
On December 22, 2017, the Securities and Exchange Commission (SEC) issued Staff Accounting Bulletin No. 118 (SAB 118) which provides guidance on accounting for the tax effects of the Tax Act. SAB 118 provides a measurement period that should not extend beyond one year from the Tax Act enactment date for companies to complete the accounting under ASC 740, Income Taxes. In accordance with SAB 118, a company must reflect the income tax effects of those aspects of the Tax Act for which the accounting under ASC 740 is complete. To the extent that a company's accounting for certain income tax effects of the Tax Act is incomplete but is able to determine a reasonable estimate, it must recognize a provisional estimate in the financial statements. Pursuant to SAB 118, we have recognized provisional estimates for the impact of the Tax Act in 2017. This includes a one-time tax charge of $30.4 million to remeasure our deferred tax assets as a result of these legislative changes. We do not anticipate that the one time transition tax on the deemed repatriation of deferred foreign income will be significant, and have provisionally included no charge in 2017 for this tax. We will update our provisional estimate amounts throughout the measurement period as additional guidance is released.
On December 30, 2017, France enacted “The Finance Law for 2018” that reduces the French corporate tax rate to 25% by 2022. This lower rate resulted in an approximately $10 million reduction in our deferred tax assets, offset fully by a change in the valuation allowance.
The following table summarizes the provision (benefit) for U.S. federal, state, and foreign taxes on income from continuing operations:
Year Ended December 31, | |||||||||||
2017 | 2016 | 2015 | |||||||||
(in thousands) | |||||||||||
Current: | |||||||||||
Federal | $ | 7,679 | $ | 20,490 | $ | 5,033 | |||||
State and local | 3,841 | 2,708 | 1,633 | ||||||||
Foreign | 12,139 | 12,586 | 13,945 | ||||||||
Total current | 23,659 | 35,784 | 20,611 | ||||||||
Deferred: | |||||||||||
Federal | 40,340 | 10,805 | 3,951 | ||||||||
State and local | (1,144 | ) | 1,160 | (972 | ) | ||||||
Foreign | 3,480 | (24,815 | ) | (41,893 | ) | ||||||
Total deferred | 42,676 | (12,850 | ) | (38,914 | ) | ||||||
Change in valuation allowance | 7,991 | 26,640 | 40,402 | ||||||||
Total provision for income taxes | $ | 74,326 | $ | 49,574 | $ | 22,099 | |||||
The change in the valuation allowance does not include the impacts of currency translation adjustments or significant intercompany transactions.
76
Our tax provision as a percentage of income before tax was 55.2%, 58.6%, and 59.6% for 2017, 2016, and 2015, respectively. Our actual tax rate differed from the 35% U.S. federal statutory tax rate due to various items. A reconciliation of income taxes at the U.S. federal statutory rate of 35% to the consolidated actual tax rate is as follows:
Year Ended December 31, | |||||||||||
2017 | 2016 | 2015 | |||||||||
(in thousands) | |||||||||||
Income (loss) before income taxes | |||||||||||
Domestic | $ | 220,342 | $ | 196,750 | $ | 115,526 | |||||
Foreign | (85,767 | ) | (112,123 | ) | (78,424 | ) | |||||
Total income before income taxes | $ | 134,575 | $ | 84,627 | $ | 37,102 | |||||
Expected federal income tax provision | $ | 47,101 | $ | 29,619 | $ | 12,986 | |||||
Change in valuation allowance | 7,991 | 26,640 | 40,402 | ||||||||
Stock-based compensation | (1,225 | ) | 2,762 | 939 | |||||||
Foreign earnings | (22,045 | ) | (12,584 | ) | (33,364 | ) | |||||
Tax credits | (777 | ) | (7,471 | ) | (5,257 | ) | |||||
Uncertain tax positions, including interest and penalties | (7,637 | ) | 3,817 | 4,274 | |||||||
Change in tax rates | 41,125 | 67 | 312 | ||||||||
State income tax provision (benefit), net of federal effect | 4,986 | 2,806 | (14 | ) | |||||||
U.S. tax provision on foreign earnings | 33 | 997 | 203 | ||||||||
Domestic production activities deduction | (2,534 | ) | (2,424 | ) | (1,100 | ) | |||||
Local foreign taxes | 2,324 | 2,914 | 1,450 | ||||||||
Transaction costs | 2,643 | — | — | ||||||||
Other, net | 2,341 | 2,431 | 1,268 | ||||||||
Total provision for income taxes | $ | 74,326 | $ | 49,574 | $ | 22,099 | |||||
Change in tax rates line above includes the deferred tax impact of material rate changes in the U.S., France, and Luxembourg, among others.
77
Deferred tax assets and liabilities consist of the following:
At December 31, | |||||||
2017 | 2016 | ||||||
(in thousands) | |||||||
Deferred tax assets | |||||||
Loss carryforwards(1) | $ | 218,420 | $ | 194,381 | |||
Tax credits(2) | 58,616 | 53,323 | |||||
Accrued expenses | 23,752 | 36,336 | |||||
Pension plan benefits expense | 18,262 | 16,822 | |||||
Warranty reserves | 11,170 | 21,306 | |||||
Depreciation and amortization | 5,736 | 15,698 | |||||
Equity compensation | 5,352 | 6,924 | |||||
Inventory valuation | 2,554 | 3,086 | |||||
Deferred revenue | 2,431 | 4,896 | |||||
Other deferred tax assets, net | 16,606 | 13,621 | |||||
Total deferred tax assets | 362,899 | 366,393 | |||||
Valuation allowance | (285,784 | ) | (249,560 | ) | |||
Total deferred tax assets, net of valuation allowance | 77,115 | 116,833 | |||||
Deferred tax liabilities | |||||||
Depreciation and amortization | (23,135 | ) | (19,995 | ) | |||
Tax effect of accumulated translation | (303 | ) | (100 | ) | |||
Other deferred tax liabilities, net | (5,231 | ) | (5,698 | ) | |||
Total deferred tax liabilities | (28,669 | ) | (25,793 | ) | |||
Net deferred tax assets | $ | 48,446 | $ | 91,040 | |||
(1) | For tax return purposes at December 31, 2017, we had U.S. federal loss carryforwards of $30.9 million which begin to expire in the year 2021. At December 31, 2017, we have net operating loss carryforwards in Luxembourg of $592.6 million, majority of which can be carried forward indefinitely, offset by a full valuation allowance. The remaining portion of the loss carryforwards are composed primarily of losses in various other state and foreign jurisdictions. The majority of these losses can be carried forward indefinitely. At December 31, 2017, there was a valuation allowance of $285.8 million primarily associated with foreign loss carryforwards and foreign tax credit carryforwards (discussed below). |
(2) | For tax return purposes at December 31, 2017, we had: (1) U.S. general business credits of $3.7 million, which begin to expire in 2022; (2) U.S. alternative minimum tax credits of $3.3 million that can be carried forward indefinitely; (3) U.S. foreign tax credits of $49.3 million, which begin to expire in 2024; and (4) state tax credits of $10.7 million, which begin to expire in 2018. |
Changes in the valuation allowance for deferred tax assets are summarized as follows:
Description | Balance at Beginning of Period | Other Adjustments | Additions Charged to Costs and Expenses | Balance at End of Period, Noncurrent | ||||||||||||
(in thousands) | ||||||||||||||||
Year ended December 31, 2017: | ||||||||||||||||
Deferred tax assets valuation allowance | $ | 249,560 | $ | 28,233 | $ | 7,991 | $ | 285,784 | ||||||||
Year ended December 31, 2016: | ||||||||||||||||
Deferred tax assets valuation allowance | $ | 235,339 | $ | (12,419 | ) | $ | 26,640 | $ | 249,560 | |||||||
Year ended December 31, 2015: | ||||||||||||||||
Deferred tax assets valuation allowance | $ | 257,728 | $ | (62,791 | ) | $ | 40,402 | $ | 235,339 | |||||||
We recognize valuation allowances to reduce deferred tax assets to the extent we believe it is more likely than not that a portion of such assets will not be realized. In making such determinations, we consider all available favorable and unfavorable evidence, including scheduled reversals of deferred tax liabilities, projected future taxable income, tax planning strategies, and our ability to carry back losses to prior years. We are required to make assumptions and judgments about potential outcomes that lie outside management’s control. Our most sensitive and critical factors are the projection, source, and character of future taxable income. Although realization is not assured, management believes it is more likely than not that deferred tax assets, net of valuation allowance, will be realized. The amount of deferred tax assets considered realizable, however, could be reduced in the near term
78
if estimates of future taxable income during the carryforward periods are reduced or current tax planning strategies are not implemented.
We do not provide U.S. deferred taxes on temporary differences related to our foreign investments that are considered permanent in duration. These temporary differences consist primarily of undistributed foreign earnings of $5.2 million and $4.9 million at December 31, 2017 and 2016, respectively. Foreign taxes have been provided on these undistributed foreign earnings. We have not computed the unrecognized deferred income tax liability on these temporary differences. There are many assumptions that must be considered to calculate the liability, thereby making it impractical to compute at this time.
We are subject to income tax in the United States and numerous foreign jurisdictions. Significant judgment is required in evaluating our tax positions and determining our provision for income taxes. During the ordinary course of business, there are many transactions and calculations for which the ultimate tax determination is uncertain. We establish reserves for tax-related uncertainties based on estimates of whether, and the extent to which, additional taxes will be due. These reserves are established when we believe that certain positions might be challenged despite our belief that our tax return positions are fully supportable. We adjust these reserves in light of changing facts and circumstances, such as the outcome of tax audits. The provision for income taxes includes the impact of reserve positions and changes to reserves that are considered appropriate.
A reconciliation of the beginning and ending amount of unrecognized tax benefits is as follows:
Total | |||
(in thousands) | |||
Unrecognized tax benefits at January 1, 2015 | $ | 28,146 | |
Gross increase to positions in prior years | 6,461 | ||
Gross decrease to positions in prior years | (2,512 | ) | |
Gross increases to current period tax positions | 25,741 | ||
Audit settlements | — | ||
Decrease related to lapsing of statute of limitations | (908 | ) | |
Effect of change in exchange rates | (2,048 | ) | |
Unrecognized tax benefits at December 31, 2015 | $ | 54,880 | |
Gross increase to positions in prior years | 1,164 | ||
Gross decrease to positions in prior years | (612 | ) | |
Gross increases to current period tax positions | 5,071 | ||
Audit settlements | (1,116 | ) | |
Decrease related to lapsing of statute of limitations | (860 | ) | |
Effect of change in exchange rates | (901 | ) | |
Unrecognized tax benefits at December 31, 2016 | $ | 57,626 | |
Gross increase to positions in prior years | 3,367 | ||
Gross decrease to positions in prior years | (5,559 | ) | |
Gross increases to current period tax positions | 6,453 | ||
Audit settlements | (5,169 | ) | |
Decrease related to lapsing of statute of limitations | (3,445 | ) | |
Effect of change in exchange rates | 3,429 | ||
Unrecognized tax benefits at December 31, 2017 | $ | 56,702 | |
At December 31, | |||||||||||
2017 | 2016 | 2015 | |||||||||
(in thousands) | |||||||||||
The amount of unrecognized tax benefits that, if recognized, would affect our effective tax rate | $ | 55,312 | $ | 56,411 | $ | 53,602 | |||||
If certain unrecognized tax benefits are recognized they would create additional deferred tax assets. These assets would require a full valuation in certain locations based upon present circumstances.
79
We classify interest expense and penalties related to unrecognized tax benefits and interest income on tax overpayments as components of income tax expense. The net interest and penalties expense recognized is as follows:
Year Ended December 31, | |||||||||||
2017 | 2016 | 2015 | |||||||||
(in thousands) | |||||||||||
Net interest and penalties expense (benefit) | $ | (543 | ) | $ | 193 | $ | 880 | ||||
At December 31, | |||||||
2017 | 2016 | ||||||
(in thousands) | |||||||
Accrued interest | $ | 2,706 | $ | 2,473 | |||
Accrued penalties | 2,426 | 2,329 | |||||
At December 31, 2017, we are under examination by certain tax authorities for the 2010 to 2015 tax years. The material jurisdictions where we are subject to examination for the 2010 to 2015 tax years include, among others, the U.S., France, Germany, Italy, Brazil and the United Kingdom. During December 2017 we settled our tax audit with the Internal Revenue Service related to research and development tax credits for the 2011-2013 years. We believe we have appropriately accrued for the expected outcome of all tax matters and do not currently anticipate that the ultimate resolution of these examinations will have a material adverse effect on our financial condition, future results of operations, or cash flows.
Based upon the timing and outcome of examinations, litigation, the impact of legislative, regulatory, and judicial developments, and the impact of these items on the statute of limitations, it is reasonably possible that the related unrecognized tax benefits could change from those recognized within the next twelve months. However, at this time, an estimate of the range of reasonably possible adjustments to the balance of unrecognized tax benefits cannot be made.
We file income tax returns in the U.S. federal jurisdiction and various states and foreign jurisdictions. We are subject to income tax examination by tax authorities in our major tax jurisdictions as follows:
Tax Jurisdiction | Years Subject to Audit | |
U.S. federal | Subsequent to 2013 | |
France | Subsequent to 2012 | |
Germany | Subsequent to 2010 | |
Brazil | Subsequent to 2011 | |
United Kingdom | Subsequent to 2012 | |
Italy | Subsequent to 2011 | |
Note 12: Commitments and Contingencies
Commitments
Operating lease rental expense for factories, service and distribution locations, offices, and equipment was as follows:
Year Ended December 31, | |||||||||||
2017 | 2016 | 2015 | |||||||||
(in thousands) | |||||||||||
Rental expense | $ | 14,824 | $ | 14,232 | $ | 15,524 | |||||
80
Future minimum lease payments at December 31, 2017, under noncancelable operating leases with initial or remaining terms in excess of one year are as follows:
Year Ending December 31, | Minimum Payments | |||
(in thousands) | ||||
2018 | $ | 15,353 | ||
2019 | 10,274 | |||
2020 | 6,556 | |||
2021 | 3,732 | |||
2022 | 2,888 | |||
Beyond 2022 | 9,799 | |||
Future minimum lease payments | $ | 48,602 | ||
Rent expense is recognized straight-line over the lease term, including renewal periods if reasonably assured. We lease most of our sales and distribution locations and administrative offices. Our leases typically contain renewal options similar to the original terms with lease payments that increase based on an index.
Guarantees and Indemnifications
We are often required to obtain standby letters of credit (LOCs) or bonds in support of our obligations for customer contracts. These standby LOCs or bonds typically provide a guarantee to the customer for future performance, which usually covers the installation phase of a contract and may, on occasion, cover the operations and maintenance phase of outsourcing contracts.
Our available lines of credit, outstanding standby LOCs, and bonds are as follows:
At December 31, | |||||||
2017 | 2016 | ||||||
(in thousands) | |||||||
Credit facilities(1) | |||||||
Multicurrency revolving line of credit | $ | 500,000 | $ | 500,000 | |||
Long-term borrowings | (125,414 | ) | (97,167 | ) | |||
Standby LOCs issued and outstanding | (31,881 | ) | (46,103 | ) | |||
Net available for additional borrowings under the multi-currency revolving line of credit | $ | 342,705 | $ | 356,730 | |||
Net available for additional standby LOCs under sub-facility | 218,119 | 203,897 | |||||
Unsecured multicurrency revolving lines of credit with various financial institutions | |||||||
Multicurrency revolving line of credit | $ | 110,477 | $ | 91,809 | |||
Standby LOCs issued and outstanding | (21,030 | ) | (21,734 | ) | |||
Short-term borrowings(2) | (916 | ) | (69 | ) | |||
Net available for additional borrowings and LOCs | $ | 88,531 | $ | 70,006 | |||
Unsecured surety bonds in force | $ | 51,344 | $ | 48,221 | |||
(1) | Refer to Note 6 and Note 19 for details regarding our secured credit facilities, including the refinancing of the 2015 credit facility. |
(2) | Short-term borrowings are included in “Other current liabilities” on the Consolidated Balance Sheets. |
In the event any such standby LOC or bond is called, we would be obligated to reimburse the issuer of the standby LOC or bond; however, we do not believe that any outstanding LOC or bond will be called.
We generally provide an indemnification related to the infringement of any patent, copyright, trademark, or other intellectual property right on software or equipment within our sales contracts, which indemnifies the customer from and pays the resulting costs, damages, and attorney’s fees awarded against a customer with respect to such a claim provided that (a) the customer promptly notifies us in writing of the claim and (b) we have the sole control of the defense and all related settlement negotiations. We may also provide an indemnification to our customers for third party claims resulting from damages caused by the negligence or willful misconduct of our employees/agents in connection with the performance of certain contracts. The terms of our indemnifications generally do not limit the maximum potential payments. It is not possible to predict the maximum potential amount of future payments under these or similar agreements.
81
Legal Matters
We are subject to various legal proceedings and claims of which the outcomes are subject to significant uncertainty. Our policy is to assess the likelihood of any adverse judgments or outcomes related to legal matters, as well as ranges of probable losses. A determination of the amount of the liability required, if any, for these contingencies is made after an analysis of each known issue. A liability is recognized and charged to operating expense when we determine that a loss is probable and the amount can be reasonably estimated. Additionally, we disclose contingencies for which a material loss is reasonably possible, but not probable.
Warranty
A summary of the warranty accrual account activity is as follows:
Year Ended December 31, | |||||||
2017 | 2016 | ||||||
(in thousands) | |||||||
Beginning balance | $ | 43,302 | $ | 54,512 | |||
New product warranties | 7,849 | 7,987 | |||||
Other adjustments and expirations | (393 | ) | 5,933 | ||||
Claims activity | (18,094 | ) | (24,364 | ) | |||
Effect of change in exchange rates | 2,198 | (766 | ) | ||||
Ending balance | 34,862 | 43,302 | |||||
Less: current portion of warranty | 21,150 | 24,874 | |||||
Long-term warranty | $ | 13,712 | $ | 18,428 | |||
Total warranty expense is classified within cost of revenues and consists of new product warranties issued, costs related to extended warranty contracts, insurance and supplier recoveries, and other changes and adjustments to warranties. Warranty expense was as follows:
Year Ended December 31, | |||||||||||
2017 | 2016 | 2015 | |||||||||
(in thousands) | |||||||||||
Total warranty expense | $ | (2,054 | ) | $ | 13,920 | $ | 45,984 | ||||
Warranty expense during the year ended December 31, 2015 included a $29.4 million special warranty provision. During the second quarter of 2015, we concluded it was necessary to issue a product replacement notification to customers of our Water segment who had purchased certain communication modules manufactured between July 2013 and December 2014. We determined that a component of the modules was failing prematurely.
Warranty expense decreased during the year ended December 31, 2017 compared with the same period in 2016 primarily due to an insurance recovery of $8.0 million associated with our 2015 product replacement provision.
Extended Warranty
A summary of changes to unearned revenue for extended warranty contracts is as follows:
Year Ended December 31, | |||||||
2017 | 2016 | ||||||
(in thousands) | |||||||
Beginning balance | $ | 31,549 | $ | 33,654 | |||
Unearned revenue for new extended warranties | 1,186 | 1,437 | |||||
Unearned revenue recognized | (4,247 | ) | (3,594 | ) | |||
Effect of change in exchange rates | 154 | 52 | |||||
Ending balance | 28,642 | 31,549 | |||||
Less: current portion of unearned revenue for extended warranty | 4,220 | 4,226 | |||||
Long-term unearned revenue for extended warranty within other long-term obligations | $ | 24,422 | $ | 27,323 | |||
Health Benefits
We are self insured for a substantial portion of the cost of our U.S. employee group health insurance. We purchase insurance from a third party, which provides individual and aggregate stop loss protection for these costs. Each reporting period, we expense the
82
costs of our health insurance plan including paid claims, the change in the estimate of incurred but not reported (IBNR) claims, taxes, and administrative fees (collectively, the plan costs).
Plan costs were as follows:
Year Ended December 31, | |||||||||||
2017 | 2016 | 2015 | |||||||||
(in thousands) | |||||||||||
Plan costs | $ | 30,521 | $ | 27,276 | $ | 25,355 | |||||
IBNR accrual, which is included in wages and benefits payable, was as follows:
At December 31, | |||||||
2017 | 2016 | ||||||
(in thousands) | |||||||
IBNR accrual | $ | 2,664 | $ | 2,441 | |||
Our IBNR accrual and expenses may fluctuate due to the number of plan participants, claims activity, and deductible limits. For our employees located outside of the United States, health benefits are provided primarily through governmental social plans, which are funded through employee and employer tax withholdings.
Note 13: Restructuring
2016 Projects
On September 1, 2016, we announced projects (2016 Projects) to restructure various company activities in order to improve operational efficiencies, reduce expenses and improve competiveness. We expect to close or consolidate several facilities and reduce our global workforce as a result of the restructuring.
The 2016 Projects began during the three months ended September 30, 2016, and we expect to substantially complete the 2016 Projects by the fourth quarter of 2018. Many of the affected employees are represented by unions or works councils, which require consultation, and potential restructuring projects may be subject to regulatory approval, both of which could impact the timing of charges, total expected charges, cost recognized, and planned savings in certain jurisdictions.
The total expected restructuring costs, costs recognized in prior periods, costs recognized during the year ended December 31, 2017, and the remaining expected costs as of December 31, 2017 related to the 2016 Projects are as follows:
Total Expected Costs at December 31, 2017 | Costs Recognized in Prior Periods | Costs Recognized During the Year Ended December 31, 2017 | Remaining Costs to be Recognized at December 31, 2017 | ||||||||||||
(in thousands) | |||||||||||||||
Employee severance costs | $ | 39,855 | $ | 39,686 | $ | 169 | $ | — | |||||||
Asset impairments & net gain on sale or disposal | 4,922 | 7,219 | (2,297 | ) | — | ||||||||||
Other restructuring costs | 15,435 | 889 | 8,546 | 6,000 | |||||||||||
Total | $ | 60,212 | $ | 47,794 | $ | 6,418 | $ | 6,000 | |||||||
Segments: | |||||||||||||||
Electricity | $ | 10,525 | $ | 8,827 | $ | 198 | $ | 1,500 | |||||||
Gas | 31,181 | 23,968 | 5,213 | 2,000 | |||||||||||
Water | 15,761 | 13,061 | 700 | 2,000 | |||||||||||
Corporate unallocated | 2,745 | 1,938 | 307 | 500 | |||||||||||
Total | $ | 60,212 | $ | 47,794 | $ | 6,418 | $ | 6,000 | |||||||
2014 Projects
In November 2014, our management approved restructuring projects (2014 Projects) to restructure our Electricity business and related general and administrative activities, along with certain Gas and Water activities, to improve operational efficiencies and
83
reduce expenses. We began implementing these projects in the fourth quarter of 2014, and substantially completed them in the third quarter of 2016. Project activities were completed during the fourth quarter of 2017, and no further costs are expected to be recognized. The 2014 Projects resulted in $48.5 million of restructuring expense, which was recognized from the fourth quarter of 2014 through the third quarter of 2016.
The following table summarizes the activity within the restructuring related balance sheet accounts for the 2016 and 2014 Projects during the year ended December 31, 2017:
Accrued Employee Severance | Asset Impairments & Net Gain on Sale or Disposal | Other Accrued Costs | Total | ||||||||||||
(in thousands) | |||||||||||||||
Beginning balance, January 1, 2017 | $ | 45,368 | $ | — | $ | 2,602 | $ | 47,970 | |||||||
Costs incurred and charged to expense | 169 | (2,297 | ) | 8,546 | 6,418 | ||||||||||
Cash receipts (payments) | (12,423 | ) | 3,704 | (8,683 | ) | (17,402 | ) | ||||||||
Net assets disposed and impaired | — | (1,407 | ) | — | (1,407 | ) | |||||||||
Effect of change in exchange rates | 4,540 | — | 6 | 4,546 | |||||||||||
Ending balance, December 31, 2017 | $ | 37,654 | $ | — | $ | 2,471 | $ | 40,125 | |||||||
Asset impairments are determined at the asset group level. Revenues and net operating income from the activities we have exited or will exit under the restructuring projects are not material to our operating segments or consolidated results.
Other restructuring costs include expenses for employee relocation, professional fees associated with employee severance, and costs to exit the facilities once the operations in those facilities have ceased. Costs associated with restructuring activities are generally presented in the Consolidated Statements of Operations as restructuring, except for certain costs associated with inventory write-downs, which are classified within cost of revenues, and accelerated depreciation expense, which is recognized according to the use of the asset.
The current restructuring liabilities were $32.5 million and $26.2 million as of December 31, 2017 and 2016, respectively. The current restructuring liabilities are classified within other current liabilities on the Consolidated Balance Sheets. The long-term restructuring liabilities balances were $7.6 million and $21.8 million as of December 31, 2017 and 2016, respectively. The long-term restructuring liabilities are classified within other long-term obligations on the Consolidated Balance Sheets, and include facility exit costs and severance accruals.
Note 14: Shareholders’ Equity
Preferred Stock
We have authorized the issuance of 10 million shares of preferred stock with no par value. In the event of a liquidation, dissolution, or winding up of the affairs of the corporation, whether voluntary or involuntary, the holders of any outstanding preferred stock will be entitled to be paid a preferential amount per share to be determined by our Board of Directors prior to any payment to holders of common stock. There was no preferred stock issued or outstanding at December 31, 2017, 2016, and 2015.
Stock Repurchase Plan
On February 23, 2017, our Board of Directors authorized the Company to repurchase up to $50 million of our common stock over a 12-month period, beginning February 23, 2017. There were no repurchases of common stock made prior to plan termination on February 23, 2018.
84
Other Comprehensive Income (Loss)
The changes in the components of AOCI, net of tax, were as follows:
Foreign Currency Translation Adjustments | Net Unrealized Gain (Loss) on Derivative Instruments | Net Unrealized Gain (Loss) on Nonderivative Instruments | Pension Benefit Obligation Adjustments | Accumulated Other Comprehensive Income (Loss) | |||||||||||||||
(in thousands) | |||||||||||||||||||
Balances at January 1, 2015 | $ | (85,080 | ) | $ | (768 | ) | $ | (14,380 | ) | $ | (34,832 | ) | $ | (135,060 | ) | ||||
OCI before reclassifications | (73,891 | ) | 76 | — | 4,570 | (69,245 | ) | ||||||||||||
Amounts reclassified from AOCI | 962 | 1,010 | — | 1,726 | 3,698 | ||||||||||||||
Total other comprehensive income (loss) | (72,929 | ) | 1,086 | — | 6,296 | (65,547 | ) | ||||||||||||
Balances at December 31, 2015 | $ | (158,009 | ) | $ | 318 | $ | (14,380 | ) | $ | (28,536 | ) | $ | (200,607 | ) | |||||
OCI before reclassifications | (23,570 | ) | (1,087 | ) | — | (6,191 | ) | (30,848 | ) | ||||||||||
Amounts reclassified from AOCI | (1,407 | ) | 812 | — | 2,723 | 2,128 | |||||||||||||
Total other comprehensive income (loss) | (24,977 | ) | (275 | ) | — | (3,468 | ) | (28,720 | ) | ||||||||||
Balances at December 31, 2016 | $ | (182,986 | ) | $ | 43 | $ | (14,380 | ) | $ | (32,004 | ) | $ | (229,327 | ) | |||||
OCI before reclassifications | 53,854 | 360 | — | 2,354 | 56,568 | ||||||||||||||
Amounts reclassified from AOCI | 484 | 563 | — | 1,234 | 2,281 | ||||||||||||||
Total other comprehensive income (loss) | 54,338 | 923 | — | 3,588 | 58,849 | ||||||||||||||
Balances at December 31, 2017 | $ | (128,648 | ) | $ | 966 | $ | (14,380 | ) | $ | (28,416 | ) | $ | (170,478 | ) | |||||
85
The before-tax, income tax (provision) benefit, and net-of-tax amounts related to each component of OCI during the reporting periods were as follows:
Year Ended December 31, | |||||||||||
2017 | 2016 | 2015 | |||||||||
(in thousands) | |||||||||||
Before-tax amount | |||||||||||
Foreign currency translation adjustment | $ | 54,218 | $ | (23,280 | ) | $ | (74,219 | ) | |||
Foreign currency translation adjustment reclassified into net income on disposal | 484 | (1,407 | ) | 962 | |||||||
Net unrealized gain (loss) on derivative instruments designated as cash flow hedges | 585 | (1,768 | ) | 123 | |||||||
Net hedging (gain) loss reclassified to net income | 916 | 1,322 | 1,639 | ||||||||
Net unrealized gain (loss) on defined benefit plans | 3,401 | (6,256 | ) | 6,512 | |||||||
Net defined benefit plan loss reclassified to net income | 1,782 | 2,752 | 2,459 | ||||||||
Total other comprehensive income (loss), before tax | 61,386 | (28,637 | ) | (62,524 | ) | ||||||
Tax (provision) benefit | |||||||||||
Foreign currency translation adjustment | (364 | ) | (290 | ) | 328 | ||||||
Foreign currency translation adjustment reclassified into net income on disposal | — | — | — | ||||||||
Net unrealized gain (loss) on derivative instruments designated as cash flow hedges | (225 | ) | 681 | (47 | ) | ||||||
Net hedging (gain) loss reclassified into net income | (353 | ) | (510 | ) | (629 | ) | |||||
Net unrealized gain (loss) on defined benefit plans | (1,047 | ) | 65 | (1,942 | ) | ||||||
Net defined benefit plan loss reclassified to net income | (548 | ) | (29 | ) | (733 | ) | |||||
Total other comprehensive income (loss) tax (provision) benefit | (2,537 | ) | (83 | ) | (3,023 | ) | |||||
Net-of-tax amount | |||||||||||
Foreign currency translation adjustment | 53,854 | (23,570 | ) | (73,891 | ) | ||||||
Foreign currency translation adjustment reclassified into net income on disposal | 484 | (1,407 | ) | 962 | |||||||
Net unrealized gain (loss) on derivative instruments designated as cash flow hedges | 360 | (1,087 | ) | 76 | |||||||
Net hedging (gain) loss reclassified into net income | 563 | 812 | 1,010 | ||||||||
Net unrealized gain (loss) on defined benefit plans | 2,354 | (6,191 | ) | 4,570 | |||||||
Net defined benefit plan loss reclassified to net income | 1,234 | 2,723 | 1,726 | ||||||||
Total other comprehensive income (loss), net of tax | $ | 58,849 | $ | (28,720 | ) | $ | (65,547 | ) | |||
86
Note 15: Fair Values of Financial Instruments
The fair values at December 31, 2017 and 2016 do not reflect subsequent changes in the economy, interest rates, tax rates, and other variables that may affect the determination of fair value.
December 31, 2017 | December 31, 2016 | ||||||||||||||
Carrying Amount | Fair Value | Carrying Amount | Fair Value | ||||||||||||
(in thousands) | |||||||||||||||
Assets | |||||||||||||||
Cash and cash equivalents | $ | 176,274 | $ | 176,274 | $ | 133,565 | $ | 133,565 | |||||||
Restricted cash | 311,061 | 311,061 | — | — | |||||||||||
Foreign exchange forwards | 41 | 41 | 169 | 169 | |||||||||||
Interest rate swaps | 2,370 | 2,370 | 1,830 | 1,830 | |||||||||||
Interest rate caps | 489 | 489 | 946 | 946 | |||||||||||
Liabilities | |||||||||||||||
Credit facility | |||||||||||||||
USD denominated term loan | $ | 194,063 | $ | 192,295 | $ | 208,125 | $ | 205,676 | |||||||
Multicurrency revolving line of credit | 125,414 | 124,100 | 97,167 | 95,906 | |||||||||||
Senior notes | 300,000 | 301,125 | — | — | |||||||||||
Interest rate swaps | — | — | 934 | 934 | |||||||||||
Foreign exchange forwards | 289 | 289 | 449 | 449 | |||||||||||
The following methods and assumptions were used in estimating fair values:
Cash, cash equivalents, and restricted cash: Due to the liquid nature of these instruments, the carrying value approximates fair value (Level 1).
Credit Facility - term loan and multicurrency revolving line of credit: The term loan and revolver are not traded publicly. The fair values, which are determined based upon a hypothetical market participant, are calculated using a discounted cash flow model with Level 2 inputs, including estimates of incremental borrowing rates for debt with similar terms, maturities, and credit profiles. Refer to Note 6 for a further discussion of our debt.
Derivatives: See Note 7 for a description of our methods and assumptions in determining the fair value of our derivatives, which were determined using Level 2 inputs.
Senior Notes: The Notes are not registered securities nor listed on any securities exchange, but may be actively traded by qualified institutional buyers. The fair value is estimated using Level 1 inputs, as it is based on quoted prices for these instruments in active markets.
Note 16: Segment Information
We operate under the Itron brand worldwide and manage and report under three operating segments, Electricity, Gas, and Water. Our Water operating segment includes our global water, and heat and allocation solutions. This structure allows each segment to develop its own go-to-market strategy, prioritize its marketing and product development requirements, and focus on its strategic investments. Our sales, marketing, and delivery functions are managed under each segment. Our product development and manufacturing operations are managed on a worldwide basis to promote a global perspective in our operations and processes and yet still maintain alignment with the segments.
We have three GAAP measures of segment performance: revenues, gross profit (margin), and operating income (margin). Intersegment revenues are minimal. Certain operating expenses are allocated to the operating segments based upon internally established allocation methodologies. Corporate operating expenses, interest income, interest expense, other income (expense), and income tax provision are not allocated to the segments, nor are included in the measure of segment profit or loss. In addition, we allocate only certain production assets and intangible assets to our operating segments. We do not manage the performance of the segments on a balance sheet basis.
87
Segment Products
Electricity | Standard electricity (electromechanical and electronic) meters; smart metering solutions that include one or several of the following: smart electricity meters; smart electricity communication modules; prepayment systems, including smart key, keypad, and smart card communication technologies; smart systems including handheld, mobile, and fixed network collection technologies; smart network technologies; meter data management software; knowledge application solutions; installation; implementation; and professional services including consulting and analysis. |
Gas | Standard gas meters; smart metering solutions that include one or several of the following: smart gas meters; smart gas communication modules; prepayment systems, including smart key, keypad, and smart card communication technologies; smart systems, including handheld, mobile, and fixed network collection technologies; smart network technologies; meter data management software; knowledge application solutions installation; implementation; and professional services including consulting and analysis. |
Water | Standard water and heat meters; smart metering solutions that include one or several of the following: smart water meters and communication modules; smart heat meters; smart systems including handheld, mobile, and fixed network collection technologies; meter data management software; knowledge application solutions; installation; implementation; and professional services including consulting and analysis. |
Revenues, gross profit, and operating income associated with our segments were as follows:
Year Ended December 31, | |||||||||||
2017 | 2016 | 2015 | |||||||||
(in thousands) | |||||||||||
Revenues | |||||||||||
Electricity | $ | 1,022,939 | $ | 938,374 | $ | 820,306 | |||||
Gas | 533,624 | 569,476 | 543,805 | ||||||||
Water | 461,634 | 505,336 | 519,422 | ||||||||
Total Company | $ | 2,018,197 | $ | 2,013,186 | $ | 1,883,533 | |||||
Gross profit | |||||||||||
Electricity | $ | 318,953 | $ | 282,677 | $ | 225,446 | |||||
Gas | 191,303 | 205,063 | 185,559 | ||||||||
Water | 164,898 | 172,580 | 145,680 | ||||||||
Total Company | $ | 675,154 | $ | 660,320 | $ | 556,685 | |||||
Operating income | |||||||||||
Electricity | $ | 93,566 | $ | 68,287 | $ | 31,104 | |||||
Gas | 74,206 | 66,813 | 67,471 | ||||||||
Water | 44,494 | 37,266 | 19,864 | ||||||||
Corporate unallocated | (60,840 | ) | (76,155 | ) | (65,593 | ) | |||||
Total Company | 151,426 | 96,211 | 52,846 | ||||||||
Total other income (expense) | (16,851 | ) | (11,584 | ) | (15,744 | ) | |||||
Income before income taxes | $ | 134,575 | $ | 84,627 | $ | 37,102 | |||||
During the year ended December 31, 2015, we concluded it was necessary to issue a product replacement notification to customers of our Water segment who had purchased certain communication modules manufactured between July 2013 and December 2014. We determined that a component of the modules was failing prematurely. This resulted in a decrease to gross profit of $29.4 million for the year ended December 31, 2015. After adjusting for the tax impact, this charge resulted in a decrease to basic and diluted EPS of $0.47 for the year ended December 31, 2015.
During the year ended December 31, 2017, we recognized an insurance recovery associated with warranty expenses previously recognized as a result of our 2015 product replacement notification discussed above. As a result, gross profit increased $8.0 million for the year ended December 31, 2017. After adjusting for the tax impact, the recovery resulted in an increase of $0.13 and $0.12 for basic and diluted EPS, respectively, for the year ended December 31, 2017.
For the year ended December 31, 2017, one customer represented 19% and two additional customers each represented 11% of the Electricity operating segment revenues. There was no single customer that represented more than 10% of total Company or the Gas or Water operating segment revenues.
88
For the years ended December 31, 2016, two customers represented 12% and 10% of total Electricity operating segment revenues, respectively. There was no customer that represented more than 10% of total Company or the Gas or Water operating segment revenues.
For the years ended December 31, 2015, no single customer represented more than 10% of total Company or the Electricity, Gas or Water operating segment revenues.
Revenues by region were as follows:
Year Ended December 31, | |||||||||||
2017 | 2016 | 2015 | |||||||||
(in thousands) | |||||||||||
United States and Canada | $ | 1,137,508 | $ | 1,126,787 | $ | 997,293 | |||||
Europe, Middle East, and Africa (EMEA) | 672,942 | 698,106 | 701,301 | ||||||||
Other | 207,747 | 188,293 | 184,939 | ||||||||
Total Company | $ | 2,018,197 | $ | 2,013,186 | $ | 1,883,533 | |||||
Revenues are allocated to countries and regions based on the location of the selling entity.
Property, plant, and equipment, net, by geographic area were as follows:
At December 31, | |||||||
2017 | 2016 | ||||||
(in thousands) | |||||||
United States | $ | 67,764 | $ | 70,435 | |||
Outside United States | 133,004 | 106,023 | |||||
Total Company | $ | 200,768 | $ | 176,458 | |||
Depreciation and amortization expense associated with our segments was as follows:
Year Ended December 31, | |||||||||||
2017 | 2016 | 2015 | |||||||||
(in thousands) | |||||||||||
Electricity | $ | 24,703 | $ | 28,468 | $ | 35,896 | |||||
Gas | 18,800 | 20,714 | 20,288 | ||||||||
Water | 16,092 | 18,675 | 19,459 | ||||||||
Corporate unallocated | 3,620 | 461 | 350 | ||||||||
Total Company | $ | 63,215 | $ | 68,318 | $ | 75,993 | |||||
Note 17: Business Combinations
On June 1, 2017, we completed the acquisition of Comverge by purchasing the stock of its parent, Peak Holding Corp. (Comverge). This was financed through borrowings on our multicurrency revolving line of credit and cash on hand. Comverge is a leading provider of integrated demand response and customer engagement solutions that enable electric utilities to ensure grid reliability, lower energy costs for consumers, meet regulatory demands, and enhance the customer experience. Comverge's technologies are complementary to our Electricity segment's growing software and services offerings, and will help optimize grid performance and reliability.
89
The purchase price of Comverge was $100.0 million in cash, net of $18.2 million of cash and cash equivalents acquired. We allocated the purchase price to the assets acquired and liabilities assumed based on fair value assessments. The fair values of these assets and liabilities are considered final. The following reflects our final allocation of purchase price as of June 1, 2017:
Fair Value | Weighted Average Useful Life | ||||
(in thousands) | (in years) | ||||
Current assets | $ | 15,118 | |||
Property, plant, and equipment | 2,275 | ||||
Other long-term assets | 1,879 | ||||
Identified intangible assets | |||||
Core-developed technology | 19,250 | 8 | |||
Customer contracts and relationships | 12,230 | 10 | |||
Trademarks and trade names | 4,310 | 15 | |||
Total identified intangible assets subject to amortization | 35,790 | ||||
In-process research and development (IPR&D) | 710 | ||||
Total identified intangible assets | 36,500 | ||||
Goodwill | 59,675 | ||||
Current liabilities | (10,787 | ) | |||
Long-term liabilities | (4,645 | ) | |||
Total net assets acquired | $ | 100,015 | |||
The fair values for the identified core-developed technology, trademarks, and IPR&D intangible assets were estimated using the income approach. Under the income approach, the fair value reflects the present value of the projected cash flows that are expected to be generated. Core-developed technology represents the fair values of Comverge products that have reached technological feasibility and were part of Comverge's product offerings at the date of the acquisition. Customer contracts and relationships represent the fair value of the relationships developed with its customers, including the backlog, and these were valued utilizing the replacement cost method, which measures the value of an asset based on the cost to replace the existing asset. The core-developed technology, trademarks, and IPR&D intangible assets valued using the income approach will be amortized using the estimated discounted cash flows assumed in the valuation models. Customer contracts and relationships will be amortized using the straight-line method.
IPR&D assets acquired represented the fair value of Comverge research and development projects that had not yet reached technological feasibility at the time of acquisition. These projects were completed in the fourth quarter of 2017 and were reclassified to core-developed technology. Incremental costs to be incurred for these projects were not significant and were recognized as product development expense as incurred within the Consolidated Statements of Operations.
Goodwill of $59.7 million arising from the acquisition consists largely of the synergies expected from combining the operations of Itron and Comverge, as well as certain intangible assets that do not qualify for separate recognition. All of the goodwill balance was assigned to the Electricity reporting unit and segment. We will not be able to deduct any of the goodwill balance for income tax purposes.
The following table presents the revenues and net income (loss) from Comverge's operations that are included in our Consolidated Statements of Operations:
June 1, 2017 - December 31, 2017 | |||
Revenues | $ | 32,436 | |
Net income (loss) | (2,448 | ) | |
90
The following supplemental pro forma results are based on the individual historical results of Itron and Comverge, with adjustments to give effect to the combined operations as if the acquisition had been consummated on January 1, 2016.
Year Ended December 31, | |||||||
2017 | 2016 | ||||||
Revenues | $ | 2,040,309 | $ | 2,072,695 | |||
Net income | 64,230 | 24,415 | |||||
The significant nonrecurring adjustments reflected in the proforma schedule above are not considered material and include the following:
• | Elimination of transaction costs incurred by Comverge and Itron prior to the acquisition completion |
• | Reclassification of certain expenses incurred after the acquisition to the appropriate periods assuming the acquisition closed on January 1, 2016 |
The supplemental pro forma results are intended for information purposes only and do not purport to represent what the combined companies' results of operations would actually have been had the transaction in fact occurred at an earlier date or project the results for any future date or period.
Note 18: Quarterly Results (Unaudited)
First Quarter | Second Quarter | Third Quarter | Fourth Quarter | Total Year | |||||||||||||||
(in thousands, except per share data) | |||||||||||||||||||
2017 | |||||||||||||||||||
Statement of operations data (unaudited): | |||||||||||||||||||
Revenues | $ | 477,592 | $ | 503,082 | $ | 486,747 | $ | 550,776 | $ | 2,018,197 | |||||||||
Gross profit | 157,225 | 177,860 | 165,318 | 174,751 | 675,154 | ||||||||||||||
Net income attributable to Itron, Inc. | 15,845 | 14,097 | 25,576 | 1,780 | 57,298 | ||||||||||||||
Earnings per common share - Basic(1) | $ | 0.41 | $ | 0.36 | $ | 0.66 | $ | 0.05 | $ | 1.48 | |||||||||
Earnings per common share - Diluted(1) | $ | 0.40 | $ | 0.36 | $ | 0.65 | $ | 0.05 | $ | 1.45 | |||||||||
First Quarter | Second Quarter | Third Quarter | Fourth Quarter | Total Year | |||||||||||||||
(in thousands, except per share data) | |||||||||||||||||||
2016 | |||||||||||||||||||
Statement of operations data (unaudited): | |||||||||||||||||||
Revenues | $ | 497,590 | $ | 513,024 | $ | 506,859 | $ | 495,713 | $ | 2,013,186 | |||||||||
Gross profit | 163,203 | 169,705 | 170,749 | 156,663 | 660,320 | ||||||||||||||
Net income (loss) attributable to Itron, Inc. | 10,089 | 19,917 | (9,885 | ) | 11,649 | 31,770 | |||||||||||||
Earnings (loss) per common share - Basic(1) | $ | 0.27 | $ | 0.52 | $ | (0.26 | ) | $ | 0.30 | $ | 0.83 | ||||||||
Earnings (loss) per common share - Diluted(1) | $ | 0.26 | $ | 0.52 | $ | (0.26 | ) | $ | 0.30 | $ | 0.82 | ||||||||
(1) | The sum of the quarterly EPS data presented in the table may not equal the annual results due to rounding and the impact of dilutive securities on the annual versus the quarterly EPS calculations. |
During the fourth quarter of 2017, the Tax Act was enacted into law in the United States. We recognized provisional estimates for the impact of the Tax Act of $30.4 million to remeasure our deferred tax assets as a result of these legislative changes. This resulted in a decrease of $0.79 and $0.77 to basic and diluted earnings per share, respectively, for the three months ended December 31, 2017.
During the second quarter of 2017, we recognized an insurance recovery in our Water segment associated with warranty costs recognized as a result of our 2015 product replacement notification to customers who had purchased certain communication modules. As a result, gross profit increased $8.0 million for the three months ended June 30, 2017. After adjusting for the tax impact, the recovery resulted in an increase of $0.13 and $0.12 to basic and diluted earnings per share, respectively, for the three months ended June 30, 2017.
91
During the third quarter of 2016, we announced the 2016 Projects to restructure various company activities in order to improve operational efficiencies, reduce expenses and improve competiveness. As a result, we recognized $40.0 million and $7.8 million in restructuring costs during the third and fourth quarters of 2016, respectively, related to the 2016 Projects.
Note 19: Subsequent Events
Business Acquisition
On January 5, 2018, we completed our acquisition of SSNI by purchasing all outstanding shares for $16.25 per share, resulting in a total purchase price, net of cash, of approximately $810 million. All other business combination disclosures are not available due to the proximity of the acquisition to the issuance of these financial statements. During 2017, we incurred approximately $7 million of acquisition and integration related expenses associated with the SSNI acquisition.
SSNI provided Internet of Important ThingsTM connectivity platforms and solutions to utilities and cities. The acquisition continues our focus on expanding management services and SaaS solutions, which allows us to provide more value to our customers by optimizing devices, network technologies, outcomes and analytics.
Debt Refinancing
On January 5, 2018, we entered into the 2018 credit facility, which amended and restated the 2015 credit facility. The 2018 credit facility consists of a $650 million U.S. dollar term loan (the term loan) and a multicurrency revolving line of credit (the revolver) with a principal amount of up to $500 million. The revolver also contains a $300 million standby letter of credit sub-facility and a $50 million swingline sub-facility (available for immediate cash needs at a higher interest rate). Both the term loan and the revolver mature on January 5, 2023, and amounts borrowed under the revolver may be repaid and reborrowed until the revolver's maturity, at which time the revolver will terminate, and all outstanding loans, together with all accrued and unpaid interest, must be repaid. Amounts not borrowed under the revolver are subject to a commitment fee, which is paid in arrears on the last day of each fiscal quarter, ranging from 0.18% to 0.35% per annum depending on our total leverage ratio as of the most recently ended fiscal quarter. Amounts repaid on the term loan may not be reborrowed. The 2018 credit facility permits us and certain of our foreign subsidiaries to borrow in U.S. dollars, euros, British pounds, or, with lender approval, other currencies readily convertible into U.S. dollars. All obligations under the 2018 credit facility are guaranteed by Itron, Inc. and material U.S. domestic subsidiaries and are secured by a pledge of substantially all of the assets of Itron, Inc. and material U.S. domestic subsidiaries, including a pledge of 100% of the capital stock of material U.S. domestic subsidiaries and up to 66% of the voting stock (100% of the non-voting stock) of their first-tier foreign subsidiaries. In addition, the obligations of any foreign subsidiary who is a foreign borrower, as defined by the 2018 credit facility, are guaranteed by the foreign subsidiary and by its direct and indirect foreign parents.
Scheduled principal repayments for the term loan are due quarterly in the amount of $4.1 million from June 2018 through March 2019, $8.1 million from June 2019 through March 2020, $12.2 million from June 2020 through March 2021, $16.3 million from June 2021 through December 2022, and the remainder due at maturity on January 5, 2023. The term loan may be repaid early in whole or in part, subject to certain minimum thresholds, without penalty.
Under the 2018 credit facility, we elect applicable market interest rates for both the term loan and any outstanding revolving loans. We also pay an applicable margin, which is based on our total leverage ratio (as defined in the credit agreement). The applicable rates per annum may be based on either: (1) the LIBOR rate or EURIBOR rate (floor of 0%), plus an applicable margin, or (2) the Alternate Base Rate, plus an applicable margin. The Alternate Base Rate election is equal to the greatest of three rates: (i) the prime rate, (ii) the Federal Reserve effective rate plus 1/2 of 1%, or (iii) one month LIBOR plus 1%. At January 5, 2018, the interest rate for both the term loan and the USD revolver was 3.56% (the LIBOR rate plus a margin of 2.00%), and the interest rate for the EUR revolver was 2.00% (the EURIBOR floor rate plus a margin of 2.00%).
Senior Notes
On January 19, 2018, we closed an offering of an additional $100 million aggregate principal amount of our 5.00% senior notes which were issued pursuant to the Indenture, as disclosed in Note 6: Debt.
2018 Restructuring Projects
On February 22, 2018, our Board of Directors approved a restructuring plan (2018 Projects). The 2018 Projects will include activities that continue our efforts to optimize our global supply chain and manufacturing operations, product development, and sales and marketing organizations. We expect to substantially complete the plan by the end of 2020. We estimate pre-tax restructuring charges of $100 million to $110 million with approximately 20% related to closing or consolidating facilities and non-manufacturing operations and approximately 80% associated with severance and other one-time termination benefits. Of the total estimated charge, approximately 95% will result in cash expenditures. We expect to record the majority of the charges in the first quarter of 2018.
92
ITEM 9: | CHANGES IN AND DISAGREEMENTS WITH ACCOUNTANTS ON ACCOUNTING AND FINANCIAL DISCLOSURE |
There were no disagreements with our independent accountants on accounting and financial disclosure matters within the three year period ended December 31, 2017, or in any period subsequent to such date, through the date of this report.
ITEM 9A: CONTROLS AND PROCEDURES
Evaluation of disclosure controls and procedures
An evaluation was performed under the supervision and with the participation of our Company’s management, including the Chief Executive Officer and Chief Financial Officer, of the effectiveness of the design and operation of the Company’s disclosure controls and procedures (as such term is defined in Rules 13a-15(e) and 15d-15(e)) under the Securities Exchange Act of 1934 as amended. Based on that evaluation, the Company’s management, including the Chief Executive Officer and Chief Financial Officer, concluded that as of December 31, 2017, the Company’s disclosure controls and procedures were effective to ensure the information required to be disclosed by an issuer in the reports that it files or submits under the Securities Exchange Act of 1934 is accumulated and communicated to our management, including our principal executive and principal financial officers, or persons performing similar functions, as appropriate to allow timely decisions regarding required disclosure. There are inherent limitations to the effectiveness of any system of disclosure controls and procedures, including the possibility of human error and the circumvention or overriding of the controls and procedures. Accordingly, even effective disclosure controls and procedures can only provide reasonable assurance of achieving their control objectives.
Management’s Annual Report on Internal Control Over Financial Reporting
Our management is responsible for establishing and maintaining adequate internal control over financial reporting, as such term is defined in Exchange Act Rules 13a-15(f). Under the supervision and with the participation of our management, including our Chief Executive Officer and Chief Financial Officer, we conducted an evaluation of the effectiveness of our internal control over financial reporting based on the framework in Internal Control— Integrated Framework issued by the Committee of Sponsoring Organizations of the Treadway Commission (2013 Framework). Based on our evaluation under the 2013 Framework, management concluded that our internal control over financial reporting was effective as of December 31, 2017.
On June 1, 2017, we completed the acquisition of Comverge by purchasing the stock of its parent, Peak Holding Corp. (Comverge). For further discussion of the Comverge acquisition, refer to Item 8: “Financial Statements, Note 17: Business Combinations.” The Securities and Exchange Commission permits companies to exclude acquisitions from their assessment of internal control over financial reporting during the first year of an acquisition, and our management has elected to exclude Comverge from our assessment as of December 31, 2017. Comverge constituted 1% and 2% of our consolidated total assets and revenues as of and for the year ended December 31, 2017, respectively.
The effectiveness of our internal control over financial reporting as of December 31, 2017 has been audited by Deloitte & Touche LLP, an independent registered public accounting firm, as stated in their report that is included in this Annual Report on Form 10-K.
Changes in internal control over financial reporting
In the ordinary course of business, we review our system of internal control over financial reporting and make changes to our applications and processes to improve such controls and increase efficiency, while ensuring that we maintain an effective internal control environment. Changes may include such activities as implementing new, more efficient applications and automating manual processes. We are currently upgrading our global enterprise resource software applications at certain of our locations outside of the United States as well as locations acquired through acquisitions. We will continue to upgrade our financial applications in stages, and we believe the related changes to processes and internal controls will allow us to be more efficient and further enhance our internal control over financial reporting.
As described in Item 8: “Financial Statements and Supplementary Data, Note 1: Summary of Significant Accounting Policies” included in this Annual Report on Form 10-K, we will adopt Accounting Standards Update (ASU) 2014-09, Revenue from Contracts with Customers: Topic 606 effective January 1, 2018. As we continue to evaluate and prepare to implement this new revenue recognition standard, we have modified certain internal controls over financial reporting to address risks associated with the required revenue recognition methodology and related disclosure requirements. This includes enhancing controls to address risks associated with the five-step model for recognizing revenue, including the revision of our contract review controls and assessing what impacts the new standard will have. We have also implemented controls associated with the allocation of revenue associated with our complex contracts with multiple performance obligations, and developed a model and review process to assist with the
93
allocation and disclosure requirements. Additional revenue recognition controls will be implemented following adoption of the standard.
Except for these changes, there have been no other changes in our internal control over financial reporting during the three months ended December 31, 2017 that materially affected, or are reasonably likely to materially affect, internal control over financial reporting.
94
REPORT OF INDEPENDENT REGISTERED PUBLIC ACCOUNTING FIRM
To the Board of Directors and Shareholders of Itron, Inc.
Opinion on Internal Control over Financial Reporting
We have audited the internal control over financial reporting of Itron, Inc. and subsidiaries (the “Company”) as of December 31, 2017, based on criteria established in Internal Control - Integrated Framework (2013) issued by the Committee of Sponsoring Organizations of the Treadway Commission (COSO). In our opinion, the Company maintained, in all material respects, effective internal control over financial reporting as of December 31, 2017, based on criteria established in Internal Control - Integrated Framework (2013) issued by COSO.
We have also audited, in accordance with the standards of the Public Company Accounting Oversight Board (United States) (PCAOB), the consolidated financial statements as of and for the year ended December 31, 2017, of the Company and our report dated February 28, 2018, expressed an unqualified opinion on those financial statements.
As described in Management’s Annual Report on Internal Control Over Financial Reporting, management excluded from its assessment the internal control over financial reporting at Comverge, which was acquired on June 1, 2017 and whose financial statements constitute 1% and 2% of consolidated total assets and revenues, respectively, as of and for the year ended December 31, 2017. Accordingly, our audit did not include the internal control over financial reporting at Comverge.
Basis for Opinion
The Company’s management is responsible for maintaining effective internal control over financial reporting and for its assessment of the effectiveness of internal control over financial reporting, included in the accompanying Management’s Annual Report on Internal Control Over Financial Reporting. Our responsibility is to express an opinion on the Company’s internal control over financial reporting based on our audit. We are a public accounting firm registered with the PCAOB and are required to be independent with respect to the Company in accordance with the U.S. federal securities laws and the applicable rules and regulations of the Securities and Exchange Commission and the PCAOB.
We conducted our audit in accordance with the standards of the PCAOB. Those standards require that we plan and perform the audit to obtain reasonable assurance about whether effective internal control over financial reporting was maintained in all material respects. Our audit included obtaining an understanding of internal control over financial reporting, assessing the risk that a material weakness exists, testing and evaluating the design and operating effectiveness of internal control based on the assessed risk, and performing such other procedures as we considered necessary in the circumstances. We believe that our audit provides a reasonable basis for our opinion.
Definition and Limitations of Internal Control over Financial Reporting
A company’s internal control over financial reporting is a process designed to provide reasonable assurance regarding the reliability of financial reporting and the preparation of financial statements for external purposes in accordance with generally accepted accounting principles. A company’s internal control over financial reporting includes those policies and procedures that (1) pertain to the maintenance of records that, in reasonable detail, accurately and fairly reflect the transactions and dispositions of the assets of the company; (2) provide reasonable assurance that transactions are recorded as necessary to permit preparation of financial statements in accordance with generally accepted accounting principles, and that receipts and expenditures of the company are being made only in accordance with authorizations of management and directors of the company; and (3) provide reasonable assurance regarding prevention or timely detection of unauthorized acquisition, use, or disposition of the company’s assets that could have a material effect on the financial statements.
Because of its inherent limitations, internal control over financial reporting may not prevent or detect misstatements. Also, projections of any evaluation of effectiveness to future periods are subject to the risk that controls may become inadequate because of changes in conditions, or that the degree of compliance with the policies or procedures may deteriorate.
/s/ DELOITTE & TOUCHE LLP
Seattle, Washington
February 28, 2018
95
ITEM 9B: OTHER INFORMATION
No information was required to be disclosed in a report on Form 8-K during the fourth quarter of 2017 that was not reported.
96
PART III
ITEM 10: DIRECTORS, EXECUTIVE OFFICERS AND CORPORATE GOVERNANCE
The section entitled “Proposal 1 – Election of Directors” appearing in our Proxy Statement for the Annual Meeting of Shareholders to be held on May 10, 2018 (the 2018 Proxy Statement) sets forth certain information with regard to our directors as required by Item 401 of Regulation S-K and is incorporated herein by reference.
Certain information with respect to persons who are or may be deemed to be executive officers of Itron, Inc. as required by Item 401 of Regulation S-K is set forth under the caption “Executive Officers” in Part I of this Annual Report on Form 10-K.
The section entitled “Section 16(a) Beneficial Ownership Reporting Compliance” appearing in the 2018 Proxy Statement sets forth certain information as required by Item 405 of Regulation S-K and is incorporated herein by reference.
The section entitled “Corporate Governance” appearing in the 2018 Proxy Statement sets forth certain information with respect to the Registrant’s code of conduct and ethics as required by Item 406 of Regulation S-K and is incorporated herein by reference. Our code of conduct and ethics can be accessed on our website, at www.itron.com under the Investors section.
There were no material changes to the procedures by which security holders may recommend nominees to Itron's board of directors during 2018, as set forth by Item 407(c)(3) of Regulation S-K.
The section entitled “Corporate Governance” appearing in the 2018 Proxy Statement sets forth certain information regarding the Audit/Finance Committee, including the members of the Committee and the Audit/Finance Committee financial experts, as set forth by Item 407(d)(4) and (d)(5) of Regulation S-K and is incorporated herein by reference.
ITEM 11: EXECUTIVE COMPENSATION
The sections entitled “Compensation of Directors” and “Executive Compensation” appearing in the 2018 Proxy Statement set forth certain information with respect to the compensation of directors and management of Itron as required by Item 402 of Regulation S-K and are incorporated herein by reference.
The section entitled “Corporate Governance” appearing in the 2018 Proxy Statement sets forth certain information regarding members of the Compensation Committee required by Item 407(e)(4) of Regulation S-K and is incorporated herein by reference.
The section entitled “Compensation Committee Report” appearing in the 2018 Proxy Statement sets forth certain information required by Item 407(e)(5) of Regulation S-K and is incorporated herein by reference.
ITEM 12: | SECURITY OWNERSHIP OF CERTAIN BENEFICIAL OWNERS AND MANAGEMENT AND RELATED STOCKHOLDER MATTERS |
The section entitled “Equity Compensation Plan Information” appearing in the 2018 Proxy Statement sets forth certain information required by Item 201(d) of Regulation S-K and is incorporated herein by reference.
The section entitled “Security Ownership of Certain Beneficial Owners and Management” appearing in the 2018 Proxy Statement sets forth certain information with respect to the ownership of our common stock as required by Item 403 of Regulation S-K and is incorporated herein by reference.
ITEM 13: CERTAIN RELATIONSHIPS AND RELATED TRANSACTIONS, AND DIRECTOR INDEPENDENCE
The section entitled “Corporate Governance” appearing in the 2018 Proxy Statement sets forth certain information required by Item 404 of Regulation S-K and is incorporated herein by reference.
The section entitled “Corporate Governance” appearing in the 2018 Proxy Statement sets forth certain information with respect to director independence as required by Item 407(a) of Regulation S-K and is incorporated herein by reference.
97
ITEM 14: PRINCIPAL ACCOUNTING FEES AND SERVICES
The section entitled “Independent Registered Public Accounting Firm’s Audit Fees and Services” appearing in the 2018 Proxy Statement sets forth certain information with respect to the principal accounting fees and services and the Audit/Finance Committee’s policy on pre-approval of audit and permissible non-audit services performed by our independent auditors as required by Item 9(e) of Schedule 14A and is incorporated herein by reference.
98
PART IV
ITEM 15: EXHIBITS, FINANCIAL STATEMENT SCHEDULE
(a) (1) Financial Statements:
The financial statements required by this item are submitted in Item 8 of this Annual Report on Form 10-K.
(a) (2) Financial Statement Schedule:
All schedules have been omitted because of the absence of conditions under which they are required or because the required information is included in the consolidated financial statements or the notes thereto.
(a) (3) Exhibits:
Exhibit Number | Description of Exhibits | |
2.1 | ||
3.1 | ||
3.2 | ||
4.1 | ||
4.2 | ||
4.3 | ||
4.4 | ||
10.1* | ||
10.2* | ||
10.3* | ||
10.4* | ||
10.5* | ||
99
Exhibit Number | Description of Exhibits | |
10.6* | ||
10.7* | ||
10.8* | ||
10.9* | ||
10.10* | ||
10.11* | ||
10.12* | ||
10.13* | ||
10.14* | ||
10.15* | ||
10.16* | ||
10.17* | ||
10.18* | ||
10.19* | ||
10.20* | ||
100
Exhibit Number | Description of Exhibits | |
10.21* | ||
10.22* | ||
10.23* | ||
10.24* | ||
10.25* | ||
10.26 | ||
10.27 | ||
10.28 | ||
10.29* | ||
10.30* | ||
10.31* | ||
12.1 | ||
21.1 | ||
23.1 | ||
23.2 | ||
31.1 | ||
31.2 | ||
32.1 | ||
101
Exhibit Number | Description of Exhibits | |
101.INS | XBRL Instance Document. (submitted electronically with this report in accordance with the provisions of Regulation S-T) | |
101.SCH | XBRL Taxonomy Extension Schema. (submitted electronically with this report in accordance with the provisions of Regulation S-T) | |
101.CAL | XBRL Taxonomy Extension Calculation Linkbase. (submitted electronically with this report in accordance with the provisions of Regulation S-T) | |
101.DEF | XBRL Taxonomy Extension Definition Linkbase. (submitted electronically with this report in accordance with the provisions of Regulation S-T) | |
101.LAB | XBRL Taxonomy Extension Label Linkbase. (submitted electronically with this report in accordance with the provisions of Regulation S-T) | |
101.PRE | XBRL Taxonomy Extension Presentation Linkbase. (submitted electronically with this report in accordance with the provisions of Regulation S-T) | |
* | Management contract or compensatory plan or arrangement. | |
102
SIGNATURES
Pursuant to the requirements of Section 13 or 15(d) of the Securities Exchange Act of 1934, the Registrant has duly caused this report to be signed on its behalf by the undersigned, thereunto duly authorized, in the City of Liberty Lake, State of Washington, on the 28th day of February, 2018.
ITRON, INC. | ||
By: | /s/ JOAN S. HOOPER | |
Joan S. Hooper | ||
Senior Vice President and Chief Financial Officer | ||
Pursuant to the requirements of the Securities Exchange Act of 1934, this report has been signed below by the following persons on behalf of the Registrant and in the capacities indicated on the 28th day of February, 2018.
Signatures | Title | |
/s/ PHILIP C. MEZEY | ||
Philip C. Mezey | President and Chief Executive Officer (Principal Executive Officer), Director | |
/s/ JOAN S. HOOPER | ||
Joan S. Hooper | Senior Vice President and Chief Financial Officer | |
/s/ KIRBY A. DYESS | ||
Kirby A. Dyess | Director | |
/s/ THOMAS S. GLANVILLE | ||
Thomas S. Glanville | Director | |
/s/ FRANK M. JAEHNERT | ||
Frank M. Jaehnert | Director | |
/s/ JEROME J. LANDE | ||
Jerome J. Lande | Director | |
/s/ TIMOTHY M. LEYDEN | ||
Timothy M. Leyden | Director | |
/s/ PETER MAINZ | ||
Peter Mainz | Director | |
/s/ DANIEL S. PELINO | ||
Daniel S. Pelino | Director | |
/s/ GARY E. PRUITT | ||
Gary E. Pruitt | Director | |
/s/ DIANA D. TREMBLAY | ||
Diana D. Tremblay | Director | |
/s/ LYNDA L. ZIEGLER | ||
Lynda L. Ziegler | Chair of the Board | |
103