Attached files
| file | filename |
|---|---|
| EX-32.2 - EXHIBIT 32.2 - TOWN SPORTS INTERNATIONAL HOLDINGS INC | ex-322x123117.htm |
| EX-32.1 - EXHIBIT 32.1 - TOWN SPORTS INTERNATIONAL HOLDINGS INC | ex-321x123117.htm |
| EX-31.2 - EXHIBIT 31.2 - TOWN SPORTS INTERNATIONAL HOLDINGS INC | ex-312x123117.htm |
| EX-31.1 - EXHIBIT 31.1 - TOWN SPORTS INTERNATIONAL HOLDINGS INC | ex-311x123117.htm |
| EX-23.1 - EXHIBIT 23.1 - TOWN SPORTS INTERNATIONAL HOLDINGS INC | ex-231x123117.htm |
| EX-21 - EXHIBIT 21 - TOWN SPORTS INTERNATIONAL HOLDINGS INC | ex-21x123117.htm |
UNITED STATES
SECURITIES AND EXCHANGE COMMISSION
WASHINGTON, D.C. 20549
FORM 10-K
þ | Annual Report pursuant to Section 13 OR 15(d) of the Securities Exchange Act of 1934 |
For the fiscal year ended December 31, 2017 | |
¨ | Transition Report pursuant to Section 13 OR 15(d) of the Securities Exchange Act of 1934 |
For the transition period from to | |
Commission file number: 001-36803
Town Sports International Holdings, Inc.
(Exact name of Registrant as specified in its charter)
DELAWARE | 20-0640002 | |
(State or other jurisdiction of incorporation or organization) | (I.R.S. Employer Identification No.) | |
1001 US North Highway 1, Suite 201, Jupiter, Florida 33477
(Address and zip code of Registrant’s principal executive office)
399 Executive Boulevard, Elmsford, New York 10523
(Mailing address)
(212) 246-6700
(Registrant’s telephone number, including area code)
Securities registered pursuant to Section 12(b) of the Act:
Title of Each Class | Name of Each Exchange on Which Registered | |
Common Stock, $0.001 par value | The NASDAQ Stock Market LLC | |
Securities registered pursuant to Section 12(g) of the Act: None
Indicate by check mark if the registrant is a well-known seasoned issuer, as defined in Rule 405 of the Securities Act. Yes ¨ No þ
Indicate by check mark if the registrant is not required to file reports pursuant to Section 13 or 15(d) of the Securities Exchange Act of 1934. Yes ¨ No þ
Indicate by check mark whether the Registrant (1) has filed all reports required to be filed by Section 13 or 15(d) of the Securities Exchange Act of 1934 during the preceding 12 months (or for such shorter period that the Registrant was required to file such reports), and (2) has been subject to such filing requirement for the past 90 days. Yes þ No ¨
Indicate by check mark whether the registrant has submitted electronically and posted on its corporate Web site, if any, every Interactive Data File required to be submitted and posted pursuant to Rule 405 of Regulation S-T (§ 232.405 of this chapter) during the preceding 12 months (or for such shorter period that the registrant was required to submit and post such files). Yes þ No ¨
Indicate by check mark if disclosure of delinquent filers pursuant to Item 405 of Regulation S-K is not contained herein, and will not be contained, to the best of Registrant’s knowledge, in definitive proxy or information statements incorporated by reference in Part IV of this Form 10-K or any amendment to this Form 10-K. ¨
Indicate by check mark whether the registrant is a large accelerated filer, an accelerated filer, a non-accelerated filer, a smaller reporting company, or an emerging growth company. See the definitions of “large accelerated filer,” “accelerated filer”, “smaller reporting company,” and “emerging growth company” in Rule 12b-2 of the Exchange Act. (Check one):
Large accelerated filer | ¨ | Accelerated filer | ¨ | |||
Non-accelerated filer | ¨ (Do not check if a smaller reporting company) | Smaller reporting company | þ | |||
Emerging growth company | ¨ | |||||
If an emerging growth company, indicate by check mark if the Registrant has elected not to use the extended transition period for complying with any new or revised financial accounting standards provided pursuant to Section 13(a) of the Exchange Act. ¨
Indicate by check mark whether the registrant is a shell company (as defined in Rule 12b-2 of the Exchange Act). Yes ¨ No þ
The aggregate market value of the voting common stock held by non-affiliates of the registrant as of June 30, 2017 (the last business day of the registrant’s most recently completed second fiscal quarter) was approximately $69.6 million (computed by reference to the last reported sale price on The Nasdaq National Market on that date). The registrant does not have any non-voting common stock outstanding.
As of February 23, 2018, there were 27,210,377 shares of Common Stock of the Registrant outstanding.
DOCUMENTS INCORPORATED BY REFERENCE
Portions of the registrant’s definitive proxy statement for the 2018 Annual Meeting of Stockholders, to be filed not later than April 30, 2018 are incorporated by reference into Items 10, 11, 12, 13 and 14 of Part III of this Form 10-K.
TABLE OF CONTENTS
Item 1. | ||
Item 1A. | ||
Item 1B. | ||
Item 2. | ||
Item 3. | ||
Item 4. | ||
Item 5. | ||
Item 6. | ||
Item 7. | ||
Item 7A. | ||
Item 8. | ||
Item 9. | ||
Item 9A. | ||
Item 9B. | ||
Item 10. | ||
Item 11. | ||
Item 12. | ||
Item 13. | ||
Item 14. | ||
Item 15. | ||
Item 16. | ||
TOWN SPORTS INTERNATIONAL HOLDINGS, INC.
PART I
FORWARD-LOOKING STATEMENTS
This Annual Report on Form 10-K (this “Annual Report”) contains “forward-looking” statements within the meaning of the Private Securities Litigation Reform Act of 1995, including, without limitation, statements regarding future financial results and performance, potential sales revenue, potential club closures, results of cost savings initiatives, legal contingencies and tax benefits and contingencies, future declarations and payments of dividends, and the existence of adverse litigation and other risks, uncertainties and factors set forth under Item 1A., entitled “Risk Factors,” of this Annual Report and in our other reports and documents filed with the Securities and Exchange Commission (“SEC”). You can identify these forward-looking statements by the use of words such as “outlook,” “believes,” “expects,” “potential,” “continues,” “may,” “will,” “should,” “seeks,” “approximately,” “predicts,” “intends,” “plans,” “estimates,” “anticipates,” “target,” “could,” or the negative version of these words or other comparable words. These statements are subject to various risks and uncertainties, many of which are outside our control, including, among others, the level of market demand for our services, economic conditions affecting our business, the success of our pricing model, the geographic concentration of our clubs, competitive pressure, the ability to achieve reductions in operating costs and to continue to integrate acquisitions, outsourcing of certain aspects of our business, environmental matters, the application of federal and state tax laws and regulations, any security and privacy breaches involving customer data, the levels and terms of the Company’s indebtedness, and other specific factors discussed herein and in other SEC filings made by us. We believe that all forward-looking statements are based on reasonable assumptions when made; however, we caution that it is impossible to predict actual results or outcomes or the effects of risks, uncertainties or other factors on anticipated results or outcomes and that, accordingly, one should not place undue reliance on these statements. Forward-looking statements speak only as of the date when made, and we undertake no obligation to update these statements in light of subsequent events or developments. Actual results may differ materially from anticipated results or outcomes discussed in any forward-looking statement.
Item 1. Business
In this Annual Report, unless otherwise stated or the context otherwise indicates, references to “the Company,” “we,” “our,” “TSI Holdings” and similar references refer to Town Sports International Holdings, Inc. and its subsidiaries. References to “TSI, LLC” refer to Town Sports International, LLC, and “TSI Group” refer to Town Sports Group, LLC, both of which are wholly-owned operating subsidiaries of the Company. The Company is a diversified holding company owning subsidiaries engaged in a number of business and investment activities. The Company’s largest operating subsidiary, TSI, LLC, has been involved in the fitness industry since 1973 and has grown to become one of the largest owners and operators of fitness clubs in the Northeast region of the United States (“U.S.”). TSI Group was formed in 2017 to invest in public and private equities and real estate. TSI Holdings’ corporate structure provides flexibility to make investments across a broad spectrum of industries in order to create long-term value for stockholders.
General
Based on the number of clubs, we are one of the leading owners and operators of fitness clubs in the Northeast region of the United States. As of December 31, 2017, the Company, through its subsidiaries, owned and operated 165 fitness clubs (“clubs”). Our clubs collectively served approximately 587,000 members as of December 31, 2017. As of December 31, 2017, we owned and operated a total of 119 clubs in the New York metropolitan region (102 of which were under the “New York Sports Clubs” brand name, 16 of which were under the “Lucille Roberts” brand name and one of which was under the “TMPL” brand name), including 39 locations in Manhattan where we are one of the largest fitness club owners and operators. Additionally, we owned and operated 28 clubs in the Boston metropolitan region under our “Boston Sports Clubs” brand name, 10 clubs (one of which is partly-owned) in the Washington, D.C. metropolitan region under our “Washington Sports Clubs” brand name and five clubs in the Philadelphia metropolitan region under our “Philadelphia Sports Clubs” brand name, and three clubs in Switzerland. In addition, as of December 31, 2017, we have one partly-owned club that operates under a different brand name in Washington, D.C. We employ localized brand names for our clubs to create an image and atmosphere consistent with the local community and to foster recognition as a local network of quality fitness clubs rather than a national chain.
1
In 2017, we acquired a total of 18 clubs. We acquired the Lucille Roberts Health Club business (“Lucille Roberts”), which added 16 clubs to our portfolio. These 16 clubs continue to operate as women only clubs under the Lucille Roberts trade name. We also acquired one existing club in Massapequa, NY, currently operating under the New York Sports Clubs brand name, including the land and the building such club occupies, as well as TMPL Gym (“TMPL”), an existing club in Manhattan, which continues to operate under the TMPL brand name. TMPL is the Company’s luxury brand that the Company plans to expand. All 18 acquisitions were additions to our portfolio in the New York metropolitan region. The results of operations of the clubs acquired have been included in our consolidated financial statements from the respective dates of such acquisitions.
We develop clusters of clubs to serve densely populated major metropolitan regions and we service such populations by clustering clubs near the highest concentrations of our target customers’ areas of both employment and residence. Our clubs are located for maximum convenience to our members in urban or suburban areas, close to transportation hubs or office or retail centers. Our members include a wide age demographic covering the student market to the active mature market. In each of our regions, we have developed clusters by initially opening or acquiring clubs located in the more central urban markets of the region and then branching out from these urban centers to suburbs and neighboring communities.
Over our 44-year history, since incorporating in 1973, we have developed and refined our club formats, which allows us to cost-effectively construct and efficiently operate our fitness clubs in the different real estate environments in which we operate. Our fitness-only clubs average approximately 19,000 square feet, while our multi-recreational clubs average approximately 38,000 square feet. The aggregate average size of our clubs is approximately 25,000 square feet. Our clubs typically have an open fitness area to accommodate cardiovascular and strength-training equipment, as well as special purpose rooms for group fitness classes and other exercise programs. We seek to provide a broad array of high-quality exercise programs and equipment that are popular and effective, promoting a quality exercise experience for our members. When developing clubs, we carefully examine the potential membership base and the likely demand for supplemental offerings such as swimming, basketball, children’s programs, tennis or squash and, provided suitable real estate is available, we will add one or more of these offerings to our fitness-only format. For example, a multi-recreational club in a family market may include Sports Clubs for Kids programs, which can include swim lessons and sports camps for children.
Industry Overview
According to the most recent information released by the International Health, Racquet and Sports Club Association (“IHRSA”), the U.S. health club industry posted growth in revenue, memberships, and number of club locations. Revenue grew from 6.9% to $27.6 billion in 2016 from $25.8 billion in 2015, while club count increased 1.1% to 36,540 sites in 2016 from 36,160 in 2015. Roughly 57.3 million Americans belonged to a health club in 2016, up from 55.3 million in 2015. According to the IHRSA, the health club landscape extends beyond traditional, full-service fitness centers that serve local communities and all age groups as well as affordable fitness centers with basic amenities. Studio concepts, including boxing, yoga, Pilates, group cycling, barre, boot camps, and sports-specific training, also shape the club market.
According to the IHRSA, the average age of a health club member in 2016 was 39 years old. One-third of health club members, which is the most represented age group, were between the ages of 35-54 years old. The second most represented age group was 18-34 years old, which represented 28% of health club members. The oldest, the over-55 age group, represented 24% of all health club members, while those under age 18 represented 15% of all health club members. The number of health club members under age 18 has grown from 5.3 million in 2012 to 8.7 million in 2016.
As the numbers showed in 2016, the health club industry reported growth in all three key indicators: revenue, membership, and club count. Still, more than 27% of Americans remain inactive, as reported by the Physical Activity Council. More than two out of five Americans do not participate in any of the 120 activities measured by the Physical Activity Council. We are in a unique position to address physical inactivity as the health club serves as a hub for health, wellness and exercise. As the focus on exercise and overall healthy lifestyles continue to impact the health club industry, we believe that we are well positioned to benefit from these dynamics as a large operator with recognized brand names, leading regional market shares and an established operating history.
Competitive Strengths
We believe the following competitive strengths are instrumental to our success:
Strong market position with leading brands. Based on number of clubs, we are one of the largest owners and operators of fitness clubs in the Northeast region of the U.S. In 2017, we acquired 18 clubs in the New York metropolitan region. Our strong real estate presence in the New York, Boston, Washington, D.C., and Philadelphia metropolitan regions enhances convenience to our members. We attribute our positions in these markets in part to the strength of our localized owner and operator brand names, which foster recognition as a local network of quality fitness clubs.
2
Regional clustering strategy provides significant benefits to members and corporations. By operating a network of clubs in a concentrated geographic area, the value of our memberships is enhanced by our ability to offer members access to any of our clubs, which provides the convenience of having fitness clubs near a member’s workplace and home. This is also a benefit to our corporate members, as many corporations have employees that will take advantage of multiple gym locations. Approximately 226,000, or 39%, of our members currently have a passport, elite or flagship membership, and because these memberships offer enhanced privileges and greater convenience, they typically generate higher monthly dues than our single club memberships in each respective region. Regional clustering also allows us to provide special facilities to all of our members within a local area, such as swimming pools and squash, tennis and basketball courts, without offering them at every location. In the year ended December 31, 2017, approximately 28% of all club usage was by members visiting clubs other than their home clubs.
Regional clustering strategy designed to enhance revenues and achieve economies of scale. We believe our regional clustering strategy allows us to enhance revenue and earnings growth by providing high-quality, conveniently located fitness facilities on a cost-effective basis. We believe that potential new entrants would need to establish or acquire a large number of clubs in a market to compete effectively with us. Our clustering strategy also enables us to achieve economies of scale with regard to sales, marketing, purchasing, general operations and corporate administrative expenses and reduces our capital spending needs. Regional clustering also provides the opportunity for members who relocate within a region to remain members of our clubs, thus aiding in member retention.
Business Strategy
In the long-term, we seek to maximize our net member growth, revenues, earnings and cash flows using the following strategies:
Growth through acquisitions. We plan to expand our club base through selective acquisitions. We believe this is an important element of our corporate strategy as it strengthens our competitive position and expands and enhances the services that we can offer to members. In 2017, we acquired 18 clubs in the New York metropolitan region and constructed and opened two clubs. In January 2018, we acquired two additional clubs. We expect to continue to acquire selective clubs to continue our expansion of club offerings, including clubs outside of our current regions. In the event we build and acquire additional new clubs, the club expansion is expected to be funded with cash on hand or through internally generated cash flows. We may also consider certain acquisitions other than health clubs to diversify the business while enhancing shareholder value.
Grow membership revenues. We seek to grow our membership revenues in existing clubs through driving membership growth and optimizing dues and member retention. We believe our offerings are compelling because we include group exercise classes, top of the line equipment, pools and courts in the price of certain memberships, when available. Our member count increased by 43,000 members for a total member count of 587,000 in 2017 and we will continue to consider and make pricing adjustments in order to increase revenue while also driving membership growth.
Grow ancillary and other non-membership revenues. We intend to grow our ancillary and other non-membership revenues through a continued focus on increasing the additional value-added services that we provide to our members. We offer a multi-session personal training membership product and fee-based Small Group Training classes to generate additional revenue. In addition, we offer Sports Clubs for Kids programs at select clubs.
Optimization of our clubs. We remain committed to optimizing our existing club base, including club closures when appropriate. We closed five clubs in 2017. We expect these profit margin initiatives will enable us to improve in club level economics across our portfolio, and to offset the competitive pressure in the geographic regions in which we compete.
Retain members by focusing on the member experience. Our Company’s mission is “Bring the best out of every body.” By building and nurturing a strong consumer centric culture, we are able to provide a clear road map for how we serve our members and deliver a superior experience. We tailor the hours of each club to the needs of the specific member demographic utilizing each club and offer a variety of ancillary services, including personal training, group classes, Small Group Training and Sports Clubs for Kids programs. We offer a variety of different sports facilities in each regional cluster of clubs; modern, varied and well-maintained exercise and fitness equipment; and an assortment of additional amenities including access to babysitting. Through hiring, developing and training a qualified and diverse team that is passionate about fitness and health; maintaining and enhancing our programs and services; continually increasing our attention to individual member needs; and investing in our digital ecosystem, we expect to demonstrate our commitment to increase the quality of the member experience, and thereby increase net membership. To better measure the member experience, we utilize social media to help analyze the areas we can improve upon as well as the areas in which the members are satisfied overall.
3
Provide fitness experiences and services. We help educate our members to best practices in their pursuit of fitness, wellness and healthy lifestyles and each of our clubs has an array of cardiovascular machines, resistance training equipment, free weights and functional training zones. We have technicians who service and maintain our equipment on a timely basis. In addition, we have personal viewing television screens on most pieces of cardiovascular equipment which accommodate individual preferences and viewing, and many cardio machines now include embedded technology that offers both entertainment and tracking features that record workout results and communicate with many mobile technologies. Most clubs have between one and three studios used for exercise classes, including at least one large studio used for most group exercise classes, a cycling studio and a mind and body studio used for yoga and Pilates classes. We further offer a large variety of group fitness classes at each club and these classes are accessible to all members. The volume and variety of activities at each club allow each member to enjoy the club, whether customizing their own workout or participating in group activities and classes. In addition, we have a functional training zone within our clubs that features an array of innovative equipment designed to maximize the member’s workout. The functional training zones include a variety of functional training equipment, such as Total Body Resistance Exercise (“TRX” brand) suspension training frame, Kettle Bells, Battle Ropes and Power Sleds. Our functional training zones are open to members for free self-guided workouts, personal training sessions and fee-based programs.
Marketing
Our in-house marketing team is responsible for brand positioning, brand strategy, and product innovation for the Company and all of its subsidiaries. The primary objective is to ensure that our brands seize market share and opportunities through well-defined and coordinated go-to-market strategies. We are organized to enable close collaboration between our marketing, sales and operations staff, which helps to align efforts around operational objectives and new product development. We seek to inspire brand experiences and in doing so, drive sustainable and quality growth, while building a strong reputation and loyalty with both existing members and future members. In order to have credible and authentic connections to create such desirability with our audience, we utilize a market segmentation strategy. A marketing segmentation strategy divides our target market into subgroups, whereby consumers in each of these subgroups share one or more characteristics. Using this knowledge, we develop specific plans, including personalized and mass marketing, to reach these targeted customers effectively. We seek to identify and understand consumers’ individual motivations and goals in an effort to create meaningful products, services and experiences that build a lasting impression and brand loyalty.
Sales
We sell our memberships primarily through three channels: direct sales at the club level; through corporate and group sales; and through our online website. Through our corporate and group sales approach we concentrate on building long-term relationships with local and regional companies, organizations and other large groups.
We also sell individual memberships online for our standard membership types and the websites enable us to sell memberships for pre-established corporate and group programs. The websites also allow our members to give us direct feedback about our service levels and enables prospective members to sign up for a free one-day pass or purchase a 30 day guest pass. The online sales channel offers a high degree of convenience for customers who know and trust our brand and do not require up-front interaction with a membership sales consultant to make their decision. In addition, selling online significantly reduces our cost of sale. The websites also provide information about the respective club locations, program offerings, exercise class schedules and sales promotions. Job seekers can also begin the employment application process through the respective websites and investors can access financial information and resources.
Memberships
We believe that clustering clubs allows us to sell memberships based upon the opportunity for members to utilize multiple club locations near their workplace and their home. We offer various types of memberships at our clubs that include either single club or multiple club access and either month-to-month or one-year commitment options.
Our single club memberships are sold in the range of $19.99 and $64.99 per month.
We also offer various multiple-club memberships that include access to certain clusters of clubs, including our Passport Membership which provides access to all of the clubs in our four regions with the exception of certain “Elite” clubs and one “flagship” club. The Passport Membership is currently priced at $89.99 for the month-to-month option and $79.99 for the one-year commitment option. Additionally, the Company offers both Elite and Flagship Memberships. The Flagship Membership provides access to all of our clubs, including our Flagship club and all Elite clubs. The Elite Membership includes access to all clubs, including our Elite clubs, with the exception of our Flagship club. Elite and Flagship memberships range in price generally from $89.99 to $120.00 per month.
4
The membership prices above are dependent on club location and whether the member joins under a “month-to-month” or a “commit” contract. Under the commit contract, new members commit to a one year membership, generally at a lower monthly rate than a month-to-month membership. A member may cancel a commit membership at any time for a fee. When the members’ commit period is over, they retain membership as a month-to-month member until they choose to cancel. As of December 31, 2017, approximately 85% of our total members were on a month-to-month basis.
In joining a club, a new member signs a membership agreement that typically obligates the member to pay fees (“Joining Fees”) including a one-time initiation fee and the first annual fee. Initiation fees generally range between $0 and $99 while the annual fee generally charged between $59.99 and $69.99 for all memberships. These one-time Joining Fees averaged $60, $61 and $72 per sale for the years ended December 31, 2017, 2016 and 2015, respectively. The annual fee is also charged on each anniversary of the enrollment date, however is no longer considered a joining fee after the first payment.
Monthly electronic fund transfers (“EFT”) of individual membership dues on a per-member basis, including the effect of promotions, averaged approximately $46, $45 and $50 per month for the years ended December 31, 2017, 2016 and 2015, respectively. Currently, approximately 99% of our members pay their membership dues the first of each month through EFT, with EFT membership revenue constituting approximately 75% of total consolidated revenue for the year ended December 31, 2017.
Usage
Our total club usage, based on the number of member visits, was 30.2 million and 31.7 million member visits for the years ended December 31, 2017 and 2016, respectively. In the year ended December 31, 2017, approximately 28% of total usage or club visits was to members’ non-home clubs, indicating that our members take advantage of our network of clubs. Our membership plans allow for club members to elect to pay a per visit fee to use clubs that are not defined in their membership plan.
Non-Membership Revenue
The table below presents non-membership revenue components as a percentage of total revenue for the years ended December 31, 2013 through 2017.
For the Years Ended December 31, ($ in thousands) | ||||||||||||||||||||||||||||||||||
2017 | % | 2016 | % | 2015 | % | 2014 | % | 2013 | % | |||||||||||||||||||||||||
Total revenue | $ | 403,042 | 100.0 | % | $ | 396,921 | 100.0 | % | $ | 424,323 | 100.0 | % | $ | 453,842 | 100.0 | % | $ | 470,225 | 100.0 | % | ||||||||||||||
Non-Membership Revenue: | ||||||||||||||||||||||||||||||||||
Personal training revenue | 69,735 | 17.3 | % | 66,487 | 16.8 | % | 73,191 | 17.2 | % | 70,338 | 15.5 | % | 66,367 | 14.1 | % | |||||||||||||||||||
Other ancillary club revenue(1) | 17,197 | 4.3 | % | 19,642 | 4.9 | % | 22,138 | 5.2 | % | 22,304 | 4.9 | % | 24,720 | 5.3 | % | |||||||||||||||||||
Fees and Other revenue(2) | 5,876 | 1.4 | % | 6,361 | 1.6 | % | 6,254 | 1.5 | % | 5,971 | 1.3 | % | 5,985 | 1.3 | % | |||||||||||||||||||
Total non-membership revenue | $ | 92,808 | 23.0 | % | $ | 92,490 | 23.3 | % | $ | 101,583 | 23.9 | % | $ | 98,613 | 21.7 | % | $ | 97,072 | 20.7 | % | ||||||||||||||
(1) | Other ancillary club revenue primarily consists of Sports Clubs for Kids, Small Group Training and racquet sports. |
(2) | Fees and other revenue primarily consist of rental income, laundry revenue, marketing revenue and management fees. The year ended December 31, 2013 includes $424 for the correction of an accounting error related to out of period rental income. |
Club Format and Locations
Our clubs are generally located in middle- or upper-income residential, commercial, urban and suburban neighborhoods within major metropolitan areas that are capable of supporting the development of a cluster of clubs. Our clubs typically have high visibility and are easily accessible. In the New York metropolitan, Boston, Washington, D.C. and Philadelphia regions, we have created clusters of clubs in urban areas and their commuter suburban areas aligned with our operating strategy of offering our target members the convenience of multiple locations close to where they live and work, reciprocal use privileges, and standardized facilities and services.
5
Approximately 68% of our existing clubs are fitness-only clubs and the remaining clubs are multi-recreational. Our fitness-only clubs generally range in size from 15,000 to 25,000 square feet and average approximately 19,000 square feet. Our multi-recreational clubs generally range in size from 20,000 to 65,000 square feet, with one club being approximately 200,000 square feet. The average multi-recreational club size is approximately 38,000 square feet.
Our existing club base consists of clubs which we have developed and constructed as well as clubs we have acquired. Over the past five years from January 1, 2013 to December 31, 2017, we constructed ten new clubs, acquired 24 clubs and closed or relocated 29 clubs. Currently, 67 of our clubs, or approximately 41% of our existing club base, were from acquisitions of privately owned single and multi-club businesses. In the year ended December 31, 2017, we acquired 18 clubs, constructed and opened two clubs and closed five clubs, ending the year with 165 total clubs under operation. This compares to constructing and opening of one club, converting of two studio locations to clubs, and closing of five clubs during the year ended December 31, 2016. In both 2017 and 2016, we also upgraded certain existing clubs and plan to continue to do so in 2018.
Our facilities include a mix of cardiovascular and strength equipment from some of the best manufacturers including Life Fitness, Technogym, Nautilus, Cybex®, Precor®, Star Trac®, Hammer®, Woodway® and Octane®. At many locations, additional amenities are also offered, including swimming pools, racquet and basketball courts, functional training zones and babysitting services. Personal training services are offered at all locations for an additional charge. Our fee-based programs offered at many of our clubs, include personal training, Small Group Training, children’s programs, and summer camps for kids.
Our clubs also feature personal entertainment units. The units are typically mounted on or near individual pieces of cardiovascular equipment and are equipped with a flat-panel color screen for television viewing. We believe our members prefer the flexibility to view and listen to the programs of their choice during their cardiovascular workout. Recently most manufacturers are including embedded screens on their newest cardio fitness equipment which offer enhancements to both on-demand entertainment along with workout data tracking and connectivity to most mobile technologies.
Club Services and Operations
Our clubs are structured to provide an enhanced member experience through effective execution of our operating plan. Our club and support team members are the key to delivering a valued member experience and our operations are organized to maximize their overall effectiveness. Our club operations include the following:
Management. We believe that our success is largely dependent on the selection and development of our team members. Our management structure is designed to strike the right balance between consistent execution of operational excellence and nurturing a leader’s capacity for entrepreneurial decision making. Our learning and development system allows for all club positions to receive training on the key elements of their role as well as development training for growth. We believe a critical component to our growth is our ability to leverage internally-developed management talent.
Functional Support. Functional teams provide technical expertise and support designed to drive the member experience and revenue growth in specific areas of our clubs’ services, including sales and marketing, fitness and ancillary programming, learning and development, as well as facility management and member service.
Driving excellence in fitness and ancillary programming is critical to our success. Members receive an introductory session with a fitness manager or a personal trainer who helps to develop a customized routine that supports the member’s fitness goals. This initial assessment session includes a workout evaluation, cardio, strength and endurance testing, and movement screening. Members who elect to receive personal training can benefit from one-on-one coaching and guidance, with refreshed programs that evolve as the members achieve their fitness goals. All of our fitness clubs offer our personal training membership products where members can select from a package of four to 12 personal training sessions per month. The personal training membership product provides members with a certified personal trainer who works with the member to create an individualized goal-based program. Our fitness teams are trained to provide superior fitness solutions to address member needs. We believe the qualifications of the personal training staff help to ensure that members receive a consistent level of quality service throughout our clubs and that our personal training programs provide valuable guidance to our members as well as a significant source of incremental revenue for us. We believe that members who participate in personal training programs typically have a longer membership life.
Our commitment to providing a quality exercise experience to our members also includes group exercise programming. Our instructors teach a variety of classes, including dance, cycling, strength conditioning, boxing, yoga, Pilates and step classes. Instructors report through local club management and are further supported by regional managers responsible for ensuring consistency in class content, scheduling, training and instruction. We also provide Small Group Training offerings, which are fee-based programs that have smaller groups, and provide more focused, and typically more advanced classes.
6
In addition to group exercise, we offer a variety of ancillary programming for children under our Sports Clubs for Kids brand. As of December 31, 2017, Sports Clubs for Kids was being offered in 33 club locations throughout our various regions. Our Sports Clubs for Kids programming positions our multi-recreational clubs as family clubs, which we believe provides us with a competitive advantage. Depending upon the facilities available at a location, Sports Clubs for Kids programming can include traditional youth offerings such as day camps, sports camps, swim lessons, hockey and soccer leagues, gymnastics, dance, and birthday parties. It also can include non-competitive “learn-to-play” sports programs.
Our facilities and equipment management teams are dedicated to ensuring our clubs and fitness equipment are operating at the highest standard of performance for our members. Local teams are deployed to provide on-site support to clubs as needed.
Our club support and member services groups act as a coordinating point for all departments, supporting excellence in program execution and ensuring consistency of policies and procedures across the entire organization that support the member experience.
Centralized Information Systems
We recognize the value of enhancing and extending the uses of information technology (“IT”) in virtually every area of our business. Our IT strategy is aligned to support our business strategy and operating plans. We maintain an ongoing comprehensive program to monitor, replace or upgrade key technology services and infrastructure.
All of our clubs use a third-party hosted management system to process memberships, bill members, process point of sales transactions, and track member usage of the clubs. In addition, the management system tracks and analyzes key operating measurements such as membership statistics, cancellations, cross-club utilization, member tenure, and demographics profiles.
We continue to create a more customizable and efficient experience for members through updated digital tools, which included an enhanced website and mobile application. These digital tools enable enable feature membership sign up, club location search, class schedules and booking, training information, custom profiles for group fitness instructors and trainers. In addition, members are able to customize their group fitness experience based on fitness goals and preferences through a personalized search feature. We continue to enhance the digital tools accessibility to increase our online presence and member engagement.
Our back-office computer systems are comprised of a variety of technologies designed to assist in the management and analysis of our revenues, costs and key operational metrics, as well as support the daily operations of our clubs and corporate offices. These systems include an on premise financial system, a third-party hosted data warehouse, a third-party hosted telephone system and call center software to manage and track member service experiences.
We regularly implement cost effective technology solutions to accommodate growth, provide network redundancy, secure operating practices, better manage telecommunications and data costs, increase efficiencies in operations and improve management of all components of our technical architecture, including business continuity and recovery. Improvements in the IT infrastructure will continue to be made in the future in order to better serve our business needs.
Intellectual Property
We have registered various trademarks and service marks with the U.S. Patent and Trademark Office, including, NEW YORK SPORTS CLUBS and NYSC, WASHINGTON SPORTS CLUBS and WSC, BOSTON SPORTS CLUBS and BSC, PHILADELPHIA SPORTS CLUBS and PSC, LUCILLE ROBERTS, TMPL, UXF, SPORTS CLUBS FOR KIDS, COMPANIESGETFIT.COM, BFX STUDIO, RIDE REPUBLIC, and MASTER CLASS. We continue to register other trademarks and service marks. We believe that our rights to these properties are adequately protected.
Competition
The fitness club industry is highly competitive and continues to become more competitive. The number of health clubs in the U.S. has increased from 30,500 in 2012 to 36,540 in 2016, based on the most recent information available according to the IHRSA. In each of the regions in which we operate, we compete with other fitness clubs, physical fitness and recreational facilities.
7
We consider the following groups to be our primary competitors in the health and fitness industry:
• | commercial, multi-recreational and fitness-only chains; |
• | private studios, and other boutique fitness offerings; |
• | the YMCA and similar non-profit organizations; |
• | physical fitness and recreational facilities established by local governments, hospitals and businesses; |
• | exercise and small fitness clubs; racquet, tennis and other athletic clubs; |
• | amenity gyms in apartments, condominiums and offices; |
• | weight-reducing salons; |
• | country clubs; |
• | the home-use fitness equipment industry; and |
• | online fitness coaching. |
The principal methods of competition include pricing and ease of payment, required level of members’ contractual commitment, level and quality of services, age of facility and equipment, training and quality of supervisory staff, size and layout of facility and convenience of location with respect to access to transportation and pedestrian traffic.
We consider our traditional service offerings to be in the mid-tier of the value/service proposition and designed to appeal to a large portion of the population who utilize fitness facilities. The number of competitor clubs that offer lower pricing and a lower level of service have continued to grow in our regions over the last few years. These clubs have attracted, and may continue to attract, members away from both our fitness-only clubs and our multi-recreational clubs.
We also face competition from club operators offering comparable or higher pricing with higher levels of service. Larger outer-suburban family fitness centers, in areas where suitable real estate is more likely to be available, also compete effectively against our suburban formats. Additionally, we face competition from the rising popularity and demand for private studios offering niche boutique experiences.
We also compete with other entertainment and retail businesses for the discretionary income in our target demographics. There can be no assurance that we will be able to compete effectively in the future in the regions in which we operate. Competitors, who may include companies that are larger and have greater resources than us, may enter these regions to our detriment. These competitive conditions may result in increased price competition and limit our ability to attract new members and attract and retain qualified personnel. Additionally, consolidation in the fitness club industry could result in increased competition among participants, particularly large multi-facility operators that are able to compete for attractive acquisition candidates and/or newly constructed club locations. This increased competition could increase our costs associated with expansion through both acquisitions and for real estate availability for newly constructed club locations.
We believe that our market leadership, experience and operating efficiencies enable us to provide the consumer with a superior product in terms of convenience, quality service and affordability. We believe that there are barriers to entry in our metropolitan areas, including restrictive zoning laws, lengthy permit processes and a shortage of appropriate real estate, which could discourage any large competitor from attempting to open a chain of clubs in these regions. However, such a competitor could enter these regions more easily through one, or a series of, acquisitions. These barriers of entry are significant in our four metropolitan regions; however, they are less challenging in our surrounding suburban locations.
Seasonality of Business
Seasonal trends have a limited effect on our overall business. Generally, we experience greater membership through increased sales at the beginning of each year and experience an increased rate of membership attrition during the summer months. In addition, during the summer months, we experience a slight increase in operating expenses due to our outdoor pool and summer camp operations, generally matched by seasonal revenue recognition from season pool memberships and camp revenue.
8
Government Regulation
Our operations and business practices are subject to federal, state and local government regulation in the various jurisdictions in which our clubs are located, including general rules and regulations of the Federal Trade Commission, state and local consumer protection agencies and state statutes that prescribe certain forms and provisions of membership contracts and that govern the advertising, sale, financing and collection of such memberships as well as state and local health regulations.
Statutes and regulations affecting the fitness industry have been enacted in jurisdictions in which we conduct business and other states into which we may expand in the future have adopted or may adopt similar legislation. Typically, these statutes and regulations prescribe certain forms and provisions of membership contracts, afford members the right to cancel the contract within a specified time period after signing or in certain circumstances, such as for medical reasons or relocation to a certain distance from the nearest club, require an escrow of funds received from pre-opening sales or the posting of a bond or proof of financial responsibility and may establish maximum prices for membership contracts and limitations on the term of contracts. The specific procedures and reasons for cancellation vary due to differing laws in the respective jurisdictions, but in each instance, the canceling member is entitled to a refund of unused prepaid amounts. We are also subject to numerous other types of federal and state regulations governing the sale of memberships. These laws and regulations are subject to varying interpretations by a number of state and federal enforcement agencies and courts. We maintain internal review procedures to comply with these requirements and believe that our activities are in substantial compliance with all applicable statutes, rules and decisions.
We primarily accept payments for our memberships through EFT from credit cards, and, therefore, we are subject to both federal and state legislation and certification requirements, including the Electronic Funds Transfer Act. Some states, such as New York, have passed or have considered legislation requiring gyms and health clubs to offer non-automatic renewal membership option at all times and/or limit the duration for which gym memberships can auto-renew through EFT payments, if at all. Our business relies heavily on the fact that our memberships continue on a month-to-month basis after the completion of any initial term requirements (if any), and compliance with these laws, regulations, and similar requirements may be onerous and expensive, and variances and inconsistencies from jurisdiction to jurisdiction may further increase the cost of compliance and doing business. States that have such health club statutes provide harsh penalties for violations, including membership contracts being void or voidable.
Additionally, the collection, maintenance, use, disclosure and disposal of individually identifiable data by our businesses are regulated at the federal, state and provincial levels as well as by certain financial industry groups, such as the Payment Card Industry Organization and the National Automated Clearing House Association. Federal, state and financial industry groups may also consider from time to time new privacy and security requirements that may apply to our businesses and may impose further restrictions on our collection, disclosure and use of individually identifiable information that are housed in one or more of our databases.
The tax treatment of membership dues varies by state. Some states in which we operate require sales tax to be collected on membership dues and personal training sessions. Several others states in which we operate have proposed similar tax legislation. These taxes have the effect of increasing the payments by our members, which could impede our ability to attract new members or induce members to cancel their membership.
Changes in any statutes, rules or regulations could have a material adverse effect on our financial condition and results of operations.
Employees
On December 31, 2017, we had approximately 7,500 employees, of whom approximately 1,600 were employed full-time. We are not a party to any collective bargaining agreement with our employees. We operate with an open door policy and encourage a culture of openness, innovation and inclusiveness that creates a high level of work accountability. We have good relations with our employees and are proud to offer them a great work environment with opportunities for growth and development.
9
Available Information
We make available through our web site at https://www.townsportsinternational.com in the “Investor Relations — SEC Filings” section, free of charge, all reports and amendments to those reports filed or furnished pursuant to Section 13(a) or 15(d) of the Securities Exchange Act of 1934, as amended (the “Exchange Act”), as soon as reasonably practicable after we electronically file such material with, or furnish it to, the SEC. Occasionally, we may use our web site as a channel of distribution of material company information. Financial and other material information regarding the Company is routinely posted on and accessible at https://www.townsportsinternational.com. In addition, you may automatically receive email alerts and other information about the Company by enrolling through the “Email Alerts” section at https://www.townsportsinternational.com.
The foregoing information regarding our website and its content is for convenience only. The content of our website is not deemed to be incorporated by reference into this report nor should it be deemed to have been filed with the SEC.
Item 1A. Risk Factors
Investors should carefully consider the risks described below and all other information in this Annual Report. The risks and uncertainties described below are not the only ones that we face. Additional risks and uncertainties not presently known to us or that we currently deem immaterial may also impair our business and operations. If any of the following risks actually occur, our business, financial condition, cash flows or results of operations could be materially adversely affected.
Risks Related to Our Business
We are dependent on our Chief Executive Officer. In addition, the loss of key personnel and/or failure to attract and retain highly qualified personnel could make it more difficult for us to develop our business and enhance our financial performance.
We are dependent on the continued services of our senior management team, including our Chief Executive Officer, Patrick Walsh. We believe the loss of Mr. Walsh could have a material adverse effect on us and our financial performance. Currently, we do not have any long-term employment agreements with our executive officers, and we may not be able to attract and retain sufficient qualified personnel to meet our business needs.
Our future profitability is not assured.
Our operating results for future periods are subject to numerous uncertainties and there can be no assurances that we will be profitable in the foreseeable future, if at all. If our revenues decrease in a given period, we may be unable to reduce operating expenses as a significant part of our operating expenses are fixed, which could materially and adversely affect our business and, therefore, our results of operations and lead to a net loss (or a larger net loss) for that period and subsequent periods.
We may be unable to attract and retain members, which could have a negative effect on our business.
The performance of our clubs is highly dependent on our ability to attract and retain members, and we may not be successful in these efforts. Most of our members hold month-to-month memberships and accordingly, most members can cancel their club membership at any time without penalty. In addition, we experience attrition and must continually engage existing members and attract new members in order to maintain our membership levels and ancillary sales. There are numerous factors that have in the past and could in the future lead to a decline in membership levels or that could prevent us from increasing our membership, including a decline in our ability to deliver quality service at a competitive cost, the age and condition of our clubs and equipment, the presence of direct and indirect competition in the areas in which the clubs are located, the public’s interest in fitness clubs and general economic conditions. In order to increase membership levels, we may from time to time offer lower membership rates and initiation fees. Any decrease in our average membership rates or reductions in initiation fees may adversely impact our results of operations.
10
Negative economic conditions, including increased unemployment levels and decreased consumer confidence, have in the past contributed to and in the future could lead to significant pressures and declines in economic growth, including reduced consumer spending. In a depressed economic and consumer environment, consumers and businesses may postpone spending in response to tighter credit, negative financial news and/or declines in income or asset values, which could have a material negative effect on the demand for our services and products and such decline in demand may continue as the economy continues to struggle and disposable income declines. Other factors that could influence demand include increases in fuel and other energy costs, conditions in the residential real estate and mortgage markets, labor and healthcare costs, access to credit, consumer confidence and other macroeconomic factors affecting consumer spending behavior. We believe the challenges to the global economy during the past several years have adversely affected our business and our revenues and profits and continuing challenges may result in additional adverse effects. As a result of these factors, membership levels might not be adequate to maintain our operations at current levels or permit the expansion of our operations.
In addition, to the extent our corporate clients are adversely affected by negative economic conditions, they may decide, as part of expense reduction strategies, to curtail or cancel club membership benefits provided to their respective employees. Any reductions in corporate memberships may lead to membership cancellations as we cannot assure that employees of corporate customers will choose to continue their memberships without employer subsidies. A decline in membership levels may have a material adverse effect on our business, financial condition, results of operations and cash flows.
The level of competition in the fitness club industry could negatively impact our revenue growth and profitability.
The fitness club industry is highly competitive and continues to become more competitive. In each of the regions in which we operate, we compete with other fitness clubs, private studios, physical fitness and recreational facilities established by local governments, hospitals and businesses for their employees, amenity and condominium clubs, the YMCA and similar organizations and, to a certain extent, with racquet and tennis and other athletic clubs, country clubs, weight reducing salons and the home-use fitness equipment industry. We also compete with other entertainment and retail businesses for the discretionary income in our target demographics. We might not be able to compete effectively in the future in the regions in which we operate. Competitors include companies that are larger and have greater resources than us and also may enter these regions to our detriment. These competitive conditions may limit our ability to increase dues without a material loss in membership, attract new members and attract and retain qualified personnel. Additionally, consolidation in the fitness club industry could result in increased competition among participants, particularly large multi-facility operators that are able to compete for attractive acquisition candidates or newly constructed club locations, thereby increasing costs associated with expansion through both acquisitions and lease negotiation and real estate availability for newly constructed club locations.
The number of competitor clubs that offer lower pricing and a lower level of service continue to grow in our regions. These clubs have attracted, and may continue to attract, members away from both our fitness-only clubs and our multi-recreational clubs, particularly in the current consumer environment. Furthermore, smaller and less expensive weight loss facilities present a competitive alternative for consumers.
We also face competition from competitors offering comparable or higher pricing with higher levels of service or offerings. Larger outer-suburban, multi-recreational family fitness centers, in areas where suitable real estate is more likely to be available, also compete against our suburban, fitness-only models.
We also face competition from the increased popularity and demand for private studios offering group exercise classes. The prevalence of these smaller studios may compete against our own studio type offerings, such as cycling, Yoga and Pilates, as consumers may opt to use these competing studios to fulfill their fitness needs.
In addition, large competitors could enter the urban regions in which we operate to open a chain of clubs in these regions through one, or a series of, acquisitions.
The success of our business depends on our ability to retain the value of our brands.
Our ability to maintain our brand image and reputation is integral to our business. Maintaining, promoting and growing our brand will depend largely on the success of our marketing efforts and our ability to provide a consistent, high-quality member experience. Our reputation could be jeopardized if we fail to maintain high standards for member experiences, fail to maintain high ethical, social, and environmental standards for all of our operations and activities, or we fail to appropriately respond to concerns associated with any of the foregoing or any other concerns from our members. We could be adversely impacted if we fail to achieve any of these objectives or if the reputation or image of any of our brands is tarnished or receives negative publicity. In addition, adverse publicity about regulatory or legal action against us, or by us, could damage our reputation and brand image. Damage to our reputation or loss of consumer confidence for any of these reasons may result in fewer memberships sold or renewed, which in turn could materially and adversely affect our results of operations and financial condition.
11
The lower average membership dues have and may in the future negatively impact our comparable club revenue growth and our operating margins.
In the past several years, we lowered monthly dues and/or initiation and processing fees at certain clubs in order to attract more members and, as a result, initially experienced lower revenues and margin pressure. Recently, the Company has been increasing monthly dues to more accurately reflect the membership value; however, if we are unable to attract a sufficient number of new members or if we experience higher attrition as a result of these increases in monthly dues, the pressure on the Company's revenue and result of operations could be adversely impacted.
Declines in revenue have adversely affected our results or operations and cash flow from operations and we may be compelled to take additional actions which may not be successful in mitigating such effects.
We continue to experience revenue pressure from members as the fitness industry continues to be highly competitive in the geographic regions in which we compete. Also, our previous strategy of converting to a low-cost gym implemented in 2014 resulted in additional revenue pressure for the past few years. New members joined at lower monthly rates and cancellations of members paying higher rates negatively impacted our results and liquidity. In response to this, we implemented cost-savings initiatives in 2015, 2016 and 2017, which mitigated the impact the decline in revenue had on its profitability and cash flow from operations.
We continue to strategize on improving our financial results. We focus on increasing membership in existing clubs to increase revenue. We may consider additional actions within our control, including certain acquisitions, license arrangements, and the closure of unprofitable clubs upon lease expiration and the sale of certain assets. We may also consider additional strategic alternatives, including opportunities to reduce TSI, LLC’s existing debt and further cost-savings initiatives. Our ability to continue to meet our obligations is dependent on our ability to generate positive cash flow from a combination of initiatives, including those mentioned above. Failure to successfully implement these initiatives could have a material adverse effect on our liquidity and our operations, and we would need to implement alternative plans that could include additional asset sales, additional reductions in operating costs, additional reductions in working capital, debt restructurings and the deferral of capital expenditures. There can be no assurance that such alternatives would be available to us or that we would be successful in their implementation.
Low consumer confidence levels, increased competition and decreased spending could negatively impact our financial position and result in club closures and fixed asset and goodwill impairments.
In each of the years ended December 31, 2017 and 2016, we closed five clubs. In the year ended December 31, 2017 and 2016, we recognized fixed asset impairment charges of $6.5 million and $742,000, respectively, at underperforming clubs. In addition, we recorded goodwill impairment charges of $31.6 million in the year ended December 31, 2016. The goodwill impairment charges in 2016 was primarily due to existing members downgrading their memberships to those with lower monthly dues and new members enrolling at lower rates. Some of our club closures and impairments were due, in large part, to the economic and consumer environment, and increased competition in areas in which our clubs operate. If the economic and consumer environment were to deteriorate or not improve or if we are unable to improve the overall competitive position of our clubs, our operating performance may experience declines and we may need to recognize additional impairments of our fixed assets and goodwill and may be compelled to close additional clubs. In addition, we cannot ensure that we will be able to replace any of the revenue lost from these closed clubs from our other club operations. We will continue to monitor the results and changes in expectations of these clubs closely to determine if additional fixed asset or goodwill impairment charges will be necessary.
Our geographic concentration heightens our exposure to adverse regional developments.
As of December 31, 2017, we operated 119 fitness clubs in the New York metropolitan region, 28 fitness clubs in the Boston region, 10 fitness clubs in the Washington, D.C. region, five fitness clubs in the Philadelphia region and three fitness clubs in Switzerland. Our geographic concentration in the Northeast and Mid-Atlantic regions and, in particular, the New York metropolitan area, heightens our exposure to adverse developments in these areas, including those related to economic and demographic changes in these regions, competition, severe weather, potential terrorist threats or other unforeseen events.
For example, in the year ended December 31, 2012, as a result of flooding and power outages caused by Hurricane Sandy, 131 clubs were closed on October 29, 2012, with one club that closed permanently, 16 clubs that remained closed for over a week and one club that was closed for over a year and reopened in December 2013. We cannot predict the impact that any future severe weather events will have on our ability to avoid wide-spread or prolonged club closures. Any such events affecting the areas in which we operate might result in a material adverse effect on our business, financial condition, cash flows and results of operations in the future.
12
Any condition that causes people to refrain, or prevents people, from visiting our clubs, such as severe weather, outbreaks of pandemic or contagious diseases, or threats of terrorist attacks may adversely affect our business, operating results and financial condition.
Our business and operations could be materially and adversely affected by severe weather or outbreaks of pandemic or contagious diseases, threats of terrorist attacks or other conditions that cause people to refrain, or prevent people, from visiting our clubs. Our business could be severely impacted by a widespread regional, national or global health epidemic. A widespread health epidemic or perception of a health epidemic (such as Ebola), whether or not traced to one of our clubs, may cause members and prospective members to avoid public gathering places or otherwise change their behaviors and impact our ability to staff our clubs. Outbreaks of disease, such as influenza, could reduce traffic in our clubs. Any of these events would negatively impact our business. In addition, any negative publicity relating to these and other health-related matters may affect members’ perceptions of our clubs, reduce member and prospective member visits to our clubs and negatively impact demand for our club offerings.
Further, terrorist attacks, such as the attacks that occurred in New York City and Washington, D.C. on September 11, 2001, and other acts of violence or war may affect our markets, our operating results or the market on which our common stock trades. Our geographic concentration in the major cities in the Northeast and Mid-Atlantic regions and, in particular, the New York City and Washington, D.C. areas, heightens our exposure to any such future terrorist attacks, which may adversely affect our clubs and result in a decrease in our revenues. The potential near-term and long-term effect these attacks may have for our members, the markets for our services and the market for our common stock are uncertain; however, their occurrence can be expected to further negatively affect the U.S. economy generally and specifically the regional markets in which we operate. The consequences of any terrorist attacks or any armed conflicts are unpredictable; and we may not be able to foresee events that could have an adverse effect on our business.
Our dependence on a limited number of suppliers for equipment and certain products and services could result in disruptions to our business and could adversely affect our revenues and gross profit.
Equipment and certain products and services used in our clubs, including our exercise equipment and point-of-sale software and hardware, are sourced from third-party suppliers. Although we believe that adequate substitutes are currently available, we depend on these third-party suppliers to operate our business efficiently and consistently meet our business requirements. The ability of these third-party suppliers to successfully provide reliable and high-quality services is subject to technical and operational uncertainties that are beyond our control, including, for our overseas suppliers, vessel availability and port delays or congestion. Any disruption to our suppliers’ operations could impact our supply chain and our ability to service our existing stores and open new stores on time or at all and thereby generate revenue. If we lose such suppliers or our suppliers encounter financial hardships unrelated to the demand for our equipment or other products or services, we may not be able to identify or enter into agreements with alternative suppliers on a timely basis on acceptable terms, if at all. Transitioning to new suppliers would be time consuming and expensive and may result in interruptions in our operations. If we should encounter delays or difficulties in securing the quantity of equipment we require to open new and refurbish existing stores, our suppliers encounter difficulties meeting our demands for products or services, our websites experience delays or become impaired due to errors in the third-party technology or there is a deficiency, lack or poor quality of products or services provided, our ability to serve our members and grow our brand would be interrupted. If any of these events occur, it could have a material adverse effect on our business and operating results.
Our trademarks and trade names may be infringed, misappropriated or challenged by others.
We believe our brand names and related intellectual property are important to our business. We seek to protect our trademarks, trade names and other intellectual property by exercising our rights under applicable trademark and copyright laws. If we were to fail to successfully protect our intellectual property rights for any reason, it could have an adverse effect on our business, results of operations and financial condition. Any damage to our reputation could cause membership levels to decline and make it more difficult to attract new members.
Use of social media may adversely impact our reputation or subject us to fines or other penalties.
There has been a substantial increase in the use of social media platforms, including blogs, social media websites and other forms of internet-based communication, which allow individuals’ access to a broad audience of consumers and other interested persons. Negative commentary about us may be posted on social media platforms or similar devices at any time and may harm our reputation or business. Consumers value readily available information about health clubs and often act on such information without further investigation and without regard to its accuracy. The harm may be immediate without affording us an opportunity for redress or correction. In addition, social media platforms provide users with access to such a broad audience that collective action against our stores, such as boycotts, can be more easily organized. If such actions were organized, we could suffer reputational damage as well as physical damage to our stores.
13
We also use social medial platforms as marketing tools. For example, we maintain Facebook and Twitter accounts. As laws and regulations rapidly evolve to govern the use of these platforms and devices, the failure by us, our employees or third parties acting at our direction to abide by applicable laws and regulations in the use of these platforms and devices could adversely impact our business, financial condition and results of operations or subject us to fines or other penalties.
If we fail to comply with applicable privacy, security, and data laws, regulations and standards, our business could be materially and adversely affected.
We use electronic mail (“email”), text messages and phone calls to market our services to potential members and as a means of communicating with our existing members. The laws and regulations governing the use of telephonic communication, including but not limited to emails, text messages and phone calls, for commercial purposes continue to evolve. Because messaging and phone calls are important to our business, if we are unable to successfully deliver messages or make phone calls to existing members and potential members, if there are legal restrictions on delivering these messages to consumers, or if consumers do not or cannot receive our messages or phone calls, our revenues and profitability could be adversely affected. If new laws or regulations are adopted, or existing laws and regulations are interpreted, to impose additional restrictions on our ability to call or send email or text messages to our members or potential members, we may not be able to communicate with them in a cost-effective manner and it may limit our ability to utilize such forms of communication. In addition to legal restrictions on the use of emails, text messages and phone calls for commercial purposes, service providers and others attempt to block the transmission of unsolicited messages, commonly known as “spam.” Many service providers have relationships with organizations whose purpose it is to detect and notify the service providers of entities that the organization believes is sending unsolicited messages. If a service provider identifies messaging from us as “spam” as a result of reports from these organizations or otherwise, we could be placed on a restricted list that will block our messages to members or potential members. If we are restricted or unable to communicate through emails, text messages or phone calls with our members and potential members as a result of legislation, regulation, blockage or otherwise, our business, operating results and financial condition could be adversely effected.
If we are unable to identify and acquire suitable sites for new clubs, our revenue growth rate and profits may be negatively impacted.
To successfully expand our business over the long term, we must identify and acquire sites that meet our site selection criteria. In addition to finding sites with the right geographical, demographic and other measures we employ in our selection process, we also need to evaluate the penetration of our competitors in the region. We face competition from other health and fitness center operators for sites that meet our criteria and as a result, we may lose those sites or we could be forced to pay higher prices for those sites. If we are unable to identify and acquire sites for new clubs on attractive terms, our revenue, growth rate and profits may be negatively impacted. Additionally, if our analysis of the suitability of a site is incorrect, we may not be able to recover our capital investment in developing and building a new club.
Acquisitions could result in operating difficulties, dilution, and other consequences that may adversely impact our business and results of operations.
Part of our key strategy is to grow through acquisitions. We expect to continue to evaluate and enter into discussions regarding a wide array of potential strategic transactions. There can be no assurance that we will continue to be able to successfully integrate these acquisitions into our existing business without substantial costs, delays or other operational or financial difficulties. The areas where we face risks include:
• | diversion of management time and focus from operating our business to acquisition integration challenges; |
• | difficulties in the transition of acquired members onto our systems; |
• | the acquired businesses failing to provide, or delays in realizing, the benefits originally anticipated; |
• | integration of the acquired company's accounting, human resource, and other administrative systems, and coordination of sales and marketing functions; |
• | challenges related to the lack of experience in operating in the geographical regions of the acquired business; |
• | unanticipated contract or regulatory issues and the assumption of, and exposure to, unknown or contingent liabilities of the acquired businesses. |
14
We anticipate that any future acquisitions we pursue as part of our business strategy may be financed through a combination of cash on hand, operating cash flow and availability under our existing credit facility. If new debt is added to current debt levels, or if we incur other liabilities, including contingent liabilities, in connection with an acquisition, the debt or liabilities could impose additional constraints and requirements on our business and financial performance, which could materially adversely affect our financial condition and operations.
If an acquisition is not successfully completed or integrated into our existing operations or does not result in the benefits we expect, as a result of the factors mentioned above or otherwise, our business, financial condition or results of operations may be adversely affected. In addition, failure to integrate successfully or realize the anticipated business opportunities and growth prospects from our acquisitions, could result in unanticipated expenses and losses and may require significant financial resources that would otherwise be available for the ongoing development or expansion of our existing operations. Accordingly, in connection with any acquisition, there can be no assurance as to whether or when any benefits or cost synergies we hope to achieve will occur, or the extent to which they actually will be achieved.
We have, and will continue to have, significant lease obligations. We are subject to risks associated with leasing substantial amounts of space, including future increases in occupancy costs and the need to generate significant cash flow to meet our lease obligations.
We have, and will continue to have, significant lease obligations. We currently lease substantially all of our fitness club locations pursuant to long-term leases (generally 15 to 20 years, including option periods). During the next five years, or the period from January 1, 2018 through December 31, 2022, we have leases for 25 club locations that are due to expire without any renewal options, eight of which expire in 2018, and 61 club locations that are due to expire with renewal options. For leases with renewal options, several of them provide for our unilateral option to renew for additional rental periods at specific rental rates (for example, based on the consumer price index or stated renewal terms already set in the leases) or based on the fair market rate at the location. Our ability to negotiate favorable terms on an expiring lease or to negotiate favorable terms on leases with renewal options, or conversely for a suitable alternate location, could depend on conditions in the real estate market, competition for desirable properties and our relationships with current and prospective landlords or may depend on other factors that are not within our control. Any or all of these factors and conditions could negatively impact our revenue, growth and profitability.
In addition to future minimum lease payments, some of our club leases provide for additional rental payments based on a percentage of net sales, or “percentage rent,” if sales at the respective stores exceed specified levels, as well as the payment of common area maintenance charges, real property insurance, and real estate taxes. Many of our lease agreements have defined escalating rent provisions over the initial term and any extensions.
We depend on cash flow from operations to pay our lease expenses. If our business does not generate sufficient cash flow from operating activities to fund these expenses, we may not be able to service our lease expenses, which could materially harm our business. Furthermore, the significant cash flow required to satisfy our obligations under the leases increases our vulnerability to adverse changes in general economic, industry, and competitive conditions, and could limit our ability to fund working capital, incur indebtedness, and make capital expenditures or other investments in our business.
If an existing or future club is not profitable, and we decide to close it, we may nonetheless be committed to perform our obligations under the applicable lease including, among other things, paying the base rent for the balance of the lease term. Moreover, even if a lease has an early cancellation clause, we may not satisfy the contractual requirements for early cancellation under that lease. Our inability to enter into new leases or renew existing leases on terms acceptable to us or be released from our obligations under leases for stores that we close could materially adversely affect us.
We may experience prolonged periods of losses in our recently opened clubs and when we open new clubs in existing regions our comparable club revenue growth and our operating margins may be negatively impacted.
Upon opening a club, we typically experience an initial period of club operating losses. The sale of memberships typically generates insufficient revenue for the club to initially generate positive cash flow. As a result, a new club typically generates an operating loss in its first full year of operations and substantially lower margins in its second full year of operations than a club opened for more than 24 months. These operating losses and lower margins will negatively impact our future results of operations. This negative impact will be increased by the initial expensing of pre-opening costs, which include legal and other costs associated with lease negotiations and permitting and zoning requirements, as well as depreciation and amortization expenses, which will further negatively impact our results of operations. We may, at our discretion, accelerate or expand our plans to open new clubs, which may adversely affect results from operations.
15
We currently operate clubs throughout the Northeast and Mid-Atlantic regions of the United States. In the case of existing regions, our experience has been that opening new clubs may attract some memberships away from other clubs already operated by us in those regions and diminish their revenues. In addition, as a result of new club openings in existing regions and because older clubs will represent an increasing proportion of our club base over time, our mature club revenue increases may be lower in future periods than in the past.
Another result of opening new clubs is that our club operating margins may be lower than they have been historically while the clubs build a membership base. We expect both the addition of pre-opening expenses and the lower revenue volumes characteristic of newly opened clubs to affect our club operating margins at these new clubs.
We are subject to government regulation, and changes in these regulations could have a negative effect on our financial condition and results of operations.
Our operations and business practices are subject to federal, state and local government regulation in the various jurisdictions in which our clubs are located, including, but not limited to the following:
• | general rules and regulations of the Federal Trade Commission; |
• | rules and regulations of state and local consumer protection agencies; |
• | state statutes that prescribe certain forms and provisions of membership contracts |
• | state statutes that govern the advertising, sale, financing and collection of memberships; |
• | federal and state laws and regulations governing privacy and security of information; and |
• | state and local health regulations |
Any changes in such laws or regulations could have a material adverse effect on our financial condition and results of operations.
We could be subject to claims related to health or safety risks at our clubs.
Use of our clubs poses some potential health or safety risks to members or guests through physical exertion and use of our services and facilities, including exercise equipment. Claims might be asserted against us for injury suffered by, or death of members or guests while exercising at a club. We might not be able to successfully defend such claims. As a result, we might not be able to maintain our general liability insurance on acceptable terms in the future or maintain a level of insurance that would provide adequate coverage against potential claims.
Depending upon the outcome, these matters may have a material effect on our consolidated financial position, results of operations and cash flows.
We may be exposed to other litigation from time to time that can have significant adverse effects upon us.
In the ordinary course of conducting our business, we are exposed to litigation from time to time that can have significant adverse effects upon our consolidated financial position, results of operations and cash flows. At any given time there may be one or more civil actions initiated against us, including the matters disclosed under “Legal Proceedings” in this Annual Report. If one or more of these pending lawsuits, or any lawsuits in the future are adjudicated in a manner adverse to our interests, or if a settlement of any lawsuit requires us to pay a significant amount, the result could have an adverse impact on our consolidated financial position, results of operations and cash flows. In addition, any litigation, regardless of the outcome, may distract our management from the operation of our business.
16
Security and privacy breaches may expose us to liability and cause us to lose customers.
Federal and state law requires us to safeguard our customers’ financial information, including credit card information. Although we have established security procedures and protocol, including credit card industry compliance procedures, to protect against identity theft and the theft of our customers’ financial information, our security and testing measures may not prevent security breaches and breaches of our customers’ privacy may occur, which could harm our business. For example, a significant number of our users provide us with credit card and other confidential information and authorize us to bill their credit card accounts directly for our products and services. Typically, we rely on encryption and authentication technology licensed from third parties to enhance transmission security of confidential information. Techniques used to obtain unauthorized access or to sabotage systems change frequently and are constantly evolving. These techniques and other advances in computer capabilities, new discoveries in the field of cryptography, inadequate facility security or other developments may result in a compromise or breach of the technology used by us or one of our vendors to protect customer data. We may be unable to anticipate these techniques or to implement adequate preventive or reactive measures. Several recent, highly publicized data security breaches at other companies have heightened consumer awareness of this issue. Further, a significant number of states require the customers be notified if a security breach results in the disclosure of their personal financial account or other information. Additional states and governmental entities are considering such “notice” laws. In addition, other public disclosure laws may require that material security breaches be reported.
Any compromise of our security or that of our third party vendors or noncompliance with privacy or other laws or requirements could harm our reputation, cause our members to lose confidence in us, or harm our financial condition and, therefore, our business. In addition, a party who is able to circumvent our security measures or exploit inadequacies in our security measures or that of our third party vendors, could, among other effects, misappropriate proprietary information, cause interruptions in our operations or expose members to computer viruses or other disruptions. We may be required to make significant expenditures to protect against security breaches or to remedy problems caused by any breaches. Actual or perceived vulnerabilities may lead to claims against us. To the extent the measures taken by us or our third party vendors prove to be insufficient or inadequate, we may become subject to litigation or administrative sanctions, which could result in significant fines, penalties or damages and harm to our reputation.
Changes in legislation or requirements related to electronic fund transfer, or our failure to comply with existing or future regulations, may adversely impact our business.
We primarily accept payments for our memberships through EFT from members’ bank accounts and, therefore, we are subject to federal, state and provincial legislation and certification requirements governing EFT, including the Electronic Funds Transfer Act. Some states, such as New York, have passed or have considered legislation requiring gyms and health clubs to offer a prepaid membership option at all times and/or limit the duration for which gym memberships can auto-renew through EFT payments, if at all. Our business relies heavily on the fact that our memberships continue on a month-to-month basis after the completion of any initial term requirements, and compliance with these laws and regulations and similar requirements may be onerous and expensive. In addition, variances and inconsistencies from jurisdiction to jurisdiction may further increase the cost of compliance and doing business. States that have such health club statutes provide harsh penalties for violations, including membership contracts being void or voidable. Our failure to comply fully with these rules or requirements may subject us to fines, higher transaction fees, penalties, damages and civil liability and may result in the loss of our ability to accept EFT payments, which would have a material adverse effect on our business, results of operations and financial condition. In addition, any such costs, which may arise in the future as a result of changes to the legislation and regulations or in their interpretation, could individually or in the aggregate cause us to change or limit our business practice, which may make our business model less attractive to our members.
We are subject to a number of risks related to ACH, credit card and debit card payments we accept.
We accept payments through automated clearing house (“ACH”), credit card and debit card transactions. For ACH, credit card and debit card payments, we pay interchange and other fees, which may increase over time. An increase in those fees would require us to either increase the prices we charge for our memberships, which could cause us to lose members or suffer an increase in our operating expenses, either of which could harm our operating results.
If we or any of our processing vendors have problems with our billing software, or the billing software malfunctions, it could have an adverse effect on our member satisfaction and could cause one or more of the major credit card companies to disallow our continued use of their payment products. In addition, if our billing software fails to work properly and, as a result, we do not automatically charge our members’ credit cards, debit cards or bank accounts on a timely basis or at all, we could lose membership revenue, which would harm our operating results.
17
If we fail to adequately control fraudulent ACH, credit card and debit card transactions, we may face civil liability, diminished public perception of our security measures and significantly higher ACH, credit card and debit card related costs, each of which could adversely affect our business, financial condition and results of operations. The termination of our ability to process payments through ACH transactions or on any major credit or debit card would significantly impair our ability to operate our business.
Regulatory changes in the terms of credit and debit card usage, including any existing or future regulatory requirements, could have an adverse effect on our business.
Our business relies heavily on the use of credit and debit cards in sales transactions. Regulatory changes to existing rules or future regulatory requirements affecting the use of credit and debit cards or the fees charged could impact the consumer and financial institutions that provide card services. This may lead to an adverse impact on our business if the regulatory changes result in unfavorable terms to either the consumer or the banking institutions.
Disruptions and failures involving our information systems could cause customer dissatisfaction and adversely affect our billing and other administrative functions.
The continuing and uninterrupted performance of our information systems is critical to our success. We use a fully-integrated information system to process new memberships, bill members, check-in members and track and analyze sales and membership statistics, the frequency and timing of member workouts, cross-club utilization, member life, value-added services and demographic profiles by member. This system also assists us in evaluating staffing needs and program offerings. We believe that, without investing in enhancements, this system was approaching the end of its life cycle. Correcting any disruptions or failures that affect our proprietary system could be difficult, time-consuming and expensive because we would need to use contracted consultants familiar with our system.
Any failure of our current system could also cause us to lose members and adversely affect our business and results of operations. Our members may become dissatisfied by any systems disruption or failure that interrupts our ability to provide our services to them. Disruptions or failures that affect our billing and other administrative functions could have an adverse effect on our operating results.
Infrastructure changes are being undertaken to accommodate our growth, provide network redundancy, better manage telecommunications and data costs, increase efficiencies in operations and improve management of all components of our technical architecture. Fire, floods, earthquakes, power loss, telecommunications failures, break-ins, acts of terrorism and similar events could damage our systems. In addition, computer viruses, electronic break-ins or other similar disruptive problems could also adversely affect our sites. Any system disruption or failure, security breach or other damage that interrupts or delays our operations could cause us to lose members, damage our reputation, and adversely affect our business and results of operations.
Our growth or changes in the industry could place strains on our management, employees, information systems and internal controls, which may adversely impact our business.
Future expansion or changes in the industry will place increased demands on our administrative, operational, financial and other resources. Any failure to manage such growth or changes effectively could seriously harm our business. To be successful, we will need to continue to improve management information systems and our operating, administrative, financial and accounting systems and controls. We will also need to train new employees and maintain close coordination among our executive, accounting, finance, marketing, sales and operations functions. These processes are time-consuming and expensive, increase management responsibilities and divert management attention.
Outsourcing certain aspects of our business could result in disruption and increased costs.
We have outsourced certain aspects of our business to third party vendors that subject us to risks, including disruptions in our business and increased costs. For example, we have engaged third parties to host and manage certain aspects of our data center, information and technology infrastructure and electronic pay solutions. Accordingly, we are subject to the risks associated with the vendor's ability to provide these services to meet our needs. If the cost of these services is more than expected, if the vendor is not able to handle the volume of activity or perform the quality of service that we expect, if we or the vendor are unable to adequately protect our data and information is lost, if our ability to deliver our services is interrupted, or if our third party vendors face financial or other difficulties, then our business and results of operations may be negatively impacted.
18
Our cash and cash equivalents are concentrated in a small number of banks.
Our cash and cash equivalents are held, primarily, in a small number of commercial banks. These deposits are not collateralized. In the event these banks become insolvent, we would be unable to recover most of our cash and cash equivalents deposited at the banks. Cash and cash equivalents held in one commercial bank as of December 31, 2017 totaled $19.9 million. During 2017, in any one month, the amount held in one commercial bank has been as high as approximately $45.2 million.
Because of the capital-intensive nature of our business, we may have to incur additional indebtedness or issue new equity securities and, if we are not able to obtain additional capital, our ability to operate or expand our business may be impaired and our results of operations could be adversely affected.
Our business requires significant levels of capital to finance the development of additional sites for new clubs and the construction of our clubs. If cash from available sources is insufficient or unavailable due to restrictive credit markets, or if cash is used for unanticipated needs, we may require additional capital sooner than anticipated. In the event that we are required or choose to raise additional funds, we may be unable to do so on favorable terms or at all. Furthermore, the cost of debt financing could significantly increase, making it cost-prohibitive to borrow, which could force us to issue new equity securities. If we issue new equity securities, existing stockholders may experience additional dilution or the new equity securities may have rights, preferences or privileges senior to those of existing holders of common stock. If we cannot raise funds on acceptable terms, we may not be able to execute our current growth plans, take advantage of future opportunities or respond to competitive pressures. Any inability to raise additional capital when required could have an adverse effect on our business plans and operating results.
We may incur rising costs related to construction of new clubs and maintaining our existing clubs. If we are not able to pass these cost increases through to our members, our returns may be adversely affected.
Our clubs require significant upfront investment. If our investment is higher than we had planned, we may need to outperform our operational plan to achieve our targeted return. We cannot assure that we can offset cost increases by increasing our membership dues and other fees and improving profitability through cost efficiencies.
We may be required to remit unclaimed property to states for unused, expired personal training sessions.
We recognize revenue from personal training sessions as the services are performed (i.e., when the session is trained). Unused personal training sessions expire after a set, disclosed period of time after purchase and are not refundable or redeemable by the member for cash. As of December 31, 2017, we had approximately $12.5 million of unused and expired personal training sessions that had not been recognized as revenue and was recorded as deferred revenue. We do not believe this amount is subject to the escheatment or abandoned property laws of any of the jurisdictions in which we conduct our business, including the State of New York. It is possible however, that one or more of these jurisdictions may not agree with our position and may claim that we must remit all or a portion of these amounts to such jurisdiction. This could have a material adverse effect on our cash flows. The State of New York has informed us that it is considering whether we are required to remit the amount received by us for unused, expired personal training sessions to the State of New York as unclaimed property. For a total of six of the jurisdictions in which we operate, we have concluded, based on opinions from outside counsel, that monies held by a company for unused and expired personal training sessions are not escheatable. In 2010, for three jurisdictions, we concluded, based on opinions from outside counsel, that monies held by a company for unused and expired personal training sessions are not escheatable. As a result, we recorded approximately $2.7 million as personal training revenue in the fourth quarter of 2010. This amount was previously recorded in deferred revenue. In 2017, for another three jurisdictions, we concluded, based on opinions from outside counsel, that money held by a company for unused and expired personal training sessions are not escheatable. As a result, we recorded approximately $3.6 million as personal training revenue in the fourth quarter of 2017. This amount was previously recorded in deferred revenue, which was primarily related to sessions purchased prior to the year ended December 31, 2015.
19
We may have exposure to additional tax liabilities.
From time to time, we are under audit by federal and local tax authorities and we may be liable for additional tax obligations and may incur additional costs in defending any claims that may arise. For example, as of December 31, 2017, certain of our state and local tax returns from years 2006 through 2014 were currently being examined by certain state and local jurisdictions and it is difficult to predict the final outcome or timing of resolution of any particular matter regarding these examinations. In particular, we disagree with the proposed assessment dated December 12, 2016 from the State of New York and attended a conciliation conference with the New York State Department of Taxation and Finance Audit section on June 7, 2017. No settlement was reached at the conference and the proposed assessment was sustained. As such, in a revised letter dated November 30, 2017, we received from the State of New York a revised assessment related to tax years 2006-2009 for approximately $5.1 million, inclusive of approximately $2.4 million of interest. We currently are in the process of appealing the assessment with the New York State Division of Tax Appeals. We have not recorded a tax reserve related to the proposed assessment. It is difficult to predict the ultimate outcome of this or any other tax examination and the result of any such tax examination could have a material adverse effect on our results of operations and financial condition. Additionally, on November 17, 2017, we were notified that the State of New York proposed an adjustment in the amount of approximately $3.9 million for the years 2010 to 2014, inclusive of approximately $757,000 in interest.
Risks Related to Our Leverage and Our Indebtedness
On November 15, 2013, TSI, LLC entered into a $370.0 million senior secured credit facility (“2013 Senior Credit Facility”). The 2013 Senior Credit Facility consists of a $325.0 million term loan facility (“2013 Term Loan Facility”), and a $45.0 million revolving loan facility (“2013 Revolving Loan Facility”). The 2013 Term Loan Facility matures on November 15, 2020, and the 2013 Revolving Loan Facility matures on November 15, 2018.
We may be negatively affected by economic conditions in the U.S. and key international markets.
We must maintain liquidity to fund our working capital, service our outstanding indebtedness and finance investment opportunities. Without sufficient liquidity, we could be forced to curtail our operations or we may not be able to pursue new business opportunities. The principal sources of our liquidity are funds generated from operating activities, available cash and cash equivalents and borrowings under our 2013 Revolving Loan Facility. If our current resources do not satisfy our liquidity requirements, we may have to seek additional financing.
Economic conditions, both domestic and foreign, may affect our financial performance. Prevailing economic conditions, including unemployment levels, inflation, availability of credit, energy costs and other macro-economic factors, as well as uncertainty about future economic conditions, adversely affect consumer spending and, consequently, our business and results of operations.
Our leverage may impair our financial condition, and we may incur significant additional debt.
We currently have a substantial amount of debt. As of December 31, 2017, our total outstanding consolidated debt was $199.9 million under our 2013 Term Loan Facility. The 2013 Term Loan Facility expires on November 15, 2020. In addition, as of December 31, 2017, under the 2013 Revolving Loan Facility there were no outstanding borrowings and outstanding letters of credit issued totaled $7.0 million, which if still outstanding, will likely need to be funded by our cash upon the expiration of the 2013 Revolving Loan Facility on November 15, 2018. The unutilized portion of the 2013 Revolving Loan Facility as of December 31, 2017 was $38.0 million, with borrowings under such facility subject to the conditions applicable to borrowings under our 2013 Senior Credit Facility, which conditions we may or may not be able to satisfy at the time of borrowing. Our substantial debt could have important consequences, including:
• | making it more difficult to satisfy our obligations, including with respect to our outstanding indebtedness; |
• | increasing our vulnerability to general adverse economic and industry conditions; |
• | limiting our ability to obtain additional financing to fund future working capital, capital expenditures, acquisitions of new clubs and other general corporate requirements; |
• | requiring a substantial portion of our cash flow from operations for the payment of interest on our debt, which is variable on our 2013 Revolving Loan Facility and partially variable on our 2013 Term Loan Facility, and/or principal pursuant to excess cash flow requirements and reducing our ability to use our cash flow to fund working capital, capital expenditures and acquisitions of new clubs and general corporate requirements; |
• | increasing our vulnerability to interest rate fluctuations in connection with borrowings under our 2013 Senior Credit Facility, some of which are at variable interest rates; |
20
• | limiting our ability to refinance our existing indebtedness on favorable terms before the expiration of the current 2013 Term Loan Facility, or at all; and |
• | limiting our flexibility in planning for, or reacting to, changes in our business and the industry in which we operate. |
These limitations and consequences may place us at a competitive disadvantage to other less-leveraged competitors.
If new debt is added to our and our subsidiaries’ current debt levels, the related risks that we and they currently face could intensify.
The current debt under the 2013 Senior Credit Facility has a floating interest rate and an increase in interest rates may negatively impact our financial results.
Interest rates applicable to our debt are expected to fluctuate based on economic and market factors that are beyond our control. In particular, the unhedged portion of $39.9 million of our outstanding debt under our 2013 Senior Credit Facility as of December 31, 2017, has a floating interest rate. Any significant increase in market interest rates, and in particular the short-term Eurodollar rates, would result in a significant increase in interest expense on our debt, which could negatively impact our net income and cash flows.
The Company may be unsuccessful in its efforts to effectively hedge against interest rate changes on our variable rate debt.
In its normal operations, the Company is exposed to market risk relating to fluctuations in interest rates. In order to minimize the negative impact of such fluctuations on the Company’s cash flows, the Company may enter into derivative financial instruments, such as interest rate swaps. The Company’s current interest rate swap arrangement is with one financial institution and covers $160.0 million of our current $199.9 million outstanding term loan principal balance with the swap expiring on May 15, 2018. We are exposed to credit risk if the counterparty to the agreement is not able to perform on its obligations. Additionally, a failure on our part to effectively hedge against interest rate changes may adversely affect our financial condition and results of operations. We are required to record the interest rate swap at its fair value. Changes in interest rates can significantly impact the valuation of the instrument resulting in non-cash changes to our financial position.
Credit market volatility may affect our ability to refinance our existing debt, borrow funds under our existing lines of credit or incur additional debt.
Future disruption and volatility in credit market conditions could have a material adverse impact on our ability to refinance debt when it comes due on terms similar to our current credit facilities, or to draw upon existing lines of credit or incur additional debt if needed as a result of unanticipated downturns in the markets for our products and services, which may require us or our subsidiaries to seek other funding sources to meet our cash requirements. We cannot be certain that alternative sources of financing would be available in the future on terms and conditions that are acceptable.
Our outstanding indebtedness and the inability to renew or refinance our 2013 Senior Credit Facility could materially adversely affect our financial condition and our ability to operate our business.
We will need to refinance our outstanding debt as it matures. There is a risk that we may not be able to refinance existing debt or that the terms of any refinancing may not be as favorable as the terms of our existing debt or refinance our existing debt at all. Furthermore, if prevailing interest rates or other factors at the time of refinancing result in higher interest rates upon refinancing, then the interest expense relating to that refinanced indebtedness would increase. In addition, changes by any rating agency to our outlook or credit rating could negatively affect the value of both our debt and equity securities, which could adversely affect our ability to refinance existing debt or raise additional capital. These risks could impair the Company's liquidity and would likely have a material adverse effect on our businesses, financial condition and results of operations.
Covenant restrictions under our indebtedness may limit our ability to operate our business and, in such an event, we may not have sufficient assets to settle our indebtedness.
Our 2013 Senior Credit Facility and the agreements related thereto contain, among other things, covenants that may restrict our ability to finance future operations or capital needs or to engage in other business activities and that may impact our ability and the ability of our restricted subsidiaries to:
• | incur debt; |
• | pay dividends or make distributions; |
• | purchase or redeem stock; |
21
• | make investments and extend credit; |
• | engage in transactions with affiliates; |
• | engage in sale-leaseback transactions; |
• | consummate certain asset sales; |
• | effect a consolidation or merger or sell, transfer, lease or otherwise dispose of all or substantially all of our assets; and |
• | create liens on our assets. |
The terms of the 2013 Senior Credit Facility provide for a financial covenant in the situation where the total utilization of the revolving loan commitments (other than letters of credit up to $5.5 million at any time outstanding) exceeds 25% of the aggregate amount of those commitments. In such event, TSI, LLC is required to maintain a total leverage ratio, as defined in the 2013 Senior Credit Facility, of no greater than 4.50:1.00. As of December 31, 2017, TSI, LLC had outstanding letters of credit of $7.0 million and a total leverage ratio that was below 4.50:1.00. Other than these outstanding letters of credit, TSI, LLC did not have any amounts utilized on the 2013 Revolving Loan Facility. The terms of the 2013 Senior Credit Facility include a financial covenant under which the Company is not able to utilize more than 25%, or $11.3 million, in accordance with terms of the 2013 Revolving Loan Facility if the total leverage ratio exceeds 4.50:1:00 (calculated on a proforma basis to give effect to any borrowing).
Events beyond our control, including changes in general economic and business conditions, may affect our ability to meet certain financial ratios under the 2013 Senior Credit Facility. We may be unable to meet those tests and the lenders may decide not to waive any failure to meet those tests. A failure to satisfy these tests could limit our ability to obtain funds to pay dividends or cause a default under the 2013 Senior Credit Facility. If an event of default under the 2013 Senior Credit Facility occurs, the lenders could elect to terminate any and all outstanding undrawn commitments to lend and declare all amounts outstanding thereunder, together with accrued interest, to be immediately due and payable. If any such event should occur, we might not have sufficient assets to pay our indebtedness and meet our other obligations, which would have a material adverse effect on our business, financial condition and results of operations.
We will need to repay any indebtedness under the 2013 Revolving Loan Facility in the event the 2013 Revolving Loan Facility is not extended, restructured or refinanced.
The 2013 Revolving Loan Facility will mature on November 15, 2018. Given that the 2013 Senior Credit Facility contains a restrictive covenant on obtaining secured debt, if we are unable to extend, restructure or refinance the 2013 Revolving Loan Facility prior to maturity, all letters of credit that remain outstanding under the 2013 Revolving Loan Facility will become immediately due and payable upon maturity. As of December 31, 2017, the Company had a total of approximately $7.0 million letters of credit outstanding under the 2013 Revolving Loan Facility. This acceleration of payment related to the letters of credit could have a material adverse effect on our businesses, financial condition and results of operations.
Risks Related to Our Common Stock
The stock ownership of certain large stockholders will likely limit your ability to influence corporate matters.
As of February 23, 2018, the Company had two stockholders (including Patrick Walsh, the Chief Executive Officer and Chairman of our board of directors) which, together with each such stockholder's affiliates, beneficially owned 13.7% and 31.2% of our outstanding common stock, respectively, based on public filings made by such stockholders. Each of these stockholders may vote their stock with respect to certain matters, including any determinations with respect to mergers or other business combinations, the acquisition of assets for stock consideration or disposition of all or substantially all of our assets, and the issuance of any additional common stock or other equity securities, in a manner which may not be viewed as beneficial by other stockholders.
Our stock price could be extremely volatile, and, as a result, you may not be able to resell your shares at or above the price you paid for them.
In recent years the stock market in general has been highly volatile. As a result, the market price and trading volume of our common stock is likely to be similarly volatile, and investors in our common stock may experience a decrease, which could be substantial, in the value of their stock, including decreases unrelated to our results of operations or prospects, and could lose part or all of their investment. The price of our common stock could be subject to wide fluctuations in response to a number of factors, including those described elsewhere in this report and others such as:
22
• | actual or anticipated fluctuations in our quarterly financial results or the quarterly financial results of companies perceived to be similar to us; |
• | changes in the market’s expectations about our operating results; |
• | success of competitors; |
• | our operating results failing to meet the expectation of securities analysts or investors in a particular period; |
• | changes in financial estimates and recommendations by securities analysts concerning us or our industry in general; |
• | operating and stock price performance of other companies that investors deem comparable to the Company; |
• | our ability to market new and enhanced services on a timely basis; |
• | changes in laws and regulations affecting our business; |
• | our ability to meet compliance requirements; |
• | commencement of, or involvement in, litigation involving us; |
• | changes in our capital structure, such as future issuances of securities or the incurrence of additional debt; any major change in our board of directors or management; |
• | sales of substantial amounts of common stock by our directors, executive officers or significant stockholders or the perception that such sales could occur; and |
• | general economic and political conditions such as recessions, interest rates, fuel prices, and acts of war or terrorism. |
In the past, securities class action litigation has often been initiated against companies following periods of volatility in their stock price. This type of litigation could result in substantial costs and divert our management’s attention and resources, and could also require us to make substantial payments to satisfy judgments or to settle litigation.
Your percentage ownership in us may be diluted by future issuances of capital stock, which could reduce your influence over matters on which stockholders vote.
Our board of directors has the authority, without action or vote of our stockholders, to issue all or any part of our authorized but unissued shares of common stock, including shares issuable upon the exercise of options, or shares of our authorized but unissued preferred stock. Issuances of common stock or voting preferred stock would reduce your influence over matters on which our stockholders vote and, in the case of issuances of preferred stock, would likely result in your interest in us being subject to the prior rights of holders of that preferred stock.
Because we have no current plans to pay cash dividends on our common stock for the foreseeable future, you may not receive any return on investment unless you sell your common stock for a price greater than that which you paid for it.
We may retain future earnings, if any, for future operations, expansion and debt repayment and have no current plans to pay any cash dividends for the foreseeable future. Any decision to declare and pay dividends in the future will be made at the discretion of our board of directors and will depend on, among other things, our results of operations, financial condition, cash requirements, contractual restrictions and other factors that our board of directors may deem relevant. In addition, our ability to pay dividends may be limited by covenants of any existing and future outstanding indebtedness we or our subsidiaries incur, including our credit facility. As a result, you may not receive any return on an investment in our common stock unless you sell our common stock for a price greater than that which you paid for it.
Item 1B. Unresolved Staff Comments
None
23
Item 2. Properties
We own our 1000 Sunrise Highway location in Massapequa, New York, which houses one of our clubs and a retail tenant. This property was acquired in November 2017. We lease the remainder of our fitness clubs pursuant to long-term leases (generally 15 to 20 years, including options). In the next five years, or the period from January 1, 2018 through December 31, 2022, we have leases for 25 club locations that are due to expire without any renewal options, eight of which are due to expire in 2018, and 61 club locations that are due to expire with renewal options. Renewal options include terms for rental increases based on the consumer price index, fair market rates or stated renewal terms already set in the lease agreements.
We lease office space in Jupiter, Florida and New York City, both used for administrative and general corporate purposes. We lease approximately 82,000 square feet in Elmsford, NY, for the operation of a centralized laundry facility for the New York Sports Clubs offering towel service, and for construction and equipment storage. This space also serves as corporate office space. Total square footage related to the laundry facility is 42,000 and total square footage related to the corporate office and warehouse space is 40,000.
24
The following table provides information regarding our club locations:
Location | Address | Date Opened or Management Assumed | ||
New York region (New York Sports Clubs): | ||||
Manhattan, NY | 61 West 62nd Street | July 1983 | ||
Manhattan, NY | 1601 Broadway | September 1991 | ||
Manhattan, NY | 349 East 76th Street | April 1994 | ||
Manhattan, NY | 248 West 80th Street | May 1994 | ||
Manhattan, NY | 502 Park Avenue | February 1995 | ||
Manhattan, NY | 117 Seventh Avenue South | March 1995 | ||
Manhattan, NY | 303 Park Avenue South | December 1995 | ||
Manhattan, NY | 1635 Third Avenue | October 1996 | ||
Manhattan, NY | 575 Lexington Avenue | November 1996 | ||
Manhattan, NY | 278 Eighth Avenue | December 1996 | ||
Manhattan, NY | 200 Madison Avenue | February 1997 | ||
Manhattan, NY | 2162 Broadway | November 1997 | ||
Manhattan, NY | 633 Third Avenue | April 1998 | ||
Manhattan, NY | 217 Broadway | March 1999 | ||
Manhattan, NY | 23 West 73rd Street | April 1999 | ||
Manhattan, NY | 34 West 14th Street | July 1999 | ||
Manhattan, NY | 1372 Broadway | October 1999 | ||
Manhattan, NY | 300 West 125th Street | May 2000 | ||
Manhattan, NY | 128 Eighth Avenue | December 2000 | ||
Manhattan, NY | 2527 Broadway | August 2001 | ||
Manhattan, NY | 3 Park Avenue | August 2001 | ||
Manhattan, NY | 10 Irving Place | November 2001 | ||
Manhattan, NY | 230 West 41st Street | November 2001 | ||
Manhattan, NY | 1221 Avenue of the Americas | January 2002 | ||
Manhattan, NY | 200 Park Avenue | December 2002 | ||
Manhattan, NY | 232 Mercer Street | September 2004 | ||
Manhattan, NY | 225 Varick Street | August 2006 | ||
Manhattan, NY | 885 Second Avenue | February 2007 | ||
Manhattan, NY | 301 West 145th Street | October 2007 | ||
Manhattan, NY | 1400 5th Avenue | December 2007 | ||
Manhattan, NY | 75 West End Avenue | April 2013 | ||
Manhattan, NY | 555 Sixth Avenue | September 2014 | ||
Manhattan, NY | 28-30 Avenue A | March 2015 | ||
Manhattan, NY | 30 Broad Street | March 2015 | ||
Manhattan, NY | 1231 Third Avenue | February 2017 | ||
Manhattan, NY | 4 Astor Place | May 2017 | ||
Bronx, NY | 1601 Bronxdale Avenue | November 2007 | ||
Brooklyn, NY | 110 Boerum Place | October 1985 | ||
Brooklyn, NY | 1736 Shore Parkway | June 1998 | ||
Brooklyn, NY | 179 Remsen Street | May 2001 | ||
Brooklyn, NY | 324 Ninth Street | August 2003 | ||
Brooklyn, NY | 1630 E 15th Street | August 2007 | ||
Brooklyn, NY | 7118 Third Avenue | May 2004 | ||
Brooklyn, NY | 439 86th Street | April 2008 | ||
Brooklyn, NY | 147 Greenpoint Avenue | June 2014 | ||
Queens, NY | 69-33 Austin Street | April 1997 | ||
25
Location | Address | Date Opened or Management Assumed | ||
Queens, NY | 153-67 A Cross Island Parkway | June 1998 | ||
Queens, NY | 2856-2861 Steinway Street | February 2004 | ||
Queens, NY | 8000 Cooper Avenue | March 2007 | ||
Queens, NY | 99-01 Queens Boulevard | June 2007 | ||
Queens, NY | 39-01 Queens Boulevard | December 2007 | ||
Staten Island, NY | 300 West Service Road | June 1998 | ||
Scarsdale, NY | 696 White Plains Road | October 1995 | ||
Mamaroneck, NY | 124 Palmer Avenue | January 1997 | ||
Croton-on-Hudson, NY | 420 South Riverside Drive | January 1998 | ||
Larchmont, NY | 15 Madison Avenue | December 1998 | ||
Great Neck, NY | 15 Barstow Road | July 1989 | ||
East Meadow, NY | 625 Merrick Avenue | January 1999 | ||
Commack, NY | 6136 Jericho Turnpike | January 1999 | ||
Massapequa, NY | 1000 Sunrise Highway | November 2017 | ||
Oceanside, NY | 2909 Lincoln Avenue | May 1999 | ||
Long Beach, NY | 265 East Park Avenue | July 1999 | ||
Garden City, NY | 833 Franklin Avenue | May 2000 | ||
Huntington, NY | 350 New York Avenue | February 2001 | ||
Syosset, NY | 49 Ira Road | March 2001 | ||
West Nyack, NY | 3656 Palisades Center Drive | February 2002 | ||
Woodmere, NY | 158 Irving Street | March 2002 | ||
Hartsdale, NY | 208 E. Hartsdale Avenue | September 2004 | ||
Somers, NY | Somers Commons, 80 Route 6 | February 2005 | ||
White Plains, NY | 4 City Center | September 2005 | ||
Hawthorne, NY | 24 Saw Mill River Road | January 2006 | ||
Dobbs Ferry, NY | 50 Livingstone Avenue | June 2008 | ||
Smithtown, NY | 5 Browns Road | December 2007 | ||
Carmel, NY | 1880 Route 6 | July 2007 | ||
Hicksville, NY | 100 Duffy Avenue | November 2008 | ||
New Rochelle, NY | Trump Plaza, Huguenot Street | March 2008 | ||
Deer Park, NY | 455 Commack Avenue | March 2009 | ||
Garnerville, NY | 20 W. Ramapo Road | October 2011 | ||
Stamford, CT | 106 Commerce Road | January 1998 | ||
Greenwich, CT | 6 Liberty Way | May 1999 | ||
West Hartford, CT | 65 Memorial Road | November 2007 | ||
Princeton, NJ | 301 North Harrison Street | May 1997 | ||
Matawan, NJ | 450 Route 34 | April 1998 | ||
Marlboro, NJ | 34 Route 9 North | April 1998 | ||
Ramsey, NJ | 1100 Route 17 North | June 1998 | ||
Mahwah, NJ | 7 Leighton Place | June 1998 | ||
Springfield, NJ | 215 Morris Avenue | August 1998 | ||
Colonia, NJ | 1250 Route 27 | August 1998 | ||
Hoboken, NJ | 59 Newark Street | October 1998 | ||
West Caldwell, NJ | 913 Bloomfield Avenue | April 1999 | ||
Jersey City, NJ | 147 Two Harborside Financial Center | June 2002 | ||
Newark, NJ | 1 Gateway Center | October 2002 | ||
Ridgewood, NJ | 129 S. Broad Street | June 2003 | ||
Westwood, NJ | 35 Jefferson Avenue | June 2004 | ||
Livingston, NJ | 39 W. North Field Road | February 2005 | ||
Hoboken, NJ | 210 14th Street | December 2006 | ||
26
Location | Address | Date Opened or Management Assumed | ||
Englewood, NJ | 34-36 South Dean Street | December 2006 | ||
Clifton, NJ | 202 Main Avenue | March 2007 | ||
Montclair, NJ | 56 Church Street | January 2008 | ||
Butler, NJ | 1481 Route 23 | January 2009 | ||
East Brunswick, NJ | 300 State Route 18 | March 2009 | ||
Bayonne, NJ | 550 Route 440 North | December 2011 | ||
New York region (Lucille Roberts): | ||||
Manhattan, NY | 50 East 42nd Street | September 2017 | ||
Manhattan, NY | 1387 Nicholas Avenue | September 2017 | ||
Bronx, NY | 2449 Morris Avenue | September 2017 | ||
Brooklyn, NY | 430 89th Street | September 2017 | ||
Brooklyn, NY | 925 Kings Highway | September 2017 | ||
Brooklyn, NY | 1950 Ralph Avenue | September 2017 | ||
Queens, NY | 32-62 Steinway Street | September 2017 | ||
Queens, NY | 135-39 38th Avenue | September 2017 | ||
Queens, NY | 70-20 Austin Street | September 2017 | ||
Commack, NY | 6534 Jericho Turnpike | September 2017 | ||
Bay Shore, NY | 1850 Sunrise Highway | September 2017 | ||
Holbrook, NY | 5801 Sunrise Highway | September 2017 | ||
Rockville Centre, NY | 298 Sunrise Highway | September 2017 | ||
Valley Stream, NY | 225 West Merrick Road | September 2017 | ||
Clifton, NJ | 1075 Bloomfield Avenue | September 2017 | ||
Jersey City, NJ | 338 Central Avenue | September 2017 | ||
New York region (TMPL): | ||||
Manhattan, NY | 355 West 49th Street | December 2017 | ||
Boston region (Boston Sports Clubs): | ||||
Boston, MA | 1 Bulfinch Place | August 1998 | ||
Boston, MA | 201 Brookline Avenue | June 2000 | ||
Boston, MA | 361 Newbury Street | November 2001 | ||
Boston, MA | 350 Washington Street | February 2002 | ||
Boston, MA | 505 Boylston Street | January 2006 | ||
Boston, MA | 560 Harrison Avenue | February 2006 | ||
Boston, MA | 695 Atlantic Avenue | October 2006 | ||
Boston, MA | One Beacon Street | May 2013 | ||
Boston, MA | 800 Boylston Street | May 2013 | ||
Boston, MA | 100 Summer Street | May 2013 | ||
Boston, MA | 540 Gallivan Road | October 2014 | ||
Boston, MA | 95 Washington Street | November 2014 | ||
Boston, MA | 699 Boylston Street | June 2015 | ||
Allston, MA | 15 Gorham Street | July 1997 | ||
Wellesley, MA | 140 Great Plain Avenue | July 2000 | ||
Lynnfield, MA | 425 Walnut Street | July 2000 | ||
Lexington, MA | 475 Bedford Avenue | July 2000 | ||
Cambridge, MA | 625 Massachusetts Avenue | January 2001 | ||
West Newton, MA | 1359 Washington Street | November 2001 | ||
Waltham, MA | 840 Winter Street | November 2002 | ||
Watertown, MA | 311 Arsenal Street | January 2006 | ||
Newton, MA | 135 Wells Avenue | August 2006 | ||
Somerville, MA | 1 Davis Square | December 2007 | ||
Medford, MA | 70 Station Landing | December 2007 | ||
Westborough, MA | 1500 Union Street | September 2008 | ||
27
Location | Address | Date Opened or Management Assumed | ||
Westborough, MA | 35 Chauncy Street | January 2018 | ||
Woburn, MA | 300 Presidential Way | December 2008 | ||
Wayland, MA | Wayland Town Center | November 2014 | ||
Providence, RI | 131 Pittman Street | December 2008 | ||
Washington, D.C. region (Washington Sports Clubs): | ||||
Washington, D.C. | 1835 Connecticut Avenue, N.W | January 1990 | ||
Washington, D.C. | 2251 Wisconsin Avenue, N.W | May 1994 | ||
Washington, D.C. | 1211 Connecticut Avenue, N.W | July 2000 | ||
Washington, D.C. | 783 Seventh Street, N.W | October 2004 | ||
Washington, D.C. | 3222 M Street, N.W | February 2005 | ||
Washington, D.C. | 14th Street, N.W | June 2008 | ||
North Bethesda, MD | 10400 Old Georgetown Road | June 1998 | ||
Silver Spring, MD | 8506 Fenton Street | November 2005 | ||
Bethesda, MD | 6800 Wisconsin Avenue | November 2007 | ||
Clarendon, VA | 2700 Clarendon Boulevard | November 2001 | ||
Philadelphia region (Philadelphia Sports Clubs): | ||||
Philadelphia, PA | 220 South 5th Street | January 1999 | ||
Philadelphia, PA | 2000 Hamilton Street | July 1999 | ||
Chalfont, PA | One Highpoint Drive | January 2000 | ||
Philadelphia, PA | 1735 Market Street | October 2000 | ||
Radnor, PA | 555 East Lancaster Avenue | December 2006 | ||
Florida region (Christi's Fitness): | ||||
Vero Beach, FL | 1250 Old Dixie Highway | January 2018 | ||
Switzerland region: | ||||
Basel, Switzerland | St. Johanns-Vorstadt 41 | August 1987 | ||
Zurich, Switzerland | Glarnischstrasse 35 | August 1987 | ||
Basel, Switzerland | Gellerstrasse 235 | August 2001 | ||
28
Item 3. Legal Proceedings
On February 7, 2007, in an action styled White Plains Plaza Realty, LLC v. TSI, LLC et al., the landlord of one of TSI, LLC’s former health and fitness clubs filed a lawsuit in the Appellate Division, Second Department of the Supreme Court of the State of New York against it and two of its health club subsidiaries alleging, among other things, breach of lease in connection with the decision to close the club located in a building owned by the plaintiff and leased to a subsidiary of TSI, LLC, the tenant, and take additional space in a nearby facility leased by another subsidiary of TSI, LLC. Following a determination of an initial award, which TSI, LLC and the tenant have paid in full, the landlord appealed the trial court’s award of damages, and on August 29, 2011, an additional award (amounting to approximately $900,000) (the “Additional Award”), was entered against the tenant, which has recorded a liability. Separately, TSI, LLC is party to an agreement with a third-party developer, which by its terms provides indemnification for the full amount of any liability of any nature arising out of the lease described above, including attorneys’ fees incurred to enforce the indemnity. As a result, the developer reimbursed TSI, LLC and the tenant the amount of the initial award in installments over time and also agreed to be responsible for the payment of the Additional Award, and the tenant has recorded a receivable related to the indemnification for the Additional Award. The developer and the landlord are currently litigating the payment of the Additional Award and judgment was entered against the developer on June 5, 2013, in the amount of approximately $1.0 million, plus interest, which judgment was upheld by the appellate court on April 29, 2015. TSI, LLC does not believe it is probable that TSI, LLC will be required to pay for any amount of the Additional Award.
In addition to the litigation discussed above, the Company is involved in various other lawsuits, claims and proceedings incidental to the ordinary course of business, including personal injury, construction matters, employee relations claims and landlord tenant disputes. The results of litigation are inherently unpredictable. Any claims against the Company, whether meritorious or not, could be time consuming, result in costly litigation, require significant amounts of management time and result in diversion of significant resources. The results of these other lawsuits, claims and proceedings cannot be predicted with certainty. The Company establishes accruals for loss contingencies when it has determined that a loss is probable and that the amount of loss, or range of loss, can be reasonably estimated. Any such accruals are adjusted thereafter as appropriate to reflect changes in circumstances. We currently believe that the ultimate outcome of such lawsuits, claims and proceedings will not, individually or in the aggregate, have a material adverse effect on our consolidated financial position, results of operations or liquidity. However, depending on the amount and timing, an unfavorable resolution of some or all of these matters could materially affect our future results of operations in a particular period.
Item 4. Mine Safety Disclosures
Not applicable.
29
PART II
Item 5. Market for Registrant’s Common Equity and Related Stockholder Matters and Issuer Purchases of Equity Securities
Price Range of Common Stock
Our common stock currently trades on The NASDAQ Global Market, under the symbol CLUB. The following table sets forth, for each quarterly period in the last two fiscal years, the high and low sales prices (in dollars per share) of our common stock as quoted or reported on The NASDAQ Global Market:
High | Low | ||||||
Year ended December 31, 2017: | |||||||
First Quarter | $ | 4.20 | $ | 2.45 | |||
Second Quarter | $ | 4.90 | $ | 3.15 | |||
Third Quarter | $ | 7.15 | $ | 4.28 | |||
Fourth Quarter | $ | 7.10 | $ | 5.00 | |||
Year ended December 31, 2016: | |||||||
First Quarter | $ | 3.02 | $ | 0.92 | |||
Second Quarter | $ | 3.97 | $ | 2.38 | |||
Third Quarter | $ | 3.45 | $ | 2.43 | |||
Fourth Quarter | $ | 3.16 | $ | 2.10 | |||
Holders
As of February 23, 2018, there were approximately 110 holders of record of our common stock. There are additional holders who are not “holders of record” but who beneficially own stock through nominee holders such as brokers and benefit plan trustees.
Dividends Policy
The Company did not declare any dividends in 2017, 2016 or 2015. The cash dividends were funded by available cash on hand.
The board of directors does not currently intend to declare dividends. The declaration and payment of dividends to holders of our common stock by us, if any, are subject to the discretion of our board of directors. Our board of directors will take into account such matters as general economic and business conditions, our strategic plans, our financial results and condition, contractual, legal and regulatory restrictions on the payment of dividends by us and our subsidiaries and such other factors as our board of directors may consider to be relevant. If we decide to pay a dividend, we may rely on cash on hand at TSI Holdings, which was approximately $17.6 million at December 31, 2017, and distributions received from our subsidiaries to provide the funds necessary to pay dividends on our common stock.
The existing credit agreement of TSI, LLC restricts the ability of our subsidiaries to pay cash distributions to TSI Holdings in order for TSI Holdings to pay cash dividends except (a) in an amount, when combined with certain prepayments of indebtedness, of up to $35.0 million, subject to pro forma compliance with a total leverage ratio of no greater than 4.50:1.00 and no default or event of default existing or continuing under the credit agreement, and (b) an additional amount based on excess cash flow, such additional amounts subject to pro forma compliance with a total leverage ratio of less than 4.00:1.00 and no default or event of default existing or continuing under the credit agreement. In October 2017, TSI, LLC made a dividend distribution of $35.0 million to TSI Holdings, Inc.
Issuer Purchases of Equity Securities
We did not purchase any equity securities during the fourth quarter ended December 31, 2017.
Recent Sales of Unregistered Securities
We did not sell any securities during the year ended December 31, 2017 that were not registered under the Securities Act of 1933, as amended (the “Securities Act”), other than as previously reported in a Current Report on Form 8-K.
30
Stock Performance Graph
The graph depicted below compares the changes in our cumulative total stockholder return with the cumulative total return of the Russell 2000 and the NASDAQ composite indices.
COMPARISON OF 5 YEAR CUMULATIVE TOTAL RETURN*
Among Town Sports International Holdings, Inc, the NASDAQ Composite Index, and the Russell 2000 Index
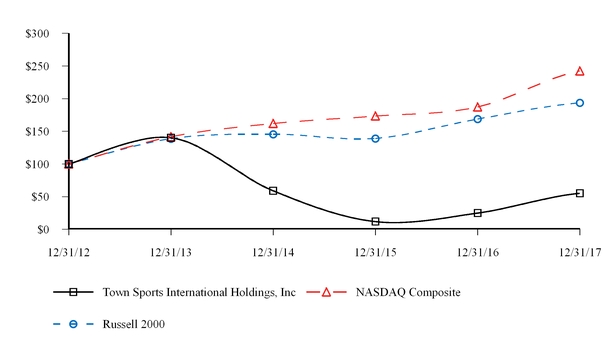
* | $100 invested on 12/31/12 in stock or index, including reinvestment of dividends. Fiscal year ended December 31. |
December 31, | |||||||||||||||||||||||
2012 | 2013 | 2014 | 2015 | 2016 | 2017 | ||||||||||||||||||
Town Sports International Holdings, Inc | $ | 100.00 | $ | 140.06 | $ | 59.01 | $ | 11.82 | $ | 24.83 | $ | 55.13 | |||||||||||
NASDAQ Composite | $ | 100.00 | $ | 141.63 | $ | 162.09 | $ | 173.33 | $ | 187.19 | $ | 242.29 | |||||||||||
Russell 2000 | $ | 100.00 | $ | 138.82 | $ | 145.62 | $ | 139.19 | $ | 168.85 | $ | 193.58 | |||||||||||
Notes :
(1) | The graph covers the period from December 31, 2012 to December 31, 2017. |
(2) | The graph assumes that $100 was invested at the market close on December 31, 2011, in our common stock, in the Russell 2000 and in the NASDAQ composite indexes and that all dividends were reinvested. |
(3) | On each of November 26, 2013, March 5, 2014 and June 5, 2014, we paid a quarterly cash dividend of $0.16 per share to common stock holders. |
(4) | Stockholder returns over the indicated period should not be considered indicative of future stockholder returns. |
(5) | We include a comparison against the Russell 2000 because there is no published industry or line-of-business index for our industry and we do not have a readily definable peer group that is publicly traded. |
Notwithstanding anything to the contrary set forth in any of our previous or future filings under the Securities Act, or the Exchange Act that might incorporate by reference this Annual Report or future filings made by the Company under those statutes, the Stock Performance Graph is not deemed filed with the SEC, is not deemed soliciting material and shall not be deemed incorporated by reference into any of those prior filings or into any future filings made by the Company under those statutes, except to the extent that the Company specifically incorporates such information by reference into a previous or future filing, or specifically requests that such information be treated as soliciting material, in each case under those statutes.
31
Item 6. Selected Financial Data
SELECTED CONSOLIDATED FINANCIAL AND OTHER DATA
(In thousands, except share, per share, club and membership data)
The selected consolidated balance sheet data as of December 31, 2017 and 2016 and the selected consolidated statement of operations and cash flow data for the years ended December 31, 2017, 2016 and 2015 have been derived from our audited consolidated financial statements included elsewhere herein. The selected consolidated balance sheet data as of December 31, 2015, 2014 and 2013 and the selected consolidated statement of operations and cash flow data for the years ended December 31, 2014 and 2013 have been derived from our audited consolidated financial statements not included herein. Other data and club and membership data for all periods presented have been derived from our unaudited books and records. Our historical results are not necessarily indicative of results for any future period. You should read these selected consolidated financial and other data, together with the accompanying notes, in conjunction with the “Management’s Discussion and Analysis of Financial Condition and Results of Operations” section of this Annual Report and our consolidated financial statements and the related notes appearing at the end of this Annual Report.
Year Ended December 31, | ||||||||||||||||||||
2017 | 2016 | 2015 | 2014 | 2013 | ||||||||||||||||
Statement of Operations Data: | ||||||||||||||||||||
Revenues | $ | 403,042 | $ | 396,921 | $ | 424,323 | $ | 453,842 | $ | 470,225 | ||||||||||
Operating expenses: | ||||||||||||||||||||
Payroll and related | 145,612 | 149,029 | 175,898 | 177,009 | 174,894 | |||||||||||||||
Club operating | 180,467 | 185,104 | 196,725 | 192,716 | 179,683 | |||||||||||||||
General and administrative | 22,680 | 24,702 | 30,683 | 31,352 | 28,431 | |||||||||||||||
Depreciation and amortization | 40,849 | 43,727 | 47,887 | 47,307 | 49,099 | |||||||||||||||
Impairment of fixed assets | 6,497 | 742 | 14,571 | 4,569 | 714 | |||||||||||||||
Impairment of goodwill | — | — | 31,558 | 137 | — | |||||||||||||||
Gain on sale of building(1) | — | — | (77,146 | ) | — | — | ||||||||||||||
Gain on lease termination(2) | — | — | (2,967 | ) | — | — | ||||||||||||||
Insurance recovery related to damaged property(3) | — | — | — | — | (3,194 | ) | ||||||||||||||
Operating income (loss) | 6,937 | (6,383 | ) | 7,114 | 752 | 40,598 | ||||||||||||||
(Gain) loss on extinguishment of debt(4) | — | (37,893 | ) | (17,911 | ) | 493 | 750 | |||||||||||||
Interest expense, net of interest income | 12,587 | 13,938 | 20,579 | 19,039 | 22,616 | |||||||||||||||
Equity in the earnings of investees and rental income | (333 | ) | (242 | ) | (2,361 | ) | (2,402 | ) | (2,459 | ) | ||||||||||
(Loss) income before provision (benefit) for corporate income taxes | (5,317 | ) | 17,814 | 6,807 | (16,378 | ) | 19,691 | |||||||||||||
(Benefit) provision for corporate income taxes(5) | (9,686 | ) | 9,771 | (14,351 | ) | 52,611 | 7,367 | |||||||||||||
Net income (loss) | $ | 4,369 | $ | 8,043 | $ | 21,158 | $ | (68,989 | ) | $ | 12,324 | |||||||||
Earnings (loss) per share: | ||||||||||||||||||||
Basic | $ | 0.16 | $ | 0.31 | $ | 0.86 | $ | (2.84 | ) | $ | 0.51 | |||||||||
Diluted | $ | 0.16 | $ | 0.31 | $ | 0.84 | $ | (2.84 | ) | $ | 0.50 | |||||||||
Dividends declared per common share(6) | $ | — | $ | — | $ | — | $ | 0.32 | $ | 0.16 | ||||||||||
32
As of December 31, | ||||||||||||||||||||
2017 | 2016 | 2015 | 2014 | 2013 | ||||||||||||||||
Balance Sheet Data: | ||||||||||||||||||||
Cash and cash equivalents | $ | 30,321 | $ | 45,596 | $ | 76,217 | $ | 93,452 | $ | 73,598 | ||||||||||
Working capital surplus (deficit) | 5,398 | (6,323 | ) | 27,947 | 52,280 | 27,830 | ||||||||||||||
Total assets(7) | 236,671 | 235,878 | 303,101 | 407,150 | 410,588 | |||||||||||||||
Long-term debt, including current installments(7) | 196,029 | 196,825 | 266,740 | 297,188 | 311,705 | |||||||||||||||
Total stockholders’ deficit | (77,957 | ) | (85,670 | ) | (96,245 | ) | (118,084 | ) | (43,516 | ) | ||||||||||
Net debt(8) | 169,597 | 156,404 | 199,200 | 214,832 | 251,402 | |||||||||||||||
Year Ended December 31, | ||||||||||||||||||||
2017 | 2016 | 2015 | 2014 | 2013 | ||||||||||||||||
Cash Flow Data: | ||||||||||||||||||||
Cash provided by (used in): | ||||||||||||||||||||
Operating activities | $ | 28,199 | $ | 21,190 | $ | 24,870 | $ | 4,758 | $ | 67,388 | ||||||||||
Investing activities | (41,531 | ) | (20,003 | ) | (31,571 | ) | (42,054 | ) | (30,606 | ) | ||||||||||
Financing activities | (1,980 | ) | (31,763 | ) | (10,511 | ) | 57,503 | (975 | ) | |||||||||||
Year Ended December 31, | ||||||||||||||||||||
2017 | 2016 | 2015 | 2014 | 2013 | ||||||||||||||||
Club and Membership Data: | ||||||||||||||||||||
New clubs opened | 2 | 1 | 1 | 4 | — | |||||||||||||||
Clubs acquired | 18 | — | — | — | 6 | |||||||||||||||
Studio locations converted to clubs | — | 2 | — | — | — | |||||||||||||||
Clubs closed | (5 | ) | (5 | ) | (6 | ) | (8 | ) | (4 | ) | ||||||||||
Wholly-owned clubs operated at end of period | 164 | 149 | 151 | 156 | 160 | |||||||||||||||
Total clubs operated at end of period(9) | 165 | 150 | 152 | 158 | 162 | |||||||||||||||
Studio locations at end of period | — | — | 3 | 1 | — | |||||||||||||||
Total members at end of period(10) | 587,000 | 544,000 | 541,000 | 484,000 | 497,000 | |||||||||||||||
Restricted members at end of period(11) | — | — | — | 20,000 | 41,000 | |||||||||||||||
Comparable club revenue increase (decrease)(12) | 1.6 | % | (4.1 | )% | (5.6 | )% | (4.2 | )% | (1.8 | )% | ||||||||||
Revenue per weighted average club (in thousands)(13) | $ | 2,641 | $ | 2,634 | $ | 2,777 | $ | 2,842 | $ | 2,971 | ||||||||||
Average revenue per member(14) | $ | 713 | $ | 728 | $ | 823 | $ | 941 | $ | 934 | ||||||||||
Average Joining Fees per member(15) | $ | 60 | $ | 61 | $ | 72 | $ | 75 | $ | 59 | ||||||||||
Annual attrition(16) | 47.0 | % | 44.3 | % | 46.9 | % | 44.3 | % | 41.9 | % | ||||||||||
(1) | The $77,146 gain on sale of building in the year ended December 31, 2015 was related to the sale of our East 86th Street property. Refer to Note 9 – Sale of Building to the Company’s consolidated financial statements for further details. |
(2) | The $2,967 net gain on lease termination in the year ended December 31, 2015 was related to the termination of a lease for a planned club opening that was not yet effective. |
(3) | The $3,194 of insurance recovery related to damaged property in the year ended December 31, 2013 was related to property damaged by Hurricane Sandy. |
(4) | The $37,893 gain on extinguishment of debt recorded for the year ended December 31, 2016 was net of the write-off of deferred financing costs and debt discount of $545 and $1,561, respectively, and other costs related to the transaction. In April 2016, TSI Holdings settled a transaction to purchase $8,705 principal amount of debt outstanding under the 2013 |
33
Senior Credit Facility for $3,787. In May 2016, TSI Holdings settled another transaction to purchase $62,447 principal amount of debt outstanding under the 2013 Senior Credit Facility for $25,978. The purchased debt was transferred to TSI, LLC and canceled.
The $17,911 gain on extinguishment of debt recorded for the year ended December 31, 2015 included the write-off of related deferred financing costs and debt discount of $249 and $707, respectively, and other costs related to the transaction. In the year ended December 31, 2015, TSI Holdings purchased $29,829 principal amount of debt outstanding under the 2013 Senior Credit Facility in the open market for $10,947, and such debt was transferred to TSI, LLC and cancelled.
The $493 loss on extinguishment of debt recorded for the year ended December 31, 2014 is comprised of the write-off of unamortized debt issuance costs and debt discount in connection with the fourth quarter 2014 mandatory prepayment of $13,500 on the 2013 Term Loan Facility.
The $750 loss on extinguishment of debt recorded for the year ended December 31, 2013 is comprised of the write-off of net deferred financing costs and debt discount in connection with the November 15, 2013 debt refinancing. The proceeds from the 2013 Senior Credit Facility were used to repay the remaining outstanding principal amounts of a previous senior secured credit facility, entered into in May 2011, of $315,743 plus accrued and unpaid interest.
(5) | Corporate income taxes for the years ended December 31, 2017, 2016 and 2015 included non-cash charges of $38,769, $54,193 and $52,637, respectively, related to tax valuation allowances. Corporate income taxes for the year ended December 31, 2013 included income tax benefits totaling $16 related to the correction of accounting errors. For the years ended December 31, 2017, 2016 and 2015, see Note 15 — Corporate Income Taxes to the Company’s consolidated financial statements in this Annual Report for further details. |
(6) | In April 2014, February 2014 and November 2013, the board of directors of the Company declared quarterly cash dividends of $0.16 per share. The quarterly dividend was discontinued in the second quarter of 2014. |
(7) | Effective January 1, 2016, the Company elected to change its method of presentation relating to debt issuance costs in accordance with Accounting Standards Update (“ASU”) 2015-03. As a result, in 2015, 2014 and 2013, the Company reclassified $2,259, $2,683 and $3,204, respectively, of deferred financing costs from other long-term assets to long-term debt. |
(8) | Net debt represents the total principal balance of long-term debt outstanding, net of cash and cash equivalents. |
(9) | Includes wholly-owned and one partly-owned club. Not included in the total club count is one partly-owned club in which we have an equity interest but operates under a different brand and four locations that are managed by us in which we do not have an equity interest. |
(10) | Represents members (including restricted members) at wholly-owned and partly-owned clubs. Restricted members primarily include students and teachers. |
(11) | Restricted members (“Restricted Memberships”) primarily include students and teachers. This membership allowed for club usage at restricted times, at a discount to other memberships offered. The Restricted Membership was discontinued and the Company aggregated all members beginning in 2015. |
(12) | Total revenue for a club is included in comparable club revenue increase (decrease) beginning on the first day of the thirteenth full calendar month of the club’s operation. |
(13) | Revenue per weighted average club is calculated as total revenue divided by the product of the total number of clubs and their weighted average months in operation as a percentage of the period. |
(14) | Average revenue per member is total revenue from wholly-owned clubs for the period divided by the average number of members from wholly-owned clubs for the period, where average number of memberships for the period is derived by dividing the sum of the total memberships at the end of each month during the period by the total number of months in the period. |
(15) | Average joining fees per member is calculated as the first annual fees and total initiation fees divided by the number of new members during each respective year. |
(16) | Annual attrition is calculated as total member losses for the year divided by the average monthly member count over the year during each respective year. |
34
Item 7. Management’s Discussion and Analysis of Financial Condition and Results of Operations
You should read the following discussion and analysis of our financial condition and consolidated results of operations in conjunction with the “Selected Consolidated Financial and Other Data” section of this Annual Report and our consolidated financial statements and the related notes appearing at the end of this Annual Report. In addition to historical information, this discussion and analysis contains forward-looking statements that involve risks, uncertainties and assumptions. Our actual results may differ materially from those anticipated in these forward-looking statements as a result of certain factors, including, but not limited to, those set forth under the headings “Risk Factors,” “Business” and “Forward-Looking Statements” contained in Item 1A, Item 1, and Part I, respectively, of this Annual Report.
Overview
Based on the number of clubs, we are one of the leading owners and operators of fitness clubs in the Northeast region of the U.S. As of December 31, 2017, the Company, through its subsidiaries, owned and operated 165 clubs. Our clubs collectively served approximately 587,000 members as of December 31, 2017. As of December 31, 2017, we owned and operated a total of 119 clubs in the New York metropolitan region (102 of which were under the “New York Sports Clubs” brand name, 16 of which were under the “Lucille Roberts” brand name and one of which was under the “TMPL” brand name), including 39 locations in Manhattan where we are one of the largest fitness club owners and operators. Additionally, we owned and operated 28 clubs in the Boston metropolitan region under our “Boston Sports Clubs” brand name, 10 clubs (one of which is partly-owned) in the Washington, D.C. metropolitan region under our “Washington Sports Clubs” brand name and five clubs in the Philadelphia metropolitan region under our “Philadelphia Sports Clubs” brand name, and three clubs in Switzerland. In addition, as of December 31, 2017, we have one partly-owned club that operates under a different brand name in Washington, D.C. We employ localized brand names for our clubs to create an image and atmosphere consistent with the local community and to foster recognition as a local network of quality fitness clubs rather than a national chain.
We develop clusters of clubs to serve densely populated major metropolitan regions and we service such populations by clustering clubs near the highest concentrations of our target customers’ areas of both employment and residence. Our clubs are located for maximum convenience to our members in urban or suburban areas, close to transportation hubs or office or retail centers. Our members include a wide age demographic covering the student market to the active mature market. In each of our markets, we have developed clusters by initially opening or acquiring clubs located in the more central urban markets of the region and then branching out from these urban centers to suburbs and neighboring communities.
We focus on opening and acquiring clubs in areas where we believe the region is underserved or where new clubs are intended to replace existing clubs at lease expiration. Prior to 2017, our focus was on building new clubs. Based on our experience, a new club tends to experience a significant increase in revenue during the first three years of operation until it reaches maturity and because there is relatively little incremental cost associated with increasing such revenue, there is a greater proportionate increase in profitability. In contrast, operating income margins may be negatively impacted at these locations until the club matures. More recently, our focus has been on acquiring health clubs that have already reached maturity and therefore operating results are more established and stable upon acquisition.
In 2017, we acquired a total of 18 clubs. We acquired Lucille Roberts, which added 16 clubs to our portfolio. These 16 clubs continue to operate as women only clubs under the Lucille Roberts trade name. We also acquired one existing club in Massapequa, NY, currently operating under the New York Sports Clubs brand name, including the land and the building such club occupies, as well as TMPL Gym (“TMPL”), an existing club in Manhattan, which continues to operate under the TMPL brand name. TMPL is the Company’s luxury brand that the Company plans to expand. All 18 acquisitions were additions to our portfolio in the New York metropolitan region. The results of operations of the clubs acquired have been included in our consolidated financial statements from the respective dates of such acquisitions.
Revenue and Operating Expenses
We have two principal sources of revenue:
• | Membership revenue: Our largest sources of revenue are dues inclusive of monthly membership fees, annual maintenance fees, and initiation and processing fees paid by our members. In addition, we collect usage fees on a per visit basis for non-passport members using non-home clubs. These dues and fees comprised 77.0% of our total revenue for the year ended December 31, 2017. We recognize revenue from membership dues in the month when the services are rendered. We recognize revenue from initiation and processing fees over the estimated average membership life and annual fees over a twelve month period. |
35
• | Ancillary club revenue: For the year ended December 31, 2017, we generated 17.3% of our revenue from personal training and 4.3% of our revenue from other ancillary programs and services consisting of Sports Clubs for Kids, racquet sports and Small Group Training programs. We continue to grow ancillary club revenue by building on ancillary programs such as our personal training membership product and our fee-based Small Group Training programs. |
We also receive revenue (approximately 1.4% of our total revenue for the year ended December 31, 2017) from the rental of space in our facilities to operators who offer wellness-related offerings, such as physical therapy and juice bars. In addition, we sell in-club advertising and sponsorships, provide laundry services to third parties, and generate management fees from certain club facilities that we do not wholly own. We refer to these revenues as Fees and other revenue.
Our performance is dependent in part on our ability to continually attract and retain members at our clubs. In the years ended December 31, 2017 and 2016, our attrition rate was 47.0% and 46.9%, respectively.
Our operating expenses are comprised of both fixed and variable costs. Fixed costs include club and supervisory and other salary and related expenses, occupancy costs, including most elements of rent, utilities, housekeeping and contracted maintenance expenses, as well as depreciation. Variable costs are primarily related to payroll associated with ancillary club revenue, membership sales compensation, advertising, certain facility repairs and club supplies.
General and administrative expenses include costs relating to our centralized support functions, such as accounting, insurance, information and communication systems, purchasing, member relations, legal and consulting fees and real estate development expenses. Payroll and related expenses are included in a separate line item on the consolidated statement of operations and are not included in general and administrative expenses. Approximately 45% of general and administrative expenses relate directly to club operations including phone and data lines, computer maintenance, business licenses, office and sales supplies, general liability insurance, recruiting and training.
As clubs mature and increase their membership base, fixed costs are typically spread over an increasing revenue base and operating margins tend to improve. Conversely, when our membership base declines, our operating margins are negatively impacted.
Our primary capital expenditures relate to routine improvements at our clubs, the construction or acquisition of new club facilities and the upgrade and renovation of our existing clubs. The construction and equipment costs vary based on the costs of construction labor, as well as the planned service offerings and size and configuration of the facility. We perform routine improvements at our clubs and partial replacement of the fitness equipment each year for which we are currently budgeting approximately 2% of projected annual revenue. In this regard, facility remodeling is also considered where appropriate.
Operating income is impacted by certain charges and benefits which can fluctuate year to year. In 2017 and 2016, operating income was impacted by fixed asset impairment charges of $6.5 million and $742,000, respectively, related to underperforming clubs. In 2015, operating income included a gain on sale of building of $77.1 million and gain on lease termination of $3.0 million, partially offset by goodwill impairment charges of $31.6 million associated with the New York and Boston regions, and fixed asset impairment charges of $14.6 million related to underperforming clubs.
Year Ended December 31, | ||||||||||||
2017 | 2016 | 2015 | ||||||||||
($ amounts in thousands) | ||||||||||||
Operating income (loss) | $ | 6,937 | $ | (6,383 | ) | $ | 7,114 | |||||
Increase (decrease) over prior period | 208.7 | % | (189.7 | )% | 846.0 | % | ||||||
Net income | $ | 4,369 | $ | 8,043 | $ | 21,158 | ||||||
(Decrease) increase over prior period | (45.7 | )% | (62.0 | )% | 130.7 | % | ||||||
Cash flows provided by operating activities | $ | 28,199 | $ | 21,190 | $ | 24,870 | ||||||
Increase (decrease) over prior period | 33.1 | % | (14.8 | )% | 422.7 | % | ||||||
As of December 31, 2017, 164 of our fitness clubs were wholly-owned by us and our consolidated financial statements include the operating results of all such clubs. One location in Washington, D.C., was partly-owned by us, with our profit sharing percentage approximating 45%, and is treated as an unconsolidated affiliate for which we apply the equity method of accounting. We also partly-owned another location in Washington, D.C., which does not operate under the Washington Sports Clubs brand, with a profit sharing percentage approximating 20% (after priority distributions) for which the equity accounting method is also applied. In addition, we provide management services at four locations where we do not have an equity interest.
36
Comparable Club Revenue
We define comparable club revenue as revenue at those clubs that were operated by us for over 12 months and comparable club revenue increase (decrease) as revenue for the 13th month and thereafter as applicable as compared to the same period of the prior year.
Comparable Club Revenue Increase (Decrease) | ||||||
Quarter | Full-Year | |||||
2015 | ||||||
First Quarter | (3.5 | )% | ||||
Second Quarter | (5.4 | )% | ||||
Third Quarter | (7.1 | )% | ||||
Fourth Quarter | (6.7 | )% | (5.6 | )% | ||
2016 | ||||||
First Quarter | (7.6 | )% | ||||
Second Quarter | (4.5 | )% | ||||
Third Quarter | (3.0 | )% | ||||
Fourth Quarter | (2.2 | )% | (4.1 | )% | ||
2017 | ||||||
First Quarter | 0.7 | % | ||||
Second Quarter | 1.2 | % | ||||
Third Quarter | 1.8 | % | ||||
Fourth Quarter | 2.8 | % | 1.6 | % | ||
Key determinants of comparable club revenue increases (decreases) are new memberships, member retention rates, pricing and ancillary revenue increases (decreases).
The comparable club revenue increase in 2017 was primarily due to higher average dues per membership and an increase in member count in comparable clubs, partially offset by decreased initiation and processing fees and other ancillary club revenue. The comparable club revenue decline experienced in 2016 was primarily due to lower average dues per membership, partially offset by an increase in membership sales volume and annual fees. The comparable club revenue decline experienced in 2015 was primarily due to the decline in membership dues. In 2015, the effect of new members enrolling at lower monthly dues combined with members cancelling who were paying higher monthly dues was only partially offset by an increase in membership sales volume.
Historical Club Count
Year Ended December 31, | |||||||||
2017 | 2016 | 2015 | |||||||
Wholly-owned clubs operated at beginning of period | 149 | 151 | 156 | ||||||
Acquired clubs | 18 | — | — | ||||||
New clubs opened | 2 | 1 | 1 | ||||||
Studio locations converted to clubs | — | 2 | — | ||||||
Clubs closed | (5 | ) | (5 | ) | (6 | ) | |||
Wholly-owned clubs operated at end of period | 164 | 149 | 151 | ||||||
Partly-owned clubs operated at end of period(1) | 1 | 1 | 1 | ||||||
Total clubs operated at end of period(1)(2) | 165 | 150 | 152 | ||||||
(1) | Excludes one partly-owned club that operates under a different brand name in our Washington, D.C. region. |
(2) | Excludes locations that are managed by us in which we do not have an equity interest. |
37
Consolidated Results of Operations
The following table sets forth certain operating data as a percentage of revenue for the periods indicated:
Year Ended December 31, | ||||||||
2017 | 2016 | 2015 | ||||||
Revenues | 100.0 | % | 100.0 | % | 100.0 | % | ||
Operating expenses: | ||||||||
Payroll and related | 36.1 | 37.5 | 41.5 | |||||
Club operating | 44.8 | 46.7 | 46.4 | |||||
General and administrative | 5.6 | 6.2 | 7.2 | |||||
Depreciation and amortization | 10.2 | 11.0 | 11.3 | |||||
Impairment of fixed assets | 1.6 | 0.2 | 3.4 | |||||
Impairment of goodwill | — | — | 7.4 | |||||
Gain on sale of building | — | — | (18.2 | ) | ||||
Gain on lease termination | — | — | (0.7 | ) | ||||
98.3 | 101.6 | 98.3 | ||||||
Operating income (loss) | 1.7 | (1.6 | ) | 1.7 | ||||
Gain on extinguishment of debt | — | (9.5 | ) | (4.2 | ) | |||
Interest expense | 3.1 | 3.5 | 4.9 | |||||
Equity in the earnings of investees and rental income | (0.1 | ) | (0.1 | ) | (0.6 | ) | ||
(Loss) income before (benefit) provision for corporate income taxes | (1.3 | ) | 4.5 | 1.6 | ||||
(Benefit) provision for corporate income taxes | (2.4 | ) | 2.5 | (3.4 | ) | |||
Net income | 1.1 | % | 2.0 | % | 5.0 | % | ||
Year ended December 31, 2017 compared to year ended December 31, 2016
Revenue
Revenue (in thousands) was comprised of the following for the periods indicated:
Year Ended December 31, | ||||||||||||||||
2017 | 2016 | |||||||||||||||
Revenue | % Revenue | Revenue | % Revenue | % Variance | ||||||||||||
Membership dues | $ | 307,966 | 76.4 | % | $ | 296,795 | 74.8 | % | 3.8 | % | ||||||
Initiation and processing fees | 2,268 | 0.6 | % | 7,636 | 1.9 | % | (70.3 | )% | ||||||||
Membership revenue | 310,234 | 77.0 | % | 304,431 | 76.7 | % | 1.9 | % | ||||||||
Personal training revenue | 69,735 | 17.3 | % | 66,487 | 16.8 | % | 4.9 | % | ||||||||
Other ancillary club revenue | 17,197 | 4.3 | % | 19,642 | 4.9 | % | (12.4 | )% | ||||||||
Ancillary club revenue | 86,932 | 21.6 | % | 86,129 | 21.7 | % | 0.9 | % | ||||||||
Fees and other revenue | 5,876 | 1.4 | % | 6,361 | 1.6 | % | (7.6 | )% | ||||||||
Total revenue | $ | 403,042 | 100.0 | % | $ | 396,921 | 100.0 | % | 1.5 | % | ||||||
Revenue increased $6.1 million, or 1.5%, for the year ended December 31, 2017 compared to the year ended December 31, 2016, primarily reflecting an increase in membership dues, the favorable impact from the newly opened and acquired clubs. These increases were partially offset by the impact of club closures and decline in initiation and processing fees. In the year ended December 31, 2017 compared to the year ended December 31, 2016, revenue increased approximately $8.8 million from our clubs that were opened in the last 24 months and $7.8 million at our clubs operating longer than 24 months, partially offset by a $10.5 million decrease in revenue as a result of closed clubs.
Comparable club revenue increased 1.6% in the year ended December 31, 2017 compared to the year ended December 31, 2016, primarily due to higher average dues per membership and an increase in member count in comparable clubs. The comparable club revenue increase was partially offset by decreased initiation and processing fees, and other ancillary club revenue.
38
Membership dues revenue increased $11.2 million, or 3.8% in the year ended December 31, 2017 compared to the year ended December 31, 2016, primarily reflecting higher average dues per membership, increased annual fees and the impact of new club openings. These increases were partially offset by the impact of club closures.
Initiation and processing fees revenue decreased $5.4 million, or 70.3% in the year ended December 31, 2017 compared to the year ended December 31, 2016. The high initiation fees that were initially collected with the conversion to the lower pricing model in 2014 and early 2015 were substantially recognized into income in 2016 and prior, which resulted in a decrease in revenue recognized in the year ended December 31, 2017. Initiation and processing fees are amortized over the estimated average membership life. Additionally, the average membership life was 26 months for the full year of 2017 versus 25 months for the full year of 2016, which resulted in the amortization of initiation and processing fees over the longer time period in 2017.
Personal training revenue increased $3.2 million, or 4.9% in the year ended December 31, 2017 compared to the year ended December 31, 2016. Personal training revenue in 2017 included revenue recognition of $3.6 million related to unused and expired sessions in three of our states discussed further below. Personal training revenue on a comparable club basis increased $1.0 million. The increase in personal training revenue was also due to the impact of newly opened clubs, partially offset by the impact of club closures.
We recognize revenue from personal training sessions as the services are performed (i.e., when the session is trained). Unused personal training sessions expire after a set, disclosed period of time after purchase and are not refundable or redeemable by the member for cash. As of December 31, 2017, we had approximately $12.5 million of unused and expired personal training sessions that had not been recognized as revenue and was recorded as deferred revenue. We do not believe this amount is subject to the escheatment or abandoned property laws of any of the jurisdictions in which we conduct our business, including the State of New York. It is possible however, that one or more of these jurisdictions may not agree with our position and may claim that we must remit all or a portion of these amounts to such jurisdiction. This could have a material adverse effect on our cash flows. The State of New York has informed us that it is considering whether we are required to remit the amount received by us for unused, expired personal training sessions to the State of New York as unclaimed property. For a total of six of the jurisdictions in which we operate, we have concluded, based on opinions from outside counsel, that money held by a company for unused and expired personal training sessions are not escheatable. In 2010, for three jurisdictions, we concluded, based on opinions from outside counsel, that monies held by a company for unused and expired personal training sessions are not escheatable. As a result, we recorded approximately $2.7 million as personal training revenue in the fourth quarter of 2010. This amount was previously recorded in deferred revenue. In 2017, for another three jurisdictions, we concluded, based on opinions from outside counsel, that monies held by a company for unused and expired personal training sessions are not escheatable. As a result, we recorded approximately $3.6 million as personal training revenue in the fourth quarter of 2017. This amount was previously recorded in deferred revenue, which was primarily related to sessions purchased prior to the year ended December 31, 2015.
Other ancillary club revenue decreased $2.4 million, or 12.4%, in the year ended December 31, 2017 compared to the year ended December 31, 2016, primarily related to decreased membership cancellation fee and decreased revenue from our Sports Clubs for Kids programs.
Operating Expenses
Operating expenses (in thousands) were comprised of the following for the periods indicated:
Year Ended December 31, | |||||||||||||||
2017 | 2016 | $ Variance | % Variance | ||||||||||||
Payroll and related | $ | 145,612 | $ | 149,029 | $ | (3,417 | ) | (2.3 | )% | ||||||
Club operating | 180,467 | 185,104 | (4,637 | ) | (2.5 | )% | |||||||||
General and administrative | 22,680 | 24,702 | (2,022 | ) | (8.2 | )% | |||||||||
Depreciation and amortization | 40,849 | 43,727 | (2,878 | ) | (6.6 | )% | |||||||||
Impairment of fixed assets | 6,497 | 742 | 5,755 | >100% | |||||||||||
Operating expenses | $ | 396,105 | $ | 403,304 | $ | (7,199 | ) | (1.8 | )% | ||||||
39
Operating expenses increased due to the following factors:
Payroll and related. Payroll and related expenses for the year ended December 31, 2017 decreased $3.4 million, or 2.3%, compared to the year ended December 31, 2016, primarily reflecting savings from commissions, labor optimization, and the effect of club closures. These decreases were partially offset by minimum wage increases, effective January 1, 2017, in most of the states we operate, and the impact of newly opened clubs.
Club operating. Club operating expenses decreased $4.6 million or 2.5% in the year ended December 31, 2017 compared to the year ended December 31, 2016, primarily reflecting expense savings of $3.6 million in marketing, $1.1 million in repair and maintenance and $1.0 million in utilities, all mainly due to our continued cost-savings initiatives. These savings were partially offset by a net increase in rent and occupancy expenses of $1.2 million primarily due to rent escalations of $3.4 million at mature clubs, increases of $3.1 million for newly opened and acquired clubs, partially offset by savings of $5.3 million mainly due to closed clubs.
General and administrative. General and administrative expense decreased $2.0 million, or 8.2%, in the year ended December 31, 2017 compared to the year ended December 31, 2016, primarily reflecting the results of our cost-savings initiatives.
Depreciation and amortization. In the year ended December 31, 2017 compared to the year ended December 31, 2016, depreciation and amortization expense decreased $2.9 million, or 6.6%, primarily due to the impact of closed locations and a decrease at our mature clubs. These decreases were offset by depreciation of assets at our new clubs.
Impairment of fixed assets. We recorded fixed asset impairment charges of $6.5 million and $742,000 at underperforming clubs in the year ended December 31, 2017 and 2016, respectively.
Gain on Extinguishment of Debt
On April 21, 2016, TSI Holdings settled a transaction to purchase $8.7 million principal amount of debt outstanding under the 2013 Senior Credit Facility for $3.8 million, or 43.5% of face value. On May 6, 2016, TSI Holdings settled another transaction to purchase $62.4 million principal amount of debt outstanding under the 2013 Senior Credit Facility for $26.0 million, or 41.6% of face value. The April and May transactions created gains on extinguishment of debt in 2016 of $37.9 million. The gain was net of the write-off of deferred financing costs and debt discount of $545,000 and $1.6 million, respectively, and other costs related to the transaction. The purchased debt described above was transferred to TSI, LLC and canceled.
Interest Expense
Interest expense decreased by $1.3 million in the year ended December 31, 2017 compared to the year ended December 31, 2016, primarily reflecting the effect of principal payments made on, and purchases of debt outstanding under, the 2013 Term Loan Facility since December 31, 2016.
(Benefit) Provision for Corporate Income Taxes
We recorded income tax benefit of $9.7 million during the year ended December 31, 2017. For year ended December 31, 2016, we recorded an income tax expense of $9.8 million. Our effective tax rate was 182% and 55% for the years ended December 31, 2017 and 2016, respectively. Separate from the impact of valuation allowance, our effective tax rate was 31% and 37% for the years ended December 31, 2017 and 2016, respectively.
As of December 31, 2017 and 2016, we have a net deferred tax liability of $93,000 and $61,000, respectively, as there is a full valuation allowance recorded against the U.S. net deferred tax assets. The state net deferred tax liability balance was $37,000 and $17,000, respectively, as of December 31, 2017 and 2016.
In assessing the realizability of deferred tax assets, we evaluate whether it is more likely than not (more than 50%) that some portion or all of the deferred tax assets will be realized. A valuation allowance, if needed reduces the deferred tax assets to the amount expected to be realized. The ultimate realization of deferred tax assets is dependent upon the generation of future taxable income in those periods in which temporary differences become deductible and/or net operating loss carry forwards can be utilized. We assess all positive and negative evidence when determining the amount of the net deferred tax assets that are more likely than not to be realized. This evidence includes, but is not limited to, prior earnings history, scheduled reversal of taxable temporary differences, tax planning strategies and projected future taxable income. Significant weight is given to positive and negative evidence that is objectively verifiable.
40
As required by the authoritative guidance on accounting for income taxes, we evaluate the realizability of deferred tax assets on a jurisdictional basis at each reporting date. Accounting for income taxes requires that a valuation allowance be established when it is more likely than not that all or a portion of the deferred tax assets will not be realized. In circumstances where there is sufficient negative evidence indicating that the deferred tax assets are not more likely than not realizable, we establish a valuation allowance. We recorded valuation allowances in the amounts of $38.8 million and $54.2 million as of December 31, 2017 and 2016, respectively.
In recording the valuation allowance, deferred tax liabilities associated with indefinite lived intangible assets generally cannot be used as a source of income to realize deferred tax assets with a definitive loss carry forward period. We do not amortize goodwill for book purposes but have amortized goodwill with tax basis for tax purposes. The deferred tax liabilities recorded at December 31, 2017 and 2016 related to the tax effect of differences between the book and tax basis of goodwill that is not expected to reverse until some indefinite future period for our goodwill from operations of our clubs in Switzerland and asset acquisitions of clubs in the U.S. during 2017.
We are currently under examination in New York State (2006 through 2014). In August 2017, we consented to extend the assessment period for tax years 2010 - 2013 through September 15, 2018. In particular, we disagree with the proposed assessment dated December 12, 2016 from the State of New York and attended a conciliation conference with the New York State Department of Taxation and Finance Audit section on June 7, 2017. No settlement was reached at the conference and the proposed assessment was sustained. As such, in a revised letter dated November 30, 2017, we received from the State of New York a revised assessment related to tax years 2006-2009 for approximately $5.1 million, inclusive of approximately $2.4 million of interest. We currently are in the process of appealing the assessment with the New York State Division of Tax Appeals. We have not recorded a tax reserve related to the proposed assessment. It is difficult to predict the final outcome or timing of resolution of any particular matter regarding these examinations. An estimate of the reasonably possible change to unrecognized tax benefits within the next 12 months cannot be made. Additionally, on November 17, 2017, we were notified that the State of New York proposed an adjustment in the amount of approximately $3.9 million for the years 2010 to 2014, inclusive of approximately $757,000 in interest. We are also under examination in New York City (2006 through 2014), which we have consented to extend the assessment period through December 31, 2018. Lastly, we are under examination by the Internal Revenue Service regarding our federal income tax returns for the years ended December 31, 2014 and 2015.
Year ended December 31, 2016 compared to year ended December 31, 2015
Revenue
Revenue (in thousands) was comprised of the following for the periods indicated:
Year Ended December 31, | |||||||||||||||||
2016 | 2015 | ||||||||||||||||
Revenue | % Revenue | Revenue | % Revenue | % Variance | |||||||||||||
Membership dues | $ | 296,795 | 74.8 | % | $ | 309,096 | 72.8 | % | (4.0 | )% | |||||||
Initiation and processing fees | 7,636 | 1.9 | % | 13,644 | 3.2 | % | (44.0 | )% | |||||||||
Membership revenue | 304,431 | 76.7 | % | 322,740 | 76.0 | % | (5.7 | )% | |||||||||
Personal training revenue | 66,487 | 16.8 | % | 73,191 | 17.3 | % | (9.2 | )% | |||||||||
Other ancillary club revenue | 19,642 | 4.9 | % | 22,138 | 5.2 | % | (11.3 | )% | |||||||||
Ancillary club revenue | 86,129 | 21.7 | % | 95,329 | 22.5 | % | (9.7 | )% | |||||||||
Fees and other revenue | 6,361 | 1.6 | % | 6,254 | 1.5 | % | 1.7 | % | |||||||||
Total revenue | $ | 396,921 | 100.0 | % | $ | 424,323 | 100.0 | % | (6.5 | )% | |||||||
Revenue decreased $27.4 million, or 6.5%, for the year ended December 31, 2016 compared to the year ended December 31, 2015, as a result of lower membership revenue and ancillary club revenue, as well as club closures. Revenue decreased approximately $16.8 million at our clubs operating longer than 24 months and $13.6 million at closed clubs. These decreases were partially offset by a $3.0 million increase in revenue from our clubs that were opened within the last 24 months.
Membership dues revenue decreased $12.3 million, or 4.0% in the year ended December 31, 2016 compared to the year ended December 31, 2015, primarily reflecting lower average dues per membership and the effect of club closures, partially offset by an increase in annual fees.
41
Initiation and processing fees revenue decreased $6.0 million, or 44.0% in the year ended December 31, 2016 compared to the year ended December 31, 2015, primarily reflecting a decrease in initiation fees collected per new membership which began in the third quarter of 2015, and a reduction in new memberships. Initiation and processing fees are amortized over the estimated average membership life and as a lesser amount of fees is collected, the revenue recognized will continue to decrease for the amortization period. The average membership life was 26 months for the full year of 2016 versus 22 months for 2015, which resulted in initiation and processing fees being amortized over the longer time period and therefore less revenue was recognized.
Personal training revenue decreased $6.7 million, or 9.2% in the year ended December 31, 2016 compared to the year ended December 31, 2015, primarily due to a decline in sales volume for our personal training products, as well as the impact of club closures.
Other ancillary club revenue decreased $2.5 million, or 11.3%, in the year ended December 31, 2016 compared to the year ended December 31, 2015, primarily due to decreased revenue from our Sports Clubs for Kids programs.
Comparable club revenue decreased 4.1% in the year ended December 31, 2016 compared to the year ended December 31, 2015. The price of membership dues and enrollment fees decreased on average which was partially offset by an increase in memberships at our comparable clubs.
Operating Expenses
Operating expenses (in thousands) were comprised of the following for the periods indicated:
Year Ended December 31, | |||||||||||||||
2016 | 2015 | $ Variance | % Variance | ||||||||||||
Payroll and related | $ | 149,029 | $ | 175,898 | $ | (26,869 | ) | (15.3 | )% | ||||||
Club operating | 185,104 | 196,725 | (11,621 | ) | (5.9 | )% | |||||||||
General and administrative | 24,702 | 30,683 | (5,981 | ) | (19.5 | )% | |||||||||
Depreciation and amortization | 43,727 | 47,887 | (4,160 | ) | (8.7 | )% | |||||||||
Impairment of fixed assets | 742 | 14,571 | (13,829 | ) | (94.9 | )% | |||||||||
Impairment of goodwill | — | 31,558 | (31,558 | ) | (100.0 | )% | |||||||||
Gain on sale of building | — | (77,146 | ) | 77,146 | 100.0 | % | |||||||||
Gain on lease termination | — | (2,967 | ) | 2,967 | 100.0 | % | |||||||||
Operating expenses | $ | 403,304 | $ | 417,209 | $ | (13,905 | ) | (3.3 | )% | ||||||
Operating expenses increased due to the following factors:
Payroll and related. Payroll and related expenses for the year ended December 31, 2016 decreased $26.9 million, or 15.3%, compared to the year ended December 31, 2015, primarily reflecting decreased overhead and club payroll associated with club closures, headcount reductions and other cost savings initiatives. In the years ended December 31, 2016 and 2015, Payroll and related expenses also included $1.7 million and $3.0 million, respectively, of separation expense primarily related to the departure of certain executive officers.
Club operating. Club operating expenses decreased $11.6 million or 5.9% in the year ended December 31, 2016 compared to the year ended December 31, 2015. This decrease was principally attributable to the following:
• | Marketing expenses decreased $4.7 million mainly due to reduced spending in the year ended December 31, 2016 related to our cost-savings initiatives, and the increased advertising spend in the year ended December 31, 2015 associated with the roll-out of the lower pricing model. |
• | Repair and maintenance expenses decreased $2.9 million primarily reflecting a decrease in vendor costs as well as other cost-savings initiatives. The decline also reflected the effect of club closures. |
• | Utilities expenses decreased $2.3 million primarily reflecting the effect of club closures, and lower electric rates, lower energy prices due to the mild weather experienced in our regions in the year ended December 31, 2016. |
• | Rent and occupancy expenses decreased $327,000 in the year ended December 31, 2016 compared to the year ended December 31, 2015. The decrease was driven by savings of $3.3 million for closed clubs, and a decrease in early lease termination penalties of $1.3 million. Offsetting these decreases was an increase of $2.9 million at mature clubs primarily due to rent escalations and an increase of $1.4 million related to newly opened clubs and one future club. |
42
General and administrative. General and administrative expense decreased $6.0 million, or 19.5%, in the year ended December 31, 2016 compared to the year ended December 31, 2015, primarily reflecting the results of our cost savings initiatives. In addition, for the year ended December 31, 2015, it included costs of $899,000 associated with the changes to our Board of Directors and other related expenses.
Depreciation and amortization. In the year ended December 31, 2016 compared to the year ended December 31, 2015, depreciation and amortization expense decreased $4.2 million, or 8.7%, primarily due to a decline in our depreciable fixed assets base resulting from club closures and impairment charges.
Impairment of fixed assets. We recorded fixed asset impairment charges of $742,000 and $14.6 million at underperforming clubs in the year ended December 31, 2016 and 2015, respectively.
Impairment of goodwill. We did not have goodwill impairment charges in the year ended December 31, 2016. In the year ended December 31, 2015, as a result of the significant decrease in market capitalization and a decline in our current performance primarily due to existing members downgrading their memberships to those with lower monthly dues and new members enrolling at lower rates, we performed an interim impairment test as of May 31, 2015. We concluded that there would be no remaining implied fair value of goodwill attributable to the New York and Boston regions. Accordingly, we wrote off $31.6 million of goodwill associated with these reporting units.
Gain on Sale of Building. On September 12, 2014, we completed the legal sale of our property (building and land) on East 86th Street, New York City, to an unaffiliated third-party for gross proceeds of $85.7 million. Concurrent with the closing of the transaction, we leased back the portion of the property comprising our health club (“Initial Lease”) and had agreed to vacate the property in connection with the purchaser's future development of a new luxury, high-rise multi-use building. In connection with vacating the property, we had agreed to enter into a new lease (“New Club Lease”) for approximately 24,000 square feet in the new building for the purpose of operating a health club upon completion of construction by the purchaser/landlord. This sale-leaseback transaction was characterized as a financing arrangement for accounting purposes rather than a sale until any continuing involvement has ceased. In March 2015, we received the remaining proceeds that had been held in escrow of $500,000.
On December 23, 2015, we terminated the Initial Lease and the agreement to enter into the New Club Lease and received gross proceeds of $3.5 million in connection with the termination. Because the lease was terminated with no continuing involvement, this sale-leaseback transaction was accounted for as a completed sale as of December 23, 2015. Under this treatment, we recorded a $77.1 million gain, previously accounted for as a financing, on the sale of the property, recorded in Gain on sale of building in the consolidated statements of operations for the year ended December 31, 2015.
Gain on lease termination. In the year ended December 31, 2015, we recorded a $3.0 million net gain on lease termination related to the termination of a lease for a planned club opening that was not yet effective.
Gain on Extinguishment of Debt
On April 21, 2016, TSI Holdings settled a transaction to purchase $8.7 million principal amount of debt outstanding under the 2013 Senior Credit Facility for $3.8 million, or 43.5% of face value. On May 6, 2016, TSI Holdings settled another transaction to purchase $62.4 million principal amount of debt outstanding under the 2013 Senior Credit Facility for $26.0 million, or 41.6% of face value. The April and May transactions created gains on extinguishment of debt in 2016 of $37.9 million. The gain was net of the write-off of deferred financing costs and debt discount of $545,000 and $1.6 million, respectively, and other costs related to the transaction. The purchased debt described above was transferred to TSI, LLC and canceled.
In the year ended December 31, 2015, TSI Holdings purchased $29.8 million principal amount of debt outstanding under the 2013 Senior Credit Facility in the open market for $10.9 million, and such debt was transferred to TSI, LLC and cancelled, which resulted in a gain on extinguishment of debt of $17.9 million, including the write-off of related deferred financing costs and debt discount of $249,000 and $707,000, respectively.
43
Interest Expense
Interest expense decreased by $6.6 million in the year ended December 31, 2016 compared to the year ended December 31, 2015, primarily reflecting the effect of principal payments made on, and purchases of debt outstanding under, the 2013 Term Loan Facility in late 2015 and early 2016. Additionally, in 2015, we recorded approximately $2.0 million of non-cash rental income related to our former tenant following the legal sale of this location in September 2014. Because the legal sale of our East 86th Street property was characterized for accounting purposes as a financing rather than a sale, the rental payments were treated as interest on the financing arrangement until any continuing involvement in the property ceased. In December 2015, we terminated our current lease and the agreement to enter into our future lease with the purchaser/landlord, so this sale-leaseback transaction was accounted for as a completed sale in December 2015.
Provision (Benefit) for Corporate Income Taxes
We recorded income tax expense of $9.8 million during the year ended December 31, 2016. For year ended December 31, 2015, we recorded an income tax benefit of $14.4 million, which included a decrease of $17.3 million (net of the elimination of federal effect of state deferred taxes); to the full valuation allowance against the U.S. net deferred tax assets. Our effective tax rate was 55% and (211)% for the years ended December 31, 2016 and 2015, respectively. Separate from the impact of valuation allowance, our effective tax rate was 37% and 38% for the years ended December 31, 2016 and 2015, respectively.
As of both December 31, 2016 and 2015, we had a net deferred tax liability of $61,000 as there is a full valuation allowance recorded against the U.S. net deferred tax assets. The state net deferred tax liability balance was $17,000 as of both December 31, 2016 and 2015.
We were under examination in New York State (from 2006 through 2014). In May 2016, we consented to extend the assessment period for tax years 2006 - 2012 through June 30, 2017. In a revised letter dated December 12, 2016, we received a revised assessment from the State of New York related to tax years 2006-2009 for $4.7 million, inclusive of $2.0 million of interest. We disagreed with the proposed assessment and scheduled a conciliation conference with the State of New York to appeal the assessment. We had not recorded a tax reserve related to the proposed assessment. It was difficult to predict the final outcome or timing of a resolution of any particular matter regarding these examinations. An estimate of the reasonably possible change to unrecognized tax benefits within the next 12 months cannot be made. Additionally, we were also under examination in New York City (from 2006 through 2012), which we consented to extend the assessment period through December 31, 2017. Lastly, we were under examination by the Internal Revenue Service regarding our federal income tax returns for the years ended December 31, 2014 and 2015.
Liquidity and Capital Resources
We continue to experience revenue pressure from members as the fitness industry continues to be highly competitive in the geographic regions in which we compete. Also, our previous strategy of converting to a low-cost gym implemented in 2014 resulted in additional revenue pressure for the past few years. New members joined at lower monthly rates and cancellations of members paying higher rates negatively impacted our results and liquidity. In response to this, we implemented cost-savings initiatives in 2015, 2016 and 2017, which mitigated the impact the decline in revenue had on its profitability and cash flow from operations.
We continue to strategize on improving our financial results. We focus on increasing membership in existing clubs to increase revenue. We may consider additional actions within our control, including certain acquisitions, license arrangements, and the closure of unprofitable clubs upon lease expiration and the sale of certain assets. We may also consider additional strategic alternatives, including opportunities to reduce TSI, LLC’s existing debt and further cost-savings initiatives. Our ability to continue to meet our obligations is dependent on our ability to generate positive cash flow from a combination of initiatives, including those mentioned above. Failure to successfully implement these initiatives could have a material adverse effect on our liquidity and our operations, and we would need to implement alternative plans that could include additional asset sales, additional reductions in operating costs, additional reductions in working capital, debt restructurings and the deferral of capital expenditures. There can be no assurance that such alternatives would be available to us or that we would be successful in their implementation.
As of December 31, 2017, we had $30.3 million of cash and cash equivalents. Financial instruments that potentially subject us to concentrations of credit risk consist of cash and cash equivalents and the interest rate swap. Although we deposit our cash with more than one financial institution, as of December 31, 2017, $19.9 million was held at one financial institution. We have not experienced any losses on cash and cash equivalent accounts to date and we do not believe that, based on the credit ratings of the aforementioned institutions, we are exposed to any significant credit risk related to cash at this time.
44
Historically, we have satisfied our liquidity needs through cash generated from operations and various borrowing arrangements. Principal liquidity needs have included the acquisition and development of new clubs, debt service requirements, debt purchases and other capital expenditures necessary to upgrade, expand and renovate existing clubs. We believe that our existing cash and cash equivalents, and cash generated from operations will be sufficient to fund capital expenditures, working capital needs and other liquidity requirements associated with our operations through at least the next 12 months.
Operating Activities. Net cash provided by operating activities increased $7.0 million for the year ended December 31, 2017 compared to the year ended December 31, 2016.
Increases in operating cash included the following:
• | Cash collected for membership dues increased $11.1 million. |
• | Cash collected for recurring annual fees increased $3.8 million. |
• | Cash paid for taxes decreased $7.4 million. |
• | Cash paid for marketing decreased $3.7 million due to our cost-savings initiatives. |
• | Cash paid for interest decreased $1.1 million. |
Offsetting decreases in operating cash included the following:
• | Cash paid for prepaid rent increased $9.2 million. |
• | Cash paid for payroll increased $3.4 million. |
• | Cash collected for income tax refunds decreased $5.4 million. |
Net cash provided by operating activities decreased $3.7 million for the year ended December 31, 2016 compared to the year ended December 31, 2015. Decreases in operating cash included the following:
• | Cash collected for membership dues decreased by $24.2 million. |
• | Cash collected for member enrollment, including the initial annual fee paid upon joining, decreased by $9.7 million, which was related to the decrease in memberships sold and a reduction in joining fees collected per membership. |
• | Cash collected for personal training memberships decreased by $6.5 million. |
• | Cash collected for the termination of a lease related to a future club opening decreased $3.1 million. |
• | Cash collected for tax refunds decreased by $783,000. |
• | Cash paid for income taxes increased by $11.2 million primarily resulting from the gain from purchases of debt outstanding under the 2013 Term Loan Facility. |
Offsetting increases in operating cash included the following:
• | Cash paid for various operating expenses decreased due to our cost savings initiatives including, among others, cash paid for payroll of $27.5 million, marketing of $4.6 million, repair and maintenance of $3.2 million, utilities of $3.0 million. |
• | Cash paid for interest decreased by $4.5 million due to principal payments made on, and purchases of debt outstanding under the 2013 Term Loan Facility. |
• | Cash paid for lease termination penalties decreased by $1.3 million. |
• | Cash collected for recurring annual and rate lock fees increased by $3.8 million. |
• | Cash collected for landlord contributions increased by $792,000. |
Investing Activities. Net cash used in investing activities increased $21.5 million in the year ended December 31, 2017 compared to the year ended December 31, 2016. Investing activities in the year ended December 31, 2017 consisted of $15.4 million of cash paid for the acquisition of businesses, $12.6 million of cash paid for the acquisition of a building and the land it occupies in the New York metropolitan region, as well as a single health club located on the premises, and $2.8 million deposit paid in connection with January 2018 acquisitions. The increase in cash used in investing activities was partially offset by a decrease in capital expenditures of $9.5 million, primarily due to decreased activity in conducting major renovations at clubs and the expansion of our laundry facility in 2016.
The 2017 investing activities included approximately $3.0 million of capital expenditures related to club openings, $4.6 million to continue to enhance or upgrade existing clubs, approximately $1.9 million related to major renovations at clubs, including the purchase of new fitness equipment. We also invested approximately $700,000 related to website and information systems enhancements.
45
The 2016 investing activities included approximately $5.0 million of capital expenditures related to 2016 and 2017 club openings, $5.0 million to continue to enhance or upgrade existing clubs, approximately $1.8 million related to our new brand refresh completed at five clubs, and approximately $2.8 million related to major renovations at clubs, including the purchase of new fitness equipment. We also invested approximately $3.3 million related to the expansion of our laundry facility and $1.8 million to enhance our management information and communication systems, including our new website and member application.
Capital expenditures are funded by cash flow from operations and available cash on hand.
Financing Activities. Net cash used in financing activities for the year ended December 31, 2017, 2016 and 2015 was $2.0 million, $31.8 million and $10.5 million, respectively.
In the year ended December 31, 2017, total principal payments made on the 2013 Term Loan Facility were $2.1 million.
In the year ended December 31, 2016, TSI Holdings settled two transactions to purchase a total of $71.1 million principal amount of debt outstanding under the 2013 Senior Credit Facility for $29.8 million, or an average of 41.8% of face value. Additionally, total principal payments made on the 2013 Term Loan Facility were $2.3 million.
In the year ended December 31, 2015, TSI Holdings purchased $29.8 million principal amount of debt outstanding under the 2013 Senior Credit Facility in the open market for $10.9 million. The purchased debt described above was transferred to TSI, LLC and canceled upon settlement. Additionally, financing activities consisted of gross cash proceeds from the sale of the East 86th Street property of $4.0 million and total principal payments made on the 2013 Term Loan Facility of $3.0 million.
2013 Senior Credit Facility
On November 15, 2013, TSI, LLC, an indirect, wholly-owned subsidiary, entered into the 2013 Senior Credit Facility, pursuant to a credit agreement among TSI, LLC, TSI Holdings II, LLC, a newly-formed, wholly-owned subsidiary of the Company (“Holdings II”), as a Guarantor, the lenders party thereto, Deutsche Bank AG, as administrative agent, and Keybank National Association, as syndication agent. The 2013 Senior Credit Facility consists of the 2013 Term Loan Facility and the 2013 Revolving Loan Facility. Proceeds from the 2013 Term Loan Facility of $323.4 million were issued, net of an original issue discount (“OID”) of 0.5%, or $1.6 million. Debt issuance costs recorded in connection with the 2013 Senior Credit Facility were $5.1 million and are being amortized as interest expense and are recorded as a contra-liability to long-term debt on the accompanying consolidated balance sheets. The Company also recorded additional debt discount of $4.4 million related to creditor fees. The proceeds from the 2013 Term Loan Facility were used to pay off amounts outstanding under the Company’s previously outstanding long-term debt facility, and to pay related fees and expenses. None of the revolving loan facility was drawn upon as of the closing date on November 15, 2013, but loans under the 2013 Revolving Loan Facility may be drawn from time to time pursuant to the terms of the 2013 Senior Credit Facility. The borrowings under the 2013 Senior Credit Facility are guaranteed and secured by assets and pledges of capital stock by Holdings II, TSI, LLC, and, subject to certain customary exceptions, the wholly-owned domestic subsidiaries of TSI, LLC.
Borrowings under the 2013 Term Loan Facility and the 2013 Revolving Loan Facility, at TSI, LLC’s option, bear interest at either the administrative agent’s base rate plus 2.5% or a LIBOR rate adjusted for certain additional costs (the “Eurodollar Rate”) plus 3.5%, each as defined in the 2013 Senior Credit Facility. With respect to the outstanding term loans, the Eurodollar Rate has a floor of 1.00% and the base rate has a floor of 2.00%. Commencing with the last business day of the quarter ended March 31, 2014, TSI, LLC is required to pay 0.25% of the principal amount of the term loans each quarter, which may be reduced by voluntary prepayments. As of December 31, 2017, TSI LLC has made a total of $24.1 million in principal payments on the 2013 Term Loan Facility.
On January 30, 2015, the 2013 Senior Credit Facility was amended (the “Amendment”) to permit TSI Holdings to purchase term loans under the credit agreement. Any term loans purchased by TSI Holdings will be canceled in accordance with the terms of the credit agreement, as amended by the Amendment. The Company may from time to time purchase term loans in market transactions, privately negotiated transactions or otherwise; however the Company is under no obligation to make any such purchases. Any such transactions, and the amounts involved, will depend on prevailing market conditions, liquidity requirements, contractual restrictions and other factors. The amounts involved may be material. As of December 31, 2017, TSI Holdings had a cash balance of approximately $17.6 million.
46
In December 2015, TSI Holdings purchased $29.8 million principal amount of debt outstanding under the 2013 Senior Credit Facility in the open market for $10.9 million, or 36.7% of face value, which resulted in a gain on extinguishment of debt of $17.9 million, including the write-off of related deferred financing costs and debt discount of $249,000 and $707,000, respectively. On April 21, 2016, TSI Holdings settled a transaction to purchase $8.7 million principal amount of debt outstanding under the 2013 Senior Credit Facility for $3.8 million, or 43.5% of face value. On May 6, 2016, TSI Holdings settled another transaction to purchase $62.4 million principal amount of debt outstanding under the 2013 Senior Credit Facility for $26.0 million, or 41.6% of face value. The April and May transactions created total net gains on extinguishment of debt in 2016 of $37.9 million with a tax effect of $13.5 million. When this was netted with our operating loss, it resulted in a tax provision for 2016 of $9.8 million. The gain on extinguishment of debt was net of the write-off of deferred financing costs and debt discount of $545,000 and $1.6 million, respectively, and other costs related to the transaction. All of the above purchased debt was transferred to TSI, LLC and canceled.
In May 2017, TSI, LLC loaned $5.0 million to TSI Group at a rate of LIBOR plus 9.55% per annum. In addition to the interest payments, TSI Group is required to repay 1.0% of the principal amount of the loan, $50,000 per annum, on a quarterly basis commencing September 30, 2017. The loan is secured by certain collateral. This transaction has no impact on the Company's consolidated financial statements as it is eliminated in consolidation. In October 2017, TSI, LLC made a dividend distribution of $35.0 million to TSI Holdings, Inc.
The terms of the 2013 Senior Credit Facility provide for a financial covenant in the situation where the total utilization of the revolving loan commitments (other than letters of credit up to $5.5 million at any time outstanding) exceeds 25% of the aggregate amount of those commitments. In such event, TSI, LLC is required to maintain a total leverage ratio, as defined in the 2013 Senior Credit Facility, of no greater than 4.50:1.00. As of December 31, 2017, TSI, LLC had outstanding letters of credit of $7.0 million and a total leverage ratio that was below 4.50:1.00. Other than these outstanding letters of credit, TSI, LLC did not have any amounts utilized on the 2013 Revolving Loan Facility. The terms of the 2013 Senior Credit Facility include a financial covenant under which the Company is not able to utilize more than 25% or $11.3 million in accordance with terms of the 2013 Revolving Loan Facility if the total leverage ratio exceeds 4.50:1:00 (calculated on a proforma basis to give effect to any borrowing). The 2013 Senior Credit Facility also contains certain affirmative and negative covenants, including covenants that may limit or restrict TSI, LLC and Holdings II’s ability to, among other things, incur indebtedness and other liabilities; create liens; merge or consolidate; dispose of assets; make investments; pay dividends and make payments to stockholders; make payments on certain indebtedness; and enter into sale leaseback transactions, in each case, subject to certain qualifications and exceptions. In addition, at any time when the total leverage ratio is greater than 4.50:1.00, there are additional limitations on the ability of TSI, LLC and Holdings II to, among other things, make certain distributions of cash to TSI Holdings. The 2013 Senior Credit Facility also includes customary events of default (including non-compliance with the covenants or other terms of the 2013 Senior Credit Facility) which may allow the lenders to terminate the commitments under the 2013 Revolving Loan Facility and declare all outstanding term loans and revolving loans immediately due and payable and enforce its rights as a secured creditor.
TSI, LLC may prepay the 2013 Term Loan Facility and 2013 Revolving Loan Facility without premium or penalty in accordance with the 2013 Senior Credit Facility. Mandatory prepayments are required relating to certain asset sales, insurance recovery and incurrence of certain other debt and commencing in 2015 in certain circumstances relating to excess cash flow (as defined) for the prior fiscal year, as described below, in excess of certain expenditures. Pursuant to the terms of the 2013 Senior Credit Facility, the Company is required to apply net proceeds in excess of $30.0 million from sales of assets in any fiscal year towards mandatory prepayments of outstanding borrowings.
In addition, the 2013 Senior Credit Facility contains provisions that require excess cash flow payments, as defined therein, to be applied against outstanding 2013 Term Loan Facility balances. The excess cash flow is calculated annually for each fiscal year ending December 31 and paid 95 days after the fiscal year end. The applicable excess cash flow repayment percentage is applied to the excess cash flow when determining the excess cash flow payment. Earnings, changes in working capital and capital expenditure levels all impact the determination of any excess cash flow. The applicable excess cash flow repayment percentage is 50% when the total leverage ratio, as defined in the 2013 Senior Credit Facility, exceeds or is equal to 2.50:1.00; 25% when the total leverage ratio is greater than or equal to 2.00:1.00 but less than 2.50:1.00 and 0% when the total leverage ratio is less than 2.00:1.00. The excess cash flow calculation performed as of December 31, 2017 did not result in any required payments.
As of December 31, 2017, the 2013 Term Loan Facility has a gross principal balance of $199.9 million and a balance of $196.0 million net of unamortized debt discount of $2.9 million and unamortized debt issuance costs of $1.0 million. As of December 31, 2017, both the unamortized balance of debt issuance costs and unamortized debt discount are recorded as a contra-liability to long-term debt on the accompanying condensed consolidated balance sheet and are being amortized as interest expense using the effective interest method.
47
As of December 31, 2017, there were no outstanding 2013 Revolving Loan Facility borrowings and outstanding letters of credit issued totaled $7.0 million. The unutilized portion of the 2013 Revolving Loan Facility as of December 31, 2017 was $38.0 million, with borrowings under such facility subject to the conditions applicable to borrowings under the Company’s 2013 Senior Credit Facility, which conditions the Company may or may not be able to satisfy at the time of borrowing. The 2013 Revolving Loan Facility will mature on November 15, 2018. Given that the 2013 Senior Credit Facility contains a restrictive covenant on obtaining secured debt, if the Company is unable to extend, restructure or refinance the 2013 Revolving Loan Facility prior to maturity, all letters of credit that remain outstanding under the 2013 Revolving Loan Facility will terminate on the fifth Business Day prior to the Revolving Loan Maturity Date. The Company is considering alternative means to satisfy obligations which are currently satisfied with letters of credit issued under the 2013 Revolving Loan Facility, including cash collateralization of such obligations.
Financial Instruments
In our normal operations, we are exposed to market risks relating to fluctuations in interest rates. In order to minimize the possible negative impact of such fluctuations on our cash flows, we may enter into derivative financial instruments (“derivatives”), such as interest-rate swaps. Derivatives are not entered into for trading purposes and we only use commonly traded instruments. Currently, we have used derivatives solely relating to the variability of cash flows from interest rate fluctuations.
We originally entered into an interest rate swap arrangement on July 13, 2011 in connection with our previous credit facility. In connection with entering into the 2013 Senior Credit Facility, we amended and restated the interest rate swap agreement initially entered into (and amended in August 2012 and November 2012). Effective as of November 15, 2013, the closing date of the 2013 Senior Credit Facility, the interest rate swap arrangement had a notional amount of $160.0 million and will mature on May 15, 2018. The swap effectively converts $160.0 million of the current outstanding principal of the total variable-rate debt under the 2013 Senior Credit Facility to a fixed rate of 0.884% plus the 3.5% applicable margin and the Eurodollar rate, which has a floor of 1%. As permitted by ASC 815, Derivatives and Hedging, the Company has designated this swap as a cash flow hedge, the effects of which have been reflected in the Company’s consolidated financial statements as of and for the years ended December 31, 2017, 2016 and 2015. The objective of this hedge is to manage the variability of cash flows in the interest payments related to the portion of the variable-rate debt designated as being hedged.
When our derivative instrument was executed, hedge accounting was deemed appropriate and it was designated as a cash flow hedge at inception with re-designation being permitted under ASC 815, Derivatives and Hedging. Interest rate swaps are designated as cash flow hedges for accounting purposes since they are being used to transform variable interest rate exposure to fixed interest rate exposure on a recognized liability (debt). On an ongoing basis, we perform a quarterly assessment of the hedge effectiveness of the hedge relationship and measures and recognizes any hedge ineffectiveness in the consolidated statements of operations. For the years ended December 31, 2017, 2016 and 2015, hedge ineffectiveness was evaluated using the hypothetical derivative method. There was no hedge ineffectiveness in the years ended December 31, 2017, 2016 and 2015.
The counterparty to our interest rate swap is a major banking institution with a credit rating of investment grade or better and no collateral is required, and there are no significant risk concentrations. We believe the risk of incurring losses on derivative contracts related to credit risk is unlikely.
Consolidated Debt
As of December 31, 2017, our total principal amount of debt outstanding was $199.9 million, of which $195.8 million is due in 2020. This substantial amount of debt could have significant consequences, including:
• | making it more difficult to satisfy our obligations, including with respect to our outstanding indebtedness; |
• | increasing our vulnerability to general adverse economic and industry conditions; |
• | limiting our ability to obtain additional financing to fund future working capital, capital expenditures, acquisitions of new clubs and other general corporate requirements; |
• | requiring a substantial portion of our cash flow from operations for the payment of interest on our debt, which is variable on our 2013 Revolving Loan Facility and partially variable on our 2013 Term Loan Facility, and/or principal pursuant to excess cash flow requirements and reducing our ability to use our cash flow to fund working capital, capital expenditures and acquisitions of new clubs and general corporate requirements; |
• | increasing our vulnerability to interest rate fluctuations in connection with borrowings under our 2013 Senior Credit Facility, some of which are at variable interest rates; |
48
• | limiting our ability to refinance our existing indebtedness on favorable terms, or at all; and |
• | limiting our flexibility in planning for, or reacting to, changes in our business and the industry in which we operate. |
These limitations and consequences may place us at a competitive disadvantage to other less-leveraged competitors.
We believe that we have, or will be able to, obtain or generate sufficient funds to finance our current operating plans through the next 12 months. Any material acceleration or expansion of our plans through newly constructed clubs or acquisitions (to the extent such acquisitions include cash payments) may require us to pursue additional sources of financing. There can be no assurance that such financing will be available, available on acceptable terms, or permitted under the 2013 Credit Facility.
Contractual Obligations and Commitments
As of December 31, 2017, our contractual obligations listed in the table below and payments by period were as follows:
Payments Due by Period (in thousands) | ||||||||||||||||||||
Contractual Obligations(4) | Total | Less than 1 Year | 1-3 Years | 3-5 Years | More than 5 Years | |||||||||||||||
Long-term debt(1) | $ | 199,918 | $ | 2,082 | $ | 197,836 | $ | — | $ | — | ||||||||||
Interest payments on long-term debt(2) | 32,139 | 10,898 | 21,241 | — | — | |||||||||||||||
Operating lease obligations(3) | 658,715 | 96,518 | 176,337 | 137,949 | 247,911 | |||||||||||||||
Total contractual obligations | $ | 890,772 | $ | 109,498 | $ | 395,414 | $ | 137,949 | $ | 247,911 | ||||||||||
Notes:
(1) | Principal amounts paid each year may increase if annual excess cash flow amounts are required (as described above). Excess cash flow was calculated as of December 31, 2017 and no payments are currently required in 2018 or any future period. |
(2) | Based on interest rates pursuant to the 2013 Term Loan Facility and the interest swap agreement as of December 31, 2017. |
(3) | Operating lease obligations include base rent only. Certain leases provide for additional rent based on real estate taxes, common area maintenance and defined amounts based on our operating results. For the years ending December 31, 2018 and 2019, future minimum rental payments include capital lease payments of $129 and $31, respectively. |
(4) | The table above does not reflect potential commitments in connection with our outstanding letters of credit under the 2013 Revolving Loan Facility, which matures on November 15, 2018, or our agreement with CYC Fitness Partners, LLC. |
The following long-term liabilities included on the consolidated balance sheet are excluded from the table above: income taxes (including uncertain tax positions or benefits), insurance accruals and other accruals. We are unable to estimate the timing of payments for these items.
We had positive working capital of $5.4 million as of December 31, 2017, compared to working capital deficit of $6.3 million as of December 31, 2016. Major components of our working capital on our current assets are cash and cash equivalents, accounts receivable, prepaid corporate income taxes, prepaid rent expense, and prepaid expenses and other current assets. As of December 31, 2017, these current assets more than offset the current liabilities, which consists of deferred revenues, accounts payable, accrued expenses (including, among others, accrued payroll and occupancy costs), and the current portion of long-term debt. The deferred revenue that is classified as a current liability relates to dues and services paid-in-full in advance and fees paid at the time of enrollment and totaled $33.5 million and $34.6 million at December 31, 2017 and December 31, 2016, respectively. Initiation and processing fees received are deferred and amortized over the estimated average membership life of a club member and all annual fees are deferred and amortized over a 12 month period. Prepaid dues and fees for prepaid services are generally realized over a period of up to 12 months. In periods when we increase the number of members and consequently increase the level of payments received in advance, we would expect to see increased deferred revenue balances. By contrast, any decrease in demand for our services or reductions in initiation fees collected would have the effect of reducing deferred revenue balances, which would likely require us to rely more heavily on other sources of funding. In either case, a significant portion of the deferred revenue is not expected to constitute a liability that must be funded with cash. At the time a member joins our club, we incur enrollment costs, a portion of which are deferred over the estimated average membership life or 12 months to the extent these costs are related to the first annual fee paid at the time of enrollment or within the first month of membership. These costs are recorded as a long-term asset and as such do not affect working capital. Any working capital deficits in future periods, as in the past, will be funded by our cash and cash equivalents and our 2013 Senior Credit Facility,
49
which includes a 2013 Revolving Loan Facility, which expires on November 15, 2018. We believe that these sources are sufficient to fund our operating, investing and financing requirements for the next twelve months.
Recent Changes in or Recently Issued Accounting Standards
For details of applicable new accounting standards, please, see Note 3 — Recent Accounting Pronouncements to our consolidated financial statements in this Annual Report.
Use of Estimates and Critical Accounting Policies
The preparation of financial statements in conformity with accounting principles generally accepted in the United States of America requires management to make estimates and assumptions that affect the reported amounts of assets and liabilities and disclosure of contingent assets and liabilities at the dates of the financial statements and the reported amounts of revenues and expenses during the reporting periods. Actual results could differ from those estimates.
The most significant assumptions and estimates relate to the useful lives of long-term assets, recoverability and impairment of fixed and intangible assets, deferred income tax valuation, valuation of and expense incurred in connection with stock options, valuation of interest-rate swap arrangements, insurance reserves, legal contingencies and the estimated average membership life.
Estimated average membership life. Initiation and processing fees, as well as related direct and incremental expenses of membership acquisition, which may include sales commissions, bonuses and related taxes and benefits, are deferred and recognized, on a straight-line basis, in operations over the estimated average membership life or 12 months to the extent these costs are related to the first annual fee paid within one month of enrollment. Annual fees are amortized over 12 months. As of December 31, 2017, the average membership life was 26 months. The Company monitors factors that might affect the estimated average membership life including retention trends, attrition trends, membership sales volumes, membership composition, competition, and general economic conditions, and adjusts the estimate as necessary on an annual basis.
Fixed and intangible assets. Fixed assets are recorded at cost and depreciated on a straight-line basis over the estimated useful lives of the assets, which are 30 years for building and improvements, five years for club equipment, furniture, fixtures and computer equipment and three to five years for computer software. Leasehold improvements are amortized over the shorter of their estimated useful lives or the remaining period of the related lease. Payroll costs directly related to the construction or expansion of the Company’s locations are capitalized with leasehold improvements. Expenditures for maintenance and repairs are charged to operations as incurred. The cost and related accumulated depreciation of assets retired or sold, is removed from the respective accounts and any gain or loss is recognized in operations. The costs related to developing web applications, developing web pages and installing or enhancing developed applications on the web servers are capitalized and classified as computer software. Website hosting fees and maintenance costs are expensed as incurred.
Fixed assets are evaluated for impairment periodically whenever events or changes in circumstances indicate that related carrying amounts may not be recoverable from undiscounted cash flows in accordance with Financial Accounting Standards Board (“FASB”) guidance. The Company’s long-lived assets and liabilities are grouped at the individual club level, which is the lowest level for which there are identifiable cash flows. To the extent that estimated future undiscounted net cash flows attributable to the assets are less than the carrying amount, an impairment charge equal to the difference between the carrying value of such asset and their fair values is recognized.
In the year ended December 31, 2017, 2016 and 2015, we recorded fixed asset impairment charges of $6.5 million, $742,000 and $14.6 million, respectively. The fixed asset impairment charges are included as a component of operating expenses in a separate line on the condensed consolidated statements of operations. We will continue to monitor the performance of the clubs on a quarterly basis. If we under-perform against forecasts, we may record additional impairment charges in future quarters.
Goodwill was allocated to reporting units that closely reflect the regions served by the Company: New York, Boston, Washington, D.C., Philadelphia and Switzerland, with certain more remote clubs that do not benefit from a regional cluster being considered single reporting units (“Outlier Clubs”). In the second half of 2017, the Company acquired Lucille Roberts and a single existing club under the TMPL trade name. In connection with these acquisitions, $5.2 million of goodwill was added to the Company’s goodwill balance in the New York region. For more information on the Lucille Roberts and the TMPL Gym acquisitions, refer to Note 6 - Acquisitions of our consolidated financial statements in this Annual Report. As of December 31, 2017, only the New York and Switzerland regions had a goodwill balance.
50
The Company early adopted ASU No. 2017-04, “Simplifying the Test for Goodwill Impairment” in the first quarter of 2017. This standard eliminated the second step of the goodwill impairment test, where a determination of the fair value of individual assets and liabilities of a reporting unit was needed to measure the goodwill impairment. As a result of the updated guidance, the Company’s annual goodwill impairment test as of February 28, 2017 was performed by comparing the fair value of the Company’s reporting unit with its carrying amount and then recognizing an impairment charge, as necessary, for the amount by which the carrying amount exceeds the reporting unit’s fair value, not to exceed the total amount of goodwill allocated to that reporting unit.
Prior to the adoption of ASU 2017-04, the impairment test required a two-step quantitative evaluation. Step 1 involved comparing the estimated fair value of the Company’s reporting units to their carrying amounts. If the estimated fair value of the reporting unit was greater than its carrying amount, there was no requirement to perform Step 2 of the impairment test, and there was no impairment. If the reporting unit’s carrying amount was greater than the estimated fair value, the second step must be completed to measure the amount of impairment, if any. Step 2 calculated the implied fair value of goodwill by deducting the estimated fair value of all tangible and intangible assets, excluding goodwill, of the reporting unit from the estimated fair value of the reporting unit as determined in Step 1. The implied fair value of goodwill determined in this step was compared to the carrying value of goodwill. If the implied fair value of goodwill was less than the carrying value of goodwill, an impairment charge was recognized equal to the difference.
For the years ended December 31, 2017 and 2016, the estimated fair value was determined using an income approach. For the year ended December 31, 2015, the estimated fair value was determined using a combined income and market approach with equal weighting on each approach. The income approach was based on discounted future cash flows and required significant assumptions, including estimates regarding revenue growth rates, operating margins, weighted average cost of capital, and future economic and market conditions. Under the market approach, the Company utilized information regarding the Company, the Company’s industry as well as publicly available industry information to determine earnings multiples and sales multiples that are used to value the Company’s reporting units.
The annual impairment tests as of the last day of February in 2017, 2016 and 2015 supported the goodwill balance and as such no impairment of goodwill was required. As a result of the significant decrease in market capitalization and a decline in our performance primarily due to existing members downgrading their memberships to those with lower monthly dues and new members enrolling at lower rates between February 28, 2015 and May 31, 2015, the Company performed an interim impairment test as of May 31, 2015. The Company concluded that there would be no remaining implied fair value of goodwill attributable to the New York and Boston regions. Accordingly, as of May 31, 2015, the Company wrote off $31.6 million of goodwill associated with these reporting units. The Company did not have a goodwill impairment charge in the Switzerland region as a result of the interim test given the profitability of this unit.
The Company has historically performed goodwill impairment test annually as of the last day of February and in the interim if a triggering event occurs. During the fourth quarter of 2017, the Company established the date of its annual goodwill impairment test for the New York region from the last day of February to August 1. The Company believes that performing the test annually on August 1 will alleviate the information and resource constraints that historically existed during the first quarter and will more closely align with the timing of related forecasts, reports and analysis. The Company will perform a goodwill impairment test on the Switzerland region as of February 28, 2018.
The goodwill in the New York region was acquired in connection with the Lucille Roberts and TMPL acquisitions in the third and fourth quarters of 2017, respectively. As such, these intangible assets were recorded at fair value at the time of acquisitions. The next goodwill impairment test for the New York region will be August 1, 2018 which is within 12 months of the acquisitions. The Company believes that the resulting change in accounting principle related to the annual testing date will not delay, accelerate or avoid an impairment charge. The Company has also determined that it is impracticable to objectively determine projected cash flows and related valuation estimates that would have been used as of August 1 for periods prior to August 1, 2018 without the use of hindsight. As such, the Company will prospectively apply the change in the annual goodwill impairment assessment date beginning August 1, 2018.
Legal contingencies. In accordance with FASB guidance, we determine whether to disclose and accrue for loss contingencies based on an assessment of whether the risk of loss is remote, reasonably possible or probable. Our assessment is developed in consultation with our outside counsel and other advisors and is based on an analysis of possible outcomes under various strategies. Loss contingency assumptions involve judgments that are inherently subjective and can involve matters that are in litigation, which, by its nature are unpredictable. We believe that our assessment of the probability of loss contingencies is reasonable, but because of the subjectivity involved and the unpredictable nature of the subject matter at issue, our assessment may prove ultimately to be incorrect, which could materially impact the consolidated financial statements.
51
Self-insurance reserves. We self-insure our health benefits for all U.S.-based employees and maintain stop loss coverage to limit our exposure. We also limit our exposure to casualty losses on insurance claims by maintaining liability coverage subject to specific and aggregate liability deductibles. Self-insurance losses for claims filed and claims incurred but not reported are accrued based upon a number of factors including sales estimates for each insurance year, claim amounts, claim settlements and number of claims, our historical loss experience and valuations provided by independent third-party consultants. To the extent that estimated self-insurance losses differ from actual losses realized, our insurance reserves could differ significantly and may result in either higher or lower insurance expense in future periods.
Deferred income taxes. Deferred tax assets and liabilities are recognized based on the differences between the financial statement carrying amounts and the tax basis of assets and liabilities. Deferred tax assets represent items to be used as a tax deduction or credit in future tax returns for which a tax benefit has been recorded in the income statement. We record net deferred tax assets to the extent we believe these assets will more likely than not be realized. In making such determination, we consider all positive and negative evidence, including future reversals of existing taxable temporary differences, projected future taxable income, tax planning strategies and recent financial operations. Significant weight is given to positive and negative evidence that is objectively verifiable.
Our deferred tax asset realization assessment considers future income which considers the execution of our business plans and other expectations about future outcomes and is based on certain assumptions. These assumptions require significant judgment about the forecast of future income and are consistent with the plans and estimates we are using to manage our business. When actual results do not meet our forecasted results or there are changes to future business results, such changes can lead to a change in judgment related to the realization of the deferred tax asset.
Based on the weight of the evidence at December 31, 2014, we were projected to be in a cumulative loss position during the three year period ending in December 31, 2015, which was considered to be a significant piece of negative evidence. We determined that it was appropriate to conclude that there would be losses that are projected in the near term due to our conversion to the lower pricing model in a substantial majority of our clubs, which includes lower membership revenue. We continue to consider and make pricing adjustments in order to increase revenue while also driving membership growth. However, because the accounting guidance for income taxes considers a projection of future earnings inherently subjective, it does not carry significant weight to overcome the objectively verifiable evidence of cumulative losses in recent years. Based on these factors, most notably the projected three year cumulative loss, in the fourth quarter of 2014, we recorded a $60.4 million non-cash charge to income tax expense to establish a full valuation allowance against our U.S. net deferred tax assets. As of December 31, 2017, we continue to maintain a full valuation allowance of $38.8 million against outstanding net deferred tax assets as the company continues to have a three year cumulative loss position excluding one-time extraordinary income and expense items.
Tax benefits are recognized for a tax position when, in management’s judgment, it is more likely than not that the position will be sustained upon examination by a taxing authority. For a tax position that meets the more-likely-than-not recognition threshold, the tax benefit is measured as the largest amount that is judged to have a greater than 50% likelihood of being realized upon ultimate settlement with a taxing authority. The liability associated with unrecognized tax benefits is adjusted periodically due to changing circumstances, such as the progress of tax audits, case law developments and new or emerging legislation. Such adjustments are recognized in the period in which they are identified. The effective tax rate includes the net impact of changes in the liability for unrecognized tax benefits and subsequent adjustments as considered appropriate by management. The number of years with open tax audits varies by jurisdiction. While it is often difficult to predict the final outcome or the timing of resolution of any particular tax matter, we believe our liability for unrecognized tax benefits is adequate. Favorable resolution of an unrecognized tax benefit could be recognized as a reduction in our tax provision and effective tax rate in the period of resolution. Unfavorable settlement of an unrecognized tax benefit or a recognized tax position under examination could increase the tax provision and effective tax rate and may require the use of cash in the period of resolution. Interest and penalties recognized on the liability for unrecognized tax benefits is recorded as income tax expense.
Business Combinations. In connection with an acquisition of a business, the Company records all assets acquired and liabilities assumed of the acquired business at their acquisition date fair value, including the recognition of contingent consideration at fair value on the acquisition date. These fair value determinations require judgment and may involve the use of significant estimates and assumptions, including assumptions with respect to future cash inflows and outflows, discount rates, asset lives, and market multiples, among other items. We may utilize independent third-party valuation firms to assist in making these fair value determinations.
52
Inflation
Although we cannot accurately anticipate the effect of inflation on our operations, we believe that inflation has not had a material impact on our results of operations or financial condition. Should there be periods of high inflation in the future, our results of operations or financial condition would be exposed to the effects of inflation, such as higher rents for our leases under escalation terms based on the consumer price index and higher interest expense on the variable rate portion of our debt.
Item 7A. Quantitative and Qualitative Disclosures About Market Risk
Our debt effectively bears interest at fixed and variable rates so that we are exposed to market risks resulting from interest rate fluctuations. We regularly evaluate our exposure to these risks and take measures to mitigate these risks on our consolidated financial results. We do not participate in speculative derivative trading.
Interest rates on borrowings for the 2013 Term Loan Facility are for one-month periods in the case of Eurodollar borrowings. Our exposure to market risk for changes in interest rates relates to interest expense on variable rate debt. As of December 31, 2017, we had $199.9 million of outstanding borrowings under our 2013 Term Loan Facility of which $160.0 million of this variable rate debt is hedged to a fixed rate under an interest rate swap agreement. Changes in the fair value of the interest rate swap derivative instrument is recorded each period in accumulated other comprehensive income (loss). Based on the amount of our variable rate debt and our interest rate swap agreement as of December 31, 2017, a hypothetical 100 basis point interest increase would increase our annual interest cost by approximately $700,000.
For additional information concerning the terms of our 2013 Term Loan Facility, see Note 8 - Long-Term Debt to our consolidated financial statements in this Annual Report.
Item 8. Financial Statements and Supplementary Data
Our Financial Statements appear following the signature page hereto, are incorporated herein by reference and are listed in the index appearing under Item 15.
Item 9. Changes in and Disagreements with Accountants on Accounting and Financial Disclosure
None
Item 9A. Controls and Procedures
Evaluation of Disclosure Controls and Procedures: We maintain disclosure controls and procedures (as such term is defined in Rules 13a-15(e) and 15d-15(e) under the Exchange Act) that are designed to ensure that the information required to be disclosed by us in the reports filed or submitted by us under the Exchange Act is recorded, processed, summarized and reported within the time periods specified in the SEC’s rules and forms and such information is accumulated and communicated to management, including the Chief Executive Officer and the Chief Financial Officer, as appropriate, to allow timely decisions regarding required disclosure. Disclosure controls and procedures, no matter how well designed and operated, can provide only reasonable assurances of achieving the desired controls.
As of December 31, 2017, we carried out an evaluation, under the supervision and with the participation of our management, including the Chief Executive Officer and the Chief Financial Officer, of the effectiveness of the design and operation of our disclosure controls and procedures defined above. Based upon that evaluation, our Chief Executive Officer and Chief Financial Officer have concluded that, as of December 31, 2017, our disclosure controls and procedures were effective at the reasonable assurance level.
Management’s Annual Report on Internal Control Over Financial Reporting: Our management is responsible for establishing and maintaining adequate internal control over financial reporting (as such term is defined in Rules 13a-15(f) and 15d-15(f) under the Exchange Act). Under the supervision and with the participation of our management, including our Chief Executive Officer and Chief Financial Officer, we assessed the effectiveness of our internal control over financial reporting as of December 31, 2017. In making this assessment, our management used the criteria set forth by the Committee of Sponsoring Organizations of the Treadway Commission (COSO) in Internal Control — Integrated Framework (2013). Based on our management’s assessment using those criteria, our management concluded that, as of December 31, 2017, we maintained effective internal control over financial reporting.
53
Our internal control over financial reporting is designed to provide reasonable assurance regarding the reliability of financial reporting and the preparation of consolidated financial statements for external purposes in accordance with generally accepted accounting principles. Because of its inherent limitations, internal control over financial reporting may not prevent or detect misstatements. Also, projections of any evaluation of effectiveness to future periods are subject to the risk that controls may become inadequate because of changes in conditions, or that the degree of compliance with the policies or procedures may deteriorate.
PricewaterhouseCoopers LLP, our independent registered public accounting firm, has audited the effectiveness of our internal control over financial reporting as of December 31, 2017, as stated in their attestation report included following the signature page hereto, included in Item 15.
Changes in Internal Control Over Financial Reporting: There have been no changes in our internal control over financial reporting during the quarter ended December 31, 2017 that have materially affected, or are reasonably likely to materially affect, our internal control over financial reporting.
Item 9B. Other Information
None.
54
PART III
Item 10. Directors, Executive Officers and Corporate Governance
The information with respect to directors, executive officers and corporate governance of the Company is incorporated herein by reference to the following sections of the Company’s definitive Proxy Statement relating to the Company’s 2018 Annual Meeting of Stockholders to be filed with the SEC within 120 days of the Company’s fiscal year ended December 31, 2017 (the “Proxy Statement”): “Matters to be Considered at Annual Meeting — Proposal One — Election of Directors,” “Corporate Governance and Board Matters — Corporate Governance Documents,” “Corporate Governance and Board Matters — Committee Membership — Audit Committee,” “Section 16(A) Beneficial Ownership Reporting Compliance,” “Executive Officers,” and “Deadline for Receipt of Stockholder Proposals.”
The following are the members of our Board of Directors and our Executive Officers:
Board of Directors: | ||
Patrick Walsh | Chairman and Chief Executive Officer, Town Sports International Holdings, Inc. and Chief Executive Officer, PW Partners Atlas Funds, LLC | |
Martin Annese | Principal, MJA Consulting, LLC | |
Marcus B. Dunlop | Managing Partner, HG Vora Capital Management, LLC | |
Jason M. Fish | Chief Investment Officer and member, Alliance Partners, LLC | |
Thomas J. Galligan III | Former Executive Chairman, Papa Gino’s Holdings Corp. | |
Mandy Lam | General Counsel, HG Vora Capital Management, LLC | |
L. Spencer Wells | Partner, Drivetrain Advisors, LLC | |
Executive Officers: | ||
Patrick Walsh | Chief Executive Officer | |
Carolyn Spatafora | Chief Financial Officer | |
Stuart Steinberg | General Counsel | |
Nitin Ajmera | Senior Vice President — Shared Services and Controller | |
Item 11. Executive Compensation
The information with respect to executive compensation is incorporated herein by reference to the following section of the Proxy Statement: “Executive Compensation.”
The information with respect to compensation of directors is incorporated herein by reference to the following section of the Proxy Statement: “Corporate Governance and Board Matters — Directors’ Compensation for the 2017 Fiscal Year.”
Item 12. Security Ownership of Certain Beneficial Owners and Management and Related Stockholder Matters
The information about securities authorized for issuance under equity compensation plans is incorporated herein by reference to the following section of the Proxy Statement: “Executive Compensation - Equity Compensation Plan Information.”
The information with respect to security ownership of certain beneficial owners and management is incorporated herein by reference to the following section of the Proxy Statement: “Ownership of Securities.”
Item 13. Certain Relationships and Related Transactions, and Director Independence
The information with respect to certain relationships and related transactions and director independence is incorporated herein by reference to the following sections of the Proxy Statement: “Certain Relationships and Related Transactions” and “Corporate Governance and Board Matters — Director Independence.”
Item 14. Principal Accountant Fees and Services
The information with respect to principal accountant fees and services is incorporated herein by reference to the following section of the Proxy Statement: “Matters to be Considered at Annual Meeting — Proposal Two — Ratification of Independent Registered Public Accounting Firm.”
55
PART IV
Item 15. Exhibits And Financial Statements
(a) Financial Statements
(1) Financial statements filed as part of this report:
Page Number | ||
Consolidated Annual Financial Statements of Town Sports International Holdings, Inc: | ||
F-2 | ||
F-3 | ||
F-4 | ||
F-5 | ||
F-6 | ||
F-7 | ||
F-8 | ||
(2) Financial Statements Schedules:
The schedules have been omitted because they are not applicable or the required information has been included in the financial statements or notes thereto.
(3) Exhibits. See Item 15(b) below.
(b) Exhibits required by Item 601 of Regulation S-K
The information required by this item is incorporated herein by reference from the Index to Exhibits immediately following page F-36 of this Annual Report.
56
SIGNATURES
Pursuant to the requirements of Section 13 or 15(d) of the Securities Exchange Act of 1934, the registrant has duly caused this report to be signed on its behalf by the undersigned, thereunto duly authorized, on February 28, 2018.
TOWN SPORTS INTERNATIONAL HOLDINGS, INC. | ||
By: | /s/ PATRICK WALSH | |
Chairman and Chief Executive Officer | ||
Pursuant to the requirements of the Securities Exchange Act of 1934, this report has been signed below by the following persons on behalf of the registrant and in the capacities and on the dates indicated.
Signature | Title | Date | ||||
By: | /s/ PATRICK WALSH | Chairman and Chief Executive Officer | February 28, 2018 | |||
Patrick Walsh | (principal executive officer) | |||||
By: | /s/ CAROLYN SPATAFORA | Chief Financial Officer | February 28, 2018 | |||
Carolyn Spatafora | (principal financial and accounting officer) | |||||
By: | /s/ MARTIN ANNESE | Director | February 28, 2018 | |||
Martin Annese | ||||||
By: | /s/ MARCUS B. DUNLOP | Director | February 28, 2018 | |||
Marcus B. Dunlop | ||||||
By: | /s/ JASON M. FISH | Director | February 28, 2018 | |||
Jason M. Fish | ||||||
By: | /s/ THOMAS J. GALLIGAN III | Director | February 28, 2018 | |||
Thomas J. Galligan III | ||||||
By: | /s/ MANDY LAM | Director | February 28, 2018 | |||
Mandy Lam | ||||||
By: | /s/ L. SPENCER WELLS | Director | February 28, 2018 | |||
L. Spencer Wells | ||||||
57
INDEX TO FINANCIAL STATEMENTS
Page | |
Consolidated Annual Financial Statements of Town Sports International Holdings, Inc.: | |
F-1
Report of Independent Registered Public Accounting Firm
To the Board of Directors and Stockholders of
Town Sports International Holdings, Inc.:
Opinions on the Financial Statements and Internal Control over Financial Reporting
We have audited the accompanying consolidated balance sheets of Town Sports International Holdings, Inc. and its subsidiaries as of December 31, 2017 and 2016, and the related consolidated statements of operations, comprehensive income (loss), stockholders’ deficit and cash flows for each of the three years in the period ended December 31, 2017, including the related notes (collectively referred to as the “consolidated financial statements”). We also have audited the Company's internal control over financial reporting as of December 31, 2017, based on criteria established in Internal Control - Integrated Framework (2013) issued by the Committee of Sponsoring Organizations of the Treadway Commission (COSO).
In our opinion, the consolidated financial statements referred to above present fairly, in all material respects, the financial position of the Company as of December 31, 2017 and 2016, and the results of their operations and their cash flows for each of the three years in the period ended December 31, 2017 in conformity with accounting principles generally accepted in the United States of America. Also in our opinion, the Company maintained, in all material respects, effective internal control over financial reporting as of December 31, 2017, based on criteria established in Internal Control - Integrated Framework (2013) issued by the COSO.
Basis for Opinions
The Company's management is responsible for these consolidated financial statements, for maintaining effective internal control over financial reporting, and for its assessment of the effectiveness of internal control over financial reporting, included in Management's Annual Report on Internal Control Over Financial Reporting appearing under Item 9A. Our responsibility is to express opinions on the Company’s consolidated financial statements and on the Company's internal control over financial reporting based on our audits. We are a public accounting firm registered with the Public Company Accounting Oversight Board (United States) (“PCAOB”) and are required to be independent with respect to the Company in accordance with the U.S. federal securities laws and the applicable rules and regulations of the Securities and Exchange Commission and the PCAOB.
We conducted our audits in accordance with the standards of the PCAOB. Those standards require that we plan and perform the audits to obtain reasonable assurance about whether the consolidated financial statements are free of material misstatement, whether due to error or fraud, and whether effective internal control over financial reporting was maintained in all material respects.
Our audits of the consolidated financial statements included performing procedures to assess the risks of material misstatement of the consolidated financial statements, whether due to error or fraud, and performing procedures that respond to those risks. Such procedures included examining, on a test basis, evidence regarding the amounts and disclosures in the consolidated financial statements. Our audits also included evaluating the accounting principles used and significant estimates made by management, as well as evaluating the overall presentation of the consolidated financial statements. Our audit of internal control over financial reporting included obtaining an understanding of internal control over financial reporting, assessing the risk that a material weakness exists, and testing and evaluating the design and operating effectiveness of internal control based on the assessed risk. Our audits also included performing such other procedures as we considered necessary in the circumstances. We believe that our audits provide a reasonable basis for our opinions.
Definition and Limitations of Internal Control over Financial Reporting
A company’s internal control over financial reporting is a process designed to provide reasonable assurance regarding the reliability of financial reporting and the preparation of financial statements for external purposes in accordance with generally accepted accounting principles. A company’s internal control over financial reporting includes those policies and procedures that (i) pertain to the maintenance of records that, in reasonable detail, accurately and fairly reflect the transactions and dispositions of the assets of the company; (ii) provide reasonable assurance that transactions are recorded as necessary to permit preparation of financial statements in accordance with generally accepted accounting principles, and that receipts and expenditures of the company are being made only in accordance with authorizations of management and directors of the company; and (iii) provide reasonable assurance regarding prevention or timely detection of unauthorized acquisition, use, or disposition of the company’s assets that could have a material effect on the financial statements.
F-2
Because of its inherent limitations, internal control over financial reporting may not prevent or detect misstatements. Also, projections of any evaluation of effectiveness to future periods are subject to the risk that controls may become inadequate because of changes in conditions, or that the degree of compliance with the policies or procedures may deteriorate.
/s/ PricewaterhouseCoopers LLP
New York, New York
February 28, 2018
We have served as the Company’s auditor since at least 1996. We have not determined the specific year we began serving as auditor of the Company.
F-3
TOWN SPORTS INTERNATIONAL HOLDINGS, INC. AND SUBSIDIARIES
CONSOLIDATED BALANCE SHEETS
As of December 31, 2017 and 2016
(All figures in thousands except share and per share data)
2017 | 2016 | ||||||
ASSETS | |||||||
Current assets: | |||||||
Cash and cash equivalents | $ | 30,321 | $ | 45,596 | |||
Accounts receivable, net | 2,216 | 1,221 | |||||
Inventory | — | 238 | |||||
Prepaid corporate income taxes | 13,563 | 1,505 | |||||
Prepaid rent expense | 9,153 | — | |||||
Prepaid expenses and other current assets | 12,894 | 10,274 | |||||
Total current assets | 68,147 | 58,834 | |||||
Fixed assets, net | 151,498 | 170,580 | |||||
Goodwill | 6,217 | 1,008 | |||||
Intangible assets, net | 5,134 | 135 | |||||
Deferred membership costs | 959 | 1,092 | |||||
Other assets | 4,716 | 4,229 | |||||
Total assets | $ | 236,671 | $ | 235,878 | |||
LIABILITIES AND STOCKHOLDERS’ DEFICIT | |||||||
Current liabilities: | |||||||
Current portion of long-term debt | $ | 2,082 | $ | 2,082 | |||
Accounts payable | 2,247 | 2,477 | |||||
Accrued expenses | 24,669 | 25,907 | |||||
Accrued interest | 118 | 119 | |||||
Capital lease liabilities | 160 | — | |||||
Deferred revenue | 33,473 | 34,572 | |||||
Total current liabilities | 62,749 | 65,157 | |||||
Long-term debt | 193,947 | 194,743 | |||||
Deferred lease liabilities | 47,356 | 49,660 | |||||
Deferred tax liabilities | 93 | 61 | |||||
Deferred revenue | 351 | 440 | |||||
Other liabilities | 10,132 | 11,487 | |||||
Total liabilities | 314,628 | 321,548 | |||||
Commitments and Contingencies (Note 16) | |||||||
Stockholders’ deficit: | |||||||
Preferred stock, $0.001 par value; no shares issued and outstanding at both December 31, 2017 and December 31, 2016 | |||||||
Common stock, $0.001 par value; issued and outstanding 27,149,135 and 26,560,547 shares at December 31, 2017 and 2016, respectively | 25 | 24 | |||||
Additional paid-in capital | (4,290 | ) | (6,261 | ) | |||
Accumulated other comprehensive income (loss) | 1,201 | (168 | ) | ||||
Accumulated deficit | (74,893 | ) | (79,265 | ) | |||
Total stockholders’ deficit | (77,957 | ) | (85,670 | ) | |||
Total liabilities and stockholders’ deficit | $ | 236,671 | $ | 235,878 | |||
See notes to consolidated financial statements.
F-4
TOWN SPORTS INTERNATIONAL HOLDINGS, INC. AND SUBSIDIARIES
CONSOLIDATED STATEMENTS OF OPERATIONS
Years Ended December 31, 2017, 2016 and 2015
(All figures in thousands except share and per share data)
2017 | 2016 | 2015 | |||||||||
Revenues: | |||||||||||
Club operations | $ | 397,166 | $ | 390,560 | $ | 418,069 | |||||
Fees and other | 5,876 | 6,361 | 6,254 | ||||||||
403,042 | 396,921 | 424,323 | |||||||||
Operating Expenses: | |||||||||||
Payroll and related | 145,612 | 149,029 | 175,898 | ||||||||
Club operating | 180,467 | 185,104 | 196,725 | ||||||||
General and administrative | 22,680 | 24,702 | 30,683 | ||||||||
Depreciation and amortization | 40,849 | 43,727 | 47,887 | ||||||||
Impairment of fixed assets | 6,497 | 742 | 14,571 | ||||||||
Impairment of goodwill | — | — | 31,558 | ||||||||
Gain on sale of building | — | — | (77,146 | ) | |||||||
Gain on lease termination | — | — | (2,967 | ) | |||||||
396,105 | 403,304 | 417,209 | |||||||||
Operating income (loss) | 6,937 | (6,383 | ) | 7,114 | |||||||
Gain on extinguishment of debt | — | (37,893 | ) | (17,911 | ) | ||||||
Interest expense | 12,665 | 13,940 | 20,579 | ||||||||
Interest income | (78 | ) | (2 | ) | — | ||||||
Equity in the earnings of investees and rental income | (333 | ) | (242 | ) | (2,361 | ) | |||||
(Loss) income before (benefit) provision for corporate income taxes | (5,317 | ) | 17,814 | 6,807 | |||||||
(Benefit) provision for corporate income taxes | (9,686 | ) | 9,771 | (14,351 | ) | ||||||
Net income | $ | 4,369 | $ | 8,043 | $ | 21,158 | |||||
Earnings per share: | |||||||||||
Basic | $ | 0.16 | $ | 0.31 | $ | 0.86 | |||||
Diluted | $ | 0.16 | $ | 0.31 | $ | 0.84 | |||||
Weighted average number of shares used in calculating earnings per share: | |||||||||||
Basic | 26,703,577 | 25,568,371 | 24,630,898 | ||||||||
Diluted | 27,422,833 | 26,074,735 | 25,114,057 | ||||||||
See notes to consolidated financial statements.
F-5
TOWN SPORTS INTERNATIONAL HOLDINGS, INC. AND SUBSIDIARIES
CONSOLIDATED STATEMENTS OF COMPREHENSIVE INCOME (LOSS)
Years Ended December 31, 2017, 2016 and 2015
(All figures in thousands)
2017 | 2016 | 2015 | |||||||||
Net income | $ | 4,369 | $ | 8,043 | $ | 21,158 | |||||
Other comprehensive income (loss), net of tax: | |||||||||||
Foreign currency translation adjustments, net of tax of $0 for the years ended in December 31, 2017, 2016 and 2015 | 42 | (176 | ) | (165 | ) | ||||||
Interest rate swap, net of tax of $0 for the years ended in December 31, 2017, 2016 and 2015 | 1,327 | 531 | (753 | ) | |||||||
Total other comprehensive income (loss), net of tax | 1,369 | 355 | (918 | ) | |||||||
Total comprehensive income | $ | 5,738 | $ | 8,398 | $ | 20,240 | |||||
See notes to consolidated financial statements.
F-6
TOWN SPORTS INTERNATIONAL HOLDINGS, INC. AND SUBSIDIARIES
CONSOLIDATED STATEMENTS OF STOCKHOLDERS’ DEFICIT
Years Ended December 31, 2017, 2016 and 2015
(All figures in thousands except share and per share data)
Common Stock ($.001 par) | Additional Paid-in Capital | Accumulated Other Comprehensive Income | Retained Earnings (Deficit) | Total Stockholders’ (Deficit) Equity | ||||||||||||||||||
Shares | Amount | |||||||||||||||||||||
Balance at December 31, 2014 | 24,322,249 | $ | 24 | $ | (10,055 | ) | $ | 395 | $ | (108,448 | ) | $ | (118,084 | ) | ||||||||
Stock option exercises | 171,718 | — | 283 | — | — | 283 | ||||||||||||||||
Common stock grants | 67,609 | — | 445 | — | — | 445 | ||||||||||||||||
Restricted stock grants | 507,000 | — | — | — | — | — | ||||||||||||||||
Forfeiture of restricted stock | (249,790 | ) | — | — | — | — | — | |||||||||||||||
Compensation related to stock options and restricted stock grants | — | — | 941 | — | — | 941 | ||||||||||||||||
Dividend forfeitures | — | — | — | — | 176 | 176 | ||||||||||||||||
Net income | — | — | — | — | 21,158 | 21,158 | ||||||||||||||||
Derivative financial instruments | — | — | — | (753 | ) | — | (753 | ) | ||||||||||||||
Foreign currency translation adjustment | — | — | — | (165 | ) | — | (165 | ) | ||||||||||||||
Dividend related to registration rights | — | — | — | — | (246 | ) | (246 | ) | ||||||||||||||
Balance at December 31, 2015 | 24,818,786 | 24 | (8,386 | ) | (523 | ) | (87,360 | ) | (96,245 | ) | ||||||||||||
Stock option exercises | 226,011 | — | 318 | — | — | 318 | ||||||||||||||||
Common stock grants | 206,750 | — | 246 | — | — | 246 | ||||||||||||||||
Restricted stock grants | 1,711,000 | — | — | — | — | — | ||||||||||||||||
Forfeiture of restricted stock | (402,000 | ) | — | — | — | — | — | |||||||||||||||
Compensation related to stock options and restricted stock grants | — | — | 1,561 | — | — | 1,561 | ||||||||||||||||
Dividend forfeitures | — | — | — | — | 52 | 52 | ||||||||||||||||
Net income | — | — | — | — | 8,043 | 8,043 | ||||||||||||||||
Derivative financial instruments | — | — | — | 531 | — | 531 | ||||||||||||||||
Foreign currency translation adjustment | — | — | — | (176 | ) | — | (176 | ) | ||||||||||||||
Balance at December 31, 2016 | 26,560,547 | 24 | (6,261 | ) | (168 | ) | (79,265 | ) | (85,670 | ) | ||||||||||||
Stock option exercises | 44,114 | 1 | 110 | — | — | 111 | ||||||||||||||||
Common stock grants | 108,940 | — | 368 | — | — | 368 | ||||||||||||||||
Restricted stock grants | 506,200 | — | — | — | — | — | ||||||||||||||||
Forfeiture of restricted stock | (70,666 | ) | — | — | — | — | — | |||||||||||||||
Compensation related to stock options and restricted stock grants | — | — | 1,493 | — | — | 1,493 | ||||||||||||||||
Dividend forfeitures | — | — | — | — | 3 | 3 | ||||||||||||||||
Net income | — | — | — | — | 4,369 | 4,369 | ||||||||||||||||
Derivative financial instruments | — | — | — | 1,327 | — | 1,327 | ||||||||||||||||
Foreign currency translation adjustment | — | — | — | 42 | — | 42 | ||||||||||||||||
Balance at December 31, 2017 | 27,149,135 | $ | 25 | $ | (4,290 | ) | $ | 1,201 | $ | (74,893 | ) | $ | (77,957 | ) | ||||||||
See notes to consolidated financial statements.
F-7
TOWN SPORTS INTERNATIONAL HOLDINGS, INC. AND SUBSIDIARIES
CONSOLIDATED STATEMENTS OF CASH FLOWS
Years Ended December 31, 2017, 2016 and 2015
(All figures in thousands)
2017 | 2016 | 2015 | |||||||||
Cash flows from operating activities: | |||||||||||
Net income | $ | 4,369 | $ | 8,043 | $ | 21,158 | |||||
Adjustments to reconcile net income to net cash provided by operating activities: | |||||||||||
Depreciation and amortization | 40,849 | 43,727 | 47,887 | ||||||||
Impairment of fixed assets | 6,497 | 742 | 14,571 | ||||||||
Impairment of goodwill | — | — | 31,558 | ||||||||
Gain on sale of building | — | — | (77,146 | ) | |||||||
Gain on extinguishment of debt | — | (37,893 | ) | (17,911 | ) | ||||||
Amortization of debt discount | 939 | 1,006 | 1,288 | ||||||||
Amortization of debt issuance costs | 601 | 644 | 778 | ||||||||
Amortization of building financing costs | — | — | 124 | ||||||||
Noncash rental income, net of non-cash rental expense | (4,250 | ) | (3,617 | ) | (3,647 | ) | |||||
Share-based compensation expense | 1,861 | 1,807 | 1,386 | ||||||||
Net change in deferred taxes | 32 | — | (11,519 | ) | |||||||
Net change in certain operating assets and liabilities | (24,450 | ) | 1,500 | 9,185 | |||||||
Decrease in membership costs | 133 | 1,937 | 4,367 | ||||||||
Landlord contributions to tenant improvements | 2,115 | 2,080 | 1,288 | ||||||||
Increase in insurance reserves | 552 | 1,130 | 1,087 | ||||||||
Other | (1,049 | ) | 84 | 416 | |||||||
Total adjustments | 23,830 | 13,147 | 3,712 | ||||||||
Net cash provided by operating activities | 28,199 | 21,190 | 24,870 | ||||||||
Cash flows from investing activities: | |||||||||||
Capital expenditures | (10,206 | ) | (19,723 | ) | (30,471 | ) | |||||
Acquisition of businesses | (15,375 | ) | — | — | |||||||
Acquisition of assets | (12,600 | ) | — | — | |||||||
Deposit paid in connection with acquisitions | (2,800 | ) | — | — | |||||||
Change in restricted cash | — | — | (1,100 | ) | |||||||
Other | (550 | ) | (280 | ) | — | ||||||
Net cash used in investing activities | (41,531 | ) | (20,003 | ) | (31,571 | ) | |||||
Cash flows from financing activities: | |||||||||||
Proceeds from building financing arrangement | — | — | 4,000 | ||||||||
Principal payments on 2013 Term Loan Facility | (2,082 | ) | (2,266 | ) | (3,038 | ) | |||||
Repurchase of 2013 Term Loan Facility | — | (29,765 | ) | (10,947 | ) | ||||||
Debt issuance costs | — | — | (350 | ) | |||||||
Cash dividends paid | (9 | ) | (50 | ) | (213 | ) | |||||
Redemption paid pursuant to the Rights Plan | — | — | (246 | ) | |||||||
Proceeds from stock option exercises | 111 | 318 | 283 | ||||||||
Net cash used in financing activities | (1,980 | ) | (31,763 | ) | (10,511 | ) | |||||
Effect of exchange rate changes on cash | 37 | (45 | ) | (23 | ) | ||||||
Net decrease in cash and cash equivalents | (15,275 | ) | (30,621 | ) | (17,235 | ) | |||||
Cash and cash equivalents beginning of period | 45,596 | 76,217 | 93,452 | ||||||||
Cash and cash equivalents end of period | $ | 30,321 | $ | 45,596 | $ | 76,217 | |||||
Summary of the change in certain operating assets and liabilities: | |||||||||||
(Increase) decrease in accounts receivable | $ | (984 | ) | $ | 763 | $ | 1,446 | ||||
Decrease in inventory | 238 | 99 | 219 | ||||||||
(Increase) decrease in prepaid expenses and other current assets | (9,180 | ) | 2,997 | 596 | |||||||
Increase (decrease) in accounts payable, accrued expenses and accrued interest | 143 | (2,298 | ) | 1,011 | |||||||
Change in prepaid corporate income taxes and corporate income taxes payable | (12,010 | ) | 5,471 | 4,774 | |||||||
(Decrease) increase in deferred revenue | (2,657 | ) | (5,532 | ) | 1,139 | ||||||
Net change in certain working capital components | $ | (24,450 | ) | $ | 1,500 | $ | 9,185 | ||||
See notes to consolidated financial statements.
F-8
TOWN SPORTS INTERNATIONAL HOLDINGS, INC. AND SUBSIDIARIES
NOTES TO CONSOLIDATED FINANCIAL STATEMENTS
December 31, 2017, 2016 and 2015
(In thousands except share and per share data)
1. Basis of Presentation
Town Sports International Holdings, Inc. (the “Company” or “TSI Holdings”) is a diversified holding company owning subsidiaries engaged in a number of business and investment activities. References to “TSI, LLC” refer to Town Sports International, LLC, and references to “TSI Group” refer to Town Sports Group, LLC, both of which are wholly-owned operating subsidiaries of the Company. As of December 31, 2017, the Company owned and operated 165 fitness clubs. The clubs are comprised of 119 clubs in the New York metropolitan region (102 of which were under the “New York Sports Clubs” brand name, 16 of which were under the “Lucille Roberts” brand name, and one of which was under the “TMPL” brand name), including 39 locations in Manhattan. Additionally, the Company owned and operated 28 clubs in the Boston metropolitan region under the “Boston Sports Clubs” brand name, 10 clubs (one of which is partly-owned) in the Washington, D.C. metropolitan region under the “Washington Sports Clubs” brand name, five clubs in the Philadelphia metropolitan region under the “Philadelphia Sports Clubs” brand name and three clubs in Switzerland. In addition, as of December 31, 2017, the Company has one partly-owned club that operates under a different brand name in Washington, D.C. The Company’s operating segments are classified by geographical regions, which include the New York, Boston, Philadelphia, Washington, D.C. and Switzerland regions. These operating segments are the level at which the chief operating decision makers review discrete financial information and make decisions about segment profitability based on earnings before income tax depreciation and amortization. The Company has determined that these operating segments have similar economic characteristics and meet the criteria which permit them to be aggregated into one reportable segment.
The Company continues to experience revenue pressure from members as the fitness industry continues to be highly competitive in the geographic regions in which the Company competes. Also, the prior strategy of converting to a low-cost gym implemented in 2014 resulted in additional revenue pressure for the past few years. New members joined at lower monthly rates and cancellations of members paying higher rates negatively impacted the Company's results and liquidity. In response to this, the Company implemented cost-savings initiatives in 2015, 2016 and 2017, which mitigated the impact the decline in revenue had on its profitability and cash flow from operations.
The Company continues to strategize on improving its financial results. The Company focuses on increasing membership in existing clubs to increase revenue. The Company may consider additional actions within its control, including certain acquisitions, license arrangements, the closure of unprofitable clubs upon lease expiration and the sale of certain assets. The Company may also consider additional strategic alternatives, including opportunities to reduce TSI, LLC’s existing debt and further cost-savings initiatives. The Company’s ability to continue to meet its obligations is dependent on its ability to generate positive cash flow from a combination of initiatives, including those mentioned above. Failure to successfully implement these initiatives could have a material adverse effect on the Company’s liquidity and operations, and the Company would need to implement alternative plans that could include additional asset sales, additional reductions in operating costs, additional reductions in working capital, debt restructurings and the deferral of capital expenditures. There can be no assurance that such alternatives would be available to the Company or that the Company would be successful in their implementation.
2. Summary of Significant Accounting Policies
Principles of Consolidation
The accompanying consolidated financial statements include the accounts of TSI Holdings and all wholly-owned subsidiaries. All intercompany accounts and transactions have been eliminated in consolidation.
Revenue Recognition
The Company generally receives one-time non-refundable joining fees and monthly dues from its members. The Company offers both month-to-month and one-year commit memberships. Members can cancel their membership with a fee charged to those still under contract. Membership dues are recognized in the period in which access to the club is provided.
The Company's membership plans allow for club members to elect to pay a per visit fee to use non-home clubs. These usage fees are recorded to membership revenue in the month the usage occurs. Usage fees recorded were $1,404, $1,015 and $719 for the years ended December 31, 2017, 2016 and 2015, respectively.
F-9
TOWN SPORTS INTERNATIONAL HOLDINGS, INC. AND SUBSIDIARIES
NOTES TO CONSOLIDATED FINANCIAL STATEMENTS — (Continued)
Initiation and processing fees, as well as related direct and incremental expenses of membership acquisition, which may include sales commissions, bonuses and related taxes and benefits, are deferred and recognized, on a straight-line basis, in operations over the estimated average membership life or 12 months to the extent these costs are related to the first annual fee paid within one month of enrollment. Annual fees are amortized over 12 months. Deferred membership costs were $959 and $1,092 at December 31, 2017 and 2016, respectively.
The average membership life was 26 months, 25 months and 22 months for the years ended December 31, 2017, 2016 and 2015. The Company monitors factors that might affect the estimated average membership life including retention trends, attrition trends, membership sales volumes, membership composition, competition, and general economic conditions, and adjusts the estimate as necessary on an annual basis.
The Company recognizes revenue from personal training sessions as the services are performed (i.e., when the session is trained). Unused personal training sessions expire after a set, disclosed period of time after purchase and are not refundable or redeemable by the member for cash. As of December 31, 2017 and 2016, the Company had approximately $12,456 of unused and expired personal training sessions that had not been recognized as revenue and was recorded as deferred revenue. The Company does not believe this amount is subject to the escheatment or abandoned property laws of any of the jurisdictions in which we conduct our business, including the State of New York. It is possible however, that one or more of these jurisdictions may not agree with the Company's position and may claim that the Company must remit all or a portion of these amounts to such jurisdiction. This could have a material adverse effect on the Company's cash flows. The State of New York has informed the Company that it is considering whether the Company is required to remit the amount received by the Company for unused, expired personal training sessions to the State of New York as unclaimed property. For a total of six jurisdictions, the Company has concluded, based on opinions from outside counsel, that money held by a company for unused and expired personal training sessions are not escheatable. In 2010, for three jurisdictions, the Company concluded, based on opinions from outside counsel, that monies held by a company for unused and expired personal training sessions are not escheatable. As a result, the Company recorded approximately $2,697 as personal training revenue in the fourth quarter of 2010. This amount was previously recorded in deferred revenue. In 2017, for another three jurisdictions, the Company concluded, based on opinions from outside counsel, that monies held by a company for unused and expired personal training sessions are not escheatable. As a result, the Company recorded approximately $3,557 as personal training revenue in the fourth quarter of 2017. This amount was previously recorded in deferred revenue, which was primarily related to sessions purchased prior to the year ended December 31, 2015.
In addition to the prepaid personal training sessions the Company also offers a personal training membership product which consists of single or multi-session packages ranging from four to 12 sessions per month. These sessions provided by the membership product are at a discount to our stand-alone session pricing and must be used in each respective month. Members who purchase this product commit to a three month period and revenue is recognized ratably over this period.
The Company generates management fees from certain club facilities that are not wholly-owned, which include four managed sites as of December 31, 2017. Management fees earned for services rendered are recognized at the time the related services are performed. Revenue generated from managed sites was $922, $1,892 and $1,802 for the years ended December 31, 2017, 2016 and 2015, respectively.
When a revenue agreement involves multiple elements, such as sales of both memberships and services in one arrangement or potentially multiple arrangements, the entire fee from the arrangement is allocated to each respective element based on its relative fair value and recognized when the revenue recognition criteria for each element is met.
The Company recognizes revenue from merchandise sales upon delivery to the member.
In connection with advance receipts of fees or dues, the Company was required to maintain bonds totaling $2,658 and $3,112 as of December 31, 2017 and 2016, respectively, pursuant to various state consumer protection laws.
Advertising Costs
Advertising costs are charged to operations during the period in which they are incurred, except for production costs related to television and radio advertisements, which are expensed when the related commercials are first aired. Total advertising costs incurred by the Company for the years ended December 31, 2017, 2016 and 2015 totaled $2,827, $6,384 and $11,057, respectively, and are included in Club operating expenses in the accompanying statements of operations for each respective year.
F-10
TOWN SPORTS INTERNATIONAL HOLDINGS, INC. AND SUBSIDIARIES
NOTES TO CONSOLIDATED FINANCIAL STATEMENTS — (Continued)
Cash and Cash Equivalents
The Company considers all highly liquid instruments which have original maturities of three months or less when acquired to be cash equivalents. The carrying amounts reported in the balance sheets for cash and cash equivalents approximate fair value. The Company owns and operates a captive insurance company in the State of New York. Under the insurance laws of the State of New York, this captive insurance company is required to maintain a cash balance of at least $250. Cash related to this wholly-owned subsidiary of $276 is included in cash and cash equivalents at both December 31, 2017 and 2016, respectively.
Deferred Lease Liabilities, Non-Cash Rental Expense and Additional Rent
The Company recognizes rental expense for leases with scheduled rent increases and inclusive of rental concessions, on the straight-line basis over the life of the lease beginning upon the commencement date of the lease. Rent concessions, primarily received in the form of free rental periods, are also deferred and amortized on a straight-line basis over the life of the lease.
The Company leases office, warehouse and multi-recreational facilities and certain equipment under non-cancelable operating leases. In addition to base rent, the facility leases generally provide for additional rent to cover common area maintenance charges incurred and to pass along increases in real estate taxes. The Company accrues for any unpaid common area maintenance charges and real estate taxes on a club-by-club basis.
Upon entering into certain leases, the Company receives construction allowances from the landlord. These construction allowances are recorded as deferred lease liability credits on the balance sheet when the requirements for these allowances are met as stated in the respective lease and are amortized as a reduction of rent expense over the term of the lease. Amortization of deferred construction allowances were $2,884, $3,190 and $2,920 as of December 31, 2017, 2016 and 2015, respectively.
Certain leases provide for contingent rent based upon defined formulas of revenue, cash flows or operating results for the respective facilities. These contingent rent payments typically call for additional rent payments calculated as a percentage of the respective club’s revenue or a percentage of revenue in excess of defined break-points during a specified year. The Company records contingent rent expense over the related contingent rental period at the time the respective contingent targets are probable of being met. Contingent rent expense was $131, $467 and $693 for the years ended December 31, 2017, 2016 and 2015, respectively, and is included in Club operating expenses in the accompanying consolidated statements of operations for each respective year.
Lease termination gains and losses are recognized at fair value based on the expected settlement amount with the landlord when the Company terminates the contract before the lease termination date. In closing a club, the Company discontinues operating 30 days prior to giving back the space to the landlord, and uses this time to remove equipment and clean the premises. Accordingly, lease termination gains and losses related to certain club closures also include one month additional rent to the landlord. In the years ended December 31, 2017, 2016 and 2015, the Company recorded $201, $329 and $1,550 of lease termination losses, respectively, which were included in Club operating expenses in the accompanying consolidated statements of operations for each respective year.
In the year ended December 31, 2015, in addition to the $1,550 lease termination losses recorded in Club operating expenses in the accompanying statements of operations, the Company also recorded an additional $2,967 net gain on lease termination in a separate line item on the accompanying consolidated statements of operations related to the termination of a lease for a planned club opening that was not yet effective. The Company received one-time gross proceeds of $3,090 from a landlord related to this lease termination in November 2015.
Accounts Receivable and Allowance for Doubtful Accounts
Accounts receivable consists of amounts due from the Company’s membership base and was $6,453 and $4,133 at December 31, 2017 and 2016, respectively, before the allowance for doubtful accounts. The Company maintains allowances for doubtful accounts for estimated losses resulting from the inability of the Company’s customers to make required payments. The Company considers factors such as: historical collection experience, the age of the receivable balance and general economic conditions that may affect a customer’s ability to pay.
F-11
TOWN SPORTS INTERNATIONAL HOLDINGS, INC. AND SUBSIDIARIES
NOTES TO CONSOLIDATED FINANCIAL STATEMENTS — (Continued)
Following are the changes in the allowance for doubtful accounts for the years December 31, 2017, 2016 and 2015:
Balance Beginning of the Year | Additions | Write-offs Net of Recoveries | Balance at End of Year | ||||||||||||
December 31, 2017 | $ | 2,912 | $ | 9,712 | $ | (8,387 | ) | $ | 4,237 | ||||||
December 31, 2016 | $ | 3,133 | $ | 6,704 | $ | (6,925 | ) | $ | 2,912 | ||||||
December 31, 2015 | $ | 2,511 | $ | 11,237 | $ | (10,615 | ) | $ | 3,133 | ||||||
Inventory
As of December 31, 2016, inventory consisted primarily of equipment parts and cleaning and locker room supplies. Inventory was valued at the lower of cost or net realizable value by the first-in, first-out method. In 2017, the Company began to pre-pay for some of these items and store them at a third-party vendor location. These prepaid assets are included in prepaid and other current assets on the accompanying consolidated balance sheet as of December 31, 2017.
Fixed Assets
Fixed assets are recorded at cost and depreciated on a straight-line basis over the estimated useful lives of the assets, which are 30 years for building and improvements, five years for club equipment, furniture, fixtures and computer equipment and three to five years for computer software. Leasehold improvements are amortized over the shorter of their estimated useful lives or the remaining period of the related lease. Payroll costs directly related to the construction or expansion of the Company’s locations are capitalized with leasehold improvements. Expenditures for maintenance and repairs are charged to operations as incurred. The cost and related accumulated depreciation of assets retired or sold is removed from the respective accounts and any gain or loss is recognized in operations. Third-party costs related to developing web applications, developing web pages and installing or enhancing developed applications on the web servers are capitalized and classified as computer software. Website hosting fees and maintenance costs are expensed as incurred.
Intangible Assets and Debt Issuance Costs
Intangible assets are stated at cost and amortized by the straight-line method over their respective estimated lives. Intangible assets currently consist of membership lists, favorable lease commitments, management contracts, trade names and non-compete agreements. Membership lists are amortized over the estimated average membership life, currently at 26 months, favorable lease commitments are amortized over the remaining life of the lease, trade names are amortized over their estimated useful lives of between five and 15 years, and non-compete agreements are amortized over five years. For the years ended December 31, 2017, 2016 and 2015, management contracts were amortized over their contractual lives of between nine and 11 years.
Debt issuance costs are classified within other assets and are being amortized as additional interest expense over the life of the underlying debt, five to seven years, using the interest method. Amortization of debt issue costs was $601, $644 and $778, for the years ended December 31, 2017, 2016 and 2015, respectively. For the year ended December 31, 2015, building financing costs were classified within other assets and were being amortized as additional interest expense over the life of the underlying financing arrangement, 25 years, using the interest method. Amortization of building financing costs was $124 for the year ended December 31, 2015. There was no amortization of building financing costs in the years ended December 31, 2017 and 2016. The balance of building financing costs of $3,005 was written off in December 2015 in connection with the termination of the future lease, which was included in Gain on sale of building in the accompanying statements of operations.
Business Combinations
In connection with an acquisition of a business, the Company records all assets acquired and liabilities assumed, if any, of the acquired business at their acquisition date fair value, including the recognition of contingent consideration at fair value on the acquisition date. These fair value determinations require judgment and may involve the use of significant estimates and assumptions, including assumptions with respect to future cash inflows and outflows, discount rates, asset lives, and market multiples, among other items. We may utilize independent third-party valuation firms to assist in making these fair value determinations.
F-12
TOWN SPORTS INTERNATIONAL HOLDINGS, INC. AND SUBSIDIARIES
NOTES TO CONSOLIDATED FINANCIAL STATEMENTS — (Continued)
Fair Value Measurements
Accounting guidance on fair value measurements specifies a hierarchy of valuation techniques based on whether the inputs to those valuation techniques are observable or unobservable. Observable inputs reflect market data obtained from independent sources, while unobservable inputs reflect the Company’s market assumptions. These two types of inputs create the following fair value hierarchy:
• | Level 1 — Quoted prices for identical instruments in active markets. |
• | Level 2 — Quoted prices for similar instruments in active markets; quoted prices for identical or similar instruments in markets that are not active; and model-derived valuations in which all significant inputs and significant value drivers are observable in active markets. |
• | Level 3 — Valuations derived from valuation techniques in which one or more significant inputs or significant value drivers are unobservable. |
This hierarchy requires the Company to use observable market data, when available, and to minimize the use of unobservable inputs when determining fair value.
Accounting for the Impairment of Long-Lived Assets and Goodwill
Long-lived assets, such as fixed assets and intangible assets are reviewed for impairment periodically whenever events or changes in circumstances indicate that their carrying amounts may not be recoverable from undiscounted cash flows. Estimated undiscounted expected future cash flows are used to determine if an asset group is impaired, in which case the asset carrying value would be reduced to its fair value, calculated considering a combination of market approach and a cost approach. In determining the recoverability of fixed assets Level 3 inputs were used in determining undiscounted cash flows, which are based on internal budgets and forecasts through the end of the life of the primary asset in the asset group which is normally the life of leasehold improvements. The most significant assumptions in those budgets and forecasts relate to estimated membership and ancillary revenue, attrition rates, discount rates, income tax rates, estimated results related to new program launches and maintenance capital expenditures, which are generally estimated at approximately 2% of total revenues depending upon the conditions and needs of a given club. If the Company continues to experience competitive pressure, certain assumptions may not be accurate.
Goodwill represents the excess of consideration paid over the fair value of the net identifiable business assets acquired in the acquisition of a club or group of clubs. Financial Accounting Standards Board (“FASB”) Accounting Standards Codification (“ASC”) 350-20, Intangibles – Goodwill and Other, requires goodwill to be tested for impairment on an annual basis and between annual tests in certain circumstances, and written down when impaired. The Company’s impairment review process compares the fair value of the reporting unit in which the goodwill resides to its carrying value.
The Company early adopted Accounting Standards Update (“ASU”) No. 2017-04, “Simplifying the Test for Goodwill Impairment” in the first quarter of 2017. This standard eliminated the second step of the goodwill impairment test, where a determination of the fair value of individual assets and liabilities of a reporting unit was needed to measure the goodwill impairment. As a result of the updated guidance, the Company’s annual goodwill impairment test as of February 28, 2017 was performed by comparing the fair value of the Company’s reporting unit with its carrying amount and then recognizing an impairment charge, as necessary, for the amount by which the carrying amount exceeds the reporting unit’s fair value, not to exceed the total amount of goodwill allocated to that reporting unit.
Prior to the adoption of ASU 2017-04, the impairment test required a two-step quantitative evaluation. Step 1 involved comparing the estimated fair value of the Company’s reporting units to their carrying amounts. If the estimated fair value of the reporting unit was greater than its carrying amount, there was no requirement to perform Step 2 of the impairment test, and there was no impairment. If the reporting unit’s carrying amount was greater than the estimated fair value, the second step must be completed to measure the amount of impairment, if any. Step 2 calculated the implied fair value of goodwill by deducting the estimated fair value of all tangible and intangible assets, excluding goodwill, of the reporting unit from the estimated fair value of the reporting unit as determined in Step 1. The implied fair value of goodwill determined in this step was compared to the carrying value of goodwill. If the implied fair value of goodwill was less than the carrying value of goodwill, an impairment charge was recognized equal to the difference.
F-13
TOWN SPORTS INTERNATIONAL HOLDINGS, INC. AND SUBSIDIARIES
NOTES TO CONSOLIDATED FINANCIAL STATEMENTS — (Continued)
For the years ended December 31, 2017 and 2016, the estimated fair value was determined using an income approach. For the year ended December 31, 2015, the estimated fair value was determined using a combined income and market approach with equal weighting on each approach. The income approach was based on discounted future cash flows and required significant assumptions, including estimates regarding revenue growth rates, operating margins, weighted average cost of capital, and future economic and market conditions. Under the market approach, the Company utilized information regarding the Company, the Company’s industry as well as publicly available industry information to determine earnings multiples and sales multiples that are used to value the Company’s reporting units.
Solely for purposes of establishing inputs for the fair value calculation described above related to goodwill impairment testing, the Company developed long-range financial forecasts (three years) for all reporting units and assumed known changes in the existing club base. Terminal growth rates were calculated for years beyond the three year forecast.
The Company has historically performed goodwill impairment test annually as of the last day of February and in the interim if a triggering event occurs. During the fourth quarter of 2017, the Company established the date of its annual goodwill impairment test for the New York region from the last day of February to August 1. The Company believes that performing the test annually on August 1 will alleviate the information and resource constraints that historically existed during the first quarter and will more closely align with the timing of related forecasts, reports and analysis. The Company will perform a goodwill impairment test on the Switzerland region as of February 28, 2018.
The goodwill in the New York region was acquired in connection with the Lucille Roberts and TMPL acquisitions in the third and fourth quarters of 2017, respectively. As such, these intangible assets were recorded at fair value at the time of the acquisitions. The next goodwill impairment test for the New York region will be August 1, 2018 which is within 12 months of the acquisitions. The Company believes that the resulting change in accounting principle related to the annual testing date will not delay, accelerate or avoid an impairment charge. The Company has also determined that it is impracticable to objectively determine projected cash flows and related valuation estimates that would have been used as of August 1 for periods prior to August 1, 2018 without the use of hindsight. As such, the Company will prospectively apply the change in the annual goodwill impairment assessment date beginning August 1, 2018.
Insurance
The Company obtains insurance coverage for significant exposures as well as those risks required to be insured by law or contract. The Company retains a portion of risk internally related to general liability losses. Where the Company retains risk, provisions are recorded based upon the Company’s estimates of its ultimate exposure for claims, which are included in general and administrative expenses in the accompanying statements of operations. The provisions are estimated using actuarial analysis based on claims experience, an estimate of claims incurred but not yet reported and other relevant factors. In this connection, under the provision of the deductible agreement related to the payment and administration of the Company’s insurance claims, we are required to maintain irrevocable letters of credit, totaling $415 and $615 as of December 31, 2017 and 2016, respectively.
The Company maintains a self-insured health benefits plan, which provides medical benefits to employees electing coverage under the plan. The Company maintains a reserve for incurred but not reported medical claims and claim development. The reserve is an estimate based on historical experience, actuarial estimates and other assumptions, some of which are subjective. The Company will adjust its self-insured medical benefits reserve as the Company’s loss experience changes due to medical inflation, changes in the number of plan participants and an aging employee base.
Use of Estimates
The preparation of financial statements in conformity with accounting principles generally accepted in the United States of America (“U.S.”) requires management to make estimates and assumptions that affect the reported amounts of assets and liabilities and disclosure of contingent assets and liabilities at the dates of the financial statements and the reported amounts of revenues and expenses during the reporting periods. Actual results could differ from those estimates.
The most significant assumptions and estimates relate to the useful lives of long-term assets, recoverability and impairment of fixed and intangible assets, deferred income tax valuation, valuation of and expense incurred in connection with stock options, valuation of interest-rate swap arrangements, insurance reserves, legal contingencies and the estimated average membership life and the underlying forecasts for these assumptions and estimates.
F-14
TOWN SPORTS INTERNATIONAL HOLDINGS, INC. AND SUBSIDIARIES
NOTES TO CONSOLIDATED FINANCIAL STATEMENTS — (Continued)
Income Taxes
Deferred tax liabilities and assets are recognized for the expected future tax consequences of events that have been included in the financial statements or tax returns. The Company also recognizes deferred tax in relation to the U.S. taxes on the total cumulative earnings of the Company's Swiss clubs. Deferred tax liabilities and assets are determined on the basis of the difference between the financial statement and tax basis of assets and liabilities (“temporary differences”) at enacted tax rates in effect for the years in which the temporary differences are expected to reverse. A valuation allowance is recorded to reduce deferred tax assets to the amount that is more likely than not to be realized. In assessing the need for a valuation allowance, we consider all positive and negative evidence, including future reversals of existing taxable temporary differences, projected future taxable income, tax planning strategies and recent financial operations. As of December 31, 2017, the Company maintained a full valuation allowance of $38,769 against outstanding net deferred tax assets as the company had a three year cumulative loss position excluding one-time extraordinary income and expense items.
The guidance related to accounting for uncertain tax positions prescribes a recognition threshold and measurement attribute for a tax position taken or expected to be taken in a tax return and also provides guidance on de-recognition, classification, interest and penalties, accounting in interim periods, disclosure and transition. The Company recognizes interest and penalties accrued related to unrecognized tax benefits in income tax expense.
Statements of Cash Flows
Supplemental disclosure of cash flow information:
Year Ended December 31, | |||||||||||
2017 | 2016 | 2015 | |||||||||
Cash paid: | |||||||||||
Interest paid (net of amounts capitalized) (a) | $ | 11,165 | $ | 12,289 | $ | 16,749 | |||||
Income taxes paid | $ | 3,891 | $ | 11,286 | $ | 105 | |||||
Cash received: | |||||||||||
Income taxes refund | $ | 1,600 | $ | 6,985 | $ | 7,768 | |||||
Noncash investing and financing activities: | |||||||||||
Acquisition of fixed assets included in accounts payable and accrued expenses | $ | 455 | $ | 2,058 | $ | 2,031 | |||||
(a) Interest includes cash payments under the Initial Lease (as defined below) resulting from the sale of the East 86th Street property in the year ended December 31, 2015. See Notes 9 for additional noncash financing activities. | |||||||||||
Other Comprehensive (Loss) Income
Other comprehensive (loss) income is defined as the change in equity of a business enterprise during a period from transactions and other events and circumstances from non-owner sources, including changes in the fair value of the Company’s derivative financial instrument and foreign currency translation adjustments. The Company presents other comprehensive (loss) income in its consolidated statements of comprehensive (loss) income.
The Company uses a derivative financial instrument to limit exposure to changes in interest rates on the Company’s existing term loan facility. The derivative financial instrument is recorded at fair value on the balance sheet and changes in the fair value are either recognized in accumulated other comprehensive income (a component of stockholders’ equity) or net income depending on the nature of the underlying exposure, whether the hedge is formally designated as a hedge, and if designated, the extent to which the hedge is effective. The Company’s derivative financial instrument has been designated as a cash flow hedge. See Note 10 - Derivative Financial Instruments for more information on the Company’s risk management program and derivatives.
F-15
TOWN SPORTS INTERNATIONAL HOLDINGS, INC. AND SUBSIDIARIES
NOTES TO CONSOLIDATED FINANCIAL STATEMENTS — (Continued)
At December 31, 2017, the Company owned three Swiss clubs, which use the Swiss Franc, their local currency, as their functional currency. Assets and liabilities are translated into U.S. dollars at year-end exchange rates, while income and expense items are translated into U.S. dollars at the average exchange rate for the period. For all periods presented, foreign exchange transaction gains and losses were not material. Adjustments resulting from the translation of foreign functional currency financial statements into U.S. dollars are included in the currency translation adjustment in the consolidated statements of stockholders’ deficit and the consolidated statements of comprehensive income (loss). The effect of foreign exchange translation adjustments was $42, net of tax of $0; $(176), net of tax of $0 and $(165), net of tax of $0, for the years ended December 31, 2017, 2016 and 2015, respectively.
Concentrations of Credit Risk
Financial instruments that potentially subject the Company to concentrations of credit risk consist of cash and cash equivalents and the interest rate swap. Although the Company deposits its cash with more than one financial institution, as of December 31, 2017, $19,932 of the cash balance of $30,321 was held at one financial institution. The Company has not experienced any losses on cash and cash equivalent accounts to date, and the Company believes that, based on the credit ratings of these financial institutions, it is not exposed to any significant credit risk related to cash at this time.
The counterparty to the Company’s interest rate swap is a major banking institution with a credit rating of investment grade or better and no collateral is required, and there are no significant risk concentrations. The Company believes the risk of incurring losses on derivative contracts related to credit risk is unlikely.
Earnings (Loss) Per Share
Basic earnings (loss) per share (“EPS”) is computed by dividing net income (loss) applicable to common stockholders by the weighted average numbers of shares of common stock outstanding during the period. Diluted EPS is computed similarly to basic EPS, except that the denominator is increased for the assumed exercise of dilutive stock options and unvested restricted stock calculated using the treasury stock method.
The following table summarizes the weighted average common shares for basic and diluted EPS computations.
For The Year Ended December 31, | |||||||||||
2017 | 2016 | 2015 | |||||||||
Net income | $ | 4,369 | $ | 8,043 | $ | 21,158 | |||||
Weighted average number of common share outstanding — basic | 26,703,577 | 25,568,371 | 24,630,898 | ||||||||
Effect of dilutive share-based awards | 719,256 | 506,364 | 483,159 | ||||||||
Weighted average number of common shares outstanding — diluted | 27,422,833 | 26,074,735 | 25,114,057 | ||||||||
Earnings per share: | |||||||||||
Basic | $ | 0.16 | $ | 0.31 | $ | 0.86 | |||||
Diluted | $ | 0.16 | $ | 0.31 | $ | 0.84 | |||||
For the years ended December 31, 2017, 2016 and 2015, the Company did not include options to purchase 28,681, 810,571 and 276,846 shares of the Company’s common stock, respectively, in the calculations of diluted EPS because the exercise prices of those options were greater than the average market price and such inclusion would be anti-dilutive.
Stock-Based Compensation
The Company accounts for stock-based compensation in accordance with ASC 718, Compensation - Stock Compensation (“ASC 718”). ASC 718 requires that the cost resulting from all share-based payment transactions be treated as compensation and recognized in the consolidated financial statements. We record share-based payment awards at fair value on the grant date of the awards, based on the estimated number of awards that are expected to vest. The fair value of stock options is determined using the Black-Scholes option-pricing model. The assumptions in the Black-Scholes model include risk-free interest rate, the Company's expected stock price volatility over the term of the awards, expected term of the award, and dividend yield. The fair value of the restricted stock awards is based on the closing price of the Company’s common stock on the date of the grant.
F-16
TOWN SPORTS INTERNATIONAL HOLDINGS, INC. AND SUBSIDIARIES
NOTES TO CONSOLIDATED FINANCIAL STATEMENTS — (Continued)
3. Recent Accounting Pronouncements
In August 2017, the FASB issued ASU No. 2017-12, Derivatives and Hedging (Topic 815): Targeted Improvements to Accounting for Hedging Activities. The updated standard expands the range of transactions that qualify for hedge accounting. It also amends the presentation and disclosure requirements and changes how companies assess effectiveness. It is intended to more closely align hedge accounting with companies’ risk management strategies, simplify the application of hedge accounting, and increase the transparency as to the scope and results of hedging programs. This standard is effective for fiscal years beginning after December 15, 2018, and interim periods within those fiscal years. Early adoption is permitted. The adoption of this guidance is not expected to have a material impact on the Company’s financial statements.
In January 2017, the FASB issued ASU No. 2017-04, “Simplifying the Test for Goodwill Impairment.” This standard eliminates the second step of the goodwill impairment test, where a determination of the fair value of individual assets and liabilities of a reporting unit was needed to measure the goodwill impairment. As a result of ASU No. 2017-04, an entity should perform its goodwill impairment test by comparing the fair value of a reporting unit with its carrying amount and then recognize an impairment charge, as necessary, for the amount by which the carrying amount exceeds the reporting unit’s fair value, not to exceed the total amount of goodwill allocated to that reporting unit. This standard is effective prospectively for annual and interim periods beginning on or after December 15, 2019, and early adoption is permitted on testing dates after January 1, 2017. The Company early adopted the updated guidance for the fiscal year beginning January 1, 2017 with no impact on the Company’s financial statements.
In January 2017, the FASB issued ASU 2017-01, “Business Combinations (Topic 805): Clarifying the Definition of a Business.” This ASU clarifies the definition of a business with the objective of adding guidance to assist entities with evaluating whether transactions should be accounted for as acquisitions (or disposals) of assets or businesses. This ASU is effective for fiscal years beginning after December 15, 2017, and interim periods within those years, with early adoption permitted. The Company early adopted the updated guidance for the fiscal year beginning September 1, 2017 with no impact on the Company’s financial statements.
In August 2016, the FASB issued ASU No. 2016-15, “Statement of Cash Flows (Topic 230): Classification of Certain Cash Receipts and Cash Payments (A Consensus of the FASB Emerging Issues Task Force).” This ASU provides specific guidance over eight identified cash flow issues. This standard is effective for interim and annual periods beginning after December 15, 2017, and early adoption is permitted. The adoption of this guidance will not have a material impact on the Company’s financial statements.
In March 2016, the FASB issued ASU No. 2016-09, “Improvements to Employee Share-Based Payment Accounting.” Under this standard, all excess tax benefits and tax deficiencies will be recorded as an income tax expense or benefit in the income statement in the period in which the awards vest or are exercised. Excess tax benefits will be classified as an operating activity in the statement of cash flows. The standard also allows an entity to elect an accounting policy to either estimate the number of forfeitures or account for forfeitures when they occur. In addition, entities can withhold up to the maximum individual statutory tax rate without classifying the awards as a liability. This standard was effective for interim and annual reporting periods beginning after December 15, 2016, with early adoption permitted. The Company adopted the updated guidance for the fiscal year beginning January 1, 2017 with no material impact on the Company’s financial statements. The Company elected to account for forfeitures of share-based payments by recognizing forfeitures of awards as they occur. Refer to Note 13 - Stockholders’ (Deficit) Equity for further detail.
In February 2016, the FASB issued ASU No. 2016-02, “Leases (topic 842),” to increase transparency and comparability among organizations by recognizing lease assets and lease liabilities on the balance sheet and disclosing key information about leasing arrangements. This standard is effective for annual periods beginning after December 15, 2018, including interim periods within those fiscal years. Early adoption of this standard is permitted. The Company is evaluating the impact of this standard on its financial statements. Refer to Note 12 - Leases for further detail.
F-17
TOWN SPORTS INTERNATIONAL HOLDINGS, INC. AND SUBSIDIARIES
NOTES TO CONSOLIDATED FINANCIAL STATEMENTS — (Continued)
In May 2014, the FASB issued ASU No. 2014-09, “Revenue from Contracts with Customers” (Topic 606). The standard provides a single, comprehensive revenue recognition model for all contracts with customers and supersedes current revenue recognition guidance. The revenue standard contains principles that an entity will apply to determine the measurement of revenue and timing of when it is recognized. The underlying principle is that an entity will recognize revenue to depict the transfer of goods or services to customers at an amount that the entity expects to be entitled to in exchange for those goods or services. The new standard also includes enhanced disclosures which are significantly more comprehensive than those in existing revenue standards. In August 2015, the FASB issued ASU No. 2015-14, which defers the effective date of ASU No. 2014-09 for all entities by one year, to annual reporting periods beginning after December 15, 2017. Early adoption is permitted for annual reporting periods beginning after December 15, 2016. The standard allows for either “full retrospective” adoption, meaning the standard is applied to all of the periods presented, or “modified retrospective” adoption, meaning the standard is applied only to the most current period presented in the financial statements. In addition, the FASB issued ASU No. 2016-08, ASU No. 2016-10, and ASU No. 2016-12 in March 2016, April 2016, and May 2016, respectively, to help provide interpretive clarifications on the new guidance in FASB ASC Topic 606. The Company will adopt this guidance on January 1, 2018 using the modified retrospective method. The Company expects to record an impact to opening retained earnings as of January 1, 2018 due to the cumulative impact of adopting FASB ASC Topic 606, with the impact primarily related to how costs associated with contracts for customers are deferred and recognized. The Company is in the process of finalizing the additional disclosures that may be acquired.
4. Fixed Assets
Fixed assets as of December 31, 2017 and 2016 are shown at cost, less accumulated depreciation and amortization and are summarized below:
December 31, | |||||||
2017 | 2016 | ||||||
Leasehold improvements | $ | 489,738 | $ | 495,515 | |||
Club equipment (a) | 103,998 | 107,905 | |||||
Furniture, fixtures and computer equipment | 56,203 | 71,222 | |||||
Computer software | 19,048 | 25,813 | |||||
Construction in progress | 1,237 | 3,617 | |||||
Building and improvements | 9,575 | — | |||||
Land | 2,675 | — | |||||
682,474 | 704,072 | ||||||
Less: Accumulated depreciation and amortization | (530,976 | ) | (533,492 | ) | |||
$ | 151,498 | $ | 170,580 | ||||
(a) Included $505 of club equipment under capital lease for the year ending December 31, 2017.
Depreciation and leasehold amortization expense for the years ended December 31, 2017, 2016 and 2015, was $40,299, $43,691 and $47,664, respectively.
Fixed assets are evaluated for impairment periodically whenever events or changes in circumstances indicate that related carrying amounts may not be recoverable from undiscounted cash flows in accordance with the FASB guidance. The Company’s long-lived assets and liabilities are grouped at the individual club level which is the lowest level for which there are identifiable cash flows. To the extent that estimated future undiscounted net cash flows attributable to the assets are less than the carrying amount, an impairment charge equal to the difference between the carrying value of such asset and their fair values is recognized.
In the year ended December 31, 2017, the Company tested its underperforming clubs and recorded impairment charges of $6,497 on leasehold improvements and furniture and fixtures at clubs that experienced decreased profitability and sales levels below expectations during this period. In the years ended December 31, 2016 and December 31, 2015, the Company recorded impairment charges of $742 and $14,571, respectively, related to underperforming clubs.
The fair value of long-lived assets is determined using the level 3 valuation technique established by the FASB. Level 3 valuation is based upon unobservable inputs that are significant to the fair value measurement.
F-18
TOWN SPORTS INTERNATIONAL HOLDINGS, INC. AND SUBSIDIARIES
NOTES TO CONSOLIDATED FINANCIAL STATEMENTS — (Continued)
5. Goodwill and Intangible Assets
Goodwill was allocated to reporting units that closely reflect the regions served by the Company: New York, Boston, Washington, D.C., Philadelphia and Switzerland, with certain more remote clubs that do not benefit from a regional cluster being considered single reporting units (“Outlier Clubs”). In the second half of 2017, the Company acquired the Lucille Roberts Health Club business (“Lucille Roberts”) and a single existing club under the TMPL trade name. In connection with these acquisitions, $5,158 of goodwill was added to the Company’s goodwill balance in the New York region. For more information on the Lucille Roberts and the TMPL Gym acquisitions, refer to Note 6 - Acquisitions. As of December 31, 2017, only the New York and Switzerland regions had a goodwill balance.
The Company early adopted ASU No. 2017-04, “Simplifying the Test for Goodwill Impairment” in the first quarter of 2017. This standard eliminated the second step of the goodwill impairment test, where a determination of the fair value of individual assets and liabilities of a reporting unit was needed to measure the goodwill impairment. As a result of the updated guidance, the Company’s annual goodwill impairment test as of February 28, 2017 was performed by comparing the fair value of the Company’s reporting unit with its carrying amount and then recognizing an impairment charge, as necessary, for the amount by which the carrying amount exceeds the reporting unit’s fair value, not to exceed the total amount of goodwill allocated to that reporting unit.
Prior to the adoption of ASU 2017-04, the impairment test required a two-step quantitative evaluation. Step 1 involved comparing the estimated fair value of the Company’s reporting units to their carrying amounts. If the estimated fair value of the reporting unit was greater than its carrying amount, there was no requirement to perform Step 2 of the impairment test, and there was no impairment. If the reporting unit’s carrying amount was greater than the estimated fair value, the second step must be completed to measure the amount of impairment, if any. Step 2 calculated the implied fair value of goodwill by deducting the estimated fair value of all tangible and intangible assets, excluding goodwill, of the reporting unit from the estimated fair value of the reporting unit as determined in Step 1. The implied fair value of goodwill determined in this step was compared to the carrying value of goodwill. If the implied fair value of goodwill was less than the carrying value of goodwill, an impairment charge was recognized equal to the difference.
For the years ended December 31, 2017 and 2016, the estimated fair value was determined using an income approach. For the year ended December 31, 2015, the estimated fair value was determined using a combined income and market approach with equal weighting on each approach. The income approach was based on discounted future cash flows and required significant assumptions, including estimates regarding revenue growth rates, operating margins, weighted average cost of capital, and future economic and market conditions. Under the market approach, the Company utilized information regarding the Company, the Company’s industry as well as publicly available industry information to determine earnings multiples and sales multiples that are used to value the Company’s reporting units.
The annual impairment tests as of the last day of February in 2017, 2016 and 2015 supported the goodwill balance and as such no impairment of goodwill was required. As a result of the significant decrease in market capitalization and a decline in our performance primarily due to existing members downgrading their memberships to those with lower monthly dues and new members enrolling at lower rates between February 28, 2015 and May 31, 2015, the Company performed an interim impairment test as of May 31, 2015. The Company concluded that there would be no remaining implied fair value of goodwill attributable to the New York and Boston regions. Accordingly, as of May 31, 2015, the Company wrote off $31,558 of goodwill associated with these reporting units. The Company did not have a goodwill impairment charge in the Switzerland region as a result of the interim test given the profitability of this unit.
The Company has historically performed goodwill impairment test annually as of the last day of February and in the interim if a triggering event occurs. During the fourth quarter of 2017, the Company established the date of its annual goodwill impairment test for the New York region from the last day of February to August 1. The Company believes that performing the test annually on August 1 will alleviate the information and resource constraints that historically existed during the first quarter and will more closely align with the timing of related forecasts, reports and analysis. The Company will perform a goodwill impairment test on the Switzerland region as of February 28, 2018.
F-19
TOWN SPORTS INTERNATIONAL HOLDINGS, INC. AND SUBSIDIARIES
NOTES TO CONSOLIDATED FINANCIAL STATEMENTS — (Continued)
The goodwill in the New York region was acquired in connection with the Lucille Roberts and TMPL acquisitions in the third and fourth quarters of 2017, respectively. As such, these intangible assets were recorded at fair value at the time of acquisitions. The next goodwill impairment test for the New York region will be August 1, 2018 which is within 12 months of the acquisitions. The Company believes that the resulting change in accounting principle related to the annual testing date will not delay, accelerate or avoid an impairment charge. The Company has also determined that it is impracticable to objectively determine projected cash flows and related valuation estimates that would have been used as of August 1 for periods prior to August 1, 2018 without the use of hindsight. As such, the Company will prospectively apply the change in the annual goodwill impairment assessment date beginning August 1, 2018.
The changes in the carrying amount of goodwill from December 31, 2016 through December 31, 2017 are detailed in the charts below.
New York | Boston | Switzerland | Outlier Clubs | Total | |||||||||||||||
Goodwill, net of accumulated amortization | $ | 31,549 | $ | 15,775 | $ | 1,175 | $ | 3,982 | $ | 52,481 | |||||||||
Changes due to foreign currency exchange rate fluctuations | — | — | (167 | ) | — | (167 | ) | ||||||||||||
Less: accumulated impairment of goodwill | (31,549 | ) | (15,775 | ) | — | (3,982 | ) | (51,306 | ) | ||||||||||
Balance as of December 31, 2016 | — | — | 1,008 | — | 1,008 | ||||||||||||||
Acquired goodwill | 5,158 | — | — | — | 5,158 | ||||||||||||||
Changes due to foreign currency exchange rate fluctuations | — | — | 51 | — | 51 | ||||||||||||||
Balance as of December 31, 2017 | $ | 5,158 | $ | — | $ | 1,059 | $ | — | $ | 6,217 | |||||||||
Intangible assets were acquired in connection with the Lucille Roberts and TMPL acquisitions in 2017. Amortization expense of intangible assets for the years ended December 31, 2017, 2016 and 2015 was $550, $36 and $223 respectively. Intangible assets are as follows:
As of December 31, 2017 | As of December 31, 2016 | ||||||||||||||||||||||
Gross Carrying Amount | Accumulated Amortization | Net Intangibles | Gross Carrying Amount | Accumulated Amortization | Net Intangibles | ||||||||||||||||||
Membership lists | $ | 12,744 | $ | (11,577 | ) | $ | 1,167 | $ | 11,344 | $ | (11,344 | ) | $ | — | |||||||||
Favorable lease commitments | 2,350 | (136 | ) | 2,214 | — | — | — | ||||||||||||||||
Trade names | 900 | (47 | ) | 853 | 40 | (9 | ) | 31 | |||||||||||||||
Non-compete agreement | 900 | — | 900 | — | — | — | |||||||||||||||||
Management contracts | — | — | — | 250 | (146 | ) | 104 | ||||||||||||||||
$ | 16,894 | $ | (11,760 | ) | $ | 5,134 | $ | 11,634 | $ | (11,499 | ) | $ | 135 | ||||||||||
The aggregate amortization expense for the next five years and thereafter of the acquired intangible assets is as follows:
Year Ending December 31, | |||
2018 | $ | 1,377 | |
2019 | 1,251 | ||
2020 | 731 | ||
2021 | 731 | ||
2022 | 506 | ||
2023 and thereafter | 538 | ||
$ | 5,134 | ||
F-20
TOWN SPORTS INTERNATIONAL HOLDINGS, INC. AND SUBSIDIARIES
NOTES TO CONSOLIDATED FINANCIAL STATEMENTS — (Continued)
6. Acquisitions
Acquisitions of businesses are accounted for in accordance with ASC 805, Business Combinations and ASU 2017-01. According to ASC 805, transactions that represent business combinations should be accounted for under the acquisition method. In addition, the ASC 805 includes a subtopic which provides guidance on transactions sometimes associated with business combinations but that do not meet the requirements to be accounted for as business combinations under the acquisition method. Under the acquisition method, the purchase price is allocated to the assets acquired and the liabilities assumed based on their respective estimated fair values as of the acquisition date. Any excess of the purchase price over the fair values of the assets acquired and liabilities assumed was allocated to goodwill. These acquisitions were not material to the financial position, results of operations or cash flows of the Company; therefore, the respective pro forma financial information has not been presented. The results of operations of the clubs acquired have been included in the Company’s consolidated financial statements pro rata from the date of acquisition.
Acquisition of Lucille Roberts Health Club Business
In September 2017, the Company acquired Lucille Roberts for a net cash purchase price of $9,450. The acquisition added 16 clubs to the Company's portfolio in the New York metropolitan region and was accounted for as a business combination. These 16 clubs continue to operate under the Lucille Roberts trade name. Acquisition costs incurred in connection with this transaction during the year ended December 31, 2017, were approximately $285 and are included in general and administrative expenses in the accompanying condensed consolidated statements of income. The following table summarizes the allocation of the purchase price to the fair value of the assets and liabilities acquired.
September 2017 | |||
Allocation of purchase price: | |||
Fixed assets | $ | 1,024 | |
Goodwill | 4,793 | ||
Definite lived intangible assets: | |||
Membership lists | 1,400 | ||
Trade names | 700 | ||
Favorable lease commitments | 2,350 | ||
Deferred revenue | (817 | ) | |
Total allocation of purchase price | $ | 9,450 | |
The goodwill recognized represents the excess of the purchase price over the fair value of the assets acquired and liabilities assumed. The goodwill associated with this acquisition is partially attributable to the avoided costs of acquiring the assembled workforce and is deductible for tax purposes in its entirety. The definite lived intangible assets acquired are being amortized over their estimated useful lives with the membership lists amortized over the estimated average membership life of 26 months, the trade name amortized over its estimated useful life of five years and the favorable lease commitments amortized over the remaining life of each respective lease, or a weighted average life of 6.3 years.
From the acquisition on September 11, 2017 through December 31, 2017, the Lucille Roberts clubs generated revenue of $3,937 and net loss of ($778). It is impractical to disclose proforma information due to the unavailability of historical audited financial statements for Lucille Roberts.
Acquisition of Assets
In November 2017, the Company acquired a building and the land it occupies in the New York metropolitan region, as well as a single health club located on the premises for a purchase price of $12,600. Of the total purchase price, $2,675 was attributed to land, $9,675 was attributed to building, and the remainder of the purchase price was primarily equipment and deferred revenue. This transaction was accounted for as an asset acquisition.
Acquisition of TMPL Gym
In December 2017, the Company acquired an existing club in the New York metropolitan region under the TMPL trade name for a net cash purchase price of $5,925. TMPL is a luxury gym that features a wide variety of fitness programs and group exercises. The club continues to operate under the TMPL trade name and was accounted for as a business combination.
F-21
TOWN SPORTS INTERNATIONAL HOLDINGS, INC. AND SUBSIDIARIES
NOTES TO CONSOLIDATED FINANCIAL STATEMENTS — (Continued)
Acquisition costs incurred in connection with this transaction during the year ended December 31, 2017, were approximately $61 and are included in general and administrative expenses in the accompanying condensed consolidated statements of income. The following table summarizes the allocation of the purchase price to the fair value of the assets and liabilities acquired. The purchase price allocation presented below has been prepared on a preliminary basis and changes to the preliminary purchase price allocations may occur as additional information concerning asset and liability valuations are finalized.
December 2017 | |||
Allocation of purchase price: | |||
Fixed assets | $ | 5,195 | |
Goodwill | 365 | ||
Definite lived intangible assets: | |||
Non-compete agreement | 900 | ||
Trade name | 200 | ||
Deferred revenue | (500 | ) | |
Capital lease liability | (160 | ) | |
Other liabilities | (75 | ) | |
Total allocation of purchase price | $ | 5,925 | |
The goodwill recognized represents the excess of the purchase price over the fair value of the assets acquired and liabilities assumed. The goodwill associated with this acquisition is partially attributable to the avoided costs of acquiring the assembled workforce and is deductible for tax purposes in its entirety. The definite lived intangible assets acquired are being amortized over their estimated useful lives with the non-compete amortized over five years and the trade name amortized over 15 years. It is impractical to disclose proforma information due to the unavailability of historical audited financial statements for TMPL.
Subsequent Acquisitions
In December 2017, the Company entered into an agreement to acquire an existing club in the Boston metropolitan region. In connection with this agreement, the Company deposited $250 and into an escrow account in November 2017. The remaining purchase price of $2,500 was deposited into an escrow account in December 2017. These amounts were recorded in prepaid expenses and other current assets on the balance sheet as of December 31, 2017. The fair value of the net assets acquired on the acquisition date primarily comprises property, plant and equipment, and intangible assets. This acquisition was effective in January 2018. The acquisition will be accounted for as a business combination and the purchase price allocation is pending.
In December 2017, the Company entered into an agreement to acquire an existing club in the Florida region, as well as the land and building the club occupied. In connection with this agreement, the Company deposited $50 into an escrow account in November 2017. The remaining purchase price of $3,969 was made in January 2018 and the acquisition was effective at that time. The fair value of the net assets acquired on the acquisition date primarily comprises land, building, and equipment. This transaction will be accounted for as an asset acquisition in the first quarter of 2018.
The above transactions were completed in January 2018 with no material impact on the Company's financial statements. The purchase price allocations are in the process of being finalized.
7. Accrued Expenses
Accrued expenses as of December 31, 2017 and 2016 consisted of the following:
December 31, | |||||||
2017 | 2016 | ||||||
Accrued payroll and related | $ | 5,888 | $ | 6,817 | |||
Accrued occupancy costs | 10,009 | 8,594 | |||||
Accrued insurance claims | 2,282 | 2,786 | |||||
Accrued other | 6,490 | 7,710 | |||||
$ | 24,669 | $ | 25,907 | ||||
F-22
TOWN SPORTS INTERNATIONAL HOLDINGS, INC. AND SUBSIDIARIES
NOTES TO CONSOLIDATED FINANCIAL STATEMENTS — (Continued)
8. Long-Term Debt
Long-term debt as of December 31, 2017 and 2016 consisted of the following:
December 31, | |||||||
2017 | 2016 | ||||||
2013 Term Loan Facility | $ | 199,918 | $ | 202,000 | |||
Less: Unamortized discount | (2,912 | ) | (3,851 | ) | |||
Less: Deferred financing costs | (977 | ) | (1,324 | ) | |||
Less: Current portion due within one year | (2,082 | ) | (2,082 | ) | |||
Long-term portion | $ | 193,947 | $ | 194,743 | |||
The aggregate long-term debt obligations maturing in the next five years and thereafter are as follows:
Amount Due | |||
Year Ending December 31, | |||
2018 | $ | 2,082 | |
2019 | 2,082 | ||
2020 | 195,754 | ||
2021 | — | ||
2022 | — | ||
2023 and thereafter | — | ||
$ | 199,918 | ||
The table above does not reflect potential commitments in connection with our outstanding letters of credit under the 2013 Revolving Loan Facility (defined below) which matures on November 15, 2018.
2013 Senior Credit Facility
On November 15, 2013, TSI, LLC, an indirect, wholly-owned subsidiary, entered into a $370,000 senior secured credit facility (“2013 Senior Credit Facility”), among TSI, LLC, TSI Holdings II, LLC, a newly-formed, wholly-owned subsidiary of the Company (“Holdings II”), as a Guarantor, the lenders party thereto, Deutsche Bank AG, as administrative agent, and Keybank National Association, as syndication agent. The 2013 Senior Credit Facility consists of a $325,000 term loan facility maturing on November 15, 2020 (“2013 Term Loan Facility”) and a $45,000 revolving loan facility maturing on November 15, 2018 (“2013 Revolving Loan Facility”). Proceeds from the 2013 Term Loan Facility of $323,375 were issued, net of an original issue discount (“OID”) of 0.5%, or $1,625. Debt issuance costs recorded in connection with the 2013 Senior Credit Facility were $5,119 and are being amortized as interest expense and are recorded as a contra-liability to long-term debt on the accompanying consolidated balance sheets. The Company also recorded additional debt discount of $4,356 related to creditor fees. The proceeds from the 2013 Term Loan Facility were used to pay off amounts outstanding under the Company’s previously outstanding long-term debt facility, and to pay related fees and expenses. None of the revolving loan facility was drawn upon as of the closing date on November 15, 2013, but loans under the 2013 Revolving Loan Facility may be drawn from time to time pursuant to the terms of the 2013 Senior Credit Facility. The borrowings under the 2013 Senior Credit Facility are guaranteed and secured by assets and pledges of capital stock by Holdings II, TSI, LLC, and, subject to certain customary exceptions, the wholly-owned domestic subsidiaries of TSI, LLC.
Borrowings under the 2013 Term Loan Facility and the 2013 Revolving Loan Facility, at TSI, LLC’s option, bear interest at either the administrative agent’s base rate plus 2.5% or a LIBOR rate adjusted for certain additional costs (the “Eurodollar Rate”) plus 3.5%, each as defined in the 2013 Senior Credit Facility. With respect to the outstanding term loans, the Eurodollar Rate has a floor of 1.00% and the base rate has a floor of 2.00%. Commencing with the last business day of the quarter ended March 31, 2014, TSI, LLC is required to pay 0.25% of the principal amount of the term loans each quarter, which may be reduced by voluntary prepayments. As of December 31, 2017, TSI LLC has made a total of $24,101 in principal payments on the 2013 Term Loan Facility.
F-23
TOWN SPORTS INTERNATIONAL HOLDINGS, INC. AND SUBSIDIARIES
NOTES TO CONSOLIDATED FINANCIAL STATEMENTS — (Continued)
On January 30, 2015, the 2013 Senior Credit Facility was amended (the “Amendment”) to permit TSI Holdings to purchase term loans under the credit agreement. Any term loans purchased by TSI Holdings will be canceled in accordance with the terms of the credit agreement, as amended by the Amendment. The Company may from time to time purchase term loans in market transactions, privately negotiated transactions or otherwise; however the Company is under no obligation to make any such purchases. Any such transactions, and the amounts involved, will depend on prevailing market conditions, liquidity requirements, contractual restrictions and other factors. The amounts involved may be material. As of December 31, 2017, TSI Holdings had a cash balance of approximately $17,556.
In December 2015, TSI Holdings purchased $29,829 principal amount of debt outstanding under the 2013 Senior Credit Facility in the open market for $10,947, or 36.7% of face value, which resulted in a gain on extinguishment of debt of $17,911, including the write-off of related deferred financing costs and debt discount of $249 and $707, respectively. On April 21, 2016, TSI Holdings settled a transaction to purchase $8,705 principal amount of debt outstanding under the 2013 Senior Credit Facility for $3,787, or 43.5% of face value. On May 6, 2016, TSI Holdings settled another transaction to purchase $62,447 principal amount of debt outstanding under the 2013 Senior Credit Facility for $25,978, or 41.6% of face value. The April and May transactions created total net gains on extinguishment of debt in 2016 of $37,893 with a tax effect of $13,451. When this was netted with our operating loss, it resulted in a tax provision for 2016 of $9,771. The gain on extinguishment of debt was net of the write-off of deferred financing costs and debt discount of $545 and $1,561, respectively, and other costs related to the transaction. All of the above purchased debt was transferred to TSI, LLC and canceled.
In May 2017, TSI, LLC loaned $5,000 to TSI Group, a newly-formed wholly-owned subsidiary of TSI Holdings, at a rate of LIBOR plus 9.55% per annum. In addition to the interest payments, TSI Group is required to repay 1.0% of the principal amount of the loan, $50 per annum, on a quarterly basis commencing September 30, 2017. The loan is secured by certain collateral. This transaction has no impact on the Company's consolidated financial statements as it is eliminated in consolidation. In October 2017, TSI, LLC made a dividend distribution of $35,000 to TSI Holdings, Inc.
The terms of the 2013 Senior Credit Facility provide for a financial covenant in the situation where the total utilization of the revolving loan commitments (other than letters of credit up to $5,500 at any time outstanding) exceeds 25% of the aggregate amount of those commitments. In such event, TSI, LLC is required to maintain a total leverage ratio, as defined in the 2013 Senior Credit Facility, of no greater than 4.50:1.00. As of December 31, 2017, TSI, LLC had outstanding letters of credit of $7,007 and a total leverage ratio that was below 4.50:1.00. Other than these outstanding letters of credit, TSI, LLC did not have any amounts utilized on the 2013 Revolving Loan Facility. The terms of the 2013 Senior Credit Facility include a financial covenant under which the Company is not able to utilize more than 25% or $11,250 in accordance with terms of the 2013 Revolving Loan Facility if the total leverage ratio exceeds 4.50:1:00 (calculated on a proforma basis to give effect to any borrowing). The 2013 Senior Credit Facility also contains certain affirmative and negative covenants, including covenants that may limit or restrict TSI, LLC and Holdings II’s ability to, among other things, incur indebtedness and other liabilities; create liens; merge or consolidate; dispose of assets; make investments; pay dividends and make payments to stockholders; make payments on certain indebtedness; and enter into sale leaseback transactions, in each case, subject to certain qualifications and exceptions. In addition, at any time when the total leverage ratio is greater than 4.50:1.00, there are additional limitations on the ability of TSI, LLC and Holdings II to, among other things, make certain distributions of cash to TSI Holdings. The 2013 Senior Credit Facility also includes customary events of default (including non-compliance with the covenants or other terms of the 2013 Senior Credit Facility) which may allow the lenders to terminate the commitments under the 2013 Revolving Loan Facility and declare all outstanding term loans and revolving loans immediately due and payable and enforce its rights as a secured creditor.
TSI, LLC may prepay the 2013 Term Loan Facility and 2013 Revolving Loan Facility without premium or penalty in accordance with the 2013 Senior Credit Facility. Mandatory prepayments are required relating to certain asset sales, insurance recovery and incurrence of certain other debt and commencing in 2015 in certain circumstances relating to excess cash flow (as defined) for the prior fiscal year, as described below, in excess of certain expenditures. Pursuant to the terms of the 2013 Senior Credit Facility, the Company is required to apply net proceeds in excess of $30,000 from sales of assets in any fiscal year towards mandatory prepayments of outstanding borrowings.
F-24
TOWN SPORTS INTERNATIONAL HOLDINGS, INC. AND SUBSIDIARIES
NOTES TO CONSOLIDATED FINANCIAL STATEMENTS — (Continued)
In addition, the 2013 Senior Credit Facility contains provisions that require excess cash flow payments, as defined therein, to be applied against outstanding 2013 Term Loan Facility balances. The excess cash flow is calculated annually for each fiscal year ending December 31 and paid 95 days after the fiscal year end. The applicable excess cash flow repayment percentage is applied to the excess cash flow when determining the excess cash flow payment. Earnings, changes in working capital and capital expenditure levels all impact the determination of any excess cash flow. The applicable excess cash flow repayment percentage is 50% when the total leverage ratio, as defined in the 2013 Senior Credit Facility, exceeds or is equal to 2.50:1.00; 25% when the total leverage ratio is greater than or equal to 2.00:1.00 but less than 2.50:1.00 and 0% when the total leverage ratio is less than 2.00:1.00. The excess cash flow calculation performed as of December 31, 2017 did not result in any required payments.
As of December 31, 2017, the 2013 Term Loan Facility has a gross principal balance of $199,918 and a balance of $196,029 net of unamortized debt discount of $2,912 and unamortized debt issuance costs of $977. As of December 31, 2017, both the unamortized balance of debt issuance costs and unamortized debt discount are recorded as a contra-liability to long-term debt on the accompanying condensed consolidated balance sheet and are being amortized as interest expense using the effective interest method.
As of December 31, 2017, there were no outstanding 2013 Revolving Loan Facility borrowings and outstanding letters of credit issued totaled $7,007. The unutilized portion of the 2013 Revolving Loan Facility as of December 31, 2017 was $37,993, with borrowings under such facility subject to the conditions applicable to borrowings under the Company’s 2013 Senior Credit Facility, which conditions the Company may or may not be able to satisfy at the time of borrowing. The 2013 Revolving Loan Facility expires on November 15, 2018. Given that the 2013 Senior Credit Facility contains a restrictive covenant on obtaining secured debt, if the Company is unable to extend, restructure or refinance the 2013 Revolving Loan Facility prior to maturity, all letters of credit that remain outstanding under the 2013 Revolving Loan Facility will become immediately due and payable upon maturity. The Company is considering alternative means to satisfy these obligations, including cash collateralization.
Fair Market Value
Based on quoted market prices, the 2013 Term Loan Facility had a fair value of approximately $188,173 and $163,115 at December 31, 2017 and December 31, 2016, respectively, and is classified within level 2 of the fair value hierarchy. Level 2 is based on quoted prices for similar instruments in active markets; quoted prices for identical or similar instruments in markets that are not active; and model-derived valuations in which all significant inputs and significant value drivers are observable in active markets. The fair value for the Company’s 2013 Term Loan Facility is determined using observable current market information such as the prevailing Eurodollar interest rate and Eurodollar yield curve rates and includes consideration of counterparty credit risk.
For the fair market value of the Company’s interest rate swap instrument refer to Note 10 - Derivative Financial Instruments.
Interest Expense
The Company’s interest expense and capitalized interest related to funds borrowed to finance club facilities under construction for the years ended December 31, 2017, 2016 and 2015 were as follows:
Year Ended December 31, | |||||||||||
2017 | 2016 | 2015 | |||||||||
Interest costs expensed | $ | 12,657 | $ | 13,904 | $ | 17,914 | |||||
Interest costs capitalized | — | 28 | 72 | ||||||||
Total interest expense and amounts capitalized | $ | 12,657 | $ | 13,932 | $ | 17,986 | |||||
The table above does not include $2,666 of interest expense related to the building financing arrangement in the year ended December 31, 2015.
F-25
TOWN SPORTS INTERNATIONAL HOLDINGS, INC. AND SUBSIDIARIES
NOTES TO CONSOLIDATED FINANCIAL STATEMENTS — (Continued)
9. Sale of Building
On September 12, 2014, the Company completed the legal sale of its property (building and land) on East 86th Street, New York City, to an unaffiliated third-party for gross proceeds of $85,650. Concurrent with the closing of the transaction, the Company leased back the portion of the property comprising its health club (“Initial Lease”) and had agreed to vacate the property in connection with the purchaser's future development of a new luxury, high-rise multi-use building. In connection with vacating the property, the Company agreed to enter into a new lease (“New Club Lease”) for approximately 24,000 square feet in the new building for the purpose of operating a health club upon completion of construction by the purchaser/landlord. This sale-leaseback transaction was characterized as a financing arrangement for accounting purposes rather than a sale until any continuing involvement has ceased. In March 2015, the Company received the remaining proceeds that had been held in escrow of $500.
On December 23, 2015, the Company terminated the Initial Lease and the agreement to enter into the New Club Lease and received gross proceeds of $3,500 in connection with the termination. Because the lease was terminated with no continuing involvement, this sale-leaseback transaction was accounted for as a completed sale as of December 23, 2015. Under this treatment, the Company recorded a $77,146 gain, previously accounted for as a financing, on the sale of the property, recorded in Gain on sale of building in the consolidated statements of operations for the year ended December 31, 2015.
10. Derivative Financial Instruments
In its normal operations, the Company is exposed to market risks relating to fluctuations in interest rates. In order to minimize the possible negative impact of such fluctuations on the Company’s cash flows, the Company may enter into derivative financial instruments (“derivatives”), such as interest-rate swaps. Derivatives are not entered into for trading purposes and the Company only uses commonly traded instruments. Currently, the Company has used derivatives solely relating to the variability of cash flows from interest rate fluctuations.
The Company originally entered into an interest rate swap arrangement on July 13, 2011 in connection with the Company’s previous credit facility. In connection with entering into the 2013 Senior Credit Facility, the Company amended and restated the interest rate swap agreement initially entered into (and amended in August 2012 and November 2012). Effective as of November 15, 2013, the closing date of the 2013 Senior Credit Facility, the interest rate swap arrangement had a notional amount of $160,000 and will mature on May 15, 2018. The swap effectively converts $160,000 of the current outstanding principal of the total variable-rate debt under the 2013 Senior Credit Facility to a fixed rate of 0.884% plus the 3.5% applicable margin and the Eurodollar rate, which has a floor of 1%. As permitted by ASC 815, Derivatives and Hedging, the Company has designated this swap as a cash flow hedge, the effects of which have been reflected in the Company’s consolidated financial statements as of and for the years ended December 31, 2017, 2016 and 2015. The objective of this hedge is to manage the variability of cash flows in the interest payments related to the portion of the variable-rate debt designated as being hedged.
When the Company’s derivative instrument was executed, hedge accounting was deemed appropriate and it was designated as a cash flow hedge at inception with re-designation being permitted under ASC 815, Derivatives and Hedging. Interest rate swaps are designated as cash flow hedges for accounting purposes since they are being used to transform variable interest rate exposure to fixed interest rate exposure on a recognized liability (debt). On an ongoing basis, the Company performs a quarterly assessment of the hedge effectiveness of the hedge relationship and measures and recognizes any hedge ineffectiveness in the consolidated statements of operations. For the years ended December 31, 2017, 2016 and 2015, hedge ineffectiveness was evaluated using the hypothetical derivative method. There was no hedge ineffectiveness in the years ended December 31, 2017, 2016 and 2015.
The fair value for the Company’s interest rate swap is determined using observable current market information such as the prevailing Eurodollar interest rate and Eurodollar yield curve rates and include consideration of counterparty credit risk. The following table presents the aggregate fair value of the Company’s derivative financial instrument:
Fair Value Measurements Using: | |||||||||||||||
Total Fair Value | Quoted Prices in Active Markets for Identical Assets (Level 1) | Significant Other Observable Inputs (Level 2) | Significant Unobservable Inputs (Level 3) | ||||||||||||
Interest rate swap liability as of December 31, 2017 | $ | 184 | $ | — | $ | 184 | $ | — | |||||||
Interest rate swap liability as of December 31, 2016 | $ | 1,511 | $ | — | $ | 1,511 | $ | — | |||||||
F-26
TOWN SPORTS INTERNATIONAL HOLDINGS, INC. AND SUBSIDIARIES
NOTES TO CONSOLIDATED FINANCIAL STATEMENTS — (Continued)
The swap contract liability of $184 and $1,511 was recorded as a component of accrued expenses as of December 31, 2017 and 2016, respectively, with the offset to accumulated other comprehensive income ($104 and $854, net of taxes, as of December 31, 2017 and 2016, respectively) on the accompanying consolidated balance sheets.
There were no significant reclassifications out of accumulated other comprehensive income in 2017, 2016 and 2015 and the Company does not expect that significant derivative losses included in accumulated other comprehensive income at December 31, 2017 will be reclassified into earnings within the next 12 months.
11. Related Party
On April 25, 2017, the Company approved the appointment of Stuart M. Steinberg as General Counsel of the Company, effective as of May 1, 2017. Furthermore, the Company and Mr. Steinberg's law firm (the “Firm”) previously entered into an engagement letter agreement (the “Agreement”) dated as of February 4, 2016, and as amended and restated effective as of May 1, 2017, pursuant to which the Company engaged the Firm to provide general legal services requested by the Company. Mr. Steinberg continues to provide services for the Firm while employed by the Company. The Agreement provides for a monthly retainer fee payable to the Firm in the amount of $21, excluding litigation services. The Company will also reimburse the Firm for any expenses incurred in connection with the Firm’s services to the Company. In connection with this arrangement, the Company incurred legal expenses payable to the Firm in the amount of $183 in the year ended December 31, 2017. These amounts were classified within general and administrative expenses on the condensed consolidated statements of operations for the year ended December 31, 2017.
12. Leases
The Company leases office, warehouse and multi-recreational facilities and certain equipment under non-cancelable operating leases. In addition to base rent, the facility leases generally provide for additional rent based on operating results, increases in real estate taxes and other costs. Certain leases provide for additional rent based upon defined formulas of revenue, cash flow or operating results of the respective facilities. Under the provisions of certain of these leases, the Company is required to maintain irrevocable letters of credit, which amounted to $5,492 as of December 31, 2017.
The leases expire at various times through May 31, 2038 and certain leases may be extended at the Company’s option. Escalation terms on these leases generally include fixed rent escalations, escalations based on an inflation index such as the consumer price index, and fair market value adjustments. In the next five years, or the period from January 1, 2018 through December 31, 2022, the Company has leases for 25 club locations that are due to expire without any renewal options, eight of which are due to expire in 2018, and 61 club locations that are due to expire with renewal options.
Future minimum rental payments under non-cancelable leases are shown in the chart below.
Minimum Annual Rental | |||
Year Ending December 31, | |||
2018 (a) | $ | 96,518 | |
2019 (a) | 91,208 | ||
2020 | 85,129 | ||
2021 | 75,016 | ||
2022 | 62,933 | ||
2023 and thereafter | 247,911 | ||
(a) For the years ending December 31, 2018 and 2019, future minimum rental payments include capital lease payments of $129 and $31, respectively.
Rent expense for the years ended December 31, 2017, 2016 and 2015 was $126,318, $124,952 and $124,920, respectively. Such amounts include non-base rent items of $24,881, $25,384 and $24,767, respectively. Including the effect of deferred lease liabilities, rent expense was $124,997, $124,333 and $123,872 for the years ended December 31, 2017, 2016 and 2015.
F-27
TOWN SPORTS INTERNATIONAL HOLDINGS, INC. AND SUBSIDIARIES
NOTES TO CONSOLIDATED FINANCIAL STATEMENTS — (Continued)
The Company, as landlord, leases space to third party tenants under non-cancelable operating leases and licenses. In addition to base rent, certain leases provide for additional rent based on increases in real estate taxes, indexation, utilities and defined amounts based on the operating results of the lessee. The sub-leases expire at various times through December 31, 2022. Future minimum rentals receivable under non-cancelable leases are shown in the chart below.
Minimum Annual Rental | |||
Year Ending December 31, | |||
2018 | $ | 1,367 | |
2019 | 1,021 | ||
2020 | 761 | ||
2021 | 537 | ||
2022 | 99 | ||
2023 and thereafter | — | ||
Rental income, including non-cash rental income, for the years ended December 31, 2017, 2016 and 2015 was $2,558, $2,338 and $4,669, respectively. For the years ended December 31, 2017, 2016 and 2015, such amounts included no additional rental charges above the base rent. The Company previously owned the building at the 86th Street club location which housed a rental tenant that generated rental income of approximately $1,926 for the year ended December 31, 2015. Refer to Note 9 - Sale of Building for further details.
13. Stockholders’ (Deficit) Equity
The Company’s certificate of incorporation adopted in connection with the IPO provides for 105,000,000 shares of capital stock, consisting of 5,000,000 shares of Preferred Stock, par value $0.001 per share (“Preferred Stock”) and 100,000,000 shares of Common Stock, par value $0.001 per share (“Common Stock”).
The Company’s 2006 Stock Incentive Plan, as amended and restated in April 2015 (the “2006 Plan”), authorizes the Company to issue up to 3,500,000 shares of Common Stock to employees, non-employee directors and consultants pursuant to awards of stock options, stock appreciation rights, restricted stock, in payment of performance shares or other stock-based awards. The Company amended the 2006 Plan to increase the aggregate number of shares of common stock issuable under the 2006 Plan by 1,000,000 shares to a total of 4,500,000 in May 2016, and by 2,000,000 shares to a total of 6,500,000 in May 2017. As of December 31, 2017, there were 2,072,967 shares available to be issued under the 2006 Plan.
In September 2016, the Chief Operating Officer’s employment with the Company was terminated. As a result of the termination, the Company partially accelerated certain share awards previously granted to the Chief Operating Officer. The Company incurred non-cash severance expense of $250 related to this acceleration.
Beginning January 1, 2017, the Company adopted ASU No. 2016-09, “Improvements to Employee Share-Based Payment Accounting.” As a result of this updated guidance, the Company elected to account for forfeitures of share-based payments by recognizing forfeitures of awards as they occur. In the year ended December 31, 2017, the Company adjusted the forfeiture estimates to reflect actual forfeitures. The forfeiture adjustment reduced stock-based compensation expense by $234 in the year ended December 31, 2017.
a. Common Stock Options
The outstanding Common Stock options as of December 31, 2017 were all fully vested. Stock options generally vest over a three to four year service period and expire five to ten years from the date of grant.
As of December 31, 2017, 2016 and 2015, a total of 61,013, 150,207 and 544,869 Common Stock options were exercisable, respectively.
At December 31, 2017, the Company had 61,013 stock options outstanding under the 2006 Plan.
F-28
TOWN SPORTS INTERNATIONAL HOLDINGS, INC. AND SUBSIDIARIES
NOTES TO CONSOLIDATED FINANCIAL STATEMENTS — (Continued)
The Company recognizes stock option expense equal to the grant date fair value of a stock option on a straight-line basis over the requisite service period, which is generally the vesting period. The total compensation expense related to options, classified within Payroll and related on the consolidated statements of operations was $15, $156, and $99 for the years ended December 31, 2017, 2016 and 2015, respectively, and the related tax benefit was $5, $67 and $38 for the years ended December 31, 2017, 2016 and 2015, respectively. Each of these 2017, 2016 and 2015 tax benefits were prior to the recognition of the valuation allowance.
The following table summarizes the stock option activity for the years ended December 31, 2017, 2016 and 2015:
Common | Weighted Average Exercise Price | |||||
Balance at January 1, 2015 | 1,030,521 | $ | 5.29 | |||
Granted | 850,000 | 2.68 | ||||
Exercised | (171,718 | ) | 1.68 | |||
Canceled | (313,934 | ) | 8.61 | |||
Balance at December 31, 2015 | 1,394,869 | 3.40 | ||||
Exercised | (226,011 | ) | 1.41 | |||
Canceled | (533,484 | ) | 3.99 | |||
Forfeited | (447,667 | ) | 2.71 | |||
Balance at December 31, 2016 | 187,707 | 5.78 | ||||
Exercised | (44,114 | ) | 2.50 | |||
Canceled | (57,580 | ) | 13.32 | |||
Forfeited | (25,000 | ) | 2.95 | |||
Balance at December 31, 2017 | 61,013 | $ | 2.19 | |||
The following table summarizes information about stock options outstanding and exercisable as of December 31, 2017:
Options Outstanding | Options Exercisable | ||||||||||||||
Number of Options | Weighted-Average Remaining Contractual Life | Weighted-Average Exercise Price | Number of Options | Weighted-Average Exercise Price | |||||||||||
Common | |||||||||||||||
2008 grants | 26,208 | 11 months | $ | 2.70 | 26,208 | $ | 2.70 | ||||||||
2009 grants | 23,490 | 23 months | $ | 1.74 | 23,490 | $ | 1.74 | ||||||||
2010 grants | 11,315 | 30 months | $ | 1.91 | 11,315 | $ | 1.91 | ||||||||
Total Grants | 61,013 | 19 months | $ | 2.19 | 61,013 | $ | 2.19 | ||||||||
At December 31, 2017, stock options outstanding have a weighted average remaining contractual life of 1.6 years and the total intrinsic value for “in-the-money” options, based on the Company’s closing stock price of $5.55, was $209. At December 31, 2017, stock options exercisable have a weighted average remaining contractual life of 1.6 years and the total intrinsic value for “in-the-money” exercisable options was $209. The total intrinsic value of options exercised was $111 for the year ended December 31, 2017.
The aggregated intrinsic value represents the pre-tax intrinsic value (the difference between the fair value of the Company’s common stock at December 31, 2017 of $5.55 and the exercise price, multiplied by the number of in-the-money options) that would have been received by the option holders had all option holders exercised their options on December 31, 2017. The intrinsic value is based on the fair market value of the Company’s stock and therefore changes as the fair market value of the stock price changes.
Under the 2006 Plan, stock options must be granted at a price not less than the fair market value of the stock on the date the option is granted, generally are not subject to re-pricing, and will not be exercisable more than ten years after the date of grant. Options granted under the 2006 Plan generally qualify as “non-qualified stock options” under the U.S. Internal Revenue Code. The exercise price of a stock option is equal to the fair market value of the Company’s Common Stock on the option grant date. The Company did not grant any stock options during the years ended December 31, 2017 and 2016. In the year ended December 31, 2015, the Company granted 850,000 stock options, with an aggregate grant date fair value of $2,279.
F-29
TOWN SPORTS INTERNATIONAL HOLDINGS, INC. AND SUBSIDIARIES
NOTES TO CONSOLIDATED FINANCIAL STATEMENTS — (Continued)
Options granted during the year ended December 31, 2015 to employees of the Company were as follows:
Date | Number of Shares | Exercise Price | Grant Date Fair Value | |||||||
August 19, 2015 | 700,000 | $ | 2.61 | $ | 1,827 | |||||
October 12, 2015 | 50,000 | $ | 2.95 | 148 | ||||||
October 19, 2015 | 100,000 | $ | 3.04 | 304 | ||||||
850,000 | $ | 2,279 | ||||||||
The weighted average fair value of stock options as of the grant date was $1.10 in 2015. The fair value of each option grant is estimated on the date of grant using the Black-Scholes option-pricing model with the following weighted average assumptions:
Common | Risk-Free Interest Rate | Expected Dividend Yield | Expected Term (Years) | Expected Volatility | |||||||
2015 Grants | 1.1 | % | — | 3.99 | 52.03 | % | |||||
The Company calculated the weighted average expected term of stock options to be 3.99 years, which represented the period of time that options were expected to be outstanding. The risk free interest rate for periods within the contractual life of the option was based on the U.S. treasury yield in effect at the time of grant. The volatility was determined based on management's estimate or historical volatilities of comparable companies.
As of December 31, 2017, there was no unrecognized compensation cost related to stock options.
b. Common Stock Grants
Restricted Stock Grants
The following restricted stock grants were issued to employees of the Company during the year ended December 31, 2017.
Number of Shares | Share Price | Grant Date Fair Value | ||||||||
March 8, 2017 | 26,000 | $ | 4.00 | $ | 104 | |||||
December 4, 2017 | 480,200 | $ | 5.85 | 2,809 | ||||||
Total | 506,200 | $ | 2,913 | |||||||
The following table summarizes the restricted stock activity for the years ended December 31, 2017, 2016 and 2015:
Number of Shares | Weighted Average Grant Date Fair Value | |||||
Balance as of January 1, 2015 | 401,534 | $ | 9.38 | |||
Granted | 507,000 | 4.27 | ||||
Vested | (133,874 | ) | 9.20 | |||
Forfeited | (249,790 | ) | 8.19 | |||
Balance as of December 31, 2015 | 524,870 | 5.06 | ||||
Granted | 1,711,000 | 2.48 | ||||
Vested | (222,495 | ) | 4.59 | |||
Forfeited | (402,000 | ) | 3.39 | |||
Balance as of December 31, 2016 | 1,611,375 | 2.80 | ||||
Granted | 506,200 | 5.75 | ||||
Vested | (534,968 | ) | 2.93 | |||
Forfeited | (70,666 | ) | 3.06 | |||
Balance as of December 31, 2017 | 1,511,941 | $ | 3.73 | |||
F-30
TOWN SPORTS INTERNATIONAL HOLDINGS, INC. AND SUBSIDIARIES
NOTES TO CONSOLIDATED FINANCIAL STATEMENTS — (Continued)
The fair value of restricted stock is based on the closing stock price of an unrestricted share of the Company’s Common Stock on the grant date and is amortized to compensation expense on a straight-line basis over the requisite service period, which is generally the vesting period. The total compensation expense, classified within Payroll and related on the consolidated statements of operations, related to restricted stock grants was $1,478, $1,155 and $842 for the years ended December 31, 2017, 2016 and 2015, respectively, and the related tax benefit was $452, $496 and $321 for the years ended December 31, 2017, 2016 and 2015, respectively. Each of these 2017, 2016 and 2015 tax benefit were prior to the recognition of the valuation allowance. The restricted shares contain vesting restrictions and vest in equal installments over either three or four years on the anniversary date of the grants. In the year ended December 31, 2017, the Company granted 506,200 restricted shares with an aggregate grant date fair value of $2,913. In the years ended December 31, 2016 and 2015, the Company granted 1,711,000 and 507,000 restricted shares, respectively, with an aggregate grant date fair value of $4,245 and $2,166, respectively.
As of December 31, 2017, $5,128 of unrecognized compensation cost related to restricted stock was expected to be recognized over a weighted-average period of 2.4 years.
Non-Restricted Stock Grants
The Company issued 56,940 and 52,000 shares of Common Stock to members of the Company’s Board of Directors with respect to their annual retainer on February 1, 2017 and March 8, 2017. The fair value of the shares issued on February 1, 2017 and March 8, 2017 was $2.81 and $4.00 per share, respectively, and was expensed upon the date of grant. The total compensation expense, classified within general and administrative expenses, related to Board of Director Common Stock grants was $368 in the year ended December 31, 2017. In the years ended December 31, 2016 and 2015, the Company issued 206,750 and 67,609 shares of Common Stock, respectively, with an aggregate grant date fair value of $246 and $445, respectively.
14. Revenues
Revenues for the years ended December 31, 2017, 2016 and 2015 are summarized below:
Years Ended December 31, | |||||||||||
2017 | 2016 | 2015 | |||||||||
Membership dues | $ | 307,966 | $ | 296,795 | $ | 309,096 | |||||
Initiation and processing fees | 2,268 | 7,636 | 13,644 | ||||||||
Personal training revenue | 69,735 | 66,487 | 73,191 | ||||||||
Other ancillary club revenue(1) | 17,197 | 19,642 | 22,138 | ||||||||
Total club revenue | 397,166 | 390,560 | 418,069 | ||||||||
Fees and other revenue(2) | 5,876 | 6,361 | 6,254 | ||||||||
Total revenue | $ | 403,042 | $ | 396,921 | $ | 424,323 | |||||
(1) | Other ancillary club revenue primarily consists of Sports Clubs for Kids, Small Group Training and racquet sports. |
(2) | Fees and other revenue primarily consist of rental income, laundry revenue, marketing revenue and management fees. |
15. Corporate Income Taxes
On December 22, 2017, the U.S. President signed into law H.R.1, formerly known as the Tax Cuts and Jobs Act (the “Tax Legislation”). The Tax Legislation significantly revises the U.S. tax code by, (i) lowering the U.S federal statutory income tax rate from 35% to 21%, (ii) implementing a territorial tax system, (iii) imposing a one-time transition tax on deemed repatriated earnings of foreign subsidiaries (“Transition Tax”), (iv) requiring a current inclusion of global intangible low taxed income (“GILTI”) of certain earnings of controlled foreign corporations in U.S. federal taxable income, (v) creating the base erosion anti-abuse tax (“BEAT”) regime, (vi) implementing bonus depreciation that will allow for full expensing of qualified property, and (vii) limiting deductibility of interest and executive compensation expense, among other changes. The Company has computed its current tax benefit using the U.S. federal statutory rate of 35% while it has computed its deferred tax expense using the new statutory rate effective on January 1, 2018 of 21%.
F-31
TOWN SPORTS INTERNATIONAL HOLDINGS, INC. AND SUBSIDIARIES
NOTES TO CONSOLIDATED FINANCIAL STATEMENTS — (Continued)
The Company recorded the applicable impact of the Tax Legislation within its provision for income taxes in the year ended December 31, 2017. The Company has recorded the required income tax effects under the Tax Legislation and provided disclosure pursuant to ASC 740, Income Taxes, and the SEC Staff Accounting Bulletin (“SAB”) 118, using its best estimates based on reasonable and supportable assumptions and available inputs and underlying information as of the reporting date. The three provisions that most significantly impact the Company for the year ended December 31, 2017 are (i) the impact of the U.S. federal statutory rate reduction, from 35% to 21%, on the deferred tax provision and related valuation allowance (ii) the full expensing of qualified property and (iii) the calculation of the Transition Tax. These amounts were recorded as provisional pursuant to SAB 118 since they require more detailed information before these amounts can be finalized. All amounts recorded were based on current available guidance on interpretation of the Tax Legislation, and reasonable approaches to estimating their impact. The amounts recorded in the year ended December 31, 2017, are subject to adjustment as future guidance becomes available, additional facts become known or estimation approaches are refined.
Other provisions of the new legislation that are not applicable to the Company until the year ended December 31, 2018 include, but are not limited to, limiting deductibility of interest and executive compensation expense. Based on current facts and circumstances, we do not anticipate the impact of these provisions to be material to the overall financial statements.
The (benefit) provision for income taxes for the years ended December 31, 2017, 2016 and 2015 consisted of the following:
Year Ended December 31, 2017 | |||||||||||||||
Federal | Foreign | State and Local | Total | ||||||||||||
Current | $ | (9,599 | ) | $ | (63 | ) | $ | (56 | ) | $ | (9,718 | ) | |||
Deferred | 12 | — | 20 | 32 | |||||||||||
$ | (9,587 | ) | $ | (63 | ) | $ | (36 | ) | $ | (9,686 | ) | ||||
Year Ended December 31, 2016 | |||||||||||||||
Federal | Foreign | State and Local | Total | ||||||||||||
Current | $ | 9,346 | $ | (63 | ) | $ | 488 | $ | 9,771 | ||||||
Deferred | — | — | — | — | |||||||||||
$ | 9,346 | $ | (63 | ) | $ | 488 | $ | 9,771 | |||||||
Year Ended December 31, 2015 | |||||||||||||||
Federal | Foreign | State and Local | Total | ||||||||||||
Current | $ | (3,100 | ) | $ | 67 | $ | 197 | $ | (2,836 | ) | |||||
Deferred | (8,262 | ) | — | (3,253 | ) | (11,515 | ) | ||||||||
$ | (11,362 | ) | $ | 67 | $ | (3,056 | ) | $ | (14,351 | ) | |||||
F-32
TOWN SPORTS INTERNATIONAL HOLDINGS, INC. AND SUBSIDIARIES
NOTES TO CONSOLIDATED FINANCIAL STATEMENTS — (Continued)
The components of deferred tax liabilities, net consist of the following items:
December 31, | |||||||
2017 | 2016 | ||||||
Deferred tax assets | |||||||
Basis differences in depreciation and amortization | $ | — | $ | 10,073 | |||
Deferred lease liabilities | 15,638 | 23,527 | |||||
Deferred revenue | 4,590 | 8,247 | |||||
Deferred compensation expense incurred in connection with stock options | 912 | 994 | |||||
Federal and state net operating loss carry-forwards | 15,645 | 8,473 | |||||
Accruals, reserves and other | 4,942 | 7,297 | |||||
$ | 41,727 | $ | 58,611 | ||||
Deferred tax liabilities | |||||||
Deferred costs | $ | 1,740 | $ | 803 | |||
Basis differences in depreciation and amortization | 1,311 | — | |||||
Change in accounting method | — | 3,147 | |||||
Undistributed foreign earnings and other | — | 529 | |||||
$ | 3,051 | $ | 4,479 | ||||
Gross deferred tax assets | 38,676 | 54,132 | |||||
Valuation allowance | (38,769 | ) | (54,193 | ) | |||
Deferred tax liabilities, net | $ | (93 | ) | $ | (61 | ) | |
As of December 31, 2017 and 2016, the Company had a net deferred tax liability of $93 and $61, respectively.
In assessing the realizability of deferred tax assets, the Company evaluates whether it is more likely than not (more than 50%) that some portion or all of the deferred tax assets will be realized. A valuation allowance, if needed, reduces the deferred tax assets to the amount expected to be realized. The ultimate realization of deferred tax assets is dependent upon the generation of future taxable income in those periods in which temporary differences become deductible and/or net operating loss carryforward can be utilized. The Company evaluates all positive and negative evidence when determining the amount of the net deferred tax assets that are more likely than not to be realized. This evidence includes, but is not limited to, prior earnings history, scheduled reversal of taxable temporary differences, tax planning strategies and projected future taxable income. Significant weight is given to positive and negative evidence that is objectively verifiable.
As required by the authoritative guidance on accounting for income taxes, the Company evaluates the realizability of deferred tax assets on a jurisdictional basis at each reporting date. Accounting for income taxes requires that a valuation allowance be established when it is more likely than not that all or a portion of the deferred tax assets will not be realized. In circumstances where there is sufficient negative evidence indicating that the deferred tax assets are not more likely than not realizable, we establish a valuation allowance. The Company has recorded valuation allowances in the amounts of $38,769 and $54,193 at December 31, 2017 and 2016, respectively. Due to the change in the U.S. federal statutory income tax rate from the Tax Legislation, the deferred tax assets and liabilities of the Company were re-measured from using a 35% tax rate to a 21% tax rate. As the Company maintains a full valuation allowance against its outstanding net deferred tax assets, the change in net deferred tax assets due to the rate change was offset by a corresponding change in the valuation allowance.
In recording the valuation allowance, deferred tax liabilities associated with goodwill generally cannot be used as a source of taxable income to realize deferred tax assets with a definitive loss carry forward period. The Company does not amortize goodwill for book purposes but does amortize goodwill with tax basis for tax purposes. The deferred tax liability remaining after full valuation allowance at December 31, 2017 relates to the tax effect of differences between book and tax basis of intangible assets not expected to reverse during the Company’s net operating loss carry forward period.
As of December 31, 2017, state tax net operating loss carry-forwards were $133,840. Such amounts expire between December 31, 2018 and December 31, 2037.
F-33
TOWN SPORTS INTERNATIONAL HOLDINGS, INC. AND SUBSIDIARIES
NOTES TO CONSOLIDATED FINANCIAL STATEMENTS — (Continued)
The Company’s foreign pre-tax earnings (loss) related to the Swiss clubs were $(262), $(264) and $277 for the years ended December 31, 2017, 2016 and 2015, respectively. The related current tax provisions (benefit) were $(63) for both the years ended December 31, 2017 and 2016, and $67 for the year ended December 31, 2015. In 2011, the Company repatriated Swiss earnings through 2010. In accordance with ASC 740-30, the Company had recognized a deferred tax liability of $529 for the incremental U.S. tax cost on the total cumulative undistributed earnings of the Swiss clubs for the period through December 31, 2016. Due to the Transition Tax, the Company expects a deemed repatriation of its foreign earnings and profits related to the Swiss clubs therefore reversing its deferred tax liability on those unrepatriated foreign earnings and profits. As the Company has a taxable loss for the current year, it expects to not pay any Transition Tax but rather it will have a corresponding reduction to its net operating loss carryforward.
The differences between the U.S. Federal statutory income tax rate and the Company’s effective tax rate were as follows for the years ended December 31, 2017, 2016 and 2015:
Years Ended December 31, | ||||||||
2017 | 2016 | 2015 | ||||||
Federal statutory tax rate | 35 | % | 35 | % | 35 | % | ||
State and local income taxes (net of federal tax benefit) | 1 | 2 | 11 | |||||
Change in state effective income tax rate | — | — | 3 | |||||
State tax (benefit) provision related to insurance premiums | — | — | (14 | ) | ||||
Tax reserves | — | — | 1 | |||||
Permanent differences in fines and penalties | (3 | ) | — | 2 | ||||
Permanent difference in compensation | (2 | ) | — | — | ||||
31 | 37 | 38 | ||||||
Valuation allowance | 151 | 18 | (249 | ) | ||||
182 | % | 55 | % | (211 | )% | |||
The effective tax rate on the Company’s pre-tax income or loss was 182% for 2017, 55% for 2016, and (211)% for 2015, which was primarily impacted by the change in the valuation allowance.
The amount of unrecognized tax benefits that, if recognized, would affect the Company's effective tax rate in any future periods were $1,155 and $1,187 as of December 31, 2017 and 2016, respectively. Interest expense on unrecognized tax benefits was $81 for the years ended both December 31, 2017 and 2016. The Company recognizes both interest accrued related to unrecognized tax benefits and penalties in income tax expenses. The Company had total accruals for interest as of December 31, 2017 and 2016 of $865 and $785, respectively.
A reconciliation of unrecognized tax benefits, excluding interest and penalties, is as follows:
2017 | 2016 | 2015 | |||||||||
Balance on January 1 | $ | 1,187 | $ | 1,187 | $ | 1,187 | |||||
Gross decreases for tax positions taken in prior years | — | — | — | ||||||||
Gross increases for tax positions taken in prior years | — | — | — | ||||||||
Decreases relating to settlements with taxing authorities | — | — | — | ||||||||
Reductions due to a lapse of applicable statute of limitations | (32 | ) | — | — | |||||||
Balance on December 31 | $ | 1,155 | $ | 1,187 | $ | 1,187 | |||||
As of December 31, 2017, the Company had $1,155 of unrecognized tax benefits and it is reasonably possible that the entire amount could be realized by the Company in 2018 since the income tax returns may no longer be subject to audit in 2018.
The Company files federal, foreign and multiple state and local jurisdiction income tax returns. The Company is no longer subject to examinations of its federal income tax returns by the Internal Revenue Service for years 2013 and prior. U.S. net operating losses generated in closed years and utilized in open years are subject to adjustment by tax authorities. The Company is under examination by the Internal Revenue Service regarding federal income tax returns for years 2014 and 2015.
F-34
TOWN SPORTS INTERNATIONAL HOLDINGS, INC. AND SUBSIDIARIES
NOTES TO CONSOLIDATED FINANCIAL STATEMENTS — (Continued)
The following state and local jurisdictions are currently examining our respective returns for the years indicated: New York State (2006 through 2014), and New York City (2006 through 2014).
In particular, the Company disagrees with the proposed assessment dated December 12, 2016 from the State of New York and attended a conciliation conference with the New York State Department of Taxation and Finance Audit section on June 7, 2017. No settlement was reached at the conference and the proposed assessment was sustained. As such, in a revised letter dated November 30, 2017, the Company received from the State of New York a revised assessment related to tax years 2006-2009 for approximately $5,097, inclusive of approximately $2,419 of interest. The Company is currently in the process of appealing the assessment with the New York State Division of Tax Appeals. The Company has not recorded a tax reserve related to the proposed assessment. It is difficult to predict the final outcome or timing of resolution of any particular matter regarding these examinations. An estimate of the reasonably possible change to unrecognized tax benefits within the next 12 months cannot be made. On November 17, 2017, the Company was notified that the State of New York proposed an adjustment in the amount of approximately $3,906 for the years 2010 to 2014, inclusive of approximately $757 in interest. The Company is also under examination in New York City (2006 through 2014), which the Company has consented to extend the assessment period through December 31, 2018.
16. Commitments and Contingencies
On February 7, 2007, in an action styled White Plains Plaza Realty, LLC v. TSI, LLC et al., the landlord of one of TSI, LLC’s former health and fitness clubs filed a lawsuit in the Appellate Division, Second Department of the Supreme Court of the State of New York against it and two of its health club subsidiaries alleging, among other things, breach of lease in connection with the decision to close the club located in a building owned by the plaintiff and leased to a subsidiary of TSI, LLC, the tenant, and take additional space in a nearby facility leased by another subsidiary of TSI, LLC. Following a determination of an initial award, which TSI, LLC and the tenant have paid in full, the landlord appealed the trial court’s award of damages, and on August 29, 2011, an additional award (amounting to approximately $900) (the “Additional Award”), was entered against the tenant, which has recorded a liability. Separately, TSI, LLC is party to an agreement with a third-party developer, which by its terms provides indemnification for the full amount of any liability of any nature arising out of the lease described above, including attorneys’ fees incurred to enforce the indemnity. As a result, the developer reimbursed TSI, LLC and the tenant the amount of the initial award in installments over time and also agreed to be responsible for the payment of the Additional Award, and the tenant has recorded a receivable related to the indemnification for the Additional Award. The developer and the landlord are currently litigating the payment of the Additional Award and judgment was entered against the developer on June 5, 2013, in the amount of approximately $1,045, plus interest, which judgment was upheld by the appellate court on April 29, 2015. TSI, LLC does not believe it is probable that TSI, LLC will be required to pay for any amount of the Additional Award.
In addition to the litigation discussed above, the Company is involved in various other lawsuits, claims and proceedings incidental to the ordinary course of business, including personal injury, construction matters, employee relations claims and landlord tenant disputes. The results of litigation are inherently unpredictable. Any claims against the Company, whether meritorious or not, could be time consuming, result in costly litigation, require significant amounts of management time and result in diversion of significant resources. The results of these other lawsuits, claims and proceedings cannot be predicted with certainty. The Company establishes accruals for loss contingencies when it has determined that a loss is probable and that the amount of loss, or range of loss, can be reasonably estimated. Any such accruals are adjusted thereafter as appropriate to reflect changes in circumstances. The Company concluded that an accrual for any such matters is not required as of December 31, 2017.
17. Employee Benefit Plan
The Company maintains a 401(k) defined contribution plan and is subject to the provisions of the Employee Retirement Income Security Act of 1974 (“ERISA”). The plan provides for the Company to make discretionary contributions. The plan was amended, effective January 1, 2001, to provide for an employer matching contribution in an amount equal to 25% of the participant’s contribution with a limit of five hundred dollars per individual, per annum. Effective January 1, 2016, the plan was amended to eliminate the nondiscretionary matching contribution and to provide for a discretionary matching contribution as determined by the participating employer. Employer matching contributions totaling $204 were made in March 2016 for the plan year ended December 31, 2015.
F-35
TOWN SPORTS INTERNATIONAL HOLDINGS, INC. AND SUBSIDIARIES
NOTES TO CONSOLIDATED FINANCIAL STATEMENTS — (Continued)
18. Selected Quarterly Financial Data (Unaudited)
2017 | |||||||||||||||
First Quarter | Second Quarter | Third Quarter | Fourth Quarter | ||||||||||||
(b) | (c) | ||||||||||||||
Net revenue | $ | 99,080 | $ | 99,993 | $ | 98,641 | $ | 105,328 | |||||||
Operating (loss) income | (118 | ) | 3,518 | (6,269 | ) | 9,806 | |||||||||
Net (loss) income | (2,935 | ) | (410 | ) | (13,276 | ) | 20,990 | ||||||||
(Loss) earnings per share (a) | |||||||||||||||
Basic | $ | (0.11 | ) | $ | (0.02 | ) | $ | (0.50 | ) | $ | 0.78 | ||||
Diluted | $ | (0.11 | ) | $ | (0.02 | ) | $ | (0.50 | ) | $ | 0.76 | ||||
2016 | |||||||||||||||
First Quarter | Second Quarter | Third Quarter | Fourth Quarter | ||||||||||||
(d) | (e) | ||||||||||||||
Net revenue | $ | 101,345 | $ | 100,935 | $ | 98,534 | $ | 96,107 | |||||||
Operating (loss) income | (3,722 | ) | (1,462 | ) | (2,624 | ) | 1,425 | ||||||||
Net (loss) earnings | (6,925 | ) | 20,733 | (5,506 | ) | (259 | ) | ||||||||
(Loss) earnings per share (a) | |||||||||||||||
Basic | $ | (0.28 | ) | $ | 0.81 | $ | (0.21 | ) | $ | (0.01 | ) | ||||
Diluted | $ | (0.28 | ) | $ | 0.79 | $ | (0.21 | ) | $ | (0.01 | ) | ||||
(a) | Basic and diluted (loss) earnings per share are computed independently for each quarter presented. Accordingly, the sum of the quarterly earnings per share may not agree with the calculated full year earnings per share. |
(b) | In the third quarter of 2017, the Company recorded a pre-tax non-cash fixed asset impairment charge of $6,497 related to underperforming clubs. |
(c) | In the fourth quarter of 2017, the Company recognized $3,557 of pre-tax personal training revenue related to unused and expired sessions in three of the states it operates clubs. |
(d) | In the second quarter of 2016, the Company recorded a pre-tax gain on extinguishment of debt of $38,497 in connection with the purchase of $71,152 of its debt. |
(e) | In the third quarter of 2016, the Company recorded a pre-tax non-cash fixed asset impairment charge of $742 related to underperforming clubs. |
19. Subsequent Events
In January 2018, the Company acquired an existing club in the Boston metropolitan region. The Company also acquired an existing club in the Florida region, as well as the land and building the club occupied. Refer to Note 6 - Acquisitions for further details.
In January 2018, the Company adopted a management stock purchase plan known as the Town Sports International Holdings, Inc. 2018 Management Stock Purchase Plan. There were no stock purchases under this plan as of February 28, 2018.
On February 21, 2018, the Company entered into an agreement to acquire substantially all of the assets of the Total Woman Gym and Spa business (“Total Woman”). Once consummated, this acquisition will add another women-focused fitness brand to the Company’s growing fitness portfolio. The Company expects this transaction to be completed in the second quarter of 2018.
F-36
Exhibit Index
The following is a list of all exhibits filed or incorporated by reference as part of this Report:
Exhibit No. | Description of Exhibit | |
Exhibit No. | Description of Exhibit | |
Exhibit No. | Description of Exhibit | |
Exhibit No. | Description of Exhibit | |
Exhibit No. | Description of Exhibit | |
101.INS | XBRL Instance Document. | |
101.SCH | XBRL Taxonomy Extension Schema. | |
101.CAL | XBRL Taxonomy Extension Calculation Linkbase. | |
101.DEF | XBRL Taxonomy Extension Definition Linkbase. | |
101.LAB | XBRL Taxonomy Extension Label Linkbase. | |
101.PRE | XBRL Taxonomy Extension Presentation Linkbase. | |
___________________________
* | Management contract or compensatory plan or arrangement. |
Item 16. Form 10-K Summary
None.