Attached files
| file | filename |
|---|---|
| EX-32.1 - EXHIBIT 32.1 - Milacron Holdings Corp. | exhibit321-10k2017.htm |
| EX-31.2 - EXHIBIT 31.2 - Milacron Holdings Corp. | exhibit312-10k2017.htm |
| EX-31.1 - EXHIBIT 31.1 - Milacron Holdings Corp. | exhibit311-10k2017.htm |
| EX-23.1 - EXHIBIT 23.1 - Milacron Holdings Corp. | exhibit231-10k2017.htm |
| EX-21.1 - EXHIBIT 21.1 - Milacron Holdings Corp. | exhibit211-10k2017.htm |
| EX-10.39 - EXHIBIT 10.39 - Milacron Holdings Corp. | exhibit1039-10k2017.htm |
| EX-10.38 - EXHIBIT 10.38 - Milacron Holdings Corp. | exhibit1038-10k2017.htm |
UNITED STATES
SECURITIES AND EXCHANGE COMMISSION
Washington, D.C. 20549
Form 10-K
ý | ANNUAL REPORT PURSUANT TO SECTION 13 OR 15(d) OF THE SECURITIES EXCHANGE ACT OF 1934 |
For the fiscal year ended December 31, 2017
OR
o | TRANSITION REPORT PURSUANT TO SECTION 13 or 15(d) OF THE SECURITIES EXCHANGE ACT OF 1934 |
For the transition period from _____ to _____.
Commission File Number 001-37458
Milacron Holdings Corp.
(Exact name of registrant as specified in its charter)
Delaware | 80-0798640 | |
(State or Other Jurisdiction of Incorporation or Organization) | (I.R.S. Employer Identification Number) | |
10200 Alliance Road, Suite 200, Cincinnati, Ohio 45242 | (513) 487-5000 | |
(Address of principal executive offices, including zip code) | (Registrant's telephone number, including area code) | |
Securities registered pursuant to section 12(b) of the Act: | ||
Title of each class: | Name of each exchange on which registered | |
Common Stock, par value $0.01 per share | New York Stock Exchange | |
Securities registered pursuant to section 12(g) of the Act: None
Indicate by check mark whether the registrant is a well-known seasoned issuer, as defined in Rule 405 of the Securities Act. Yes o No ý
Indicate by check mark whether the registrant is not required to file reports pursuant to Section 13 or Section 15(d) of the Act. Yes o No ý
Indicate by check mark whether the registrant (1) has filed all reports required to be filed by Section 13 or 15(d) of the Securities Exchange Act of 1934 during the preceding 12 months (or for such shorter period that the registrant was required to file such reports), and (2) has been subject to such filing requirements for the past 90 days. Yes ý No o
Indicate by check mark whether the registrant has submitted electronically and posted on its corporate Web site, if any, every Interactive Data File required to be submitted and posted pursuant to Rule 405 of Regulation S-T (§232.405 of this chapter) during the preceding 12 months (or for such shorter period that the registrant was required to submit and post such files). Yes ý No o
Indicate by check mark if disclosure of delinquent filers pursuant to Item 405 of Regulation S-K (§229.405 of this chapter) is not contained herein, and will not be contained, to the best of registrant's knowledge, in definitive proxy or information statements incorporated by reference in Part III of this Form 10-K or any amendment to this form 10-K. ý
Indicate by check mark whether the registrant is a large accelerated filer, an accelerated filer, a non-accelerated filer, a smaller reporting company or an emerging growth company. See the definitions of “large accelerated filer,” “accelerated filer,” “smaller reporting company,” and "emerging growth company" in Rule 12b-2 of the Exchange Act.
Large accelerated filer ý | Accelerated filer ¨ | Non-accelerated filer ¨ | Smaller reporting company ¨ | Emerging growth company ¨ | ||||
If an emerging growth company, indicate by check mark if the registrant has elected not to use the extended transition period for complying with any new or revised financing accounting standards provided pursuant to Section 13(a) of the Exchange Act. o
Indicate by check mark whether the registrant is a shell company (as defined in Rule 12b-2 of the Exchange Act). Yes o No ý
At June 30, 2017, the aggregate market value of voting stock held by non-affiliates of the registrant was approximately $816 million. In determining this amount, the registrant has assumed that its directors and executive officers are affiliates. Such assumption shall not be deemed conclusive for any other purpose.
At February 22, 2018, there were 69,832,732 common shares, $0.01 par value per share, outstanding.
Documents Incorporated by Reference
The information required to be furnished pursuant to Part III of this Form 10-K will be set forth in, and incorporated by reference from, the registrant’s definitive proxy statement for the annual meeting of stockholders (the “2018 Proxy Statement”), which will be filed with the Securities and Exchange Commission not later than 120 days after the end of the fiscal year ended December 31, 2017.
Milacron Holdings Corp.
Form 10-K
Year Ended December 31, 2017
TABLE OF CONTENTS
Page | ||
PART I | ||
ITEM 1. | ||
ITEM 1A. | ||
ITEM 1B. | ||
ITEM 2. | ||
ITEM 3. | ||
ITEM 4. | ||
PART II | ||
ITEM 5. | ||
ITEM 6. | ||
ITEM 7. | ||
ITEM 7A. | ||
ITEM 8. | ||
ITEM 9. | ||
ITEM 9A. | ||
ITEM 9B. | ||
PART III | ||
ITEM 10. | ||
ITEM 11. | ||
ITEM 12. | ||
ITEM 13. | ||
ITEM 14. | ||
PART IV | ||
ITEM 15. | ||
2
Cautionary Note Regarding Forward-Looking Statements
This Annual Report on Form 10-K contains forward-looking statements within the meaning of Section 27A of the Securities Act of 1933 and Section 21E of the Securities Exchange Act of 1934 that are subject to risks and uncertainties. All statements other than statements of historical fact or relating to present facts or current conditions contained in this Annual Report on Form 10-K are forward-looking statements. Forward-looking statements give our current expectations and projections relating to our financial condition, results of operations, plans, objectives, future performance and business. You can identify forward-looking statements by the fact that they do not relate strictly to historical or current facts. These statements may include words such as “anticipate,” “estimate,” “expect,” “project,” “plan,” “intend,” “believe,” “may,” “should,” “can have,” “likely” and other words and terms of similar meaning in connection with any discussion of the timing or nature of future operating or financial performance or other events.
The forward-looking statements contained in this Annual Report on Form 10-K are based on assumptions that we have made in light of our industry experience and our perceptions of historical trends, current conditions, expected future developments and other factors we believe are appropriate under the circumstances. As you read this Annual Report on Form 10-K, you should understand that these statements are not guarantees of performance or results. They involve risks, uncertainties (many of which are beyond our control) and assumptions. Although we believe that these forward-looking statements are based on reasonable assumptions, you should be aware that many factors could affect our actual operating and financial performance and cause our performance to differ materially from the performance anticipated in the forward-looking statements, including the risk factors discussed under the heading "Risk Factors" in Item 1A. and "Management's Discussion and Analysis of Financial Condition and Results of Operations" in Item 7. There may be other factors that may cause our actual results to differ materially from the forward-looking statements.
Should one or more of these risks or uncertainties materialize, or should any of these assumptions prove incorrect, our actual operating and financial performance may vary in material respects from the performance projected in these forward-looking statements. We caution you therefore against relying on these forward-looking statements.
Any forward-looking statement made by us in this Annual Report on Form 10-K speaks only as of the date on which we make it. Factors or events that could cause our actual operating and financial performance to differ may emerge from time to time, and it is not possible for us to predict all of them. We undertake no obligation to publicly update any forward-looking statement, whether as a result of new information, future developments or otherwise, except as may be required by law.
3
PART I
ITEM 1. BUSINESS
As used in this Annual Report on Form 10-K, "Milacron", "Company", "we", "us", "ours" refer to the registrant and its consolidated subsidiaries except where the context requires otherwise. References to “Milacron LLC” refer to Milacron LLC, our wholly owned subsidiary.
Corporate History
Milacron Inc. began operations in 1860 in Cincinnati, Ohio as a screw, tap and die manufacturer, and expanded over the subsequent decades into a leading U.S. manufacturer of milling machinery and other equipment for metal processing. In the 1940s the company expanded into metalworking fluids and in the 1960s diversified into the growing market for plastic processing equipment by developing a line of injection molding equipment. After consistent growth from the 1960s through the 1990s, the plastic processing technology industry in North America was challenged in the 2001-2009 period by a reduction of spending by its customer base. As a result of significant legacy liabilities, excess production capacity and the 2009 recession, Milacron Inc. filed for bankruptcy protection in March 2009, resulting in the sale later that year of substantially all the assets and certain liabilities and equity interests of the company to newly formed Milacron Holdings Inc. (“MHI”). In April 2012 affiliates of CCMP Capital Advisors, LLC (collectively referred to as “CCMP”), together with certain members of our management, purchased the stock of MHI, forming the current Company. Since 2012, Milacron has expanded its global manufacturing platform and product offering through acquisitions, including Mold-Masters Luxembourg Holdings S.à r.l. ("Mold-Masters") in March 2013, and in June 2015 the Company completed an initial public offering of its common stock.
Business Overview
Milacron is a global leader in the manufacture, distribution and service of highly engineered and customized systems within the plastic technology and processing industry. We are the only global company with a full-line product portfolio that includes hot runner systems, injection molding, blow molding and extrusion equipment. We maintain strong market positions across these products, as well as leading positions in process control systems, mold bases and components, maintenance, repair and operating ("MRO") supplies and fluid technology.
Milacron has strong brand recognition with products sold in over 100 countries across six continents and our established and market driven global footprint is well-positioned to benefit from continued robust industry growth in both developed and emerging markets. Our sales are geographically diversified with 51% in North America, 20% in Europe, 11% in China, 9% in India and 9% in the rest of the world for the year ended December 31, 2017. Our breadth of products, long history, and global reach have resulted in a large installed base of plastic processing machines and hot runner systems as of December 31, 2017.
We are headquartered in Cincinnati, Ohio and have 5,957 employees worldwide. Principal manufacturing facilities are located in the United States, Canada, China, Germany, the Czech Republic and India.
Operating Segments
The following is a summary of the product lines and markets served by our operating segments. In accordance with accounting principles generally accepted in the United States of America ("U.S. GAAP"), we have reported information about our three operating segments within Note 15 of the Notes to Consolidated Financial Statements, which can be found in "Item 8. Financial Statements and Supplementary Data" of this Annual Report.
Advanced Plastic Processing Technologies ("APPT")
Our APPT segment designs, manufactures and sells plastic processing equipment and systems, which include injection molding, blow molding, extrusion and auxiliary systems along with the related parts and service. We are the only full-line plastic equipment supplier with a significant offering across all three technologies in North America. We provide aftermarket service and support for our core plastic equipment business and are expanding our co-injection product suite. Our APPT segment has a diverse set of customers, including companies who serve in the consumer goods, packaging, electronics, medical, automotive and construction end markets. We believe our competitive strength in APPT is our ability to supply and support our customers through the entire life cycle of their equipment usage to deliver precision parts at the lowest cost for our customers.
Increased demand in the plastic processing machinery industry is expected to be driven by the overall expected rise in plastic processing, increasing equipment age and continuing advances in technology, such as the shift to higher efficiency and lower energy equipment, as plastic processors seek to reduce their operating costs and produce higher quality products. With 64% of APPT sales in North America, demand is also impacted by customers bringing manufacturing operations back to North America.
4
Melt Delivery and Control Systems ("MDCS")
Our MDCS segment designs, manufactures and sells highly-engineered, technically advanced hot runner and process control systems, mold bases and components, and sells MRO supplies for plastic processing operations. Hot runner systems are designed for each product a customer manufactures on an injection molding machine. Our MDCS segment derives substantially all of its sales from recurring consumable products, parts and services. Hot runner systems are product-specific and replaced frequently due to design changes and innovation in customers’ end products, driving a one to five year replacement cycle. Recurring sales for our MDCS segment is supported by a large estimated installed base of hot runner systems worldwide as of December 31, 2017.
Our MDCS segment serves a diverse group of global customers across the entire plastic processing value chain and manufacturing spectrum, including OEMs, molders and mold makers, in consumer goods, electronics, automotive, packaging and medical end markets. As injection molding processing technologies and material requirements evolve, our MDCS business is committed to partnering with its customers across the life cycle of a machine by leveraging its industry knowledge and engineering expertise to develop technologies that help its customers adapt and succeed.
Consistent with historical periods, according to an August 2017 Interconnection Consulting report, the hot runner market is expected to grow faster than the overall global economy based on macroeconomic drivers involving product life cycles, demographics, technology conversion and greater use of plastic. Demand within the hot runner market is driven more by the frequency of product design changes and model refreshes than by end product volume, because hot runner systems are typically custom ordered for each new product mold, representing a critical factor in the market’s resiliency during economic cycles.
Fluid Technologies ("Fluids")
Our Fluids segment is a global manufacturer of products that are used in a variety of metalworking processes such as cutting, grinding, stamping and forming and high speed machining. The technology we provide is used in diverse global end markets such as aerospace, medical, automotive, industrial components and machinery, bearings, munitions, packaging, job shops, and glass and mirror production. We are an established market leader in synthetic and semi-synthetic metalworking fluids and offer a full line of innovative metalworking products. Our fluid technologies are essential to improving manufacturing operations by providing more machine uptime, producing more parts of higher quality in a shorter time. We sell fluids with advanced technologies that extend tool life, reduce coolant usage and improve productivity in metal removal and metal forming operations. Our fluids are often custom-designed to meet not only stringent performance, health, safety and environmental requirements based on innovative technology, but also for specific customer application and productivity needs.
Key Drivers of our Businesses
Our strategy is designed to maximize revenue from consumable products across the life of a machine, while offering plastic technology solutions to a broad customer base. Management estimates that the value of available consumables revenue across the life of a machine is one to four times the cost of a machine. This strategy is shifting our revenue and earnings model to be more heavily weighted towards consumables. The consumables portion of our APPT and MDCS segments consists of: (1) machine aftermarket parts and service which are required annually, (2) hot runner systems and mold bases which are required each time new plastic parts are designed and existing plastic parts are redesigned and (3) upgrades and overhauls which occur as customers decide to improve the performance or extend the life of their machines. Upon a customer’s decision to replace a machine, we can repurchase the existing machine and sell it as a certified pre-owned machine. All of our sales in our Fluids segment are considered to be consumable and, when combined with our APPT and MDCS consumable product lines, consumables accounted for 64% and 63% of our sales for the years ended December 31, 2017 and 2016, respectively. We believe this percentage will increase as we capture more of our customers’ spend on consumable products through our lifecycle sales approach.
Milacron executes its strategy through selective initiatives that leverage our market position, geographic footprint and core competencies. Management expects, in the near term, profitability will be driven by both sales growth and margin expansion. Management expects that sales growth will come from underlying market growth in our key segments, geographic expansion of certain product lines and incremental share gain from new products. New products are focused on solidifying our current market position, expanding our addressable market and expanding the market through the introduction of technology that displaces other materials, primarily metal and glass. Operating margin expansion is expected to result from active organizational design and cost reduction initiatives focused on leveraging our geographic footprint that will allow us to consolidate manufacturing capacity, sales offices and call centers on a regional basis, and shift certain back-office functions from a decentralized local structure to a low-cost country global shared service center model.
5
Global population growth, coupled with continued urbanization, increased purchasing power and improved lifestyle in emerging markets has resulted in greater demand for a broad range of finished plastic products in many segments of the economy, including automotive, construction and consumer products. We believe our strong global presence positions us well to capture a portion of this growth. We have made significant investments in China and India in order to capitalize on the projected growth rates of the plastic business in these markets. We plan to continue to expand our manufacturing capabilities while also increasing our technical, marketing and sales efforts. We also continue to strategically reorganize our manufacturing base in order to shift resources to high growth geographic markets.
Cost Reduction Initiatives
Since 2014, we have undertaken a number of organizational redesign and cost reduction initiatives to improve our cost structure and operating flexibility. This includes consolidating manufacturing and back office infrastructure in North America and Europe. Milacron incurred approximately $59 million and $33 million of one-time costs related to these projects during the years ended December 31, 2017 and 2016, respectively.
See “Item 1A. - Risk Factors - Our results also depend on the successful implementation of several additional strategic initiatives. We may not be able to implement these strategies successfully, on a timely basis, or at all.”
Customers
Our customers consist of many blue-chip and Fortune 500 companies including OEMs, molders and mold-makers. Our customer base covers a wide range of end market applications including packaging, automotive, medical, construction, consumer goods and electronics. We have long-standing relationships with our key customers, having served many of our top customers for over 30 years. In 2017, our largest customer accounted for only 1.2% of total sales and our top 10 largest customers accounted for 7.9% of total sales.
Backlog
Our backlog of unfilled orders increased to $287.0 million at December 31, 2017 from $225.6 million at December 31, 2016. Excluding $15.2 million of favorable effects of foreign currency movements, backlog increased 20.5% compared to December 31, 2016. The increase in our backlog is primarily a result of strength in our equipment business in India and hot runner business in China. All of our backlog is expected to be filled within the next twelve months and there are no seasonal or other aspects of the backlog that would impact filling the orders.
Sales and Marketing
Our sales have an increasingly global focus, while maintaining regional flavor through our international brands. We have also focused our sales on key accounts, implementing corporate buying agreements with select customers while targeting several others. Our sales of aftermarket services and parts and our MDCS products benefit from our extensive global installed base of equipment, creating an advantage over our competitors in securing a wide base of customers for our high-margin offerings.
Our direct sales efforts have resulted in a more concentrated effort to promote our value-add products which may include machine upgrades to promote improved performance or cost savings for our customers. Our sales force also acts as the conduit between the customer and our team of engineers, working closely with the customer to design a product that meets their specifications. We have also created a Strategic Accounts Management sales leadership team to drive relationships with major plastic processors across our different product lines. We believe this will enhance our leadership position in the injection molding equipment market and continue to drive share gains for the overall business.
Our Fluids business sells its products primarily through its direct sales and distribution networks. In connection with most accounts, the segment supports its fluids with service and analysis, but generally does not enter into contracts for chemical management. We continuously work with customers to reformulate our products to best serve their individual needs.
We do not typically have long-term supply agreements with customers and terms are generally negotiated on an individual order basis. We typically require customers purchasing injection molding, blow molding or extrusion machines to make a 10% to 40% down payment when an order is placed, often with a series of additional progress payments required prior to shipment which helps ensure collection of the full purchase price. Pricing is set at the time of order, typically on a customized basis for each product. Raw materials and component purchases are managed based on new machine order trends, allowing us to reduce the risk of changes in raw material and components pricing.
6
Raw Materials
Steel, which we source both directly and indirectly through our component suppliers, is the primary material used in our APPT and MDCS products. We do not enter into derivative financial instruments to hedge our commodity price risk and currently do not have a significant number of long-term supply contracts with key suppliers. In order to secure our supply needs, we have developed a global network of reliable, low-cost suppliers.
Within Fluids, many of the raw materials are derivatives of petroleum or natural gas. As a result, fluctuations in commodity-based pricing may impact the cost of these materials. We manage the impact of raw material cost increases through sales pricing adjustments, but we may be impacted by a delay in implementing these adjustments throughout our distribution network. In addition, due to the specialty nature of our products, some of our raw materials have few sources, and we may be impacted by disruptions to supply. Where possible, we seek alternative sources and, in some situations, we are able to reformulate product with alternative materials without impacting performance, environmental, or health and safety features.
Intellectual Property
Milacron considers its intellectual property, including patents, trade secrets, and trademarks, to be of significant value to its business as a whole. We currently hold approximately 1,100 issued and pending patents worldwide. In addition to our patent portfolio we also have a number of trade secrets and know how relating to our MDCS products, designs, and manufacturing techniques as well as proprietary chemical formulations used in our Fluids business. All of which, when combined, serve an important role in protecting us and our customers’ competitive positions by building barriers to entry and increasing switching costs. We develop new intellectual property on an ongoing basis and consider all of our intellectual property to be valuable. We are committed to protecting it through internal policies and training, confidentiality agreements with employees, customers and suppliers, as well as filing and obtaining patents for innovative new products and processes including product modifications and improvements.
Research and Development
We continually invest in research and development to improve the performance of existing products, to bring new products to market and to remain at the technological forefront of the plastic processing, melt delivery and controls and metalworking fluids industries. We have design engineers in all major production regions worldwide, including a global design center in India and research and development centers in the United States and Canada. We invested $17.1 million, $21.1 million and $21.8 million in research and development for the years ended December 31, 2017, 2016 and 2015, respectively.
Competition
Our competition varies within each segment based on the nature of our products, the industries we serve and geographical locations.
Advanced Plastic Processing Technologies
In general, plastic equipment competitors are large companies that compete with us on a global basis. Some are divisions of larger companies, and some offer an extensive range of plastic processing machines. Our main machine competitors are Arburg (Germany), Battenfeld Cincinnati (Austria, which includes American Maplan (United States)), Bekum (Germany), Davis Standard (United States), Engel (Austria), Graham Engineering (United States), Haitian International Holdings (China), Husky (Canada), Krauss Maffei (Germany, which includes Netstal Maschinen AG (Switzerland)), Sumitomo Heavy Industries (Japan) and Toshiba (Japan).
Melt Delivery and Control Systems
The hot runner and mold industry is highly fragmented. The majority of the industry competes on regional and niche levels, with only a few truly global players. Our main competitors in the MDCS market are Husky (Canada), Yudo (Korea), Synventive (United States), Manner (Germany), Ewikon (Germany), Incoe (United States), Thermoplay (Italy), Gamaflux (United States) and HRS Flow (Italy) for the hot runner market and LKM (China), Futaba (Japan), Hasco (Germany), Meusburger (Austria), Misumi (Japan, which includes PCS (United States)) and Progressive (United States) for the moldbase market.
Fluid Technologies
Our Fluids segment competes with other suppliers of industrial fluids such as Castrol Industrial (U.K.), FUCHS Petrolub (Germany), Quaker Chemical (United States) and Houghton/DA Stuart (United States), which was acquired by Gulf Oil of India. However, because we specialize in high-performance synthetic (water-based) and semi-synthetic fluids, we believe there are few players who compete directly with our Fluids business.
7
Seasonal Variation in Business
Generally, the highest volume of our APPT equipment sales occurs in our fourth quarter due in large part to the timing of customers' capital spending programs. Accordingly, first quarter equipment sales volume is typically the lowest of the year due to timing of customers' capital spending programs. There is less seasonal variation in business within the MDCS and Fluids segments due to the consumable nature of those products.
Employees
As of December 31, 2017, Milacron had 5,957 employees. Approximately 550 of our European employees belong to works councils or are otherwise subject to labor agreements.
Environmental and Regulatory Matters
We are subject to laws, regulations and permitting requirements relating to the protection of the environment and public and workplace health and safety, including those governing discharges of pollutants to the air and water, the management and disposal of hazardous substances and wastes, the clean-up of contaminated sites and the protection of employee health and safety. Failure to comply with, or imposition of liability under, such laws and regulations could result in significant costs, including clean-up costs, fines and sanctions, and claims by third parties for property damage and personal injury. Some environmental laws impose strict, and in certain circumstances joint and several, liability on present and former owners and operators of facilities and sites for contamination at those locations. Many of our facilities and sites have an extended history of industrial use. From time to time, soil or groundwater contamination has been detected at some of our sites. In the past we have been engaged in investigation and remediation of these facilities. We do not currently believe that any future remediation or compliance costs, or claims of government or other parties, involving environmental, health or safety matters would have a material adverse effect on our business. However, it is not possible to quantify with certainty the potential impact of actions relating to environmental, health and safety matters, particularly remediation and other compliance efforts that our subsidiaries may undertake in the future, due to uncertainties about the status of laws, regulations, technology and information related to individual sites.
Executive Officers
Information required with respect to the Company's executive officers and directors will be included in the Company's 2018 Proxy Statement and is incorporated herein by reference.
The following table sets forth the name, age and principal position with the Company of each of our executive officers as of December 31, 2017:
Name | Age | Position | ||
Thomas Goeke | 58 | President, Chief Executive Officer and Director | ||
Bruce Chalmers | 51 | Chief Financial Officer | ||
Thomas Goeke was appointed Chief Executive Officer of Milacron in September 2012 and has served as President from September 2012 to April 2016 and July 2017 to the present. Mr. Goeke previously served as Chief Operating Officer of Seakeeper Inc. from October 2011 to June 2012 and as Chief Executive Officer of Klöckner Pentaplast Group from July 2005 to May 2011.
Bruce Chalmers was appointed Chief Financial Officer in November 2014, and prior to that, he was our Vice President, Finance since January 2014. Mr. Chalmers also heads our finance and shared service function. Most recently, Mr. Chalmers served as Chief Financial Officer of MetoKote Corporation, Inc. from 2012 until 2014. Prior to that, he served as a Managing Director at PricewaterhouseCoopers in their transaction services practice where he was employed from 2006 until 2012.
Available Information
Milacron makes available, free of charge, through its website the Company’s Annual Report on Form 10-K, quarterly reports on Form 10-Q, current reports on Form 8-K and any amendments to those reports as soon as reasonably practicable after such material is electronically filed with or furnished to the Securities and Exchange Commission. These documents are available through the Investor Relations page of the Company’s website at www.milacron.com.
8
ITEM 1A. RISK FACTORS
In addition to the other information set forth in this Annual Report on Form 10-K, you should carefully consider the following factors that could have a material adverse effect on our business, financial condition, results of operations or the price of our common stock. The following information should be read together and in conjunction with "Cautionary Statement Regarding Forward-Looking Statements," "Item 1. Business," "Item 7. Management's Discussion and Analysis of Financial Condition and Results of Operations," our consolidated financial statements and the accompanying notes thereto. The risks below are not the only risks we face. Additional risks and uncertainties not currently known to us or that we currently deem to be immaterial may also adversely affect our business, financial condition, results of operations or the price of our common stock.
Demand for our products is affected by general economic conditions, including our customers’ industries and capital expenditures, consumer spending trends and other macroeconomic conditions.
Our business is affected by general economic conditions. Any uncertainty or adverse changes such as turmoil in global economic and political conditions, including through rising interest rates or inflation, commodity prices, high unemployment, increased volatility in global capital markets, international conflicts, sovereign debt concerns and/or other factors beyond our control, could lead to a significant decline in demand for our products. In addition, the success of our business depends on the profitability of our customers’ businesses. Many of our customers are in businesses that are cyclical in nature and sensitive to changes in general economic conditions, such as the packaging, automotive, industrial machinery, construction, consumer goods, electronics and medical industries. The performance of our business is directly related to the production levels of our customers. In particular, prices for plastic resins used to make plastic products and parts tend to fluctuate to a greater degree than our customers can adjust for in the pricing of their products. When resin prices increase, our customers’ profit margins decrease, which may result in lower demand for our products. Therefore, our business is affected by fluctuations in the price of resin, which could have an adverse effect on our business and ability to generate operating cash flows.
In addition, deterioration in the credit quality of our customers or the estimated residual value of our equipment could negatively impact the ability of our customers to obtain the resources they need to make purchases of our equipment. If our customers cannot access credit markets or do not utilize discretionary funds to purchase our products and services as a result of the economy or other factors, our business could suffer. Moreover, any prolonged periods of decline in our customers’ capital expenditures could have a material adverse effect on our business, financial condition or results of operations.
If the use of plastic declines, it could have a material adverse effect on our business, financial condition or results of operations.
Approximately 90% of our 2017 sales were realized from the sale of equipment and services to the plastic processing market. A reduction in the usage of plastic would likely result in the reduction of our sales of equipment and services, which could have a material adverse effect on our business, financial condition or results of operations. Factors that could result in a decline in the usage of plastic include, but are not limited to the following:
• | The relative cost of plastic compared with other materials, such as glass, metal and paper. The principal cost of plastic is petroleum-based resins and fluctuations in the price of crude oil and natural gas typically impact the price of these resins. If the price of plastic resins were to increase substantially or the cost associated with other competing materials such as glass, metal and paper, were to materially decrease, the plastic products of our customers may no longer be economically competitive relative to other alternatives. |
• | The environmental impact of plastic may be perceived negatively by environmental groups, customers and government regulators. A number of governmental authorities and advocacy groups have lobbied for and considered, or are expected to consider, legislation aimed at addressing the environmental impacts of plastic. These proposals have included mandating certain rates of recycling and/or the use of recycled materials, imposing deposits or taxes on plastic packaging material, requiring retailers or manufacturers to develop a recycling infrastructure and increased scrutiny on the use of plastic. Legislative and other changes aimed at reducing the environmental impact of plastic may result in increased costs associated with plastic and/or reduced demand for plastic. |
Any of the foregoing factors as well as other factors, including those unknown to us, could result in a decline in the usage of plastic which could have a material adverse effect on our business, financial condition or results of operations.
9
We operate in highly competitive industries, many of which are currently subject to intense price competition, and if we are unable to compete successfully, it could have a material adverse effect on our business, financial condition and results of operations.
Many of the industries in which we operate are highly competitive. Our products may not compete successfully with those of our competitors. The markets for plastic processing equipment and related products, mold components and metalworking fluids are highly competitive and include a number of North American, European and Asian competitors. Principal competitive factors in the plastic processing industry include price, product features, technology, performance, reliability, quality, delivery and customer service. Principal competitive factors in the mold components industry include technology, price, quality, performance and delivery. Principal competitive factors in the metalworking industrial fluids industry include price, market coverage, technology, performance, delivery and customer service.
Our competitors may be positioned to offer more favorable pricing to customers, resulting in reduced profitability and a loss of market share for us. In certain cases we have lost business to competitors who offered prices lower than ours. Competition may also limit our ability to pass on the effects of increases in our cost structure. In addition, some of our competitors may have greater financial resources and less debt than we do, which may place us at a competitive disadvantage in the future. These competitors may be better able to withstand and respond to changes in conditions within our industry.
Competition in any of these areas may reduce our sales and adversely affect our earnings and/or cash flow by resulting in decreased sales volumes, reduced prices and increased costs of manufacturing, distributing and selling our products.
Our results also depend on the successful implementation of several additional strategic initiatives. We may not be able to implement these strategies successfully, on a timely basis, or at all.
We have implemented and continue to implement several strategic initiatives that are designed to increase our cost savings and revenue, transform our business and improve our performance. These initiatives include expanding low-cost production capabilities and consolidation of facilities, continued back-office integration to a shared service center and implementation of lean sourcing initiatives. The success of our recent initiatives is subject to both the risks affecting our business generally and the inherent difficulty associated with implementing these initiatives, and is largely dependent on the skills, experience, and efforts of our management and other employees. We face a number of uncertainties in connection with the successful implementation of these strategic initiatives. As a result, we may not be successful in implementing these initiatives nor realize anticipated cost savings and increases in sales. If we are unsuccessful in implementing these initiatives, our financial condition, results of operations and cash flows could be adversely affected.
Increases in our cost structure or disruption in our supply chain could have a material adverse effect on our results of operations and cash flows.
Our costs are subject to fluctuations, particularly for raw materials and purchased components used in our business, including the cost of labor and steel and the cost of oil and chemicals used in the production of metalworking fluids. Our success is dependent, in part, upon our ability to manage these fluctuations through pricing actions, cost savings projects and global sourcing actions. While we have historically responded by reducing our cost structure and increasing the prices we charge our customers, these measures may not always be sufficient to offset the effects of the cost increases we experience. Accordingly, market changes in raw material and purchased component prices could have a material adverse effect on our results of operations and cash flows.
Additionally, we have developed a network of third-party vendors who supply certain parts and components for our products. While we currently believe that these third-party vendors represent a low-cost source of supply, their costs could rise in the future and we may not be able to effectively source or produce these components and parts. Significant disruptions to our supply chain could limit our ability to source parts and components on a cost effective basis, if at all, and could have a material adverse effect on our business, financial condition or results of operations.
Our significant international operations subject us to risks such as unfavorable political, regulatory, labor and tax conditions.
Our business is subject to risks related to the different legal, political, social and regulatory requirements and economic conditions of many jurisdictions. We have operations in many foreign countries, including, but not limited to, countries in Europe and Asia. For the year ended December 31, 2017, markets outside North America represented the following percentages of our sales: Asia 26%; Europe 20%; and the rest of the world 3%. In addition, as of December 31, 2017, approximately 72% of our workforce was located outside the United States.
10
Additional risks associated with our international operations include, but are not limited to the following:
• | agreements may be difficult to enforce and receivables difficult to collect through a foreign country’s legal system; |
• | foreign countries may impose additional withholding taxes or otherwise tax our foreign income, attempt to impose transfer taxes on past or future corporate level transactions, impose tariffs or adopt other restrictions on foreign trade or investment, including currency exchange controls; |
• | general economic and political conditions or instability in the countries in which we operate could have an adverse effect on our earnings from operations in those countries; |
• | restrictions on or costs relating to the repatriation of foreign profits to the United States, including possible taxes or withholding obligations; |
• | differing, and possibly more stringent, labor regulations; |
• | natural disasters, pandemics or international conflict, including terrorist acts, could interrupt the manufacturing of our products or performance of services, endanger our personnel or cause delays; |
• | enforcement of anti-bribery laws, including the U.S. Foreign Corrupt Practices Act of 1977, as amended, (the “FCPA”), the U.K. Bribery Act (the “UKBA”) and similar laws, economic sanctions laws, regulations and regimes (including those administered by the Office of Foreign Assets Control (“OFAC”) of the U.S. Department of the Treasury), and other international laws and regulations; |
• | the difficulties of staffing and managing dispersed international operations; |
• | less protective foreign intellectual property laws; |
• | unexpected adverse changes in foreign laws or regulatory requirements may occur; |
• | longer customer payment cycles; and |
• | legal systems that may be less developed and less predictable than those in the United States. |
We are also subject to numerous regulations in the jurisdictions in which we operate, including customs and international trade laws, export control, antitrust laws and zoning and occupancy laws that regulate producers generally and/or govern the importation, exportation, promotion and sale of our products, the operation of facilities and our relationships with our customers, suppliers and competitors. If these regulations or laws were to change or were violated by our management, employees, suppliers or agents, the costs of certain goods could increase, or we could experience delays in shipments of our goods, be subjected to fines or penalties or suffer reputational harm, any of which could reduce demand for our products and negatively impact our business and results of operations. In addition, changes in national and local minimum wage laws and other laws relating to employee benefits could cause us to incur additional wage and benefits costs, which could negatively impact our profitability.
Our overall success as a global business depends, in part, upon our ability to succeed in differing and unpredictable legal, regulatory, economic, social and political conditions. We may not be able to continue to succeed in developing and implementing policies and strategies that will be effective in each foreign market where we do business. Any of the foregoing factors may have a material adverse effect on our ability to generate cash flow and grow our business.
Our operations partly depend on the rate of economic development and growth in the emerging markets of Asia, Africa, Central America and South America.
Our operations partly depend upon the economies of the Asian, African, Central American and South American markets. These markets include countries with economies in various stages of development or structural reform, some of which are subject to rapid fluctuations in terms of consumer prices, employment levels, gross domestic product, interest rates and foreign exchange rates. Our operations in these markets may also be subject to risks relating to weak legal systems which may affect our ability to enforce our intellectual property and contractual rights, exchange controls, unstable governments and privatization, changes in customs or tax regimes, or other government actions affect the flow of goods and currency. To the extent such fluctuations and risks have an effect on the ability of our consumers to pay for our products, the growth of sales of our products in such markets could be impacted negatively.
11
Our operations are conducted worldwide and our results of operations are subject to currency translation risk and currency transaction risk that could have a material adverse effect on our financial condition and results of operations.
Since a significant portion of our sales are made in currencies other than the U.S. dollar, our financial results are affected by currency fluctuations. The financial condition and results of operations of each of our foreign operating subsidiaries are reported in the relevant local currency and then translated to U.S. dollars at the applicable currency exchange rate for inclusion in our consolidated financial statements. Exchange rates between these currencies, including the Canadian dollar, the Euro, Chinese yuan renminbi, Indian rupee and the U.S. dollar in recent years have fluctuated significantly and may do so in the future.
For the year ended December 31, 2017, approximately 48% of our sales were in currency other than the U.S. dollar. Significant changes in the value of the Canadian dollar, Euro, Chinese yuan renminbi and Indian rupee relative to the U.S. dollar could have an adverse effect on our financial condition and results of operations. If the Canadian dollar, Euro, Chinese yuan renminbi or Indian rupee should weaken against the U.S. dollar in the future, we will experience a negative effect in translating our new orders, sales and earnings when compared to historical results. In addition to currency translation risks, we incur currency transaction risk whenever one of our operating subsidiaries enters into either a purchase or a sales transaction using a different currency from the currency in which it records sales. See “Item 7A. Quantitative and Qualitative Disclosure about Market Risk—Foreign Currency Exchange Rate Risk.” Given the volatility of exchange rates, we may not be able to effectively manage our currency transaction and translation risks and any volatility in currency exchange rates may have a material adverse effect on our business, financial condition or results of operations.
We might not be able to timely develop, manufacture and gain market acceptance of new and enhanced products required to maintain or expand our business.
Our success in the future will depend in part upon our ability to maintain and enhance our technological capabilities, develop and market products and applications that meet changing customer needs and successfully anticipate or respond to technological changes of our competitors in a cost-effective and timely manner. Difficulties or delays in identifying viable new products, research, development or production of new products or failure to gain regulatory approval, intellectual property protection or market acceptance of new products and technologies may reduce future sales and adversely affect our competitive position. Our competitors may develop other patent technologies that are more effective or commercially attractive than our current or future technologies or render our technologies or services less competitive or obsolete. Our inability to anticipate, respond to or utilize changing technologies could cause us to lose customers.
Our business, financial condition and results of operations could be adversely impacted by business disruptions, security threats and security breaches.
Business disruptions, including supply disruptions, increasing costs for energy, temporary plant and/or power outages and network disruptions, could harm our operations as well as the operations of our customers, distributors or suppliers. In addition, the operation of our business relies on information technology (“IT”) infrastructure and systems on multiple platforms to process, transmit and store electronic information, and to support a variety of business processes and activities. We face security threats and risks of security breaches to our facilities, data and IT infrastructure. Although it is impossible to predict the occurrence or consequences of business disruptions, security threats or security breaches, they could harm our reputation, subject us to material liabilities, result in reduced demand for our products, make it difficult or impossible for us to deliver products to our customers or distributors or to receive raw materials from suppliers, compromise our networks, subject us to liability or regulatory penalty under laws protecting the privacy of personal information and create delays and inefficiencies in our supply chain. Further, the failure of our systems to perform could severely disrupt our business and adversely affect our results of operations. Our systems are also vulnerable to natural or man-made disasters, computer viruses or hackers, power loss or other technology system failures. We may also be required to incur significant costs to protect against damage caused by these disruptions or security breaches in the future. These events could have a material adverse effect on our business, financial condition or results of operations.
We may not be able to adequately protect our intellectual property and proprietary rights and our products could infringe on the intellectual property of others, which could harm our future success and competitive position.
Our future success and competitive position depend in part upon our ability to obtain and maintain certain proprietary technologies used in our principal products. We may not always be successful in preventing the unauthorized use of our existing intellectual property rights by our competitors. We may not be able to discover unauthorized use of our proprietary technologies in the future or be able to receive any payments therefor. If we are not successful in protecting our intellectual property, it may result in the loss of valuable technologies or require us to make payments to other companies for infringing on their intellectual property rights. We generally rely on patent, trade secret and copyright laws as well as confidentiality agreements with other parties to protect our technologies; however, some of our technologies may not be adequately protected. Confidentiality agreements may be breached or terminated, and we may not have adequate remedies for any breach. A third party could copy or otherwise obtain and use our products or technology without authorization.
12
Additionally, third parties may assert infringement or other intellectual property claims against us based on their patents or other intellectual property rights. Litigation may be necessary for us to defend against claims of infringement or to protect our intellectual property rights and could result in substantial cost to us and diversion of our efforts. Further, we might not prevail in such litigation, which could harm our business and could result in us having to obtain a license to sell our products or pay substantial royalties. Our failure to obtain or maintain adequate protection of our intellectual property rights for any reason could have a material adverse effect on our business, results of operations and financial condition.
We have applied for patent protection relating to certain existing and proposed products, processes and services. While we generally apply for patents in those countries where we intend to make, have made, use, or sell patented products, we may not accurately predict all of the countries where patent protection will ultimately be desirable. If we fail to timely file a patent application in any such country, we may be precluded from doing so at a later date. The patents issued as a result of our foreign patent applications may not have the same scope of coverage as our U.S. patents. Further, competitors may infringe on our patents and we may not have adequate resources to enforce our patents. We may also have any of the following occur:
• | any of our patents could be invalidated, circumvented or challenged; |
• | any of our pending or future patent applications could fail to be issued within the scope of the claims sought by us, if at all, and patents issued from such applications may not be of sufficient scope or strength to provide us with any meaningful protection or commercial advantage; |
• | others may develop technologies that are similar or superior to our technologies, duplicate our technologies or design around our patents; or |
• | steps taken by us to protect our technologies may not prevent misappropriation of such technologies. |
We also own or have rights to various trademark registrations and trademark registration applications in the United States and certain international jurisdictions that we use in connection with our business. Monitoring unauthorized use of our trademarks is difficult and expensive, and we may not be able to prevent misappropriation of our trademark rights in all jurisdictions, particularly in countries whose laws do not grant the same protections as the United States grants.
Our financial results are impacted by unpredictable customer purchasing trends and the timing of converting orders into sales can lead to variations in, and uncertainties regarding, our financial results from period to period.
Sales of our plastic processing machinery products are subject to customer buying patterns and can vary from period to period. We sometimes have sales to customers that are large relative to our sales in any given period. Fluctuations in demand for our plastic processing machinery products due to large unpredictable sales to customers and delays or failures to fulfill purchase orders could lead to variations in, and uncertainties regarding, our financial results from period to period. In addition, our plastic processing machinery sales are impacted by the timing of orders and the length of time required to convert these unshipped orders, or backlog, into sales, which varies based on the type of customer and product and can range from several weeks to several months.
Our inability to satisfy orders on a timely basis could have a material adverse effect on our business, results of operations and financial condition and the conversion of our backlog and open orders into sales may occur at a slower rate than historical trends.
Our backlog as of December 31, 2017 was $287.0 million. This backlog is based upon anticipated sales revenue from confirmed orders. The majority of our plastic processing machinery products are produced after a price has been agreed to, an order has been received and a deposit has been paid by our customers and generally require delivery within a specified period of time. If we are unsuccessful in recruiting skilled labor, experience delays in purchase component deliveries or experience changes in customer specifications on ordered equipment, the rate at which backlog or open orders are converted into sales may be slower than we have historically experienced. If it takes longer than expected to realize sales, our results of operations and financial condition may be materially and adversely affected. Additionally, any failure to deliver products on a timely basis could result in our customers cancelling their orders, requesting discounts or ceasing to do business with us altogether. Furthermore, the portion of our backlog that may be produced in our foreign subsidiaries is exposed to fluctuations in the applicable foreign currencies, which may be material. The historical relationship of backlog to sales actually realized by us should not be considered indicative of future results. See “Item 7. Management’s Discussion and Analysis of Financial Condition and Results of Operations - New Orders and Backlog.”
13
Our operations depend on our ability to maintain production at our facilities.
Our operations may be subject to disruption due to extreme weather conditions, floods, fire, natural disaster, war, terrorist activity, sustained mechanical failure and similar events, major industrial accidents, strikes and lockouts, new laws or regulations, changes in interpretations of existing laws or regulations or changes in governmental enforcement policies, regulatory actions and other events. Any disruption resulting from any of these events could cause significant delays in shipments of products and the loss of sales and customers and we may not have insurance to adequately compensate us. Our facilities and the manufacturing equipment located in our facilities would be difficult to replace and could require substantial replacement lead time. Furthermore, due to the concentration of our operations, a closure of one of our manufacturing facilities could have a substantial negative effect on our results of operations. Our business, financial condition or results of operations could be materially and adversely affected by any prolonged interruption of all or a substantial portion of our business.
If our products fail to perform or fail to meet customer requirements or expectations, we could incur significant additional costs.
The production of some of our products involves highly complex processes. Our customers specify quality, performance and reliability standards that we must meet. If our products do not meet these standards, we may be required to replace or rework the products. In some cases, our products may contain undetected defects or flaws that only become evident after shipment. In the past, we have proactively replaced parts in the field that have experienced a high rate of failure.
We also may be the target of product liability lawsuits. If a person were to bring a product liability suit against one of our customers, this customer may attempt to seek contribution from us. A person may also bring a product liability claim directly against us. A successful product liability claim or series of claims against us in excess of our insurance coverage for payments, for which we are not otherwise indemnified, could have a material adverse effect on our business, financial condition or results of operations. In addition, we may not be able to continue to maintain our existing insurance or obtain comparable insurance at a reasonable cost, if at all, in the event a significant product or service claim arises. A significant product liability case could also result in adverse publicity, damage to our reputation and a loss of customer confidence in our products.
We could be subject to litigation that could have an adverse effect upon our business, financial condition, results of operations or reputation.
From time to time we are a defendant in or otherwise a party to certain lawsuits and other proceedings that result from, and are incidental to, the conduct of our business. These suits and proceedings may concern issues including product liability, employment, antitrust, warranty and contractual disputes, environmental matters, and intellectual property matters. In addition, various factors or developments can lead to changes in current estimates of liabilities such as a final adverse judgment, significant settlement or changes in applicable law. A future adverse ruling or unfavorable development could result in future charges that could have a material adverse effect on us. While it is not feasible to predict the outcome of all pending or future suits, claims and proceedings, the ultimate resolution of these matters could have a material adverse effect upon our business, financial condition, results of operations or reputation.
Our business depends on attracting and retaining qualified management personnel.
The unanticipated departure of any key member of our management team could have an adverse effect on our business. Given our relative size and the breadth of our global operations, there are a limited number of qualified management personnel to assume the responsibilities of management level employees should there be management turnover. Our success depends to a significant extent upon a number of key employees, including members of senior management. The loss of the services of one or more of these key employees could have a material adverse effect on our results of operations and prospects. In addition, because of the specialized and technical nature of our business, our future performance depends on the continued service of, and our ability to attract and retain qualified management, commercial and technical personnel. Competition for such personnel is intense, and we may be unable to continue to attract or retain such personnel to support our growth and operational initiatives and replace executives who retire or resign. Failure to retain our leadership team and attract and retain other important management and technical personnel could place a constraint on our growth and operational initiatives, which could have a material adverse effect on our sales, results of operations and product development efforts and eventually result in a decrease in profitability.
14
Our operations may subject us to potential responsibilities and costs under environmental laws that could have a material adverse effect on our business, financial condition or results of operations.
Our operations are subject to environmental and health and safety laws, regulations and permitting requirements in the United States and abroad relating to the protection of the environment and health and safety matters, including those governing discharges of pollutants to the air, soil and water, the management, treatment, storage and disposal of, and exposure to, solid and hazardous substances and wastes, the investigation and clean-up of contaminated sites and the protection of employee health and safety. Environmental, health and safety regulations and standards are becoming increasingly strict, which could require us to make potentially significant capital or operating expenditures to comply with such standards. In addition, we could incur significant costs, including fines and sanctions, and claims by third parties for property damage and personal injury, as a result of violations of these laws and regulations.
Certain environmental laws, in the jurisdictions in which we operate, including the Comprehensive Environmental Response, Compensation and Liability Act (“CERCLA”), in the United States, impose joint and several liability for cleanup costs, without regard to fault, on current and former owners of property that has been impacted by a release of a hazardous substance or on persons who have disposed of, arranged for the disposal of or released hazardous substances into the environment. We have been involved in remedial investigations and actions at various locations, and could in the future become involved in such matters at current or former facilities or off-site disposal sites. An adverse result in any potential future matter could materially and adversely affect our business, financial position and results of operations.
Terrorist attacks, other acts of violence or war, natural disasters, political unrest or other uncommon global events may affect the markets in which we operate and our profitability.
Terrorist attacks, other acts of violence or war, natural disasters, political unrest or other uncommon global events may negatively affect our operations. There could be further terrorist attacks against the United States or other locations where we do business. Also, other uncommon global events, such as earthquakes, fires and tsunamis, cannot be predicted. Terrorist attacks, other acts of violence or armed conflicts and natural disasters may directly impact our physical facilities or those of our suppliers or customers. Additional terrorist attacks or natural disasters may disrupt the global insurance and reinsurance industries with the result that we may not be able to obtain insurance at historical terms, pricing and levels for all of our operations.
Furthermore, any of these events may make travel and the transportation of our supplies and products more difficult and more expensive and ultimately affect the sales of our products. The consequences of terrorist attacks, other acts of violence or armed conflicts, natural disasters or other uncommon global events are unpredictable, and we may not be able to foresee events, such as these, that could have a material adverse effect on our business, financial condition and results of operations.
Work stoppages or unionization activities could disrupt our operations.
As of December 31, 2017, approximately 550 members (9% of our total number of employees) of our European workforce belong to work councils or are otherwise subject to labor agreements. These employees are primarily members of the European Works Council, as is standard practice in the region. None of our other employees were represented by unions, although it is possible that our workforce will become unionized in the future. Unionization activities could increase our costs, which could have a material adverse effect on our business, financial condition or results of operations.
We may be subject to work stoppages and may be affected by other labor disputes. A work stoppage at one or more of our plants may have a material adverse effect on our business, financial condition or results of operations. Additionally, a work stoppage at one or more of our customers or our customers’ suppliers could materially adversely affect our operations if an alternative source of supply were not readily available. Stoppages by employees of our customers also could result in reduced demand for our products and have a material adverse effect on our business.
Governmental authorities may question our intercompany transfer pricing policies or change their laws in a manner that could increase our effective tax rate or otherwise harm our business.
As a U.S. company doing business in international markets through subsidiaries, we are subject to foreign tax and intercompany transfer pricing laws, including those relating to the flow of funds between the parent and subsidiaries. Regulators in the United States and in foreign markets closely monitor our corporate structure and how we account for intercompany fund transfers. If regulators challenge our corporate structure, transfer pricing mechanisms or intercompany transfers, our operations may be negatively affected and our effective tax rate may increase. Tax rates vary from country to country and if regulators determine that our profits in one jurisdiction should be increased, we may not be able to fully utilize all foreign tax credits that are generated, which would increase our effective tax rate. We may not be in compliance with all applicable exchange control and transfer pricing laws despite our efforts to be aware of and to comply with such laws. Further, if these laws change, we may need to adjust our operating procedures, and our business could be materially and adversely affected.
15
We are exposed to a number of different tax uncertainties, which could have a material adverse effect on our results of operations.
We are required to pay taxes in multiple jurisdictions. We determine the tax liability we are required to pay based on our interpretation of applicable tax laws and regulations in the jurisdictions in which we operate.
We may be subject to unfavorable changes, including retroactive changes, in the tax laws and regulations to which we are subject. For example, on December 22, 2017, the Tax Cuts and Jobs Act of 2017 (the “Tax Act”) was signed into law in the United States. The changes in the Tax Act are broad and complex and we continue to examine the impact the Tax Act may have on our business and financial results. Among its many provisions, the Tax Act reduces the corporate tax rate to 21%, repeals the alternative minimum tax, limits the interest deduction, enhances the expensing of capital investments, implements a dividend exemption system, eliminates the deferral of foreign earnings, provides a minimum tax on low-taxed foreign earnings and new measures to deter base erosion. In accordance with applicable SEC guidance, we recorded a provisional net income tax benefit in the fourth quarter of 2017 resulting from the enactment of the Tax Act. This provisional benefit is subject to change, possibly materially, due to, among other things, changes in estimates, interpretations and assumptions we have made, changes in Internal Revenue Service interpretations, the issuance of new guidance, legislative actions, changes in accounting standards or related interpretations in response to the Tax Act and future actions by states within the United States that have not currently adopted the Tax Act.
We are subject to tax audits by governmental authorities in the United States and numerous non-U.S. jurisdictions, which are inherently uncertain. Negative or unexpected results from one or more such tax audits could adversely affect our results of operations. Tax controls and changes in tax laws or regulations or the interpretation given to them may expose us to negative tax consequences, including interest payments and potential penalties, which could have a material adverse effect on our results of operations.
Our ability to use our net operating loss carryforwards might be limited.
As of December 31, 2017, we had net operating loss carryforwards of approximately $136.5 million for U.S. federal income tax purposes. These loss carryforwards will expire in varying amounts through 2029. To the extent these net operating loss carryforward are available, we intend to use them to reduce the corporate income tax liability associated with our operations. Section 382 of the Internal Revenue Code ("Section 382") generally imposes an annual limit on the amount of net operating loss carryforwards that might be used to offset taxable income when a corporation has undergone significant changes in stock ownership. As a result, prior or future changes in ownership could put limitations on the availability of our net operating loss carryforwards. In addition, our ability to use the current net operating loss carryforwards might be further limited by the issuance of common stock in the future. To the extent our use of net operating loss carryforwards is significantly limited, our income could be subject to corporate income tax earlier than it would if we were able to use net operating loss carryforwards, which could result in lower profits.
We have determined that we have experienced multiple ownership changes under Section 382 in prior years. As of December 31, 2017, we have not completed a formal study to determine whether there are Section 382 limitations as a result of ownership changes that occurred during the year ended December 31, 2017. Depending on the results of that study, there could be a material adverse effect on our results of operations.
We have a history of net losses and may not maintain profitability in the future.
We have not been consistently profitable on a quarterly or annual basis. While we generated net earnings of $1.1 million and $30.5 million for the years ended December 31, 2017 and 2016, we incurred a net loss of $38.8 million for the year ended December 31, 2015. We have historically incurred net losses and may continue to incur losses for the foreseeable future. We may not be able to sustain or increase our growth or profitability in the future. We may incur significant losses in the future for a number of reasons, including the other risks and uncertainties described in this Annual Report on Form 10-K. Additionally, we may encounter unforeseen operating expenses, difficulties, complications, delays and other unknown factors that may result in losses in future periods. If these losses exceed our expectations or our growth expectations are not met in future periods, our financial performance will be affected adversely.
16
Downturns in the economy and disruptions in the financial and credit markets may negatively affect our ability to raise capital to fund capital expenditures, pursue proposed expansion or acquisition opportunities or refinance our indebtedness.
Our businesses are capital intensive. We rely on earnings and cash flow from operations to finance our business, capital expenditures, expansion and acquisitions and, to the extent that we cannot fund such expenditures from cash generated by operations, funds must be borrowed or otherwise obtained. We will also be required in the future to refinance our outstanding debt. Downturns in the economy and disruptions in the financial and credit markets have periodically made it more difficult and more expensive to raise capital. Our ability to effectively operate and grow our businesses may be constrained if we are unable to borrow additional capital or refinance existing borrowings on reasonable terms. If we do not have access to credit or capital markets at desirable times or at rates that we would consider acceptable, the lack of such funding could have a material adverse effect on our business, results of operations and financial condition and our ability to service our indebtedness.
If we are not able to maintain and enhance our brand, or if events occur that damage our reputation and brand, our ability to maintain and expand our base of customers may be impaired, and our business and financial results may be harmed.
We believe that the Milacron brand has significantly contributed to the success of our business. We also believe that maintaining and enhancing our brand is critical to maintaining and expanding our base of customers. Maintaining and enhancing our brand will depend largely on our ability to continue to provide useful, reliable, trustworthy and innovative products, which we may not do successfully. We may introduce new products or technologies that do not meet the market demand, which may negatively affect our brand. We have in the past experienced, and we expect that in the future we will continue to experience, media, legislative, or regulatory scrutiny of our impact on the environment, which may adversely affect our reputation and brand. We also may fail to provide adequate customer service, which could erode confidence in our brand. Maintaining and enhancing our brand may require us to make substantial investments and these investments may not be successful. As part of our broader branding and marketing strategy we may choose to consolidate or change product brands which may result in us incurring impairment charges. If we fail to successfully promote and maintain the Milacron brand or if we incur excessive expenses or impairment charges in this effort, our business and financial results may be adversely affected.
We are subject to anti-corruption statutes and a number of U.S. regulations, and if we fail to comply with such statutes and regulations it could have a material adverse effect on our business, financial condition and results of operations.
As a global business, we are subject to anti-bribery laws and regulations of the U.S. government and those of various international and subnational jurisdictions, and our failure to successfully comply with these rules and regulations may expose us to liabilities. These laws and regulations apply to companies, individual directors, officers, employees and agents, and may restrict our operations, trade practices, investment decisions and partnering activities. In particular, our international operations are subject to U.S. and foreign anti-corruption laws and regulations, such as the FCPA and the UKBA, as well as anti-corruption laws of the various jurisdictions in which we operate. The FCPA and other laws prohibit us and our officers, directors, employees and agents acting on our behalf from corruptly offering, promising, authorizing or providing anything of value to foreign officials for the purposes of influencing official decisions or obtaining or retaining business or otherwise obtaining favorable treatment. As part of our business, we deal with state-owned business enterprises, the employees and representatives of which may be considered foreign officials for purposes of the FCPA. We are subject to the jurisdiction of various governments and regulatory agencies outside of the United States, which may bring our personnel into contact with foreign officials responsible for issuing or renewing permits, licenses or approvals or for enforcing other governmental regulations. In addition, some of the international locations in which we operate lack a developed legal system and have elevated levels of corruption. Our global operations expose us to the risk of violating, or being accused of violating, the foregoing or other anti-corruption laws. Such violations could be punishable by criminal fines, imprisonment, civil penalties, disgorgement of profits, injunctions and debarment from government contracts, as well as other remedial measures. Investigations of alleged violations can be very expensive and disruptive. If we have been determined to be in violation of the FCPA, the UKBA or other anti-corruption laws, we could be subject to significant fines, penalties, repayments, other damages (in certain cases, treble damages) which could have a material and adverse effect on our business, financial condition and results of operations.
Our business activities are also subject to various restrictions under U.S. export controls and trade and economic sanctions laws, including the U.S. Commerce Department’s Export Administration Regulations and economic and trade sanctions regulations maintained by OFAC. If we fail to comply with these laws and regulations, we could be subject to civil or criminal penalties and reputational harm, which could have a material and adverse effect on our business, financial condition and results of operations.
17
Goodwill and other identifiable intangible assets represent a significant portion of our total assets, and we may never realize the full value of our intangible assets.
As of December 31, 2017, goodwill and other identifiable intangible assets were approximately $867.5 million, or 46.7% of our total assets. Goodwill and other identifiable intangible assets are recorded at fair value on the date of acquisition. In accordance with the guidance under Financial Accounting Standards Board (“FASB”) ASC 350-20, “Intangibles—Goodwill and Other,” we review such assets at least annually for impairment. Impairment may result from, among other things, deterioration in performance, adverse market conditions, adverse changes in applicable laws or regulations, including changes that restrict the activities of or affect the products and services we sell, challenges to the validity of certain registered intellectual property, reduced sales of certain products incorporating registered intellectual property and a variety of other factors. The amount of any quantified impairment must be expensed immediately as a charge to results of operations. Depending on future circumstances, it is possible that we may never realize the full value of our intangible assets. Any future determination of impairment of goodwill or other identifiable intangible assets could have a material adverse effect on our financial position and results of operations.
Our growth strategy may include acquisitions, and we may not be able to execute on our acquisition strategy or integrate acquisitions successfully which could materially adversely affect our business.
As part of our growth strategy, we may consider the acquisition of other companies, assets and product lines that either complement or expand our existing business and create economic value. We continually evaluate potential acquisition opportunities in the ordinary course of business, including those that could be material in size and scope. Acquisitions involve a number of special risks, which may include:
• | the diversion of management’s time and attention from other business concerns to the assimilation of the acquired companies and their employees and on the management of expanding operations; |
• | the use of debt to finance acquisitions, increasing the risk that we may be unable to satisfy our financial obligations; |
• | the incorporation of acquired products into our product line; |
• | the disruption of existing supplier or customer relationships and the difficulty of presenting a unified corporate image; |
• | the increasing demands on our operational systems and integration costs, which may be greater than expectations; |
• | difficulties in maintaining uniform standards, controls, procedures and policies throughout acquired companies; |
• | increased regulatory scrutiny as a result of perceived concentration in certain markets; |
• | the impact of accounting requirements relating to business combinations, including the requirement to expense certain acquisition costs as incurred, which may cause us to experience greater earnings volatility and generally lower earnings during period in which we acquire new businesses; and |
• | difficulties in retaining key employees, customers or suppliers of the acquired business. |
We may become responsible for unexpected liabilities that we failed or were unable to discover in the course of performing due diligence in connection with any future acquisitions. Any indemnification rights we obtain in the future may not be enforceable, collectible or sufficient in amount, scope or duration to fully offset the possible liabilities associated with the business or property acquired. Any of these liabilities, individually or in the aggregate, could have a material adverse effect on our business, financial condition or results of operations.
In addition, any acquisition, once successfully integrated, may not perform as planned, be accretive to earnings or prove to be beneficial to our operations and cash flow. The costs of such integration could have a material adverse effect on our business, financial condition or results of operations.
18
Our business and reputation could suffer if we are unable to protect our information systems against, or effectively respond to, cybersecurity incidents or if our information systems are otherwise disrupted.
We depend on information technology, including public websites, for many activities important to our business, including to enable and improve the effectiveness of our operations, to order and manage materials from suppliers, to maintain financial accuracy and efficiency, to comply with regulatory, financial reporting, legal and tax requirements, to collect and store sensitive data and confidential information, and to communicate electronically among our global operations and with our employees and the employees of our suppliers and other third parties. If we do not allocate and effectively manage the resources necessary to build and sustain our IT infrastructure, if we fail to timely identify or appropriately respond to cybersecurity incidents, or if our information systems are damaged, destroyed or shut down (whether as a result of natural disasters, fires, power outages, acts of terrorism or other catastrophic events, network outages, software, equipment or telecommunications failures, user errors, or from deliberate cyberattacks such as malicious or disruptive software, denial of service attacks, malicious social engineering, hackers or otherwise), our business could be disrupted and we could, among other things, be subject to: transaction errors; processing inefficiencies; the loss of, or failure to attract new, customers; the loss of revenues from unauthorized use, acquisition or disclosure of or access to confidential information; the loss of or damage to intellectual property or trade secrets, including the loss or unauthorized disclosure of sensitive data, confidential information or other assets; damage to our reputation; litigation; regulatory enforcement actions; violation of data privacy, security or other laws and regulations; and remediation costs. Further, our information systems and the information stored therein, could be compromised by, and we could experience similar adverse consequences due to unauthorized outside parties intent on accessing or extracting sensitive data or confidential information, corrupting information or disrupting business processes or by inadvertent or intentional actions by our employees or agents. Similar risks exist with respect to the third-party vendors we rely upon for aspects of our IT support services and administrative functions, including payroll processing, health and benefit plan administration and certain finance and accounting functions.
Many factors may adversely affect the price of our common stock and our business, financial condition or results of operations.
Many factors may adversely affect the price of our common stock and our business, financial condition or results of operations. Such factors, some of which are beyond our control, may include, but are not limited to: unfavorable economic conditions; changes in financial or tax reporting and changes in accounting principles or practices that materially affect our reported financial condition and results; investor perceptions of our performance; actions by shareholders or others seeking to influence our business strategies; speculation by the media or investment community regarding our business; trading activity in our common stock or trading activity in derivative instruments with respect to our common stock; and the impact of our share repurchase programs or dividend rate. In addition, corporate actions, such as those we may or may not take from time to time as part of our continuous review of our corporate structure, including as a result of business, legal and tax considerations, may not have the impact we intend and may adversely affect the price of our common stock and our business, financial condition or results of operations. The above factors, as well as other risks included in this "Item 1A. Risk Factors," could adversely affect the price of our common stock and our business, financial condition or results of operations.
We have a substantial amount of indebtedness, which could have a material adverse effect on our financial condition and our ability to obtain financing in the future and to react to changes in our business.
As of December 31, 2017, we had $945.1 million aggregate principal amount of senior debt outstanding, including $937.5 million under our senior secured term loan facility due September 2023 (the "2017 Term Loan Facility"). We also had $64.9 million (excluding approximately $29.1 million of undrawn letters of credit) of availability under our senior secured asset-based revolving credit facility (the "ABL Facility") and $13.1 million of undrawn availability under other lines of credit, in each case subject to borrowing base or other limitations.
Our substantial indebtedness could limit our ability to satisfy our obligations and operate our business and could also impair our competitive position. For example, it could:
• | make it more difficult for us to satisfy our obligations under the ABL Facility or the 2017 Term Loan Facility; |
• | increase our vulnerability to adverse economic and general industry conditions, including interest rate fluctuations, because a portion of our borrowings are and will continue to be at variable rates of interest; |
• | require us to dedicate a substantial portion of our cash flow from operations to payments on our debt, which would reduce the availability of our cash flow from operations to fund working capital, capital expenditures, acquisitions, or other general corporate purposes; |
• | limit our flexibility in planning for, or reacting to, changes in general economic conditions or in our business and industry; |
• | place us at a disadvantage compared to competitors that may have proportionately less debt; |
19
• | limit our ability to obtain additional debt or equity financing due to applicable financial and restrictive covenants in our debt agreements; and |
• | increase our cost of borrowing. |
Despite our current indebtedness levels and restrictive covenants, we and our subsidiaries may still incur significant additional indebtedness. Incurring more indebtedness could increase the risks associated with our current, substantial indebtedness.
Certain agreements governing our indebtedness, including the credit agreements governing our ABL Facility and our 2017 Term Loan Facility, contain restrictions on the incurrence of additional indebtedness, subject to specified conditions and limitations. Under certain circumstances, the amount of indebtedness, including senior secured indebtedness, we could incur in compliance with these restrictions could be substantial. Additionally, these restrictions may not prevent us from incurring obligations that, although preferential to our common stock in terms of payment, do not constitute indebtedness. If we add new debt to our outstanding debt levels, the risks relating to our indebtedness would increase. If we incur additional debt, the risks associated with our substantial leverage and the ability to service such debt would increase. See “Item 7. Management’s Discussion and Analysis of Financial Condition and Results of Operations—Liquidity and Capital Resources.”
The credit agreements governing our ABL Facility and 2017 Term Loan Facility impose significant operating and financial restrictions on Milacron LLC and its subsidiaries, which may prevent us from capitalizing on business opportunities.
The credit agreements governing our ABL Facility and 2017 Term Loan Facility impose significant operating and financial restrictions on the issuers of such indebtedness and their restricted subsidiaries. These restrictions limit the ability of Milacron LLC and its restricted subsidiaries, among other things, to:
• | incur, assume or permit to exist additional indebtedness (including guarantees thereof); |
• | pay dividends or certain other distributions on their capital stock or repurchase our capital stock or prepay subordinated indebtedness; |
• | incur liens on assets; |
• | make certain investments or other restricted payments; |
• | allow to exist certain restrictions on the ability of the restricted subsidiaries to pay dividends or make other payments to the issuers of such indebtedness; |
• | engage in transactions with affiliates; |
• | sell certain assets or merge or consolidate with or into other companies; |
• | guarantee indebtedness; and |
• | alter the business that we conduct. |
In addition, our ABL Facility contains a financial covenant requiring Milacron LLC and its restricted subsidiaries to maintain a 1.0 to 1.0 minimum trailing four quarter fixed charge coverage ratio, to be tested at any time that excess availability under the ABL Facility decreases to a level below the greater of 12.5% of the aggregate revolver commitments and $13.75 million, until the date on which excess availability exceeds the greater of 12.5% of the aggregate revolver commitments and $13.75 million for 30 consecutive days.
As a result of these covenants and restrictions, we will be limited in how we conduct our business and we may be unable to raise additional debt or equity financing to compete effectively or to take advantage of new business opportunities. The terms of any future indebtedness we may incur could include more restrictive covenants. As of December 31, 2017, we were in compliance with all of the covenants under our debt instruments. However, we may not be able to maintain compliance with these covenants in the future and, if we fail to do so, we may not be able to obtain waivers from the applicable lenders or noteholders and/or amend the covenants. A breach of any of these covenants could result in an event of default under one or more of the credit agreements governing the ABL Facility and the 2017 Term Loan Facility and, if not cured or waived, could give the holders of the defaulted debt a right to accelerate such debt. Acceleration of any of our debt could result in cross-defaults under our other debt instruments.
20
We may not be able to generate sufficient cash to service all of our indebtedness and may be forced to take other actions to satisfy our obligations under our indebtedness, which may not be successful.
Our ability to make scheduled payments on or to refinance our debt obligations depends on our financial condition and operating performance, which is subject to prevailing economic and competitive conditions and to certain financial, business and other factors beyond our control. We may not be able to maintain a level of cash flows from operating activities sufficient to permit us to pay the principal, premium, if any, and interest on our indebtedness.
If our cash flows and capital resources are insufficient to fund our debt service obligations, we may be forced to reduce or delay investments and capital expenditures, or to sell assets, seek additional capital or restructure or refinance our indebtedness. Our ability to restructure or refinance our debt will depend on the condition of the capital markets and our financial condition at such time. Any refinancing of our debt could be at higher interest rates and may require us to comply with more onerous covenants, which could further restrict our business operations. The terms of existing or future debt instruments may restrict us from adopting some of these alternatives. In addition, any failure to make payments of interest and principal on our outstanding indebtedness on a timely basis would likely result in a reduction of our credit rating, which could harm our ability to incur additional indebtedness.
ITEM 1B. UNRESOLVED STAFF COMMENTS
None.
21
ITEM 2. PROPERTIES
We are headquartered in Cincinnati, Ohio in a 22,000 square foot leased facility. This facility is used for management offices as well as certain human resources, information technology, finance, and treasury functions. We have taken a disciplined approach in realigning our manufacturing presence to optimize our cost structure and ability to serve high growth regions. We have operations in 19 countries with a sales and service network that covers all major markets across the globe.
The following table describes our principal owned and leased properties as of December 31, 2017:
Location | Square Footage | Type | Own/ Lease | APPT | MDCS | Fluids | |||||||
Americas | |||||||||||||
Atlanta, Georgia | 39,000 | Manufacturing | Lease | Ÿ | |||||||||
Batavia, Ohio | 490,000 | Manufacturing | Own | Ÿ | |||||||||
McPherson, Kansas | 93,000 | Manufacturing | Lease | Ÿ | |||||||||
Mt. Orab, Ohio | 213,000 | Manufacturing | Own | Ÿ | |||||||||
Rowley, Massachusetts | 46,000 | Manufacturing | Lease | Ÿ | |||||||||
Querétaro, Mexico | 31,000 | Distribution and Service | Lease | Ÿ | |||||||||
Southlake, Texas | 24,000 | Distribution and Service | Lease | Ÿ | |||||||||
Tecumseh, Michigan | 262,000 | Manufacturing | Lease | Ÿ | |||||||||
Georgetown, Ontario, Canada | 122,000 | Manufacturing | Lease | Ÿ | |||||||||
Georgetown, Ontario, Canada | 54,000 | R&D | Lease | Ÿ | |||||||||
Brantford, Ontario, Canada | 18,000 | Manufacturing | Lease | Ÿ | |||||||||
Campinas, Brazil | 12,000 | Manufacturing | Lease | Ÿ | Ÿ | ||||||||
Madison Heights, Michigan | 71,000 | Distribution | Own | Ÿ | |||||||||
Greenville, Michigan | 65,000 | Manufacturing | Lease | Ÿ | |||||||||
Windsor, Ontario, Canada | 24,000 | Manufacturing | Own | Ÿ | |||||||||
Youngwood, Pennsylvania | 140,000 | Manufacturing | Own | Ÿ | |||||||||
Cincinnati, Ohio | 76,000 | Manufacturing | Own | Ÿ | |||||||||
Querétaro, Mexico | 14,000 | Distribution and Service | Lease | Ÿ | |||||||||
Europe | |||||||||||||
Berlin, Germany | 16,000 | Distribution and Service | Lease | Ÿ | |||||||||
Magenta, Italy | 97,000 | Manufacturing | Own | Ÿ | |||||||||
Malterdingen, Germany | 420,000 | Manufacturing | Own | Ÿ | |||||||||
Policka, Czech Republic | 191,000 | Manufacturing | Own | Ÿ | |||||||||
Baden-Baden, Germany | 36,000 | Manufacturing | Lease | Ÿ | |||||||||
Hereford, United Kingdom | 16,000 | Manufacturing | Lease | Ÿ | |||||||||
Zeletava, Czech Republic | 110,000 | Manufacturing | Own | Ÿ | |||||||||
Vlaardingen, Netherlands | 74,000 | Manufacturing | Own | Ÿ | |||||||||
Asia Pacific | |||||||||||||
Ahmedabad, India | 201,000 | Manufacturing | Own | Ÿ | |||||||||
Jiangyin, China | 87,000 | Manufacturing | Lease | Ÿ | |||||||||
Kawasaki, Japan | 8,000 | Distribution | Own | Ÿ | |||||||||
Kunshan, China | 176,000 | Manufacturing | Own | Ÿ | |||||||||
Coimbatore, India | 48,000 | Office | Lease | Ÿ | Ÿ | Ÿ | |||||||
Coimbatore, India | 25,000 | Office | Lease | Ÿ | |||||||||
Coimbatore, India | 24,000 | Manufacturing | Lease | Ÿ | |||||||||
Shenzhen, China | 19,000 | Distribution | Lease | Ÿ | |||||||||
Shinoli, India | 22,000 | Manufacturing | Own | Ÿ | |||||||||
Shanghai, China | 59,000 | Manufacturing | Lease | Ÿ | |||||||||
Ulsan, South Korea | 100,000 | Manufacturing | Own | Ÿ | |||||||||
Total | 3,523,000 | ||||||||||||
22
ITEM 3. LEGAL PROCEEDINGS
The Company is involved in litigation from time to time in the regular course of its business. The Company believes that adequate provisions for resolution of all contingencies, claims and pending litigation have been made for probable losses that are reasonably estimable. The Company does not believe that the ultimate outcome of these actions will have a material adverse effect on its financial condition, results of operations or cash flows. However, the final amounts required to resolve these matters could differ materially from our recorded estimates. See Note 14 of the Notes to Consolidated Financial Statements within "Item 8. Financial Statements and Supplementary Data."
ITEM 4. MINE SAFETY DISCLOSURES
None.
23
PART II
ITEM 5. | MARKET FOR REGISTRANT'S COMMON EQUITY, RELATED STOCKHOLDER MATTERS AND | |||
ISSUER PURCHASES OF EQUITY SECURITIES | ||||
Market for Common Equity
The Company's common stock began trading on the New York Stock Exchange (NYSE) under the symbol MCRN on June 25, 2015. As of February 22, 2018, there were approximately 21 holders of record of our common stock.
The table below sets forth for the calendar quarters indicated the reported high and low sales prices of the Company's common stock:
2017 | |||
High | Low | ||
First Quarter | $19.25 | $15.93 | |
Second Quarter | $19.45 | $16.88 | |
Third Quarter | $19.57 | $15.09 | |
Fourth Quarter | $19.33 | $15.90 | |
2016 | |||
High | Low | ||
First Quarter | $16.74 | $11.56 | |
Second Quarter | $18.50 | $13.85 | |
Third Quarter | $17.69 | $13.52 | |
Fourth Quarter | $19.32 | $12.43 | |
Dividends
We do not intend to pay cash dividends on our common stock in the foreseeable future. We are a holding company that does not conduct any business operations of our own. As a result, our ability to pay cash dividends on our common stock is dependent upon cash dividends and distributions and other transfers from our subsidiaries. The amounts available to us to pay cash dividends are restricted by our subsidiaries’ debt agreements. The declaration and payment of dividends also is subject to the discretion of our Board of Directors and depends on various factors, including our net earnings, financial condition, cash requirements, future prospects and other factors deemed relevant by our Board of Directors.
Securities Authorized for Issuance Under Equity Compensation Plans
For information regarding Securities Authorized for Issuance Under Equity Compensation Plans, see Part III, Item 12 of this Annual Report on Form 10-K.
Issuer Purchases of Equity Securities
None.
Unregistered Sales of Equity Securities and Use of Proceeds
None.
24
Stock Performance Graph
The following graph compares the Company's cumulative total shareholder return with the cumulative total return of the Standard & Poor's 500 Stock Index ("S&P 500 Index") and the Dow Jones U.S. Industrial Machinery Index for the period from June 25, 2015 to December 31, 2017, assuming a fixed investment of $100 made at the respective closing prices on June 25, 2015 and the reinvestment of cash dividends.
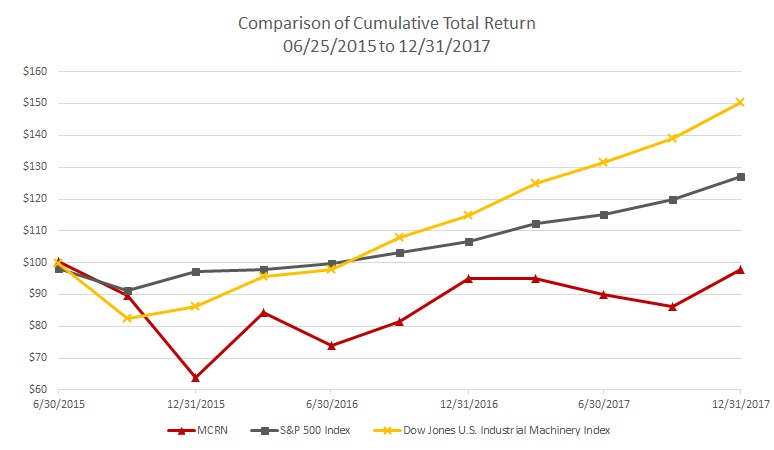
June 25, 2015 | December 31, 2015 | December 31, 2016 | December 31, 2017 | ||||
MCRN | $100 | $63.89 | $95.15 | $97.75 | |||
S&P 500 Index | $100 | $97.22 | $106.49 | $127.17 | |||
Dow Jones U.S. Industrial Machinery Index | $100 | $86.29 | $114.89 | $150.49 | |||
25
ITEM 6. SELECTED FINANCIAL DATA
The following table sets forth our selected historical financial data for the periods and as of the dates indicated. The consolidated statements of operations data for the years ended December 31, 2017, 2016, and 2015, and the consolidated balance sheet data as of December 31, 2017 and 2016 are derived from our audited consolidated financial statements that are included in "Item 8. Financial Statements and Supplementary Data." The consolidated statements of operations data for the years ended December 31, 2014 and 2013, and the consolidated balance sheet data as of December 31, 2015, 2014, and 2013 are derived from our audited consolidated financial statements that are not present elsewhere in this Form 10-K.
Our historical results are not necessarily indicative of future operating results. You should read the information set forth below in conjunction with “Item 7. Management’s Discussion and Analysis of Financial Condition and Results of Operations,” and "Item 8. Financial Statements and Supplementary Data."
Selected Financial Data (U.S. GAAP)
Year Ended December 31, 2017 | Year Ended December 31, 2016 | Year Ended December 31, 2015 | Year Ended December 31, 2014 | Year Ended December 31, 2013 | |||||||||||||||
(in millions, except per share data) | |||||||||||||||||||
Balance sheet data: | |||||||||||||||||||
Cash and cash equivalents | $ | 187.9 | $ | 130.2 | $ | 67.5 | $ | 81.5 | $ | 100.7 | |||||||||
Accounts receivable, net | 186.3 | 182.3 | 204.4 | 183.3 | 174.5 | ||||||||||||||
Inventories, net | 267.9 | 249.5 | 238.9 | 238.1 | 207.4 | ||||||||||||||
Property and equipment, net | 260.8 | 243.7 | 221.8 | 216.9 | 203.6 | ||||||||||||||
Total assets | 1,858.8 | 1,722.0 | 1,696.3 | 1,769.8 | 1,768.3 | ||||||||||||||
Accounts payable | 121.6 | 92.5 | 79.2 | 89.9 | 83.4 | ||||||||||||||
Advanced billings and deposits | 62.8 | 52.7 | 39.7 | 58.5 | 56.2 | ||||||||||||||
Total debt and capital lease obligations, including current portion (a) | 933.2 | 941.4 | 939.7 | 1,013.7 | 963.5 | ||||||||||||||
Statements of operations data: | |||||||||||||||||||
Net sales | $ | 1,234.2 | $ | 1,166.7 | $ | 1,179.5 | $ | 1,211.3 | $ | 1,028.8 | |||||||||
Operating earnings | 88.0 | 105.6 | 71.8 | 85.1 | 54.3 | ||||||||||||||
Net earnings (loss) attributable to Milacron Holdings Corp. | 1.1 | 30.5 | (38.8 | ) | (14.8 | ) | (24.6 | ) | |||||||||||
Basic earnings (loss) per share | $ | 0.02 | $ | 0.45 | $ | (0.65 | ) | $ | (0.28 | ) | $ | (0.55 | ) | ||||||
Diluted earnings (loss) per share | $ | 0.02 | $ | 0.43 | $ | (0.65 | ) | $ | (0.28 | ) | $ | (0.55 | ) | ||||||
Statements of cash flows data: | |||||||||||||||||||
Net cash provided by operating activities | $ | 110.4 | $ | 116.2 | $ | 36.8 | $ | 37.6 | $ | 82.1 | |||||||||
Net cash used in investing activities | (38.1 | ) | (56.4 | ) | (73.3 | ) | (94.3 | ) | (993.4 | ) | |||||||||
Net cash (used in) provided by financing activities | (21.9 | ) | 6.2 | 27.8 | 41.2 | 964.8 | |||||||||||||
(a) Balances as of December 31, 2013 have been conformed to the 2017 presentation for the classification of debt issuance costs of $25.9 million.
Other Selected Financial Data (Non-GAAP)
Year Ended December 31, 2017 | Year Ended December 31, 2016 | Year Ended December 31, 2015 | Year Ended December 31, 2014 | Year Ended December 31, 2013 | |||||||||||||||
(in millions) | |||||||||||||||||||
Adjusted EBITDA | $ | 227.3 | $ | 212.8 | $ | 213.4 | $ | 198.5 | $ | 161.6 | |||||||||
Adjusted Net Income | 128.2 | 105.7 | 98.2 | 74.5 | 57.0 | ||||||||||||||
We prepare our financial statements in conformity with United States generally accepted accounting principles ("U.S. GAAP"). To supplement this information, we also use the following non-GAAP financial measures: Adjusted EBITDA and Adjusted Net Income. Because not all companies use identical calculations, these presentations may not be comparable to other similarly titled measures of other companies.
26
We refer to pages 34 through 38 of “Item 7. Management’s Discussion and Analysis of Financial Condition and Results of Operations” for a detailed reconciliation of reported (U.S. GAAP) net earnings (loss) attributable to Milacron Holdings Corp. to Adjusted Net Income and Adjusted EBITDA and operating earnings to Adjusted EBITDA. We also refer to these pages for information regarding, but not limited to, (1) how we believe the Non-GAAP measures provide useful information to investors; (2) how we use the Non-GAAP measures to evaluate our business; and (3) the limitations of these Non-GAAP measures.
27
ITEM 7. | MANAGEMENT'S DISCUSSION AND ANALYSIS OF FINANCIAL CONDITION AND RESULTS OF | |||
OPERATIONS | ||||
The following discussion should be read in conjunction with our consolidated financial statements and related notes in "Item 8. Financial Statements and Supplementary Data." This discussion contains forward-looking statements based on current expectations and related to future events and our future financial performance. Our actual results may differ materially from those anticipated in these forward-looking statements as a result of many factors, including those set forth under "Item 1A. Risk Factors."
Executive Overview
For the year ended December 31, 2017, Milacron reported sales of $1,234.2 million, operating earnings of $88.0 million and net earnings of $1.1 million. This compares to sales of $1,166.7 million, operating earnings of $105.6 million and net earnings of $30.5 million for the year ended December 31, 2016. Excluding $7.4 million of favorable effects of foreign currency movements, sales increased 5.2% compared to the prior year. Adjusted EBITDA increased 6.8% to $227.3 million, or 18.4% of sales, during the year ended December 31, 2017 compared to $212.8 million in Adjusted EBITDA, or 18.2% of sales, during the year ended December 31, 2016. Adjusted Net Income increased 21.3% to $128.2 million, or 10.4% of sales, during the year ended December 31, 2017 compared to $105.7 million in Adjusted Net Income, or 9.1% of sales, during the year ended December 31, 2016.
Advanced Plastic Processing Technologies
For the year ended December 31, 2017, APPT generated $689.1 million in sales and $86.3 million in Adjusted EBITDA, or 12.5% of sales, before corporate expenses, compared to $663.9 million in sales and $81.6 million in Adjusted EBITDA, or 12.3% of sales, before corporate expenses, in the same period in 2016. Excluding $6.5 million of favorable effects of foreign currency movements, sales increased 2.8% compared to the prior year.
Melt Delivery and Control Systems
For the year ended December 31, 2017, MDCS generated $423.9 million in sales and $138.2 million in Adjusted EBITDA, or 32.6% of sales, before corporate expenses, compared to $389.9 million in sales and $127.2 million in Adjusted EBITDA, or 32.6% of sales, before corporate expenses, in the same period in 2016. Sales increased 8.7% in 2017 compared to the prior year on both an as-reported and constant currency basis.
Fluid Technologies
For the year ended December 31, 2017, Fluids generated $121.2 million in sales and $26.9 million in Adjusted EBITDA, or 22.2% of sales, before corporate expenses, compared to $112.9 million in sales and $24.4 million in Adjusted EBITDA, or 21.6% of sales, before corporate expenses, in the same period in 2016. Excluding $0.9 million of favorable effects of foreign currency movements, sales increased 6.6% compared to the prior year.
Liquidity
During the year ended December 31, 2017, cash increased $57.7 million primarily driven by cash flow from operations partially offset by capital expenditures and costs incurred in connection with the Company's debt refinancing activity during 2017. Operating activities generated $110.4 million of cash during the year ended December 31, 2017 compared to $116.2 million of cash in the same period in 2016. The decrease in operating cash flow from 2016 was primarily driven by a reduction in working capital improvements when compared to the prior year. Investing activities used $38.1 million of cash during the year ended December 31, 2017 primarily due to capital expenditures. Financing activities used $21.9 million during the year ended December 31, 2017 primarily as a result of the $18.0 million premium paid and other debt refinancing costs incurred in connection with the debt refinancing activity during the first and fourth quarters of 2017. These outflows were partially offset by proceeds received in connection with the Company's lease financing transaction during the second quarter of 2017 and from the exercise of stock options.
Cash on hand at December 31, 2017 was $187.9 million, and we had approximately $78.0 million available for borrowing under our asset-based and other credit facilities.
28
New Orders and Backlog
New orders represent the value of incoming purchase orders received for a period of time that may or may not have been shipped during the period. New orders for the year ended December 31, 2017 were $1,299.9 million, an increase of $108.6 million, or 9.1%, compared to $1,191.3 million for the year ended December 31, 2016. Excluding $7.5 million of favorable effects of foreign currency movements, new orders increased 8.5% compared to the prior period. New orders were primarily impacted by growth in our equipment business in India and growth in our hot runner business in China.
Backlog represents the value of unfilled orders as of the applicable date. These unfilled orders are supported by a valid purchase order and price, terms and credit have been approved by us. Our backlog of unfilled orders at December 31, 2017 was $287.0 million, an increase of $61.4 million from December 31, 2016. Excluding $15.2 million of favorable effects of foreign currency movements, backlog increased 20.5% compared to December 31, 2016. The increase in our backlog is predominantly driven by our equipment business in India and our hot runner business in China. All of our backlog is expected to be filled within the next twelve months and there are no seasonal or other aspects of the backlog that would impact filling the orders.
Backlog of confirmed orders for equipment within the APPT business is tracked on a monthly basis. Lead times can vary significantly depending on the type and size of machine. Backlog within our MDCS business is relatively stable, as mold bases and hot runner systems have a short lead time from receipt of order to shipment with a global average of six to eight weeks; whereas spare parts sales of standard products are typically in stock and shipped with very little lead time. We do not track backlog in our Fluids segment as most orders are filled with minimal lead time.
29
Results of Operations
The following table sets forth our results of operations for the periods presented:
Year Ended December 31, | ||||||||||||
2017 | 2016 | 2015 | ||||||||||
(in millions) | ||||||||||||
Net sales | $ | 1,234.2 | $ | 1,166.7 | $ | 1,179.5 | ||||||
Cost of sales | 852.3 | 770.9 | 775.6 | |||||||||
Manufacturing margins | 381.9 | 395.8 | 403.9 | |||||||||
Operating expenses: | ||||||||||||
Selling, general and administrative expenses | 254.0 | 252.4 | 261.1 | |||||||||
Amortization expense | 28.7 | 31.3 | 35.9 | |||||||||
(Gain) loss on currency translation | (7.3 | ) | (3.3 | ) | 21.6 | |||||||
Other expense, net | 18.5 | 9.8 | 13.5 | |||||||||
Total operating expenses | 293.9 | 290.2 | 332.1 | |||||||||
Operating earnings | 88.0 | 105.6 | 71.8 | |||||||||
Interest expense, net | 44.5 | 60.9 | 68.0 | |||||||||
Loss on debt extinguishment | 25.2 | — | 22.2 | |||||||||
Earnings (loss) before income taxes | 18.3 | 44.7 | (18.4 | ) | ||||||||
Income tax expense | 17.2 | 14.2 | 20.4 | |||||||||
Net earnings (loss) | $ | 1.1 | $ | 30.5 | $ | (38.8 | ) | |||||
The following table sets forth our sales by segment for the periods presented:
Year Ended December 31, | ||||||||||||
2017 | 2016 | 2015 | ||||||||||
(in millions) | ||||||||||||
Net sales by segment: | ||||||||||||
Advanced Plastic Processing Technologies | $ | 689.1 | $ | 663.9 | $ | 680.8 | ||||||
Melt Delivery and Control Systems | 423.9 | 389.9 | 383.5 | |||||||||
Fluid Technologies | 121.2 | 112.9 | 115.2 | |||||||||
Total | $ | 1,234.2 | $ | 1,166.7 | $ | 1,179.5 | ||||||
Comparison of the Years Ended December 31, 2017 and 2016
Net Sales
Sales for the year ended December 31, 2017 were $1,234.2 million compared to $1,166.7 million for the year ended December 31, 2016, an increase of $67.5 million or 5.8%. Excluding $7.4 million of favorable effects of foreign currency movements, sales increased $60.1 million, or 5.2%, compared to the prior year.
Sales for our APPT segment for the year ended December 31, 2017 were $689.1 million compared to $663.9 million for the year ended December 31, 2016, an increase of $25.2 million or 3.8%. Excluding $6.5 million of favorable effects of foreign currency movements, sales increased $18.7 million, or 2.8%, compared to the prior year. Regionally, sales benefited from growth primarily in India. End market segment growth was primarily driven by increases in consumer goods, electronics and construction end markets, partially offset by declines in the automotive and medical end markets.
Sales for our MDCS segment for the year ended December 31, 2017 were $423.9 million compared to $389.9 million for the year ended December 31, 2016, an increase of $34.0 million or 8.7%. Regionally, sales benefited from growth primarily in China and Europe, partially offset by a decline in North America. End market growth was primarily driven by increases in the automotive, consumer goods, electronics and custom molders end markets, partially offset by declines in the packaging and medical end markets.
30
Sales for our Fluids segment for the year ended December 31, 2017 were $121.2 million compared to $112.9 million for the year ended December 31, 2016, an increase of $8.3 million or 7.4%. Excluding $0.9 million of favorable effects of foreign currency movements, sales increased $7.4 million, or 6.6%, compared to the prior year. Regionally, sales benefited from growth primarily in North America, Europe and China with end market growth driven by increases in the automotive, electronics, consumer goods and industrial machinery end markets.
Cost of Sales
Cost of sales for the year ended December 31, 2017 was $852.3 million compared to $770.9 million for the year ended December 31, 2016, an increase of $81.4 million, or 10.6%.
Manufacturing Margin
The Company's manufacturing margin (or gross margin) for the year ended December 31, 2017 was $381.9 million compared to $395.8 million for the year ended December 31, 2016, a decrease of $13.9 million or 3.5%. The manufacturing margin as a percent of sales for the year ended December 31, 2017 was 30.9% compared to 33.9% for the year ended December 31, 2016.
While sales increased during the year ended December 31, 2017 compared to the prior year, the Company encountered competitive pricing pressure within the APPT and MDCS segments. Manufacturing margins have also been negatively impacted by material inflation which has not been fully offset by procurement savings realized by the Company. Within the Company's APPT segment, as a result of higher order rates in the European equipment businesses, the Company experienced operational inefficiencies as a result of the Company's need to manufacture in multiple locations. Within the Company's MDCS segment, due to higher order rates within the hot runner business, incremental overtime and subcontracting costs in North America and China were incurred. Finally, during the fourth quarter of 2017, the Company recorded a $7.7 million inventory write-down associated with the Company's decision to exit a product line within the APPT segment that contributed approximately $3.4 million in sales for the year ended December 31, 2017.
Selling, General and Administrative Expenses
Selling, general and administrative expenses for the year ended December 31, 2017 were $254.0 million compared to $252.4 million for the year ended December 31, 2016, an increase of $1.6 million or 0.6%. The increase is primarily related to an increase in stock-based compensation expense, short-term incentive plan expense and expenses incurred in connection with our debt refinancing activities during the first and fourth quarters of 2017. These increases were partially offset by a reduction in research and development costs and certain discretionary costs.
Amortization Expense
Amortization expense related to intangible assets for the year ended December 31, 2017 was $28.7 million compared to $31.3 million for the year ended December 31, 2016, a decrease of $2.6 million or 8.3%. The decrease is primarily related to accelerated amortization methods on certain intangible assets subject to amortization as well as favorable foreign currency translation effects.
Gain on Currency Translation
The gain on currency translation for the year ended December 31, 2017 was $7.3 million compared to $3.3 million for the year ended December 31, 2016, resulting in a favorable change of $4.0 million. The gains and losses primarily relate to the translation impact on intercompany advances related to the Canadian dollar associated with the acquisition of Mold-Masters Luxembourg Holdings S.à r.l ("Mold-Masters") within our MDCS segment.
Other Expense, Net
Other expense, net for the year ended December 31, 2017 was $18.5 million compared $9.8 million for the year ended December 31, 2016, an increase of $8.7 million or 88.8%. The increase is primarily related to severance and other related costs incurred in connection with our restructuring plan at our Malterdingen, Germany facility. As the employees are required to render service in order to receive the termination benefits, the associated liability and expense are being recognized ratably over the related service period. The increase is also driven by severance expense recorded during the second quarter related to the elimination of certain positions within the Company's APPT and Corporate segments. Additionally, other expense, net includes a $1.4 million goodwill impairment charge recognized during the fourth quarter within the APPT segment.
31
Operating Earnings
Operating earnings for the year ended December 31, 2017 were $88.0 million compared to $105.6 million for the year ended December 31, 2016, a decrease of $17.6 million or 16.7%. In addition to incremental severance-related costs, the decrease is primarily related to the inventory write-down associated with the Company's decision to exit a product line within the APPT segment and competitive pricing pressure within the APPT and MDCS segments.
Interest Expense, Net
Interest expense, net of interest income, for the year ended December 31, 2017 was $44.5 million compared to $60.9 million for the year ended December 31, 2016, a decrease of $16.4 million or 26.9%. The decrease is primarily due to a reduction in our weighted-average interest rate, when compared to 2016, as a result of our debt refinancings during the first and fourth quarters of 2017.
Loss on Debt Extinguishment
Loss on debt extinguishment was $25.2 million for the year ended December 31, 2017. The loss on debt extinguishment was principally related to the $18.0 million premium paid upon the repayment of our 7.75% senior unsecured notes due 2021 (the "Senior Unsecured Notes") as well as the write-off of deferred financing costs related to the Senior Unsecured Notes and the senior secured term loan facility due September 2020 ("New Term Loan Facility").
Income Tax Expense
Income tax expense for the year ended December 31, 2017 was $17.2 million compared to $14.2 million for the year ended December 31, 2016, an increase of $3.0 million or 21.1%. Income tax expense for both periods was primarily due to earnings in jurisdictions paying cash taxes or where utilization of deferred tax assets was not offset by reversal of valuation allowances. The increase is principally related to an increase in earnings in certain foreign jurisdictions paying cash taxes, most notably China and India.
On December 22, 2017, the Tax Cuts and Jobs Act of 2017 (the "Tax Act") was signed into law and it institutes fundamental changes to the taxation of multinational corporations. The Tax Act reduces the corporate tax rate to 21%, repeals the alternative minimum tax, limits the interest deduction, enhances the expensing of capital investments, implements a dividend exemption system, eliminates the deferral of foreign earnings, provides a minimum tax on low-taxed foreign earnings and new measures to deter base erosion. The increase in tax expense associated with the increase in earnings was partially offset by an $8.9 million tax benefit the Company recorded in the fourth quarter of 2017 related to the enactment of the Tax Act. This benefit was primarily driven by the release of valuation allowances on our AMT credits and the revaluation of net deferred tax liabilities, partially offset by the recognition of withholding tax liabilities on planned cash repatriation from non-U.S. subsidiaries.
Comparison of the Years Ended December 31, 2016 and 2015
Net Sales
Sales for the year ended December 31, 2016 were $1,166.7 million compared to $1,179.5 million for the year ended December 31, 2015, a decrease of $12.8 million or 1.1%. Excluding $17.2 million of unfavorable effects of foreign currency movements, sales increased $4.4 million, or 0.4%, compared to the prior period.
Sales for our APPT segment for the year ended December 31, 2016 were $663.9 million compared to $680.8 million for the year ended December 31, 2015, a decrease of $16.9 million, or 2.5%. Excluding $7.4 million of unfavorable effects of foreign currency movements, sales decreased $9.5 million, or 1.4%, compared to the prior year. Sales decreased as a result of the equipment business in North America primarily driven by declines in the packaging, electronics and medical industries. These decreases were partially offset by growth in the equipment business in India, Europe and China with increases in the consumer goods and construction industries. Sales were favorably impacted $19.9 million in 2016, when compared to 2015, from the acquisition of CanGen Holdings Inc. ("CanGen") during the fourth quarter of 2015.
Sales for our MDCS segment for the year ended December 31, 2016 were $389.9 million compared to $383.5 million for the year ended December 31, 2015, an increase of $6.4 million, or 1.7%. Excluding $6.6 million of unfavorable effects of foreign currency movements, sales increased $13.0 million, or 3.4%, compared to the prior year. Sales increased as a result of growth in China, Europe, India and North America with increases in the consumer goods, custom molders and packaging industries. These increases were partially offset by declines in the automotive, construction and electronics industries.
Sales for our Fluids segment for the year ended December 31, 2016 were $112.9 million, compared to $115.2 million for the year ended December 31, 2015, a decrease of $2.3 million, or 2.0%. Excluding $3.2 million of unfavorable effects of foreign currency
32
movements, sales increased $0.9 million, or 0.8%, compared to the prior year. Sales increased in China and was partially offset by a decrease in North America.
Cost of Sales
Cost of sales for the year ended December 31, 2016 was $770.9 million compared to $775.6 million for the year ended December 31, 2015, a decrease of $4.7 million, or 0.6%.
Manufacturing Margin
Our manufacturing margin (or gross margin) for the year ended December 31, 2016 was $395.8 million compared to $403.9 million for the year ended December 31, 2015, a decrease of $8.1 million, or 2.0%.
The manufacturing margin as a percent of sales for the year ended December 31, 2016 was 33.9% compared to 34.2% for the year ended December 31, 2015.
While the Company has realized material cost savings and benefits from cost reduction actions, these improvements have been partially offset by the effects of foreign currency translation and competitive pricing pressure on sales.
Selling, General and Administrative Expenses
Selling, general and administrative expenses for the year ended December 31, 2016 were $252.4 million compared to $261.1 million for the year ended December 31, 2015, a decrease of $8.7 million, or 3.3%. The decrease is primarily related to our organizational redesign initiatives and a decrease in stock-based compensation expense. In connection with our initial public offering ("IPO") in June 2015, we recognized an additional $17.4 million of stock-based compensation expense in 2015 associated with time-based and performance-based awards previously granted under our 2012 Equity Incentive Plan. These awards contained a market condition in which the vesting of the awards was accelerated upon the satisfaction of the market condition. Based upon the trading price of the Company's common stock subsequent to the IPO, the market condition was satisfied which resulted in the vesting of the awards in July 2015 and the Company's recognition of all previously unrecognized stock-based compensation expense associated with these awards. These reductions were partially offset by increased costs related to our acquisition of CanGen in the fourth quarter of 2015.
Amortization Expense
Amortization expense related to intangible assets for the year ended December 31, 2016 was $31.3 million compared to $35.9 million for the year ended December 31, 2015, a decrease of $4.6 million, or 12.8%. The decrease is primarily related to accelerated amortization methods on certain intangible assets subject to amortization as well as favorable foreign currency translation effects and was partially offset by amortization on certain intangible assets acquired in connection with the acquisition of CanGen in the fourth quarter of 2015.
(Gain) Loss on Currency Translation
The gain on currency translation for the year ended December 31, 2016 was $3.3 million compared to a loss of $21.6 million for the year ended December 31, 2015, resulting in a favorable change of $24.9 million. The gains and losses primarily relate to the translation impact on intercompany advances related to the Canadian dollar associated with the acquisition of Mold-Masters within our MDCS segment.
Other Expense, Net
Other expense, net for the year ended December 31, 2016 was $9.8 million compared to expense of $13.5 million for the year ended December 31, 2015, an decrease of $3.7 million, or 27.4%. The decrease is principally driven by expenses incurred in 2015 in connection with our organizational redesign initiatives in Europe as well as the $2.2 million impairment on certain trademarks incurred during the second quarter of 2015 which were discontinued as a result of a rebranding initiative.
Operating Earnings
Operating earnings for the year ended December 31, 2016 were $105.6 million compared to $71.8 million for the year ended December 31, 2015, a decrease of $33.8 million, or 47.1%. The increase in mainly attributable to the gains from currency translation and a reduction in stock-based compensation expense during the year ended December 31, 2017.
33
Interest Expense, Net
Interest expense, net of interest income, for the year ended December 31, 2016 was $60.9 million compared to $68.0 million for the year ended December 31, 2015, a decrease of $7.1 million, or 10.4%. The decrease is primarily due to the repayment of our 8.375% senior secured notes due 2019 ("Senior Secured Notes") which were replaced by our New Term Loan Facility with a lower interest rate. In addition, interest expense was favorably impacted as a result of a decrease in our average indebtedness during 2016 when compared to 2015.
Loss on Debt Extinguishment
Loss on debt extinguishment was $22.2 million for the year ended December 31, 2015. The loss on debt extinguishment is principally related to the $13.8 million premium paid upon the repayment of our Senior Secured Notes as well as the related write-off of deferred financing costs during the period.
Income Tax Expense
Income tax expense for the year end December 31, 2016 was $14.2 million compared to $20.4 million for the year ended December 31, 2015, a decrease of $6.2 million or 30.4%. Income tax expense for both periods was primarily due to earnings in jurisdictions paying cash taxes or where utilization of deferred tax assets was not offset by reversal of valuation allowances. The decrease is principally related to the reversal of certain valuation allowances in Germany driven by the Company's organizational redesign initiatives, partially offset by increased earnings. During the fourth quarter of 2016, as a result of changing the ownership structure of our German subsidiaries, the Company can elect to file a consolidated German tax return. This tax planning strategy, which had not been previously available until the fourth quarter of 2016, provides significant positive evidence for the future utilization of the deferred tax assets of the newly formed consolidated group. As a result, the Company recognized a $8.5 million income tax benefit related to the reversal of valuation allowances previously recorded against the deferred tax assets of one member of the group and the Company expects this tax planning strategy to result in at least $1.0 million in annual cash tax savings.
Non-GAAP Financial Measures
We prepare our financial statements in conformity with United States generally accepted accounting principles ("U.S. GAAP"). To supplement this information, we also use the following non-GAAP financial measures: Adjusted EBITDA and Adjusted Net Income. Because not all companies use identical calculations, these presentations may not be comparable to other similarly titled measures of other companies.
Adjusted EBITDA
Adjusted EBITDA represents net earnings (loss) before interest expense, taxes, depreciation and amortization, as further adjusted for the other items reflected in the reconciliation table set forth below. Adjusted EBITDA is a measure used by management to measure operating performance. Adjusted EBITDA is not a presentation made in accordance with U.S. GAAP, is not a measure of financial condition or profitability, and should not be considered as an alternative to net earnings (loss) determined in accordance with U.S. GAAP or operating cash flows determined in accordance with U.S. GAAP or any other performance measure derived in accordance with U.S. GAAP and should not be construed as an inference that our future results will be unaffected by unusual non-recurring items. Additionally, Adjusted EBITDA is not intended to be a measure of free cash flow for management’s discretionary use, as it does not include certain cash requirements such as interest payments, tax payments, debt service requirements and certain other cash costs that may recur in the future.
We view Adjusted EBITDA as a key measure of our performance. We present Adjusted EBITDA not only due to its importance for purposes of our credit agreements but also because it assists us in comparing our performance across reporting periods on a consistent basis as it excludes items that we do not believe are indicative of our core operating performance. Our management uses Adjusted EBITDA:
• | as a measurement used in evaluating our consolidated and segment-level operating performance on a consistent basis; |
•to calculate incentive compensation for our employees;
•for planning purposes, including the preparation of our internal annual operating budget;
•to evaluate the performance and effectiveness of our operational strategies; and
•to assess compliance with various metrics associated with our debt agreements.
We believe that the inclusion of Adjusted EBITDA in this Annual Report on Form 10-K is useful to provide additional information to investors about certain material non-cash items as well as items considered to be one-time or non-recurring to the operations
34
of the business. While we believe these financial measures are commonly used by investors to evaluate our performance and that of our competitors, because not all companies use identical calculations, this presentation of Adjusted EBITDA may not be comparable to other similarly titled measures of other companies and should not be considered as an alternative to performance measures derived in accordance with U.S. GAAP. Adjusted EBITDA is calculated as net earnings (loss) attributable to Milacron Holdings Corp. before income tax expense, interest expense, net, depreciation and amortization further adjusted to exclude other items as reflected in the reconciliation table below.
In evaluating Adjusted EBITDA, you should be aware that in the future we will incur expenses such as those used in calculating Adjusted EBITDA. Our presentation of Adjusted EBITDA should not be construed as an inference that our future results will be unaffected by usual or non-recurring items. Because of these limitations, Adjusted EBITDA should not be considered as a measure of discretionary cash available to us to invest in the growth of our business. We compensate for these limitations by relying primarily on our U.S. GAAP results and using Adjusted EBITDA only supplementary.
Adjusted Net Income
Adjusted Net Income measures our operating performance by adjusting net earnings (loss) to exclude amortization expense, non-cash currency effect on intercompany advances, organizational redesign costs, long-term equity awards and shareholder's fees, debt costs, acquisition integration costs, professional services, business combination costs and certain other non-recurring items. Management uses this measure to evaluate our core operating results as it excludes certain items whose fluctuations from period-to-period do not necessarily correspond to changes in the core operations of the business, but includes certain items such as depreciation, interest expense and income tax expense, which are otherwise excluded from Adjusted EBITDA. We believe the presentation of Adjusted Net Income enhances our investors’ overall understanding of the financial performance and cash flow of our business. You should not consider Adjusted Net Income as an alternative to net earnings (loss), determined in accordance with U.S. GAAP, as an indicator of operating performance.
The following is a reconciliation of net loss attributable to Milacron Holdings Corp., the most comparable U.S. GAAP measure, to Adjusted Net Income and Adjusted EBITDA:
Year Ended December 31, | |||||||||||
2017 | 2016 | 2015 | |||||||||
(in millions) | |||||||||||
Net earnings (loss) attributable to Milacron Holdings Corp. | $ | 1.1 | $ | 30.5 | $ | (38.8 | ) | ||||
Amortization expense | 28.7 | 31.3 | 35.9 | ||||||||
Currency effect on intercompany advances (a) | (8.7 | ) | (1.6 | ) | 23.3 | ||||||
Organizational redesign costs (b) | 58.6 | 32.9 | 21.7 | ||||||||
Long-term equity awards and shareholder fees (c) | 9.4 | 7.1 | 22.9 | ||||||||
Debt costs (d) | 27.1 | — | 23.2 | ||||||||
Acquisition integration costs (e) | — | — | 3.7 | ||||||||
Professional services (f) | 6.5 | 4.7 | 5.2 | ||||||||
Business combination costs (g) | — | — | 0.4 | ||||||||
Fair market value adjustments (h) | — | 0.2 | — | ||||||||
Annual effective tax rate adjustment (i) | (7.5 | ) | (3.4 | ) | — | ||||||
Other (j) | 13.0 | 4.0 | 0.7 | ||||||||
Adjusted Net Income | 128.2 | 105.7 | 98.2 | ||||||||
Income tax expense | 24.7 | 17.6 | 20.4 | ||||||||
Interest expense, net | 44.5 | 60.9 | 68.0 | ||||||||
Depreciation expense | 29.9 | 28.6 | 26.8 | ||||||||
Adjusted EBITDA | $ | 227.3 | $ | 212.8 | $ | 213.4 | |||||
(a) | Non-cash currency effect on intercompany advances primarily relates to advances denominated in foreign currencies. The most significant exposure relates to the Canadian dollar pursuant to intercompany advances associated with the acquisition of Mold-Masters. |
(b) | Organizational redesign costs for the year ended December 31, 2017 primarily include $17.6 million for termination costs as a result of eliminated positions, $21.7 million of costs related to relocating our facilities in Belgium, Italy and Germany to the Czech Republic and $4.0 million of costs related to our facility consolidation in North America. Organizational redesign costs for the year ended December 31, 2016 primarily include $13.3 million for termination costs as a result of eliminated positions, $4.4 million of costs related to the shutdown of facilities, $5.2 million of costs related to relocating our facilities in Belgium, Italy and Germany to the Czech Republic and $0.5 million of costs related to the restructuring of Fluids in Europe. Organizational redesign costs in the year ended December 31, 2015 primarily included $9.3 million of costs related to relocating our facilities in Italy and Belgium to the Czech Republic, $4.4 million for termination costs as a result of eliminated positions, $3.7 million of costs related to the restructuring of Fluids in Europe, and $1.4 million of costs related to the shutdown of facilities. |
35
(c) | Long-term equity awards and shareholder fees include the charges associated with stock-based compensation awards granted to certain executives and independent directors and a cash advisory fee paid to CCMP in the years ended December 31, 2017, 2016 and 2015. The cash advisory payment to CCMP ceased as of the effective date of our IPO. |
(d) | Debt costs incurred during the year ended December 31, 2017 included $25.2 million of debt extinguishment costs and $1.9 million of fees related to the $947.0 million senior secured term loan facility due September 2023. Debt costs incurred during the year ended December 31, 2015 included $22.2 million of debt extinguishment costs and $1.0 million of fees related to the New Term Loan Facility. |
(e) | Acquisition integration costs in year ended December 31, 2015 included a $0.4 million gain for an adjustment to an accrued incentive payment and $1.7 million of costs to introduce the integration and new branding of all Milacron companies. In addition, acquisition integration costs in the year ended December 31, 2015 included $1.9 million of costs related to the Kortec, Inc. ("Kortec"), TIRAD s.r.o. ("TIRAD") and Mold-Masters acquisitions for product line integration and other strategic alignment initiatives. |
(f) | Professional fees in the years ended December 31, 2017 and 2016 included $6.5 million and $4.7 million, respectively, of costs for strategic organizational initiatives. Professional fees in the year ended December 31, 2015 included $2.8 million of fees for readiness initiatives associated with our IPO and $1.9 million of costs for strategic organizational initiatives. |
(g) | Business combination costs relate to certain professional, audit and other fees related to the acquisition of CanGen. |
(h) | Non-cash fair market value adjustments in the year ended December 31, 2016 relate to acquisition accounting for the fair market value of inventory as part of our acquisition of CanGen in the fourth quarter of 2015. |
(i) | The annual effective tax rate adjustment primarily includes the tax benefit associated with reconciling net earnings (loss) to Adjusted Net Income. |
(j) | Other costs for the year ended December 31, 2017 primarily include $7.7 million of costs to write-down the inventory of a discontinued product line and $1.4 million of goodwill impairment. Other costs for the year ended December 31, 2016 includes $1.4 million related to the impairment of certain software licenses and the write-off of a $0.5 million non-trade receivable. Other costs for the year ended December 31, 2015 included a $1.5 million non-cash gain related to the termination of a postretirement medical benefit plan and a non-cash charge of $2.2 million related to the impairment of certain trademarks. |
36
The following table provides a reconciliation of operating earnings, the most comparable U.S. GAAP measure, to Adjusted EBITDA for each of our segments.
Year Ended December 31, | |||||||||||
2017 | 2016 | 2015 | |||||||||
(in millions) | |||||||||||
Operating earnings (loss): | |||||||||||
APPT | $ | 10.6 | $ | 34.9 | $ | 55.3 | |||||
MDCS | 102.5 | 91.4 | 52.1 | ||||||||
Fluids | 20.7 | 17.4 | 12.9 | ||||||||
Corporate | (45.8 | ) | (38.1 | ) | (48.5 | ) | |||||
Total operating earnings | 88.0 | 105.6 | 71.8 | ||||||||
Adjustments to operating earnings: | |||||||||||
APPT Adjustments: | |||||||||||
Depreciation and amortization | 19.1 | 20.3 | 19.9 | ||||||||
Currency effect on intercompany advances (a) | (2.0 | ) | (0.1 | ) | — | ||||||
Organizational redesign costs (b) | 45.9 | 22.6 | 7.0 | ||||||||
Acquisition integration costs (e) | — | — | 1.2 | ||||||||
Professional services (f) | 0.8 | 0.6 | 0.2 | ||||||||
Fair market value adjustments (h) | — | 0.3 | — | ||||||||
Other (i) | 11.9 | 3.0 | 2.2 | ||||||||
Total APPT Adjustments | 75.7 | 46.7 | 30.5 | ||||||||
MDCS Adjustments: | |||||||||||
Depreciation and amortization | 33.5 | 33.2 | 35.7 | ||||||||
Currency effect on intercompany advances (a) | (6.9 | ) | (3.0 | ) | 23.2 | ||||||
Organizational redesign costs (b) | 8.3 | 5.2 | 8.3 | ||||||||
Acquisition integration costs (e) | — | — | 1.7 | ||||||||
Professional services (f) | 0.4 | 0.1 | 0.3 | ||||||||
Fair market value adjustments (h) | — | (0.1 | ) | — | |||||||
Other (i) | 0.4 | 0.4 | — | ||||||||
Total MDCS Adjustments | 35.7 | 35.8 | 69.2 | ||||||||
Fluids Adjustments: | |||||||||||
Depreciation and amortization | 4.9 | 5.5 | 6.7 | ||||||||
Organizational redesign costs (b) | 1.4 | 1.0 | 5.0 | ||||||||
Professional services (f) | — | — | 0.1 | ||||||||
Other (i) | (0.1 | ) | 0.5 | — | |||||||
Total Fluids Adjustments | 6.2 | 7.0 | 11.8 | ||||||||
Corporate Adjustments: | |||||||||||
Depreciation and amortization | 1.1 | 0.9 | 0.4 | ||||||||
Currency effect on intercompany advances (a) | 0.2 | 1.5 | 0.1 | ||||||||
Organizational redesign costs (b) | 3.0 | 4.1 | 1.4 | ||||||||
Long-term equity awards and shareholder fees (c) | 9.4 | 7.1 | 22.9 | ||||||||
Debt costs (d) | 1.9 | — | 1.0 | ||||||||
Acquisition integration costs (e) | — | — | 0.8 | ||||||||
Professional services (f) | 5.3 | 4.0 | 4.6 | ||||||||
Business combination costs (g) | — | — | 0.4 | ||||||||
Other (i) | 0.8 | 0.1 | (1.5 | ) | |||||||
Total Corporate Adjustments | 21.7 | 17.7 | 30.1 | ||||||||
Adjusted EBITDA: | |||||||||||
APPT | 86.3 | 81.6 | 85.8 | ||||||||
MDCS | 138.2 | 127.2 | 121.3 | ||||||||
Fluids | 26.9 | 24.4 | 24.7 | ||||||||
Corporate | (24.1 | ) | (20.4 | ) | (18.4 | ) | |||||
Total Adjusted EBITDA | $ | 227.3 | $ | 212.8 | $ | 213.4 | |||||
37
(a) | Non-cash currency effect on intercompany advances primarily relates to advances denominated in foreign currencies. The most significant exposure relates to the Canadian dollar pursuant to intercompany advances associated with the acquisition of Mold-Masters within the MDCS segment. |
(b) | Organizational redesign costs in the year ended December 31, 2017 included $13.0 million for termination costs as a result of eliminated positions and $20.8 million of costs related to relocating our facilities in Italy and Germany to the Czech Republic in APPT. Organizational redesign costs in the year ended December 31, 2017 also included $1.8 million of termination costs as a result of eliminated positions and $4.0 million of costs related to our facility consolidation in North America within MDCS. Organizational redesign costs in the year ended December 31, 2016 included $4.4 million of costs related to the shutdown of facilities in APPT, $5.1 million of costs related to relocating our facilities in Belgium, Italy and Germany to the Czech Republic in APPT and MDCS and $0.5 million of costs related to the restructuring of Fluids in Europe. In the year ended December 31, 2016, organizational redesign costs across all segments included $13.3 million for termination costs as a result of eliminated positions. Organizational redesign costs in APPT and MDCS segments in the year ended December 31, 2015 included $4.3 million and $5.0 million for costs related to relocating our facilities in Italy and Belgium to the Czech Republic, respectively. As incurred at the respective segments, organizational redesign costs in the year ended December 31, 2015 included $4.4 million for termination costs as a result of eliminated positions. Organizational redesign costs for Fluids during the year ended December 31, 2015 included $3.7 million of severance and one-time project costs related to restructuring in Europe. |
(c) | Long-term equity options and shareholder fees in Corporate included the non-cash charges associated with stock-based compensation awards granted to certain executives and independent directors and a cash advisory fee paid to CCMP in the years ended December 31, 2017, 2016 and 2015. The cash advisory payment to CCMP ceased as of the effective date of our IPO. |
(d) | Debt costs incurred during the year ended December 31, 2017 included $1.9 million of fees related to the 2017 Term Loan Facility. Debt costs incurred during the year ended December 31, 2015 included $1.0 million of fees to increase the New Term Loan Facility. |
(e) | Acquisition integration costs for MDCS in the year ended December 31, 2015 included a $0.4 million gain for an adjustment to an accrued incentive payment and $1.8 million related to the Kortec, TIRAD and Mold-Masters acquisitions for product line integration and other strategic alignment initiatives. Both APPT and Corporate acquisition integration costs for the year ended December 31, 2015 included $0.7 million of one-time costs to introduce the integration and new branding of all Milacron companies, respectively. |
(f) | Professional fees incurred by Corporate in the year ended December 31, 2017 and 2016 included $5.3 million and $4.0 million, respectively, of costs for strategic organizational initiatives. Professional fees incurred by Corporate in the year ended December 31, 2015 included $2.0 million of costs for strategic organizational initiatives and $2.6 million of costs for readiness initiatives associated with our IPO. |
(g) | Business combination costs for Corporate relate to certain professional, audit and other fees related to the acquisition of CanGen. |
(h) | Non-cash fair market value adjustments relate to acquisition accounting for the fair market value of inventory as part of our acquisition of CanGen in the fourth quarter of 2015. |
(i) | Other costs in APPT for the year ended December 31, 2017 primarily include $7.7 million of costs to write-down the inventory of a discontinued product line and $1.4 million of goodwill impairment. Other costs for APPT in the year ended December 31, 2016 includes $1.4 million related to the impairment of certain software licenses. Other costs for Fluids in the year ended December 31, 2016 includes the write-off of a $0.5 million non-trade receivable. Other costs in APPT for the year ended December, 31 2015 included a non-cash charge of $2.2 million related to the impairment of certain trademarks. Other costs in Corporate for the year ended December 31, 2015 included a $1.5 million non-cash gain related to the termination of a postretirement medical benefit plan. |
Liquidity and Capital Resources
Our primary source of liquidity is cash generated from operations and availability under our senior secured asset-based revolving credit facility (the "ABL Facility") and other foreign credit facilities. At December 31, 2017, we had cash and cash equivalents of $187.9 million, of which $49.8 million was held in the U.S. and $138.1 million was held by subsidiaries outside of the U.S. However, if such amounts were repatriated to the U.S., additional taxes would likely need to be accrued and paid depending on the source of the earnings remitted. For amounts we plan to repatriate, appropriate taxes have been accrued and we currently have no plans to repatriate any additional amounts for which U.S. or foreign taxes would need to be accrued. At December 31, 2017, we had $64.9 million of availability under the ABL Facility and $13.1 million of availability under other credit facilities. Our primary cash requirements are for working capital, operating expenses, capital expenditures and scheduled payments of principal and interest. We may from time to time seek to retire our outstanding debt. Such events, if any, will depend on prevailing market conditions, our liquidity requirements, contractual restrictions and other factors. The amounts involved may be material.
During the year ended December 31, 2017, we generated $57.7 million of cash compared to $62.7 million in the year ended December 31, 2016. During the year ended December 31, 2017, cash provided by operations was partially offset by capital expenditures and costs incurred in connection with the Company's debt refinancing activity during 2017. During the year ended December 31, 2016, cash provided by operations of $116.2 million was partially offset by capital expenditures.
38
On February 15, 2017, Milacron LLC, a wholly-owned subsidiary of the Company, entered into a new $947.0 million senior secured term loan facility with a maturity date of September 28, 2023 ("2017 Term Loan Facility") pursuant to an amendment of the Company's existing New Term Loan Facility. The net proceeds from the 2017 Term Loan Facility, together with cash on-hand, were used to redeem in full $464.4 million aggregate principal amount outstanding of our Senior Unsecured Notes, repay in full $482.0 million aggregate principal amount outstanding under our existing New Term Loan Facility and pay fees and expenses associated with these transactions. The 2017 Term Loan Facility was priced at 99.625% of the principal amount and bears interest at a rate per annum equal to an applicable margin or applicable rate plus, at our option, either (a) a base rate determined by the reference to the highest of (1) the prime commercial lending rate publicly announced by the administrative agent of the 2017 Term Loan Facility as the “prime rate” as in effect on such day, (2) the federal funds effective rate plus 0.50%, and (3) the LIBOR rate determined by reference to the cost of funds for Eurodollar deposits for an interest period of one month, plus 1.00% or (b) a LIBOR rate (which shall be no less than 0.00%) determined by reference to the costs of funds for Eurodollar deposits for the specified interest period, as adjusted for certain statutory reserve requirements. The applicable margins for borrowings are (i) 2.00% with respect to base rate borrowings and 3.00% with respect to LIBOR borrowings, subject to compliance with a total net leverage ratio of greater than 3.50 to 1.00 and (ii) 1.75% with respect to base rate borrowings and 2.75% with respect to LIBOR borrowings, subject to compliance with a total net leverage ratio not to exceed 3.50 to 1.00.
On November 8, 2017, the Company re-priced the 2017 Term Loan Facility. The applicable margins for borrowings are now (i) 1.75% with respect to base rate borrowings and 2.75% with respect to LIBOR borrowings, subject to compliance with a total net leverage ratio of greater than 3.50 to 1.00 and (ii) 1.50% with respect to base rate borrowings and 2.50% with respect to LIBOR borrowings, subject to compliance with a total net leverage ratio not to exceed 3.50 to 1.00. No other terms of the facility were changed.
We believe that our current level of operations, our cash and cash equivalents, cash flow from operations and borrowings under our ABL Facility, 2017 Term Loan Facility and other foreign lines of credit will provide us adequate cash to fund the operating needs, working capital, capital expenditure, debt service and other requirements for our business for the foreseeable future. Our ability to make scheduled payments of principal or interest on, or to refinance, our indebtedness or to fund working capital requirements, capital expenditures and other current obligations will depend on our ability to generate cash from operations. Such cash generation is subject to general economic, financial, competitive and other factors that are beyond our control. We have unused availability, subject to certain terms and conditions and other limitations, of $78.0 million under these lines of credit.
The following table shows our statements of cash flows for the years ended December 31, 2017, 2016 and 2015:
Year Ended December 31, | |||||||||||
2017 | 2016 | 2015 | |||||||||
(in millions) | |||||||||||
Statements of cash flow data | |||||||||||
Net cash provided by operating activities | $ | 110.4 | $ | 116.2 | $ | 36.8 | |||||
Net cash used in investing activities | (38.1 | ) | (56.4 | ) | (73.3 | ) | |||||
Net cash (used in) provided by financing activities | (21.9 | ) | 6.2 | 27.8 | |||||||
Cash provided by operating activities
Operating activities for the year ended December 31, 2017 generated $110.4 million of cash compared to $116.2 million for the year ended December 31, 2016. The decrease was primarily driven by a reduction in working capital improvements when compared to the prior year.
Operating activities for the year ended December 31, 2016 generated $116.2 million of cash compared to $36.8 million for the year ended December 31, 2015. The increase was primarily driven by improvements in working capital including the collection of outstanding accounts receivable and an increase in advanced billings and deposits received.
Cash used in investing activities
Investing activities for the year ended December 31, 2017 used $38.1 million of cash compared to $56.4 million of cash for the year ended December 31, 2016. The decrease is a result of a reduction in capital expenditures during the year ended December 31, 2017. Capital expenditures during the year ended December 31, 2016 included $10.8 million related to the purchase of two properties located in Ontario, Canada which were previously leased and subsequently sold during the year ended December 31, 2017.
39
Investing activities for the year ended December 31, 2016 used $56.4 million of cash compared to $73.3 million of cash for the year ended December 31, 2015. The decrease is a result of the CanGen acquisition which occurred in 2015, partially offset by an increase in capital expenditures during the year ended December 31, 2016. Capital expenditures for the year ended December 31, 2016 include the Company's $10.8 million purchase in the fourth quarter of two properties located in Halton Hills, Ontario, Canada which were previously leased.
Cash (used in) provided by financing activities
Financing activities for the year ended December 31, 2017 used $21.9 million compared to generating $6.2 million for the year ended December 31, 2016. During the year ended December 31, 2017, cash was used primarily for an $18.0 million premium paid and other debt refinancing costs incurred in connection with the debt refinancing activity during the first and fourth quarters of 2017. These outflows were partially offset by proceeds received in connection with the Company's lease financing transaction during the second quarter of 2017 and from the exercise of stock options. During the year ended December 31, 2016, cash was generated primarily from proceeds on the exercise of stock options, partially offset by the repurchase of $0.6 million of our Senior Unsecured Notes.
Financing activities for the year ended December 31, 2016 generated $6.2 million compared to $27.8 million for the year ended December 31, 2015. During the year ended December 31, 2016, cash was generated primarily from proceeds on the exercise of stock options, partially offset by the repurchase of $0.6 million of our Senior Unsecured Notes. During the year ended December 31, 2015, cash was generated from the proceeds of our IPO and the New Term Loan Facility, partially offset by the payment of dividends, the redemption of our Senior Secured Notes and the Term Loan Facility and costs associated with our IPO.
Excluding unamortized discount and debt issuance costs, total debt was $945.1 million at December 31, 2017 compared to $953.8 million at December 31, 2016. Total debt at December 31, 2017 included $937.5 million outstanding on the 2017 Term Loan Faciliy while the ABL Facility was undrawn except for letter of credit issuances.
Description of the ABL Facility
On April 30, 2012, we entered into the ABL Facility with Merrill Lynch, Pierce, Fenner & Smith Incorporated, RBC Capital Markets and Barclays Bank PLC, as joint lead arrangers and bookrunners which was amended and restated on March 28, 2013. The ABL Facility has a five-year term, bears interest at a floating rate and provides for an aggregate principal amount of $70.0 million of loans under the U.S. sub-facility thereunder and for an aggregate principal amount of $30.0 million of loans under the Canadian sub-facility thereunder, each subject to a borrowing base and other limitations. We have the right at any time to request up to $20.0 million of additional commitments. The existing lenders under the ABL Facility are not under any obligation to provide such additional commitments, and any increase in commitments is subject to customary conditions precedent. On March 17, 2014, we exercised our right to increase the U.S. sub-facility of the ABL Facility by $10.0 million to $80.0 million and decrease the Canadian sub-facility by $10.0 million to $20.0 million. The covenants and other terms of the ABL Facility were not changed. On October 17, 2014, the ABL Facility was amended and restated to add a $25.0 million German sub-facility and the term was reset to mature on February 14, 2019 or October 17, 2019 subject to the satisfaction of certain conditions on or prior to February 14, 2019. The covenants and other terms of the ABL Facility were not materially changed. On May 15, 2015, the credit agreement governing the ABL Facility was amended and restated to, among other things, conform certain terms to the credit agreement governing the New Term Loan Facility. We had approximately $29.1 million of letters of credit outstanding as of December 31, 2017.
The obligations under the ABL Facility are secured, subject to certain exceptions, by substantially all of the assets of the borrowers and the assets of the guarantors under such facility. In addition, the ABL Facility includes certain customary negative covenants that, subject to exceptions, limit the ability of the borrowers and their restricted subsidiaries to incur additional indebtedness, pay dividends or certain other distributions on the Company’s capital stock, repurchase the Company’s capital stock, prepay subordinated indebtedness, incur liens on assets, make certain investments or other restricted payments, engage in transactions with affiliates, sell certain assets, merge or consolidate with or into other companies and alter the business that the Company conducts.
Description of the Senior Secured Notes
On April 30, 2012, we issued $275.0 million aggregate principal amount of Senior Secured Notes pursuant to an indenture, dated as of April 30, 2012, among the Company, Mcron Finance Corp, the guarantors party thereto and U.S. Bank National Association, as Trustee and Notes Collateral Agent.
On April 29, 2014 and April 30, 2014, we redeemed a combined $55.0 million of our Senior Secured Notes. On May 15, 2015, we redeemed the remaining $220.0 million of our Senior Secured Notes.
40
Description of the Term Loan Facility
On March 28, 2013, we entered into the $245.0 million Term Loan Facility, with a 50 basis point discount, pursuant to a term loan agreement, among the Company and Milacron LLC, the guarantors party thereto, and J.P. Morgan Securities LLC, Merrill Lynch, Pierce, Fenner & Smith Incorporated, Credit Suisse Securities (USA) LLC, Barclays Bank PLC and RBC Capital Markets as joint lead arrangers and bookrunners.
On March 31, 2014, we exercised our right to request an incremental term increase and borrowed an additional $100.0 million, net of a discount of $0.5 million, under the Term Loan Facility for the principal purpose of funding acquisitions in 2014 as well as refinancing portions of our outstanding debt. The agreement was also amended to reduce the margin on the interest rate from 3.25% to 3.00% for LIBOR loans and from 2.25% to 2.00% for non-LIBOR loans. No other terms of the facility were changed. On May 14, 2015 we repaid $339.1 million, which represents all amounts outstanding under the Term Loan Facility.
Description of the Senior Unsecured Notes
On March 28, 2013, we issued $465.0 million aggregate principal amount of Senior Unsecured Notes pursuant to an indenture, among the Company, Mcron Finance Corp, the guarantors party thereto and U.S. Bank National Association, as Trustee (the “2013 Indenture”). The Senior Unsecured Notes were set to mature on February 15, 2021 and interest on the Senior Unsecured Notes was payable semi-annually on February 15 and August 15 of each year. The Senior Unsecured Notes were issued in a private transaction that is not subject to the registration requirements of the Securities Act. The Senior Unsecured Notes were guaranteed, jointly and severally, on a senior unsecured basis by Milacron Holdings Corp. and each of our wholly-owned domestic subsidiaries that are obligors under our ABL Facility and New Term Loan Facility. The Senior Unsecured Notes were redeemable, in whole or in part, at any time on or after February 15, 2016 on the redemption dates and at the redemption prices set forth in the 2013 Indenture. In addition, we may redeem up to 40% of the Senior Unsecured Notes before February 15, 2016 with the net cash proceeds from certain equity offerings. We may also redeem some or all of the Senior Unsecured Notes before February 15, 2016 at a redemption price of 100% of the principal amount thereof plus accrued and unpaid interest, if any, to the redemption date, plus a ‘‘make whole’’ premium. In addition, we may be required to make an offer to purchase the Senior Unsecured Notes upon the sale of certain assets and upon a change of control.
As noted above, on February 15, 2017 we redeemed the remaining $464.4 million aggregate principal amount outstanding of our Senior Unsecured Notes.
Description of the New Term Loan Facility
On May 14, 2015, we entered into the $730.0 million New Term Loan Facility, pursuant to a term loan agreement, among Milacron Holdings Corp., Milacron LLC, the guarantors party thereto, the lenders party thereto and JPMorgan Chase Bank, N.A., as administrative agent. The New Term Loan Facility was set to mature on September 28, 2020. The New Term Loan Facility ranked equal in right of payment with all existing and future senior indebtedness of the issuers and guarantors. The New Term Loan Facility was also secured by a second-priority lien on all of the assets of the Company, Milacron LLC and the guarantors that secure the ABL Facility. The interest rate applicable to the New Term Loan Facility was, at our option, equal to either (i) the published LIBOR rate, plus a margin of, depending upon the current total net leverage ratio, 3.25% (if our total net leverage ratio is less than or equal to 4.00 to 1.00) to 3.50% (if our total net leverage ratio is greater than 4.00 to 1.00) per annum or (ii) the greater of (1) the prime rate, (2) the federal funds rate plus 0.50% per annum, (3) published LIBOR rate plus 1.00% or (4) 2.00% per annum, plus depending upon the current total net leverage ratio, 2.25% (if our total net leverage ratio is less than or equal to 4.00 to 1.00) to 2.50% (if our total net leverage ratio is greater than 4.00 to 1.00) per annum. In no event will the LIBOR rate be less than 1.00% at any time.
On June 30, 2015 we completed our IPO whereby the Company sold 14,285,714 shares of common stock at a price of $20.00 per share. The net proceeds, in part, were used to repay $248.0 million outstanding under the New Term Loan Facility. On February 15, 2017 we repaid $482.0 million, which represented all amounts outstanding under the New Term Loan Facility.
41
Description of the 2017 Term Loan Facility
On February 15, 2017, we entered into the $947.0 million 2017 Term Loan Facility, pursuant to a term loan agreement, among Milacron Holdings Corp., Milacron LLC, the guarantors party thereto, the lenders party thereto and JPMorgan Chase Bank, N.A., as administrative agent. The 2017 Term Loan Facility matures on September 28, 2023. The 2017 Term Loan Facility is secured by a first-priority lien on substantially all of the Company and guarantors’ assets other than accounts receivable, inventory, and other certain assets. The 2017 Term Loan Facility is also secured by a second-priority lien on all of the assets of the Company, Milacron LLC and the guarantors that secure the ABL Facility. The interest rate applicable to the 2017 Term Loan Facility is, at our option, equal to either (i) the published LIBOR rate, plus a margin of, depending upon the current total net leverage ratio, 2.75% (if our total net leverage ratio is less than or equal to 3.50 to 1.00) to 3.00% (if our total net leverage ratio is greater than 3.50 to 1.00) per annum or (ii) the greater of (1) the prime rate, (2) the federal funds rate plus 0.50% per annum or (3) published LIBOR rate plus 1.00%. In no event will the LIBOR rate be less than 0.00% at any time. The 2017 Term Loan Facility provides us with the right, at any time, to request one or more incremental term increases not to exceed (x) $220.0 million plus (y) an additional amount subject to compliance on a pro forma basis with a total net secured leverage ratio not to exceed 4.00 to 1.00. The following amounts will be applied to repay the New Term Loan Facility, subject to certain thresholds, carve-outs and exceptions: (i) 100% of the net cash proceeds of any incurrence of debt by us and certain of our subsidiaries, (ii) 100% of net cash proceeds of any non-ordinary course sale or other disposition of assets by us or certain subsidiaries and (iii) 50% of our excess cash flow, subject to certain reductions.
On November 8, 2017, the Company re-priced the 2017 Term Loan Facility. The applicable margins for borrowings are now (i) 1.75% with respect to base rate borrowings and 2.75% with respect to LIBOR borrowings, subject to compliance with a total net leverage ratio of greater than 3.50 to 1.00 and (ii) 1.50% with respect to base rate borrowings and 2.50% with respect to LIBOR borrowings, subject to compliance with a total net leverage ratio not to exceed 3.50 to 1.00. No other terms of the facility were changed.
Description of Other Debt
At December 31, 2017, we had approximately $0.2 million in capital lease obligations outstanding as well as $7.4 million of borrowings under certain lines of credit. We also had approximately $2.5 million of outstanding letters of credit and other commitments related to these facilities at December 31, 2017.
Contractual Obligations
The following table summarizes our contractual obligations as of December 31, 2017:
Total | 2018 | 2019 - 2020 | 2021 - 2022 | Beyond 2022 | ||||||||||||||||
(in millions) | ||||||||||||||||||||
2017 Term Loan Facility | $ | 937.5 | $ | 9.4 | $ | 19.0 | $ | 19.0 | $ | 890.1 | ||||||||||
Interest on long term debt (a) | 229.3 | 40.9 | 80.6 | 79.0 | 28.8 | |||||||||||||||
Capital lease obligations and other | 0.2 | 0.1 | 0.1 | — | — | |||||||||||||||
Estimated pension benefit payments (b) | 13.1 | 1.0 | 2.1 | 2.7 | 7.3 | |||||||||||||||
Operating leases | 34.3 | 10.3 | 12.3 | 6.5 | 5.2 | |||||||||||||||
Total (c) | $ | 1,214.4 | $ | 61.7 | $ | 114.1 | $ | 107.2 | $ | 931.4 | ||||||||||
(a) Amounts include contractual interest payments using the interest rates as of December 31, 2017 applicable to our variable-rate debt and stated fixed interest rates for fixed-rate debt.
(b) Amounts include estimated pension benefit payments based on actuarial estimates and are estimated through 2027.
(c) The table excludes tax liability payments, including those for unrecognized tax benefits. See Note 4 of the Notes to Consolidated Financial Statements for additional information.
Off-balance Sheet Arrangements
As part of its normal course of business, Milacron is a party to various financial guarantees and other commitments. These arrangements involve elements of performance and credit risk that are not included in the Consolidated Balance Sheets. The possibility that Milacron would have to make actual cash expenditures in connection with these obligations is largely dependent on the performance of the guaranteed party, or the occurrence of future events that Milacron is unable to predict. Milacron has reserved the approximate fair value of these guarantees in accordance with U.S. GAAP.
42
Critical Accounting Policies and Estimates
We prepare our consolidated financial statements in conformity with U.S. GAAP and our significant accounting policies are described in Note 1 of the Notes to Consolidated Financial Statements within "Item 8. Financial Statements and Supplementary Data." The preparation of financial statements in conformity with U.S. GAAP requires us to make estimates and assumptions that affect reported amounts and related disclosures. We base our estimates and judgments on historical experience and other relevant factors that we believe to be reasonable under the circumstances, the results of which form the basis for making judgments about the carrying values of assets and liabilities that are not readily apparent from other sources. Actual results may differ from these estimates under different assumptions or conditions. We have identified below the accounting policies and estimates that we believe are most critical in compiling our consolidated statements of financial condition and operating results.
Revenue Recognition
We record revenue on products when persuasive evidence of an arrangement exists, legal title has passed and the risk and rewards of ownership are transferred, the sales price is fixed and determinable, all significant contractual obligations have been satisfied and the collectability of the sales price is reasonably assured.
We continually evaluate the creditworthiness of our customers and enter into sales contracts only when collection of the sales price is reasonably assured. For sales of plastic processing equipment, customers are generally required to make substantial down-payments prior to shipment which helps to ensure collection of the full price. The estimate of the allowance for doubtful accounts is our best estimate of the amount of probable credit loss in our existing accounts receivable. We regularly review the adequacy of our allowance for doubtful accounts. We determine the allowance based upon an analysis of prior collection experience, specific customer creditworthiness and economic trends within the industries we serve. In circumstances where we are aware of a specific customer’s inability to meet its financial obligation (e.g., bankruptcy filings), we record a specific reserve to reduce the receivable to the amount reasonably believed to be collected.
Goodwill and Indefinite-Lived Intangible Assets
We perform an annual impairment assessment for goodwill and intangible assets with indefinite useful lives as of October 1, or more frequently when impairment indicators exist. The annual impairment assessment for goodwill is performed at the reporting unit level, which is at the operating segment level or one level below the operating segment. We may first perform a qualitative assessment which includes assessing a range of qualitative factors including, but not limited to, macroeconomic conditions, industry conditions, the competitive environment, changes in the market for the Company’s products and services, regulatory and political developments, entity-specific factors such as strategies and financial performance, when evaluating the potential for impairment of goodwill. For reporting units in which this assessment concludes that it is more likely than not that the fair value is more than its carrying value, goodwill is not considered impaired. For reporting units in which this impairment assessment is not conclusive that it is more likely than not that the fair value is greater than its carrying value, we compare the estimated fair value of each reporting unit to its carrying value, including goodwill. If the estimated fair value exceeds the carrying amount, then no impairment exists.
For all of our reporting units in 2017, we performed the aforementioned comparison whereby we compared the estimated fair value of the reporting unit to its carrying value, including goodwill. For one of our reporting units, the carrying value exceeded the estimated fair value and as a result a $1.4 million impairment was recognized during the year ended December 31, 2017 within our APPT segment. The estimated fair value of each reporting unit exceeded the carrying amount for all other periods presented. The estimated fair value of all reporting units is determined by using a discounted cash flow approach, with an appropriate risk adjusted discount rate, and a market approach. The significant estimates and assumptions utilized in determining the estimated fair value of each reporting unit included projected sales growth, operating earnings rates, working capital requirements, capital expenditures, terminal growth rates, discount rates per reporting unit and the selection of peer company multiples. We also used comparable market earnings multiple data to corroborate our reporting unit valuation. Due to the historical and projected performance of all other reporting units, we believe that it is more likely than not that the fair value of this reporting unit exceeds the carrying amount, unless future sales and cash flow projections differ significantly from our current estimates as a result of unforeseen circumstances or if the assumed weighted-average cost of capital were to become substantially higher in future periods.
Indefinite-lived intangible assets relate to certain unamortized trade names. The estimated fair value of these assets, as calculated during our annual impairment test, are determined using a relief from royalty valuation methodology similar to that employed when the associated assets were acquired. Significant assumptions used under this approach include sales projections, the royalty rate and the weighted-average cost of capital for each of the respective assets. Due to the historical and projected performance for the reporting units which hold indefinite-lived trade names, we do not believe there is a reasonable likelihood these assets could be impaired, unless future sales and cash flow projections differ significantly from our current estimates as a result of unforeseen circumstances.
43
If actual results are materially inconsistent with our estimates or assumptions for any of the above assessments, we may be exposed to impairment charges in future periods.
Long-Lived Assets
Expenditures for long-lived assets, including property and equipment and definite-lived intangible assets, are recorded at cost and are generally depreciated using the straight-line method over the estimated useful lives of the assets. Long-lived assets are reviewed for impairment whenever events or changes in circumstances indicate that the carrying amount of an asset may not be recoverable. Examples of events or changes in circumstances could include, but are not limited to, a prolonged economic downturn, current period operating or cash flow losses combined with a history of losses or a forecast of continuing losses associated with the use of an asset group, or a current expectation that an asset group will be sold or disposed of before the end of its previously estimated useful life. Recorded values of long-lived assets that are not expected to be recovered through undiscounted future cash flows are written down to current fair value, which generally is determined from estimated discounted future net cash flows (for assets held for use) or net realizable value (for assets held for sale).
The carrying values of long-lived assets are reviewed if facts and circumstances indicate potential impairment of their carrying value. If the review indicates that the long-lived assets are impaired, as determined by the undiscounted cash flow method, the carrying value will be reduced to the estimated fair value.
Defined Benefit Pension Plans
The determination of pension obligations and the related pension expense or credits to operations for our defined benefit plans (“Plans”) involves significant estimates. The most significant estimate is the discount rate used to calculate the actuarial present value of benefit obligations for each Plan. Accumulated and projected benefit obligations are measured as the present value of expected payments. We discount those cash payments using the weighted average of market-observed yields for high-quality fixed-income securities with maturities that correspond to the payment of benefits. Lower discount rates increase present values and subsequent-year pension expense; higher discount rates decrease present values and subsequent-year pension expense. The weighted-average discount rates for our Plans at December 31, 2017, 2016 and 2015 were 1.80%, 2.71% and 2.44%, respectively. We evaluate the discount rates for our Plans at least annually on a plan and country-specific basis. We periodically evaluate other assumptions involving demographic factors such as retirement age, mortality and turnover, and update them to reflect our experience and expectations for the future. Actual results in any given year will often differ from actuarial assumptions because of economic and other factors.
Income Taxes
We are subject to income taxes in the United States and numerous foreign jurisdictions. Significant judgment in the forecasting of taxable income using historical and projected future operating results is required in determining our provision for income taxes and the related assets and liabilities. The provision for income taxes includes income taxes paid, currently payable or receivable and deferred taxes including those related to investments in foreign subsidiaries that are not permanent in nature. Under U.S. GAAP, deferred tax assets and liabilities are recognized for future tax consequences attributable to temporary differences between financial statement carrying amounts of existing assets and liabilities and their respective tax bases. Deferred tax assets and liabilities are measured using enacted tax rates expected to apply to taxable income in the years in which those temporary differences are expected to be settled or realized. Deferred tax assets are also recognized for the estimated future effects of tax loss carryforwards. The effect on deferred taxes of changes in tax rates is recognized in the period in which the enactment date occurs.
Valuation allowances are established when necessary on a jurisdictional basis to reduce deferred tax assets to the amounts expected to be realized. The recoverability of deferred tax assets and the recognition and measurement of uncertain tax positions are subject to various assumptions and judgment. If actual results differ from the estimates made in establishing or maintaining valuation allowances against deferred tax assets, the resulting change in the valuation allowance would generally impact earnings or other comprehensive income depending on the nature of the respective deferred tax asset. Positive and negative evidence is considered in determining the need for a valuation allowance against deferred tax assets, which includes such evidence as historical earnings, projected future earnings, tax planning strategies and expected timing of reversal of existing temporary differences.
In determining the recoverability of deferred tax assets, we give consideration to all available positive and negative evidence including reversals of deferred tax liabilities (other than those with an indefinite reversal period), projected future taxable income, tax planning strategies and recent financial operations. We reflect increases and decreases in our valuation allowances based on the overall weight of positive versus negative evidence on a jurisdiction by jurisdiction basis.
44
At December 31, 2017, as a result of an updated analysis of future cash needs in the U.S. and opportunities for investment outside the U.S., we assert that all foreign earnings will be indefinitely reinvested with the exception of certain foreign investments in which earnings and cash generation are in excess of local needs. We will continue to monitor our assertion related to investment of foreign earnings. In the event that the actual outcome of future tax consequences differs from our estimates and assumptions due to changes or future events such as tax legislation, geographic mix of earnings, completion of tax audits or earnings repatriation plans, the resulting change to the provision for income taxes could have a material effect on our consolidated financial statements.
On December 22, 2017, the Tax Act was enacted that institutes fundamental changes to the taxation of multinational corporations. The Tax Act reduces the corporate tax rate to 21%, repeals the alternative minimum tax, limits the interest deduction, enhances the expensing of capital investments, implements a dividend exemption system, eliminates the deferral of foreign earnings, provides a minimum tax on low-taxed foreign earnings and new measures to deter base erosion. As part of the transition to the new tax system, the Act imposes a one-time transition tax on historical undistributed earnings of foreign affiliates through the year ended December 31, 2017. The Global Intangible Low-Taxed Income ("GILTI") provisions of the Tax Act also require the Company to include in its U.S. income tax return foreign subsidiary earnings in excess of an allowable return on the foreign subsidiary’s tangible assets. The Company expects that it will have incremental U.S. taxable income as a result of the GILTI provisions beginning in 2018. The FASB states that an entity can make an accounting policy election to either recognize deferred taxes for temporary basis differences expected to reverse as GILTI in future years or provide for the tax expense related to GILTI in the year the tax is incurred. Given the complexity of the GILTI provisions, the Company is still evaluating the effects of the GILTI provisions and has not yet determined its accounting policy. At December 31, 2017, because the Company is still evaluating the GILTI provisions and the Company's analysis of future taxable income that is subject to GILTI, the Company is unable to make a reasonable estimate and have not reflected any adjustments related to GILTI in the Company's consolidated financial statements.
Recently Issued Accounting Pronouncements
For information on recent accounting pronouncements, see Note 1 to the Notes to Consolidated Financial Statements appearing in "Item 8. of Financial Statements and Supplementary Data."
45
ITEM 7A. QUANTITATIVE AND QUALITATIVE DISCLOSURES ABOUT MARKET RISK
Market Risk
We are exposed to financial market risks associated with foreign currency exchange rates, interest rates, commodity prices and credit risk. In the normal course of business and in accordance with our policies, we manage these risks through a variety of strategies, which may include the use of derivative financial instruments to hedge our underlying exposure. We do not use derivative instruments for speculative or trading purposes and we have policies and procedures in place that monitor and control their use.
Foreign Currency Exchange Rate Risk
We operate in international markets and, accordingly, our competitiveness and financial results are subject to foreign currency fluctuations where revenues and costs are denominated in currencies other than the U.S. dollar. During the years ended December 31, 2017, 2016 and 2015, approximately 57%, 53% and 51% of our sales were attributable to our operations outside of the United States, respectively. Approximately 48% of sales in fiscal 2017 were typically denominated in currencies other than the U.S. dollar, whereas a significant portion of our fixed costs, including payments made on our senior secured asset-based revolving credit facility ("ABL Facility") and our senior secured term loan facility due September 2023 ("2017 Term Loan Facility"), are denominated in U.S. dollars. Our earnings could be materially impacted particularly by movement in the exchange rate between the Canadian dollar, the Euro, the Chinese yuan renminbi, the Indian rupee and the U.S. dollar.
We occasionally use foreign currency forward exchange contracts to hedge our exposure to adverse changes in foreign currency exchange rates related to known or expected cash flow exposures arising from international transactions. At December 31, 2017 and 2016, we had $5.1 million and $12.8 million, respectively, notional amount of forward exchange contracts outstanding with remaining maturities of up to three months. At December 31, 2017, the net fair value of financial instruments with exposure to foreign currency risk was insignificant at December 31, 2016, the net fair value liability of financial instruments with exposure to foreign currency risk was $0.6 million. The fair value of these financial instruments would hypothetically decrease by $0.5 million and $1.2 million as of December 31, 2017 and 2016, respectively, if the U.S. dollar were to appreciate against all other currencies by 10% of current levels.
Interest Rate Risk
We are primarily exposed to interest rate risk through our ABL Facility, our 2017 Term Loan Facility and other foreign lines of credit. Interest on our ABL Facility accrues, at our option, at either (i) LIBOR plus a margin of 1.75% to 2.25% per annum, based on availability or (ii) the highest rate of (a) the prime rate, (b) the federal funds rate plus 0.50% per annum, or (c) LIBOR plus 1.00% per annum, plus a margin of 0.75% to 1.25% per annum, based on availability. Interest on the 2017 Term Loan Facility accrues, at our option, equal to either (i) the published LIBOR rate, plus a margin of 2.50% (if our total net leverage ratio is less than or equal to 3.50 to 1.00) or 2.75% (if our total net leverage ratio is greater than 3.50 to 1.00) per annum or (ii) the greater of (1) the prime rate, (2) the federal funds rate plus 0.50% per annum, (3) published LIBOR rate plus 1.00% or (4) 2.00% per annum, plus 1.50% (if our total net leverage ratio is less than or equal to 3.50 to 1.00) or 1.75% (if our total net leverage ratio is greater than 3.50 to 1.00) per annum. In no event will the LIBOR rate be less than 0.00% at any time. We currently estimate that our annual interest expense on floating rate indebtedness would increase by approximately $9.4 million for each 1.00% increase in interest rates.
In order to manage this risk, on February 16, 2017, Milacron LLC, a wholly-owned subsidiary of the Company, entered into two interest rate swap transactions effective for a period of four years beginning January 31, 2018 with a total notional amount of $400.0 million. The interest rate swaps are intended to manage the Company's interest rate risk by fixing the interest rate on a portion of the Company's debt outstanding under the 2017 Term Loan Facility that was previously subject to a floating interest rate equal to 1-month LIBOR plus a credit spread. The swaps provide for the Company to pay a fixed rate of 2.062% per annum on such portion of the outstanding debt in exchange for receiving a variable interest rate based on 1-month LIBOR. The effect is a synthetically fixed rate of 2.062% plus the loan spread for the term and debt hedged.
Commodity Risk
We have direct and indirect exposure to certain commodities, principally steel and steel-based components. We typically do not enter into derivative financial instruments to hedge our commodity price risk and we do not currently have long-term supply contracts with key suppliers. While future movements of steel costs are uncertain, we respond to this volatility in a number of ways, including strategic steel purchases and customer price adjustments.
46
ITEM 8. FINANCIAL STATEMENTS AND SUPPLEMENTARY DATA
Index to Consolidated Financial Statements | ||
Page | ||
Consolidated Financial Statements: | ||
47
REPORT OF INDEPENDENT REGISTERED PUBLIC ACCOUNTING FIRM
The Board of Directors and Shareholders
Milacron Holdings Corp.
Opinion on the Financial Statements
We have audited the accompanying consolidated balance sheets of Milacron Holdings Corp. (the Company) as of December 31, 2017 and 2016, the related consolidated statements of operations, comprehensive income (loss), shareholders' equity and cash flows for each of the three years in the period ended December 31, 2017, and the related notes and financial statement schedule listed in the Index at Item 15(a)(2) (collectively referred to as the “consolidated financial statements”). In our opinion, the consolidated financial statements present fairly, in all material respects, the financial position of the Company at December 31, 2017 and 2016, and the results of its operations and its cash flows for each of the three years in the period ended December 31, 2017, in conformity with U.S. generally accepted accounting principles.
We also have audited, in accordance with the standards of the Public Company Accounting Oversight Board (United States) (PCAOB), the Company's internal control over financial reporting as of December 31, 2017, based on criteria established in Internal Control-Integrated Framework issued by the Committee of Sponsoring Organizations of the Treadway Commission (2013 framework), and our report dated February 28, 2018 expressed an unqualified opinion thereon.
Basis for Opinion
These financial statements are the responsibility of the Company's management. Our responsibility is to express an opinion on the Company’s financial statements based on our audits. We are a public accounting firm registered with the PCAOB and are required to be independent with respect to the Company in accordance with the U.S. federal securities laws and the applicable rules and regulations of the Securities and Exchange Commission and the PCAOB.
We conducted our audits in accordance with the standards of the PCAOB. Those standards require that we plan and perform the audit to obtain reasonable assurance about whether the financial statements are free of material misstatement, whether due to error or fraud. Our audits included performing procedures to assess the risks of material misstatement of the financial statements, whether due to error or fraud, and performing procedures that respond to those risks. Such procedures included examining, on a test basis, evidence regarding the amounts and disclosures in the financial statements. Our audits also included evaluating the accounting principles used and significant estimates made by management, as well as evaluating the overall presentation of the financial statements. We believe that our audits provide a reasonable basis for our opinion.
/s/ Ernst & Young LLP
We have served as the Company’s auditor since 2009.
Cincinnati, Ohio
February 28, 2018
48
MILACRON HOLDINGS CORP.
CONSOLIDATED BALANCE SHEETS
December 31, | |||||||
2017 | 2016 | ||||||
(in millions, except share data) | |||||||
Assets | |||||||
Current assets: | |||||||
Cash and cash equivalents | $ | 187.9 | $ | 130.2 | |||
Accounts receivable, less allowance for doubtful accounts of $6.5 and $8.2 at December 31, 2017 and 2016, respectively | 186.3 | 182.3 | |||||
Inventories, net: | |||||||
Raw materials | 90.2 | 81.3 | |||||
Work-in-process | 56.0 | 52.6 | |||||
Finished products | 121.7 | 115.6 | |||||
Total inventories | 267.9 | 249.5 | |||||
Prepaid and other current assets | 62.8 | 46.3 | |||||
Total current assets | 704.9 | 608.3 | |||||
Property and equipment, net | 260.8 | 243.7 | |||||
Goodwill | 535.1 | 507.9 | |||||
Intangible assets, net | 332.4 | 341.8 | |||||
Other noncurrent assets | 25.6 | 20.3 | |||||
Total assets | $ | 1,858.8 | $ | 1,722.0 | |||
Liabilities and shareholders’ equity | |||||||
Current liabilities: | |||||||
Short-term borrowings | $ | 7.4 | $ | 7.0 | |||
Long-term debt and capital lease obligations due within one year | 9.4 | 0.3 | |||||
Accounts payable | 121.6 | 92.5 | |||||
Advanced billings and deposits | 62.8 | 52.7 | |||||
Accrued salaries, wages and other compensation | 29.7 | 26.7 | |||||
Accrued interest | 0.6 | 13.9 | |||||
Other current liabilities | 75.1 | 59.7 | |||||
Total current liabilities | 306.6 | 252.8 | |||||
Long-term debt and capital lease obligations, less unamortized discount and debt issuance costs | 916.4 | 934.1 | |||||
Deferred income tax liabilities | 60.4 | 64.4 | |||||
Accrued pension liabilities | 30.9 | 27.8 | |||||
Other noncurrent accrued liabilities | 23.8 | 8.0 | |||||
Total liabilities | 1,338.1 | 1,287.1 | |||||
Shareholders’ equity: | |||||||
Preferred stock - $0.01 par value, 50,000,000 shares authorized, none outstanding | — | — | |||||
Common stock - $0.01 par value, 500,000,000 shares authorized; 69,644,918 and 68,473,561 issued and outstanding as of December 31, 2017 and 2016, respectively | 0.7 | 0.7 | |||||
Capital in excess of par value | 675.9 | 661.0 | |||||
Retained deficit | (70.5 | ) | (68.9 | ) | |||
Accumulated other comprehensive loss | (85.4 | ) | (157.9 | ) | |||
Total shareholders’ equity | 520.7 | 434.9 | |||||
Total liabilities and shareholders’ equity | $ | 1,858.8 | $ | 1,722.0 | |||
See accompanying notes.
49
MILACRON HOLDINGS CORP.
CONSOLIDATED STATEMENTS OF OPERATIONS
Year Ended December 31, | |||||||||||
2017 | 2016 | 2015 | |||||||||
(in millions, except per share data) | |||||||||||
Net sales | $ | 1,234.2 | $ | 1,166.7 | $ | 1,179.5 | |||||
Cost of sales | 852.3 | 770.9 | 775.6 | ||||||||
Manufacturing margins | 381.9 | 395.8 | 403.9 | ||||||||
Operating expenses: | |||||||||||
Selling, general and administrative expenses | 254.0 | 252.4 | 261.1 | ||||||||
Amortization expense | 28.7 | 31.3 | 35.9 | ||||||||
(Gain) loss on currency translation | (7.3 | ) | (3.3 | ) | 21.6 | ||||||
Other expense, net | 18.5 | 9.8 | 13.5 | ||||||||
Total operating expenses | 293.9 | 290.2 | 332.1 | ||||||||
Operating earnings | 88.0 | 105.6 | 71.8 | ||||||||
Interest expense, net | 44.5 | 60.9 | 68.0 | ||||||||
Loss on debt extinguishment | 25.2 | — | 22.2 | ||||||||
Earnings (loss) before income taxes | 18.3 | 44.7 | (18.4 | ) | |||||||
Income tax expense | 17.2 | 14.2 | 20.4 | ||||||||
Net earnings (loss) | $ | 1.1 | $ | 30.5 | $ | (38.8 | ) | ||||
Earnings (loss) per share: | |||||||||||
Basic | $ | 0.02 | $ | 0.45 | $ | (0.65 | ) | ||||
Diluted | $ | 0.02 | $ | 0.43 | $ | (0.65 | ) | ||||
See accompanying notes.
50
MILACRON HOLDINGS CORP.
CONSOLIDATED STATEMENTS OF COMPREHENSIVE INCOME (LOSS)
Year Ended December 31, | |||||||||||
2017 | 2016 | 2015 | |||||||||
(in millions) | |||||||||||
Net earnings (loss) | $ | 1.1 | $ | 30.5 | $ | (38.8 | ) | ||||
Other comprehensive income (loss), net of tax: | |||||||||||
Foreign currency translation adjustments | 71.7 | (45.5 | ) | (59.1 | ) | ||||||
Unrecognized postretirement plan gain (loss) | 0.1 | (2.7 | ) | 1.0 | |||||||
Unrealized gain (loss) on hedging activities | 0.7 | (0.6 | ) | 3.1 | |||||||
Total other comprehensive income (loss), net of tax | 72.5 | (48.8 | ) | (55.0 | ) | ||||||
Comprehensive income (loss) | $ | 73.6 | $ | (18.3 | ) | $ | (93.8 | ) | |||
See accompanying notes.
51
MILACRON HOLDINGS CORP.
CONSOLIDATED STATEMENTS OF SHAREHOLDERS’ EQUITY
Common Stock (Shares) | Common Stock | Capital In Excess of Par Value | Retained Deficit | Accumulated Other Comprehensive Loss | Totals | ||||||||||||||||||
(in millions, except share data) | |||||||||||||||||||||||
Balance at December 31, 2014 | 52,286,100 | $ | 0.5 | $ | 499.6 | $ | (60.6 | ) | $ | (54.1 | ) | $ | 385.4 | ||||||||||
Capital contribution | 14,703,931 | 0.2 | 293.8 | — | — | 294.0 | |||||||||||||||||
Initial public offering issuance costs | — | — | (21.3 | ) | — | — | (21.3 | ) | |||||||||||||||
Dividends paid | — | — | (144.6 | ) | — | — | (144.6 | ) | |||||||||||||||
Stock-based compensation activity | 306,647 | — | 21.2 | — | — | 21.2 | |||||||||||||||||
Net loss | — | — | — | (38.8 | ) | — | (38.8 | ) | |||||||||||||||
Other comprehensive loss, net of tax | — | — | — | — | (55.0 | ) | (55.0 | ) | |||||||||||||||
Balance at December 31, 2015 | 67,296,678 | 0.7 | 648.7 | (99.4 | ) | (109.1 | ) | 440.9 | |||||||||||||||
Stock-based compensation activity | 1,176,883 | — | 12.3 | — | — | 12.3 | |||||||||||||||||
Net earnings | — | — | — | 30.5 | — | 30.5 | |||||||||||||||||
Other comprehensive loss, net of tax | — | — | — | — | (48.8 | ) | (48.8 | ) | |||||||||||||||
Balance at December 31, 2016 | 68,473,561 | 0.7 | 661.0 | (68.9 | ) | (157.9 | ) | 434.9 | |||||||||||||||
Adjustment to adopt new accounting standards | — | — | 0.8 | (2.7 | ) | — | (1.9 | ) | |||||||||||||||
Balance at January 1, 2017 | 68,473,561 | 0.7 | 661.8 | (71.6 | ) | (157.9 | ) | 433.0 | |||||||||||||||
Stock-based compensation activity | 1,171,357 | — | 14.1 | — | — | 14.1 | |||||||||||||||||
Net earnings | — | — | — | 1.1 | — | 1.1 | |||||||||||||||||
Other comprehensive income, net of tax | — | — | — | — | 72.5 | 72.5 | |||||||||||||||||
Balance at December 31, 2017 | 69,644,918 | $ | 0.7 | $ | 675.9 | $ | (70.5 | ) | $ | (85.4 | ) | $ | 520.7 | ||||||||||
See accompanying notes.
52
MILACRON HOLDINGS CORP.
CONSOLIDATED STATEMENTS OF CASH FLOWS
Year Ended December 31, | |||||||||||
2017 | 2016 | 2015 | |||||||||
(in millions) | |||||||||||
Operating activities | |||||||||||
Net earnings (loss) | $ | 1.1 | $ | 30.5 | $ | (38.8 | ) | ||||
Adjustments to reconcile net earnings (loss) to net cash provided by operating activities: | |||||||||||
Depreciation and amortization | 58.6 | 59.9 | 62.7 | ||||||||
Unrealized (gain) loss on currency translation of intercompany advances | (8.7 | ) | (1.6 | ) | 23.3 | ||||||
Amortization of debt issuance costs and discount | 3.0 | 3.8 | 4.0 | ||||||||
Gain on termination of postretirement plan | — | — | (1.5 | ) | |||||||
Loss on debt extinguishment | 25.2 | — | 22.2 | ||||||||
Trademark impairment | — | — | 2.2 | ||||||||
Other non-cash asset impairment | — | 1.6 | — | ||||||||
Goodwill impairment | 1.4 | — | — | ||||||||
Inventory write-down - discontinued product line | 7.7 | — | — | ||||||||
Non-cash stock-based compensation expense | 8.8 | 5.3 | 20.8 | ||||||||
Deferred income taxes | (8.4 | ) | (8.6 | ) | (5.3 | ) | |||||
Changes in assets and liabilities: | |||||||||||
Accounts receivable | 8.0 | 16.2 | (28.3 | ) | |||||||
Inventories | (11.9 | ) | (16.0 | ) | (8.8 | ) | |||||
Prepaid and other current assets | (9.9 | ) | (8.9 | ) | 2.0 | ||||||
Accounts payable | 24.6 | 12.5 | (3.1 | ) | |||||||
Advanced billings and deposits | 7.8 | 13.9 | (17.1 | ) | |||||||
Other current liabilities | (2.7 | ) | 1.8 | 3.3 | |||||||
Other noncurrent assets | 1.3 | 5.0 | 0.5 | ||||||||
Other noncurrent accrued liabilities | 4.5 | 0.8 | (1.3 | ) | |||||||
Net cash provided by operating activities | 110.4 | 116.2 | 36.8 | ||||||||
Investing activities | |||||||||||
Purchases of property and equipment | (39.8 | ) | (57.3 | ) | (52.7 | ) | |||||
Proceeds from disposals of property and equipment | 3.8 | 0.9 | 1.6 | ||||||||
Acquisitions, net of cash acquired | (2.1 | ) | — | (22.2 | ) | ||||||
Net cash used in investing activities | (38.1 | ) | (56.4 | ) | (73.3 | ) | |||||
Financing activities | |||||||||||
Proceeds from issuance of long-term debt (original maturities longer than 90 days) | 1,016.3 | — | 806.3 | ||||||||
Payments on long-term debt and capital lease obligations (original maturities longer than 90 days) | (1,025.6 | ) | (0.8 | ) | (885.0 | ) | |||||
Net decrease in short-term borrowings (original maturities of 90 days or less) | (0.1 | ) | — | (1.1 | ) | ||||||
Debt extinguishment costs | (18.0 | ) | — | (13.8 | ) | ||||||
Dividends paid | — | — | (144.6 | ) | |||||||
Proceeds from the issuance of common stock | — | — | 294.0 | ||||||||
Initial public offering issuance costs | — | — | (21.3 | ) | |||||||
Proceeds from exercise of stock options | 5.3 | 7.0 | 0.4 | ||||||||
Proceeds from lease financing transaction | 10.9 | — | — | ||||||||
Debt issuance costs | (10.7 | ) | — | (7.1 | ) | ||||||
Net cash (used in) provided by financing activities | (21.9 | ) | 6.2 | 27.8 | |||||||
Effect of exchange rate changes on cash | 7.3 | (3.3 | ) | (5.3 | ) | ||||||
Increase (decrease) in cash and cash equivalents | 57.7 | 62.7 | (14.0 | ) | |||||||
Cash and cash equivalents at beginning of year | 130.2 | 67.5 | 81.5 | ||||||||
Cash and cash equivalents at end of year | $ | 187.9 | $ | 130.2 | $ | 67.5 | |||||
53
MILACRON HOLDINGS CORP.
CONSOLIDATED STATEMENTS OF CASH FLOWS (CONTINUED)
Year Ended December 31, | |||||||||||
2017 | 2016 | 2015 | |||||||||
(in millions) | |||||||||||
Supplemental cash flow information: | |||||||||||
Cash paid during the period for: | |||||||||||
Interest | $ | 56.3 | $ | 58.6 | $ | 67.4 | |||||
Income taxes, net | $ | 26.2 | $ | 24.6 | $ | 23.2 | |||||
Significant non-cash transactions: | |||||||||||
Accrued expenditures for property and equipment at December 31 | $ | 2.5 | $ | 5.2 | $ | 2.4 | |||||
See accompanying notes
54
MILACRON HOLDINGS CORP.
NOTES TO CONSOLIDATED FINANCIAL STATEMENTS
As of December 31, 2017 and 2016 and for the
Years Ended December 31, 2017, 2016 and 2015
1. Background and Basis of Presentation
Milacron Holdings Corp. (the "Company" or "Milacron") is a global leader in the manufacture, distribution, and service of highly engineered and customized systems used in the plastic technology and processing industry. The Company has a full-line product portfolio that includes hot runner systems, injection molding, blow molding and extrusion equipment and produces process control systems, mold bases and components and maintenance, repair and operating ("MRO") supplies for plastic processing equipment and fluid technology. The Company operates throughout the world and is headquartered in Cincinnati, Ohio.
Initial Public Offering
On June 30, 2015, the Company completed its initial public offering ("IPO") whereby the Company sold 14,285,714 shares of common stock at a price of $20.00 per share. The shares began trading on the New York Stock Exchange on June 25, 2015. The aggregate net proceeds received by the Company from the offering was approximately $265.0 million, net of underwriting discounts and commissions and estimated offering expenses. The net proceeds were used to repay existing indebtedness as further described in Note 5.
In July 2015 the Company's underwriters exercised their option to purchase additional shares of the Company's common stock. The underwriters purchased 415,600 shares of the Company's common stock at the public offering price of $20.00 per share, less the underwriting discount, and on July 29, 2015 the Company received $7.8 million in proceeds, net of the underwriting discount. These net proceeds were used for general corporate purposes.
Principles of Consolidation and Basis of Presentation
The accompanying Consolidated Financial Statements have been prepared in accordance with accounting principles generally accepted in the United States of America ("U.S. GAAP") and include the accounts of the Company, its majority-owned subsidiaries and entities over which the Company has control. All intercompany balances and transactions have been eliminated in consolidation.
Use of Estimates
The preparation of consolidated financial statements in conformity with U.S. GAAP requires management to make estimates and assumptions that affect the amounts of assets and liabilities at the reporting date and the amounts of revenue and expenses in the periods presented in the Consolidated Financial Statements. Actual results could differ from these estimates. The Company’s results are affected by economic, political, legislative, regulatory and legal actions. Economic conditions, such as recessionary trends, inflation, interest and monetary exchange rates, governmental fiscal policies and changes in the prices of raw materials, can have a significant effect on estimates recognized.
Foreign Currency
Assets and liabilities of the Company’s non-U.S. operations, whose functional currency is the local currency, are translated into U.S. dollars at period-end exchange rates. Income and expense items are translated at the average rates of exchange during the period. Net exchange gains or losses resulting from such translation are included in accumulated other comprehensive loss, a component of shareholders’ equity, and included in net earnings only upon sale or liquidation of the underlying foreign subsidiary. Foreign currency transaction gains and losses are recognized in net earnings based on differences between foreign exchange rates on the transaction date and the settlement date. Intercompany foreign currency transactions, including intercompany advances, that are not long-term in nature are recorded within (gain) loss on currency translation within the Consolidated Statements of Operations.
Cash and Cash Equivalents
Cash and cash equivalents consist of cash on hand and all highly liquid investments with original maturities of three months or less. The carrying value of cash and cash equivalents approximates fair value.
55
MILACRON HOLDINGS CORP.
NOTES TO CONSOLIDATED FINANCIAL STATEMENTS (CONTINUED)
1. Background and Basis of Presentation (continued)
Accounts Receivable and Allowance for Doubtful Accounts
Accounts receivable consists of amounts owed to the Company through product shipments and services provided and is presented net of an allowance for doubtful accounts. The Company grants credit to its customers in the normal course of business. To reduce credit risk, the Company performs credit investigations prior to accepting new customers and prior to adjusting existing credit limits.
The estimate of the allowance for doubtful accounts is the Company’s best estimate of the amount of probable credit loss in the Company’s existing accounts receivable. The Company regularly reviews the adequacy of its allowance for doubtful accounts. The Company determines the allowance based upon an analysis of prior collection experience, specific customer creditworthiness and economic trends within the industries the Company serves. In circumstances where the Company is aware of a specific customer’s inability to meet its financial obligation (e.g., bankruptcy filings), the Company records a specific reserve to reduce the receivable to the amount reasonably believed to be collected. When an account is considered uncollectible, it is written off against the allowance for doubtful accounts.
During 2017, the Company entered into an accounts receivable factoring agreement to sell certain unsecured receivables, without recourse, to an unrelated third-party financial institution. Under the terms of the agreement, the Company retains no rights or interest and has no obligations with respect to the receivables. As such, the factoring under this arrangement is accounted for as a sale. The Company sold $5.7 million of receivables during 2017. The loss on factoring during 2017 was insignificant. The receivables sold under this agreement were recorded as a reduction of accounts receivable and proceeds as cash provided by operating activities.
Inventories
Inventories consist of metalworking fluids and chemicals, machinery parts and supplies, and machines and components manufactured or in the process of assembly. Inventories are stated at the lower of cost or market. The principal methods of determining costs are average or standard costs, which approximate the first-in, first-out method.
Inventories are recorded net of reserves for obsolescence of $32.6 million and $16.8 million at December 31, 2017 and 2016, respectively. The inventory obsolescence reserve is determined by specific identification, as well as an estimate based on age, saleability and market conditions.
Debt Issuance Costs
The Company capitalizes costs associated with the issuance of debt and amortizes these costs over the lives of the debt instruments using the effective interest method or the straight-line method based on the terms of the underlying debt instrument. These costs are recorded as debt issuance costs as a direct reduction from the carrying amount of the corresponding debt liability in the accompanying Consolidated Balance Sheets and the related amortization of debt issuance costs is included within interest expense, net within the Consolidated Statements of Operations and amounted to $2.4 million, $3.8 million and $4.0 million for the years ended December 31, 2017, 2016 and 2015, respectively. Upon the prepayment of the related debt, the Company accelerates the recognition of an appropriate amount of the costs.
Property and Equipment
Expenditures for property and equipment, including amounts related to capital leases, are carried at cost and are depreciated using the straight-line method over the estimated useful lives of the assets. Buildings are generally depreciated over useful lives of 20 to 45 years and machinery and equipment over useful lives of 3 to 12 years. Leasehold improvements are depreciated over the shorter of their estimated useful life or the remaining term of the associated lease. Repairs, betterments, and renewals that extend the life of the asset are capitalized. Other repairs and maintenance expenditures are expensed as incurred.
56
MILACRON HOLDINGS CORP.
NOTES TO CONSOLIDATED FINANCIAL STATEMENTS (CONTINUED)
1. Background and Basis of Presentation (continued)
Property and equipment consist of the following as of:
December 31, | ||||||||
2017 | 2016 | |||||||
(in millions) | ||||||||
Land | $ | 30.2 | $ | 28.3 | ||||
Buildings | 117.0 | 98.0 | ||||||
Machinery and equipment | 249.9 | 223.5 | ||||||
397.1 | 349.8 | |||||||
Accumulated depreciation | (136.3 | ) | (106.1 | ) | ||||
$ | 260.8 | $ | 243.7 | |||||
The Company recorded depreciation expense of $29.9 million, $28.6 million and $26.8 million for the years ended December 31, 2017, 2016 and 2015, respectively. The Company allocates depreciation expense to cost of sales and selling, general and administrative expense as appropriate.
Goodwill and Other Intangible Assets
Goodwill represents the excess of acquisition cost over the estimated fair value of net assets acquired in business combinations. Intangible assets are recorded at cost, and those intangible assets with finite lives are amortized over their respective estimated useful lives. The Company estimates the useful lives of the intangible assets acquired in business combinations based on information available at the time of acquisition. In establishing the useful lives of acquired customer relationships, the Company considered the buying patterns and length of time that the acquired customers have purchased the Company’s products as well as the estimated future cash flows the Company anticipates to be generated from these customers. For technology, the Company considered the likelihood of competitors creating new competing technologies. For trademarks, the Company considered how well the acquired trademarks are known throughout the industry and are expected to continue to generate positive cash flows in the future. The useful lives of non-compete agreements are equal to the respective agreement terms.
The Company performs an annual impairment test on all existing goodwill and other indefinite lived assets on October 1 of each year and whenever events or circumstances make it more likely than not that impairment may have occurred. The Company tested goodwill for impairment based on its identified reporting units.
As a result of the adoption of Accounting Standards Update ("ASU") No. 2011-08, Testing Goodwill for Impairment, the Company may first assess a range of qualitative factors including, but not limited to, macroeconomic conditions, industry conditions, the competitive environment, changes in the market for the Company’s products and services, regulatory and political developments, entity-specific factors such as strategies and financial performance, when evaluating the potential for impairment of goodwill. For reporting units in which this assessment is not conclusive that it is more likely than not that the fair value is greater than its carrying value, the Company will determine the estimated fair value of each reporting unit and compare that to its carrying amount.
If the estimated fair value of the reporting unit is in excess of the carrying value, the related goodwill is considered not to be impaired. As a result of the adoption of ASU No. 2017-04, Simplifying the Test for Goodwill Impairment, if the carrying amount of the reporting unit exceeds the estimated fair value, the excess of the carrying value of the reporting unit over the estimated fair value of the reporting unit will be recorded as an impairment loss.
The Company performed a quantitative impairment test for all reporting units as of October 1, 2017. The Company’s determination of estimated fair value of each reporting unit was determined using a combination of the market approach and the income approach. Under the market approach, fair value is based on revenue and earnings multiples for guideline public companies in the reporting unit’s peer group. The market approach requires significant judgment regarding the selection of guideline companies. Under the income approach, value is determined based upon the estimate of future positive cash flows to be derived from ownership. The income approach requires significant judgment including estimates about future cash flows and risk-adjusted discount rates. A combination of the methodologies is used and weighted appropriately for each reporting unit.
The Company also tests its indefinite-lived intangible assets, consisting of trademarks, for impairment using a “relief-from-royalty” method. Significant assumptions inherent in the methodologies are employed and include such estimates as royalty and discount rates.
57
MILACRON HOLDINGS CORP.
NOTES TO CONSOLIDATED FINANCIAL STATEMENTS (CONTINUED)
1. Background and Basis of Presentation (continued)
The Company performed its annual impairment test of goodwill and indefinite-lived intangible assets in 2017 which resulted in a goodwill impairment charge of $1.4 million. No impairment charges were recognized in 2016 and 2015. For further information on goodwill and other intangible assets, see Note 3.
Long-Lived Assets
Long-lived assets are reviewed for impairment whenever events or changes in circumstances indicate that the carrying amount of an asset may not be recoverable. Examples of events or changes in circumstances could include, but are not limited to, a prolonged economic downturn, current period operating or cash flow losses combined with a history of losses or a forecast of continuing losses associated with the use of an asset group, or a current expectation that an asset group will be sold or disposed of before the end of its previously estimated useful life. Recoverability of long-lived assets is assessed by a comparison of the carrying amount of the asset to the estimated future undiscounted net cash flows expected to be generated by the asset or group of assets. If estimated future undiscounted net cash flows are less than the carrying amount of the asset or group of assets, the asset is considered impaired and a loss is recognized in an amount required to reduce the carrying amount of the asset to its then estimated fair value. Fair value generally is determined from estimated discounted future net cash flows (for assets held for use) or net realizable value (for assets held for sale).
Self-Insurance Reserves
The Company is primarily self-insured for many types of risks, including, but not limited to, general liability, auto liability, product liability, environmental claims and workers’ compensation for most domestic employees. The Company establishes undiscounted reserves for the estimated ultimate cost of all asserted and unasserted claims incurred and is established based on historical experience and known or estimated ultimate exposure. The Company’s exposure, except for certain environmental claims, is limited by excess liability coverage. Workers’ compensation claims in excess of certain limits are insured with commercial carriers. Reserves, gross of expected recoveries, are included in current and noncurrent liabilities. Expected recoveries from excess carriers are included in noncurrent assets.
Employee Benefit Plans
The Company maintains defined contribution plans for its U.S. employees and certain non-U.S. employees. Certain of the Company’s non-U.S. subsidiaries in Germany and the United Kingdom sponsor defined benefit pension plans for certain non-U.S. employees. The Company’s policy is to fund the plans in accordance with applicable laws and regulations and the funded status of the Company’s defined benefit plans is recognized in the Consolidated Balance Sheets. The funded status is measured as the difference between the fair value of plan assets and the benefit obligation at December 31, the measurement date. For defined benefit pension plans, the benefit obligation is the projected benefit obligation ("PBO"). The PBO represents the actuarial present value of benefits expected to be paid upon retirement based on estimated future compensation levels. The fair value of plan assets represents the current market value of assets. The measurement of the benefit obligation is based on the Company’s estimates and actuarial valuations. These valuations reflect the terms of the plans and use participant-specific information such as compensation, age and years of service, as well as certain key assumptions that require significant judgment, including, but not limited to, estimates of discount rates, expected return on plan assets, rate of compensation increases, interest crediting rates and mortality rates. For additional information regarding plan assumptions and the current financial position of the Company's defined benefit pension plans, see Note 6.
Revenue Recognition
The Company records revenue on products when persuasive evidence of an arrangement exists, legal title has passed and the risks and rewards of ownership are transferred, the sales price is fixed and determinable, all significant contractual obligations have been satisfied and the collectability of the sales price is reasonably assured.
Appropriate allowances for returns are recorded at the time revenue is recognized. The Company continually evaluates the creditworthiness of its customers and enters into sales contracts only when collection of the sales price is reasonably assured. For sales of plastic processing machinery, customers are generally required to make substantial down-payments prior to shipment, which helps to ensure collection of the full price. These down-payments are classified within advanced billings and deposits on the Consolidated Balance Sheets.
58
MILACRON HOLDINGS CORP.
NOTES TO CONSOLIDATED FINANCIAL STATEMENTS (CONTINUED)
1. Background and Basis of Presentation (continued)
Cost of Sales
Costs associated with net sales are recorded in cost of sales. Cost of sales includes the costs of receiving, producing, inspecting, warehousing, insuring, and shipping goods during the period, as well as depreciation and amortization of long-lived assets used in these processes. Cost of sales also includes shipping and handling costs associated with the delivery of goods to customers and costs associated with internal transfers between plant locations.
Advertising Costs
Advertising costs are charged to expense as incurred and include amounts related to participation in trade shows. The Company incurred advertising costs of $3.5 million, $5.4 million and $7.5 million for the years ended December 31, 2017, 2016 and 2015, respectively.
Warranty Costs
A reserve for estimated warranty costs is recorded at the time of sale of machinery and parts and these estimates are based on historical warranty claim experience, with subsequent adjustments for ongoing claims exposure. The reserve for estimated warranty costs is included in other current liabilities in the accompanying Consolidated Balance Sheets.
The following table summarizes changes in the Company’s warranty reserves:
Year Ended December 31, | |||||||||||
2017 | 2016 | 2015 | |||||||||
(in millions) | |||||||||||
Balance at the beginning of year | $ | 8.7 | $ | 8.3 | $ | 8.6 | |||||
Warranty expense | 16.6 | 13.0 | 13.2 | ||||||||
Warranty claims paid | (16.0 | ) | (12.5 | ) | (12.8 | ) | |||||
Foreign currency translation adjustments | 0.6 | (0.1 | ) | (0.7 | ) | ||||||
Balance at the end of year | $ | 9.9 | $ | 8.7 | $ | 8.3 | |||||
Stock-Based Compensation
The Company accounts for stock-based payment transactions in which the Company receives employee services in exchange for equity instruments of the Company. Stock-based compensation, including grants of stock options and restricted stock, is measured in the Consolidated Statements of Operations based on the grant date fair values of the stock-based awards.
The compensation expense recognized for each stock-based award is recognized ratably on a straight-line basis over the requisite service period except for performance-based awards which are recognized over the requisite service period if it is probable that the performance conditions will be satisfied. Stock-based compensation expense is reported within selling, general and administrative expenses in the Consolidated Statements of Operations. The Company will recognize a benefit from stock-based compensation within income tax expense if an incremental tax benefit is realized by following the ordering provisions of the tax law. Additional information regarding stock-based compensation can be found in Note 9.
Research and Development
Expenditures for research and development are expensed as incurred and included in selling, general and administrative expense in the accompanying Consolidated Statements of Operations. The Company incurred research and development expenses of $17.1 million, $21.1 million and $21.8 million for the years ended December 31, 2017, 2016 and 2015, respectively.
59
MILACRON HOLDINGS CORP.
NOTES TO CONSOLIDATED FINANCIAL STATEMENTS (CONTINUED)
1. Background and Basis of Presentation (continued)
Income Taxes
The Company is subject to income taxes in the United States and numerous foreign jurisdictions. Significant judgment in the forecasting of taxable income using historical and projected future operating results is required in determining the Company’s provision for income taxes and the related assets and liabilities. The provision for income taxes includes income taxes paid, currently payable or receivable, and deferred taxes including those related to investments in foreign subsidiaries that are not permanent in nature. Under U.S. GAAP, deferred tax assets and liabilities are recognized for future tax consequences attributable to temporary differences between financial statement carrying amounts of existing assets and liabilities and their respective tax bases. Deferred tax assets and liabilities are measured using enacted tax rates expected to apply to taxable income in the years in which those temporary differences are expected to be settled or realized. Deferred tax assets are also recognized for the estimated future effects of tax loss carryforwards. The effect of changes in tax rates on deferred taxes is recognized in the period in which the enactment dates change.
The Company regularly reviews its deferred tax assets for recoverability and establishes a valuation allowance if it is more likely than not that some portion or all of a deferred tax asset will not be realized. The determination as to whether a deferred tax asset will be realized is made on a jurisdictional basis and is based on the evaluation of positive and negative evidence. This evidence includes historical pre-tax and taxable income, projected future taxable income, the expected timing of the reversal of temporary differences and the implementation of tax planning strategies. Projected future taxable income is based on expected results and assumptions as to the jurisdiction in which the income will be earned. The expected timing of the reversals of existing temporary differences is based on current tax law and the Company’s tax methods of accounting.
The Company records income tax liabilities for uncertain foreign and domestic tax positions utilizing the prescribed recognition and measurement principles under U.S. GAAP.
Fair Value of Financial Instruments
The Company applies fair value accounting for all financial assets and liabilities and non-financial assets and liabilities that are recognized or disclosed at fair value in the Consolidated Financial Statements on a recurring basis. The Company defines fair value as the price that would be received from selling an asset or paid to transfer a liability in an orderly transaction between market participants at the measurement date. When determining the fair value measurements for assets and liabilities, the Company considers the principal or most advantageous market in which the Company would transact and the market-based risk measurements or assumptions that market participants would use in pricing the asset or liability, such as inherent risk, transfer restrictions and credit risk.
The Company estimates fair value of its financial instruments utilizing an established three-level hierarchy. The hierarchy is based upon the transparency of inputs to the valuation of an asset or liability as of the measurement date as follows:
• | Level 1–Valuation is based upon unadjusted quoted prices for identical assets or liabilities in active markets. |
• | Level 2–Valuation is based upon quoted prices for similar assets and liabilities in active markets, or other inputs that are observable for the asset or liability, either directly or indirectly, for substantially the full term of the financial statements. |
• | Level 3–Valuation is based upon other unobservable inputs that are significant to the fair value measurements. |
Derivative Financial Instruments
The Company’s risk management strategy includes the use of derivative instruments, specifically foreign currency forward exchange contracts, to reduce the effects on its operating results and cash flows from fluctuations caused by volatility in currency exchange rates. The Company recognizes all derivative instruments as either assets or liabilities in the Consolidated Balance Sheets at their respective estimated fair values. The accounting for changes in the fair value (i.e., unrealized gains or losses) of a derivative instrument depends on whether it has been designated, and is highly effective, as a hedge and further, on the type of hedging relationship. For those derivative instruments that are designated and qualify as hedging instruments, the Company designates the hedging instrument, based upon the exposure being hedged, as a fair value hedge, cash flow hedge or a hedge of a net investment in a foreign operation. Changes in the fair value of derivative instruments that are highly effective and designated as cash flow hedges are reported as a component of other comprehensive income (loss) ("OCI") and reclassified into earnings in the same line-item associated with the forecasted transaction and in the same period during which the hedged transaction impacts earnings. The change in the fair value of the ineffective portion of a derivative instrument and the change in the fair value of derivative instruments that are not designated as hedges are recognized in earnings immediately.
60
MILACRON HOLDINGS CORP.
NOTES TO CONSOLIDATED FINANCIAL STATEMENTS (CONTINUED)
1. Background and Basis of Presentation (continued)
Recently Adopted Accounting Pronouncements
In March 2016, the Financial Accounting Standards Board ("FASB") issued ASU No. 2016-09, Compensation - Stock Compensation (Topic 718): Improvements to Employee Share-Based Payment Accounting ("ASU 2016-09"). ASU 2016-09 simplifies several aspects of the accounting for share-based payment transactions, including the income tax consequences, classification of awards as either equity or liabilities, and classification on the statement of cash flows. ASU 2016-09 was effective for the Company beginning January 1, 2017 and the impact of the Company's adoption in 2017 resulted in the following:
• | The Company recorded $1.1 million of previously unrecognized deferred tax assets that arose from tax deductions for share-based compensation in excess of compensation expense recognized for financial reporting during years when net operating losses were created. A corresponding increase in the valuation allowance was also recorded and, as a result, there was no impact to the Company's Consolidated Statements of Operations. |
• | The Company elected to change its policy on accounting for forfeitures and now will account for forfeitures as they occur. This policy election resulted in a cumulative-effect adjustment to retained earnings of $0.8 million as of January 1, 2017. |
• | The Company will no longer reclassify any excess tax benefits from operating activities to financing activities in the statement of cash flows. The Company elected to apply this change in presentation prospectively and thus prior periods have not been adjusted. |
• | The Company excluded the excess tax benefits from the assumed proceeds available to repurchase shares in the computation of diluted earnings per share for the year ended December 31, 2017. This did not have an impact on our computation of diluted weighted-average common shares outstanding. |
In August 2016, the FASB issued ASU No. 2016-15, Statement of Cash Flows (Topic 230) ("ASU 2016-15"). ASU 2016-15 clarifies the classification of certain cash receipts and cash payments within the statement of cash flows to reduce diversity in practice. ASU 2016-15 is effective for the Company beginning January 1, 2018 and early adoption is permitted. The Company elected to early adopt ASU 2016-15 as of January 1, 2017 which is required to be adopted retrospectively. As a result, the Company has classified debt extinguishment costs paid as a financing activity within the Company's Consolidated Statements of Cash Flows.
In October 2016, the FASB issued ASU No. 2016-16, Accounting for Income Taxes: Intra-Entity Asset Transfers of Assets Other than Inventory ("ASU 2016-16"). Prior to the adoption of ASU 2016-16, the tax effects of intra-entity transfers are deferred until the transferred asset is sold to a third party or otherwise recovered through use. ASU 2016-16 eliminates this deferral for all intra-entity sales of assets other than inventory. ASU 2016-16 is effective for the Company beginning January 1, 2018 with early adoption permitted and the Company elected to early adopt ASU 2016-16 as of January 1, 2017. As a result, the Company recorded a cumulative-effect adjustment to retained earnings of approximately $1.9 million with a corresponding reduction in prepaid tax assets as of January 1, 2017.
In January 2017, the FASB issued ASU No. 2017-01, Business Combinations (Topic 805): Clarifying the Definition of a Business ("ASU 2017-01"). ASU 2017-01 adds guidance to assist entities with evaluating whether transactions should be accounted for as acquisitions (or disposals) of assets or businesses. ASU 2017-01 is effective for the Company beginning January 1, 2018 with early adoption permitted. The Company elected to early adopt ASU 2017-01 as of January 1, 2017 and the adoption did not have a material impact on the Consolidated Financial Statements.
In January 2017, the FASB issued ASU 2017-04, Simplifying the Test for Goodwill Impairment ("ASU 2017-04"). ASU 2017-04 eliminates the two-step process that required identification of potential impairment and a separate measure of the actual impairment. Goodwill impairment charges, if any, would be determined by the difference between a reporting unit's carrying value and its fair value (impairment loss is limited to the carrying value). ASU 2017-04 is effective for annual or any interim goodwill impairment tests beginning after December 15, 2019 with early adoption permitted. The Company elected to early adopt ASU 2017-04 as of January 1, 2017 and the adoption did not have a material impact on the Consolidated Financial Statements.
61
MILACRON HOLDINGS CORP.
NOTES TO CONSOLIDATED FINANCIAL STATEMENTS (CONTINUED)
1. Background and Basis of Presentation (continued)
Recently Issued Accounting Pronouncements
In May 2014, the FASB issued ASU No. 2014-09, Revenue from Contracts with Customers (Topic 606) ("ASU 2014-09"). ASU 2014-09, as further amended, affects virtually all aspects of an entity’s revenue recognition, including determining the measurement of revenue and the timing of when it is recognized for the transfer of goods or services to customers. ASU 2014-09 is effective for the Company beginning January 1, 2018. The guidance permits two methods of adoption - retrospectively to each prior reporting period presented (full retrospective method), or retrospectively with the cumulative effect of initially applying the guidance recognized at the date of initial application (modified retrospective method). The new standard also requires additional disclosure about the nature, amount, timing and uncertainty of revenue and cash flows from customer contracts. The Company has completed its detailed review of the impact of the new standard and the Company adopted Topic 606 on January 1, 2018 using the modified retrospective method, which did not result in an adjustment to equity. The Company's sales transactions generally consist of a single performance obligation to transfer promised goods or services and are not accounted for under industry-specific guidance. The Company does not expect any impacts to its Consolidated Financial Statements, with the exception of the new and expanded disclosures requirements, as transactions recorded under Topic 606 will be substantially consistent with treatment under existing guidance.
In February 2016, the FASB issued ASU No. 2016-02, Leases (Topic 842) ("ASU 2016-02"). ASU 2016-02 establishes a right-of-use ("ROU") model that requires a lessee to record a ROU asset and a lease liability on the balance sheet for all leases with terms longer than twelve months. Leases will be either classified as finance or operating, with classification affecting the pattern of expense recognition in the income statement. ASU 2016-02 also requires significant additional disclosures about the amount, timing and uncertainty of cash flows from leases. ASU 2016-02 is effective for the Company beginning January 1, 2019 with early adoption allowed and practical expedients to measure the effect of adoption also being allowed. The Company does not plan to early adopt ASU 2016-02 and is currently in the process of evaluating the overall lease portfolio to assess the effect that the adoption will have on the Company's Consolidated Financial Statements.
In March 2017, the FASB issued ASU 2017-07, Improving the Presentation of Net Periodic Pension Cost and Net Periodic Postretirement Benefit Costs ("ASU 2017-07"). ASU 2017-07 requires the service component of pension and other postretirement benefit costs to be presented in the same line item as other employee compensation costs on the consolidated statements of operations; however, the other components of net benefit cost are required to be presented outside of operating income within the consolidated statements of operations. ASU 2017-07 is effective for fiscal years beginning after December 15, 2017 and the Company adopted the accounting standard update as of January 1, 2018. This guidance impacts the presentation of the Company's Consolidated Financial Statements. The Company's current presentation of the service cost component is consistent with the requirements of the new standard; however, the Company will present the other components outside of operating income.
2. Business Combinations
On December 1, 2015, the Company acquired all the outstanding equity interests of CanGen Holdings Inc. ("CanGen"), a supplier of highly engineered aftermarket process control components for extrusion and injection molding applications, subject to a working capital settlement. The total consideration, net of cash acquired, to acquire CanGen was $22.2 million. The Company accounted for the acquisition using the acquisition method of accounting in accordance with applicable U.S. GAAP whereby the total purchase price was allocated to tangible and intangible assets acquired and liabilities assumed based on respective estimated fair values. Acquisition related costs were expensed as incurred and included legal fees and advisory services. The Company incurred acquisition related costs of $0.4 million for the year ended December 31, 2015. These costs are included in other expense, net within the Consolidated Statements of Operations.
During the year ended December 31, 2017, the Company paid $2.1 million related to the acquisition of a distributor within the Melt Delivery and Control Systems segment.
62
MILACRON HOLDINGS CORP.
NOTES TO CONSOLIDATED FINANCIAL STATEMENTS (CONTINUED)
3. Goodwill and Other Intangible Assets
The following table summarizes the changes in the Company’s goodwill, by reportable segment, for the years ended December 31, 2017 and 2016:
Advanced Plastic Processing Technologies | Melt Delivery and Control Systems | Fluid Technologies | Corporate | Total | |||||||||||||||
(in millions) | |||||||||||||||||||
Balance at December 31, 2015 | $ | 37.0 | $ | 446.2 | $ | 46.9 | $ | — | $ | 530.1 | |||||||||
Foreign currency translation adjustments | — | (22.2 | ) | — | — | (22.2 | ) | ||||||||||||
Balance at December 31, 2016 | 37.0 | 424.0 | 46.9 | — | 507.9 | ||||||||||||||
Goodwill impairment | (1.4 | ) | — | — | — | (1.4 | ) | ||||||||||||
Foreign currency translation adjustments | — | 28.6 | — | — | 28.6 | ||||||||||||||
Balance at December 31, 2017 | $ | 35.6 | $ | 452.6 | $ | 46.9 | $ | — | $ | 535.1 | |||||||||
The Company completed its annual impairment test in the fourth quarter of 2017, which indicated the fair value of each reporting unit was substantially above its respective carrying value, including goodwill, with the exception of one reporting unit, which is part of the Advanced Plastic Processing Technologies segment. The Company used a combination of the income approach and market approach to determine the fair value of the reporting unit which was negatively impacted by lower operating results leading the Company to exit a product line within the reporting unit. The exit of this product line resulted in lower forecasted revenue and profitability. Accordingly, the Company recorded a goodwill impairment charge of $1.4 million, representing all of the reporting unit's goodwill, in 2017 which is included in other expense, net in the Consolidated Statements of Operations. There were no goodwill impairment charges in 2016 and 2015. Accumulated goodwill impairment was $1.4 million at December 31, 2017 and there was no accumulated goodwill impairment at December 31, 2016.
The following table summarizes the Company’s other intangible assets at December 31, 2017:
Gross Amount | Accumulated Amortization | Net Amount | |||||||||
(in millions) | |||||||||||
Intangible assets subject to amortization: | |||||||||||
Trademarks | $ | 43.3 | $ | 22.5 | $ | 20.8 | |||||
Technology | 119.7 | 48.1 | 71.6 | ||||||||
Customer relationships | 232.5 | 134.1 | 98.4 | ||||||||
Total intangible assets subject to amortization | 395.5 | 204.7 | 190.8 | ||||||||
Trademarks, not subject to amortization | 141.6 | — | 141.6 | ||||||||
Total | $ | 537.1 | $ | 204.7 | $ | 332.4 | |||||
The following table summarizes the Company’s other intangible assets at December 31, 2016:
Gross Amount | Accumulated Amortization | Net Amount | |||||||||
(in millions) | |||||||||||
Intangible assets subject to amortization: | |||||||||||
Trademarks | $ | 41.5 | $ | 18.2 | $ | 23.3 | |||||
Technology | 112.6 | 36.3 | 76.3 | ||||||||
Customer relationships | 222.7 | 114.9 | 107.8 | ||||||||
Total intangible assets subject to amortization | 376.8 | 169.4 | 207.4 | ||||||||
Trademarks, not subject to amortization | 134.4 | — | 134.4 | ||||||||
Total | $ | 511.2 | $ | 169.4 | $ | 341.8 | |||||
63
MILACRON HOLDINGS CORP.
NOTES TO CONSOLIDATED FINANCIAL STATEMENTS (CONTINUED)
3. Goodwill and Other Intangible Assets
Consolidated amortization expense related to intangible assets subject to amortization was $28.7 million, $31.3 million and $35.9 million for the years ended December 31, 2017, 2016 and 2015, respectively. In connection with the Company's rebranding initiative and marketing strategy, the Company ceased utilizing certain trademarks within the Advanced Plastic Processing Technologies reportable segment during 2015. The Company concluded this was an indicator of impairment and the Company recognized an impairment charge of $2.2 million during the year ended December 31, 2015, which is included within other expense, net on the Company's Consolidated Statements of Operations. Estimated annual amortization expense for intangible assets subject to amortization over the next five years is as follows: $25.8 million in 2018, $21.8 million in 2019, $18.9 million in 2020, $17.1 million in 2021 and $15.1 million in 2022.
4. Income Taxes
The Company’s provision for income taxes consists of the following:
Year Ended December 31, | |||||||||||
2017 | 2016 | 2015 | |||||||||
(in millions) | |||||||||||
Current: | |||||||||||
United States | $ | (0.4 | ) | $ | — | $ | (0.5 | ) | |||
State and local | 0.3 | 0.4 | 0.3 | ||||||||
Foreign | 25.7 | 22.4 | 25.9 | ||||||||
Total current | 25.6 | 22.8 | 25.7 | ||||||||
Deferred: | |||||||||||
United States | (10.9 | ) | 0.5 | (4.6 | ) | ||||||
State and local | 0.1 | (0.1 | ) | (0.2 | ) | ||||||
Foreign | 2.4 | (9.0 | ) | (0.5 | ) | ||||||
Total deferred | (8.4 | ) | (8.6 | ) | (5.3 | ) | |||||
Total income tax expense | $ | 17.2 | $ | 14.2 | $ | 20.4 | |||||
The following sets forth the amount of earnings (loss) before income taxes:
Year Ended December 31, | |||||||||||
2017 | 2016 | 2015 | |||||||||
(in millions) | |||||||||||
Earnings (loss) before income taxes: | |||||||||||
United States | $ | (62.5 | ) | $ | (30.7 | ) | $ | (60.3 | ) | ||
Rest of the world | 80.8 | 75.4 | 41.9 | ||||||||
$ | 18.3 | $ | 44.7 | $ | (18.4 | ) | |||||
64
MILACRON HOLDINGS CORP.
NOTES TO CONSOLIDATED FINANCIAL STATEMENTS (CONTINUED)
4. Income Taxes (continued)
The Company’s effective income tax rate differs from the amount calculated using the statutory U.S. federal income tax rate, principally due to the following:
Year Ended December 31, | |||||||||||
2017 | 2016 | 2015 | |||||||||
(in millions) | |||||||||||
Income tax expense (benefit) computed at U.S. federal statutory rate | $ | 6.4 | $ | 15.7 | $ | (6.4 | ) | ||||
Foreign withholding tax | 8.3 | 3.9 | 4.2 | ||||||||
State and local income taxes, net of federal benefit | 0.2 | 0.2 | 0.1 | ||||||||
Foreign tax differential | (9.8 | ) | (9.1 | ) | (1.0 | ) | |||||
Change in tax rates | (4.6 | ) | (1.9 | ) | 0.3 | ||||||
Change in valuation allowances | 11.2 | 0.2 | 15.7 | ||||||||
Uncertain tax positions | 0.2 | 0.7 | 6.5 | ||||||||
Reduction in valuation allowances for business combination | — | — | (4.0 | ) | |||||||
Dividend elimination, subpart F and special charges | 0.4 | 3.1 | 2.4 | ||||||||
Other permanent differences | (0.6 | ) | 1.5 | 2.4 | |||||||
Tax credits | (2.5 | ) | (2.1 | ) | (2.3 | ) | |||||
Adjust deferred taxes | 0.5 | 0.2 | (1.4 | ) | |||||||
Share-based compensation | (0.1 | ) | 0.9 | 3.0 | |||||||
Deferred transition tax | 6.5 | — | — | ||||||||
Other | 1.1 | 0.9 | 0.9 | ||||||||
Income tax expense | $ | 17.2 | $ | 14.2 | $ | 20.4 | |||||
The Company’s effective tax rate can vary significantly from the U.S. federal statutory rate primarily due to the level and mix of income among domestic and foreign jurisdictions and the creation and release of valuation allowances. In addition, the 2017 effective tax rate varied from the U.S. federal statutory rate due to a net $8.9 million benefit resulting from the enactment of the Tax Cuts and Jobs Act of 2017. In 2016, the effective tax rate varied from the federal statutory rate due to a benefit of $1.9 million related to a three-year reduced statutory tax rate at one of the Company’s non-U.S. subsidiaries. The reduction in the statutory rate is effective through December 31, 2018 and is expected to be renewed for a successive three-year period, although there can be no guarantees that the tax authority will accept the Company’s application.
Significant components of net deferred tax assets and liabilities are as follows:
December 31, | ||||||||
2017 | 2016 | |||||||
(in millions) | ||||||||
Deferred tax assets: | ||||||||
Net operating loss and other deferred carryforwards | $ | 81.6 | $ | 86.3 | ||||
Tax credit carryforwards | 15.9 | 16.7 | ||||||
Inventories | 6.3 | 6.5 | ||||||
Employee benefits | 12.0 | 13.3 | ||||||
Accrued liabilities and other | 6.4 | 6.5 | ||||||
Total deferred tax assets | 122.2 | 129.3 | ||||||
Less valuation allowances | (79.8 | ) | (77.7 | ) | ||||
Deferred tax assets, net of valuation allowances | 42.4 | 51.6 | ||||||
Deferred tax liabilities: | ||||||||
Goodwill and other intangible assets | 68.1 | 79.3 | ||||||
Property and equipment | 11.3 | 11.1 | ||||||
Withholdings taxes / undistributed non-U.S. earnings | 8.4 | 12.8 | ||||||
Total deferred tax liabilities | 87.8 | 103.2 | ||||||
Net deferred tax liabilities | $ | (45.4 | ) | $ | (51.6 | ) | ||
65
MILACRON HOLDINGS CORP.
NOTES TO CONSOLIDATED FINANCIAL STATEMENTS (CONTINUED)
4. Income Taxes (continued)
Deferred income taxes reflect the net effects of temporary differences between the carrying values of assets and liabilities and the tax basis of the assets and liabilities. In jurisdictions for which the Company has net deferred tax assets, these amounts are recorded in other noncurrent assets in the Consolidated Balance Sheets.
At December 31, 2017, the Company had non-U.S. net operating loss carryforwards, principally in The Netherlands, Germany, Italy and Belgium, totaling $166.2 million, $16.9 million of which will expire between 2019 and 2037. The remaining $149.3 million of non-U.S. net operating losses existing at December 31, 2017 have an indefinite carryforward period. In 2017, the Company utilized $16.2 million of prior net operating loss carryforwards from 2016 and earlier to reduce cash taxes by $4.3 million.
At December 31, 2017, the Company had estimated U.S. net operating loss carryforwards totaling $136.5 million, which are scheduled to expire beginning in 2029. As of December 31, 2017, the Company has determined that it has experienced multiple ownership changes under Internal Revenue Code Section 382 in prior years; however, the Company has not completed a formal study to determine whether there are Section 382 limitations as a result of ownership changes that occurred during the year ended December 31, 2017.
At December 31, 2017, the Company had tax credit carryovers, principally in the U.S. and Canada, totaling $15.9 million, $7.6 million of which will expire between 2018 and 2037. The remaining $8.3 million of tax credit carryovers have an unlimited life.
During the year ended December 31, 2016, as a result of changing the ownership structure of the Company's German subsidiaries, the Company could elect to file a consolidated German tax return. This tax planning strategy, which had not been previously available until the fourth quarter of 2016 and was subsequently made during the year ended December 31, 2017, provides significant positive evidence for the future utilization of the deferred tax assets of the newly formed consolidated group. As a result, the Company recognized an $8.5 million income tax benefit in the fourth quarter of 2016 related to the reversal of valuation allowances previously recorded against the deferred tax assets of one member of the group.
Tax Cuts and Jobs Act
On December 22, 2017, the Tax Cuts and Jobs Act of 2017 (the "Tax Act") was signed into law and it institutes fundamental changes to the taxation of multinational corporations. The Tax Act reduces the corporate tax rate to 21%, repeals the alternative minimum tax, limits the interest deduction, enhances the expensing of capital investments, implements a dividend exemption system, eliminates the deferral of foreign earnings, provides a minimum tax on low-taxed foreign earnings and new measures to deter base erosion. As part of the transition to the new tax system, the Tax Act imposes a one-time transition tax on historical undistributed earnings of foreign affiliates through the year ended December 31, 2017. SEC Staff Accounting Bulletin No. 118, issued in late December 2017, provides that the Company has one year to complete the accounting for the impact of the Tax Act and as of December 31, 2017 the Company has recorded a provisional estimate. Although the Tax Act is generally effective January 1, 2018, the Company is required to calculate the effects of changes in tax rates and laws on deferred tax balances in 2017, the period in which the legislation was enacted. The Company has not completed its determination of the accounting implications of the Tax Act on its tax balances. However, the Company has reasonably estimated the provisional effects of the Tax Act in the Consolidated Financial Statements as of December 31, 2017.
Corporate Tax Rate Change - For the year ended December 31, 2017, the Company recorded an income tax benefit of $4.6 million due to the decrease in the corporate tax rate from 35% to 21%. The income tax benefit resulted from reducing net deferred tax liabilities to the new lower rate. There was no impact on the Consolidated Financial Statements as a result of revaluing the Company’s U.S. deferred tax assets as the income tax expense was offset by an income tax benefit for revaluing the associated valuation allowances.
Elimination of Alternative Minimum Tax ("AMT") - For the year ended December 31, 2017, the Company recorded an income tax benefit of $6.7 million due to the elimination of the AMT. The Company reversed valuation allowances recorded against its AMT credit carryovers as provided in the rate reconciliation above. Under the Tax Act, the AMT credit carryovers will be refunded between 2019 and 2022.
Mandatory Transition Tax - For the year ended December 31, 2017, the Company recorded a provisional transition tax of $6.5 million. The Company expects to utilize existing U.S. net operating loss carryovers in lieu of paying the transition tax over the next eight years.
66
MILACRON HOLDINGS CORP.
NOTES TO CONSOLIDATED FINANCIAL STATEMENTS (CONTINUED)
4. Income Taxes (continued)
Global Intangible Low-Taxed Income ("GILTI") - The GILTI provisions of the Tax Act also require the Company to include in its U.S. income tax return foreign subsidiary earnings in excess of an allowable return on the foreign subsidiary’s tangible assets. The Company expects that it will have incremental U.S. taxable income as a result of the GILTI provisions beginning in 2018. The FASB states that an entity can make an accounting policy election to either recognize deferred taxes for temporary basis differences expected to reverse as GILTI in future years or provide for the tax expense related to GILTI in the year the tax is incurred. Given the complexity of the GILTI provisions, the Company is still evaluating the effects of the GILTI provisions and has not yet determined its accounting policy. At December 31, 2017, because the Company is still evaluating the GILTI provisions and the Company's analysis of future taxable income that is subject to GILTI, the Company is unable to make a reasonable estimate and have not reflected any adjustments related to GILTI in the Company's consolidated financial statements.
Undistributed Foreign Earnings - For the year ended December 31, 2017, the Company recorded a provisional charge of $2.4 million related to additional foreign withholding taxes on potential repatriations of historical foreign earnings. As a result of an updated analysis of future cash needs in the U.S. and opportunities for investment outside the U.S., the Company asserts that all foreign earnings will be indefinitely reinvested with the exception of certain foreign investments in which earnings and cash generation are in excess of local needs. With passage of the Tax Act, the Company's deferral of recognition of its previously earned foreign earnings ceased. Deferred tax liabilities recorded represent withholding taxes on accumulated foreign earnings for which the Company does not intend to permanently invest. The Company will continue to monitor its assertion related to investment of foreign earnings.
As of December 31, 2017, the Company has provided $8.4 million of deferred tax liabilities for withholding taxes on planned repatriations of foreign earnings. As of December 31, 2016, the Company intended to indefinitely reinvest $102.5 million of foreign earnings.
Uncertain Tax Positions
The Company recorded a liability of $11.0 million and $3.2 million for uncertain tax positions as of December 31, 2017 and 2016, respectively, of which, $9.7 million and $1.6 million would impact the effective tax rate, net of valuation allowance, respectively. In July 2017, the Company received approval for a tax-neutral amalgamation of two of its subsidiaries in India, effective March 1, 2017. The Company’s position is that the amalgamation resulted in approximately $21.7 million of tax basis in goodwill which is amortizable for Indian statutory purposes. At December 31, 2017, the Company has recorded an uncertain tax position of $7.5 million for the Indian income tax effects of this position as it does not meet the more-likely-than-not recognition threshold under U.S. GAAP. The statute of limitations for tax positions in India is seven years.
From a combination of statute expirations and audit settlements in the next twelve months, the Company does not expect a decrease in the amount of unrecognized tax benefits. For the remaining balance as of December 31, 2017, it is reasonably possible there could be material changes to the amount of uncertain tax positions due to activities of the taxing authorities, settlement of audit issues and reassessment of existing uncertain tax positions. However, the Company is not able to estimate the impact of these items at this time.
During the year ended December 31, 2016, an agreement was reached with the tax authority in one of the Company's foreign jurisdictions. Based upon the settlement, the Company concluded that a previously unrecognized tax benefit met the effective settlement criteria within Accounting Standards Codification ("ASC") 740. This settlement resulted in a $15.7 million reduction of the Company's unrecognized tax benefits and corresponding deferred tax assets during the third quarter of 2016; thus, the settlement had no impact on the Company's Consolidated Statements of Operations.
The Company’s policy is to recognize interest and penalties associated with unrecognized tax benefits within income tax expense within the Consolidated Statements of Operations. The Company has not recognized a liability for interest and penalties as of December 31, 2017 and 2016.
67
MILACRON HOLDINGS CORP.
NOTES TO CONSOLIDATED FINANCIAL STATEMENTS (CONTINUED)
4. Income Taxes (continued)
The reconciliation of the beginning and ending total amounts of unrecognized tax benefits (exclusive of interest and penalties) is as follows:
Year Ended December 31, | |||||||||||
2017 | 2016 | 2015 | |||||||||
(in millions) | |||||||||||
Balance as of beginning of year | $ | 3.2 | $ | 18.1 | $ | 1.0 | |||||
Additions for tax positions of prior years | — | — | 11.4 | ||||||||
Additions for tax positions of current year | 7.9 | 0.8 | 6.7 | ||||||||
Reductions due to lapse of statutes and settlements | (0.1 | ) | (15.7 | ) | (1.0 | ) | |||||
Balance as of the end of year | $ | 11.0 | $ | 3.2 | $ | 18.1 | |||||
The following tax years remain subject to examinations by major tax jurisdictions:
Tax Years | ||||
Tax Jurisdiction: | ||||
United States | 2014 - current | |||
Germany | 2011 - current | |||
China | 2014 - current | |||
Netherlands | 2014 - current | |||
Canada | 2012 - current | |||
India | 2014 - current | |||
5. Debt
Debt for the Company consists of the following:
December 31, 2017 | December 31, 2016 | ||||||||||||||||||||||
Principal | Unamortized Discount and Debt Issuance Costs | Net | Principal | Unamortized Discount and Debt Issuance Costs | Net | ||||||||||||||||||
(in millions) | |||||||||||||||||||||||
Senior secured term loan facility due September 2023 | $ | 937.5 | $ | 11.9 | $ | 925.6 | $ | — | $ | — | $ | — | |||||||||||
7.75% senior unsecured notes due 2021 | — | — | — | 464.4 | 7.3 | 457.1 | |||||||||||||||||
Senior secured term loan facility due September 2020 | — | — | — | 482.0 | 5.1 | 476.9 | |||||||||||||||||
Borrowings under other lines of credit | 7.4 | — | 7.4 | 7.0 | — | 7.0 | |||||||||||||||||
Capital lease obligations and other | 0.2 | — | 0.2 | 0.4 | — | 0.4 | |||||||||||||||||
945.1 | 11.9 | 933.2 | 953.8 | 12.4 | 941.4 | ||||||||||||||||||
Less current portion | (16.9 | ) | (0.1 | ) | (16.8 | ) | (7.3 | ) | — | (7.3 | ) | ||||||||||||
$ | 928.2 | $ | 11.8 | $ | 916.4 | $ | 946.5 | $ | 12.4 | $ | 934.1 | ||||||||||||
68
MILACRON HOLDINGS CORP.
NOTES TO CONSOLIDATED FINANCIAL STATEMENTS (CONTINUED)
5. Debt (continued)
2017 Term Loan Facility
On February 15, 2017, Milacron LLC, a wholly-owned subsidiary of the Company, entered into a new $947.0 million senior secured term loan facility with a maturity date of September 28, 2023 (the "2017 Term Loan Facility") pursuant to an amendment of the Company's $730.0 million senior secured term loan facility due September 2020 (the "New Term Loan Facility"). The net proceeds from the 2017 Term Loan Facility, together with cash on-hand, were used to redeem in full $464.4 million aggregate principal amount outstanding of the Company's 7.75% senior unsecured notes due 2021 (the "Senior Unsecured Notes"), repay in full $482.0 million aggregate principal amount outstanding under the Company's New Term Loan Facility and pay fees and expenses associated with these transactions. The 2017 Term Loan Facility was priced at 99.625% of the principal amount and bears interest at a rate per annum equal to an applicable margin or applicable rate plus, at the Company's option, either (a) a base rate determined by the reference to the highest of (1) the prime commercial lending rate publicly announced by the administrative agent of the 2017 Term Loan Facility as the “prime rate” as in effect on such day, (2) the federal funds effective rate plus 0.50%, and (3) the LIBOR rate determined by reference to the cost of funds for Eurodollar deposits for an interest period of one month, plus 1.00% or (b) a LIBOR rate (which shall be no less than 0.00%) determined by reference to the costs of funds for Eurodollar deposits for the specified interest period, as adjusted for certain statutory reserve requirements. The applicable margins for borrowings are (i) 2.00% with respect to base rate borrowings and 3.00% with respect to LIBOR borrowings, subject to compliance with a total net leverage ratio of greater than 3.50 to 1.00 and (ii) 1.75% with respect to base rate borrowings and 2.75% with respect to LIBOR borrowings, subject to compliance with a total net leverage ratio not to exceed 3.50 to 1.00.
In connection with these transactions, the Company recognized a $25.2 million loss on the early extinguishment of debt. The loss on debt extinguishment includes an $18.0 million premium paid to redeem the Senior Unsecured Notes and the write-off of $7.2 million of deferred financing costs and debt discount associated with the Senior Unsecured Notes and the New Term Loan Facility. The Company also capitalized an additional $4.6 million of deferred financing costs related to the issuance of the 2017 Term Loan Facility which are being amortized over the term of the loan using the effective interest rate method.
On November 8, 2017, the Company re-priced the 2017 Term Loan Facility. The applicable margins for borrowings are now (i) 1.75% with respect to base rate borrowings and 2.75% with respect to LIBOR borrowings, subject to compliance with a total net leverage ratio of greater than 3.50 to 1.00 and (ii) 1.50% with respect to base rate borrowings and 2.50% with respect to LIBOR borrowings, subject to compliance with a total net leverage ratio not to exceed 3.50 to 1.00. No other terms of the facility were changed. The Company was in compliance with all applicable covenants as of and for the year ended December 31, 2017.
New Term Loan Facility
On May 14, 2015, the Company entered into the $730.0 million New Term Loan Facility, pursuant to a term loan agreement, among Milacron Holdings Corp., Milacron LLC, the guarantors party thereto, the lenders party thereto and JPMorgan Chase Bank, N.A., as administrative agent. The New Term Loan Facility was set to mature on September 28, 2020. The New Term Loan Facility ranked equal in right of payment with all existing and future senior indebtedness of the issuers and guarantors. The New Term Loan Facility was also secured by a second-priority lien on all of the assets of the Company, Milacron LLC and the guarantors that secure the senior secured asset-based revolving credit facility (the "ABL Facility"). The interest rate applicable to the New Term Loan Facility was, at the Company's option, equal to either (i) the published LIBOR rate, plus a margin of, depending upon the current total net leverage ratio, 3.25% (if the Company's total net leverage ratio is less than or equal to 4.00 to 1.00) to 3.50% (if the Company's total net leverage ratio is greater than 4.00 to 1.00) per annum or (ii) the greater of (1) the prime rate, (2) the federal funds rate plus 0.50% per annum, (3) published LIBOR rate plus 1.00% or (4) 2.00% per annum, plus depending upon the current total net leverage ratio, 2.25% (if the Company's total net leverage ratio is less than or equal to 4.00 to 1.00) to 2.50% (if the Company's total net leverage ratio is greater than 4.00 to 1.00) per annum. In no event will the LIBOR rate be less than 1.00% at any time. The New Term Loan Facility provided the Company with the right, at any time, to request one or more incremental term increases in the aggregate amount (x) $200.0 million plus (y) an unlimited amount so long as our pro forma total net secured leverage ratio does not exceed 4.00 to 1.00 plus (z) the amount of any optional prepayment of any term loan under the New Term Loan Facility to the extent not funded with proceeds of any long-term indebtedness (other than revolving indebtedness) or proceeds of any incremental term facility that effectively extends the maturity date with respect to any class of term loans under the New Term Loan Facility. The following amounts will be applied to repay the New Term Loan Facility, subject to certain thresholds, carve-outs and exceptions: (i) 100% of the net cash proceeds of any incurrence of debt by us and certain of our subsidiaries, (ii) 100% of net cash proceeds of any non-ordinary course sale or other disposition of assets by us or certain subsidiaries and (iii) 50% of our excess cash flow, subject to certain reductions.
69
MILACRON HOLDINGS CORP.
NOTES TO CONSOLIDATED FINANCIAL STATEMENTS (CONTINUED)
5. Debt (continued)
The net proceeds from the New Term Loan Facility were used (i) to repay in full the $339.1 million principal outstanding under the Company's existing senior secured term loan facility due March 2020 (the "Term Loan Facility"), (ii) to redeem in full the $220.0 million aggregate principal amount outstanding on our 8.375% senior secured notes due 2019 (the "Senior Secured Notes") on May 15, 2015 at a redemption price of 106.281% of the principal amount thereof, plus accrued and unpaid interest, to, but not including May 15, 2015 and (iii) to pay a cash dividend of approximately $144.6 million to the holders of the Company's common stock.
In connection with these transactions, the Company recognized an $18.6 million loss on the early extinguishment of debt which is classified within loss on debt extinguishment in the Company's Consolidated Statements of Operations. The loss on debt extinguishment includes a $13.8 million premium paid to redeem the Senior Secured Notes and the write-off of $4.8 million of deferred financing costs and debt discount associated with the Senior Secured Notes and the Term Loan Facility. The Company also capitalized an additional $5.2 million of deferred financing costs related to the issuance of the New Term Loan Facility which are being amortized over the term of the loan using the effective interest rate method.
On June 30, 2015, in connection with the Company's completion of its IPO, the Company repaid $248.0 million of the principal amount outstanding under the New Term Loan Facility. As a result of this repayment, the Company recognized a $3.6 million loss on the early extinguishment of debt which is classified within loss on debt extinguishment in the Company's Consolidated Statements of Operations.
On February 15, 2017, the entire $482.0 million aggregate principle balance outstanding under the New Term Loan Facility was repaid.
Senior Unsecured Notes
On March 28, 2013, Milacron LLC and Mcron Financial Corp. issued $465.0 million aggregate principal amount of 7.75% Senior Unsecured Notes pursuant to an indenture, dated as of March 28, 2013 (the "2013 Indenture"), among Milacron LLC and Mcron Financial Corp., the guarantors party thereto and U.S. Bank National Association, as trustee and notes collateral agent. The Senior Unsecured Notes mature on February 15, 2021 and interest is payable semi-annually on February 15 and August 15 of each year. The Senior Unsecured Notes are unsecured and were issued in a private transaction that is not subject to the registration requirements of the Securities Act of 1933. The Senior Unsecured Notes are redeemable, in whole or in part, at any time on or after February 15, 2016 on the redemption dates and at the redemption prices set forth in the 2013 Indenture. In addition, the Company may redeem up to 40% of the Senior Unsecured Notes before February 15, 2016 with the net cash proceeds from certain equity offerings. The Company may also redeem some or all of the Senior Unsecured Notes before February 15, 2016 at a redemption price of 100% of the principal amount thereof plus accrued and unpaid interest, if any, to the redemption date, plus a “make whole” premium. In addition, the Company may be required to make an offer to purchase the Senior Unsecured Notes upon the sale of certain assets and upon a change of control.
In March 2016, the Company repurchased approximately $0.6 million of the Company's Senior Unsecured Notes on the open market at a discount to par. On February 15, 2017, the Company redeemed in the full the $464.4 million aggregate principal amount outstanding of the Senior Unsecured Notes.
Senior Secured Notes
On April 30, 2012, the Company issued $275.0 million aggregate principal amount of Senior Secured Notes pursuant to an indenture, among the Company, the guarantors party thereto and U.S. Bank National Association, as trustee and notes collateral agent.
In April 2014, the Company redeemed $55.0 million of the Senior Secured Notes. The Company recorded a $2.9 million loss on the early extinguishment of debt related to the redemption that is recorded within loss on debt extinguishment in the Company's Consolidated Statements of Operations. On May 15, 2015, the Company redeemed in full the $220.0 million aggregate principal amount outstanding on the Senior Secured Notes at a redemption price of 106.281% of the principal amount thereof, plus accrued and unpaid interest, to, but not including May 15, 2015.
Term Loan Facility
On March 28, 2013, Milacron Holdings Corp., Milacron LLC and certain domestic subsidiaries entered into a seven-year $245.0 million Term Loan Facility with JPMorgan Chase Bank, N.A. acting as administrative agent.
70
MILACRON HOLDINGS CORP.
NOTES TO CONSOLIDATED FINANCIAL STATEMENTS (CONTINUED)
5. Debt (continued)
On March 31, 2014, the Company exercised its right to request an incremental term increase and borrowed an additional $100.0 million, net of a discount of $0.5 million, under the Term Loan Facility for the principal purpose of funding acquisitions in 2016 as well as redeeming a portion of the Senior Secured Notes. The agreement was also amended to reduce the margin on the interest rate from 3.25% to 3.00% for LIBOR loans and from 2.25% to 2.00% for non-LIBOR loans. No other significant terms of the Term Loan Facility were changed. As a result of the modification, an additional $0.8 million of related costs were deferred and were being amortized over the term of the agreement. On May 14, 2015, the Company repaid in full the $339.1 million principal amount outstanding under the Term Loan Facility.
ABL Facility
On April 30, 2012, Milacron Holdings Corp., Milacron LLC and certain subsidiaries entered into a new ABL Facility. The ABL Facility has a five-year term, bears interest at a floating rate and provides for an aggregate principal amount of $60.0 million of loans thereunder, subject to a borrowing base and other limitations. The Company has the right at any time to request up to $20.0 million of additional commitments. The existing lenders under the ABL Facility are not under any obligation to provide such additional commitments, and any increase in commitments is subject to customary conditions.
The obligations under the ABL Facility are secured, subject to certain exceptions, by substantially all of the assets of the borrowers and the assets of the guarantors under such facility. In addition, the ABL Facility includes certain customary negative covenants that, subject to exceptions, limit the ability of Milacron Holdings Corp. to incur additional indebtedness, pay dividends or certain other distributions on its capital stock, repurchase its capital stock, prepay subordinated indebtedness, incur liens on assets, make certain investments or other restricted payments, engage in transactions with affiliates, sell certain assets, merge or consolidate with or into other companies and alter the business that it conducts.
On March 28, 2013, the ABL Facility was amended to increase the maximum borrowings under the U.S. sub-facility from $60.0 million to $70.0 million and to allow for additional borrowings of up to $30.0 million under a Canadian sub-facility, subject to a borrowing base and other limitations. The covenants and other terms of the ABL Facility were not significantly changed. As a result of this modification, an additional $1.1 million of related costs were deferred and are being amortized over the term of the amended agreement. On March 17, 2014, the Company exercised its right to increase the U.S. sub-facility of the ABL Facility by $10.0 million to $80.0 million and decrease the Canadian sub-facility by $10.0 million to $20.0 million. The covenants and other terms of the program were not changed. On October 17, 2014, the ABL Facility was amended to add a $25.0 million German sub-facility and the term was reset to five years from the date of the amendment. The covenants and other terms of the ABL Facility were not materially changed. As a result of this modification, an additional $1.3 million of related costs were deferred and are being amortized over the term of the amended agreement. On May 14, 2015, the Company amended and restated the credit agreement governing the ABL Facility to conform certain terms in the credit agreement governing the ABL Facility to the terms contained in the credit agreement governing the New Term Loan Facility.
At December 31, 2017, $29.1 million of the ABL Facility was utilized, all of which represent letters of credit, with $64.9 million available under the facility. At December 31, 2016, $16.7 million of the ABL Facility was utilized, all of which represent letters of credit, with $77.6 million available under the facility. The Company is in compliance with all covenants as of and for the years ended December 31, 2017 and 2016.
Other Borrowings
The Company has other lines of credit and capital lease arrangements with various U.S. and non-U.S. banks totaling approximately $23.2 million and $23.5 million at December 31, 2017 and 2016, respectively. These credit facilities support letters of credit, guarantees and leases in addition to providing borrowings under varying terms. At December 31, 2017, $10.1 million was outstanding with $7.6 million representing borrowings and $2.5 million representing letters of credit and bank guarantees. At December 31, 2016, $12.0 million was outstanding with $7.4 million representing borrowings and $4.6 million representing letters of credit and bank guarantees. Approximately $13.1 million and $11.5 million were available to the Company under certain conditions under these lines at December 31, 2017 and 2016, respectively. The weighted-average interest rate on short-term borrowings was 5.15% at December 31, 2017 and 5.14% at December 31, 2016.
71
MILACRON HOLDINGS CORP.
NOTES TO CONSOLIDATED FINANCIAL STATEMENTS (CONTINUED)
5. Debt (continued)
Debt Issuance Costs
As a result of the Company’s issuance of the Senior Secured Notes in 2012, $8.9 million of debt issuance costs were capitalized and were being amortized over seven years using the effective interest rate method. Additionally, as a result of the issuance of the Term Loan Facility and the Senior Unsecured Notes in 2013, $21.3 million of debt issuance costs were capitalized and were being amortized using the effective interest rate method. As previously described, the Company recognized a $22.2 million loss on the early extinguishment of debt which is classified within loss on debt extinguishment in the Company's Consolidated Statements of Operations for the year ended December 31, 2015. The loss on debt extinguishment includes a $13.8 million premium paid to redeem the Senior Secured Notes, the write-off of $4.8 million of debt issuance costs and debt discount associated with the Senior Secured Notes and the Term Loan Facility and $3.6 million write-off of debt issuance costs and debt discount associated with the New Term Loan Facility as a result of the repayment of $248.0 million on June 30, 2015. The Company also capitalized an additional $5.2 million of deferred financing costs related to the issuance of the New Term Loan Facility which were being amortized over the term of the loan using the effective interest rate method. Also as previously described, the Company recognized a $25.2 million loss on the early extinguishment of debt for the year ended December 31, 2017. The loss includes a $18.0 million premium paid to redeem the Senior Unsecured Notes and the write-off of $7.2 million of deferred financing costs and debt discount associated with the Senior Unsecured Notes and the New Term Loan Facility. The Company also capitalized an additional $4.6 million of deferred financing costs related to the issuance of the 2017 Term Loan Facility which are being amortized over the term of the loan using the effective interest rate method. The Company also capitalized an additional $0.8 million of deferred financing costs in relation to the re-pricing of the 2017 Term Loan Facility in November 2017. Deferred financing costs are netted against long-term debt in the accompanying Consolidated Balance Sheets and the related amortization expense is included in interest expense, net in the accompanying Consolidated Statements of Operations.
As of December 31, 2017, future minimum payments of the Company’s debt and capital lease arrangements are as follows (in millions):
2018 | $ | 9.5 | |
2019 | 9.6 | ||
2020 | 9.5 | ||
2021 | 9.5 | ||
2022 | 9.5 | ||
At December 31, 2017, based on Level 2 inputs such as quoted market prices, the fair value of the 2017 Term Loan Facility was approximately $937.5 million, which equals the carrying value. The carrying amount of the Company’s other debt approximates fair value.
6. Employee Benefit Plans
Savings Plans
The Company sponsors a defined contribution plan (the "401(k) Plan") for eligible U.S. employees. The provisions of the 401(k) Plan allow eligible employees to contribute a percentage of their compensation, not to exceed the limits established by federal income tax law and employees are immediately vested in their voluntary contributions. The Company’s contributions to the 401(k) Plan are based on matching a portion of the employee contributions and employees become vested in the Company contributions once they attain one year of credited service.
The Company also maintains defined contribution plans for eligible employees at certain of its foreign subsidiaries. Employees are immediately vested in both their voluntary and company matching contributions.
The Company recorded expense of $3.6 million, $3.4 million and $2.7 million for the years ended December 31, 2017, 2016 and 2015, respectively.
Pension Plans
The Company sponsors three noncontributory defined benefit pension plans for certain non-U.S. employees and retirees. One plan covers certain employees in the United Kingdom and the other two plans cover certain employees in Germany. Contributions to these plans are expected to approximate benefit payments.
72
MILACRON HOLDINGS CORP.
NOTES TO CONSOLIDATED FINANCIAL STATEMENTS (CONTINUED)
6. Employee Benefit Plans (continued)
Components of net periodic pension cost included in the accompanying Consolidated Statements of Operations were as follows:
Year Ended December 31, | |||||||||||
2017 | 2016 | 2015 | |||||||||
(in millions) | |||||||||||
Service costs | $ | 0.4 | $ | 0.4 | $ | 0.4 | |||||
Interest cost | 0.7 | 0.8 | 0.8 | ||||||||
Expected return on plan assets | (0.2 | ) | (0.3 | ) | (0.3 | ) | |||||
Amortization of unrecognized losses | 0.6 | 0.2 | 0.3 | ||||||||
Pension expense | $ | 1.5 | $ | 1.1 | $ | 1.2 | |||||
The measurement date for all of the Company’s defined benefit pension plans is December 31. The funded status of the plans is as follows:
Year Ended December 31, | |||||||||||
2017 | 2016 | 2015 | |||||||||
(in millions) | |||||||||||
Change in benefit obligation: | |||||||||||
Projected benefit obligation at beginning of year | $ | 34.4 | $ | 31.6 | $ | 35.3 | |||||
Service cost | 0.4 | 0.4 | 0.4 | ||||||||
Interest cost | 0.7 | 0.8 | 0.8 | ||||||||
Benefits paid | (1.0 | ) | (0.8 | ) | (0.8 | ) | |||||
Actuarial (gain) loss | (0.4 | ) | 5.3 | (1.0 | ) | ||||||
Foreign currency translation adjustments | 4.5 | (2.9 | ) | (3.1 | ) | ||||||
Projected benefit obligation at end of year | $ | 38.6 | $ | 34.4 | $ | 31.6 | |||||
Change in plans assets: | |||||||||||
Fair value of plan assets at beginning of year | $ | 5.9 | $ | 5.7 | $ | 5.6 | |||||
Employer contributions | 0.2 | 0.5 | 0.3 | ||||||||
Actual return on plan assets | 0.5 | 1.0 | 0.2 | ||||||||
Benefits paid | (0.3 | ) | (0.1 | ) | (0.1 | ) | |||||
Foreign currency translation adjustments | 0.6 | (1.2 | ) | (0.3 | ) | ||||||
Fair value of plan assets at end of year | $ | 6.9 | $ | 5.9 | $ | 5.7 | |||||
Underfunded status | $ | 31.7 | $ | 28.5 | $ | 25.9 | |||||
Amounts recognized in the Consolidated Balance Sheets consisted of:
December 31, | ||||||||
2017 | 2016 | |||||||
(in millions) | ||||||||
Current accrued pension liabilities | $ | 0.8 | $ | 0.7 | ||||
Noncurrent accrued pension liabilities | 30.9 | 27.8 | ||||||
Accumulated other comprehensive loss | (7.2 | ) | (7.3 | ) | ||||
The actuarial loss included in accumulated other comprehensive loss that is expected to be recognized in net periodic pension cost during the fiscal year ended December 31, 2018 is $0.6 million. The accumulated benefit obligation for the defined benefit plans was $37.7 million and $33.5 million at December 31, 2017 and 2016, respectively.
73
MILACRON HOLDINGS CORP.
NOTES TO CONSOLIDATED FINANCIAL STATEMENTS (CONTINUED)
6. Employee Benefit Plans (continued)
Estimated future benefit payments from the defined benefit plans, including the effects of future service, are as follows (in millions):
2018 | $ | 1.0 | |
2019 | 1.0 | ||
2020 | 1.1 | ||
2021 | 1.2 | ||
2022 | 1.5 | ||
2023 – 2027 | 7.3 | ||
The following table presents the weighted-average actuarial assumptions used to determine pension cost for the Company’s defined benefit plans:
Year Ended December 31, | ||||||||
2017 | 2016 | 2015 | ||||||
Discount rate | 1.80 | % | 2.71 | % | 2.44 | % | ||
Expected long-term rate of return on plan assets | 3.69 | % | 4.72 | % | 4.54 | % | ||
Rate of expected increase in future compensation levels | 3.49 | % | 3.45 | % | 3.36 | % | ||
The following table presents the weighted-average actuarial assumptions used to determine the projected benefit obligation for the Company’s defined benefit plans:
December 31, | ||||||
2017 | 2016 | |||||
Discount rate | 1.75 | % | 1.80 | % | ||
Rate of expected increase in future compensation levels | 3.43 | % | 3.46 | % | ||
Plan assets are held in the United Kingdom plan and in one of the plans in Germany. Plan assets are primarily invested in common/collective trusts which are valued at the net asset value ("NAV") per share or unit multiplied by the number of shares or units held as of the measurement date. The NAV is based on the fair value of the underlying net assets owned by the fund and the NAV’s unit or per share price is quoted on a private market that may not be active. The investment objectives for the plan assets are to generate returns that will enable the plans to meet their future obligations. The Company’s expected long-term rate of return was determined based on the asset mix of the plan, projected returns, past performance and other factors. There were no transfers between the three levels of the fair value hierarchy during the years ended December 31, 2017 and 2016.
74
MILACRON HOLDINGS CORP.
NOTES TO CONSOLIDATED FINANCIAL STATEMENTS (CONTINUED)
6. Employee Benefit Plans (continued)
The following table sets forth by level, within the fair value hierarchy, the plans assets at fair value as of December 31, 2017 and 2016:
Total | Level 1 | Level 2 | Level 3 | |||||||||||||
(in millions) | ||||||||||||||||
December 31, 2017 | ||||||||||||||||
Investments: | ||||||||||||||||
Common/Collective trusts: | ||||||||||||||||
Equity | $ | 3.4 | $ | — | $ | 3.4 | $ | — | ||||||||
Corporate and government bonds | 3.3 | — | 3.3 | — | ||||||||||||
Cash equivalents and other | 0.2 | 0.2 | — | — | ||||||||||||
Total investments | $ | 6.9 | $ | 0.2 | $ | 6.7 | $ | — | ||||||||
December 31, 2016 | ||||||||||||||||
Investments: | ||||||||||||||||
Common/Collective trusts: | ||||||||||||||||
Equity | $ | 2.7 | $ | — | $ | 2.7 | $ | — | ||||||||
Corporate and government bonds | 2.8 | — | 2.8 | — | ||||||||||||
Cash equivalents and other | 0.4 | 0.4 | — | — | ||||||||||||
Total investments | $ | 5.9 | $ | 0.4 | $ | 5.5 | $ | — | ||||||||
Other postretirement plan
The Company sponsored a postretirement medical insurance plan for certain eligible employees. During the year ended December 31, 2015, the Company terminated the plan and recognized a $1.5 million gain which is included within other expense, net on the Company's Consolidated Statements of Operations.
75
7. Shareholders’ Equity
At inception, the Company had 48,898,000 authorized shares of common stock and 10,000 authorized shares of preferred stock, each with a par value of $0.01 per share. On March 7, 2013, the number of common shares authorized was increased to 83,977,000. On June 25, 2015, in conjunction with the Company's IPO, the number of preferred shares authorized was increased to 50,000,000 and the number of common shares authorized was increased to 500,000,000. The holders of the common stock are entitled to one vote for each share held of record on all matters submitted to a vote of shareholders. Subject to preferences that may be applicable to any outstanding preferred stock, holders of common stock are entitled to receive ratably such dividends as may be declared from time to time by the Board of Directors. At December 31, 2017 and 2016, the Company has 69,644,918 and 68,473,561 common shares issued and outstanding, respectively, and no preferred shares issued or outstanding for any period.
On May 15, 2015, the Company paid a cash dividend of $144.6 million to holders of the Company's common stock. On June 12, 2015, the Company’s Board of Directors and stockholders approved a 106.3 for 1 stock split of the Company’s common stock. All common share and common per share amounts in the consolidated financial statements and notes thereto have been retroactively adjusted for all periods presented to give effect to this stock split.
8. Net Earnings (Loss) Per Share
The following is a reconciliation of the numerator and denominator of the basic and diluted net earnings (loss) per share (EPS) computations:
Year Ended December 31, | |||||||||||
2017 | 2016 | 2015 | |||||||||
(in millions, except share and per share amounts) | |||||||||||
Numerator: | |||||||||||
Net earnings (loss) applicable to common shareholders | $ | 1.1 | $ | 30.5 | $ | (38.8 | ) | ||||
Denominator: | |||||||||||
Denominator for basic EPS—weighted-average common shares | 68,574,631 | 67,504,065 | 59,925,776 | ||||||||
Dilutive effect of stock-based compensation arrangements | 2,427,276 | 2,625,997 | — | ||||||||
Denominator for diluted EPS—adjusted weighted-average common shares | 71,001,907 | 70,130,062 | 59,925,776 | ||||||||
Basic EPS | $ | 0.02 | $ | 0.45 | $ | (0.65 | ) | ||||
Diluted EPS | $ | 0.02 | $ | 0.43 | $ | (0.65 | ) | ||||
The diluted EPS calculation for the year ended December 31, 2015 excludes the effect of the following outstanding stock-based awards as their effect is anti-dilutive: 6,296,789 stock options, 258,813 shares of restricted stock and 16,125 restricted stock units. Holders of non-vested stock-based compensation awards do not have voting rights or rights to receive nonforfeitable dividends on the shares covered by the awards.
9. Stock-based Compensation
The Company sponsors an equity incentive plan (the "2012 Plan") which provides for the granting of stock options, stock appreciation rights ("SARs"), restricted stock and other stock-based awards to employees, non-employee directors and Company consultants. The Company has granted both time-based and performance-based stock options and time-based and performance-based SARs under the 2012 Plan. The time-based stock options vest in equal increments over four years in tranches for the awards granted to employees and five years in tranches for awards granted to non-employee directors and were valued using a closed form option-pricing model. The performance-based stock options only vest when specific liquidity events, as defined, occur and were valued using a Monte Carlo simulation. The performance-based stock options also contain a market condition in which the CCMP Capital Advisors, LLC ("CCMP") Stockholders, as defined, must receive a certain multiple of their initial investment in order for the awards to vest. The time-based stock options also contain provisions that accelerate vesting of the awards upon the occurrence of a liquidity event, as defined. The time-based SARs vest in equal increments over four years in tranches and the performance-based SARs only vest when specific liquidity events, as defined, occurs and if the CCMP Stockholders, as defined, receive a certain multiple on their initial investment.
76
MILACRON HOLDINGS CORP.
NOTES TO CONSOLIDATED FINANCIAL STATEMENTS (CONTINUED)
9. Stock-based Compensation (continued)
In June 2015, the Company's Board of Directors adopted the 2015 Equity Incentive Plan (the "2015 Plan") which became effective upon the pricing of the Company's IPO. The 2015 Plan allows for the granting of stock options, SARs, restricted stock awards, restricted stock units and other awards convertible into or otherwise based on shares of the Company's common stock. All stock-based awards granted post-IPO are granted under the 2015 Plan.
Stock Options
Stock options, valued using a closed form option-pricing model, granted by the Company under the 2015 Plan vest in equal annual increments over four years.
The models utilized to value the time-based and performance-based awards granted under the 2012 Plan and 2015 Plan require the input of certain subjective assumptions, including (a) the expected stock price volatility, (b) the calculation of expected term of the award, (c) the risk-free interest rate and (d) expected dividends. Due to the lack of a public market for the trading of the Company’s common stock prior to the IPO and a lack of company-specific historical and implied volatility data, the Company has based its estimate of expected volatility on the historical volatility of a group of similar companies that are publicly traded. The historical volatility is calculated based on a period of time commensurate with the expected term assumption. The computation of expected volatility is based on the historical volatility of a representative group of companies with similar characteristics to the Company. The Company believes the group selected has sufficient similar economic and industry characteristics, and includes companies that are most representative of the Company. The Company uses the simplified method as prescribed by the SEC Staff Accounting Bulletin No. 107, Share-Based Payment, to calculate the expected term for the stock options granted to employees as it does not have sufficient historical exercise data to provide a reasonable basis upon which to estimate the expected term. The expected term of the performance-based options was based on the expected time to a liquidity event, as defined. The risk-free interest rate is based on a treasury instrument whose term is consistent with the expected life of the stock options. The expected dividend yield is assumed to be zero as the Company has no current plans to pay any dividends on its common stock.
The key assumptions utilized in determining the fair value of the stock options granted during the years ended December 31, 2017, 2016 and 2015 are as follows for the various tranches:
Time-Based Options | ||||||
Year Ended December 31, | ||||||
2017 | 2016 | 2015 | ||||
Assumptions: | ||||||
Expected term (years) | 6.25 | 6.25 | 2.07 - 7.50 | |||
Expected volatility | 39.50% | 42.00% | 45.00% - 77.00% | |||
Risk-free interest rate | 2.17% | 1.59% | 0.46% - 2.31% | |||
Expected dividend yield | —% | —% | —% | |||
Performance-Based Options | ||||||
Year Ended December 31, | ||||||
2017 | 2016 | 2015 | ||||
Assumptions: | ||||||
Expected term (years) | N/A | N/A | 2.07 - 4.30 | |||
Expected volatility | N/A | N/A | 44.00% - 74.00% | |||
Risk-free interest rate | N/A | N/A | 0.29% - 3.09% | |||
Expected dividend yield | N/A | N/A | —% | |||
77
MILACRON HOLDINGS CORP.
NOTES TO CONSOLIDATED FINANCIAL STATEMENTS (CONTINUED)
9. Stock-based Compensation (continued)
For the stock option grants made in 2015 and January 2016, the estimated grant date fair value of the Company’s common stock, as determined by the Company’s Board of Directors, which in part relied upon a valuation from a third-party specialist, approximated $9.41, therefore, the strike prices for those grants are $9.41. In connection with the cash dividend of $144.6 million paid to the holders of the Company's common stock in May 2015, as disclosed in Note 7, the Company made an adjustment to the exercise price of all stock options outstanding as of that date in accordance with the stock option agreements’ original terms and conditions related to anti-dilution. The dividend, $2.77 on a per share basis, reduced the exercise price of all outstanding options from $9.41 to $6.64 effective May 15, 2015. For the stock option grants made in conjunction with the Company's IPO, the strike price was set at the opening price of $20.00. For the stock option grants made during the years ended December 31, 2017 and 2016, the weighted-average strike price was $18.42 and $17.71, respectively. Additionally, all awards granted for the years presented expire ten years from the grant date.
The total fair value of the time-based stock options granted is being recognized into compensation expense over the requisite service period. In 2015, based on the trading price of the Company's common stock subsequent to the IPO, the market condition related to the time-based options issued under the 2012 Plan was satisfied which resulted in the vesting of these awards and the Company's recognition of all previously unrecognized stock-based compensation expense associated with these awards. For the years ended December 31, 2017, 2016 and 2015, compensation expense related to time-based options granted under both the 2012 Plan and 2015 Plan was $3.4 million, $3.5 million and $10.6 million, respectively.
In 2015, the performance condition was satisfied in conjunction with the Company's IPO and the market condition was satisfied based on the trading price of the Company's common stock subsequent to the IPO which resulted in the Company's recognition of all unrecognized stock-based compensation associated with the performance-based awards. For the year ended December 31, 2015, compensation expense related to the performance-based options was $9.2 million. As all performance-based awards were vested as of December 31, 2015 and no additional performance-based awards were granted during the years ended December 31, 2017 and 2016, no compensation expense was recognized during 2017 and 2016 for performance-based awards.
At December 31, 2017, the time-based stock options had unrecognized compensation expense related to nonvested options of $5.7 million which is expected to be recognized over a weighted-average remaining period of 2.3 years. Approximately $2.9 million is expected to be recognized into compensation expense in 2018 related to the time-based awards.
The following tables present combined stock option information under the 2012 Plan and the 2015 Plan as of and for the year ended December 31, 2017:
Outstanding | Exercisable | |||||||||||||||
Exercise Price | Options | Weighted- Average Remaining Contractual Term (In years) | Weighted- Average Exercise Price | Options | Weighted- Average Exercise Price | |||||||||||
$6.64 | 3,164,646 | 5.4 | $ | 6.64 | 3,104,691 | $ | 6.64 | |||||||||
$16.00 - $20.00 | 1,506,251 | 8.0 | 19.41 | 507,726 | 19.91 | |||||||||||
Total | 4,670,897 | 6.2 | $ | 10.76 | 3,612,417 | $ | 8.51 | |||||||||
Options | Weighted- Average Exercise Price | Weighted- Average Remaining Contractual Term (In years) | Aggregate Intrinsic Value (In millions) | ||||||||||
Outstanding at December 31, 2016 | 5,167,297 | $ | 9.62 | ||||||||||
Granted | 474,502 | 18.42 | |||||||||||
Exercised | (804,350 | ) | 6.64 | ||||||||||
Expired | (51,130 | ) | 13.06 | ||||||||||
Forfeited | (115,422 | ) | 18.91 | ||||||||||
Outstanding at December 31, 2017 | 4,670,897 | $ | 10.76 | 6.2 | $ | 40.0 | |||||||
Exercisable at December 31, 2017 | 3,612,417 | $ | 8.51 | 5.7 | $ | 38.8 | |||||||
78
MILACRON HOLDINGS CORP.
NOTES TO CONSOLIDATED FINANCIAL STATEMENTS (CONTINUED)
9. Stock-based Compensation (continued)
The Company received cash proceeds from the exercise of stock options of $5.3 million, $7.0 million and $0.4 million for the years ended December 31, 2017, 2016 and 2015, respectively. The total intrinsic value (the amount by which the stock price exceeds the exercise price of the option on the date of exercise) of the stock options exercised during the years ended December 31, 2017, 2016 and 2015 was $8.7 million, $10.0 million and $0.4 million, respectively.
At December 31, 2017, there were 3,250,398 time-based stock options outstanding and the weighted-average grant-date fair value of time-based stock options granted during the years ended December 31, 2017, 2016 and 2015 was $7.75, $7.62 and $8.88, respectively. At December 31, 2017, there were 1,420,499 performance-based stock options outstanding and the weighted-average grant-date fair value of performance-based stock options granted during the year ended December 31, 2015 was $4.46.
Stock Appreciation Rights
Under the 2012 Plan, the Company granted a total of 161,941 time-based SARs and 161,952 performance-based SARs with a strike price of $6.64 per share that will expire ten years from the date of grant and will only be settled in cash. The time-based awards vest in equal increments over four years in tranches and the performance-based awards only vest when specific liquidity events, as defined, occurs and if the CCMP Stockholders, as defined, receive a certain multiple on their initial investment. At December 31, 2017, there were 103,822 time-based SARs and 119,944 performance-based SARs vested and outstanding related to the 2012 Plan with a liability balance of $2.8 million, which is reported in accrued salaries, wages and other compensation in the Company's Consolidated Balance Sheets.
In June 2015, in conjunction with the Company's IPO, the Company granted an additional 136,441 SARs under the 2015 Plan with a strike price of $20.00 per share. These awards will vest in equal increments over four years in tranches, will expire ten years from the date of grant and will only be settled in cash. At December 31, 2017, 83,229 SARs were outstanding with 65,491 vested related to the 2015 Plan and there was a $0.4 million liability associated with these awards. For the years ended December 31, 2017, 2016 and 2015, the Company recorded compensation expense of $0.6 million, $1.8 million and $1.6 million, respectively, related to SARs granted under both the 2012 Plan and 2015 Plan.
Restricted Stock Awards
In June 2015, in conjunction with the Company's IPO, 266,313 shares of restricted common stock were granted with a fair value of $20.00 per share. In 2016, 180,571 shares of restricted common stock were granted with a weighted-average fair value of $15.86 per share. All shares of restricted common stock granted in 2016 and 2015 vest at the end of three years. In 2017, 435,824 shares of restricted common stock were granted with a weighted-average fair value of $18.14 that vest in equal increments over three years in tranches. During the years ended December 31, 2017, 2016 and 2015, 98,091, 68,650 and 7,500 shares of restricted stock were forfeited, respectively. At December 31, 2017, there were 704,560 restricted stock awards outstanding and there is unrecognized compensation expense of $6.9 million associated with these awards which is expected to be recognized over a weighted-average period of 2.1 years. For the years ended December 31, 2017, 2016 and 2015, the Company recorded compensation expense of $3.1 million, $1.4 million and $0.7 million, respectively, and approximately $3.5 million is expected to be recognized into compensation expense in 2018.
Restricted Stock Units
In June 2015, in conjunction with the Company's IPO, 16,125 restricted stock units were granted with a fair value of $20.00 per share and vested two business days after the public disclosure in 2016 of the Company’s financial results for fiscal year 2015. In 2016, 29,274 restricted stock units were granted with a fair value of $14.69 per share and vested one year from the date of grant. In 2017, 340,395 restricted stock units were granted with 33,051 vesting seven months from the grant date, 23,384 vesting one year from the date of grant and 283,960 vesting in equal increments over three years in tranches. The restricted stock units granted in 2017 had a weighted-average fair value of $18.22 per share. During the year ended December 31, 2017, 4,072 restricted stock units were forfeited. At December 31, 2017, there were 336,323 restricted stock units outstanding and there is unrecognized compensation expense of $3.6 million associated with these awards which is expected to be recognized over a weighted-average period of 2.3 years. For the years ended December 31, 2017, 2016 and 2015, the Company recorded compensation expense of $2.0 million, $0.4 million and $0.2 million, respectively, and approximately $1.6 million is expected to be recognized into compensation expense in 2018.
79
MILACRON HOLDINGS CORP.
NOTES TO CONSOLIDATED FINANCIAL STATEMENTS (CONTINUED)
9. Stock-based Compensation (continued)
Performance Stock Units
In 2017, the Company granted 87,202 performance stock units with a fair value of $18.42 per share all of which are outstanding at December 31, 2017. The performance stock units contain a three-year performance period with a performance target based on return on invested capital and possible payouts ranging from 50% to 200% of the target awards. The Company recorded compensation expense of $0.4 million for the year ended December 31, 3017 and approximately $0.5 million is expected to be recognized into compensation expense in 2018. At December 31, 2017, there was $1.0 million of unrecognized expense which is expected to be recognized over a weighted-average period of 2.0 years.
10. Derivative Financial Instruments
In the normal course of business, including the purchasing of materials and selling of products, the Company is exposed to certain risks related to fluctuations in foreign currency exchange rates. The Company uses foreign currency forward contracts to manage risks from these market fluctuations. The Company is also exposed to certain risks related to fluctuations in interest rates and uses interest rate swaps to manage risk from these market fluctuations. The counterparties to these financial instruments are financial institutions with strong credit ratings. The Company maintains control over the size of positions entered into with any one counterparty and monitors the credit ratings of these institutions.
Foreign Currency Forward Contracts
The Company currently hedges its risk relative to fluctuations in the Canadian dollar, Euro and Japanese yen for forecasted cash outflows denominated in these currencies. The Company had foreign currency forward exchange contracts denominated in these currencies outstanding with notional amounts totaling $0.3 million at December 31, 2017 and $7.0 million at December 31, 2016. As of December 31, 2017, all of the Company’s outstanding instruments mature within one month.
The Company’s derivative instruments discussed above are designated as cash flow hedges and the fair value of these derivative instruments was insignificant at December 31, 2017 and $0.6 million at December 31, 2016 and is included in other current liabilities in the Company's Consolidated Balance Sheets.
The Company also enters into derivative instruments (forwards) to economically hedge the impact of fluctuations in the Indian rupee. During the year ended December 31, 2015, the Company recognized a gain of $0.1 million related to the changes in fair value of these derivative instruments not designated as hedges. These gains and losses are recognized immediately within the Company's Consolidated Statements of Operations and are classified within (gain) loss on currency translation. The fair value of these derivative instruments not designated as hedges at December 31, 2017 was insignificant.
Interest Rate Swap Agreements
The Company is exposed to changes in interest rates on its variable rate debt. In order to manage this risk, on February 16, 2017, Milacron LLC, a wholly-owned subsidiary of the Company, entered into two interest rate swap transactions effective for a four-year period beginning January 31, 2018 with a total notional amount of $400.0 million. The interest rate swaps are intended to manage the Company's interest rate risk by fixing the interest rate on a portion of the Company's debt outstanding under the 2017 Term Loan Facility that was previously subject to a floating interest rate equal to 1-month LIBOR plus a credit spread. The swaps provide for the Company to pay a fixed rate of 2.062% per annum on such portion of the outstanding debt in exchange for receiving a variable interest rate based on 1-month LIBOR. The effect is a synthetically fixed rate of 2.062% plus the loan spread for the term and debt hedged.
The Company designated these interest rate swaps as cash flow hedges of floating rate borrowings and expects the hedge to be highly effective in offsetting fluctuations in the designated interest payments resulting from changes in the benchmark interest rate. The gains and losses on the designated interest rate swaps will offset losses and gains on the transactions being hedged. The fair value of the interest rate swaps is calculated by taking into consideration current interest rates and the current creditworthiness of the counterparties or the Company, as applicable. The effective portion of changes in the fair value of the interest rate swaps is reflected as a component of accumulated other comprehensive income and recognized as interest expense, net as payments are paid or accrued. The remaining gain or loss in excess of the cumulative change in the present value of the future cash flows of the hedge item, if any (i.e. the ineffective portion), is recognized as interest expense, net during the current period. During the year ended December 31, 2017, the Company recorded $0.2 million of hedge ineffectiveness in earnings.
80
MILACRON HOLDINGS CORP.
NOTES TO CONSOLIDATED FINANCIAL STATEMENTS (CONTINUED)
10. Derivative Financial Instruments (continued)
The following table provides the effect of the Company’s foreign currency forward contracts and interest rate swaps designated as cash flow hedges on the Company’s Consolidated Financial Statements for the years ended December 31, 2017, 2016 and 2015:
Type of instrument: | Gain (Loss) Recognized in OCI on Derivative (Effective Portion) | Gain (Loss) Reclassified from Accumulated OCI into Income (Effective Portion) | |||||
(in millions) | |||||||
2017 | |||||||
Foreign exchange contract | $ | (0.5 | ) | $ | (1.1 | ) | |
Interest rate swaps: | $ | 0.4 | $ | — | |||
2016: | |||||||
Foreign exchange contract | $ | 0.5 | $ | 1.1 | |||
2015: | |||||||
Foreign exchange contract | $ | (0.5 | ) | $ | (3.6 | ) | |
All gains (losses) that are reclassified from accumulated other comprehensive income (loss) into income (effective portion) are classified in (gain) loss on currency translation or cost of sales within the Company's Consolidated Statements of Operations. The gain (loss) recognized related to the ineffective portion of the derivative instruments was immaterial for all periods presented. During the year ended December 31, 2017, the Company recorded a net loss of $1.1 million related to the settlement of forward exchange contracts which were designated as cash flow hedges. During the year ended December 31, 2016, the Company recorded net gain of $1.1 million related to the settlement of forward exchange contracts which were designated as cash flow hedges. During the year ended December 31, 2015, the Company recorded a net loss $3.6 million related to the settlement of forward exchange contracts which were designated as cash flow hedges.
The Company estimates fair value of its financial instruments utilizing an established three-level hierarchy. The hierarchy is based upon the transparency of inputs to the valuation of an asset or liability as of the measurement date as follows:
• | Level 1–Valuation is based upon unadjusted quoted prices for identical assets or liabilities in active markets. |
• | Level 2–Valuation is based upon quoted prices for similar assets and liabilities in active markets, or other inputs that are observable for the asset or liability, either directly or indirectly, for substantially the full term of the financial statements. |
• | Level 3–Valuation is based upon other unobservable inputs that are significant to the fair value measurements. |
The classification of fair value measurements within the established three-level hierarchy is based upon the lowest level of input that is significant to that measurement. The fair values of the Company’s derivative instruments were measured using valuations based upon quoted prices for similar assets and liabilities in active markets (Level 2) and are valued by reference to similar financial instruments, adjusted for terms specific to the contracts. There were no transfers between the three levels of the fair value hierarchy during any period presented. The derivative assets and liabilities measured at fair value on a recurring basis as of December 31, 2017 and 2016 were as follows:
Balance Sheet Location | Total | Level 1 | Level 2 | Level 3 | ||||||||||||
(in millions) | ||||||||||||||||
December 31, 2017 | ||||||||||||||||
Interest rate swaps (asset position) | Other noncurrent assets | $ | 1.7 | $ | — | $ | 1.7 | $ | — | |||||||
Interest rate swaps (liability position) | Other current liabilities | $ | 1.0 | $ | — | $ | 1.0 | $ | — | |||||||
December 31, 2016 | ||||||||||||||||
Foreign currency forward contracts (liability position) | Other current liabilities | $ | 0.6 | $ | — | $ | 0.6 | $ | — | |||||||
81
11. Accumulated Other Comprehensive Loss
The following table summarizes the changes in the accumulated balances for each component of accumulated other comprehensive loss:
Foreign Currency Translation | Unrecognized Post- Retirement Plan Losses | Derivative Financial Instruments | Total | ||||||||||||
(in millions) | |||||||||||||||
Balance at December 31, 2014 | $ | (45.4 | ) | $ | (5.6 | ) | $ | (3.1 | ) | $ | (54.1 | ) | |||
Other comprehensive (loss) income before reclassifications | (59.1 | ) | 2.2 | (0.4 | ) | (57.3 | ) | ||||||||
Amounts reclassified from accumulated other comprehensive income (loss) | — | (1.2 | ) | 3.5 | 2.3 | ||||||||||
Other comprehensive (loss) income | (59.1 | ) | 1.0 | 3.1 | (55.0 | ) | |||||||||
Balance at December 31, 2015 | (104.5 | ) | (4.6 | ) | — | (109.1 | ) | ||||||||
Other comprehensive (loss) income before reclassifications | (45.5 | ) | (2.9 | ) | 0.5 | (47.9 | ) | ||||||||
Amounts reclassified from accumulated other comprehensive income (loss) | — | 0.2 | (1.1 | ) | (0.9 | ) | |||||||||
Other comprehensive loss | (45.5 | ) | (2.7 | ) | (0.6 | ) | (48.8 | ) | |||||||
Balance at December 31, 2016 | (150.0 | ) | (7.3 | ) | (0.6 | ) | (157.9 | ) | |||||||
Other comprehensive income (loss) before reclassifications | 71.7 | (0.5 | ) | (0.2 | ) | 71.0 | |||||||||
Amounts reclassified from accumulated other comprehensive income (loss) | — | 0.6 | 0.9 | 1.5 | |||||||||||
Other comprehensive income | 71.7 | 0.1 | 0.7 | 72.5 | |||||||||||
Balance at December 31, 2017 | $ | (78.3 | ) | $ | (7.2 | ) | $ | 0.1 | $ | (85.4 | ) | ||||
The following table summarizes the reclassifications out of accumulated other comprehensive loss during the years ended December 31, 2017, 2016 and 2015:
Classification | Year Ended December 31, | ||||||||||||
of Expense | 2017 | 2016 | 2015 | ||||||||||
(in millions) | |||||||||||||
Unrealized pension and post-retirement obligations: | |||||||||||||
Adjustment of pension and post-retirement obligations | (a) | $ | (0.7 | ) | $ | (0.2 | ) | $ | 1.2 | ||||
Tax benefit | (c) | 0.1 | — | — | |||||||||
Adjustment of pension and post-retirement obligations, net of tax | (0.6 | ) | (0.2 | ) | 1.2 | ||||||||
Derivative financial instruments: | |||||||||||||
(Loss) gain on derivative financial instruments | (b) | (1.1 | ) | 1.1 | (3.6 | ) | |||||||
Tax benefit | (c) | 0.2 | — | 0.1 | |||||||||
Gain (loss) on derivative financial instruments, net of tax | (0.9 | ) | 1.1 | (3.5 | ) | ||||||||
Total reclassifications from accumulated other comprehensive income (loss) | $ | (1.5 | ) | $ | 0.9 | $ | (2.3 | ) | |||||
(a) | Amount is included in the calculation of pension cost within cost of sales and selling, general and administrative expense in the Company's Consolidated Statements of Operations. |
(b) | Amount is included in cost of sales and (gain) loss on currency translation in the Company's Consolidated Statements of Operations. |
(c) | These amounts are included in income tax expense in the Company's Consolidated Statements of Operations. |
82
12. Restructuring Reserves
2017 Actions
The Company recorded severance expense of $2.7 million during the year ended December 31, 2017 related to the elimination of certain positions with the Company's Advanced Plastic Processing Technologies and Corporate segments. These amounts are included within other expense, net in the Company's Consolidated Statements of Operations and are expected to be substantially paid in cash by the end of 2018. The total remaining liability under these severance-related actions was $1.2 million as of December 31, 2017, and is included in other current liabilities in the Company's Consolidated Balance Sheets.
2016 Actions
On September 30, 2016, the Company's wholly-owned subsidiary Ferromatik Milacron GmbH entered into an agreement with its local works council setting forth a restructuring plan related to its manufacturing facility in Malterdingen, Germany whereby certain operational functions will be shifted to the Company's operations in the Czech Republic, U.S. and India. The Company expects to incur severance and other related costs of approximately $18.0 million to $20.0 million. Substantially all of these costs will result in future cash expenditures and are expected to be substantially complete by the end of 2018. As the employees are required to render service in order to receive the termination benefits, the associated liability will be recognized ratably over the future service period. During the years ended December 31, 2017 and 2016, the Company recognized $8.9 million and $3.3 million of expense, respectively, and these amounts are included within other expense, net in the Company's Consolidated Statements of Operations. The total remaining liability related to this plan was $11.1 million as of December 31, 2017 and $2.6 million as of December 31, 2016.
2015 Actions
The Company recorded severance expense of $6.6 million for the year ended December 31, 2015 related to the Company's organizational redesign initiatives in Europe including the consolidation of certain manufacturing operations to the Czech Republic. These amounts are included within other expense, net in the Company's Consolidated Statements of Operations. The total remaining liability under these severance-related actions, which is included within other current liabilities in the Company's Consolidated Balance Sheets, was $0.3 million as of December 31, 2016.
In connection with the Company's organizational redesign initiatives in Europe, the Company has committed to a plan to sell two separate facilities, one located in Mechelen, Belgium and one located in Magenta, Italy. As of December 31, 2016, the Mechelen, Belgium facility met the held-for-sale criteria set forth in U.S. GAAP, resulting in the classification of $3.2 million of property and equipment as held-for-sale and is classified within prepaid and other current assets in the Consolidated Balance Sheets. During the year ended December 31, 2017, the Company closed the sale of the Mechelen, Belgium facility and proceeds from the sale were approximately $3.0 million. During the fourth quarter of 2016, the Company determined the Magenta, Italy facility no longer met the held-for-sale criteria as it was no longer probable it would be sold within one year which resulted in $5.5 million being reclassified to property and equipment. The Mechelen, Belgium facility is reported within the Melt Delivery and Control Systems segment and the Magenta, Italy facility is reported within the Advanced Plastic Processing Technologies segment.
13. Related-Party Transaction
The Company executed an advisory services and monitoring agreement with CCMP on April 30, 2012 that provides a quarterly advisory fee to CCMP. The Company incurred $0.3 million of expense for the year ended December 31, 2015 related to the advisory services and monitoring agreement and these costs are included within selling, general and administrative expenses within the Company's Consolidated Statements of Operations. In connection with the Company's IPO, the advisory services and monitoring agreement between the Company and CCMP was terminated.
83
14. Commitments and Contingencies
The Company is obligated under various non-cancelable operating leases for equipment and facilities, some of which contain renewal options. At December 31, 2017, future minimum lease commitments under non-cancelable operating leases were approximately $34.3 million with required payments of $10.3 million in 2018, $7.3 million in 2019, $5.0 million in 2020, $3.5 million in 2021, $3.0 million in 2022, and $5.2 million thereafter. The Company recorded $11.8 million, $12.1 million and $11.0 million of rent expense for the years ended December 31, 2017, 2016 and 2015, respectively.
In June 2017, the Company's wholly-owned subsidiary Mold-Masters (2007) Limited completed the sale of two properties ("Properties") in Halton Hills, Ontario, Canada for CAD $14.25 million, or approximately USD $10.7 million, and simultaneously entered into agreements to lease back the Properties. Due to the existence of a prohibited form of continuing involvement, the transactions did not qualify for sale-leaseback accounting and as a result have been accounted for as financing transactions under lease accounting standards. Under the financing method, the assets will remain on the Company's Consolidated Balance Sheets and the proceeds received from the transactions are reported as a financing obligation. The leases have fifteen year terms with a total of approximately CAD $16.7 million, or approximately USD $12.6 million, to be paid over the term of the leases in accordance with the base rent schedule included in the lease agreements. At December 31, 2017, the liability under the financing transactions was $11.2 million which is included in other current liabilities and other noncurrent accrued liabilities in the Consolidated Balance Sheets.
In December 2017, the Company completed the sale of certain manufacturing equipment in the Company's Advanced Plastic Processing Technologies segment. The Company received proceeds of $8.0 million in January 2018 from the sale and recorded a loss of $0.4 million during the year ended December 31, 2017. In connection to the sale, the Company simultaneously entered into an agreement to lease back the equipment for a period of six years with a total of approximately $8.0 million to be paid over the term of the lease in accordance with the rent schedule included in the lease agreement. The lease has been classified as an operating lease and the Company has an option to purchase the equipment at the future fair value upon expiration of the lease.
The Company is involved in environmental remedial investigations and actions at certain locations where the Company has been designated a potentially liable party. The Company is also from time to time involved in various other loss contingencies, including tax and legal contingencies that arise during the normal course of business. The Company accrues for a loss contingency when it is probable that a liability has been incurred and the amount of such loss can be reasonably estimated. Accruals for estimated losses from environmental remediation obligations are recognized no later than the completion of a remediation feasibility study. The accruals are adjusted as further information becomes available or circumstances change. Environmental costs have not been material at the Company’s sites. At this time, the Company believes that the results of any such contingencies, either individually or in the aggregate, will not have a materially adverse effect on the Company’s results of operations or financial condition. However, the outcome of any litigation cannot be predicted with certainty. An unfavorable resolution of one or more pending matters could have a materially adverse impact on the Company’s results of operations or financial condition in the future.
15. Business Segment Information
The Company’s operations are principally managed based upon the products that are produced and are comprised of three operating segments, which are the same as the Company’s reportable segments: Advanced Plastic Processing Technologies, Melt Delivery and Control Systems and Fluid Technologies. The factors for determining the Company’s reportable segments include the manner in which management evaluates performance combined with the nature of the individual business activities. The Company evaluates the performance of its segments based on net sales and operating earnings. Operating earnings includes net sales to third parties, related cost of sales and operating expenses directly attributable to the segments. Operating earnings for each segment excludes items that are of a non-operating nature or are of a corporate or functional governance nature. Costs excluded from segment operating earnings include interest expense, income taxes and various corporate expenses such as transaction costs associated with the acquisition of certain businesses, stock-based compensation expense and other separately managed general and administrative costs. The effects of intersegment transactions have been eliminated.
84
MILACRON HOLDINGS CORP.
NOTES TO CONSOLIDATED FINANCIAL STATEMENTS (CONTINUED)
15. Business Segment Information (continued)
The Advanced Plastic Processing Technologies segment is a global leader in the manufacture, distribution and service of equipment and products used in the plastic technology and processing industry, including injection molding, blow molding and extrusion applications with its principal operations located in the U.S., Germany, Italy, Czech Republic and India. The segment also sells specialty and peripheral equipment for plastic processing as well as replacement parts for machinery products. The Melt Delivery and Control Systems segment, which has major operations in the U.S., Canada, Germany and China, is a global leader in the manufacture of plastic delivery and precision control systems which are recurring, consumable sales for injection molding applications. The Melt Delivery and Control Systems segment sells highly engineered, technically advanced hot runner systems, process control systems, mold bases, mold components, aftermarket parts and related technologies and services for injection molding, as well as MRO supplies for plastic processing operations. The Fluid Technologies segment has major blending facilities in the U.S., The Netherlands and South Korea and is a leading manufacturer of premium coolants, lubricants, process cleaners and corrosion inhibitors that are used in a variety of metalworking industries. Effective January 1, 2016, the Advance Plastic Processing Technologies segment includes the Company's MPET product line that had previously been reported in the Melt Delivery and Control Systems segment. This reclassification more closely reflects the change in management of this product line and its related growth opportunities. Prior year results have been reclassified to reflect the segment change. For the year ended December 31, 2015, the MPET product line had revenue of $6.8 million and operating losses of $1.2 million, respectively.
The following table summarizes total assets by segment:
December 31, 2017 | December 31, 2016 | ||||||
(in millions) | |||||||
Advanced Plastic Processing Technologies | $ | 524.8 | $ | 503.0 | |||
Melt Delivery and Control Systems | 1,104.5 | 1,003.8 | |||||
Fluid Technologies | 149.0 | 141.6 | |||||
Corporate | 80.5 | 73.6 | |||||
Total assets | $ | 1,858.8 | $ | 1,722.0 | |||
The following table summarizes long-lived assets by segment:
December 31, 2017 | December 31, 2016 | ||||||
(in millions) | |||||||
Advanced Plastic Processing Technologies | $ | 123.5 | $ | 121.4 | |||
Melt Delivery and Control Systems | 113.3 | 101.0 | |||||
Fluid Technologies | 17.8 | 15.2 | |||||
Corporate | 6.2 | 6.1 | |||||
Total long-lived assets | $ | 260.8 | $ | 243.7 | |||
The following tables summarize segment information:
Year Ended December 31, | |||||||||||
2017 | 2016 | 2015 | |||||||||
(in millions) | |||||||||||
Net sales to external customers: | |||||||||||
Advanced Plastic Processing Technologies | $ | 689.1 | $ | 663.9 | $ | 680.8 | |||||
Melt Delivery and Control Systems | 423.9 | 389.9 | 383.5 | ||||||||
Fluid Technologies | 121.2 | 112.9 | 115.2 | ||||||||
Total net sales to external customers | $ | 1,234.2 | $ | 1,166.7 | $ | 1,179.5 | |||||
85
MILACRON HOLDINGS CORP.
NOTES TO CONSOLIDATED FINANCIAL STATEMENTS (CONTINUED)
15. Business Segment Information (continued)
Year Ended December 31, | |||||||||||
2017 | 2016 | 2015 | |||||||||
(in millions) | |||||||||||
Operating earnings (loss): | |||||||||||
Advanced Plastic Processing Technologies | $ | 10.6 | $ | 34.9 | $ | 55.3 | |||||
Melt Delivery and Control Systems | 102.5 | 91.4 | 52.1 | ||||||||
Fluid Technologies | 20.7 | 17.4 | 12.9 | ||||||||
Corporate | (45.8 | ) | (38.1 | ) | (48.5 | ) | |||||
Total operating earnings | $ | 88.0 | $ | 105.6 | $ | 71.8 | |||||
Capital expenditures: | |||||||||||
Advanced Plastic Processing Technologies | $ | 14.1 | $ | 30.4 | $ | 29.4 | |||||
Melt Delivery and Control Systems | 23.0 | 24.4 | 19.5 | ||||||||
Fluid Technologies | 2.1 | 1.8 | 1.2 | ||||||||
Corporate | 0.6 | 0.7 | 2.6 | ||||||||
Total capital expenditures | $ | 39.8 | $ | 57.3 | $ | 52.7 | |||||
Depreciation and amortization: | |||||||||||
Advanced Plastic Processing Technologies | $ | 19.1 | $ | 20.3 | $ | 19.9 | |||||
Melt Delivery and Control Systems | 33.5 | 33.2 | 35.7 | ||||||||
Fluid Technologies | 4.9 | 5.5 | 6.7 | ||||||||
Corporate | 1.1 | 0.9 | 0.4 | ||||||||
Total depreciation and amortization | $ | 58.6 | $ | 59.9 | $ | 62.7 | |||||
The following tables summarize net sales to external customers and long-lived assets by geographic region:
Year Ended December 31, | |||||||||||
2017 | 2016 | 2015 | |||||||||
(in millions) | |||||||||||
Net sales to external customers: | |||||||||||
United States | $ | 532.6 | $ | 546.1 | $ | 576.0 | |||||
China | 140.1 | 111.3 | 107.5 | ||||||||
India | 115.3 | 99.7 | 87.4 | ||||||||
Rest of World | 446.2 | 409.6 | 408.6 | ||||||||
Total net sales to external customers | $ | 1,234.2 | $ | 1,166.7 | $ | 1,179.5 | |||||
December 31, 2017 | December 31, 2016 | ||||||
(in millions) | |||||||
Long-lived assets: | |||||||
United States | $ | 67.9 | $ | 80.3 | |||
China | 48.1 | 37.1 | |||||
India | 27.5 | 25.9 | |||||
Czech Republic | 48.2 | 36.9 | |||||
Canada | 31.0 | 29.1 | |||||
Rest of World | 38.1 | 34.4 | |||||
Total long-lived assets | $ | 260.8 | $ | 243.7 | |||
86
16. Summarized Quarterly Financial Information (Unaudited)
Earnings per share for each quarter and year are calculated individually and may not sum to the total for the year.
2017 Quarter Ended | |||||||||||||||||||
March 31 | June 30 | September 30 | December 31 | Full Year | |||||||||||||||
(in millions, except per share data) | |||||||||||||||||||
Net sales | $ | 285.4 | $ | 309.2 | $ | 314.7 | $ | 324.9 | $ | 1,234.2 | |||||||||
Manufacturing margins | $ | 93.8 | $ | 103.8 | $ | 98.7 | $ | 85.6 | $ | 381.9 | |||||||||
Operating earnings | $ | 19.7 | $ | 28.6 | $ | 29.6 | $ | 10.1 | $ | 88.0 | |||||||||
Net (loss) earnings | $ | (24.6 | ) | $ | 10.1 | $ | 12.3 | $ | 3.3 | $ | 1.1 | ||||||||
Basic EPS | $ | (0.36 | ) | $ | 0.15 | $ | 0.18 | $ | 0.05 | $ | 0.02 | ||||||||
Diluted EPS | $ | (0.36 | ) | $ | 0.14 | $ | 0.17 | $ | 0.05 | $ | 0.02 | ||||||||
2016 Quarter Ended | |||||||||||||||||||
March 31 | June 30 | September 30 | December 31 | Full Year | |||||||||||||||
(in millions, except per share data) | |||||||||||||||||||
Net sales | $ | 277.3 | $ | 308.1 | $ | 292.2 | $ | 289.1 | $ | 1,166.7 | |||||||||
Manufacturing margins | $ | 96.1 | $ | 107.3 | $ | 99.7 | $ | 92.7 | $ | 395.8 | |||||||||
Operating earnings | $ | 32.0 | $ | 35.7 | $ | 29.1 | $ | 8.8 | $ | 105.6 | |||||||||
Net earnings | $ | 9.8 | $ | 12.9 | $ | 6.7 | $ | 1.1 | $ | 30.5 | |||||||||
Basic EPS | $ | 0.15 | $ | 0.19 | $ | 0.10 | $ | 0.02 | $ | 0.45 | |||||||||
Diluted EPS | $ | 0.14 | $ | 0.18 | $ | 0.10 | $ | 0.02 | $ | 0.43 | |||||||||
17. Subsequent Events
On February 28, 2018, the Company made a voluntary $25.0 million principal payment on the 2017 Term Loan Facility.
ITEM 9. | CHANGES IN AND DISAGREEMENTS WITH ACCOUNTANTS ON ACCOUNTING AND FINANCIAL | |||
DISCLOSURES | ||||
None.
87
ITEM 9A. CONTROLS AND PROCEDURES
Evaluation of Disclosure Controls and Procedures
Our Management, with the participation of our Chief Executive Officer ("CEO") and Chief Financial Officer ("CFO"), evaluated the effectiveness of our disclosure controls and procedures pursuant to Rules 13a-15(e) and 15d-15(e) under the Securities Exchange Act of 1934, as amended (the "Exchange Act"), as of the end of the period covered by this Annual Report on Form 10-K.
Based on this evaluation, our CEO and CFO concluded that, as of December 31, 2017, our disclosure controls and procedures are designed at a reasonable assurance level and are effective to provide reasonable assurance that information we are required to disclose in reports we file or submit under the Exchange Act is recorded, processed, summarized and reported within time periods specified in the SEC's rules and forms, and that such information is accumulated and communicated to our management, including our CEO and CFO, as appropriate, to allow timely decisions regarding required disclosure.
Management’s Report on Internal Control over Financial Reporting
Management of the Company is responsible for establishing and maintaining adequate internal control over financial reporting, as defined in Rules 13a-15(f) and 15d-15(f) under the Exchange Act. The Company’s internal control over financial reporting is a process designed to provide reasonable assurance regarding the reliability of financial reporting and the preparation of financial statements for external purposes in accordance with accounting principles generally accepted in the United States of America ("U.S. GAAP") and includes those policies and procedures that:
• | pertain to the maintenance of records that in reasonable detail, accurately and fairly reflect the transactions and dispositions of the assets of the Company; |
• | provide reasonable assurance that transactions are recorded as necessary to permit preparation of financial statements in accordance with U.S. GAAP, and that receipts and expenditures of the Company are being made only in accordance with authorizations of management and directors of the Company; and |
• | provide reasonable assurance that unauthorized acquisition, use or disposition of the Company’s assets that could have a material effect on the financial statements are prevented or detected timely. |
Management, including our CEO and CFO, does not expect that our internal controls will prevent or detect all errors and all fraud. A control system, no matter how well designed and operated, can provide only reasonable, not absolute, assurance that the objectives of the control system are met. Further, the design of a control system must reflect the fact that there are resource constraints, and the benefits of controls must be considered relative to their costs. In addition, any evaluation of the effectiveness of controls is subject to risks that those internal controls may become inadequate in future periods because of changes in business conditions, or that the degree of compliance with the policies or procedures deteriorates.
Management assessed the effectiveness of our internal control over financial reporting as of December 31, 2017. In making this assessment, management used the criteria established in Internal Control-Integrated Framework issued by the Committee of Sponsoring Organizations of the Treadway Commission in 2013. Based on this assessment, management believes that the Company maintained effective internal control over financial reporting as of December 31, 2017.
The effectiveness of the Company’s internal control over financial reporting as of December 31, 2017, has been audited by Ernst & Young LLP, an independent registered public accounting firm, as stated in their report, which appears herein.
Changes in Internal Control Over Financial Reporting
No changes in our internal control over financial reporting occurred during the quarter ended December 31, 2017 that materially affected, or which are reasonably likely to materially affect, our internal control over financial reporting.
88
REPORT OF INDEPENDENT REGISTERED PUBLIC ACCOUNTING FIRM
The Board of Directors and Shareholders
Milacron Holdings Corp.
Opinion on Internal Control over Financial Reporting
We have audited Milacron Holdings Corp.’s internal control over financial reporting as of December 31, 2017, based on criteria established in Internal Control-Integrated Framework issued by the Committee of Sponsoring Organizations of the Treadway Commission (2013 framework) (the COSO criteria). In our opinion, Milacron Holdings Corp. (the Company) maintained, in all material respects, effective internal control over financial reporting as of December 31, 2017, based on the COSO criteria.
We also have audited, in accordance with the standards of the Public Company Accounting Oversight Board (United States) (PCAOB), the 2017 consolidated financial statements of the Company and our report dated February 28, 2018 expressed an unqualified opinion thereon.
Basis for Opinion
The Company’s management is responsible for maintaining effective internal control over financial reporting and for its assessment of the effectiveness of internal control over financial reporting included in the accompanying Management’s Report on Internal Control over Financial Reporting. Our responsibility is to express an opinion on the Company’s internal control over financial reporting based on our audit. We are a public accounting firm registered with the PCAOB and are required to be independent with respect to the Company in accordance with the U.S. federal securities laws and the applicable rules and regulations of the Securities and Exchange Commission and the PCAOB.
We conducted our audit in accordance with the standards of the PCAOB. Those standards require that we plan and perform the audit to obtain reasonable assurance about whether effective internal control over financial reporting was maintained in all material respects.
Our audit included obtaining an understanding of internal control over financial reporting, assessing the risk that a material weakness exists, testing and evaluating the design and operating effectiveness of internal control based on the assessed risk, and performing such other procedures as we considered necessary in the circumstances. We believe that our audit provides a reasonable basis for our opinion.
Definition and Limitations of Internal Control Over Financial Reporting
A company’s internal control over financial reporting is a process designed to provide reasonable assurance regarding the reliability of financial reporting and the preparation of financial statements for external purposes in accordance with generally accepted accounting principles. A company’s internal control over financial reporting includes those policies and procedures that (1) pertain to the maintenance of records that, in reasonable detail, accurately and fairly reflect the transactions and dispositions of the assets of the company; (2) provide reasonable assurance that transactions are recorded as necessary to permit preparation of financial statements in accordance with generally accepted accounting principles, and that receipts and expenditures of the company are being made only in accordance with authorizations of management and directors of the company; and (3) provide reasonable assurance regarding prevention or timely detection of unauthorized acquisition, use, or disposition of the company’s assets that could have a material effect on the financial statements.
Because of its inherent limitations, internal control over financial reporting may not prevent or detect misstatements. Also, projections of any evaluation of effectiveness to future periods are subject to the risk that controls may become inadequate because of changes in conditions, or that the degree of compliance with the policies or procedures may deteriorate.
/s/ Ernst & Young LLP
Cincinnati, Ohio
February 28, 2018
89
ITEM 9B. OTHER INFORMATION
None.
PART III
ITEM 10. DIRECTORS, EXECUTIVE OFFICERS AND CORPORATE GOVERNANCE
The information required by this item will be included in the Company's 2018 Proxy Statement and is incorporated herein by reference.
ITEM 11. EXECUTIVE COMPENSATION
The information required by this item will be included in the Company's 2018 Proxy Statement and is incorporated herein by reference.
ITEM 12. | SECURITY OWNERSHIP OF CERTAIN BENEFICIAL OWNERS AND MANAGEMENT AND RELATED | |||
STOCKHOLDER MATTERS | ||||
The information required by this item will be included in the Company's 2018 Proxy Statement and is incorporated herein by reference.
ITEM 13. CERTAIN RELATIONSHIPS AND RELATED TRANSACTIONS AND DIRECTOR INDEPENDENCE
The information required by this item will be included in the Company's 2018 Proxy Statement and is incorporated herein by reference.
ITEM 14. PRINCIPAL ACCOUNTING FEES AND SERVICES
The information required by this item will be included in the Company's 2018 Proxy Statement and is incorporated herein by reference.
90
PART IV
ITEM 15. EXHIBITS AND FINANCIAL STATEMENT SCHEDULES
(a)(1) Financial Statements
The consolidated financial statements of Milacron Holdings Corp. filed as part of this Form 10-K are included in Item 8. Financial Statements and Supplementary Data.
(a)(2) Financial Statement Schedules
Schedules Omitted
Schedules other than Schedule II are omitted because they are not required or applicable under instructions contained in Regulation S-X or because the information called for is shown in the consolidated financial statements and notes thereto.
Schedule II: Valuation and Qualifying Accounts
Additions | ||||||||||||||||||||
Description | Balance at Beginning of Period | Charged to Costs and Expenses | Acquired Obligations | Deductions | Balance at End of Period | |||||||||||||||
(in millions) | ||||||||||||||||||||
Valuation allowance for deferred tax assets: | ||||||||||||||||||||
Year Ended December 31, 2017 | $ | 77.7 | $ | 26.8 | $ | — | $ | (24.7 | ) | $ | 79.8 | |||||||||
Year Ended December 31, 2016 | 70.0 | 20.6 | — | (12.9 | ) | 77.7 | ||||||||||||||
Year Ended December 31, 2015 | 65.3 | 18.8 | — | (14.1 | ) | 70.0 | ||||||||||||||
(a)(3) Exhibit Index
The following is an index of the exhibits included in this report:
Exhibit Number: | |
3.1 | |
3.2 | |
4.1 | |
4.2 | |
4.3 | |
10.1 | |
10.2 | |
91
10.3 | |
10.4# | |
10.5# | |
10.6# | |
10.7# | |
10.8# | |
10.9# | |
10.10# | |
10.11# | |
10.12# | |
10.13# | |
10.14 | |
10.15# | |
10.16# | |
10.17# | |
10.18# | |
10.19 | |
10.20 | |
10.21 | |
10.22 | |
10.23# | |
10.24 | |
10.25 | |
10.26 | |
10.27 | |
92
10.28 | |
10.29 | |
10.30 | |
10.31 | |
10.32 | |
10.33 | |
10.34 | |
10.35 | |
10.36# | |
10.37# | |
10.38 | |
10.39 | |
21.1 | |
23.1 | |
24.1 | |
31.1 | |
31.2 | |
32.1* | |
101.0 | The following materials from Milacron Holdings Corp.'s Annual Report on Form 10-K for the year ended December 31, 2017, formatted in XBRL (Extensible Business Reporting Language): (i) the Consolidated Balance Sheets, (ii) the Consolidated Statements of Operations, (iii) the Consolidated Statements of Comprehensive Loss, (iv) the Consolidated Statements of Shareholders' Equity, (v) Consolidated Statements of Cash Flows, and (vi) the Notes to the Consolidated Financial Statements. |
# | Indicates management contract or compensatory plan or arrangement. |
*The certifications attached as Exhibit 32.1 accompanying this Annual Report on Form 10-K are deemed furnished and not filed with the Securities and Exchange Commission and are not to be incorporated by reference into any filing under the Securities Act of 1933, as amended, or the Securities Act of 1934, as amended, whether made before or after the date of this Annual Report on Form 10-K, irrespective of any general incorporation language contained in such filing. | |
93
SIGNATURES
Pursuant to the requirements of Section 13 or 15(d) of the Securities Exchange Act of 1934, the Registrant has duly caused this report to be signed on its behalf by the undersigned, thereunto duly authorized.
Milacron Holdings Corp. | ||
(Registrant) | ||
Date: February 28, 2018 | By: | /s/ BRUCE CHALMERS |
Bruce Chalmers | ||
Chief Financial Officer | ||
POWER OF ATTORNEY
KNOW ALL MEN BY THESE PRESENTS, that each of the undersigned constitutes and appoints each of Thomas Goeke, Bruce Chalmers and Hugh C. O’Donnell or any of them, each acting alone, his true and lawful attorney-in-fact and agent, with full power of substitution and resubstitution, for such person and in his name, place and stead, in any and all capacities, to sign this Annual Report on Form 10-K, and to file the same, with all exhibits thereto, and other documents in connection therewith, with the SEC, granting unto said attorneys-in-fact and agents, each acting alone, full power and authority to do and perform each and every act and thing requisite and necessary to be done in and about the premises, as fully to all intents and purposes as he might or could do in person, hereby ratifying and confirming that any such attorney-in-fact and agent, or his substitute or substitutes, may lawfully do or cause to be done by virtue hereof.
Pursuant to the requirements of the Securities Exchange Act of 1934, this report has been signed below by the following persons on behalf of the registrant and in the capacities indicated on February 28, 2018.
94
Signatures | Capacity | |
/s/ Thomas Goeke | President, Chief Executive Officer and Director | |
Thomas Goeke | (Principal Executive Officer) | |
/s/ Bruce Chalmers | Chief Financial Officer | |
Bruce Chalmers | (Principal Financial and Accounting Officer) | |
/s/ Ira Boots | Director | |
Ira Boots | ||
/s/ Timothy Walsh | Director | |
Timothy Walsh | ||
/s/ Mark McFadden | Director | |
Mark McFadden | ||
/s/ Jim Gentilcore | Director | |
Jim Gentilcore | ||
/s/ Waters Davis | Director | |
Waters Davis | ||
/s/ Jim Kratochvil | Director | |
Jim Kratochvil | ||
/s/ James Ridout | Director | |
James Ridout | ||
/s/ Rebecca Lee Steinfort | Director | |
Rebecca Lee Steinfort | ||
/s/ David Reeder | Director | |
David Reeder | ||
/s/ Gregory Gluchowski Jr. | Director | |
Gregory Gluchowski Jr. | ||
/s/ Timothy Crow | Director | |
Timothy Crow | ||
95